Embed Size (px)
Citation preview
Vending Machine Energy Consumption andVendingMiser Evaluation
Submitted to:
TAMU Energy Office
By:
John RitterJoel Hugghins
Energy Systems LaboratoryTexas A&M University System
October 31, 2000
Executive Summary
The Texas A&M campus has approximately 263 soda vending machinesoperated by the local Coca Cola distributor. Machines at the Coca Cola Bryanwarehouse and a new machine located at the Energy Systems Riverside labwere analyzed to determine the energy consumption for each machine and forthe individual electrical components within the machine. The machines selectedwere representative of the machines used on the A&M campus, and were inworking order. From this testing, it was determined that the 263 campusmachines consume an estimated 3546 kilowatt-hours per year, with a demand of106 kilowatts, incurring about $34,000 per year in electrical costs. It was alsofound that the newer machines offer little energy savings over similar oldermodels, and that the lighting systems account for 40% of the electrical cost forthe vending machines.
VendingMiser an economy maximizing hardware was also evaluated over thecourse of the study. The energy savings from the use of VendingMiser would besignificantly less for the few vending machines in buildings occupied duringregular business hours; however, the majority of vending machines on campusare in continually occupied areas, resulting only in a slight energy reduction.
This report details the following prioritized recommendations and the estimatedsavings for each recommendation. Refer to the complete report for clarification.
1. Disconnect vending machine lights.• $11,252 and 375,072 kWh annual savings.
2. Use of economy maximizing hardware, such as VendingMiser.• The greatest energy savings from the use of a VendingMiser on the
Texas A&M campus for an individual machine is $64 per year, witha payback around 2.6 years.
• Most vending machines are in continually occupied areas andwould not achieve the energy savings indicated above, so the useof the VendingMiser is not recommended.
2
Introduction
As an effort to decrease the amount of non-critical energy used on the TexasA&M campus, and to assist Dixie Narco in evaluating the efficiency of theirvending machines, the Texas A&M Energy Systems Laboratory investigated thepower consumption of soda vending machines on the Texas A&M campus.Several vending machines were evaluated to determine the power consumptionfor the individual components, and the whole machine. Recommendations weremade from the results. The VendingMiser device was also tested to evaluate thepotential energy savings of this device.
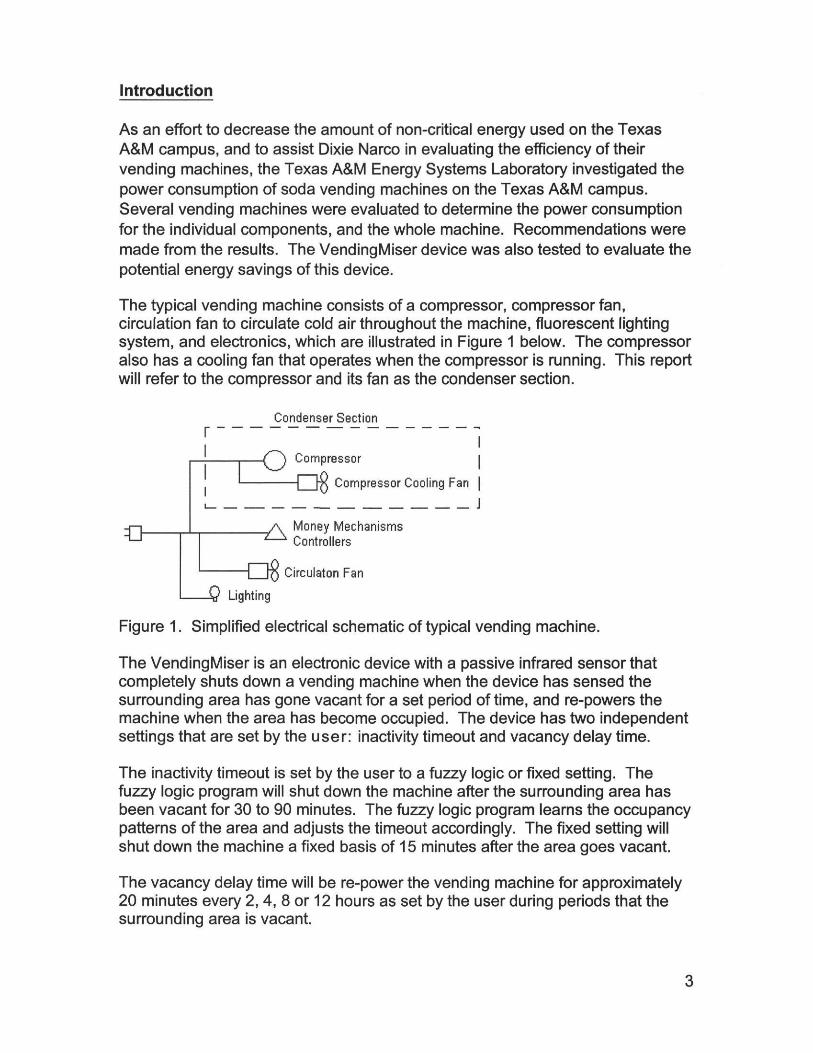
The typical vending machine consists of a compressor, compressor fan,circulation fan to circulate cold air throughout the machine, fluorescent lightingsystem, and electronics, which are illustrated in Figure 1 below. The compressoralso has a cooling fan that operates when the compressor is running. This reportwill refer to the compressor and its fan as the condenser section.
Figure 1. Simplified electrical schematic of typical vending machine.
The VendingMiser is an electronic device with a passive infrared sensor thatcompletely shuts down a vending machine when the device has sensed thesurrounding area has gone vacant for a set period of time, and re-powers themachine when the area has become occupied. The device has two independentsettings that are set by the user: inactivity timeout and vacancy delay time.
The inactivity timeout is set by the user to a fuzzy logic or fixed setting. Thefuzzy logic program will shut down the machine after the surrounding area hasbeen vacant for 30 to 90 minutes. The fuzzy logic program learns the occupancypatterns of the area and adjusts the timeout accordingly. The fixed setting willshut down the machine a fixed basis of 15 minutes after the area goes vacant.
The vacancy delay time will be re-power the vending machine for approximately20 minutes every 2, 4, 8 or 12 hours as set by the user during periods that thesurrounding area is vacant.
3
Test Procedure
Vending Machine Energy Consumption Evaluation:
With the assistance of the local Coca Cola distributor and the Dixie Narcovending machine company, five vending machines similar to those on the TexasA&M campus were measured for their energy consumption. The machinesevaluated are listed below in Table 1.
Table 1. Vending Machines Evaluated.
The DN 501E is a new machine sent to the Energy Systems Lab for evaluationby Dixie Narco. The other machines were machines used on the A&M campusfor several years, which were recently decommissioned to the local Coca Colawarehouse.
Each machine listed above was connected to a metering device and a portabledata logging unit for the purpose of measuring (1) the line voltage, (2) the current(Amp) draw for up to four of the metered components, and (3) the calculatedpower consumption of the metered components. All the fields listed above weremeasured in real time and logged in single minute increments for a time span ofat least 20 hours. Tracking these continuous data points generates powerprofiles that reveal the typical behavior of these machines in normal conditions.
After sufficient data was collected on all the various devices, a scaling-upprocedure was used to estimate vending machine energy consumption for thewhole campus. The Energy Systems Lab obtained a current vending machinecount of 263 machines on the A&M campus from the local Coca Cola distributor.The machines tested represented the general assortment of machines on thecampus, and in order to simplify the scale-up, the machines tested wereconsidered to be the average representation of the machines found on campus.The data from all the machines tested were averaged together, and thenmultiplied by 263 to obtain the total campus estimates. Estimates of deviationare given to provide for potential upper and lower boundaries of power use.
4
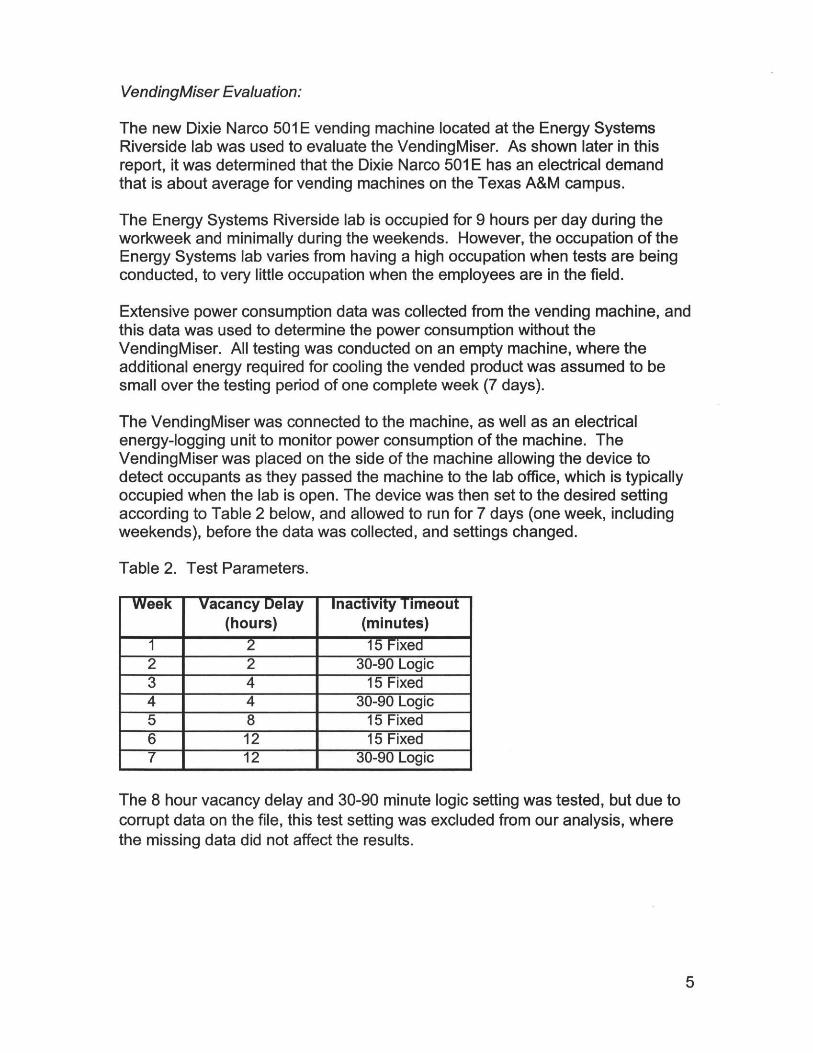
VendingMiser Evaluation:
The new Dixie Narco 501E vending machine located at the Energy SystemsRiverside lab was used to evaluate the VendingMiser. As shown later in thisreport, it was determined that the Dixie Narco 501E has an electrical demandthat is about average for vending machines on the Texas A&M campus.
The Energy Systems Riverside lab is occupied for 9 hours per day during theworkweek and minimally during the weekends. However, the occupation of theEnergy Systems lab varies from having a high occupation when tests are beingconducted, to very little occupation when the employees are in the field.
Extensive power consumption data was collected from the vending machine, andthis data was used to determine the power consumption without theVendingMiser. All testing was conducted on an empty machine, where theadditional energy required for cooling the vended product was assumed to besmall over the testing period of one complete week (7 days).
The VendingMiser was connected to the machine, as well as an electricalenergy-logging unit to monitor power consumption of the machine. TheVendingMiser was placed on the side of the machine allowing the device todetect occupants as they passed the machine to the lab office, which is typicallyoccupied when the lab is open. The device was then set to the desired settingaccording to Table 2 below, and allowed to run for 7 days (one week, includingweekends), before the data was collected, and settings changed.
Table 2. Test Parameters.
The 8 hour vacancy delay and 30-90 minute logic setting was tested, but due tocorrupt data on the file, this test setting was excluded from our analysis, wherethe missing data did not affect the results.
5
Results
Vending Machine Energy Consumption Evaluation:
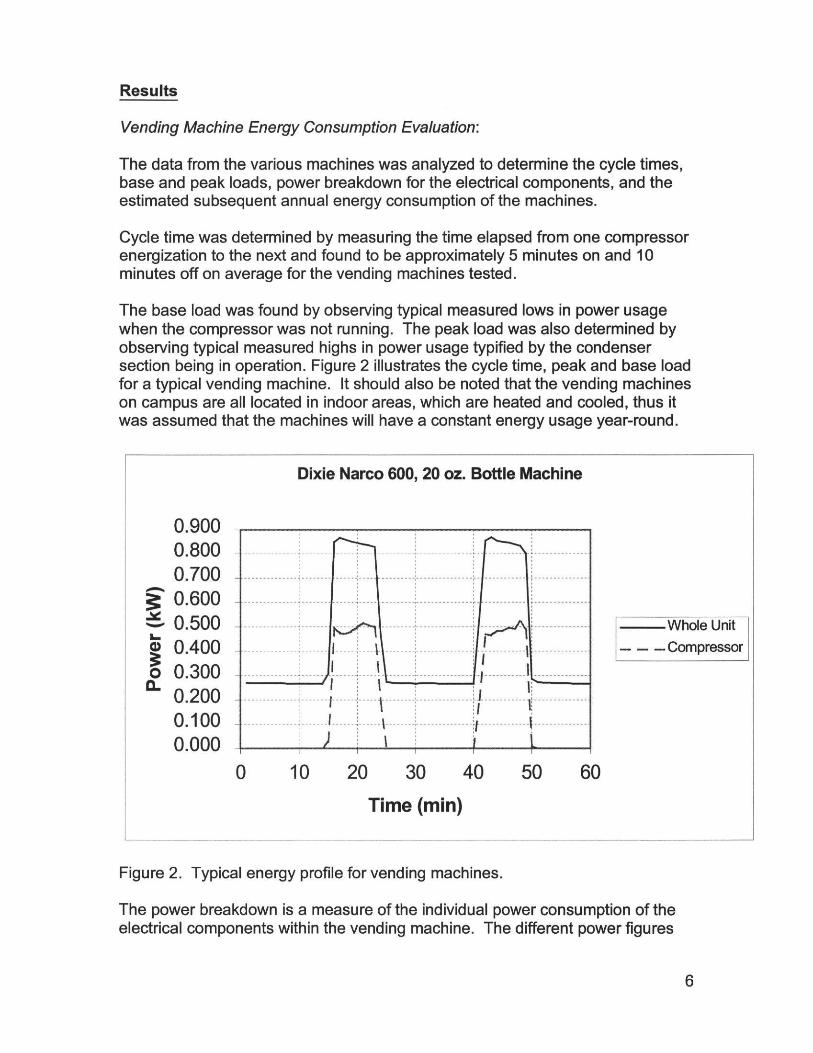
The data from the various machines was analyzed to determine the cycle times,base and peak loads, power breakdown for the electrical components, and theestimated subsequent annual energy consumption of the machines.
Cycle time was determined by measuring the time elapsed from one compressorenergization to the next and found to be approximately 5 minutes on and 10minutes off on average for the vending machines tested.
The base load was found by observing typical measured lows in power usagewhen the compressor was not running. The peak load was also determined byobserving typical measured highs in power usage typified by the condensersection being in operation. Figure 2 illustrates the cycle time, peak and base loadfor a typical vending machine. It should also be noted that the vending machineson campus are all located in indoor areas, which are heated and cooled, thus itwas assumed that the machines will have a constant energy usage year-round.
Figure 2. Typical energy profile for vending machines.
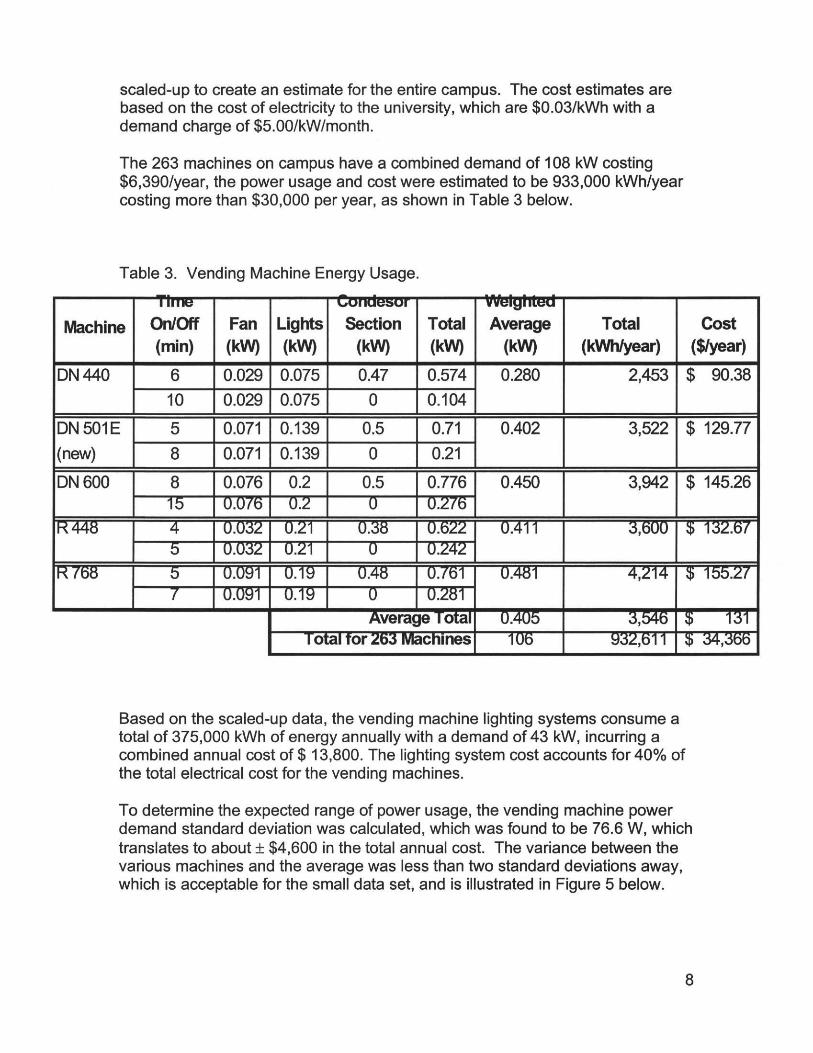
The power breakdown is a measure of the individual power consumption of theelectrical components within the vending machine. The different power figures
6
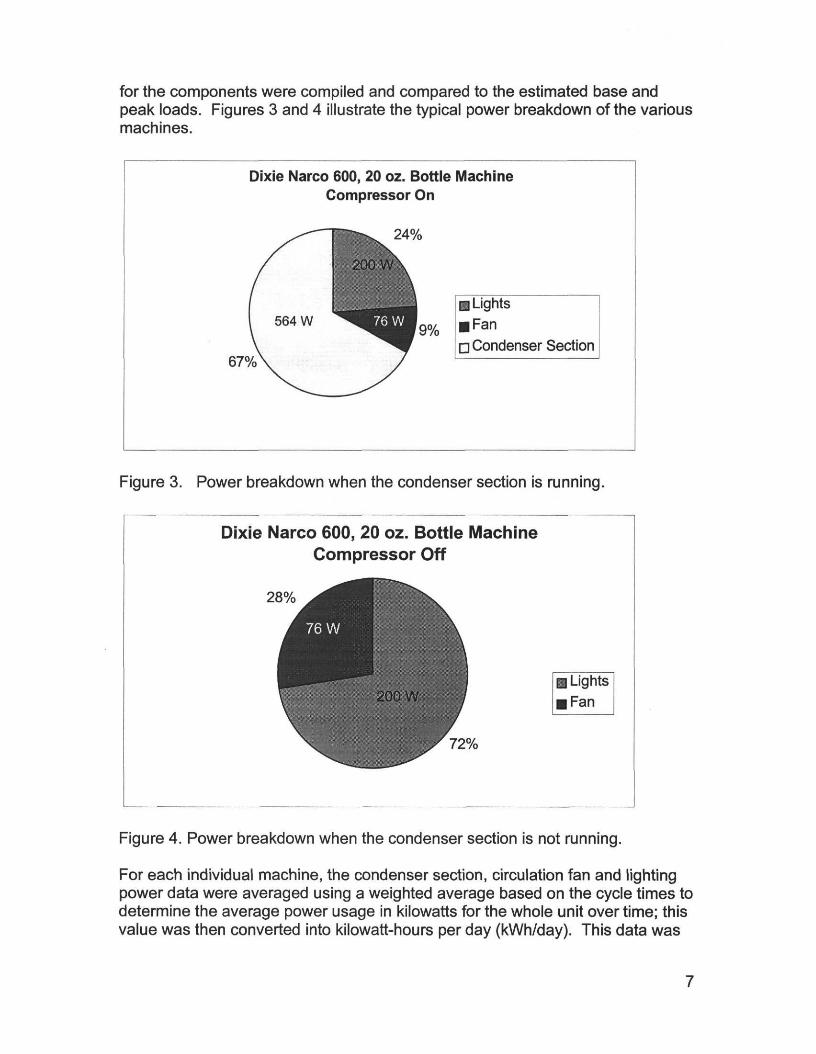
for the components were compiled and compared to the estimated base andpeak loads. Figures 3 and 4 illustrate the typical power breakdown of the variousmachines.
Figure 3. Power breakdown when the condenser section is running.
Figure 4. Power breakdown when the condenser section is not running.
For each individual machine, the condenser section, circulation fan and lightingpower data were averaged using a weighted average based on the cycle times todetermine the average power usage in kilowatts for the whole unit over time; thisvalue was then converted into kilowatt-hours per day (kWh/day). This data was
7
scaled-up to create an estimate for the entire campus. The cost estimates arebased on the cost of electricity to the university, which are $0.03/kWh with ademand charge of $5.00/kW/month.
The 263 machines on campus have a combined demand of 108 kW costing$6,390/year, the power usage and cost were estimated to be 933,000 kWh/yearcosting more than $30,000 per year, as shown in Table 3 below.
Table 3. Vending Machine Energy Usage.
Based on the scaled-up data, the vending machine lighting systems consume atotal of 375,000 kWh of energy annually with a demand of 43 kW, incurring acombined annual cost of $ 13,800. The lighting system cost accounts for 40% ofthe total electrical cost for the vending machines.
To determine the expected range of power usage, the vending machine powerdemand standard deviation was calculated, which was found to be 76.6 W, whichtranslates to about ± $4,600 in the total annual cost. The variance between thevarious machines and the average was less than two standard deviations away,which is acceptable for the small data set, and is illustrated in Figure 5 below.
8
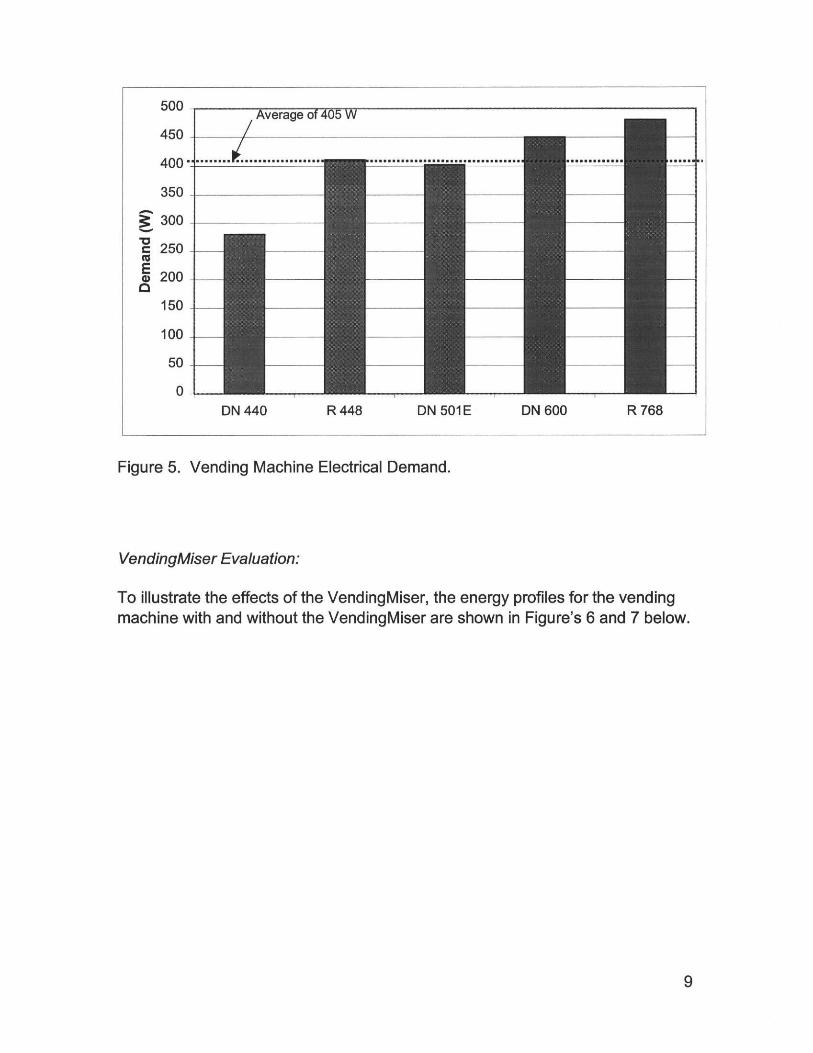
Figure 5. Vending Machine Electrical Demand.
VendingMiser Evaluation:
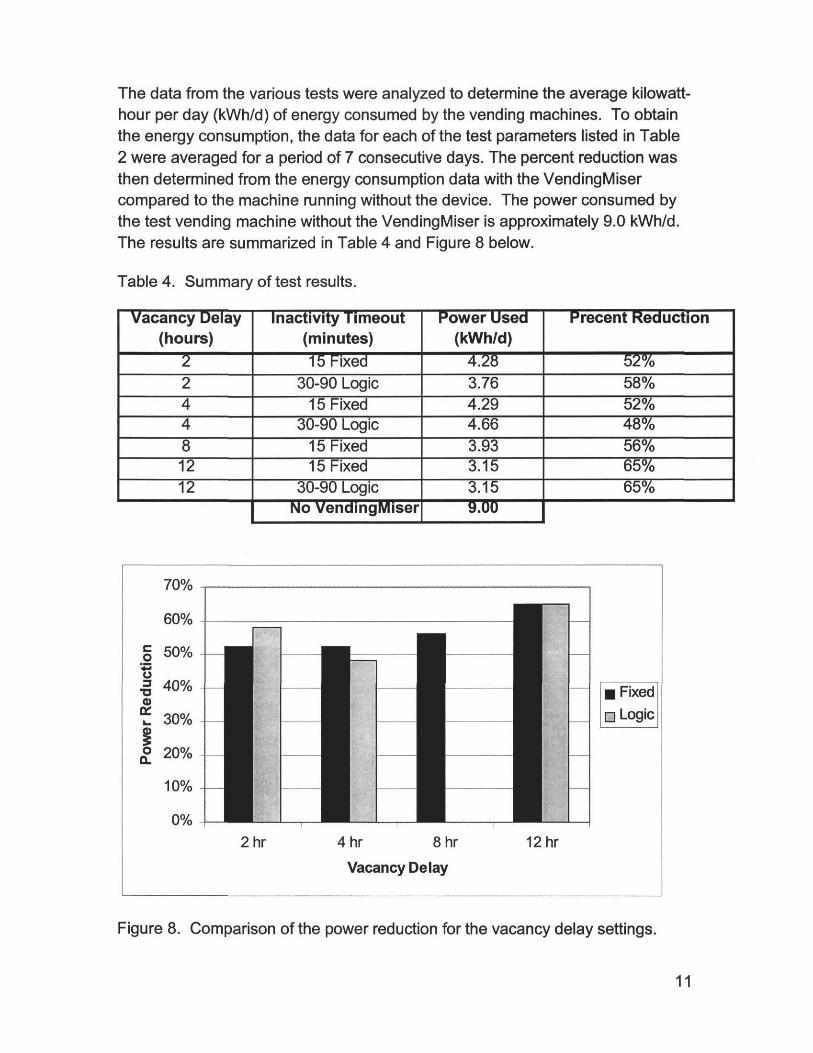
To illustrate the effects of the VendingMiser, the energy profiles for the vendingmachine with and without the VendingMiser are shown in Figure's 6 and 7 below.
9
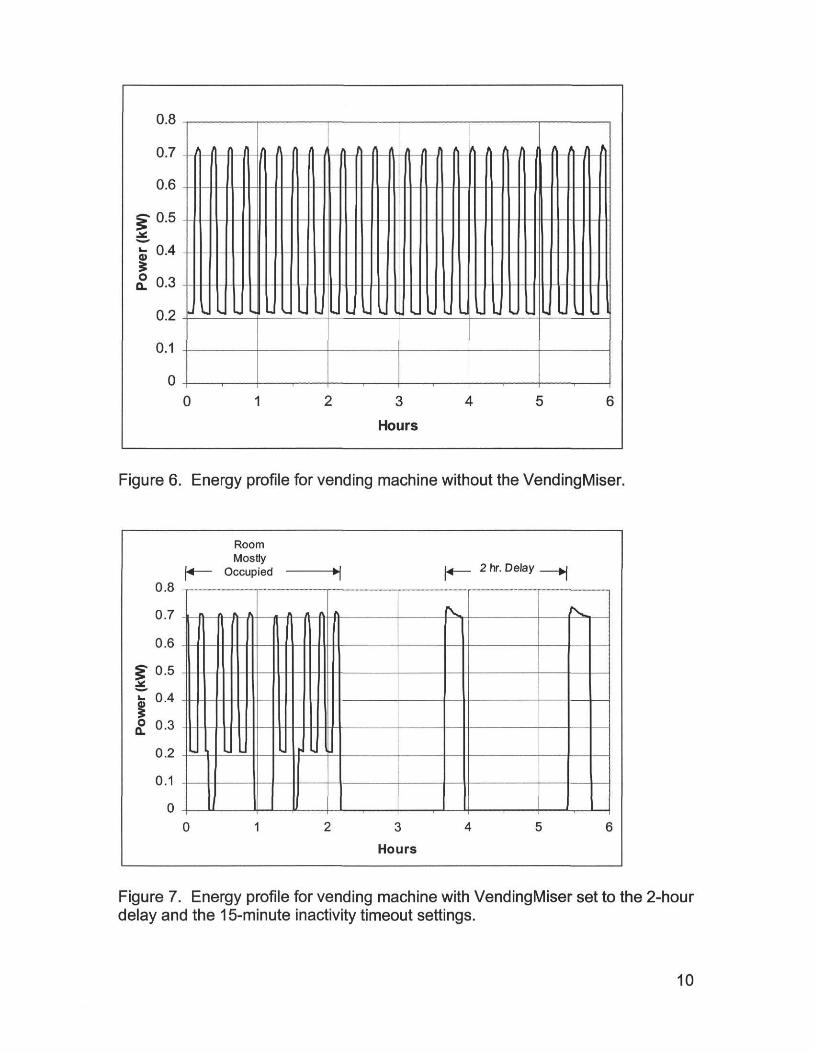
Figure 6. Energy profile for vending machine without the VendingMiser.
Figure 7. Energy profile for vending machine with VendingMiser set to the 2-hourdelay and the 15-minute inactivity timeout settings.
10
The data from the various tests were analyzed to determine the average kilowatt-hour per day (kWh/d) of energy consumed by the vending machines. To obtainthe energy consumption, the data for each of the test parameters listed in Table2 were averaged for a period of 7 consecutive days. The percent reduction wasthen determined from the energy consumption data with the VendingMisercompared to the machine running without the device. The power consumed bythe test vending machine without the VendingMiser is approximately 9.0 kWh/d.The results are summarized in Table 4 and Figure 8 below.
Table 4. Summary of test results.
Figure 8. Comparison of the power reduction for the vacancy delay settings.
11
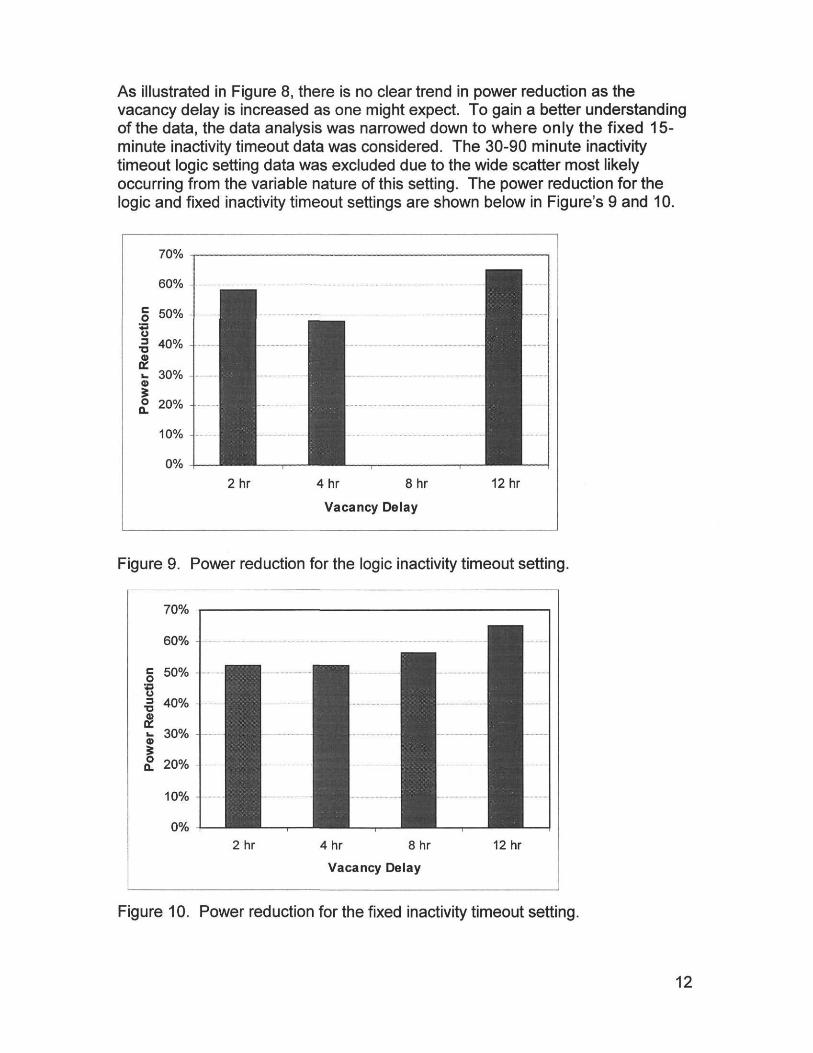
As illustrated in Figure 8, there is no clear trend in power reduction as thevacancy delay is increased as one might expect. To gain a better understandingof the data, the data analysis was narrowed down to where only the fixed 15-minute inactivity timeout data was considered. The 30-90 minute inactivitytimeout logic setting data was excluded due to the wide scatter most likelyoccurring from the variable nature of this setting. The power reduction for thelogic and fixed inactivity timeout settings are shown below in Figure's 9 and 10.
Figure 9. Power reduction for the logic inactivity timeout setting.
2hr 4 hr 8 hr
Vacancy Delay
12 hr
Figure 10. Power reduction for the fixed inactivity timeout setting.
12
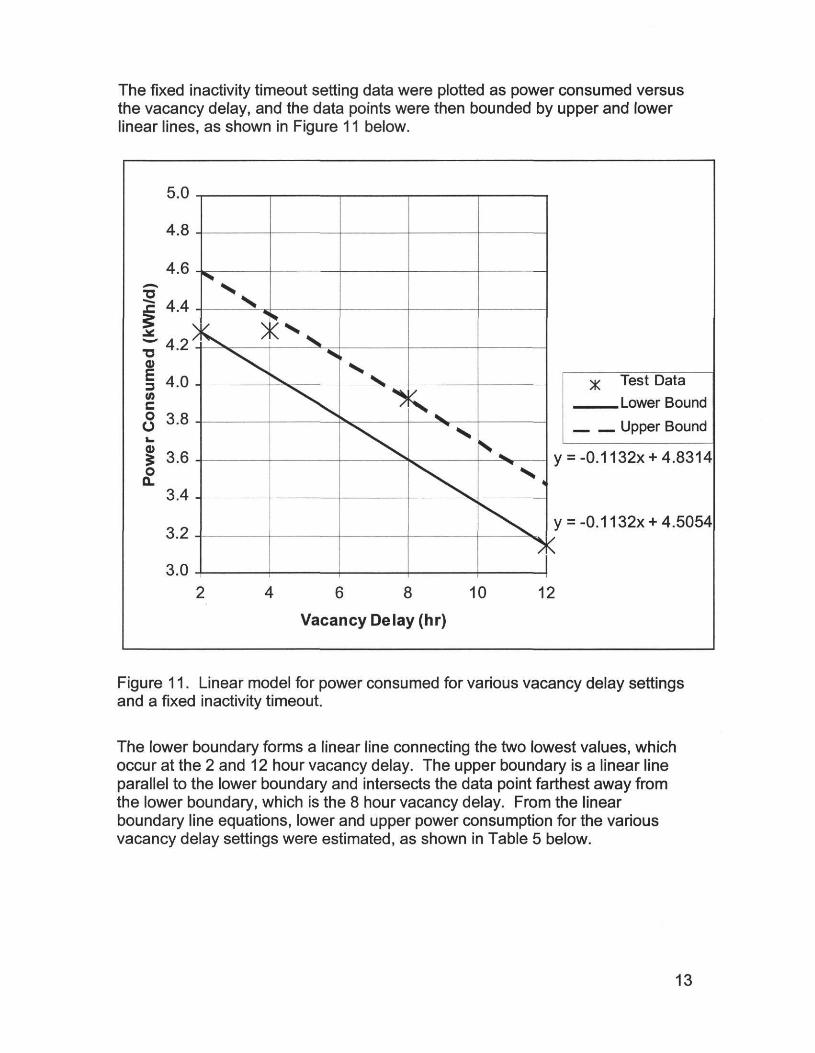
The fixed inactivity timeout setting data were plotted as power consumed versusthe vacancy delay, and the data points were then bounded by upper and lowerlinear lines, as shown in Figure 11 below.
Figure 11. Linear model for power consumed for various vacancy delay settingsand a fixed inactivity timeout.
The lower boundary forms a linear line connecting the two lowest values, whichoccur at the 2 and 12 hour vacancy delay. The upper boundary is a linear lineparallel to the lower boundary and intersects the data point farthest away fromthe lower boundary, which is the 8 hour vacancy delay. From the linearboundary line equations, lower and upper power consumption for the variousvacancy delay settings were estimated, as shown in Table 5 below.
13
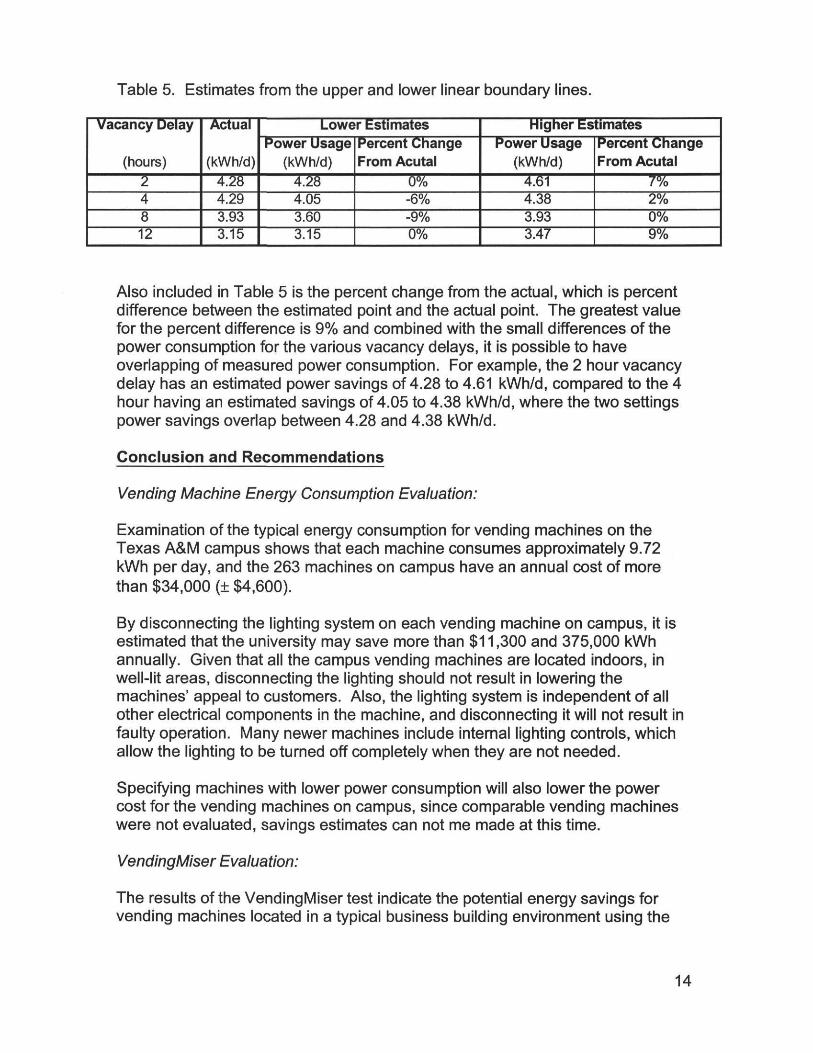
Table 5. Estimates from the upper and lower linear boundary lines.
Also included in Table 5 is the percent change from the actual, which is percentdifference between the estimated point and the actual point. The greatest valuefor the percent difference is 9% and combined with the small differences of thepower consumption for the various vacancy delays, it is possible to haveoverlapping of measured power consumption. For example, the 2 hour vacancydelay has an estimated power savings of 4.28 to 4.61 kWh/d, compared to the 4hour having an estimated savings of 4.05 to 4.38 kWh/d, where the two settingspower savings overlap between 4.28 and 4.38 kWh/d.
Conclusion and Recommendations
Vending Machine Energy Consumption Evaluation:
Examination of the typical energy consumption for vending machines on theTexas A&M campus shows that each machine consumes approximately 9.72kWh per day, and the 263 machines on campus have an annual cost of morethan $34,000 (± $4,600).
By disconnecting the lighting system on each vending machine on campus, it isestimated that the university may save more than $11,300 and 375,000 kWhannually. Given that all the campus vending machines are located indoors, inwell-lit areas, disconnecting the lighting should not result in lowering themachines' appeal to customers. Also, the lighting system is independent of allother electrical components in the machine, and disconnecting it will not result infaulty operation. Many newer machines include internal lighting controls, whichallow the lighting to be turned off completely when they are not needed.
Specifying machines with lower power consumption will also lower the powercost for the vending machines on campus, since comparable vending machineswere not evaluated, savings estimates can not me made at this time.
VendingMiser Evaluation:
The results of the VendingMiser test indicate the potential energy savings forvending machines located in a typical business building environment using the
14
VendingMiser device, with building operating hours of 8 a.m. to 5 p.m. weekdays,and minimal weekend activity. The evaluation indicates that the VendingMisercould possibly reduce energy consumption ranging from 48 to 65 percent inthese conditions.
However, the VendingMiser will save considerably less energy for vendingmachines in locations occupied mostly by students, such as a dorm, as studentstend to observe sporadic working hours at all times of the day and night.
Although the cause of the variance of the power consumption for the variousvacancy delay settings is not completely known, it is most likely a result of thevariance of occupation of the Energy Systems Laboratory during the evaluationperiod. The Energy Systems Riverside lab occupation varied from highoccupation when tests were being conducted, to very little occupation when theemployees were in the field. Other causes may be from natural occurrences,such as birds flying through the lab, thunderstorms, and other randommovements, all of which might have set off the occupancy sensor.
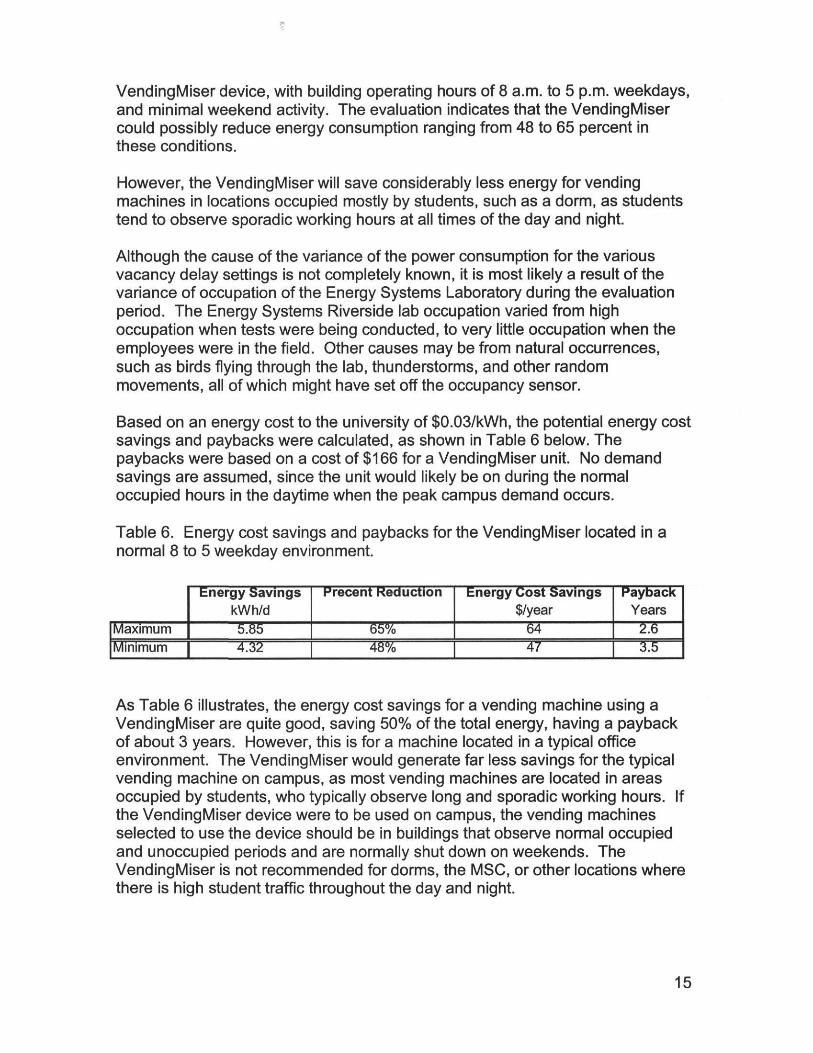
Based on an energy cost to the university of $0.03/kWh, the potential energy costsavings and paybacks were calculated, as shown in Table 6 below. Thepaybacks were based on a cost of $166 for a VendingMiser unit. No demandsavings are assumed, since the unit would likely be on during the normaloccupied hours in the daytime when the peak campus demand occurs.
Table 6. Energy cost savings and paybacks for the VendingMiser located in anormal 8 to 5 weekday environment.
As Table 6 illustrates, the energy cost savings for a vending machine using aVendingMiser are quite good, saving 50% of the total energy, having a paybackof about 3 years. However, this is for a machine located in a typical officeenvironment. The VendingMiser would generate far less savings for the typicalvending machine on campus, as most vending machines are located in areasoccupied by students, who typically observe long and sporadic working hours. Ifthe VendingMiser device were to be used on campus, the vending machinesselected to use the device should be in buildings that observe normal occupiedand unoccupied periods and are normally shut down on weekends. TheVendingMiser is not recommended for dorms, the MSC, or other locations wherethere is high student traffic throughout the day and night.
15


![Pizza Vending Machine [ENG]](https://img.pdfslide.net/doc/110x75/549e2a9fac795942768b463f/pizza-vending-machine-eng.jpg)