Embed Size (px)
Citation preview
1 Info-Tech Research Group Vendor Landscape: Server Virtualization
Info-Tech Research Group, Inc. Is a global leader in providing IT research and advice.
Info-Tech’s products and services combine actionable insight and relevant advice with
ready-to-use tools and templates that cover the full spectrum of IT concerns.
© 1997-2013 Info-Tech Research Group Inc.
Vendor Landscape: Server Virtualization Server virtualization continues to drive value in infrastructure consolidation and management
while laying the foundation of private and public computing.
2 Info-Tech Research Group Vendor Landscape: Server Virtualization
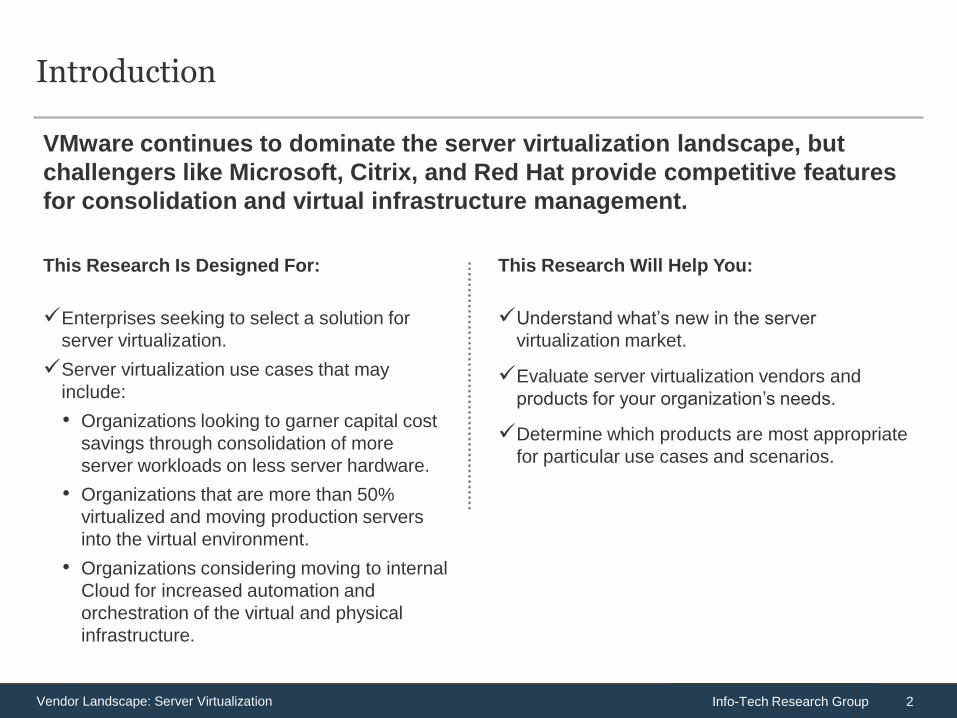
VMware continues to dominate the server virtualization landscape, but
challengers like Microsoft, Citrix, and Red Hat provide competitive features
for consolidation and virtual infrastructure management.
Introduction
Enterprises seeking to select a solution for
server virtualization.
Server virtualization use cases that may
include:
• Organizations looking to garner capital cost
savings through consolidation of more
server workloads on less server hardware.
• Organizations that are more than 50%
virtualized and moving production servers
into the virtual environment.
• Organizations considering moving to internal
Cloud for increased automation and
orchestration of the virtual and physical
infrastructure.
This Research Is Designed For: This Research Will Help You:
Understand what’s new in the server
virtualization market.
Evaluate server virtualization vendors and
products for your organization’s needs.
Determine which products are most appropriate
for particular use cases and scenarios.
3 Info-Tech Research Group Vendor Landscape: Server Virtualization
1234
Executive Summary
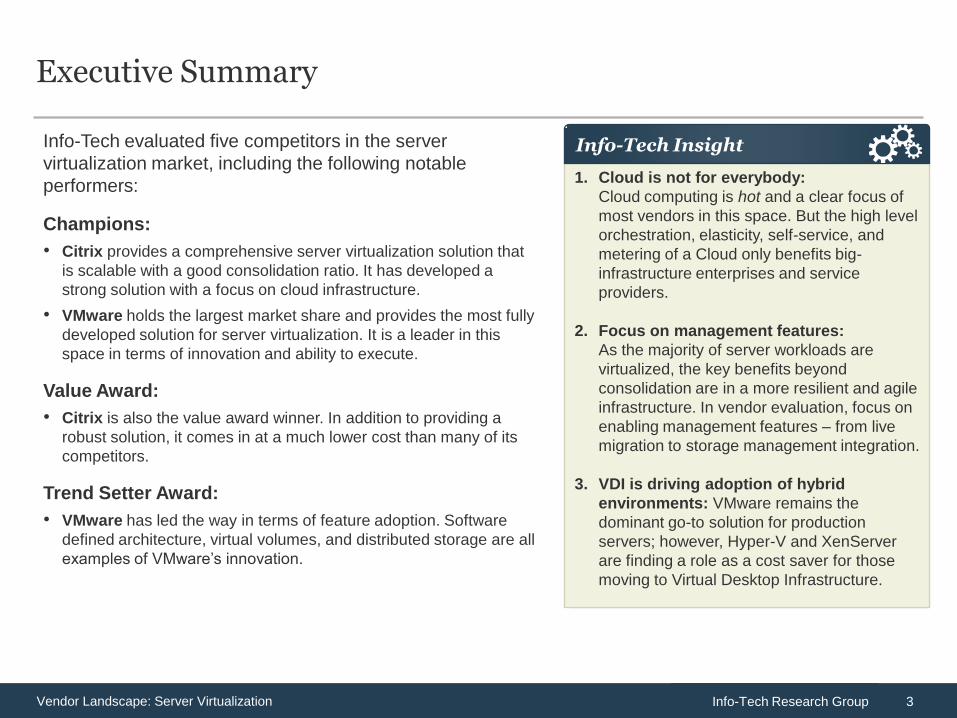
Info-Tech evaluated five competitors in the server
virtualization market, including the following notable
performers:
Champions:
• Citrix provides a comprehensive server virtualization solution that
is scalable with a good consolidation ratio. It has developed a
strong solution with a focus on cloud infrastructure.
• VMware holds the largest market share and provides the most fully
developed solution for server virtualization. It is a leader in this
space in terms of innovation and ability to execute.
Value Award:
• Citrix is also the value award winner. In addition to providing a
robust solution, it comes in at a much lower cost than many of its
competitors.
Trend Setter Award:
• VMware has led the way in terms of feature adoption. Software
defined architecture, virtual volumes, and distributed storage are all
examples of VMware’s innovation.
1. Cloud is not for everybody:
Cloud computing is hot and a clear focus of
most vendors in this space. But the high level
orchestration, elasticity, self-service, and
metering of a Cloud only benefits big-
infrastructure enterprises and service
providers.
2. Focus on management features:
As the majority of server workloads are
virtualized, the key benefits beyond
consolidation are in a more resilient and agile
infrastructure. In vendor evaluation, focus on
enabling management features – from live
migration to storage management integration.
3. VDI is driving adoption of hybrid
environments: VMware remains the
dominant go-to solution for production
servers; however, Hyper-V and XenServer
are finding a role as a cost saver for those
moving to Virtual Desktop Infrastructure.
Info-Tech Insight
4 Info-Tech Research Group Vendor Landscape: Server Virtualization
Market Overview
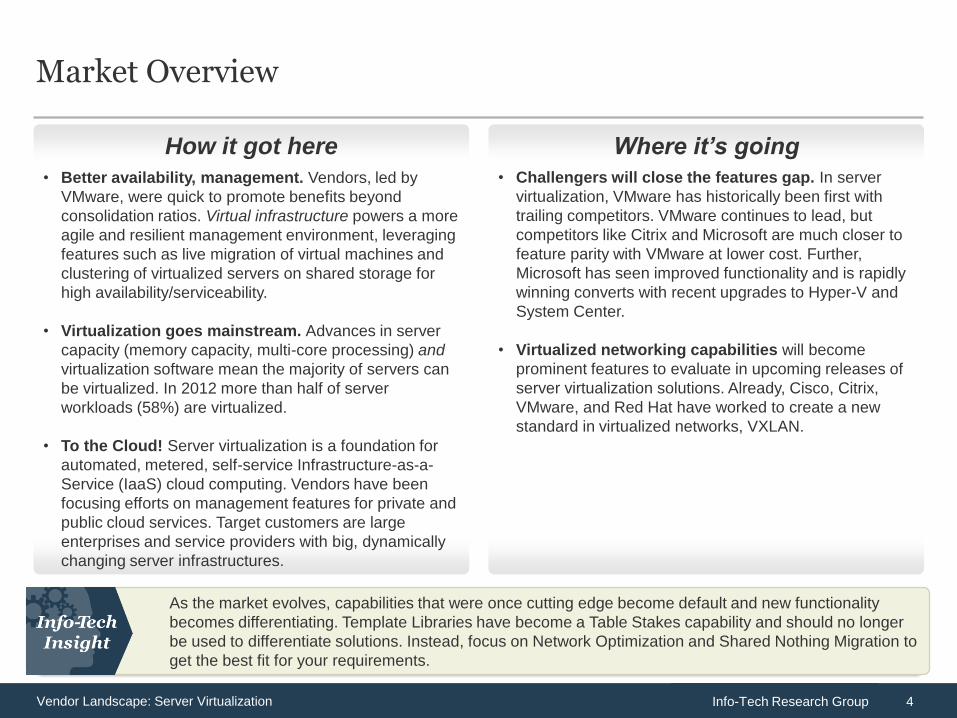
• Challengers will close the features gap. In server
virtualization, VMware has historically been first with
trailing competitors. VMware continues to lead, but
competitors like Citrix and Microsoft are much closer to
feature parity with VMware at lower cost. Further,
Microsoft has seen improved functionality and is rapidly
winning converts with recent upgrades to Hyper-V and
System Center.
• Virtualized networking capabilities will become
prominent features to evaluate in upcoming releases of
server virtualization solutions. Already, Cisco, Citrix,
VMware, and Red Hat have worked to create a new
standard in virtualized networks, VXLAN.
How it got here Where it’s going
As the market evolves, capabilities that were once cutting edge become default and new functionality
becomes differentiating. Template Libraries have become a Table Stakes capability and should no longer
be used to differentiate solutions. Instead, focus on Network Optimization and Shared Nothing Migration to
get the best fit for your requirements.
• Better availability, management. Vendors, led by
VMware, were quick to promote benefits beyond
consolidation ratios. Virtual infrastructure powers a more
agile and resilient management environment, leveraging
features such as live migration of virtual machines and
clustering of virtualized servers on shared storage for
high availability/serviceability.
• Virtualization goes mainstream. Advances in server
capacity (memory capacity, multi-core processing) and
virtualization software mean the majority of servers can
be virtualized. In 2012 more than half of server
workloads (58%) are virtualized.
• To the Cloud! Server virtualization is a foundation for
automated, metered, self-service Infrastructure-as-a-
Service (IaaS) cloud computing. Vendors have been
focusing efforts on management features for private and
public cloud services. Target customers are large
enterprises and service providers with big, dynamically
changing server infrastructures.
5 Info-Tech Research Group Vendor Landscape: Server Virtualization
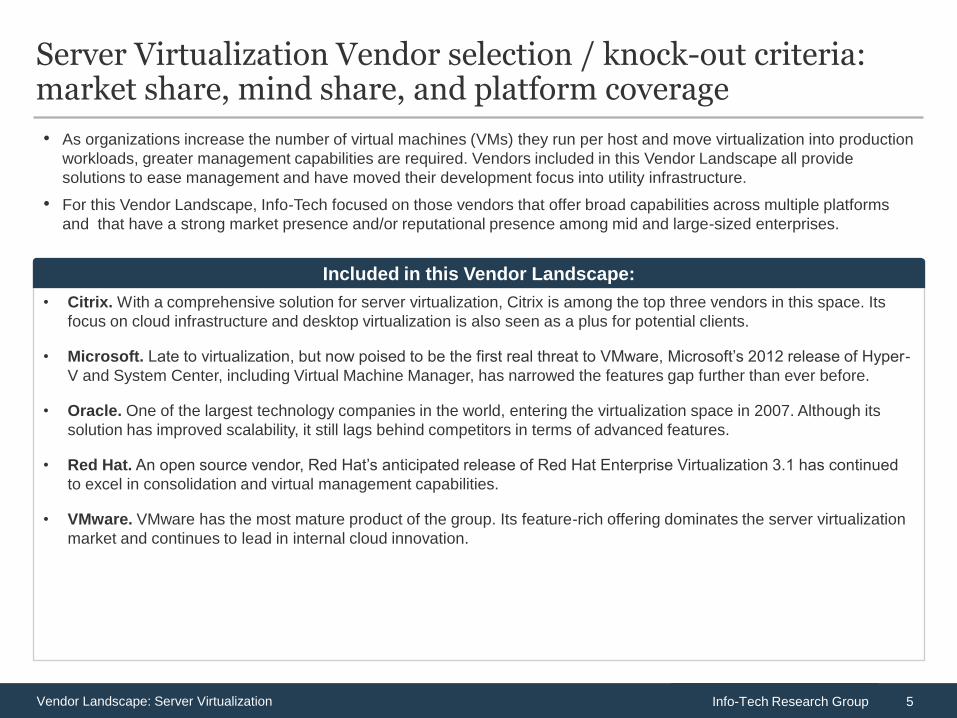
Server Virtualization Vendor selection / knock-out criteria: market share, mind share, and platform coverage
• Citrix. With a comprehensive solution for server virtualization, Citrix is among the top three vendors in this space. Its
focus on cloud infrastructure and desktop virtualization is also seen as a plus for potential clients.
• Microsoft. Late to virtualization, but now poised to be the first real threat to VMware, Microsoft’s 2012 release of Hyper-
V and System Center, including Virtual Machine Manager, has narrowed the features gap further than ever before.
• Oracle. One of the largest technology companies in the world, entering the virtualization space in 2007. Although its
solution has improved scalability, it still lags behind competitors in terms of advanced features.
• Red Hat. An open source vendor, Red Hat’s anticipated release of Red Hat Enterprise Virtualization 3.1 has continued
to excel in consolidation and virtual management capabilities.
• VMware. VMware has the most mature product of the group. Its feature-rich offering dominates the server virtualization
market and continues to lead in internal cloud innovation.
Included in this Vendor Landscape:
• As organizations increase the number of virtual machines (VMs) they run per host and move virtualization into production
workloads, greater management capabilities are required. Vendors included in this Vendor Landscape all provide
solutions to ease management and have moved their development focus into utility infrastructure.
• For this Vendor Landscape, Info-Tech focused on those vendors that offer broad capabilities across multiple platforms
and that have a strong market presence and/or reputational presence among mid and large-sized enterprises.
6 Info-Tech Research Group Vendor Landscape: Server Virtualization
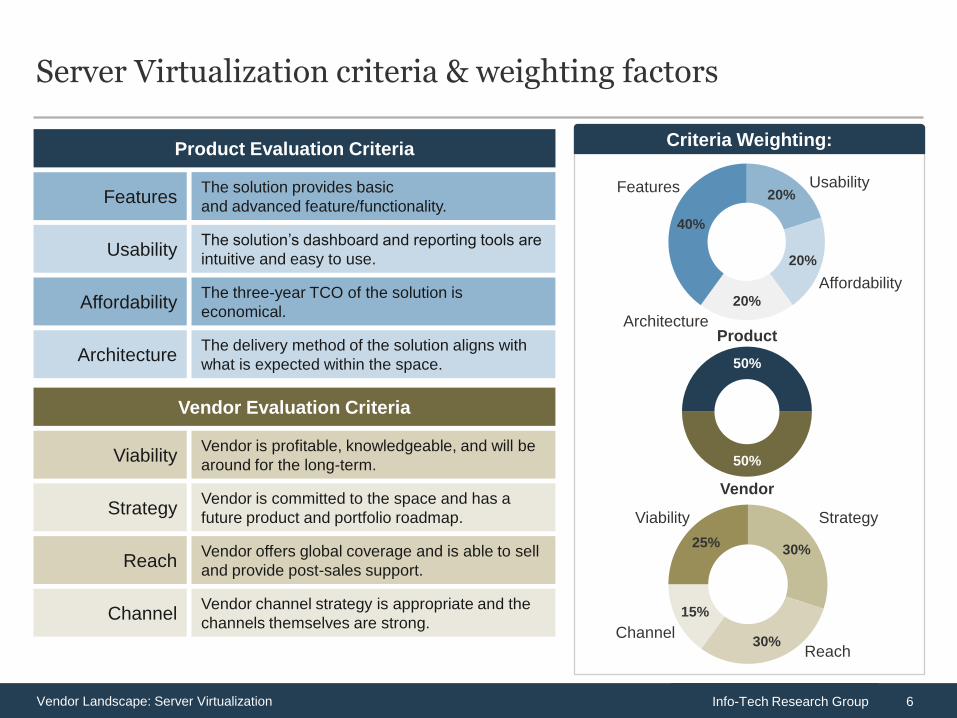
Criteria Weighting:
Server Virtualization criteria & weighting factors
20%
20%
20%
40%
50%
50%
Vendor is committed to the space and has a
future product and portfolio roadmap. Strategy
Vendor offers global coverage and is able to sell
and provide post-sales support. Reach
Vendor is profitable, knowledgeable, and will be
around for the long-term. Viability
Vendor channel strategy is appropriate and the
channels themselves are strong. Channel
The three-year TCO of the solution is
economical. Affordability
The delivery method of the solution aligns with
what is expected within the space. Architecture
The solution’s dashboard and reporting tools are
intuitive and easy to use. Usability
The solution provides basic
and advanced feature/functionality. Features
30%
30%
15%
25%
Features Usability
Architecture
Affordability
Product
Vendor
Viability Strategy
Channel
Reach
Product Evaluation Criteria
Vendor Evaluation Criteria
7 Info-Tech Research Group Vendor Landscape: Server Virtualization
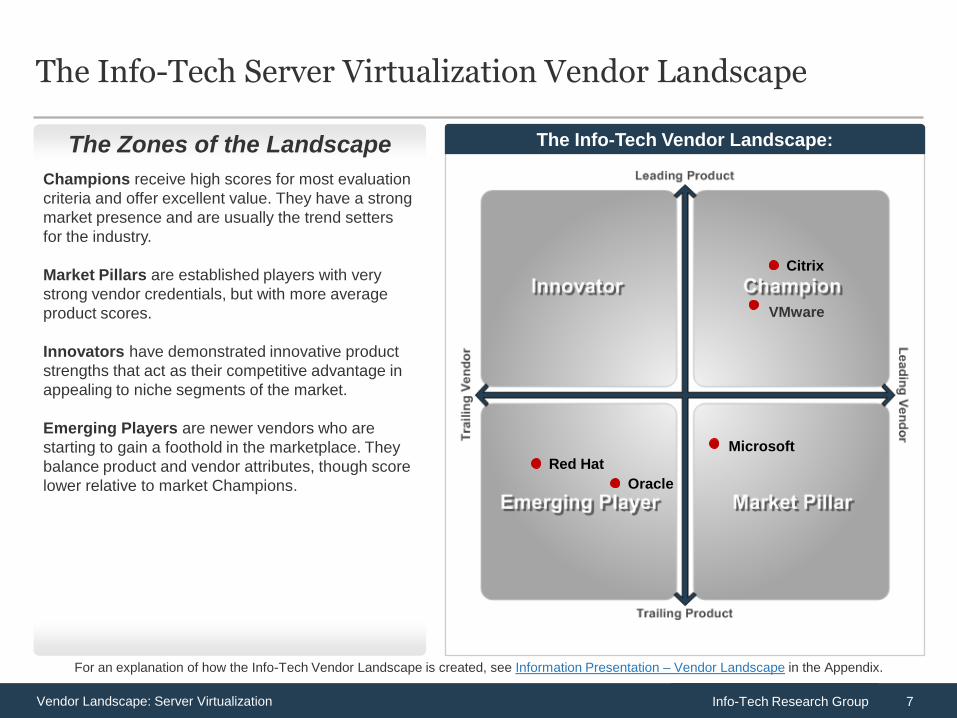
The Info-Tech Vendor Landscape:
The Info-Tech Server Virtualization Vendor Landscape
Champions receive high scores for most evaluation
criteria and offer excellent value. They have a strong
market presence and are usually the trend setters
for the industry.
Market Pillars are established players with very
strong vendor credentials, but with more average
product scores.
Innovators have demonstrated innovative product
strengths that act as their competitive advantage in
appealing to niche segments of the market.
Emerging Players are newer vendors who are
starting to gain a foothold in the marketplace. They
balance product and vendor attributes, though score
lower relative to market Champions.
For an explanation of how the Info-Tech Vendor Landscape is created, see Information Presentation – Vendor Landscape in the Appendix.
The Zones of the Landscape
Citrix
Microsoft
Oracle
Red Hat
VMware
8 Info-Tech Research Group Vendor Landscape: Server Virtualization
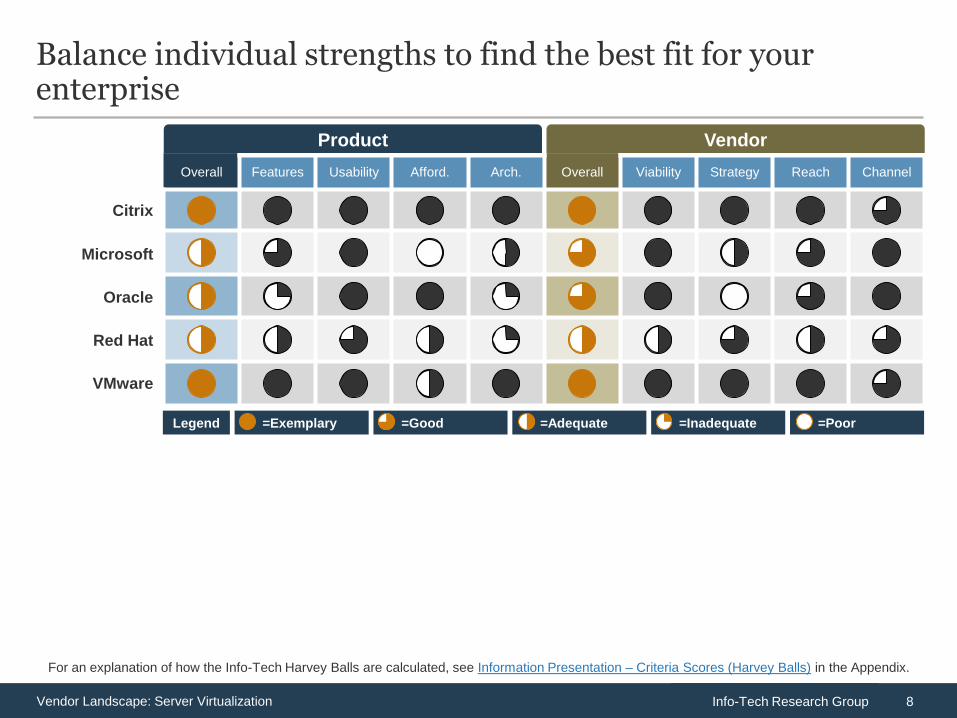
Balance individual strengths to find the best fit for your enterprise
Oracle
Microsoft
Red Hat
VMware
Citrix
Overall Features Usability Afford. Arch. Overall Viability Strategy Reach Channel
Product Vendor
=Exemplary =Good =Adequate =Inadequate =Poor Legend
For an explanation of how the Info-Tech Harvey Balls are calculated, see Information Presentation – Criteria Scores (Harvey Balls) in the Appendix.
9 Info-Tech Research Group Vendor Landscape: Server Virtualization
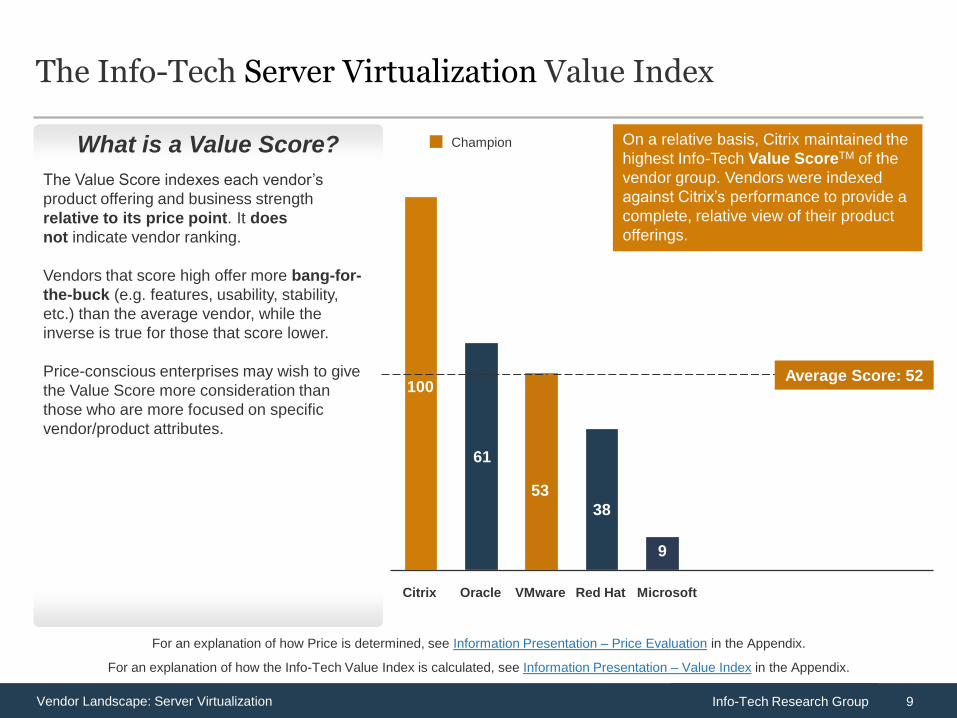
What is a Value Score?
The Info-Tech Server Virtualization Value Index
40 50 60
70 80
90
30 20
10
The Value Score indexes each vendor’s
product offering and business strength
relative to its price point. It does
not indicate vendor ranking.
Vendors that score high offer more bang-for-
the-buck (e.g. features, usability, stability,
etc.) than the average vendor, while the
inverse is true for those that score lower.
Price-conscious enterprises may wish to give
the Value Score more consideration than
those who are more focused on specific
vendor/product attributes.
On a relative basis, Citrix maintained the
highest Info-Tech Value ScoreTM of the
vendor group. Vendors were indexed
against Citrix’s performance to provide a
complete, relative view of their product
offerings.
Champion
For an explanation of how the Info-Tech Value Index is calculated, see Information Presentation – Value Index in the Appendix.
For an explanation of how Price is determined, see Information Presentation – Price Evaluation in the Appendix.
12 15
Microsoft Red Hat VMware
53
Oracle
61
Citrix
100 Average Score: 52
38
9
10 Info-Tech Research Group Vendor Landscape: Server Virtualization
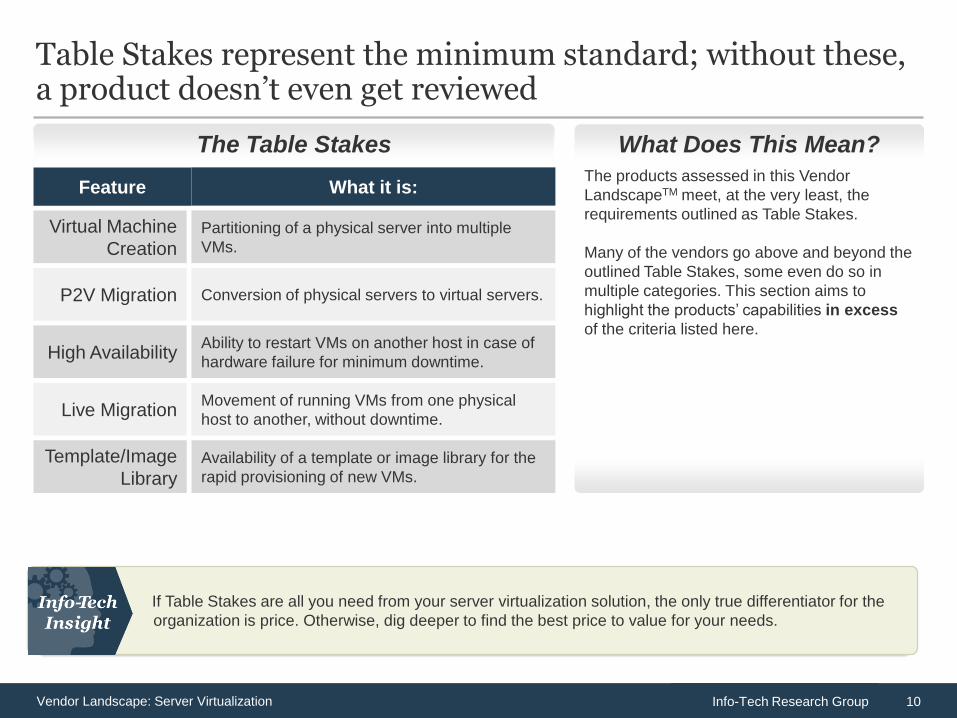
Table Stakes represent the minimum standard; without these, a product doesn’t even get reviewed
If Table Stakes are all you need from your server virtualization solution, the only true differentiator for the
organization is price. Otherwise, dig deeper to find the best price to value for your needs.
The products assessed in this Vendor
LandscapeTM meet, at the very least, the
requirements outlined as Table Stakes.
Many of the vendors go above and beyond the
outlined Table Stakes, some even do so in
multiple categories. This section aims to
highlight the products’ capabilities in excess
of the criteria listed here.
The Table Stakes What Does This Mean?
What it is: Feature
Ability to restart VMs on another host in case of
hardware failure for minimum downtime. High Availability
Movement of running VMs from one physical
host to another, without downtime. Live Migration
Conversion of physical servers to virtual servers. P2V Migration
Partitioning of a physical server into multiple
VMs.
Virtual Machine
Creation
Availability of a template or image library for the
rapid provisioning of new VMs.
Template/Image
Library
11 Info-Tech Research Group Vendor Landscape: Server Virtualization
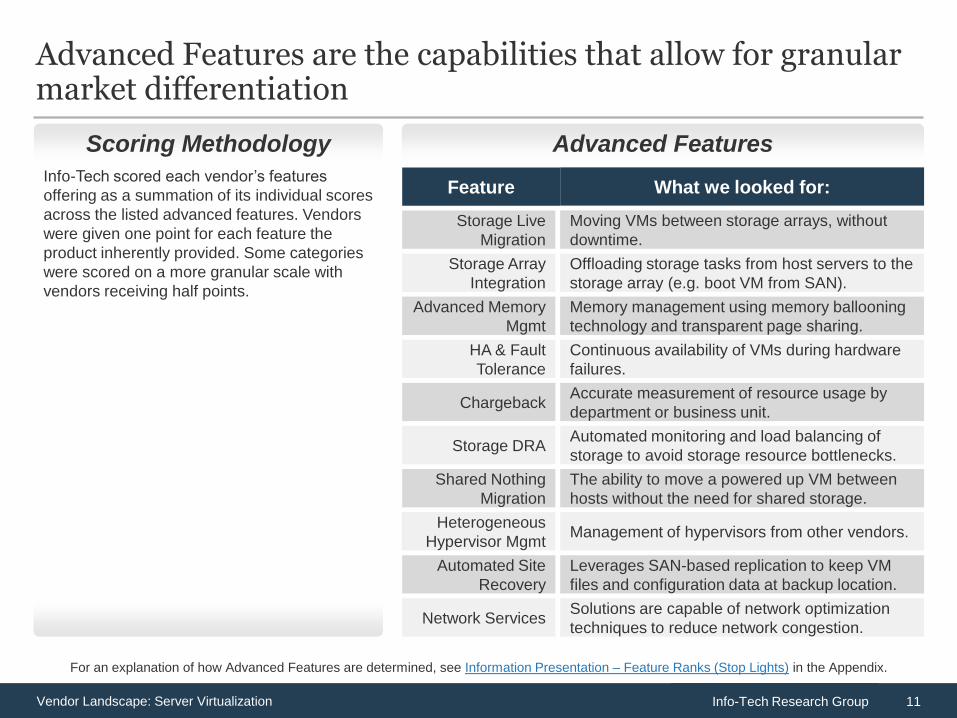
Advanced Features are the capabilities that allow for granular market differentiation
Advanced Features
Info-Tech scored each vendor’s features
offering as a summation of its individual scores
across the listed advanced features. Vendors
were given one point for each feature the
product inherently provided. Some categories
were scored on a more granular scale with
vendors receiving half points.
Scoring Methodology
Memory management using memory ballooning
technology and transparent page sharing.
Advanced Memory
Mgmt
Continuous availability of VMs during hardware
failures.
HA & Fault
Tolerance
Offloading storage tasks from host servers to the
storage array (e.g. boot VM from SAN).
Storage Array
Integration
Moving VMs between storage arrays, without
downtime.
Storage Live
Migration
Accurate measurement of resource usage by
department or business unit. Chargeback
Automated monitoring and load balancing of
storage to avoid storage resource bottlenecks. Storage DRA
The ability to move a powered up VM between
hosts without the need for shared storage.
Shared Nothing
Migration
Management of hypervisors from other vendors. Heterogeneous
Hypervisor Mgmt
Leverages SAN-based replication to keep VM
files and configuration data at backup location.
Automated Site
Recovery
Solutions are capable of network optimization
techniques to reduce network congestion. Network Services
What we looked for: Feature
For an explanation of how Advanced Features are determined, see Information Presentation – Feature Ranks (Stop Lights) in the Appendix.
12 Info-Tech Research Group Vendor Landscape: Server Virtualization
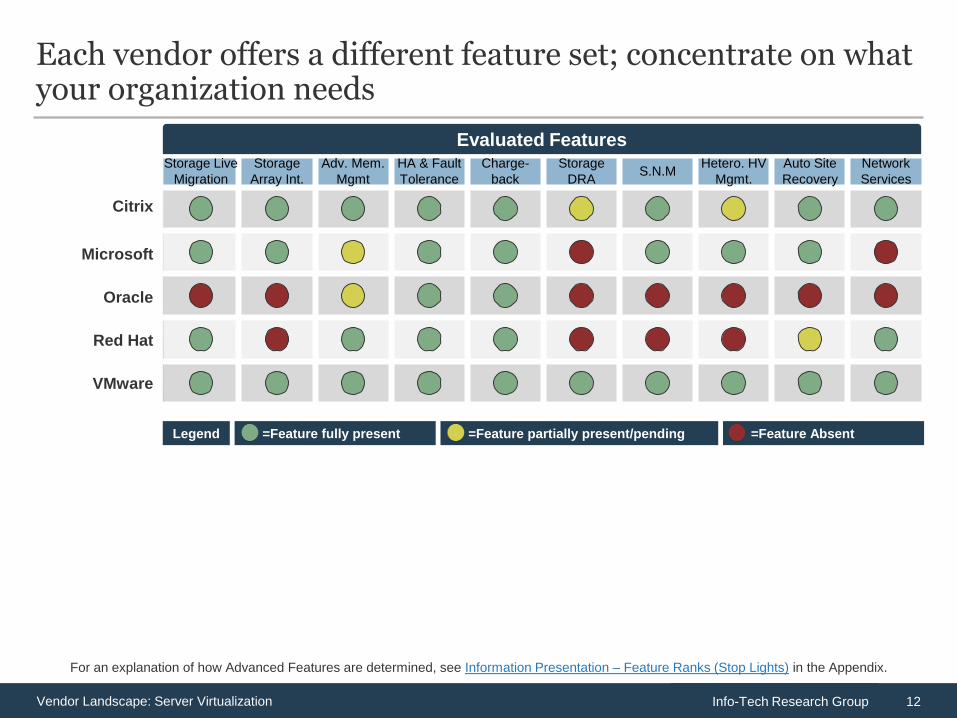
Each vendor offers a different feature set; concentrate on what your organization needs
Oracle
Microsoft
Red Hat
VMware
Citrix
Storage Live
Migration
Storage
Array Int.
Adv. Mem.
Mgmt
HA & Fault
Tolerance
Charge-
back
Storage
DRA S.N.M
Hetero. HV
Mgmt.
Auto Site
Recovery
Network
Services
Evaluated Features
=Feature Absent =Feature partially present/pending =Feature fully present Legend
For an explanation of how Advanced Features are determined, see Information Presentation – Feature Ranks (Stop Lights) in the Appendix.
13 Info-Tech Research Group Vendor Landscape: Server Virtualization
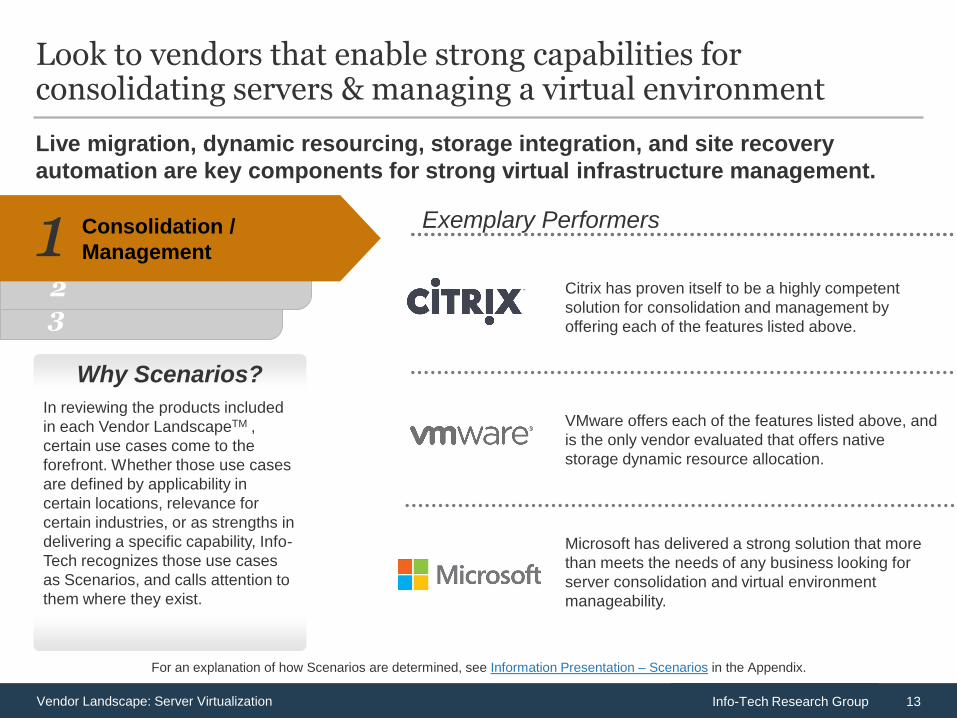
Live migration, dynamic resourcing, storage integration, and site recovery
automation are key components for strong virtual infrastructure management.
Look to vendors that enable strong capabilities for consolidating servers & managing a virtual environment
Why Scenarios?
In reviewing the products included
in each Vendor LandscapeTM ,
certain use cases come to the
forefront. Whether those use cases
are defined by applicability in
certain locations, relevance for
certain industries, or as strengths in
delivering a specific capability, Info-
Tech recognizes those use cases
as Scenarios, and calls attention to
them where they exist.
3 2
Consolidation /
Management 1
For an explanation of how Scenarios are determined, see Information Presentation – Scenarios in the Appendix.
Exemplary Performers
Citrix has proven itself to be a highly competent
solution for consolidation and management by
offering each of the features listed above.
VMware offers each of the features listed above, and
is the only vendor evaluated that offers native
storage dynamic resource allocation.
Microsoft has delivered a strong solution that more
than meets the needs of any business looking for
server consolidation and virtual environment
manageability.
14 Info-Tech Research Group Vendor Landscape: Server Virtualization
For an explanation of how Scenarios are determined, see Information Presentation – Scenarios in the Appendix.
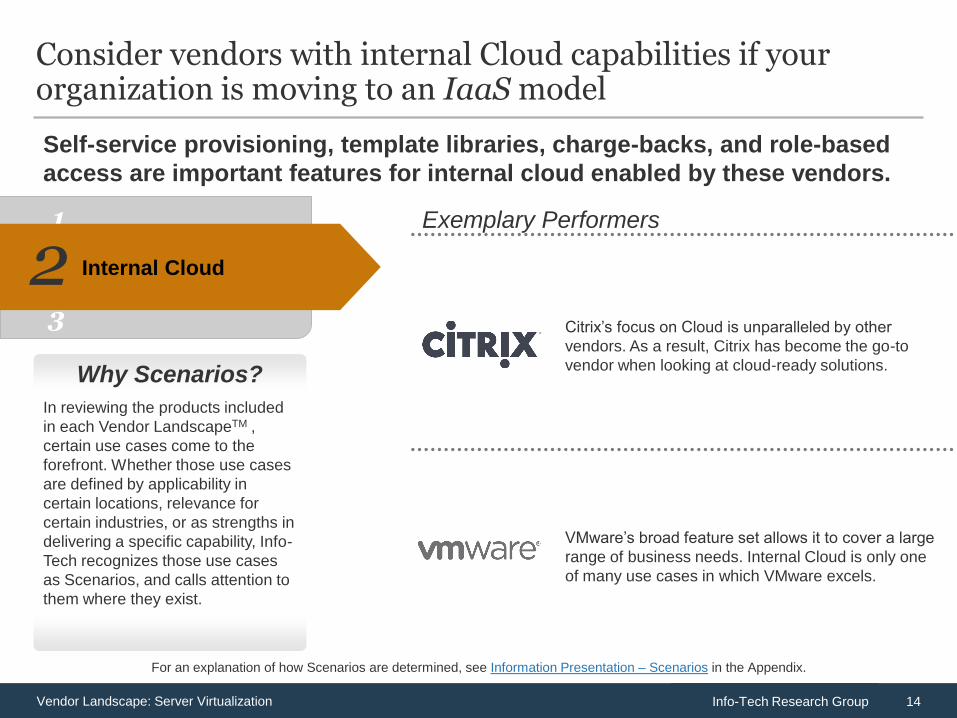
Self-service provisioning, template libraries, charge-backs, and role-based
access are important features for internal cloud enabled by these vendors.
Consider vendors with internal Cloud capabilities if your organization is moving to an IaaS model
Why Scenarios?
In reviewing the products included
in each Vendor LandscapeTM ,
certain use cases come to the
forefront. Whether those use cases
are defined by applicability in
certain locations, relevance for
certain industries, or as strengths in
delivering a specific capability, Info-
Tech recognizes those use cases
as Scenarios, and calls attention to
them where they exist.
3
1
Internal Cloud 2 Exemplary Performers
Citrix’s focus on Cloud is unparalleled by other
vendors. As a result, Citrix has become the go-to
vendor when looking at cloud-ready solutions.
VMware’s broad feature set allows it to cover a large
range of business needs. Internal Cloud is only one
of many use cases in which VMware excels.
15 Info-Tech Research Group Vendor Landscape: Server Virtualization
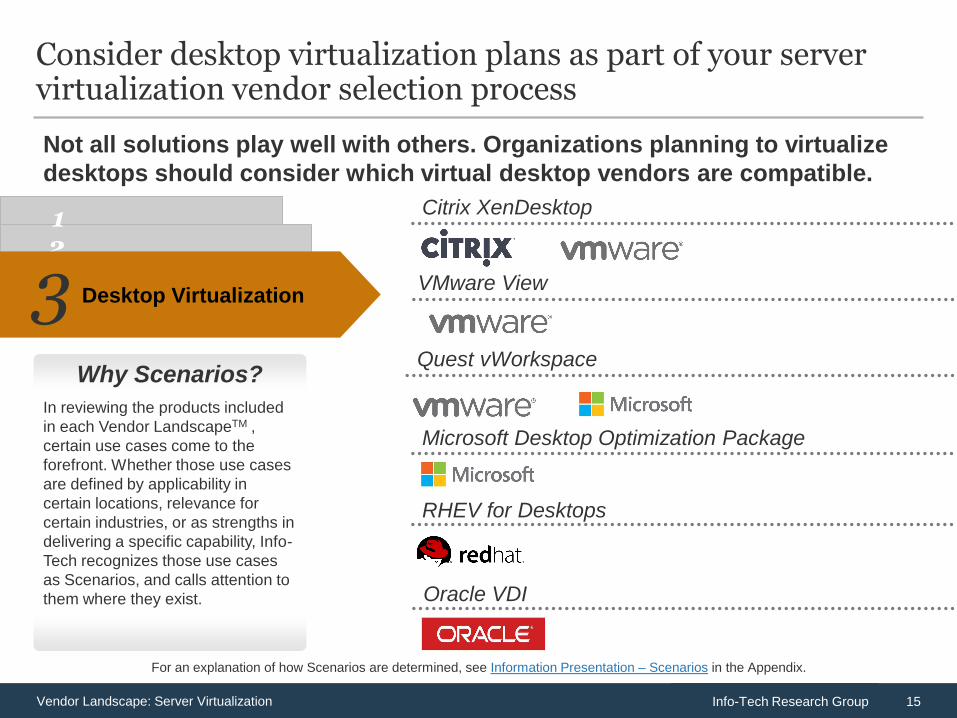
Not all solutions play well with others. Organizations planning to virtualize
desktops should consider which virtual desktop vendors are compatible.
Consider desktop virtualization plans as part of your server virtualization vendor selection process
Why Scenarios?
In reviewing the products included
in each Vendor LandscapeTM ,
certain use cases come to the
forefront. Whether those use cases
are defined by applicability in
certain locations, relevance for
certain industries, or as strengths in
delivering a specific capability, Info-
Tech recognizes those use cases
as Scenarios, and calls attention to
them where they exist.
2 1
Desktop Virtualization 3
For an explanation of how Scenarios are determined, see Information Presentation – Scenarios in the Appendix.
Citrix XenDesktop
Microsoft Desktop Optimization Package
RHEV for Desktops
VMware View
Oracle VDI
Quest vWorkspace
16 Info-Tech Research Group Vendor Landscape: Server Virtualization
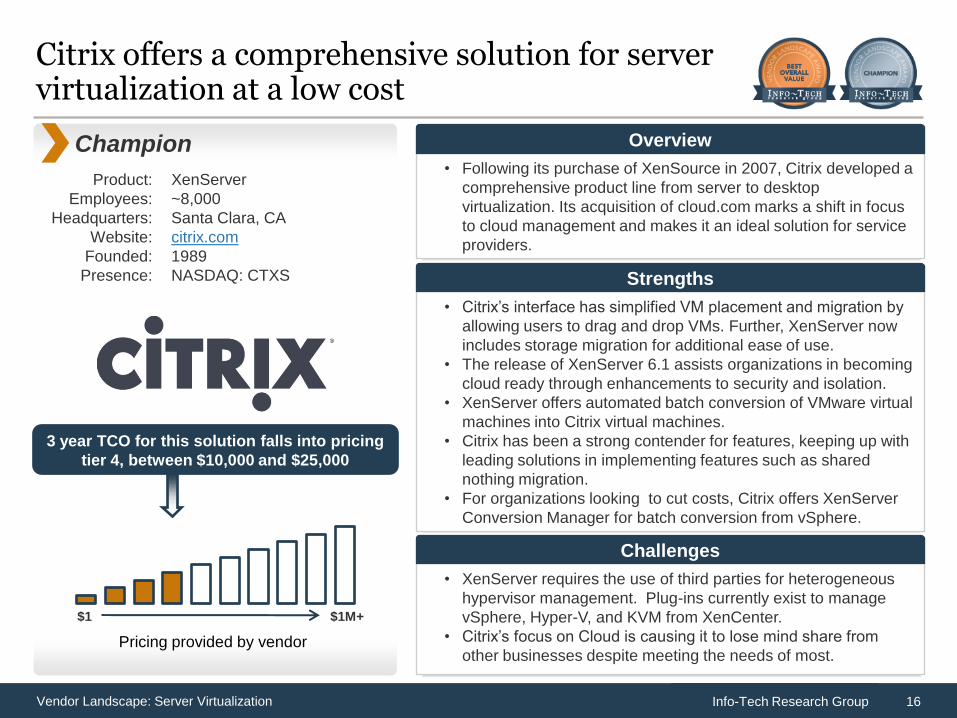
Product:
Employees:
Headquarters:
Website:
Founded:
Presence:
XenServer
~8,000
Santa Clara, CA
citrix.com
1989
NASDAQ: CTXS
Citrix offers a comprehensive solution for server virtualization at a low cost
Champion • Following its purchase of XenSource in 2007, Citrix developed a
comprehensive product line from server to desktop
virtualization. Its acquisition of cloud.com marks a shift in focus
to cloud management and makes it an ideal solution for service
providers.
Overview
• Citrix’s interface has simplified VM placement and migration by
allowing users to drag and drop VMs. Further, XenServer now
includes storage migration for additional ease of use.
• The release of XenServer 6.1 assists organizations in becoming
cloud ready through enhancements to security and isolation.
• XenServer offers automated batch conversion of VMware virtual
machines into Citrix virtual machines.
• Citrix has been a strong contender for features, keeping up with
leading solutions in implementing features such as shared
nothing migration.
• For organizations looking to cut costs, Citrix offers XenServer
Conversion Manager for batch conversion from vSphere.
Strengths
• XenServer requires the use of third parties for heterogeneous
hypervisor management. Plug-ins currently exist to manage
vSphere, Hyper-V, and KVM from XenCenter.
• Citrix’s focus on Cloud is causing it to lose mind share from
other businesses despite meeting the needs of most.
Challenges
$1 $1M+
Pricing provided by vendor
3 year TCO for this solution falls into pricing
tier 4, between $10,000 and $25,000
17 Info-Tech Research Group Vendor Landscape: Server Virtualization
Vendor Landscape
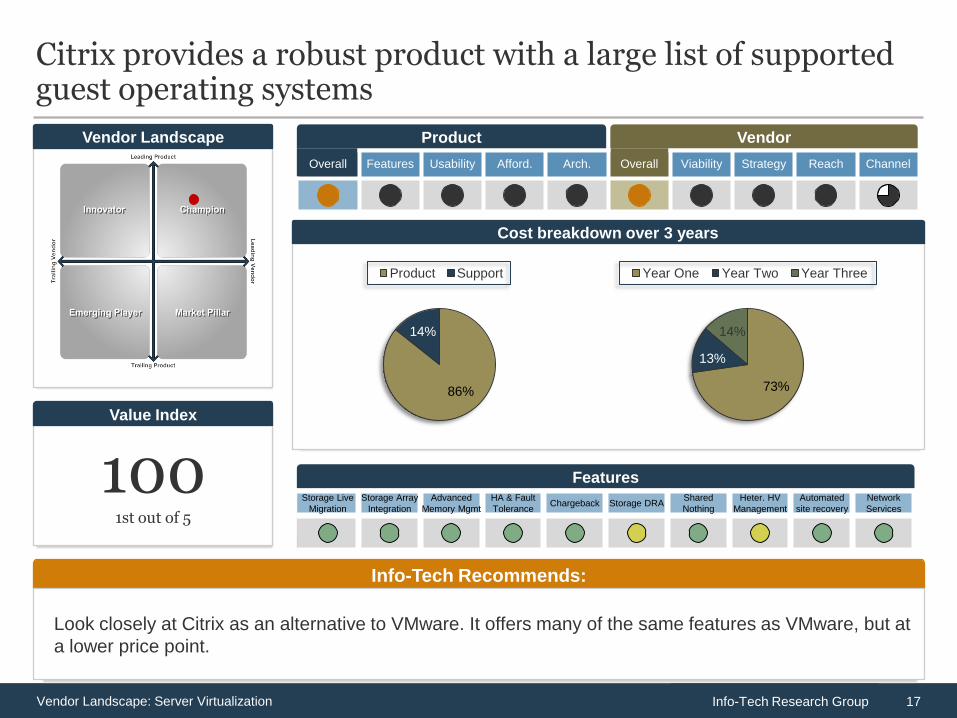
Citrix provides a robust product with a large list of supported guest operating systems
100 1st out of 5
Value Index
Info-Tech Recommends:
Look closely at Citrix as an alternative to VMware. It offers many of the same features as VMware, but at
a lower price point.
Cost breakdown over 3 years
Overall Features Usability Afford. Arch. Overall Viability Strategy Reach Channel
Product Vendor
Storage Live
Migration
Storage Array
Integration
Advanced
Memory Mgmt
HA & Fault
Tolerance Chargeback Storage DRA
Shared
Nothing
Heter. HV
Management
Automated
site recovery
Network
Services
Features
73%
13%
14%
Year One Year Two Year Three
86%
14%
Product Support
18 Info-Tech Research Group Vendor Landscape: Server Virtualization
Product:
Employees:
Headquarters:
Website:
Founded:
Presence:
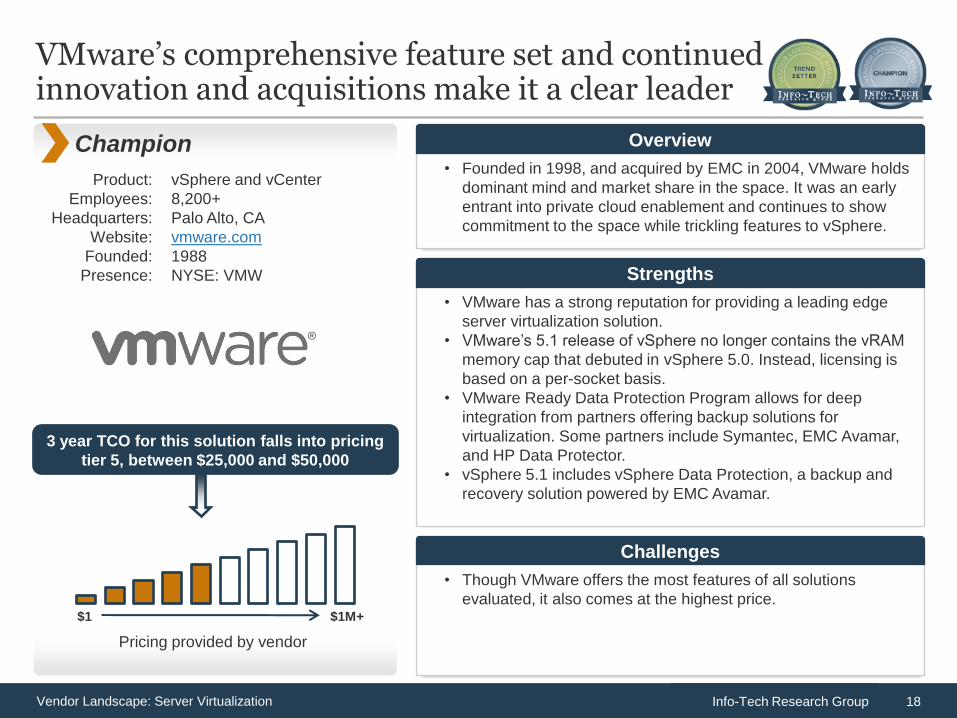
vSphere and vCenter
8,200+
Palo Alto, CA
vmware.com
1988
NYSE: VMW
VMware’s comprehensive feature set and continued innovation and acquisitions make it a clear leader
Champion • Founded in 1998, and acquired by EMC in 2004, VMware holds
dominant mind and market share in the space. It was an early
entrant into private cloud enablement and continues to show
commitment to the space while trickling features to vSphere.
Overview
• VMware has a strong reputation for providing a leading edge
server virtualization solution.
• VMware’s 5.1 release of vSphere no longer contains the vRAM
memory cap that debuted in vSphere 5.0. Instead, licensing is
based on a per-socket basis.
• VMware Ready Data Protection Program allows for deep
integration from partners offering backup solutions for
virtualization. Some partners include Symantec, EMC Avamar,
and HP Data Protector.
• vSphere 5.1 includes vSphere Data Protection, a backup and
recovery solution powered by EMC Avamar.
Strengths
• Though VMware offers the most features of all solutions
evaluated, it also comes at the highest price.
Challenges
$1 $1M+
Pricing provided by vendor
3 year TCO for this solution falls into pricing
tier 5, between $25,000 and $50,000
19 Info-Tech Research Group Vendor Landscape: Server Virtualization
Vendor Landscape
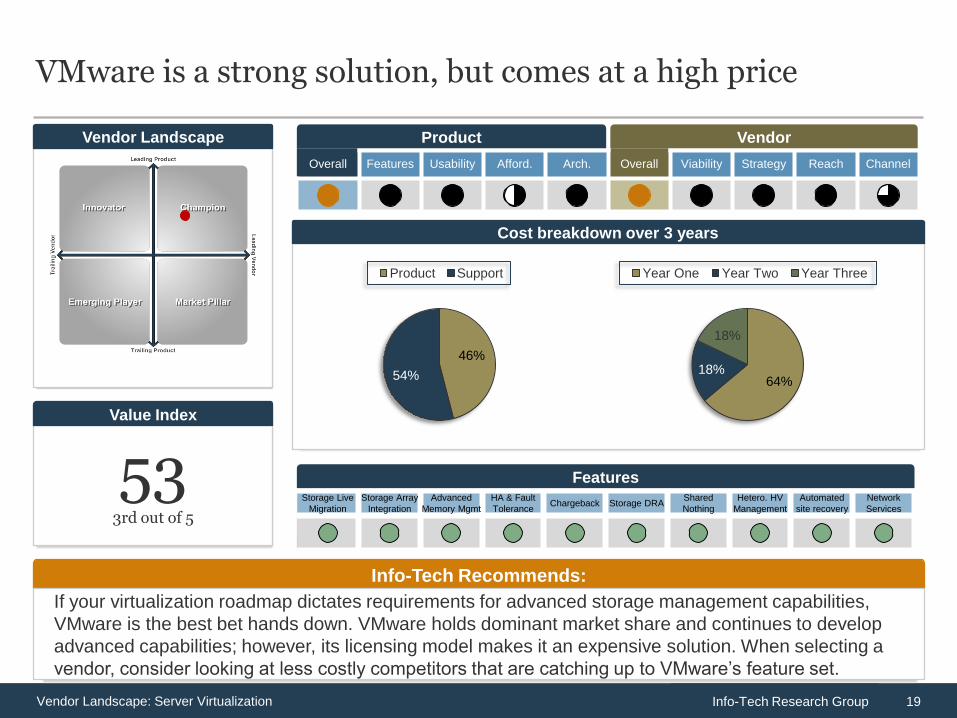
VMware is a strong solution, but comes at a high price
53 3rd out of 5
Value Index
Info-Tech Recommends:
If your virtualization roadmap dictates requirements for advanced storage management capabilities,
VMware is the best bet hands down. VMware holds dominant market share and continues to develop
advanced capabilities; however, its licensing model makes it an expensive solution. When selecting a
vendor, consider looking at less costly competitors that are catching up to VMware’s feature set.
Cost breakdown over 3 years
Overall Features Usability Afford. Arch. Overall Viability Strategy Reach Channel
Product Vendor
Storage Live
Migration
Storage Array
Integration
Advanced
Memory Mgmt
HA & Fault
Tolerance Chargeback Storage DRA
Shared
Nothing
Hetero. HV
Management
Automated
site recovery
Network
Services
Features
64% 18%
18%
Year One Year Two Year Three
46%
54%
Product Support
20 Info-Tech Research Group Vendor Landscape: Server Virtualization
Product:
Employees:
Headquarters:
Website:
Founded:
Presence:
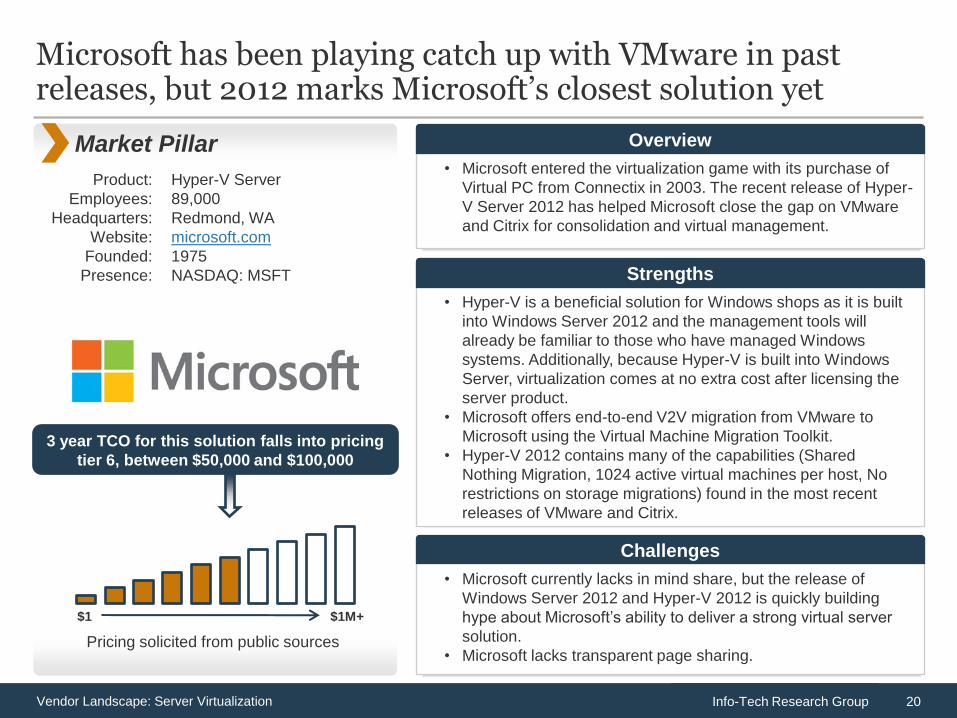
Hyper-V Server
89,000
Redmond, WA
microsoft.com
1975
NASDAQ: MSFT
Microsoft has been playing catch up with VMware in past releases, but 2012 marks Microsoft’s closest solution yet
Market Pillar • Microsoft entered the virtualization game with its purchase of
Virtual PC from Connectix in 2003. The recent release of Hyper-
V Server 2012 has helped Microsoft close the gap on VMware
and Citrix for consolidation and virtual management.
Overview
• Hyper-V is a beneficial solution for Windows shops as it is built
into Windows Server 2012 and the management tools will
already be familiar to those who have managed Windows
systems. Additionally, because Hyper-V is built into Windows
Server, virtualization comes at no extra cost after licensing the
server product.
• Microsoft offers end-to-end V2V migration from VMware to
Microsoft using the Virtual Machine Migration Toolkit.
• Hyper-V 2012 contains many of the capabilities (Shared
Nothing Migration, 1024 active virtual machines per host, No
restrictions on storage migrations) found in the most recent
releases of VMware and Citrix.
Strengths
• Microsoft currently lacks in mind share, but the release of
Windows Server 2012 and Hyper-V 2012 is quickly building
hype about Microsoft’s ability to deliver a strong virtual server
solution.
• Microsoft lacks transparent page sharing.
Challenges
$1 $1M+
3 year TCO for this solution falls into pricing
tier 6, between $50,000 and $100,000
Pricing solicited from public sources
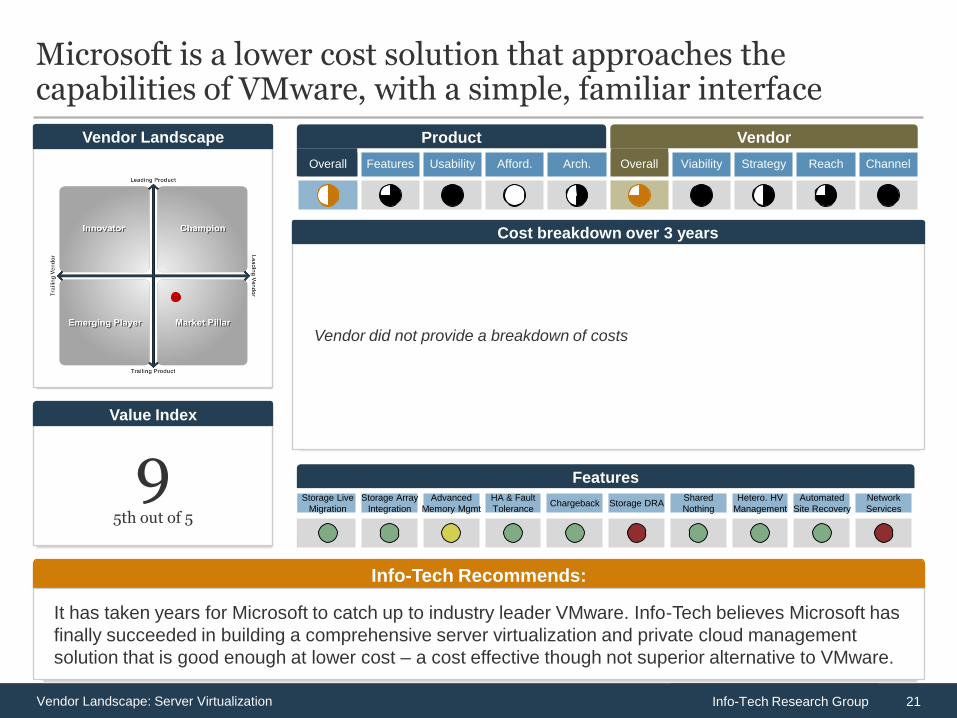
21 Info-Tech Research Group Vendor Landscape: Server Virtualization
Vendor Landscape
Microsoft is a lower cost solution that approaches the capabilities of VMware, with a simple, familiar interface
Info-Tech Recommends:
It has taken years for Microsoft to catch up to industry leader VMware. Info-Tech believes Microsoft has
finally succeeded in building a comprehensive server virtualization and private cloud management
solution that is good enough at lower cost – a cost effective though not superior alternative to VMware.
Vendor did not provide a breakdown of costs
Cost breakdown over 3 years
Overall Features Usability Afford. Arch. Overall Viability Strategy Reach Channel
Product Vendor
Storage Live
Migration
Storage Array
Integration
Advanced
Memory Mgmt
HA & Fault
Tolerance Chargeback Storage DRA
Shared
Nothing
Hetero. HV
Management
Automated
Site Recovery
Network
Services
Features 9 5th out of 5
Value Index
22 Info-Tech Research Group Vendor Landscape: Server Virtualization
Product:
Employees:
Headquarters:
Website:
Founded:
Presence:
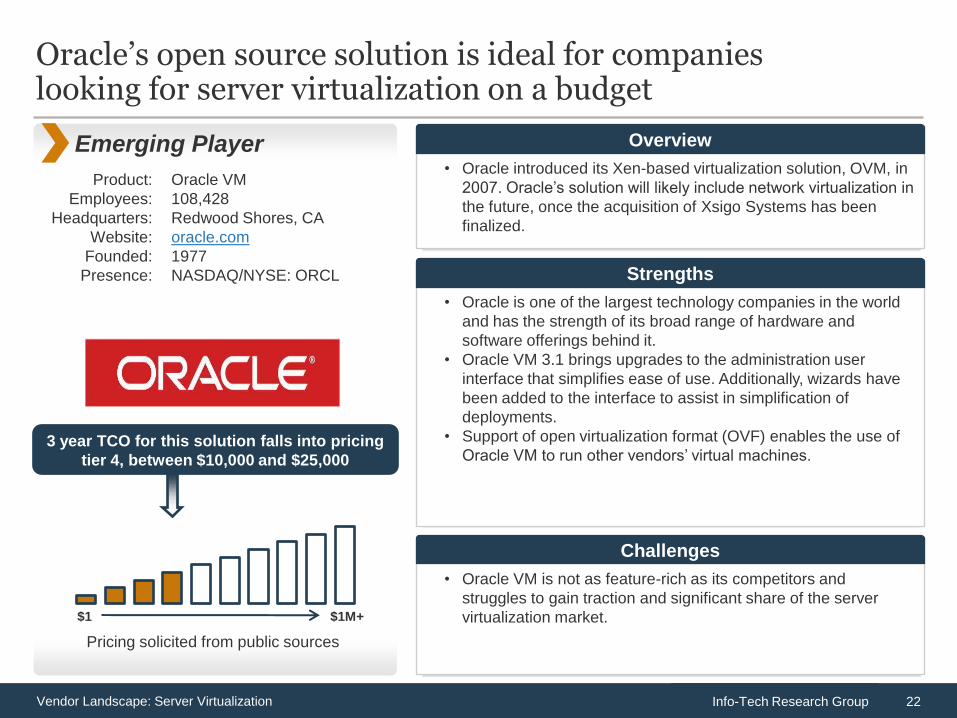
Oracle VM
108,428
Redwood Shores, CA
oracle.com
1977
NASDAQ/NYSE: ORCL
Oracle’s open source solution is ideal for companies looking for server virtualization on a budget
Emerging Player • Oracle introduced its Xen-based virtualization solution, OVM, in
2007. Oracle’s solution will likely include network virtualization in
the future, once the acquisition of Xsigo Systems has been
finalized.
Overview
• Oracle is one of the largest technology companies in the world
and has the strength of its broad range of hardware and
software offerings behind it.
• Oracle VM 3.1 brings upgrades to the administration user
interface that simplifies ease of use. Additionally, wizards have
been added to the interface to assist in simplification of
deployments.
• Support of open virtualization format (OVF) enables the use of
Oracle VM to run other vendors’ virtual machines.
Strengths
• Oracle VM is not as feature-rich as its competitors and
struggles to gain traction and significant share of the server
virtualization market.
Challenges
$1 $1M+
Pricing solicited from public sources
3 year TCO for this solution falls into pricing
tier 4, between $10,000 and $25,000
23 Info-Tech Research Group Vendor Landscape: Server Virtualization
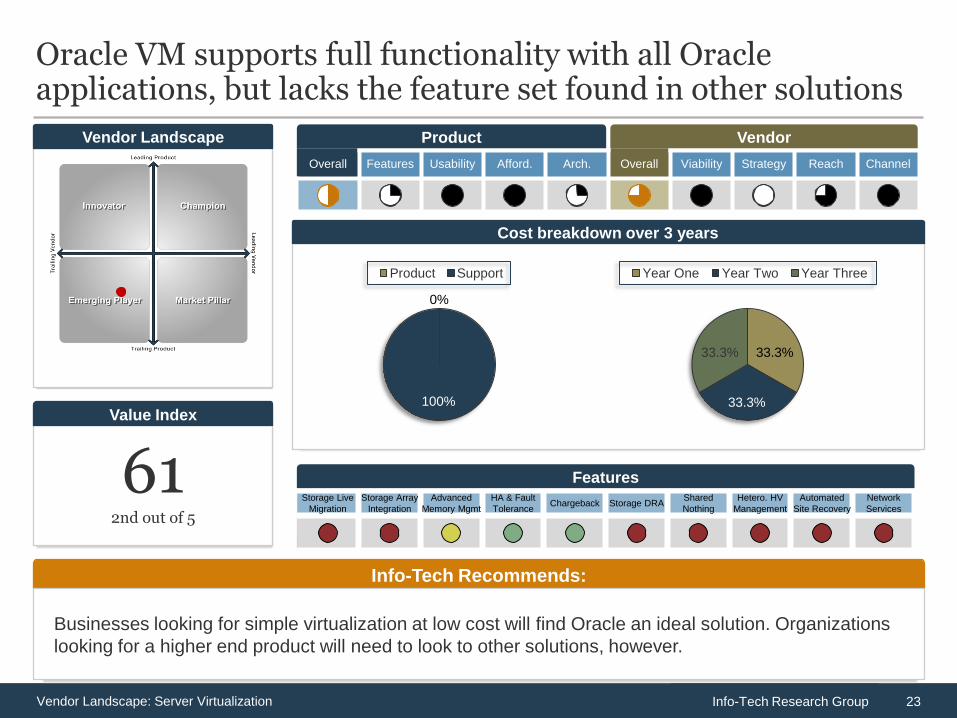
Vendor Landscape
Oracle VM supports full functionality with all Oracle applications, but lacks the feature set found in other solutions
61 2nd out of 5
Value Index
Info-Tech Recommends:
Businesses looking for simple virtualization at low cost will find Oracle an ideal solution. Organizations
looking for a higher end product will need to look to other solutions, however.
Cost breakdown over 3 years
Overall Features Usability Afford. Arch. Overall Viability Strategy Reach Channel
Product Vendor
Storage Live
Migration
Storage Array
Integration
Advanced
Memory Mgmt
HA & Fault
Tolerance Chargeback Storage DRA
Shared
Nothing
Hetero. HV
Management
Automated
Site Recovery
Network
Services
Features
33.3%
33.3%
33.3%
Year One Year Two Year Three
0%
100%
Product Support
24 Info-Tech Research Group Vendor Landscape: Server Virtualization
Product:
Employees:
Headquarters:
Website:
Founded:
Presence:
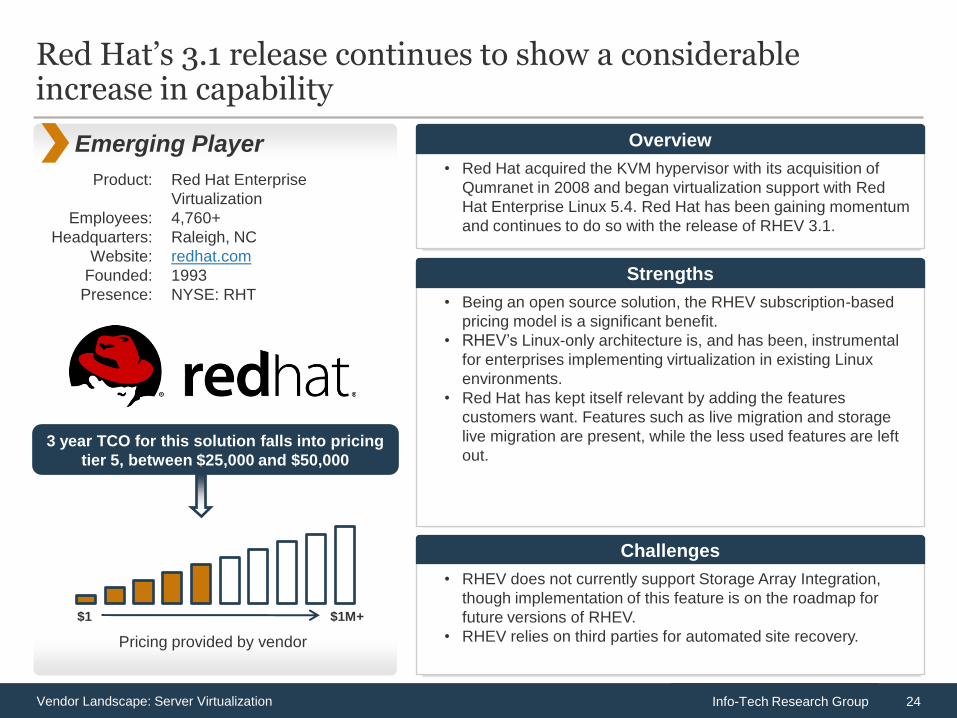
Red Hat Enterprise
Virtualization
4,760+
Raleigh, NC
redhat.com
1993
NYSE: RHT
Red Hat’s 3.1 release continues to show a considerable increase in capability
Emerging Player • Red Hat acquired the KVM hypervisor with its acquisition of
Qumranet in 2008 and began virtualization support with Red
Hat Enterprise Linux 5.4. Red Hat has been gaining momentum
and continues to do so with the release of RHEV 3.1.
Overview
• Being an open source solution, the RHEV subscription-based
pricing model is a significant benefit.
• RHEV’s Linux-only architecture is, and has been, instrumental
for enterprises implementing virtualization in existing Linux
environments.
• Red Hat has kept itself relevant by adding the features
customers want. Features such as live migration and storage
live migration are present, while the less used features are left
out.
Strengths
• RHEV does not currently support Storage Array Integration,
though implementation of this feature is on the roadmap for
future versions of RHEV.
• RHEV relies on third parties for automated site recovery.
Challenges
$1 $1M+
Pricing provided by vendor
3 year TCO for this solution falls into pricing
tier 5, between $25,000 and $50,000
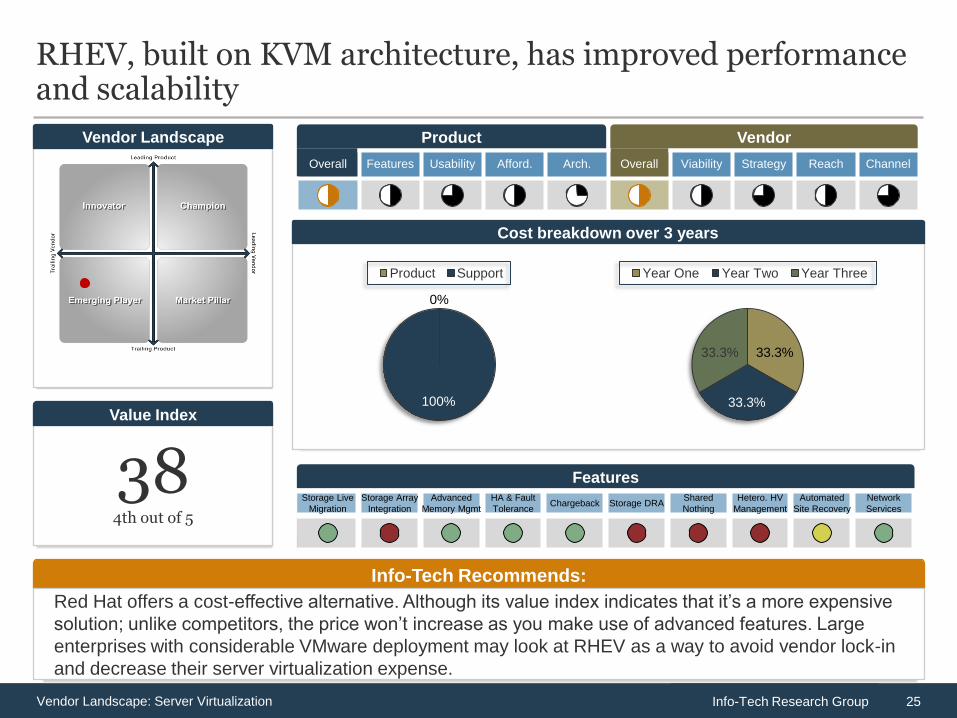
25 Info-Tech Research Group Vendor Landscape: Server Virtualization
Vendor Landscape
RHEV, built on KVM architecture, has improved performance and scalability
38 4th out of 5
Value Index
Info-Tech Recommends:
Red Hat offers a cost-effective alternative. Although its value index indicates that it’s a more expensive
solution; unlike competitors, the price won’t increase as you make use of advanced features. Large
enterprises with considerable VMware deployment may look at RHEV as a way to avoid vendor lock-in
and decrease their server virtualization expense.
Cost breakdown over 3 years
Overall Features Usability Afford. Arch. Overall Viability Strategy Reach Channel
Product Vendor
Storage Live
Migration
Storage Array
Integration
Advanced
Memory Mgmt
HA & Fault
Tolerance Chargeback Storage DRA
Shared
Nothing
Hetero. HV
Management
Automated
Site Recovery
Network
Services
Features
33.3%
33.3%
33.3%
Year One Year Two Year Three
0%
100%
Product Support
26 Info-Tech Research Group Vendor Landscape: Server Virtualization
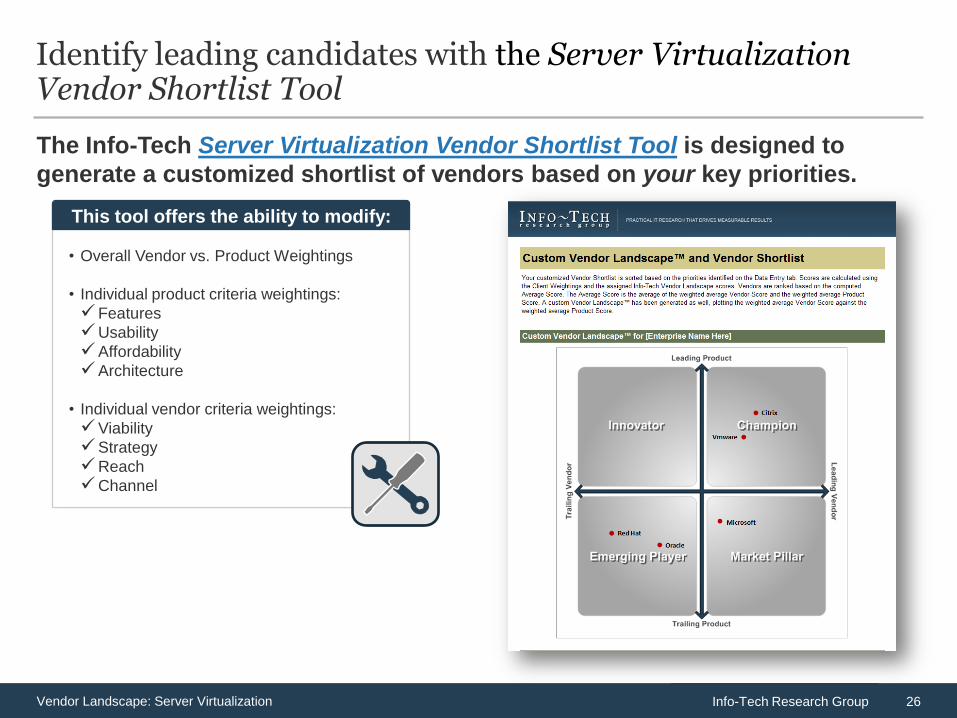
The Info-Tech Server Virtualization Vendor Shortlist Tool is designed to
generate a customized shortlist of vendors based on your key priorities.
Identify leading candidates with the Server Virtualization Vendor Shortlist Tool
• Overall Vendor vs. Product Weightings
• Individual product criteria weightings:
Features
Usability
Affordability
Architecture
• Individual vendor criteria weightings:
Viability
Strategy
Reach
Channel
This tool offers the ability to modify:
27 Info-Tech Research Group Vendor Landscape: Server Virtualization
Appendix
1. Vendor Landscape Methodology: Overview
2. Vendor Landscape Methodology: Product Selection & Information Gathering
3. Vendor Landscape Methodology: Scoring
4. Vendor Landscape Methodology: Information Presentation
5. Vendor Landscape Methodology: Fact Check & Publication
6. Product Pricing Scenario
28 Info-Tech Research Group Vendor Landscape: Server Virtualization
Vendor Landscape Methodology: Overview
Info-Tech’s Vendor Landscapes are research materials that review a particular IT market space, evaluating the strengths and abilities of both
the products available in that space, as well as the vendors of those products. These materials are created by a team of dedicated analysts
operating under the direction of a senior subject matter expert over a period of six weeks.
Evaluations weigh selected vendors and their products (collectively “solutions”) on the following eight criteria to determine overall standing:
• Features: The presence of advanced and market-differentiating capabilities.
• Usability: The intuitiveness, power, and integrated nature of administrative consoles and client software components.
• Affordability: The three-year total cost of ownership of the solution.
• Architecture: The degree of integration with the vendor’s other tools, flexibility of deployment, and breadth of platform applicability.
• Viability: The stability of the company as measured by its history in the market, the size of its client base, and its financial performance.
• Strategy: The commitment to both the market-space, as well as to the various sized clients (small, mid-sized, and enterprise clients).
• Reach: The ability of the vendor to support its products on a global scale.
• Channel: The measure of the size of the vendor’s channel partner program, as well as any channel strengthening strategies.
Evaluated solutions are plotted on a standard two by two matrix:
• Champions: Both the product and the vendor receive scores that are above the average score for the evaluated group.
• Innovators: The product receives a score that is above the average score for the evaluated group, but the vendor receives a score that is
below the average score for the evaluated group.
• Market Pillars: The product receives a score that is below the average score for the evaluated group, but the vendor receives a score that
is above the average score for the evaluated group.
• Emerging Players: Both the product and the vendor receive scores that are below the average score for the evaluated group.
Info-Tech’s Vendor Landscapes are researched and produced according to a strictly adhered to process that includes the following steps:
• Vendor/product selection
• Information gathering
• Vendor/product scoring
• Information presentation
• Fact checking
• Publication
This document outlines how each of these steps is conducted.
29 Info-Tech Research Group Vendor Landscape: Server Virtualization
Vendor Landscape Methodology: Vendor/Product Selection & Information Gathering
Info-Tech works closely with its client base to solicit guidance in terms of understanding the vendors with whom clients wish to work and the
products that they wish evaluated; this demand pool forms the basis of the vendor selection process for Vendor Landscapes. Balancing this
demand, Info-Tech also relies upon the deep subject matter expertise and market awareness of its Senior and Lead Research Analysts to
ensure that appropriate solutions are included in the evaluation. As an aspect of that expertise and awareness, Info-Tech’s analysts may, at
their discretion, determine the specific capabilities that are required of the products under evaluation, and include in the Vendor Landscape
only those solutions that meet all specified requirements.
Information on vendors and products is gathered in a number of ways via a number of channels.
Initially, a request package is submitted to vendors to solicit information on a broad range of topics. The request package includes:
• A detailed survey.
• A pricing scenario (see Vendor Landscape Methodology: Price Evaluation and Pricing Scenario, below).
• A request for reference clients.
• A request for a briefing and, where applicable, guided product demonstration.
These request packages are distributed approximately twelve weeks prior to the initiation of the actual research project to allow vendors ample
time to consolidate the required information and schedule appropriate resources.
During the course of the research project, briefings and demonstrations are scheduled (generally for one hour each session, though more time
is scheduled as required) to allow the analyst team to discuss the information provided in the survey, validate vendor claims, and gain direct
exposure to the evaluated products. Additionally, an end-user survey is circulated to Info-Tech’s client base and vendor-supplied reference
accounts are interviewed to solicit their feedback on their experiences with the evaluated solutions and with the vendors of those solutions.
These materials are supplemented by a thorough review of all product briefs, technical manuals, and publicly available marketing materials
about the product, as well as about the vendor itself.
Refusal by a vendor to supply completed surveys or submit to participation in briefings and demonstrations does not eliminate a vendor from
inclusion in the evaluation. Where analyst and client input has determined that a vendor belongs in a particular evaluation, it will be evaluated
as best as possible based on publicly available materials only. As these materials are not as comprehensive as a survey, briefing, and
demonstration, the possibility exists that the evaluation may not be as thorough or accurate. Since Info-Tech includes vendors regardless of
vendor participation, it is always in the vendor’s best interest to participate fully.
All information is recorded and catalogued, as required, to facilitate scoring and for future reference.
30 Info-Tech Research Group Vendor Landscape: Server Virtualization
Vendor Landscape Methodology: Scoring
Once all information has been gathered and evaluated for all vendors and products, the analyst team moves to scoring. All scoring is
performed at the same time so as to ensure as much consistency as possible. Each criterion is scored on a ten point scale, though the manner
of scoring for criteria differs slightly:
• Features is scored via Cumulative Scoring
• Affordability is scored via Scalar Scoring
• All other criteria are scored via Base5 Scoring
In Cumulative Scoring, a single point is assigned to each evaluated feature that is regarded as being fully present, a half point to each feature
that is partially present or pending in an upcoming release, and zero points to features that are deemed to be absent. The assigned points are
summed and normalized to a value out of ten. For example, if a particular Vendor Landscape evaluates eight specific features in the Feature
Criteria, the summed score out of eight for each evaluated product would be multiplied by 1.25 to yield a value out of ten.
In Scalar Scoring, a score of ten is assigned to the lowest cost solution, and a score of one is assigned to the highest cost solution. All other
solutions are assigned a mathematically determined score based on their proximity to / distance from these two endpoints. For example, in an
evaluation of three solutions, where the middle cost solution is closer to the low end of the pricing scale it will receive a higher score, and
where it is closer to the high end of the pricing scale it will receive a lower score; depending on proximity to the high or low price it is entirely
possible that it could receive either ten points (if it is very close to the lowest price) or one point (if it is very close to the highest price). Where
pricing cannot be determined (vendor does not supply price and public sources do not exist), a score of 0 is automatically assigned.
In Base5 scoring a number of sub-criteria are specified for each criterion (for example, Longevity, Market Presence, and Financials are sub-
criteria of the Viability criterion), and each one is scored on the following scale:
5 - The product/vendor is exemplary in this area (nothing could be done to improve the status).
4 - The product/vendor is good in this area (small changes could be made that would move things to the next level).
3 - The product/vendor is adequate in this area (small changes would make it good, more significant changes required to be exemplary).
2 - The product/vendor is poor in this area (this is a notable weakness and significant work is required).
1 - The product/vendor is terrible/fails in this area (this is a glaring oversight and a serious impediment to adoption).
The assigned points are summed and normalized to a value out of ten as explained in Cumulative Scoring above.
Scores out of ten, known as Raw scores, are transposed as-is into Info-Tech’s Vendor Landscape Shortlist Tool, which automatically
determines Vendor Landscape positioning (see Vendor Landscape Methodology: Information Presentation - Vendor Landscape, below),
Criteria Score (see Vendor Landscape Methodology: Information Presentation - Criteria Score, below), and Value Index (see Vendor
Landscape Methodology: Information Presentation - Value Index, below).
31 Info-Tech Research Group Vendor Landscape: Server Virtualization
Vendor Landscape Methodology: Information Presentation – Vendor Landscape
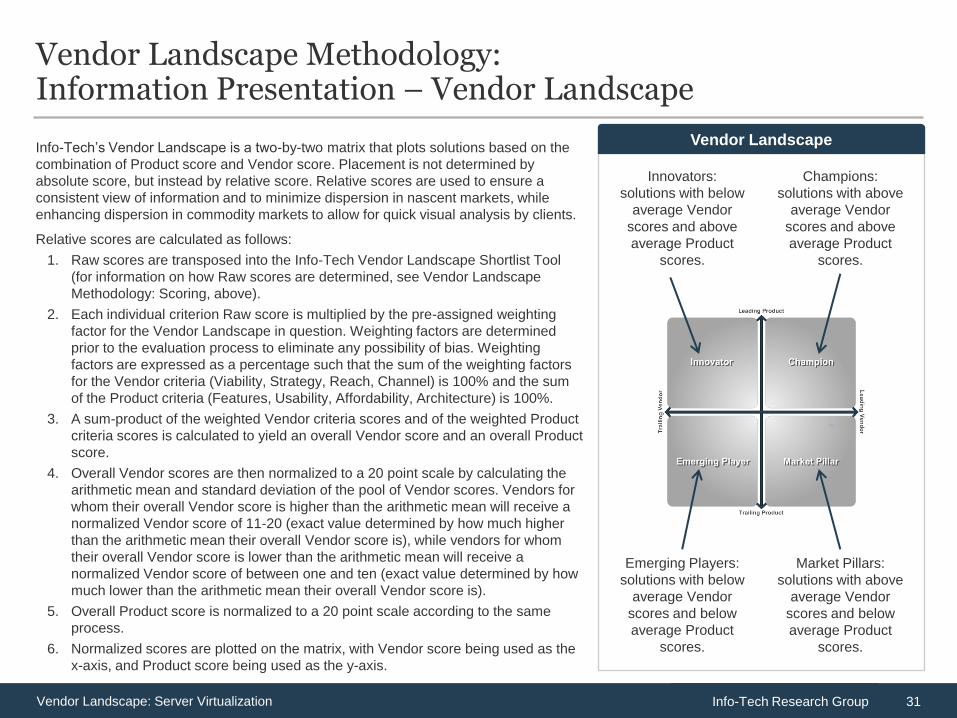
Info-Tech’s Vendor Landscape is a two-by-two matrix that plots solutions based on the
combination of Product score and Vendor score. Placement is not determined by
absolute score, but instead by relative score. Relative scores are used to ensure a
consistent view of information and to minimize dispersion in nascent markets, while
enhancing dispersion in commodity markets to allow for quick visual analysis by clients.
Relative scores are calculated as follows:
1. Raw scores are transposed into the Info-Tech Vendor Landscape Shortlist Tool
(for information on how Raw scores are determined, see Vendor Landscape
Methodology: Scoring, above).
2. Each individual criterion Raw score is multiplied by the pre-assigned weighting
factor for the Vendor Landscape in question. Weighting factors are determined
prior to the evaluation process to eliminate any possibility of bias. Weighting
factors are expressed as a percentage such that the sum of the weighting factors
for the Vendor criteria (Viability, Strategy, Reach, Channel) is 100% and the sum
of the Product criteria (Features, Usability, Affordability, Architecture) is 100%.
3. A sum-product of the weighted Vendor criteria scores and of the weighted Product
criteria scores is calculated to yield an overall Vendor score and an overall Product
score.
4. Overall Vendor scores are then normalized to a 20 point scale by calculating the
arithmetic mean and standard deviation of the pool of Vendor scores. Vendors for
whom their overall Vendor score is higher than the arithmetic mean will receive a
normalized Vendor score of 11-20 (exact value determined by how much higher
than the arithmetic mean their overall Vendor score is), while vendors for whom
their overall Vendor score is lower than the arithmetic mean will receive a
normalized Vendor score of between one and ten (exact value determined by how
much lower than the arithmetic mean their overall Vendor score is).
5. Overall Product score is normalized to a 20 point scale according to the same
process.
6. Normalized scores are plotted on the matrix, with Vendor score being used as the
x-axis, and Product score being used as the y-axis.
Vendor Landscape
Champions:
solutions with above
average Vendor
scores and above
average Product
scores.
Innovators:
solutions with below
average Vendor
scores and above
average Product
scores.
Market Pillars:
solutions with above
average Vendor
scores and below
average Product
scores.
Emerging Players:
solutions with below
average Vendor
scores and below
average Product
scores.
32 Info-Tech Research Group Vendor Landscape: Server Virtualization
Harvey Balls
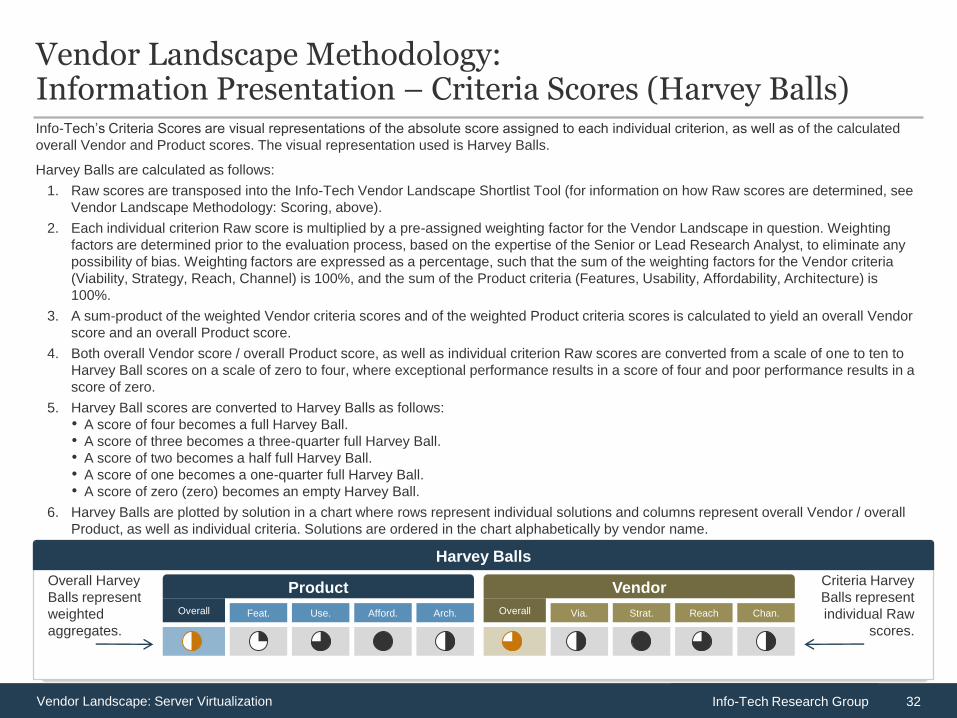
Vendor Landscape Methodology: Information Presentation – Criteria Scores (Harvey Balls) Info-Tech’s Criteria Scores are visual representations of the absolute score assigned to each individual criterion, as well as of the calculated
overall Vendor and Product scores. The visual representation used is Harvey Balls.
Harvey Balls are calculated as follows:
1. Raw scores are transposed into the Info-Tech Vendor Landscape Shortlist Tool (for information on how Raw scores are determined, see
Vendor Landscape Methodology: Scoring, above).
2. Each individual criterion Raw score is multiplied by a pre-assigned weighting factor for the Vendor Landscape in question. Weighting
factors are determined prior to the evaluation process, based on the expertise of the Senior or Lead Research Analyst, to eliminate any
possibility of bias. Weighting factors are expressed as a percentage, such that the sum of the weighting factors for the Vendor criteria
(Viability, Strategy, Reach, Channel) is 100%, and the sum of the Product criteria (Features, Usability, Affordability, Architecture) is
100%.
3. A sum-product of the weighted Vendor criteria scores and of the weighted Product criteria scores is calculated to yield an overall Vendor
score and an overall Product score.
4. Both overall Vendor score / overall Product score, as well as individual criterion Raw scores are converted from a scale of one to ten to
Harvey Ball scores on a scale of zero to four, where exceptional performance results in a score of four and poor performance results in a
score of zero.
5. Harvey Ball scores are converted to Harvey Balls as follows:
• A score of four becomes a full Harvey Ball.
• A score of three becomes a three-quarter full Harvey Ball.
• A score of two becomes a half full Harvey Ball.
• A score of one becomes a one-quarter full Harvey Ball.
• A score of zero (zero) becomes an empty Harvey Ball.
6. Harvey Balls are plotted by solution in a chart where rows represent individual solutions and columns represent overall Vendor / overall
Product, as well as individual criteria. Solutions are ordered in the chart alphabetically by vendor name.
Product Vendor
Feat. Use. Afford. Via. Strat. Chan. Reach Arch. Overall Overall
Overall Harvey
Balls represent
weighted
aggregates.
Criteria Harvey
Balls represent
individual Raw
scores.
33 Info-Tech Research Group Vendor Landscape: Server Virtualization
Stop Lights
Vendor Landscape Methodology: Information Presentation – Feature Ranks (Stop Lights)
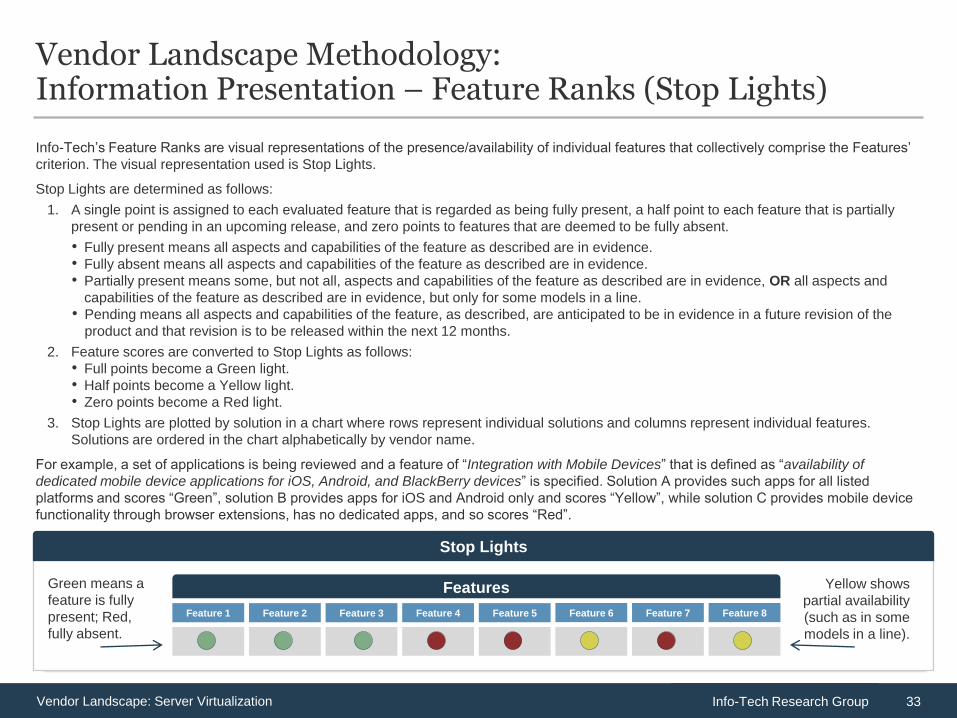
Info-Tech’s Feature Ranks are visual representations of the presence/availability of individual features that collectively comprise the Features’
criterion. The visual representation used is Stop Lights.
Stop Lights are determined as follows:
1. A single point is assigned to each evaluated feature that is regarded as being fully present, a half point to each feature that is partially
present or pending in an upcoming release, and zero points to features that are deemed to be fully absent.
• Fully present means all aspects and capabilities of the feature as described are in evidence.
• Fully absent means all aspects and capabilities of the feature as described are in evidence.
• Partially present means some, but not all, aspects and capabilities of the feature as described are in evidence, OR all aspects and
capabilities of the feature as described are in evidence, but only for some models in a line.
• Pending means all aspects and capabilities of the feature, as described, are anticipated to be in evidence in a future revision of the
product and that revision is to be released within the next 12 months.
2. Feature scores are converted to Stop Lights as follows:
• Full points become a Green light.
• Half points become a Yellow light.
• Zero points become a Red light.
3. Stop Lights are plotted by solution in a chart where rows represent individual solutions and columns represent individual features.
Solutions are ordered in the chart alphabetically by vendor name.
For example, a set of applications is being reviewed and a feature of “Integration with Mobile Devices” that is defined as “availability of
dedicated mobile device applications for iOS, Android, and BlackBerry devices” is specified. Solution A provides such apps for all listed
platforms and scores “Green”, solution B provides apps for iOS and Android only and scores “Yellow”, while solution C provides mobile device
functionality through browser extensions, has no dedicated apps, and so scores “Red”.
Feature 1 Feature 2 Feature 4 Feature 5 Feature 3
Features
Feature 6 Feature 7 Feature 8
Yellow shows
partial availability
(such as in some
models in a line).
Green means a
feature is fully
present; Red,
fully absent.
34 Info-Tech Research Group Vendor Landscape: Server Virtualization
Value Index
Vendor Landscape Methodology: Information Presentation – Value Index
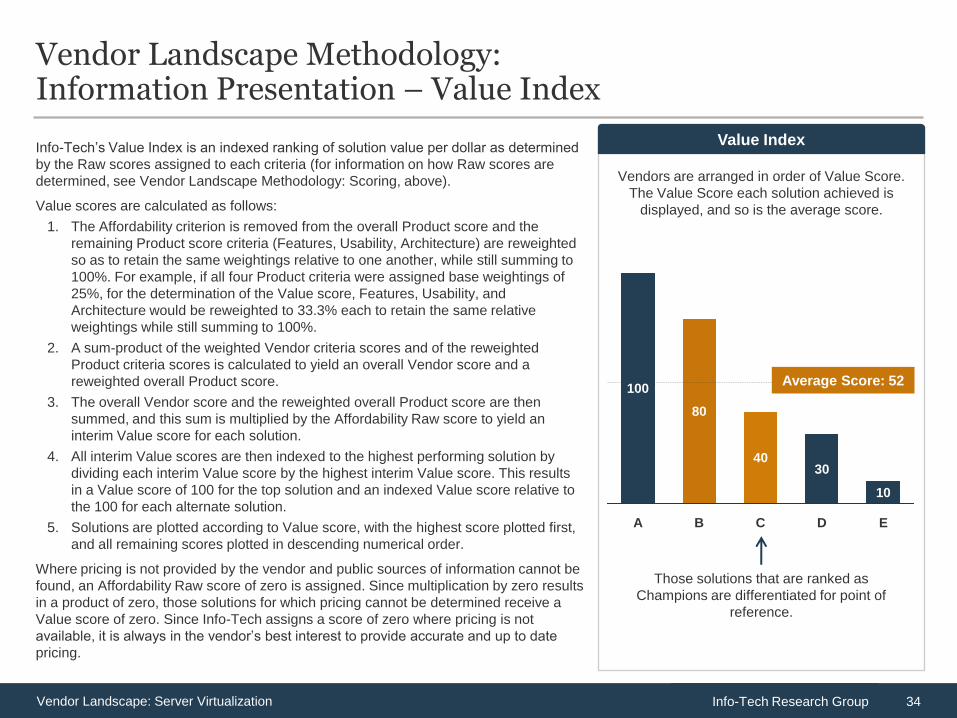
Info-Tech’s Value Index is an indexed ranking of solution value per dollar as determined
by the Raw scores assigned to each criteria (for information on how Raw scores are
determined, see Vendor Landscape Methodology: Scoring, above).
Value scores are calculated as follows:
1. The Affordability criterion is removed from the overall Product score and the
remaining Product score criteria (Features, Usability, Architecture) are reweighted
so as to retain the same weightings relative to one another, while still summing to
100%. For example, if all four Product criteria were assigned base weightings of
25%, for the determination of the Value score, Features, Usability, and
Architecture would be reweighted to 33.3% each to retain the same relative
weightings while still summing to 100%.
2. A sum-product of the weighted Vendor criteria scores and of the reweighted
Product criteria scores is calculated to yield an overall Vendor score and a
reweighted overall Product score.
3. The overall Vendor score and the reweighted overall Product score are then
summed, and this sum is multiplied by the Affordability Raw score to yield an
interim Value score for each solution.
4. All interim Value scores are then indexed to the highest performing solution by
dividing each interim Value score by the highest interim Value score. This results
in a Value score of 100 for the top solution and an indexed Value score relative to
the 100 for each alternate solution.
5. Solutions are plotted according to Value score, with the highest score plotted first,
and all remaining scores plotted in descending numerical order.
Where pricing is not provided by the vendor and public sources of information cannot be
found, an Affordability Raw score of zero is assigned. Since multiplication by zero results
in a product of zero, those solutions for which pricing cannot be determined receive a
Value score of zero. Since Info-Tech assigns a score of zero where pricing is not
available, it is always in the vendor’s best interest to provide accurate and up to date
pricing.
Those solutions that are ranked as
Champions are differentiated for point of
reference.
E
10
D
30
C
40
B
80
A
100 Average Score: 52
Vendors are arranged in order of Value Score.
The Value Score each solution achieved is
displayed, and so is the average score.
35 Info-Tech Research Group Vendor Landscape: Server Virtualization
Vendor Landscape Methodology: Information Presentation – Price Evaluation
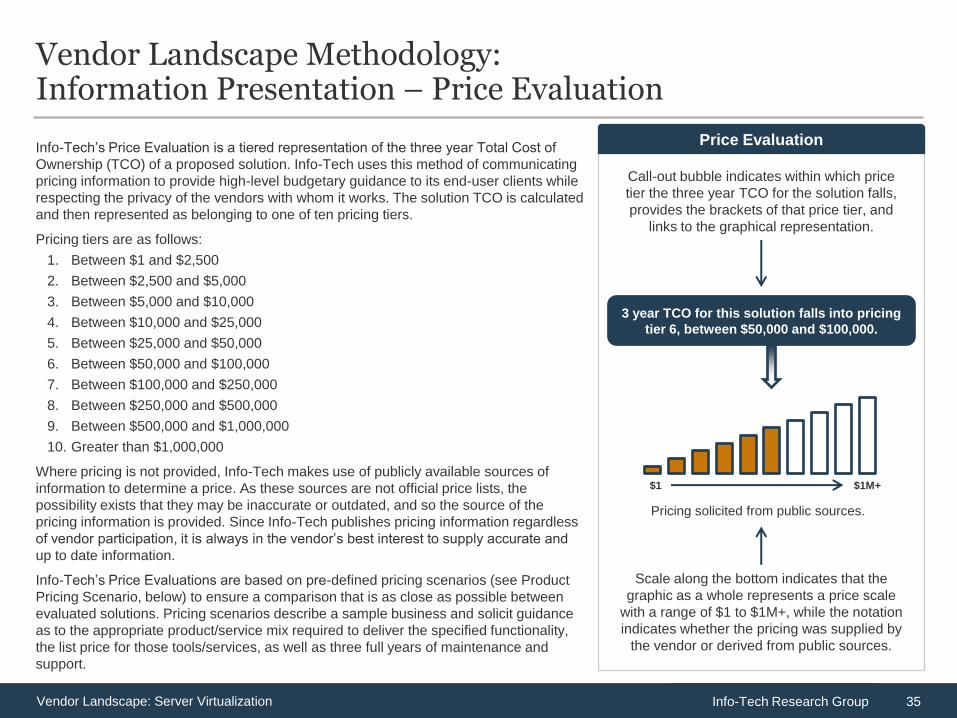
Info-Tech’s Price Evaluation is a tiered representation of the three year Total Cost of
Ownership (TCO) of a proposed solution. Info-Tech uses this method of communicating
pricing information to provide high-level budgetary guidance to its end-user clients while
respecting the privacy of the vendors with whom it works. The solution TCO is calculated
and then represented as belonging to one of ten pricing tiers.
Pricing tiers are as follows:
1. Between $1 and $2,500
2. Between $2,500 and $5,000
3. Between $5,000 and $10,000
4. Between $10,000 and $25,000
5. Between $25,000 and $50,000
6. Between $50,000 and $100,000
7. Between $100,000 and $250,000
8. Between $250,000 and $500,000
9. Between $500,000 and $1,000,000
10. Greater than $1,000,000
Where pricing is not provided, Info-Tech makes use of publicly available sources of
information to determine a price. As these sources are not official price lists, the
possibility exists that they may be inaccurate or outdated, and so the source of the
pricing information is provided. Since Info-Tech publishes pricing information regardless
of vendor participation, it is always in the vendor’s best interest to supply accurate and
up to date information.
Info-Tech’s Price Evaluations are based on pre-defined pricing scenarios (see Product
Pricing Scenario, below) to ensure a comparison that is as close as possible between
evaluated solutions. Pricing scenarios describe a sample business and solicit guidance
as to the appropriate product/service mix required to deliver the specified functionality,
the list price for those tools/services, as well as three full years of maintenance and
support.
Price Evaluation
Call-out bubble indicates within which price
tier the three year TCO for the solution falls,
provides the brackets of that price tier, and
links to the graphical representation.
Scale along the bottom indicates that the
graphic as a whole represents a price scale
with a range of $1 to $1M+, while the notation
indicates whether the pricing was supplied by
the vendor or derived from public sources.
3 year TCO for this solution falls into pricing
tier 6, between $50,000 and $100,000.
$1 $1M+
Pricing solicited from public sources.
36 Info-Tech Research Group Vendor Landscape: Server Virtualization
Vendor Landscape Methodology: Information Presentation – Scenarios
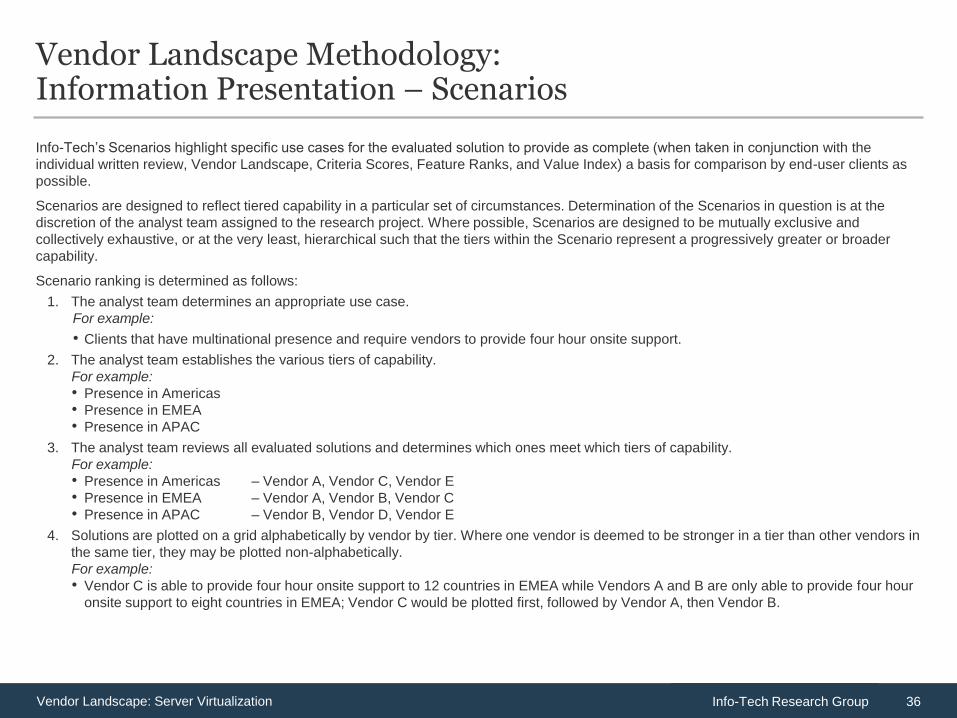
Info-Tech’s Scenarios highlight specific use cases for the evaluated solution to provide as complete (when taken in conjunction with the
individual written review, Vendor Landscape, Criteria Scores, Feature Ranks, and Value Index) a basis for comparison by end-user clients as
possible.
Scenarios are designed to reflect tiered capability in a particular set of circumstances. Determination of the Scenarios in question is at the
discretion of the analyst team assigned to the research project. Where possible, Scenarios are designed to be mutually exclusive and
collectively exhaustive, or at the very least, hierarchical such that the tiers within the Scenario represent a progressively greater or broader
capability.
Scenario ranking is determined as follows:
1. The analyst team determines an appropriate use case.
For example:
• Clients that have multinational presence and require vendors to provide four hour onsite support.
2. The analyst team establishes the various tiers of capability.
For example:
• Presence in Americas
• Presence in EMEA
• Presence in APAC
3. The analyst team reviews all evaluated solutions and determines which ones meet which tiers of capability.
For example:
• Presence in Americas – Vendor A, Vendor C, Vendor E
• Presence in EMEA – Vendor A, Vendor B, Vendor C
• Presence in APAC – Vendor B, Vendor D, Vendor E
4. Solutions are plotted on a grid alphabetically by vendor by tier. Where one vendor is deemed to be stronger in a tier than other vendors in
the same tier, they may be plotted non-alphabetically.
For example:
• Vendor C is able to provide four hour onsite support to 12 countries in EMEA while Vendors A and B are only able to provide four hour
onsite support to eight countries in EMEA; Vendor C would be plotted first, followed by Vendor A, then Vendor B.
37 Info-Tech Research Group Vendor Landscape: Server Virtualization
Vendor Landscape Methodology: Information Presentation – Vendor Awards
At the conclusion of all analyses, Info-Tech presents awards to exceptional solutions in
three distinct categories. Award presentation is discretionary; not all awards are
extended subsequent to each Vendor landscape and it is entirely possible, though
unlikely, that no awards may be presented.
Awards categories are as follows:
• Champion Awards are presented to those solutions, and only those solutions, that
land in the Champion zone of the Info-Tech Vendor Landscape (see Vendor
Landscape Methodology: Information Presentation - Vendor Landscape, above). If
no solutions land in the Champion zone, no Champion Awards are presented.
Similarly, if multiple solutions land in the Champion zone, multiple Champion Awards
are presented.
• Trend Setter Awards are presented to those solutions, and only those solutions,
that are deemed to include the most original/inventive product/service, or the most
original/inventive feature/capability of a product/service. If no solution is deemed to
be markedly or sufficiently original/inventive, either as a product/service on the
whole or by feature/capability specifically, no Trend Setter Award is presented. Only
one Trend Setter Award is available for each Vendor Landscape.
• Best Overall Value Awards are presented to those solutions, and only those
solutions, that are ranked highest on the Info-Tech Value Index (see Vendor
Landscape Methodology: Information Presentation – Value Index, above). If
insufficient pricing information is made available for the evaluated solutions, such
that a Value Index cannot be calculated, no Best Overall Value Award will be
presented. Only one Best Overall Value Award is available for each Vendor
Landscape.
Vendor Awards
Info-Tech’s Champion
Award is presented to
solutions in the Champion
zone of the Vendor
Landscape.
Info-Tech’s Trend Setter
Award is presented to the
most original/inventive
solution evaluated.
Info-Tech’s Best Overall
Value Award is
presented to the solution
with the highest Value
Index score.
38 Info-Tech Research Group Vendor Landscape: Server Virtualization
Vendor Landscape Methodology: Fact Check & Publication
Info-Tech takes the factual accuracy of its Vendor Landscapes, and indeed of all of its published content, very seriously. To ensure the utmost
accuracy in its Vendor Landscapes, we invite all vendors of evaluated solutions (whether the vendor elected to provide a survey and/or
participate in a briefing or not) to participate in a process of Fact Check.
Once the research project is complete and the materials are deemed to be in a publication ready state, excerpts of the material specific to each
vendor’s solution are provided to the vendor. Info-Tech only provides material specific to the individual vendor’s solution for review
encompassing the following:
• All written review materials of the vendor and the vendor’s product that comprise the evaluated solution.
• Info-Tech’s Criteria Scores / Harvey Balls detailing the individual and overall Vendor / Product scores assigned.
• Info-Tech’s Feature Rank / Stop Lights detailing the individual feature scores of the evaluated product.
• Info-Tech’s Value Index ranking for the evaluated solution.
• Info-Tech’s Scenario ranking for all considered scenarios for the evaluated solution.
Info-Tech does not provide the following:
• Info-Tech’s Vendor Landscape placement of the evaluated solution.
• Info-Tech’s Value Score for the evaluated solution.
• End-user feedback gathered during the research project.
• Info-Tech’s overall recommendation in regard to the evaluated solution.
Info-Tech provides a one-week window for each vendor to provide written feedback. Feedback must be corroborated (be provided with
supporting evidence), and where it does, feedback that addresses factual errors or omissions is adopted fully, while feedback that addresses
opinions is taken under consideration. The assigned analyst team makes all appropriate edits and supplies an edited copy of the materials to
the vendor within one week for final review.
Should a vendor still have concerns or objections at that time, they are invited to a conversation, initially via email, but as required and deemed
appropriate by Info-Tech, subsequently via telephone, to ensure common understanding of the concerns. Where concerns relate to ongoing
factual errors or omissions they are corrected under the supervision of Info-Tech’s Vendor Relations personnel. Where concerns relate to
ongoing differences of opinion they are again taken under consideration with neither explicit not implicit indication of adoption.
Publication of materials is scheduled to occur within the six weeks immediately following the completion of the research project, but does not
occur until the Fact Check process has come to conclusion, and under no circumstances are “pre-publication” copies of any materials made
available to any client.
39 Info-Tech Research Group Vendor Landscape: Server Virtualization
Product Pricing Scenario
An organization is looking to implement server virtualization. It has 7 host servers (20 VMs per host) connected to a shared
SAN that it wants to add hypervisors to with a three-year licensing agreement. Its host servers are 2 socket servers with Xeon
5600 processors and 256 GB of RAM. The organization also requires a robust management suite (vCenter, XenCenter,
Systems Center Virtual Machine Manager) and gold level support services to be included in its purchase.
The expected solution capabilities are as follows:
The solution must be able to partition the physical server into virtual machines (VMs)
• Robust management software for managing VMs on 7 physical hosts
• The management system should enable and ease the task of VM management by including the following features:
◦ Live migration
◦ High availability
• Gold level support services should include the following:
◦ Implementation support
◦ Technical documentation and guides
◦ 24/7 Technical support by phone or online
◦ Do not include licensing cost for Microsoft host server operating systems
◦ If the management suite requires the purchase of an addition host server, do not include the cost of the server