Embed Size (px)
Citation preview
Venetia MineWelcomes
FUND MANAGERS DELEGATION
A GENERAL OVERVIEW
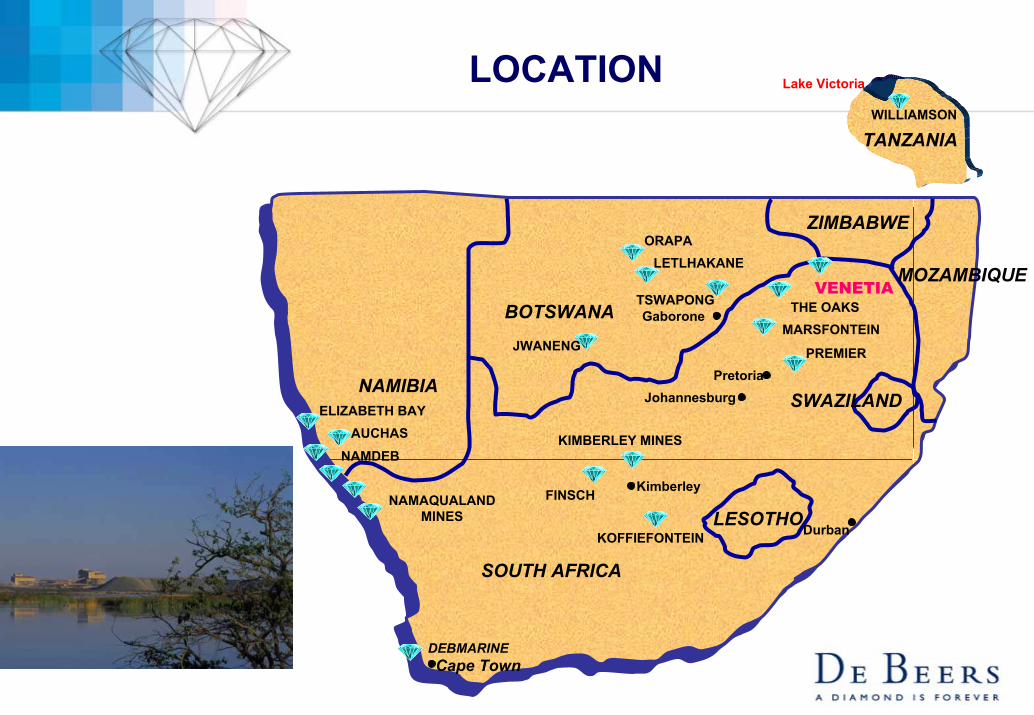
LOCATIONTANZANIA
WILLIAMSON
Lake Victoria
NAMIBIA
ZIMBABWE
MOZAMBIQUE
LESOTHO
SOUTH AFRICA
DEBMARINECape Town
KOFFIEFONTEIN
FINSCH
KIMBERLEY MINES
Kimberley
JohannesburgELIZABETH BAY
NAMDEBAUCHAS
Durban
PREMIER
MARSFONTEINTHE OAKS
Pretoria
GaboroneTSWAPONG
LETLHAKANEORAPA
JWANENG
NAMAQUALANDMINES
BOTSWANAVENETIAVENETIA
SWAZILAND
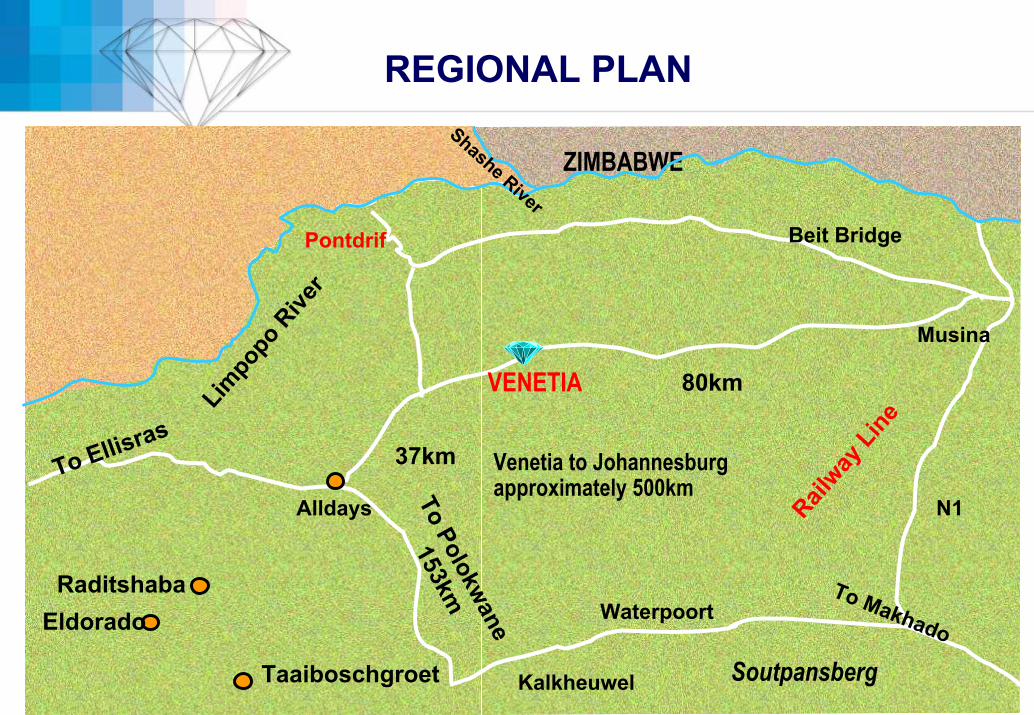
REGIONAL PLAN
BOTSWANA
VENETIA
Venetia to Johannesburgapproximately 500km
37km
80km
Alldays
To Ellisras
Pontdrif Beit Bridge
Musina
N1
To MakhadoWaterpoort
To Polokwane
153km
Railway
Line
Taaiboschgroet
RaditshabaEldorado
SoutpansbergKalkheuwel
Limpo
po R
iver
ZIMBABWEShashe River
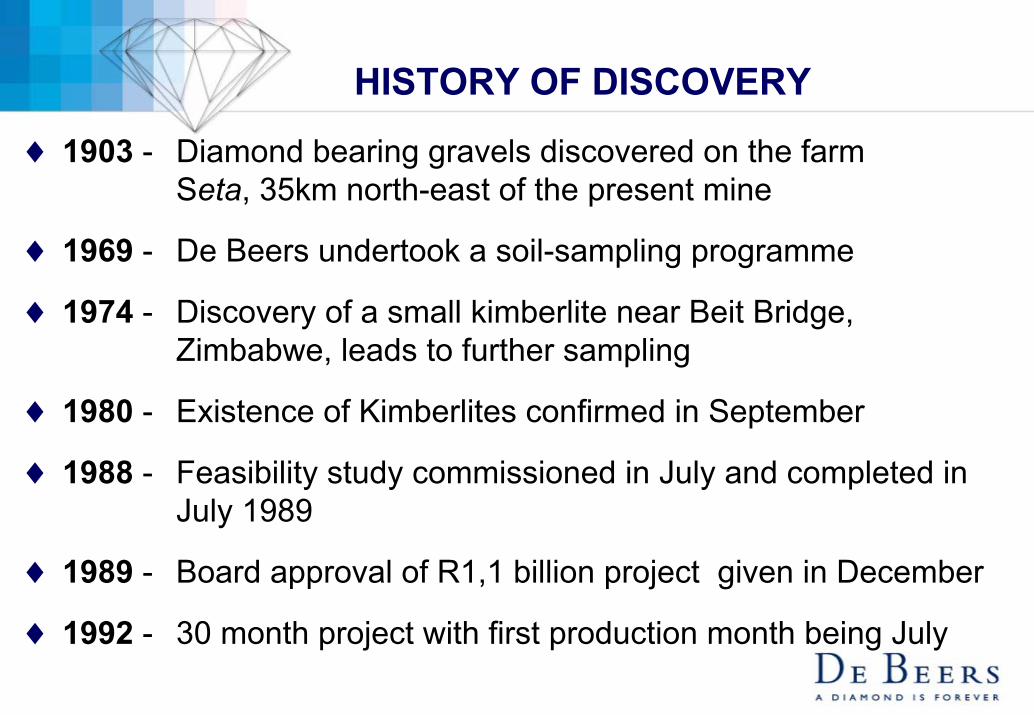
HISTORY OF DISCOVERY
♦ 1903 - Diamond bearing gravels discovered on the farmSeta, 35km north-east of the present mine
♦ 1969 - De Beers undertook a soil-sampling programme
♦ 1974 - Discovery of a small kimberlite near Beit Bridge, Zimbabwe, leads to further sampling
♦ 1980 - Existence of Kimberlites confirmed in September
♦ 1988 - Feasibility study commissioned in July and completed inJuly 1989
♦ 1989 - Board approval of R1,1 billion project given in December
♦ 1992 - 30 month project with first production month being July
MISSIONTo contribute to the
Growth and Profitability of De Beers by mining diamonds
VISIONOur vision is to be the world leader in
Open Cast Diamond Mining
FOCUS 2002/2003
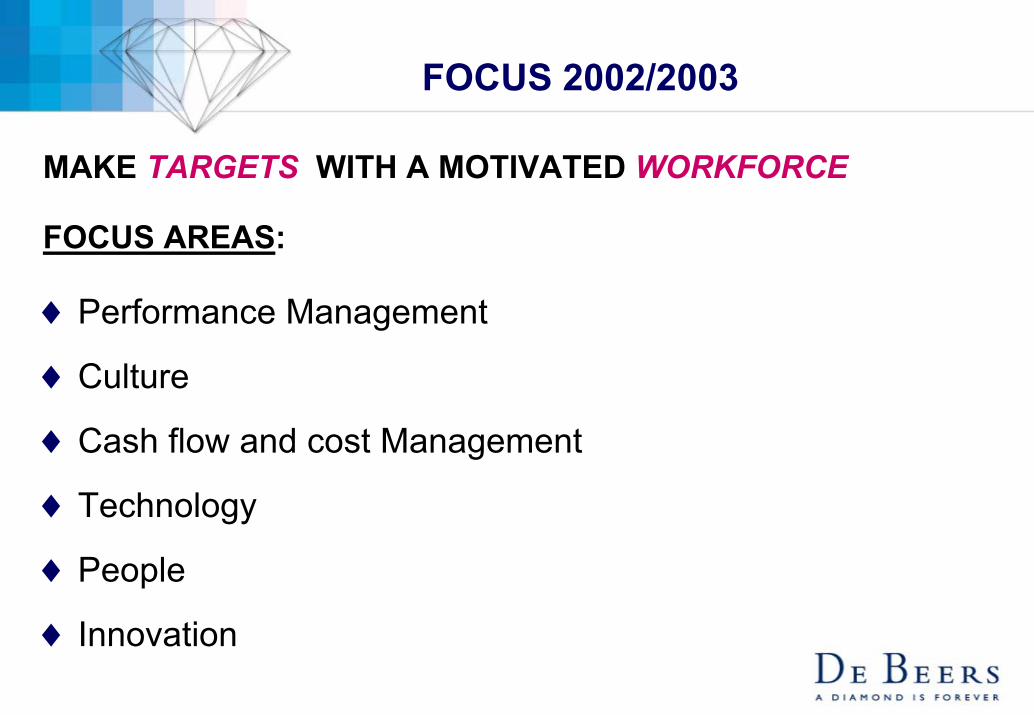
♦Performance Management
♦Culture
♦Cash flow and cost Management
♦Technology
♦People
MAKE TARGETS WITH A MOTIVATED WORKFORCE
FOCUS AREAS:
♦ Innovation
SAFETY, HEALTH & ENVIRONMENT
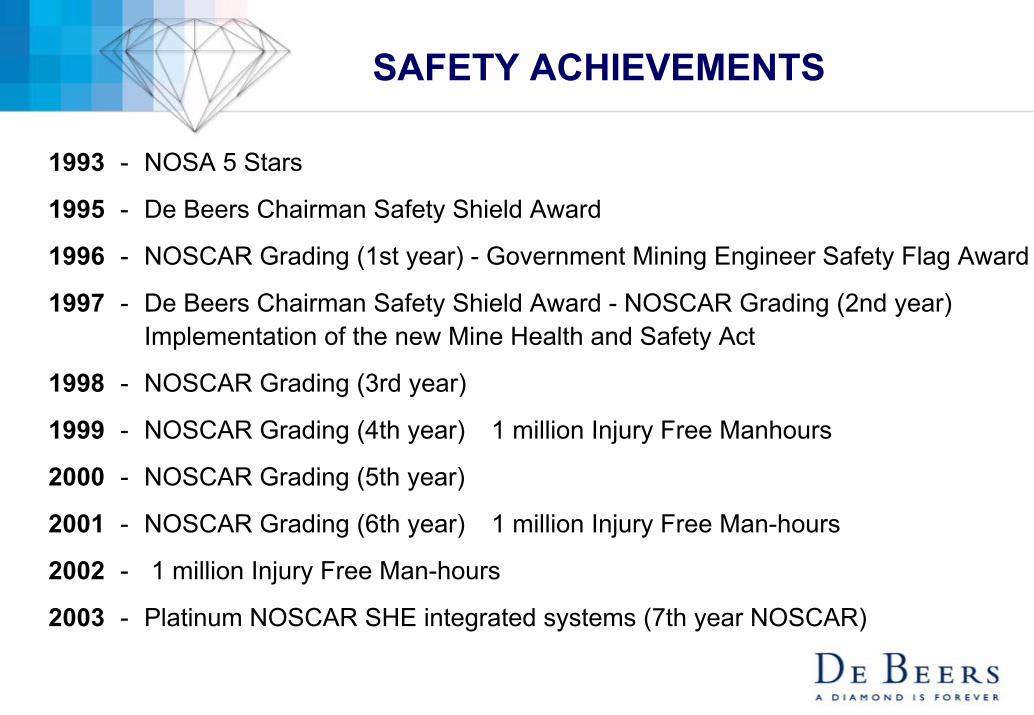
SAFETY ACHIEVEMENTS
1993 - NOSA 5 Stars
1995 - De Beers Chairman Safety Shield Award
1996 - NOSCAR Grading (1st year) - Government Mining Engineer Safety Flag Award
1997 - De Beers Chairman Safety Shield Award - NOSCAR Grading (2nd year)Implementation of the new Mine Health and Safety Act
1998 - NOSCAR Grading (3rd year)
1999 - NOSCAR Grading (4th year) 1 million Injury Free Manhours
2000 - NOSCAR Grading (5th year)
2001 - NOSCAR Grading (6th year) 1 million Injury Free Man-hours
2002 - 1 million Injury Free Man-hours
2003 - Platinum NOSCAR SHE integrated systems (7th year NOSCAR)
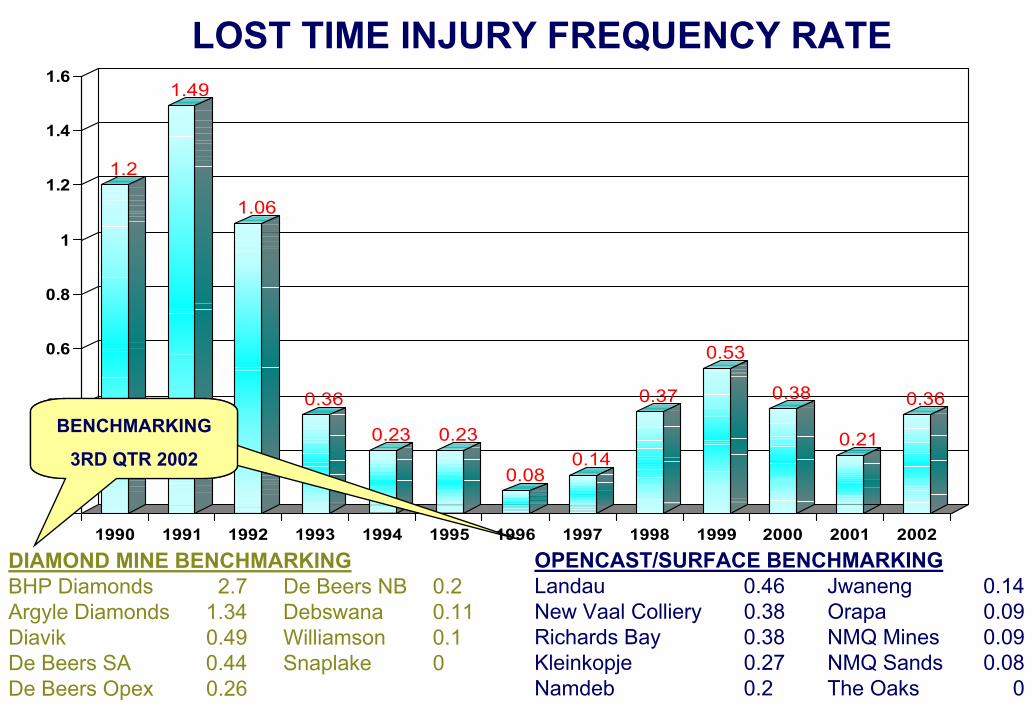
1.2
1.49
1.06
0.36
0.23 0.23
0.080.14
0.37
0.53
0.38
0.21
0.36
0
0.2
0.4
0.6
0.8
1
1.2
1.4
1.6
1990 1991 1992 1993 1994 1995 1996 1997 1998 1999 2000 2001 2002OPENCAST/SURFACE BENCHMARKINGLandau 0.46 Jwaneng 0.14New Vaal Colliery 0.38 Orapa 0.09Richards Bay 0.38 NMQ Mines 0.09Kleinkopje 0.27 NMQ Sands 0.08Namdeb 0.2 The Oaks 0
BENCHMARKING
3RD QTR 2002
DIAMOND MINE BENCHMARKINGBHP Diamonds 2.7 De Beers NB 0.2Argyle Diamonds 1.34 Debswana 0.11Diavik 0.49 Williamson 0.1De Beers SA 0.44 Snaplake 0De Beers Opex 0.26
BENCHMARKING
3RD QTR 2002
LOST TIME INJURY FREQUENCY RATE
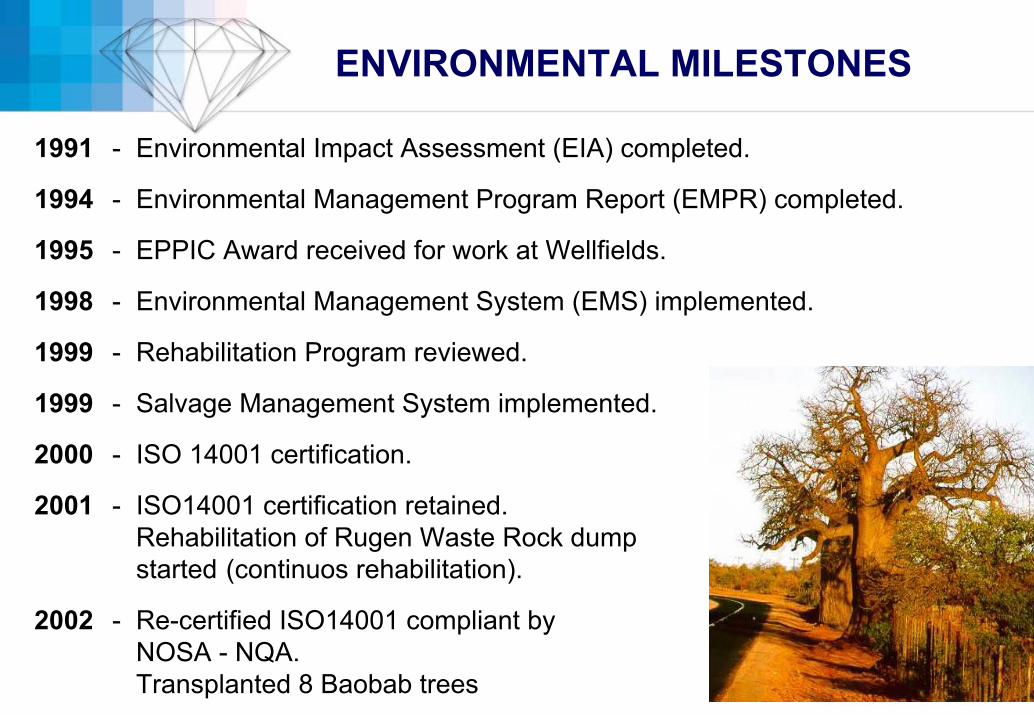
ENVIRONMENTAL MILESTONES
1991 - Environmental Impact Assessment (EIA) completed.
1994 - Environmental Management Program Report (EMPR) completed.
1995 - EPPIC Award received for work at Wellfields.
1998 - Environmental Management System (EMS) implemented.
1999 - Rehabilitation Program reviewed.
1999 - Salvage Management System implemented.
2000 - ISO 14001 certification.
2001 - ISO14001 certification retained.Rehabilitation of Rugen Waste Rock dumpstarted (continuos rehabilitation).
2002 - Re-certified ISO14001 compliant byNOSA - NQA.Transplanted 8 Baobab trees
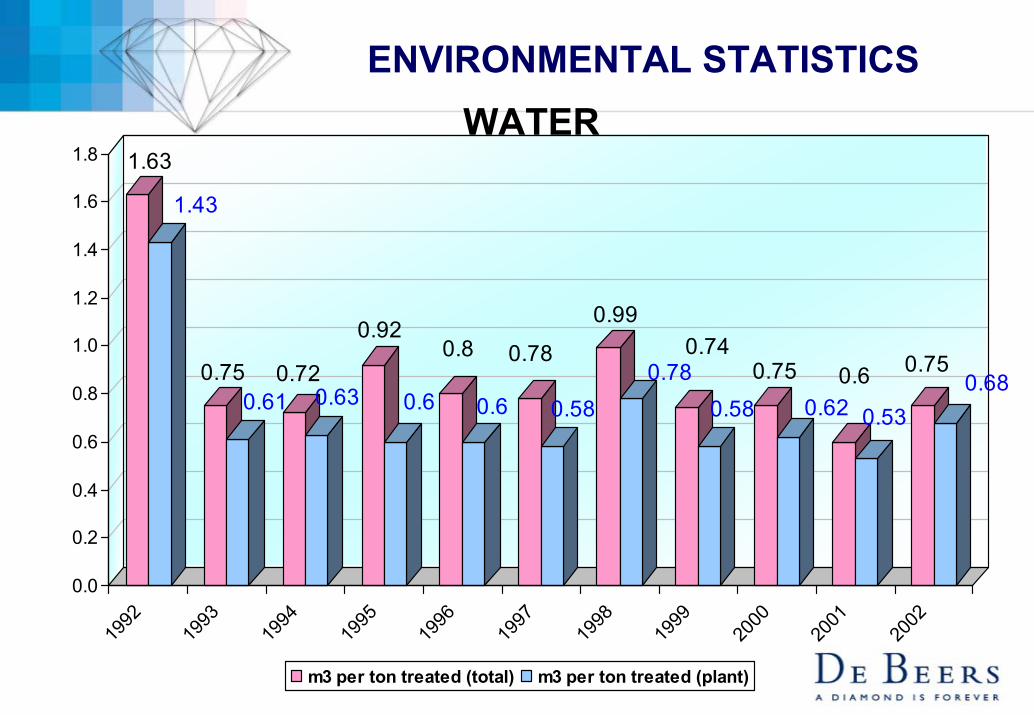
ENVIRONMENTAL STATISTICS
1.63
1.43
0.750.61
0.720.63
0.92
0.6
0.8
0.6
0.78
0.58
0.99
0.780.74
0.580.75
0.620.6
0.53
0.750.68
0.0
0.2
0.4
0.6
0.8
1.0
1.2
1.4
1.6
1.8
1992
1993
1994
1995
1996
1997
1998
1999
2000
2001
2002
m3 per ton treated (total) m3 per ton treated (plant)
WATER
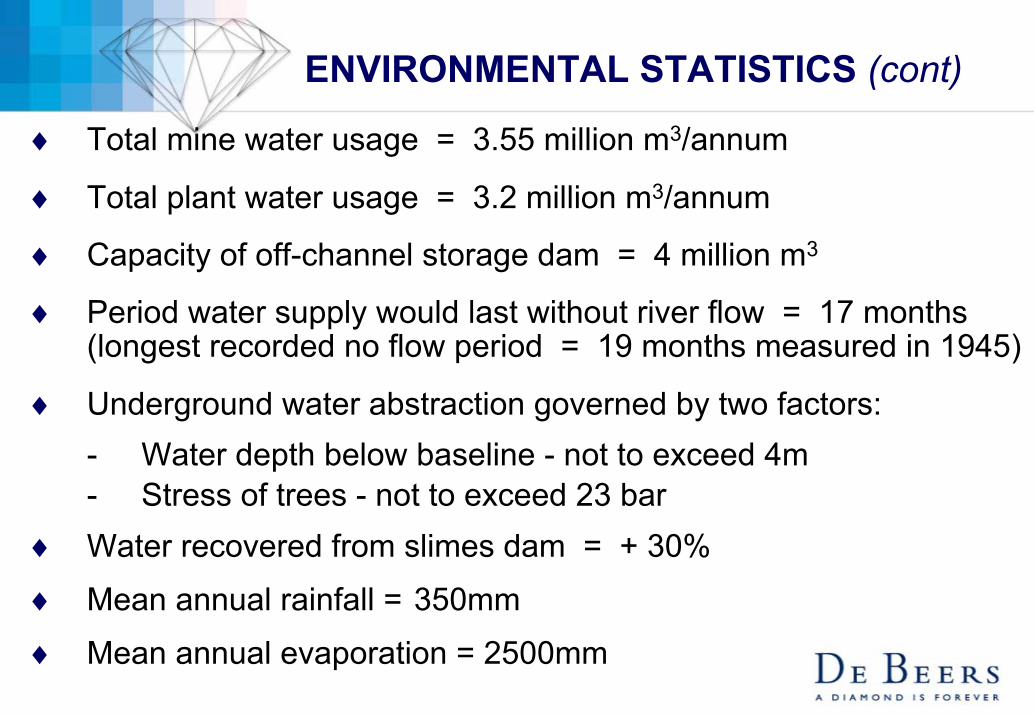
ENVIRONMENTAL STATISTICS (cont)
♦ Total mine water usage = 3.55 million m3/annum
♦ Total plant water usage = 3.2 million m3/annum
♦ Capacity of off-channel storage dam = 4 million m3
♦ Period water supply would last without river flow = 17 months(longest recorded no flow period = 19 months measured in 1945)
♦ Underground water abstraction governed by two factors:- Water depth below baseline - not to exceed 4m- Stress of trees - not to exceed 23 bar
♦ Water recovered from slimes dam = + 30%♦ Mean annual rainfall = 350mm♦ Mean annual evaporation = 2500mm
ISO CERTIFICATION
ISO 9002 obtained in 1996
ISO 14001 obtained in 2000
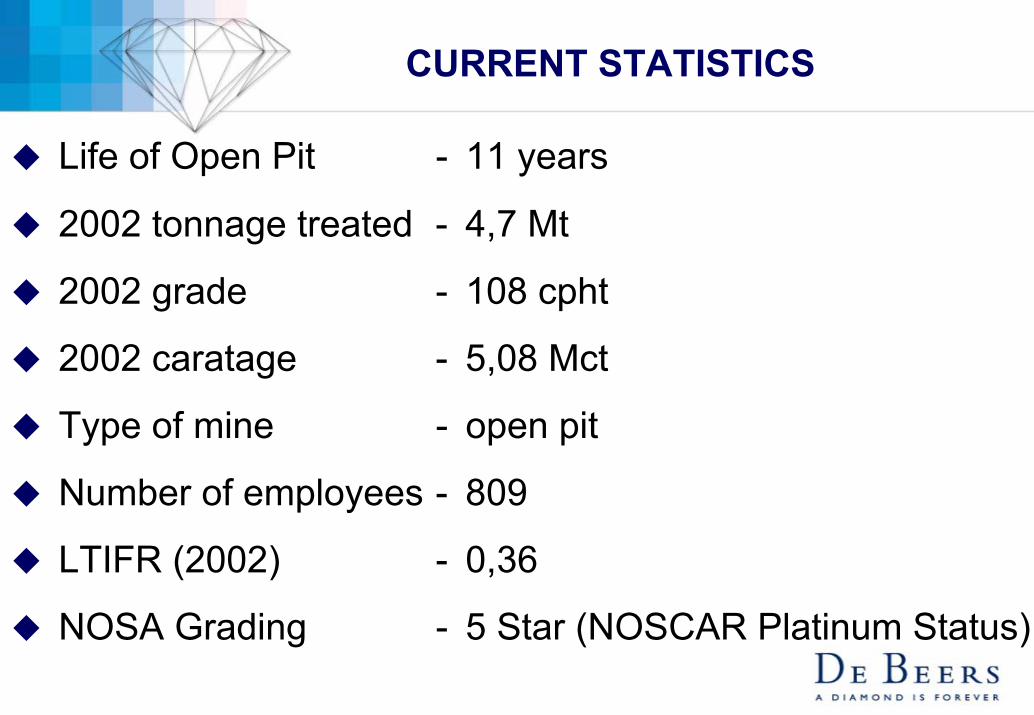
CURRENT STATISTICS
Life of Open Pit - 11 years
2002 tonnage treated - 4,7 Mt
2002 grade - 108 cpht
2002 caratage - 5,08 Mct
Type of mine - open pit
Number of employees - 809
LTIFR (2002) - 0,36
NOSA Grading - 5 Star (NOSCAR Platinum Status)
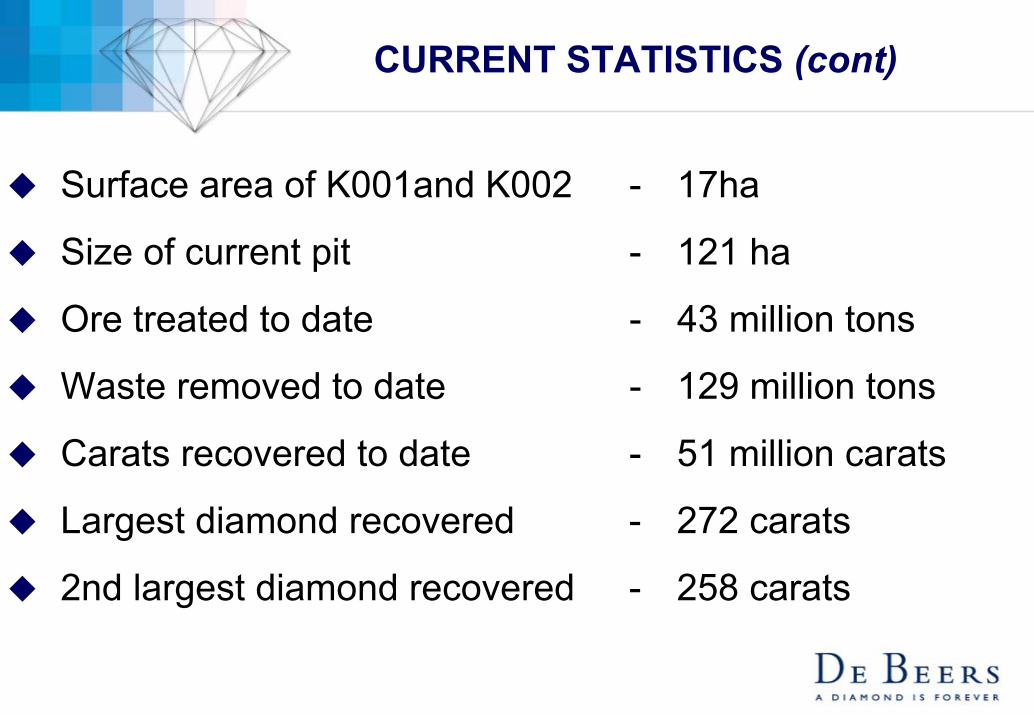
CURRENT STATISTICS (cont)
Surface area of K001and K002 - 17ha
Size of current pit - 121 ha
Ore treated to date - 43 million tons
Waste removed to date - 129 million tons
Carats recovered to date - 51 million carats
Largest diamond recovered - 272 carats
2nd largest diamond recovered - 258 carats
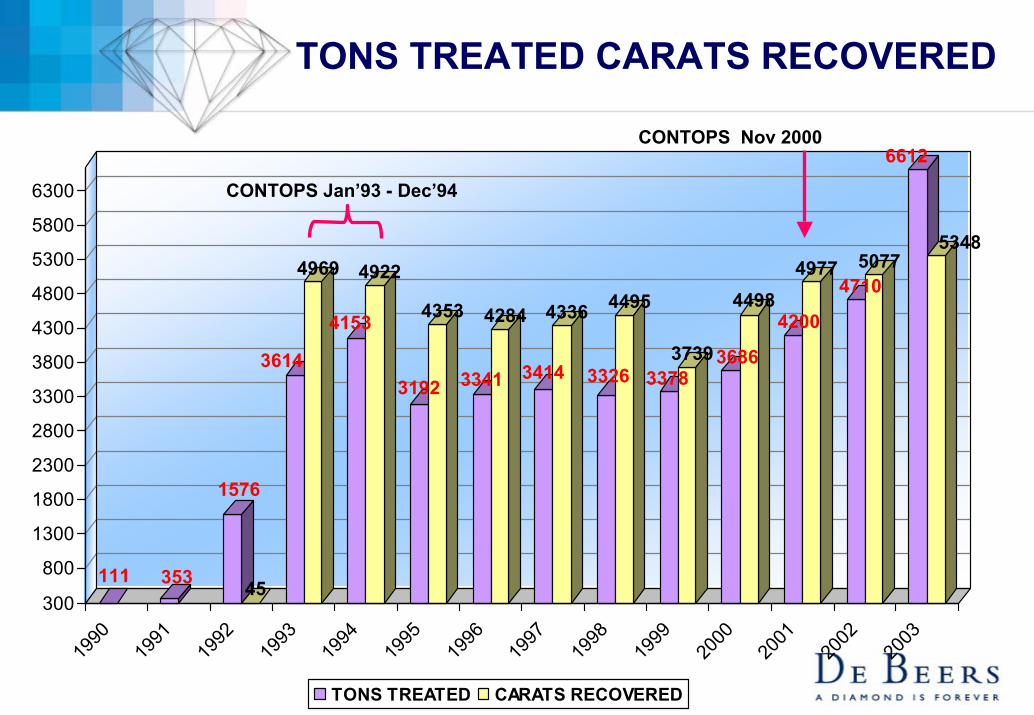
TONS TREATED CARATS RECOVERED
111 353
1576
45
3614
4969
4153
4922
3192
4353
3341
4284
3414
4336
3326
4495
337837393686
44984200
49774710
5077
6612
5348
300
800
1300
1800
2300
2800
3300
3800
4300
4800
5300
5800
6300
1990
1991
1992
1993
1994
1995
1996
1997
1998
1999
2000
2001
2002
2003
TONS TREATED CARATS RECOVERED
CONTOPS Jan’93 - Dec’94
CONTOPS Nov 2000
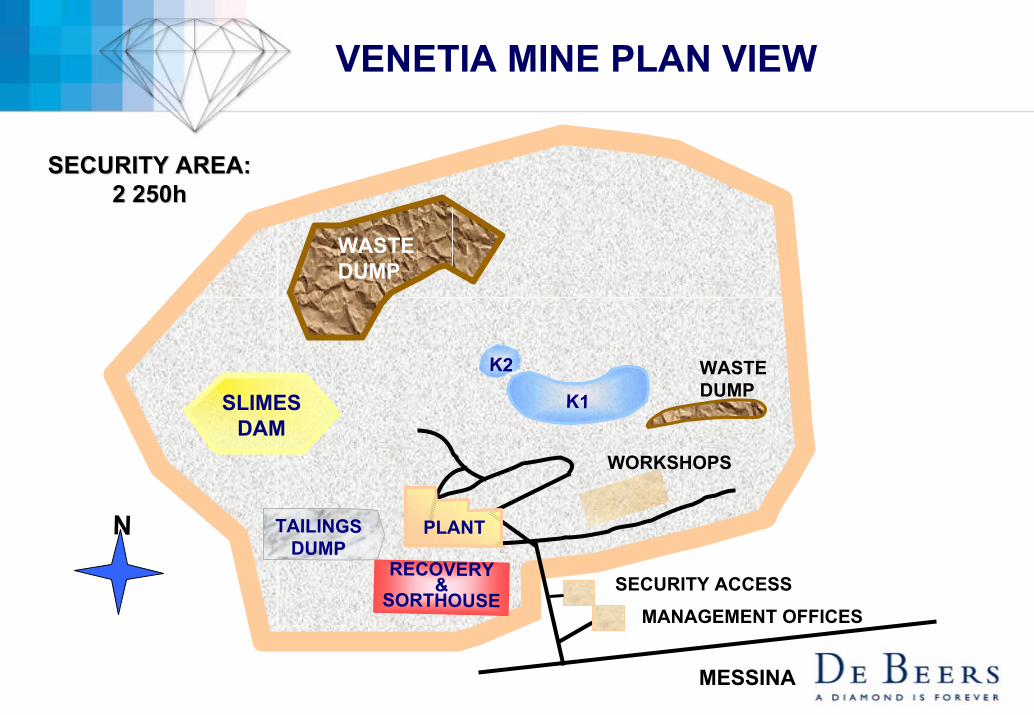
VENETIA MINE PLAN VIEW
K2
K1
TAILINGSDUMP
N PLANT
WASTEDUMP
WASTEDUMPSLIMES
DAM
MANAGEMENT OFFICESSECURITY ACCESS
MESSINA
SECURITY AREA: SECURITY AREA: 2 250h2 250h
WORKSHOPS
RECOVERY&
SORTHOUSE

GEOLOGY
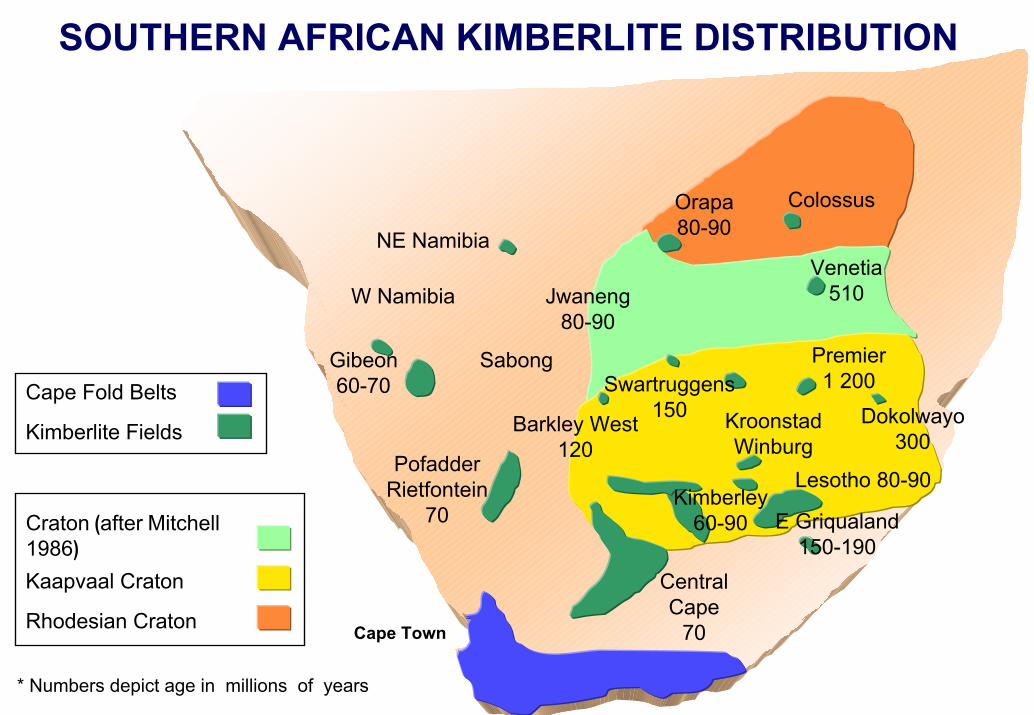
SOUTHERN AFRICAN KIMBERLITE DISTRIBUTION
Cape Fold Belts
Kimberlite Fields
* Numbers depict age in millions of years
Kaapvaal Craton
Rhodesian Craton
Craton (after Mitchell1986)
Cape Town
ColossusOrapa80-90
Venetia510
Premier1 200
Dokolwayo300
Swartruggens150 Kroonstad
WinburgLesotho 80-90
E Griqualand150-190
Barkley West120Pofadder
Rietfontein70
W Namibia
Gibeon60-70
Jwaneng80-90
Sabong
CentralCape
70
NE Namibia
Kimberley60-90
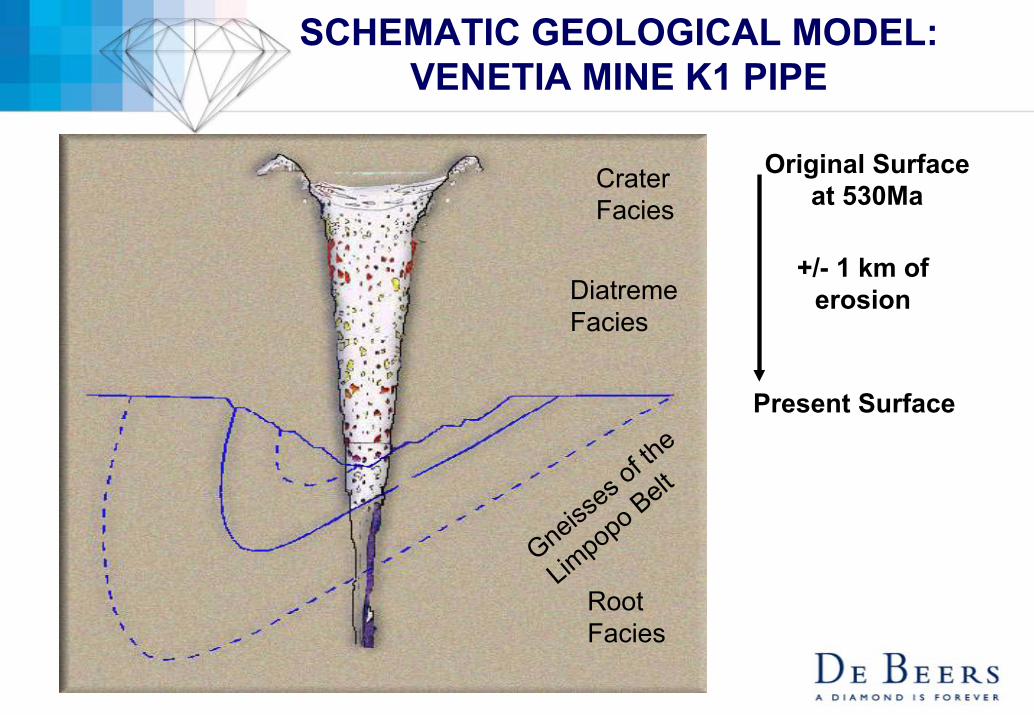
SCHEMATIC GEOLOGICAL MODEL:VENETIA MINE K1 PIPE
Gneisses o
f the
Limpopo Belt
Crater Facies
Diatreme Facies
Root Facies
Original Surface at 530Ma
+/- 1 km of erosion
Present Surface
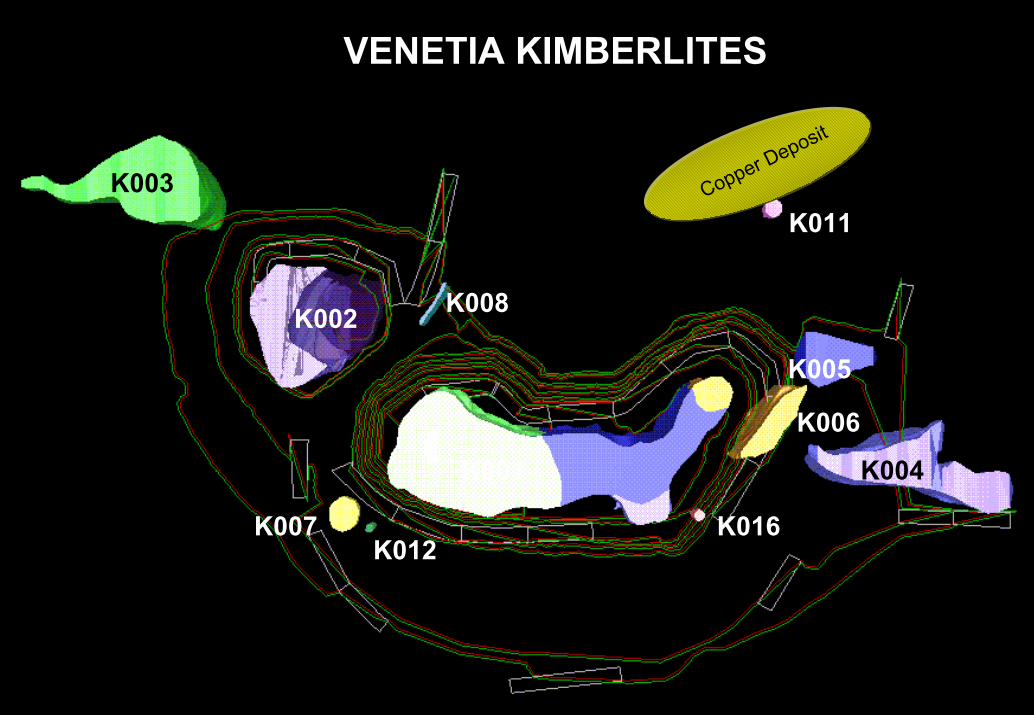
VENETIA KIMBERLITES
K002
K001
K003
K004
K005
K007 K012
K008
K011
K006
Copper Deposit
K016
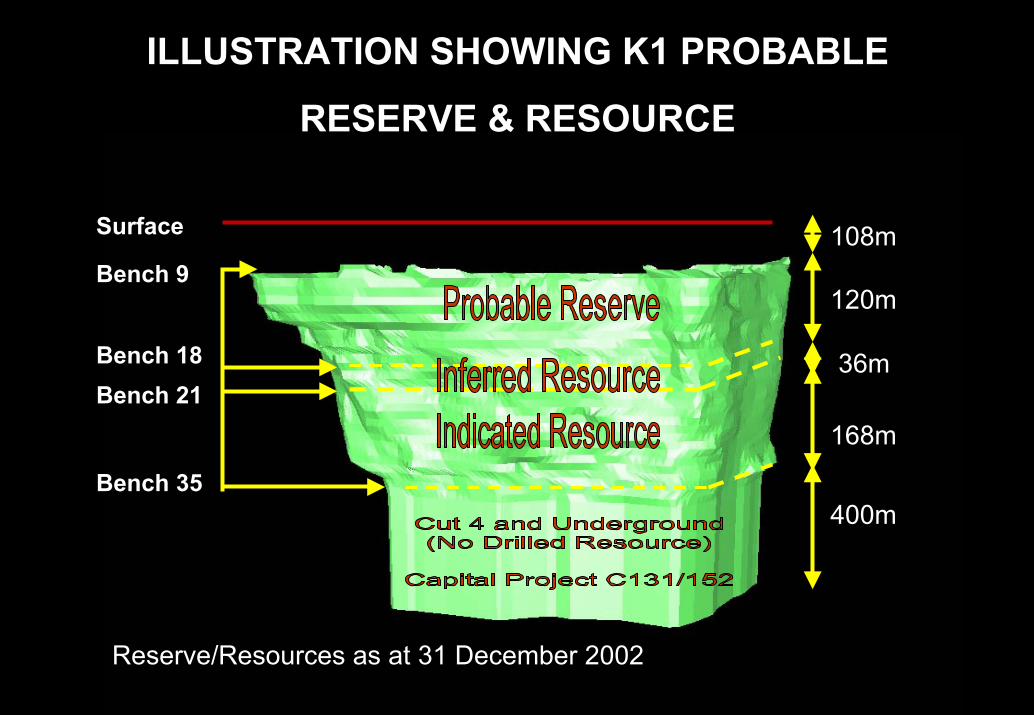
Surface
Reserve/Resources as at 31 December 2002
Bench 9
Bench 35
108m
120m
400m
Bench 18Bench 21
36m
168m
ILLUSTRATION SHOWING K1 PROBABLE
RESERVE & RESOURCE
ILLUSTRATION SHOWING K1 PROBABLE
RESERVE & RESOURCE
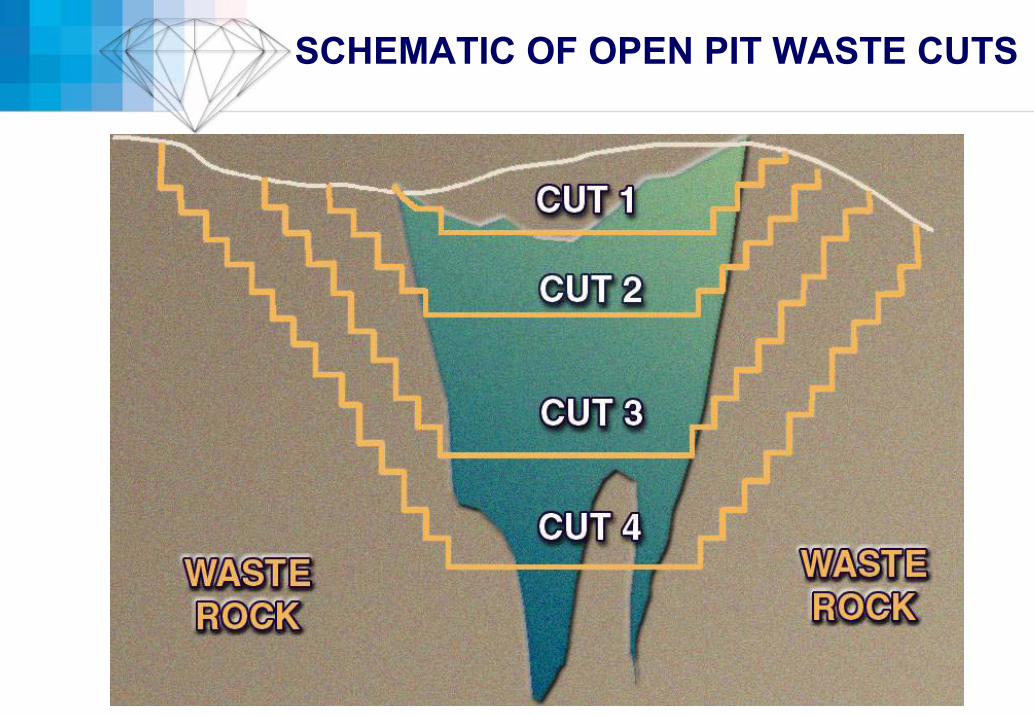
SCHEMATIC OF OPEN PIT WASTE CUTS
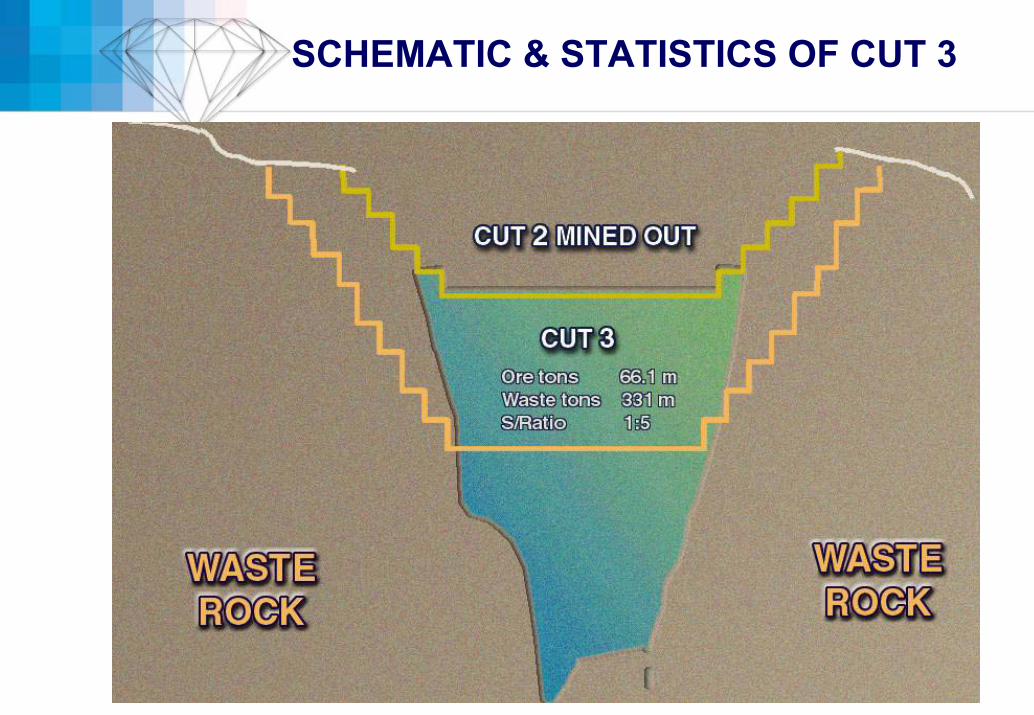
SCHEMATIC & STATISTICS OF CUT 3
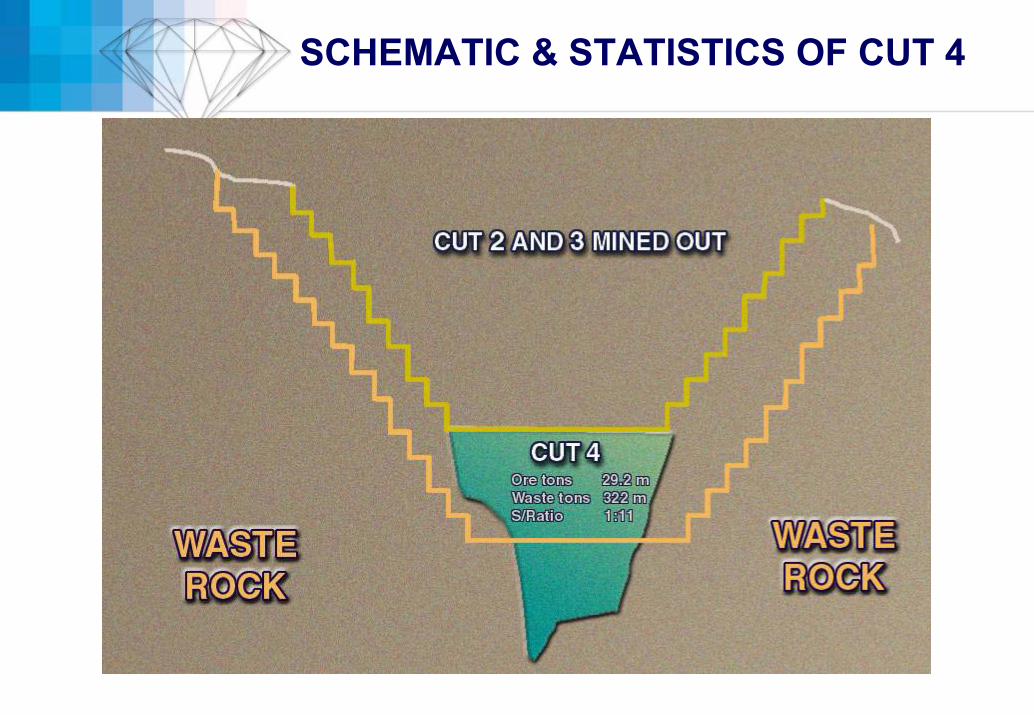
SCHEMATIC & STATISTICS OF CUT 4
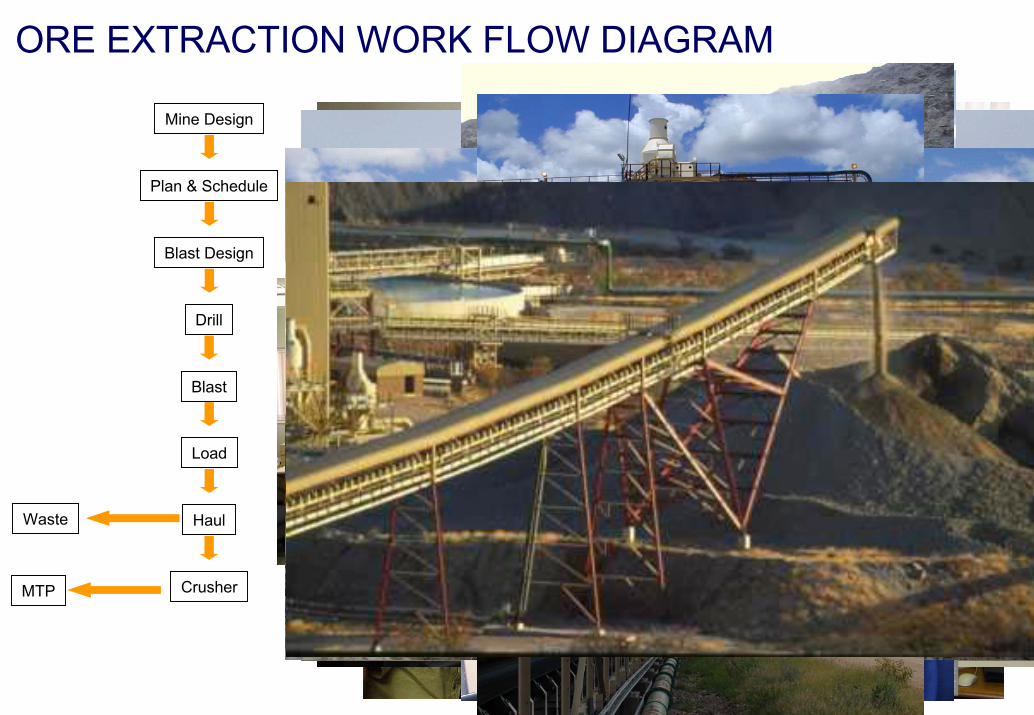
ORE EXTRACTION WORK FLOW DIAGRAM
Plan & Schedule
Mine Design
Blast Design
Drill
Blast
Load
Haul
MTP
Waste
Crusher
ORE PROCESSING
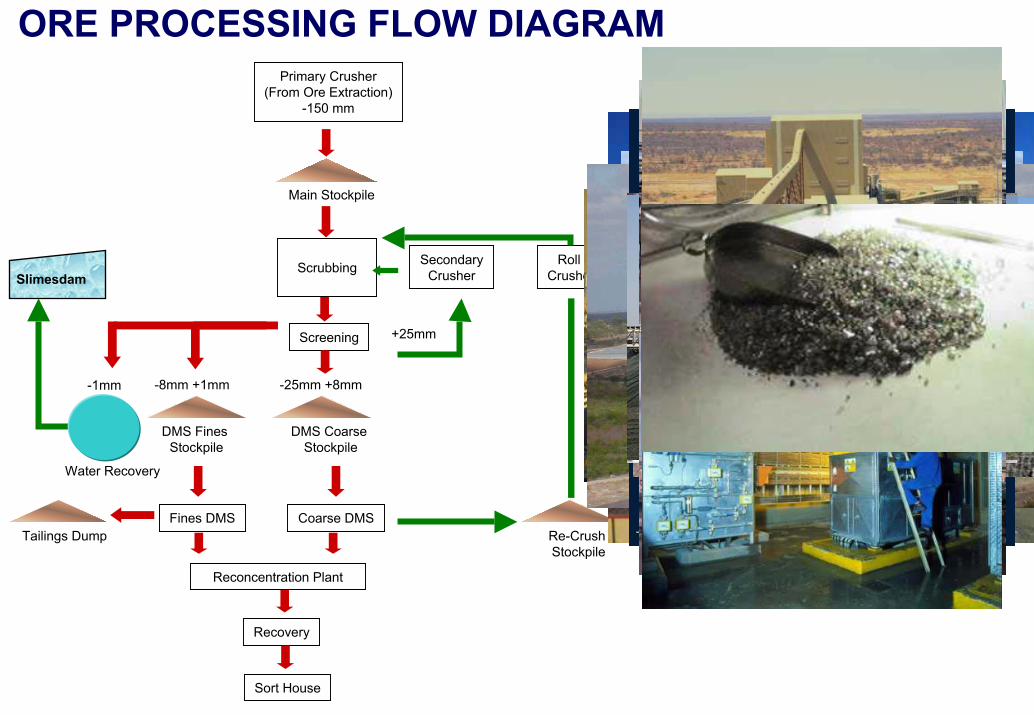
Primary Crusher(From Ore Extraction)
-150 mm
Main Stockpile
Scrubbing
Screening
DMS Coarse Stockpile
-25mm +8mm
Fines DMS Coarse DMSTailings Dump
Recovery
Sort House
-8mm +1mm
DMS Fines Stockpile
Reconcentration Plant
Roll Crusher
Re-Crush Stockpile
SecondaryCrusher
+25mm
Slimesdam
Water Recovery
-1mm
ORE PROCESSING FLOW DIAGRAM
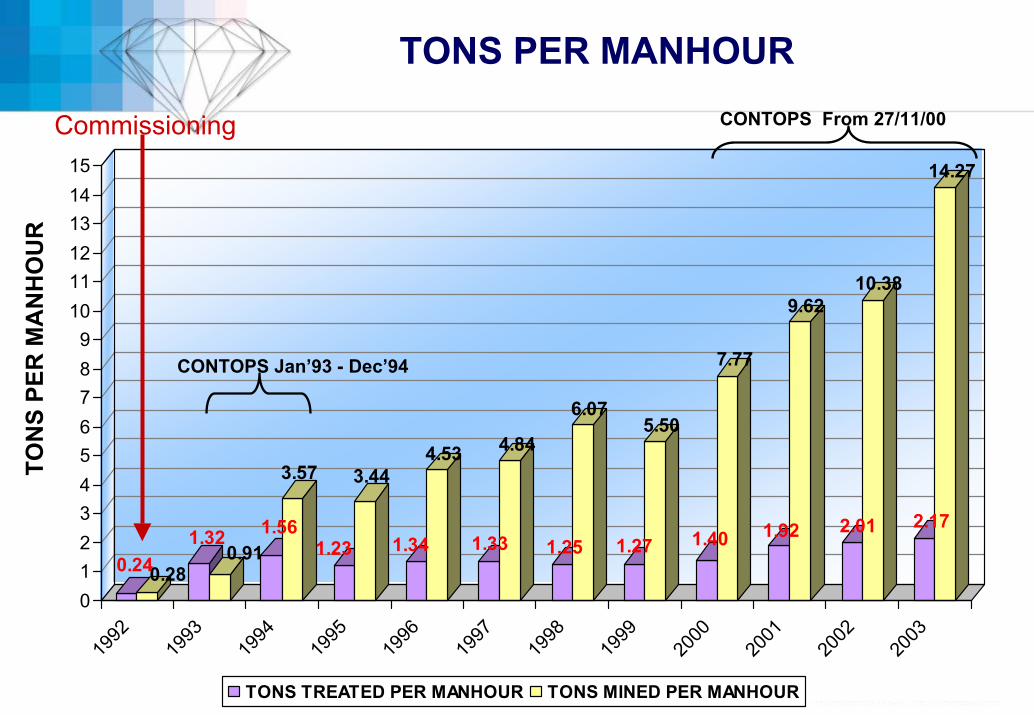
TONS PER MANHOUR
0.240.28
1.320.91
1.56
3.57
1.23
3.44
1.34
4.53
1.33
4.84
1.25
6.07
1.27
5.50
1.40
7.77
1.92
9.62
2.01
10.38
2.17
14.27
0123456789
101112131415
1992
1993
1994
1995
1996
1997
1998
1999
2000
2001
2002
2003
TONS TREATED PER MANHOUR TONS MINED PER MANHOUR
TON
S PE
R M
AN
HO
UR
CONTOPS Jan’93 - Dec’94
CONTOPS From 27/11/00Commissioning
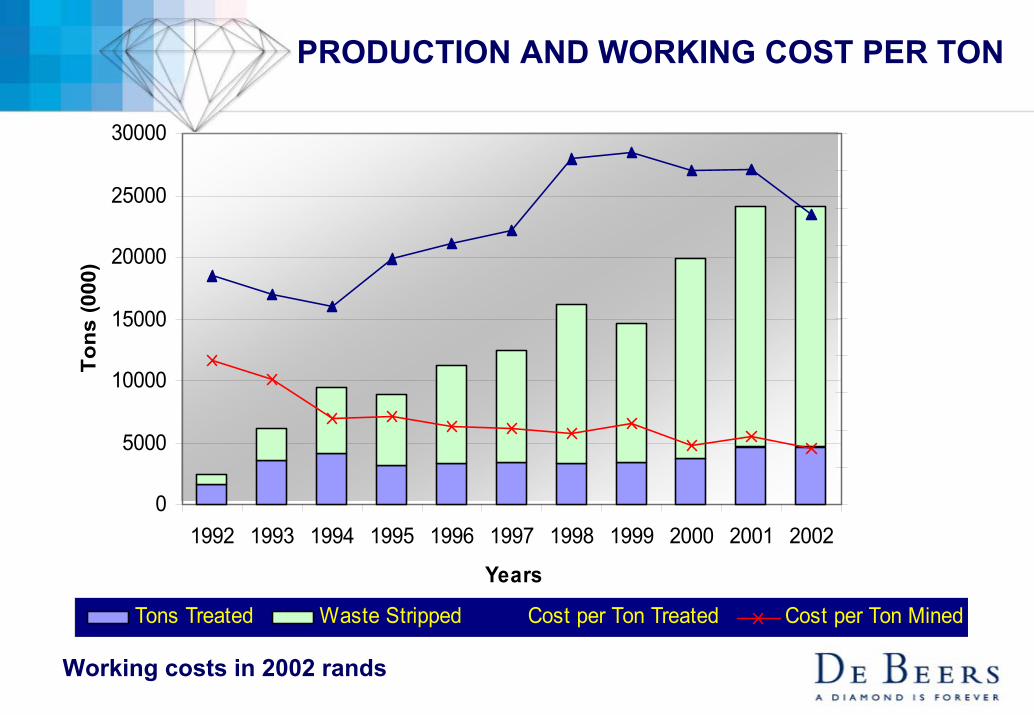
PRODUCTION AND WORKING COST PER TON
Working costs in 2002 rands
0
5000
10000
15000
20000
25000
30000
1992 1993 1994 1995 1996 1997 1998 1999 2000 2001 2002
Years
Tons
(000
)
R 0.00R 10.00R 20.00R 30.00R 40.00R 50.00R 60.00R 70.00R 80.00R 90.00R 100.00
Cos
t per
Ton
Tons Treated Waste Stripped Cost per Ton Treated Cost per Ton Mined

TECHNOLOGY
♦ Split shell mining method♦ Fleet Management Control System♦ Drill Monitoring System♦ Computer Aided Earthmoving System♦ Plant Control Expert System♦ Mine Planning System♦ Integrated Resource Asset Management System♦ Batcat Diamond Transport System♦ Scannex Personnel Scanner
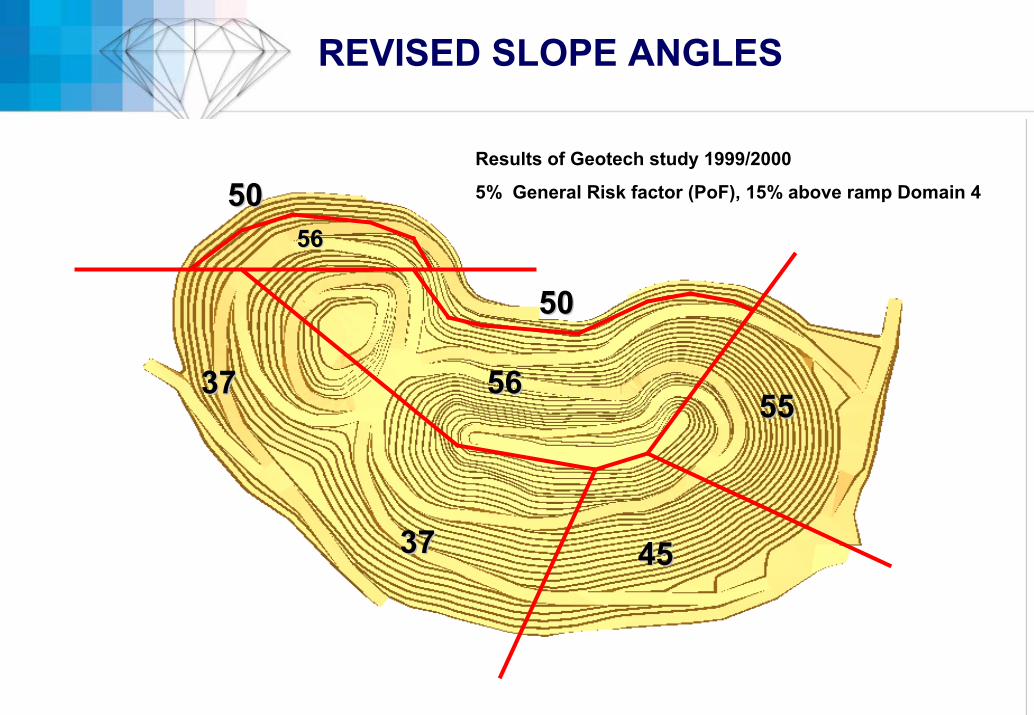
REVISED SLOPE ANGLES
3737 5656
5050
5555
56565050
45453737
Results of Geotech study 1999/2000
5% General Risk factor (PoF), 15% above ramp Domain 4
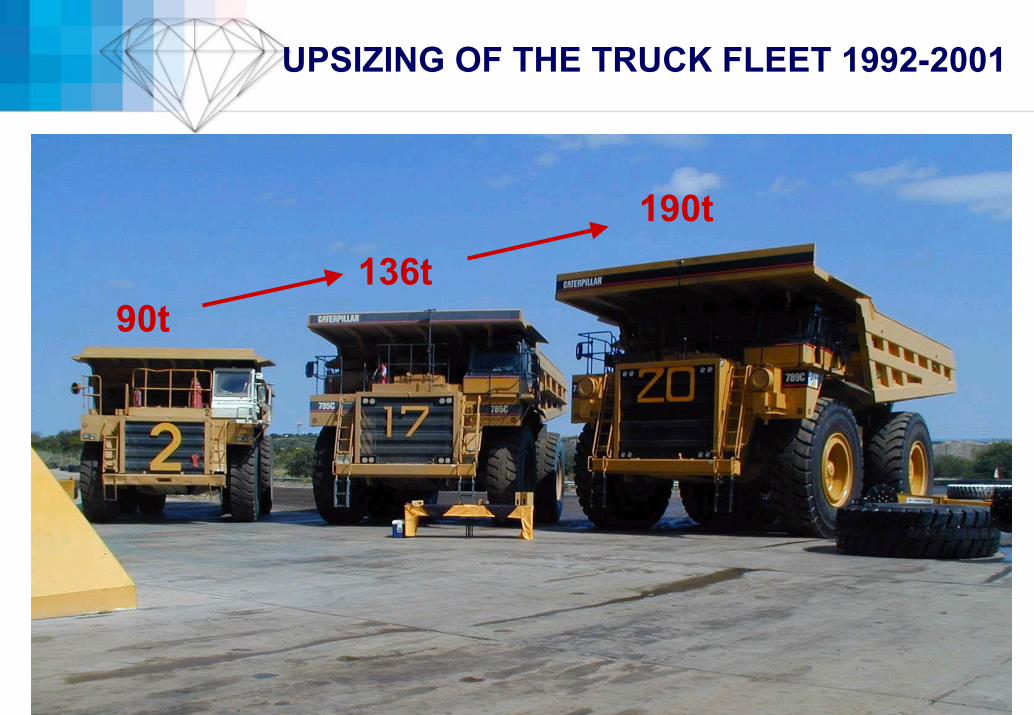
UPSIZING OF THE TRUCK FLEET 1992-2001
90t136t
190t
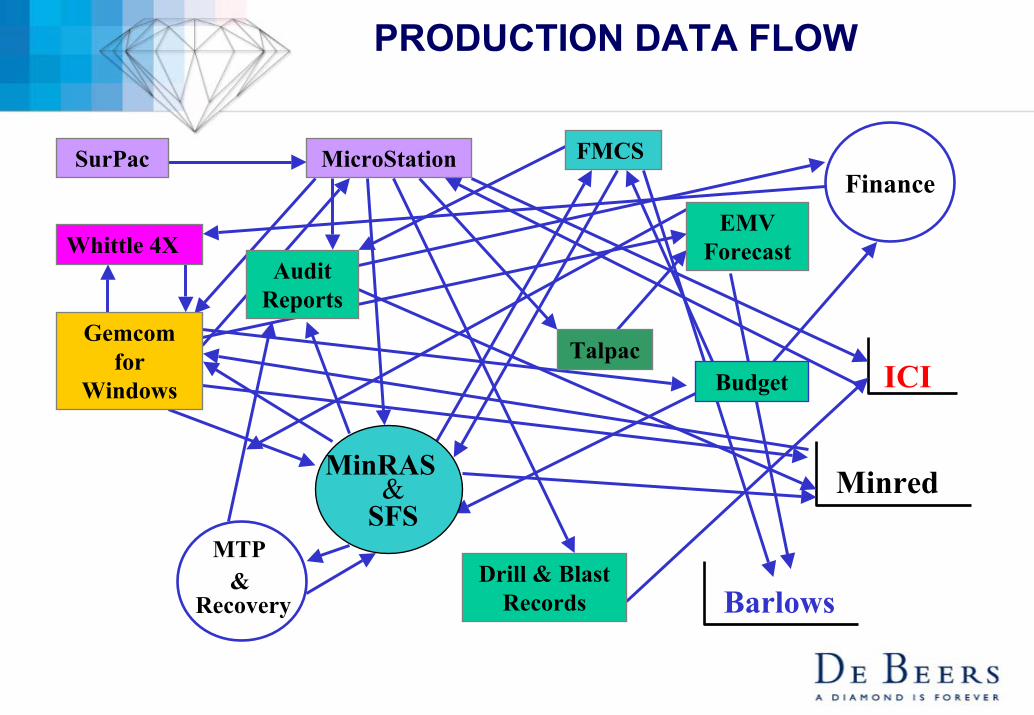
PRODUCTION DATA FLOW
Barlows
ICI
Minred
&
Finance
MinRAS
SFS&
Gemcomfor
Windows
MicroStation FMCS
EMV Forecast
Talpac
SurPac
MTP
RecoveryDrill & Blast
Records
Whittle 4XAudit
Reports
Budget
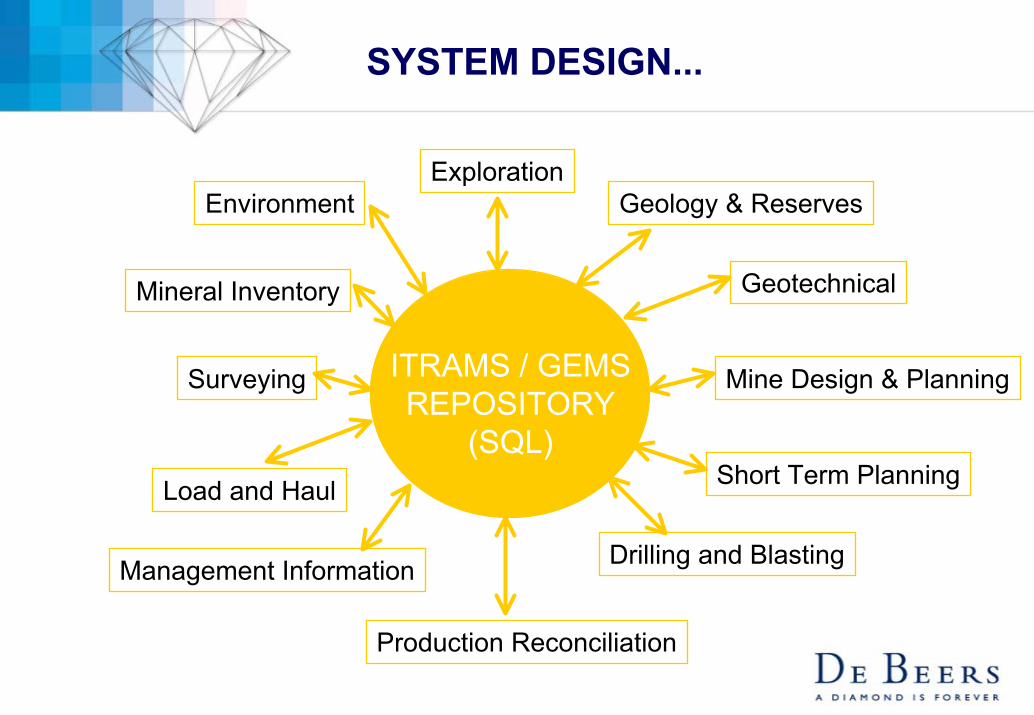
SYSTEM DESIGN...
Management Information
ITRAMS / GEMSREPOSITORY
(SQL)
Exploration
Geotechnical
Geology & Reserves
Mine Design & Planning
Drilling and Blasting
Short Term Planning
Production Reconciliation
Load and Haul
Surveying
Mineral Inventory
Environment
SMART PARTNERSHIP
common objective
reduce working costs
efficiency improvements
increased productivity
innovation and technology
safety and training
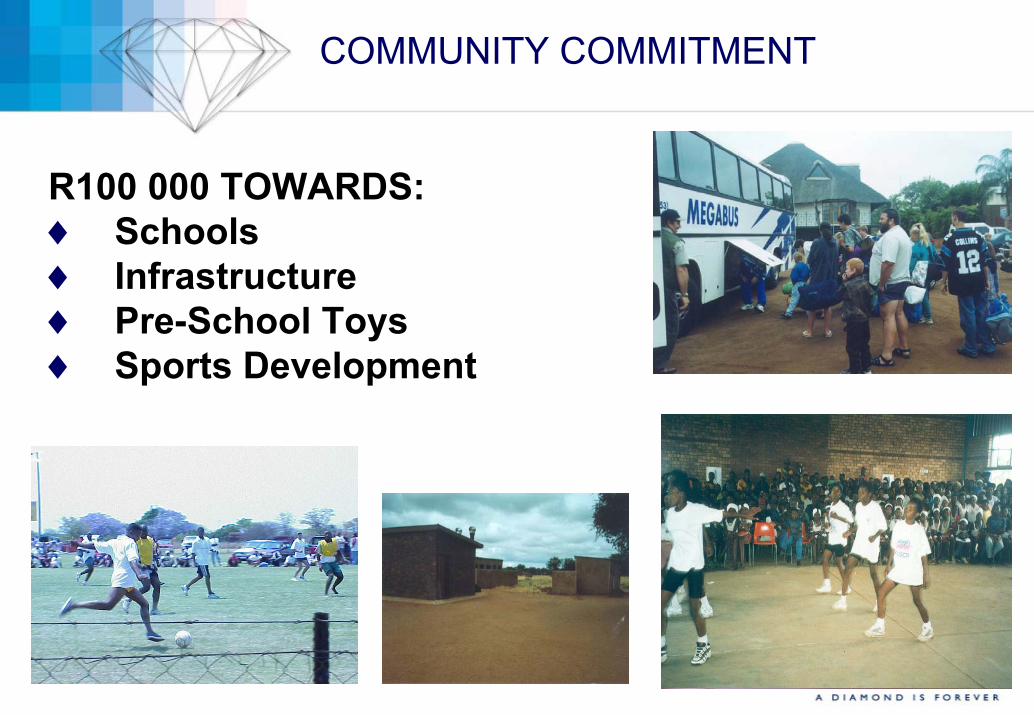
COMMUNITY COMMITMENT
R100 000 TOWARDS:♦ Schools♦ Infrastructure♦ Pre-School Toys♦ Sports Development
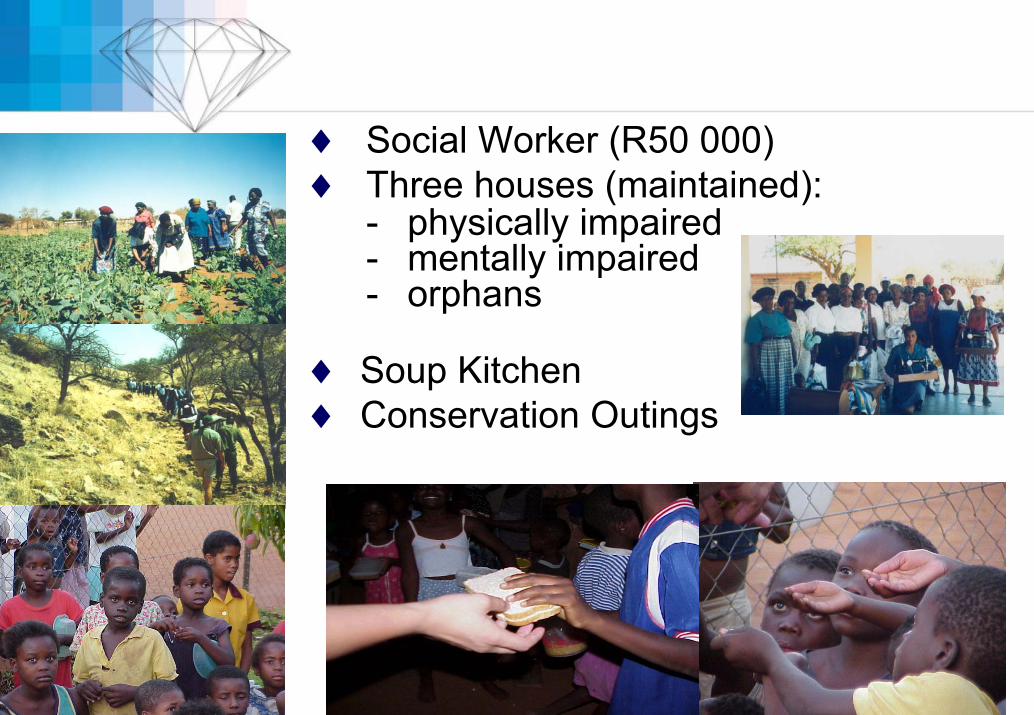
♦ Soup Kitchen♦ Conservation Outings
♦ Social Worker (R50 000)♦ Three houses (maintained):
- physically impaired- mentally impaired- orphans

SCHOOLS
♦ Re-Engineering - roles, structure changes♦ Strategic Planning Sessions♦ Teambuilding ♦ Computers (R 200 000 computer centres in both schools) ♦ Winning Teams - focus on English (Maths, Science, Biology)♦ Teachers Salary Subvention - R 1,1 million ♦ Governing Body Representation♦ Pass Rate - overall from 38% to 75%
THE END