Embed Size (px)
Citation preview
V E N T U R E C A P I T A L R E P O R T
Venture Capital Report Europe | 3Q | 2015
V E N T U R E C A P I T A L R E P O R T
VENTURE CAPITAL REPORT
The following report presents Dow Jones VentureSource’s quarterly findings for European venture capital fundraising, investment, valuation, and liquidity. The included charts and graphs offer a comprehensive view of the trends currently affecting the venture capital market.
Highlights for 3Q 2015 include:
• European venture capital fundraising falls from prior quarter;
• Venture capital investment into European companies improves in consecutive quarters;
• The number of initial public offerings (IPOs) experienced a decrease from the prior quarter, while the number of mergers and acquisitions (M&As) are on the rise.
2
V E N T U R E C A P I T A L R E P O R T
EUROPEAN VENTURE CAPITAL FUNDRAISING FALLS IN 3Q 2015
3
FUNDRAISING
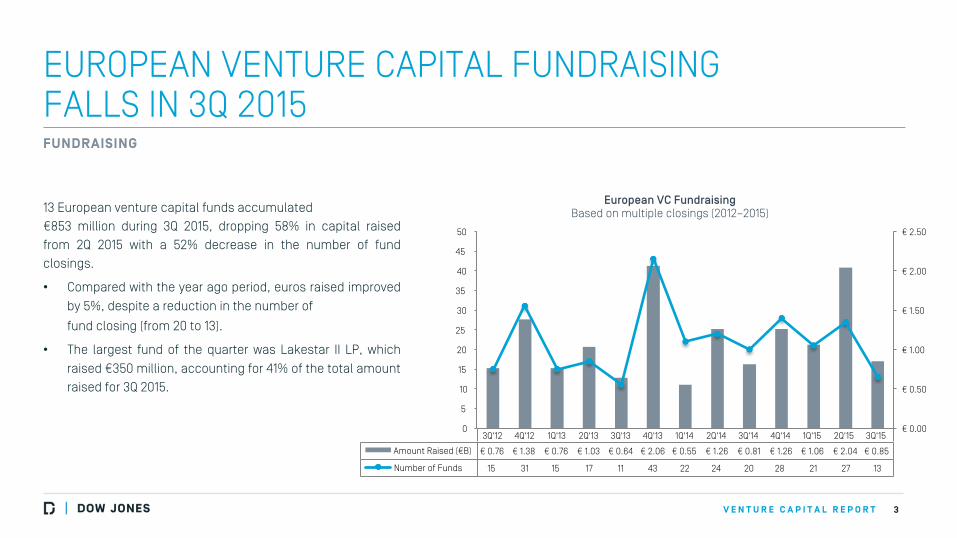
European VC Fundraising Based on multiple closings (2012–2015) 13 European venture capital funds accumulated
€853 million during 3Q 2015, dropping 58% in capital raised from 2Q 2015 with a 52% decrease in the number of fund closings.
• Compared with the year ago period, euros raised improved by 5%, despite a reduction in the number of
fund closing (from 20 to 13).
• The largest fund of the quarter was Lakestar II LP, which raised €350 million, accounting for 41% of the total amount raised for 3Q 2015.
3Q'12 4Q'12 1Q'13 2Q'13 3Q'13 4Q'13 1Q'14 2Q'14 3Q'14 4Q'14 1Q'15 2Q'15 3Q'15
Amount Raised (€B) € 0.76 € 1.38 € 0.76 € 1.03 € 0.64 € 2.06 € 0.55 € 1.26 € 0.81 € 1.26 € 1.06 € 2.04 € 0.85
Number of Funds 15 31 15 17 11 43 22 24 20 28 21 27 13
0
5
10
15
20
25
30
35
40
45
50
€ 0.00
€ 0.50
€ 1.00
€ 1.50
€ 2.00
€ 2.50
V E N T U R E C A P I T A L R E P O R T
LARGEST EUROPEAN VC FUNDS RAISED IN 3Q 2015
4
FUNDRAISING
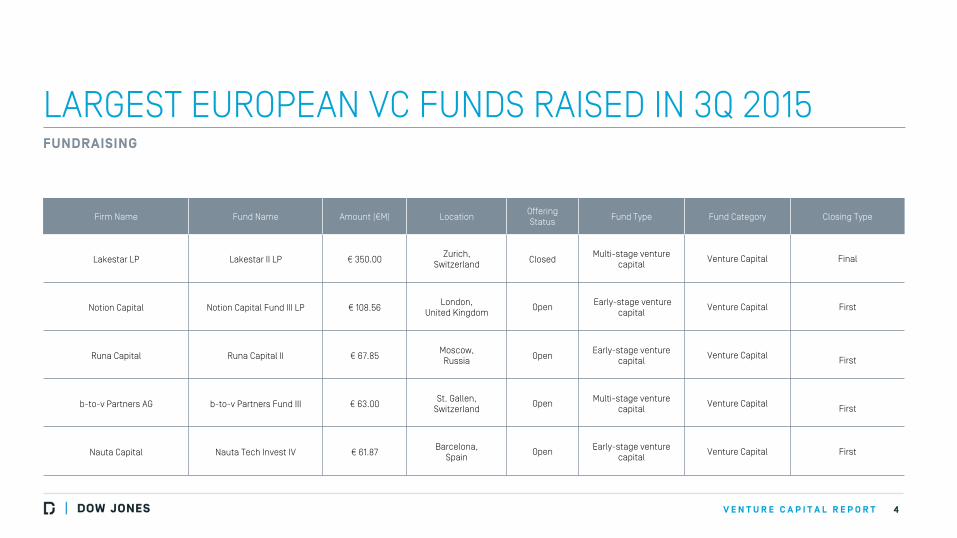
Firm Name Fund Name Amount (€M) Location Offering Status Fund Type Fund Category Closing Type
Lakestar LP Lakestar II LP € 350.00 Zurich,
Switzerland Closed Multi-stage venture
capital Venture Capital Final
Notion Capital Notion Capital Fund III LP € 108.56 London,
United Kingdom Open Early-stage venture
capital Venture Capital First
Runa Capital Runa Capital II € 67.85 Moscow, Russia Open
Early-stage venture capital
Venture Capital
First
b-to-v Partners AG b-to-v Partners Fund III € 63.00 St. Gallen,
Switzerland Open Multi-stage venture
capital Venture Capital
First
Nauta Capital Nauta Tech Invest IV € 61.87 Barcelona,
Spain Open Early-stage venture
capital Venture Capital First
V E N T U R E C A P I T A L R E P O R T
INVESTMENT INTO EUROPEAN VENTURE-BACKED COMPANIES IMPROVES ONCE MORE IN 3Q 2015
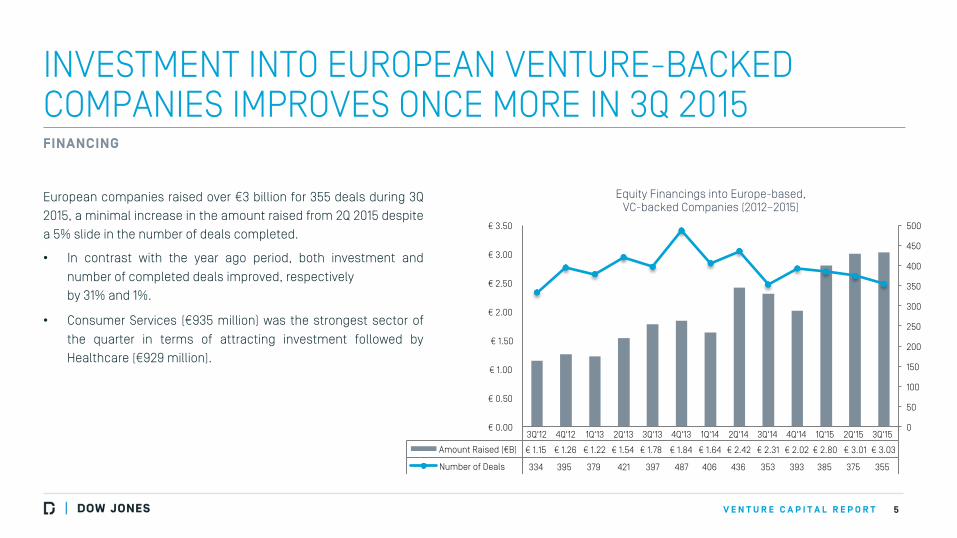
European companies raised over €3 billion for 355 deals during 3Q 2015, a minimal increase in the amount raised from 2Q 2015 despite a 5% slide in the number of deals completed.
• In contrast with the year ago period, both investment and number of completed deals improved, respectively by 31% and 1%.
• Consumer Services (€935 million) was the strongest sector of the quarter in terms of attracting investment followed by Healthcare (€929 million).
5
FINANCING
Equity Financings into Europe-based, VC-backed Companies (2012–2015)
3Q'12 4Q'12 1Q'13 2Q'13 3Q'13 4Q'13 1Q'14 2Q'14 3Q'14 4Q'14 1Q'15 2Q'15 3Q'15
Amount Raised (€B) € 1.15 € 1.26 € 1.22 € 1.54 € 1.78 € 1.84 € 1.64 € 2.42 € 2.31 € 2.02 € 2.80 € 3.01 € 3.03
Number of Deals 334 395 379 421 397 487 406 436 353 393 385 375 355
0
50
100
150
200
250
300
350
400
450
500
€ 0.00
€ 0.50
€ 1.00
€ 1.50
€ 2.00
€ 2.50
€ 3.00
€ 3.50
V E N T U R E C A P I T A L R E P O R T
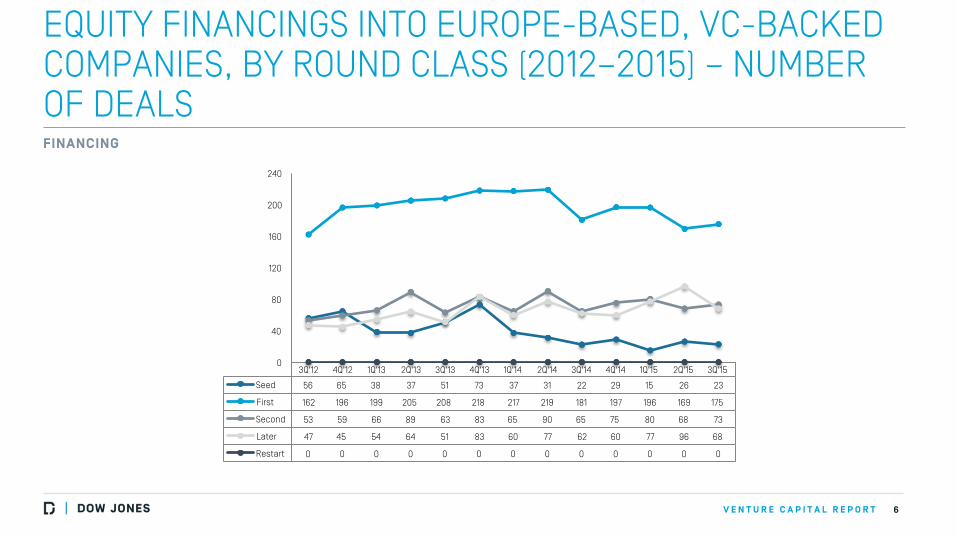
EQUITY FINANCINGS INTO EUROPE-BASED, VC-BACKED COMPANIES, BY ROUND CLASS (2012–2015) – NUMBER OF DEALS
6
FINANCING
3Q'12 4Q'12 1Q'13 2Q'13 3Q'13 4Q'13 1Q'14 2Q'14 3Q'14 4Q'14 1Q'15 2Q'15 3Q'15
Seed 56 65 38 37 51 73 37 31 22 29 15 26 23
First 162 196 199 205 208 218 217 219 181 197 196 169 175
Second 53 59 66 89 63 83 65 90 65 75 80 68 73
Later 47 45 54 64 51 83 60 77 62 60 77 96 68
Restart 0 0 0 0 0 0 0 0 0 0 0 0 0
0
40
80
120
160
200
240
V E N T U R E C A P I T A L R E P O R T
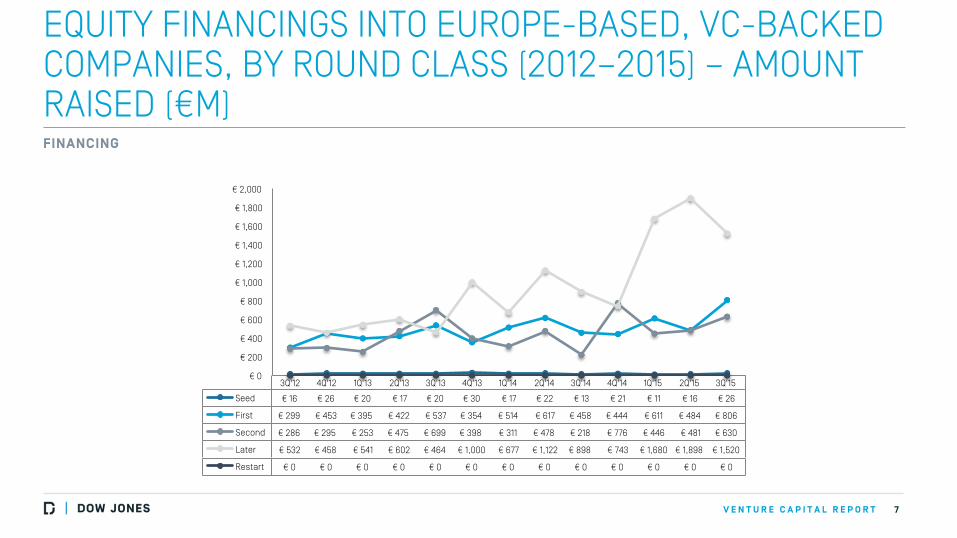
EQUITY FINANCINGS INTO EUROPE-BASED, VC-BACKED COMPANIES, BY ROUND CLASS (2012–2015) – AMOUNT RAISED (€M)
7
FINANCING
3Q'12 4Q'12 1Q'13 2Q'13 3Q'13 4Q'13 1Q'14 2Q'14 3Q'14 4Q'14 1Q'15 2Q'15 3Q'15
Seed € 16 € 26 € 20 € 17 € 20 € 30 € 17 € 22 € 13 € 21 € 11 € 16 € 26
First € 299 € 453 € 395 € 422 € 537 € 354 € 514 € 617 € 458 € 444 € 611 € 484 € 806
Second € 286 € 295 € 253 € 475 € 699 € 398 € 311 € 478 € 218 € 776 € 446 € 481 € 630
Later € 532 € 458 € 541 € 602 € 464 € 1,000 € 677 € 1,122 € 898 € 743 € 1,680 € 1,898 € 1,520
Restart € 0 € 0 € 0 € 0 € 0 € 0 € 0 € 0 € 0 € 0 € 0 € 0 € 0
€ 0
€ 200
€ 400
€ 600
€ 800
€ 1,000
€ 1,200
€ 1,400
€ 1,600
€ 1,800
€ 2,000
V E N T U R E C A P I T A L R E P O R T
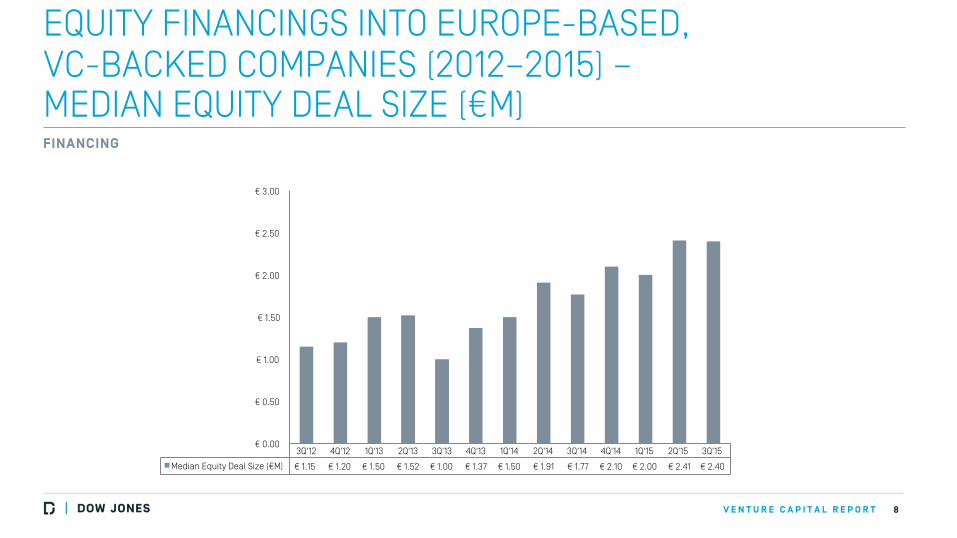
EQUITY FINANCINGS INTO EUROPE-BASED, VC-BACKED COMPANIES (2012–2015) – MEDIAN EQUITY DEAL SIZE (€M)
8
FINANCING
3Q'12 4Q'12 1Q'13 2Q'13 3Q'13 4Q'13 1Q'14 2Q'14 3Q'14 4Q'14 1Q'15 2Q'15 3Q'15
Median Equity Deal Size (€M) € 1.15 € 1.20 € 1.50 € 1.52 € 1.00 € 1.37 € 1.50 € 1.91 € 1.77 € 2.10 € 2.00 € 2.41 € 2.40
€ 0.00
€ 0.50
€ 1.00
€ 1.50
€ 2.00
€ 2.50
€ 3.00
V E N T U R E C A P I T A L R E P O R T
EQUITY FINANCINGS INTO EUROPE-BASED, VC-BACKED COMPANIES, BY INDUSTRY GROUP (3Q 2015)
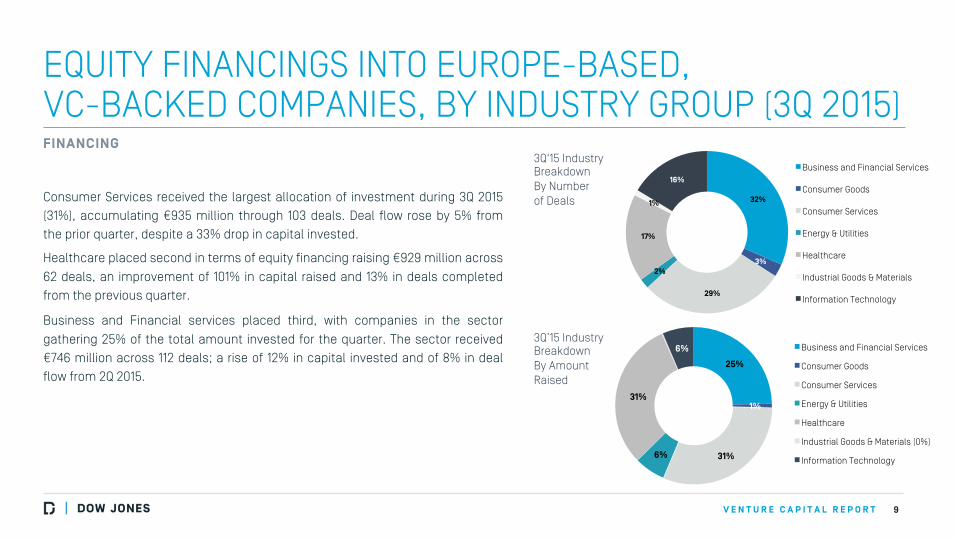
Consumer Services received the largest allocation of investment during 3Q 2015 (31%), accumulating €935 million through 103 deals. Deal flow rose by 5% from the prior quarter, despite a 33% drop in capital invested.
Healthcare placed second in terms of equity financing raising €929 million across 62 deals, an improvement of 101% in capital raised and 13% in deals completed from the previous quarter.
Business and Financial services placed third, with companies in the sector gathering 25% of the total amount invested for the quarter. The sector received €746 million across 112 deals; a rise of 12% in capital invested and of 8% in deal flow from 2Q 2015.
9
FINANCING 3Q'15 Industry Breakdown By Number of Deals
3Q’15 Industry Breakdown By Amount Raised
32%
3%
29%
2%
17%
1%
16% Business and Financial Services
Consumer Goods
Consumer Services
Energy & Utilities
Healthcare
Industrial Goods & Materials
Information Technology
25%
1%
31% 6%
31%
6% Business and Financial Services
Consumer Goods
Consumer Services
Energy & Utilities
Healthcare
Industrial Goods & Materials (0%)
Information Technology
V E N T U R E C A P I T A L R E P O R T
TOP 5 DEALS INTO EUROPEAN VC-BACKED COMPANIES (3Q 2015)
1 0
Co. Name Location Industry
Code Industry Segment
Industry Group
Brief Description
Close Date
Round Type
Raised (€M)
Round Investors (* denotes lead)
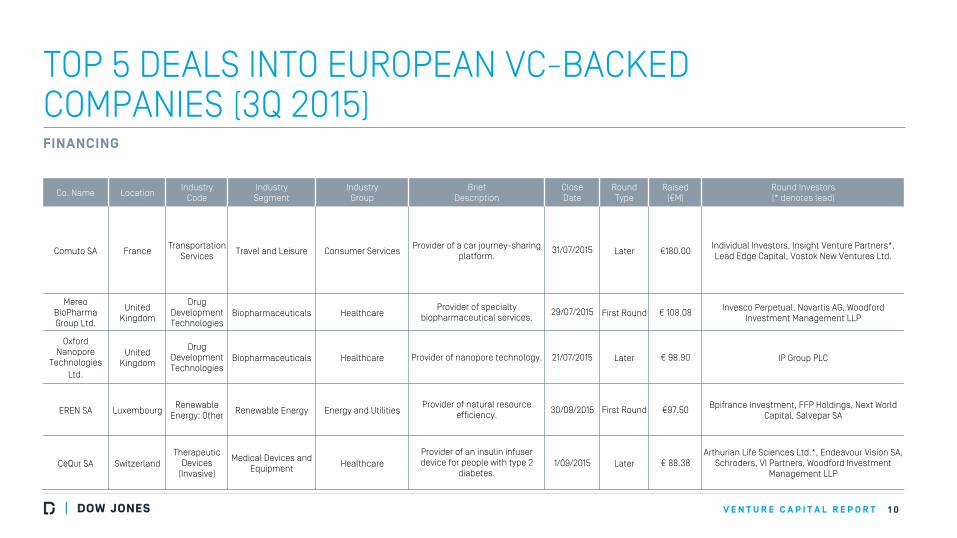
Comuto SA France Transportation
Services Travel and Leisure Consumer Services Provider of a car journey-sharing
platform. 31/07/2015 Later €180.00
Individual Investors, Insight Venture Partners*, Lead Edge Capital, Vostok New Ventures Ltd.
Mereo BioPharma Group Ltd.
United Kingdom
Drug Development Technologies
Biopharmaceuticals Healthcare Provider of specialty
biopharmaceutical services. 29/07/2015 First Round € 108.08 Invesco Perpetual, Novartis AG, Woodford
Investment Management LLP
Oxford Nanopore
Technologies Ltd.
United Kingdom
Drug Development Technologies
Biopharmaceuticals Healthcare Provider of nanopore technology. 21/07/2015 Later € 98.90 IP Group PLC
EREN SA Luxembourg Renewable
Energy: Other Renewable Energy Energy and Utilities Provider of natural resource
efficiency. 30/09/2015 First Round €97.50 Bpifrance Investment, FFP Holdings, Next World Capital, Salvepar SA
CeQur SA Switzerland Therapeutic
Devices (Invasive)
Medical Devices and Equipment Healthcare
Provider of an insulin infuser device for people with type 2
diabetes. 1/09/2015 Later € 88.38
Arthurian Life Sciences Ltd.*, Endeavour Vision SA, Schroders, VI Partners, Woodford Investment
Management LLP
FINANCING
V E N T U R E C A P I T A L R E P O R T
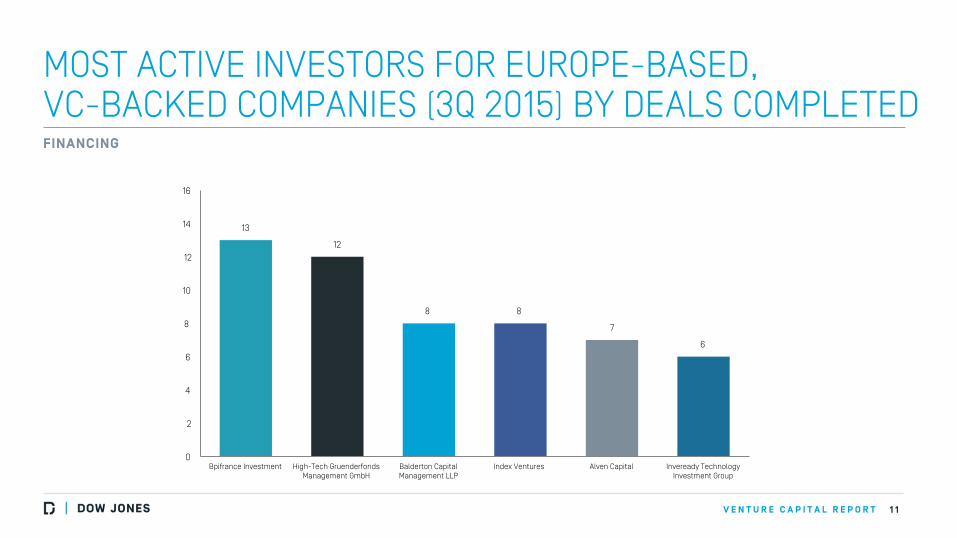
MOST ACTIVE INVESTORS FOR EUROPE-BASED, VC-BACKED COMPANIES (3Q 2015) BY DEALS COMPLETED
1 1
FINANCING
13
12
8 8
7
6
0
2
4
6
8
10
12
14
16
Bpifrance Investment High-Tech Gruenderfonds Management GmbH
Balderton Capital Management LLP
Index Ventures Alven Capital Inveready Technology Investment Group
V E N T U R E C A P I T A L R E P O R T
EQUITY FINANCINGS INTO EUROPE-BASED, VC-BACKED COMPANIES BY COUNTRY (3Q 2015)
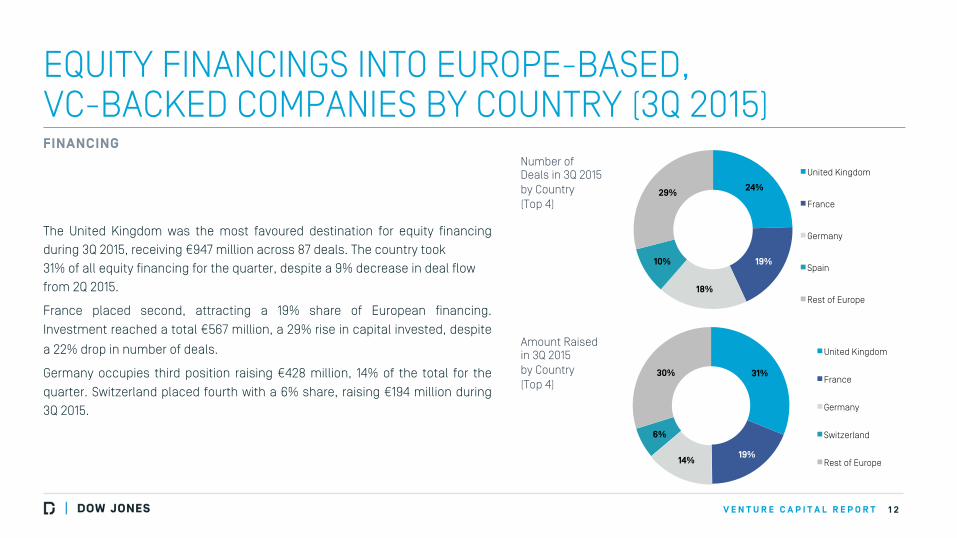
The United Kingdom was the most favoured destination for equity financing during 3Q 2015, receiving €947 million across 87 deals. The country took 31% of all equity financing for the quarter, despite a 9% decrease in deal flow from 2Q 2015.
France placed second, attracting a 19% share of European financing. Investment reached a total €567 million, a 29% rise in capital invested, despite
a 22% drop in number of deals.
Germany occupies third position raising €428 million, 14% of the total for the quarter. Switzerland placed fourth with a 6% share, raising €194 million during 3Q 2015.
1 2
FINANCING Number of Deals in 3Q 2015 by Country (Top 4)
Amount Raised in 3Q 2015 by Country (Top 4)
23%
19%
24%
19%
18%
10%
29%
United Kingdom
France
Germany
Spain
Rest of Europe
31%
19% 14%
6%
30%
United Kingdom
France
Germany
Switzerland
Rest of Europe
V E N T U R E C A P I T A L R E P O R T
EUROPE 3Q 2015 VENTURE EXIT ACTIVITY
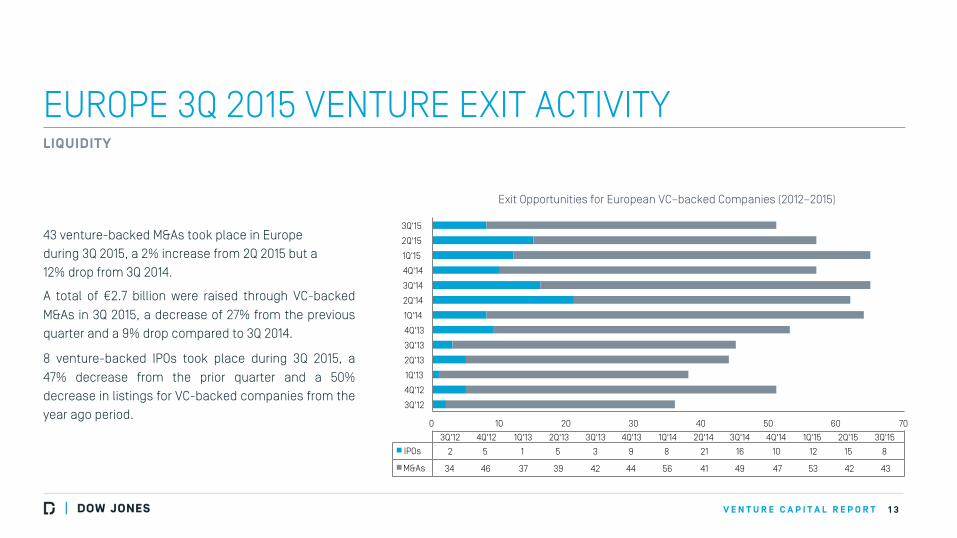
43 venture-backed M&As took place in Europe during 3Q 2015, a 2% increase from 2Q 2015 but a 12% drop from 3Q 2014.
A total of €2.7 billion were raised through VC-backed M&As in 3Q 2015, a decrease of 27% from the previous quarter and a 9% drop compared to 3Q 2014.
8 venture-backed IPOs took place during 3Q 2015, a 47% decrease from the prior quarter and a 50% decrease in listings for VC-backed companies from the year ago period.
1 3
LIQUIDITY
Exit Opportunities for European VC–backed Companies (2012–2015)
0 10 20 30 40 50 60 70
3Q'12
4Q'12
1Q'13
2Q'13
3Q'13
4Q'13
1Q'14
2Q'14
3Q'14
4Q'14
1Q'15
2Q'15
3Q'15
3Q'12 4Q'12 1Q'13 2Q'13 3Q'13 4Q'13 1Q'14 2Q'14 3Q'14 4Q'14 1Q'15 2Q'15 3Q'15
IPOs 2 5 1 5 3 9 8 21 16 10 12 15 8
M&As 34 46 37 39 42 44 56 41 49 47 53 42 43
V E N T U R E C A P I T A L R E P O R T
TOP 3 M&As IN EUROPE (3Q 2015)
1 4
Company Name Location Brief
Description Industry
Code Industry Segment Industry Group Close Date
Round Type
Amount Paid (€M) Acquirer
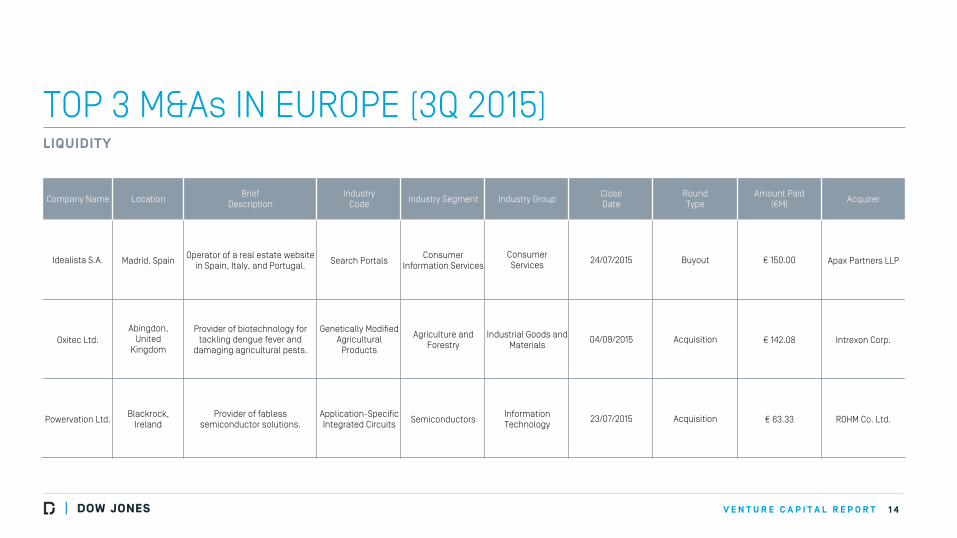
Idealista S.A. Madrid, Spain Operator of a real estate website
in Spain, Italy, and Portugal. Search Portals Consumer
Information Services Consumer Services 24/07/2015 Buyout € 150.00 Apax Partners LLP
Oxitec Ltd. Abingdon,
United Kingdom
Provider of biotechnology for tackling dengue fever and
damaging agricultural pests.
Genetically Modified Agricultural
Products
Agriculture and Forestry
Industrial Goods and Materials
04/09/2015 Acquisition € 142.08 Intrexon Corp.
Powervation Ltd. Blackrock,
Ireland Provider of fabless
semiconductor solutions. Application-Specific Integrated Circuits Semiconductors
Information Technology
23/07/2015 Acquisition € 63.33 ROHM Co. Ltd.
LIQUIDITY
V E N T U R E C A P I T A L R E P O R T
EUROPEAN VC-BACKED IPOs (2012-2015)
1 5
LIQUIDITY
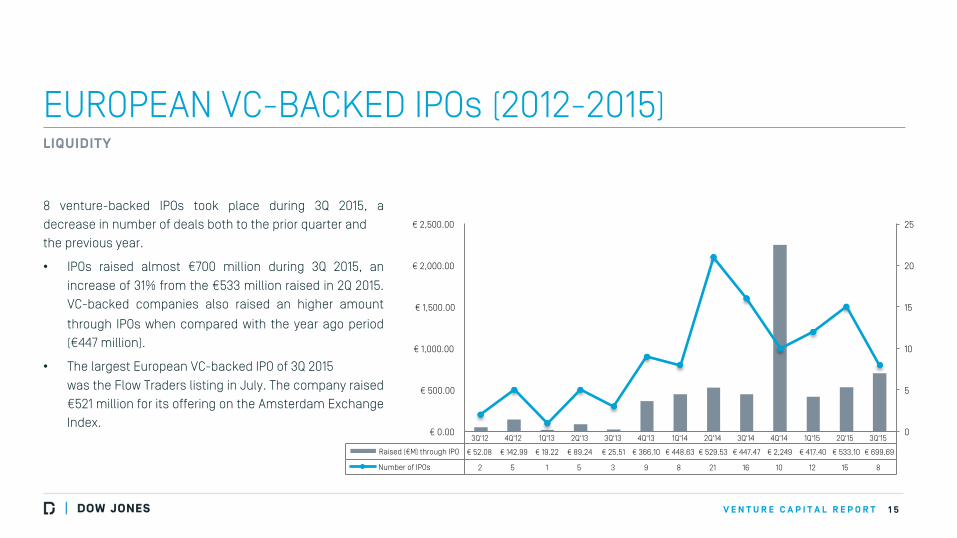
8 venture-backed IPOs took place during 3Q 2015, a decrease in number of deals both to the prior quarter and the previous year.
• IPOs raised almost €700 million during 3Q 2015, an increase of 31% from the €533 million raised in 2Q 2015. VC-backed companies also raised an higher amount
through IPOs when compared with the year ago period (€447 million).
• The largest European VC-backed IPO of 3Q 2015 was the Flow Traders listing in July. The company raised €521 million for its offering on the Amsterdam Exchange Index.
3Q'12 4Q'12 1Q'13 2Q'13 3Q'13 4Q'13 1Q'14 2Q'14 3Q'14 4Q'14 1Q'15 2Q'15 3Q'15
Raised (€M) through IPO € 52.08 € 142.99 € 19.22 € 89.24 € 25.51 € 366.10 € 448.63 € 529.53 € 447.47 € 2,249 € 417.40 € 533.10 € 699.69
Number of IPOs 2 5 1 5 3 9 8 21 16 10 12 15 8
0
5
10
15
20
25
€ 0.00
€ 500.00
€ 1,000.00
€ 1,500.00
€ 2,000.00
€ 2,500.00
V E N T U R E C A P I T A L R E P O R T
TOP 3 IPOs IN EUROPE (3Q 2015)
1 6
LIQUIDITY
Company Name Location Brief
Description Industry
Code Industry Segment Industry Group Close Date
Raised through IPO (€M)
Exchange/ Symbol
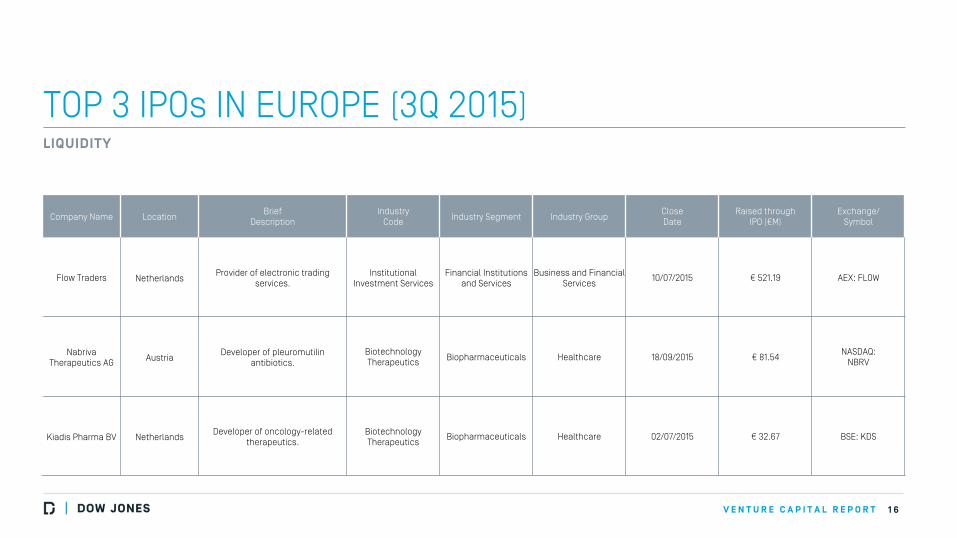
Flow Traders Netherlands Provider of electronic trading
services. Institutional
Investment Services Financial Institutions
and Services Business and Financial
Services 10/07/2015 € 521.19 AEX: FLOW
Nabriva Therapeutics AG Austria
Developer of pleuromutilin antibiotics.
Biotechnology Therapeutics Biopharmaceuticals Healthcare 18/09/2015 € 81.54
NASDAQ: NBRV
Kiadis Pharma BV Netherlands Developer of oncology-related
therapeutics. Biotechnology Therapeutics
Biopharmaceuticals Healthcare 02/07/2015 € 32.67 BSE: KDS
V E N T U R E C A P I T A L R E P O R T
ABOUT US
Dow Jones VentureSource helps venture capitalists, corporate development executives, investment bankers and service provider find deal and partnership opportunities, perform comprehensive due diligence and examine trends in venture capital investment, fund-raising and liquidity. It provides accurate, comprehensive data on venture-backed companies – including their investors and executives – in every region, industry and stage of development throughout the world.
The investment figures included in this release are based on aggregate findings of Dow Jones’ proprietary research and are contained in VentureSource. This data was collected through survey of professional firms, interviews with company executives, and from secondary sources. These venture capital
statistics cover equity investments into early stage, innovative companies and do not include companies receiving funding solely from corporate, individual, and/or government investors. Figures contained throughout the report current at time of editorial but are subject to change without notice. No statement herein is to be construed as a recommendation to buy or sell securities or to provide investment advice.
1 7
V E N T U R E C A P I T A L R E P O R T
ABOUT DOW JONES
Dow Jones is a global provider of news and business information, delivering content to consumers and organizations around the world across multiple formats, including print digital, mobile and live events. Dow Jones has produced unrivaled quality content for more than 125 years and today has one of the world’s largest newsgathering operations globally. It produces leading publications and products including the flagship Wall Street Journal, America’s largest newspaper by paid circulation; Factiva, Barron’s, MarketWatch, Financial News, DJX, Dow Jones Risk & Compliance, Dow Jones Newswires, and Dow Jones VentureSource.
MEDIA CONTACT:
44 (0)20 7573 4016
1 8


![VENTURE CAPITAL FOR SUSTAINABILITY 2007 REPORT [2007] Venture Capital... · growing sector as Venture Capital for Sustainability ... Venture Capitalists’ stake in ... Venture Capital](https://img.pdfslide.net/doc/110x75/5a7926b77f8b9a00168dc540/venture-capital-for-sustainability-2007-2007-venture-capitalgrowing-sector.jpg)