Embed Size (px)
Citation preview
1 Australian Charities and Not-for-profits Commission Centre for Social Impact and Social Policy Research Centre
AUSTRALIA’S GRANT-MAKING CHARITIES IN 2016
Australian Charities and Not-for-profits Commission
The Australian Charities and Not-for-profits Commission (ACNC) is Australia’s national charity regulator. Registered charities are required to provide the ACNC with an Annual Information Statement comprising up-to-date corporate governance and financial data. The ACNC has commissioned the University of New South Wales (UNSW) Sydney to analyse charity data and provide reports for distribution to the sector and the broader Australian community. This closes the feedback loop for charities required to provide data and provides empirically-based insights into Australia’s charities. ACNC data can also be explored at: http://australiancharities.acnc.gov.au/.
Centre for Social ImpactThe Centre for Social Impact (CSI) is a national research and education centre dedicated to catalysing social change for a better world. CSI is built on the foundation of three of Australia’s leading universities: UNSW Sydney, The University of Western Australia and Swinburne University of Technology. Our research develops knowledge to understand current social challenges and opportunities; our postgraduate and undergraduate education develops social impact leaders; and we aim to catalyse change by drawing on these foundations and translating knowledge, creating leaders, developing usable resources and reaching across traditional divides to facilitate collaborations.
Social Policy Research CentreThe Social Policy Research Centre (SPRC) at UNSW Sydney was founded in 1980 as Australia’s first national research centre dedicated to shaping awareness of social welfare issues. The Centre makes a positive impact through independent and leading research that explores the key social issues of poverty, inequality, wellbeing and justice.
Research teamCSI: Abigail Powell, Ioana Ramia, Axelle Marjolin, Nicola Hannigan
SPRC: Natasha Cortis
Suggested citationCortis, N, Powell, A, Ramia, I and Marjolin, A 2018, Australia’s grant-making charities in 2016: an analysis of structured philanthropy and other grant-makers, Centre for Social Impact and Social Policy Research Centre, UNSW Australia.
Contact for follow-upAbigail Powell, Senior Research Fellow, Centre for Social Impact: Email: [email protected] Ph: 02 8936 0916
AcknowledgementsThe research team thanks ACNC staff for support, including Annie Keely, Natashia Allitt, Tim Liu, Emma Chiu, Breanna Murray, and Nathan Hughes. Report Advisers include Wendy Scaife, Myles McGregor-Lowndes, Krystian Seibert, John McLeod, John Fitzgerald and David Ward. We extend appreciation to the charities featured as case studies: Reichstein Foundation, Starfish Foundation, CAGES Foundation, Fremantle Foundation and Women’s Plans Foundation. Any errors or omissions are those of the authors.©ACNC for the Commonwealth of Australia. You are free to copy, adapt, modify, transmit and distribute this material as you wish (but not in any way that suggests the ACNC or the Commonwealth endorses you or any of your services or products). However, we do ask that you cite this report using the suggested citation above.
2 Australian Charities and Not-for-profits Commission Centre for Social Impact and Social Policy Research Centre
AUSTRALIA’S GRANT-MAKING CHARITIES IN 2016
ContentsContents................................................................................................................................................3
Case Studies..........................................................................................................................................4
Figures...................................................................................................................................................5
Appendix figures....................................................................................................................................7
Abbreviations........................................................................................................................................8
Executive summary................................................................................................................................9Headline statistics............................................................................................................................... 9Where does the data come from?.....................................................................................................11
1. Introduction.................................................................................................................................12Defining grant-making charities.........................................................................................................12Building knowledge of Australia’s grant-making charities..................................................................15About the dataset.............................................................................................................................. 16
2. What size were grant-making charities?........................................................................................18ACNC measure of size...................................................................................................................... 18Detailed measure of the size of grant-making charities.....................................................................19
3. Where were grant-making charities located?................................................................................21Charity street address....................................................................................................................... 21Charity operating locations................................................................................................................21Charities registered in rural and remote locations.............................................................................22Charities operating overseas.............................................................................................................23
4. How old were grant-making charities?..........................................................................................26
5. What did grant-making charities do?............................................................................................27Charitable purpose............................................................................................................................ 27DGR status........................................................................................................................................ 27Main activities.................................................................................................................................... 28Activities and outcomes that helped grant-making charities achieve their purpose...........................30
6. Understanding the purpose and structure of grants.....................................................................34
7. Who did grant-making charities help?...........................................................................................39Charities helping the general community in Australia........................................................................39Charities that helped specific groups.................................................................................................41
8. Who worked in grant-making charities?........................................................................................44Paid employees................................................................................................................................. 44Volunteers in Australia’s grant-making charities................................................................................45Charities with both volunteers and employees..................................................................................46
9. How did grant-making charities fund their activities?....................................................................48Summary of revenue and other income............................................................................................48Total revenue.................................................................................................................................... 49Revenue sources.............................................................................................................................. 50
10. Assets held by grant-making charities...........................................................................................53
11. How did grant-making charities allocate their funds?....................................................................55Total expenses.................................................................................................................................. 55Composition of expenditure...............................................................................................................55Expenditure on grants and donations................................................................................................56Concentration of expenditure............................................................................................................59
Australian Charities and Not-for-profits Commission Centre for Social Impact and Social Policy Research Centre 3
AUSTRALIA’S GRANT-MAKING CHARITIES IN 2016
12. The financial status of grant-making charities...............................................................................60Revenue diversification.....................................................................................................................60Net income........................................................................................................................................ 61Asset ratios....................................................................................................................................... 63
13. Change among grant-making charities 2015 to 2016....................................................................65Size................................................................................................................................................... 65Change in numbers of paid staff and volunteers...............................................................................66Change in financial resources...........................................................................................................66Change in expenditure on grants and donations...............................................................................66
14. Conclusion....................................................................................................................................68
References...........................................................................................................................................70
Appendix A: Supplementary Tables......................................................................................................71What size were grant-making charities?............................................................................................71Where were grant-making charities located?....................................................................................72How old were grant-making charities?..............................................................................................73What did grant-making charities do?.................................................................................................74Who did grant-making charities help?...............................................................................................75Who worked in grant-making charities?............................................................................................77How did grant-making charities fund their activities?.........................................................................77How did grant-making charities allocate their funds?........................................................................78What were the total assets of grant-making charities?......................................................................79The financial status of grant-making charities...................................................................................79Change among grant-making charities from 2015 to 2016................................................................81
Appendix B: Australia’s largest grant-making charities in 2016.............................................................82Highest grants expended..................................................................................................................82Highest donations and bequests received.........................................................................................83
Case StudiesWomen’s Plans Foundation: Case study of a grant-making charity engaged overseas...........................25
The Reichstein Foundation: Case study of a trust providing multi-year support....................................38
Fremantle Foundation: Case study of a grant-making charity assisting the general community............40
CAGES Foundation: Case study of a charity supporting Aboriginal and Torres Strait Islander people.....43
Starfish Foundation: Case study of a grant-making charity without employees....................................47
4 Australian Charities and Not-for-profits Commission Centre for Social Impact and Social Policy Research Centre
AUSTRALIA’S GRANT-MAKING CHARITIES IN 2016
FiguresFigure 1.1 Number of private ancillary funds and their total distributions, 2001–02 to 2014–15..............13
Figure 1.2 Number of public ancillary funds and their total distributions, 2011–12 to 2014–15................14
Figure 1.3 Summary of grant-making charities.........................................................................................16
Figure 2.1 ACNC measure of size for grant-making charities and all charities (%)..................................19
Figure 2.2 Detailed measure of size by revenue (%)................................................................................20
Figure 3.1 Charity street addresses by jurisdiction (%)............................................................................21
Figure 3.2 Charities operating in each jurisdiction (%).............................................................................22
Figure 3.3 Charities operating in each jurisdiction (%).............................................................................22
Figure 3.4 Charities registered in major cities, regional and remote areas (%)........................................23
Figure 3.5 Charities operating overseas (%)............................................................................................24
Figure 3.6 Top 10 countries by number of Australian charities operating there.......................................24
Figure 4.1 Age of grant-making charities (%)...........................................................................................26
Figure 5.1 Most common charitable purposes among charities...............................................................27
Figure 5.2 Most common main activities selected (%).............................................................................29
Figure 5.3 Word frequency: how grant-making charities’ activities and outcomes helped achieve purpose................................................................................................................................................ 30
Figure 5.4 Word frequency: how grant-making charities expect to change or introduce activities in 2017 reporting period....................................................................................................................... 32
Figure 6.1 Charities spending major and minor proportions of grant funds on capacity building of grant recipients (%).......................................................................................................................... 34
Figure 6.2 Charities spending major and minor amounts of grant funds specifically on recipients in rural and regional Australia (%).......................................................................................................35
Figure 6.3 Charities distributing major and minor proportions of grant funds as multi-year grants (%)....36
Figure 6.4 Charities distributing major and minor amounts of grant funds through public or open application processes (%).......................................................................................................37
Figure 7.1 Beneficiary type by type of grant-making charity (%)..............................................................39
Figure 7.2 Grant-making charities that helped specific categories of beneficiaries (%)............................41
Figure 7.3 Specific categories helped, grant-makers and all charities (%)...............................................42
Figure 8.1 Charities with no paid staff (%)................................................................................................44
Figure 8.2 Full-time, part-time and casual staff in grant-making charities................................................45
Figure 8.3 Mean number of volunteers.....................................................................................................45
Figure 8.4 Grant-making charities with employees and volunteers (%)....................................................46
Figure 9.1 Total revenue and other income for all grant-making charities................................................48
Figure 9.2 Total revenue of grant-making charities in 2016.....................................................................49
Figure 9.3 Concentration of revenue among grant-making charities in 2016...........................................50
Figure 9.4 Total revenue by source (%)...................................................................................................50
Figure 9.5 Grant-making charities with any revenue from each source (%).............................................51
Figure 9.6 Charities for which donations and bequests comprised more than 50% of total income (%). .52
Australian Charities and Not-for-profits Commission Centre for Social Impact and Social Policy Research Centre 5
AUSTRALIA’S GRANT-MAKING CHARITIES IN 2016
Figure 10.1 Key indicators of total and average assets..............................................................................53
Figure 10.2 Mean value of total assets ($million).......................................................................................54
Figure 10.3 Concentration of total assets among grant-making charities...................................................54
Figure 11.1 Mean and median total expenditure ($)...................................................................................55
Figure 11.2 Composition of expenditure (%)..............................................................................................56
Figure 11.3 Spending on grants and donations for use in and outside Australia ($)..................................57
Figure 11.4 Spending on grants and donations for use in and outside Australia (%).................................58
Figure 11.5 Contribution of grant-makers to total spending on grants and donations for use in and outside Australia (%)............................................................................................................................ 58
Figure 11.6 Concentration of expenditure..................................................................................................59
Figure 12.1 Revenue diversification (%).....................................................................................................61
Figure 12.2 Summary of income and expenses ($)....................................................................................62
Figure 12.3 Net income ratio (%)...............................................................................................................62
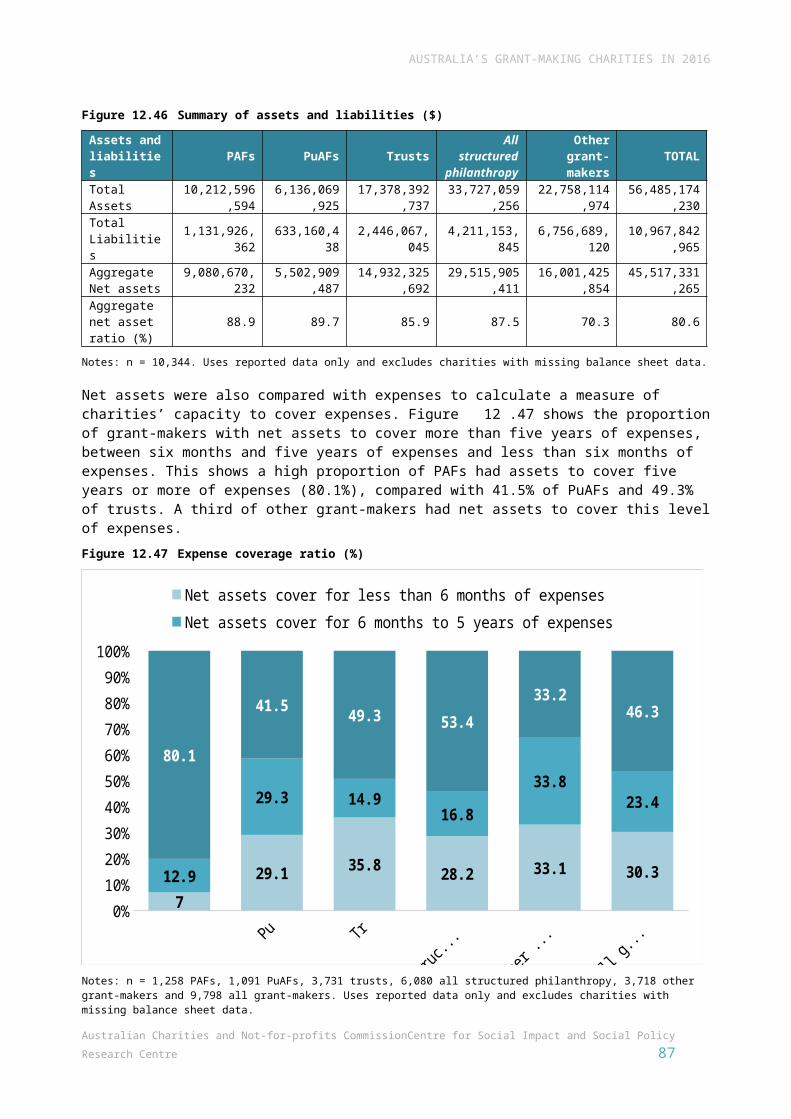
Figure 12.4 Summary of assets and liabilities ($).......................................................................................63
Figure 12.5 Expense coverage ratio (%)....................................................................................................64
Figure 13.1 Percentage of grant-making charities that changed size category from 2015 to 2016............65
Figure 13.2 Key indicators of change in staff and volunteers, 2015 and 2016...........................................66
Figure 13.3 Key financial indicators, 2015 to 2016 ($)...............................................................................66
Figure 13.4 Expenditure on grants and donations, 2015 to 2016 ($).........................................................67
6 Australian Charities and Not-for-profits Commission Centre for Social Impact and Social Policy Research Centre
AUSTRALIA’S GRANT-MAKING CHARITIES IN 2016
Appendix figuresFigure A.1 ACNC size definition using revenue........................................................................................71
Figure A.2 Detailed measure of size by revenue......................................................................................71
Figure A.3 Grant-making charities registered in each jurisdiction.............................................................72
Figure A.4 Grant-making charities operating in each jurisdiction..............................................................72
Figure A.5 Proportion of grant-making charities by age............................................................................73
Figure A.6 Main activities most commonly selected by grant-making charities........................................74
Figure A.7 Grant-making charities helping the general community and specific categories of beneficiaries................................................................................................................................................ 75
Figure A.8 Specific groups helped by grant-making charities...................................................................76
Figure A.9 Grant-making charities with employees and volunteers..........................................................77
Figure A.10 Total income ($)...................................................................................................................... 77
Figure A.11 Sources of income and revenue..............................................................................................78
Figure A.12 Composition of expenditure.....................................................................................................78
Figure A.13 Mean, median and total assets...............................................................................................79
Figure A.14 Revenue diversification...........................................................................................................79
Figure A.15 Net income ratio......................................................................................................................80
Figure A.16 Expenses coverage ratio.........................................................................................................80
Figure A.17 Change in size from 2015 to 2016..........................................................................................81
Figure A.18 PAFs ranked by level of expenditure on donations and grants...............................................82
Figure A.19 PuAFs ranked by level of expenditure on donations and grants.............................................82
Figure A.20 Trusts ranked by level of expenditure on donations and grants..............................................83
Figure A.21 Other grant-makers ranked by level of expenditure on donations and grants.........................83
Figure A.22 PAFs ranked by donations and bequests received.................................................................83
Figure A.23 PuAFs ranked by donations and bequests received...............................................................84
Figure A.24 Trusts ranked by donations and bequests received................................................................84
Figure A.25 Other grant-makers ranked by donations and bequests received...........................................84
Australian Charities and Not-for-profits Commission Centre for Social Impact and Social Policy Research Centre 7
AUSTRALIA’S GRANT-MAKING CHARITIES IN 2016
AbbreviationsABN Australian Business Number
ABR Australian Business Register
ACNC Australian Charities and Not-for-profits Commission
AIS Annual Information Statement
ATO Australian Taxation Office
CSI Centre for Social Impact
DGR Deductible Gift Recipient
L Large charity (total revenue $1,000,000 to less than $10,000,000 in detailed size categories)
M Medium charity (total revenue $250,000 to less than $1,000,000)
NGO non-government organisation
PAF private ancillary fund
PuAF public ancillary fund
S Small charity (total revenue $50,000 to less than $250,000 in detailed size categories)
SPRC Social Policy Research Centre
WPF Women’s Plans Foundation
XL Extra-large charity (total revenue $10,000,000 to less than $100,000,000 in detailed size categories)
XS Extra-small charity (total revenue less than $50,000 in detailed size categories)
XXL Extra-extra-large charity (total revenue $100,000,000 or more in detailed size categories)
8 Australian Charities and Not-for-profits Commission Centre for Social Impact and Social Policy Research Centre
Executive summary
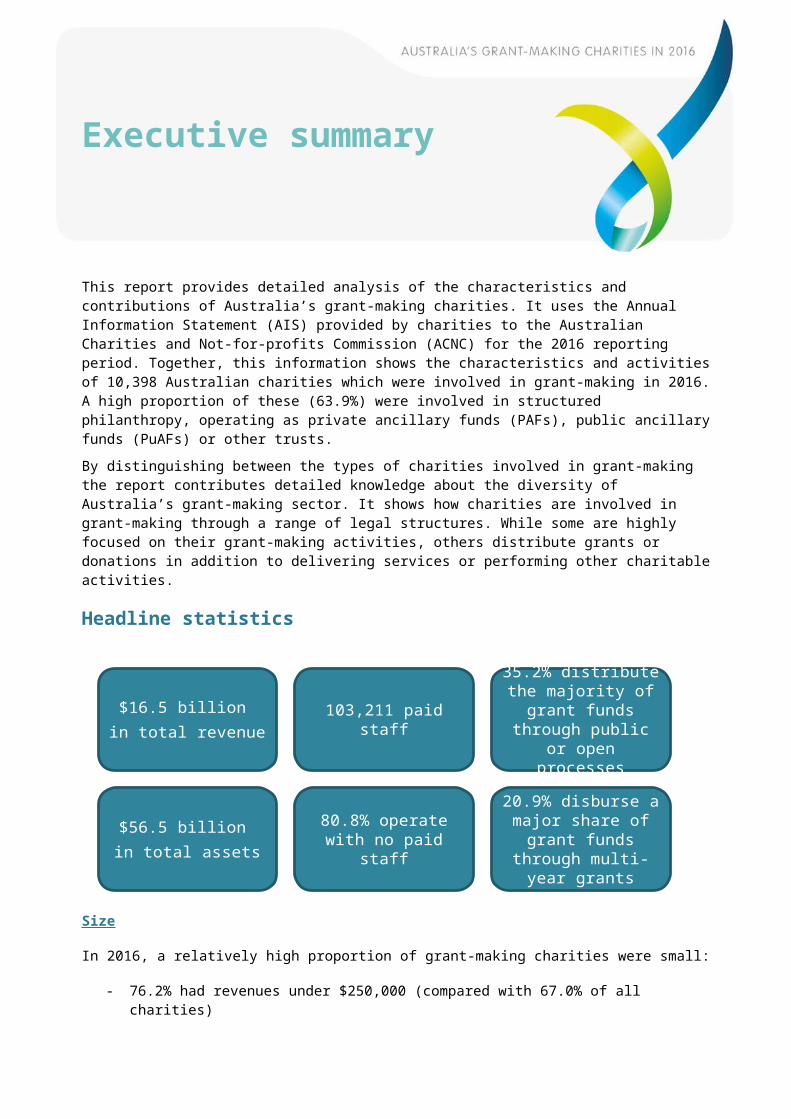
This report provides detailed analysis of the characteristics and contributions of Australia’s grant-making charities. It uses the Annual Information Statement (AIS) provided by charities to the Australian Charities and Not-for-profits Commission (ACNC) for the 2016 reporting period. Together, this information shows the characteristics and activities of 10,398 Australian charities which were involved in grant-making in 2016. A high proportion of these (63.9%) were involved in structured philanthropy, operating as private ancillary funds (PAFs), public ancillary funds (PuAFs) or other trusts.
By distinguishing between the types of charities involved in grant-making the report contributes detailed knowledge about the diversity of Australia’s grant-making sector. It shows how charities are involved in grant-making through a range of legal structures. While some are highly focused on their grant-making activities, others distribute grants or donations in addition to delivering services or performing other charitable activities.
Headline statistics
Size
In 2016, a relatively high proportion of grant-making charities were small:
- 76.2% had revenues under $250,000 (compared with 67.0% of all charities)- 49.3% had revenues under $50,000 (compared with 39.8% of all charities)- a relatively small proportion of grant-making charities had revenue over $10 million (2.0%,
compared with 4.0% of all charities).
Size profiles differed among grant-making charities. PAFs were less likely than others to be small. Around a third of PAFs (33.6%) had revenue under $50,000, compared with 43.2% of PuAFs and 56.7% of trusts.
$16.5 billion in total revenue
103,211 paid staff
35.2% distribute the majority of grant funds through public or open
processes
$56.5 billion in total assets
80.8% operate with no paid staff
20.9% disburse a major share of grant funds through multi-year
grants
AUSTRALIA’S GRANT-MAKING CHARITIES IN 2016
Activities After ‘grant-making activities’, the next most common main activities reported by Australia’s grant-makers were economic, social and community development (7.5%), religious activities (7.3%) and primary and secondary education (6.4%).
BeneficiariesRoughly half of grant-makers reported their beneficiaries were ‘the general community within Australia’ rather than specific groups, but this was higher among PAFs. Among grant-making charities that reported helping specific groups, the most common groups helped were ‘other charities’ and youth and children (aged 6–14).
The variety in the grant-making purposeGrants were provided for a variety of purposes, in a variety of ways, and to a variety of beneficiaries, including but not limited to:
39.2% for capacity-building purposes 14.0% to rural and regional recipients 37.1% distributed through public or open processes, and 23.6% as part of multi-year grants.
Staff and volunteersTogether, Australia’s grant-making charities employed a total of 103,211 paid staff. However, many grant-makers perform multiple activities and, as employment numbers are counted for the whole charity, this number includes staff involved in service delivery or other activities which may be unelated to charities’ grant-making functions.
A relatively high proportion of grant-making charities (80.8%) operated with no paid staff and a third (33.1%) reported neither paid staff nor volunteers for 2016.
Together, grant-making charities were supported by 337,288 volunteers over the year. The mean number of volunteers per grant-making charity was 32.9 (median of 3), lower than across the whole charity sector (57.8, median of 10).
Revenue Australia’s grant-making charities received approximately $16.5 billion in revenue in 2016 (see Figure9.29). Mean revenue per charity was $1.6 million, less than the mean figure for all of Australia’s charities ($2.8 million).
Donations and bequests contributed 24.8% of total revenue among grant-making charities, much higher than across the whole charity sector (7.3%). Over a third of grant-making charities (35.7%) received more than half their total income from donations and bequests.
As would be expected, government grants comprise a lower proportion of total revenue for grant-making charities (30.0%) than for the sector as a whole (43.0%).
Expenses
On average, grant-making charities spent $387,577 on grants and donations in 2016. Spending on grants and donations comprised 27.4% of grant-making charities’ total spending. This reflects the involvement of many grant-making charities in service delivery and other charitable activities in addition to making grants and donations. Among PAFs, spending on grants and donations comprised a much higher proportion of total expenditure (83.1%).
AssetsAustralia’s grant-making charities held total assets worth $56.5 billion in 2016. This accounted for 28.6% of the total value of assets held by Australia’s charities. On average, each grant-making charity held $5.5 million in assets; this was higher for PAFs ($7.8 million) and lower for trusts ($4.3 million).
10 Australian Charities and Not-for-profits Commission Centre for Social Impact and Social Policy Research Centre
AUSTRALIA’S GRANT-MAKING CHARITIES IN 2016
Assets were highly concentrated, with the top 10% of grant-makers holding 90.1% of grant-makers’ total assets.
Financial statusA little under half of grant-making charities (45.3%) reported one revenue source, although the figure was lower for PuAFs (31.7%). Grant-making charities had an aggregate net income ratio of 26.1%, but this figure was particularly high for PAFs (85.8%) reflecting high income relative to expenses.
Change from 2015 to 2016Expenditure on donations and grants for use in Australia grew by 28.2%, exceeding the growth in grant-makers’ total income over the same period (14.3%). The value of total assets increased by 7.5%.
Where does the data come from?
Data comes from information provided by Australian charities registered with the ACNC at the end of each charity’s 2016 financial year. This report uses the best and most recent data available for each charity to build a comprehensive and accurate picture of Australia’s charity sector. In most cases, data came from the 2016 AIS. Where a 2016 AIS was unavailable, proxy data was drawn from the charity’s most recent AIS and estimates used for the small number of charities for which an AIS was unavailable. More information is available in the Australian Charities Report 2016 and at http://australiancharities.acnc.gov.au/.
Australian Charities and Not-for-profits Commission Centre for Social Impact and Social Policy Research Centre 11
1. Introduction
As shown in the Australian Charities Report 2016, Australia’s charities perform a wide range of activities, including distributing grants and donations to other charitable causes. In 2016, over half of Australia’s charities reported some expenditure on grants and donations, and charities spent $6.7b on grants and donations for use either in Australia or overseas (Powell et al, 2017). As a companion report to the Australian Charities Report 2016, this report provides an in-depth exploration of the characteristics and activities of 10,398 charities which had a focus on grant-making in 2016. As with the Australian Charities Report 2016, this report uses data provided by charities in their 2016 AIS.
This report profiles the characteristics and activities of grant-makers as a group, with a key contribution being the exploration of diversity among grant-making charities. To do this, the report provides a breakdown of the characteristics and activities of those grant-makers that comprise structured philanthropy, consisting of PAFs, PuAFs and other trusts. The characteristics of structured philanthropy are explored alongside those identified as ‘other grant-makers’, based on information they provided to the ACNC about their activities and expenditure as part of their AIS.
In addition, five case studies are included throughout this report to showcase and celebrate the diversity of Australia’s grant-making charities and to demonstrate the many ways they pursue and achieve their purposes.
Overall, the information provides unprecedented insight into the characteristics, structure, activities, purposes and resources of different grant-making charities. It shows that, while there are some shared characteristics, grant-makers differ in many ways from the wider charity sector and there are also differences among grant-making charities. As such, this report contributes to a growing body of information about the rich and diverse social, economic and cultural contributions that charities make in Australia and internationally. This report also recognises the value of Australia’s charities and strengthens capacity for evidence-based regulation.
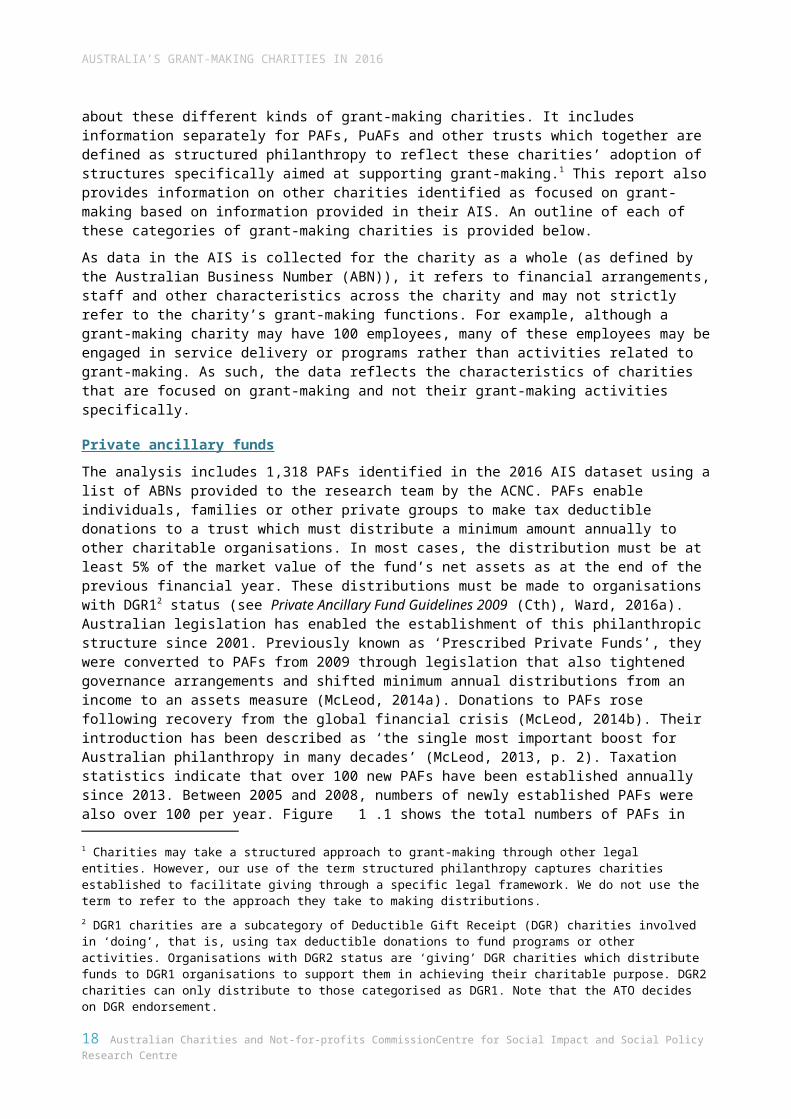
Defining grant-making charitiesGrant-making is undertaken by Australian charities using a range of legal structures. For many, grant-making may be only one component of the charity’s activities, operations and programs, while others may solely focus on distributing grants and donations. This report provides detail about these different kinds of grant-making charities. It includes information separately for PAFs, PuAFs and other trusts which together are defined as structured philanthropy to reflect these charities’ adoption of structures specifically aimed at supporting grant-making.1 This report also provides information on other charities identified as focused on grant-making based on information provided in their AIS. An outline of each of these categories of grant-making charities is provided below.
As data in the AIS is collected for the charity as a whole (as defined by the Australian Business Number (ABN)), it refers to financial arrangements, staff and other characteristics across the charity and may not strictly refer to the charity’s grant-making functions. For example, although a grant-making charity may have 100 employees, many of these employees may be engaged in service delivery or programs rather than activities related to grant-making. As such, the data reflects the characteristics of charities that are focused on grant-making and not their grant-making activities specifically.
1 Charities may take a structured approach to grant-making through other legal entities. However, our use of the term structured philanthropy captures charities established to facilitate giving through a specific legal framework. We do not use the term to refer to the approach they take to making distributions.
AUSTRALIA’S GRANT-MAKING CHARITIES IN 2016
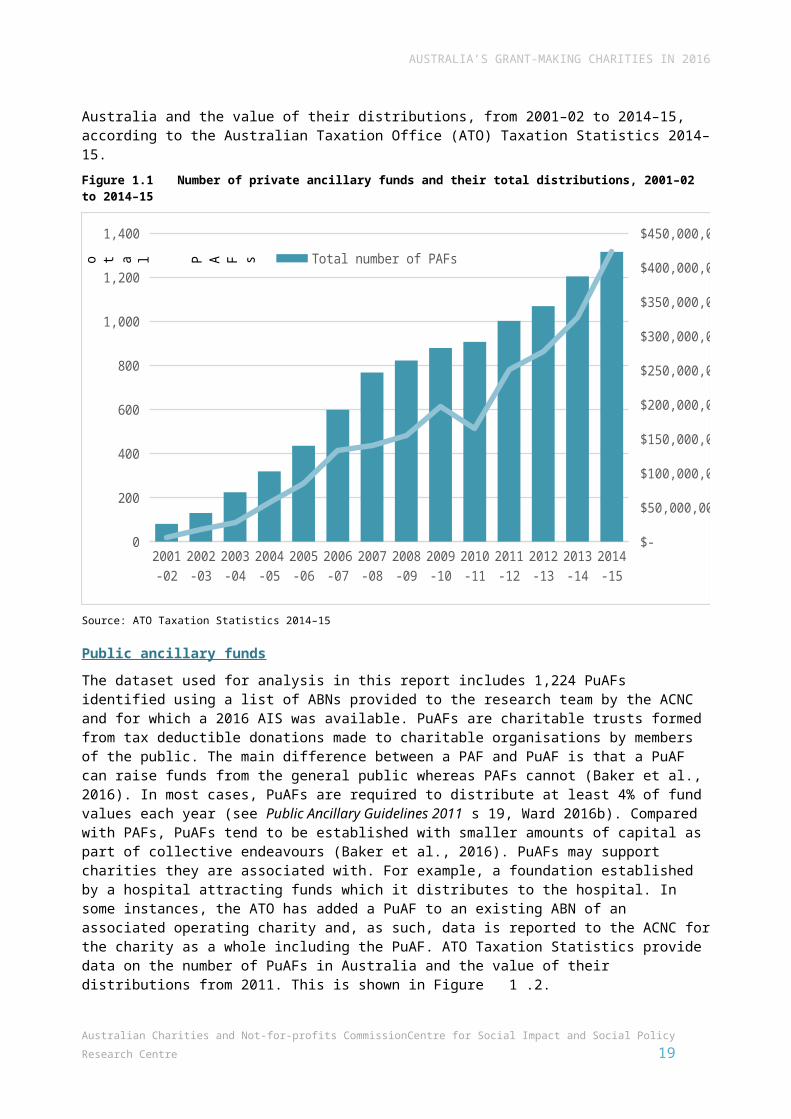
Private ancillary fundsThe analysis includes 1,318 PAFs identified in the 2016 AIS dataset using a list of ABNs provided to the research team by the ACNC. PAFs enable individuals, families or other private groups to make tax deductible donations to a trust which must distribute a minimum amount annually to other charitable organisations. In most cases, the distribution must be at least 5% of the market value of the fund’s net assets as at the end of the previous financial year. These distributions must be made to organisations with DGR12 status (see Private Ancillary Fund Guidelines 2009 (Cth), Ward, 2016a). Australian legislation has enabled the establishment of this philanthropic structure since 2001. Previously known as ‘Prescribed Private Funds’, they were converted to PAFs from 2009 through legislation that also tightened governance arrangements and shifted minimum annual distributions from an income to an assets measure (McLeod, 2014a). Donations to PAFs rose following recovery from the global financial crisis (McLeod, 2014b). Their introduction has been described as ‘the single most important boost for Australian philanthropy in many decades’ (McLeod, 2013, p. 2). Taxation statistics indicate that over 100 new PAFs have been established annually since 2013. Between 2005 and 2008, numbers of newly established PAFs were also over 100 per year. Figure 1.1 shows the total numbers of PAFs in Australia and the value of their distributions, from 2001–02 to 2014–15, according to the Australian Taxation Office (ATO) Taxation Statistics 2014–15.Figure 1.1 Number of private ancillary funds and their total distributions, 2001–02 to 2014–15
2001-02
2002-03
2003-04
2004-05
2005-06
2006-07
2007-08
2008-09
2009-10
2010-11
2011-12
2012-13
2013-14
2014-15
0
200
400
600
800
1,000
1,200
1,400
$-
$50,000,000
$100,000,000
$150,000,000
$200,000,000
$250,000,000
$300,000,000
$350,000,000
$400,000,000
$450,000,000
Total number of PAFs Total distributions made ($)T o t a l P A F s
Source: ATO Taxation Statistics 2014–15
Public ancillary fundsThe dataset used for analysis in this report includes 1,224 PuAFs identified using a list of ABNs provided to the research team by the ACNC and for which a 2016 AIS was available. PuAFs are charitable trusts formed from tax deductible donations made to charitable organisations by members of the public. The main difference between a PAF and PuAF is that a PuAF can raise funds from the
2 DGR1 charities are a subcategory of Deductible Gift Receipt (DGR) charities involved in ‘doing’, that is, using tax deductible donations to fund programs or other activities. Organisations with DGR2 status are ‘giving’ DGR charities which distribute funds to DGR1 organisations to support them in achieving their charitable purpose. DGR2 charities can only distribute to those categorised as DGR1. Note that the ATO decides on DGR endorsement.
Australian Charities and Not-for-profits Commission Centre for Social Impact and Social Policy Research Centre 13
AUSTRALIA’S GRANT-MAKING CHARITIES IN 2016
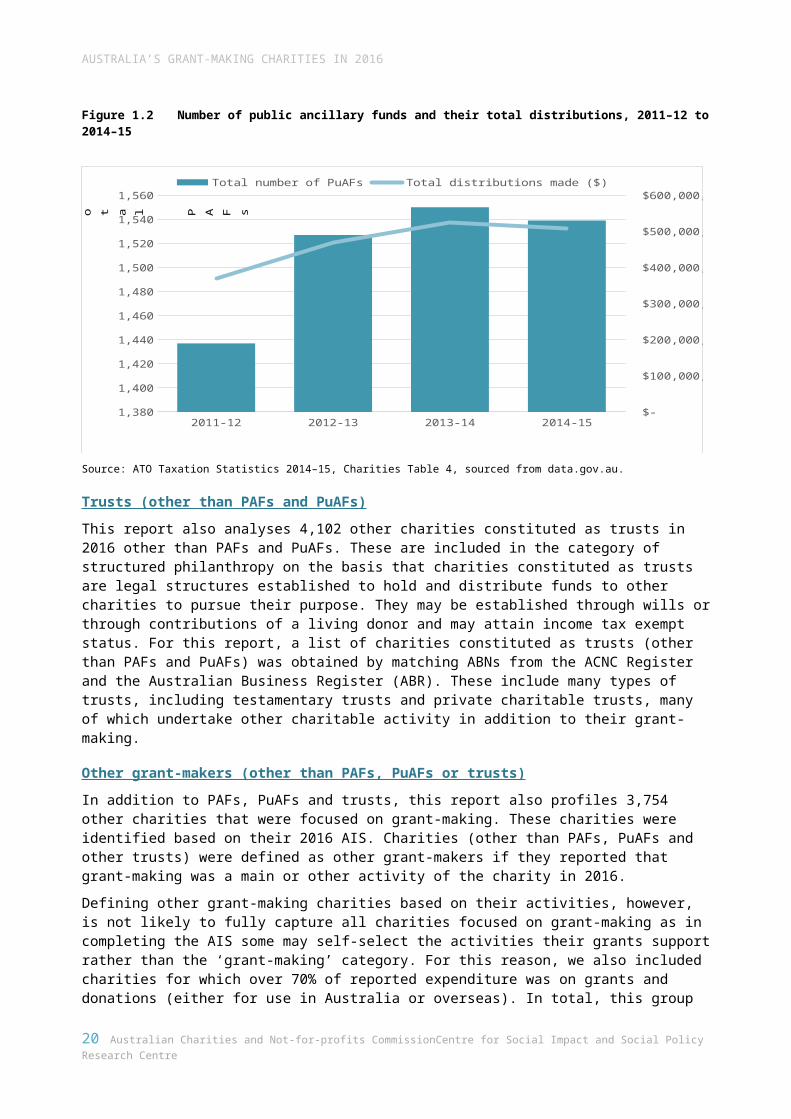
general public whereas PAFs cannot (Baker et al., 2016). In most cases, PuAFs are required to distribute at least 4% of fund values each year (see Public Ancillary Guidelines 2011 s 19, Ward 2016b). Compared with PAFs, PuAFs tend to be established with smaller amounts of capital as part of collective endeavours (Baker et al., 2016). PuAFs may support charities they are associated with. For example, a foundation established by a hospital attracting funds which it distributes to the hospital. In some instances, the ATO has added a PuAF to an existing ABN of an associated operating charity and, as such, data is reported to the ACNC for the charity as a whole including the PuAF. ATO Taxation Statistics provide data on the number of PuAFs in Australia and the value of their distributions from 2011. This is shown in Figure 1.2.Figure 1.2 Number of public ancillary funds and their total distributions, 2011–12 to 2014–15
2011-12 2012-13 2013-14 2014-151,380
1,400
1,420
1,440
1,460
1,480
1,500
1,520
1,540
1,560
$-
$100,000,000
$200,000,000
$300,000,000
$400,000,000
$500,000,000
$600,000,000 Total number of PuAFs Total distributions made ($)
T o t al
P A F s
Source: ATO Taxation Statistics 2014–15, Charities Table 4, sourced from data.gov.au.
Trusts (other than PAFs and PuAFs)This report also analyses 4,102 other charities constituted as trusts in 2016 other than PAFs and PuAFs. These are included in the category of structured philanthropy on the basis that charities constituted as trusts are legal structures established to hold and distribute funds to other charities to pursue their purpose. They may be established through wills or through contributions of a living donor and may attain income tax exempt status. For this report, a list of charities constituted as trusts (other than PAFs and PuAFs) was obtained by matching ABNs from the ACNC Register and the Australian Business Register (ABR). These include many types of trusts, including testamentary trusts and private charitable trusts, many of which undertake other charitable activity in addition to their grant-making.
Other grant-makers (other than PAFs, PuAFs or trusts)In addition to PAFs, PuAFs and trusts, this report also profiles 3,754 other charities that were focused on grant-making. These charities were identified based on their 2016 AIS. Charities (other than PAFs, PuAFs and other trusts) were defined as other grant-makers if they reported that grant-making was a main or other activity of the charity in 2016.
Defining other grant-making charities based on their activities, however, is not likely to fully capture all charities focused on grant-making as in completing the AIS some may self-select the activities their grants support rather than the ‘grant-making’ category. For this reason, we also included charities for which over 70% of reported expenditure was on grants and donations (either for use in Australia or overseas). In total, this group of other grant-makers consists of 915 charities for which grant-making was reported as the main activity and a further 883 that reported grant-making as an ‘other’ (but not main) activity. It also included a further 1,956 charities for which spending on grants and donations for use in Australia or overseas constituted over 70% of total expenditure.
14 Australian Charities and Not-for-profits Commission Centre for Social Impact and Social Policy Research Centre
AUSTRALIA’S GRANT-MAKING CHARITIES IN 2016
Building knowledge of Australia’s grant-making charitiesBy examining grant-making charities in the AIS and providing a breakdown for structured philanthropy and other grant-makers, this report builds on and complements previous studies of Australian philanthropy. It builds on the information about grant-making captured in Giving Australia 2016 (Baker et al., 2016). The Giving Australia report series provided a profile of donations made by the public to charitable causes and offers insight into the roles and contributions of different structures for giving. Findings from the report on foundations and philanthropists were based on an online survey and focus groups and interviews with representatives of foundations, trusts and ancillary funds. While breakdowns by these entity types are not possible, Giving Australia 2016 provided information about the motivations for giving through formal structures such as foundations. Motivations include to maintain the focus and sustainability of giving (through entities established to operate in perpetuity) and to increase impact. The report also showed that the top three areas for grant-making by foundations and trusts were social services, education and research, and health. Choices about causes were most commonly influenced by alignment with the personal passion of donors, along with the perceived quality of governance and apparent competence of the recipient charity (Baker et al., 2016).
This report also builds on the insights of the Grants in Australia 2017 report (Our Community, 2017). That study drew on 1,227 survey responses from representatives of not-for-profits, most of which were involved in human services, education and community and economic development. The study found that while the state and territory governments remain the primary funding sources for non-profits, a significant minority rely on grants for their main income source. Most often, this is in the form of a gift from a philanthropic foundation or trust, although other types of grant-making, including corporate grant-making, are also significant sources of income for charities (Our Community, 2017, p. 13). The Grants in Australia 2017 report also provided interesting insight into grant-seekers’ perceptions. It showed most grant-seekers were applying for single year grants and many perceived that multi-year grants were becoming harder to get (Our Community, 2017, p. 23). Over 40% perceived there were fewer grants available than 12 months ago (Our Community, 2017, p. 22).
In their Foundations for Giving report, Scaife et al. (2012) focused on philanthropic foundations as vehicles for structured giving, framing them as ‘icebergs’, given the scant data available about them. That report also explored the reasons philanthropists use these structures, highlighting the importance of life stage in motivating structured giving along with perceptions of responsibility and having sufficient wealth to give. The report also identified differences among structured giving options, with community foundation sub-funds described as offering ease of entry with lower capital and the backup of experienced professional advice and administration. Conversely, PAFs were seen to offer specific financial benefits, autonomy and a way of leaving a family legacy.
Indeed, the contribution and growth of PAFs is an important theme in philanthropy research. While the Giving Australia study did not provide a systematic breakdown of characteristics and issues among grant-making charities with different structures, it highlighted the significance of PAFs, given their rapid growth and contribution to increasing the volume of giving in Australia (Baker et al., 2016). McGregor-Lowndes (2014) similarly reported on the growth of donations to PAFs along with growth in the distributions they make. While in most cases PAFs must distribute 5% of the net value of their fund each year, McLeod (2014b) reported that annual distributions tend to be higher, with PAFs distributing 9% of assets or around $250,000 each year on average. The main charitable causes PAFs provide grants for were related to welfare, health, cultural, education and international purposes (McLeod, 2014b).
Compared with PAFs, the PuAF structure has been around for longer. PuAFs tend to be established with a smaller capital base and are more likely to support welfare, education and research (McLeod, 2014b). They also tend to make larger distributions than PAFs, with an average 22% payout ratio, as some operate as ‘flow through’ funds or fundraising vehicles of other charities (McLeod, 2014b).
By focusing on Australia’s grant-making charities using data from charities’ AISs, this report builds on the existing body of work. It contributes new information about the characteristics and contributions of structured philanthropy, defined as consisting of PAFs, PuAFs, trusts and other charities focused on grant-making. Given the comprehensive nature of the AIS, this report builds on existing information
Australian Charities and Not-for-profits Commission Centre for Social Impact and Social Policy Research Centre 15
AUSTRALIA’S GRANT-MAKING CHARITIES IN 2016
with new, detailed information about different types of grant-making charities. It explores differences between those in the structured philanthropy categories and other grant-makers, and diversity within the structured philanthropy sector. Further, the information collected through the AIS is comprehensive, high-quality administrative data reported by grant-making charities. This differentiates the analysis from previous Australian research based on sample surveys, interviews or focus groups, making a major contribution to expanding Australian philanthropy research.
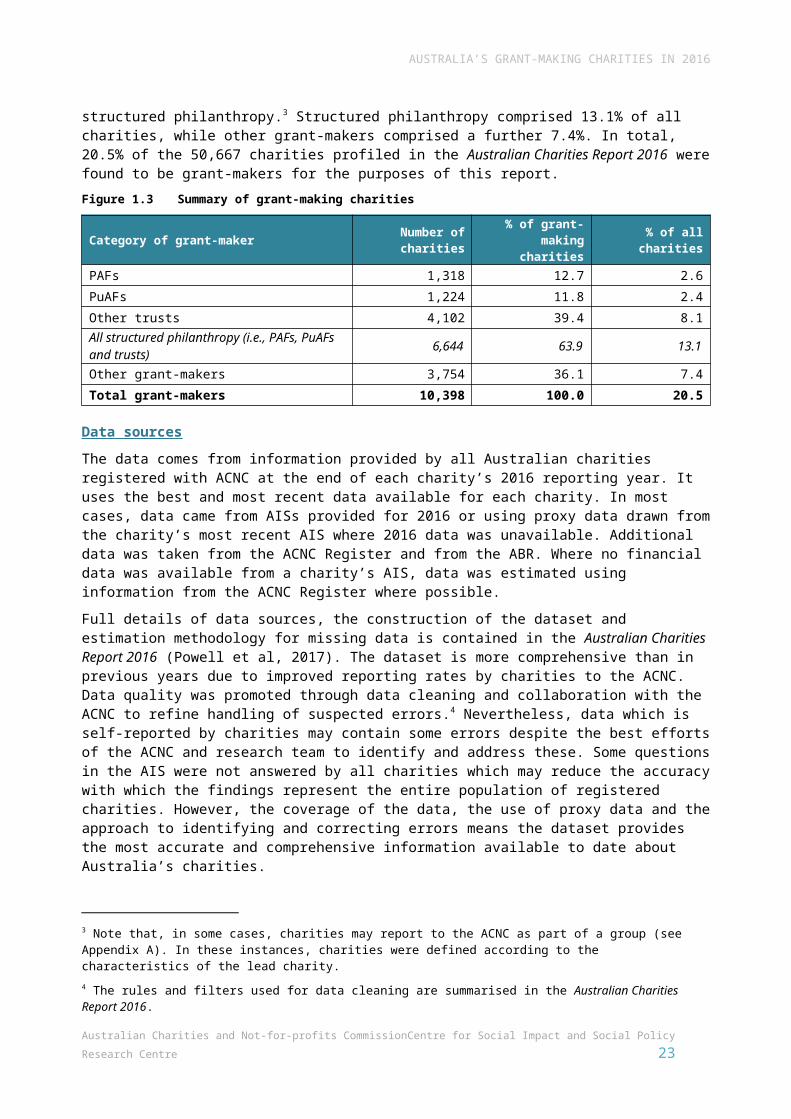
About the datasetThe composition of grant-making charities identified in the dataset is presented in Figure 1.3. Among the sample of 10,398 grant-makers, 6,644 (63.9%) were PAFs, PuAFs and other trusts, which together comprise structured philanthropy.3 Structured philanthropy comprised 13.1% of all charities, while other grant-makers comprised a further 7.4%. In total, 20.5% of the 50,667 charities profiled in the Australian Charities Report 2016 were found to be grant-makers for the purposes of this report.Figure 1.3 Summary of grant-making charities
Category of grant-maker Number of charities
% of grant-making charities % of all charities
PAFs 1,318 12.7 2.6
PuAFs 1,224 11.8 2.4
Other trusts 4,102 39.4 8.1All structured philanthropy (i.e., PAFs, PuAFs and trusts) 6,644 63.9 13.1
Other grant-makers 3,754 36.1 7.4
Total grant-makers 10,398 100.0 20.5
Data sourcesThe data comes from information provided by all Australian charities registered with ACNC at the end of each charity’s 2016 reporting year. It uses the best and most recent data available for each charity. In most cases, data came from AISs provided for 2016 or using proxy data drawn from the charity’s most recent AIS where 2016 data was unavailable. Additional data was taken from the ACNC Register and from the ABR. Where no financial data was available from a charity’s AIS, data was estimated using information from the ACNC Register where possible.
Full details of data sources, the construction of the dataset and estimation methodology for missing data is contained in the Australian Charities Report 2016 (Powell et al, 2017). The dataset is more comprehensive than in previous years due to improved reporting rates by charities to the ACNC. Data quality was promoted through data cleaning and collaboration with the ACNC to refine handling of suspected errors.4 Nevertheless, data which is self-reported by charities may contain some errors despite the best efforts of the ACNC and research team to identify and address these. Some questions in the AIS were not answered by all charities which may reduce the accuracy with which the findings represent the entire population of registered charities. However, the coverage of the data, the use of proxy data and the approach to identifying and correcting errors means the dataset provides the most accurate and comprehensive information available to date about Australia’s charities.
Interpreting the dataAs for other reports using the AIS, data relates to registered charities, each of which is defined by an ABN. Some charities may operate multiple entities with different ABNs while others may operate programs or perform other activities in addition to their grant-making activities using the same ABN. Information from the AIS gives a rich picture of grant-making charities, but it should be recognised
3 Note that, in some cases, charities may report to the ACNC as part of a group (see Appendix A). In these instances, charities were defined according to the characteristics of the lead charity.4 The rules and filters used for data cleaning are summarised in the Australian Charities Report 2016.
16 Australian Charities and Not-for-profits Commission Centre for Social Impact and Social Policy Research Centre
AUSTRALIA’S GRANT-MAKING CHARITIES IN 2016
that financial, employment and other information relates to the whole charity as defined by its ABN and not its specific grant-making or other functions. This is a particular issue with respect to PuAFs, which are in some cases operated by large charities using the same ABN used for their other operations.5 In addition, some charities report as a group.6 Where this is the case, charities have been defined as grant-makers and allocated to a category of grant-makers according to the characteristics of the lead charity, following the approach in the Australian Charities Report 2016.
Further, figures are reported throughout this report for categories of grant-making charities such as PAFs, PuAFs, trusts and other charities. Aggregate and average figures may be affected by the employment, income and expenditure of the largest charities within each category. These include very large grant-making charities such as the Paul Ramsay Foundation, World Vision and the Salvation Army. Lists of large grant-makers are provided in Appendix B.
Finally, it should be noted that data is limited to the material provided in the charity’s AIS and reflects operations and circumstances in the 2016 reporting period only. Some charities may make or receive one-off grants and donations that could make information for one year atypical. There may also be instances of grant-making charities for which data was estimated as an AIS was unavailable (more information about the estimation methodology is in Powell et al., 2017). Nevertheless, the aggregate information provides unprecedented detail about grant-making charities, enriching knowledge for policy and practice and providing a baseline for further studies of the dynamics and cycles of grant-making charities using the AIS.
Case studiesIn addition to the data analysis, this report contains five case studies. Information contained in the case studies was obtained through a telephone interview with a representative of each grant-making charity along with information contained in the 2016 AIS or on the charity’s website. The case studies help demonstrate and celebrate the contribution and diversity of Australia’s grant-making charities. They provide examples of grant-making charities’ activities, purpose and strategic goals. The case studies also highlight leaders’ perceptions of issues and challenges shaping the operating environment and ways their capacity could be strengthened.
5 An example is Curtin University, which operates the Curtin Foundation using the same ABN as its main operations. As the whole charity is covered by the AIS, the data cannot be separated for the Foundation or other aspects of its operations. As a result, the AIS may lead to some overestimation including for levels of employment and employee expenses.6 For further information about the methodology please refer to our online microsite or Appendix A: Further methodological details in Australian Charities Report 2016 (also available on the microsite).
Australian Charities and Not-for-profits Commission Centre for Social Impact and Social Policy Research Centre 17
2. What size were grant-making charities?
This section provides a profile of the size of Australia’s grant-making charities. It examines size according to the ACNC’s measure, which treats charities as ‘small’, ‘medium’ or ‘large’ based on their revenue. It also examines grant-making charities’ size with a more detailed measure which uses six categories.
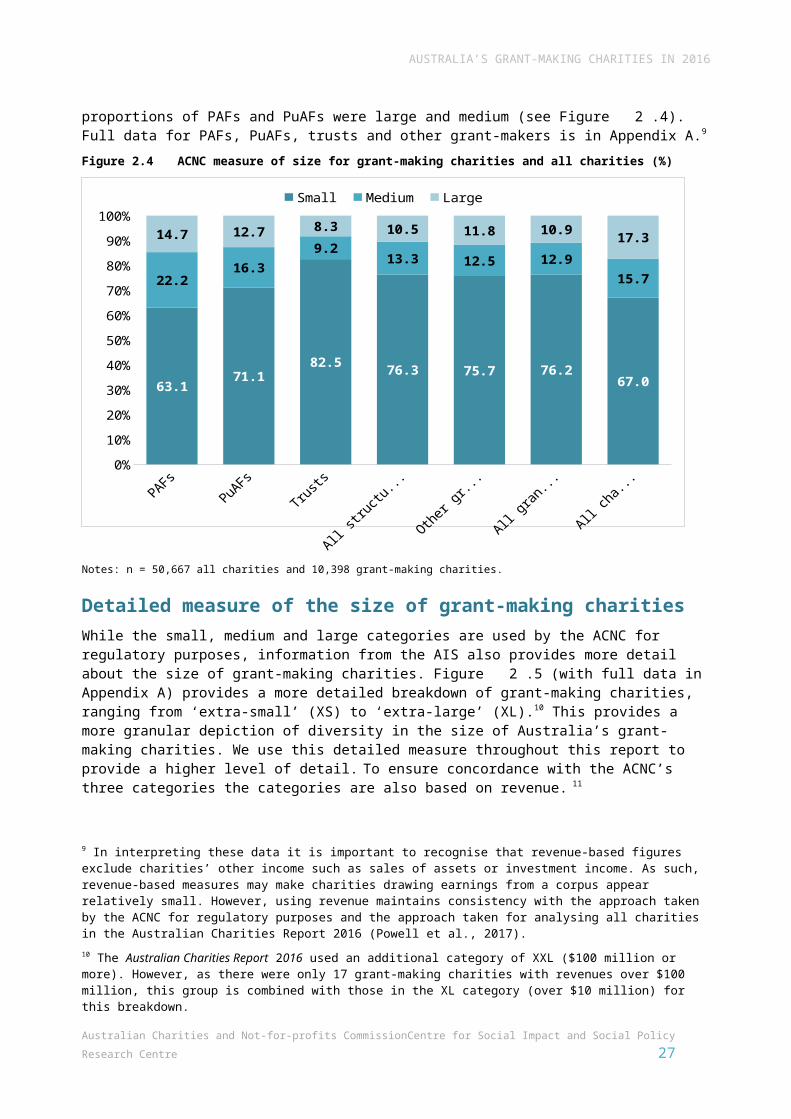
ACNC measure of sizeThe ACNC categorises charities as small, medium or large based on their revenue7 as required for regulatory purposes under the Australian Charities and Not-for-profits Act 2012 (Cth).8 Figure 2.4 provides a breakdown of the proportion of each type of grant-making charity compared with all charities. A relatively high proportion of grant-making charities were small, with revenue under $250,000 (76.2%), compared with all charities (67.0%). Correspondingly, a smaller proportion of grant-making charities were large, having revenue of $1 million or more (10.9% compared with 17.3% of all charities). However, the size profile differed across types of grant-makers. A relatively low proportion of PAFs were small (63.1%), while a relatively high proportion of trusts were small (82.5%). Higher proportions of PAFs and PuAFs were large and medium (see Figure 2.4). Full data for PAFs, PuAFs, trusts and other grant-makers is in Appendix A.9
7 Note that revenue is the amount an organisation receives for its ordinary activities. For Australian charities, this comprises government grants, donations and bequests, and other revenue/receipts. Other revenue may include for example, fundraising income (such as raffle tickets) and the sale of goods. Investment income, including dividends, is an important source of income for many grant-making charities, particularly PAFs, PuAFs and trusts. Revenue is different to income, which is the total revenue an organisation receives plus any other income from transactions that are not part of a charity’s ordinary operations or activities. Other income may include gains such as the sale of an asset (e.g., equipment or real estate), forgiveness of a liability or debt or gains on foreign currency transactions (ACNC, 2016).8 These size categories are: Small charity (annual revenue is less than $250,000); Medium charity (annual revenue is $250,000 or more, but less than $1 million); Large charity (annual revenue is $1 million or more). As well as describing annual revenue, these categories are used by the ACNC for regulatory purposes. The category selected determines the amount of financial information required by the ACNC. Small charities, along with basic religious charities, do not need to submit their financial reports or have their financial statements reviewed or audited for ACNC purposes. Basic religious charities do not need to provide any financial information (ACNC, 2015).9 In interpreting these data it is important to recognise that revenue-based figures exclude charities’ other income such as sales of assets or investment income. As such, revenue-based measures may make charities drawing earnings from a corpus appear relatively small. However, using revenue maintains consistency with the approach taken by the ACNC for regulatory purposes and the approach taken for analysing all charities in the Australian Charities Report 2016 (Powell et al., 2017).
AUSTRALIA’S GRANT-MAKING CHARITIES IN 2016
Figure 2.4 ACNC measure of size for grant-making charities and all charities (%)
PAFsPuAFs
Trusts
All structu
re...
Other gran...
All grant-..
.
All chari..
.0%
10%
20%
30%
40%
50%
60%
70%
80%
90%
100%
63.171.1
82.5 76.3 75.7 76.267.0
22.216.3
9.213.3 12.5 12.9
15.7
14.7 12.7 8.3 10.5 11.8 10.9 17.3
Small Medium Large
Notes: n = 50,667 all charities and 10,398 grant-making charities.
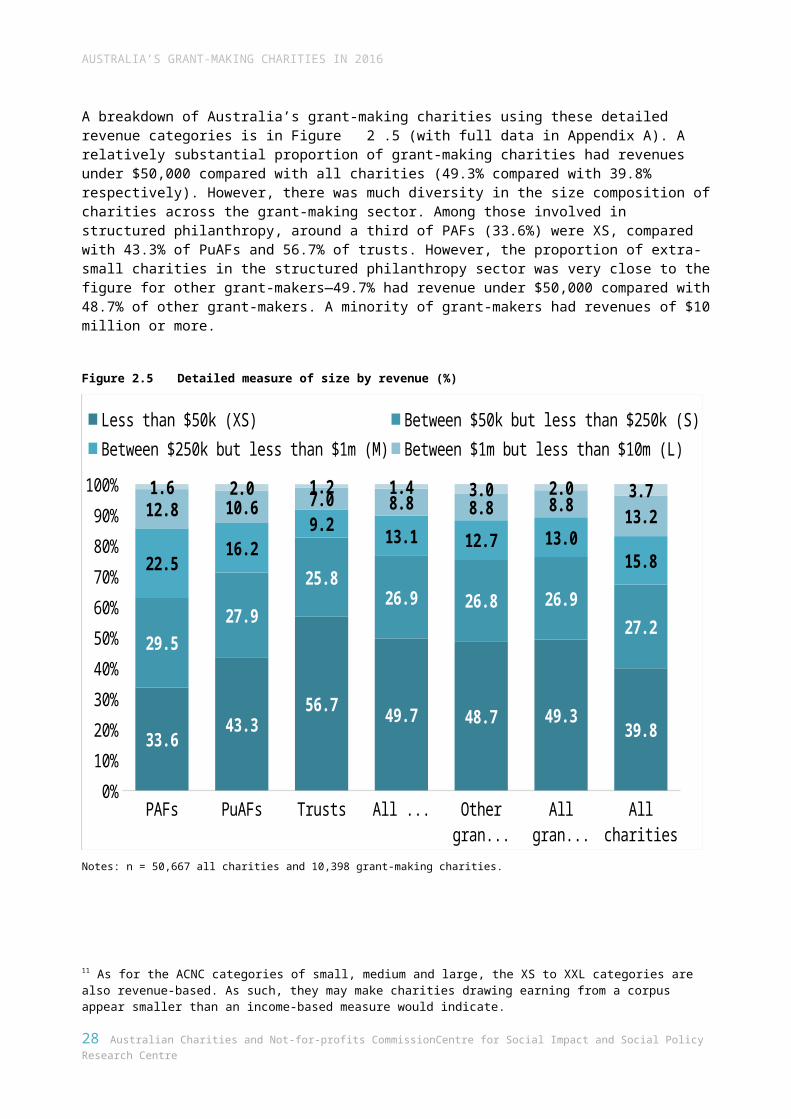
Detailed measure of the size of grant-making charitiesWhile the small, medium and large categories are used by the ACNC for regulatory purposes, information from the AIS also provides more detail about the size of grant-making charities. Figure 2.5 (with full data in Appendix A) provides a more detailed breakdown of grant-making charities, ranging from ‘extra-small’ (XS) to ‘extra-large’ (XL).10 This provides a more granular depiction of diversity in the size of Australia’s grant-making charities. We use this detailed measure throughout this report to provide a higher level of detail. To ensure concordance with the ACNC’s three categories the categories are also based on revenue. 11
A breakdown of Australia’s grant-making charities using these detailed revenue categories is in Figure 2.5 (with full data in Appendix A). A relatively substantial proportion of grant-making charities had revenues under $50,000 compared with all charities (49.3% compared with 39.8% respectively). However, there was much diversity in the size composition of charities across the grant-making sector. Among those involved in structured philanthropy, around a third of PAFs (33.6%) were XS, compared with 43.3% of PuAFs and 56.7% of trusts. However, the proportion of extra-small charities in the structured philanthropy sector was very close to the figure for other grant-makers—49.7% had revenue under $50,000 compared with 48.7% of other grant-makers. A minority of grant-makers had revenues of $10 million or more.
10 The Australian Charities Report 2016 used an additional category of XXL ($100 million or more). However, as there were only 17 grant-making charities with revenues over $100 million, this group is combined with those in the XL category (over $10 million) for this breakdown.11 As for the ACNC categories of small, medium and large, the XS to XXL categories are also revenue-based. As such, they may make charities drawing earning from a corpus appear smaller than an income-based measure would indicate.
Australian Charities and Not-for-profits Commission Centre for Social Impact and Social Policy Research Centre 19
AUSTRALIA’S GRANT-MAKING CHARITIES IN 2016
Figure 2.5 Detailed measure of size by revenue (%)
PAFsPuAFs
Trusts
All structu
...
Other g...
All gra...
All cha...
0%
10%
20%
30%
40%
50%
60%
70%
80%
90%
100%
33.643.3
56.7 49.7 48.7 49.339.8
29.527.9
25.826.9 26.8 26.9
27.2
22.516.2
9.213.1 12.7 13.0
15.8
12.8 10.6 7.0 8.8 8.8 8.8 13.21.6 2.0 1.2 1.4 3.0 2.0 3.7
Less than $50k (XS) Between $50k but less than $250k (S)Between $250k but less than $1m (M) Between $1m but less than $10m (L)$10m or more (XL)
Notes: n = 50,667 all charities and 10,398 grant-making charities.
20 Australian Charities and Not-for-profits Commission Centre for Social Impact and Social Policy Research Centre
3. Where were grant-making charities located?
This section examines the locations of Australia’s grant-making charities. It examines both their street address (i.e., their registered business address) and their operations across Australian jurisdictions and in other countries.
Charity street addressInformation about a charity’s street address includes their state and postcode. This indicates their ‘base’, but not necessarily the areas in which they conduct activities. Put simply, for the many charities that operate in multiple locations their charity street address is likely to be the location of the ‘head office’.
Compared to all charities, structured philanthropy charities were more likely to have a street address in New South Wales (40.0% compared with 35.1%) and Victoria (31.6% compared with 26.2%) while the street address profile of other grant-makers was more aligned with the charity mean average (see Figure 3.6).Figure 3.6 Charity street addresses by jurisdiction (%)
PAFs PuAFs TrustsAll
structured philanthropy
Other grant-
makersAll grant-
makersAll
charities
NSW 44.8 34.6 40.1 40.0 36.0 38.5 35.1
VIC 32.3 31.6 31.7 31.8 28.7 30.7 26.2
QLD 8.6 12.9 9.7 10.1 11.5 10.6 15.0
WA 7.7 8.8 7.9 8.0 9.5 8.5 10.3
SA 4.6 8.0 6.2 6.2 9.6 7.5 7.6
TAS 1.1 1.8 2.2 1.9 2.0 1.9 2.5
ACT 1.0 2.2 1.6 1.6 2.0 1.7 2.2
NT 0.0 0.1 0.7 0.4 0.7 0.5 1.0
Total 100.0 100.0 100.0 100.0 100.0 100.0 100.0
Notes: n = 50,667 all charities and 10,398 grant-making charities. See also Figure A.3.
Charity operating locationsCharities can operate in multiple jurisdictions. Figure 3.2 indicates the proportion of each type of grant-making charity that operated in each Australian jurisdiction. It shows that relatively high proportions of grant-makers operated in New South Wales and Victoria, although the proportion operating in other states and territories was closer to the figure for all charities. This is depicted visually in Figure 3.8. A high proportion of PAFs operated in New South Wales (49.8%) and Victoria (47.6%).
AUSTRALIA’S GRANT-MAKING CHARITIES IN 2016
Figure 3.7 Charities operating in each jurisdiction (%)
PAFs PuAFs TrustsAll
structured philanthropy
Other grant-
makersAll grant-
makersAll
charities
NSW 49.8 39.5 42.6 43.5 44.1 43.7 39.7
VIC 47.6 39.5 32.3 36.6 38.4 37.3 31.1
QLD 26.0 25.8 15.4 19.4 23.6 20.9 21.9
WA 23.3 20.8 13.0 16.5 20.2 17.8 16.6
SA 20.0 19.0 11.2 14.4 19.7 16.3 14.0
TAS 16.6 12.9 6.9 9.9 11.4 10.5 8.3
ACT 16.0 14.4 6.8 10.0 12.3 10.8 8.5
NT 16.2 10.8 5.5 8.6 9.2 8.8 6.6
Notes: Notes: n = 50,667 all charities and 10,398 grant-making charities.. Total adds to more than 100% as charities can operate in more than one jurisdiction. See also Figure A.4.
Figure 3.8 Charities operating in each jurisdiction (%)
NT
TAS
ACT
SA
WA
QLD
VIC
NSW
0 10 20 30 40 50 60
PAFsPuAFsTrustsAll structured philanthropyOther grant-makersAll grant-makersAll charities
Charities registered in rural and remote locationsThe ACNC does not currently collect information about the precise locations of charities’ operations. However, charities registered in rural and remote locations can be identified using their street
22 Australian Charities and Not-for-profits Commission Centre for Social Impact and Social Policy Research Centre
AUSTRALIA’S GRANT-MAKING CHARITIES IN 2016
address.12 Figure 3.4 shows that each type of grant-making charity was more likely to be based in major cities compared with the whole charity sector. Overall, 81.7% of grant-making charities were based in major cities compared to 67.3% of all charities. PAFs were most likely to have a street address in a major city (93.6%).Figure 3.9 Charities registered in major cities, regional and remote areas (%)
PAFsPuAFs
Trusts
All stru
ctured phila
nthropy
Other grant-m
akers
All grant-m
akers
All chariti
es0
102030405060708090
100
93.6 84.9 81.5 84.7 76.6 81.767.3
5.211.5 12.2 10.6
14.1 11.919.4
3.2 4.6 3.5 7.2 4.9 10.52.9
Major cities Inner regional Outer regional Remote and very remote
Notes: n = 50,667 all charities and 10,398 grant-making charities.
Charities operating overseasThe AIS provides an opportunity for charities to report whether they operate overseas and, if so, to select the countries overseas where they conducted activities or helped communities.
In total, 1,176 grant-making charities reported operating overseas. This represented 11.3% of all grant-making charities, higher than the average across all charities (8.4%). Figure 3.10 however, shows that structured philanthropy charities were less likely than other grant-makers to operate overseas (5.3% compared to 22.0% respectively). Among structured philanthropy charities, PuAFs were most likely to operate overseas (9.0% compared to 5.3% of PAFs and 4.1% of trusts).
12 Postcodes provided by charities were coded against the Australian Bureau of Statistics Remoteness Areas 2011, part of the Australian Standard Geographical Classification (ABS, 2011).
Australian Charities and Not-for-profits Commission Centre for Social Impact and Social Policy Research Centre 23
AUSTRALIA’S GRANT-MAKING CHARITIES IN 2016
Figure 3.10 Charities operating overseas (%)
PAFsPuAFs
Trusts
All stru
cture
d philanth
ropy
Other g
rant-m
akers
All gra
nt-make
rs
All chariti
es0
5
10
15
20
25
5.3
9.0
4.1 5.3
22.0
11.3
8.4
Notes: n = 10,398.
As with all charities, the most common country for grant-making charities to operate in overseas was India (with 19.6% of grant-making charities that operate overseas operating there). However, there were some differences in the other most popular countries that charities operated in, which included Kenya, Myanmar, East Timor and Uganda.
Figure 3.11 Top 10 countries by number of Australian charities operating there
PAFs PuAFs TrustsAll structured philanthropy
Other grant-makers
All grant-making charities
All charities
Nepal (15) Cambodia (24) India (28) India (59) India (171) India (230) India (794)
Kenya (13) India (20) United Kingdom (21)
Cambodia (51)
Cambodia (116)
Cambodia (167)
Philippines (607)
Cambodia (12)
Papua New Guinea (17)
Papua New Guinea (20)
Papua New Guinea (46)
Philippines (108) Nepal (147) New Zealand
(538)
Tanzania (12) Indonesia (16)
Indonesia (18) Nepal (41) Kenya (107) Kenya (147) Indonesia
(519)
India (11) Uganda (14) Cambodia (15) Kenya (40) Nepal (106) Indonesia
(143)Papua New Guinea (519)
Uganda (10) Kenya (13) Nepal (15) Indonesia (40)
Indonesia (103)
Philippines (141)
Cambodia (476)
Papua New Guinea (9) Thailand (13) Vietnam (15) Philippines
(33)Papua New Guinea (85)
Papua New Guinea (131)
United States (414)
East Timor (9) Myanmar (13) Fiji (15) Uganda (33) Fiji (78) East Timor
(103)Thailand (413)
Thailand (8) East Timor (12)
New Zealand (15)
East Timor (30) Myanmar (76) Fiji (102) Fiji (384)
Philippines/ Ethiopia/ Vietnam (7)
Philippines (12)
Kenya/Philippines/USA (14)
Thailand (30) East Timor (73) Uganda (101) Nepal (370)
Notes: Data based on 2016 AIS data only. Countries were ranked according to numbers of charities which reported operating there in 2016 and not financial or other criteria. Number of charities operating in the country is shown in parenthesis
24 Australian Charities and Not-for-profits Commission Centre for Social Impact and Social Policy Research Centre
Women’s Plans Foundation:Case study of a grant-making charityengaged overseas
Women’s Plans Foundation (WPF) is a grant-making charity based in Sydney. Like three-quarters of grant-making charities, WPF is small with total revenue under $250,000. It has operated for over a decade. The initiator realised while serving on overseas aid boards that non-government organisations (NGOs) were avoiding family planning because it was seen as ‘controversial’. A trust was formed to raise funds and support family planning and access to contraception as components of overseas aid programs. This commitment is founded on recognition of the contribution of family planning to outcomes across health, gender equity, poverty alleviation and environmental domains. As a representative of the foundation described:
We concentrate on advocacy and the awareness of the cascading benefits of pre-planned pregnancies on poverty, on population pressures, including migration and climate change. We focus on family planning, and contraceptive components in overseas aid and deliver through accredited, established NGO programs.
Trustees have contributed pro bono expertise in overseas aid, medical practice, education, law and accountancy. WPF draws on volunteers for fundraising, limiting its expenses and ensuring that a high proportion of funds raised serve the family planning objective.
In recent years, the charity has focused on the Asia-Pacific region, including Cambodia, Laos, Papua New Guinea and East Timor. Funds are raised and donated to Australian-registered NGOs operating in those areas to ensure inclusion of a family planning component in existing programs. The charity recognises widespread need globally but focusing on the Asia-Pacific has provided a way to target areas with high numbers of young people and areas which are disaster-prone while enacting a commitment to Australia’s neighbours. Capacity of NGO partners to effect change is also a consideration in selecting target countries. A representative of the Foundation described the strategy:
we need to look at what the country can effectively use and what the in-country partners can manage. It’s not just picking the worst countries in the world for need.
Over a number of years the charity has had continued engagement with highly valued overseas partners who make major impacts on the delivery of contraception. They also partner with other organisations that embed family planning in other activities. Recently, the charity has focused on encouraging partnerships among the charities they fund to improve the impact of their grants. An example includes encouraging collaboration between a longer-term grant recipient and a newly supported charity operating in the same country. Synergies between partners are seen to consolidate effort and lead to more effective service delivery.
In coming years, the charity anticipates improving online engagement, moving from a fully volunteer-based organisation to incorporate paid executive and administrative functions, and continuing to build its resource base. Like other NGOs, the Foundation faces challenges of filling resource gaps:
with the world situation we felt that we need to work harder and harder, because there are governments that have been pulling back funding for contraception and women’s reproductive health. So, it simply means the private sector has to work enormously harder.
The Foundation welcomes the contribution the ACNC has made to Australian charity regulation and values accreditation through Australia’s aid program for ensuring risk management and due diligence among Australian NGOs operating overseas.
4. How old were grant-making charities?
The ACNC Register includes the date of establishment, which can be used to determine the age of a charity, which is helpful for understanding activities and performance over time. As shown in Figure 4.12, 11.3% of grant-making charities were aged over 50 years. However, PAFs and PuAFs demonstrated a younger age profile. Reflecting how PAFs are a relatively new legal structure which has seen rapid growth, one third of PAFs were established less than five years ago (34.8%) and 36.7% were established five to 10 years ago. Among PuAFs, 20.7% were established less than five years ago and 25.7% were established five to 10 years ago. By contrast, among other grant-makers only 11.2% were established less than five years ago and 14.6% were established five to 10 years ago. Full data is in Appendix A.Figure 4.12 Age of grant-making charities (%)
PAFsPuAFs
Trusts
All structu
red philanthropy
Other grant-m
akers
All grant-m
akers0%
10%20%30%40%50%60%70%80%90%
100%
34.820.7 11.9 18.2 11.2 15.7
36.7
25.716.6
22.414.6
19.6
28.4
32.3
28.929.4
21.926.7
18.4
29.921.7
35.826.8
2.8 12.8 8.3 16.5 11.3
Less than 5 years old 5 to less than 10 years old 10 to less than 20 years old20 to less than 50 years old 50 years or older
Notes: n = 9,629 (data on year of establishment was missing for 769 grant-making charities).
5. What did grant-making charities do?
This section explores the range of activities of Australia’s grant-making charities. We explore this in relation to:
Charity purpose and sub-type: Taken from the ACNC Register and ABR. Main activity: In the AIS, charities are required to select their main activity and any other
activities they are involved in. How charities achieve their purpose: This information comes from charities’ descriptions in
the AIS of how their activities and outcomes helped them achieve their purpose.
Charitable purposeThe Charities Act 2013 (Cth) lists 12 charitable purposes. Charities may have more than one charitable purpose on the ACNC Register and other purposes which are themselves not charitable but assist the charity to further a charitable purpose (ACNC, 2015b).
Across the charity sector in 2016, the most common charitable purpose was ‘advancing religion’, followed by ‘advancing education’ and ‘advancing social or public welfare’. By contrast, among grant-making charities the most common charitable purpose was ‘purposes beneficial to the general public’, while the second and third were the same as for the wider charity sector (‘advancing education’ and ‘advancing social or public welfare’). There were some differences within the structured grant-making sector, including the relative importance of ‘advancing religion’. This is shown in Figure 5.1.Figure 5.13 Most common charitable purposes among charities
Most common charitable purpose
Second most common charitable purpose
Third most common charitable purpose
PAFs Purposes beneficial to the general public
Advancing social or public welfare Advancing health
PuAFs Purposes beneficial to the general public
Advancing social or public welfare Advancing health
Other trusts Advancing religion Advancing education Purposes beneficial to the general public
All structured philanthropy
Purposes beneficial to the general public Advancing religion Advancing education
Other grant-makers Advancing education Purposes beneficial to the general public
Advancing social or public welfare
Total grant-makers Purposes beneficial to the general public Advancing education Advancing social or public
welfare
All charities Advancing religion Advancing education Advancing social or public welfare
Notes: These are the most common purposes reported by charities and do not reflect charities’ relative expenditure on various purposes or any other measures of their emphasis on different purposes.
AUSTRALIA’S GRANT-MAKING CHARITIES IN 2016
DGR statusSome charities may be endorsed by the ATO as DGRs and may subsequently receive tax deductible gifts and contributions. Across the charity sector, 39.0% of charities had DGR status in 2016. However, DGR status has particular significance in the grant-making sector, as ‘Category 2’ DGR charities, which includes PAFs and PuAFs, can only give to ‘doing’ charities with ‘Category 1’ DGR status. Reflecting this, a relatively high proportion of grant-making charities were recorded as having DGR status (47.5%). This was near universal among PAFs (98.6%) and PuAFs (94.5%) but substantially lower among trusts (25.5%). The figure for other grant-makers was 38.4%, close to the figure for all charities (39.0%).
Main activitiesCharities were asked to select their main activities in the reporting period and any general activities they undertook.13 ‘Grant-making’ was listed as an option. However, not all grant-making charities selected this as a main or other activity. Some PAFs, PuAFs, trusts or others defined as grant-makers based on their expenditure may have emphasised other aspects of their operations in selecting activity types. Some may also have selected activities they supported through their grants rather than ‘grant-making’.
However, ‘grant-making’ was the most common main activity reported by 2,744 grant-making charities (30.0%). PAFs were more likely than others to select grant-making as a main activity (43.6%). After grant-making, the next most common main activities were economic, social and community development (7.5%), religious activities (7.3%) and primary and secondary education (6.4%). The ten most common main activities selected by PAFs, PuAFs, trusts and other grant-makers is shown in Figure 5.14. Full data is in Figure A.6.
13 The AIS categories are based on the International Classification of Non-profit Organisations with some variations, namely, the exclusion of business and professional associations and trade unions.
28 Australian Charities and Not-for-profits Commission Centre for Social Impact and Social Policy Research Centre
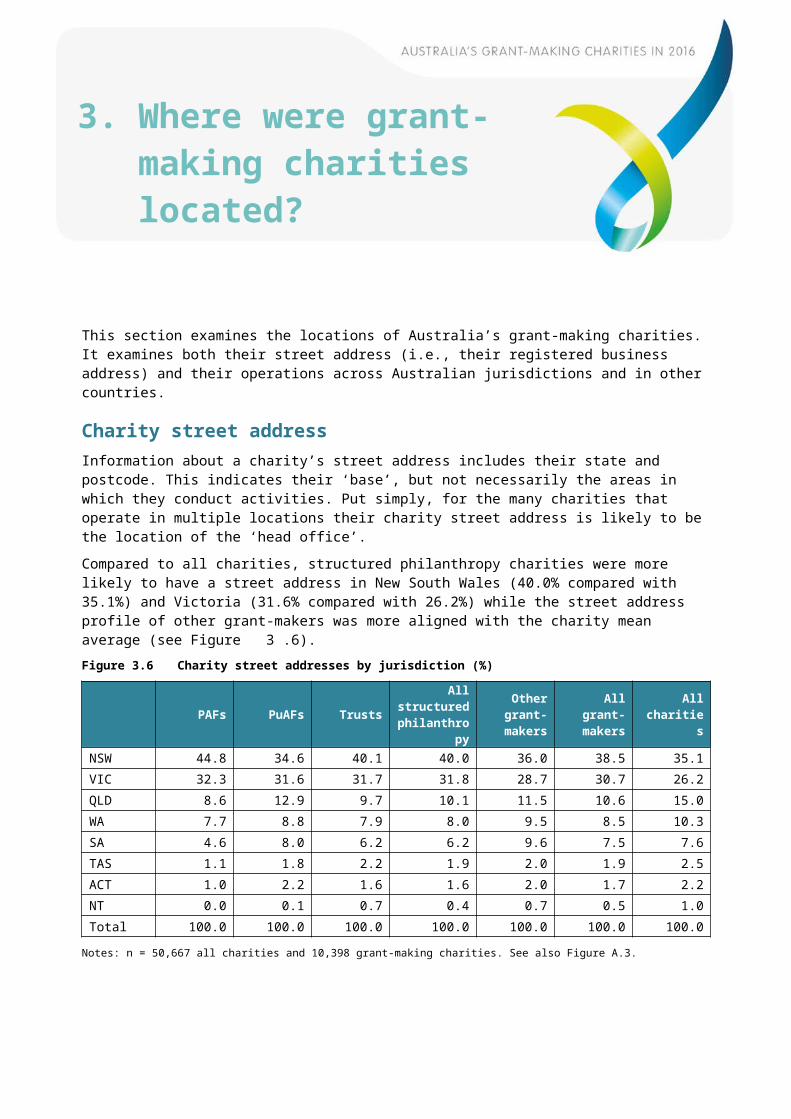
AUSTRALIA’S GRANT-MAKING CHARITIES IN 2016
Figure 5.14 Most common main activities selected (%)
Emergency Relief
International activities
Other health services
Other Education
Other Philanthropic
Culture and arts
Social services
Primary and secondary education
Economic, social and community development
Religious activities
Grant-making activities
0 5 10 15 20 25 30 35 40 45 50
PAFsPuAFS TrustsAll structured philanthropyOther grant-makersAll
Notes: n = 10,398.
Australian Charities and Not-for-profits Commission Centre for Social Impact and Social Policy Research Centre 29
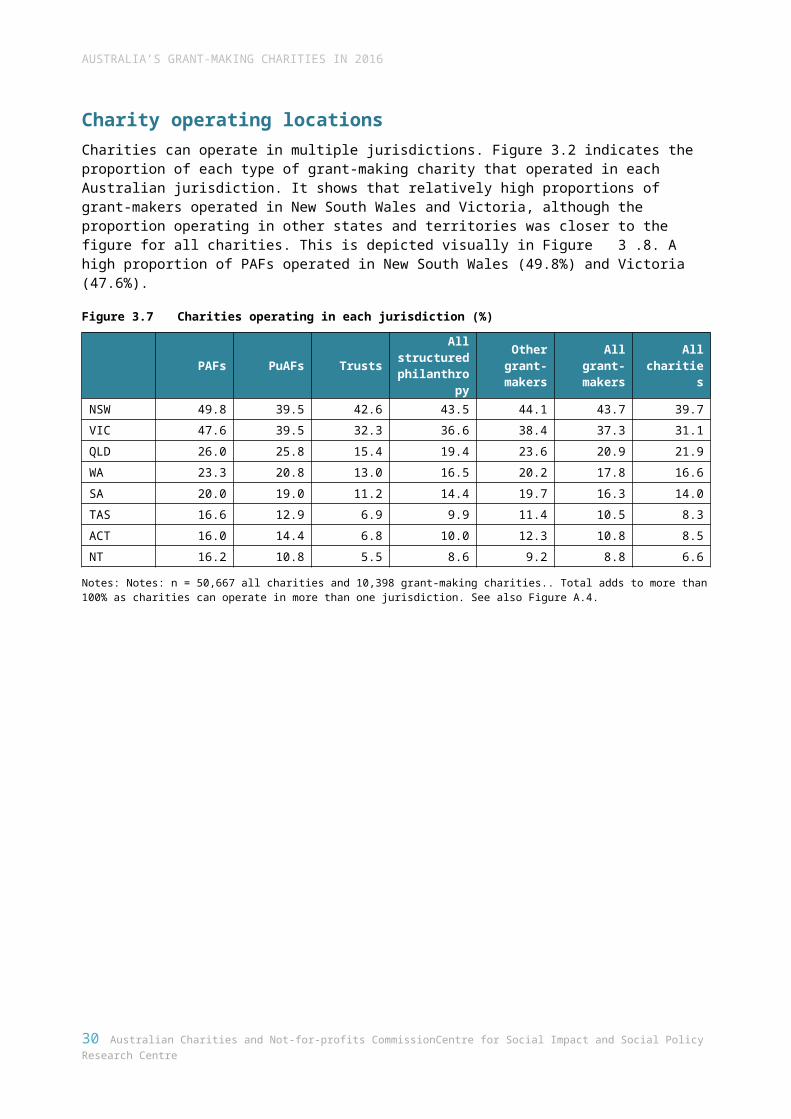
AUSTRALIA’S GRANT-MAKING CHARITIES IN 2016
Activities and outcomes that helped grant-making charities achieve their purposeAdditional insight about how grant-makers achieve their purpose is available from the open-ended accounts provided by charities in their 2016 AIS. The AIS offered charities the opportunity to describe how their activities and outcomes helped achieve their purpose during the reporting period. The language used reflects these charities’ focus on grant-making. The most common words included ‘trust’, ‘funds’ and ‘distributions’. This is depicted in the word cloud below. Reflecting the distinctive focus of Australia’s grant-making charities, the language used differed to the language used among all charities who most commonly used words like ‘community’, ‘support’, ‘services’, ‘activities’, ‘people’ and ‘education’ (see Powell et al., 2017).Figure 5.15 Word frequency: how grant-making charities’ activities and outcomes helped achieve
purpose
In their accounts, some grant-making charities focused on achieving purpose through generating and accumulating income and making distributions. Examples include:
The charity’s investment activities generated income to facilitate grant-making during the year, helping to achieve the charitable purpose. (Small charity14, WA)
As Trustee our company invests the capital and income generated is utilised for distributions to named charities or for the payment of scholarships as per the governing document. (Small charity, SA)
Biannual distributions are made to a series of charitable organisations and individuals within the community. (Large charity, WA)
Invited applications for grants twice during the year, considered applications received, made recommendations for approval of grants and administered those grants approved. (Small charity, NT)
14 Size descriptors refer to the ACNC categories of small, medium and large.
30 Australian Charities and Not-for-profits Commission Centre for Social Impact and Social Policy Research Centre
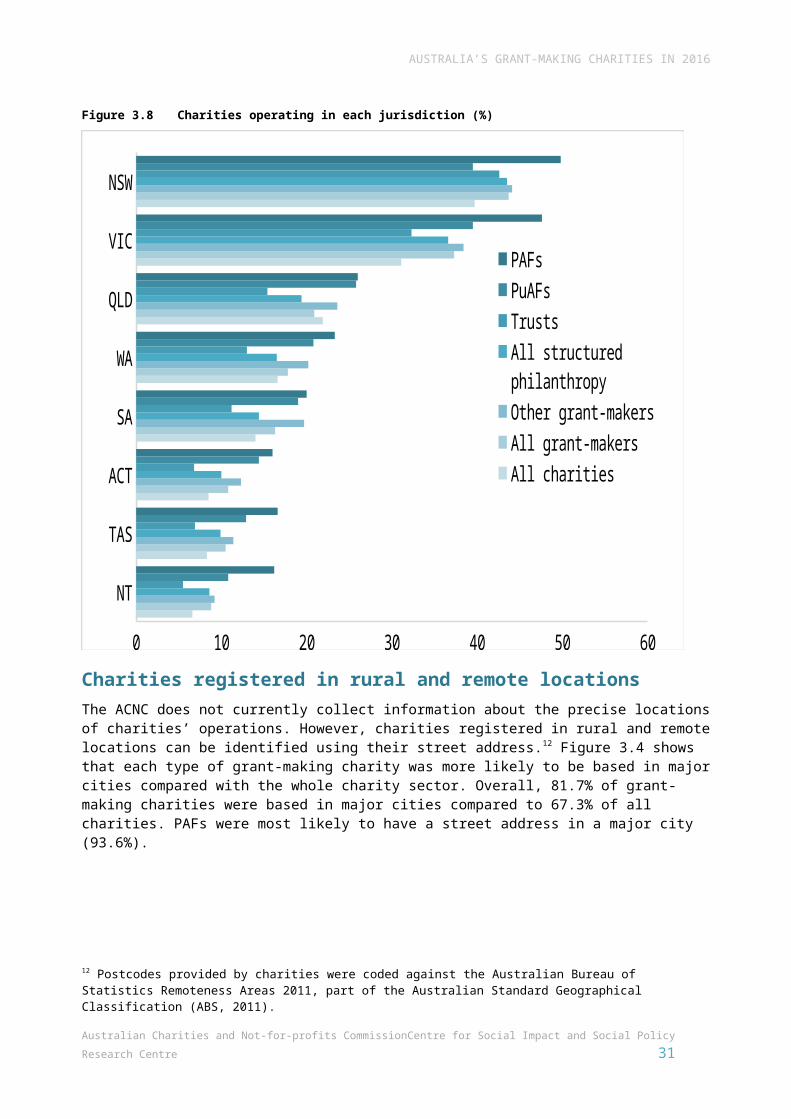
AUSTRALIA’S GRANT-MAKING CHARITIES IN 2016
Funds in excess of $385,000 have been distributed by the Foundation during the 2015/16 financial year to various groups and people who work with those in distressed and necessitous circumstances in early childhood in Australia in accordance with its Trust Deed. (Small charity, VIC)
Others described achieving purpose through making grants in particular fields and, in some cases, across multiple fields. One example was:
Provided grants to researchers to further cancer research. (Medium charity, WA)
Some charities described a fairly wide range of activities and beneficiaries, for example:
The fund has donated to various sectors during the year to achieve this objective including health research, veterans’ affairs and education. (Medium charity, QLD)
We provided funding for people in need and to organisations to deliver programs to those less fortunate. Main focus areas are educational, health and social welfare. (Large charity, ACT)
Grants to organisations - undertaking medical research; providing Aged/Invalid/Blind care services; providing services for youth; providing overseas relief/famine aid; providing education services for primary and secondary students; providing education services for tertiary and university students; preventing or relieving the suffering of animals. (Medium charity, TAS)
However, others described how their activities and outcomes helped achieve purpose for a specific group of beneficiaries:
Granting financial assistance helped to promote and encourage the advancement of knowledge of people, especially younger people, living on remote stations and in small settlements in outback parts of Australia. (Medium charity, NT)
Our grants assisted young people with vision impairment. (Medium charity, SA)
The Foundation consulted, partnered & funded organisations to support research, education, advocacy, and strengthen the effectiveness of work largely in respect of protecting & promoting Australia’s biodiversity. In particular, significant support was provided to support marine conservation programs. (Small charity, QLD)
Grant-making charities’ plans to change or introduce activities in the 2017 reporting periodThe AIS also asked if charities intend to change or introduce any activities in the 2017 reporting period and, if so, to provide further explanation. Among grant-makers’ responses, the most common words related to ‘funding’, ‘support’, ‘2017’, ‘activities’, ‘grants’, ‘community’ and ‘foundation’. A summary word cloud, based on word frequencies, is shown in Figure 5.16. Grant-making charities described three sets of changes: expanding their activities, change in how they administer grants and plans to cease activities. These are discussed below.
Australian Charities and Not-for-profits Commission Centre for Social Impact and Social Policy Research Centre 31
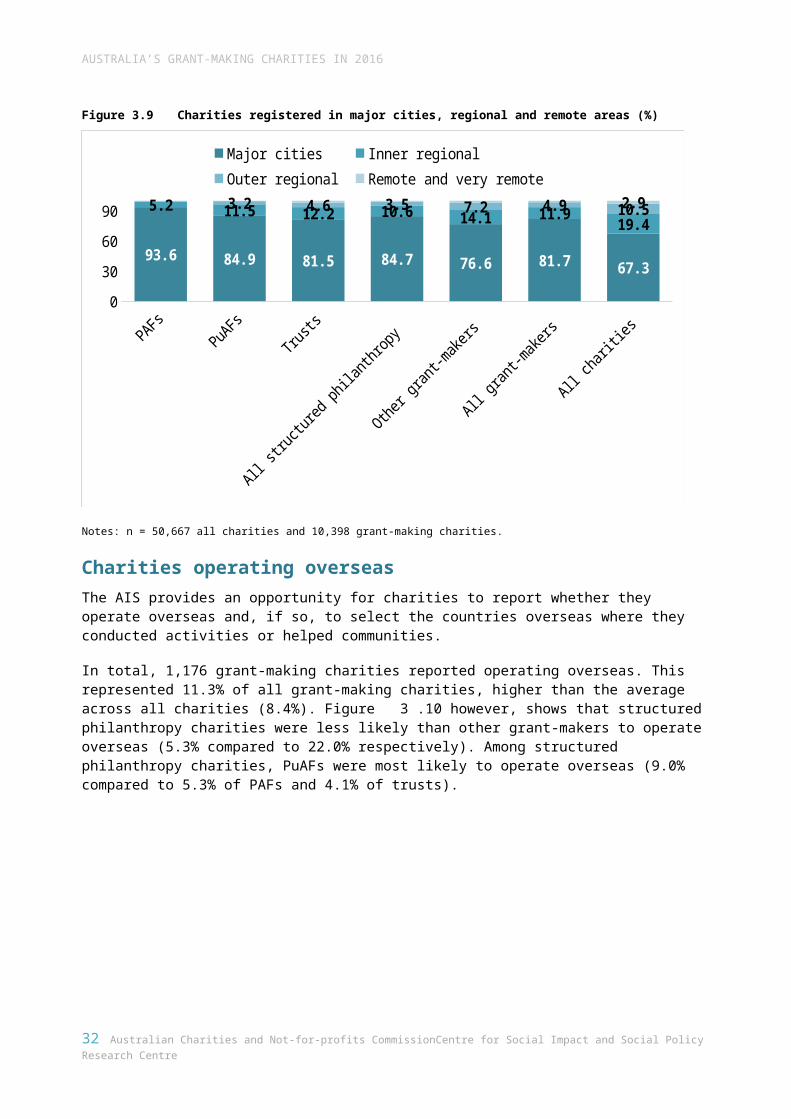
AUSTRALIA’S GRANT-MAKING CHARITIES IN 2016
Figure 5.16 Word frequency: how grant-making charities expect to change or introduce activities in 2017 reporting period
Some grant-making charities focused on how they would make changes to expand their activities. In several cases this was by increasing the scale of their current activity to provide more grants, for example:
We will provide more scholarships for students attending the local university campus. (Small charity, NSW)
In other cases, the charity indicated that it intended to expand into other areas of activity or outcome domains:
The Private Ancillary Fund intends to continue with its current activities but to also expand into the Mental Health Area. (Small charity, NSW)
In future our foundation will expand their activity in supporting advocacy, research and analysis as well as expand into capacity building, leadership development and initiatives that will improve democracy in Australia and beyond. (Large charity, VIC)
Others indicated changes to how they administered their grants or who they were targeted at:
Replace current one-year grants valued at up to $25,000p.a. with two-year grants valued at $50,000p.a. (Large charity, NSW)
The Trustees will build on the past year’s success in broadening the base of applicants for grants, and the range of activities for which grants are sought. A revamped community website, and an enhanced community Newsletter, will complement the provision of hands-on support to community groups to obtain maximum benefit from communications facilities created for their collective use. (Small charity, VIC)
We may support different charitable organisations. (Small charity, QLD)
32 Australian Charities and Not-for-profits Commission Centre for Social Impact and Social Policy Research Centre
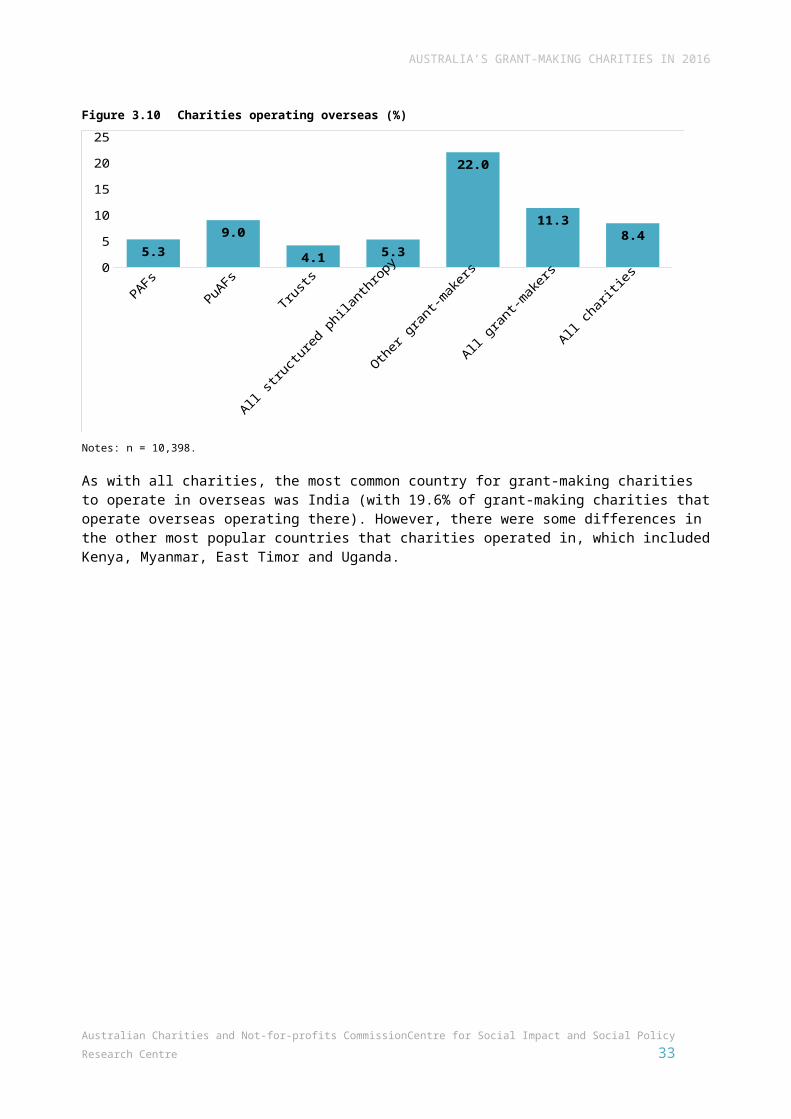
AUSTRALIA’S GRANT-MAKING CHARITIES IN 2016
Others elaborated that they expected to cease to operate in the next reporting period. Examples given included:
After a strategic review the Trustee has decided to close the trust to focus on more effective ways to support our community programs. Fundraising activities are planned to cease in March 2017. (Medium charity, VIC)
Charitable trust was wound up in 2016–2017 financial year and final distribution made. (Small charity, NSW)
Australian Charities and Not-for-profits Commission Centre for Social Impact and Social Policy Research Centre 33
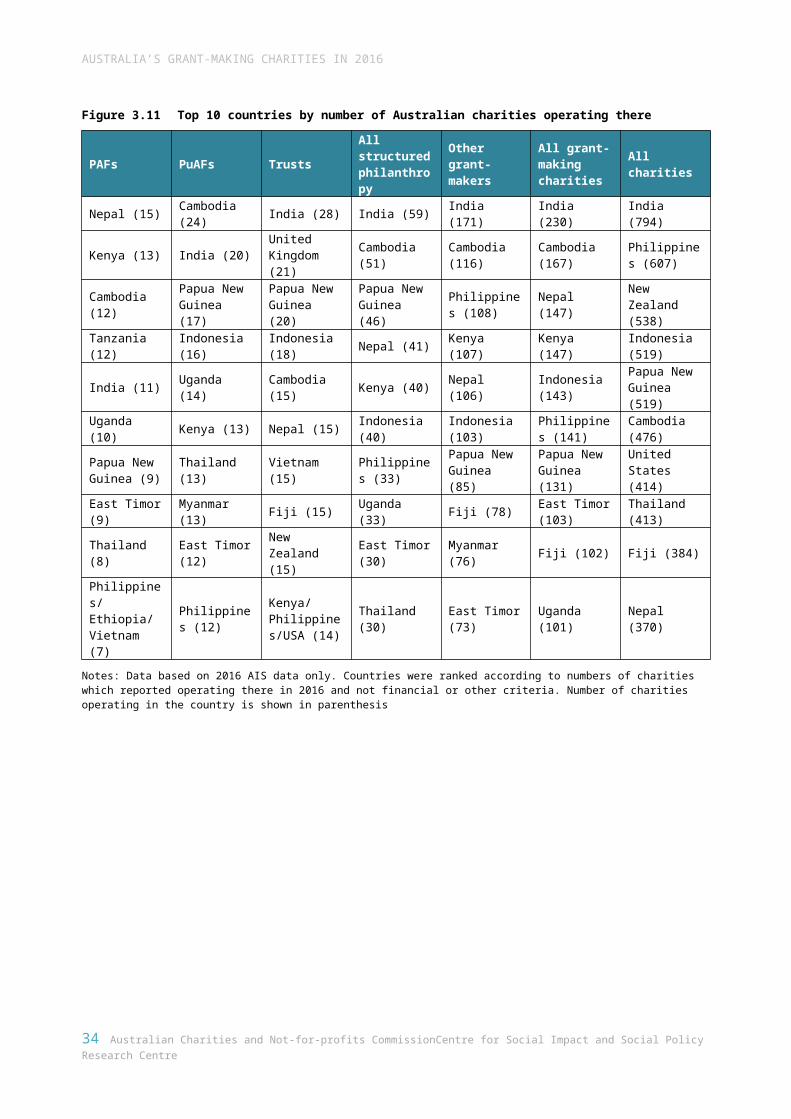
6. Understanding the purpose and structureof grants
The 2016 AIS asked additional questions to deepen understanding about the purpose and structure of grants made by Australia’s grant-making charities. Those who reported that grant-making was among their main or other activities were asked to estimate the proportion of the charity’s grant funding used for capacity building of grant recipients and specifically for recipients in rural and regional Australia. While there is some missing data, the data collected provides some indication of the purpose and structure of grants provided by Australia’s grant-making charities. Detail about the structure of grants was captured with questions about the proportion of grant funding distributed through open public processes and through multi-year grants.
Funding for capacity building of grant recipientsAs described on the AIS form, capacity-building grants provide general support for the recipient and are not for one particular program or project. Examples include infrastructure, technology, staff training and development or staff costs. Overall, 35.7% of grant-making charities reported that a clear majority of their grant funds (defined as more than 60%) was spent on capacity building (see Figure 6.17). This differed across grant-makers, ranging from 44.2% of PAFs to 31.7% of other grant-makers. Across all responding grant-makers, the mean proportion of grant funding spent on capacity building was 39.2%.Figure 6.17 Charities spending major and minor proportions of grant funds on capacity building of grant
recipients (%)
PAFs
PuAFS Trusts
All stru
ctured phila
nthropy
Other grant-m
akers
Total0%
10%20%30%40%50%60%70%80%90%
100%
50.1 55.9 62.8 56.4 59.8 58.1
5.7 2.43.4
4.18.5 6.3
44.2 41.7 33.8 39.5 31.7 35.7
Minority (less than 40%) Roughly half (40 to 60%) Majority (more than 60%)
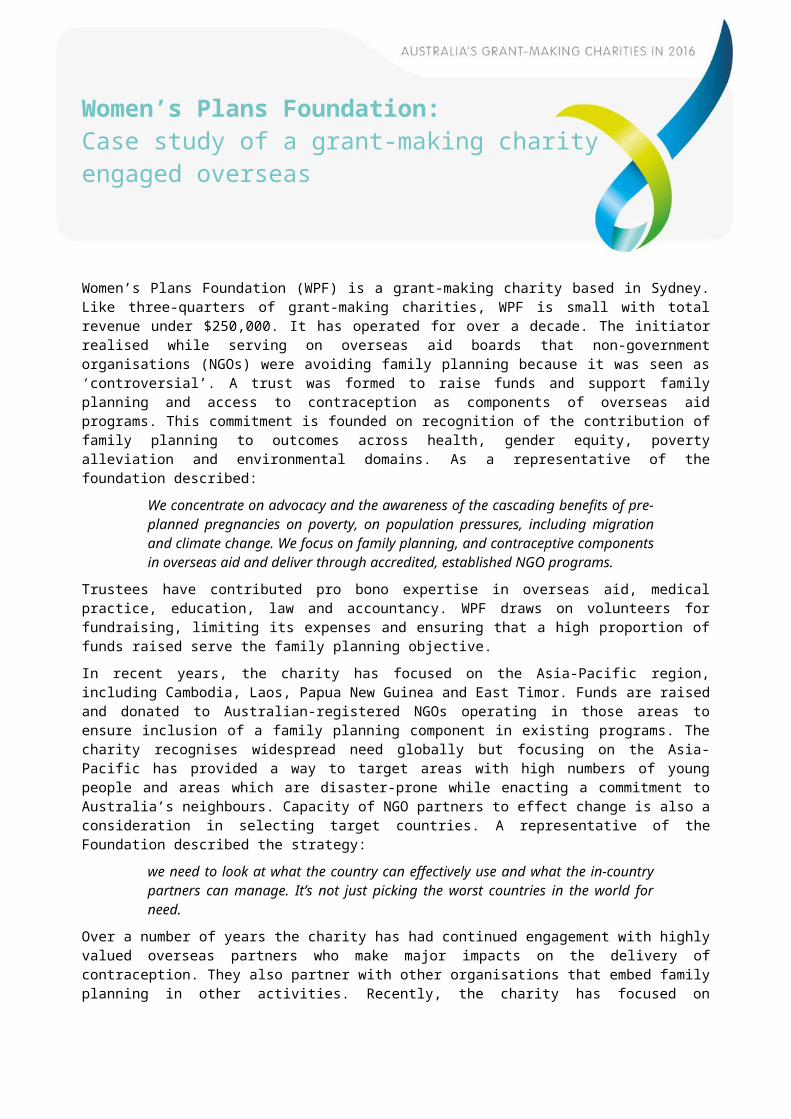
AUSTRALIA’S GRANT-MAKING CHARITIES IN 2016
Notes: n = 471 PAFs, 254 PuAFs, 471trusts, 1,196 all structured philanthropy, 1,153 other grant-makers and 2,359 all grant-makers. Numbers are lower due to charity non-response and because the AIS only asked these questions of those that reported grant-making as a main or other activity, which does not capture all charities focused on grants.
Funding for recipients in rural and regional AustraliaThe 2016 AIS asked charities involved in grant-making activities to estimate the percentage of their grant funding in the 2016 reporting period that was specifically for recipients in rural and regional Australia. It specified that rural and regional areas are those outside the capital cities of states and territories. As shown in Figure 6.18, 11.3% of grant-making charities reported a majority of funds were spent specifically on recipients in rural and regional Australia. This was slightly lower among PAFs and slightly higher among trusts. Across all grant-making charities which responded, the mean proportion of grant funds spent on rural and regional recipients was 14.0%.Figure 6.18 Charities spending major and minor amounts of grant funds specifically on recipients in rural
and regional Australia (%)
PAFsPuAFS
Trusts
All structu
red philanthropy
Other grant-m
akers Total0%
10%20%30%40%50%60%70%80%90%
100%
91.7 84.5 83.3 86.9 84.9 85.9
3.02.0 1.9 2.4 3.1 2.7
5.3 13.5 14.7 10.8 11.9 11.3
Minority (less than 40%) Roughly half (40 to 60%) Majority (more than 60%)
Notes: n = 469 PAFs, 252 PuAFs, 468 trusts, 1,189 all structured philanthropy, 1,149 other grant-makers and 2,338 all grant-makers. Numbers are lower due to charity non-response and because the AIS only asked these questions of those which reported grant-making as an activity.
Multi-year grantsFigure 6.19 shows the proportion of responding grant-makers that distributed a clear majority or minority of their grant funding as multi-year grants. Overall, 20.9% said that the major share (more than 60%) of their grant funding was multi-year, although this was slightly lower for PuAFs (16.7%) and highest for trusts (25.4%). The mean across grant-making charities was 23.6%.
Australian Charities and Not-for-profits Commission Centre for Social Impact and Social Policy Research Centre 35
AUSTRALIA’S GRANT-MAKING CHARITIES IN 2016
Figure 6.19 Charities distributing major and minor proportions of grant funds as multi-year grants (%)
PAFs PuTrusts
All struct.
..
Other g... Total
0%
10%
20%
30%
40%
50%
60%
70%
80%
90%
100%
73.0 79.469.1 72.8 74.3 73.5
8.14.0
5.56.2 4.9 5.6
18.9 16.725.4 21.0 20.7 20.9
Minority (less than 40%) Roughly half (40 to 60%) Majority (more than 60%)
Notes: n = 470 PAFs, 252 PuAFs, 469 trusts, 1,191 all structured philanthropy, 1,153 other grant-makers and 2,344 all grant-makers. Numbers are lower due to charity non-response and because the AIS only asked these questions of those which reported grant-making as an activity.
Granting through public or open application processesOne AIS question related to the proportion of grant funding granted through a public application process. The explanatory note to the question specified that this meant that usually any charity that meets the criteria can apply for grants through a public or open application process. It does not include grants open only to selected applicants or grants to charities directly approached with an offer of funding. On average, responding grant-makers reported that 37.1% of grant funds were distributed through open processes. A little over a third (35.2%) of grant-makers reported distributing the majority of funds through public processes (i.e., over 60% of total grant funds). However, this differed among types of grant-makers. While only 17.3% of PAFs distributed the majority of grant funds through public processes this was much higher among trusts (43.3%).
36 Australian Charities and Not-for-profits Commission Centre for Social Impact and Social Policy Research Centre
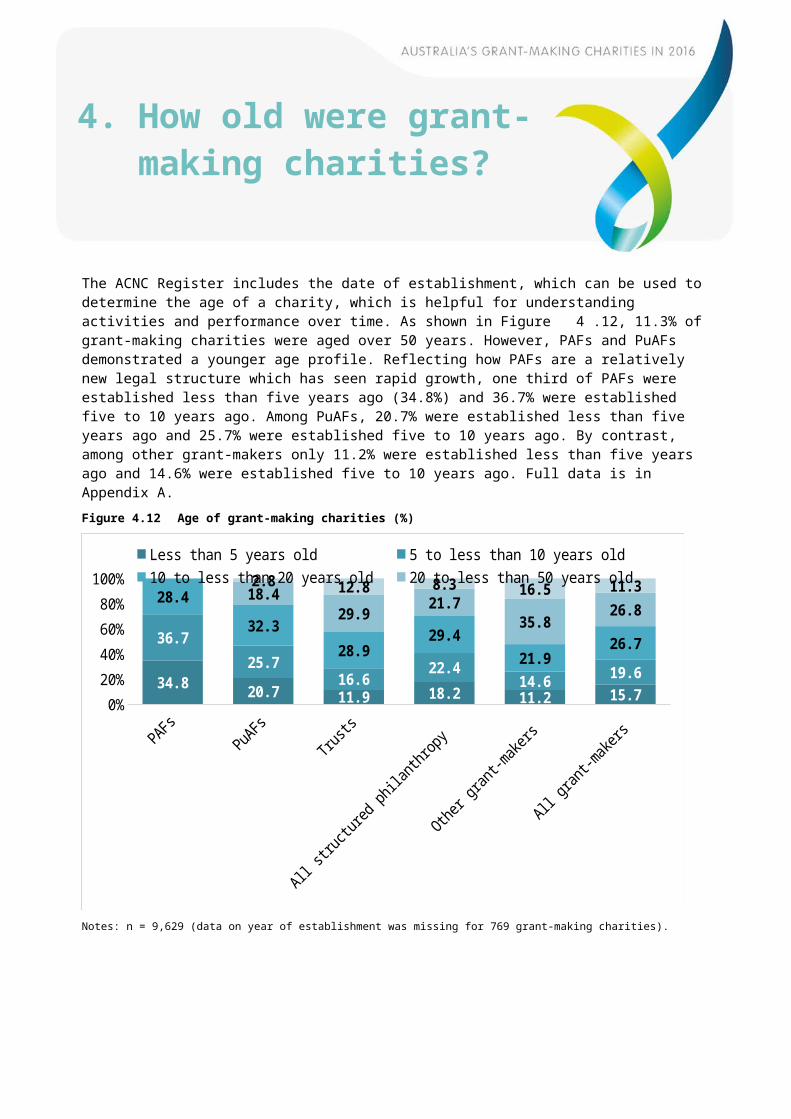
AUSTRALIA’S GRANT-MAKING CHARITIES IN 2016
Figure 6.20 Charities distributing major and minor amounts of grant funds through public or open application processes (%)
PAFsPuAFS
Trusts
All structu
red philanthropy
Other grant-m
akers Total0%
10%20%30%40%50%60%70%80%90%
100%
80.263.9 53.9
66.4 56.1 61.3
2.6
0.82.8
2.34.8 3.5
17.335.3 43.3
31.3 39.1 35.2
Minority (less than 40%) Roughly half (40 to 60%) Majority (more than 60%)
Notes: n = 469 PAFs, 252 PuAFs, 469 trusts, 1,190 all structured philanthropy, 1,153 other grant-makers and 2,343 all grant-makers. Numbers are lower due to charity non-response and because the AIS only asked these questions of those which reported grant-making as an activity.
Australian Charities and Not-for-profits Commission Centre for Social Impact and Social Policy Research Centre 37
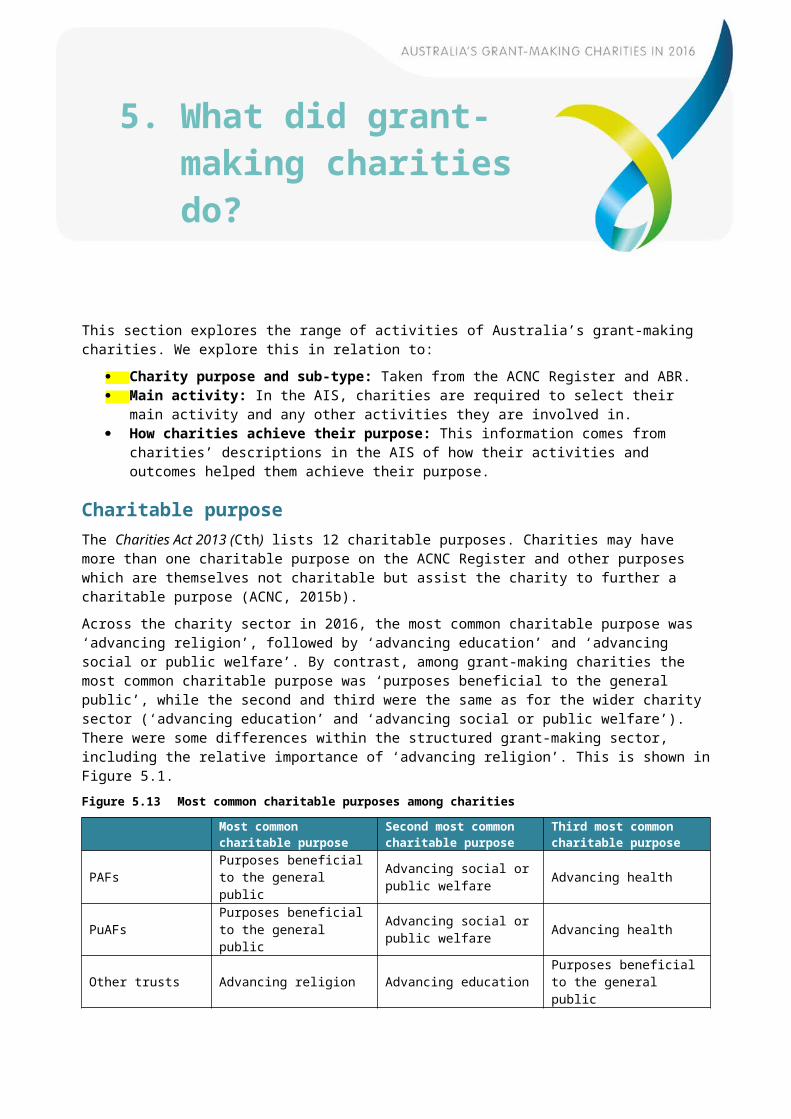
The Reichstein Foundation: Case study of a trust providing multi-year support
The Reichstein Foundation is a medium-sized Victorian-based trust established from a gift in 1970. In its early years grants focused on traditional social welfare causes, including orphanages, hospitals, veterans and widows. The Foundation continues to address social welfare issues, but its approach has evolved to focus on addressing the underlying causes of social disadvantage through social movements, policy and advocacy. Its current emphasis is on empowering and enabling people with lived experience of disadvantage to effect systems change. A representative describes its aims to:
build on the lived experience of people experiencing disadvantage and injustice. That means that you’re trying to enable people to realise their latent power, that they have a voice, they have intelligence and wisdom that should be harnessed and should be a component of how policy is made.
The Foundation’s approach to distributing funds emphasises continuity of support to grant recipients, but also makes provision to support emerging causes. A representative describes the benefit of providing continuity of support:
What we are trying to do is to provide core funding over multi-year support so that organisations have got the certainty of dollars coming from Reichstein and our supporters. They can get on with their change making rather than focusing on constant applications for funding.
While it has used public grant rounds to distribute funds in the past, its current approach involves reaching out to projects through select invitations to apply, while reserving some funds to distribute to support rapid responses to emerging social justice issues. A representative described the thinking behind this, recognising the need for grant-making to balance several considerations:
We don’t want to put organisations in the field through a process of making applications when the chances of success, given our modest funding are not that high. It is a delicate balance between trying to find the right organisations and people and being open and transparent and approachable.
In terms of the future of philanthropic charities in Australia, a Foundation representative commented on the strengths and challenges of the increasing sophistication of Australia’s philanthropic sector:
It is moving from being a cottage industry to being something that is more thoughtful and more scientific in its approach and there are positives and negatives with that. The more rational the sector gets then the more return on investment driven it gets. There are some positives with that because it means that you’re both more efficient and you can identify what your impact is. On the other hand, there are a lot of intangibles in the gift relationship and the downside of that more rational approach is that you’re at risk of losing some of the humanity and some of the compassion and some of the inspiration and risking taking that can be really central to good philanthropy.
To help build capacity and impact across the philanthropic sector, the Foundation sees collaborative approaches as promising, observing prospects for common projects and common application and assessment processes. The Foundation representative also pointed to the need for grant-makers to have access to better quality intelligence about the factors contributing to disadvantage to more effectively achieve change in systems and power structures. Maintaining charities’ right to advocacy was also seen as a priority to strengthen the future of Australian philanthropy.
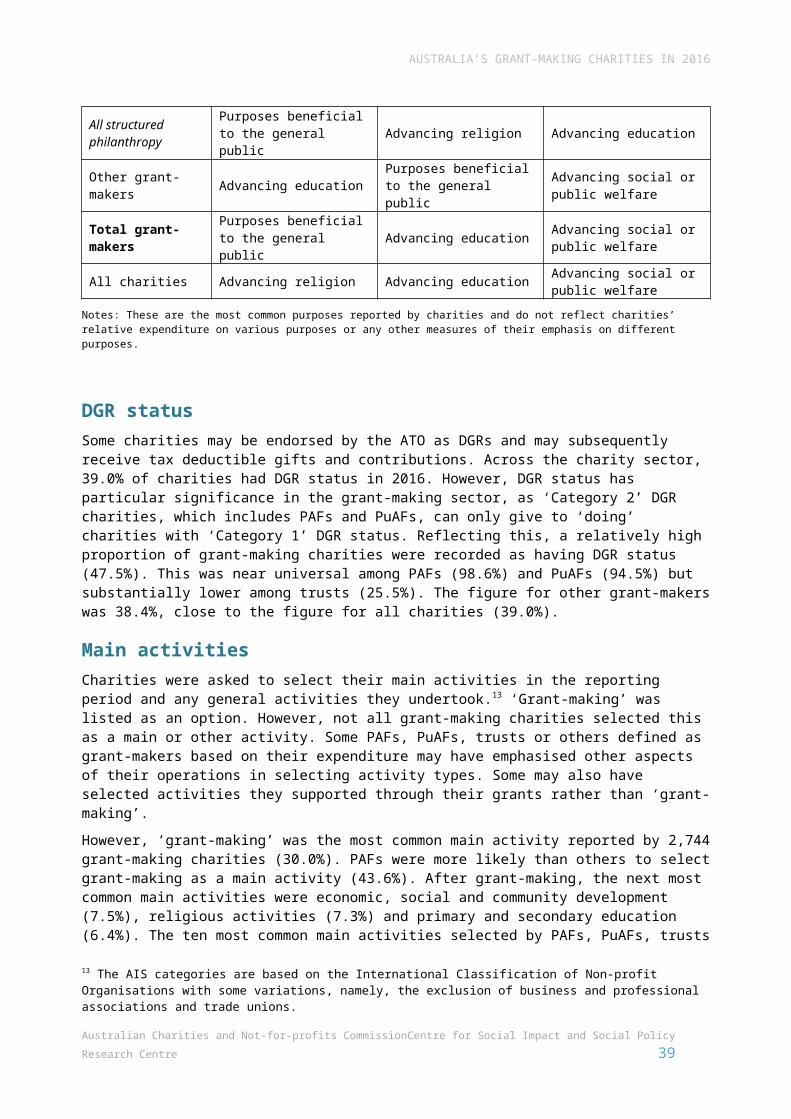
7. Who did grant-making charities help?
In the 2016 AIS, charities were able to select whether the group helped most by the charity’s activities was the general community within Australia, that is, a large cross-section of the community without any specific attributes or a specific category of beneficiaries. Those who answered specific categories were then asked to select which categories were helped most, with various options relating to the gender, age, diversity and other characteristics or needs of beneficiaries.
In this section, we examine charities that helped the general community and specific groups. Case studies are provided as examples of grant-making charities helping the general community and specific groups.
Charities helping the general community in AustraliaAround half of all grant-makers focused on the general community in Australia (see Figure 7.21). However, this was higher among PAFs, 73.7% of whom reported focusing on the general community, and lower among trusts (41.1%).Figure 7.21 Beneficiary type by type of grant-making charity (%)
PAFsPuAFs
Trusts
All structu
red philanthropy
Other grant-m
akers
All grant-m
akers0%
10%20%30%40%50%60%70%80%90%
100%
73.751.8 41.1 49.8 48.2 49.2
26.348.2 58.9 50.2 51.8 50.8
General Specific categories
Notes: n = 1,282 PAFs, 1,124 PuAFs, 3,793 trusts, 6,199 all structured philanthropy, 3,491 other grant-makers, 9,690 all grant-makers. Data is based on 2016 data only. See also Figure A.7.
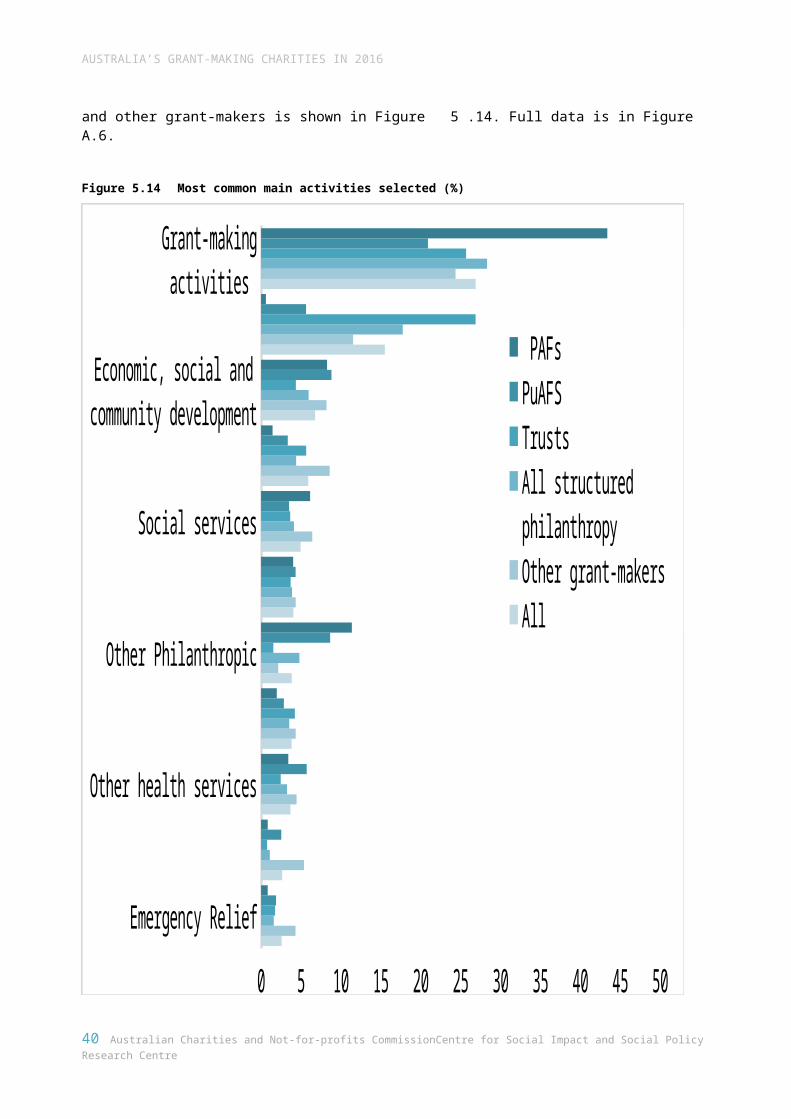
Fremantle Foundation: Case studyof a grant-making charity assistingthe general community
The Fremantle Foundation is a locally-focused community foundation. It is a medium-sized charity constituted as a PuAF, administering charitable funds on behalf of individuals, families, businesses and other donor groups. Enacting its commitment to achieving place-based social change, the Foundation makes grants to benefit charitable causes in the Fremantle area, Perth and throughout Western Australia on behalf of its donors. Grants often support grass-roots organisations working at a local level in community development, health, education, environmental, arts and culture and other causes. Its approach recognises Fremantle’s strong history and tradition of social justice and the contemporary context of rising inequality thrown into relief by the rising wealth prevalent in Fremantle and Perth.
The Foundation utilises a PuAF structure. The PuAF structure is seen to promote accessibility of structured giving, as donors can participate without large outlays, through a sub-fund of an existing entity and with support for grants administration and financial management. The Foundation structure also offers flexibility to donors in that they can choose the causes they support.
As well as making grants, the Foundation is concerned with building local philanthropic capacity, including through developing communities of local grant-makers and recipients. Currently, it is aiming to improve donors’ understanding of local issues in the Fremantle area to ensure granting is strategically aligned with community needs and priorities. A representative of the Foundation described their commitment to promoting knowledge to inform donors and expand giving:
It’s about accessibility, it’s about encouraging giving and it’s also, in our case, it’s about creating a platform and a community for fund holders to grow their understanding and comfort levels and expertise around giving.
The Foundation’s approach to grant-making is premised on an understanding of the limitations of funding which may be overly tied, sporadic or short term. To promote longer-term change, they are working to catalyse more impactful approaches among donors:
I think we have a role to play in setting an agenda and bringing partners in and like-minded people in to address long-term change. There might be a five or ten-year window, rather than, ‘Okay, what are we going to grant this year and then what are we going to grant next year?’
As well as focusing on building donor strategy and capacity, the Foundation seeks to build capacity among local grant recipients such as through knowledge exchange initiatives among new and previous grant recipients. Changes that would develop the Foundation’s impact include promoting access to DGR1 status among local charities, as this would help expand the numbers of grant recipients eligible for the Foundation’s grants. Streamlined fundraising arrangements across the jurisdictions would enable the charity to raise funds nationally, while a measurement toolkit would help provide a means to capture impact across the range of causes the Foundation supports.
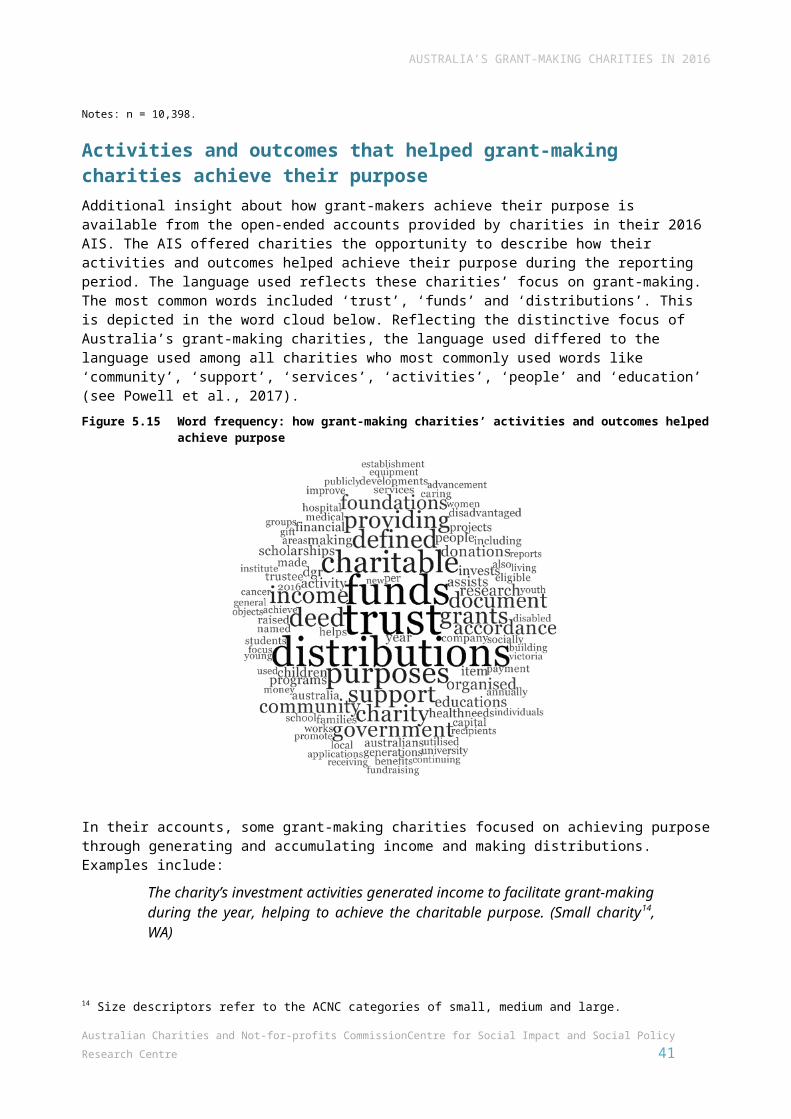
AUSTRALIA’S GRANT-MAKING CHARITIES IN 2016
Charities that helped specific groupsAmong all grant-making charities that reported helping specific groups, the most commonly supported group were ‘other charities’ (reported by 13.9% of grant-makers), followed by youth (13.6%) and children (aged 6–14) (12.6%). This differed among grant-makers (see Figure 7.22). Figure 7.23 shows differences between the specific groups helped by grant-makers and the whole charity sector. Higher proportions of grant-makers helped other charities and lower proportions helped adults, families, children (under 6), people with disabilities and Aboriginal and Torres Strait Islander people. A case study of a charity which supported Aboriginal and Torres Strait Islander people is provided below.Figure 7.22 Grant-making charities that helped specific categories of beneficiaries (%)
Most supported beneficiary group (%)
Second most supported beneficiary group (%)
Third most supported beneficiary group (%)
PAFs Youth (15–24) 6.9 Other charities 6.9 Children (6–14 years) 6.2
PuAFs Youth (15–24) 13.3 Children (6–14 years) 12.2 Females 9.2
Trusts Other charities 16.7 Others 13.4 Youth (15–24) 12.8
All structured philanthropy Other charities 13.1 Youth (15–24) 11.7 Others 9.8
Other grant-makers Children (6–14 years) 18.1 Youth (15–24) 17.0 Other charities 15.4
Total Other charities 13.9 Youth (15–24) 13.6 Children (6–14 years) 12.6
Notes: n = 9,690. Analysis uses reported 2016 AIS data only. Charities could report helping up to five specific beneficiary groups. Information captures beneficiary groups most commonly reported and does not reflect charities’ expenditure or other measures of their emphasis on different beneficiary groups.
Australian Charities and Not-for-profits Commission Centre for Social Impact and Social Policy Research Centre 41
AUSTRALIA’S GRANT-MAKING CHARITIES IN 2016
Figure 7.23 Specific categories helped, grant-makers and all charities (%)
Pre-/post-release offenders and/or their familiesGay, lesbian, bisexual, transgender or intersex persons
Veterans and/or their familiesVictims of crime (including family violence)
Victims of disasterUnemployed persons
Migrants, refugees or asylum seekersPeople from a culturally and linguistically diverse background
People at risk of or experiencing homelessnessFamilies
People in rural/regional/remote communitiesAdults (65 and over)
People with chronic illness (including terminal)Overseas communities or charities
Aboriginal and Torres Strait Islander peopleFinancially disadvantaged people
Adults (25–64 years)Early childhood (under 6)
People with disabilitiesMales
OthersFemales
Children (6–14 years)Youth (15–24 years)
Other charities
0 2 4 6 8 10 12 14 160.50.80.91.1
1.51.92.3
3.13.23.63.73.94.2
5.15.25.25.3
6.26.46.7
8.58.7
12.613.613.9
11.9
2.91.6
1.33.13.2
5.43.6
5.84
7.23.8
2.96.6
5.26.8
8.59.2
8.65.0
1014.2
11.84.7All charities Grant-makers
Notes: n = 9,690 grant-making charities. Data for all charities drawn from the Australian Charities Report 2016 (Powell et al., 2017). See also Figure A.8.
42 Australian Charities and Not-for-profits Commission Centre for Social Impact and Social Policy Research Centre
CAGES Foundation: Case studyof a charity supporting Aboriginaland Torres Strait Islander people
CAGES Foundation is a large grant-making charity established in 2009 by a family committed to ensuring Aboriginal and Torres Strait Islander people have opportunities to reach their full potential. To achieve this, the Foundation focuses on initiatives to provide Aboriginal and Torres Strait Islander children access to early childhood services. It enacts a theory of change focused on community-led and designed services and directs funding to Aboriginal-led and controlled organisations wherever possible.
CAGES Foundation is structured as a PAF. A benefit of this structure was that it enabled the charity’s founders to engage family members in structured giving, including through developing the Foundation’s guiding principles and focus. The PAF structure also enables the family’s commitment to philanthropy to endure. Like many other PAFs, CAGES Foundation has proudly made grants at levels above the required 5% annual distribution.
A key priority for the Foundation is to ensure grants processes are open and accessible, with around 92% of grant funding distributed through open processes. The Foundation’s Executive Officer described how their approach to grant-making seeks to maximise transparency, with their website containing information about their values, funding principles, amounts available for distribution and level of demand. Application requirements are designed to be short and to ensure organisations do not have to ‘jump through hoops’.
In recent years, the Foundation has focused on capacity building. It distributes over 50% of grants to capacity-building initiatives aimed at Aboriginal community-controlled organisations and charities partnering with Aboriginal organisations. Examples include supporting the development of early childhood educators in an Aboriginal preschool and supporting an Aboriginal peak body’s internal infrastructure. As a Foundation representative described, the capacity-building initiatives they support:
could take the form of training or internal funding to say ‘You’re doing great programs out there, but how do we make sure your organisation is a stronger, more viable organisation into the future because we believe that the work you do is really, really important’.
The charity welcomes the growth of the grant-making sector and its professionalisation and growing diversity and effectiveness. An important opportunity for the future is for grant-makers to continue to identify which local solutions can influence systems and policy more widely:
We have the opportunity to fund risk and to fund communities to find their way. Then they will have the evidence and data to take to the policy makers and say, ‘This isn’t just a great idea anymore, we have a real proof of this concept that can go forward’. I think that’s really exciting. And that’s a role that we have played in the past and I think is a massive opportunity for us and other grant-making charities like us to play that role into the future.
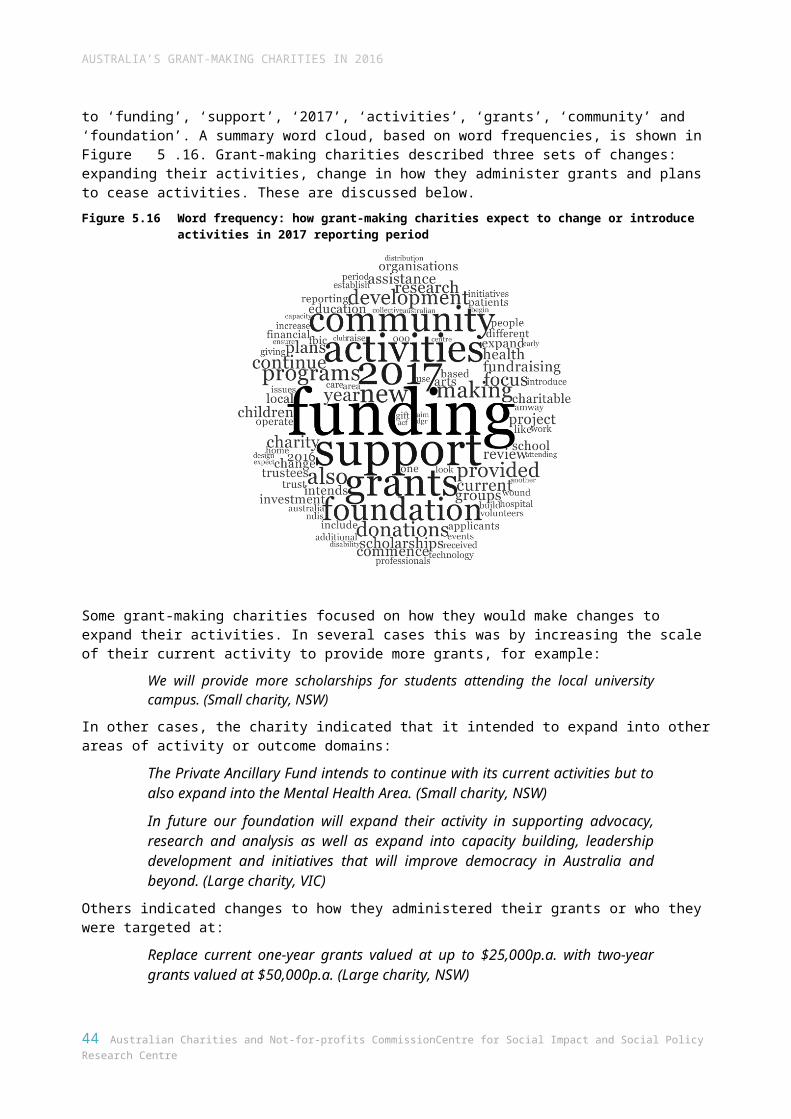
8. Who worked in grant-making charities?
Australia’s charities conduct activities and pursue their purposes using a large workforce of both paid employees and volunteers. In this section, we examine who worked in Australia’s grant-making charities, focusing on paid employees and volunteers.
Paid employeesIn the AIS, charities were asked to indicate the number of paid full-time, part-time and casual employees who worked for the charity during the last pay cycle of the 2016 reporting period. Charities were asked to provide their best estimate if exact figures were unavailable.
Employment data collected in the AIS has some limitations as it did not distinguish whether casual staff worked on a full-time or part-time basis. Further, as the data is for one pay period only it does not capture seasonal fluctuations in staffing levels. Thus, it should be considered a snapshot of employment at a single point in time. In interpreting the data for grant-making charities it should be noted that the data captures all the charity’s employees and does not distinguish those involved in grant-making from the charity’s other functions. As such, it does not reflect the numbers of staff whose work directly relates to grant-making.
As shown in Figure 8.24, the majority of grant-making charities (80.8%) employed no staff. This was much higher among PAFs (95.0%). In all categories of grant-makers there were high proportions of charities with no paid staff, ranging from 72.1% of other grant-makers to 95.0% of PAFs. By contrast, 49.6% of all charities operated with no paid staff.Figure 8.24 Charities with no paid staff (%)
PAFs
PuAFS Trusts
All stru
ctured phila
nthropy
Other grant-m
akers
All grant-m
akers
All chariti
es0
102030405060708090
10095
78.285.1 85.8
72.180.8
49.6
AUSTRALIA’S GRANT-MAKING CHARITIES IN 2016
Notes: n =10,288.
Figure 8.25 shows that grant-making charities employed 103,211 staff in total. Of these, over a third (37.9%) were involved in structured philanthropy, while 62.1% were employed in other grant-making charities. This likely reflects how those in the other grant-making category are involved in a wider range of activities, including activities requiring delivery by paid staff, compared with PAFs, PuAFs and trusts, although many charities in the structured philanthropy sector also employ staff. Within the structured philanthropy sector, trusts were the major employers followed by PuAFs. PAFs employed a very small number of staff (779 in total).
Among all the paid staff reported by grant-making charities, 35.6% were employed on a full-time basis, 31.4% were employed part time and 33.0% were casuals.Figure 8.25 Full-time, part-time and casual staff in grant-making charities
Full time
Part ti
me
Casual Total
Sum Mean Sum Me Me Me
%
o
o
a
PAFs 609 1.1 107 0
8
PuAFs 4,143 4.3 1,829
10
0
Trusts 10,336 4.1 11,033
27
1
All structured philanthropy 15,088 3.7 12,969
37
9
Other grant-makers 21,640 7.3 19,458
62
1
Total 36,728 5.2 32,427
100
0
Notes: n = 1,309 PAFs, 1,197 PuAFs, 4,036 trusts, 6,542 all structured philanthropy, 3,746 other grant-making charities and 10,288 total.
Volunteers in Australia’s grant-making charitiesAs shown above, a relatively high proportion of grant-making charities employed no paid staff in the 2016 reporting period. As such, the role of volunteers is especially important. In the AIS, charities were asked to report the estimated number of unpaid volunteers who worked for the charity during the 2016 reporting period. Together, grant-making charities drew on the volunteer efforts of 337,288
Australian Charities and Not-for-profits Commission Centre for Social Impact and Social Policy Research Centre 45
AUSTRALIA’S GRANT-MAKING CHARITIES IN 2016
people over the year. As for the employee data, this number relates to all volunteers in grant-making charities and may not reflect numbers of volunteers focused on the charities’ grant-making activities. The mean number of volunteers per grant-making charity was 32.9 (median of 3). This is lower than across the whole charity sector (57.8, median of 10). This varied across different kinds of grant-makers, with PAFs having the lowest average number of volunteers, as shown in Figure 8.26. Full data is in Appendix A.Figure 8.26 Mean number of volunteers
PAFs
PuAFS
Trust
s
All str
ucture
d phila
nthro
py
Other g
rant-
make
rs
All gra
nt-m
akers0
10
20
30
40
50
60
70
80
2.9
22.9 20.2 17.2
60.3
32.9
Notes: n = 1,308 PAFs, 1,193 PuAFs, 4,033 trusts, 6,534 all structured philanthropy, 3,726 other grant-makers and 10,260 total.
Charities with both volunteers and employeesFigure 8.27 shows the proportion of charities operating with different combinations of volunteers and paid staff. One third of grant-making charities performed their activities without either paid employees or volunteers (33.1%). This likely reflects that the activities of some grant-making charities are undertaken through other relationships, such as through trustees or contracted personnel.
A significant group of grant-making charities had volunteers only (47.7%). There were 4.6% who pursued their mission with employees only (and not volunteers) and 14.5% had both. PAFs had the highest proportion of charities operating without either employees or volunteers (60.4%) or with volunteers only (34.7%).
46 Australian Charities and Not-for-profits Commission Centre for Social Impact and Social Policy Research Centre
AUSTRALIA’S GRANT-MAKING CHARITIES IN 2016
Figure 8.27 Grant-making charities with employees and volunteers (%)
PAFsPuAFs
Trusts
All struct..
.
Other g... Total0%
10%
20%
30%
40%
50%
60%
70%
80%
90%
100%
60.4
21.9
41.3 41.6
18.333.1
34.7
56.3
43.7 44.2
53.8
47.7
1.8
15.610.0 9.4
23.514.5
3.1 6.2 4.9 4.8 4.4 4.6
Had neither employees nor volunteers Volunteers only Employees and volunteersEmployees only
Notes: n = 10,288. Data was missing for 110 grant-makers (consisting of 9 PAFs, 27 PuAFs, 66 trusts and 8 other grant-makers). See also Figure A.9.
Australian Charities and Not-for-profits Commission Centre for Social Impact and Social Policy Research Centre 47
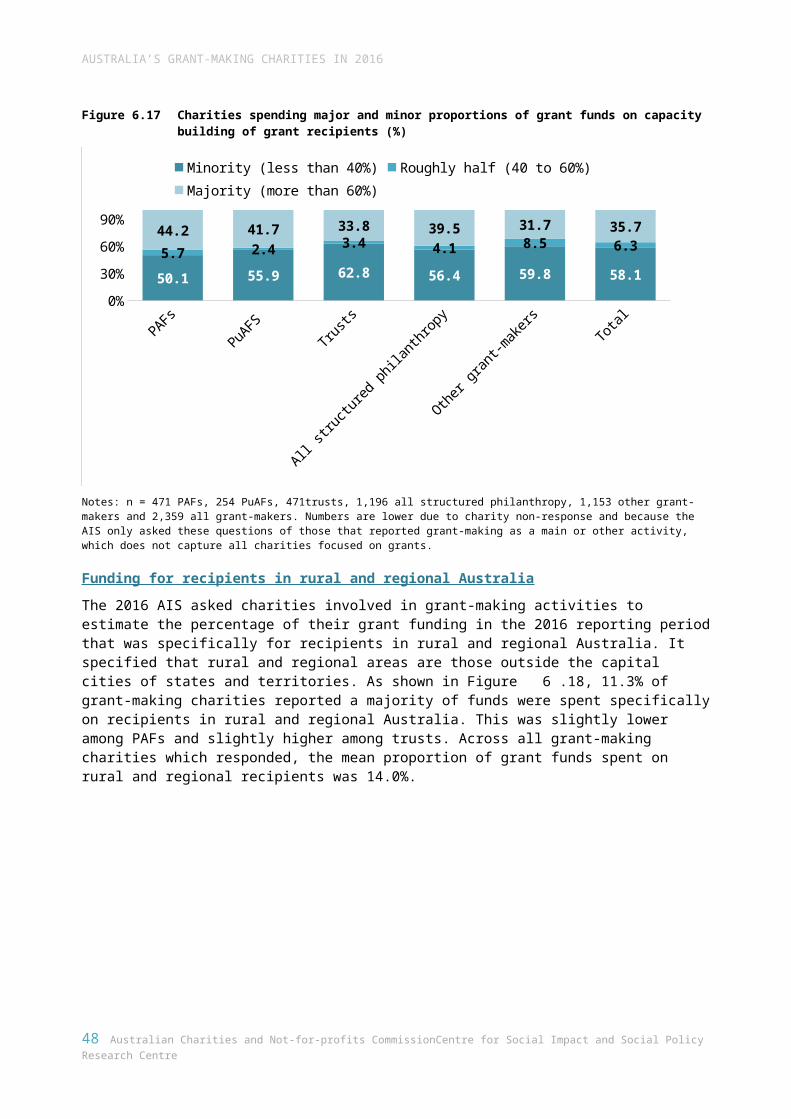
Starfish Foundation: Case study of agrant-making charity withoutemployees
Starfish Enterprises Network Limited is a large environmental charity with an attached Foundation, Starfish Foundation, which holds an endowment fund to support a range of rural sustainability initiatives. They are based on their founders’ recognition of the urgency of ecological problems associated with extreme weather, collapse of ecosystems and loss of biodiversity. Starfish has a clearly articulated theory of change and, while based in regional New South Wales, operates in other parts of Australia and overseas. The charity and Foundation take a holistic approach to rural sustainability and pursue purpose through what their representatives describe as ‘annoyingly good examples of sustainability’ across social, ecological and economic domains. Projects include renewable energy, regenerative farming, reconciliation, social housing, disability, natural funerals, youth development, leadership and collaborative governance.
Rather than raising general funds to support rural sustainability, Starfish seeks to attract and distribute funds for specific, tangible, well-understood pieces of work which can be completed in short time frames. Funds are sourced from hands-on, engaged philanthropists willing to invest in niche projects. The Foundation is a relatively new aspect of their activity, enabling a micro-grants program, and supporting ‘flexibility and administrative leanness’. Starfish runs without employees and with very low overheads. They draw on the ‘distributed architecture’ of a network of partner organisations and associates, each responsible for completing particular projects or stages of projects quickly and autonomously. Collaboration is a key priority for fundraising, grant-making and the charities’ other activities, and an expression of the charities’ ethos:
We collaborate pretty much on everything…Some of our projects involve 60–70 different organisations…We kind of jokingly call ourselves professional cat herders. I think that collaborative processes are one way to address the risk of competition, which is obviously not what we want to do as a sector at all. We really want to solve the issues we work on rather than elbow each other out of the way…the collaborative culture and methodologies that we use is a solution to that.
Over the next few years, Starfish anticipates the sector will be shaped by ‘big picture’ challenges including public resistance to recognising the urgent need to solve environmental problems and the human-centric bias of donor communities, seen to constrain the funds available for urgent environmental causes. Obtaining DGR status has been a major enabler for the Starfish Foundation, although the process of obtaining it was prolonged. As well as being registered with the ACNC, Starfish is registered with the Department of the Environment’s Register of Environmental Organisations. In terms of regulatory improvements, charities like Starfish could benefit from more flexible mechanisms allowing registration against multiple DGR categories, faster approvals of applications for DGR status, streamlining fundraising regulation across states and territories, and transferring regulation of environmental organisations to the ACNC, to reduce duplication.
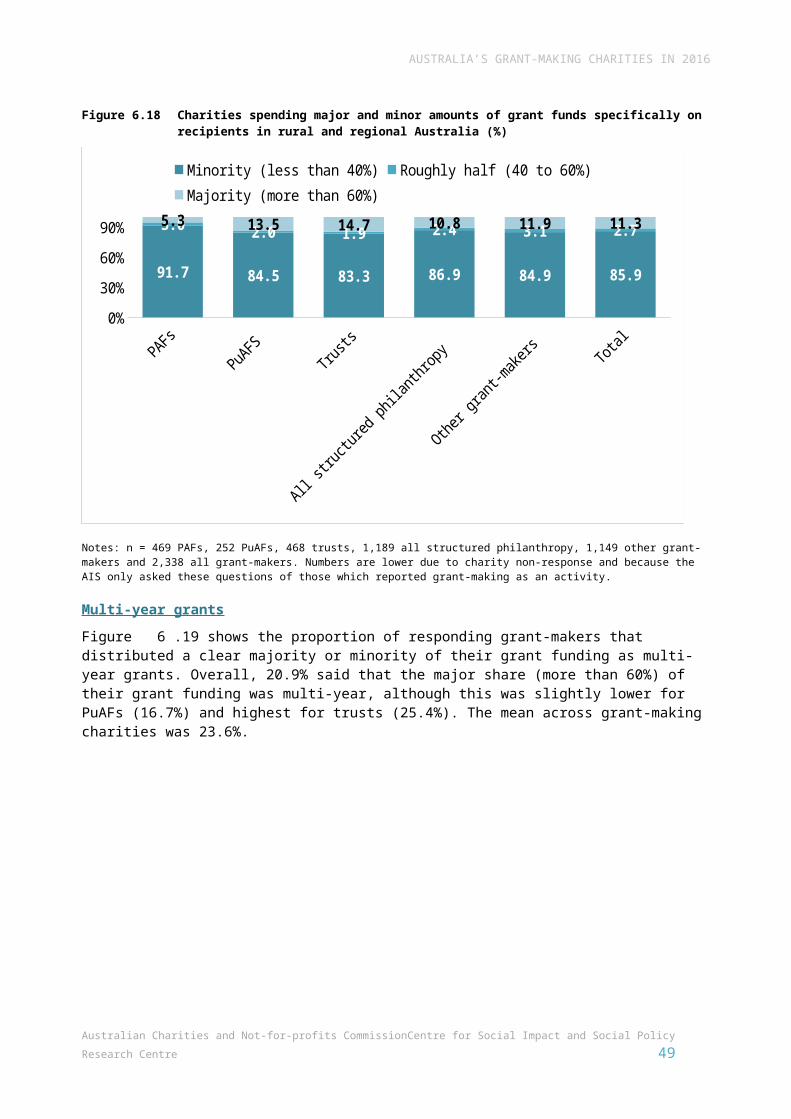
9. How did grant-making charities fund their activities?
The AIS requires most charities to answer questions about financial information including the sources of their revenue and other income for the 2016 reporting period.15 This information provides insight into the sources of grant-makers’ revenue to help understand how they fund their activities. Revenue in the AIS was captured in three main categories: government grants, donations and bequests and other revenue. Other income, including income from transactions that are not part of charities’ ordinary operations such as asset sales or investment returns, were also captured.16
Summary of revenue and other incomeTotal gross income consists of total revenue (grants, donations and bequests and other revenue) along with other income. Figure 9.28 shows that among grant-making charities total revenue constituted 82.9% of total income and other income 17.1%. The largest source of revenue was other revenue, followed by government grants and donations and bequests. However, donations and bequests contributed 24.8% of total revenue among grant-making charities, much higher than across the whole charity sector (7.3%).17 Full data is in Appendix A including breakdowns of income for each category of grant-maker. A closer examination of revenue sources for each category of grant-makers is below.Figure 9.28 Total revenue and other income for all grant-making charities
Revenue and income sources Total ($) % of total income % of total revenue
Government grants 4,949,707,742 24.8 30.0
Donations and bequests 4,099,276,985 20.6 24.8
Other revenue# 7,471,638,071 37.5 45.2
Total revenue 16,520,622,798 82.9 100.0
Other income 3,414,663,357 17.1 -
Total 19,935,286,155 100.0 -
Notes: n = 10,398. # See Box 1 on page 49 for a definition of other revenue
15 Financial data for basic religious charities and others for which financial information was unavailable is estimated, as outlined in Appendix A.16 As outlined earlier, revenue refers to the amount received for an organisation’s ordinary activities, whereas income refers to total revenue, plus other income from transactions that are not part of a charity’s ordinary operations or activities. Other income may include gains such as the sale of an asset (e.g., equipment or real estate), forgiveness of a liability or debt, or gains on foreign currency transactions.17 See Powell et al., 2017, p. 54.
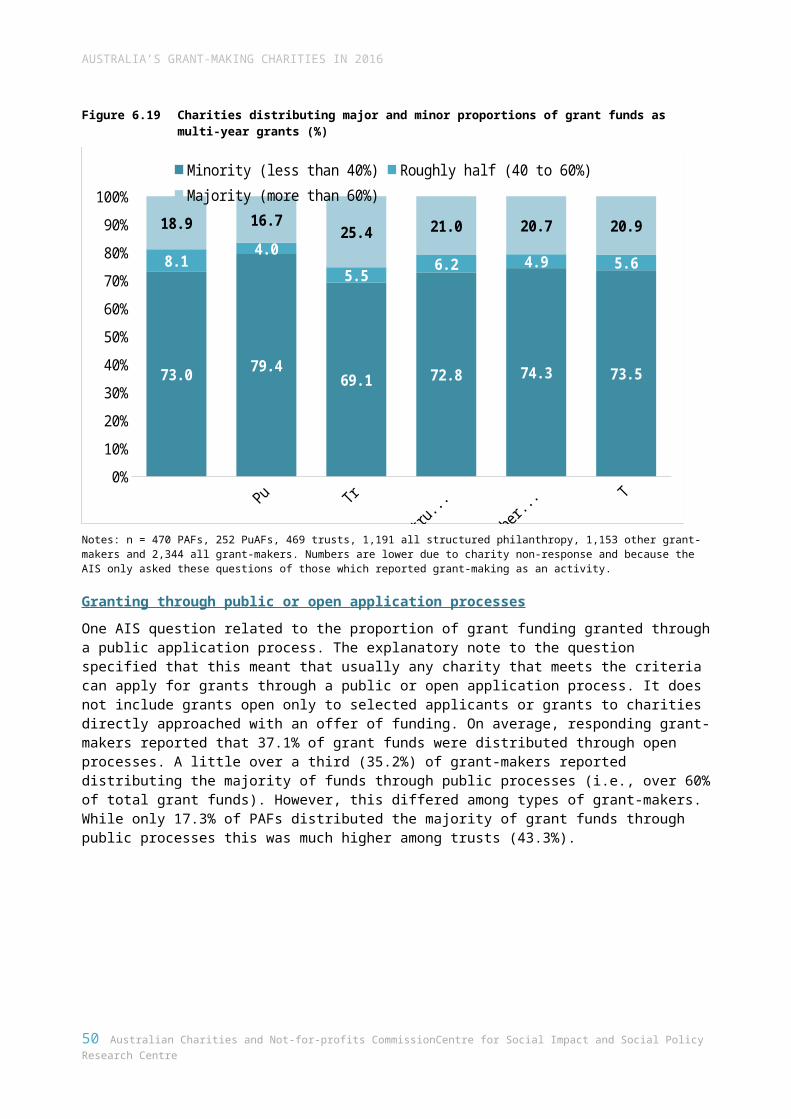
AUSTRALIA’S GRANT-MAKING CHARITIES IN 2016
Box 1 A guide to revenue sources as reported in the AIS
Government grants are a key source of income for Australia’s charities, especially in sub-sectors where charities are contracted to provide government programs or services. A government grant is financial assistance provided by the Commonwealth, state or territory government or a local government body to a charity for a purpose such as to provide goods or services to others in accordance with the terms of the grant. This includes general purpose grants and grants received under a contract with the government to provide specified services.
A donation or bequest is when a charity receives voluntary support (in cash or gifts in kind) and there is no material benefit to the donor. For example, it would not be a donation if the person giving money to the charity does so because they were the highest bidder at a charity auction. Donations and bequests include donations (both tax deductible and non-tax deductible) from public collections, fundraising, members (but not membership fees), supporters, employees, philanthropic trusts and corporations and bequests and memorials.
Other revenue/receipts includes other funding received as part of a charity’s ordinary operations. It may include interest or dividends earned from a corpus. It may also include revenue from selling goods or services (e.g., user fees or proceeds from a raffle), revenue from lotteries and gaming, non-government grants, membership fees, other fees and charges, sponsorship and licencing fees and income from rent.
Adapted from ACNC 2016.
Total revenueIn 2016, Australia’s grant-making charities reported approximately $16.5 billion in revenue (see Figure 9.29). Grant-making charities reported, on average, $1.6 million in revenue, less than the figure across the whole charity sector ($2.8 million). Median figures, based on reported data only, show many grant-making charities had much less than the mean figure, indicating that revenue is concentrated in a small number of grant-making charities. Half of grant-making charities had revenues under $52,411, although this varied across grant-making categories.
Figure 9.29 shows differences among grant-makers. In particular, PAFs and trusts tended to be smaller than other categories of grant-makers, with average total annual revenues of under $1 million. PuAFs and other grant-makers tended to be larger, reporting revenues over $1 million. It is important to note revenue figures exclude other income, which are of relative importance to the income of PAFs.Figure 9.29 Total revenue of grant-making charities in 2016
Number Mean ($) Median ($) Sum ($) % of total revenue
PAFs 1,318 881,517 112,486 1,161,839,009 7.0PuAFs 1,224 1,731,641 74,090 2,119,528,396 12.8Trusts 4,102 976,465 30,022 4,005,457,388 24.2All structured philanthropy 6,644 1,096,753 52,870 7,286,824,793 44.1
Other grant-makers 3,754 2,459,722 52,016 9,233,798,005 55.9All grant-makers 10,398 1,588,827 52,411 16,520,622,798 100.0
Notes: All figures include estimated data for charities that did not provided financial reports, except medians which are based on reported data only. For median, n = 1,297 PAFs, 1,163 PuAFs, 3,059 other trusts, 5,519 all structured philanthropy, 3,629 other grant-makers and 9,148 all grant-makers.
Concentration of revenueGrant-making charities’ revenue was concentrated among a relatively small number of very large charities. This is shown in Figure 9.30. The largest 1% of charities shared $11.2 billion or 67.8% of grant-makers’ total revenue. Reflecting the very small revenue of most grant-making charities, the combined revenue of the smallest half of grant-making charities accounted for only 0.5% of the
50 Australian Charities and Not-for-profits Commission Centre for Social Impact and Social Policy Research Centre
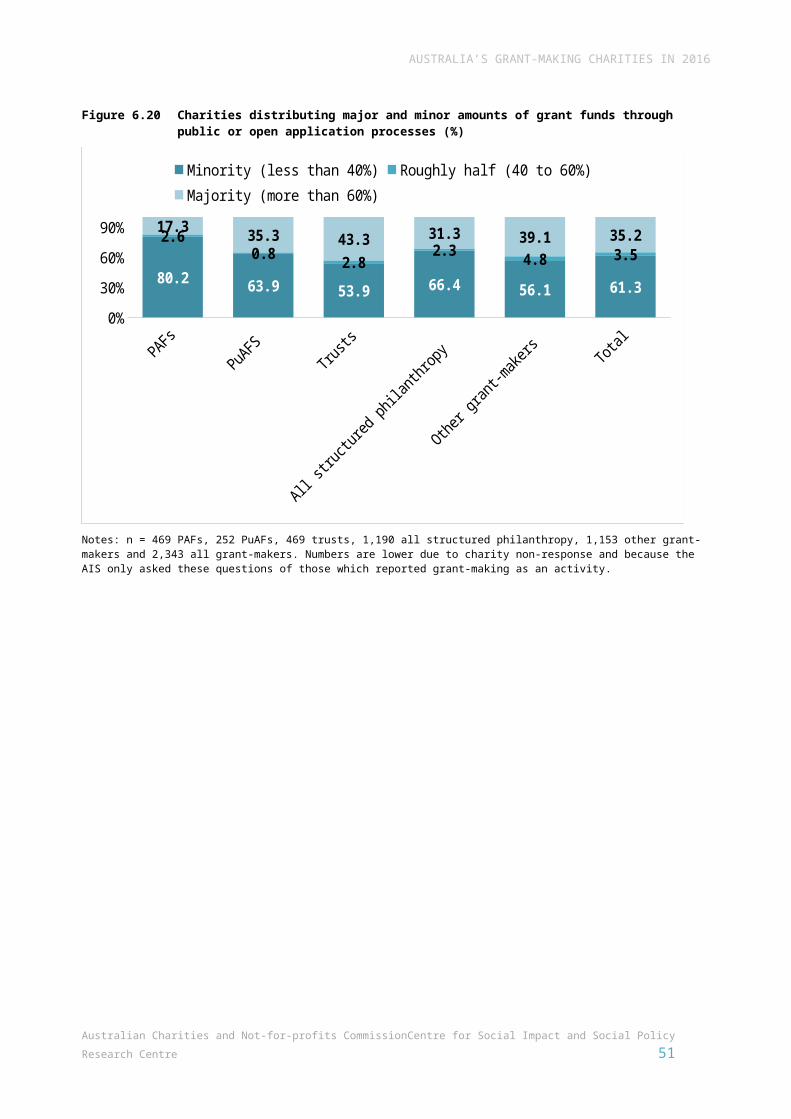
AUSTRALIA’S GRANT-MAKING CHARITIES IN 2016
sector’s total revenue. As this is for the whole charity, it reflects total revenue associated with all the charity’s activities and not only the portion association with grant-making.Figure 9.30 Concentration of revenue among grant-making charities in 2016
Number Percent of revenue Mean revenue ($) Total revenue ($)
Top 1% of grant-making charities 104 67.8 107,650,516 11,195,653,653Top 10% of grant-making charities 1,040 92.9 14,750,081 15,340,084,749
Top 20% of grant-making charities 2,080 96.8 7,688,851 15,992,810,119
Top 50% of grant-making charities 5,199 99.5 3,162,331 16,440,961,258
Bottom 50% of grant-making charities 5,199 0.5 15,322 79,661,540
All grant-making charities 10,398 100.0 1,588,827 16,520,622,798
Notes: n = 10,398.
Revenue sourcesAs shown in Figure 9.28, among all grant-making charities government grants accounted for 30.0% of revenue. Government grants were reported across different types of grant-makers, although the proportion of PAFs and PuAFs which received government funds was small (see Figure 9.32 and Figure 9.33). This likely reflects how, as well as attracting and disbursing donor funds, many grant-making charities are involved in other charitable activities for which they receive government funding.
Donations and bequests accounted for 24.8% of revenue on average, while other revenue accounted for 45.2%. However, this differed among different types of grant-makers. This is shown in Appendix A, with a summary in Figure 9.31. This shows how a relatively high proportion of the revenue of PAFs and PuAFs came from donations and bequests. Trusts had a relatively high proportion of revenue coming from other revenue sources (63.6%), which includes revenue from sales, fees and charges and investment income.Figure 9.31 Total revenue by source (%)
PAFs
PuAFS Trusts
All stru
ctured phila
nthropy
Other grant-m
akers
All grant-m
akers
0%10%20%30%40%50%60%70%80%90%
100%
0.127.4 17.0 17.4
39.9 30.0
66.137.4
19.332.0
19.124.8
33.7 35.2
63.650.6 41.0 45.2
Government grants Donations and bequests Other revenue
Notes: n = 10,398.
Australian Charities and Not-for-profits Commission Centre for Social Impact and Social Policy Research Centre 51
AUSTRALIA’S GRANT-MAKING CHARITIES IN 2016
Further analysis of revenue sources is shown in Figure 9.32. This shows the proportion of each type of grant-making charity which received any revenue from each source. Only a small proportion of PAFs (0.7%) and PuAFs (7.5%) received government grants, while there was more consistent receipt of other revenue across grant-making categories. Donations and bequests were reported by more than half of grant-making charities in each category in 2016, ranging from 50.9% of trusts to 79% of PuAFs.Figure 9.32 Grant-making charities with any revenue from each source (%)
PAFsPuAFS
Trusts
All structu
...
Other gr...
All gra...
0
10
20
30
40
50
60
70
80
90
100
0.77.5
28.7
19.2 21 19.9
56.4
79.0
50.957.2
65.460.1
84.6
74.1
86.3 83.7 84.3 83.9
Government grants Donations and bequests Other revenue
Notes: n = 10,398.
Figure 9.33 illustrates a further feature of interest among grant-making charities. This shows that while 35.7% of grant-makers received more than half of their total income from donations and bequests, this varied from 26.1% of trusts to 54.6% of PuAFs. Note that this figure is based on total income and so includes revenue and other income. A list of grant-makers with the highest receipt of donations and bequests for 2016 is in Appendix B.
52 Australian Charities and Not-for-profits Commission Centre for Social Impact and Social Policy Research Centre
AUSTRALIA’S GRANT-MAKING CHARITIES IN 2016
Figure 9.33 Charities for which donations and bequests comprised more than 50% of total income (%)
PAFsPuAFs
Trusts
All stru
ctured phila
nthropy
Other grant-m
akers
All grant-m
akers
0
10
20
30
40
50
60
43.6
54.6
26.1
34.8 37.4 35.7
Notes: n = 10,398.
Australian Charities and Not-for-profits Commission Centre for Social Impact and Social Policy Research Centre 53
10. Assets held by grant-making charities
The assets of Australia’s grant-making charities are important, providing resources to secure and sustain their future operations and grant-making capacity. In total, Australia’s grant-making charities held assets worth $56.5 billion in 2016. This accounted for around 28.6% of the total value of assets held by Australia’s charities ($197.6 billion).
Figure 10.34 and Figure 10.35 show the mean value of assets of grant-making charities. On average, Australia’s grant-making charities held $5.5 million in assets, however, this was higher for PAFs ($7.8 million) and lower for trusts ($4.3 million). Median figures were much lower, indicating that half of PAFs had assets of under $1.0 million while half of PuAFs had assets under $146,239. Figure 10.35 provides a visual depiction of the mean value of grant-makers’ assets in 2016. Figure 10.36 shows the concentration of assets—the top 1% of grant-making charities had 64.6% of grant-makers’ total assets and the top 10% had 90.1%. Information about net assets is contained in Section 12.Figure 10.34 Key indicators of total and average assets
Number Mean ($) Sum ($) Median ($)PAFs 1,317 7,754,439 10,212,596,594 1,020,983PuAFs 1,219 5,033,691 6,136,069,925 146,239Trusts 4,075 4,264,636 17,378,392,737 316,698All structured philanthropy 6,611 5,101,658 33,727,059,256 432,944Other grant-makers 3,733 6,096,468 22,758,114,974 117,102Total 10,344 5,460,670 56,485,174,230 268,606
Notes: n = 10,344 charities with reported balance sheet data. Data missing for 54 charities. Number for median is provided in Figure A.13.
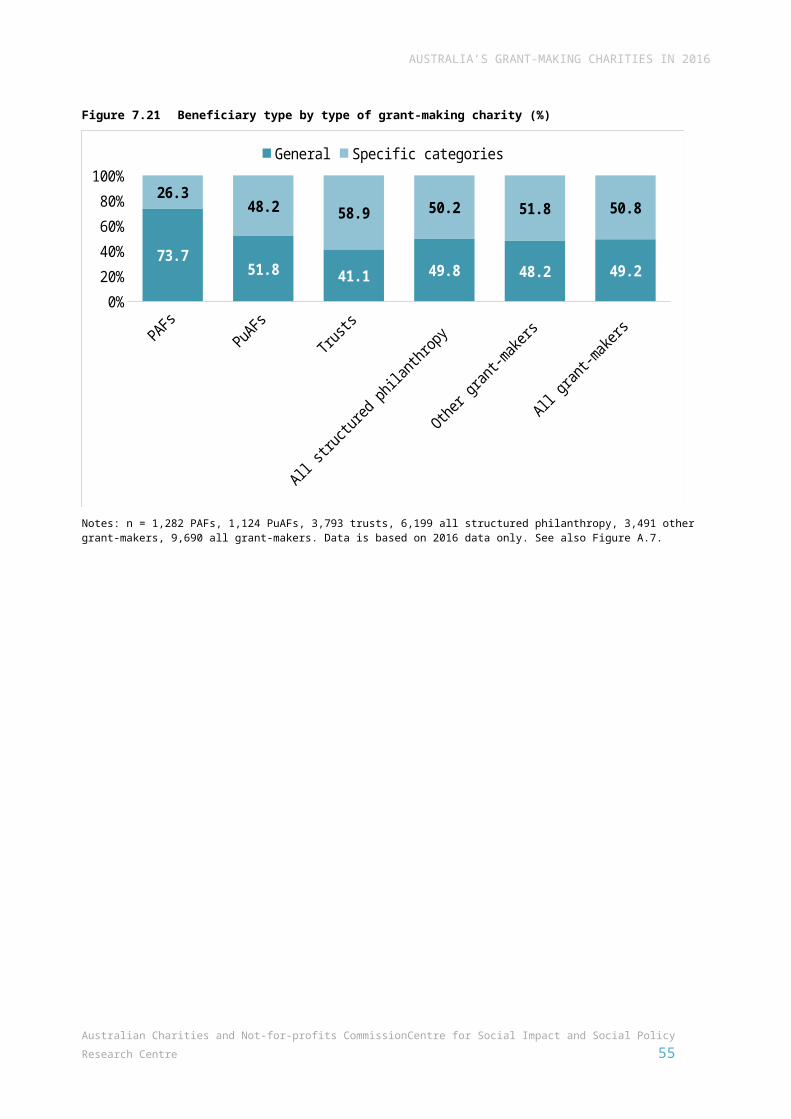
AUSTRALIA’S GRANT-MAKING CHARITIES IN 2016
Figure 10.35 Mean value of total assets ($million)
PAFsPuAFs
Trusts
All stru
ctur..
.
Other gra...
All gran...
$-
$1,000,000
$2,000,000
$3,000,000
$4,000,000
$5,000,000
$6,000,000
$7,000,000
$8,000,000
$9,000,000
7,754,439.0
5,033,691.04,264,636.0
5,101,658.0
6,096,468.05,460,670.0
Notes: n = 10,344 charities with reported balance sheet data. Data missing for 54 charities.
Figure 10.36 Concentration of total assets among grant-making charities
Number% of grant-
makers’ total assets
Mean assets ($) Total assets ($)
Top 1% of grant-making charities 103 64.6 354,142,073 36,476,633,472
Top 10% of grant-making charities 1,034 90.1 49,231,695 50,905,572,307
Top 20% of grant-making charities 2,069 95.7 26,131,886 54,066,871,807
Top 50% of grant-making charities 5,172 99.7 10,887,552 56,310,418,632
Bottom 50% of grant-making charities 5,172 0.3 33,789 174,755,598
All grant-making charities 10,344 100.0 5,460,670 56,485,174,230
Notes: n = 10,344 charities with reported balance sheet data. Data missing for 54 charities.
Australian Charities and Not-for-profits Commission Centre for Social Impact and Social Policy Research Centre 55
11. How did grant-making charities allocate their funds?
As part of the AIS, charities were required to specify how they allocate their funds. This is captured as part of the income statement under expenses/payments. Categories were:
Employee expenses/payments Grants and donations made by the registered entity for use in Australia Grants and donations made by the registered entity for use outside Australia Other expenses/payments.
These were then added to indicate total expenses.
Total expensesTogether, Australia’s grant-making charities had total expenses of $14.7 billion in the 2016 reporting period. Figure 11.37 shows differences in the mean and median level of expenditure. A high proportion of expenditure came from outside of structured philanthropy, but this includes spending on all the activities of a charity in addition to their grant-making function. Further information about the composition of expenditure and levels of expenditure on grants is below.Figure 11.37 Mean and median total expenditure ($)
Number Mean ($) Median ($) Sum ($)% of total
spending by grant-makers
PAFs 1,318 440,751 88,135 580,910,321 3.9PuAFs 1,224 1,357,085 55,064 1,661,072,060 11.3Trusts 4,102 884,773 30,488 3,629,338,662 24.6All structured philanthropy 6,644 883,703 48,491 5,871,321,043 39.9
Other grant-makers 3,754 2,358,457 54,708 8,853,646,872 60.1Total 10,398 1,416,135 51,256 14,724,967,915 100.0
Notes: All figures include estimated data for charities that did not provide financial reports, except medians which are based on reported data only. For median, n = 1,297 PAFs, 1,163 PuAFs, 3,059 other trusts, 5,519 all structured philanthropy, 3,629 other grant-makers and 9,148 all grant-makers.
Composition of expenditureAs well as spending on grants and donations, many grant-making charities also incur costs for their other charitable operations or activities including for paid employees or other elements of program delivery. Overall, grants and donations comprised 27.4% of grant-making charities’ total expenditure. However, as shown in Figure 11.38, the proportion spent on grant-making differed across the categories of grant-makers. This demonstrates diversity within the grant-making sector, in that some grant-making charities have expenditure which is highly focused on grants while others also spend on other activities such as service delivery.
AUSTRALIA’S GRANT-MAKING CHARITIES IN 2016
Among PAFs, 83.1% of expenses were allocated to grants and donations, much higher than in trusts (16.8%) and across all grant-making charities (28.3%). As could be expected with such a high proportion of expenses allocated to grants and donations, employee expenses were low among PAFs. This reflects the data in Section 8, which showed that 95% of PAFs operated with no paid staff. Figures for other categories of grant-makers are likely shaped by the presence of small numbers of large employers as, overall, 80.8% of grant-making charities had no paid staff. It is also important to remember that those that share an ABN with a parent charity will have higher employee expenses than an entity solely focused on grant-making.Figure 11.38 Composition of expenditure (%)
PAFs PuAFs Trusts All structured philanthropy
Other grant-makers TOTAL
Employee expenses 1.0 40.6 34.3 32.8 38.9 36.5
Grants and donations 83.1 26.2 16.8 26.0 28.3 27.4
Other 15.8 33.1 48.9 41.2 32.8 36.2
Total 100.0 100.0 100.0 100.0 100.0 100.0
Notes: n = 10,398. Full data is in Figure A.12. These figures include expenses across all a charity’s operations. Aggregate figures and proportions may be affected by data for large employers and grant-makers.
Expenditure on grants and donationsThe AIS captures expenditure on grants and donations made by the registered entity for use within or outside Australia. Almost three quarters (72.6%) of total grant-making charities’ spending on grants and donations was for use in Australia while 27.4% was for use outside Australia. This differed across categories of grant-makers (see Figure 11.39 and Figure 11.40)
While spending on grants and donations for use in Australia was high in the structured philanthropy sector (90.4% of grant spending), it was much lower among other grant-makers (61.7%) reflecting their stronger focus on giving for causes overseas.
Australian Charities and Not-for-profits Commission Centre for Social Impact and Social Policy Research Centre 57
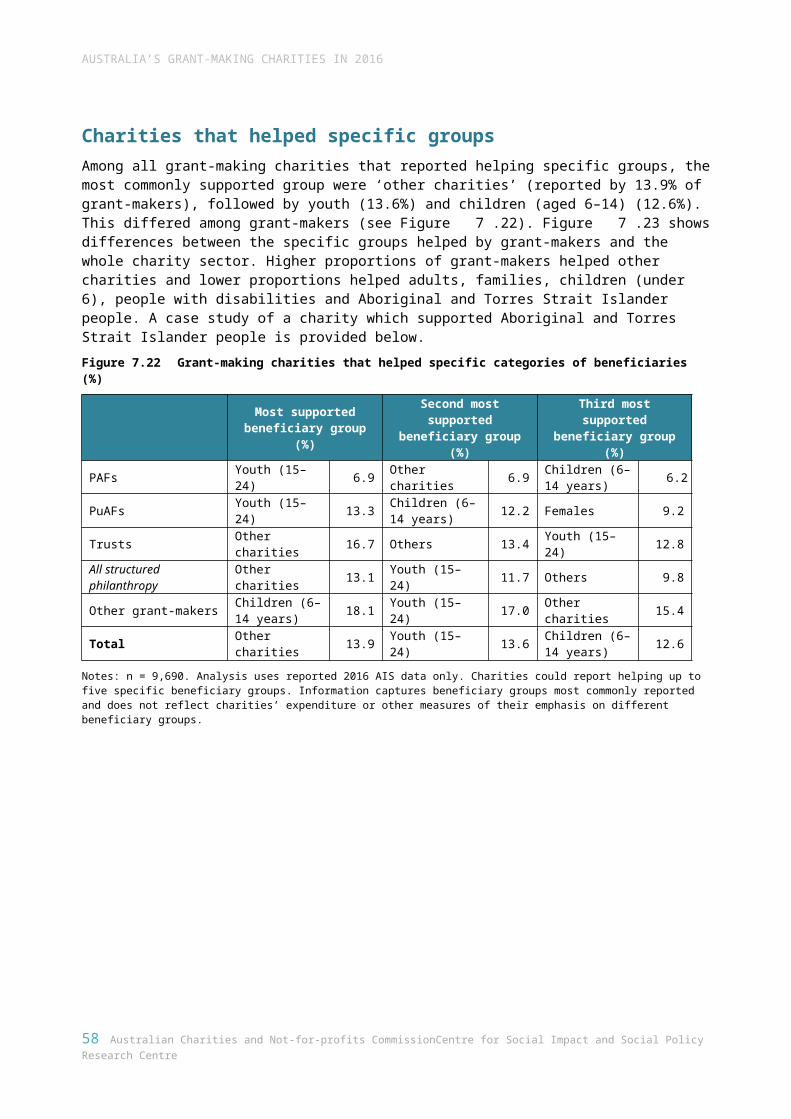
AUSTRALIA’S GRANT-MAKING CHARITIES IN 2016
Figure 11.39 Spending on grants and donations for use in and outside Australia ($)
For use in Australia For use outside Australia Total spending on grants
Mean Sum% of total
spending on grants
Mean Sum% of total
spending on grants
Mean Sum
PAFs 348,130 458,834,771 95.0 18,263 24,070,425 5 366,392 482,905,196
PuAFs 311,783 381,622,532 87.6 44,263 54,178,448 12.4 356,047 435,800,980
Trusts 131,967 541,326,937 88.8 16,677 68,409,546 11.2 148,644 609,736,483All structured philanthropy 207,975 1,381,784,240 90.4 22,074 146,658,419 9.6 230,049 1,528,442,659
Other grant-makers 411,050 1,543,082,111 61.7 255,331 958,510,780 38.3 666,381 2,501,592,891
Total 281,291 2,924,866,351 72.6 1,062,867,089 1,105,169,199 27.4 387,578 4,030,035,550
Notes: n = 1,318 PAFs, 1,224 PuAFs, 4,102 trusts, 6,644 all structured philanthropy, 3,754 other grant-makers and 10,398 all grant-makers.
58 Australian Charities and Not-for-profits Commission Centre for Social Impact and Social Policy Research Centre
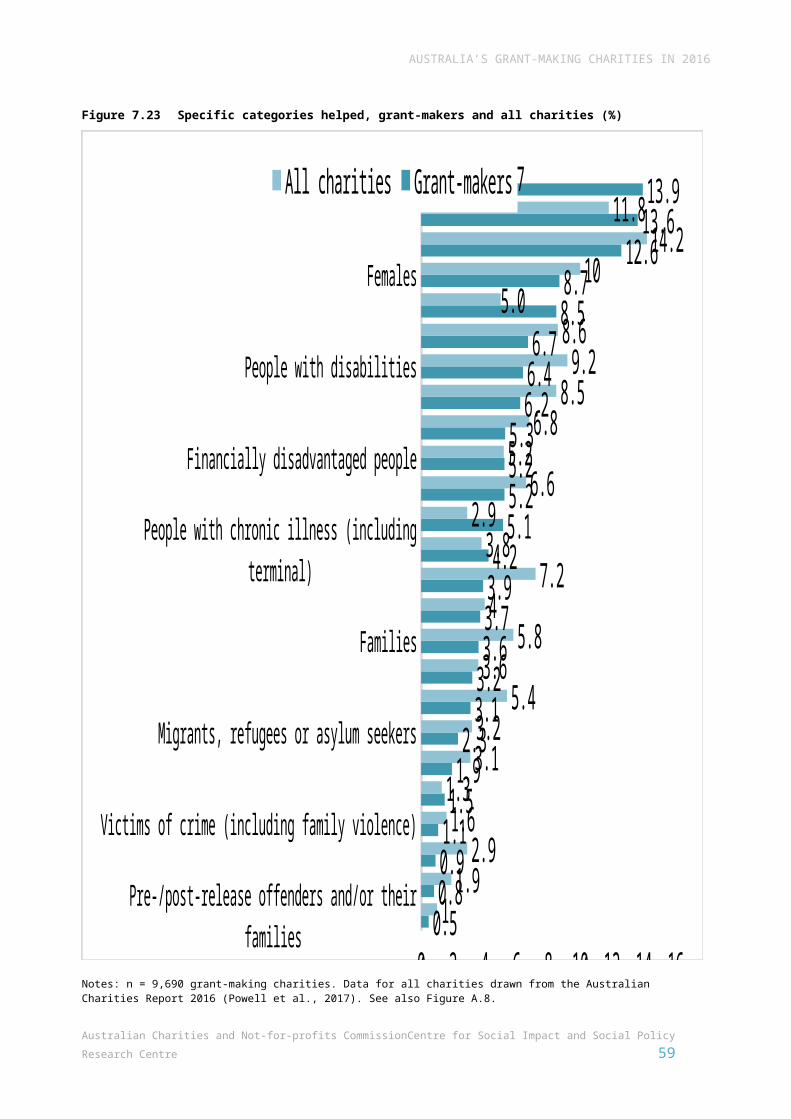
AUSTRALIA’S GRANT-MAKING CHARITIES IN 2016
Figure 11.40 Spending on grants and donations for use in and outside Australia (%)
PAFsPuAFs
Trusts
All stru
ct...
Other g...
All gra...
0%
10%
20%
30%
40%
50%
60%
70%
80%
90%
100%
95.087.6 88.8 90.4
61.772.6
5.012.4 11.2 9.6
38.327.4
For use in Australia For use outside Australia
Figure 11.41 shows the source of grant-makers’ total spending on grants and donations for use within and outside Australia. Of spending on grants for use in Australia, 52.8% was from charities outside the structured philanthropy sector. These other grant-makers were also responsible for 86.7% of spending on grants for use outside Australia. A list of grant-makers with the largest level of expenditure on grants for use in Australian and overseas is in Appendix B.Figure 11.41 Contribution of grant-makers to total spending on grants and donations for use in and
outside Australia (%)
For use in Australia For use outside Australia Total0%
10%
20%
30%
40%
50%
60%
70%
80%
90%
100%
15.7 12.0
13.0
4.9
10.8
18.5
6.2
15.1
52.8
86.7
62.1
PAFs PuAFs Trusts Other grant-makers
Australian Charities and Not-for-profits Commission Centre for Social Impact and Social Policy Research Centre 59
AUSTRALIA’S GRANT-MAKING CHARITIES IN 2016
Concentration of expenditureAs with revenue, grant-making charities’ total expenditure is highly concentrated. As shown in Figure 11.42, the top 1% of grant-making charities (104 charities) accounted for 70.4% of grant-making charities’ total expenditure, while the top 10% accounted for 93.0%.Figure 11.42 Concentration of expenditure
Number % of expenditure Mean expenditure ($)
Total expenditure ($)
Top 1% of grant-making charities 104 70.4 99,716,243.8 10,370,489,354
Top 10% of grant-making charities 1,040 93.0 13,173,445.7 13,700,383,538
Top 20% of grant-making charities 2,080 96.7 6,844,444.7 14,236,444,891
Top 50% of grant-making charities 5,199 99.4 2,815,811.6 14,639,404,709
Bottom 50% of grant-making charities 5,199 0.6 16,458 85,563,206
All grant-making charities 10,398 100.0 1,416,134.6 14,724,967,915
60 Australian Charities and Not-for-profits Commission Centre for Social Impact and Social Policy Research Centre
12. The financial status of grant-making charities
Like other charities, grant-makers have diverse financial arrangements and strategies. While some may have asset-based strategies aimed at distributing grants in perpetuity, others may spend down invested funds over a specific period. Others may pursue more intermittent revenue-generating and grant-making activity or distribute funds for specific purposes on an ad hoc basis. Given their varied arrangements and strategies, there is no clear standard against which to assess the financial status for grant-making charities. Like other charities, their financial characteristics and performance depend on a range of factors and should be interpreted in the context of the individual charity’s operating environment, strategic goals and purpose. Further, financial status indicators do not reflect a charity’s impact or effectiveness as a grant-maker or in any other capacity.
With these caveats in mind, we use the common financial status indicators used in the Australian Charities Report 2016 to explore differences in orientation and exposure to risk among different types of grant-making charities. While there are many possible indicators for measuring charity finances, in this section we use information available from the AIS to calculate common accounting ratios:
- number of revenue streams (to assess revenue diversification)- net income and net income ratio indicators (to assess position of charities in surplus and
deficit)- net assets and a net asset ratio (to assess assets in relation to liabilities)- expenses coverage ratio.
These measures are not the only indicators for individual charities but are generally considered helpful for assessing trends across a large number of organisations.18 In interpreting these data the particular arrangements in the structured philanthropy sector should be taken into account. In particular, these charities often seek to achieve charitable purpose through attracting donor funds to hold as assets to generate funding for grant-making which impacts on ratios.
Revenue diversificationAs discussed in the Australian Charities Report 2016, dependence on a narrow range of revenue sources is often considered a sign of financial vulnerability and diversified revenues are usually seen as more flexible and sustainable. Figure 12.43 shows that 45.3% of all grant-makers had one revenue source, higher than for all charities (31.3%). There were differences among grant-makers in the proportion reporting only one revenue source. Around half of PAFs and trusts had only one revenue source (50.4% and 50.9% respectively), while the figure was much lower for PuAFs (31.7%). However, trusts had the highest proportion reporting three revenue sources (29.5%), higher than the figure for all charities (23.5%).
18 Background discussion about each indicator is in the Australian Charities Report 2016.
AUSTRALIA’S GRANT-MAKING CHARITIES IN 2016
Figure 12.43 Revenue diversification (%)
PAFsPuAFs
Trusts
All structu
red philanthropy
Other grant-m
akers
All grant-m
akers
All chariti
es0%
10%20%30%40%50%60%70%80%90%
100%
50.431.7
50.9 47.3 41.9 45.331.3
48.860.4 19.6 32.9 42.5 36.5
45.2
0.7 7.929.5 19.8 15.6 18.2 23.5
One revenue source Two revenue sources Three revenue sources
Notes: n = 10,398.
Net income
A charity’s net income ratio summarises the ratio of the charity’s surplus or deficit to its total income for the financial year, that is, whether charities are making a profit or loss.19 Of course, there are a range of factors that may affect a charity’s net income, especially for charities which may be in focused phases of attracting donations to build up resources or, conversely, grant-making to spend down their corpus.
As shown in aggregate, grant-making charities had a net income ratio of 26.1%, although this was higher for PAFs (85.8%) and lower for trusts (13.4%) and other grant-makers (6.7%). This is shown in Figure 12.44.20 By comparison, the aggregate net income ratio for all charities was 8.9%, suggesting a relative tendency to growth, at least in the structured philanthropy sector.
19 In the ACNC’s AIS this financial data has different labels to those used here: ‘Net Income’ is Net Surplus/Deficit and ‘Total Income’ is Total Gross Income for Medium and Large charities and Total Income/Receipts for Small charities.20 Throughout this section we examine net income, assets and ratios as aggregates.
62 Australian Charities and Not-for-profits Commission Centre for Social Impact and Social Policy Research Centre
Net income = total income – total expenses
Net income ratio = net income/total income (%)
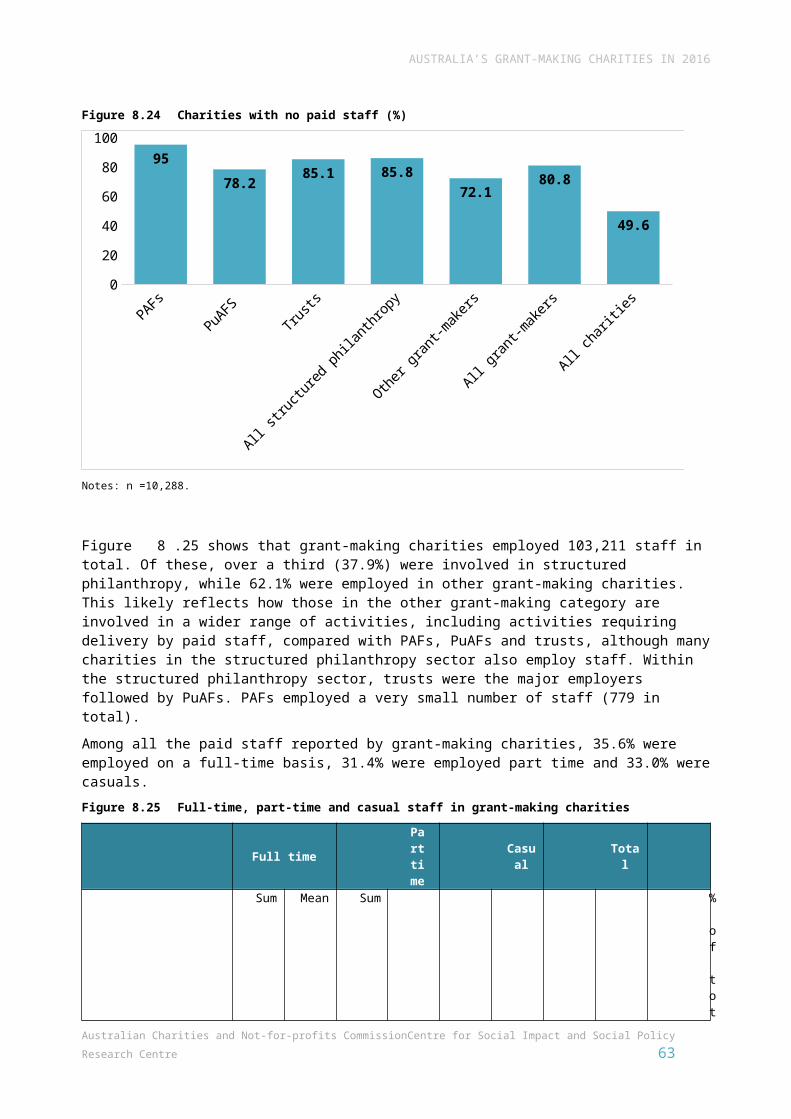
AUSTRALIA’S GRANT-MAKING CHARITIES IN 2016
Figure 12.44 Summary of income and expenses ($)
Income and expenses PAFs PuAFs Trusts All structured
philanthropyOther grant-
makers TOTAL
Total income 4,095,285,639 2,158,008,224 4,189,492,338 10,442,786,201 9,492,499,954 19,935,286,15
5
Total expenses 580,910,321 1,661,072,060 3,629,338,662 5,871,321,043 8,853,646,872 14,724,967,915
Aggregate net income 3,514,375,318 496,936,164 560,153,676 4,571,465,158 638,853,082 5,210,318,240
Aggregate net income ratio (%)
85.8 23.0 13.4 43.8 6.7 26.1
Notes: n = 10,398.
Figure 12.45 shows the proportion of grant-makers that had a net income ratio of between –5% and 5% (indicating they roughly broke even) and those with a net income ratio above or below this range. Among all grant-makers, a little over half (50.2%) had a net income ratio greater than 5% while 28.6% had a net income ratio of less than –5%. This differed across types of grant-makers, with a relatively higher proportion of PAFs having a net income ratio of less than –5% (likely indicating spending down a corpus) and a relatively high proportion of trusts and other grant-makers operating within the –5% to 5% range.Figure 12.45 Net income ratio (%)
PAFs Pu Tr
All struc...
Other ...
All gr...
0%
10%
20%
30%
40%
50%
60%
70%
80%
90%
100%
40.529.3 21.7 26.9 31.5 28.6
6.912.6 25.5 19.4
24.221.2
52.6 58.1 52.9 53.844.3 50.2
% of charities with a net income ratio less than 5%% of charities with a net income ratio between -5% and +5%% of charities with a net income ratio greater than 5%
Notes: n = 1,290 PAFs, 1,136 PuAFs, 3,905 trusts, 6,331 all structured philanthropy, 3,723 other grant-makers and 10,054 all grant-makers. Excludes 344 charities with zero income for which the ratio was not calculated.
Australian Charities and Not-for-profits Commission Centre for Social Impact and Social Policy Research Centre 63
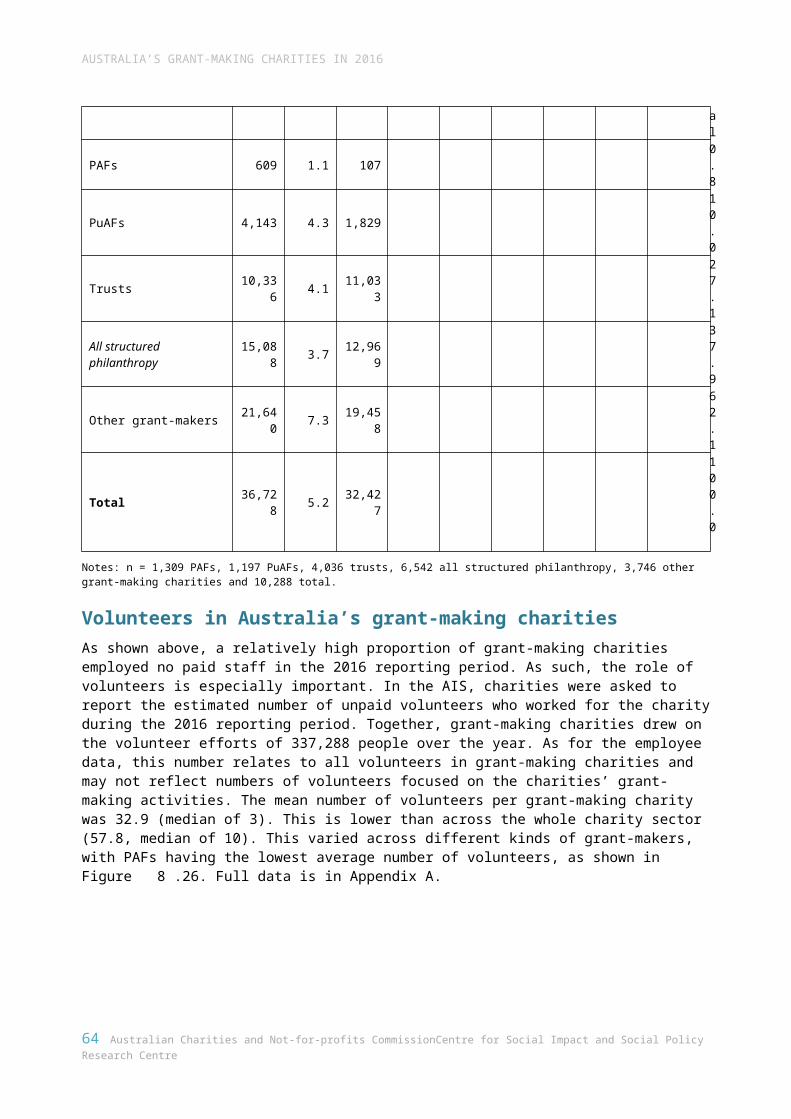
AUSTRALIA’S GRANT-MAKING CHARITIES IN 2016
Asset ratios
Assets are resources charities or other organisations own and can use to produce value. Net assets are calculated as total assets minus total liabilities, while the asset ratio is the ratio of total assets to total liabilities. We used net assets to calculate an expense coverage ratio expressed in months. This captures the number of months net assets could, hypothetically, cover expenses.
In 2016, Australia’s grant-making charities reported net assets of $45.5 billion with an asset ratio of 80.6, indicating assets are over 80 times the value of liabilities. This is much higher than the asset ratio across Australia’s charities (3.3%), reflecting the importance of assets to grant-making charities’ activities and capacity to achieve purpose.Figure 12.46 Summary of assets and liabilities ($)
Assets and liabilities PAFs PuAFs Trusts All structured
philanthropyOther grant-
makers TOTAL
Total Assets 10,212,596,594 6,136,069,925 17,378,392,737 33,727,059,256 22,758,114,974 56,485,174,230
Total Liabilities 1,131,926,362 633,160,438 2,446,067,045 4,211,153,845 6,756,689,120 10,967,842,965Aggregate Net assets 9,080,670,232 5,502,909,487 14,932,325,692 29,515,905,411 16,001,425,854 45,517,331,265
Aggregate net asset ratio (%) 88.9 89.7 85.9 87.5 70.3 80.6
Notes: n = 10,344. Uses reported data only and excludes charities with missing balance sheet data.
Net assets were also compared with expenses to calculate a measure of charities’ capacity to cover expenses. Figure 12.47 shows the proportion of grant-makers with net assets to cover more than five years of expenses, between six months and five years of expenses and less than six months of expenses. This shows a high proportion of PAFs had assets to cover five years or more of expenses (80.1%), compared with 41.5% of PuAFs and 49.3% of trusts. A third of other grant-makers had net assets to cover this level of expenses.
64 Australian Charities and Not-for-profits Commission Centre for Social Impact and Social Policy Research Centre
Net assets = total assets – total liabilities
Asset ratio = total assets/total liabilities
Expense coverage = Net assets/total expenses (months)
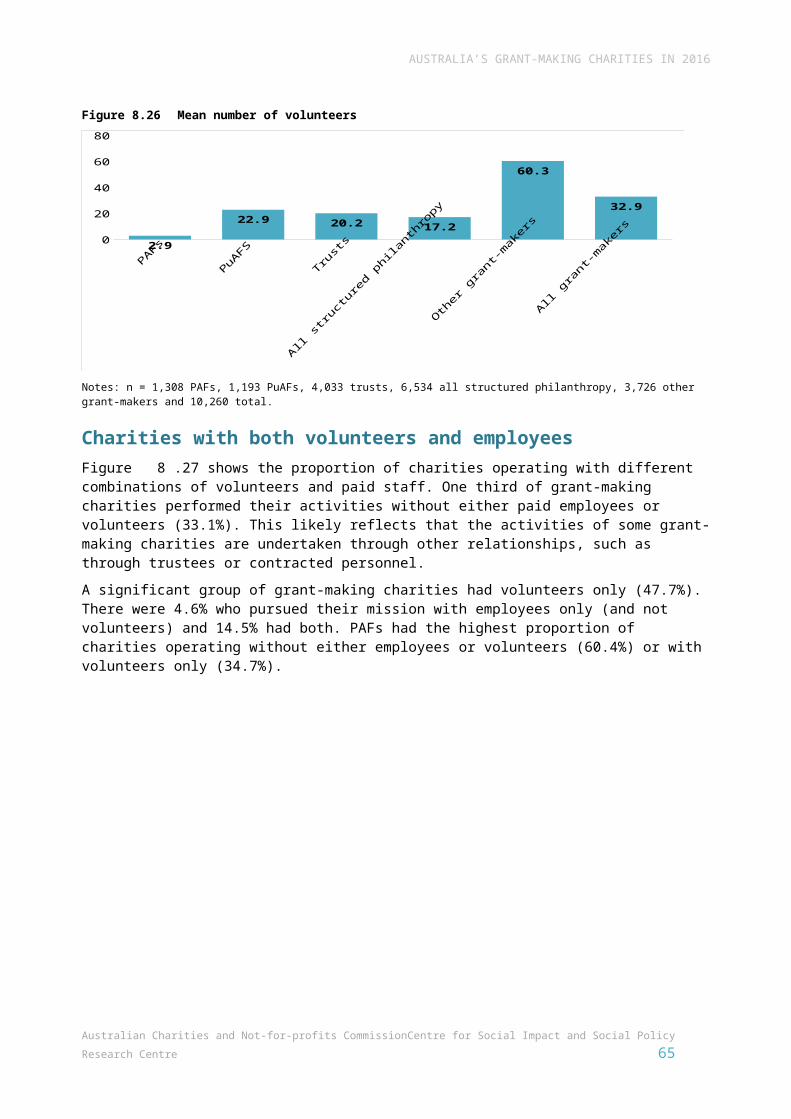
AUSTRALIA’S GRANT-MAKING CHARITIES IN 2016
Figure 12.47 Expense coverage ratio (%)
PAFsPuAFs
Trusts
All structu
...
Other gr...
All gra...
0%
10%
20%
30%
40%
50%
60%
70%
80%
90%
100%
7
29.1 35.8 28.2 33.1 30.312.9
29.3 14.916.8
33.823.4
80.1
41.5 49.3 53.4
33.246.3
Net assets cover for less than 6 months of expensesNet assets cover for 6 months to 5 years of expensesNet assets cover for 5 years or more of expenses
Notes: n = 1,258 PAFs, 1,091 PuAFs, 3,731 trusts, 6,080 all structured philanthropy, 3,718 other grant-makers and 9,798 all grant-makers. Uses reported data only and excludes charities with missing balance sheet data.
Australian Charities and Not-for-profits Commission Centre for Social Impact and Social Policy Research Centre 65
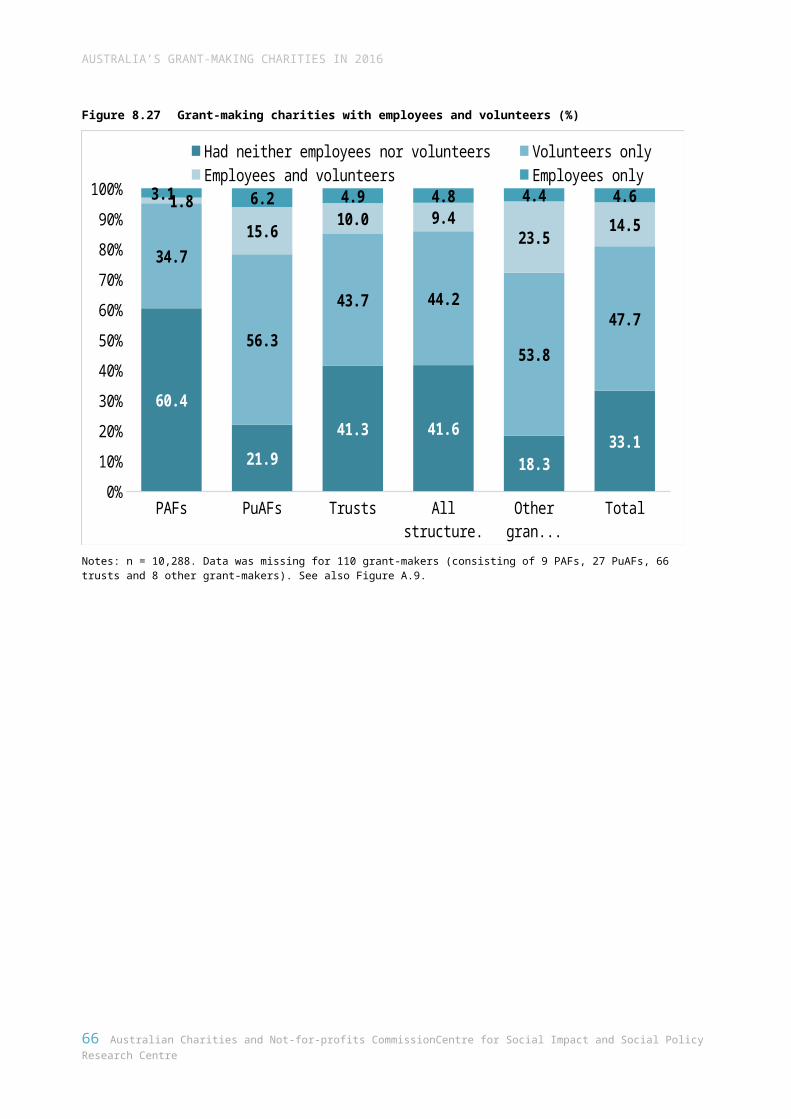
13. Change among grant-making charities 2015 to 2016
This section provides an indication of change among Australia’s grant-making charities from 2015 to 2016. It provides analysis of change in size, income, employment, spending and other indicators for the 9,977 grant-making charities that AIS data was available for both years. This represents 96% of the grant-making charities in the 2016 dataset. Because figures are based on a slightly smaller sample, there may be some minor differences in figures reported for the full 10,398 elsewhere in this report. Analysis for structured philanthropy and other grant-makers was not possible as retrospective information about PAFs, PuAFs and trusts was not available.
SizeFigure 13.48 shows the proportion of grant-making charities in each size category which were in a larger or smaller size category in 2016 or had stayed in the same size category. This shows that the majority of charities were in the same size category in both years. The vast majority of XS charities (85.5%) were still XS in 2016, while 12.3% had entered the small category and 2.1% were in a category larger than this. Of those which were small in 2015, 30.0% had moved into the XS category in 2016. Among those in the XL category and above, around two thirds remained in the same size category, and around a third were in a smaller category the following year. Only two charities had moved into the larger category. More data can be found in Appendix A.Figure 13.48 Percentage of grant-making charities that changed size category from 2015 to 2016
XS S M L XL XXL0%
10%
20%
30%
40%
50%
60%
70%
80%
90%
100%
85.5
62.569.2 72.4 67.8 66.7
14.57.5 8.5 3.3 1.0
30.0 22.257300710339424.222222222222231.155778894472433.3333333333333
Same size category in 2016 Smaller size category in 2016 Larger size category in 2016
AUSTRALIA’S GRANT-MAKING CHARITIES IN 2016
Notes: n = 9,977.
Change in numbers of paid staff and volunteersFigure 13.49 shows changes in paid staff and volunteers from 2015 to 2016. Total employment by grant-making charities grew by 15.8% and the mean number of employees grew from 9.1 to 10.6 per charity. The proportion of charities with no paid staff increased slightly, suggesting employment growth occurred among existing employers. The total number of volunteers fell by 14,287 and the mean fell from 38.2 per charity to 33.6. The proportion of grant-making charities with no volunteers increased by 2.3%, while the proportion operating with no employees or volunteers fell by 8.3%.Figure 13.49 Key indicators of change in staff and volunteers, 2015 and 2016
2015 2016 Difference Percent changeTotal number of employees 88,060 101,991 13,931 15.8Mean number of employees 9.1 10.6 1.5 15.8% charities with no employees 80.6 80.8 0.2 0.2Total number of volunteers 347,184 332,897 –14,287 –4.1Mean volunteers 38.2 33.6 –1.6 –4.1% with no volunteers 36.8 37.6 0.9 2.3% with no employees or volunteers 36.1 33.1 –3.0 –8.3
Notes: n = 9,642 (employees) and 9,087 (volunteers). Employment data was missing for 335 charities in the panel and volunteer data was missing for 890 charities.
Change in financial resourcesFigure 13.50 shows growth in total revenue (1.4%), total income (14.3%) and total expenditure (9.3%). The value of assets increased by 7.5%.Figure 13.50 Key financial indicators, 2015 to 2016 ($)
2015 2016 Difference Percent changeTotal revenue 15,812,341,261 16,034,230,954 221,889,693 1.4Total revenue (mean) 1,584,879 1,607,119 22,400 1.4Total gross income 16,996,505,097 19,420,467,896 2,423,962,799 14.3Total gross income (mean) 1,703,569 1,946,524 220,732 14.3Total assets 52,159,683,704 56,048,496,680 3,888,812,976 7.5Total assets (mean) 5,233,238 5,623,407 390,169 7.5Total expenditure 13,238,294,171 14,474,811,577 123,937 9.3Total expenditure (mean) 1,326,881 1,450,818 1,236,517,406 9.3
Notes: n = 9,977 for revenue, income and expenditure and 9,967 for assets (information about assets was missing for 10 charities in the panel).
Change in expenditure on grants and donationsFigure 13.51 shows a substantial increase in mean expenditure on grants and donations for use in Australia from 2015 to 2016, with growth of 28.2%. Expenditure on grants and donations for use outside Australia also grew, albeit by a lower amount (4.7%).
Australian Charities and Not-for-profits Commission Centre for Social Impact and Social Policy Research Centre 67
AUSTRALIA’S GRANT-MAKING CHARITIES IN 2016
Figure 13.51 Expenditure on grants and donations, 2015 to 2016 ($)
2015 2016 Difference Percent change
Expenditure on grants and donations for use in Australia 2,260,373,333 2,897,411,008 637,037,675 28.2
Expenditure on grants and donations for use in Australia (mean $)
226,558 290,409 63,851 28.2
Expenditure on grants and donations for use outside Australia 1,031,025,097 1,079,361,572 48,336,475 4.7
Expenditure on grants and donations for use outside Australia (mean $)
103,340 108,185 4,845 4.7
Notes: n = 9,977.
68 Australian Charities and Not-for-profits Commission Centre for Social Impact and Social Policy Research Centre
14. Conclusion
This report builds on the Australian Charities Report 2016 by analysing the characteristics of a significant sub-group of Australian charities: those focused on grant-making during 2016. The data collected by the ACNC through the AIS provides unprecedented opportunity for a detailed exploration of the characteristics and contribution of these charities, and to examine the substantial and interesting variation among different types of grant-makers. Together with the case studies, the AIS data attests to the social, economic and cultural contributions these charities make in Australia and internationally, both through attracting and distributing grants and through the many other charitable activities these charities perform.
Together, grant-making charities had total revenue of $16.5 billion and total assets of $56.5 billion.
Across their operations, they employed over 100,000 staff and harnessed contributions from over 300,000 volunteers.
Compared with the wider charity sector, a relatively high proportion of grant-making charities were very small, with 49.3% reporting revenues under $50,000 (compared with 39.8% of all charities).
Around four in five grant-makers (80.8%) operated with no paid staff, compared with 49.6% of all charities.
Grant-making charities spent over $4 billion on grants and donations, most of which was for use in Australia (72.6%).
Expenditure on grants for use in Australia grew by 28.2% from 2015 to 2016.
This report has also contributed new information about the purpose and structure of grants, using information specifically collected through the 2016 AIS. Among the findings:
around one third of grant-making charities (35.2%) allocated the majority of their grant funds through public or open application processes
around 20.9% structured the majority of funds as multi-year grants.
Although decisions about grant distributions are made by individual charities in the context of their strategy and operating environment, these data suggest there is likely to be some increased access to philanthropic grants nationally through expanded use of open application processes. It also shows scope to increase the use of multi-year grants, which allows grant recipients to achieve longer-term, more complex outcomes.
Complementing the data from the AIS, the case studies contribute further insight into these issues, showing a diverse range of highly sophisticated approaches to grant-making. The case studies demonstrate the careful consideration with which charities distribute their grants. For some, this involved balancing their distributions to include both sustained support for grant recipients through longer-term partnerships and supporting newly emerging causes and charities. Others focused on reducing administrative burden for recipient charities through common application and assessment processes, while yet others were engaged in enhancing local philanthropic capacity and professionalism, through knowledge sharing and partnership among grant-makers.
At a time when Australia’s philanthropy capacity is rapidly growing and developing, the information contained in this report is of critical importance. As the report has shown, Australia’s grant-making charities consist of many ancillary funds and trusts which are part of the structured philanthropy sector, along with many other types of charities, with substantial differences between and within these charities in terms of their size, location, age, assets, revenue sources and employment of staff. The
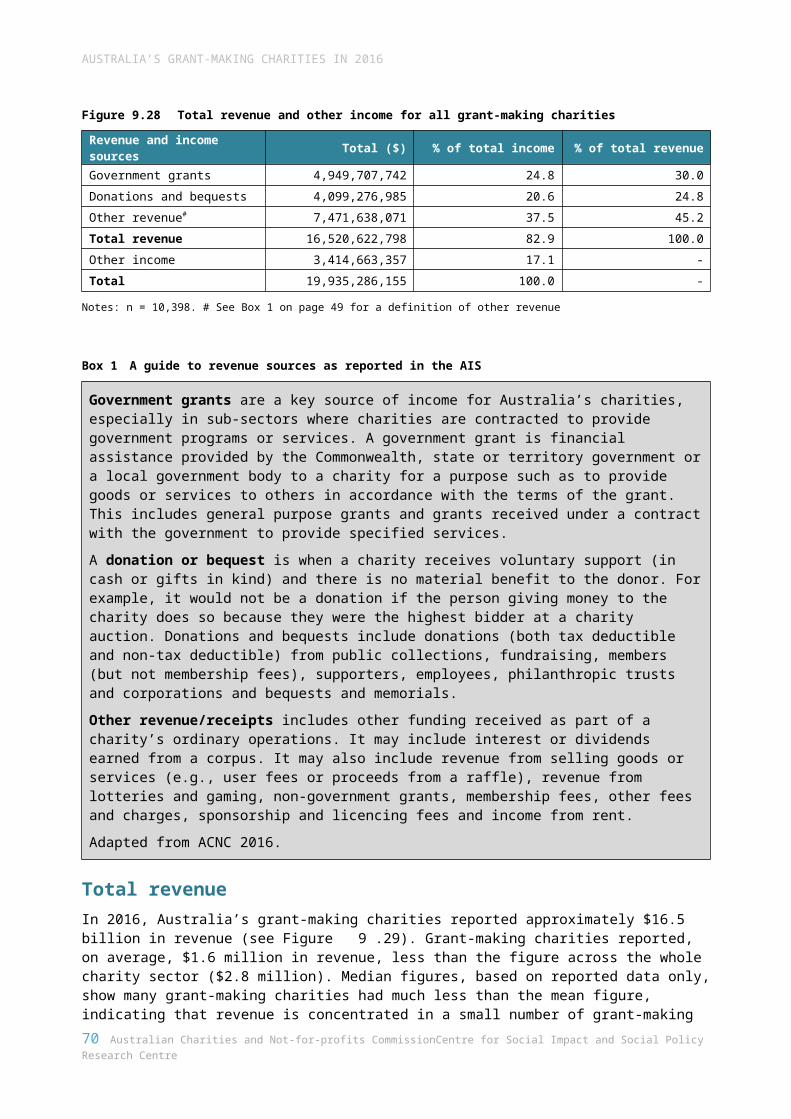
AUSTRALIA’S GRANT-MAKING CHARITIES IN 2016
data indicates that, as intended, ancillary fund structures are enabling charities to maintain a dedicated focus on grant-making. Although PAFs are not currently the major source of grant funds, ATO trends indicate their increasing popularity as a structure for private giving. By contrast, the AIS data shows how other grant-making structures (such as trusts) enable charities to engage in a range of other activities alongside grant-making. For these charities, higher levels of employment and more diverse expenditure patterns reflects their involvement in delivering services or other charitable activities in addition to grant-making.
While the AIS data is collected for the charity as a whole and does not necessarily distinguish between grant-making and the other activities a charity may be involved in, it nonetheless proves a high-quality data source to inform policy, regulation and research. The analysis provided in this report establishes a basis for further exploring the diverse forms and structures of grant-making in Australia, the role of grant-making in the wider charity sector and the ways grant-making complements and enhances the overall contribution and impact of Australia’s charities.
70 Australian Charities and Not-for-profits Commission Centre for Social Impact and Social Policy Research Centre
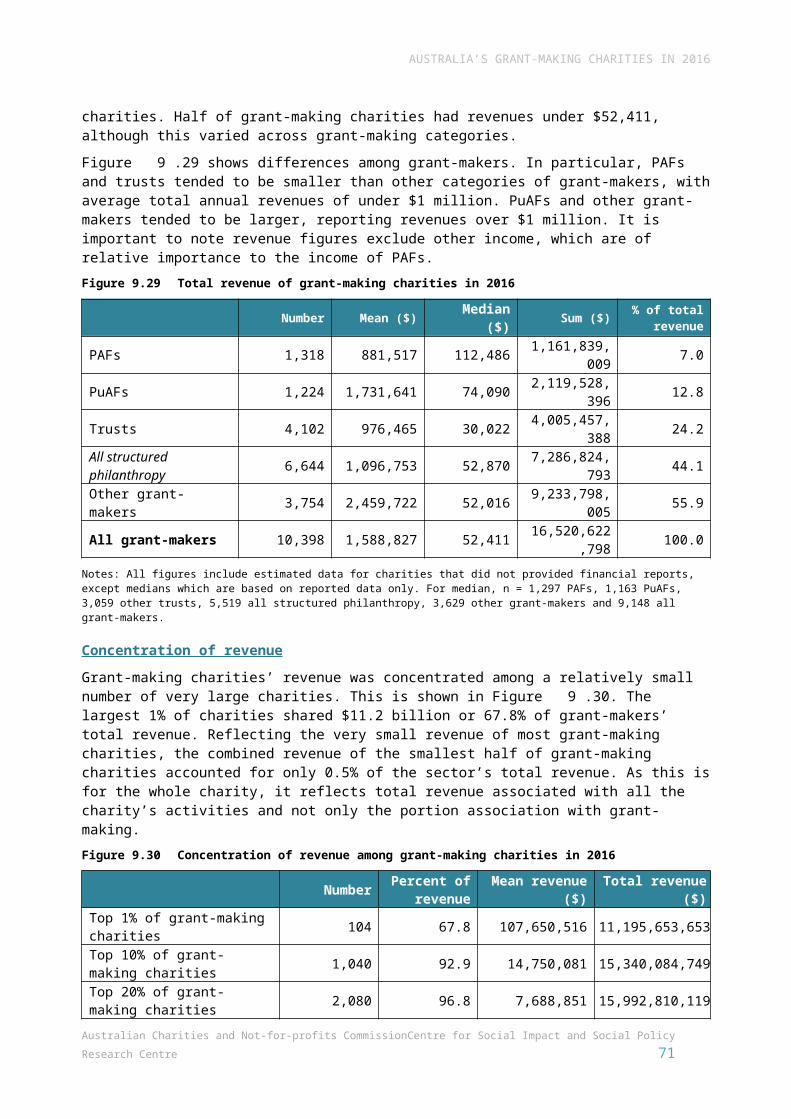
References
ABS 2011, Australian Statistical Geography Standard (ASGS): Volume 5 – Remoteness Structure, Cat. No. 1270.0.55.005. Canberra: Australian Bureau of Statistics, <http://www.abs.gov.au/ausstats/[email protected]/mf/1270.0.55.005?OpenDocument>
ACNC 2015a, Factsheet: charity size and revenue, <http://acnc.gov.au/ACNC/FTS/Fact_CharSize.aspx>.
ACNC 2015b, Factsheet: Who can Register with the ACNC, <http://acnc.gov.au/ACNC/FTS/Fact_Charity.aspx>
ACNC 2016, Annual information statement guide 2016, <http://www.acnc.gov.au/ACNC/Report/AIS_2016_Guide.aspx>.
Australian Taxation Office undated, Taxation Statistics 2014–15, Charities Table 4, https://data.gov.au/dataset/taxation-statistics-2014-15/resource/f60f9fa6-e7b0-430b-8b6a-e61c5961ea49
Baker, C, Barraket, J, Elmes, A, Williamson, A, Scaife, W and Crittall, M 2016, Philanthropy and philanthropists. Giving Australia 2016, report series commissioned by the Australian Government Department of Social Services, Centre for Social Impact, Swinburne University of Technology, The Australian Centre for Philanthropy and Nonprofit Studies, Queensland University of Technology and the Centre for Corporate Public Affairs.
McGregor-Lowndes, M 2014, Private Ancillary Funds (PAFs) 2000-2012, Australian Centre for Philanthropy and Nonprofit Studies Current Issues Information Sheet 2014/3, Queensland University of Technology Business School.
McLeod, J 2013, The PAF report – private ancillary funds after 12 years, JBWere, <http://www.anzwealthinsights.anz.com/content/dam/wealthinsights/English/Documents/PDF/the-paf-report-private-ancillary-funds-after-12-years-dec-2013.pdf>.
McLeod, J 2014a, ‘PAFs Unpacked: a brief history of private ancillary funds’, Generosity, 5 January 2014, <http://www.generositymag.com.au/pafs-unpacked-a-brief-history-of-private-ancillary-funds/>.
McLeod, J 2014b, The PAF report – record fund numbers and distributions, JBWere, <https://www.jbwere.com.au/content/dam/jbwere/documents/JBWere%20PAF%20Report%202014.pdf>.
Our Community 2017, Grants in Australia: annual research findings for Australian grantseekers and grantmakers, July 2017, <http://ourcommunity.com.au/files/aigm/GrantsInAustralia2017.pdf>.
Powell, A, Cortis, N, Ramia, I and Marjolin, A 2017, Australian charities report 2016, Centre for Social Impact and Social Policy Research Centre, UNSW Australia, <http://australiancharities.acnc.gov.au>.
Private Ancillary Guidelines 2009 (Cth) <https://www.legislation.gov.au/Details/F2016C00435>
Public Ancillary Guidelines 2011 (Cth) <https://www.legislation.gov.au/Details/F2016C00434>
Scaife, W, Williamson, A, McDonald, K and Smyllie, S 2012, Foundations for giving: why and how Australians structure their philanthropy, Australian Centre for Philanthropy and Nonprofit Studies, <https://eprints.qut.edu.au/48801/1/48801.pdf>.
Ward, D 2016a, Private ancillary funds trustee handbook, 2nd edn, Philanthropy Australia, Melbourne.
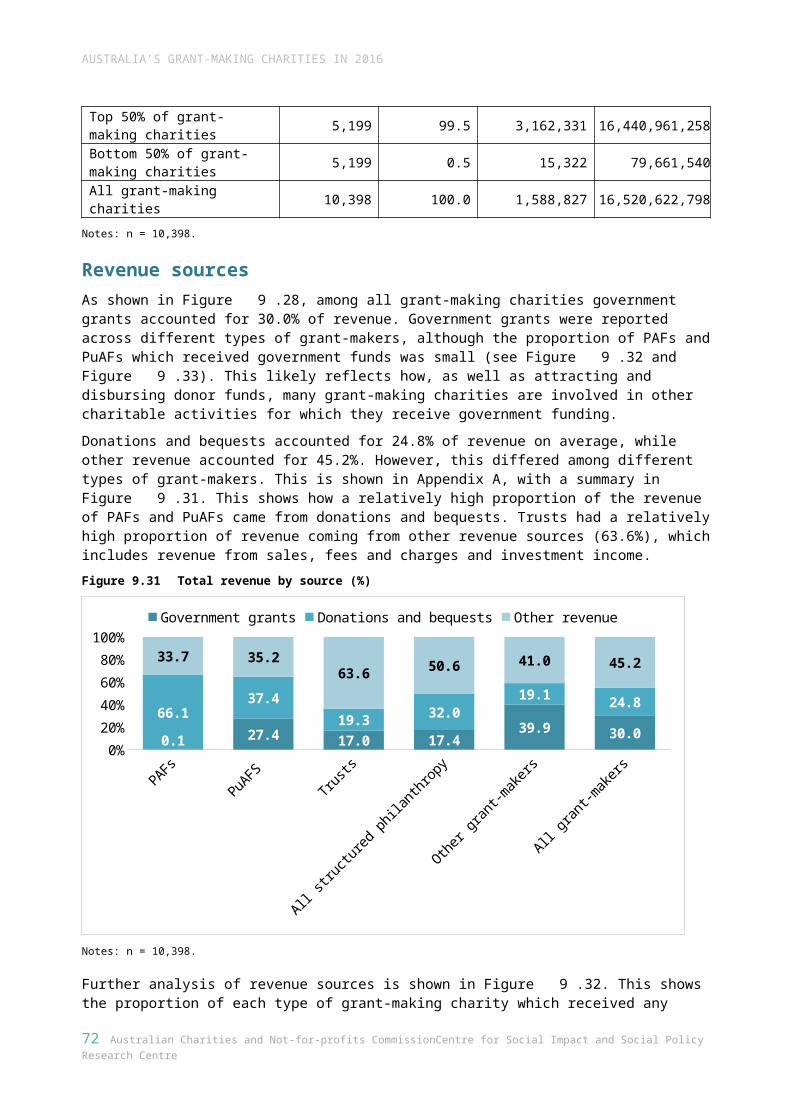
AUSTRALIA’S GRANT-MAKING CHARITIES IN 2016
Ward, D 2016b, Public ancillary funds trustee handbook, 2nd edn, Philanthropy Australia, Melbourne.
72 Australian Charities and Not-for-profits Commission Centre for Social Impact and Social Policy Research Centre
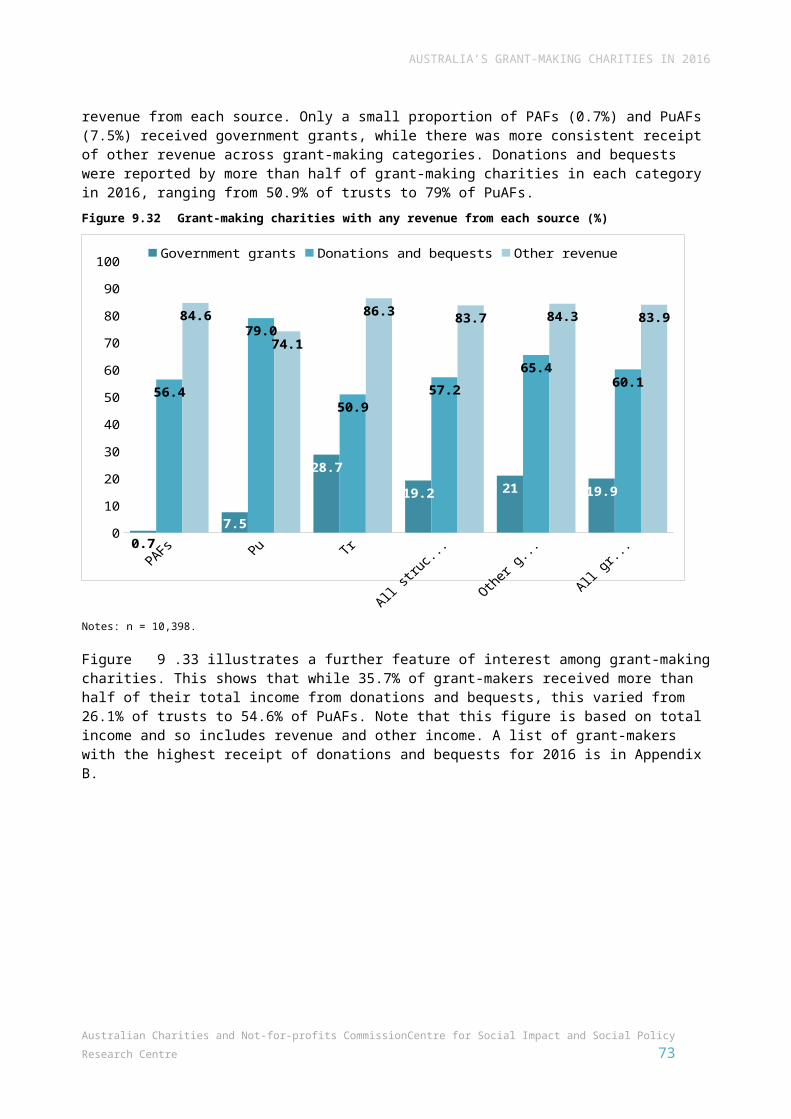
AUSTRALIA’S GRANT-MAKING CHARITIES IN 2016
Appendix A: Supplementary TablesWhat size were grant-making charities?
Figure A.1 ACNC size definition using revenue
PAFs PuAFs Trusts All structured philanthropy Other grant-makers All grant-makers
Number Percent Number Percent Number Percent Number Percent Number Percent Number PercentSmall 831 63.1 870 71.1 3,384 82.5 5,085 76.5 2,842 75.7 7,927 76.2Medium 293 22.2 199 16.3 378 9.2 870 13.1 469 12.5 1,339 12.9Large 194 14.7 155 12.7 340 8.3 689 10.4 443 11.8 1,132 10.9Total 1,318 100.0 1,224 100.0 4,102 100.0 6,644 100.0 3,754 100.0 10,398 100.0
Notes: n = 10,398.
Figure A.2 Detailed measure of size by revenue
Revenue size PAFs PuAFs Trusts All structured philanthropy Other grant-makers All grant-makers
Number Percent Number Percent Number Percent Number Percent Number Percent Number PercentXS (<$50k) 443 33.6 530 43.3 2,326 56.7 3,299 49.7 1,829 48.7 5,128 49.3S ($50k–<$250k) 389 29.5 341 27.9 1,060 25.8 1,790 26.9 1,007 26.8 2,797 26.9M ($250k–<$1m) 296 22.5 198 16.2 378 9.2 872 13.1 476 12.7 1,348 13.0L ($1m–<$10m) 169 12.8 130 10.6 288 7.0 587 8.8 330 8.8 917 8.8XL (>$10m) 21 1.6 25 2.0 50 1.2 96 1.4 112 3.0 208 2.0Total 1,318 100.0 1,224 100.0 4,102 100.0 6,644 100.0 3,754 100.0 10,398 100.0
Notes: n = 10,398.
73 Australian Charities and Not-for-profits Commission Centre for Social Impact and Social Policy Research Centre
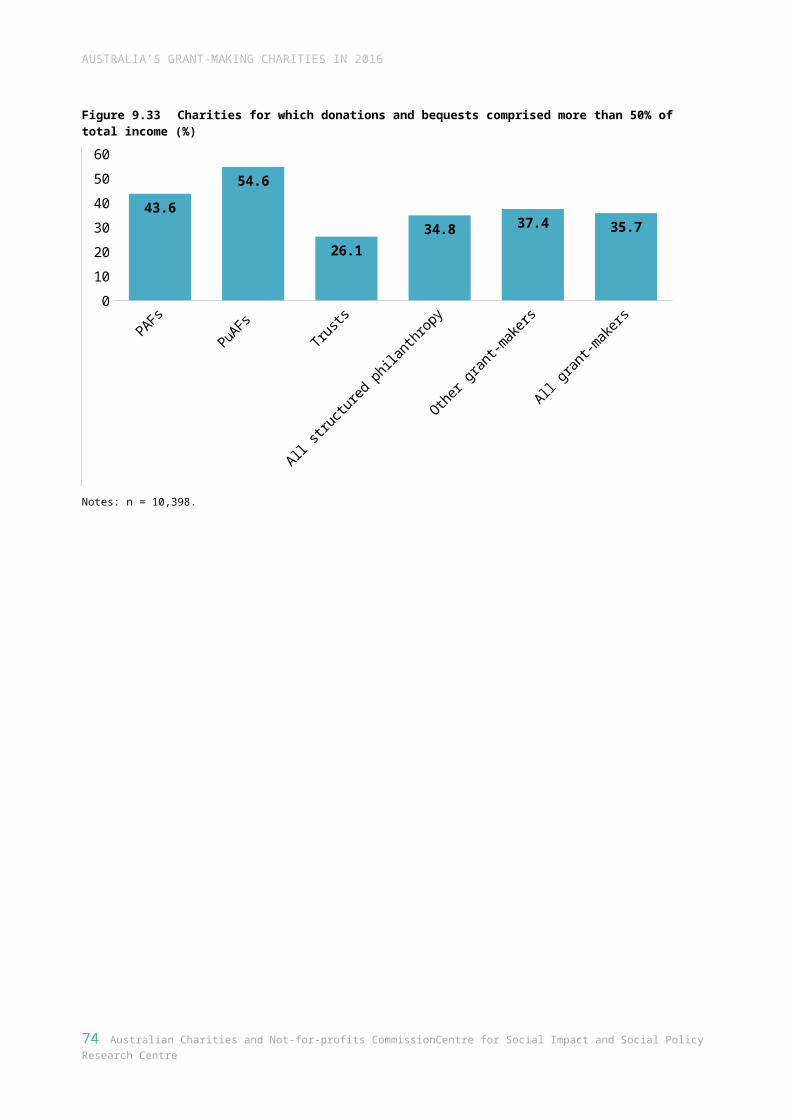
AUSTRALIA’S GRANT-MAKING CHARITIES IN 2016
Where were grant-making charities located?Figure A.3 Grant-making charities registered in each jurisdiction
PAFs PuAFs Trusts All structured philanthropy Other grant-makers All grant-makers
Number Percent Number Percent Number Percent Number Percent Number Percent Number PercentNSW 590 44.8 423 34.6 1,643 40.1 2,656 40.0 1,352 36.0 4,008 38.5VIC 426 32.3 387 31.6 1,299 31.7 2,112 31.8 1,077 28.7 3,189 30.7QLD 113 8.6 158 12.9 399 9.7 670 10.1 430 11.5 1,100 10.6WA 101 7.7 108 8.8 323 7.9 532 8.0 356 9.5 888 8.5SA 60 4.6 98 8.0 256 6.2 414 6.2 362 9.6 776 7.5TAS 15 1.1 22 1.8 90 2.2 127 1.9 75 2.0 202 1.9ACT 13 1.0 27 2.2 64 1.6 104 1.6 74 2.0 178 1.7NT 0 0.0 1 0.1 28 0.7 29 0.4 28 0.7 57 0.5Total 1,318 100.0 1,224 100.0 4,102 100.0 6,644 100.0 3,754 100.0 10,398 100.0
Notes: n = 10,398.
Figure A.4 Grant-making charities operating in each jurisdiction
PAFs PuAFs Trusts All structured philanthropy Other grant-makers All grant-makers
Number Percent Number Percent Number Percent Number Percent Number Percent Number PercentNSW 657 49.8 484 39.5 1,747 42.6 2,888 34.8 1,656 44.1 4,544 43.7VIC 627 47.6 484 39.5 1,323 32.3 2,434 28.3 1,442 38.4 3,876 37.3QLD 343 26.0 316 25.8 632 15.4 1,291 14.9 887 23.6 2,178 20.9WA 307 23.3 255 20.8 534 13.0 1,096 12.4 760 20.2 1,856 17.8SA 263 20.0 233 19.0 461 11.2 957 10.9 740 19.7 1,697 16.3TAS 219 16.6 158 12.9 283 6.9 660 6.9 428 11.4 1,088 10.5ACT 211 16.0 176 14.4 277 6.8 664 7.1 461 12.3 1,125 10.8NT 214 16.2 132 10.8 225 5.5 571 5.6 344 9.2 915 8.8Total 1,318 100 1,224 100 4,102 100 6,644 100 3,754 100 10,398 100
Notes: n = 10,398.
74 Australian Charities and Not-for-profits Commission Centre for Social Impact and Social Policy Research Centre
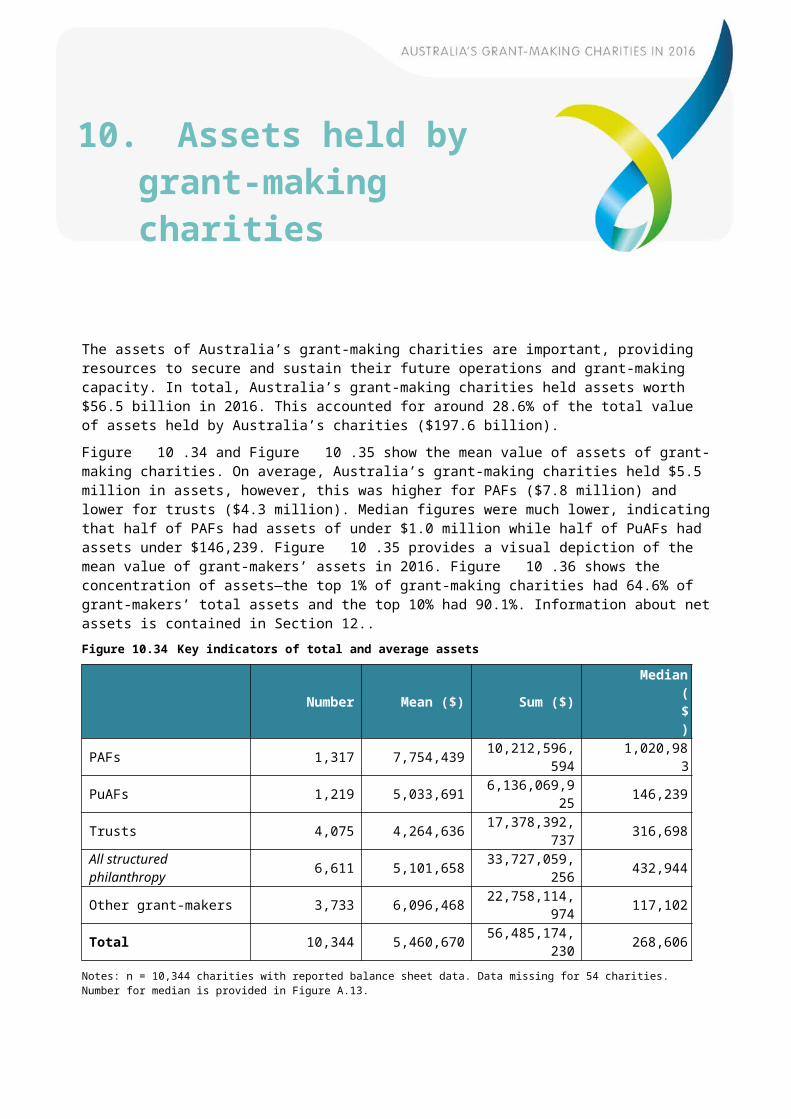
AUSTRALIA’S GRANT-MAKING CHARITIES IN 2016
How old were grant-making charities?Figure A.5 Proportion of grant-making charities by age
PAFs PuAFs Trusts All structured philanthropy Other grant-makers All grant-makers
Number Percent Number Percent Number Percent Number Percent Number Percent Number PercentLess than 1 year old 24 1.9 7 0.6 8 0.2 39 0.6 4 0.1 43 0.41 to less than 5 years old 409 32.8 233 20.1 437 11.7 1,079 17.5 386 11.1 1,465 15.25 to less than 10 years old 457 36.7 298 25.7 622 16.6 1,377 22.4 508 14.6 1,885 19.610 to less than 20 years old 354 28.4 374 32.3 1,083 28.9 1,811 29.4 762 21.9 2,573 26.720 to less than 50 years old 2 0.2 213 18.4 1,119 29.9 1,334 21.7 1,245 35.8 2,579 26.850 to less than 100 years old 0 0.0 22 1.9 409 10.9 431 7.0 468 13.5 899 9.3100 or more years old 0 0.0 11 0.9 69 1.8 80 1.3 105 3.0 185 1.9Total 1,246 100 1,158 100 3,747 100 6,151 100 3,478 100 9,629 100
Notes: n = 9,629 (data was missing for 769 grant-making charities).
75 Australian Charities and Not-for-profits Commission Centre for Social Impact and Social Policy Research Centre
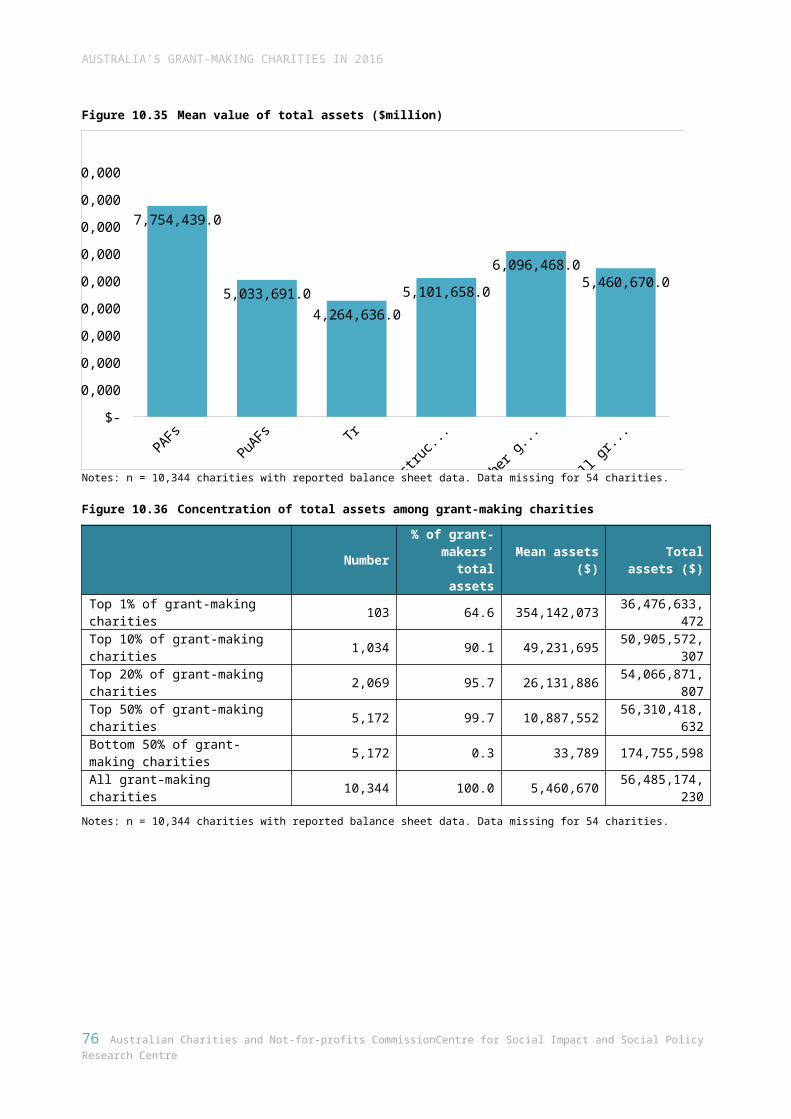
AUSTRALIA’S GRANT-MAKING CHARITIES IN 2016
What did grant-making charities do?Figure A.6 Main activities most commonly selected by grant-making charities
PAFs PuAFs Trusts All structured philanthropy Other grant-makers All grant-makers
Number Percent Number Percent Number Percent Number Percent Number Percent Number PercentGrant-making activities 572 43.4 256 20.9 1,054 25.7 1,882 28.3 915 24.4 2,797 26.9Religious activities 8 0.6 69 5.6 1,103 26.9 1,180 17.8 433 11.5 1,613 15.5Economic, social and community development 109 8.3 108 8.8 179 4.4 396 6.0 308 8.2 704 6.8Primary and secondary education 19 1.4 41 3.3 232 5.7 292 4.4 323 8.6 615 5.9Social services 81 6.1 43 3.5 150 3.7 274 4.1 241 6.4 515 5.0Culture and arts 53 4.0 53 4.3 152 3.7 258 3.9 163 4.3 421 4.0Other philanthropic 150 11.4 106 8.7 63 1.5 319 4.8 81 2.2 400 3.8Other education 26 2.0 35 2.9 174 4.2 235 3.5 163 4.3 398 3.8Other health services 45 3.4 70 5.7 101 2.5 216 3.3 167 4.4 383 3.7International activities 11 0.8 31 2.5 31 0.8 73 1.1 202 5.4 275 2.6Emergency relief 11 0.8 23 1.9 72 1.8 106 1.6 162 4.3 268 2.6All other activities 233 17.7 389 31.8 791 19.3 1,413 21.3 596 15.9 2,009 19.3Total 1,318 100 1,224 100 4,102 100 6,644 100 3,754 100 10,398 100
Notes: n = 10,398.
76 Australian Charities and Not-for-profits Commission Centre for Social Impact and Social Policy Research Centre
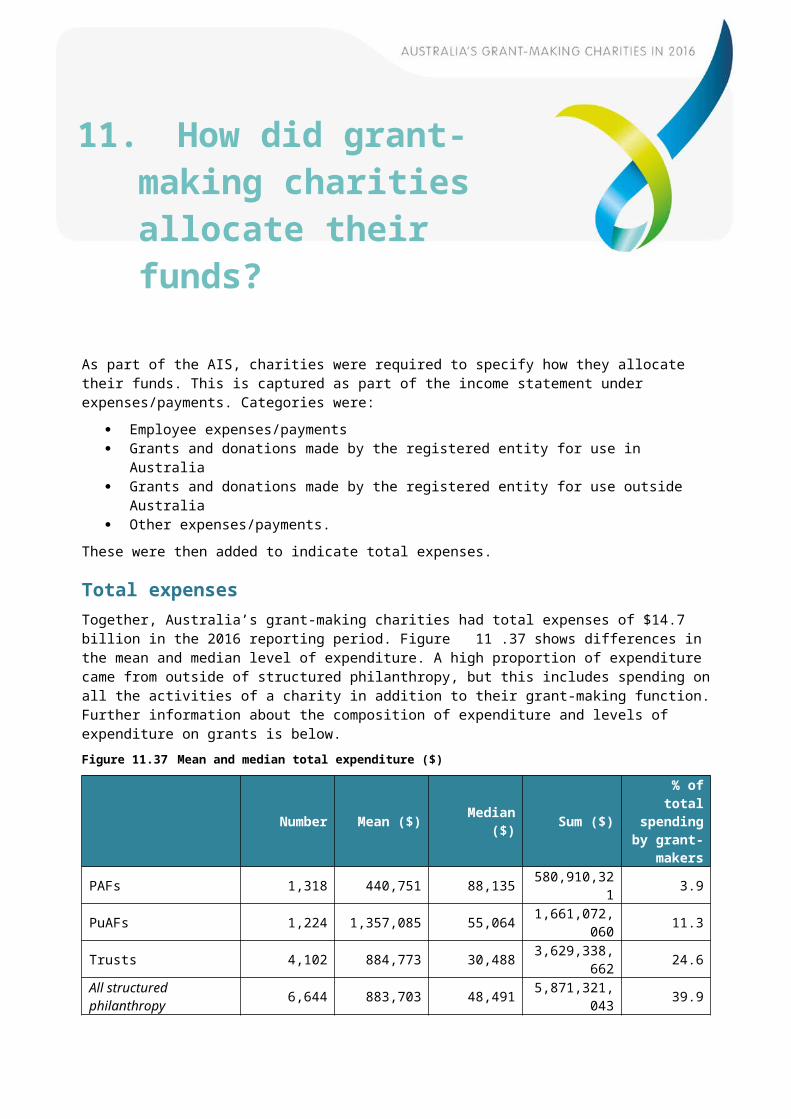
AUSTRALIA’S GRANT-MAKING CHARITIES IN 2016
Who did grant-making charities help?Figure A.7 Grant-making charities helping the general community and specific categories of beneficiaries
General Specific categories AllNumber Percent Number Percent Number Percent
PAFs 945 73.7 337 26.3 1,282 100PuAFs 582 51.8 542 48.2 1,124 100Trusts 1,560 41.1 2,233 58.9 3,793 100All structured philanthropy 3,087 49.8 3,112 50.2 6,199 100Other grant-makers 1,682 48.2 1,809 51.8 3,491 100Total 4,769 49.2 4,921 50.8 9,690 100
Notes: n = 9,690.
77 Australian Charities and Not-for-profits Commission Centre for Social Impact and Social Policy Research Centre
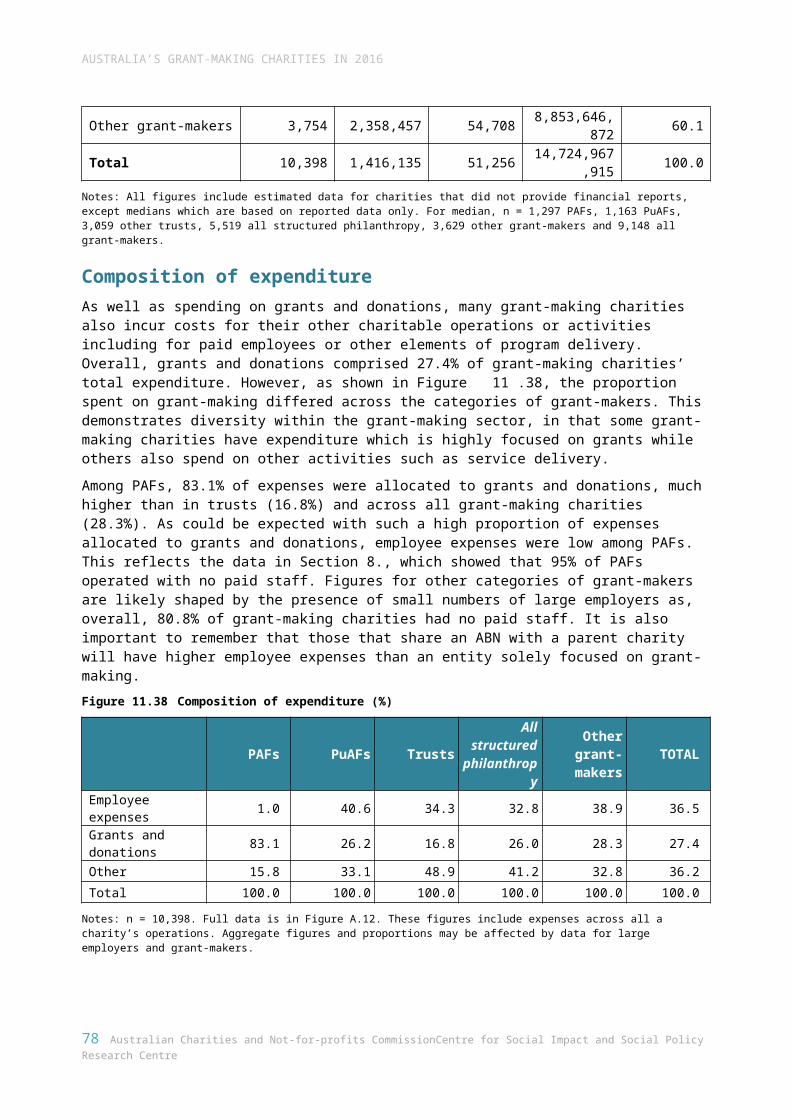
AUSTRALIA’S GRANT-MAKING CHARITIES IN 2016
Figure A.8 Specific groups helped by grant-making charities
PAFs PuAFs Trusts All structured philanthropy
Other grant-makers All grant-makers
Number Percent Number Percent Number Percent Number Percent Number Percent Number PercentFemales 46 3.6 103 9.2 226 6.0 375 6.0 466 13.3 841 8.7Males 22 1.7 73 6.5 202 5.3 297 4.8 355 10.2 652 6.7Early childhood (under 6) 41 3.2 76 6.8 160 4.2 277 4.5 327 9.4 604 6.2Children (6–14 years) 80 6.2 137 12.2 372 9.8 589 9.5 631 18.1 1,220 12.6Youth (15–24 years) 89 6.9 149 13.3 487 12.8 725 11.7 595 17.0 1,320 13.6Adults (25–64 years) 25 2.0 59 5.2 151 4.0 235 3.8 277 7.9 512 5.3Adults (65 and over) 21 1.6 46 4.1 94 2.5 161 2.6 217 6.2 378 3.9Aboriginal and Torres Strait Islander people 45 3.5 50 4.4 197 5.2 292 4.7 216 6.2 508 5.2Gay, lesbian, bisexual, transgender or intersex persons 0 0.0 11 1.0 11 0.3 22 0.4 57 1.6 79 0.8
Migrants, refugees or asylum seekers 28 2.2 16 1.4 46 1.2 90 1.5 135 3.9 225 2.3Other charities 88 6.9 90 8.0 635 16.7 813 13.1 538 15.4 1,351 13.9People from a culturally and linguistically diverse background 10 0.8 36 3.2 53 1.4 99 1.6 202 5.8 301 3.1
Overseas communities or charities 50 3.9 49 4.4 52 1.4 151 2.4 348 10.0 499 5.1People in rural/regional/remote communities 29 2.3 42 3.7 91 2.4 162 2.6 198 5.7 360 3.7Families 25 2.0 32 2.8 69 1.8 126 2.0 224 6.4 350 3.6Financially disadvantaged people 47 3.7 48 4.3 120 3.2 215 3.5 293 8.4 508 5.2People at risk of or experiencing homelessness 40 3.1 37 3.3 70 1.8 147 2.4 165 4.7 312 3.2People with chronic illness (including terminal) 57 4.4 76 6.8 75 2.0 208 3.4 203 5.8 411 4.2People with disabilities 62 4.8 88 7.8 161 4.2 311 5.0 310 8.9 621 6.4Pre-/post-release offenders and/or their families 3 0.2 3 0.3 10 0.3 16 0.3 30 0.9 46 0.5Unemployed persons 8 0.6 21 1.9 44 1.2 73 1.2 115 3.3 188 1.9Veterans and/or their families 3 0.2 6 0.5 26 0.7 35 0.6 53 1.5 88 0.9Victims of crime (including family violence) 9 0.7 15 1.3 17 0.4 41 0.7 63 1.8 104 1.1Victims of disaster 14 1.1 15 1.3 24 0.6 53 0.9 91 2.6 144 1.5Others 41 3.2 61 5.4 508 13.4 610 9.8 214 6.1 824 8.5
Notes: n = 9,690.
78 Australian Charities and Not-for-profits Commission Centre for Social Impact and Social Policy Research Centre
AUSTRALIA’S GRANT-MAKING CHARITIES IN 2016
Who worked in grant-making charities?Figure A.9 Grant-making charities with employees and volunteers
PAFs PuAFs Trusts All structured philanthropy Other grant-makers All grant-makers
Number Percent Number Percent Number Percent Number Percent Number Percent Number PercentHad neither employees nor volunteers 790 60.4 262 21.9 1,668 41.3 2,720 41.6 686 18.3 3,406 33.1Employees only 41 3.1 74 6.2 199 4.9 314 4.8 163 4.4 477 4.6Volunteers only 454 34.7 674 56.3 1,765 43.7 2,893 44.2 2,016 53.8 4,909 47.7Employees and volunteers 24 1.8 187 15.6 404 10.0 615 9.4 881 23.5 1,496 14.5Total 1,309 100 1,197 100 4,036 100 6,542 100 3,746 100 10,288 100
Notes: n = 10,288.
How did grant-making charities fund their activities?Figure A.10 Total income ($)
PAFs PuAFs Trusts All structured philanthropy Other grant-makers All grant-makers
Government grants 1,668,500 580,658,976 682,923,809 1,265,251,285 3,684,456,457 4,949,707,742
Donations and bequests 768,444,225 792,531,973 774,339,286 2,335,315,484 1,763,961,501 4,099,276,985
Other revenue 391,726,284 746,337,447 2,548,194,293 3,686,258,024 3,785,380,047 7,471,638,071
Total revenue 1,161,839,009 2,119,528,396 4,005,457,388 7,286,824,793 9,233,798,005 16,520,622,798
Other income 2,933,446,630 38,479,828 184,034,950 3,155,961,408 258,701,949 3,414,663,357
Total 4,095,285,639 2,158,008,224 4,189,492,338 10,442,786,201 9,492,499,954 19,935,286,155
Notes: n = 10,398
79 Australian Charities and Not-for-profits Commission Centre for Social Impact and Social Policy Research Centre
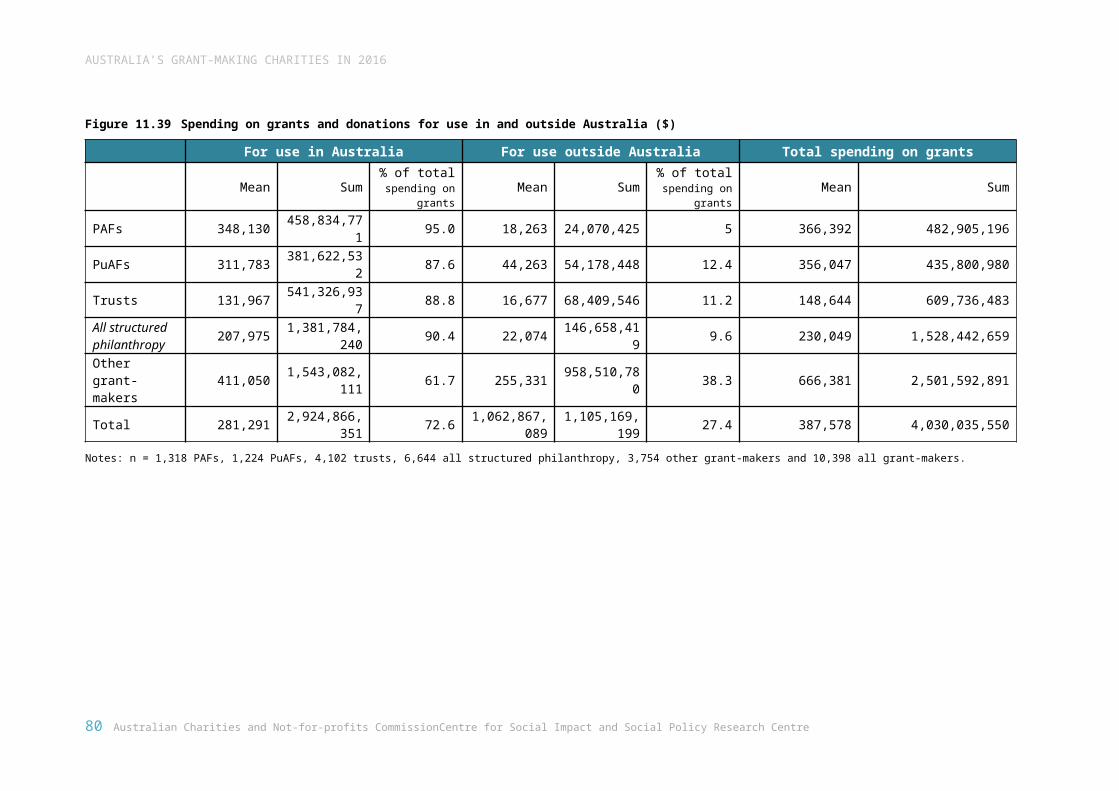
AUSTRALIA’S GRANT-MAKING CHARITIES IN 2016
Figure A.11 Sources of income and revenue
PAFs PuAFs Trusts All structured philanthropy Other grant-makers All grant-makers
% of total income
% of total revenue
% of total income
% of total revenue
% of total income
% of total revenue
% of total income
% of total revenue
% of total income
% of total revenue
% of total income
% of total revenue
Government grants 0.04 0.1 26.9 27.4 16.3 17 12.1 17.4 38.8 39.9 24.8 30
Donations and bequests 18.8 66.1 36.7 37.4 18.5 19.3 22.4 32 18.6 19.1 20.6 24.8
Other revenue 9.6 33.7 34.6 35.2 60.8 63.6 35.8 50.6 39.9 41 37.5 45.2
Total revenue 28.4 100 98.2 100 95.6 100 70.3 100 97.3 100 82.9 100
Other income 71.6 - 1.8 - 4.4 - 30.2 - 2.7 - 17.1 -
Total 100 - 100 - 100 - 100 - 100 - 100 -
Notes: n = 10,398.
How did grant-making charities allocate their funds?Figure A.12 Composition of expenditure
PAFs PuAFs Trusts All structured philanthropy Other grant-makers All grant-makers
Total ($) Percent Total ($) Percen
t Total ($) Percent Total ($) Percen
t Total ($) Percent Total ($) Percent
Employee expenses 5,958,667 1.0 674,933,168 40.6 1,244,444,441 34.3 1,925,336,276 32.8 3,446,254,641 38.9 5,371,590,917 36.5Grants and donations 482,905,196 83.1 435,800,980 26.2 609,736,483 16.8 1,528,442,659 26.0 2,501,592,891 28.3 4,030,035,550 27.4
Other 92,046,458 15.8 550,337,912 33.1 1,775,157,738 48.9 2,417,542,108 41.2 2,905,799,340 32.8 5,323,341,448 36.2
Total 580,910,321 100.0 1,661,072,060 100.0 3,629,338,662 100.0 5,871,321,043 100.0 8,853,646,872 100.0 14,724,967,915 100.0
Notes: n = 10,398.
80 Australian Charities and Not-for-profits Commission Centre for Social Impact and Social Policy Research Centre
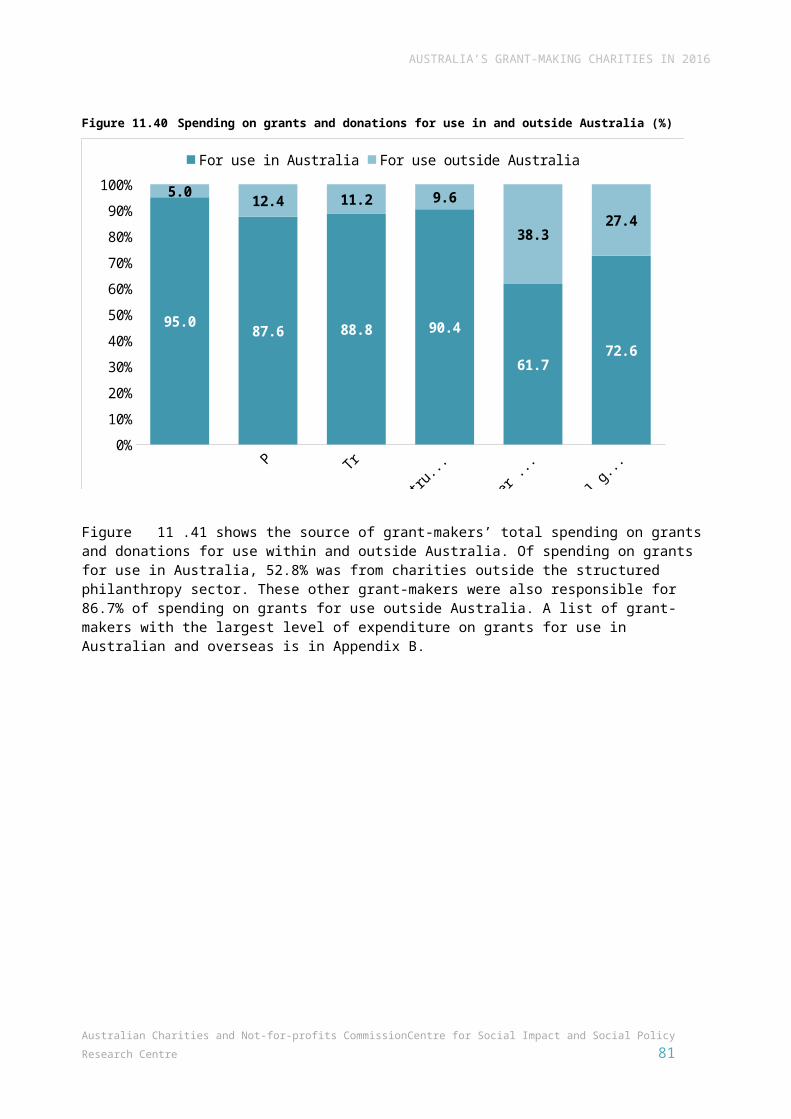
AUSTRALIA’S GRANT-MAKING CHARITIES IN 2016
What were the total assets of grant-making charities?Figure A.13 Mean, median and total assets
Mean MedianPercent of total
Number Mean ($) Sum Median ($) Number
PAFs 1,317 7,754,439 10,212,596,594 1,020,983 1,297 18.1
PuAFs 1,219 5,033,691 6,136,069,925 146,239 1,163 10.9
Trusts 4,075 4,264,636 17,378,392,737 316,698 3,059 30.8
All structured philanthropy 6,611 5,101,658 33,727,059,256 432,944 5,519 59.8
Other grant-makers 3,733 6,096,468 22,758,114,974 117,102 3,629 40.3
All grant-makers 10,344 5,460,670 56,485,174,230 268,606 9,148 100.0
Notes: n = 10,344 for mean and 9,148 for median. All figures include estimated data for charities that did not provide financial reports, except medians which are based on reported data only.
The financial status of grant-making charitiesFigure A.14 Revenue diversification
One revenue source
Two revenue sources
Three revenue sources Total
Number Percent Number Percent Number Percent Number
PAFs 627 50.4 607 48.8 9 0.7 1,243
PuAFs 354 31.7 674 60.4 88 7.9 1,116
Trusts 1,939 50.9 748 19.6 1,123 29.5 3,810
All structured philanthropy 2,920 47.3 2,029 32.9 1,220 19.8 6,169
Other grant-makers 1,548 41.9 1,569 42.5 574 15.6 3,691
Total 4,468 45.3 3,598 36.5 1,794 18.2 9,860
Notes: n = 9,860 (data was missing for 538 grant-making charities). Based on reported financial data with at least one revenue source.
Figure A.15 Net income ratio
PAFs PuAFs Trusts All structured philanthropy Other grant-makers All grant-makers
81 Australian Charities and Not-for-profits Commission Centre for Social Impact and Social Policy Research Centre
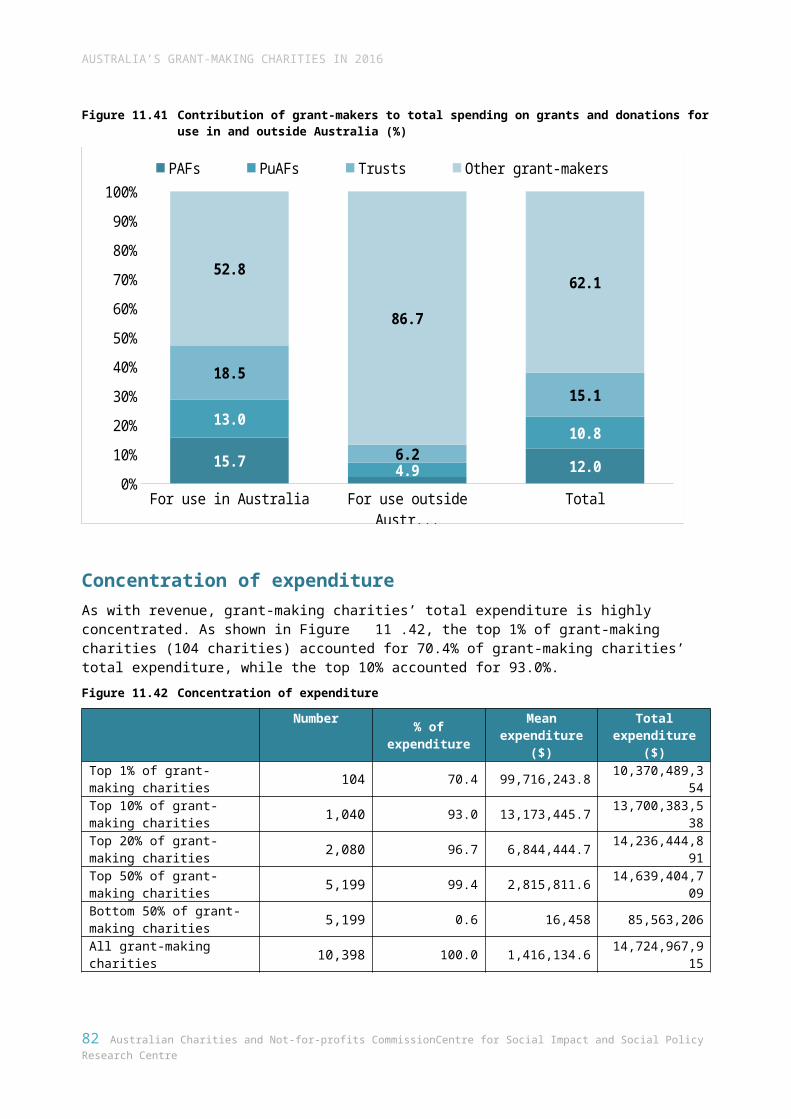
AUSTRALIA’S GRANT-MAKING CHARITIES IN 2016
Number Percent Number Percent Number Percent Number Percent Number Percent Number PercentCharities with a net income ratio greater than 5% 706 53.6 748 61.1 2,262 55.1 3,831 56.0 1,679 44.7 5,395 51.9Charities with a net income ratio between –5% and 5% 89 6.8 143 11.7 994 24.2 1,244 18.2 901 24.0 2,127 20.5
Charities with a net income ratio less than –5% 523 39.7 333 27.2 846 20.6 1,769 25.8 1,174 31.3 2,876 27.7Total 1,318 100.0 1,224 100.0 4,102 100.0 6,844 100.0 3,754 100.0 10,398 100.0
Notes: n = 10,398. Net income ratio is calculated as net income/total income (%).
Figure A.16 Expenses coverage ratio
PAFs PuAFs Trusts All structured philanthropy Other grant-makers All grant-makers
Number Percent Number Percent Number Percent Number Percent Number Percent Number PercentNet assets coverage for less than 6 months of expenses 88 7.0 318 29.1 1,336 35.8 1,742 28.2 1,230 33.1 2,972 30.3
Net assets cover for 6 months to less than 5 years of expenses 162 12.9 320 29.3 557 14.9 1,039 16.8 1,255 33.8 2,294 23.4
Net assets cover for 5 years or more of expenses 1,008 80.1 453 41.5 1,838 49.3 3,299 53.4 1,233 33.2 4,532 46.3
Total 1,258 100.0 1,091 100.0 3,731 100.0 6180 100.0 3,718 100.0 9,798 100.0
Notes: n = 9,798.
82 Australian Charities and Not-for-profits Commission Centre for Social Impact and Social Policy Research Centre
AUSTRALIA’S GRANT-MAKING CHARITIES IN 2016
Change among grant-making charities from 2015 to 2016Figure A.17 Change in size from 2015 to 2016
Size in 2016
Size in 2015 Number (2015) XSPercent
SPercent
MPercent
LPercent
XLPercent
XXLPercent
XS 4,516 85.5 12.3 1.5 0.6 0.1 0.0
S 3,066 30.0 62.5 6.1 1.2 0.1 0.0
M 1,267 6.7 15.5 69.2 8.2 0.3 0.0
L 900 3.7 4.7 15.9 72.4 3.1 0.2
XL 199 5.0 1.0 3.0 22.1 67.8 1.0
XXL 12 0.0 0.0 0.0 8.3 25.0 66.7
Notes: n = 9,960.
83 Australian Charities and Not-for-profits Commission Centre for Social Impact and Social Policy Research Centre
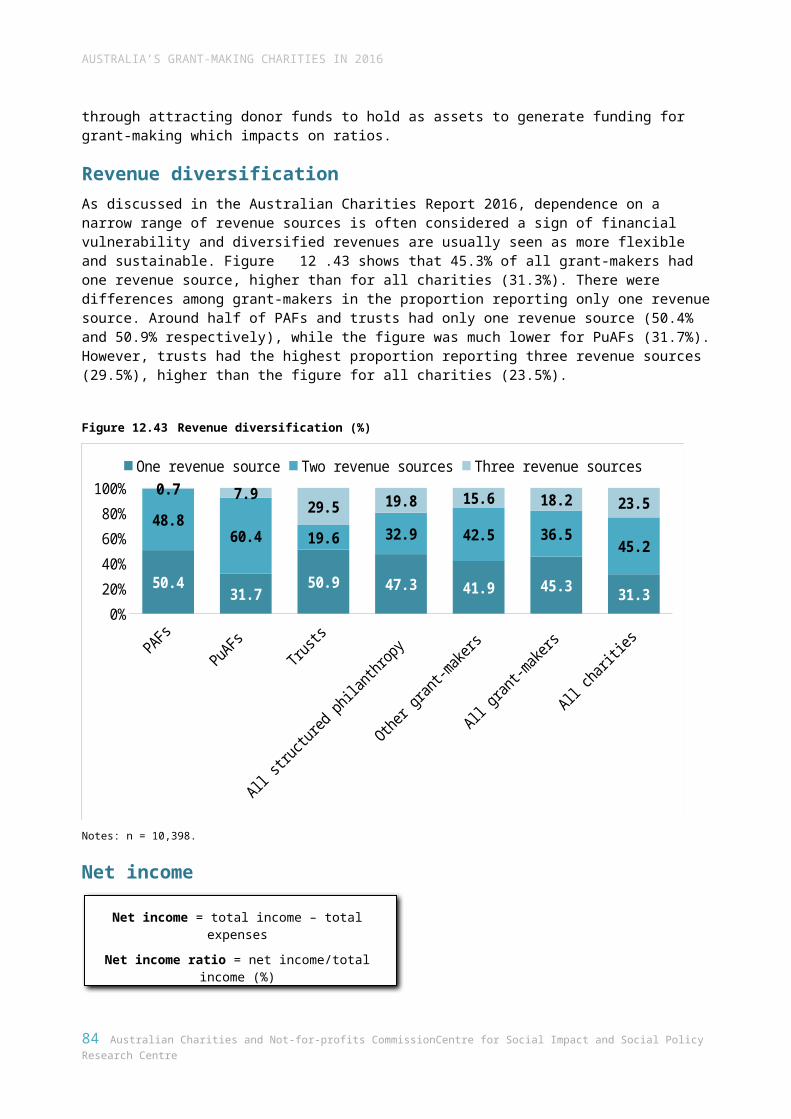
Appendix B: Australia’s largest grant-making charities in 2016
The data below includes 2016 reported data only, excluding charities that had details withheld from the ACNC Register at the date of this report’s publication.
Highest grants expendedFigure A.18 PAFs ranked by level of expenditure on donations and grants
Charity name Total grants ($)
The Paul Ramsay Foundation 45,200,000
The Trustee for The Neilson Foundation 9,738,441
The Pratt Family Foundation 9,244,780
The Trustee for The Geoff and Helen Handbury Foundation 9,185,331
Crown Resorts Foundation Private Ancillary Fund 6,919,903
The Packer Family Foundation 5,651,289
The Trustee for the Brazil Family Foundation 5,386,000
The Trustee for Lyn Storey Foundation 5,312,536
The Goding Foundation 5,080,000
The Trustee for Scanlon Foundation 4,763,307
Notes: Uses 2016 reported data only (no estimated data). Excludes charities that have data withheld from the public registry.
Figure A.19 PuAFs ranked by level of expenditure on donations and grants
Charity name Total grants ($)
The Trustee for the Ian Potter Foundation 40,849,773
The Trustee for Garvan Research Foundation 31,426,453
The Uniting Church in Australia Property Trust (Victoria) 11,055,000
Baptist World Aid Australia Public Ancillary Fund 10,949,444
Optometric Vision Research Foundation 9,103,416
Australian Communities Foundation 7,017,458
Good2Give Community Fund 6,996,684
The Perpetual Foundation 6,914,818
Health Services Charitable Gifts Board 6,811,000
St Vincent’s Curran Foundation 6,690,000
Notes: Uses 2016 reported data only (no estimated data). Excludes charities that have data withheld from the public registry.
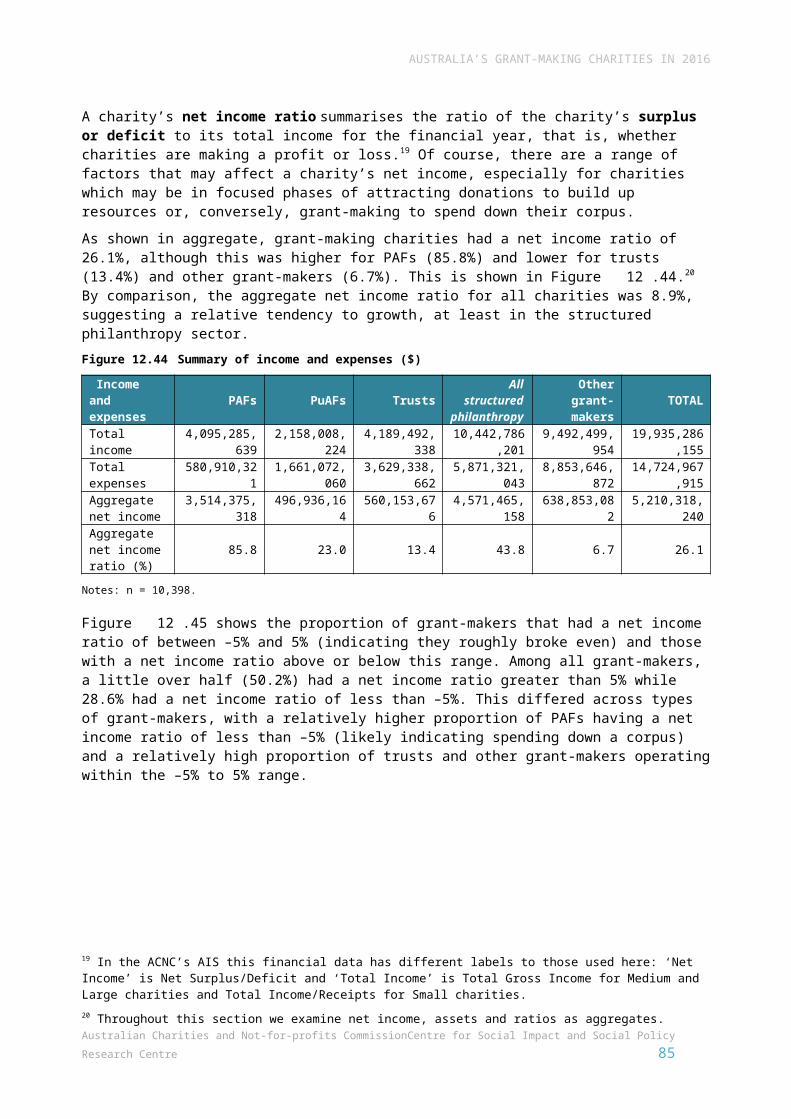
AUSTRALIA’S GRANT-MAKING CHARITIES IN 2016
Figure A.20 Trusts ranked by level of expenditure on donations and grants
Charity name Total grants ($)
The Movember Group Pty Ltd as Trustee for the Movember Foundation 46,098,481
The Trustee for Lionel R V Spencer Charitable Trust Fund 42,663,337
Ronald McDonald House Charities Trust 16,156,741
The Trustee for The Council for Jewish Education in Schools 13,234,030
The Trustee for Financial Markets Foundation for Children 11,010,554
The General Gumala Foundation Trust 9,231,560
The Trustee for Viertel S and C Charitable Foundation 8,263,200
The Trustee for The Sidney Myer Fund 7,191,451
The Trustee for Buckland William Foundation 7,061,392
The Martin Copley Will Trust 6,765,429
Notes: Uses 2016 reported data only (no estimated data). Excludes charities that have data withheld from the public registry.
Figure A.21 Other grant-makers ranked by level of expenditure on donations and grants
Charity name Total grants ($)
World Vision Australia 353,233,000
University of Melbourne (Group reporter) 179,999,000
Headspace (Group reporter) 131,431,019
Victorian Ecumenical System of Schools Ltd 131,174,183
Save The Children Australia 92,586,000
Royal Flying Doctor Service of Australia 70,796,430
Médecins Sans Frontières Australia Limited 69,616,652
Compassion Australia 62,867,653
Plan International Australia 45,143,000
Childfund Australia 38,709,135
Notes: Uses 2016 reported data only (no estimated data). Excludes charities that have data withheld from the public registry.
Highest donations and bequests receivedFigure A.22 PAFs ranked by donations and bequests received
Charity name Total donations ($)
Peter & Lyndy White Foundation Pty Ltd 37,902,061
The Paul Ramsay Foundation 16,110,000
The Trustee for the Brazil Family Foundation 11,250,000
The Pratt Family Foundation 10,958,199
The Trustee for Scanlon Foundation 10,000,000
The Trustee for the Noel and Carmel O’Brien Family Foundation 8,750,000
The Donald and Joan Wilson Foundation 8,185,629
Trustee for Upotipotpon Foundation 7,500,000
Crown Resorts Foundation Private Ancillary Fund 6,976,499
The Trustee for Lyn Storey Foundation 6,600,000
Notes: Uses 2016 reported data only (no estimated data). Excludes charities that have data withheld from the public registry.
85 Australian Charities and Not-for-profits Commission Centre for Social Impact and Social Policy Research Centre
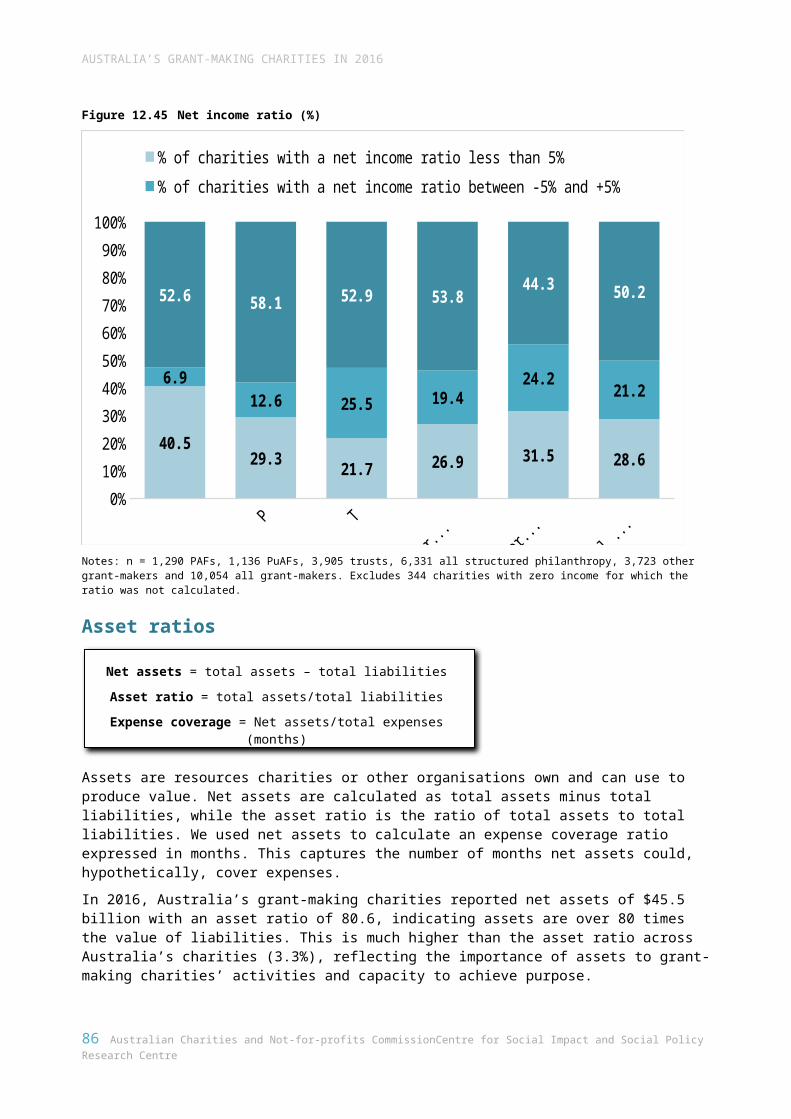
AUSTRALIA’S GRANT-MAKING CHARITIES IN 2016
Figure A.23 PuAFs ranked by donations and bequests received
Charity name Total donations ($)
LDS Charitable Trust Fund 82,751,055
The Trustee for Peter MacCallum Cancer Foundation 52,422,408
The Trustee for The Monash University Foundation 44,501,000
The Trustee for Garvan Research Foundation 33,985,395
Catholic Mission Donation Fund 22,831,289
The Royal Children’s Hospital Foundation Limited 22,521,579
Jewish Communal Appeal 18,879,954
Epworth Medical Foundation 17,205,461
The Perpetual Foundation 15,426,373
The Trustee for Cotton On Foundation 12,208,840
Notes: Uses 2016 reported data only (no estimated data). Excludes charities that have data withheld from the public registry.
Figure A.24 Trusts ranked by donations and bequests received
Charity name Total donations ($)
Salvation Army - Eastern (Group reporter) 114,300,000
The Movember Group Pty Ltd as Trustee for The Movember Foundation 75,501,480
Salvation Army - Southern (Group reporter) 50,173,000
The Trustee for Channel 7 Telethon Trust 20,652,028
The Trustee for The Royal Children's Hospital Foundation No. 2 Trust 17,666,898
Art Gallery of NSW Trust 13,725,000
The Trustee for Lifehouse Australia Trust 13,168,788
The Trustee for The Council for Jewish Education in Schools 13,128,427
Puutu Kunti Kurrama and Pinikura People Charitable Trust 11,654,726
The Trustee for Ablecare Foundation 11,384,133
Notes: Uses 2016 reported data only (no estimated data). Excludes charities that have data withheld from the public registry.
Figure A.25 Other grant-makers ranked by donations and bequests received
Charity name Total donations ($)
World Vision Australia 347,700,000
Médecins Sans Frontières Australia Limited 88,313,203
Compassion Australia 78,355,094
The Cancer Council NSW 67,415,000
University of Melbourne (Group reporter) 59,354,334
Rinehart Family Medical Foundation Inc 50,000,000
LDS Charities Australia 46,000,000
Cancer Council Victoria 45,090,000
Vision Australia (Group reporter) 41,844,000
Childfund Australia 31,107,727
Notes: Uses 2016 reported data only (no estimated data). Excludes charities that have data withheld from the public registry.
86 Australian Charities and Not-for-profits Commission Centre for Social Impact and Social Policy Research Centre