Embed Size (px)
Citation preview
Arc Hydro River
By David R. Maidment Director, Center for Research in Water Resources, University of Texas at Austin
and
Clint BrownDirector of Software Products, Environmental Systems Research Institute, Redlands CA
November 24, 2010
Beginning in 1998, with the development of the ArcGIS Geographic Information System, the Center for Research in Water Resources of the University of Texas at Austin has been collaborating with the Environmental Systems Research Institute on customizing the application of ArcGIS for water resources. The first product of this collaboration: “Arc Hydro: GIS for Water Resources” (Maidment, 2002) was established as a data model for geographic description of surface water resources, and an Arc Hydro toolset has subsequently been developed by ESRI’s Water Resources Applications group to become the most comprehensive and widely used means of watershed and stream network delineation from digital elevation models and for watershed characterization by development of hydrologic parameters. A parallel collaboration between ESRI and the Hydrologic Engineering Center of the US Army Corps of Engineers has led to the creation of the widely used tools HEC-GeoRAS and HEC-GeoHMS, which are geographic data pre-and post-processors for HEC’s hydraulic and hydrologic simulation models.
The second product of this collaboration: “Arc Hydro Groundwater: GIS for Hydrogeology” (Strassberg, Jones and Maidment, 2010) is about to appear from ESRI Press. It describes a geographic data model for characterization of subsurface hydrogeology and groundwater, including wells, aquifers, boreholes, stratigraphy, hydrogeologic mapping, observational data on water levels and water quality, and information from groundwater models such as MODFLOW. Again, an extensive toolset has been developed for application of Arc Hydro Groundwater, this time by Aquaveo, a water resources software development company based in Provo, Utah, which has also produced the widely used Groundwater Modeling System. Arc Hydro Groundwater is being adapted in Australia for development of a National Groundwater Information System for their country, beginning with a national database of well and borehole information.
This paper outlines an anticipated third product of that collaboration: Arc Hydro River – GIS for characterization of river channels and channel networks, along with accompanying applications, in particular to flood modeling and mapping and to ecological and geomorphologic characterization of rivers as living, changing, natural environments. As with the two previous
1
initiatives, it is anticipated that this initiative will result in a data model, a book from ESRI Press, and a toolset for application of the data model to geographic description of river environments.
Why Arc Hydro River?
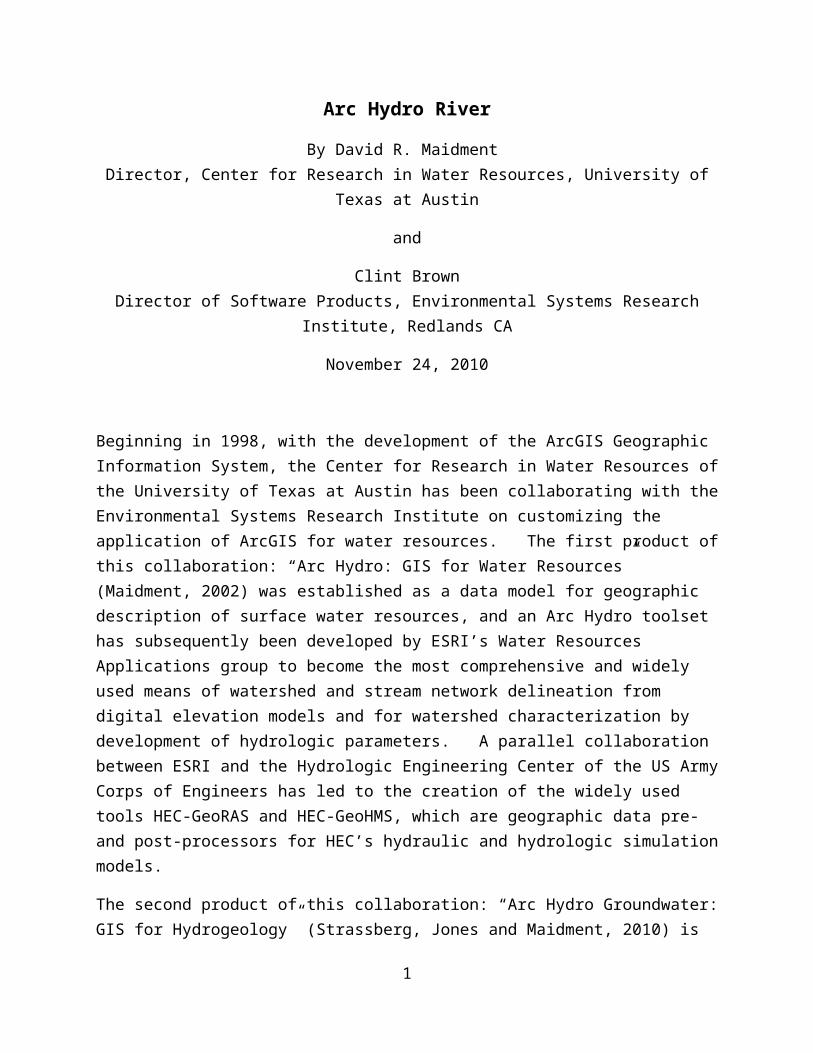
The thought model for Arc Hydro River is depicted in Figure 1. At the center is an image of a river and its surrounding riparian zone and floodplain. It is a beautiful, complex, ever-changing natural environment that has sustained human life for millennia. Rivers appear even on the most ancient of maps – they were the avenues of commerce and travel before roads emerged. Many of the world’s great cities are located on rivers. Today, as always, streams and rivers form an endless connected network by which waters gathering in the tiniest of upland streams merge eventually to join the great outflows of fresh water to the oceans through major rivers like the Mississippi, the Columbia, and the Amazon.
Figure 1. Arc Hydro River and its four main components.
Rivers are living environments that sustain a web of ecological organisms ranging from fish down to macrophytes and microphytes, and an amazing variety of plant and animal life both in the water and in its surroundings, called in ecology, the riparian zone, or the transitional zone between aquatic ecology in the river itself and terrestrial ecology in the land away from the stream and river system. Sustaining the ecological integrity of rivers and riparian zones is an important policy objective for water resources planning and management in the face of increasing use of river waters to support human development.
2
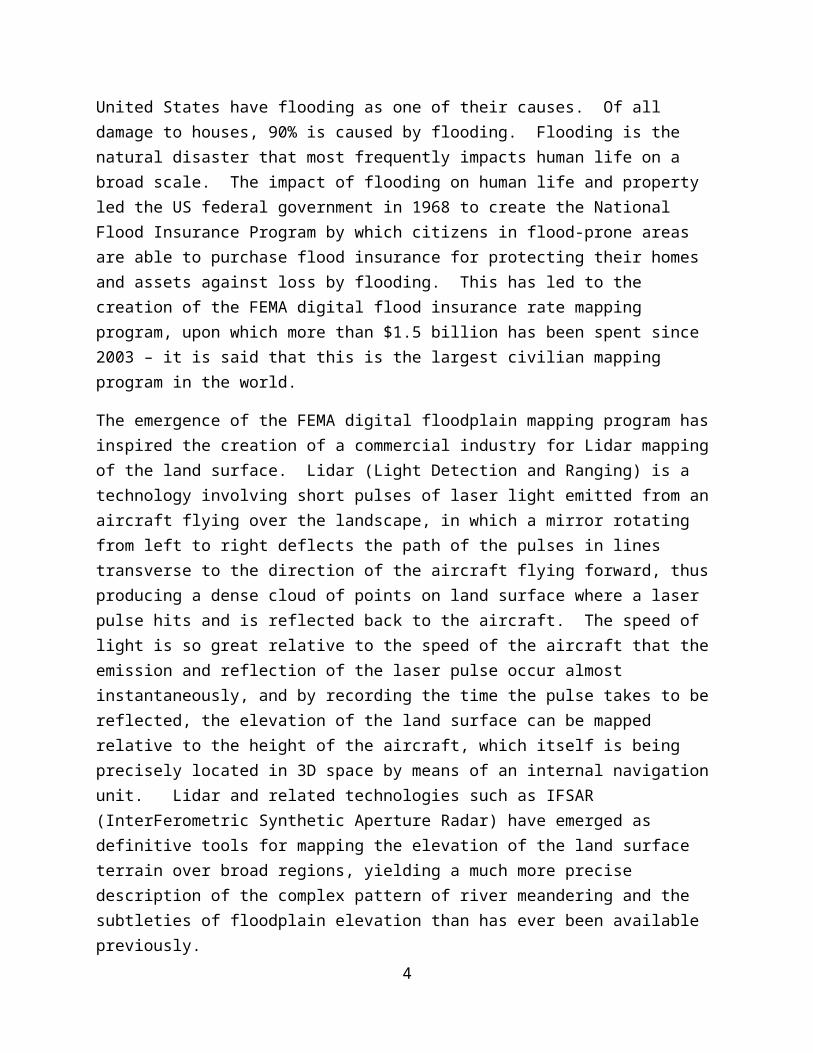
Rivers are also dangerous. Flash flooding can rage through a river system without warning and destroy in hours the labor of decades. Two-thirds of all federal disasters declared in the United States have flooding as one of their causes. Of all damage to houses, 90% is caused by flooding. Flooding is the natural disaster that most frequently impacts human life on a broad scale. The impact of flooding on human life and property led the US federal government in 1968 to create the National Flood Insurance Program by which citizens in flood-prone areas are able to purchase flood insurance for protecting their homes and assets against loss by flooding. This has led to the creation of the FEMA digital flood insurance rate mapping program, upon which more than $1.5 billion has been spent since 2003 – it is said that this is the largest civilian mapping program in the world.
The emergence of the FEMA digital floodplain mapping program has inspired the creation of a commercial industry for Lidar mapping of the land surface. Lidar (Light Detection and Ranging) is a technology involving short pulses of laser light emitted from an aircraft flying over the landscape, in which a mirror rotating from left to right deflects the path of the pulses in lines transverse to the direction of the aircraft flying forward, thus producing a dense cloud of points on land surface where a laser pulse hits and is reflected back to the aircraft. The speed of light is so great relative to the speed of the aircraft that the emission and reflection of the laser pulse occur almost instantaneously, and by recording the time the pulse takes to be reflected, the elevation of the land surface can be mapped relative to the height of the aircraft, which itself is being precisely located in 3D space by means of an internal navigation unit. Lidar and related technologies such as IFSAR (InterFerometric Synthetic Aperture Radar) have emerged as definitive tools for mapping the elevation of the land surface terrain over broad regions, yielding a much more precise description of the complex pattern of river meandering and the subtleties of floodplain elevation than has ever been available previously.
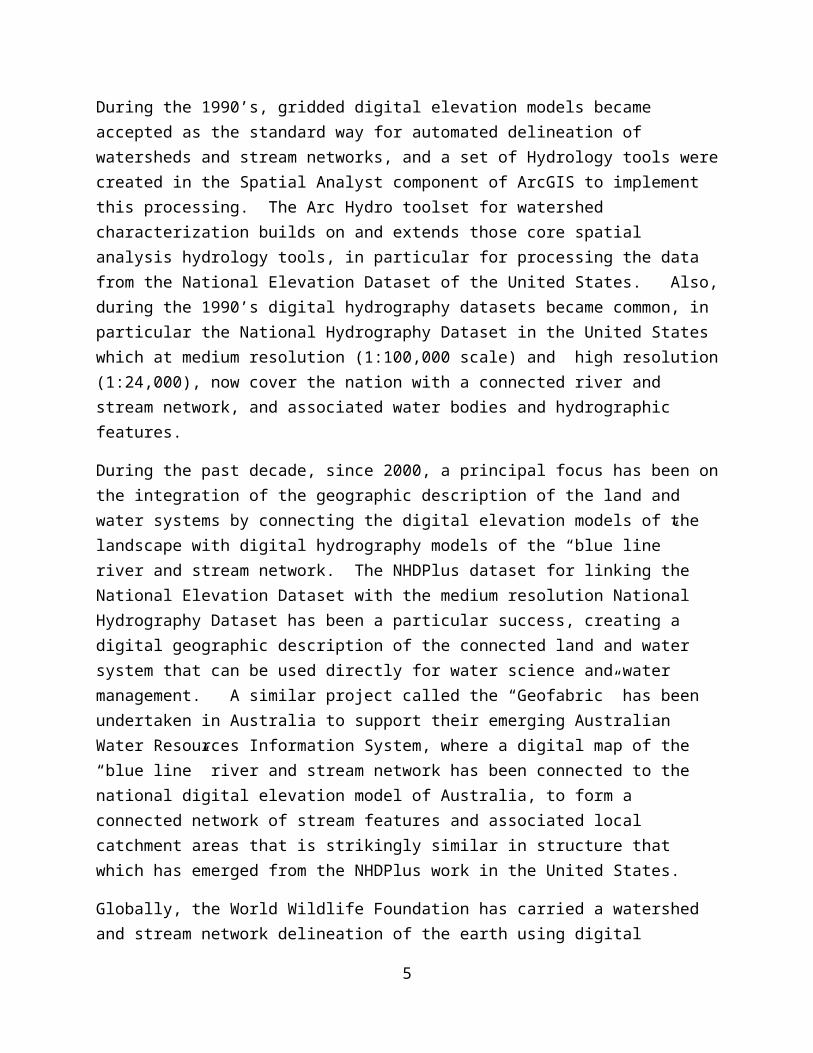
During the 1990’s, gridded digital elevation models became accepted as the standard way for automated delineation of watersheds and stream networks, and a set of Hydrology tools were created in the Spatial Analyst component of ArcGIS to implement this processing. The Arc Hydro toolset for watershed characterization builds on and extends those core spatial analysis hydrology tools, in particular for processing the data from the National Elevation Dataset of the United States. Also, during the 1990’s digital hydrography datasets became common, in particular the National Hydrography Dataset in the United States which at medium resolution (1:100,000 scale) and high resolution (1:24,000), now cover the nation with a connected river and stream network, and associated water bodies and hydrographic features.
During the past decade, since 2000, a principal focus has been on the integration of the geographic description of the land and water systems by connecting the digital elevation models of the landscape with digital hydrography models of the “blue line” river and stream network. The NHDPlus dataset for linking the National Elevation Dataset with the medium resolution National Hydrography Dataset has been a particular success, creating a digital geographic description of the connected land and water system that can be used directly for water science
3
and water management. A similar project called the “Geofabric” has been undertaken in Australia to support their emerging Australian Water Resources Information System, where a digital map of the “blue line” river and stream network has been connected to the national digital elevation model of Australia, to form a connected network of stream features and associated local catchment areas that is strikingly similar in structure that which has emerged from the NHDPlus work in the United States.
Globally, the World Wildlife Foundation has carried a watershed and stream network delineation of the earth using digital elevation model data from the Shuttle Radar Topography Mission (SRTM) that was flown in 2000. This global dataset, called HydroSheds, is now housed and made accessible by the US Geological Survey.
At the regional scale in Florida, over the last decade, many millions of dollars have been invested by the large Water Management Districts in creating Arc Hydro water network and catchment systems to support their water management functions within their areas of jurisdiction. A method is needed to link these datasets across jurisdictional boundaries, and to support different management functions by other levels of government, such as cities and counties, whose jurisdictional boundaries overlap those of the Water Management Districts.
All these factors lead to the conception of Arc Hydro River as having four components:
A river network component, which creates a geometric network of river and stream features, where each feature is associated with a local catchment area whose drainage contributes flow to that river or stream feature.
A 3D river channel component that supports detailed characterization of the surface terrain within and around rivers and water bodies based on data from Lidar and related sensing and surveying technologies.
A flood modeling and mapping component that supports river hydraulic simulation and associated floodplain mapping.
A river ecology and morphology component that supports characterization of stream habitat, mapping of fish and biota distributions, morphological description of stream environments such as pools, riffles, runs and reaches, and characterization of the sediment characteristics of the river, its bed and banks.
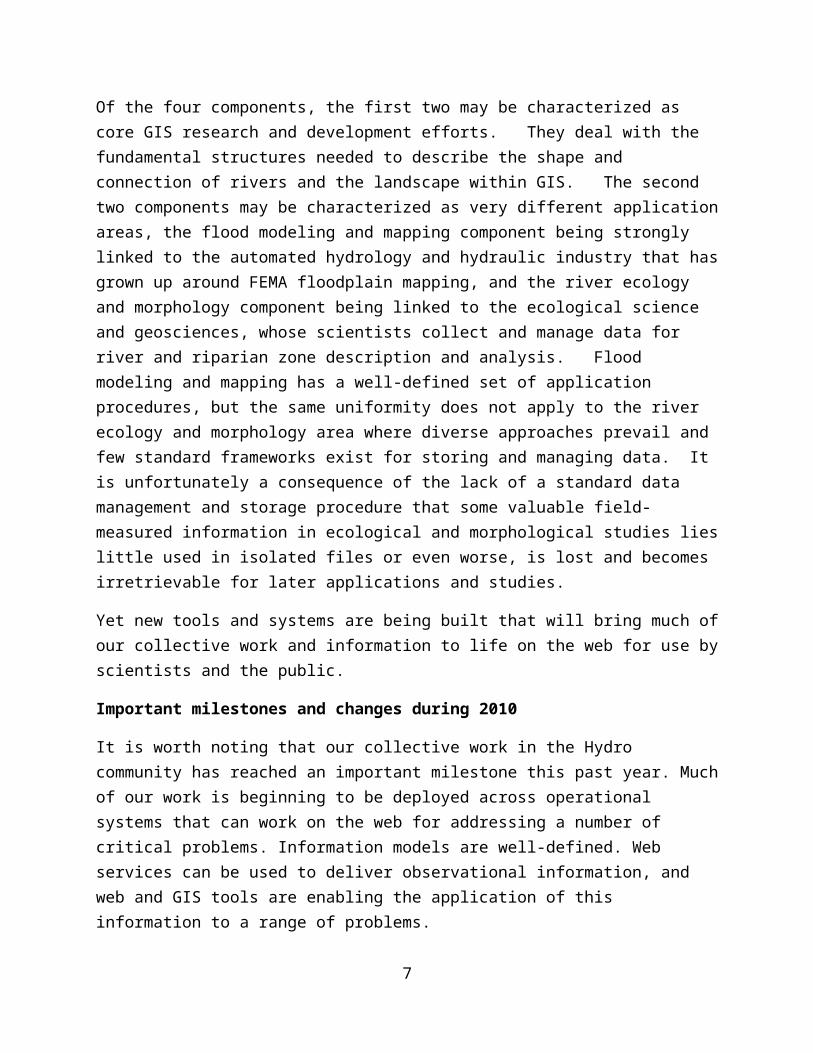
Of the four components, the first two may be characterized as core GIS research and development efforts. They deal with the fundamental structures needed to describe the shape and connection of rivers and the landscape within GIS. The second two components may be characterized as very different application areas, the flood modeling and mapping component being strongly linked to the automated hydrology and hydraulic industry that has grown up around FEMA floodplain mapping, and the river ecology and morphology component being linked to the ecological science and geosciences, whose scientists collect and manage data for river and riparian zone description and analysis. Flood modeling and mapping has a well-
4
defined set of application procedures, but the same uniformity does not apply to the river ecology and morphology area where diverse approaches prevail and few standard frameworks exist for storing and managing data. It is unfortunately a consequence of the lack of a standard data management and storage procedure that some valuable field-measured information in ecological and morphological studies lies little used in isolated files or even worse, is lost and becomes irretrievable for later applications and studies.
Yet new tools and systems are being built that will bring much of our collective work and information to life on the web for use by scientists and the public.
Important milestones and changes during 2010
It is worth noting that our collective work in the Hydro community has reached an important milestone this past year. Much of our work is beginning to be deployed across operational systems that can work on the web for addressing a number of critical problems. Information models are well-defined. Web services can be used to deliver observational information, and web and GIS tools are enabling the application of this information to a range of problems.
ArcHydro River is envisioned as an overarching framework that is intended to address many of these implementation initiatives as well as new research initiatives.
The Web 2.0 platform makes it possible for us to begin to operationalize our past work.
An Operational Online GIS Framework for Hydrological Science
In the past few years, the phenomenal growth in consumer web mapping has not only opened the eyes of the world to the value of maps and geography, it has likewise created a new pattern for the GIS community to easily disseminate and make its information available as high-quality maps and GIS analytic services. This pattern promises to improve how we deploy GIS for hydrology.
The work by GIS professionals and scientists has benefitted nearly every field of human endeavor — improving decision making and management, advancing science, enriching communication, and creating new ways of collaboration. While GIS is already making a difference in these organizations and communities, a number of unique trends promise ever more revolutionary use of GIS in the coming years. These breakthroughs will be fueled by the rich geographic content that is created and maintained by a vibrant and active community of GIS organizations and practitioners such as the Hydro community. Our maps and geographic information will be published on the web, and then discovered, accessed, and used by everyone.
Web and cloud computing will open up Hydro GIS use — and its use will go far beyond our current use by professionals.
5
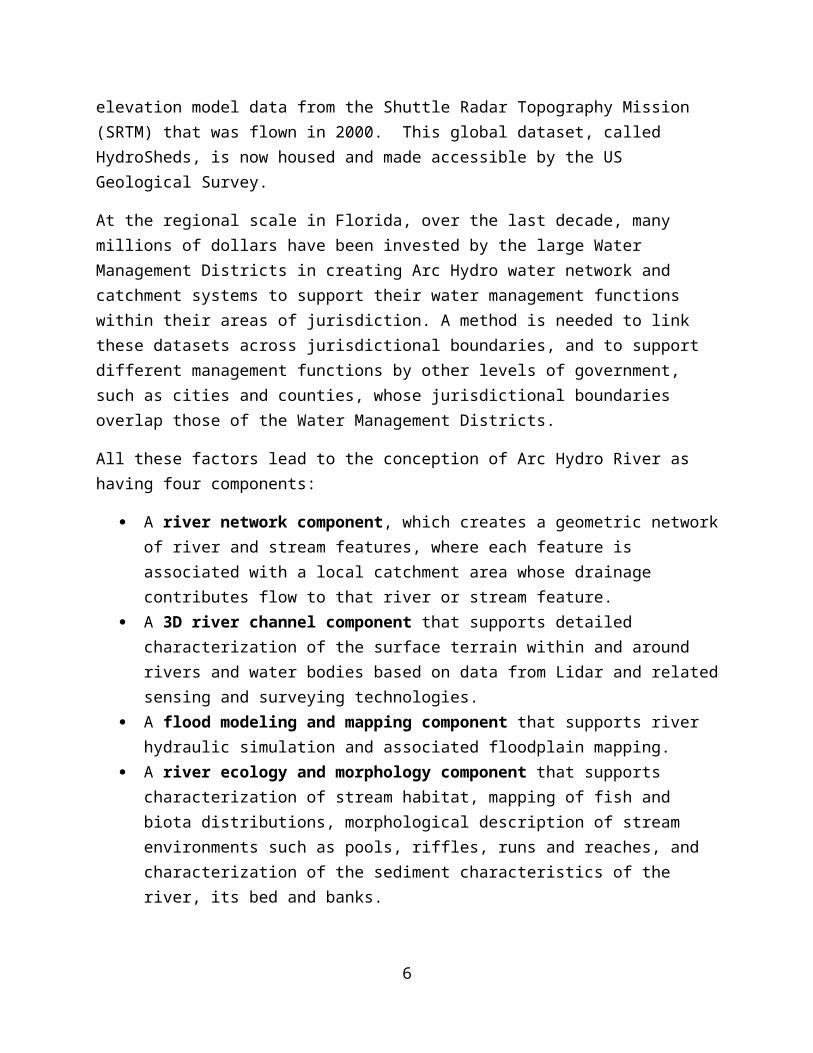
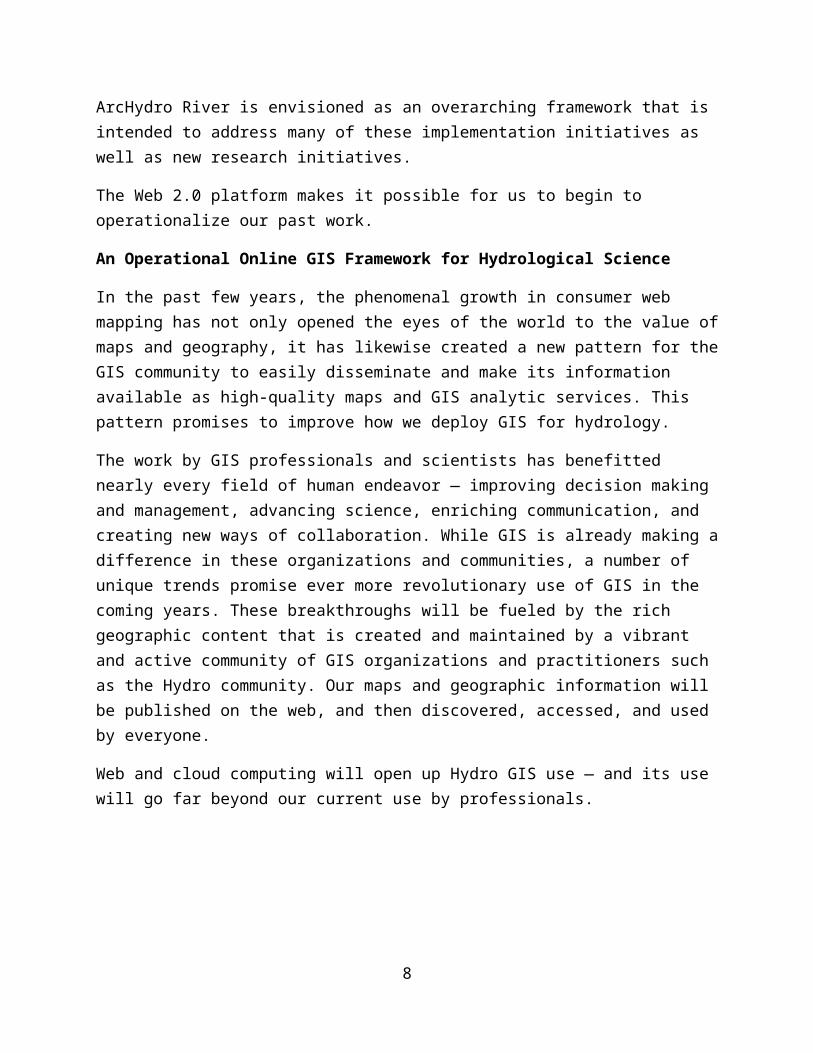
Figure 2. Views of the soon-to-be-released Community Hydro Base Map.
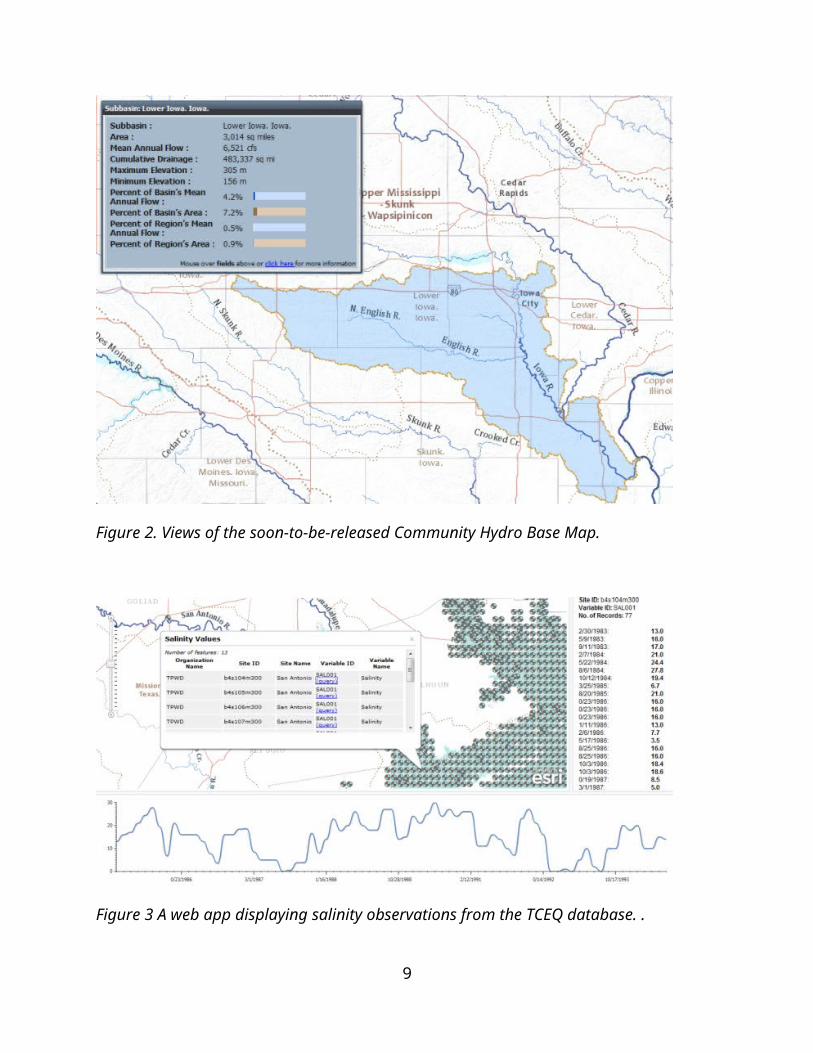
Figure 3 A web app displaying salinity observations from the TCEQ database. .
6
Sharing and Use of Authoritative Scientific Information and Models
At the heart of this vision is the large and rich collection of geographic and scientific information that is collected and maintained by hundreds of organizations. These organizations have built this critical, authoritative, and trusted geographic information within their own institutions. They also recognize the value of their data and are increasingly representing and sharing their geographic information as web map and GIS services because they want their information to be leveraged and used to make a difference.
An online GIS infrastructure brings all of this information together on the Web. Individual content from many organizations will be mashed up and combined in this new Web world. Geographic location will be used to integrate information across many organizations and disciplines. This vision for global integration of geographic information provides real synergy.
Most critically, anyone who has web access using a web browser or mobile client (such as an iPhone or an Android device) can access and use GIS. You won’t need specialized software on your computer or mobile.
The effect will be transformative and create real synergy across GIS organizations and society. Individual maps and collections of geographic information from GIS organizations will be fused and mashed up in creative ways and applied by many more users than ever before.
A new paradigm
Jack Dangermond has recently asserted that GIS is undergoing a modality shift. The shift resembles earlier, historic transformations in communications and entertainment media such as the introduction of motion pictures. When these shifts occur, the full creative utilization of the new medium usually lags behind the technology. People’s habits and assumptions remain lodged in the old paradigm until the full potential of the new medium is realized.
A shift of this nature is indeed occurring within GIS. The rapid development of web maps and GIS services, the use of location‐enabled mobile and tablet devices, cloud computing, and other factors are having a profound effect on how people access and use GIS and geospatial content.
Web 2.0 patterns for Hydro GIS
We envision ArcHydro River as an online system for using geographic information everywhere – that is authored and served by hydro scientists and GIS professionals on their internal servers and desktops, on enterprise servers, from on-premise servers out to selected users that are part of a community and to the public, and on “cloud” servers such as Amazon, Microsoft Azure, etc.
7
ArcHydro will be used everywhere and from any client – from GIS desktops and other desktops with no software using web browsers and lightweight mobile clients (all popular clients).
ArcHydro templates will create useful implementations of this framework for many applications and themes.
Hydro GIS follows a common web GIS pattern of base maps plus operational overlays.
We will be working hard to share this implementation pattern as map documents, geodatabase schemas, imagery, geoprocessing models, base maps, and other templates for GIS services for the Hydro community. We will also extend our community base map program for the Hydro community to support a number of key, continuous base maps for many critical Hydro applications. We view these as part of the GIS platform that would enable these future implementations. We want to do this in such a way that it is always building on each users’ existing work.
Elements of an online Hydro GIS.
8
There are a number of essential ingredients:
One or more multi-scale, continuous digital base maps Operational layers that include both the inputs into models as well as model results that
can be viewed, compared, and visualized. In addition, sensor feeds and other observations can be used as operational information (e.g., gage heights, rainfall, etc.).
Hydro and other analytical models. Tools for viewing and working with analytical results Operational geodatabases and observations datasets
We are now beginning to release content in the new Hydro Resource Center along with web apps and the underlying datasets and services that go with these. In this work, we must do more than simply add each new service on an individual basis and as each new opportunity arises. We want to do more to lay out a strategy to identify and publish useful services that become an integral part of key applications that we are all interested in.
We will define (and design) these services to be a part of such an overall initiative.
At this time, we know that we will publish the following:
A community Hydro Base map service. This would be a continuous base map of hydro for the world. Initially it would be for the U.S. only, but why couldn’t we incorporate Australia, NZ, etc.? And could we begin to promote that every nation will want a hydro base map for their nation.
A community elevation service. A community soils base map. Operational** Layers for a selected range of Hydro activities. ** “Operational” means
that these are not just database archives or research types of approaches. These are live, curated services that deliver the available data in a prepared, ready-to-use format and that are served using efficient, modern web techniques. This is necessary so that these data can be efficiently and effectively put to work in operations and in scientific apps. For example, these will include:
o Stream gauge network services. o Water quality serviceso Flood serviceso Rainfall services
Volunteer information (e.g., it’s flooding at my house). These locations and their elevation could be used to derive flood boundaries, etc.
A focused and planned series of web apps and maps that enable selected activities to be performed using this information, such as for public information access about floods, etc.
We sense that now is the time to transform parts of our collective work from a research-oriented approach to one in which content and tools are made operational and accessible through an
9

online GIS for a focused set of useful applications that leverage the great science and conclusions of the past decade. As part of ArcHydro River, we want to develop this concept and to test it.
10
TO BE CONTINUED…..
TO COME
Development of a community hydro base map
Underlying the base map with an “analysis” or “operational” layer of a connected river and catchment network
Overlaying the base map with “observations” layers of precipitation, streamflow and water quality information through time.
Processes for building the base map and its associated “analysis” and “observations” layers
Geoprocessing functions for integration of information across the layers (e.g. automated watershed delineation from a point on the stream network and acquisition and analysis of observations information contained within that area)
Incorporation of the core layers in ArcGIS.com, and association with “application layers” that use a set of points or segments to subdivide the core network and thus to tessellate the landscape into subwatersheds for a particular purpose – the management of multiple water management functions across a water agency using a single core network common to all.
Definition of the functional requirements for river and floodplain characterization for flood modeling and mapping
Definition of the functional requirements for river ecology and morphology characterization.
11