Embed Size (px)
Citation preview
Marissa Levine, MD, MPHState Health Commissioner
September 7, 2016
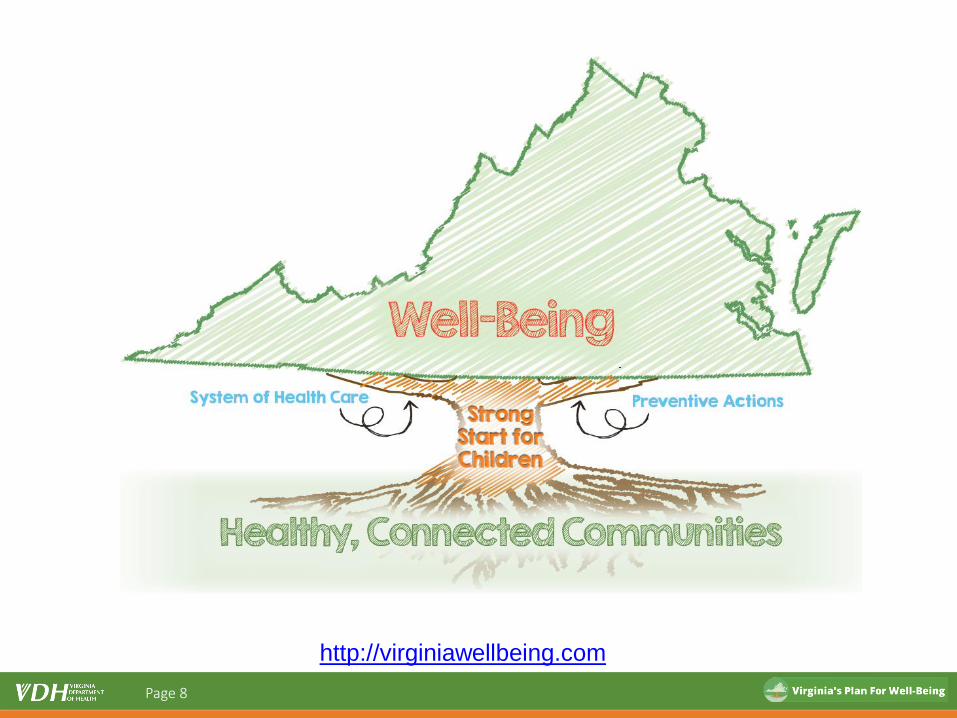
Virginia’s Plan for Well-Being
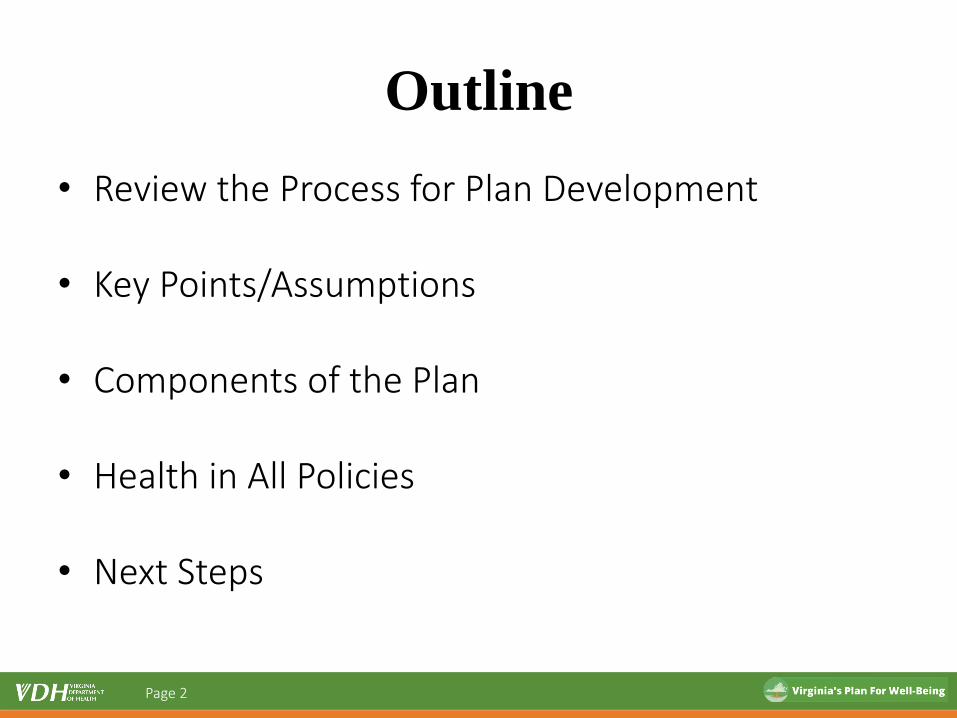
Outline
• Review the Process for Plan Development
• Key Points/Assumptions
• Components of the Plan
• Health in All Policies
• Next Steps
Page 2
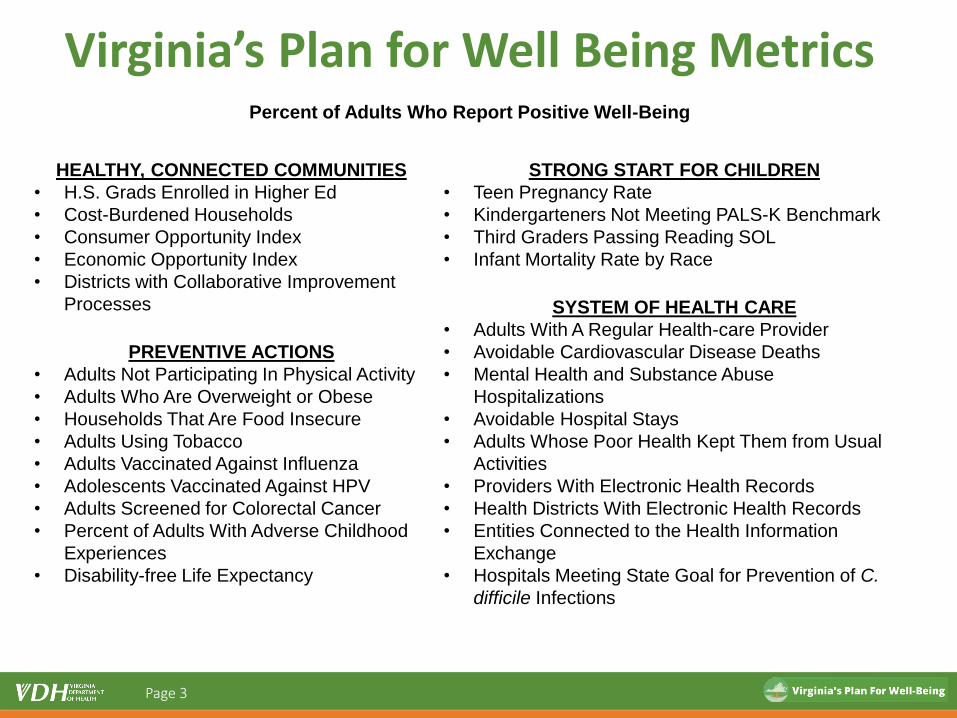
HEALTHY, CONNECTED COMMUNITIES
• H.S. Grads Enrolled in Higher Ed
• Cost-Burdened Households
• Consumer Opportunity Index
• Economic Opportunity Index
• Districts with Collaborative Improvement
Processes
PREVENTIVE ACTIONS
• Adults Not Participating In Physical Activity
• Adults Who Are Overweight or Obese
• Households That Are Food Insecure
• Adults Using Tobacco
• Adults Vaccinated Against Influenza
• Adolescents Vaccinated Against HPV
• Adults Screened for Colorectal Cancer
• Percent of Adults With Adverse Childhood
Experiences
• Disability-free Life Expectancy
STRONG START FOR CHILDREN
• Teen Pregnancy Rate
• Kindergarteners Not Meeting PALS-K Benchmark
• Third Graders Passing Reading SOL
• Infant Mortality Rate by Race
SYSTEM OF HEALTH CARE
• Adults With A Regular Health-care Provider
• Avoidable Cardiovascular Disease Deaths
• Mental Health and Substance Abuse
Hospitalizations
• Avoidable Hospital Stays
• Adults Whose Poor Health Kept Them from Usual
Activities
• Providers With Electronic Health Records
• Health Districts With Electronic Health Records
• Entities Connected to the Health Information
Exchange
• Hospitals Meeting State Goal for Prevention of C.
difficile Infections
Virginia’s Plan for Well Being MetricsPercent of Adults Who Report Positive Well-Being
Page 3
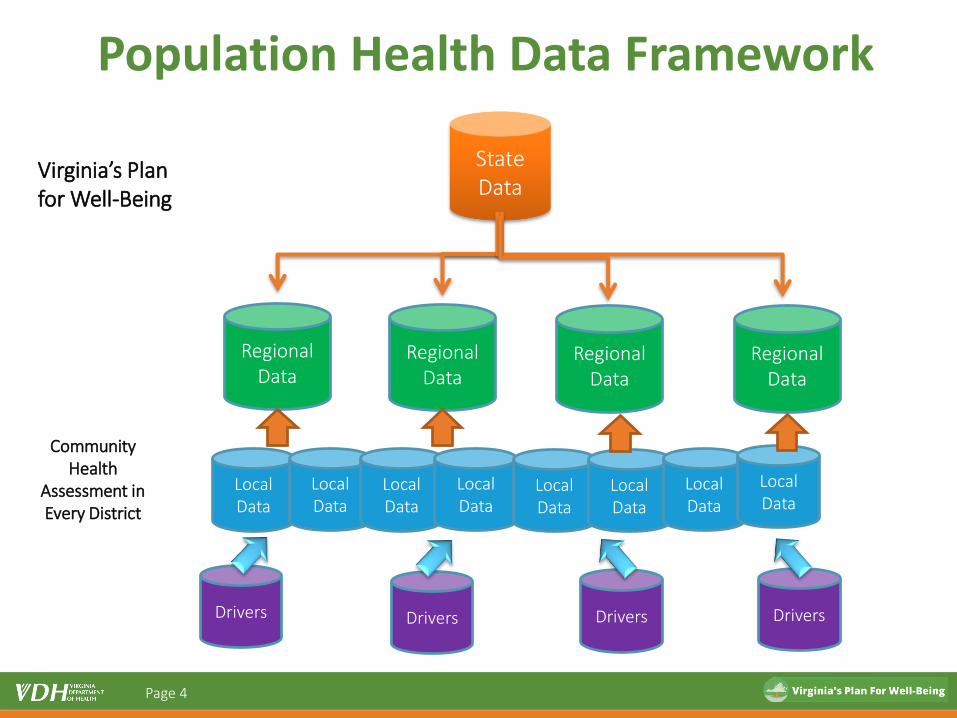
Population Health Data Framework
Drivers Drivers
StateData
Regional Data
Regional Data
Regional Data
Regional Data
Local Data
Local Data
Local Data
Local Data
Local Data
Local Data
Local Data
Local Data
Drivers Drivers
Community Health
Assessment in Every District
Page 4
Virginia’s Plan for Well-Being
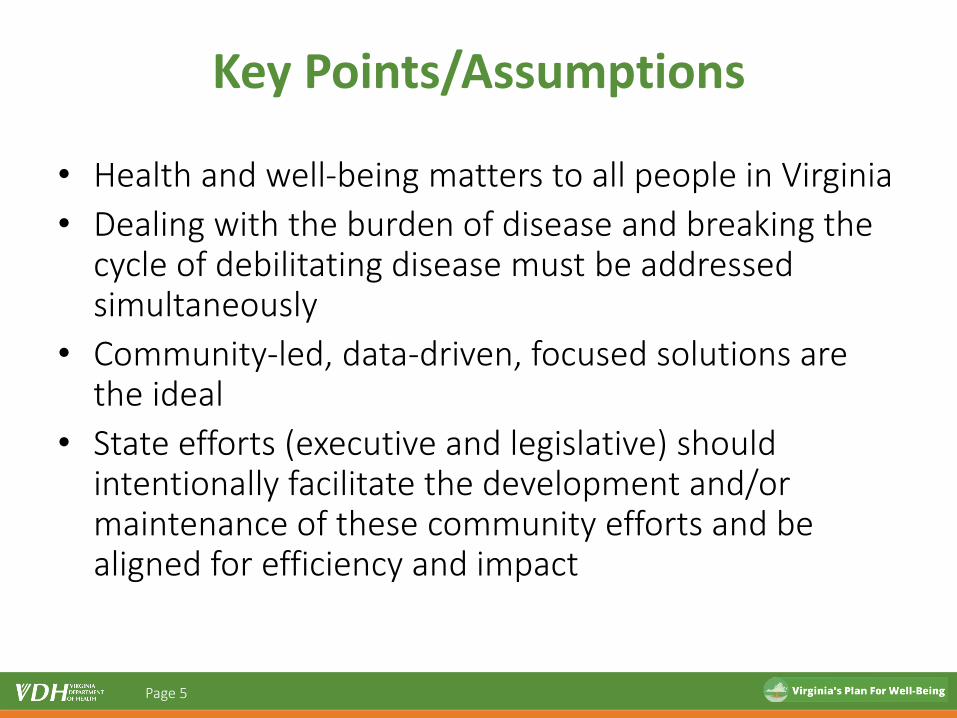
Key Points/Assumptions
• Health and well-being matters to all people in Virginia
• Dealing with the burden of disease and breaking the cycle of debilitating disease must be addressed simultaneously
• Community-led, data-driven, focused solutions are the ideal
• State efforts (executive and legislative) should intentionally facilitate the development and/or maintenance of these community efforts and be aligned for efficiency and impact
Page 5
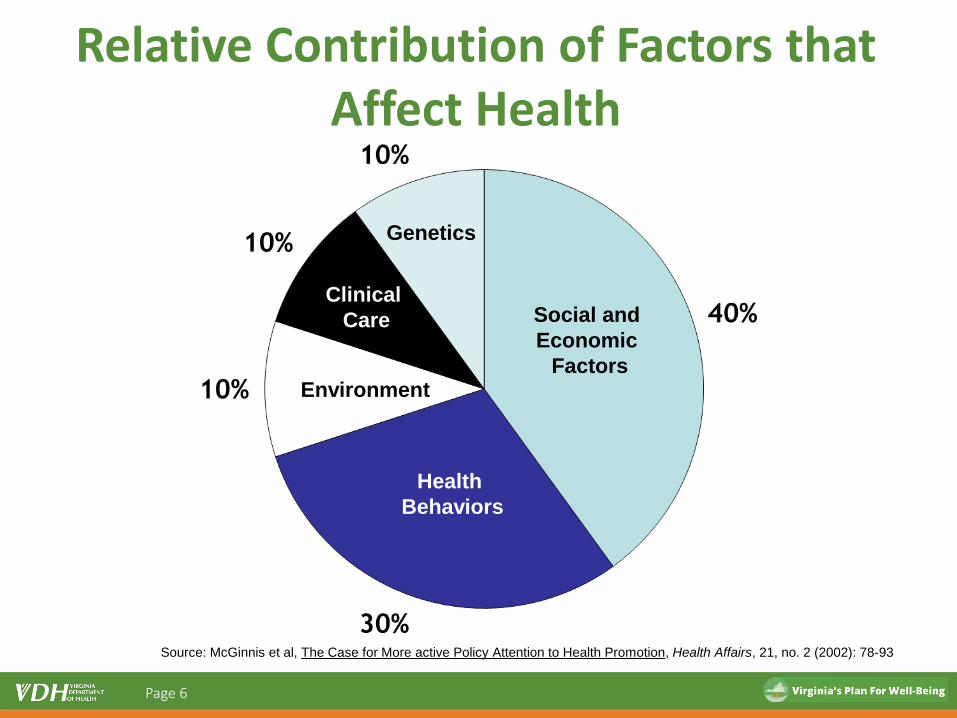
Relative Contribution of Factors that Affect Health
Social and
Economic
Factors
Health
Behaviors
Clinical
Care
Genetics
Environment
Source: McGinnis et al, The Case for More active Policy Attention to Health Promotion, Health Affairs, 21, no. 2 (2002): 78-93
Page 6
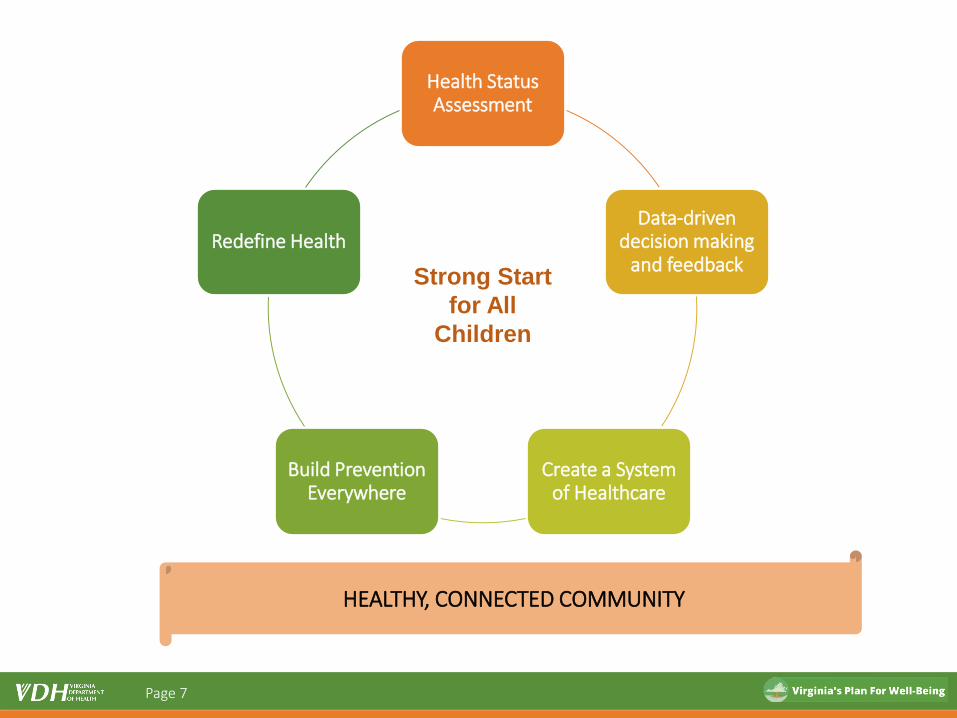
Health Status Assessment
Data-driven decision making
and feedback
Create a System of Healthcare
Build Prevention Everywhere
Redefine Health
Strong Start
for All
Children
HEALTHY, CONNECTED COMMUNITY
Page 7
Aim 1: Healthy, Connected
Communities
Page 9
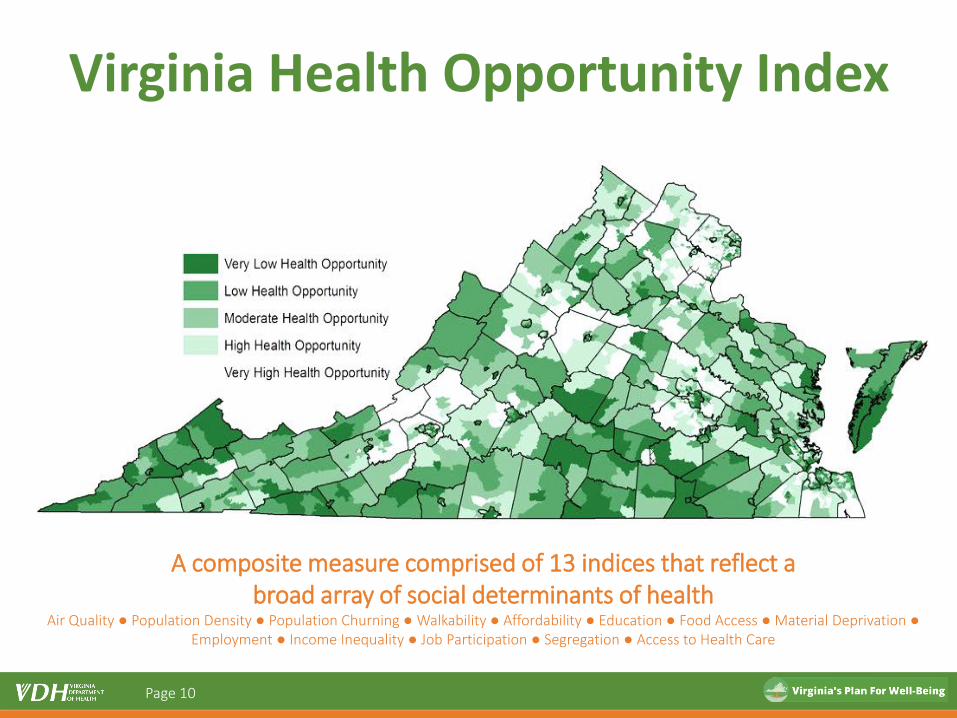
A composite measure comprised of 13 indices that reflect a broad array of social determinants of health
Air Quality ● Population Density ● Population Churning ● Walkability ● Affordability ● Education ● Food Access ● Material Deprivation ●Employment ● Income Inequality ● Job Participation ● Segregation ● Access to Health Care
Virginia Health Opportunity Index
Page 10
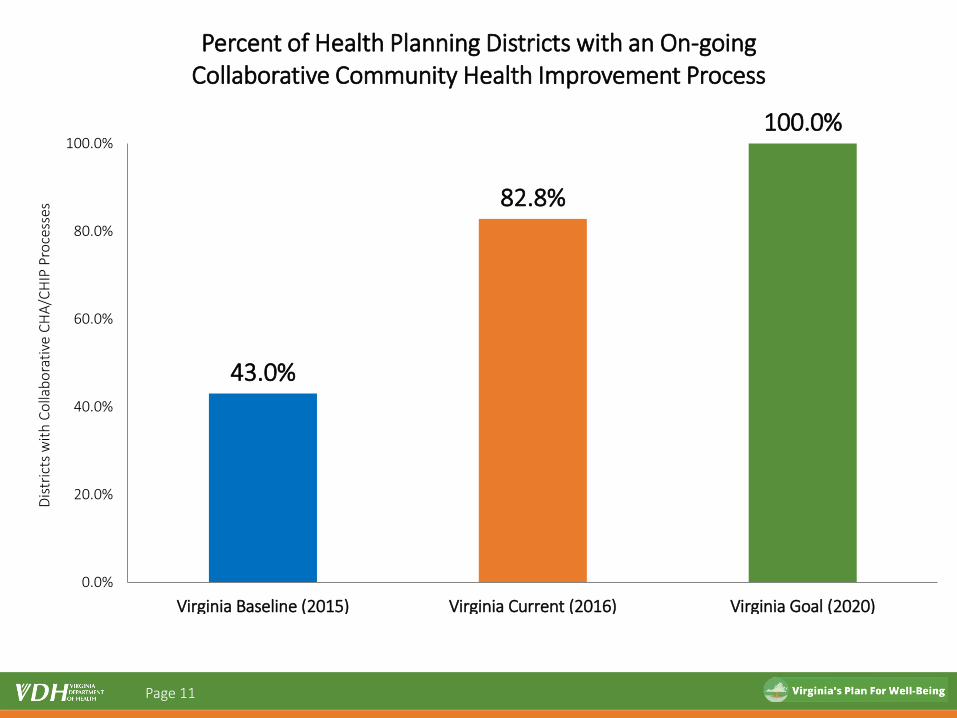
43.0%
82.8%
100.0%
0.0%
20.0%
40.0%
60.0%
80.0%
100.0%
Virginia Baseline (2015) Virginia Current (2016) Virginia Goal (2020)
Dis
tric
ts w
ith
Co
llab
ora
tive
CH
A/C
HIP
Pro
cess
esPercent of Health Planning Districts with an On-going
Collaborative Community Health Improvement Process
Page 11
Aim 2:Strong Start for
Children
Page 12
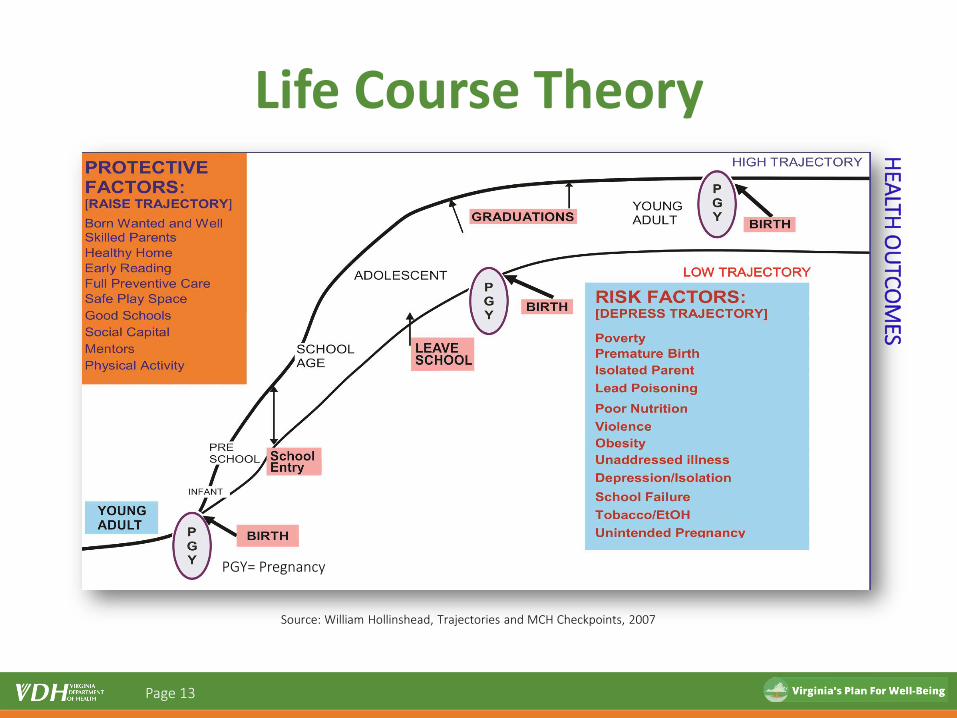
Source: William Hollinshead, Trajectories and MCH Checkpoints, 2007
Life Course Theory
PGY= Pregnancy
HEA
LTH O
UTC
OM
ES
Page 13
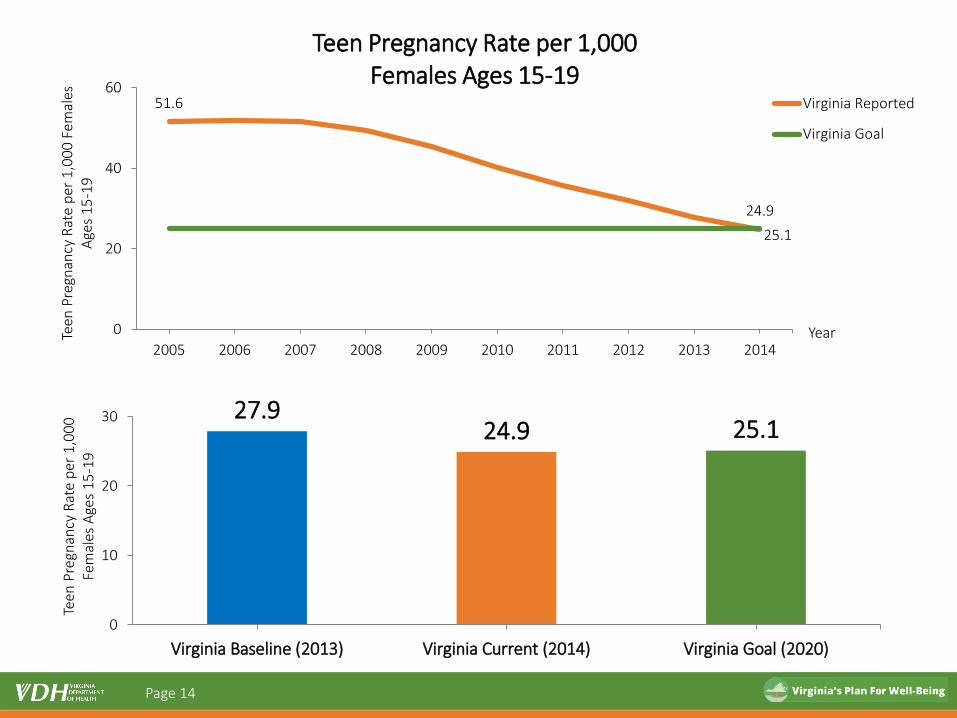
51.6
24.9
25.1
0
20
40
60
2005 2006 2007 2008 2009 2010 2011 2012 2013 2014
Teen
Pre
gnan
cy R
ate
per
1,0
00
Fem
ales
A
ges
15
-19
Year
Teen Pregnancy Rate per 1,000 Females Ages 15-19
Virginia Reported
Virginia Goal
27.924.9 25.1
0
10
20
30
Virginia Baseline (2013) Virginia Current (2014) Virginia Goal (2020)
Teen
Pre
gnan
cy R
ate
per
1,0
00
Fe
mal
es A
ges
15
-19
Page 14
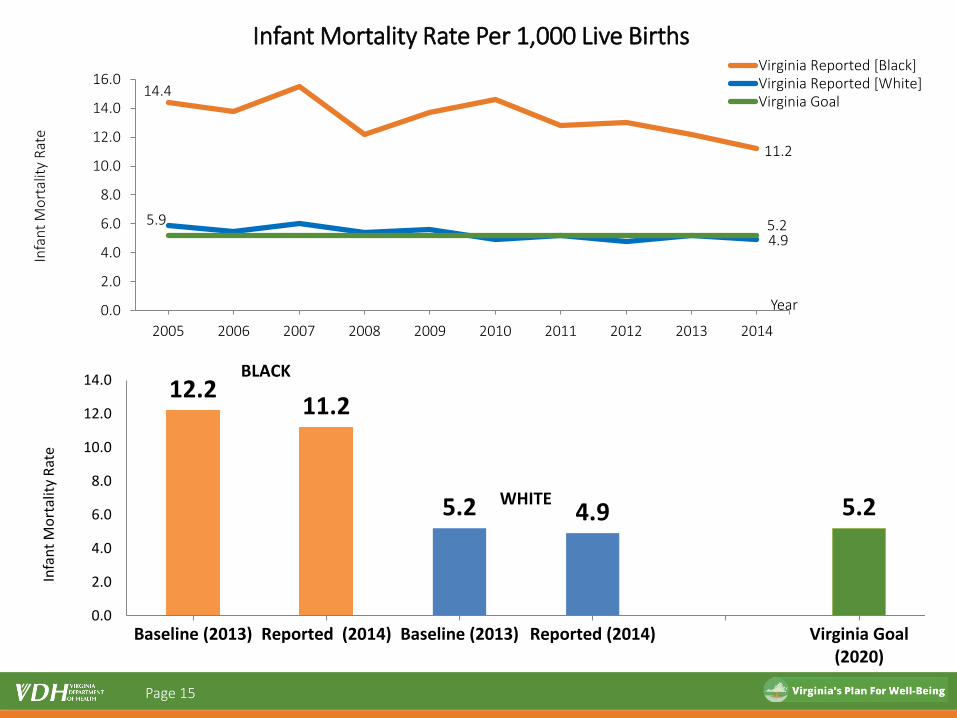
14.4
11.2
5.9
4.95.2
0.0
2.0
4.0
6.0
8.0
10.0
12.0
14.0
16.0
2005 2006 2007 2008 2009 2010 2011 2012 2013 2014
Infa
nt
Mo
rtal
ity
Rat
e
Year
Infant Mortality Rate Per 1,000 Live BirthsVirginia Reported [Black]Virginia Reported [White]Virginia Goal
12.211.2
5.2 4.9 5.2
0.0
2.0
4.0
6.0
8.0
10.0
12.0
14.0
Baseline (2013) Reported (2014) Baseline (2013) Reported (2014) Virginia Goal(2020)
Infa
nt
Mo
rtal
ity
Rat
e
BLACK
WHITE
Page 15
Page 16
Aim 3:Preventive Actions
Page 17
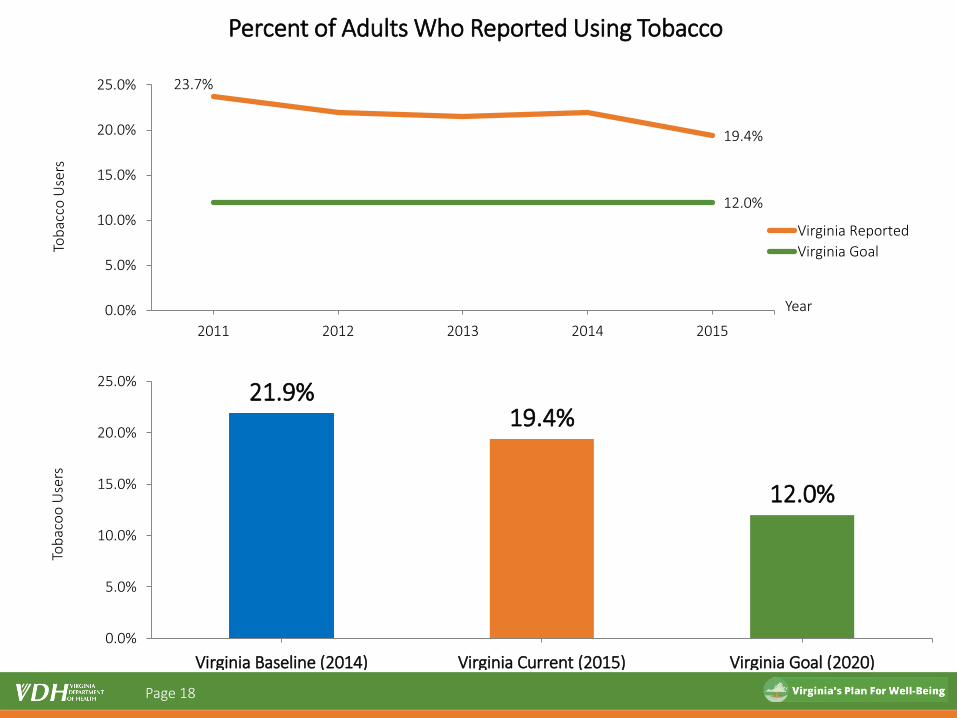
23.7%
19.4%
12.0%
0.0%
5.0%
10.0%
15.0%
20.0%
25.0%
2011 2012 2013 2014 2015
Tob
acco
Use
rs
Year
Percent of Adults Who Reported Using Tobacco
Virginia Reported
Virginia Goal
21.9%19.4%
12.0%
0.0%
5.0%
10.0%
15.0%
20.0%
25.0%
Virginia Baseline (2014) Virginia Current (2015) Virginia Goal (2020)
Tob
aco
o U
sers
Page 18
Aim 4:System of Health Care
Page 19
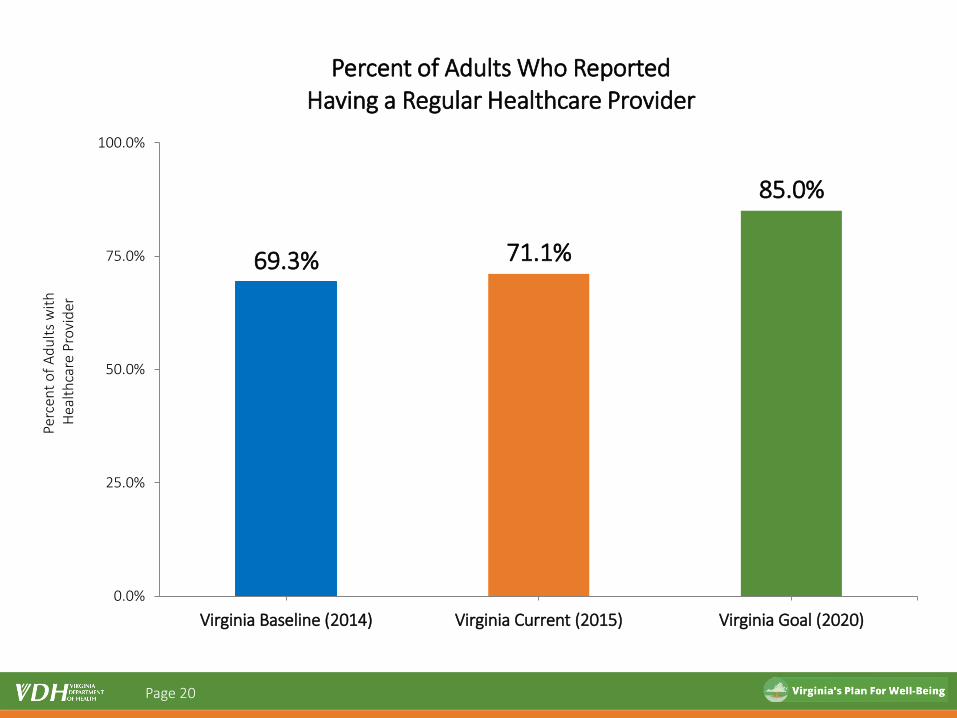
69.3% 71.1%
85.0%
0.0%
25.0%
50.0%
75.0%
100.0%
Virginia Baseline (2014) Virginia Current (2015) Virginia Goal (2020)
Perc
ent
of
Ad
ult
s w
ith
Hea
lth
care
Pro
vid
erPercent of Adults Who Reported
Having a Regular Healthcare Provider
Page 20
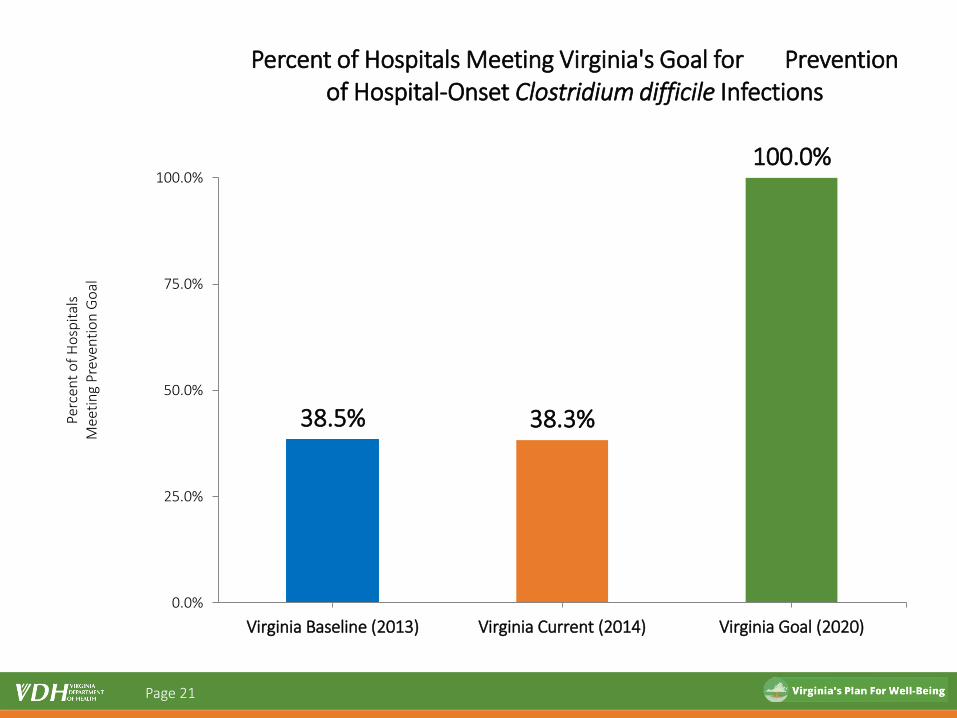
38.5% 38.3%
100.0%
0.0%
25.0%
50.0%
75.0%
100.0%
Virginia Baseline (2013) Virginia Current (2014) Virginia Goal (2020)
Perc
ent
of
Ho
spit
als
Mee
tin
g Pr
even
tio
n G
oal
Percent of Hospitals Meeting Virginia's Goal for Prevention of Hospital-Onset Clostridium difficile Infections
Page 21
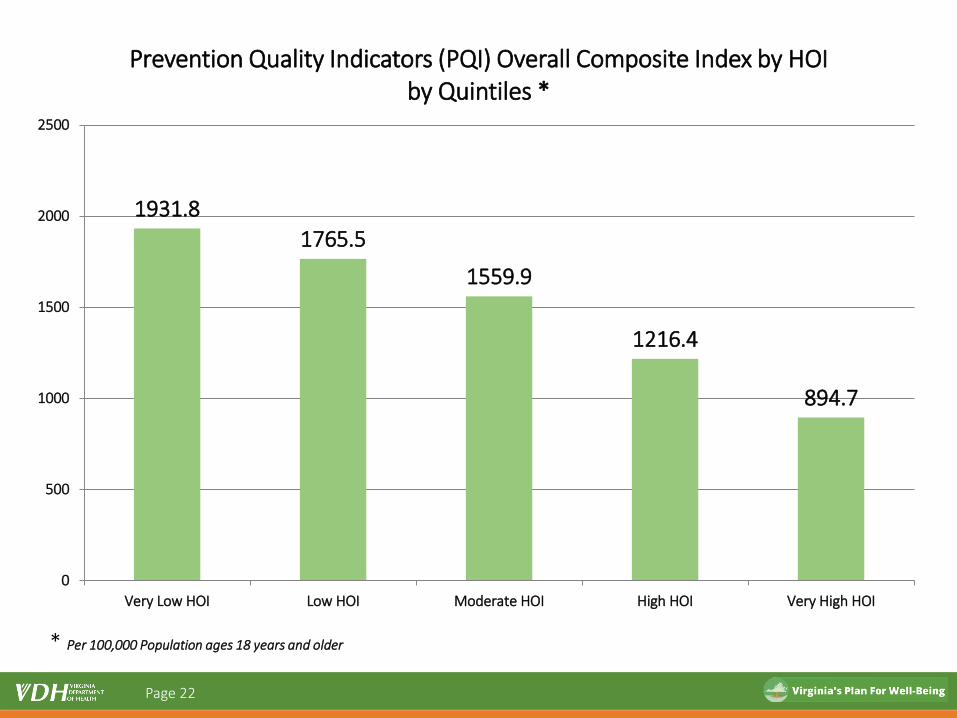
1931.8
1765.5
1559.9
1216.4
894.7
0
500
1000
1500
2000
2500
Very Low HOI Low HOI Moderate HOI High HOI Very High HOI
Prevention Quality Indicators (PQI) Overall Composite Index by HOI by Quintiles *
* Per 100,000 Population ages 18 years and older
Page 22
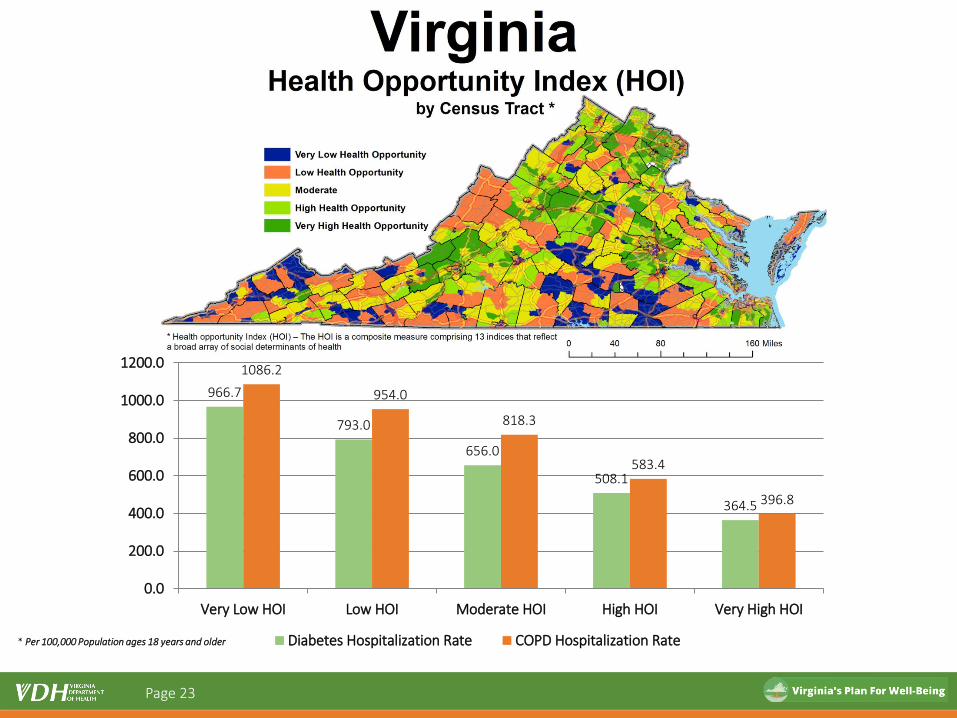
966.7
793.0
656.0
508.1
364.5
1086.2
954.0
818.3
583.4
396.8
0.0
200.0
400.0
600.0
800.0
1000.0
1200.0
Very Low HOI Low HOI Moderate HOI High HOI Very High HOI
Diabetes Hospitalization Rate COPD Hospitalization Rate* Per 100,000 Population ages 18 years and older
Page 23
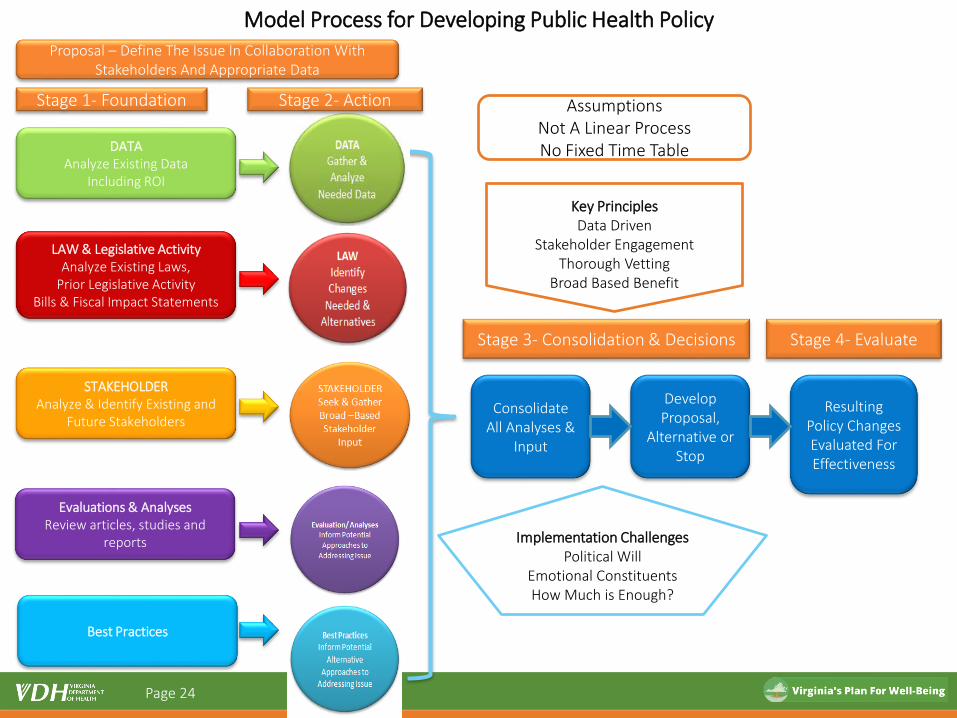
Proposal – Define The Issue In Collaboration With Stakeholders And Appropriate Data
Stage 1- Foundation
DATAAnalyze Existing Data
Including ROI
LAW & Legislative ActivityAnalyze Existing Laws,
Prior Legislative ActivityBills & Fiscal Impact Statements
STAKEHOLDER Analyze & Identify Existing and
Future Stakeholders
Stage 3- Consolidation & Decisions
Consolidate All Analyses &
Input
Develop Proposal,
Alternative or Stop
Model Process for Developing Public Health Policy
Evaluations & AnalysesReview articles, studies and
reports
Best Practices
Key Principles Data Driven
Stakeholder Engagement Thorough Vetting
Broad Based Benefit
AssumptionsNot A Linear ProcessNo Fixed Time Table
Stage 2- Action
Stage 4- Evaluate
Implementation ChallengesPolitical Will
Emotional ConstituentsHow Much is Enough?
Resulting Policy Changes Evaluated For Effectiveness
Page 24
References
• Virginia’s Plan for Well-Being
– http://virginiawellbeing.com/
• Virginia Health Opportunity Index
– https://www.vdh.virginia.gov/omhhe/hoi/
• Health in All Policies - NCSL
– http://www.ncsl.org/research/environment-and-natural-resources/health-in-all-policies.aspx
Page 25
Summary and Questions
Page 26