Embed Size (px)
Citation preview
American Institute of Aeronautics and Astronautics
1
Viscous Flow Analysis of a Twin-engine Commercial
Transport Aircraft in High Lift Landing Configuration
Rajesh Ranjan1, Abhishek Khare
2, Stimit Shah
3, Kishor Nikam
4
Computational Research Laboratories Ltd., Pune, India, 411016
and
Anutosh Moitra 5
The Boeing Company, Seattle, USA
Extensive unstructured-grid CFD analysis has been performed for predicting
performance of a twin-engine commercial transport airplane in landing configuration. The
objective of the work was to identify and resolve complex gridding and solver related issues
relevant to accurate prediction of complex flow physics associated with airplane high-lift
systems. A variety of grid generation and CFD solution techniques were investigated for
their efficacy in predicting performance of a complete airplane including high-lift devices
e.g., multiple flaps and slats, and nacelle chines. Both steady and unsteady Reynolds
Averaged Navier-Stokes (RANS) solution techniques were utilized. The role of relevant flow-
physics phenomena in attainment of maximum lift as well as computational requirements
for adequately modeling these phenomena were investigated. Computed aerodynamic forces
are compared with available wind-tunnel test data.
I. Introduction
rediction of flow over aircraft in high-lift configuration is of critical and vital importance in aircraft design.
Small increases in lift-coefficient can result in relatively large performance benefits in terms of payload and
range. This importance has prompted a great deal of effort undertaken by the fluid dynamics research community
towards understanding the complex flow phenomena1 associated with airplanes in high-lift flight conditions.
Achieving that objective still presents a major challenge due to large complexities in the geometry of airplanes with
deployed high-lift devices and the resulting flow-field characterized by flow separation, reattachment,
wake/boundary-layer interactions, boundary-layer transition and other phenomena as yet not routinely tractable by
CFD methods even for two-dimensional computations 2,3
, or for simplified geometries 4. Validation of CFD methods
for high-lift prediction is further complicated by scarcity of publicly available wind-tunnel test data and by issues
related to accurate modeling of the effects of tunnel-wall interferences 5. A validated CFD method for accurately
predicting airplane performance in high-lift mode will pay large dividends in the airplane design process by
reducing design cycle time. While CFD is not expected to replace wind-tunnel testing, it can help reduce design
costs by reducing the number of needed tests. This principally was the motivation for the present work.
The work described here was part of a collaborative project undertaken by Computational Research Laboratories
(CRL), Pune, India, and the Boeing Company, Seattle, USA with the objective of identifying and addressing current
limitations in CFD technologies for analysis of high-lift aerodynamics of airplanes and prediction of maximum lift.
A previous phase of the collaborative project had addressed basic CFD issues using a simplified high-lift
configuration, the NASA Trapezoidal Wing – a generic high-lift wing with leading and trailing-edge devices6.
Results from this previous phase were documented by Khare, et al.7 The current phase builds on process
1 Member of Technical Staff
2 Member of Technical Staff
3 Member of Technical Staff
4 Senior Engineer and Head, CFD
5 Associate Technical Fellow-Boeing, Associate Fellow-AIAA
P
American Institute of Aeronautics and Astronautics
2
improvements developed in the previous phase and extends them to a real-world airplane configuration based on
Boeing’s 777 airplane model. Recent advances in CFD solver technologies as well as high-performance computing
platforms have provided feasible means for addressing the challenges of computing high-lift flow-fields. The present
work utilized Metacomp Technologies’ CFD++ suite of flow solvers executed on CRL’s massively parallel
computing system eka – currently the largest commercially available supercomputer in the world.
CFD++ solutions were obtained in both steady and
unsteady modes. While steady Reynolds Averaged Navier-
Stokes (RANS) solutions were found adequate at low to
moderate angles of attack, unsteady RANS was utilized in
attempts to resolve the unsteady flow-fields characteristic
of high angles of attack. Grid refinement studies were
performed to establish grid densities required for resolving
complexities in the geometry and associated flow
phenomena. Massively parallel computing technology was
exploited wherever possible in pre-processing, solver, and
post-processing phases to reduce analysis cycle time.
Subsequent sections of this paper will describe details
of geometry and grid preparation, flow simulation, CFD
analysis results, and comparisons with available test data
followed by conclusions and an indication of future work.
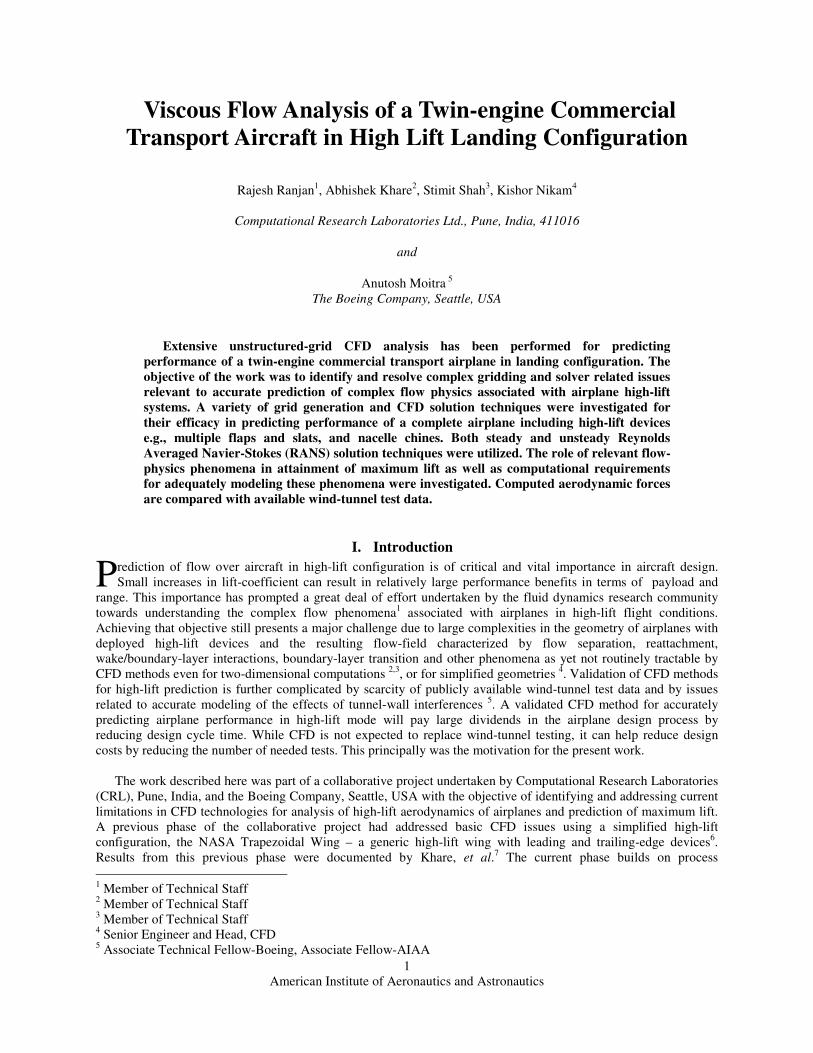
II. Geometry and Grids
The geometry model for the airplane configuration studied
in this work was provided by Boeing Commercial Airplane
(BCA) pre-configured for high-lift analysis. No changes or
modifications were made to this geometry to facilitate CFD
analysis. The full-scale model had all high-lift devices pre-
positioned in a landing configuration. The model included
inboard and outboard flap, slats and a krueger leading-edge
device. It also included the engine-nacelle with a chine
vortex generator. Horizontal tail surfaces and landing gear
were not included in the model.
Wing
Fuselage
Slat
a. Inboard
Slat
Wing
b. Outboard
Figure 2. Surface grid distribution in wing
leading edge
American Institute of Aeronautics and Astronautics
3
The grid systems used in the present work were generated using Boeing’s Modular Aerodynamic Design
Computational Analysis Process (MADCAP) and Advancing Front Local Reconnection (AFLR3) grid generator.
MADCAP is a surface grid generator which takes surfaces in various formats such as STL, IGES etc. Geometry pre-
processing and surface parameterization prior to input to MADCAP were accomplished using Boeing’s System for
Low-Speed Unstructured Grid Generation (SLUGG) software system. AFLR3 is a volume grid generator which
takes a triangulated surface grid in UGRID format and generates volume grid on that. AFLR3 generates the volume
grid in two steps. In the first step it generates the viscous grid with prisms elements. Size and number of layers of
prisms can be controlled by input parameters given to
AFLR3. In the second step of volume grid generation
AFLR3 uses advancing front algorithm to fill the
remaining domain with tetrahedral elements.
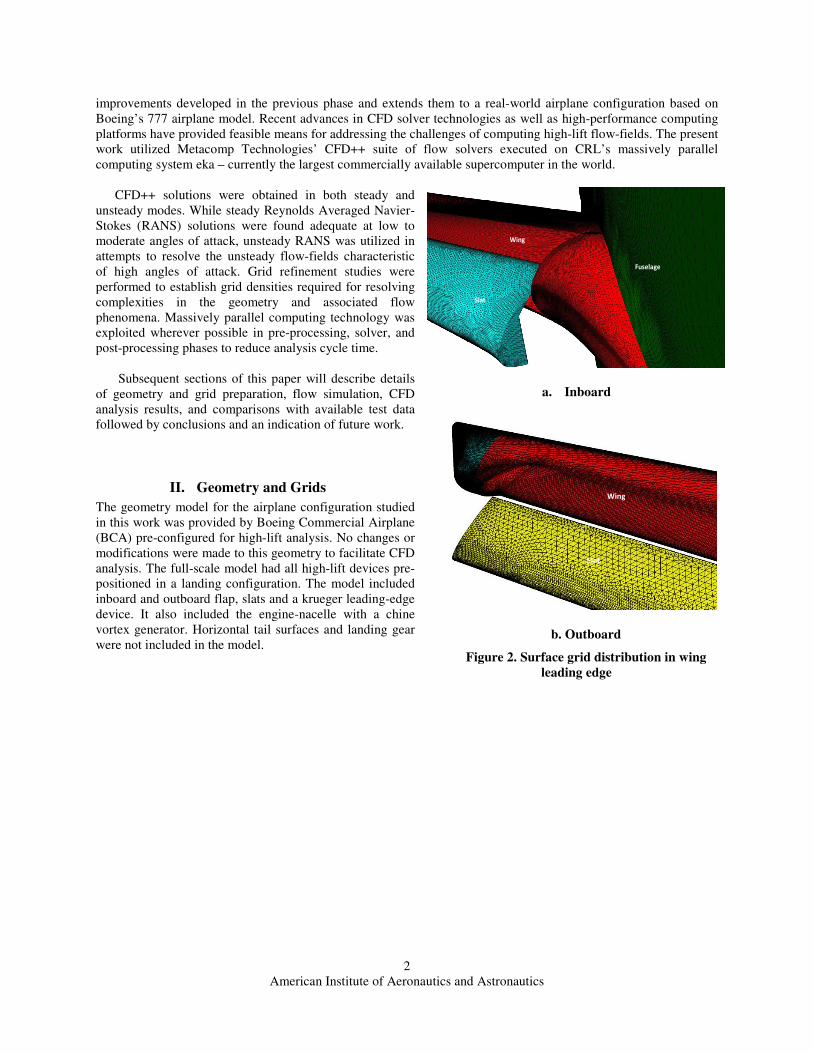
An initial grid study was performed in order to identify
areas of the grid in need of further enrichment. These
areas included the wing-body junction, gaps between
elements – both chord-wise and span-wise, coves and
wing-tips. The initial normal spacing at the solid
surface was chosen to correspond to a y+ value of 1.0.
Different values of the grid stretching-ratio were
investigated for improvements in the resolution of the
boundary layers and wakes. Apart from this no special
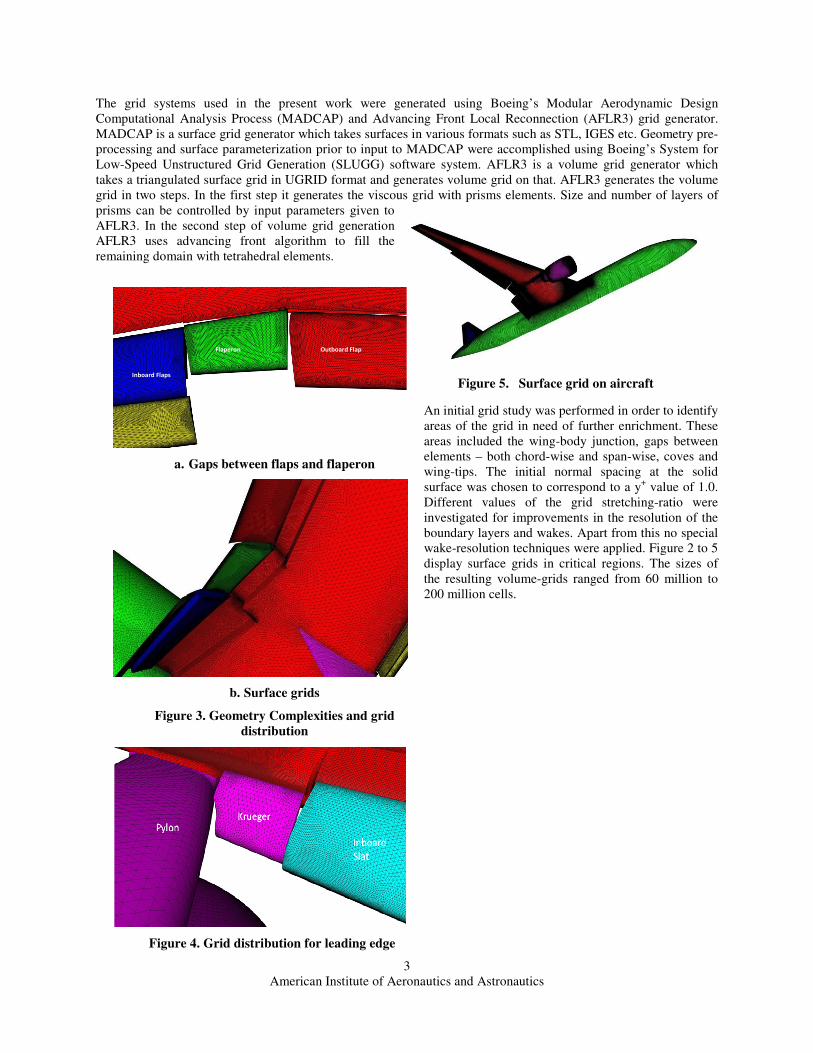
wake-resolution techniques were applied. Figure 2 to 5
display surface grids in critical regions. The sizes of
the resulting volume-grids ranged from 60 million to
200 million cells.
Inboard Flaps
Flaperon Outboard Flap
a. Gaps between flaps and flaperon
b. Surface grids
Figure 3. Geometry Complexities and grid
distribution
Figure 4. Grid distribution for leading edge
Figure 5. Surface grid on aircraft
American Institute of Aeronautics and Astronautics
4
III. Flow Simulation and Analysis of Results
A. Flow Solver
A compressible Reynolds Averaged Navier Stokes solver, CFD++ has been used to perform simulations. CFD++
uses cell centered, finite volume and implicit/explicit algorithms to solve the Navier Stokes equations on
unstructured/structured grids. In CFD++ various topography parameter free models are used to capture turbulent
flow features. The nonlinear subset of these models accounts for Reynolds stress anisotropy and streamline
curvature. All turbulence models can be integrated directly to the wall
or with a sophisticated wall function which accounts for
compressibility as well. In the present study all results were computed
by integrating to the wall surface. A minmod flux limiter is enabled to
limit the interpolation slope in the second order solution scheme.
Convergence of the simulation results varied with the turbulence
model used and the angle of attack.
B. Simulation Conditions
Simulation conditions for the current analysis are tabulated in table
1. These conditions correspond to 4.2% scaled down model as tested
in wind tunnel. For computational analysis a full-scale airplane model
was used in free-air mode, i.e., no wind-tunnel walls were modeled in
the computational scheme. CFD results were obtained at the Reynolds
number corresponding to wind-tunnel tests. Results
were compared with test data corrected for wind-
tunnel wall and blockage interference effects.
A rectangular domain of size 100 times the body
length in all three directions was used for simulations.
Free stream pressure and velocity are imposed at the
boundaries. Solve to wall approach was used and the
grid was resolved to a small Y+ (less than 1) value.
The flow was assumed to be fully turbulent and
different turbulence models were used to capture
turbulent flow-fields and wake features. Both steady
and unsteady simulations were carried out.
The simulations have been performed by CRL
researchers on CRL’s massively parallel
supercomputer eka, situated at Computational
Research Laboratories, Ltd., Pune, India. “eka” is a
cluster of high-end compute nodes connected with
high speed communications networks. With 1800
nodes, the system has a peak compute capacity of 172
teraflops and has achieved sustained compute capacity
of 132.8 teraflops for the LINPACK benchmark.
The principal objective of this collaborative effort
between Boeing and CRL was to determine and
address issues related to current shortcomings of CFD
processes for predicting maximum lift produced by
aircraft high-lift systems. Therefore the present
analyses investigated the lift-coefficient CL as the
principal metric. The drag coefficient CD has been
presented as an auxiliary metric but no special
attention was directed towards its accurate prediction.
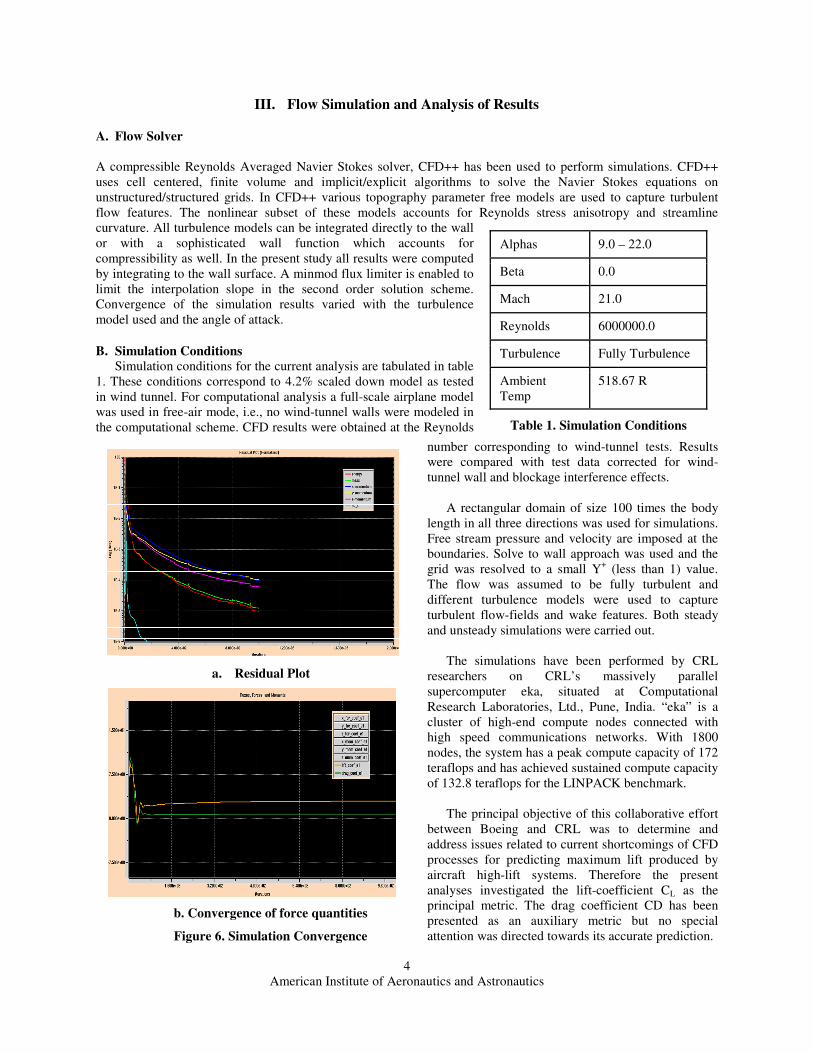
a. Residual Plot
b. Convergence of force quantities
Figure 6. Simulation Convergence
Alphas 9.0 – 22.0
Beta 0.0
Mach 21.0
Reynolds 6000000.0
Turbulence Fully Turbulence
Ambient
Temp
518.67 R
Table 1. Simulation Conditions
American Institute of Aeronautics and Astronautics
5
Each steady state simulation on EKA takes around 24 hours of wall time to complete 1000 implicit iterations on
a grid size of around 90 million grid cells with 192 processors. Convergence histories of both residuals and forces
were monitored as shown in Figure 6. The simulation is considered to be converged when the energy or density
residual reaches five orders reduction in value and the change in lift coefficient is no more than 1 count for the last
100 iterations.
C. Steady RANS Results
The first phase of the project used steady-state RANS computations for predicting CL values at various angles of
attack. Although a highly accurate prediction of the absolute value of maximum CL is not strictly required for
airplane design, a CFD process must demonstrate its ability to accurately model all flow phenomena associated with
high-lift configurations at and beyond stall in order to establish its validity as a design tool.
Initial computations were performed for angles of
attack ranging from -5 to 25 degrees and results were
compared with experimental data in order to establish
limitations of the CFD process in accurately predicting test
data. Representative convergence plots for residuals and lift
coefficient are shown in Figure 6. It was found that while
reasonable agreement between computed and test data was
obtained in the linear range of the CL-alpha curve, severe
discrepancies were noted as the angle of attack approached
the value corresponding to maximum lift. Later phase of
this study therefore focused on lift prediction at high angles
of attack.
A baseline grid system was generated using Boeing
provided grid parameter values in SLUGG defining surface
and volume grid densities. These parameter values have
been deemed to satisfy minimum grid requirements as a
result of previous work at Boeing. This grid system had a
normal grid stretching-ratio of 1.23.The baseline grid
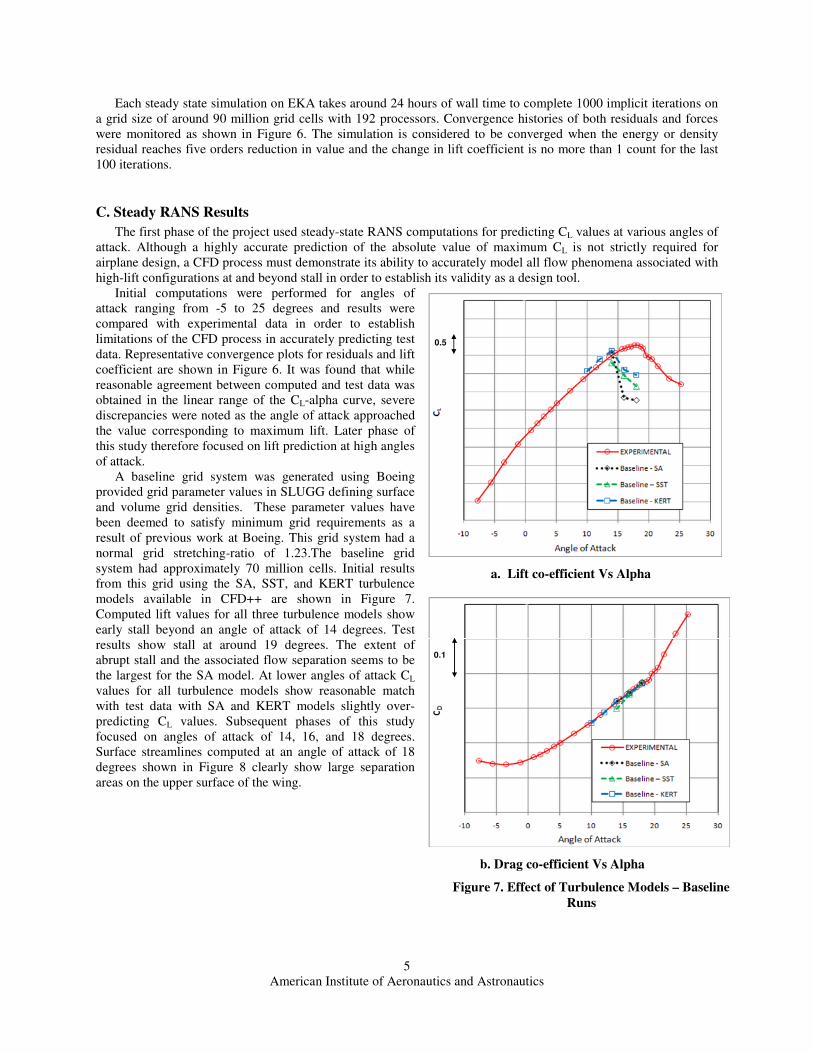
system had approximately 70 million cells. Initial results
from this grid using the SA, SST, and KERT turbulence
models available in CFD++ are shown in Figure 7.
Computed lift values for all three turbulence models show
early stall beyond an angle of attack of 14 degrees. Test
results show stall at around 19 degrees. The extent of
abrupt stall and the associated flow separation seems to be
the largest for the SA model. At lower angles of attack CL
values for all turbulence models show reasonable match
with test data with SA and KERT models slightly over-
predicting CL values. Subsequent phases of this study
focused on angles of attack of 14, 16, and 18 degrees.
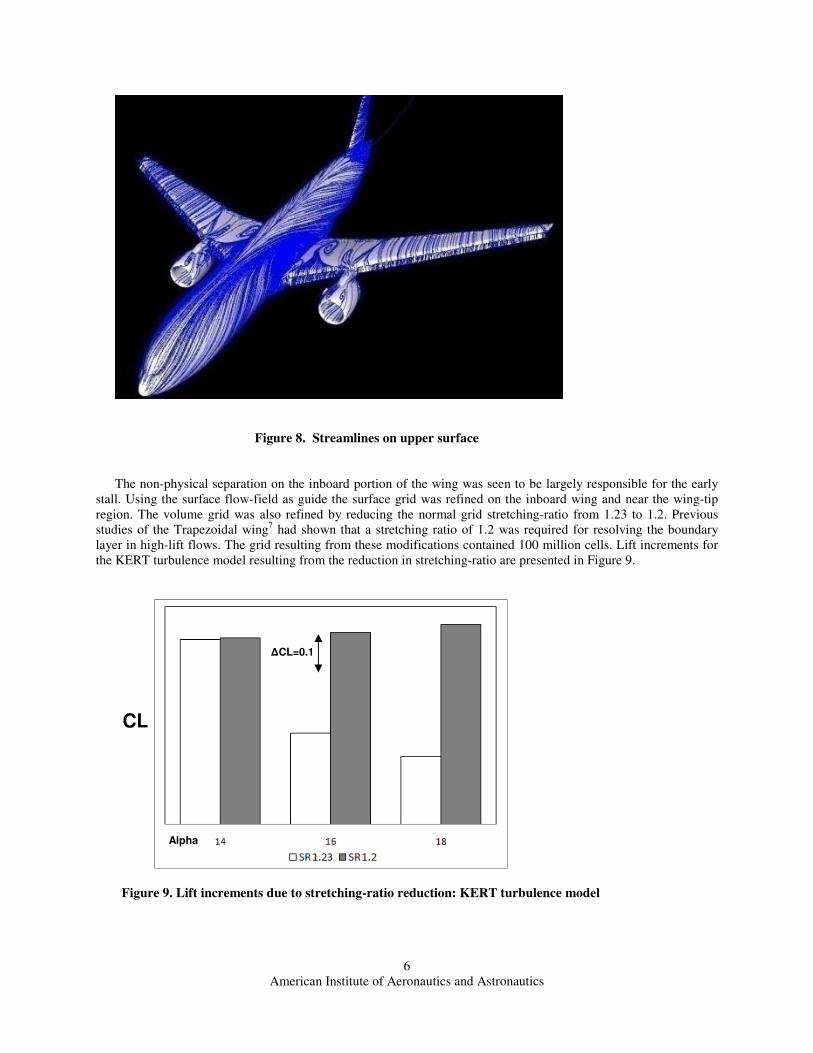
Surface streamlines computed at an angle of attack of 18
degrees shown in Figure 8 clearly show large separation
areas on the upper surface of the wing.
0.50.5
a. Lift co-efficient Vs Alpha
0.10.1
b. Drag co-efficient Vs Alpha
Figure 7. Effect of Turbulence Models – Baseline
Runs
American Institute of Aeronautics and Astronautics
6
Figure 8. Streamlines on upper surface
The non-physical separation on the inboard portion of the wing was seen to be largely responsible for the early
stall. Using the surface flow-field as guide the surface grid was refined on the inboard wing and near the wing-tip
region. The volume grid was also refined by reducing the normal grid stretching-ratio from 1.23 to 1.2. Previous
studies of the Trapezoidal wing7 had shown that a stretching ratio of 1.2 was required for resolving the boundary
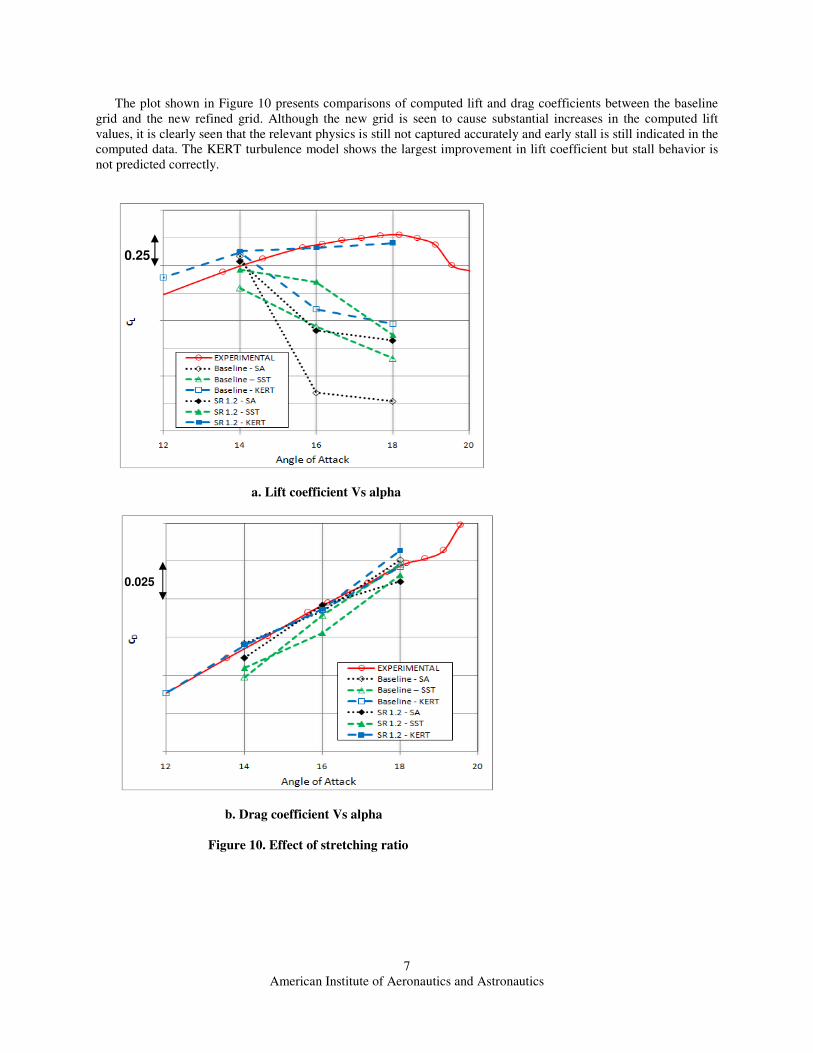
layer in high-lift flows. The grid resulting from these modifications contained 100 million cells. Lift increments for
the KERT turbulence model resulting from the reduction in stretching-ratio are presented in Figure 9.
Figure 9. Lift increments due to stretching-ratio reduction: KERT turbulence model
∆CL=0.1
CL
Alpha
American Institute of Aeronautics and Astronautics
7
The plot shown in Figure 10 presents comparisons of computed lift and drag coefficients between the baseline
grid and the new refined grid. Although the new grid is seen to cause substantial increases in the computed lift
values, it is clearly seen that the relevant physics is still not captured accurately and early stall is still indicated in the
computed data. The KERT turbulence model shows the largest improvement in lift coefficient but stall behavior is
not predicted correctly.
a. Lift coefficient Vs alpha
b. Drag coefficient Vs alpha
Figure 10. Effect of stretching ratio
0.025
0.25
American Institute of Aeronautics and Astronautics
8
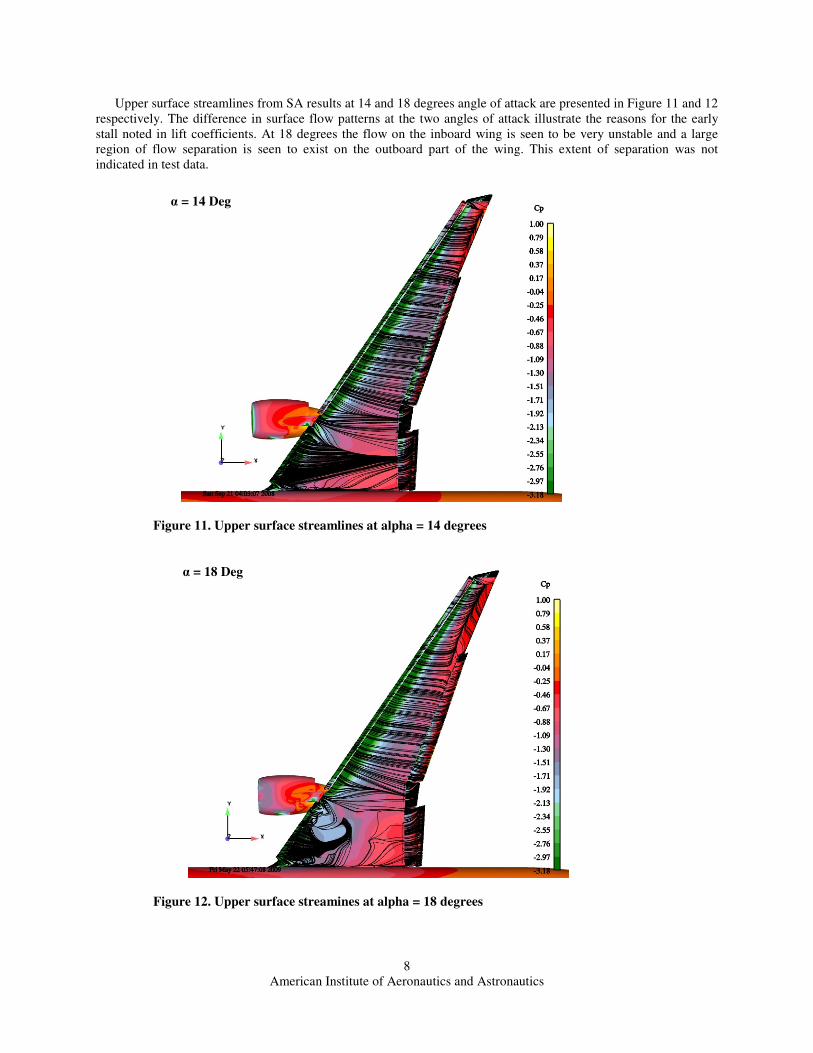
Upper surface streamlines from SA results at 14 and 18 degrees angle of attack are presented in Figure 11 and 12
respectively. The difference in surface flow patterns at the two angles of attack illustrate the reasons for the early
stall noted in lift coefficients. At 18 degrees the flow on the inboard wing is seen to be very unstable and a large
region of flow separation is seen to exist on the outboard part of the wing. This extent of separation was not
indicated in test data.
Figure 11. Upper surface streamlines at alpha = 14 degrees
Figure 12. Upper surface streamines at alpha = 18 degrees
α = 18 Deg
α = 14 Deg
American Institute of Aeronautics and Astronautics
9
Based on these computational experiments it was concluded that the reasons for the discrepancies between
computational and test data could be related to the inherent unsteadiness of high-lift flow-fields at high angles of
attack. The inboard wing flow-field is characterized by strong and unsteady interactions of the nacelle-chine vortex
with the wing boundary layer. Previous attempts at resolving this issue have been reported by Rogers, et al.8, and
Slotnick, et al9. A steady-state computational model may not be adequate for accurately capturing this interaction.
To explore this possibility, unsteady RANS computations were undertaken in the next phase of the project.
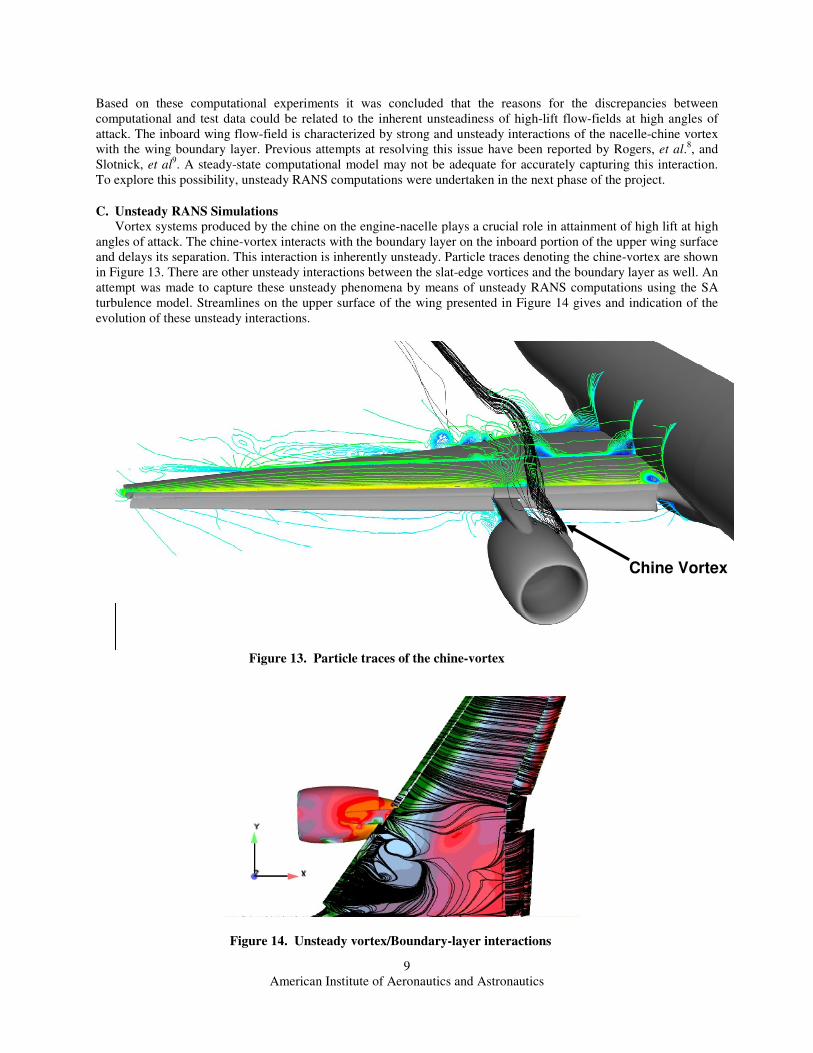
C. Unsteady RANS Simulations
Vortex systems produced by the chine on the engine-nacelle plays a crucial role in attainment of high lift at high
angles of attack. The chine-vortex interacts with the boundary layer on the inboard portion of the upper wing surface
and delays its separation. This interaction is inherently unsteady. Particle traces denoting the chine-vortex are shown
in Figure 13. There are other unsteady interactions between the slat-edge vortices and the boundary layer as well. An
attempt was made to capture these unsteady phenomena by means of unsteady RANS computations using the SA
turbulence model. Streamlines on the upper surface of the wing presented in Figure 14 gives and indication of the
evolution of these unsteady interactions.
Figure 13. Particle traces of the chine-vortex
Figure 14. Unsteady vortex/Boundary-layer interactions
Chine Vortex
American Institute of Aeronautics and Astronautics
10
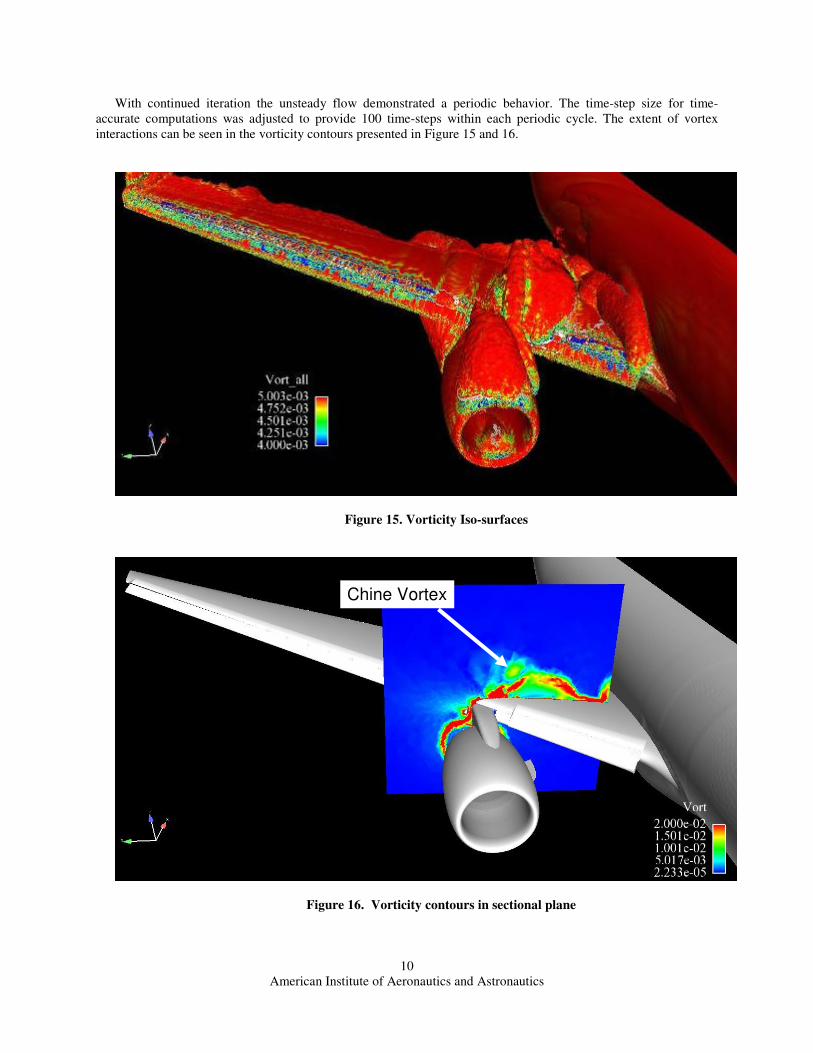
With continued iteration the unsteady flow demonstrated a periodic behavior. The time-step size for time-
accurate computations was adjusted to provide 100 time-steps within each periodic cycle. The extent of vortex
interactions can be seen in the vorticity contours presented in Figure 15 and 16.
Figure 15. Vorticity Iso-surfaces
Figure 16. Vorticity contours in sectional plane
Chine Vortex
American Institute of Aeronautics and Astronautics
11
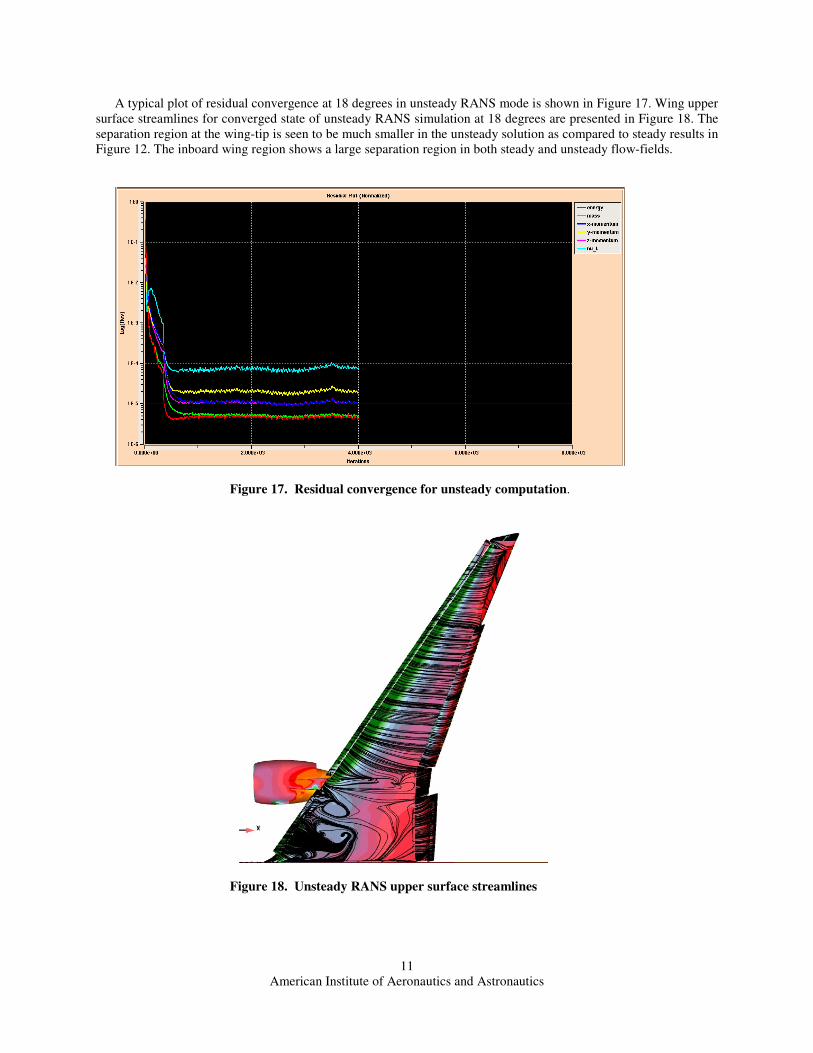
A typical plot of residual convergence at 18 degrees in unsteady RANS mode is shown in Figure 17. Wing upper
surface streamlines for converged state of unsteady RANS simulation at 18 degrees are presented in Figure 18. The
separation region at the wing-tip is seen to be much smaller in the unsteady solution as compared to steady results in
Figure 12. The inboard wing region shows a large separation region in both steady and unsteady flow-fields.
Figure 17. Residual convergence for unsteady computation.
Figure 18. Unsteady RANS upper surface streamlines
American Institute of Aeronautics and Astronautics
12
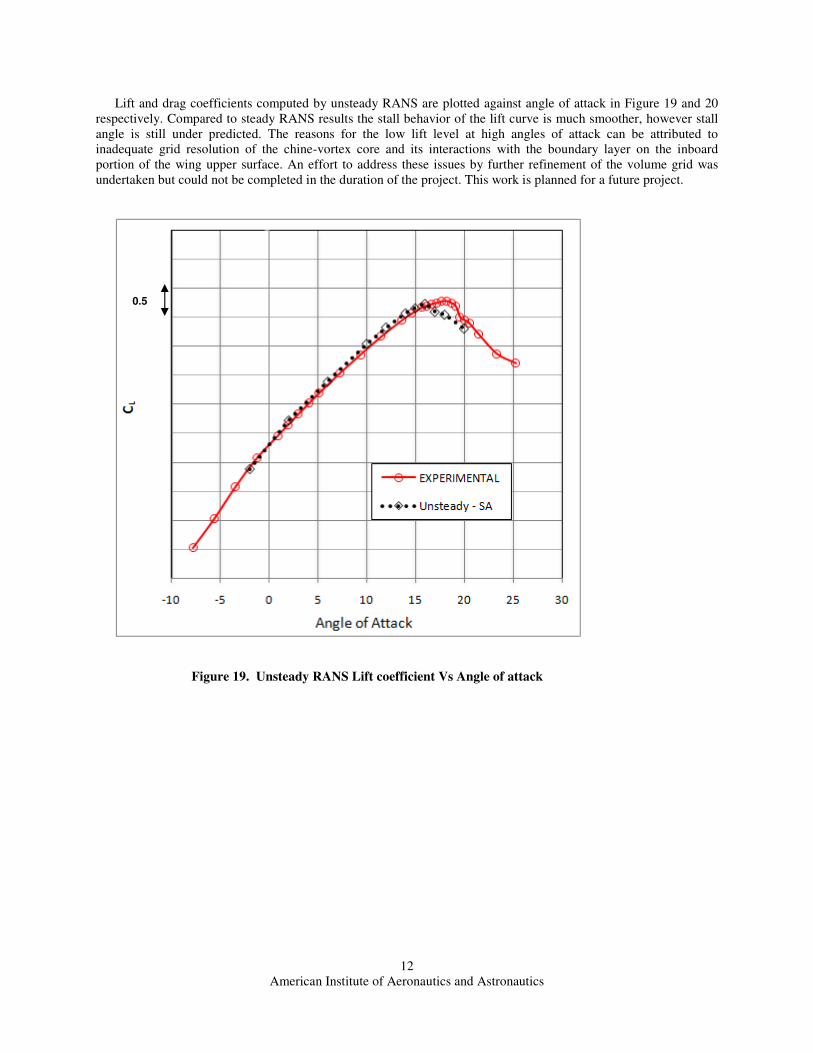
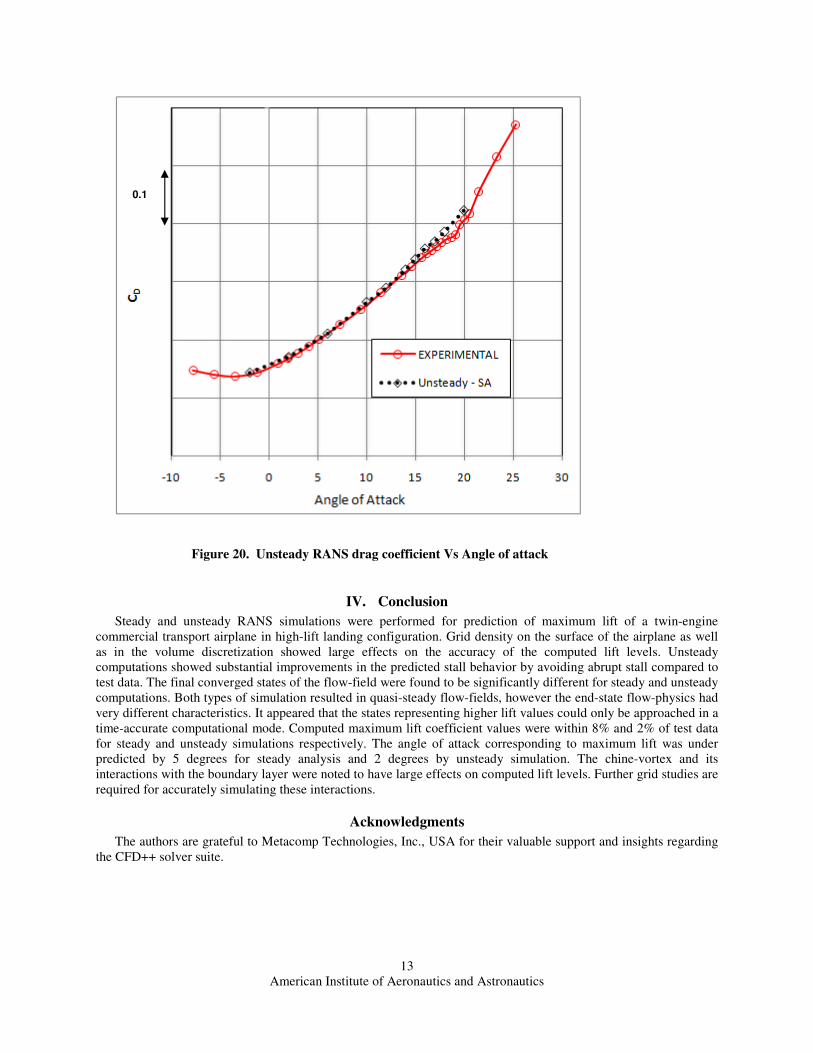
Lift and drag coefficients computed by unsteady RANS are plotted against angle of attack in Figure 19 and 20
respectively. Compared to steady RANS results the stall behavior of the lift curve is much smoother, however stall
angle is still under predicted. The reasons for the low lift level at high angles of attack can be attributed to
inadequate grid resolution of the chine-vortex core and its interactions with the boundary layer on the inboard
portion of the wing upper surface. An effort to address these issues by further refinement of the volume grid was
undertaken but could not be completed in the duration of the project. This work is planned for a future project.
Figure 19. Unsteady RANS Lift coefficient Vs Angle of attack
0.5
American Institute of Aeronautics and Astronautics
13
Figure 20. Unsteady RANS drag coefficient Vs Angle of attack
IV. Conclusion
Steady and unsteady RANS simulations were performed for prediction of maximum lift of a twin-engine
commercial transport airplane in high-lift landing configuration. Grid density on the surface of the airplane as well
as in the volume discretization showed large effects on the accuracy of the computed lift levels. Unsteady
computations showed substantial improvements in the predicted stall behavior by avoiding abrupt stall compared to
test data. The final converged states of the flow-field were found to be significantly different for steady and unsteady
computations. Both types of simulation resulted in quasi-steady flow-fields, however the end-state flow-physics had
very different characteristics. It appeared that the states representing higher lift values could only be approached in a
time-accurate computational mode. Computed maximum lift coefficient values were within 8% and 2% of test data
for steady and unsteady simulations respectively. The angle of attack corresponding to maximum lift was under
predicted by 5 degrees for steady analysis and 2 degrees by unsteady simulation. The chine-vortex and its
interactions with the boundary layer were noted to have large effects on computed lift levels. Further grid studies are
required for accurately simulating these interactions.
Acknowledgments
The authors are grateful to Metacomp Technologies, Inc., USA for their valuable support and insights regarding
the CFD++ solver suite.
0.1
American Institute of Aeronautics and Astronautics
14
References 1Smith, A.M.O., “High Lift Aerodynamics,” AIAA Journal of Aircrafts, Vol. 12, No. 6, June 1975
2Moitra, A., “Issues in 2-D High-Lift CFD Analysis: A Review,” AIAA Paper No. AIAA-2003-4072, 21st AIAA Applied
Aerodynamics Conference, Orlando, Florida, June 2003. 3Moitra, A., “Automated CFD Analysis of Two-Dimensional High-Lift Flows,” AIAA Journal of Aircraft, Vol. 39, No. 4,
2002, pp. 662-667. 4Chaffin, M., and Pirzadeh, S., “Unstructured Navier-Stokes High-Lift Computations on a Trapezoidal Wing,” AIAA Paper
No. AIAA-2005-5084, 23rd AIAA Applied Aerodynamics Conference, Toronto, Ontario, June, 2005. 5Rogers, S.E., Roth, K., Nash, S.M., “CFD Validation of High-Lift Flows with Significant Wind-Tunnel Effects,” AIAA
Paper No. AIAA-2000-4218, 18th AIAA Applied Aerodynamics Conference, Denver, Colorado, Aug., 2000. 6Johnson, P.L., Jones, K.M., Madson, M.D., “Experimental Investigation of a Simplified 3D High Lift Configuration in
Support of CFD Validation,” AIAA Paper No. AIAA-2000-4217, 18th AIAA Applied Aerodynamics Conference, Denver,
Colorado, Aug., 2000.
7 Khare, A., Baig, R., Ranjan, R., Shah, S., Pavithran, S., Nikam, K., and Moitra, A., “Computational Simulation of Flow
Over a High Lift Trapezoidal Wing,” International Journal of Aerospace Innovations, Vol.1, No.4, 2009, pp. 189-199. 8Rogers, S., Roth, K., Cao, H.V., Slotnick, J.P., Whitlock, M., Nash, S.M., Baker, M.D., “Computation of Viscous Flow for a
Boeing 777 Aircraft in Landing Configuration,” 18th AIAA Applied Aerodynamics Conference, 14 – 17 August 2000 / Denver,
Colorado, AIAA 2000-4221. 9Slotnick, J.P., An, M.Y., Mysko, S.J., Yeh, D.T., Rogers, S.E., Roth, K., Baker, M.D., Nash, S.M., “Navier-Stokes Analysis
of a High Wing Transport High-Lift Configuration with Externally Blown Flaps,” AIAA Paper No. AIAA-2000-4219, 18th
AIAA Applied Aerodynamics Conference, 14 – 17 August 2000 / Denver, Colorado.