Embed Size (px)
Citation preview
World Business Council for
Sustainable Development
Vision
2050
The new agenda for business
SINTEF BYGGFORSKDAGTrondheim, 19. juni 2013Idar Kreutzer, adm.dir i Finans Norge
A collaborative effort involving 29 companies
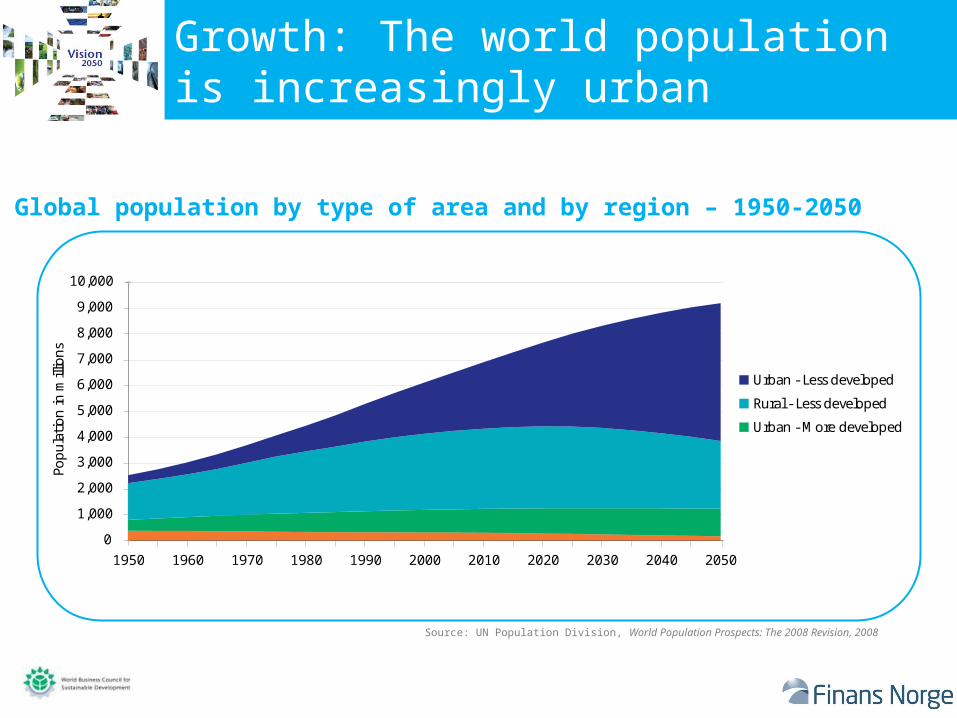
Growth: The world population is increasingly urban
0
1,000
2,000
3,000
4,000
5,000
6,000
7,000
8,000
9,000
10,000
1950 1960 1970 1980 1990 2000 2010 2020 2030 2040 2050
Popul
atio
n in
mill
ions
Urban - Less developed
Rural - Less developed
Urban - More developed
Global population by type of area and by region – 1950-2050
Source: UN Population Division, World Population Prospects: The 2008 Revision, 2008
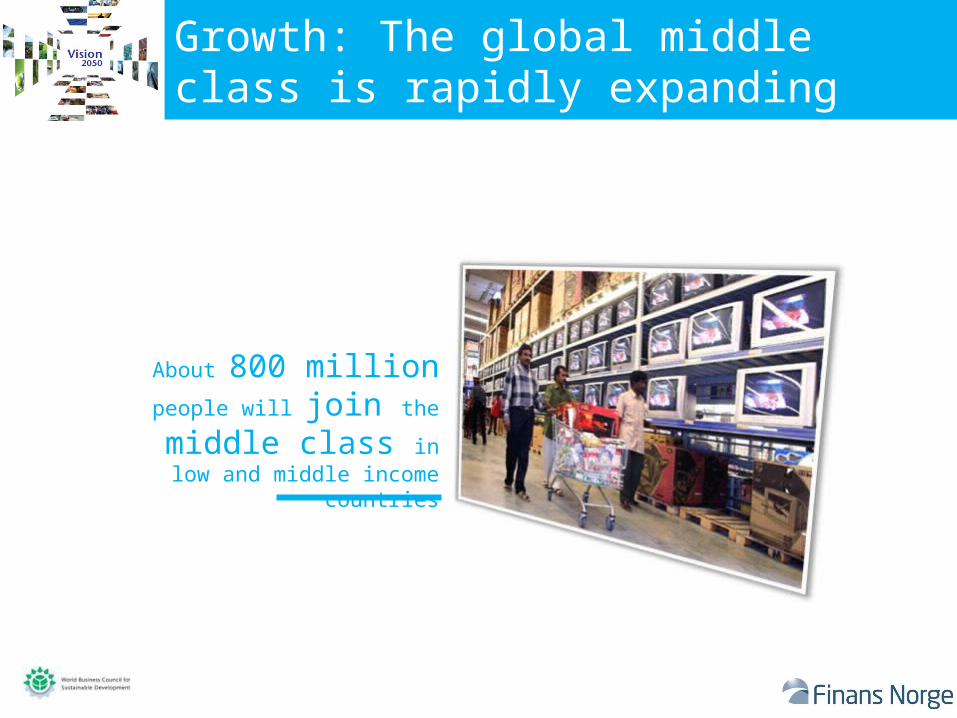
Growth: The global middle class is rapidly expanding
About 800 million people
will join the middle class in low and middle
income countries
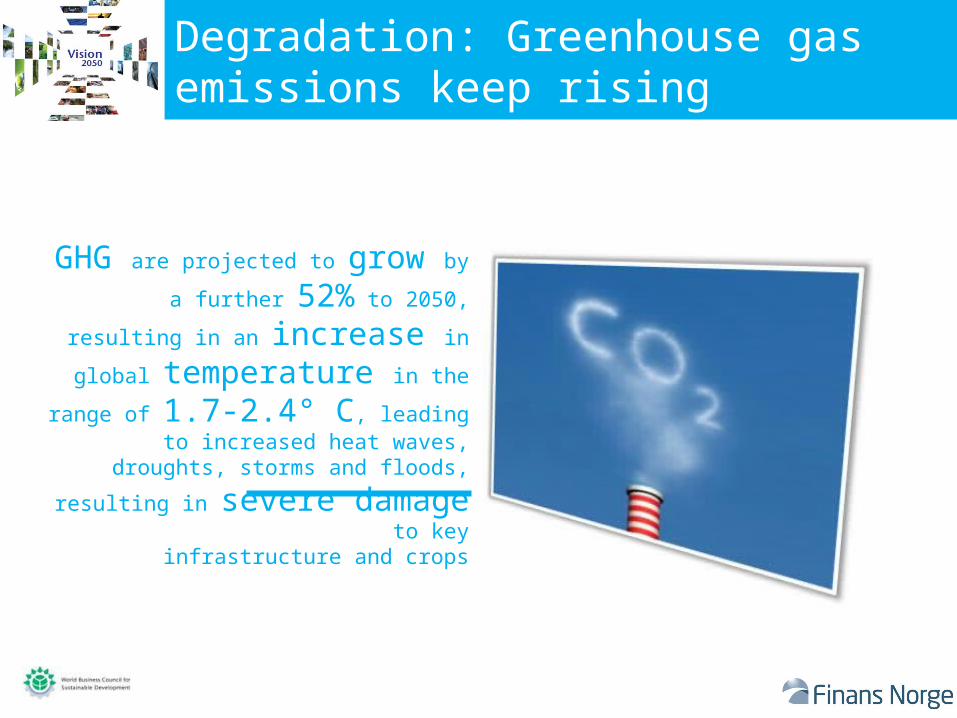
Degradation: Greenhouse gas emissions keep rising
GHG are projected to grow by a further
52% to 2050, resulting in an increase in global temperature in the range of
1.7-2.4° C, leading to increased heat waves, droughts, storms and floods,
resulting in severe damage to keyinfrastructure and crops
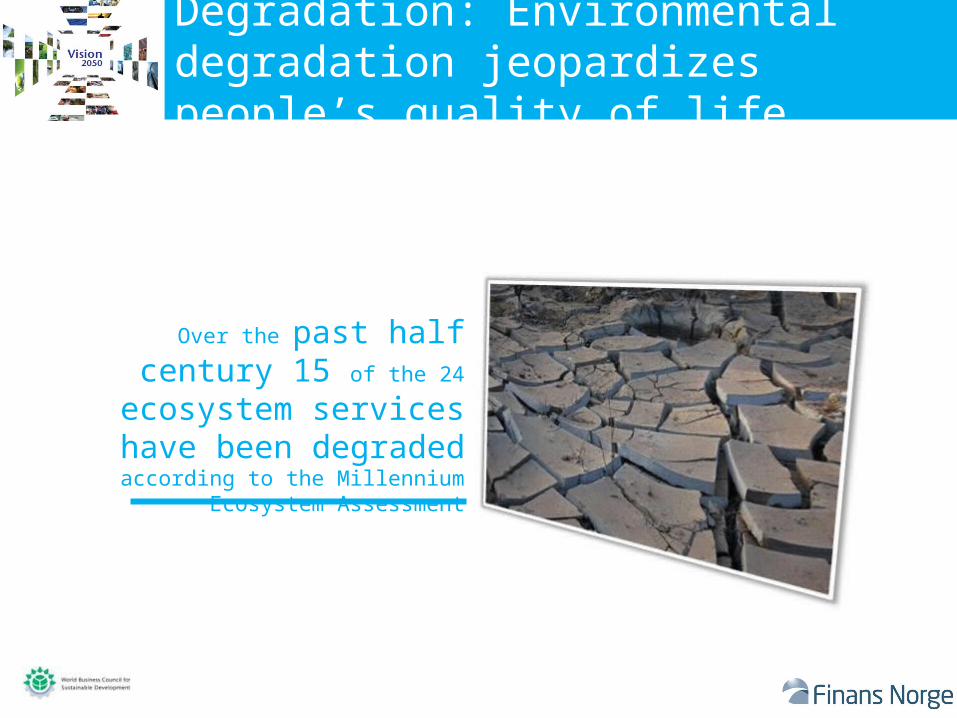
Degradation: Environmental degradation jeopardizes people’s quality of life
Over the past half century 15 of the 24 ecosystem services have been
degraded according to the Millennium Ecosystem Assessment
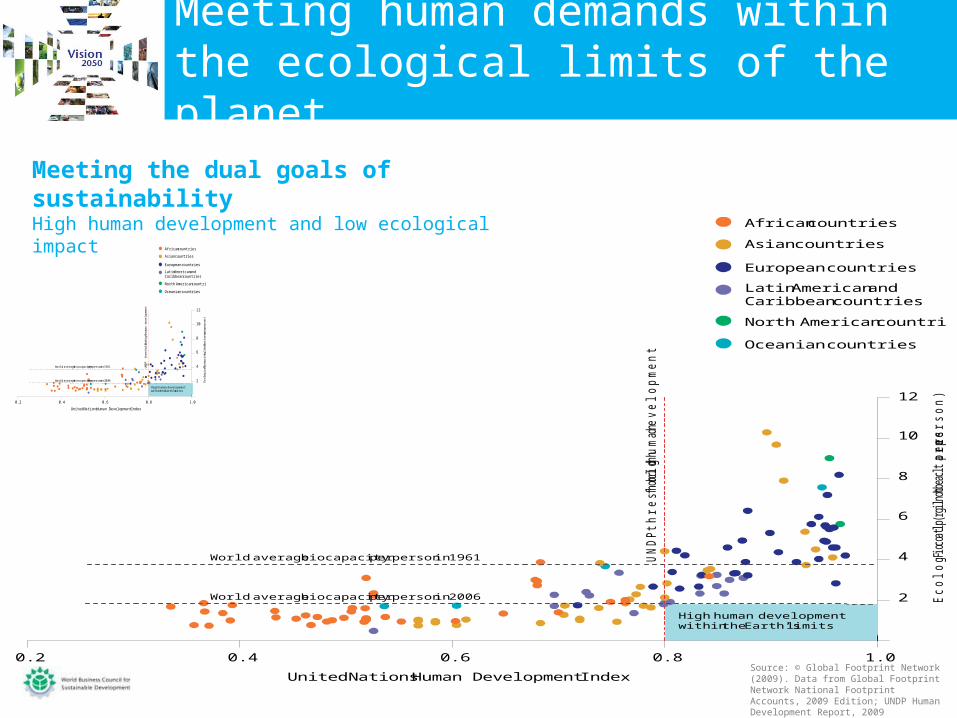
Meeting human demands within the ecological limits of the planet
0.2 0.4 0.6 0.8 1.0
World average biocapacity per person in 2006
World average biocapacity per person in 1961 UN
DP
thre
shold
for hig
h h
um
an
develo
pm
ent
High human developmentwithin the Earth’s limits
2
4
6
8
10
12
Ecolo
gic
al
Footprin
t (
glo
bal
hectares
per
person)
United Nations Human Development Index
African countries
Asian countries
European countries
Latin American andCaribbean countries
North American countries
Oceanian countries
Meeting the dual goals of sustainability High human development and low ecological impact
Source: © Global Footprint Network (2009). Data from Global Footprint Network National Footprint Accounts, 2009 Edition; UNDP Human Development Report, 2009
0.2 0.4 0.6 0.8 1.0
World average biocapacity per person in 2006
World average biocapacity per person in 1961 UN
DP
thr
esho
ld f
or h
igh
hum
an d
evel
opm
ent
High human developmentwithin the Earth’s limits
2
4
6
8
10
12
Ecol
ogic
al F
ootp
rint
(gl
obal
hec
tare
s per
per
son)
United Nations Human Development Index
African countries
Asian countries
European countries
Latin American andCaribbean countries
North American countries
Oceanian countries
Pathway to 2050

TODAY
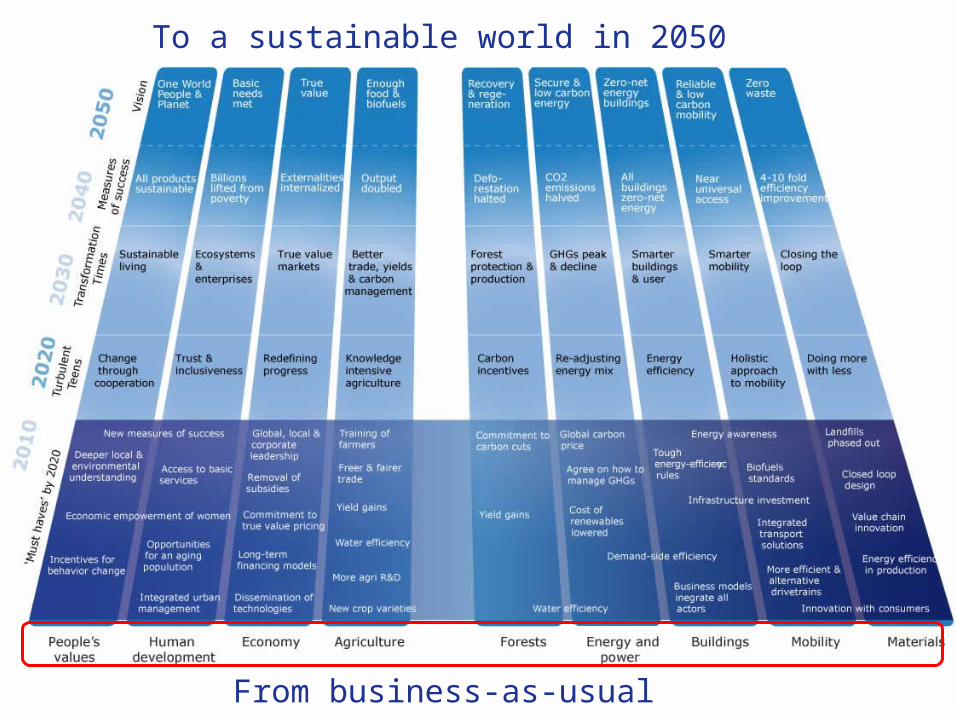
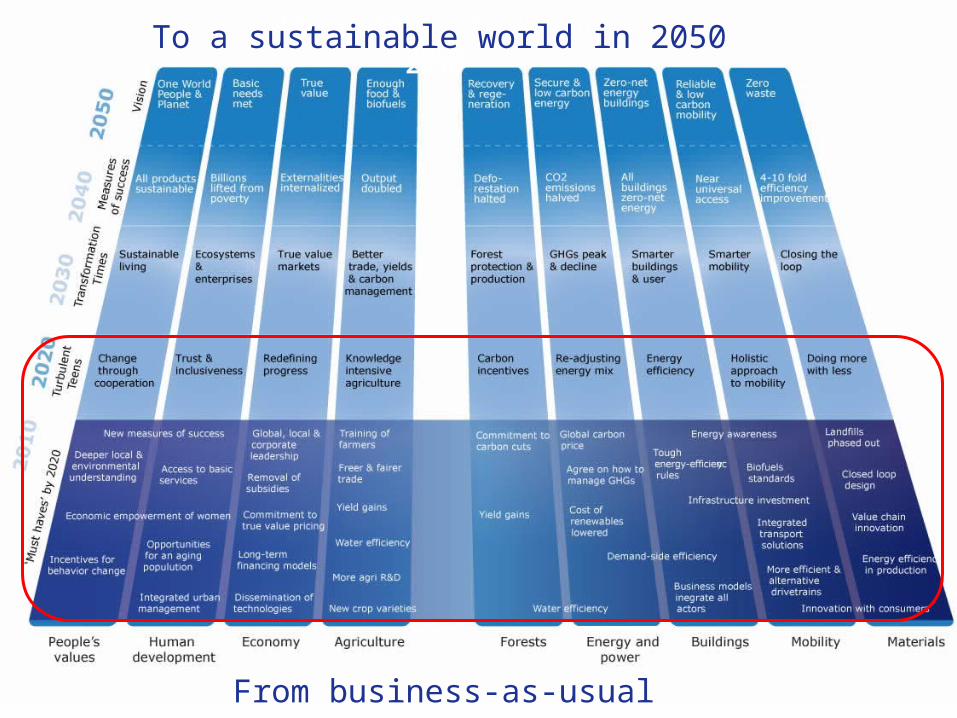
The pathway to Vision 2050To a sustainable world in 2050
From business-as-usual
TODAY
The pathway to Vision 2050To a sustainable world in 2050
From business-as-usual

2050
TODAY
The pathway to Vision 2050To a sustainable world in 2050
From business-as-usual
2050
TODAY
The pathway to Vision 2050To a sustainable world in 2050
From business-as-usual
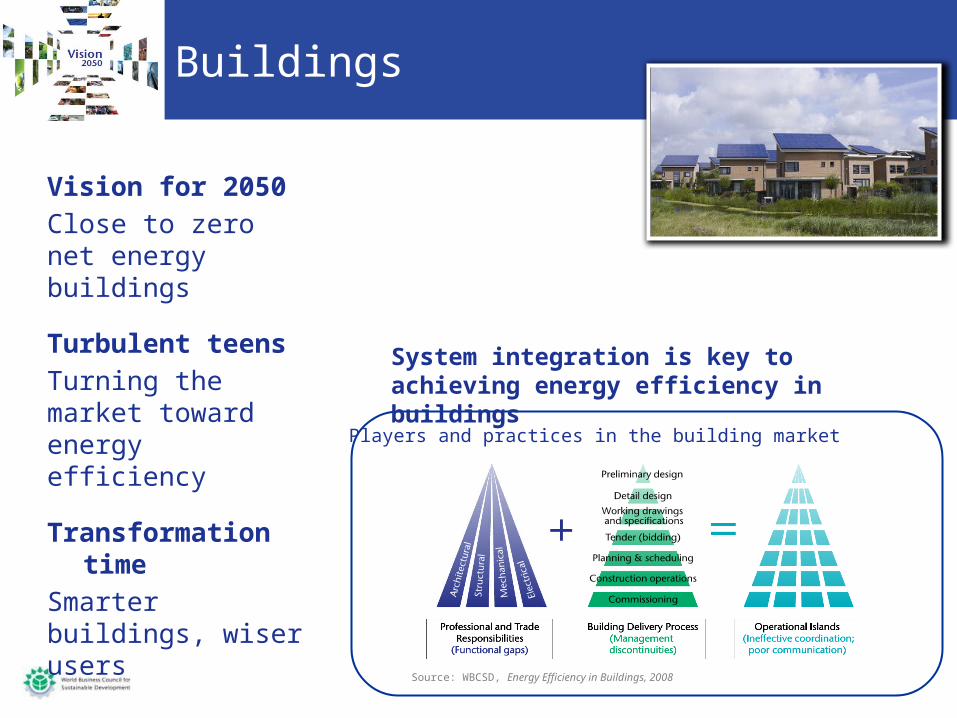
Buildings
Vision for 2050
Close to zero net energy buildings
Turbulent teens
Turning the market toward energy efficiency
Transformation time
Smarter buildings, wiser users
Source: WBCSD, Energy Efficiency in Buildings, 2008
Players and practices in the building market
System integration is key to achieving energy efficiency in buildings
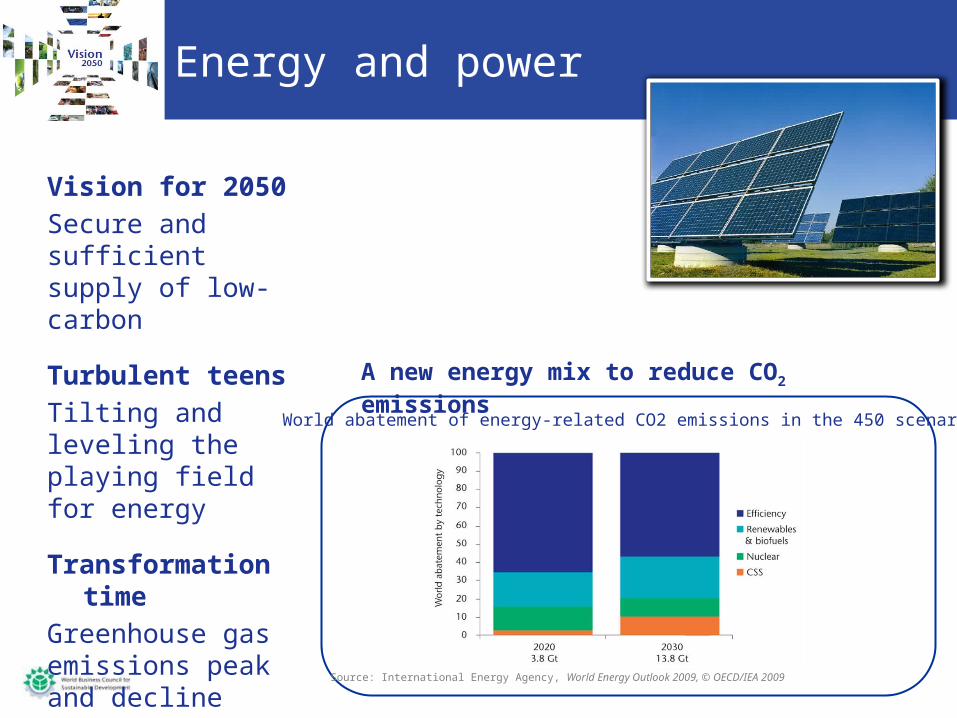
Energy and power
Vision for 2050
Secure and sufficient supply of low-carbon
Turbulent teens
Tilting and leveling the playing field for energy
Transformation time
Greenhouse gas emissions peak and decline
Source: International Energy Agency, World Energy Outlook 2009, © OECD/IEA 2009
World abatement of energy-related CO2 emissions in the 450 scenario
A new energy mix to reduce CO2 emissions
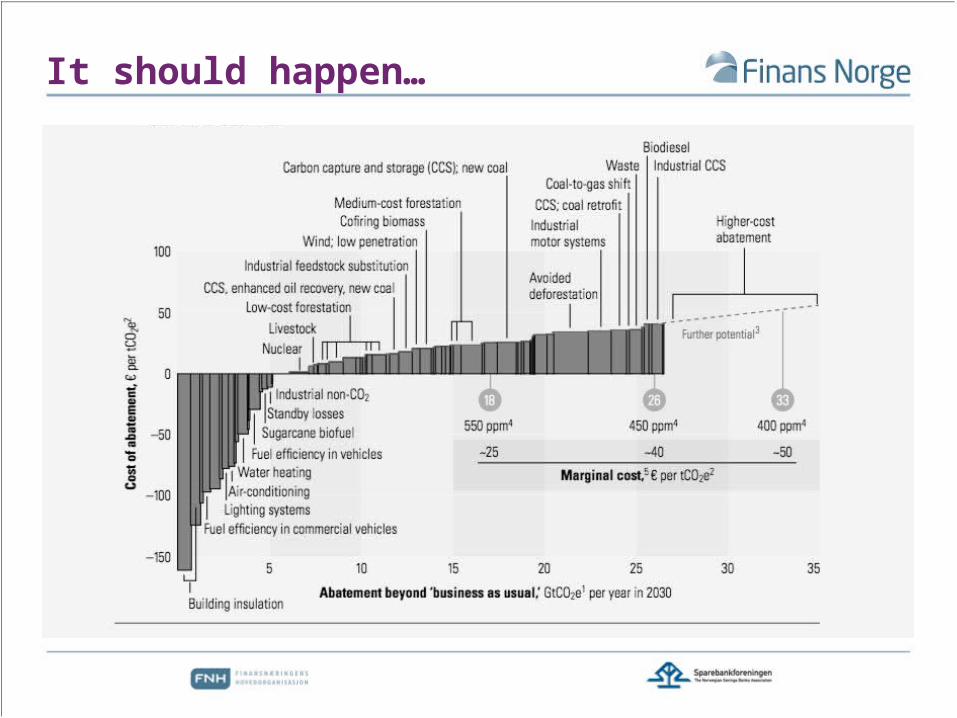
It should happen…
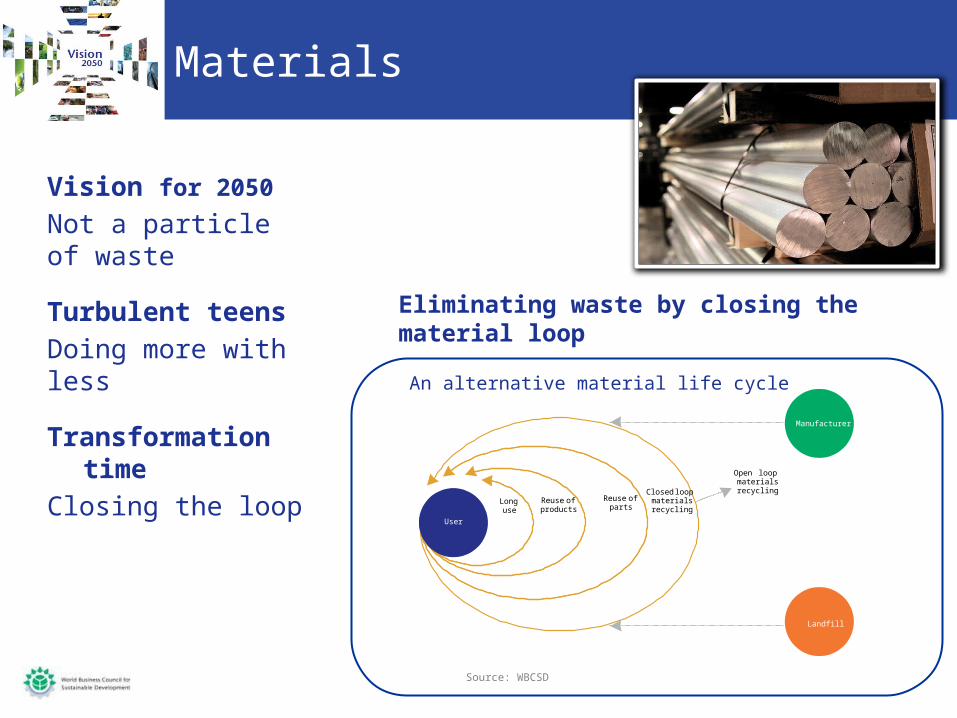
Materials
Vision for 2050
Not a particle of waste
Turbulent teens
Doing more with less
Transformation time
Closing the loop
Source: WBCSD
An alternative material life cycle
Manufacturer
Longuse
Reuse ofproducts
Reuse ofparts
Closed loopmaterialsrecycling
Open loopmaterialsrecycling
Landfill
User
Eliminating waste by closing the material loop
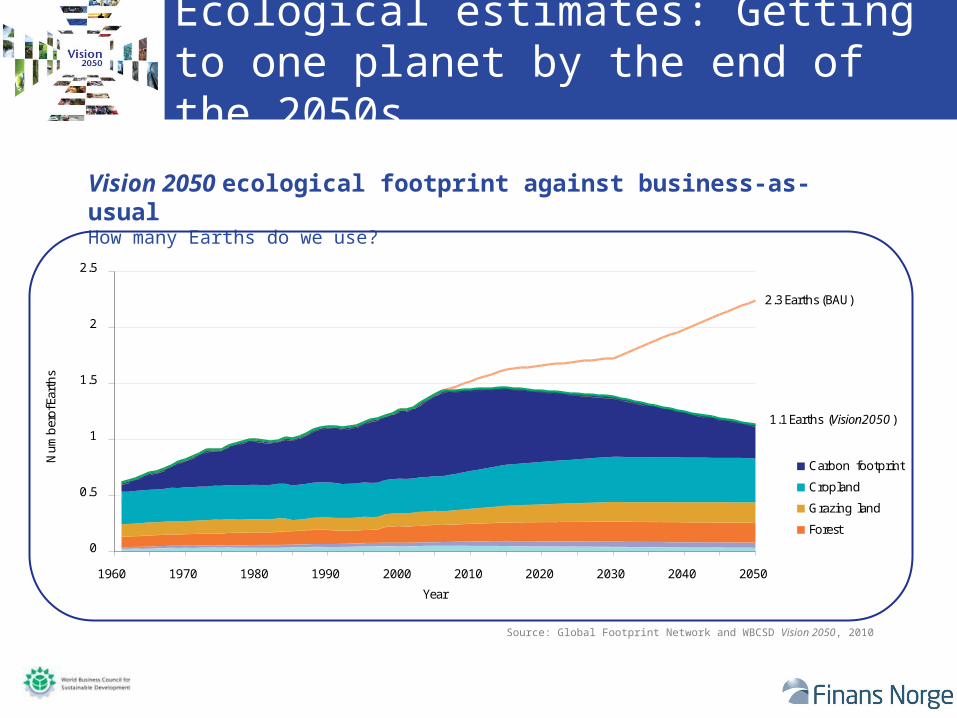
Ecological estimates: Getting to one planet by the end of the 2050s
Vision 2050 ecological footprint against business-as-usual How many Earths do we use?
Source: Global Footprint Network and WBCSD Vision 2050, 2010
2.3 Earths (BAU)
1.1 Earths (Vision 2050)
0
0.5
1
1.5
2
2.5
1960 1970 1980 1990 2000 2010 2020 2030 2040 2050
Num
ber
of E
arth
s
Year
Carbon footprint
Cropland
Grazing land
Forest
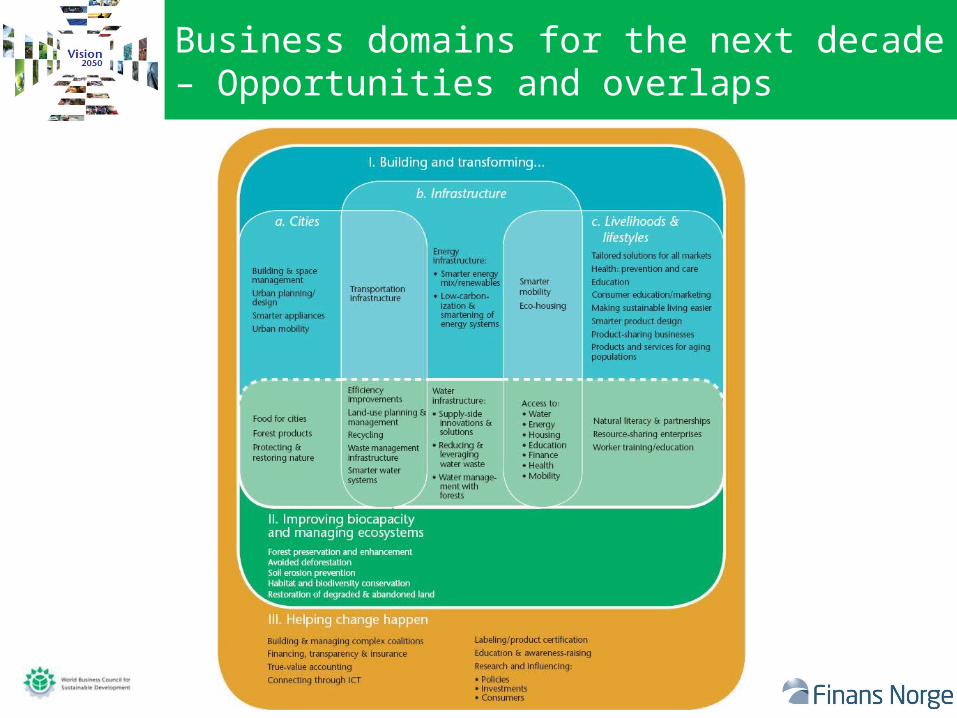
Business domains for the next decade – Opportunities and overlaps
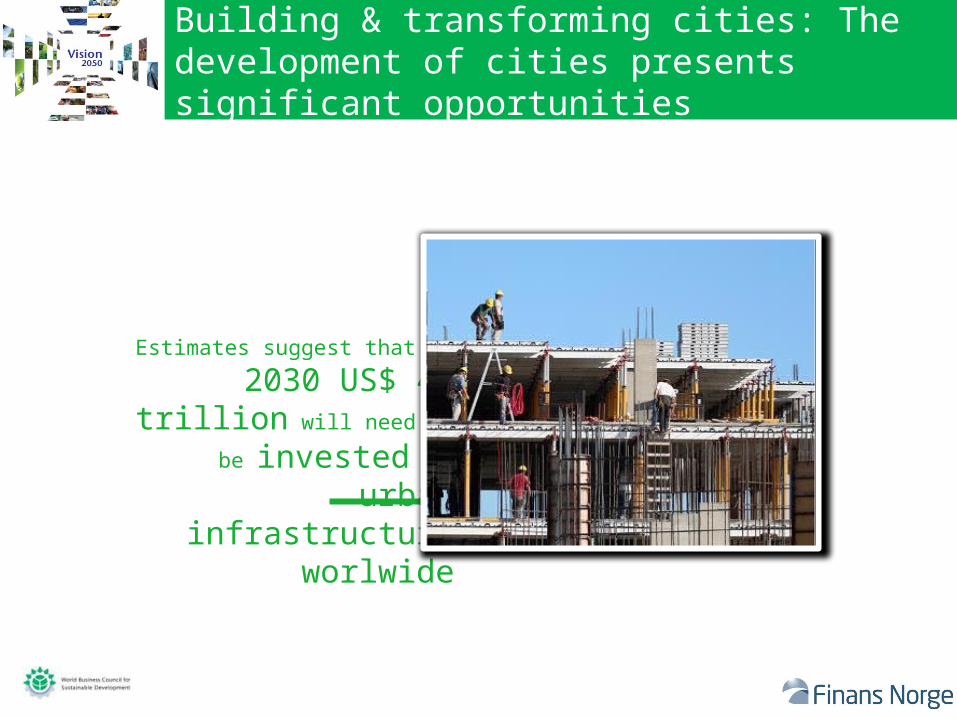
Building & transforming cities: The development of cities presents significant opportunities
Estimates suggest that by 2030 US$ 40 trillion will need to
be invested in urban infrastructure worlwide
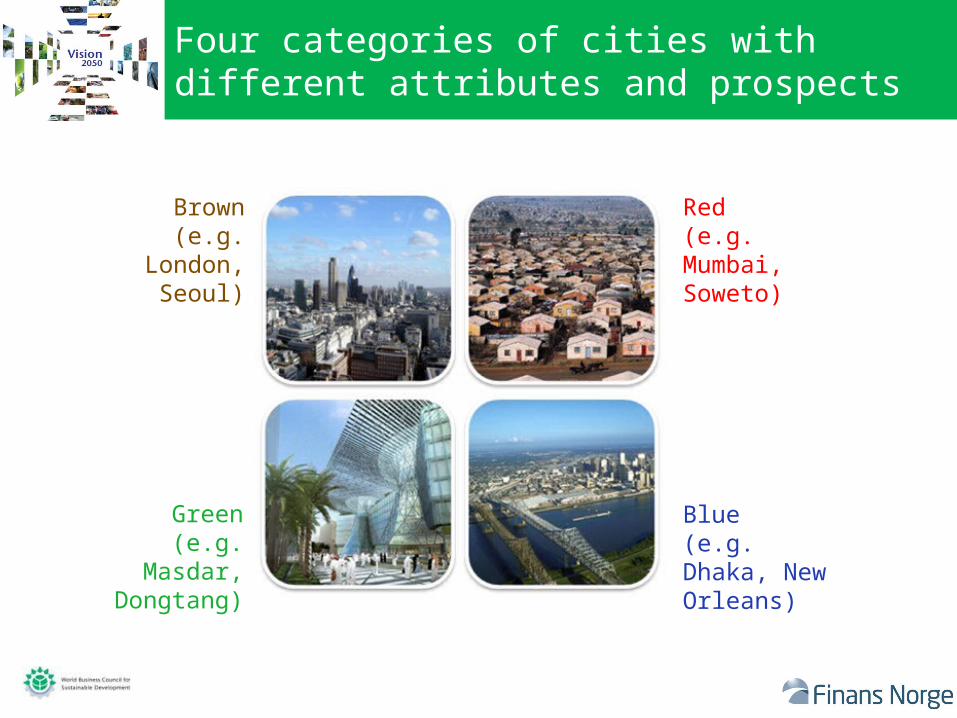
Four categories of cities with different attributes and prospects
Brown(e.g. London,
Seoul)
Green(e.g. Masdar,
Dongtang)
Red(e.g. Mumbai, Soweto)
Blue(e.g. Dhaka, New Orleans)
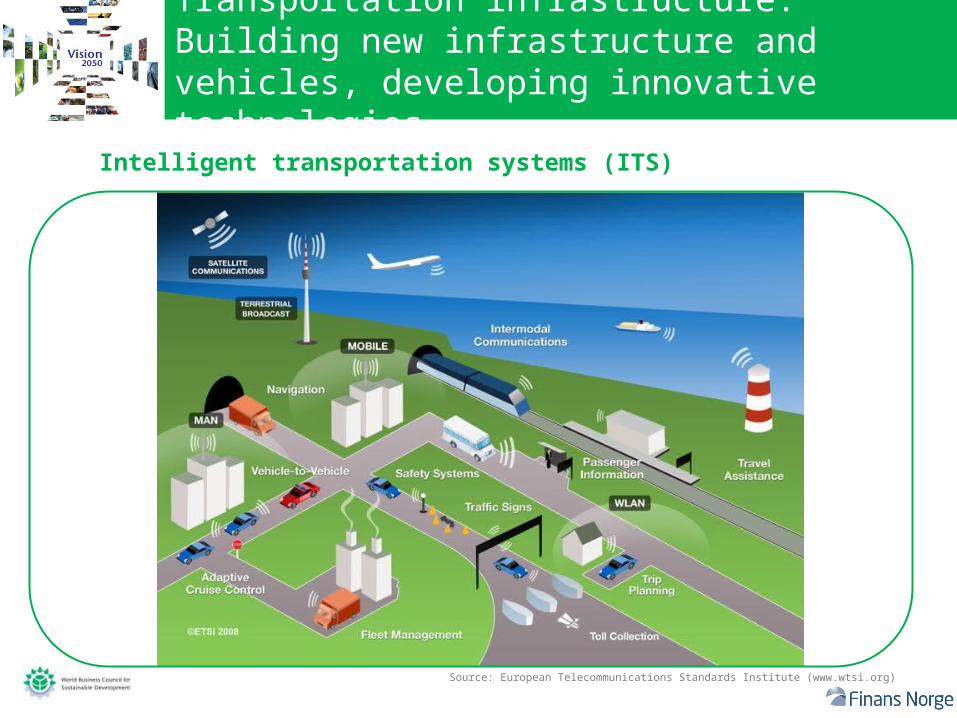
Transportation infrastructure: Building new infrastructure and vehicles, developing innovative technologies
Source: European Telecommunications Standards Institute (www.wtsi.org)
Intelligent transportation systems (ITS)
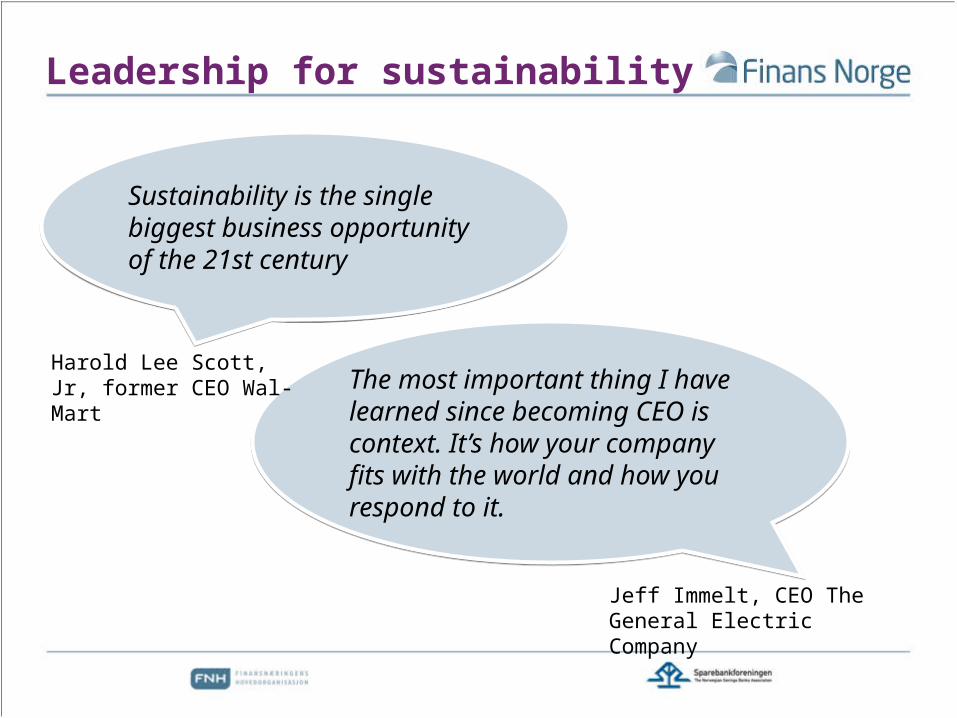
Leadership for sustainability
Sustainability is the single biggest business opportunity of the 21st century
Sustainability is the single biggest business opportunity of the 21st century
The most important thing I have learned since becoming CEO is context. It’s how your company fits with the world and how you respond to it.
The most important thing I have learned since becoming CEO is context. It’s how your company fits with the world and how you respond to it.
Jeff Immelt, CEO The General Electric Company
Harold Lee Scott, Jr, former CEO Wal-Mart
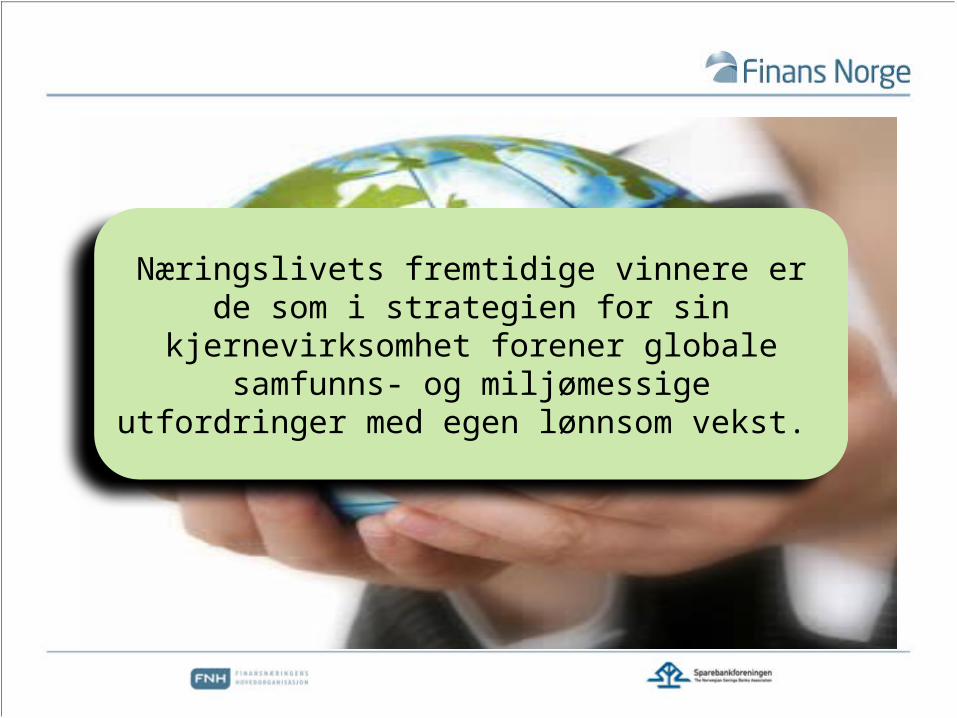
Næringslivets fremtidige vinnere er de som i strategien for sin kjernevirksomhet forener globale
samfunns- og miljømessige utfordringer med egen lønnsom vekst.