Embed Size (px)
Citation preview
VML Usability for Modelling TUI Scenarios -A Comparative Study
Eric TobiasService Science & Innovation Department
Public Research Centre Henri TudorJ.F. Kennedy av. 29, L-1855 Luxembourg, Luxembourg
Eric RasService Science & Innovation Department
Public Research Centre Henri TudorJ.F. Kennedy av. 29, L-1855 Luxembourg, Luxembourg
Nuno AmalioLaboratory for Advanced Software Systems
University of Luxembourg, Luxembourg6, rue R. Coudenhove-Kalergi
L-1359 Luxembourg
TR-LASSY-12-06
Issued: April 18, 2012Latest review: July 11, 2012
Abstract
Visual modelling languages have been around for quite a while. General-purposevisual modelling languages such as UML have long since become accepted andwidely used in industry. They use diagrammatic notations to express a mean-ing that would only be hard to grasp with text. It is with the recent focusof interest in Model Driven Engineering that visual modelling languages havecome into focus again. Often it is preferable to have a visual representation ofa domain since it enable a broader audience to participate in and understandthe modelling effort.
This report studies the suitability of general-purpose modelling languages formodelling Tangible User Interface applications. A concrete scenario using Busi-ness Process Model Notation 2 is developed and used to compare the modellingprocess, effort and outcome of the general-purpose visual Modelling languages.This report details all processes and gives a conclusion as to what degree thechosen visual modelling languages are suitable for the task. The most suitablemodelling language will be used in the scope of a master’s thesis to build ageneral model of a Tangible User Interface application.
Contents
1 Introduction 11.1 Background . . . . . . . . . . . . . . . . . . . . . . . . . . . . . . 11.2 Goals . . . . . . . . . . . . . . . . . . . . . . . . . . . . . . . . . 2
2 Identifying suitable languages 32.1 Preliminary language criteria . . . . . . . . . . . . . . . . . . . . 3
2.1.1 Visual syntax . . . . . . . . . . . . . . . . . . . . . . . . . 42.1.2 Modelling != Programming . . . . . . . . . . . . . . . . . 42.1.3 Generalisation . . . . . . . . . . . . . . . . . . . . . . . . 4
2.2 Data Collection . . . . . . . . . . . . . . . . . . . . . . . . . . . . 52.2.1 Searching . . . . . . . . . . . . . . . . . . . . . . . . . . . 52.2.2 Collecting . . . . . . . . . . . . . . . . . . . . . . . . . . . 5
2.3 Pre-selection . . . . . . . . . . . . . . . . . . . . . . . . . . . . . 62.4 Refining selection criteria . . . . . . . . . . . . . . . . . . . . . . 72.5 Candidates . . . . . . . . . . . . . . . . . . . . . . . . . . . . . . 7
2.5.1 UML + VOCL . . . . . . . . . . . . . . . . . . . . . . . . 82.5.2 VCL . . . . . . . . . . . . . . . . . . . . . . . . . . . . . . 82.5.3 Constraint Diagrams . . . . . . . . . . . . . . . . . . . . . 9
3 Building a scenario 103.1 BPMN2 . . . . . . . . . . . . . . . . . . . . . . . . . . . . . . . . 10
3.1.1 Simple scenario . . . . . . . . . . . . . . . . . . . . . . . . 113.2 Preliminary TUI model . . . . . . . . . . . . . . . . . . . . . . . 11
3.2.1 A simple TUI instance . . . . . . . . . . . . . . . . . . . . 12
4 Case study 134.1 Measurements . . . . . . . . . . . . . . . . . . . . . . . . . . . . . 134.2 Study plan . . . . . . . . . . . . . . . . . . . . . . . . . . . . . . 14
4.2.1 Create Start Event . . . . . . . . . . . . . . . . . . . . . . 154.2.2 Create Activity . . . . . . . . . . . . . . . . . . . . . . . . 154.2.3 Check portfolio . . . . . . . . . . . . . . . . . . . . . . . . 154.2.4 Take action . . . . . . . . . . . . . . . . . . . . . . . . . . 154.2.5 Wait for response . . . . . . . . . . . . . . . . . . . . . . . 154.2.6 Review portfolio . . . . . . . . . . . . . . . . . . . . . . . 164.2.7 Create Gateway / Create Event . . . . . . . . . . . . . . . 164.2.8 Link components . . . . . . . . . . . . . . . . . . . . . . . 16
4.3 Scope reduction . . . . . . . . . . . . . . . . . . . . . . . . . . . . 164.4 Product . . . . . . . . . . . . . . . . . . . . . . . . . . . . . . . . 17
i
4.4.1 UML + VOCL . . . . . . . . . . . . . . . . . . . . . . . . 174.4.2 VCL . . . . . . . . . . . . . . . . . . . . . . . . . . . . . . 194.4.3 Constraint Diagrams . . . . . . . . . . . . . . . . . . . . . 22
5 Evaluation 245.1 Tool support . . . . . . . . . . . . . . . . . . . . . . . . . . . . . 24
5.1.1 Availability . . . . . . . . . . . . . . . . . . . . . . . . . . 255.1.2 Maintainability . . . . . . . . . . . . . . . . . . . . . . . . 255.1.3 Latest version . . . . . . . . . . . . . . . . . . . . . . . . . 255.1.4 Branch . . . . . . . . . . . . . . . . . . . . . . . . . . . . 25
5.2 Semantics & Transformation . . . . . . . . . . . . . . . . . . . . 265.2.1 Formally defined . . . . . . . . . . . . . . . . . . . . . . . 265.2.2 Transformability . . . . . . . . . . . . . . . . . . . . . . . 26
5.3 Expressivity . . . . . . . . . . . . . . . . . . . . . . . . . . . . . . 275.3.1 # X (# X) . . . . . . . . . . . . . . . . . . . . . . . . . . 275.3.2 # X satisfied (# Sat X) . . . . . . . . . . . . . . . . . . . 275.3.3 # requirements partially satisfied (# Part Sat) . . . . . . 275.3.4 # unsatisfied requirements (# UnSat) . . . . . . . . . . . 275.3.5 Ratio . . . . . . . . . . . . . . . . . . . . . . . . . . . . . 28
5.4 Usability . . . . . . . . . . . . . . . . . . . . . . . . . . . . . . . . 285.4.1 Naming conventions . . . . . . . . . . . . . . . . . . . . . 285.4.2 Naming fit . . . . . . . . . . . . . . . . . . . . . . . . . . 285.4.3 Documentation . . . . . . . . . . . . . . . . . . . . . . . . 295.4.4 Tutorial . . . . . . . . . . . . . . . . . . . . . . . . . . . . 295.4.5 Hands-on tutorial . . . . . . . . . . . . . . . . . . . . . . . 295.4.6 Primitive mutability . . . . . . . . . . . . . . . . . . . . . 295.4.7 Live suggestions . . . . . . . . . . . . . . . . . . . . . . . 30
5.5 Error Checking . . . . . . . . . . . . . . . . . . . . . . . . . . . . 305.5.1 Time . . . . . . . . . . . . . . . . . . . . . . . . . . . . . . 305.5.2 Syntax highlighting . . . . . . . . . . . . . . . . . . . . . 305.5.3 Degree . . . . . . . . . . . . . . . . . . . . . . . . . . . . . 315.5.4 Error correction suggestion . . . . . . . . . . . . . . . . . 315.5.5 Debugging possible . . . . . . . . . . . . . . . . . . . . . . 31
5.6 Validation & Verification . . . . . . . . . . . . . . . . . . . . . . . 315.6.1 Modularity . . . . . . . . . . . . . . . . . . . . . . . . . . 325.6.2 Verification scheme . . . . . . . . . . . . . . . . . . . . . . 32
5.7 Weighting scheme . . . . . . . . . . . . . . . . . . . . . . . . . . . 335.8 Results . . . . . . . . . . . . . . . . . . . . . . . . . . . . . . . . . 33
6 Conclusion 366.1 Future work . . . . . . . . . . . . . . . . . . . . . . . . . . . . . . 376.2 Long time goals . . . . . . . . . . . . . . . . . . . . . . . . . . . . 37
Bibliography 40
Glossary 41
A List of literature resources 43
ii
B Requirements 46B.1 BPMN2 model requirements . . . . . . . . . . . . . . . . . . . . . 46
B.1.1 Structural requirements . . . . . . . . . . . . . . . . . . . 46B.1.2 Behavioural requirements . . . . . . . . . . . . . . . . . . 47B.1.3 Constraints . . . . . . . . . . . . . . . . . . . . . . . . . . 47
B.2 Stock Management model requirements . . . . . . . . . . . . . . 47B.2.1 Structural requirements . . . . . . . . . . . . . . . . . . . 47B.2.2 Behavioural requirements . . . . . . . . . . . . . . . . . . 47B.2.3 Constraints . . . . . . . . . . . . . . . . . . . . . . . . . . 47
B.3 Tangible User Interface model requirements . . . . . . . . . . . . 48B.3.1 Structural requirements . . . . . . . . . . . . . . . . . . . 48B.3.2 Behavioural requirements . . . . . . . . . . . . . . . . . . 48B.3.3 Constraints . . . . . . . . . . . . . . . . . . . . . . . . . . 48
B.4 Tangible User Interface scenario requirements . . . . . . . . . . . 48B.4.1 Structural requirements . . . . . . . . . . . . . . . . . . . 48B.4.2 Behavioural requirements . . . . . . . . . . . . . . . . . . 48B.4.3 Constraints . . . . . . . . . . . . . . . . . . . . . . . . . . 49
C 51
D 52
E Weighting evaluation criteria 53
iii
Chapter 1
Introduction
Tangible User Interfaces (TUIs) offer an interesting opportunity to move mod-elling tasks from a single-user environment into a collaborative environment [1].Modelling cooperatively enables users with different backgrounds to participateon the same modelling effort, which helps to involve different stakeholders, facil-itate feedback from users and experts and mitigate corrective barriers. A TUIfor modelling will make use of common metaphors and well known principles toenrich the modelling experience and facilitate cooperation and collaboration.
1.1 Background
A desirable property of a model is that it must convey the same, unambiguous,meaning to every reader. Visual Modelling Languages (VMLs) must, therefore,be able to produce such models. A common and misleading practice is to be toinvent a new domain specific language whenever it is needed rather than tryingto find a suitable general-purpose language [2]. Not only will it save time butit will also enable the modeller to rely on an established language that has thebacking of the community and resources to draw upon. Moreover, VMLs thathave gone through a lengthy design process and several iterations may have allkinds of added bonuses such as being formally defined, offering tool supportor tutorials. Due to these reason it was determined that for the purpose ofmodelling a TUI framework and its instance used to solve a simple BPMN2 [3]modelling scenario, an established VML was to be chosen.
1
1.2 Goals
The goal of this comparative study is to identify a suitable VML for modellinga TUI modelling application for BPMN2. In order to do so, the report identifiesa number of suited candidates according to a number of preliminary elimina-tion criteria. These languages are then used to model a BPMN2 cenario, andthen compared based on a number of previously fixed, weighted criteria. Theresearch question of interest is, therefore;
Which VML is most suitable for modelling a TUI application for buildingBPMN2 models?
This requires modelling a TUI instance and the corresponding model. Allcriteria and scenarios will be detailed for the reader in the following sections.While this study somewhat follows a quantitative-experimental approach, thereader should take note that all choices are subjective and while the author triedto make as objective choices as possible, it is by the limited scope and time notpossible to conduct a proper objective study.
2
Chapter 2
Identifying suitablelanguages
Before delving into any particular language choice, a suitable basket of lan-guages must first be collected. The scientific community is buzzing with ideasand some lead to the creation of new languages. Sadly, this means a rather largeamount of languages are out there and not all of them are visual and even lessof them are not domain specific. Therefore, all unsuitable languages should bediscarded before even entertaining the idea to embark on a study that is on aschedule.
The following sections will detail by what criteria the first batch of languageshas been preprocessed and give more detail reasons as to why this sorting hastaken place. The second section will list the methodology for finding languagesand the subsequent section will educate on what languages have been eliminatedand stated the reason for the elimination. The second to last section will see theselection criteria strengthened and give reasons as to why this was necessary.The last section will give a rundown of the remaining languages by the meansof a small introduction and background information.
2.1 Preliminary language criteria
The criteria dressed here serve only to limit the number of languages takeninto considerations. With the sheer number of languages and dialects producedby the scientific community in the domain of Software Engineering it would benigh impossible to undertake a comparative study as a preliminary investigativestep in the scope of a master’s thesis. These criteria are by no means sortinglanguages in a qualitative fashion nor should they be interpreted as a sign ofsuitability other than their validity for the scope of the accompanying Master’sThesis.
3
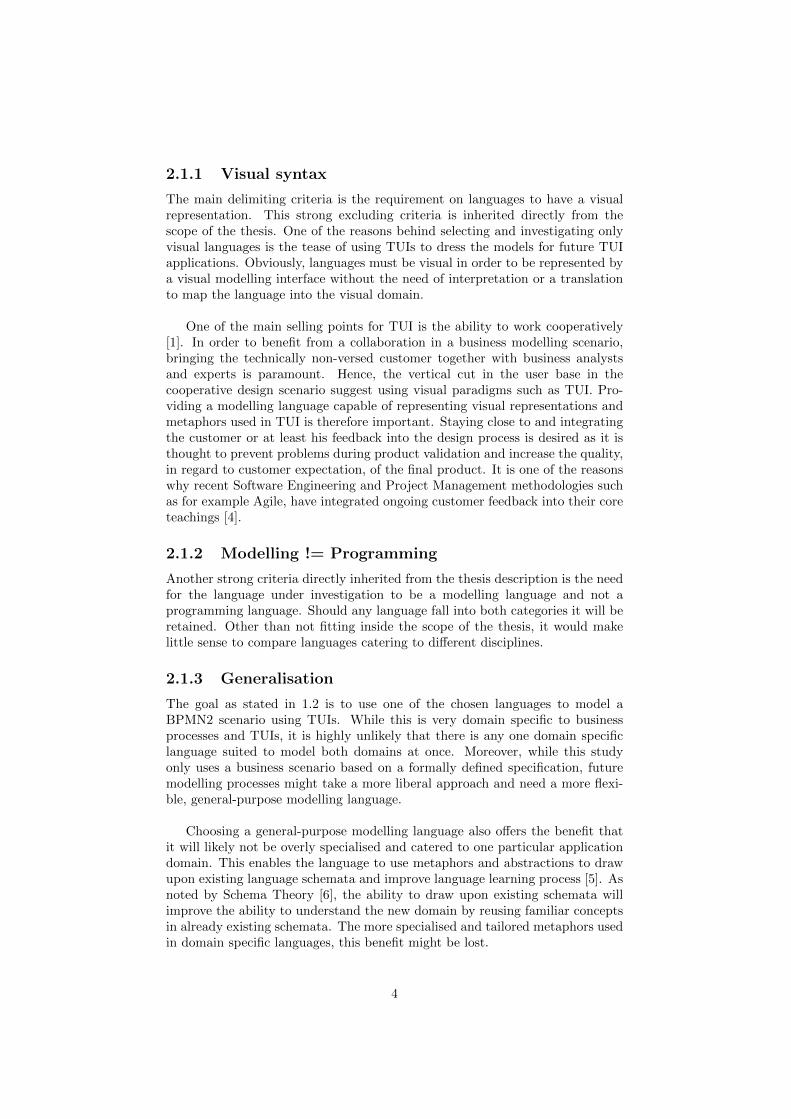
2.1.1 Visual syntax
The main delimiting criteria is the requirement on languages to have a visualrepresentation. This strong excluding criteria is inherited directly from thescope of the thesis. One of the reasons behind selecting and investigating onlyvisual languages is the tease of using TUIs to dress the models for future TUIapplications. Obviously, languages must be visual in order to be represented bya visual modelling interface without the need of interpretation or a translationto map the language into the visual domain.
One of the main selling points for TUI is the ability to work cooperatively[1]. In order to benefit from a collaboration in a business modelling scenario,bringing the technically non-versed customer together with business analystsand experts is paramount. Hence, the vertical cut in the user base in thecooperative design scenario suggest using visual paradigms such as TUI. Pro-viding a modelling language capable of representing visual representations andmetaphors used in TUI is therefore important. Staying close to and integratingthe customer or at least his feedback into the design process is desired as it isthought to prevent problems during product validation and increase the quality,in regard to customer expectation, of the final product. It is one of the reasonswhy recent Software Engineering and Project Management methodologies suchas for example Agile, have integrated ongoing customer feedback into their coreteachings [4].
2.1.2 Modelling != Programming
Another strong criteria directly inherited from the thesis description is the needfor the language under investigation to be a modelling language and not aprogramming language. Should any language fall into both categories it will beretained. Other than not fitting inside the scope of the thesis, it would makelittle sense to compare languages catering to different disciplines.
2.1.3 Generalisation
The goal as stated in 1.2 is to use one of the chosen languages to model aBPMN2 scenario using TUIs. While this is very domain specific to businessprocesses and TUIs, it is highly unlikely that there is any one domain specificlanguage suited to model both domains at once. Moreover, while this studyonly uses a business scenario based on a formally defined specification, futuremodelling processes might take a more liberal approach and need a more flexi-ble, general-purpose modelling language.
Choosing a general-purpose modelling language also offers the benefit thatit will likely not be overly specialised and catered to one particular applicationdomain. This enables the language to use metaphors and abstractions to drawupon existing language schemata and improve language learning process [5]. Asnoted by Schema Theory [6], the ability to draw upon existing schemata willimprove the ability to understand the new domain by reusing familiar conceptsin already existing schemata. The more specialised and tailored metaphors usedin domain specific languages, this benefit might be lost.
4
2.2 Data Collection
This section will state the methodology used to collect all relevant literatureon, sometimes more, sometimes less, visual modelling languages. the first sub-section will declare what services have been used and what parameters were usedto search for pertinent data. The second section will enumerate the findings andfurther processing.
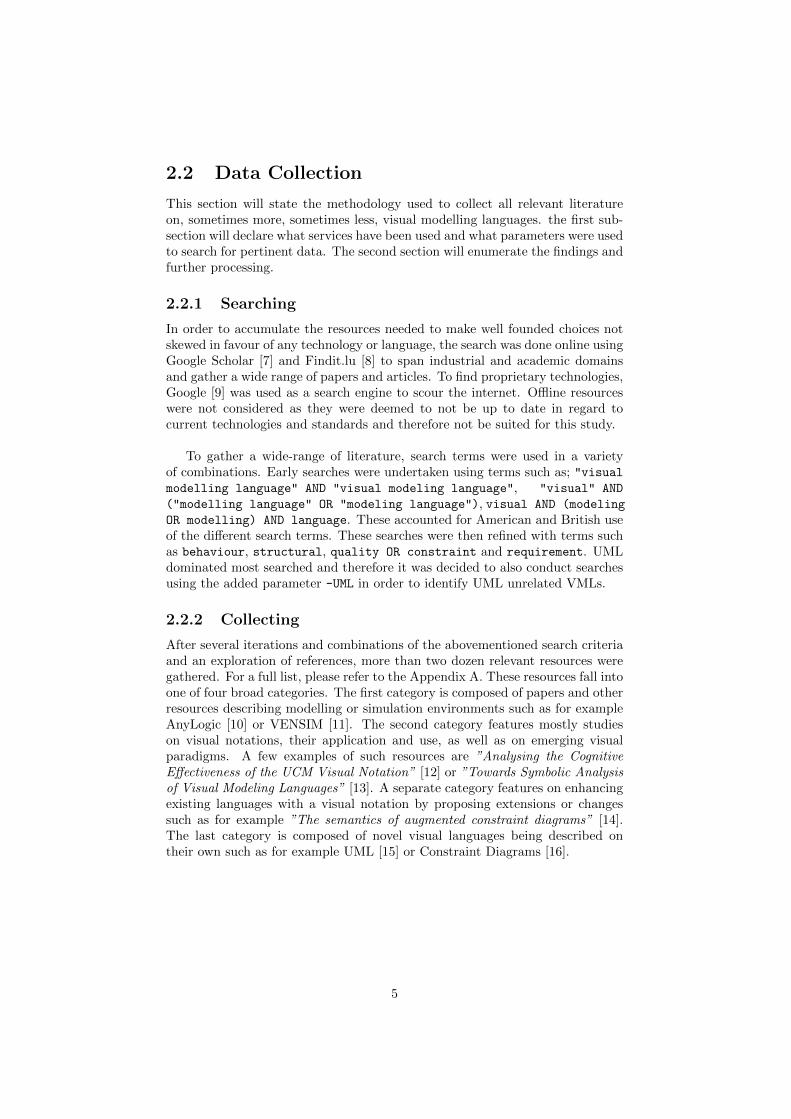
2.2.1 Searching
In order to accumulate the resources needed to make well founded choices notskewed in favour of any technology or language, the search was done online usingGoogle Scholar [7] and Findit.lu [8] to span industrial and academic domainsand gather a wide range of papers and articles. To find proprietary technologies,Google [9] was used as a search engine to scour the internet. Offline resourceswere not considered as they were deemed to not be up to date in regard tocurrent technologies and standards and therefore not be suited for this study.
To gather a wide-range of literature, search terms were used in a varietyof combinations. Early searches were undertaken using terms such as; "visualmodelling language" AND "visual modeling language", "visual" AND
("modelling language" OR "modeling language"), visual AND (modeling
OR modelling) AND language. These accounted for American and British useof the different search terms. These searches were then refined with terms suchas behaviour, structural, quality OR constraint and requirement. UMLdominated most searched and therefore it was decided to also conduct searchesusing the added parameter -UML in order to identify UML unrelated VMLs.
2.2.2 Collecting
After several iterations and combinations of the abovementioned search criteriaand an exploration of references, more than two dozen relevant resources weregathered. For a full list, please refer to the Appendix A. These resources fall intoone of four broad categories. The first category is composed of papers and otherresources describing modelling or simulation environments such as for exampleAnyLogic [10] or VENSIM [11]. The second category features mostly studieson visual notations, their application and use, as well as on emerging visualparadigms. A few examples of such resources are ”Analysing the CognitiveEffectiveness of the UCM Visual Notation” [12] or ”Towards Symbolic Analysisof Visual Modeling Languages” [13]. A separate category features on enhancingexisting languages with a visual notation by proposing extensions or changessuch as for example ”The semantics of augmented constraint diagrams” [14].The last category is composed of novel visual languages being described ontheir own such as for example UML [15] or Constraint Diagrams [16].
5
2.3 Pre-selection
In order to be able to make a final choice, the number of candidate languages hadto be reduced. The following paragraphs explain what resources and therebylanguages were discarded and for what reasons. Please note that the order waschosen by what subjectively seemed to eliminate the most resources or seemedthe most obvious. The main criteria used for elimination were detailed in 2.1and its sub-sections.
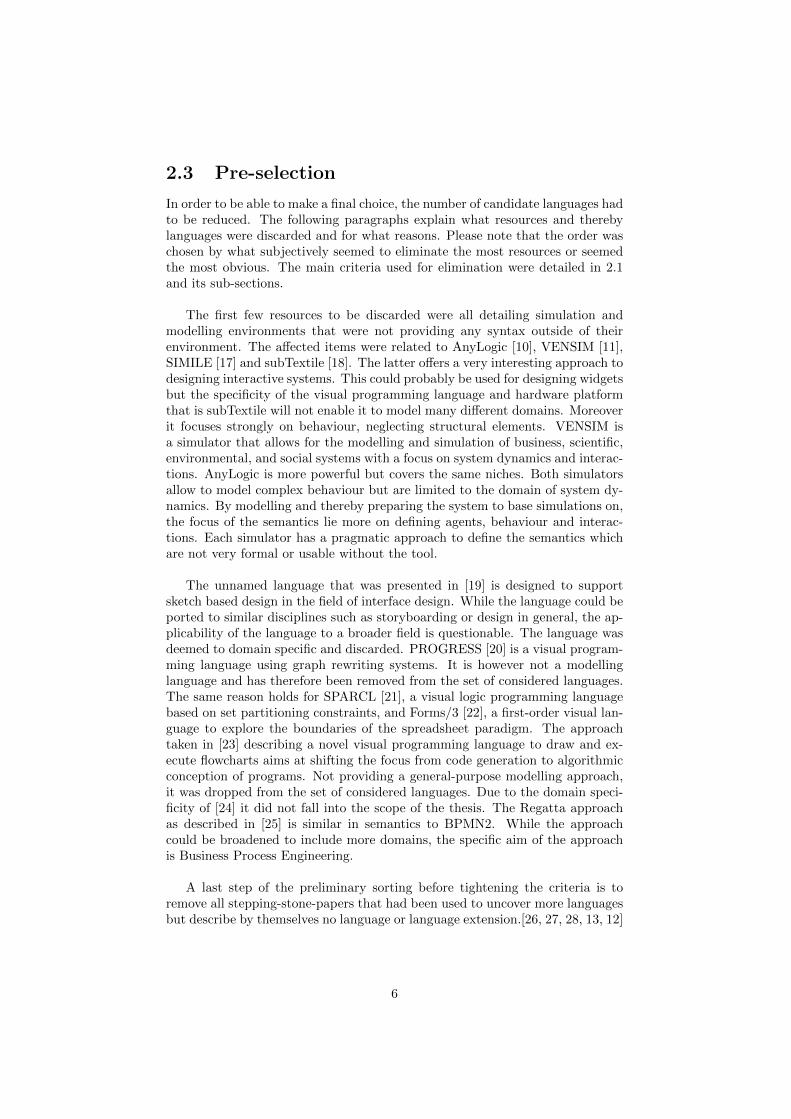
The first few resources to be discarded were all detailing simulation andmodelling environments that were not providing any syntax outside of theirenvironment. The affected items were related to AnyLogic [10], VENSIM [11],SIMILE [17] and subTextile [18]. The latter offers a very interesting approach todesigning interactive systems. This could probably be used for designing widgetsbut the specificity of the visual programming language and hardware platformthat is subTextile will not enable it to model many different domains. Moreoverit focuses strongly on behaviour, neglecting structural elements. VENSIM isa simulator that allows for the modelling and simulation of business, scientific,environmental, and social systems with a focus on system dynamics and interac-tions. AnyLogic is more powerful but covers the same niches. Both simulatorsallow to model complex behaviour but are limited to the domain of system dy-namics. By modelling and thereby preparing the system to base simulations on,the focus of the semantics lie more on defining agents, behaviour and interac-tions. Each simulator has a pragmatic approach to define the semantics whichare not very formal or usable without the tool.
The unnamed language that was presented in [19] is designed to supportsketch based design in the field of interface design. While the language could beported to similar disciplines such as storyboarding or design in general, the ap-plicability of the language to a broader field is questionable. The language wasdeemed to domain specific and discarded. PROGRESS [20] is a visual program-ming language using graph rewriting systems. It is however not a modellinglanguage and has therefore been removed from the set of considered languages.The same reason holds for SPARCL [21], a visual logic programming languagebased on set partitioning constraints, and Forms/3 [22], a first-order visual lan-guage to explore the boundaries of the spreadsheet paradigm. The approachtaken in [23] describing a novel visual programming language to draw and ex-ecute flowcharts aims at shifting the focus from code generation to algorithmicconception of programs. Not providing a general-purpose modelling approach,it was dropped from the set of considered languages. Due to the domain speci-ficity of [24] it did not fall into the scope of the thesis. The Regatta approachas described in [25] is similar in semantics to BPMN2. While the approachcould be broadened to include more domains, the specific aim of the approachis Business Process Engineering.
A last step of the preliminary sorting before tightening the criteria is toremove all stepping-stone-papers that had been used to uncover more languagesbut describe by themselves no language or language extension.[26, 27, 28, 13, 12]
6
2.4 Refining selection criteria
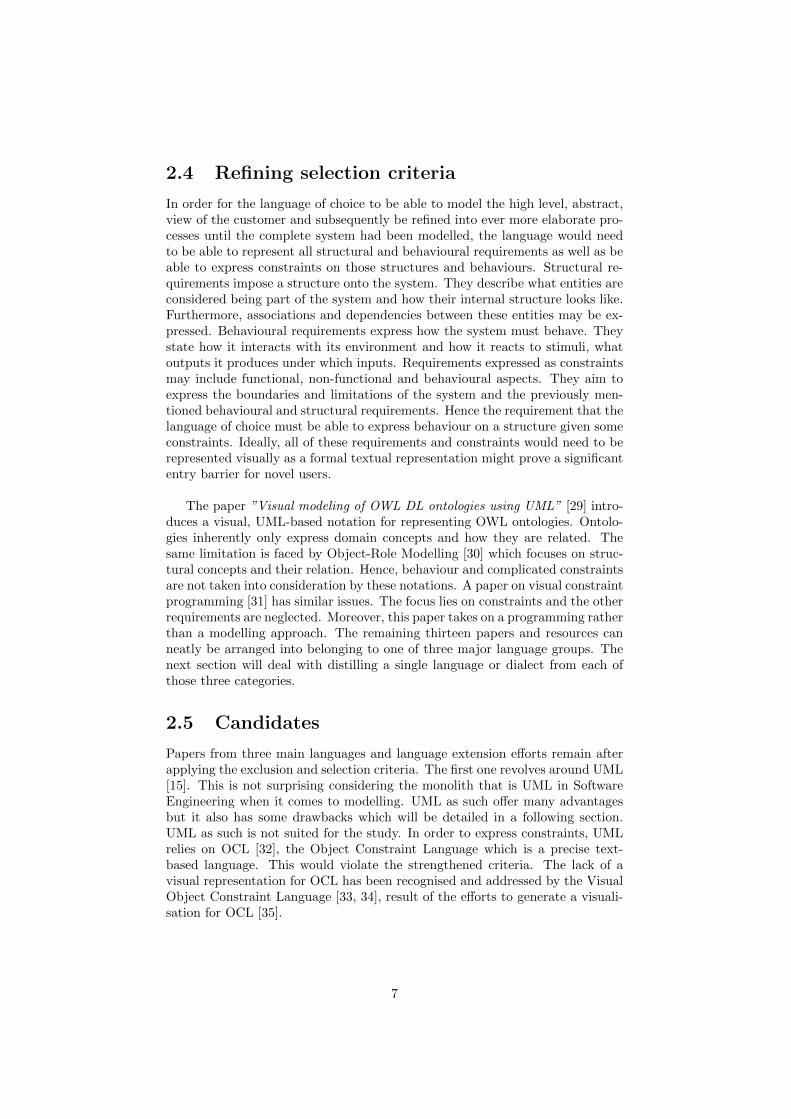
In order for the language of choice to be able to model the high level, abstract,view of the customer and subsequently be refined into ever more elaborate pro-cesses until the complete system had been modelled, the language would needto be able to represent all structural and behavioural requirements as well as beable to express constraints on those structures and behaviours. Structural re-quirements impose a structure onto the system. They describe what entities areconsidered being part of the system and how their internal structure looks like.Furthermore, associations and dependencies between these entities may be ex-pressed. Behavioural requirements express how the system must behave. Theystate how it interacts with its environment and how it reacts to stimuli, whatoutputs it produces under which inputs. Requirements expressed as constraintsmay include functional, non-functional and behavioural aspects. They aim toexpress the boundaries and limitations of the system and the previously men-tioned behavioural and structural requirements. Hence the requirement that thelanguage of choice must be able to express behaviour on a structure given someconstraints. Ideally, all of these requirements and constraints would need to berepresented visually as a formal textual representation might prove a significantentry barrier for novel users.
The paper ”Visual modeling of OWL DL ontologies using UML” [29] intro-duces a visual, UML-based notation for representing OWL ontologies. Ontolo-gies inherently only express domain concepts and how they are related. Thesame limitation is faced by Object-Role Modelling [30] which focuses on struc-tural concepts and their relation. Hence, behaviour and complicated constraintsare not taken into consideration by these notations. A paper on visual constraintprogramming [31] has similar issues. The focus lies on constraints and the otherrequirements are neglected. Moreover, this paper takes on a programming ratherthan a modelling approach. The remaining thirteen papers and resources canneatly be arranged into belonging to one of three major language groups. Thenext section will deal with distilling a single language or dialect from each ofthose three categories.
2.5 Candidates
Papers from three main languages and language extension efforts remain afterapplying the exclusion and selection criteria. The first one revolves around UML[15]. This is not surprising considering the monolith that is UML in SoftwareEngineering when it comes to modelling. UML as such offer many advantagesbut it also has some drawbacks which will be detailed in a following section.UML as such is not suited for the study. In order to express constraints, UMLrelies on OCL [32], the Object Constraint Language which is a precise text-based language. This would violate the strengthened criteria. The lack of avisual representation for OCL has been recognised and addressed by the VisualObject Constraint Language [33, 34], result of the efforts to generate a visuali-sation for OCL [35].
7
Another approach is highlighted in ”Executable Visual Contracts” [36] whichextends UML’s graphical notation to include certain types of constraints. Sincethe constraints are limited in complexity by the visual representation, UML inconjunction with VOCL will be one of the languages under investigation. Thefinal two picks, VCL [37, 38, 39, 40] and Constraint Diagrams [41, 42, 43, 16],are the sole topic in the related paper groupings. The following sections willgive some details about the language selections and highlight some features.
2.5.1 UML + VOCL
The Unified Modeling Language [15], currently at version 2.4.13, is a well es-tablished standard which has a vast user base in the software industry. Thelanguage is generic enough for the goals of this study while still offering all thetools needed to model the structure and behaviour in the domain. However,in order to satisfy requirements on correctness and quality we need constraints.This is not possible in pure UML and requires the use of an extension to UML,the Object Constraint Language, OCL [32]. OCL is a formal declarative textlanguage and does not offer a visual representation. To that end a Visualisationof OCL or simply Visual OCL (VOCL) will be used.
VOCL[33, 35] enables the user to express constraints in the same diagram-matic notation used to express the remainder of the UML model in. The ob-jective of the visualisation is to further the use of a formal language to expressconstraints as it is thought that the formal and mathematical nature of OCL isthe reason for the lack of usage [34]. Using UML to express structural and be-havioural requirements while using VOCL to express quality requirements andinvariants is suited for modelling the scenarios presented during the study.
2.5.2 VCL
The Visual Constraint Language (VCL) [37, 38, 39, 40] is a novel language thatbuilds on set theory. The language is inspired by UML class diagrams whowere in turn influenced by Entity-Relationship diagrams. VCL does take a stepfurther in that it adds assertions into the structure to increase expressiveness.VCL provides a mean to not only separate concerns using modular design butalso to address the different requirements separately, much like UML. Structuralrequirements are modelled separately from behavioural requirements which en-ables modellers to focus on one concern at a time. Instead of using multiplediagram types to specify behaviour as applied in UML, VCL uses a self-definedand separate kind of behaviour diagrams which incorporate contracts to com-pletely model behaviour. Global and local quality and correctness requirementsare addressed by so called assertion diagrams which express invariants.
3http://www.omg.org/spec/UML/2.4.1/
8
2.5.3 Constraint Diagrams
Transmitting knowledge through diagrammatic notation is an important stepin making a domain accessible by outsiders. To this goal, visual languagesand notations have been developed for quite a while. Some pioneers like Eu-ler (18th century) and Venn (19th century) recognised the need for visualisationand introduced diagrammatic notations for mathematical and logical constructs.Constraint Diagrams is a notation that is very close to those early notations andprovides a diagrammatic notation for expressing constraints akin to first orderpredicate logic [42]. While the notation could operate on its own, it is proposedto be used in conjunction with UML and replace the cumbersome non-visualOCL [16].
For the purpose of this study, the plain Constraint Diagrams as proposed by[16] is not sufficient. The initial purpose of Constraint Diagrams was to serveas an alternative OCL, hence the previously proposed conjunct use with UML.An augmented form of Constraint Diagrams is proposed in [42]. The extensionto the language allows for Constraint Diagrams to specify structural constraintsmore conveniently and even define a scheme to extent existing structures. Be-haviour is proposed to be expressed in a precondition-postcondition fashion, thesame principle used in the Design by Contract paradigm.
9
Chapter 3
Building a scenario
A model needs to be useful. A model drafted just to prove a concept might beuseful under certain circumstances but for the purpose of this study a differentapproach was chosen. When defining the scope of the thesis, BPMN2 was tobe the driver of the scenario due to its recent gain in popularity in the busi-ness modelling community. Just modelling the BPMN2 specification howeverwas out of the question. To see see if the language of choice was usable in aneveryday usage scenario, it was decided to draft a small but somewhat realisticscenario to work with. This scenario is then completed with a sample TUI in-stance created to specifically handle the scenario in question in order to be ableto express and capture the interactions between the two models.
The following sections will first introduce BPMN2 and give some pointersto find more in depth documentation. Then the BPMN2 scenario is describedas well as its different levels of refinement. In the next section the preliminaryTUI model will be described. The final paragraphs will give a brief introductionas to how widgets are constructed and what widgets were chosen to manipulatethe BPMN2 scenario models.
3.1 BPMN2
The Business Process Model and Notation was developed by the Object Manage-ment Group (OMG) and is currently in its second version[3]. The specificationintroduces the notation perfectly for the context in which it will be used;
The primary goal of BPMN is to provide a notation that is read-ily understandable by all business users, from the business analyststhat create the initial drafts of the processes, to the technical devel-opers responsible for implementing the technology that will performthose processes, and finally, to the business people who will manageand monitor those processes. Thus, BPMN creates a standardizedbridge for the gap between the business process design and processimplementation. [3]
10
For dressing the scenario for the study, the targeted BPMN2 model shouldfocus on visual concepts of the language rather than meeting the conformancecriteria stated in [3]. Focussing on the visually perceived model entities reducesthe complexity of the model and allows it to be used in the scope of the scenario.From the BPMN2 model an instance was generated that should serve as thecornerstone for the scenario. It was built upon a simple, stock themed, fictive,client-service provider model.
3.1.1 Simple scenario
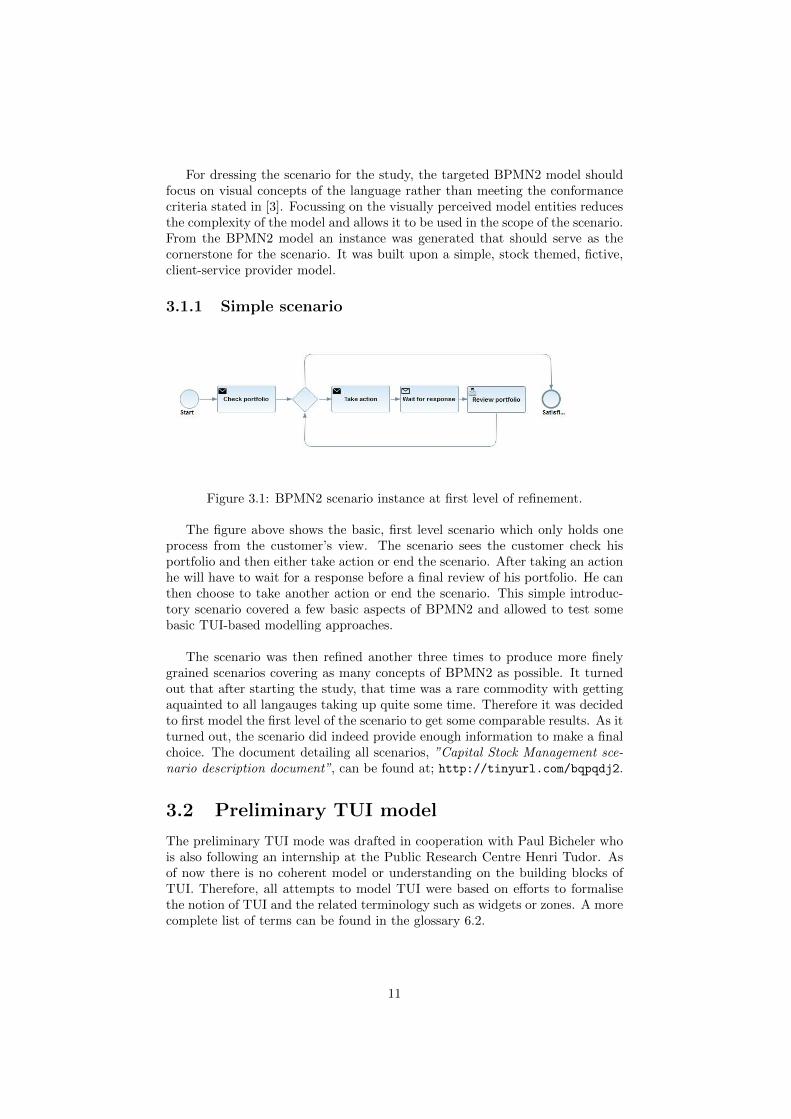
Figure 3.1: BPMN2 scenario instance at first level of refinement.
The figure above shows the basic, first level scenario which only holds oneprocess from the customer’s view. The scenario sees the customer check hisportfolio and then either take action or end the scenario. After taking an actionhe will have to wait for a response before a final review of his portfolio. He canthen choose to take another action or end the scenario. This simple introduc-tory scenario covered a few basic aspects of BPMN2 and allowed to test somebasic TUI-based modelling approaches.
The scenario was then refined another three times to produce more finelygrained scenarios covering as many concepts of BPMN2 as possible. It turnedout that after starting the study, that time was a rare commodity with gettingaquainted to all langauges taking up quite some time. Therefore it was decidedto first model the first level of the scenario to get some comparable results. As itturned out, the scenario did indeed provide enough information to make a finalchoice. The document detailing all scenarios, ”Capital Stock Management sce-nario description document”, can be found at; http://tinyurl.com/bqpqdj2.
3.2 Preliminary TUI model
The preliminary TUI mode was drafted in cooperation with Paul Bicheler whois also following an internship at the Public Research Centre Henri Tudor. Asof now there is no coherent model or understanding on the building blocks ofTUI. Therefore, all attempts to model TUI were based on efforts to formalisethe notion of TUI and the related terminology such as widgets or zones. A morecomplete list of terms can be found in the glossary 6.2.
11
In order to keep the modelling efforts comparable, a number of requirementswere drafted in cooperation with Paul. These requirements spanned structuraland behavioural aspects and detailed a few simple constraints. For example, awidget must have at least one handle or a handle may be bound. Such atomicrequirement statements are of course far removed from what a customer mightspecify but the simple nature of the requirements was preferred as it meantthat we could save time and focus on the essential, the modelling. A completeset of requirements can be found in the accompanying document, ”Scenariorequirement description document” which can be accessed at http://tinyurl.com/cnqupjj. An excerpt from the document containing all requirements canbe found in Appendix B.
3.2.1 A simple TUI instance
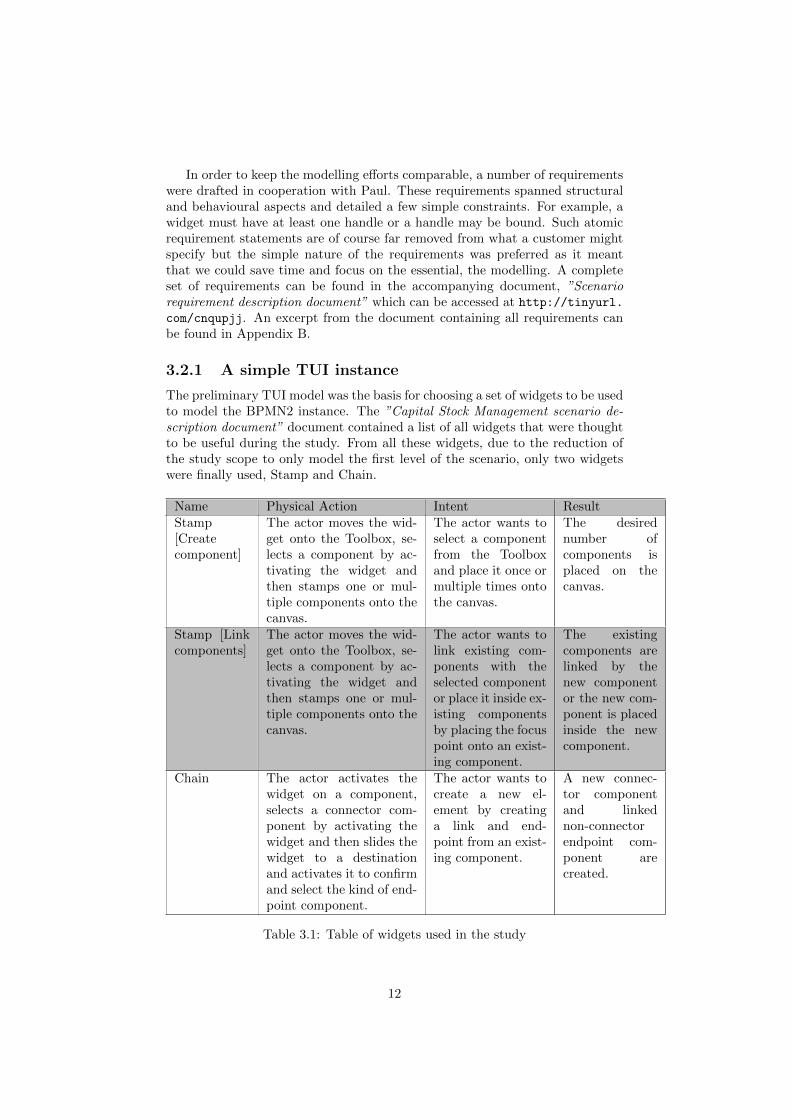
The preliminary TUI model was the basis for choosing a set of widgets to be usedto model the BPMN2 instance. The ”Capital Stock Management scenario de-scription document” document contained a list of all widgets that were thoughtto be useful during the study. From all these widgets, due to the reduction ofthe study scope to only model the first level of the scenario, only two widgetswere finally used, Stamp and Chain.
Name Physical Action Intent ResultStamp[Createcomponent]
The actor moves the wid-get onto the Toolbox, se-lects a component by ac-tivating the widget andthen stamps one or mul-tiple components onto thecanvas.
The actor wants toselect a componentfrom the Toolboxand place it once ormultiple times ontothe canvas.
The desirednumber ofcomponents isplaced on thecanvas.
Stamp [Linkcomponents]
The actor moves the wid-get onto the Toolbox, se-lects a component by ac-tivating the widget andthen stamps one or mul-tiple components onto thecanvas.
The actor wants tolink existing com-ponents with theselected componentor place it inside ex-isting componentsby placing the focuspoint onto an exist-ing component.
The existingcomponents arelinked by thenew componentor the new com-ponent is placedinside the newcomponent.
Chain The actor activates thewidget on a component,selects a connector com-ponent by activating thewidget and then slides thewidget to a destinationand activates it to confirmand select the kind of end-point component.
The actor wants tocreate a new el-ement by creatinga link and end-point from an exist-ing component.
A new connec-tor componentand linkednon-connectorendpoint com-ponent arecreated.
Table 3.1: Table of widgets used in the study
12
Chapter 4
Case study
This chapter will guide the reader through study, from design of the measure-ments till the final conclusion. During the study, the tree previously identifiedvisual modelling languages will be used in turns to try and model the scenariodefined in 3. Before each modelling attempt, a few days were spent on gettingacquainted with the languages, modelling some tutorials if available and con-sulting some papers highlighting examples.
The following sections will explain which measurements were collected inorder to be able to evaluate the chosen visual modelling languages as well asexplaining the point and weighting scheme of the measurements. Next will be arundown of the actual study. While taking the study there were some problemswhich had to be addressed. These will be explained in the second to last sectionwith the last section wrapping up the study and preparing for the next chapterwhich will concern itself with the evaluation.
4.1 Measurements
In order to be able to compare the different VMLs, measurements are neededthat can be objectively collected and evaluated. Unfortunately the picking ofthese measurements is subjective and hence makes all attempts to be objectivetainted. However, all subjective choices are given as is and no attempt wasmade to hide them. It is up to the reader to judge on the validity of the study.
The drafting of the measurements was accompanied by the ”Visual mod-elling Language Evaluation Criteria” document which can be found at http:
//tinyurl.com/bobus6c. The measurements are split into six categories. Toolsupport is aimed to measure the availability and quality of language accompany-ing tool. The use of a tool is usually preferable as it usually offers many facilitiesthat make modelling easier and less error prone. Semantics & Transformationcaptures the degree of formalism the VML offers. The Expressivity categorycaptures the number of requirements that have been met by each language andcomputes a ratio. The Usability of each VML is measured by the category withthe same name. Error Checking puts a number to the facilities each VML andits accompanying tools offer for rooting errors during the modelling process.
13
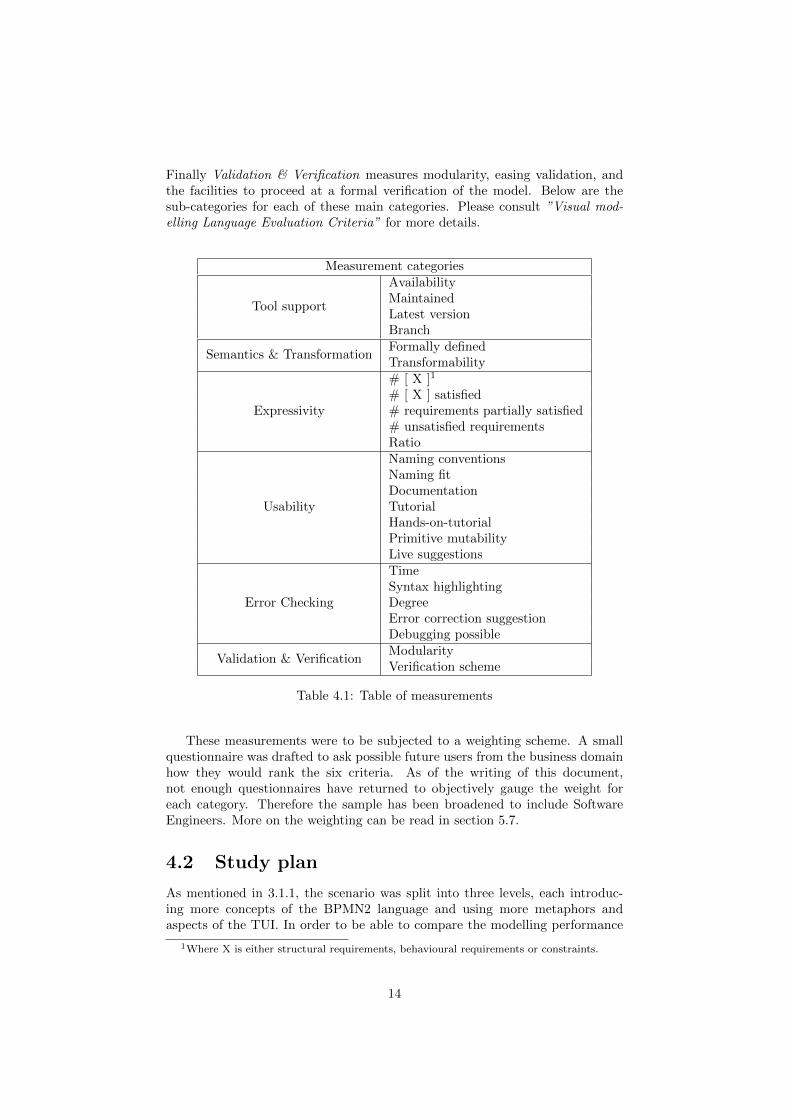
Finally Validation & Verification measures modularity, easing validation, andthe facilities to proceed at a formal verification of the model. Below are thesub-categories for each of these main categories. Please consult ”Visual mod-elling Language Evaluation Criteria” for more details.
Measurement categories
Tool support
AvailabilityMaintainedLatest versionBranch
Semantics & TransformationFormally definedTransformability
Expressivity
# [ X ]1
# [ X ] satisfied# requirements partially satisfied# unsatisfied requirementsRatio
Usability
Naming conventionsNaming fitDocumentationTutorialHands-on-tutorialPrimitive mutabilityLive suggestions
Error Checking
TimeSyntax highlightingDegreeError correction suggestionDebugging possible
Validation & VerificationModularityVerification scheme
Table 4.1: Table of measurements
These measurements were to be subjected to a weighting scheme. A smallquestionnaire was drafted to ask possible future users from the business domainhow they would rank the six criteria. As of the writing of this document,not enough questionnaires have returned to objectively gauge the weight foreach category. Therefore the sample has been broadened to include SoftwareEngineers. More on the weighting can be read in section 5.7.
4.2 Study plan
As mentioned in 3.1.1, the scenario was split into three levels, each introduc-ing more concepts of the BPMN2 language and using more metaphors andaspects of the TUI. In order to be able to compare the modelling performance
1Where X is either structural requirements, behavioural requirements or constraints.
14
of the languages given the scenario, a plan had to be followed. Therefore, itseemed unwise to simply take all requirements, as found in B, and model thesesequentially. Therefore, the ”Capital Stock Management scenario descriptiondocument”’s tasks were taken as a basis to draft a scenario, level by level. Fora definition of each requirement that will be stated by its abbreviation below,all requirements were included in Appendix B.
First, complete BPMN2 and TUI model were drafted in that order. To thatend, all requirements pertaining to the BPMN2 B.1 and TUI B.3 model neededto be fulfilled. After these steps had been modelled, the process of modellingfollowed the level based separation of complexity. The modelling of the firstlevel had eight steps, each stemming from identifying the task involved to fulfilthe step.
4.2.1 Create Start Event
To create a Start Event we need a widget in Stamp mode. We therefore mustfulfil TMS1 and TMS3. As for widget behaviour, the Stamp requires TMB1,TMB122 and TMB13.
4.2.2 Create Activity
To state all requirements needed to create an activity we need to cater to bothcreation scenarios. The use of the Stamp is covered by the previous task so wecan simply assume we need all those requirements too; TMS1, TMS3, TMB1,TMB12 and TMB13. To use the Chain widget we also need TMS2 and moreitems fromTMB12. In addition we need to meet several requirements from thestock management model, depending on the type of activity that is created.
4.2.3 Check portfolio
In order to attribute the activity to a user said user and his portfolio are needed;SS1, SS5 and SS6. Moreover, the related behaviour and constraints; SB1 andSC4 are needed.
4.2.4 Take action
Information about the customer, SS1 and about an eventual order the customermay place, SS4, SB2 and SC1 is needed. To place an order, requirementscatering to the subject of orders, stock, are needed too; SS2 and SS3. Dueto the encapsulation of information, details about the orders are not noted inBPMN2 and hence the differentiation between stocks for example would onlybecome apparent if a decision is taken based on their difference.
4.2.5 Wait for response
Information about the customer, SS1 and the action he may take; SB4 isneeded.
2For TMB12, only those rows are required that list the mode in question.
15
4.2.6 Review portfolio
In order to attribute the activity to a user said user and his portfolio are needed;SS1, SS5 and SS6. Moreover, the related behaviour and constraints; SB3 andSC4 are needed.
4.2.7 Create Gateway / Create Event
Analogous to Create Activity.
4.2.8 Link components
To create a connection we need a widget in Stamp mode. We therefore must fulfilTMS1 and TMS3. As for behaviour, the Stamp requires TMB1, TMB12and TMB13. To use the Chain widget we also need TMS2 and more itemsfrom TMB12.
After having modelled the first level, most of the requirements were coveredand it was deemed that the time investment needed to model the remaining twolevels would not offer any significant new insights into the modelling languages.
4.3 Scope reduction
During the draft of the BPMN2 models, the scenario and all related items,the scenario was split into three levels which would symbolise the increase incomplexity during a collaborative modelling approach. In theory, the customerwould model his view and then the business people would model their end.Then the processes would get more and more detailed with all parties definingthe back and forth that required for business processes. The small scenariothat was drafted seemed to be not too complex to model quickly and gain somevaluable insights.
Getting accustomed with several of the modelling languages proved moreof a challenge than expected and time elapsed quickly. After having modelledthe basis requirements and the first level for each language, the time allocatedfor the modelling process during the sturdy had elapsed. Seeing as the com-plexity of the modelling process would not increase from here on out, spendingtime on modelling the remaining levels would not benefit the study significantly.
Therefore it was chosen to reduce the scope of the study from initially threelevels of complexity to two levels. The first level can be seen in Figure 3.1.1. Thetwo remaining levels can be seen in Appendix C and Appendix D respectively.
16
4.4 Product
At the end of the modelling process, each language had produced multiple mod-els which will be given in the subsequent sub-sections. The subjective experiencegained during the modelling process will be reflected during the evaluation phasedetailed in the next chapter. Each subsequent section dedicated to one partic-ular language will include all models produced during the study. They will alsoinclude comments on the modelling experience and the models themselves.
4.4.1 UML + VOCL
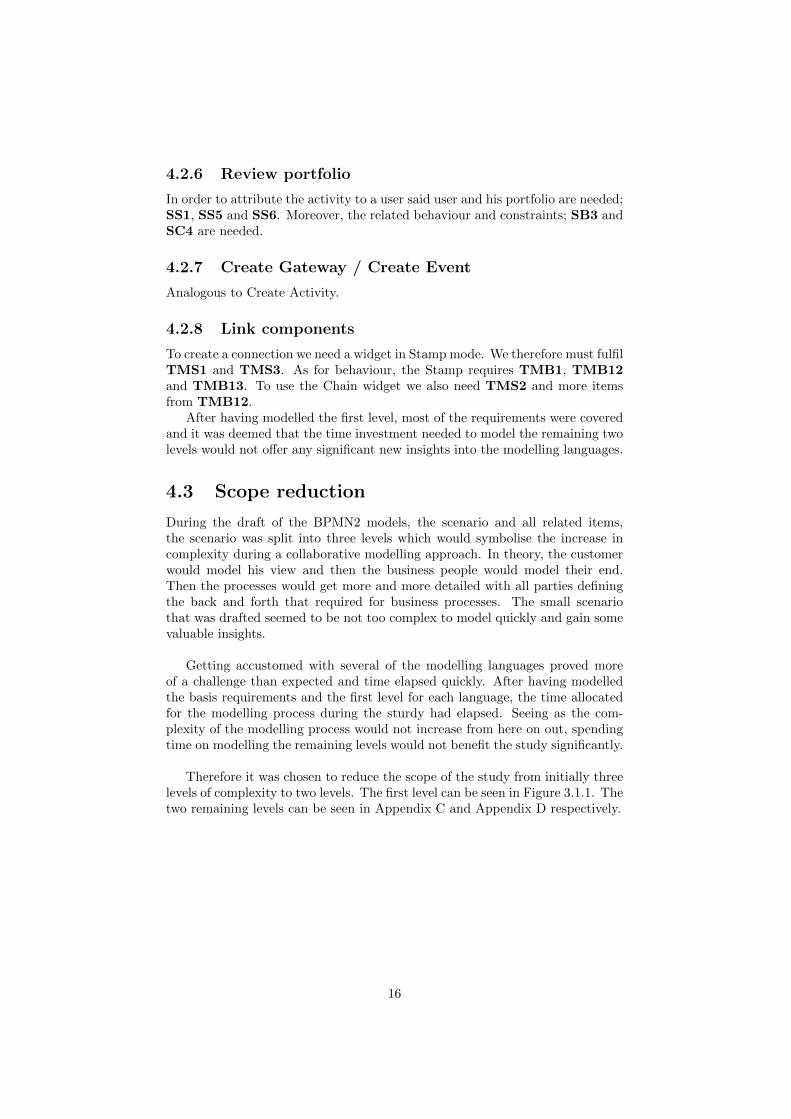
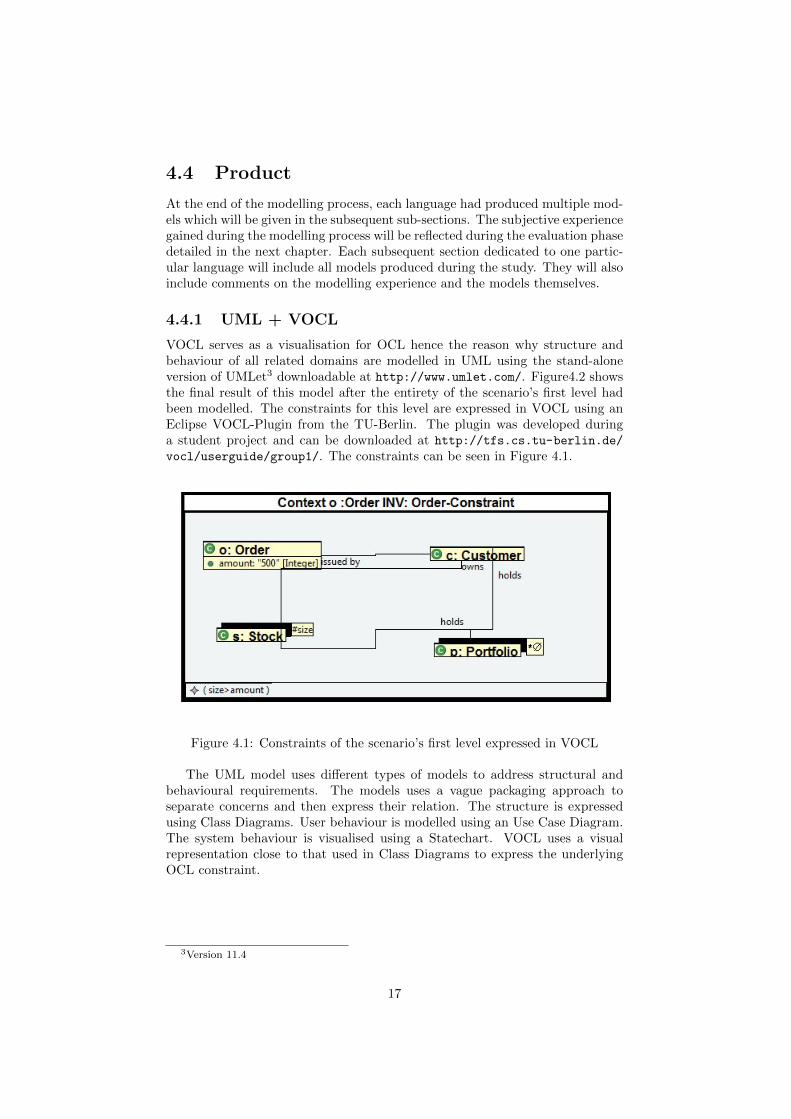
VOCL serves as a visualisation for OCL hence the reason why structure andbehaviour of all related domains are modelled in UML using the stand-aloneversion of UMLet3 downloadable at http://www.umlet.com/. Figure4.2 showsthe final result of this model after the entirety of the scenario’s first level hadbeen modelled. The constraints for this level are expressed in VOCL using anEclipse VOCL-Plugin from the TU-Berlin. The plugin was developed duringa student project and can be downloaded at http://tfs.cs.tu-berlin.de/
vocl/userguide/group1/. The constraints can be seen in Figure 4.1.
Figure 4.1: Constraints of the scenario’s first level expressed in VOCL
The UML model uses different types of models to address structural andbehavioural requirements. The models uses a vague packaging approach toseparate concerns and then express their relation. The structure is expressedusing Class Diagrams. User behaviour is modelled using an Use Case Diagram.The system behaviour is visualised using a Statechart. VOCL uses a visualrepresentation close to that used in Class Diagrams to express the underlyingOCL constraint.
3Version 11.4
17
0..n
0..n
0..n
0..n
0..n
1..n
creates
0..n0..n
0..n
Widget
id: UID
angle: Real
clearable: Boolean
visualisation: T-setC
learable(b: Boolean)
-setDP
(x: int)+
activate()+
drop()+
lift()+
shake()
Handle
+bound: B
oolean+
domainP
resence: Real
1..n
Mode
-activate()-handleD
rop()-handleLift()-handleS
hake()
Stam
p-im
print: T+
activate()+
handleDrop()
Position
-x: Real
-y: Real
setX(x: R
eal)setY
(y: Real)
getX(): R
ealgetY
(): Real
1
1
Chain
+activate()
+handleD
rop()
TU
I model
BP
MN
2 model
Diagram
Collaboration
0..1
Process
0..1
Event
type: TA
ctivityG
ateway
type: T
Connection
Sw
imlane
Artefact
0..n2..n
1..n
0..n0..n
1..n
Start
Intermediate
mode: T
End
Task
ProcessM
essage Flow
Sequence F
low
Association
Pool
Lane1..n contains
Group
Annotation
Data O
bject
1
0..nsourcetarget
1
0..nsourcetarget
10..n
sourcetarget
1
0..n
sourcetarget
1
0..nsourcetarget
1
0..nsource
1
0..n
target
1
0..n
target
1
0..ntarget
1
0..ntarget
1
0..n
target
Associated
[create]
lift / setDP
(0)
[destroy]activate [over control area] / sw
itchMode(M
ode)
dropped [over model entity] / D
rop(Position)
acivate [over model entity] / changeIm
Stam
p
Stam
pshake
lift / setDP
(0)
dropped [emtpy canvas space] / paint
[Stam
p]
[Chain]
shake
Widget B
ehaviour
Dom
ain model
Custom
ergoodS
tanding: Boolean
+checkP
ortfolio(): Portfolio
+placeO
rder(type: Enum
, amount: int)
-sellStock(am
ount: int)-buyS
tock(amnount:int)
StockB
rokerage
Portfolio
Stock
1..n
holds
0..n
1
holds
owns
manages
Custom
er
Check P
ortfolio
Custom
er Behaviour
0..n
0..n
expressed by
0..n
0..n
expressed by
Order
amount: int
Place O
rder
Sell S
tock
Buy S
tock
«extends»{if portfolio not em
pty}
«extends»
sellersubject
amount
buyer
amount
subjectC
omm
on Stock
Preferred S
hare
ConvertibleP
referredShare
+conversionR
ate+
earliestConversionD
ate
Wait for com
pletion
Review
Portfolio
dropped [onto component &
Imprint.type =
Connector] /
imprint.source=
component &
dynamicP
aint
Seek target
shake / erase(Imprint) &
Imprint.D
estroy
dropped [onto component] /
imprint.target=
component
defines behaviour
acivate [over model entity] / show
Connectors
Chain
Chain
shake
lift / setDP
(0) acivate [over empty canvas] / show
Connectors
Figure 4.2: UML model for the first level of the scenario
18
4.4.2 VCL
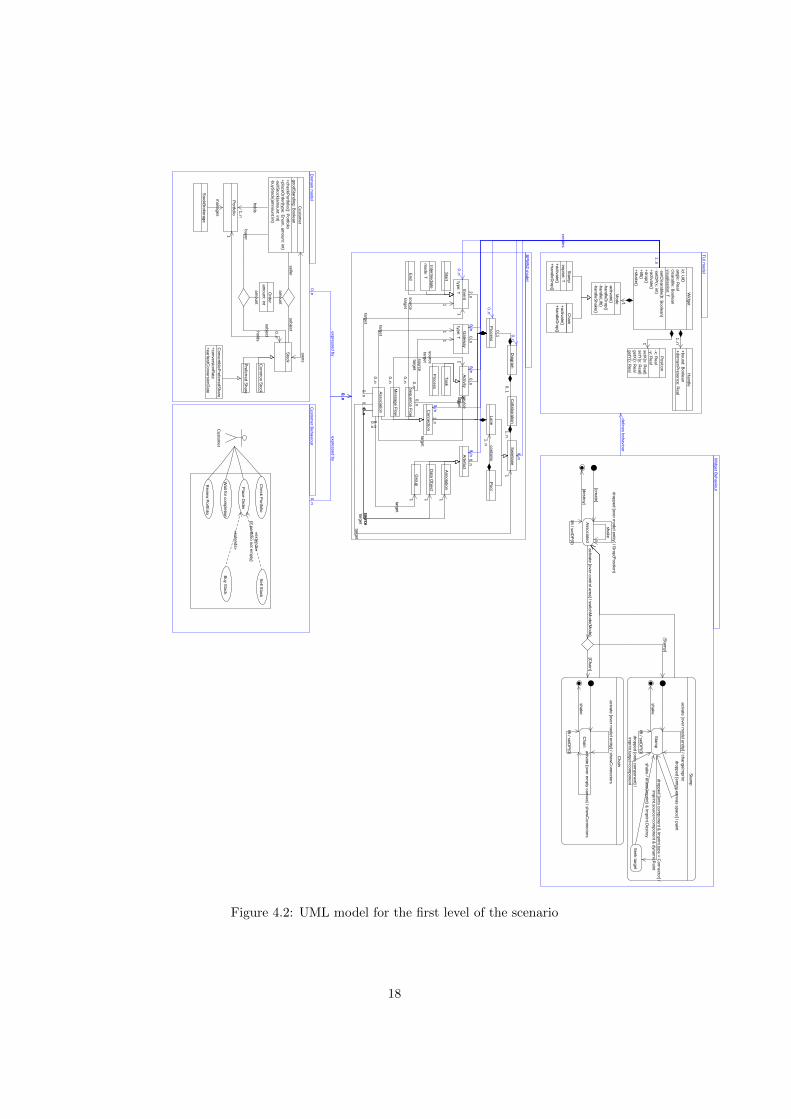
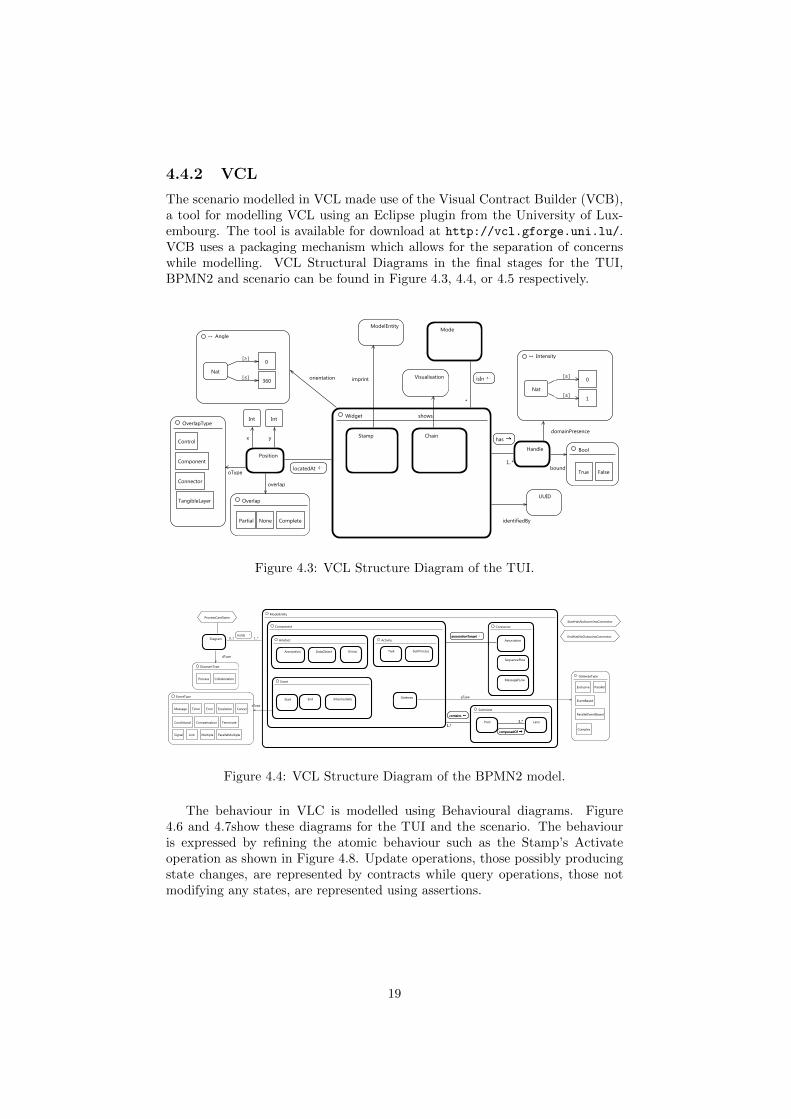
The scenario modelled in VCL made use of the Visual Contract Builder (VCB),a tool for modelling VCL using an Eclipse plugin from the University of Lux-embourg. The tool is available for download at http://vcl.gforge.uni.lu/.VCB uses a packaging mechanism which allows for the separation of concernswhile modelling. VCL Structural Diagrams in the final stages for the TUI,BPMN2 and scenario can be found in Figure 4.3, 4.4, or 4.5 respectively.
Figure 4.3: VCL Structure Diagram of the TUI.
Figure 4.4: VCL Structure Diagram of the BPMN2 model.
The behaviour in VLC is modelled using Behavioural diagrams. Figure4.6 and 4.7show these diagrams for the TUI and the scenario. The behaviouris expressed by refining the atomic behaviour such as the Stamp’s Activateoperation as shown in Figure 4.8. Update operations, those possibly producingstate changes, are represented by contracts while query operations, those notmodifying any states, are represented using assertions.
19
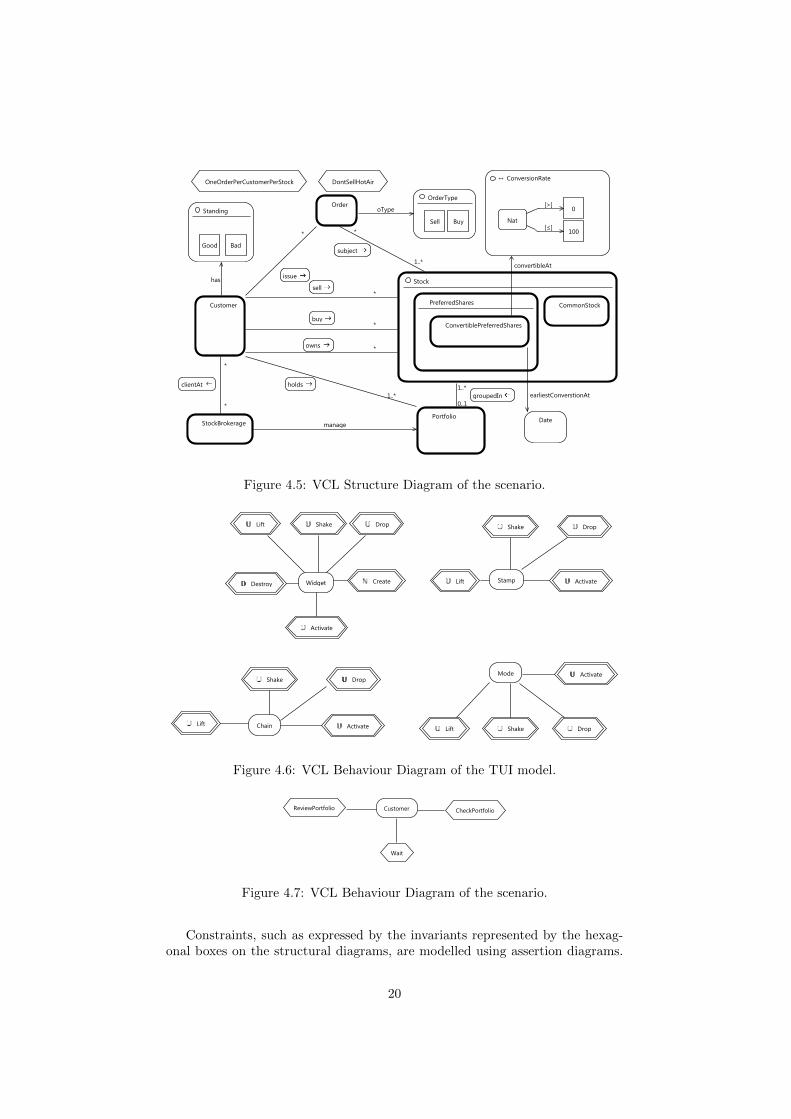
Figure 4.5: VCL Structure Diagram of the scenario.
Figure 4.6: VCL Behaviour Diagram of the TUI model.
Figure 4.7: VCL Behaviour Diagram of the scenario.
Constraints, such as expressed by the invariants represented by the hexag-onal boxes on the structural diagrams, are modelled using assertion diagrams.
20
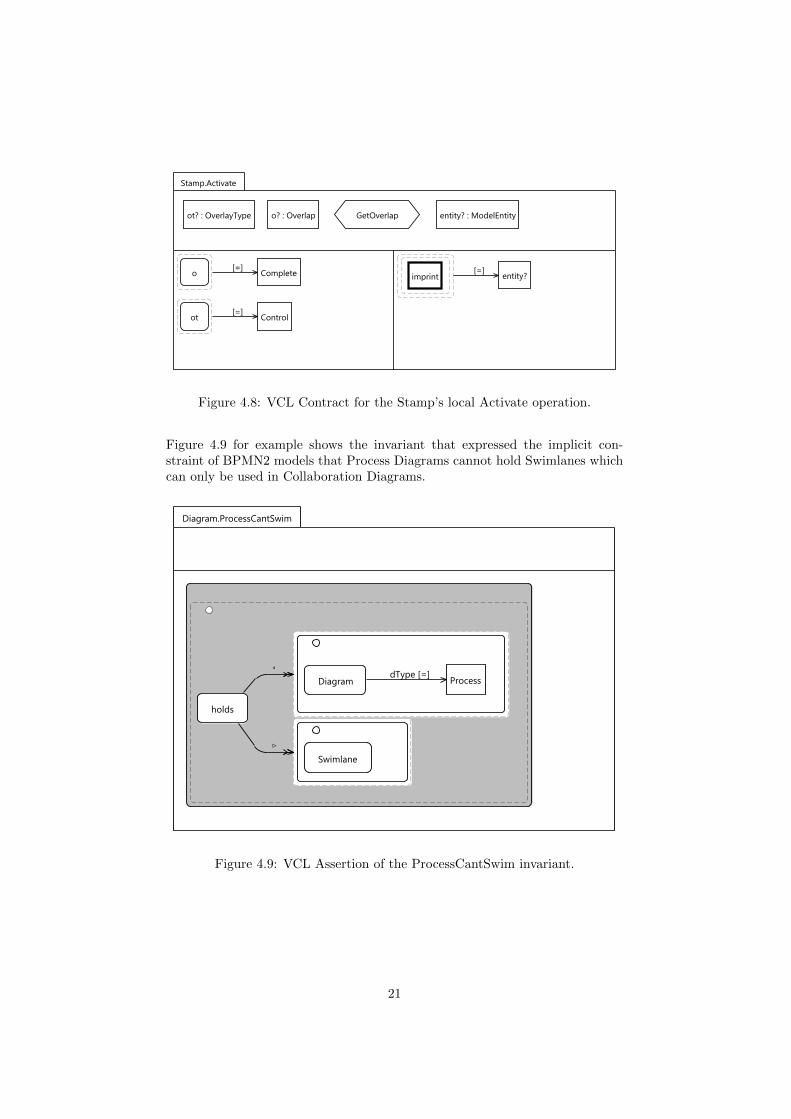
Figure 4.8: VCL Contract for the Stamp’s local Activate operation.
Figure 4.9 for example shows the invariant that expressed the implicit con-straint of BPMN2 models that Process Diagrams cannot hold Swimlanes whichcan only be used in Collaboration Diagrams.
Figure 4.9: VCL Assertion of the ProcessCantSwim invariant.
21
4.4.3 Constraint Diagrams
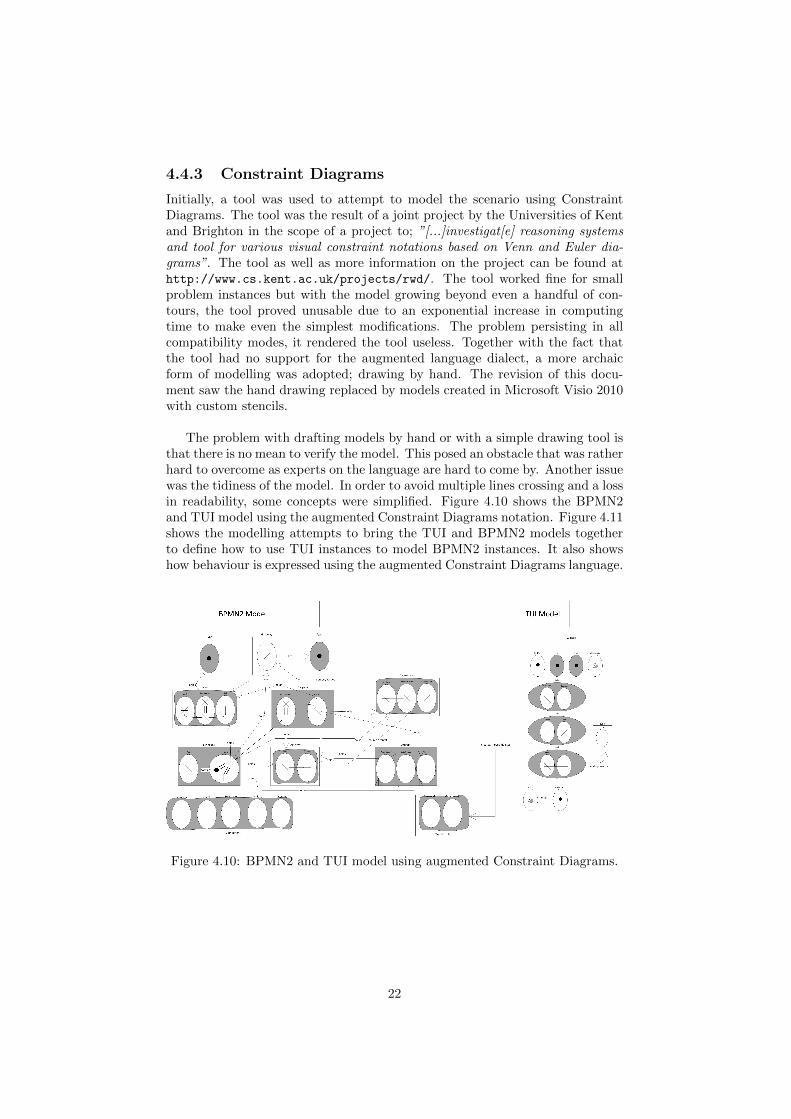
Initially, a tool was used to attempt to model the scenario using ConstraintDiagrams. The tool was the result of a joint project by the Universities of Kentand Brighton in the scope of a project to; ”[...]investigat[e] reasoning systemsand tool for various visual constraint notations based on Venn and Euler dia-grams”. The tool as well as more information on the project can be found athttp://www.cs.kent.ac.uk/projects/rwd/. The tool worked fine for smallproblem instances but with the model growing beyond even a handful of con-tours, the tool proved unusable due to an exponential increase in computingtime to make even the simplest modifications. The problem persisting in allcompatibility modes, it rendered the tool useless. Together with the fact thatthe tool had no support for the augmented language dialect, a more archaicform of modelling was adopted; drawing by hand. The revision of this docu-ment saw the hand drawing replaced by models created in Microsoft Visio 2010with custom stencils.
The problem with drafting models by hand or with a simple drawing tool isthat there is no mean to verify the model. This posed an obstacle that was ratherhard to overcome as experts on the language are hard to come by. Another issuewas the tidiness of the model. In order to avoid multiple lines crossing and a lossin readability, some concepts were simplified. Figure 4.10 shows the BPMN2and TUI model using the augmented Constraint Diagrams notation. Figure 4.11shows the modelling attempts to bring the TUI and BPMN2 models togetherto define how to use TUI instances to model BPMN2 instances. It also showshow behaviour is expressed using the augmented Constraint Diagrams language.
Figure 4.10: BPMN2 and TUI model using augmented Constraint Diagrams.
22
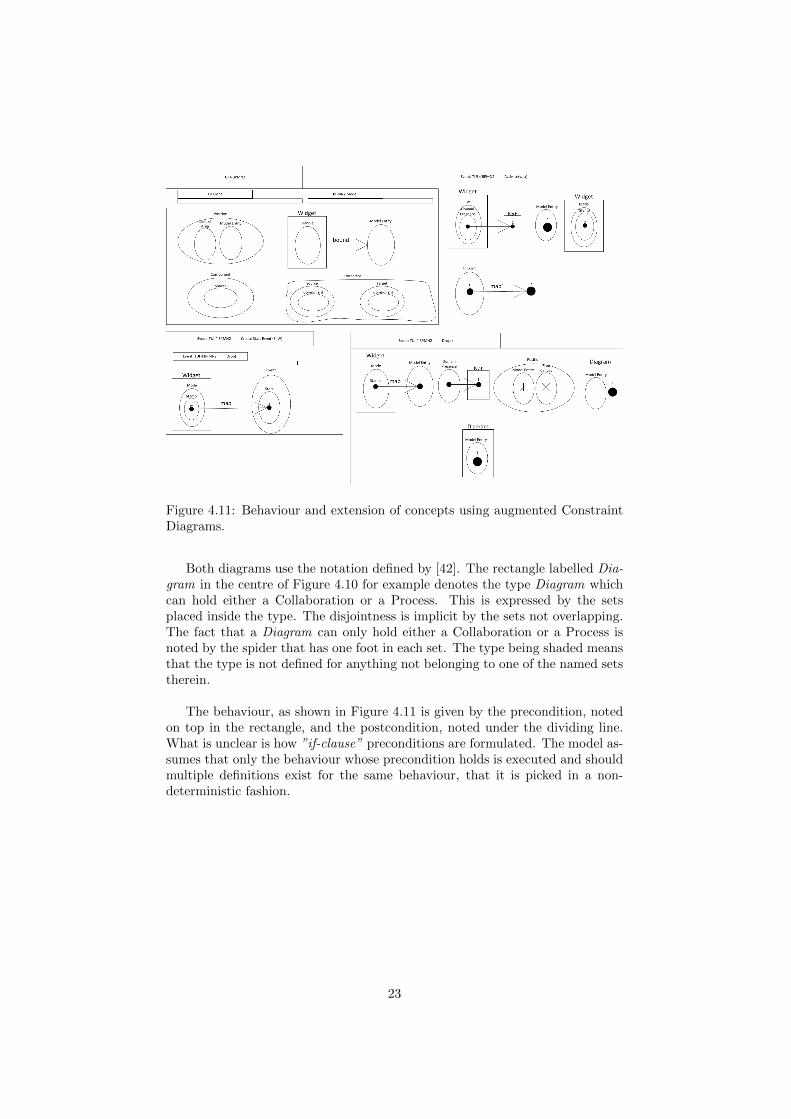
Figure 4.11: Behaviour and extension of concepts using augmented ConstraintDiagrams.
Both diagrams use the notation defined by [42]. The rectangle labelled Dia-gram in the centre of Figure 4.10 for example denotes the type Diagram whichcan hold either a Collaboration or a Process. This is expressed by the setsplaced inside the type. The disjointness is implicit by the sets not overlapping.The fact that a Diagram can only hold either a Collaboration or a Process isnoted by the spider that has one foot in each set. The type being shaded meansthat the type is not defined for anything not belonging to one of the named setstherein.
The behaviour, as shown in Figure 4.11 is given by the precondition, notedon top in the rectangle, and the postcondition, noted under the dividing line.What is unclear is how ”if-clause” preconditions are formulated. The model as-sumes that only the behaviour whose precondition holds is executed and shouldmultiple definitions exist for the same behaviour, that it is picked in a non-deterministic fashion.
23
Chapter 5
Evaluation
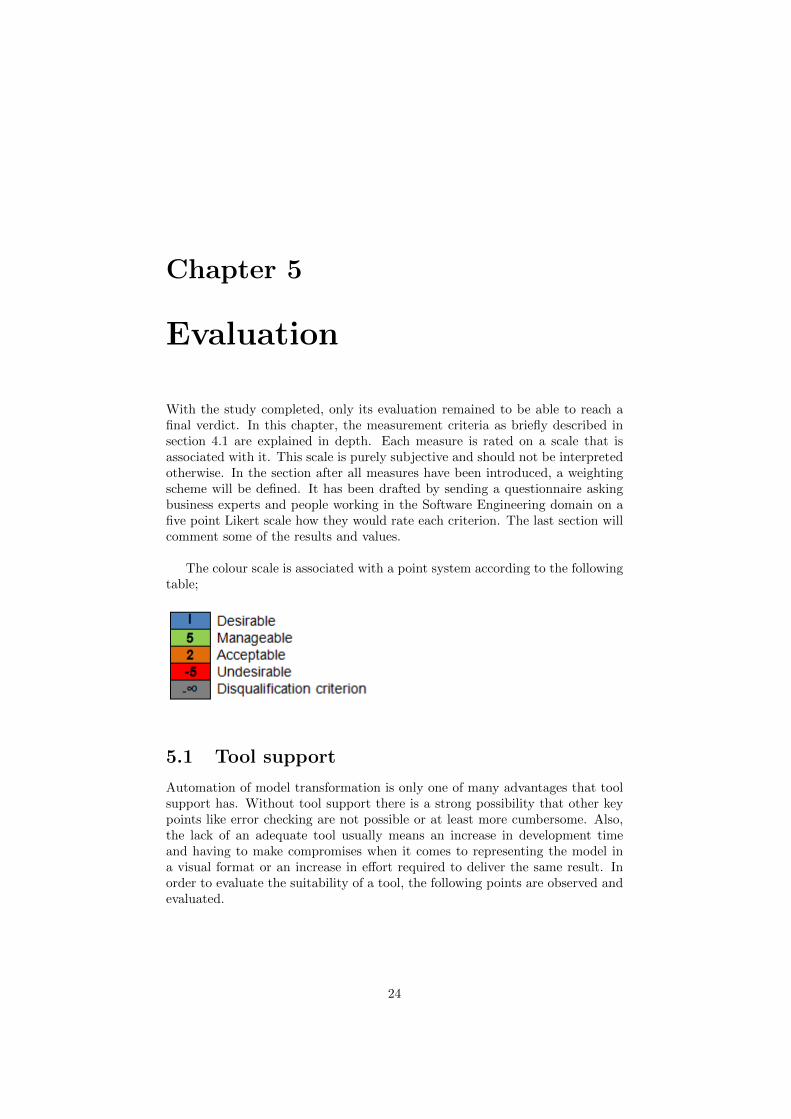
With the study completed, only its evaluation remained to be able to reach afinal verdict. In this chapter, the measurement criteria as briefly described insection 4.1 are explained in depth. Each measure is rated on a scale that isassociated with it. This scale is purely subjective and should not be interpretedotherwise. In the section after all measures have been introduced, a weightingscheme will be defined. It has been drafted by sending a questionnaire askingbusiness experts and people working in the Software Engineering domain on afive point Likert scale how they would rate each criterion. The last section willcomment some of the results and values.
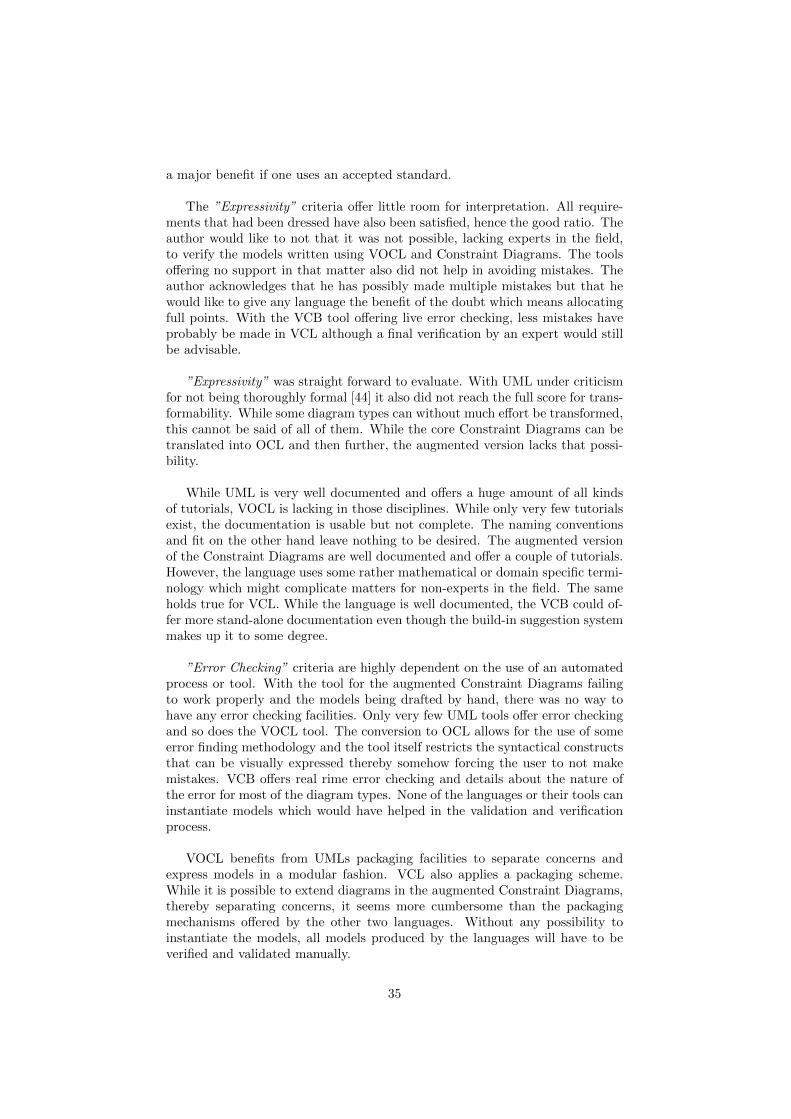
The colour scale is associated with a point system according to the followingtable;
5.1 Tool support
Automation of model transformation is only one of many advantages that toolsupport has. Without tool support there is a strong possibility that other keypoints like error checking are not possible or at least more cumbersome. Also,the lack of an adequate tool usually means an increase in development timeand having to make compromises when it comes to representing the model ina visual format or an increase in effort required to deliver the same result. Inorder to evaluate the suitability of a tool, the following points are observed andevaluated.
24
5.1.1 Availability
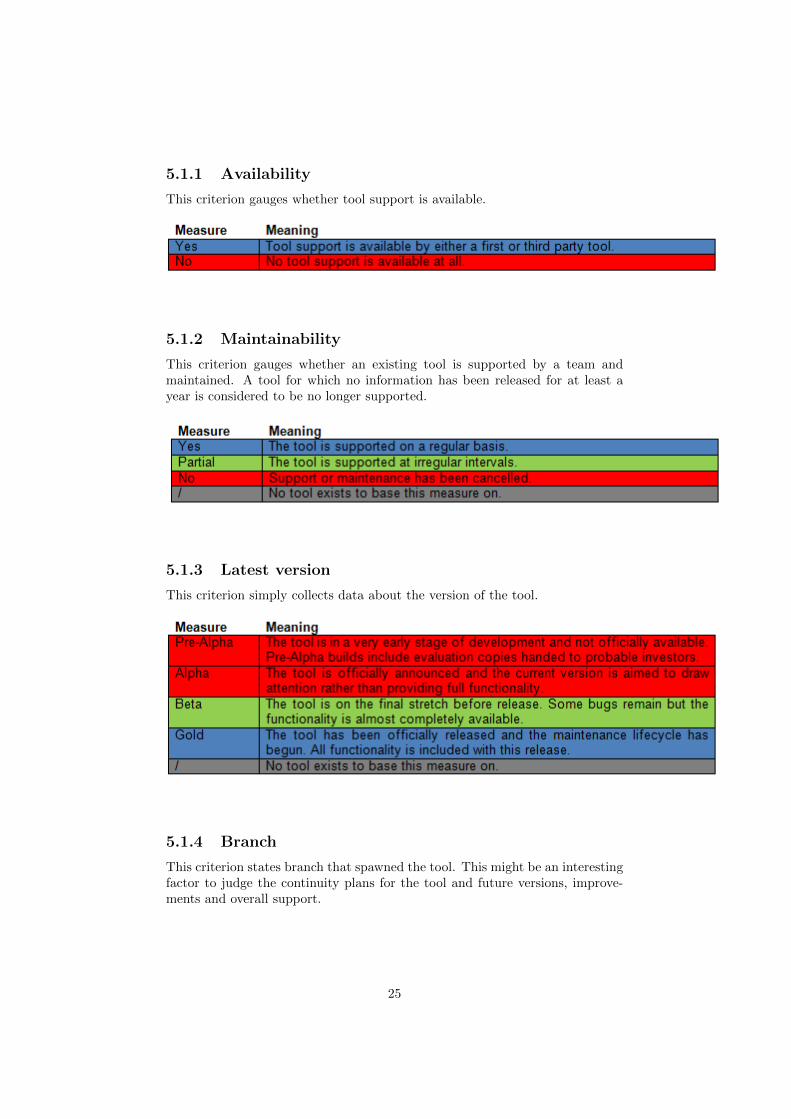
This criterion gauges whether tool support is available.
5.1.2 Maintainability
This criterion gauges whether an existing tool is supported by a team andmaintained. A tool for which no information has been released for at least ayear is considered to be no longer supported.
5.1.3 Latest version
This criterion simply collects data about the version of the tool.
5.1.4 Branch
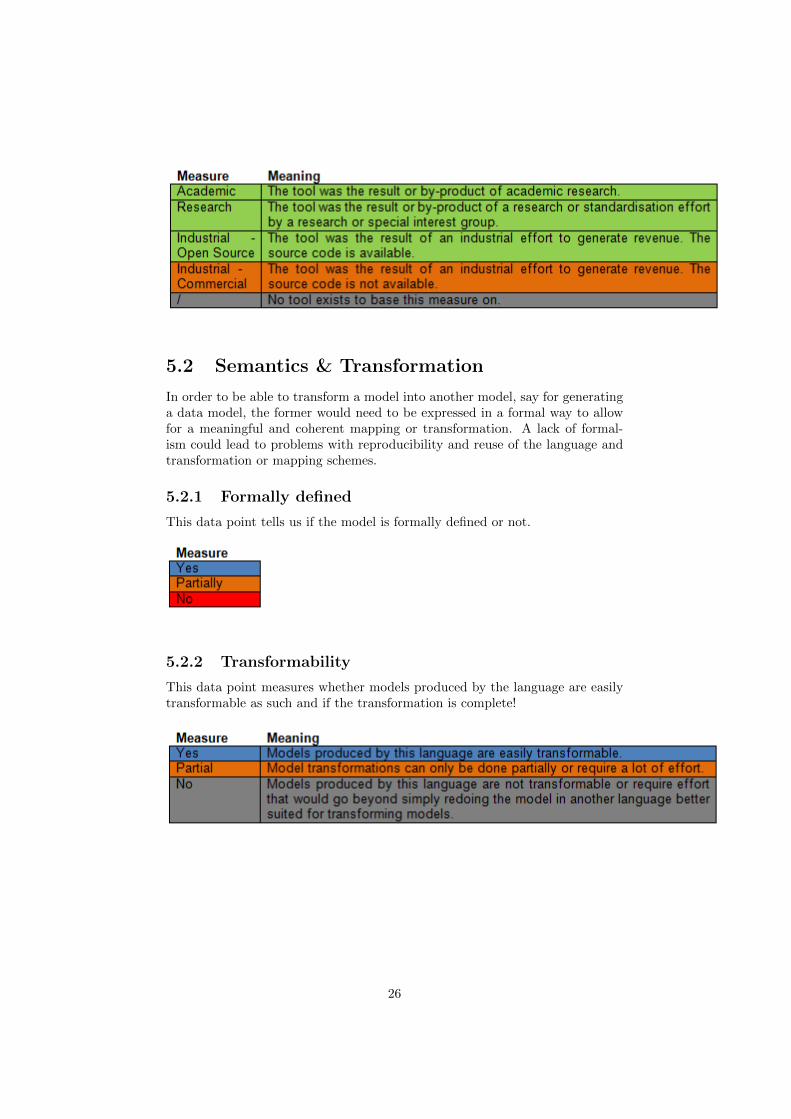
This criterion states branch that spawned the tool. This might be an interestingfactor to judge the continuity plans for the tool and future versions, improve-ments and overall support.
25
5.2 Semantics & Transformation
In order to be able to transform a model into another model, say for generatinga data model, the former would need to be expressed in a formal way to allowfor a meaningful and coherent mapping or transformation. A lack of formal-ism could lead to problems with reproducibility and reuse of the language andtransformation or mapping schemes.
5.2.1 Formally defined
This data point tells us if the model is formally defined or not.
5.2.2 Transformability
This data point measures whether models produced by the language are easilytransformable as such and if the transformation is complete!
26
5.3 Expressivity
The expressivity criteria try to capture data points which measure the perfor-mance of the VMLs to be able to compare their ability to correctly model thescenario. They measure these criteria by category; structural requirements, be-havioural requirements, or constraints. Therefore, each of the following sectionsis measured thrice with the exception of the ratio which is not observed butcomputed.
5.3.1 # X (# X)
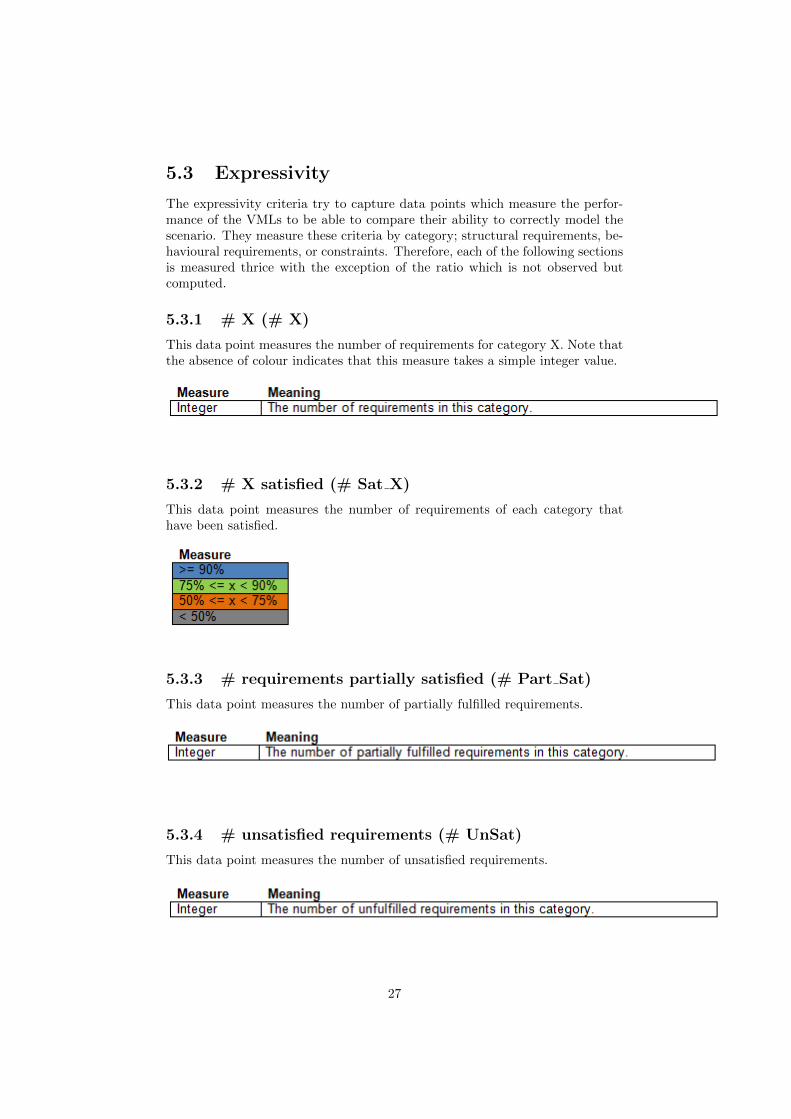
This data point measures the number of requirements for category X. Note thatthe absence of colour indicates that this measure takes a simple integer value.
5.3.2 # X satisfied (# Sat X)
This data point measures the number of requirements of each category thathave been satisfied.
5.3.3 # requirements partially satisfied (# Part Sat)
This data point measures the number of partially fulfilled requirements.
5.3.4 # unsatisfied requirements (# UnSat)
This data point measures the number of unsatisfied requirements.
27
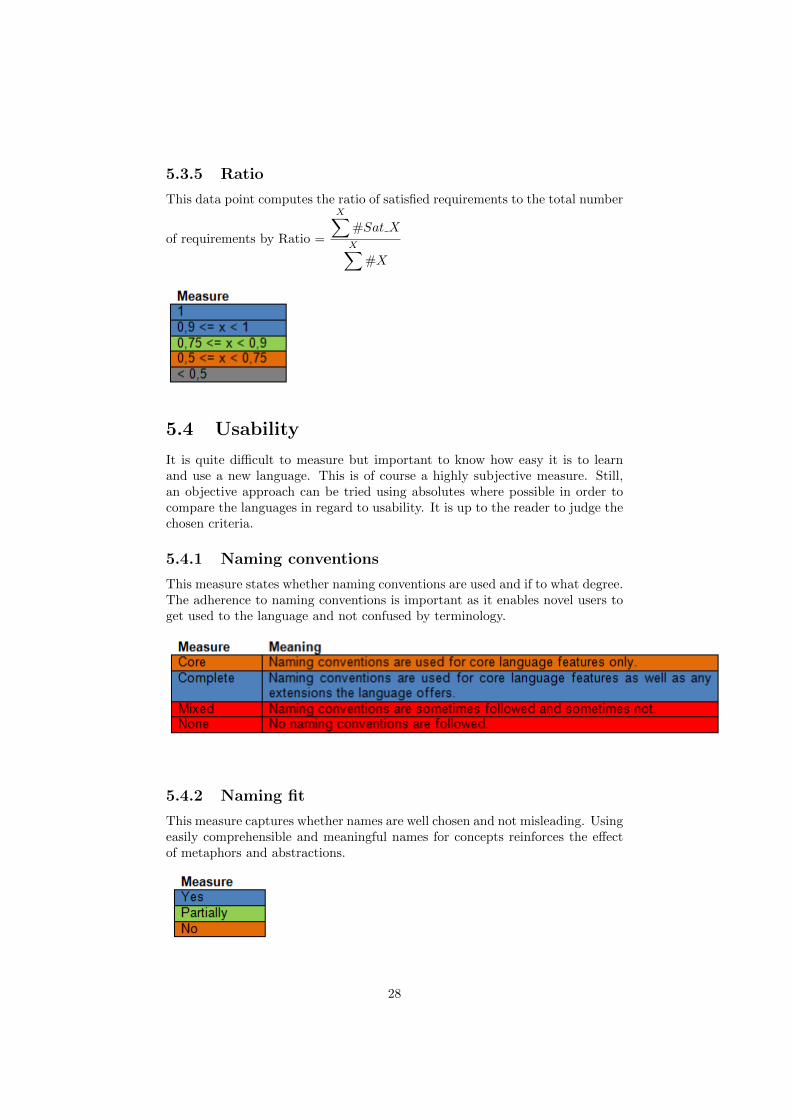
5.3.5 Ratio
This data point computes the ratio of satisfied requirements to the total number
of requirements by Ratio =
X∑#Sat XX∑
#X
5.4 Usability
It is quite difficult to measure but important to know how easy it is to learnand use a new language. This is of course a highly subjective measure. Still,an objective approach can be tried using absolutes where possible in order tocompare the languages in regard to usability. It is up to the reader to judge thechosen criteria.
5.4.1 Naming conventions
This measure states whether naming conventions are used and if to what degree.The adherence to naming conventions is important as it enables novel users toget used to the language and not confused by terminology.
5.4.2 Naming fit
This measure captures whether names are well chosen and not misleading. Usingeasily comprehensible and meaningful names for concepts reinforces the effectof metaphors and abstractions.
28
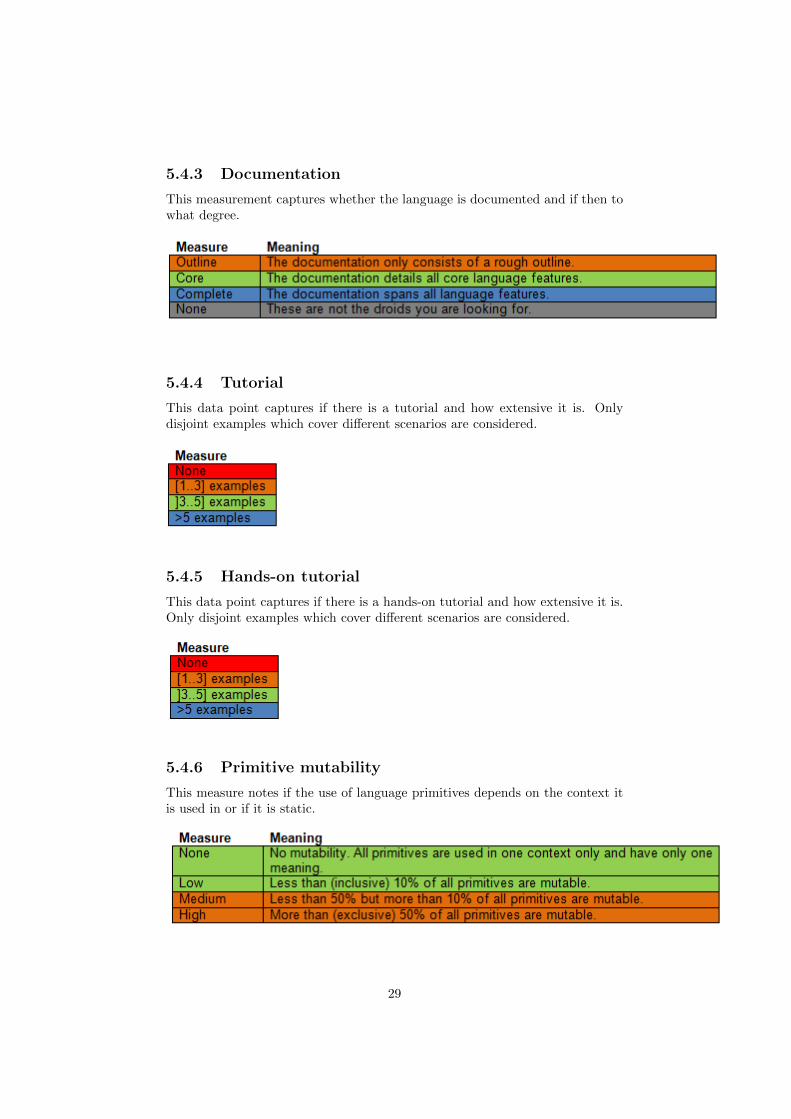
5.4.3 Documentation
This measurement captures whether the language is documented and if then towhat degree.
5.4.4 Tutorial
This data point captures if there is a tutorial and how extensive it is. Onlydisjoint examples which cover different scenarios are considered.
5.4.5 Hands-on tutorial
This data point captures if there is a hands-on tutorial and how extensive it is.Only disjoint examples which cover different scenarios are considered.
5.4.6 Primitive mutability
This measure notes if the use of language primitives depends on the context itis used in or if it is static.
29
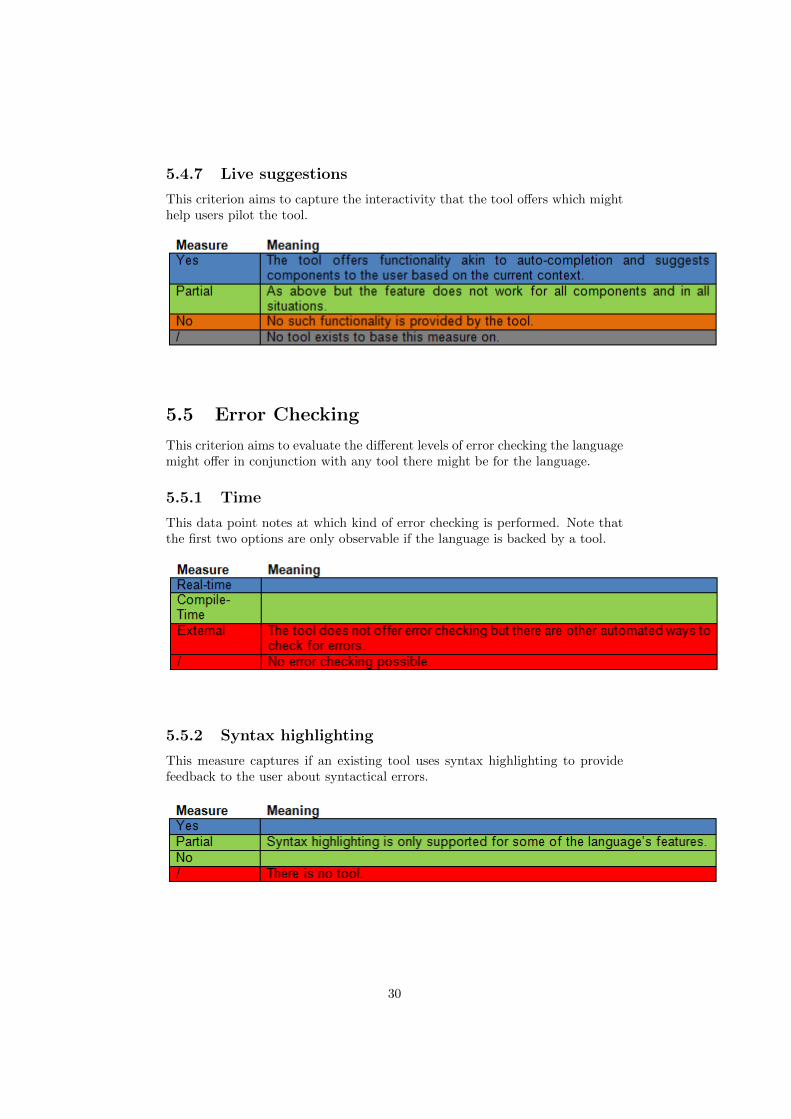
5.4.7 Live suggestions
This criterion aims to capture the interactivity that the tool offers which mighthelp users pilot the tool.
5.5 Error Checking
This criterion aims to evaluate the different levels of error checking the languagemight offer in conjunction with any tool there might be for the language.
5.5.1 Time
This data point notes at which kind of error checking is performed. Note thatthe first two options are only observable if the language is backed by a tool.
5.5.2 Syntax highlighting
This measure captures if an existing tool uses syntax highlighting to providefeedback to the user about syntactical errors.
30
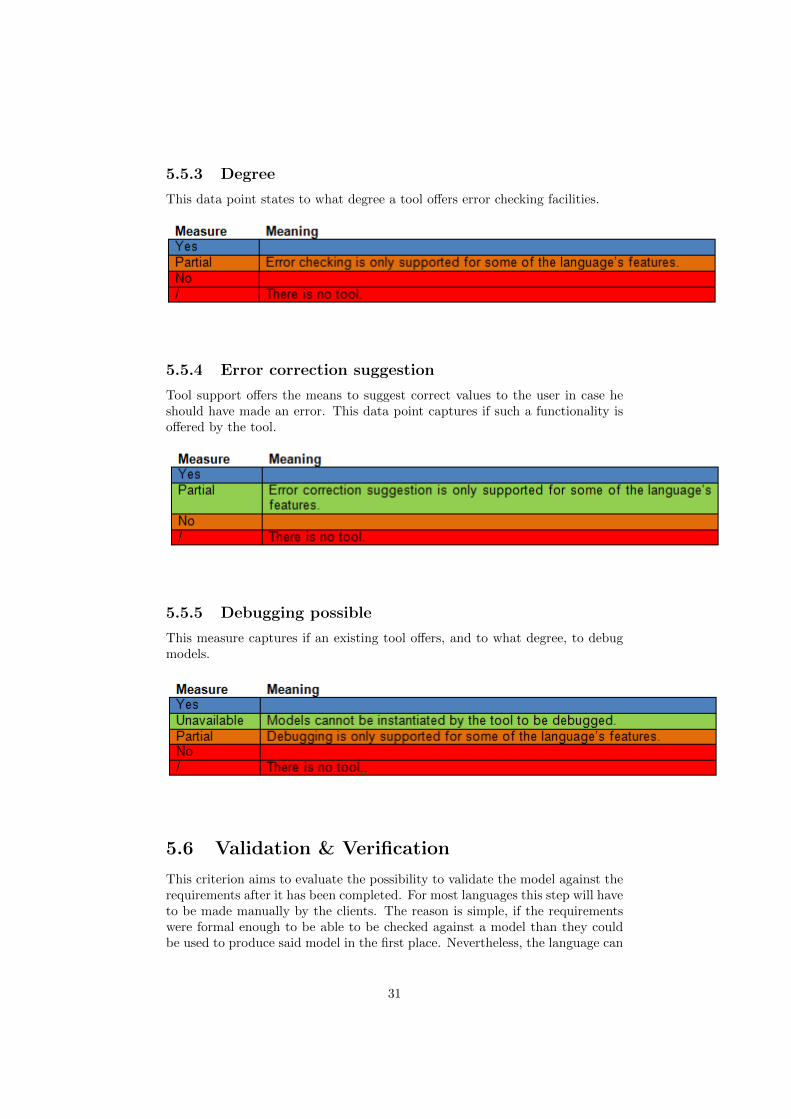
5.5.3 Degree
This data point states to what degree a tool offers error checking facilities.
5.5.4 Error correction suggestion
Tool support offers the means to suggest correct values to the user in case heshould have made an error. This data point captures if such a functionality isoffered by the tool.
5.5.5 Debugging possible
This measure captures if an existing tool offers, and to what degree, to debugmodels.
5.6 Validation & Verification
This criterion aims to evaluate the possibility to validate the model against therequirements after it has been completed. For most languages this step will haveto be made manually by the clients. The reason is simple, if the requirementswere formal enough to be able to be checked against a model than they couldbe used to produce said model in the first place. Nevertheless, the language can
31
offer some tools to statically or dynamically verify the soundness of the model.The basic option would be the verification by a static tool akin to the verificationscheme of an XML document. The next best step would be the real timeerror checking that should guarantee the soundness of the final model. Moreadvanced techniques then allow for instantiation of the model which makes iteasier to visually see quirks and kinks in the model that are not in line withthe requirements. The pinnacle of functionality that can be provided is aninteractive model explorer that does not only generate random model instancesbut allows for the user to explore and build instances as he sees fit.
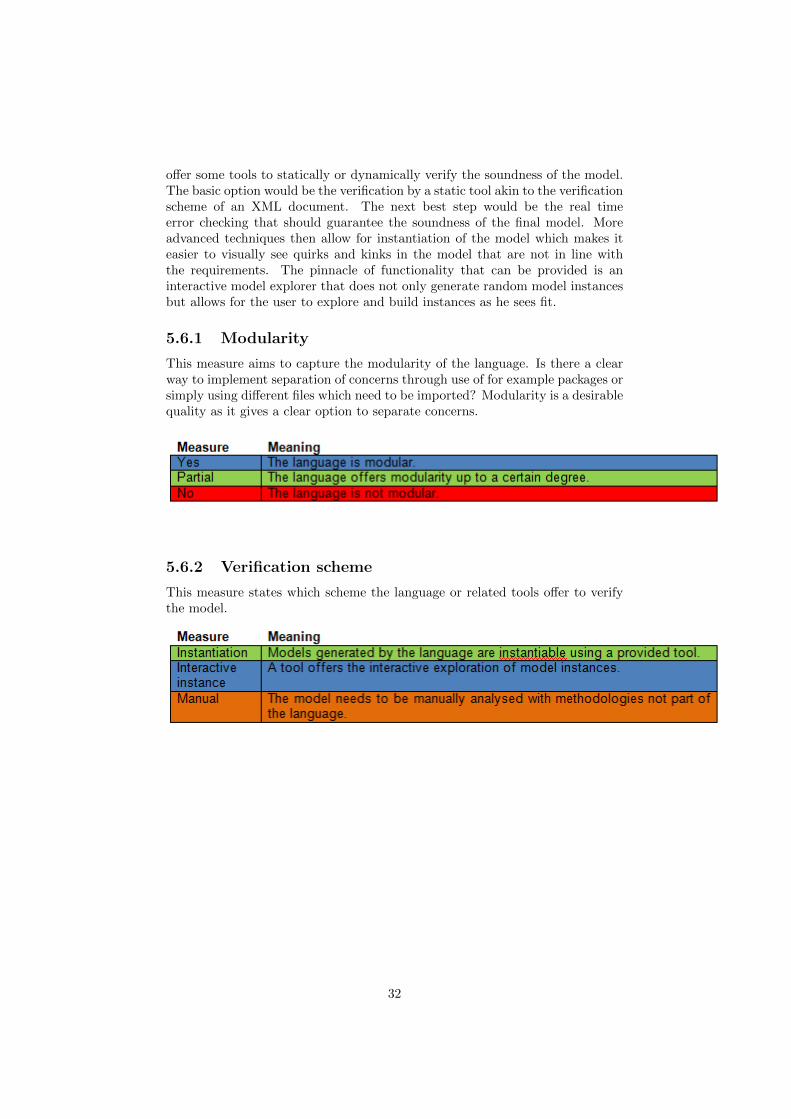
5.6.1 Modularity
This measure aims to capture the modularity of the language. Is there a clearway to implement separation of concerns through use of for example packages orsimply using different files which need to be imported? Modularity is a desirablequality as it gives a clear option to separate concerns.
5.6.2 Verification scheme
This measure states which scheme the language or related tools offer to verifythe model.
32
5.7 Weighting scheme
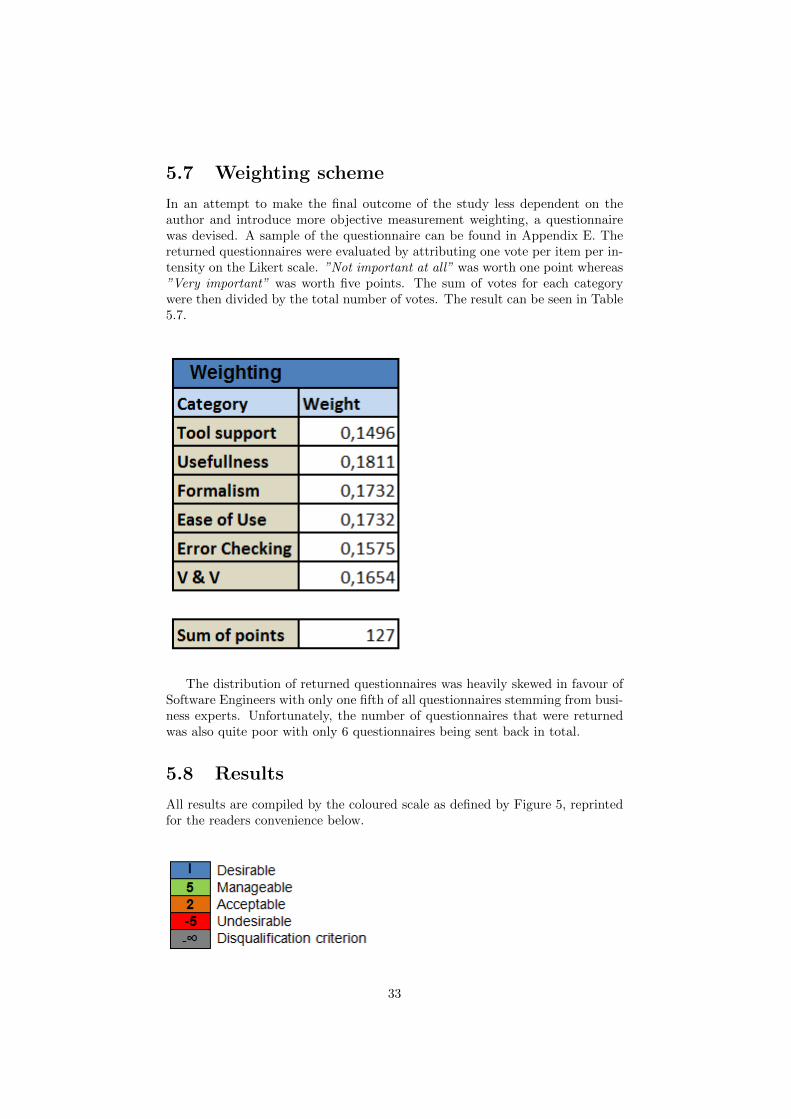
In an attempt to make the final outcome of the study less dependent on theauthor and introduce more objective measurement weighting, a questionnairewas devised. A sample of the questionnaire can be found in Appendix E. Thereturned questionnaires were evaluated by attributing one vote per item per in-tensity on the Likert scale. ”Not important at all” was worth one point whereas”Very important” was worth five points. The sum of votes for each categorywere then divided by the total number of votes. The result can be seen in Table5.7.
The distribution of returned questionnaires was heavily skewed in favour ofSoftware Engineers with only one fifth of all questionnaires stemming from busi-ness experts. Unfortunately, the number of questionnaires that were returnedwas also quite poor with only 6 questionnaires being sent back in total.
5.8 Results
All results are compiled by the coloured scale as defined by Figure 5, reprintedfor the readers convenience below.
33
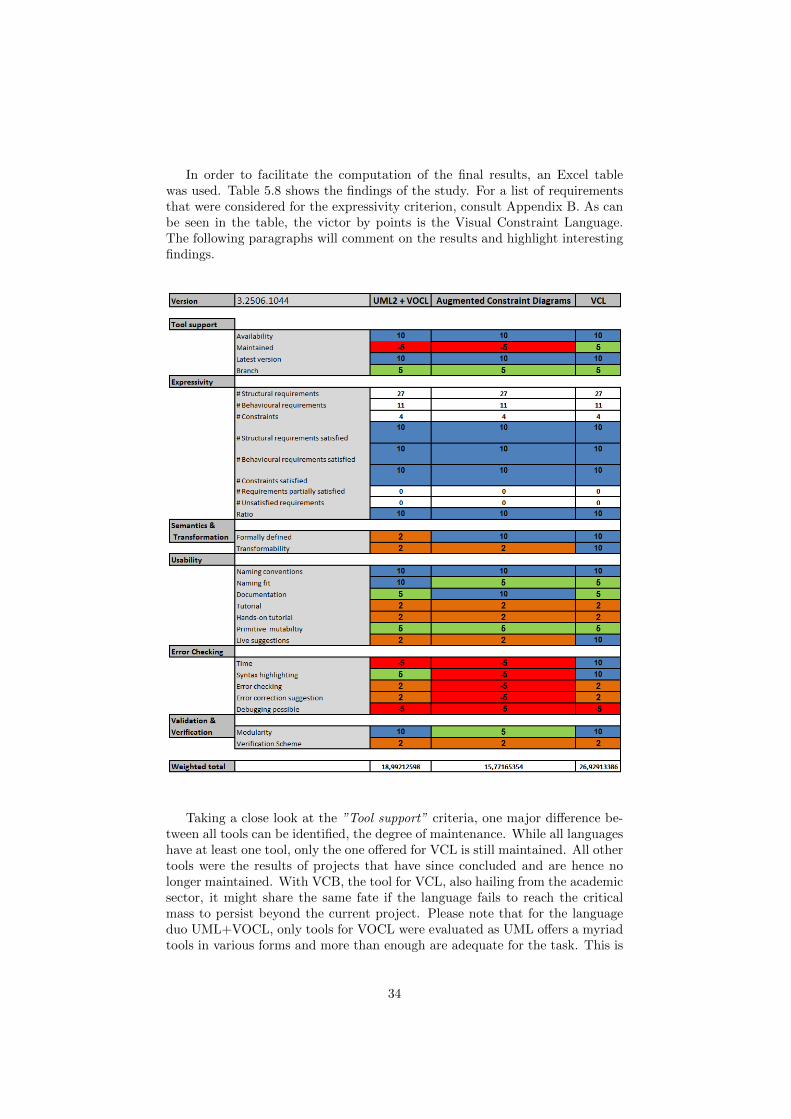
In order to facilitate the computation of the final results, an Excel tablewas used. Table 5.8 shows the findings of the study. For a list of requirementsthat were considered for the expressivity criterion, consult Appendix B. As canbe seen in the table, the victor by points is the Visual Constraint Language.The following paragraphs will comment on the results and highlight interestingfindings.
Taking a close look at the ”Tool support” criteria, one major difference be-tween all tools can be identified, the degree of maintenance. While all languageshave at least one tool, only the one offered for VCL is still maintained. All othertools were the results of projects that have since concluded and are hence nolonger maintained. With VCB, the tool for VCL, also hailing from the academicsector, it might share the same fate if the language fails to reach the criticalmass to persist beyond the current project. Please note that for the languageduo UML+VOCL, only tools for VOCL were evaluated as UML offers a myriadtools in various forms and more than enough are adequate for the task. This is
34
a major benefit if one uses an accepted standard.
The ”Expressivity” criteria offer little room for interpretation. All require-ments that had been dressed have also been satisfied, hence the good ratio. Theauthor would like to not that it was not possible, lacking experts in the field,to verify the models written using VOCL and Constraint Diagrams. The toolsoffering no support in that matter also did not help in avoiding mistakes. Theauthor acknowledges that he has possibly made multiple mistakes but that hewould like to give any language the benefit of the doubt which means allocatingfull points. With the VCB tool offering live error checking, less mistakes haveprobably be made in VCL although a final verification by an expert would stillbe advisable.
”Expressivity” was straight forward to evaluate. With UML under criticismfor not being thoroughly formal [44] it also did not reach the full score for trans-formability. While some diagram types can without much effort be transformed,this cannot be said of all of them. While the core Constraint Diagrams can betranslated into OCL and then further, the augmented version lacks that possi-bility.
While UML is very well documented and offers a huge amount of all kindsof tutorials, VOCL is lacking in those disciplines. While only very few tutorialsexist, the documentation is usable but not complete. The naming conventionsand fit on the other hand leave nothing to be desired. The augmented versionof the Constraint Diagrams are well documented and offer a couple of tutorials.However, the language uses some rather mathematical or domain specific termi-nology which might complicate matters for non-experts in the field. The sameholds true for VCL. While the language is well documented, the VCB could of-fer more stand-alone documentation even though the build-in suggestion systemmakes up it to some degree.
”Error Checking” criteria are highly dependent on the use of an automatedprocess or tool. With the tool for the augmented Constraint Diagrams failingto work properly and the models being drafted by hand, there was no way tohave any error checking facilities. Only very few UML tools offer error checkingand so does the VOCL tool. The conversion to OCL allows for the use of someerror finding methodology and the tool itself restricts the syntactical constructsthat can be visually expressed thereby somehow forcing the user to not makemistakes. VCB offers real rime error checking and details about the nature ofthe error for most of the diagram types. None of the languages or their tools caninstantiate models which would have helped in the validation and verificationprocess.
VOCL benefits from UMLs packaging facilities to separate concerns andexpress models in a modular fashion. VCL also applies a packaging scheme.While it is possible to extend diagrams in the augmented Constraint Diagrams,thereby separating concerns, it seems more cumbersome than the packagingmechanisms offered by the other two languages. Without any possibility toinstantiate the models, all models produced by the languages will have to beverified and validated manually.
35
Chapter 6
Conclusion
After an initial broad selection of all related material, only a good two dozen re-sources were deemed relevant. The dozen resources that remained after furtherselection could be grouped in three camps, one routing for the Visual ObjectConstraint Language (VOCL), one for Constraint Diagrams and one for the Vi-sual Constraint Language (VCL). VOCL required the use of UML, ConstraintDiagrams, not expressive enough on their own, were used in an extended ver-sion. VCL was used as is. After selecting adequate tools for the modellingprocess, the different advantages and disadvantages of the languages and theirtools became clear.
With all tools except for the Visual Constraint Builder, VCL’s tool, be-ing either unusable or not up to speed with that modern tools offer in regardof usability and support, VCL was the clear victor in that regard. UML inconjunction with VOCL proved adequate to model the BPMN2 Stock Manage-ment scenario. The use of VOCL however was rather cumbersome and errorprone. Modelling using the augmented Constraint Diagrams easily and quicklyadvanced which was due to the fact that it was done by hand. Unfortunatelythis also meant no support or error checking. With the language not beingbroadly established and having no expert at hand it has yet to be determined ifthe produced model is correct. With VCL, the modelling process proved to bevery modular with the language separating structure, behaviour and constraintsclearly even from a modelling point of view.
Having gathered all measurements and weighted the scores for each evalua-tion criteria, the augmented Constraint Diagrams took third place mainly dueto the lack of tool support and hence error checking capabilities. The effectson productivity were not measured although the drafting of models by hand onpaper will have its problems in a collaborative industrial or business environ-ment. Second place was claimed by the tandem of UML and VOCL. Wile UMLperformed admirably, there is a reason after all why it is so successful, VOCLproved to be no driving force to propel the team further. The winner is VCL,offering a well defined language that could offer a better naming scheme butoffers not much else to criticise. The VCB tool did help enormously in cement-ing VCL’s gold medal but without continued support for the tool the edge thatVCL currently holds over the other languages might quickly become dull.
36
6.1 Future work
The next steps of the thesis involve a refinement of the scenario in, hopefully,close collaboration with business actors. Then the modelling process in VCLwill produce models of the BPMN2 specification and the TUI framework. Afterthese have been completed they will be intertwined such that a model of themodelling process of the BPMN2 scenario using TUI can be generated.
6.2 Long time goals
In the long run it is thought to use a visual modelling language to express allmodels needed for further modelling processes using TUI. For example, a modelof the human biology could be drafted on the table using VCL and then usedto instantiate different models illustrating concepts directly on the table. Thatway, the modelling process could completely take place in the collaborative TUIenvironment without the need to first plug in external models which would notbe guaranteed to be compatible as is. Also, extensions and modifications wouldbe easy to realise. These goals are a vision of what could be, well outside thescope of the author’s Master’s Thesis.
37
Bibliography
[1] Eva Hornecker and Jacob Buur. Getting a grip on tangible interaction:a framework on physical space and social interaction. In Proceedings ofthe SIGCHI conference on Human Factors in computing systems, CHI ’06,pages 437–446, New York, NY, USA, 2006. ACM.
[2] D. Spinellis. UML Everywhere. Software, IEEE, 27(5):90 –91, sept.-oct.2010.
[3] Object Management Group. Object Management Group Business ProcessModel and Notation, Version 2.0. Technical report, Object ManagementGroup.
[4] John Hunt. Agile methods and the agile manifesto. In Agile SoftwareConstruction, pages 9–30. Springer London, 2006. 10.1007/1-84628-262-4 2.
[5] F Boers. Metaphor awareness and vocabulary retention. Applied linguistics,21(4):553–571, December 2000.
[6] Sharon Alayne Widmayer. Schema theory: An introduction. RetrievedApril, 2005.
[7] Google. Google Scholar, 2012.
[8] Consortium Luxembourg. Findit.lu, 2012.
[9] Google. Google Luxembourg, 2012.
[10] XJ Technologies Company. Simulation Software Tool - AnyLogic, 2012.
[11] Inc. Ventana Systems. Vensim, 2012.
[12] Nicolas Genon, Daniel Amyot, and P. Heymans. Analysing the CognitiveEffectiveness of the UCM Visual Notation. System Analysis and Modeling:About Models, 6598/2011:221–240, 2011.
[13] D Varro. Towards Symbolic Analysis of Visual Modeling Languages. Elec-tronic Notes in Theoretical Computer Science, 72(3):51–64, February 2003.
[14] Andrew Fish, Jean Flower, and John Howse. The semantics of augmentedconstraint diagrams. Journal of Visual Languages & Computing, 16(6):541–573, December 2005.
[15] Object Management Group. Object Management Group - UML.
38
[16] Joseph Yossi Gil, John Howse, and Stuart Kent. Constraint Diagrams :A Step Beyond UML. In Technology of Object-Oriented Languages andSystems (TOOLS USA’99), Santa Barbara, California , USA, 1999.
[17] Robert Muetzelfeldt and Jon Massheder. The Simile visual modelling envi-ronment. European Journal of Agronomy, 18(3-4):345–358, January 2003.
[18] S. Sadi and P. Maes. subTextile: Reduced event-oriented programmingsystem for sensate actuated materials. IEEE Symposium on Visual Lan-guages and Human-Centric Computing (VL/HCC 2007), pages 171–174,September 2007.
[19] James Lin, Michael Thomsen, and J.A. Landay. A visual language forsketching large and complex interactive designs. In Proceedings of theSIGCHI conference on Human factors in computing systems: Changingour world, changing ourselves, number 4, pages 307–314, New York, NewYork, USA, 2002. ACM.
[20] A. Schurr, A Winter, and A. Zundorf. Visual programming with graphrewriting systems. In Visual Languages, Proceedings., 11th IEEE Interna-tional Symposium on, pages 326–333, Darmstadt , Germany, 1995. IEEE.
[21] L. Spratt and A. Ambler. A visual logic programming language basedon sets and partitioning constraints. In 993 IEEE Symposium on VisualLanguages, pages 204–208. IEEE Comput. Soc. Press, 1993.
[22] Margaret Burnett, John Atwood, R. Walpole Djang, J. Reichwein, H. Got-tfried, and S. Yang. Forms/3: A first-order visual language to explore theboundaries of the spreadsheet paradigm. Journal of functional program-ming, 11(2):155–206, 2001.
[23] D. Lucanin and Ivan Fabek. A visual programming language for draw-ing and executing flowcharts. In MIPRO, 2011 Proceedings of the 34thInternational Convention, pages 1679–1684. IEEE, 2011.
[24] Jonathan Sprinkle and Gabor Karsai.
[25] KD Swenson. A visual language to describe collaborative work. In VisualLanguages, 1993., Proceedings 1993 IEEE Symposium on, pages 298–303,Bergen, 1993. IEEE.
[26] Roswitha Bardohl, Hartmut Ehrig, J. De Lara, and G. Taentzer. Integrat-ing meta-modelling aspects with graph transformation for efficient visuallanguage definition and model manipulation. Fundamental Approaches toSoftware Engineering, pages 214–228, 2004.
[27] I. Burnett, M.J. Baker, C. Bohus, P. Carlson, S. Yang, and P. Van Zee.Scaling Up Visual Programming Languages. Computer, 28(3):45–54, March1995.
[28] Akos Schmidt and D. Varro. CheckVML: A tool for model checking visualmodeling languages. UML 2003 - The Unified Modeling Language. ModelingLanguages and Applications, 2863:92–95, 2003.
39
[29] Sara Brockmans, Raphael Volz, and Andreas Eberhart. Visual modeling ofOWL DL ontologies using UML. In The Semantic WebISWC 2004, pages198–213. Springer, 2004.
[30] Terry Halpin. Object-role modeling: an overview. In Inhttp://www.orm.net/pdf/ORMwhitePaper.pdf, 1998.
[31] Emmanuel Chailloux and Philippe Codognet. Toward visual constraint pro-gramming. Visual Languages, 1997. Proceedings. 1997 IEEE Symposiumon, pages 420–421, 1997.
[32] Object Management Group. Object Constraint Language, 2006.
[33] Visual OCL.
[34] C. Kiesner, G. Taentzer, and J. Winkelmann. Visual OCL: A Visual Nota-tion of the Object Constraint Language. Technical Report 2002/23, Tech-nical University of Berlin, 2002.
[35] Paolo Bottoni, Manuel Koch, Francesco Parisi-presicce, and GabrieleTaentzer.
[36] M. Lohmann, S. Sauer, and G. Engels. Executable Visual Contracts. In2005 IEEE Symposium on Visual Languages and Human-Centric Comput-ing (VL/HCC’05), pages 63–70. IEEE, 2005.
[37] Nuno Amalio and Pierre Kelsen. VCL, a visual language for modellingsoftware systems formally. Computer, pages 282–284, August 2010.
[38] N. Amalio and Pierre Kelsen. Modular design by contract visually andformally using VCL. In Visual Languages and Human-Centric Computing(VL/HCC), 2010 IEEE Symposium on, pages 227–234. IEEE, September2010.
[39] Nuno Amaio, Pierre Kelsen, Qin Ma, and Christian Glodt. Using VCL asan aspect-oriented approach to requirements modelling. Transactions onAspect-Oriented Software Development, 7:151–199, 2010.
[40] Nuno Amalio, Christian Glodt, and Pierre Kelsen. Building VCL Mod-els and Automatically Generating Z Specifications from Them. FM 2011:Formal Methods, 6664:149–153, 2011.
[41] Stuart Kent. Constraint diagrams: visualizing invariants in object-orientedmodels. In OOPSLA ’97 Proceedings of the 12th ACM SIGPLAN con-ference on Object-oriented programming, systems, languages, and applica-tions, volume 32. ACM, 1997.
[42] John Howse, Steve Schuman, Gem Stapleton, and Ian Oliver. Diagram-matic Formal Specification of a Configuration Control Platform. ElectronicNotes in Theoretical Computer Science, 259:87–104, December 2009.
[43] G. Stapleton. A Decidable Constraint Diagram Reasoning System. Journalof Logic and Computation, 15(6):975–1008, December 2005.
[44] D. Milicev. On the Semantics of Associations and Association Ends inUML. Software Engineering, IEEE Transactions on, 33(4):238 –251, april2007.
40
Glossary
Application Context, App Context This is the context of the applicationgiving a specific semantics to each tool or function used. It is makes useof the underlying widget actions of level 2.
Binding, Strong binding Instantiation (M0) of specific Widget (M1) on aphysical handle. We can now use the widget in the application context.This is done by the binding effect. Not to be confused with selection.
Canvas View Point, View port It is the view port (zoom, orientation. size)on the infinite canvas as displayed by the application. Comparable to zoneson the Canvas layer.
Canvas, Canvas layer Application Context layer on which the applicationdraws on.
Component A non-connector model entity. Usually a box or circle shaperepresenting a concept rather than a relation.
Connector A non-component model entity usually in the shape of an arrowtipped line that links components and creates logical relations.
Fixed Control Points, FCP Virtual handles appearing next to bindable en-tities on the surface. E.g. Circle which can be linked to a puck by placingit inside. They are located on the Tangible layer and are implicitly there(e.g. displayed upon proximity detection).
Focus area Same as Focus line but as a real area.
Focus horizon Same as Focus point but as a line.
Focus point Single point or small area (area only big enough to accommodatea widget, still treated as a point) on which a single widget focuses (e.g.during zoom action)
Handle, Physical entity Physical counterpart of the VOb, often the physicalpart(s) of a widget.
Interaction A specific way of influencing a control limited by some constraintsdue to its specific purpose. See TAC for constraint description. E.g.moving a puck around or activating a button.
41
Level 1 Actions Simple atomic actions.
Level 2 Actions Real usable actions by the user having a tangible semantics.
Manipulation Superset of Interaction but the way of influencing the token orcontainer (data) dictates the purpose. E.g. Flipping a box upside downto empty the linked virtual container.
Model entity They are VObs that are used as primitives in the applicationcontext. All entities available from the application toolbox.
Reality Domain encompassing both the virtual/intangible and the physical/tangibledomain.
Selection, weak binding, multiple binding For an already bound widgetmultiple selections are possible, those selections are weakly linked to thewidget itself. Done by the selection effect.
Surface The conceivable work surface of the table. Root zone, divided intodifferent layers
Tangible layer The layer on which widget virtual structures are drawn on aswell as specific zones. Visually independent of the underlying applicationContext layer though zones usually represent tangible areas for applicationinteraction.
The actor Person standing at the surface, actively manipulating widgets toachieve a goal.
Tool box A zone whose sub-areas represent different tools which can be boundand used within the application context.
Virtual object, VOb Any virtual object representing a virtual entity, e.g.control, data, tool. Each VOb can be bound by a widget via a zone onthe tangible layer.
Widget Behaviour Information describing the manipulation possibilities aswell as the pre- and post-state of an action.
Widget Semantics Part of the semantics is expressed via effect. But theapplication context is also providing part of the meaning as an applicationspecific function/intention.
Widget Structure Information about the appearance and what visual, hap-tic, audible input and feedback is required to achieve full functionality.
Widget Syntax The set of syntactically valid widget models. Both correctlyassembled and mapped to actions.
Zones Planar sub-divisions of the tangible layer representing special zones ofinterest such as Fixed Control Points. Zones enable the widget to trans-parently switch between expected behaviour (program functions) dictatedby the App context.
42
Appendix A
List of literature resources
• Amlio, N., & Kelsen, P. (2010). Modular design by contract visuallyand formally using VCL. Visual Languages and Human-Centric Com-puting (VL/HCC), 2010 IEEE Symposium on (pp. 227234). IEEE.doi:10.1109/VLHCC.2010.39
• Amlio, N., Glodt, C., & Kelsen, P. (2011). Building VCL Models andAutomatically Generating Z Specifications from Them. (M. Butler & W.Schulte, Eds.)FM 2011: Formal Methods, 6664, 149-153. Springer BerlinHeidelberg. doi:10.1007/978-3-642-21437-0
• Amio, N., Kelsen, P., Ma, Q., & Glodt, C. (2010). Using VCL as an as-pectoriented approach to requirements modelling. Transactions on AspectOriented Software Development, 7, 151-199. doi:10.1007/978-3-642-16086-8 5
• Bardohl, R., Ehrig, H., De Lara, J., & Taentzer, G. (2004). Integratingmeta-modelling aspects with graph transformation for efficient visual lan-guage definition and model manipulation. Fundamental Approaches toSoftware Engineering, 214228. Springer.
• Bottoni, P., Koch, M., Parisi-presicce, F., & Taentzer, G. (2001). AVisualization of OCL using Collaborations. (M. Gogolla & C. Kobryn,Eds.)UML 2001 - The Unified Modeling Language. Modeling Languages,Concepts, and Tools, 2185, 257-271. Berlin, Heidelberg: Springer BerlinHeidelberg. doi:10.1007/3-540-45441-1
• Brockmans, S., Volz, R., & Eberhart, A. (2004). Visual modeling of OWLDL ontologies using UML. The Semantic WebISWC 2004 (pp. 198213).Springer.
• Burnett, I., Baker, M. J., Bohus, C., Carlson, P., Yang, S., & Van Zee,P. (1995). Scaling Up Visual Programming Languages. Computer, 28(3),45-54. doi:10.1109/2.366157
• Burnett, M., Atwood, J., Walpole Djang, R., Reichwein, J., Gottfried, H.,& Yang, S. (2001). Forms/3: A first-order visual language to explore theboundaries of the spreadsheet paradigm. Journal of functional program-ming, 11(2), 155206. Cambridge University Press.
43
• Chailloux, E., & Codognet, P. (1997). Toward visual constraint program-ming. Visual Languages, 1997. Proceedings. 1997 IEEE Symposium on,420-421.
• Genon, N., Amyot, D., & Heymans, P. (2011). Analysing the Cogni-tive Effectiveness of the UCM Visual Notation. System Analysis andModeling: About Models, 6598/2011, 221240. Springer. Retrieved fromhttp://www.springerlink.com/index/G7746GM683W97620.pdf
• Gil, J. Y., Howse, J., & Kent, S. (1999). Constraint Diagrams : AStep Beyond UML. Technology of Object-Oriented Languages and Sys-tems (TOOLS USA99). Santa Barbara, California , USA. Retrieved fromhttp://kar.kent.ac.uk/id/eprint/21740
• Halpin, T. (1998). Object-Role Modeling: an overview.
• Howse, J., Schuman, S., Stapleton, G., & Oliver, I. (2009). Diagram-matic Formal Specification of a Configuration Control Platform. Elec-tronic Notes in Theoretical Computer Science, 259, 87-104. doi:10.1016-/j.entcs.2009.12.019
• Kent, S. (1997). Constraint diagrams: visualizing invariants in object-oriented models. OOPSLA 97 Proceedings of the 12th ACM SIGPLANconference on Object-oriented programming, systems, languages, and ap-plications (Vol. 32). ACM.
• Lin, J., Thomsen, M., & Landay, J. A. (2002). A visual language forsketching large and complex interactive designs. Proceedings of the SIGCHIconference on Human factors in computing systems: Changing our world,changing ourselves (pp. 307314). New York, New York, USA: ACM.doi:10.1145/503429.503431
• Lohmann, M., Sauer, S., & Engels, G. (2005). Executable Visual Con-tracts. 2005 IEEE Symposium on Visual Languages and Human-CentricComputing (VL/HCC05) (pp. 63-70). IEEE. doi:10.1109/VLH-CC.2005.35
• Lucanin, D., & Fabek, I. (2011). A visual programming language fordrawing and executing flowcharts. MIPRO, 2011 Proceedings of the 34thInternational Convention (pp. 16791684). IEEE.
• Muetzelfeldt, R., & Massheder, J. (2003). The Simile visual modellingenvironment. European Journal of Agronomy, 18(3-4), 345-358.doi:10.1016/S1161-0301(02)00112-0
• Group, O. M. (2006). Object Constraint Language - OMG AvailableSpecification - Version 2. OMG.
• Sadi, S., & Maes, P. (2007). subTextile: Reduced event-oriented pro-gramming system for sensate actuated materials. IEEE Symposium onVisual Languages and Human-Centric Computing (VL/HCC 2007), 171-174. Ieee. doi:10.1109/VLHCC.2007.37
• Schmidt, A., & Varr, D. (2003). CheckVML: A tool for model checkingvisual modeling languages. UML 2003 - The Unified Modeling Language.Modeling Languages and Applications, 2863, 9295. Springer.
44
• Schurr, A., Winter, A., & Zundorf, A. (1995). Visual programming withgraph rewriting systems. Visual Languages, Proceedings., 11th IEEE In-ternational Symposium on (pp. 326333). Darmstadt , Germany: IEEE.
• Spratt, L., & Ambler, A. (1993). A visual logic programming languagebased on sets and partitioning constraints. 993 IEEE Symposium on Vi-sual Languages (pp. 204-208). IEEE Comput. Soc. Press.doi:10.1109/VL.1993.269597
• Sprinkle, J., & Karsai, G. (2004). A domain-specific visual language fordomain model evolution. Journal of Visual Languages & Computing, 15(3-4), 291-307. doi:10.1016/j.jvlc.2004.01.006
• Stapleton, G. (2005). A Decidable Constraint Diagram Reasoning System.Journal of Logic and Computation, 15(6), 975-1008. doi:10.1093/logcom/exi041
• Swenson, K. (1993). A visual language to describe collaborative work.Visual Languages, 1993., Proceedings 1993 IEEE Symposium on (pp. 298-303). Bergen: IEEE.
• Varro, D. (2003). Towards Symbolic Analysis of Visual Modeling Lan-guages. Electronic Notes in Theoretical Computer Science, 72(3), 51-64.doi:10.1016/S1571-0661(04)80611-X
• Visual Contract Language.Retrieved March 7, 2012, from http://vcl.gforge.uni.lu/
• Visual OCL.Retrieved March 6, 2012, from http://tfs.cs.tu-berlin.de/vocl/
• VENSIMRetrieved March 5, 2012, from http://www.vensim.com/
• AnyLogicRetrieved March 5, 2012, from http://www.xjtek.com/
45
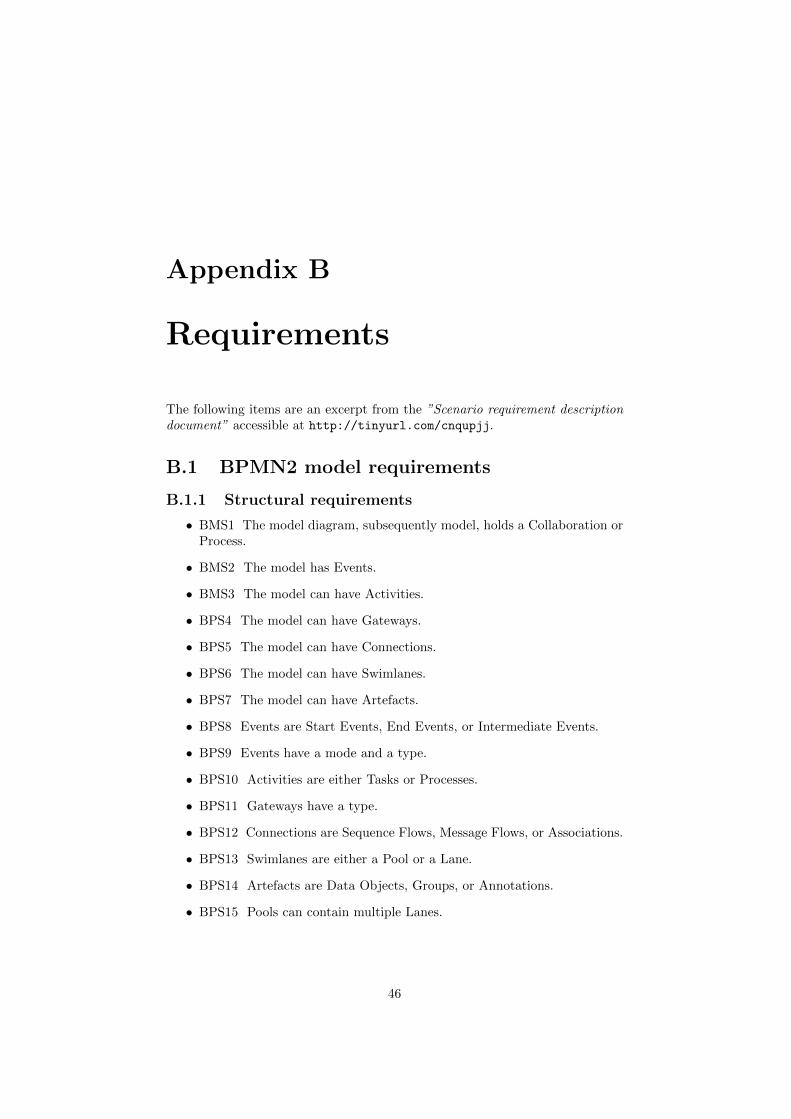
Appendix B
Requirements
The following items are an excerpt from the ”Scenario requirement descriptiondocument” accessible at http://tinyurl.com/cnqupjj.
B.1 BPMN2 model requirements
B.1.1 Structural requirements
• BMS1 The model diagram, subsequently model, holds a Collaboration orProcess.
• BMS2 The model has Events.
• BMS3 The model can have Activities.
• BPS4 The model can have Gateways.
• BPS5 The model can have Connections.
• BPS6 The model can have Swimlanes.
• BPS7 The model can have Artefacts.
• BPS8 Events are Start Events, End Events, or Intermediate Events.
• BPS9 Events have a mode and a type.
• BPS10 Activities are either Tasks or Processes.
• BPS11 Gateways have a type.
• BPS12 Connections are Sequence Flows, Message Flows, or Associations.
• BPS13 Swimlanes are either a Pool or a Lane.
• BPS14 Artefacts are Data Objects, Groups, or Annotations.
• BPS15 Pools can contain multiple Lanes.
46
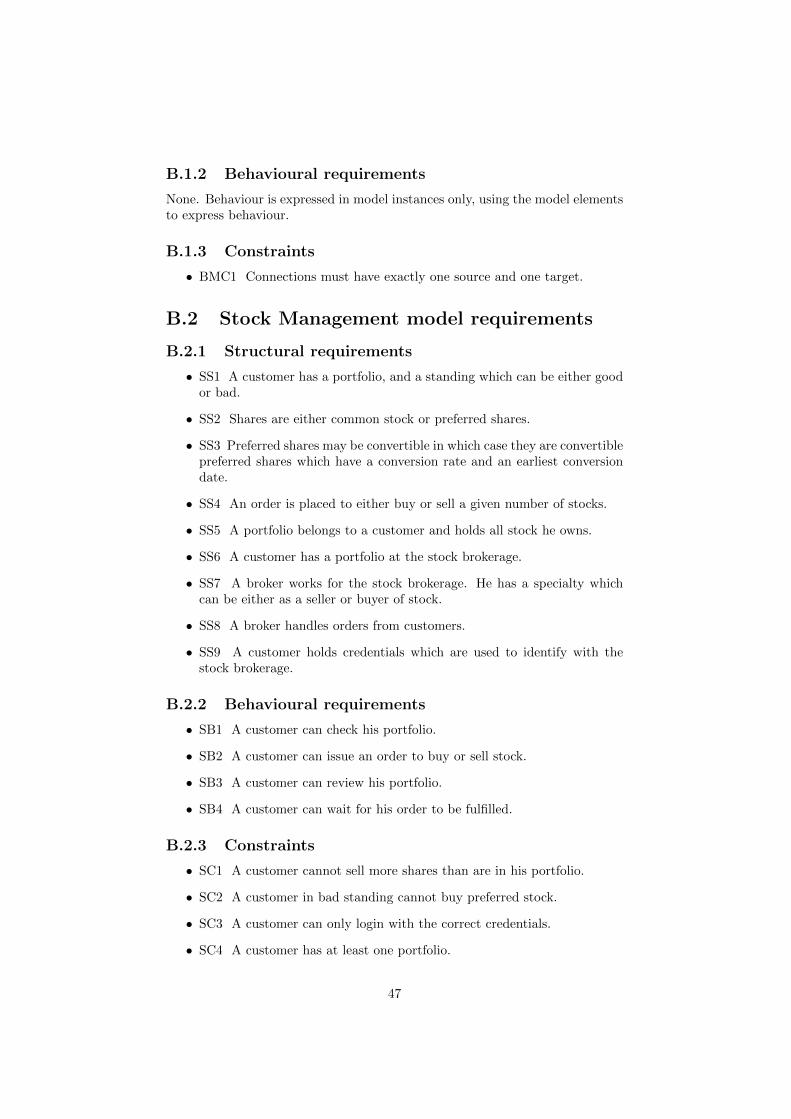
B.1.2 Behavioural requirements
None. Behaviour is expressed in model instances only, using the model elementsto express behaviour.
B.1.3 Constraints
• BMC1 Connections must have exactly one source and one target.
B.2 Stock Management model requirements
B.2.1 Structural requirements
• SS1 A customer has a portfolio, and a standing which can be either goodor bad.
• SS2 Shares are either common stock or preferred shares.
• SS3 Preferred shares may be convertible in which case they are convertiblepreferred shares which have a conversion rate and an earliest conversiondate.
• SS4 An order is placed to either buy or sell a given number of stocks.
• SS5 A portfolio belongs to a customer and holds all stock he owns.
• SS6 A customer has a portfolio at the stock brokerage.
• SS7 A broker works for the stock brokerage. He has a specialty whichcan be either as a seller or buyer of stock.
• SS8 A broker handles orders from customers.
• SS9 A customer holds credentials which are used to identify with thestock brokerage.
B.2.2 Behavioural requirements
• SB1 A customer can check his portfolio.
• SB2 A customer can issue an order to buy or sell stock.
• SB3 A customer can review his portfolio.
• SB4 A customer can wait for his order to be fulfilled.
B.2.3 Constraints
• SC1 A customer cannot sell more shares than are in his portfolio.
• SC2 A customer in bad standing cannot buy preferred stock.
• SC3 A customer can only login with the correct credentials.
• SC4 A customer has at least one portfolio.
47
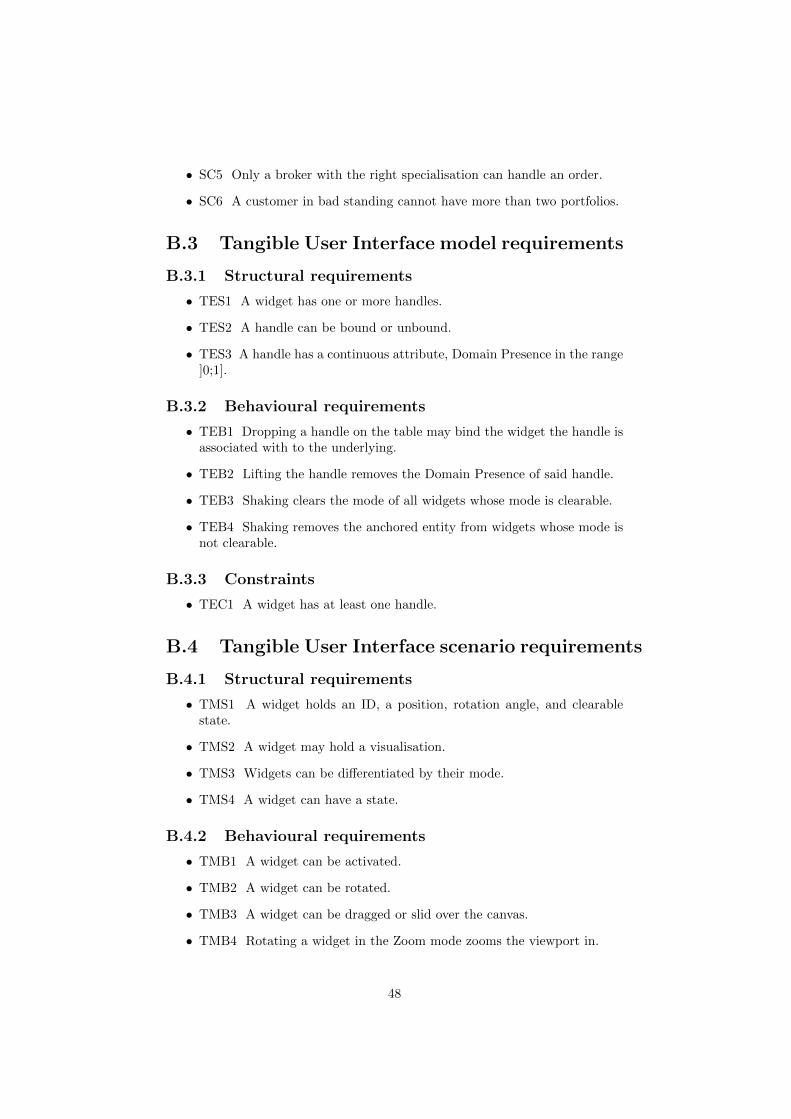
• SC5 Only a broker with the right specialisation can handle an order.
• SC6 A customer in bad standing cannot have more than two portfolios.
B.3 Tangible User Interface model requirements
B.3.1 Structural requirements
• TES1 A widget has one or more handles.
• TES2 A handle can be bound or unbound.
• TES3 A handle has a continuous attribute, Domain Presence in the range]0;1].
B.3.2 Behavioural requirements
• TEB1 Dropping a handle on the table may bind the widget the handle isassociated with to the underlying.
• TEB2 Lifting the handle removes the Domain Presence of said handle.
• TEB3 Shaking clears the mode of all widgets whose mode is clearable.
• TEB4 Shaking removes the anchored entity from widgets whose mode isnot clearable.
B.3.3 Constraints
• TEC1 A widget has at least one handle.
B.4 Tangible User Interface scenario requirements
B.4.1 Structural requirements
• TMS1 A widget holds an ID, a position, rotation angle, and clearablestate.
• TMS2 A widget may hold a visualisation.
• TMS3 Widgets can be differentiated by their mode.
• TMS4 A widget can have a state.
B.4.2 Behavioural requirements
• TMB1 A widget can be activated.
• TMB2 A widget can be rotated.
• TMB3 A widget can be dragged or slid over the canvas.
• TMB4 Rotating a widget in the Zoom mode zooms the viewport in.
48
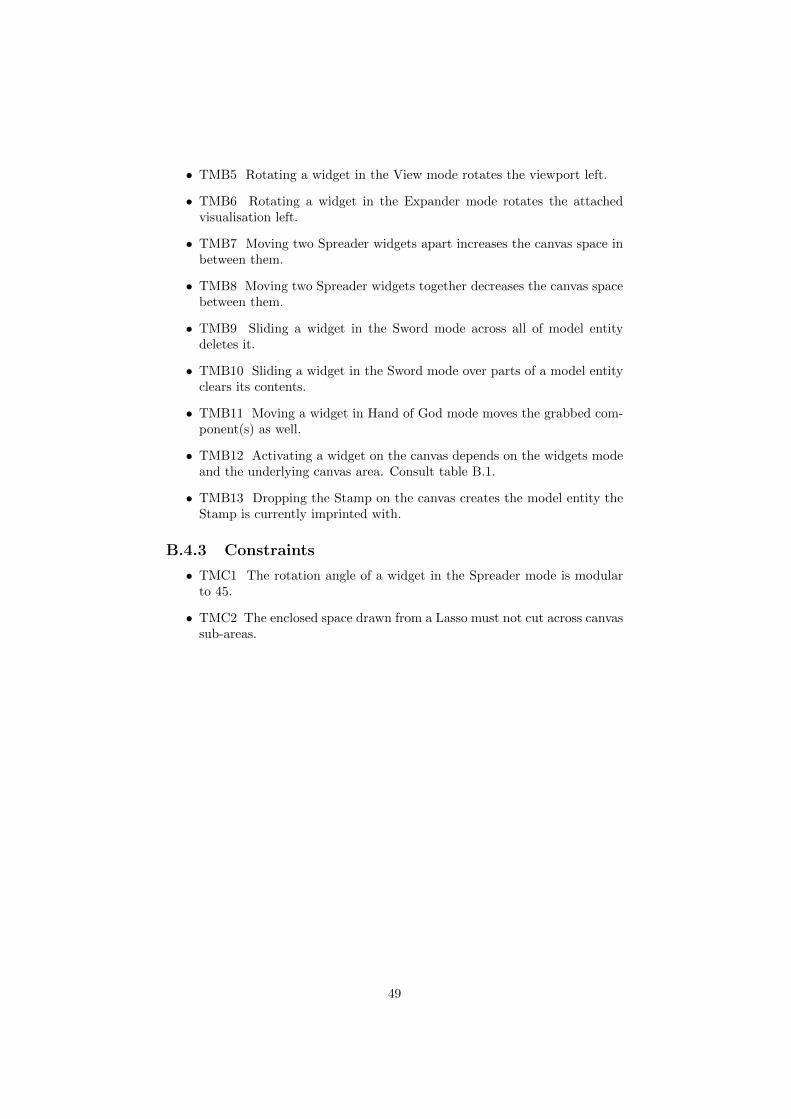
• TMB5 Rotating a widget in the View mode rotates the viewport left.
• TMB6 Rotating a widget in the Expander mode rotates the attachedvisualisation left.
• TMB7 Moving two Spreader widgets apart increases the canvas space inbetween them.
• TMB8 Moving two Spreader widgets together decreases the canvas spacebetween them.
• TMB9 Sliding a widget in the Sword mode across all of model entitydeletes it.
• TMB10 Sliding a widget in the Sword mode over parts of a model entityclears its contents.
• TMB11 Moving a widget in Hand of God mode moves the grabbed com-ponent(s) as well.
• TMB12 Activating a widget on the canvas depends on the widgets modeand the underlying canvas area. Consult table B.1.
• TMB13 Dropping the Stamp on the canvas creates the model entity theStamp is currently imprinted with.
B.4.3 Constraints
• TMC1 The rotation angle of a widget in the Spreader mode is modularto 45.
• TMC2 The enclosed space drawn from a Lasso must not cut across canvassub-areas.
49
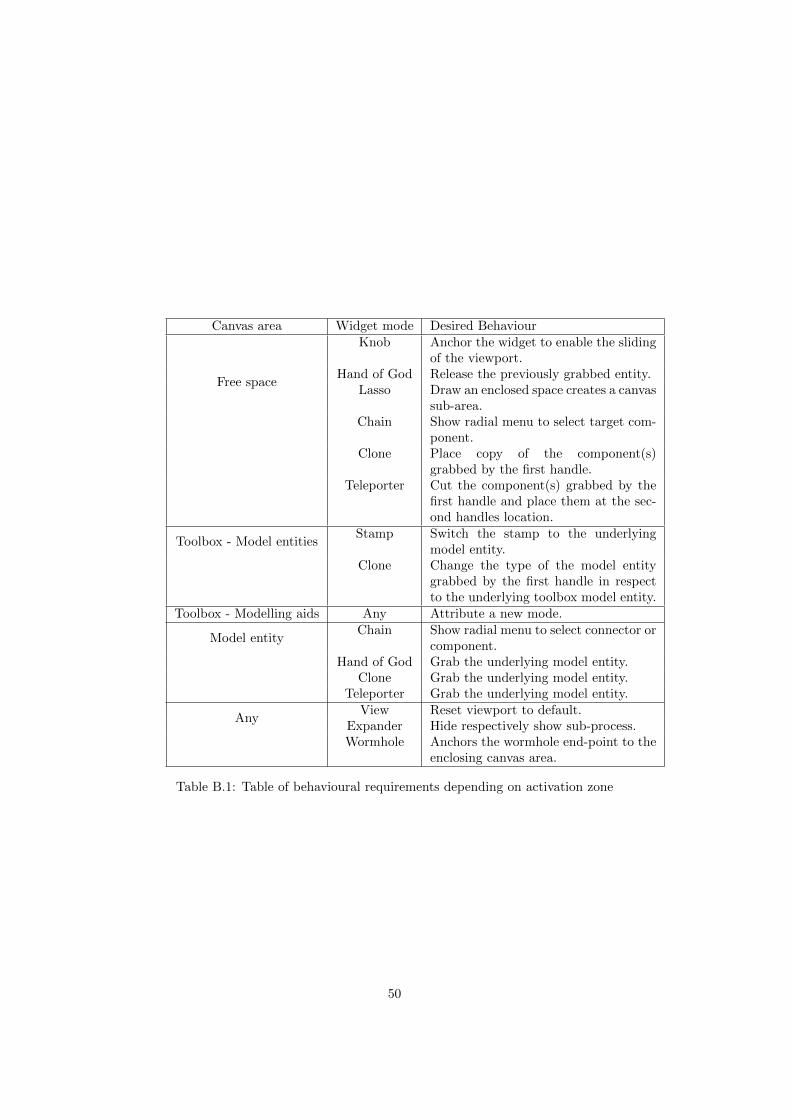
Canvas area Widget mode Desired Behaviour
Free space
Knob Anchor the widget to enable the slidingof the viewport.
Hand of God Release the previously grabbed entity.Lasso Draw an enclosed space creates a canvas
sub-area.Chain Show radial menu to select target com-
ponent.Clone Place copy of the component(s)
grabbed by the first handle.Teleporter Cut the component(s) grabbed by the
first handle and place them at the sec-ond handles location.
Toolbox - Model entitiesStamp Switch the stamp to the underlying
model entity.Clone Change the type of the model entity
grabbed by the first handle in respectto the underlying toolbox model entity.
Toolbox - Modelling aids Any Attribute a new mode.
Model entityChain Show radial menu to select connector or
component.Hand of God Grab the underlying model entity.
Clone Grab the underlying model entity.Teleporter Grab the underlying model entity.
AnyView Reset viewport to default.
Expander Hide respectively show sub-process.Wormhole Anchors the wormhole end-point to the
enclosing canvas area.
Table B.1: Table of behavioural requirements depending on activation zone
50
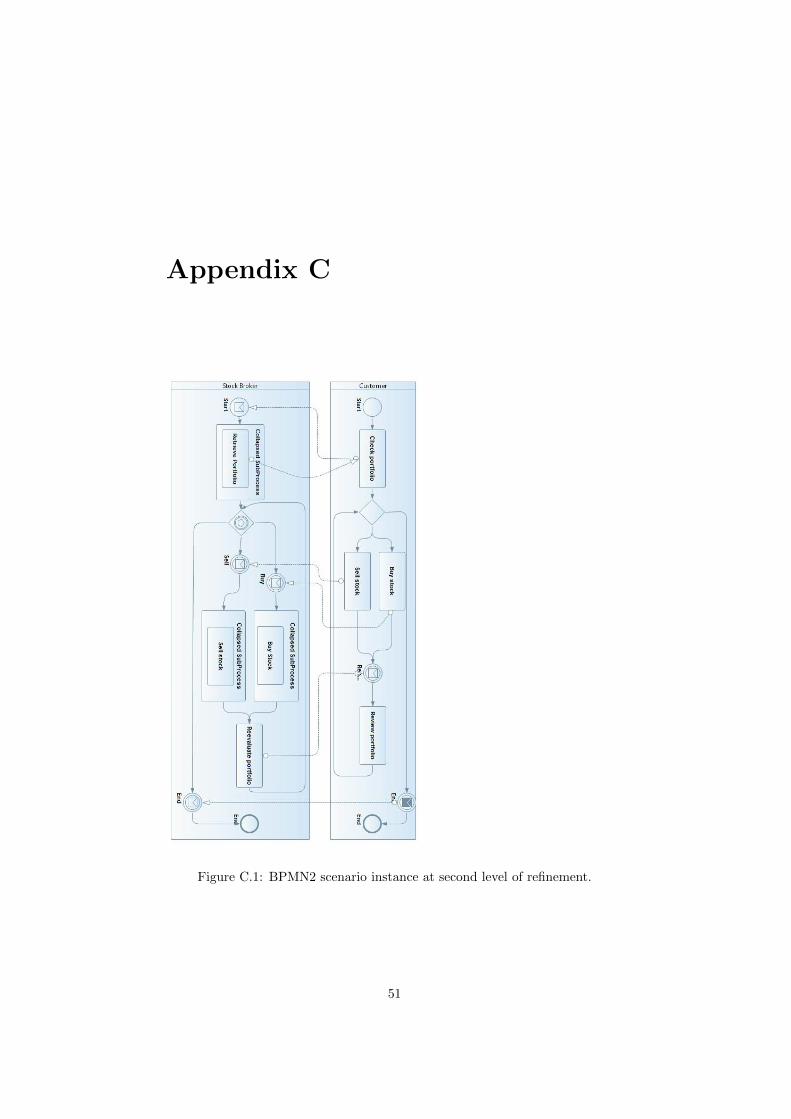
Appendix C
Figure C.1: BPMN2 scenario instance at second level of refinement.
51
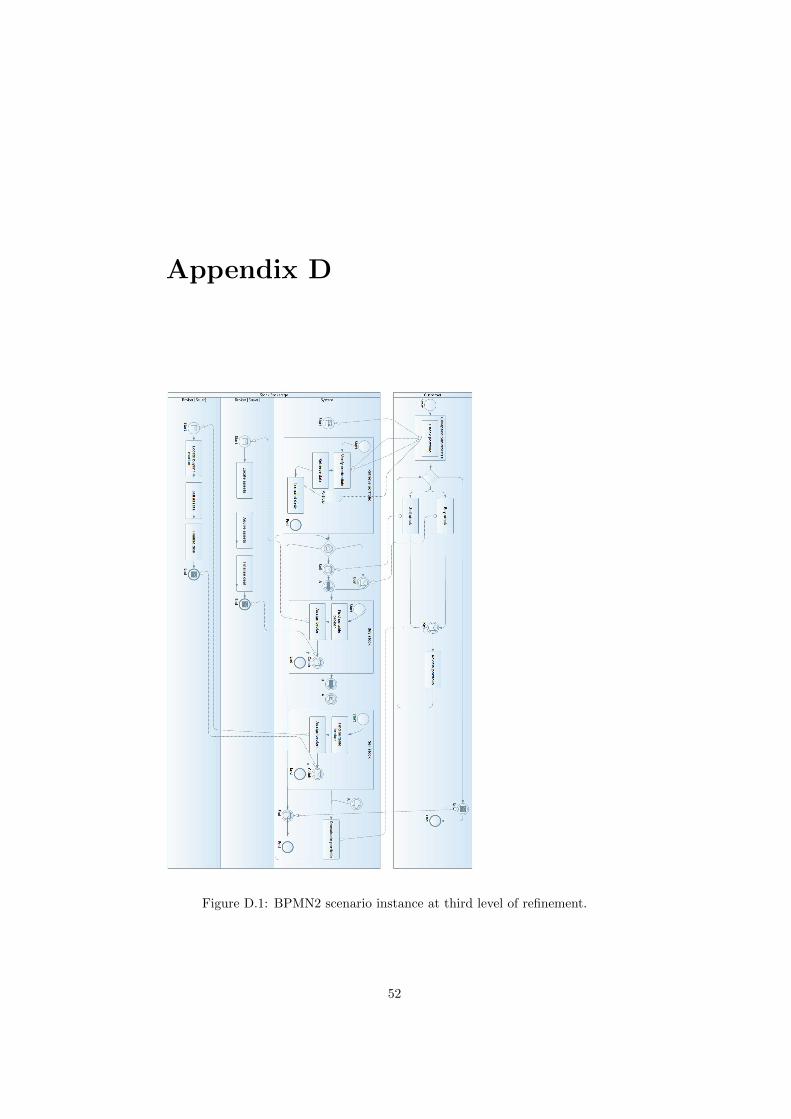
Appendix D
Figure D.1: BPMN2 scenario instance at third level of refinement.
52
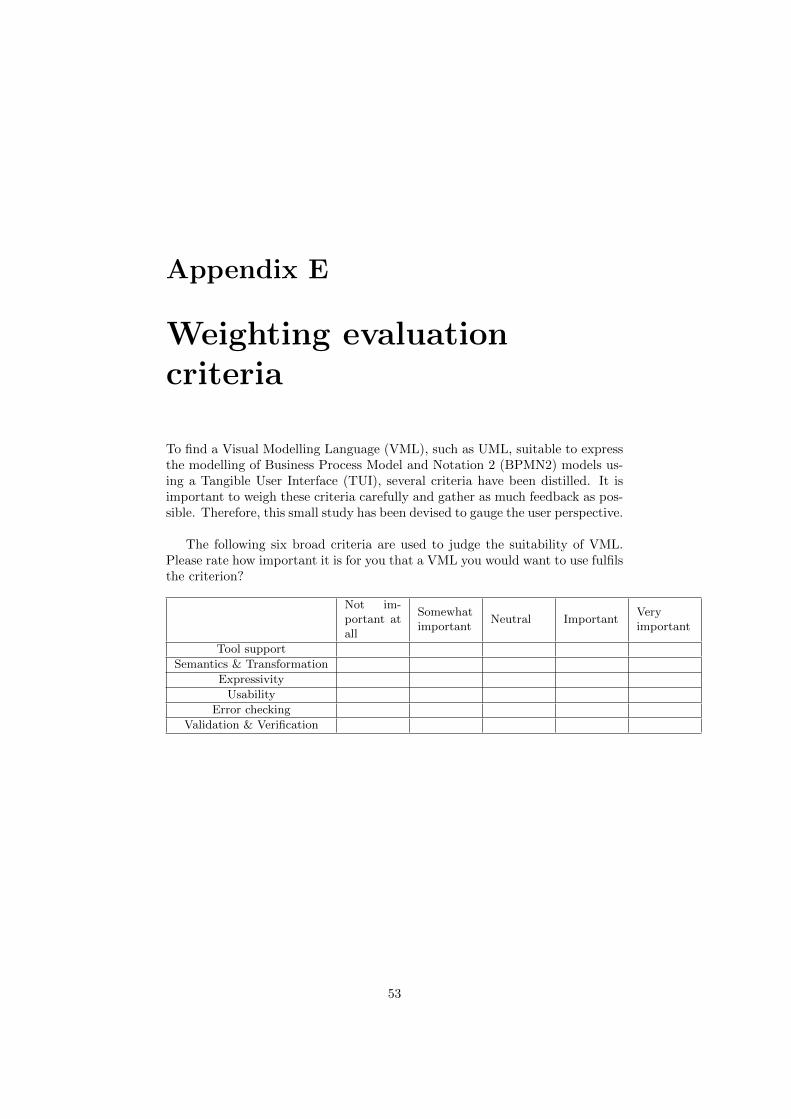
Appendix E
Weighting evaluationcriteria
To find a Visual Modelling Language (VML), such as UML, suitable to expressthe modelling of Business Process Model and Notation 2 (BPMN2) models us-ing a Tangible User Interface (TUI), several criteria have been distilled. It isimportant to weigh these criteria carefully and gather as much feedback as pos-sible. Therefore, this small study has been devised to gauge the user perspective.
The following six broad criteria are used to judge the suitability of VML.Please rate how important it is for you that a VML you would want to use fulfilsthe criterion?
Not im-portant atall
Somewhatimportant
Neutral ImportantVeryimportant
Tool support
Semantics & Transformation
Expressivity
Usability
Error checking
Validation & Verification
53