Embed Size (px)
Citation preview

Voltage Regulator Test Standard
Test Platform for Voltage Regulator and LDO Testing
Documentation
Version 1.0d, December, 2010
© 2010 Picotest Corp.
All Rights Reserved.

Trademarks The Picotest logo and “Picotest Injectors” are trademarks of Picotest Corp. All other brand and product names mentioned herein are used for identification purposes only and are registered trademarks, trademarks, or service marks of their respective holders. Copyright notice Except as permitted under the United States Copyright Act of 1976, no part of this publication may be reproduced or distributed in any form or by any means, or stored in a data base or retrieval system, without the prior written permission of Picotest Corp. Contact information Corporate offices 1-877 914-PICO Technical support e-mail [email protected]
World Wide Web http://www.picotest.com
Table of Contents Chapter 1 - Overview ...................................................................................................... 5
Welcome ........................................................................................................................................ 5 What’s Included ............................................................................................................................ 6
Parts List – Digi-Key PN .................................................................................................................................. 6 Documentation and Support ...................................................................................................... 8 Warranty ........................................................................................................................................ 8 Test Standard Kit Capabilities .................................................................................................... 9
Special Analyzer Support ................................................................................................................................... 9 Demo Board Layout .................................................................................................................. 10
Chapter 2 – Making Measurements ............................................................................. 11
Connection Legend .................................................................................................................... 11 Stability (Bode Plot) Measurements ........................................................................................ 12
Equipment List ................................................................................................................................................. 12 Connectivity Diagram ...................................................................................................................................... 12 Calibrating the setup ......................................................................................................................................... 13 Making the Measurement ................................................................................................................................ 14 Why is this important ....................................................................................................................................... 14 Tips ..................................................................................................................................................................... 15 Recommendations ............................................................................................................................................ 15
Transient Step Load Measurements ........................................................................................ 18 Equipment List ................................................................................................................................................. 18 Connectivity Diagram ...................................................................................................................................... 18 Equipment Setup .............................................................................................................................................. 19 Why is this important ....................................................................................................................................... 21 Tips ..................................................................................................................................................................... 21
PSRR Measurements ................................................................................................................. 22 Equipment List ................................................................................................................................................. 22 Connectivity Diagram ...................................................................................................................................... 23 Making the measurement ................................................................................................................................ 23 Why is this important ....................................................................................................................................... 24 Tips ..................................................................................................................................................................... 24 Other Recommendations ................................................................................................................................ 25
Output Impedance ..................................................................................................................... 26 Equipment List ................................................................................................................................................. 26 Connectivity Diagram ...................................................................................................................................... 26 Making Measurements ..................................................................................................................................... 27 Why is this important ....................................................................................................................................... 27 Recommendations ............................................................................................................................................ 27
Reverse Transfer ........................................................................................................................ 29 Equipment List ................................................................................................................................................. 29 Connectivity Diagram ...................................................................................................................................... 29 Why is this important ....................................................................................................................................... 30 Tips ..................................................................................................................................................................... 30
Crosstalk ...................................................................................................................................... 31
Equipment List ................................................................................................................................................. 31 Connectivity Diagram ...................................................................................................................................... 31 Data to Record .................................................................................................................................................. 32 Why is this important ....................................................................................................................................... 32
Input Impedance ........................................................................................................................ 33 Equipment List ................................................................................................................................................. 33 Connectivity Diagram ...................................................................................................................................... 33 Data to Record .................................................................................................................................................. 34 Why is this important ....................................................................................................................................... 34 Tips ..................................................................................................................................................................... 34
Component Impedance ............................................................................................................. 35 Equipment List ................................................................................................................................................. 35 Connectivity Diagram ...................................................................................................................................... 35 Data to Record .................................................................................................................................................. 35 Why is this important ....................................................................................................................................... 36 Tips ..................................................................................................................................................................... 36
Chapter 3 - References ................................................................................................. 37
General ........................................................................................................................................ 37
Making Measurements 5
Chapter 1 - Overview
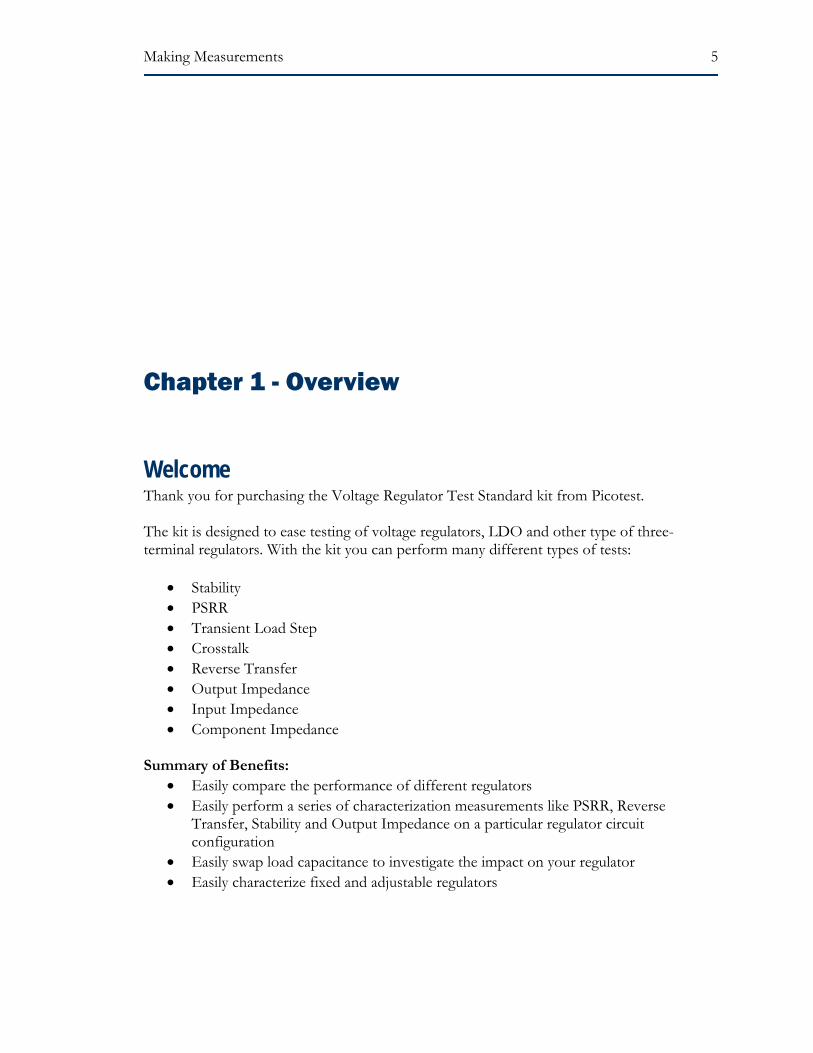
Welcome Thank you for purchasing the Voltage Regulator Test Standard kit from Picotest. The kit is designed to ease testing of voltage regulators, LDO and other type of three-terminal regulators. With the kit you can perform many different types of tests:
• Stability • PSRR • Transient Load Step • Crosstalk • Reverse Transfer • Output Impedance • Input Impedance • Component Impedance
Summary of Benefits:
• Easily compare the performance of different regulators • Easily perform a series of characterization measurements like PSRR, Reverse
Transfer, Stability and Output Impedance on a particular regulator circuit configuration
• Easily swap load capacitance to investigate the impact on your regulator • Easily characterize fixed and adjustable regulators
Making Measurements 6
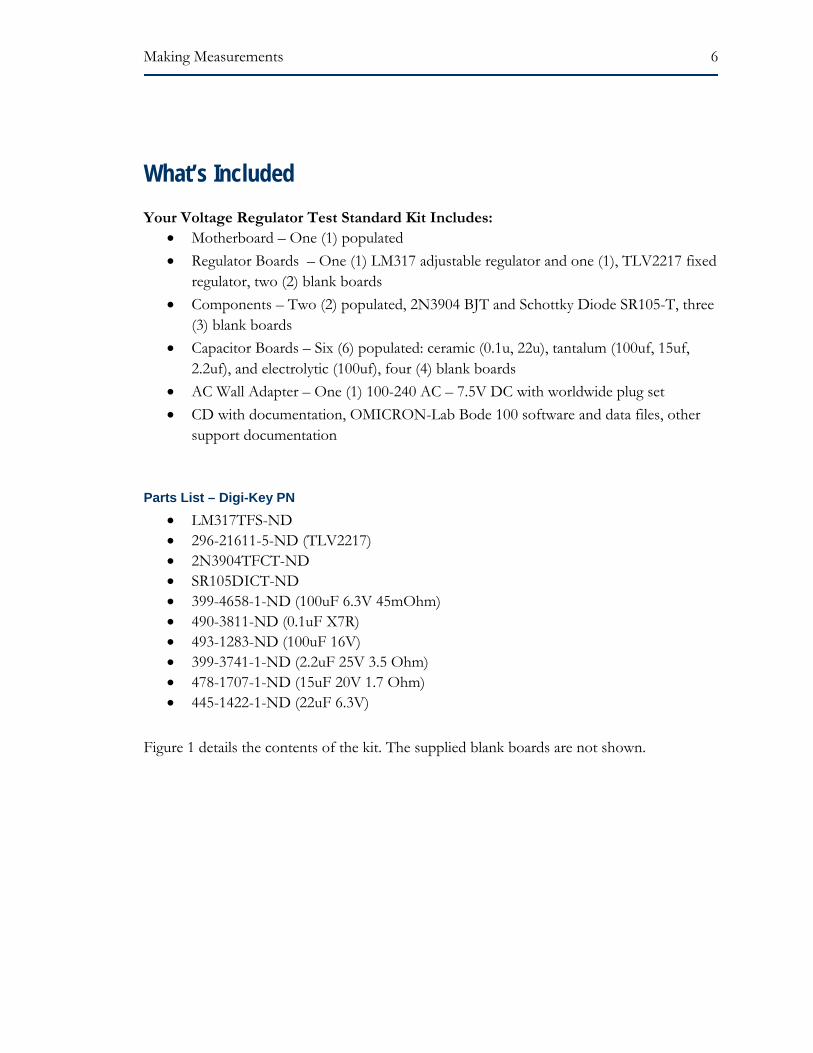
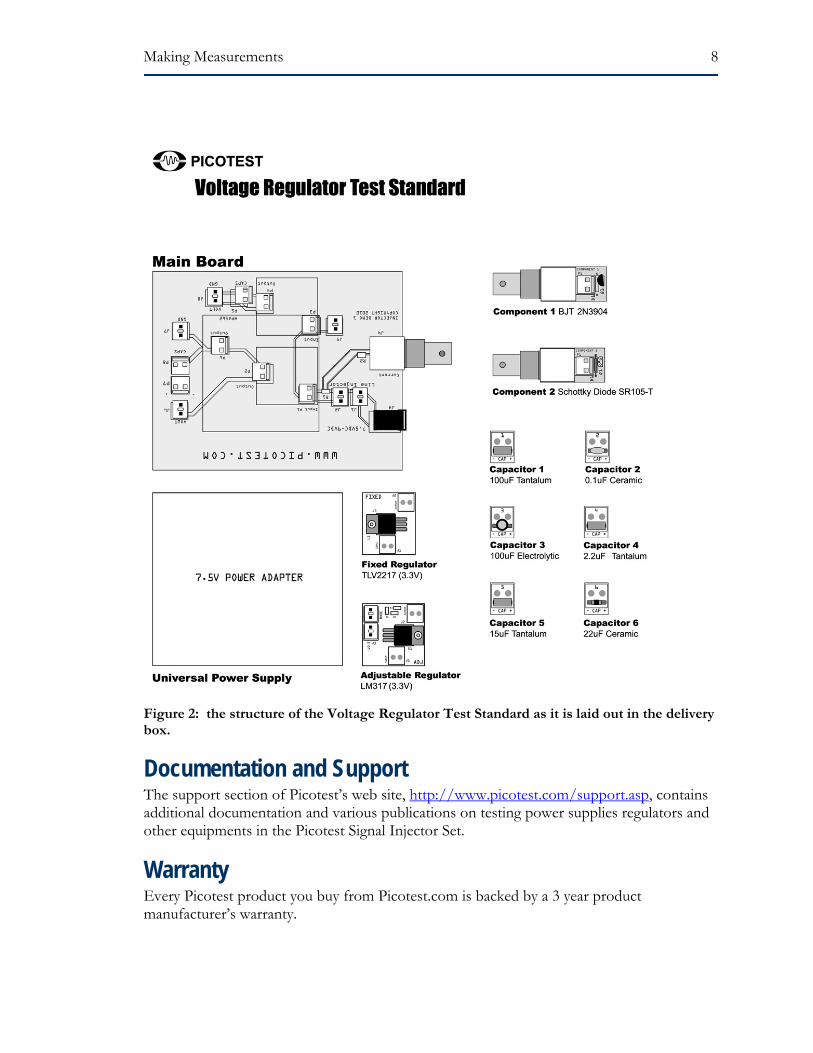
What’s Included Your Voltage Regulator Test Standard Kit Includes:
• Motherboard – One (1) populated • Regulator Boards – One (1) LM317 adjustable regulator and one (1), TLV2217 fixed
regulator, two (2) blank boards • Components – Two (2) populated, 2N3904 BJT and Schottky Diode SR105-T, three
(3) blank boards • Capacitor Boards – Six (6) populated: ceramic (0.1u, 22u), tantalum (100uf, 15uf,
2.2uf), and electrolytic (100uf), four (4) blank boards • AC Wall Adapter – One (1) 100-240 AC – 7.5V DC with worldwide plug set • CD with documentation, OMICRON-Lab Bode 100 software and data files, other
support documentation
Parts List – Digi-Key PN • LM317TFS-ND • 296-21611-5-ND (TLV2217) • 2N3904TFCT-ND • SR105DICT-ND • 399-4658-1-ND (100uF 6.3V 45mOhm) • 490-3811-ND (0.1uF X7R) • 493-1283-ND (100uF 16V) • 399-3741-1-ND (2.2uF 25V 3.5 Ohm) • 478-1707-1-ND (15uF 20V 1.7 Ohm) • 445-1422-1-ND (22uF 6.3V)
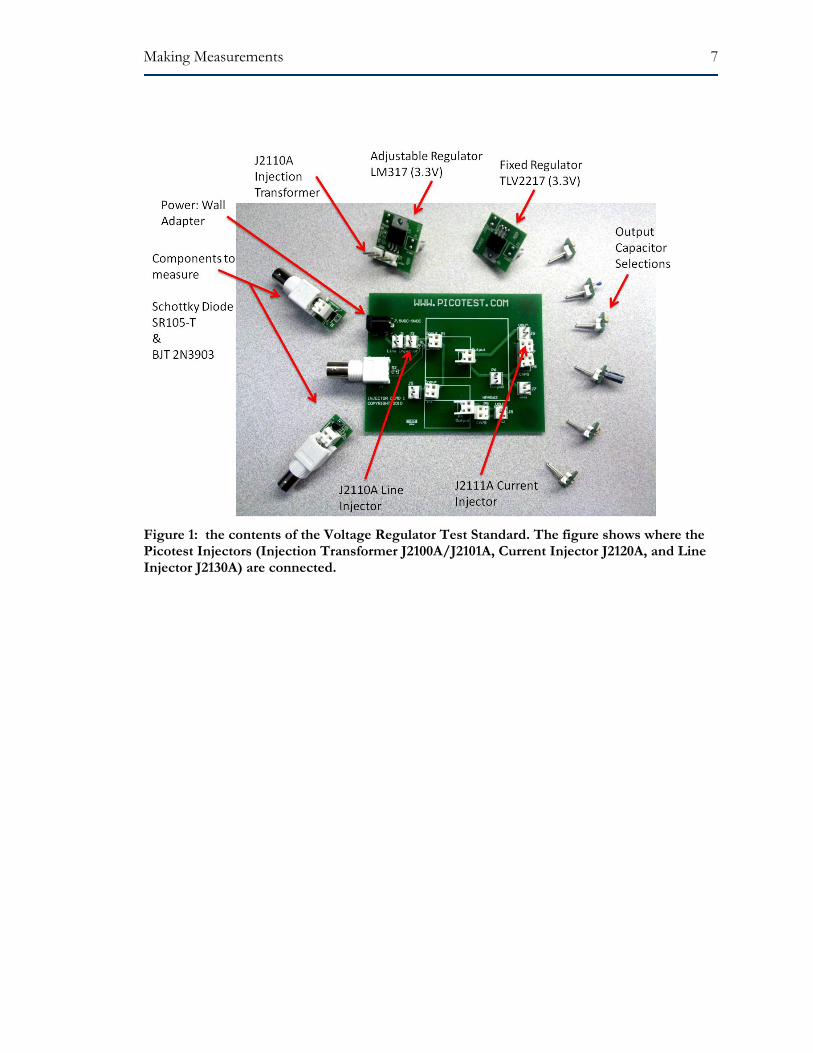
Figure 1 details the contents of the kit. The supplied blank boards are not shown.
Making Measurements 7
Figure 1: the contents of the Voltage Regulator Test Standard. The figure shows where the Picotest Injectors (Injection Transformer J2100A/J2101A, Current Injector J2120A, and Line Injector J2130A) are connected.
Making Measurements 8
Figure 2: the structure of the Voltage Regulator Test Standard as it is laid out in the delivery box.
Documentation and Support The support section of Picotest’s web site, http://www.picotest.com/support.asp, contains additional documentation and various publications on testing power supplies regulators and other equipments in the Picotest Signal Injector Set.
Warranty Every Picotest product you buy from Picotest.com is backed by a 3 year product manufacturer’s warranty.
Making Measurements 9
Test Standard Kit Capabilities The Voltage Regulator Test Standard kit is designed to assist you in testing all types of voltage regulators and LDOs, individually or as part of a distributed power system. This manual presents the material in a tutorial format so that you can perform each test yourself, using the connection diagrams provided. Bench test results are also provided so you can compare your measured results. The tests outlined require the following additional equipment
Stability, PSRR, Input / Output Impedance, reverse transfer: Test Network Analyzer - Agilent (3577A), OMICRON-Lab (Bode 100), Core Technologies, Venable, Ridley or similar network analyzer with the appropriate bandwidth range. Step Load Test Arbitrary Waveform generator or function generator with controllable rise and fall times - Picotest G5100A or similar Transient Step Load Test Oscilloscope – Agilent DSO or similar
Equipment Note: the Picotest Signal Injectors may be used with just about any suitable network analyzer, arbitrary function generator, and oscilloscope.
Special Analyzer Support The CD in you kit includes the network analyzer measurement files for each measurement. The files are compatible with the OMICRON-Lab Bode 100 analyzer. The measurements are saved as “memory” and the data display is set to memory and data. This allows all of the settings to be provided for your convenience and also for you to see if your measurement results are correct. The Bode 100 Software Suite is included along with the complete Bode 100 user manual, where you can find detailed instructions on the analyzer’s usage.
Making Measurements 10
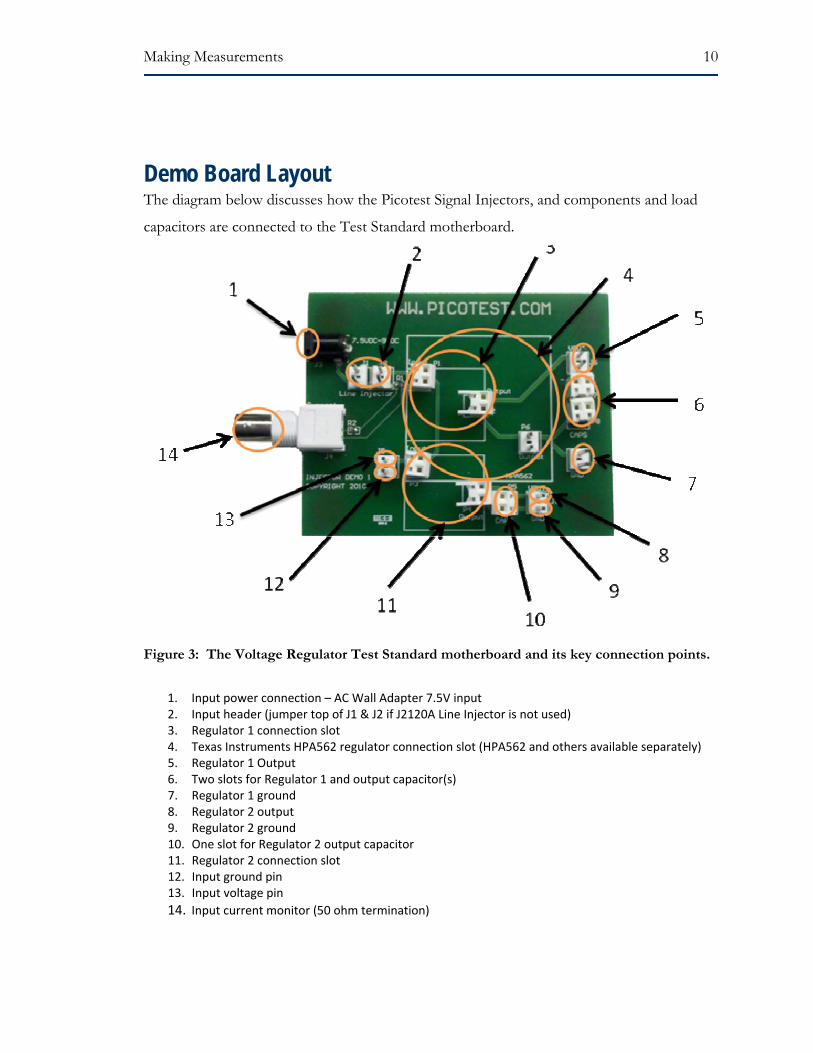
Demo Board Layout The diagram below discusses how the Picotest Signal Injectors, and components and load
capacitors are connected to the Test Standard motherboard.
Figure 3: The Voltage Regulator Test Standard motherboard and its key connection points.
1. Input power connection – AC Wall Adapter 7.5V input 2. Input header (jumper top of J1 & J2 if J2120A Line Injector is not used) 3. Regulator 1 connection slot 4. Texas Instruments HPA562 regulator connection slot (HPA562 and others available separately) 5. Regulator 1 Output 6. Two slots for Regulator 1 and output capacitor(s) 7. Regulator 1 ground 8. Regulator 2 output 9. Regulator 2 ground 10. One slot for Regulator 2 output capacitor 11. Regulator 2 connection slot 12. Input ground pin 13. Input voltage pin 14. Input current monitor (50 ohm termination)
Making Measurements 11
Chapter 2 – Making Measurements
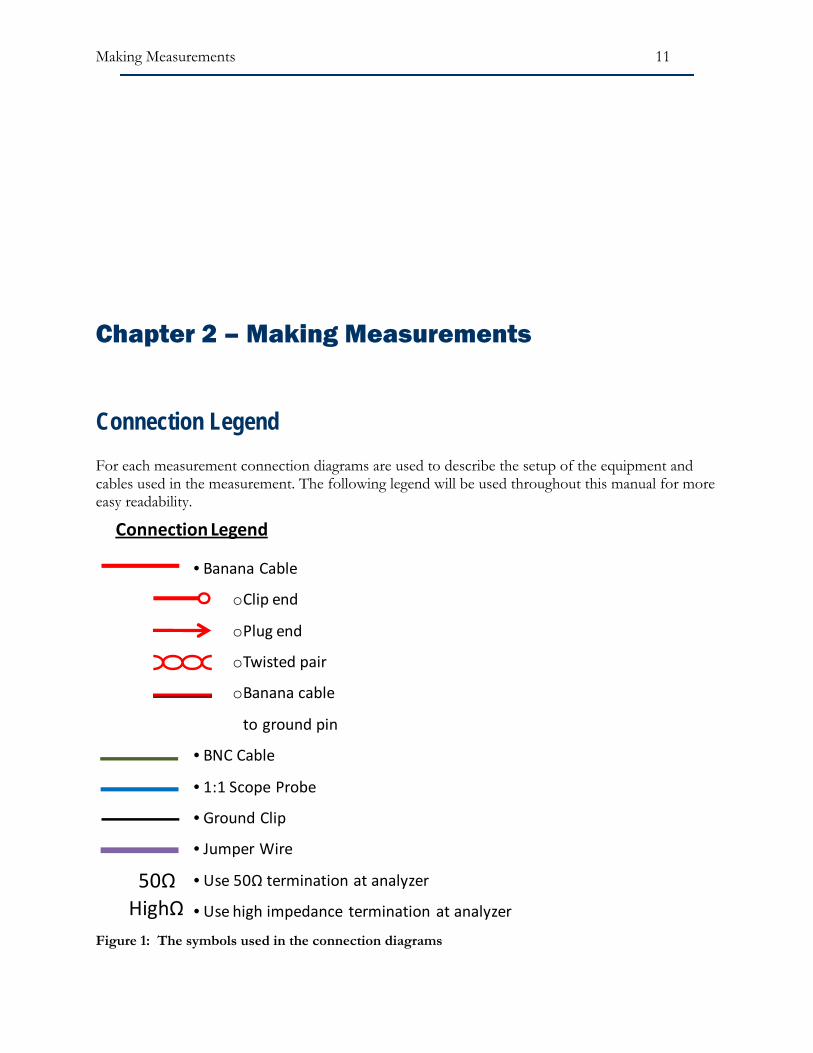
Connection Legend For each measurement connection diagrams are used to describe the setup of the equipment and cables used in the measurement. The following legend will be used throughout this manual for more easy readability.
Connection Legend
• Banana Cable
oClip end
oPlug end
oTwisted pair
oBanana cable
to ground pin
• BNC Cable
• 1:1 Scope Probe
• Ground Clip
• Jumper Wire
• Use 50Ω termination at analyzer
• Use high impedance termination at analyzer
50ΩHighΩ
Figure 1: The symbols used in the connection diagrams
Making Measurements 12
Stability (Bode Plot) Measurements The Bode plot is the generally accepted method for assessing the stability of a voltage regulator control loop. The LM317 adjustable regulator board is used to demonstrate this test. While this is a common voltage regulator type, there is one oddity in measuring the bode response. That is that the voltage reference is connected to the output voltage and not to ground. For this reason the measurements for both Ch1 and Ch2 are referenced to Vout and not ground. In most applications, the probes will connect to ground.
WARNING!!! Because the measurement is referenced to Vout and not Ground, the output is effectively floating. By connecting the ground clip leads of the scope probes to Vout of the regulator, output ground is NOT the same as input ground and by adding any grounded equipment to output ground will result in a short circuit between the output and ground. If this happens, the 2 ohm resistor on the input ground side will act as the fuse, burn out and the board will be unusable until the resistor is replaced.
Equipment List • Bode 100 or other network analyzer • J2100A or J2101A Injection Transformer • J2111A Current Injector • Two 1:1 scope probes or BNC cables with hooks or clips • J2140A Attenuator • LM317 Adjustable Regulator board
Note: In each measurement, the J2111A Current Injector is used as a static 25mA load, or a voltage controlled stepped load for load perturbations, or both. When using the oscillator of the Bode100 to modulate J2111A’s current over frequency, the bias switch on the injector must be set to “+” for positive output regulators (the analyzer's inputs must be in Class A bias). This also ensures the J2111A will not try to draw a negative current from the regulator.
Making Measurements 13
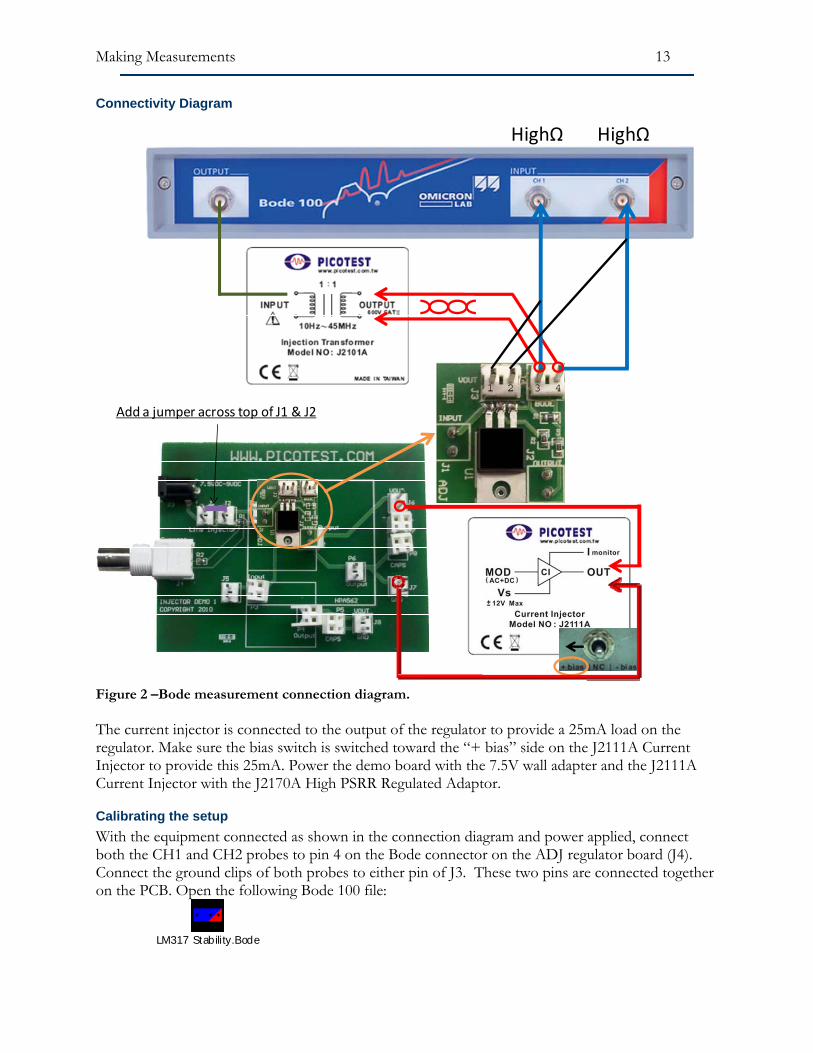
Connectivity Diagram
Add a jumper across top of J1 & J2
HighΩ HighΩ
Figure 2 –Bode measurement connection diagram. The current injector is connected to the output of the regulator to provide a 25mA load on the regulator. Make sure the bias switch is switched toward the “+ bias” side on the J2111A Current Injector to provide this 25mA. Power the demo board with the 7.5V wall adapter and the J2111A Current Injector with the J2170A High PSRR Regulated Adaptor.
Calibrating the setup With the equipment connected as shown in the connection diagram and power applied, connect both the CH1 and CH2 probes to pin 4 on the Bode connector on the ADJ regulator board (J4). Connect the ground clips of both probes to either pin of J3. These two pins are connected together on the PCB. Open the following Bode 100 file:
LM317 Stability.Bode
Making Measurements 14
Under the calibration menu, select PROBE calibration and choose the “THRU” calibration. This calibration will adjust for the differences in frequency response of the two probes. For additional details and methods about calibration, see Calibrating the Bode 100 in the Bode 100 user manual.
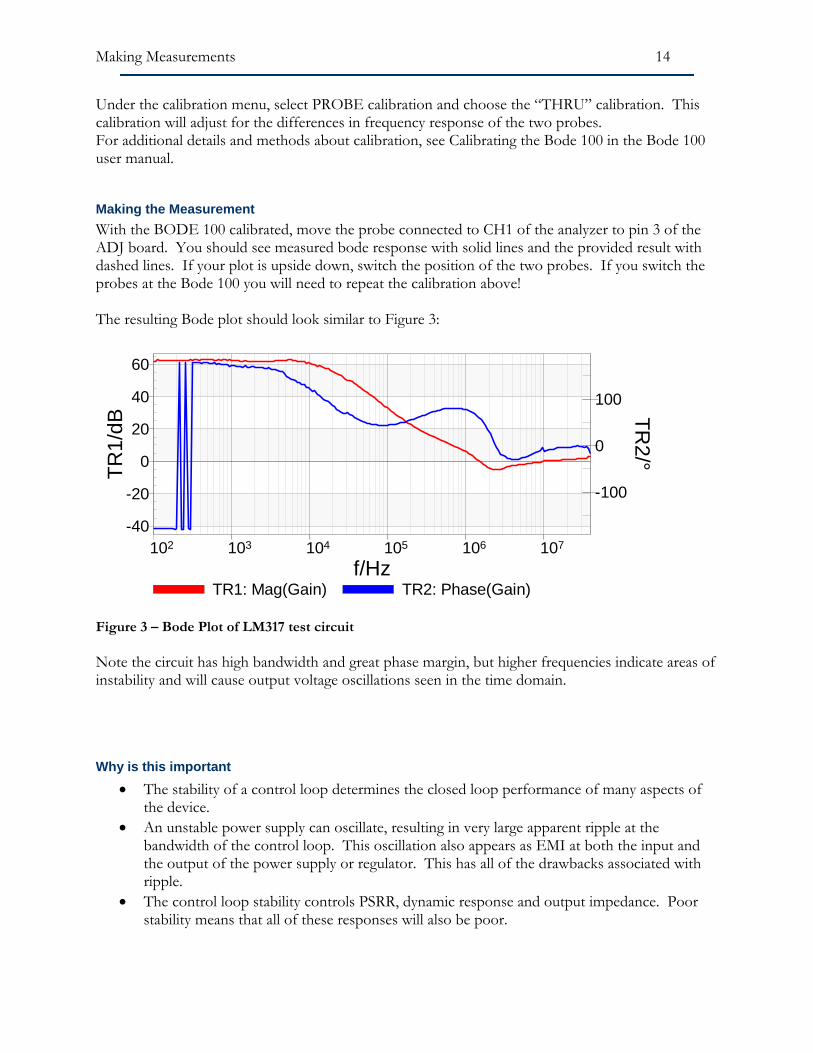
Making the Measurement With the BODE 100 calibrated, move the probe connected to CH1 of the analyzer to pin 3 of the ADJ board. You should see measured bode response with solid lines and the provided result with dashed lines. If your plot is upside down, switch the position of the two probes. If you switch the probes at the Bode 100 you will need to repeat the calibration above! The resulting Bode plot should look similar to Figure 3:
-40
-20
0
20
40
60
-100
0
100
102 103 104 105 106 107
TR1/
dB
TR2/°
f/HzTR1: Mag(Gain) TR2: Phase(Gain)
Figure 3 – Bode Plot of LM317 test circuit Note the circuit has high bandwidth and great phase margin, but higher frequencies indicate areas of instability and will cause output voltage oscillations seen in the time domain.
Why is this important • The stability of a control loop determines the closed loop performance of many aspects of
the device. • An unstable power supply can oscillate, resulting in very large apparent ripple at the
bandwidth of the control loop. This oscillation also appears as EMI at both the input and the output of the power supply or regulator. This has all of the drawbacks associated with ripple.
• The control loop stability controls PSRR, dynamic response and output impedance. Poor stability means that all of these responses will also be poor.
Making Measurements 15
Tips • The #1 measurement issue is using an injection signal that is too large. The signals must be
very small, and in some cases an attenuator is needed to reduce the oscillator signal level. The Picotest J2140A provides attenuation of 10dB-70dB in 10dB steps.
• The stability is significantly dependent on operation conditions, such as input voltage and load current, so be sure to evaluate it at all operating conditions.
• It is possible for the loop gain to increase after crossing unity gain, resulting in additional crossings so be sure that you measurement and injector are capable of measuring to a sufficient frequency.
• Often, circuit loads include decoupling capacitors and filters that can destabilize the control loop. Be sure to include them in your measurements
• Use of audio transformers or video transformers is not recommended and they will often provide incorrect results.
Recommendations Insert the 22uF ceramic capacitor (Capacitor 6) into P7 or P8. Repeat the measurement using the
following Bode 100 file.
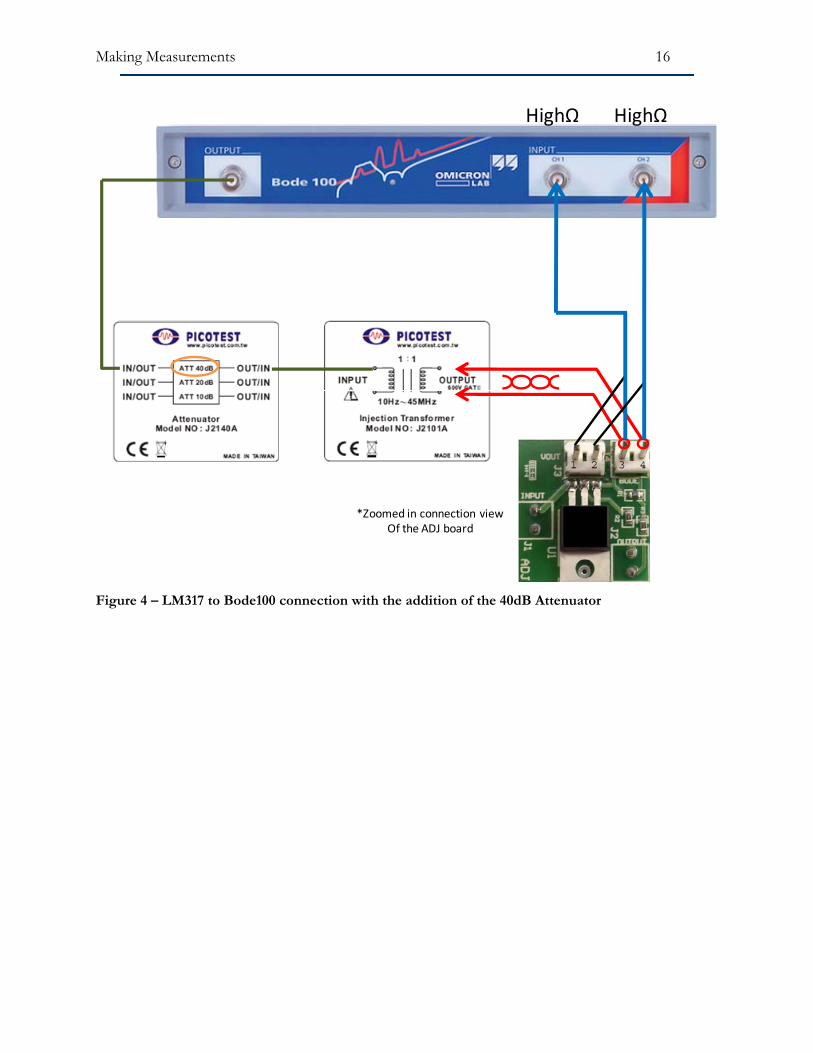
LM317 Bode, 22uF, -45dB.Bode Repeat the steps for calibrating the probes, then try measuring with the current settings. Notice that the current measurement does not overlay well with the saved data. This is because the current measurement has too large of an oscillator signal level that it is yielding a measurement with the wrong answer. In the configuration box to the left of the plot, type -10 dBm into the Level field. Re-running the measurement, you can see the results have changed from before! If you continue decrease the signal level, we will reach the lower limit of the Bode 100 (-27 dBm) before we get to the correct answer. The J2140 Attenuator is needed to produce a small enough oscillator injection level such that we are not affecting the measurement with the signal and can get the correct result. Connect the 40dB attenuator to the output of the Bode 100 oscillator as shown in Figure 4:
Making Measurements 16
*Zoomed in connection viewOf the ADJ board
HighΩ HighΩ
Figure 4 – LM317 to Bode100 connection with the addition of the 40dB Attenuator
Making Measurements 17
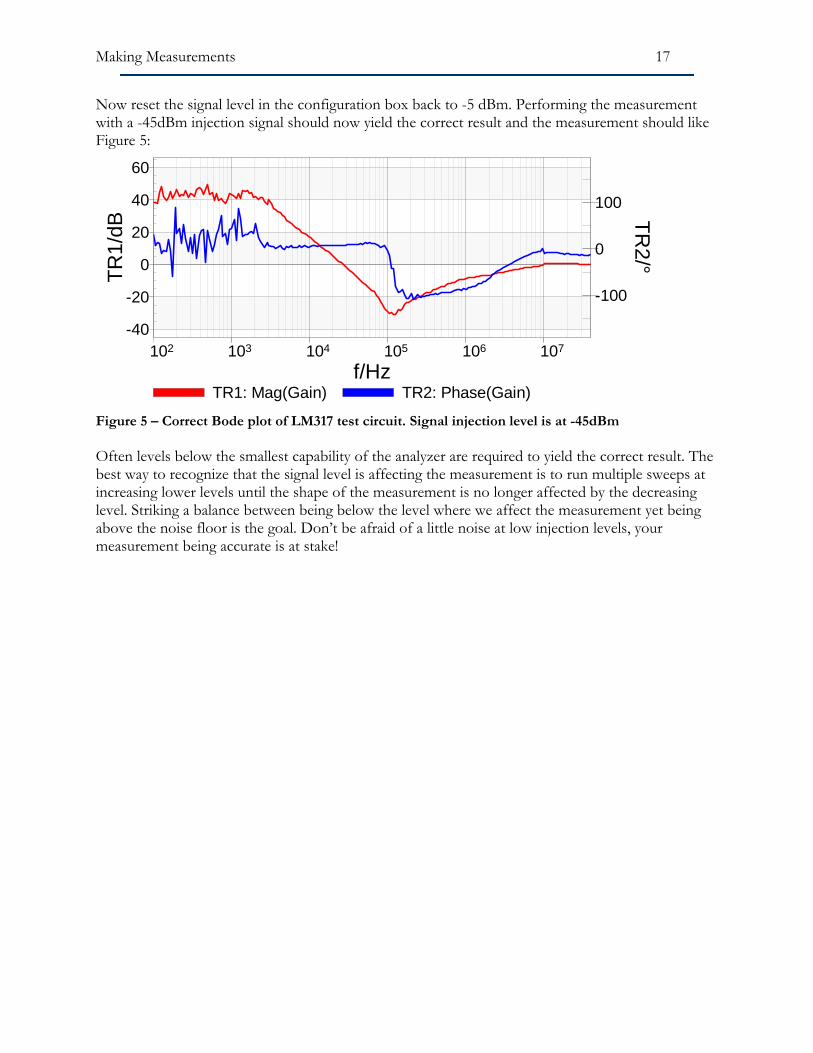
Now reset the signal level in the configuration box back to -5 dBm. Performing the measurement with a -45dBm injection signal should now yield the correct result and the measurement should like Figure 5:
-40
-20
0
20
40
60
-100
0
100
102 103 104 105 106 107
TR1/
dB
TR2/°
f/HzTR1: Mag(Gain) TR2: Phase(Gain)
Figure 5 – Correct Bode plot of LM317 test circuit. Signal injection level is at -45dBm Often levels below the smallest capability of the analyzer are required to yield the correct result. The best way to recognize that the signal level is affecting the measurement is to run multiple sweeps at increasing lower levels until the shape of the measurement is no longer affected by the decreasing level. Striking a balance between being below the level where we affect the measurement yet being above the noise floor is the goal. Don’t be afraid of a little noise at low injection levels, your measurement being accurate is at stake!
Making Measurements 18
Transient Step Load Measurements The step load test shows the time domain response of the voltage regulator to a change in current. If the current change is small signal, information about the control loop can be observed. The solid state current injector has a high bandwidth and fast response time in order to assure that the injector itself does not limit the measurement.
Equipment List • High Speed Wave Generator, such as the Picotest G5100A • J2111A Current Injector • Oscilloscope • LM317 Adjustable Regulator board
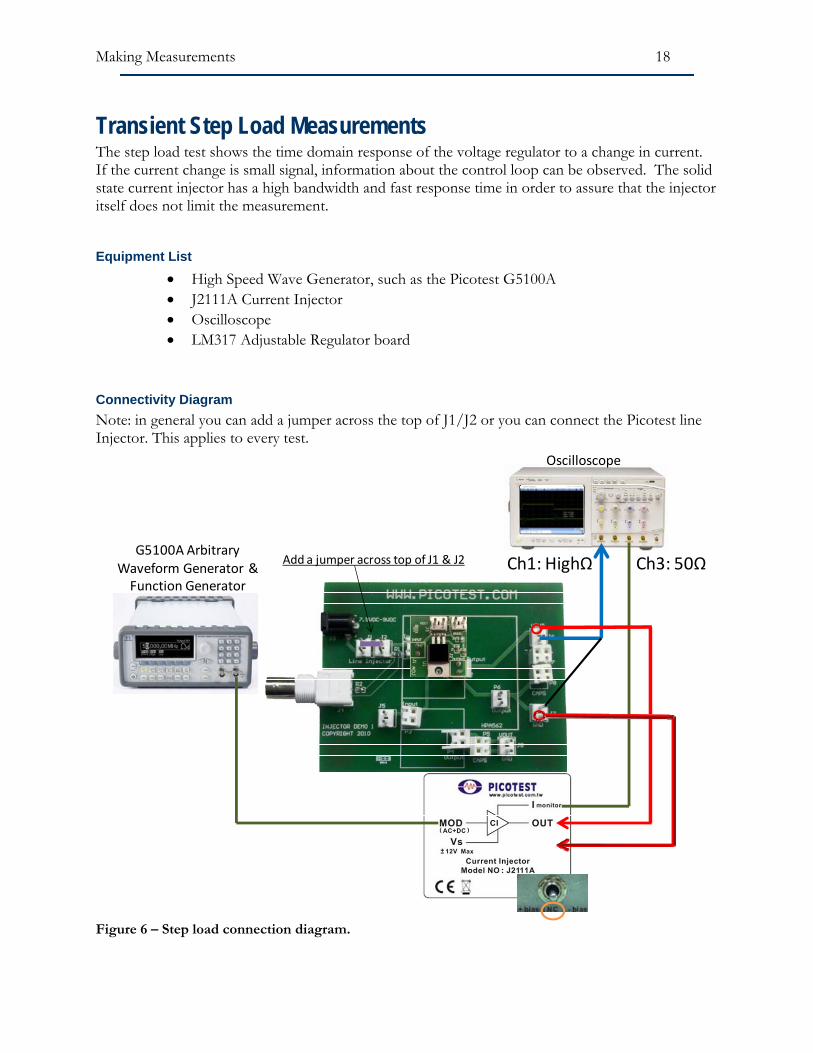
Connectivity Diagram Note: in general you can add a jumper across the top of J1/J2 or you can connect the Picotest line Injector. This applies to every test.
G5100A Arbitrary Waveform Generator & Function Generator
Oscilloscope
Add a jumper across top of J1 & J2 Ch3: 50ΩCh1: HighΩ
Figure 6 – Step load connection diagram.
Making Measurements 19
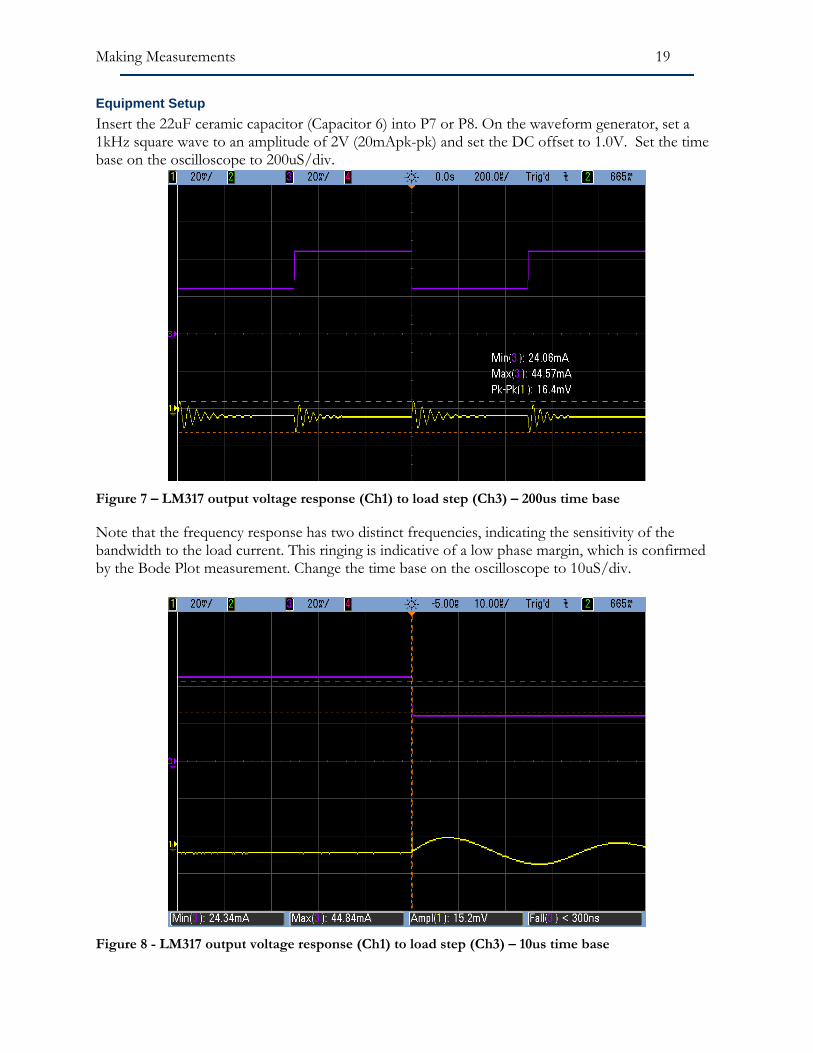
Equipment Setup Insert the 22uF ceramic capacitor (Capacitor 6) into P7 or P8. On the waveform generator, set a 1kHz square wave to an amplitude of 2V (20mApk-pk) and set the DC offset to 1.0V. Set the time base on the oscilloscope to 200uS/div.
Figure 7 – LM317 output voltage response (Ch1) to load step (Ch3) – 200us time base
Note that the frequency response has two distinct frequencies, indicating the sensitivity of the bandwidth to the load current. This ringing is indicative of a low phase margin, which is confirmed by the Bode Plot measurement. Change the time base on the oscilloscope to 10uS/div.
Figure 8 - LM317 output voltage response (Ch1) to load step (Ch3) – 10us time base
Making Measurements 20
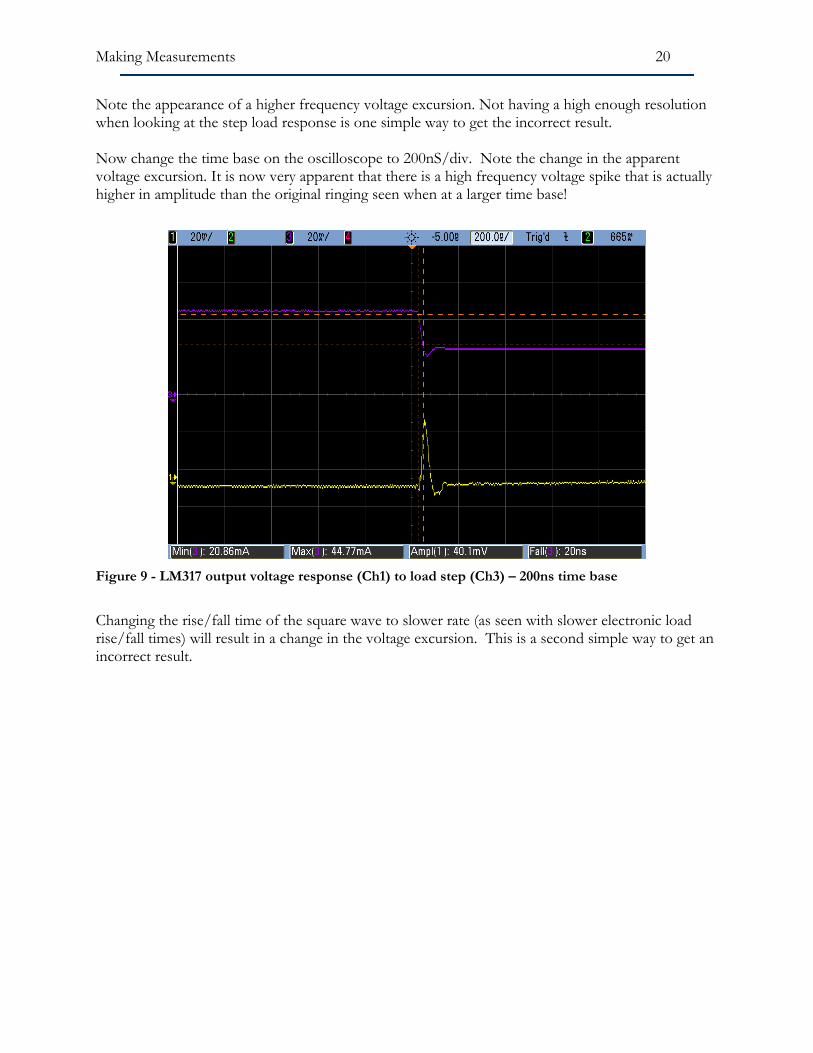
Note the appearance of a higher frequency voltage excursion. Not having a high enough resolution when looking at the step load response is one simple way to get the incorrect result. Now change the time base on the oscilloscope to 200nS/div. Note the change in the apparent voltage excursion. It is now very apparent that there is a high frequency voltage spike that is actually higher in amplitude than the original ringing seen when at a larger time base!
Figure 9 - LM317 output voltage response (Ch1) to load step (Ch3) – 200ns time base
Changing the rise/fall time of the square wave to slower rate (as seen with slower electronic load rise/fall times) will result in a change in the voltage excursion. This is a second simple way to get an incorrect result.
Making Measurements 21
Why is this important • Under dynamic loading conditions the voltages can go far below and above the DC
regulation limits. This can cause damage to the loads. • The dynamic voltage response can have similar effects to ripple, including degrading SNR,
BER, phase noise, jitter, etc.
Tips • The solid state current injector is a small signal injector, allowing observation of the control
loop performance. It is not to be confused with an electronic load • An electronic load is generally not useful for this test, especially if small output capacitors are
used. The electronic load has low current rise and fall times as well as low operating bandwidth compared with the solid state current injector
• There are two responses, the natural response, which occurs when the load change occurs at a rate much lower than the bandwidth of the regulator and the forced response, which occurs when the load change is at the bandwidth of the regulator
• It is possible (and quite easy, in fact) to obtain incorrect results from the load step testing. The oscilloscope (and probe) must have adequate bandwidth and sampling rate. The time base must also be consistent with the measurement.
Making Measurements 22
PSRR Measurements PSRR or Power Supply Rejection Ratio is the measure of the conducted susceptibility of a regulator. In short, this is a measure of how much of an AC signal is attenuated from the input to the output. In this measurement we inject an AC signal into the input of the regulator using the J2120A Line Injector and measure input voltage (into CH2) over output voltage (into CH1).
Equipment List • Bode 100 or other network analyzer • J2111A Current Injector • J2120A Line Injector • Two 1:1 scope probes or BNC cables with hooks or clips • LM317 Adjustable Regulator board
Making Measurements 23
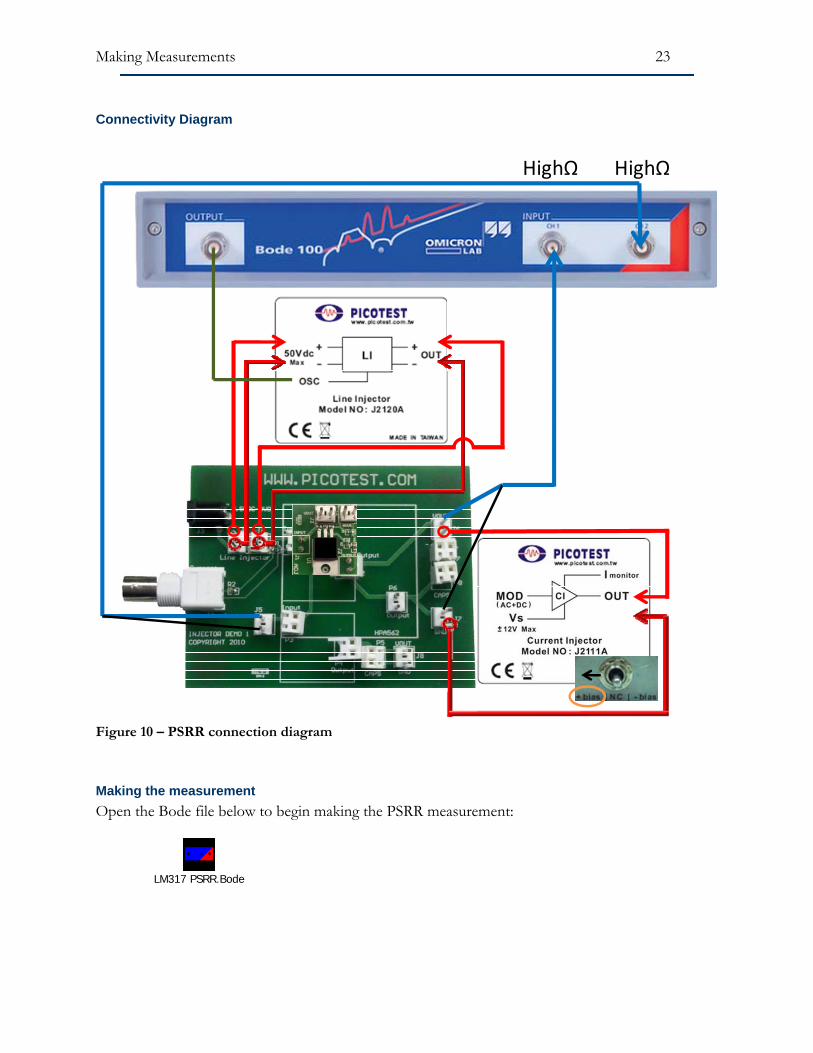
Connectivity Diagram
HighΩ HighΩ
Figure 10 – PSRR connection diagram
Making the measurement Open the Bode file below to begin making the PSRR measurement:
LM317 PSRR.Bode
Making Measurements 24
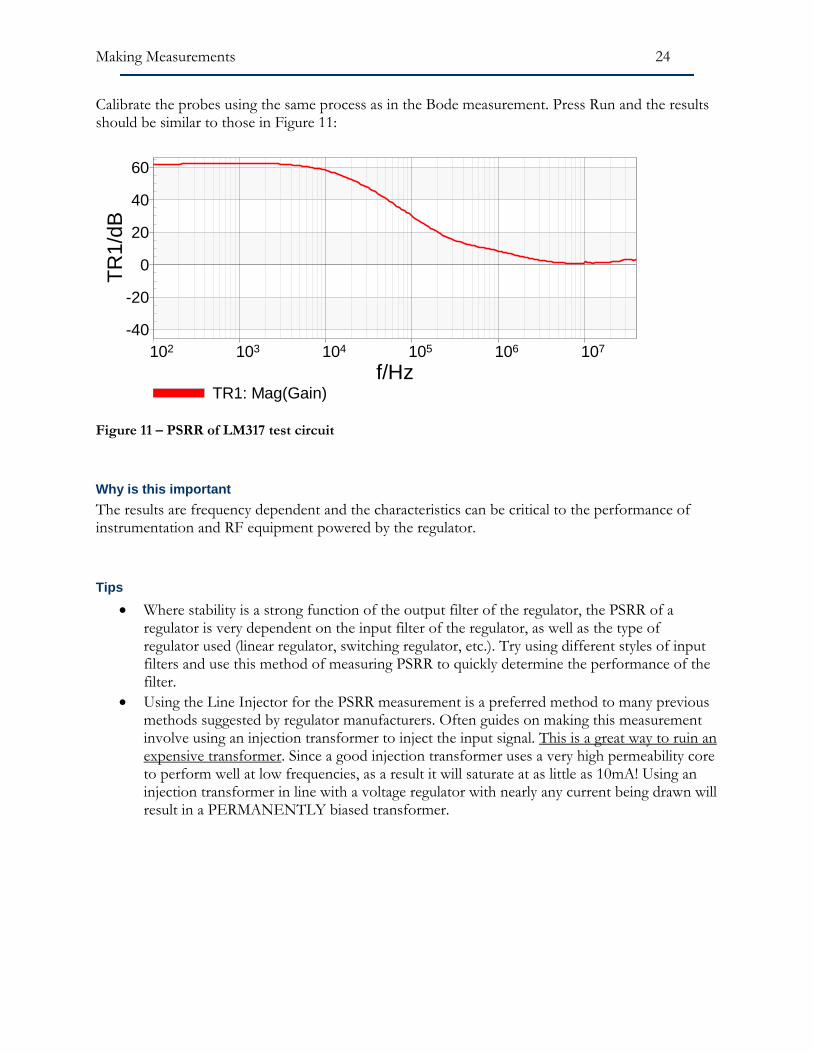
Calibrate the probes using the same process as in the Bode measurement. Press Run and the results should be similar to those in Figure 11:
-40
-20
0
20
40
60
102 103 104 105 106 107
TR1/
dB
f/HzTR1: Mag(Gain)
Figure 11 – PSRR of LM317 test circuit
Why is this important The results are frequency dependent and the characteristics can be critical to the performance of instrumentation and RF equipment powered by the regulator.
Tips • Where stability is a strong function of the output filter of the regulator, the PSRR of a
regulator is very dependent on the input filter of the regulator, as well as the type of regulator used (linear regulator, switching regulator, etc.). Try using different styles of input filters and use this method of measuring PSRR to quickly determine the performance of the filter.
• Using the Line Injector for the PSRR measurement is a preferred method to many previous methods suggested by regulator manufacturers. Often guides on making this measurement involve using an injection transformer to inject the input signal. This is a great way to ruin an expensive transformer. Since a good injection transformer uses a very high permeability core to perform well at low frequencies, as a result it will saturate at as little as 10mA! Using an injection transformer in line with a voltage regulator with nearly any current being drawn will result in a PERMANENTLY biased transformer.
Making Measurements 25
Other Recommendations Observe the frequency at which the PSRR gain curve crosses 0dB. Using the Line Injector connected in the same configuration as the first measurement, inject a 1V peak to peak sine wave at the frequency of the zero crossing seen in the PSRR measurement from an arbitrary waveform generator such as the Picotest G5100A. Connect to scope probes to the oscilloscope and put one probe on the input of the regulator and one on the output. Since 0dB translates to a 1:1 voltage ratio, you will see the same amplitude in both sine waves on the scope. Changing the sine wave to other frequencies, you can confirm the results seen the PSRR gain plot by observing the attenuation or amplification the input signal at the output of the regulator.
Making Measurements 26
Output Impedance Using output impedance measurements to characterize the stability of a regulator is quickly becoming a more popular alternative to using Bode plots and step load analysis. Using the Current Injector to sweep current over a very large range of frequencies, the output impedance can be measured and from that we can non-invasively extract Q and phase margin of the system.
Equipment List • Bode 100 or other network analyzer • J2111A Current Injector • One 1:1 scope probe or BNC cable with a hook or clip • LM317 Adjustable Regulator board
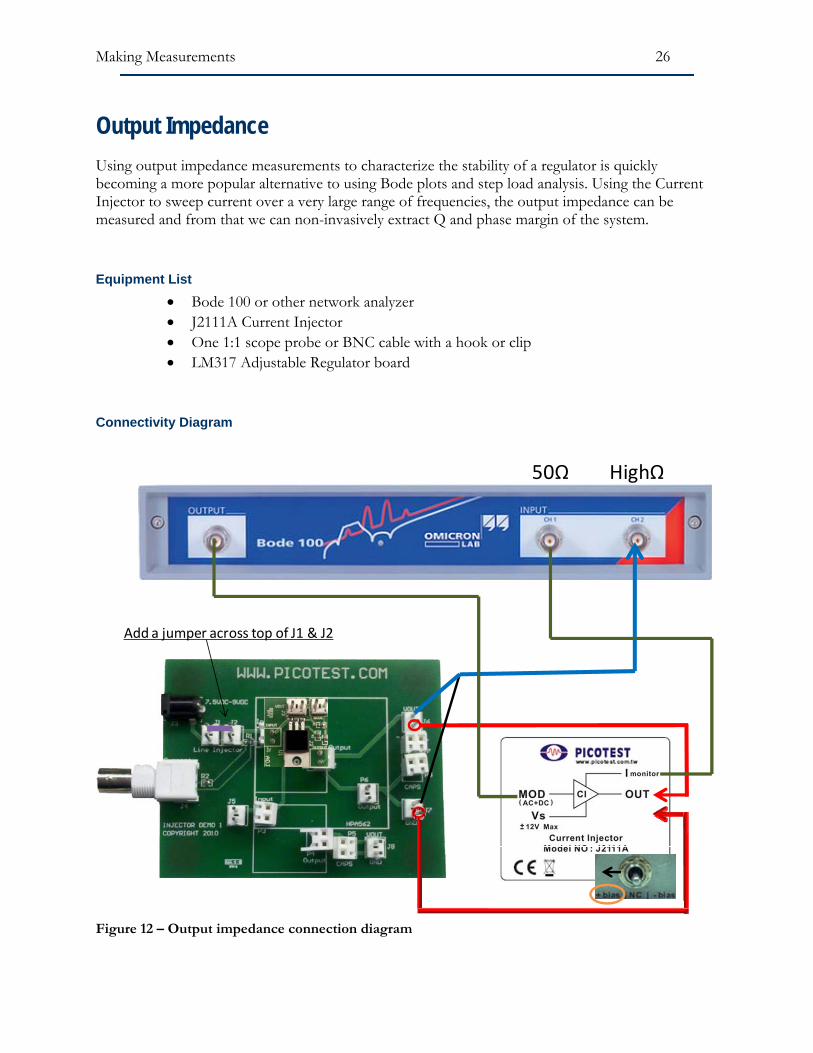
Connectivity Diagram
Add a jumper across top of J1 & J2
50Ω HighΩ
Figure 12 – Output impedance connection diagram
Making Measurements 27
Making Measurements Open the Bode file below to begin making the Output impedance measurement:
LM317 Output Z.Bode
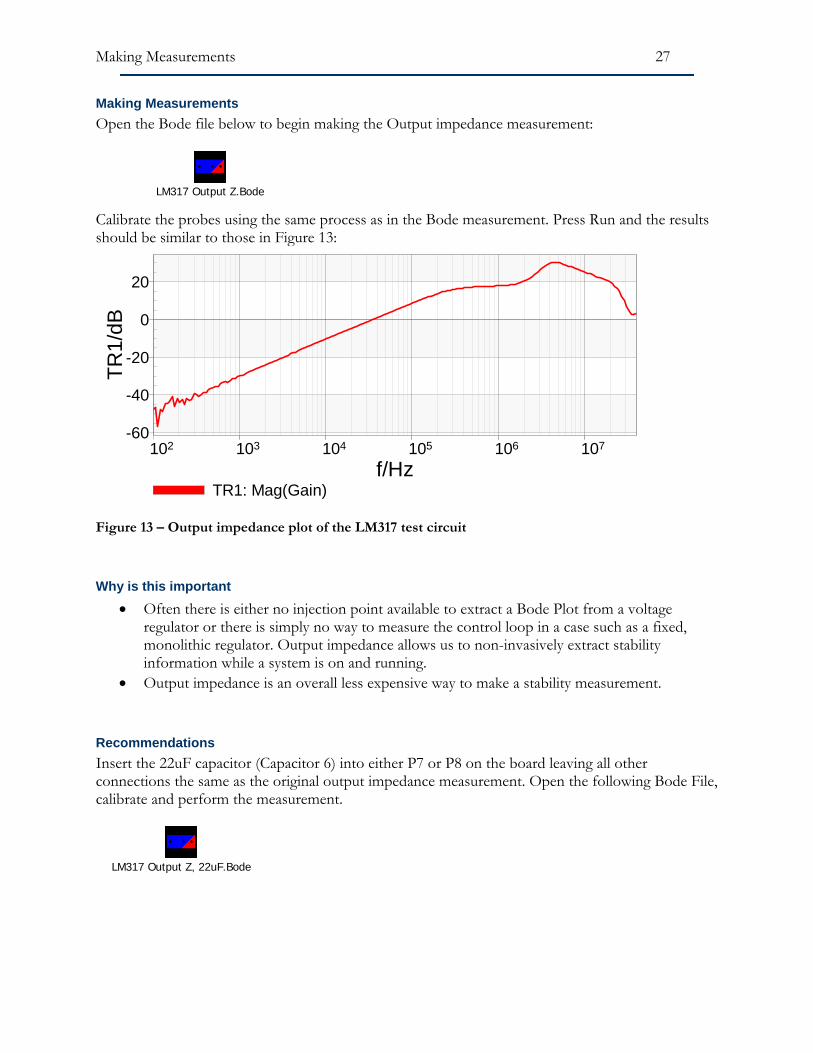
Calibrate the probes using the same process as in the Bode measurement. Press Run and the results should be similar to those in Figure 13:
-60
-40
-20
0
20
102 103 104 105 106 107
TR1/
dB
f/HzTR1: Mag(Gain)
Figure 13 – Output impedance plot of the LM317 test circuit
Why is this important • Often there is either no injection point available to extract a Bode Plot from a voltage
regulator or there is simply no way to measure the control loop in a case such as a fixed, monolithic regulator. Output impedance allows us to non-invasively extract stability information while a system is on and running.
• Output impedance is an overall less expensive way to make a stability measurement.
Recommendations Insert the 22uF capacitor (Capacitor 6) into either P7 or P8 on the board leaving all other connections the same as the original output impedance measurement. Open the following Bode File, calibrate and perform the measurement.
LM317 Output Z, 22uF.Bode
Making Measurements 28
The resulting plot should be similar to those in Figure 14:
-60
-40
-20
0
20
0
20u
40u
60u
80u
102 103 104 105 106 107
TR1/
dBTR
2/s
f/HzTR1: Mag(Gain) TR2: Tg(Gain)
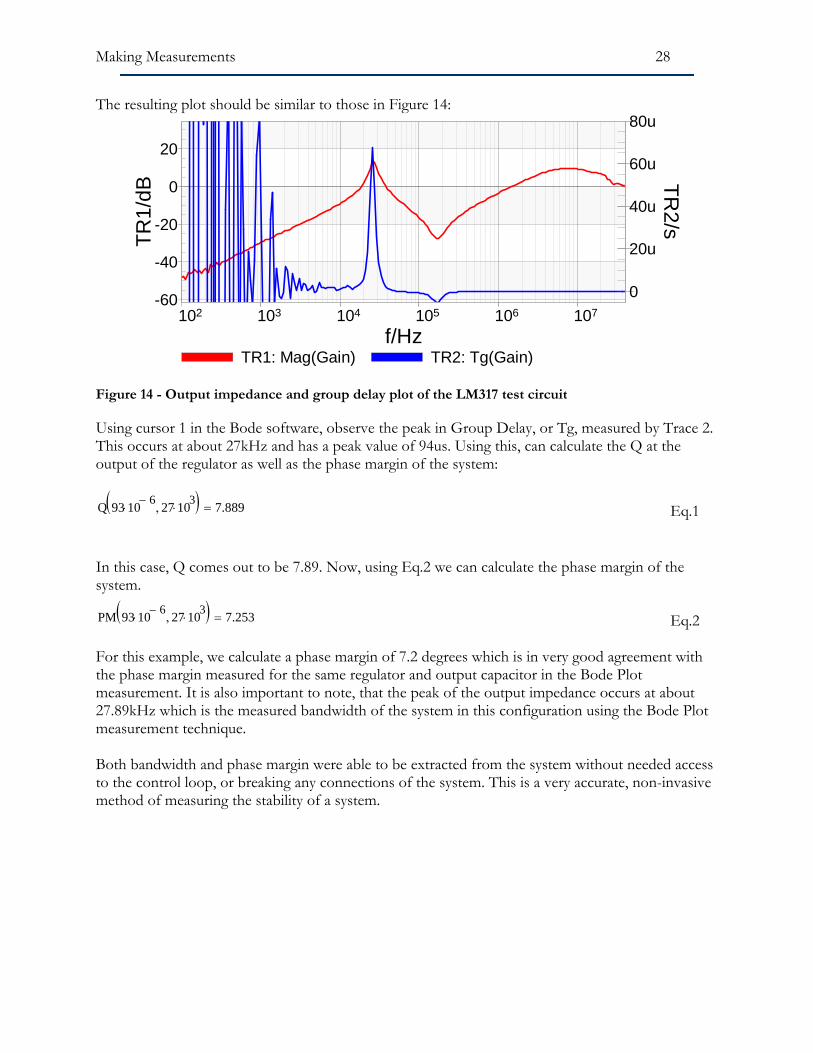
Figure 14 - Output impedance and group delay plot of the LM317 test circuit
Using cursor 1 in the Bode software, observe the peak in Group Delay, or Tg, measured by Trace 2. This occurs at about 27kHz and has a peak value of 94us. Using this, can calculate the Q at the output of the regulator as well as the phase margin of the system: Q 93 10 6−
⋅ 27 103⋅,( ) 7.889= Eq.1
In this case, Q comes out to be 7.89. Now, using Eq.2 we can calculate the phase margin of the system.
PM 93 10 6−⋅ 27 103
⋅,( ) 7.253= Eq.2 For this example, we calculate a phase margin of 7.2 degrees which is in very good agreement with the phase margin measured for the same regulator and output capacitor in the Bode Plot measurement. It is also important to note, that the peak of the output impedance occurs at about 27.89kHz which is the measured bandwidth of the system in this configuration using the Bode Plot measurement technique. Both bandwidth and phase margin were able to be extracted from the system without needed access to the control loop, or breaking any connections of the system. This is a very accurate, non-invasive method of measuring the stability of a system.
Making Measurements 29
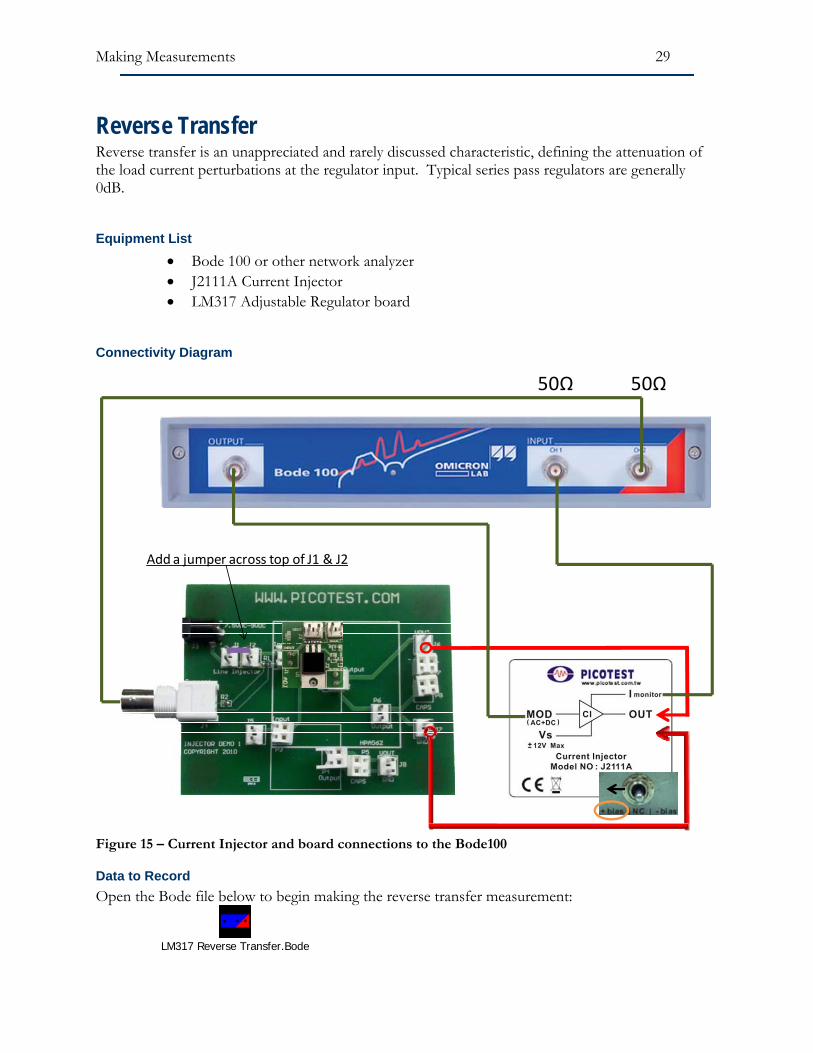
Reverse Transfer Reverse transfer is an unappreciated and rarely discussed characteristic, defining the attenuation of the load current perturbations at the regulator input. Typical series pass regulators are generally 0dB.
Equipment List • Bode 100 or other network analyzer • J2111A Current Injector • LM317 Adjustable Regulator board
Connectivity Diagram
Add a jumper across top of J1 & J2
50Ω 50Ω
Figure 15 – Current Injector and board connections to the Bode100
Data to Record Open the Bode file below to begin making the reverse transfer measurement:
LM317 Reverse Transfer.Bode
Making Measurements 30
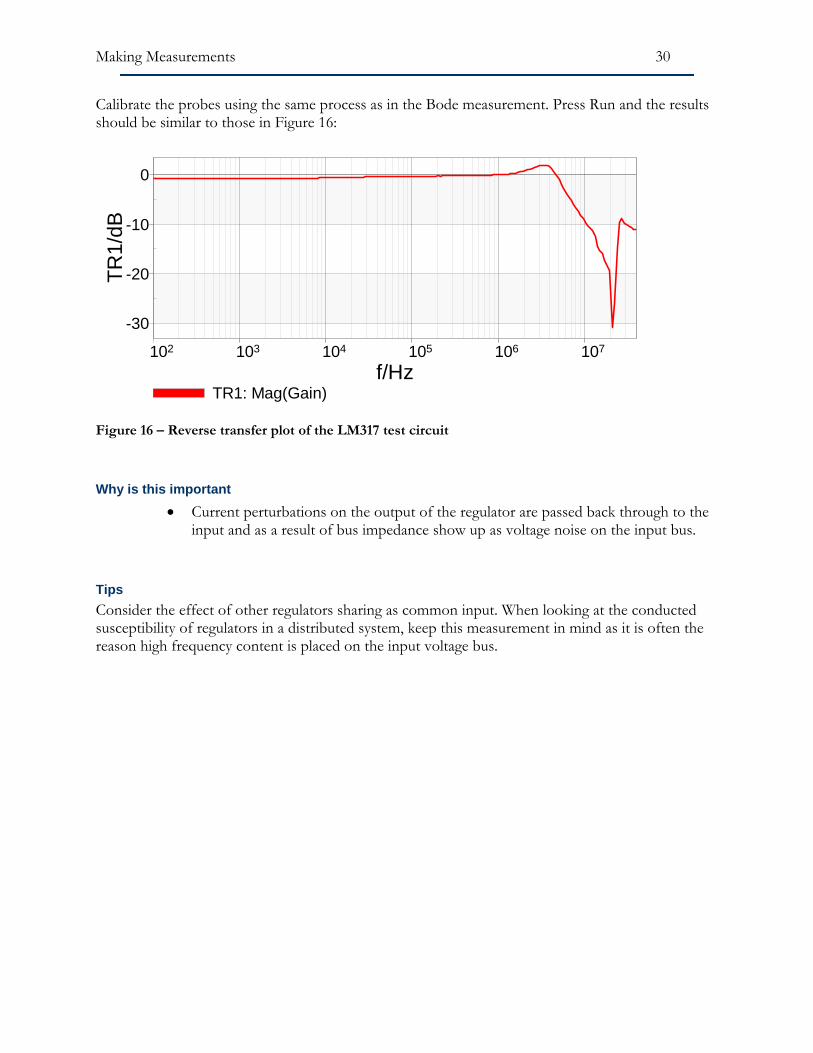
Calibrate the probes using the same process as in the Bode measurement. Press Run and the results should be similar to those in Figure 16:
-30
-20
-10
0
102 103 104 105 106 107
TR1/
dB
f/HzTR1: Mag(Gain)
Figure 16 – Reverse transfer plot of the LM317 test circuit
Why is this important • Current perturbations on the output of the regulator are passed back through to the
input and as a result of bus impedance show up as voltage noise on the input bus.
Tips Consider the effect of other regulators sharing as common input. When looking at the conducted susceptibility of regulators in a distributed system, keep this measurement in mind as it is often the reason high frequency content is placed on the input voltage bus.
Making Measurements 31
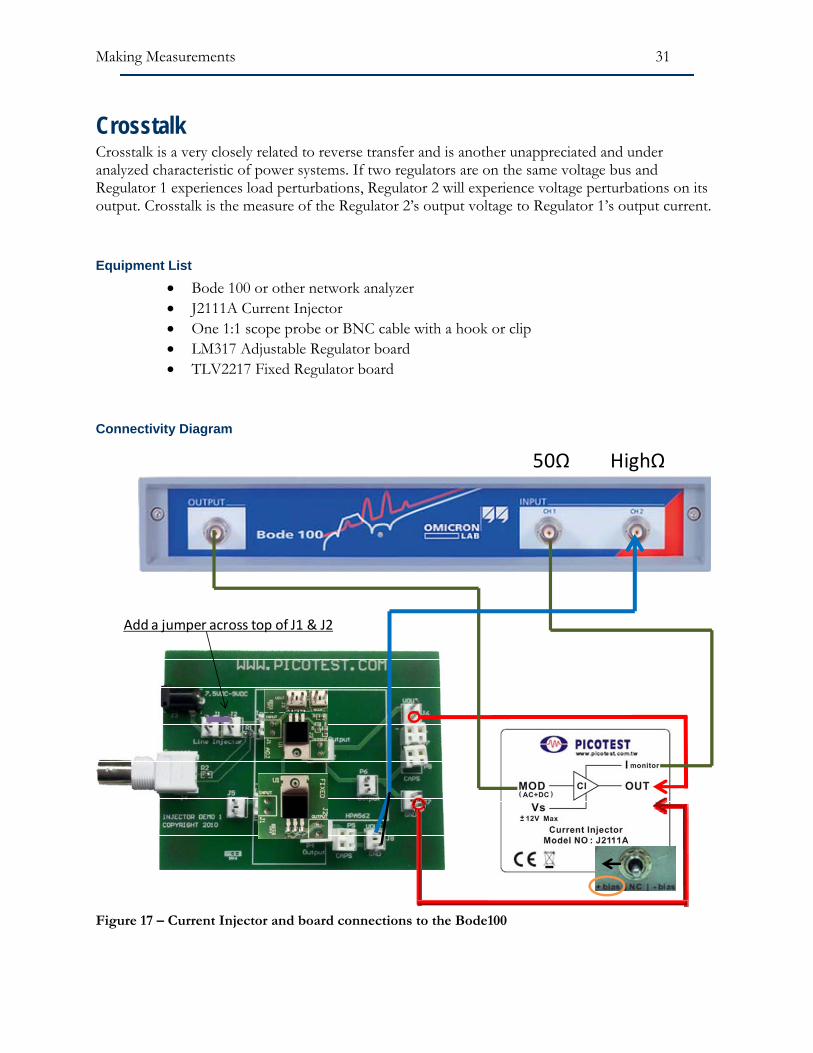
Crosstalk Crosstalk is a very closely related to reverse transfer and is another unappreciated and under analyzed characteristic of power systems. If two regulators are on the same voltage bus and Regulator 1 experiences load perturbations, Regulator 2 will experience voltage perturbations on its output. Crosstalk is the measure of the Regulator 2’s output voltage to Regulator 1’s output current.
Equipment List • Bode 100 or other network analyzer • J2111A Current Injector • One 1:1 scope probe or BNC cable with a hook or clip • LM317 Adjustable Regulator board • TLV2217 Fixed Regulator board
Connectivity Diagram
Add a jumper across top of J1 & J2
50Ω HighΩ
Figure 17 – Current Injector and board connections to the Bode100
Making Measurements 32
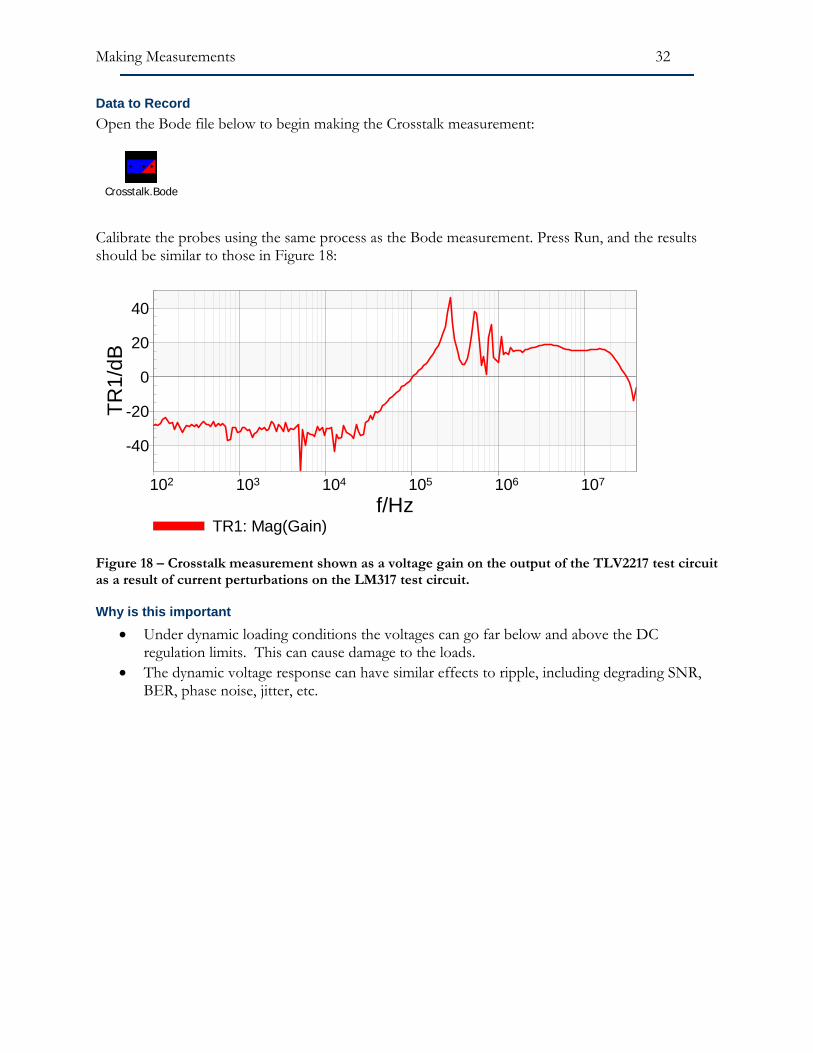
Data to Record Open the Bode file below to begin making the Crosstalk measurement:
Crosstalk.Bode Calibrate the probes using the same process as the Bode measurement. Press Run, and the results should be similar to those in Figure 18:
-40
-20
0
20
40
102 103 104 105 106 107
TR1/
dB
f/HzTR1: Mag(Gain)
Figure 18 – Crosstalk measurement shown as a voltage gain on the output of the TLV2217 test circuit as a result of current perturbations on the LM317 test circuit.
Why is this important • Under dynamic loading conditions the voltages can go far below and above the DC
regulation limits. This can cause damage to the loads. • The dynamic voltage response can have similar effects to ripple, including degrading SNR,
BER, phase noise, jitter, etc.
Making Measurements 33
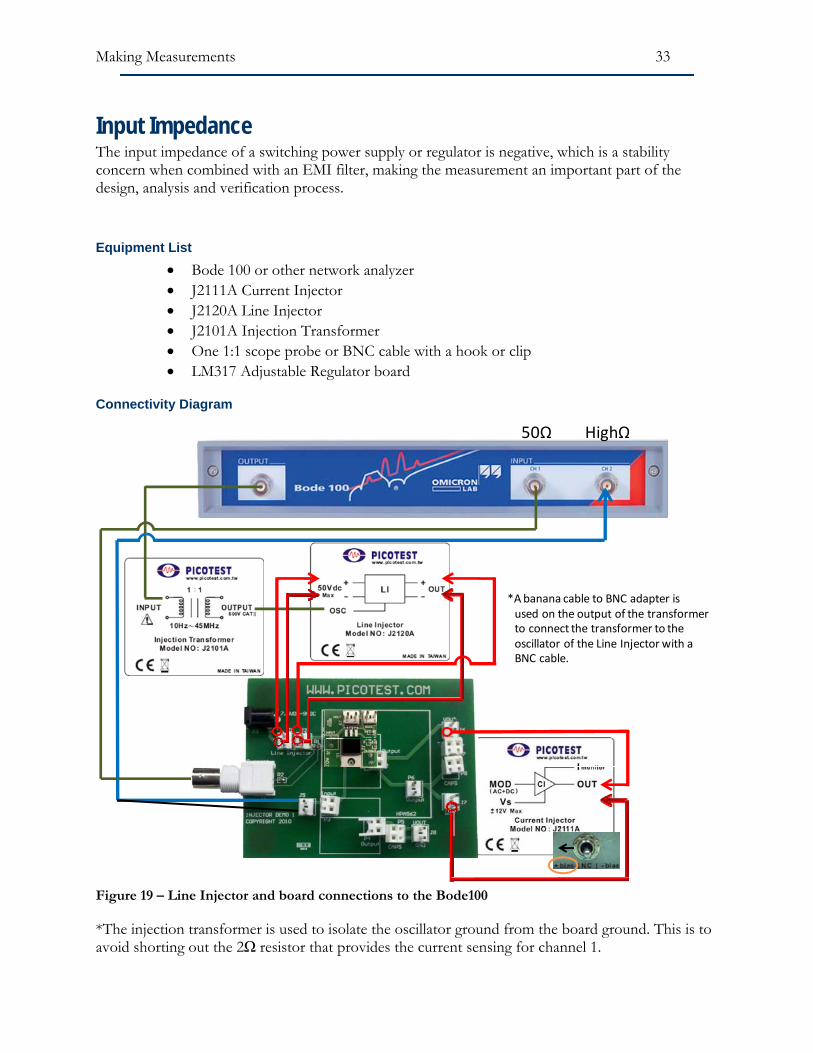
Input Impedance The input impedance of a switching power supply or regulator is negative, which is a stability concern when combined with an EMI filter, making the measurement an important part of the design, analysis and verification process.
Equipment List • Bode 100 or other network analyzer • J2111A Current Injector • J2120A Line Injector • J2101A Injection Transformer • One 1:1 scope probe or BNC cable with a hook or clip • LM317 Adjustable Regulator board
Connectivity Diagram
50Ω HighΩ
*A banana cable to BNC adapter is used on the output of the transformerto connect the transformer to theoscillator of the Line Injector with aBNC cable.
Figure 19 – Line Injector and board connections to the Bode100 *The injection transformer is used to isolate the oscillator ground from the board ground. This is to avoid shorting out the 2Ω resistor that provides the current sensing for channel 1.
Making Measurements 34
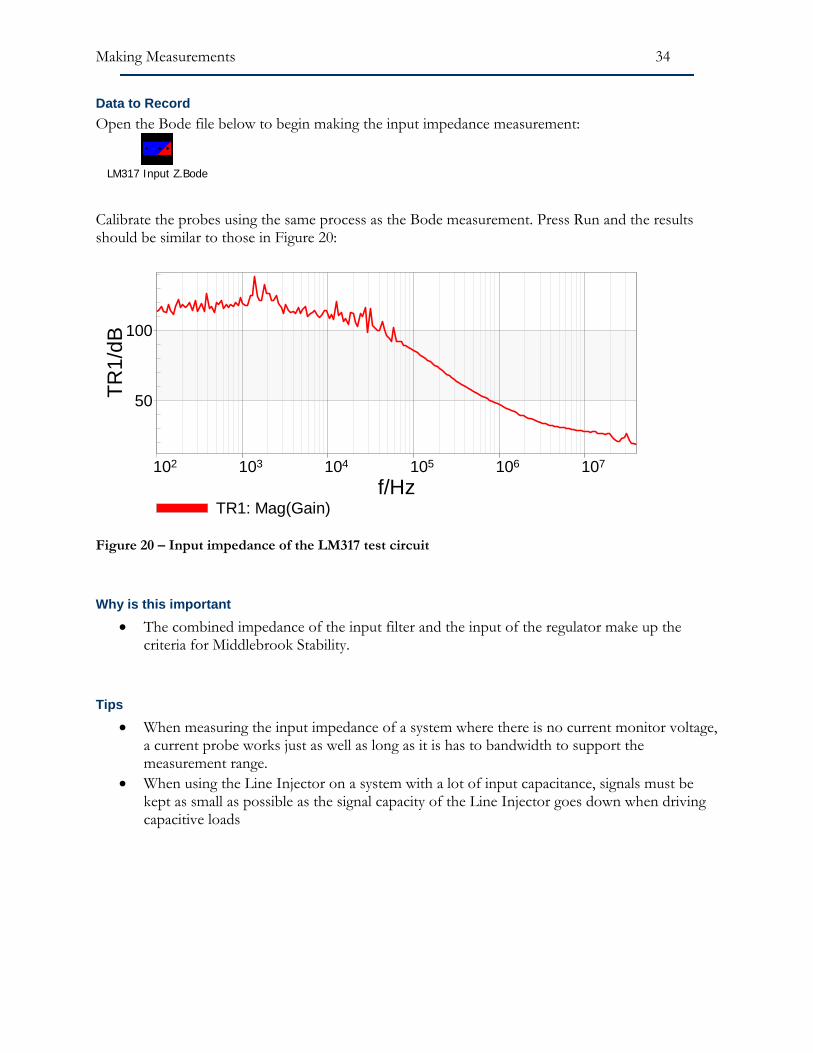
Data to Record Open the Bode file below to begin making the input impedance measurement:
LM317 Input Z.Bode Calibrate the probes using the same process as the Bode measurement. Press Run and the results should be similar to those in Figure 20:
50
100
102 103 104 105 106 107
TR1/
dB
f/HzTR1: Mag(Gain)
Figure 20 – Input impedance of the LM317 test circuit
Why is this important • The combined impedance of the input filter and the input of the regulator make up the
criteria for Middlebrook Stability.
Tips • When measuring the input impedance of a system where there is no current monitor voltage,
a current probe works just as well as long as it is has to bandwidth to support the measurement range.
• When using the Line Injector on a system with a lot of input capacitance, signals must be kept as small as possible as the signal capacity of the Line Injector goes down when driving capacitive loads
References 35
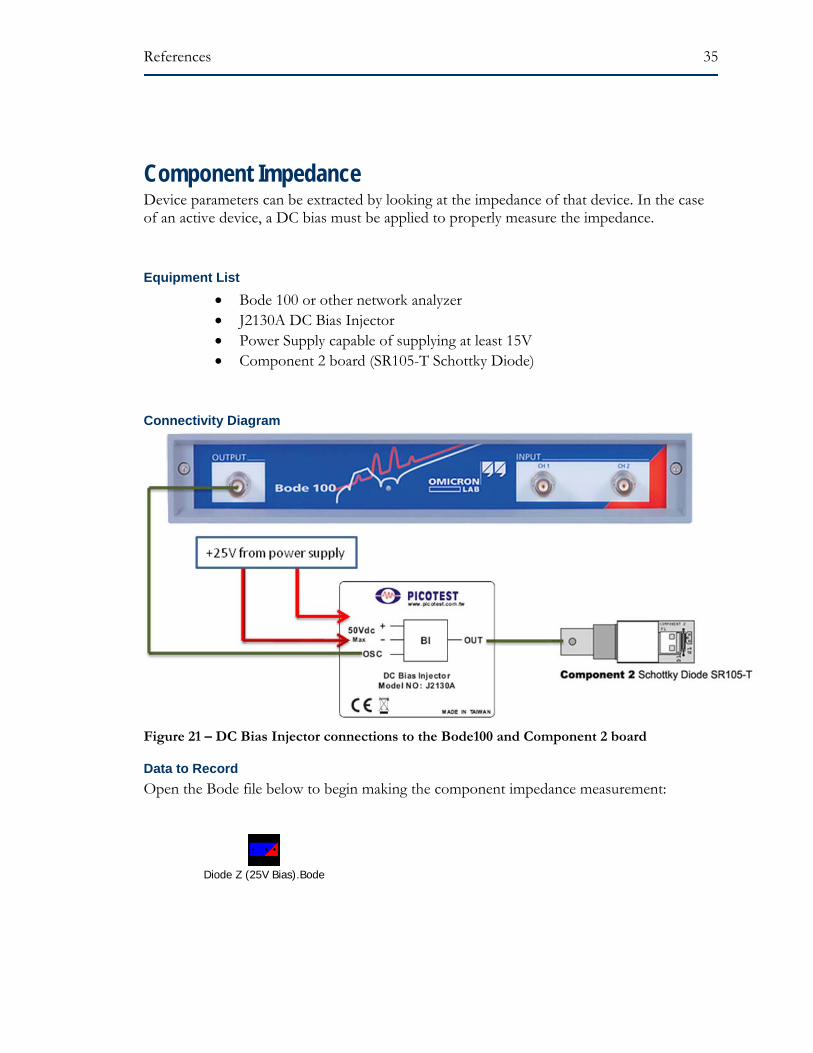
Component Impedance Device parameters can be extracted by looking at the impedance of that device. In the case of an active device, a DC bias must be applied to properly measure the impedance.
Equipment List • Bode 100 or other network analyzer • J2130A DC Bias Injector • Power Supply capable of supplying at least 15V • Component 2 board (SR105-T Schottky Diode)
Connectivity Diagram
Figure 21 – DC Bias Injector connections to the Bode100 and Component 2 board
Data to Record Open the Bode file below to begin making the component impedance measurement:
Diode Z (25V Bias).Bode
References 36
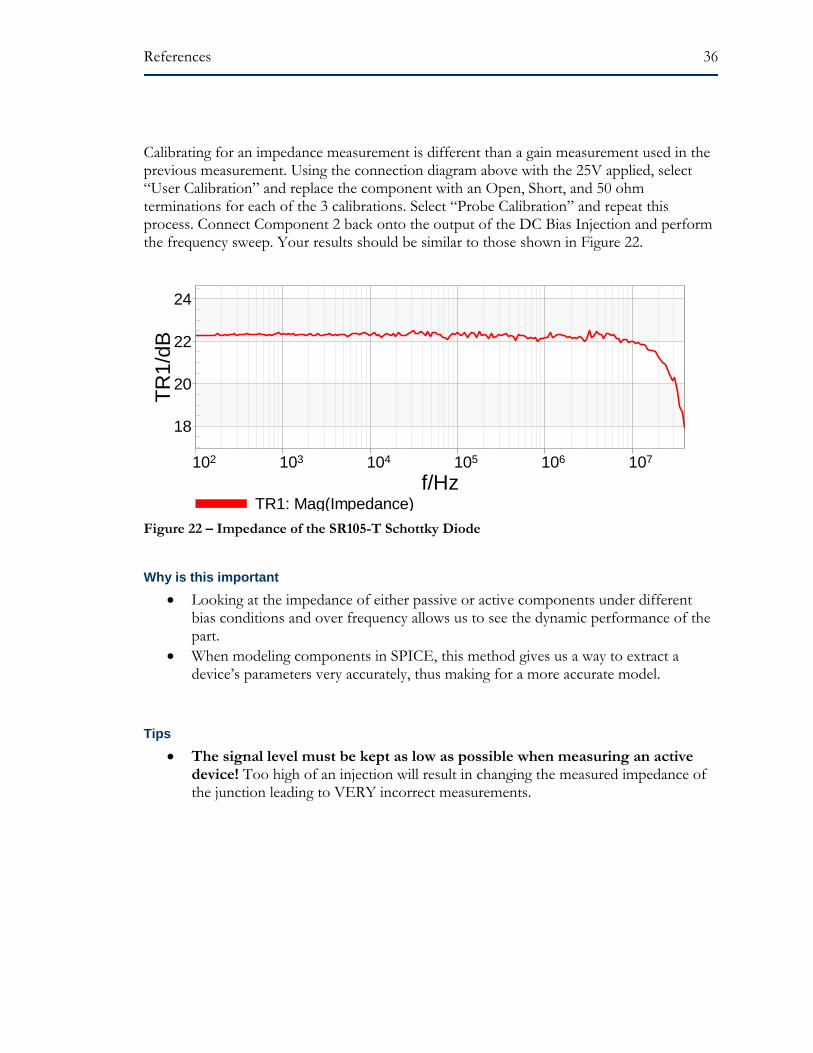
Calibrating for an impedance measurement is different than a gain measurement used in the previous measurement. Using the connection diagram above with the 25V applied, select “User Calibration” and replace the component with an Open, Short, and 50 ohm terminations for each of the 3 calibrations. Select “Probe Calibration” and repeat this process. Connect Component 2 back onto the output of the DC Bias Injection and perform the frequency sweep. Your results should be similar to those shown in Figure 22.
18
20
22
24
102 103 104 105 106 107
TR1/
dB
f/HzTR1: Mag(Impedance)
Figure 22 – Impedance of the SR105-T Schottky Diode
Why is this important • Looking at the impedance of either passive or active components under different
bias conditions and over frequency allows us to see the dynamic performance of the part.
• When modeling components in SPICE, this method gives us a way to extract a device’s parameters very accurately, thus making for a more accurate model.
Tips • The signal level must be kept as low as possible when measuring an active
device! Too high of an injection will result in changing the measured impedance of the junction leading to VERY incorrect measurements.
References 37
Chapter 3 - References
General 1. “Switchmode Power Supply Simulation with PSpice and SPICE 3”, by Steven M.
Sandler, McGraw-Hill Professional; 1 edition (2006), ISBN: 0071463267 2. “Switch-Mode Power Supply SPICE Cookbook”, by Christophe P. Basso, McGraw-Hill
Professional; 1 edition (March 19, 2001), ISBN: 0071375090 3. “Power Specialist's App Note Book, Papers on Simulation, Modeling and More”, Edited
by Charles Hymowitz, http://www.intusoft.com/lit/psbook.zip 4. “Inline equations offer hysteresis switch in PSpice”, Christophe Basso, On
Semiconductor, EDN, August 16, 2001 5. “SPICE Circuit Handbook”, by Steven M. Sandler and Charles E. Hymowitz, McGraw-
Hill Professional; 1 edition (2006), ISBN: 0071468579