Embed Size (px)
Citation preview

Volume 10 No. 11 November 2010
4320
IONOMIC VARIATION CHARACTERIZATION IN AFRICAN LEAFY VEGETABLES FOR MICRONUTRIENTS USING XRF AND HPLC
Akundabweni LSM*1, Mulokozi G2 and DM Maina3
Levi Akundabweni
*Corresponding author email: [email protected] or [email protected] 1Department of Plant Science & Crop Protection, University of Nairobi, P.O. Box 30197-0100 Nairobi, Kenya. 2Tanzania Food and Nutrition Centre, 22 Ocean Road P.O. Box 977 Dares Salaam, Tanzania. 3Institute of Nuclear Science and Technology, University of Nairobi, P.O. Box 30197- 00100 Nairobi, Kenya.
Volume 10 No. 11 November 2010
4321
ABSTRACT Beside the phytochemical, ionomic fingerprinting represents the inorganic trace element composition of the cellular and organismal component. High-throughput elemental analysis technologies, such as X-Ray Fluorescence (XRF), are applied to ionomic analysis whereas phyto-chemical analyses tend to be in vitro. Both could contribute to: (a) insights on ionome-phytochem micronutrient composition; (b) genetic diversity variant discrimination among accessions to allow simple grouping; (c) core and/or reserve collections rationalization; (d) integration of bioinformatic and genetic tools; and (e) micronutrient-dense varietal improvement and/or cropping decisions. First, variant discrimination was appraised on individual element criterion (e.g. K or Ca or Fe or Zn). Second, on a multiple element (K & Ca & Fe & Zn) condition upon which nutrahealth-implied ionomic variant conditions were rationalized as: (a) Core ‘exceptional’ grade collections scored between E8 and E10; (b) Core ‘Medium’ grades (M5-M7); and (c) ‘Least’ exceptional (Ll-L4) scored and regarded as reserve collections. Objectives were to: (1) Investigate a phyotchem background among the selected African Leafy Vegetables (ALVs) for coupling with ionome grading; (2) Assess variation among accessions based on single element criterion; (3) Characterize cumulative nutrahealth-implied ionomic variation among ALVs. Eleven ALV accessions were raised from seed at the University of Nairobi Greenhouse (2006) and leafy parts harvested. XRF was carried out at the Institute of Nuclear Science and Technology, University of Nairobi. High Performance Liquid Chromatographic (HPLC) analyses were done at the Tanzania Food and Nutritional Centre. Highly significant density variation (p< 0.001) among accessions due to Lutein and β-carotene suggested the phytochem effectiveness for variant discrimination accounting for 0.79 and 0.87 of (R2) variation. The single element K discriminator basis was highly significant (p<.001) relative to the other elements but shyly corrected with only Fe. Latter’s discrimination activity, however, correlated with 3 elements as thus: Mn’s (r=0.64; p< .001); Ca’s (r=0.51; p< .003); and leaf K’s (r= 0.35 at p< 0.05). Leaf Ca’s also correlated with three: with Mn’s (0.52; p< .003); Fe’s (already shown); and Zn (r=.39; p<.03). Data suggest that ionomic variation discriminator ability on Fe & Ca single element selection basis may ‘walk’ with others. Conclusions are: (1) that for primary data mining, XRF can be utilized as the first course of action for large-sized ionomic screening which can be rationalized into Core and Reserve collections to precede phytochem screening for utilization and/or conservation. Key Words: Nutrition, Carotenoids, Micronutrients, XRF, HPLC
Volume 10 No. 11 November 2010
4322
INTRODUCTION Plants have developed mechanisms to adapt to their environment, including adaptation to the soil mineral nutrient composition of which variants are referred to as ionomes. An ionome is generally defined as the mineral nutrient and trace element unit varying in composition as represented in the inorganic component of the cellular and organismal system [1]. Among ionomes, retrospective phyto-diversity variation can be indicated by simultaneous quantitative measurement. Such variation is due to changes in composition in response to physiological stimuli, developmental state and genetic modifications. Nutrahealth-implied Ionomic Variation screening/characterization has a potential to contribute to the emerging area of ionomics. The latter is a genomic strategy designed to rapidly identify the genes and gene networks involved in regulating how plants acquire and accumulate mineral nutrients from the soil [1, 2, 3]. Ionomic data are based on the application of high-throughput elemental analysis technologies such as the Energy dispersive X-ray Fluorescence analysis (EDXRF). The technology is based on the fact that all elements emit characteristic radiation when subjected to appropriate radiation. In this technique, a source of energy, referred to as primary radiation, is used to cause ejection of an electron from the inner shells of an atom. This induces instability in the atom’s electronic structure. To resume stability, an electron transits from a higher energy level and fills the created vacancy. This is accompanied by an emission of x-ray photons referred to as secondary radiation. Since each element has a unique electronic configuration, the emitted x-ray radiation will be characteristic of that element. The elements in the sample can therefore be identified by their spectral energies. The methodology for sample preparation is physical and it has the advantage of being simple and non-destructive in contrast to chemical methods [4]. In principle, it is possible to analyse many solid, liquid, biological and aerosol samples for the simultaneous generation of multi-elements. In the first instance, data obtained as thus can be translated into individual elemental densities upon which variants of K or Ca or Fe or Zn or Fe among others can be elemental-level discriminated. In the second instance, a multi-element value can be developed as an indicator of nutrahealth implied ionomic variation. A low level of Nutrahealth-implied Ionomic Variation sufficiency bears directly on mineral micronutrient (MMN) part of hidden hunger just as is the organo-micronutrient (OMN) malnutrition involving phytochemical carotenoids and vitamins. Problems of hidden hunger due to the combined MMN and OMN deficiencies include high incidence of illness and disability, reduced learning ability and productivity. These problems are occurring on a large scale in sub-Saharan Africa and elsewhere due to poverty, lack of access to a variety of foods, disease, and poor dietary and care practices. Malnutrition normally comes with high social and public costs, reduced work capacity in populations and tragic loss of human potential [5, 6, 7]. Whereas significant attention elsewhere has focused on micronutrient density in the agronomically classified wheat, maize, rice, cassava and beans as major crops, the
Volume 10 No. 11 November 2010
4323
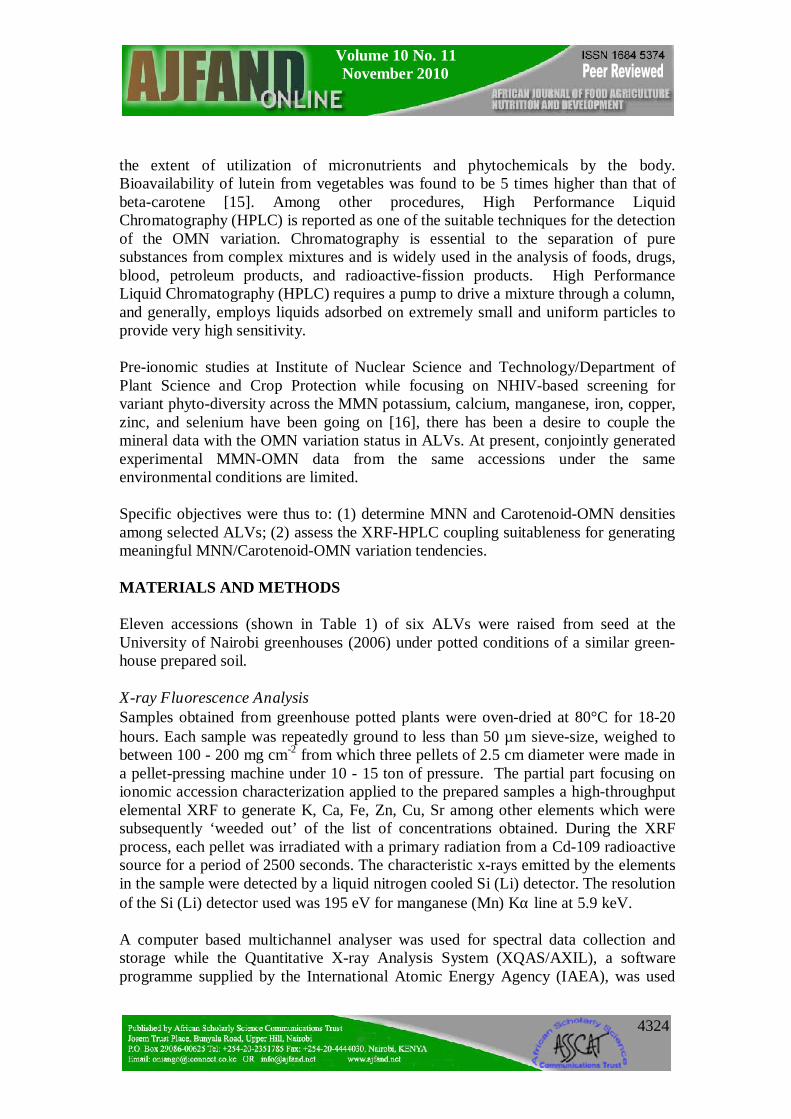
African leafy vegetable crops considered only as minor have yet been comprehensively investigated. In the major crops therefore, data on iron, zinc, iodine ( MMN) are generally available [8]. However, the staple cereal food support that is provided by the ALV accompaniments (reportedly high in invaluable OMNs) are little known. For instance, naturally extracted lutein (Figure 1) from many of the indigenous African fruits and leafy vegetables are said to possess high organo-nutrient value that, among things, is related to ophthalmological health [9, 10, 11].
Lutein
Beta carotene
Figure 1: Chemical Structure of Lutein and Beta Carotene
Lutein and zeaxanthin are associated with chloroplasts or chromoplasts in plants. Their main function is the protection of these organisms against the toxic effects of ultra-violet radiation and oxygen. The carotenoids also appear to protect humans against phototoxic damage. Lutein and zeaxanthin, for example, are found in the macula of the human retina, as well as the human crystalline lens [12, 13]. In addition, they are thought to play a role in protection against age-related macular degeneration and age-related cataract formation. Ophthalmoprotectivity conferred is due in part, to the reactive oxygen species quenching ability of these carotenoids. Dietary intake of lutein of 6.9 - 11.7 milligrams daily has been associated with a decreased risk of age-related macular degeneration [14]. In animals, some of the carotenoids form vitamin A. Food sources of lutein and zeaxanthin include maize, egg yolks and green vegetables and fruits, such as broccoli, green beans, green peas, brussel sprouts, cabbage, kale (popularly known as sukuma wiki in Kiswahili), collard greens, spinach, lettuce, kiwi and honeydew. Lutein and zeaxanthin are also found in nettles, algae and the petals of many yellow flowers. Bioavailability is a major consideration to the absorption and
Volume 10 No. 11 November 2010
4324
the extent of utilization of micronutrients and phytochemicals by the body. Bioavailability of lutein from vegetables was found to be 5 times higher than that of beta-carotene [15]. Among other procedures, High Performance Liquid Chromatography (HPLC) is reported as one of the suitable techniques for the detection of the OMN variation. Chromatography is essential to the separation of pure substances from complex mixtures and is widely used in the analysis of foods, drugs, blood, petroleum products, and radioactive-fission products. High Performance Liquid Chromatography (HPLC) requires a pump to drive a mixture through a column, and generally, employs liquids adsorbed on extremely small and uniform particles to provide very high sensitivity. Pre-ionomic studies at Institute of Nuclear Science and Technology/Department of Plant Science and Crop Protection while focusing on NHIV-based screening for variant phyto-diversity across the MMN potassium, calcium, manganese, iron, copper, zinc, and selenium have been going on [16], there has been a desire to couple the mineral data with the OMN variation status in ALVs. At present, conjointly generated experimental MMN-OMN data from the same accessions under the same environmental conditions are limited. Specific objectives were thus to: (1) determine MNN and Carotenoid-OMN densities among selected ALVs; (2) assess the XRF-HPLC coupling suitableness for generating meaningful MNN/Carotenoid-OMN variation tendencies. MATERIALS AND METHODS Eleven accessions (shown in Table 1) of six ALVs were raised from seed at the University of Nairobi greenhouses (2006) under potted conditions of a similar green-house prepared soil. X-ray Fluorescence Analysis Samples obtained from greenhouse potted plants were oven-dried at 80°C for 18-20 hours. Each sample was repeatedly ground to less than 50 µm sieve-size, weighed to between 100 - 200 mg cm-2 from which three pellets of 2.5 cm diameter were made in a pellet-pressing machine under 10 - 15 ton of pressure. The partial part focusing on ionomic accession characterization applied to the prepared samples a high-throughput elemental XRF to generate K, Ca, Fe, Zn, Cu, Sr among other elements which were subsequently ‘weeded out’ of the list of concentrations obtained. During the XRF process, each pellet was irradiated with a primary radiation from a Cd-109 radioactive source for a period of 2500 seconds. The characteristic x-rays emitted by the elements in the sample were detected by a liquid nitrogen cooled Si (Li) detector. The resolution of the Si (Li) detector used was 195 eV for manganese (Mn) Kα line at 5.9 keV. A computer based multichannel analyser was used for spectral data collection and storage while the Quantitative X-ray Analysis System (XQAS/AXIL), a software programme supplied by the International Atomic Energy Agency (IAEA), was used
Volume 10 No. 11 November 2010
4325
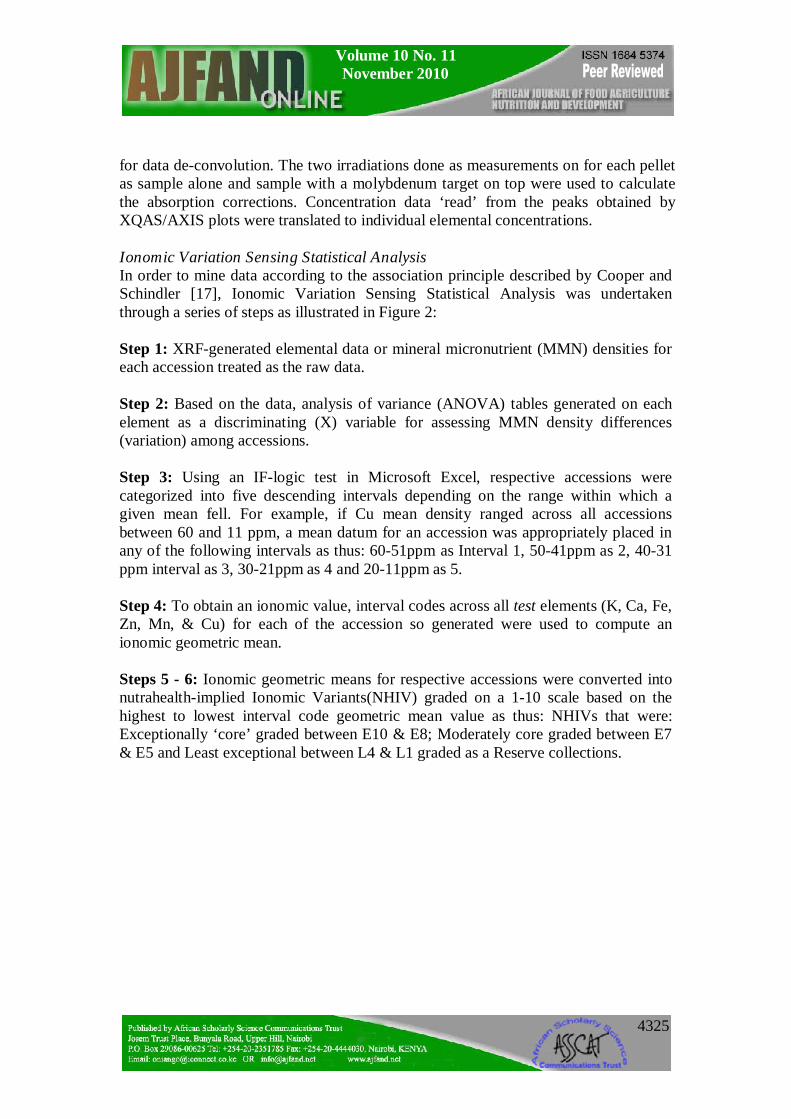
for data de-convolution. The two irradiations done as measurements on for each pellet as sample alone and sample with a molybdenum target on top were used to calculate the absorption corrections. Concentration data ‘read’ from the peaks obtained by XQAS/AXIS plots were translated to individual elemental concentrations. Ionomic Variation Sensing Statistical Analysis In order to mine data according to the association principle described by Cooper and Schindler [17], Ionomic Variation Sensing Statistical Analysis was undertaken through a series of steps as illustrated in Figure 2: Step 1: XRF-generated elemental data or mineral micronutrient (MMN) densities for each accession treated as the raw data. Step 2: Based on the data, analysis of variance (ANOVA) tables generated on each element as a discriminating (X) variable for assessing MMN density differences (variation) among accessions. Step 3: Using an IF-logic test in Microsoft Excel, respective accessions were categorized into five descending intervals depending on the range within which a given mean fell. For example, if Cu mean density ranged across all accessions between 60 and 11 ppm, a mean datum for an accession was appropriately placed in any of the following intervals as thus: 60-51ppm as Interval 1, 50-41ppm as 2, 40-31 ppm interval as 3, 30-21ppm as 4 and 20-11ppm as 5. Step 4: To obtain an ionomic value, interval codes across all test elements (K, Ca, Fe, Zn, Mn, & Cu) for each of the accession so generated were used to compute an ionomic geometric mean. Steps 5 - 6: Ionomic geometric means for respective accessions were converted into nutrahealth-implied Ionomic Variants(NHIV) graded on a 1-10 scale based on the highest to lowest interval code geometric mean value as thus: NHIVs that were: Exceptionally ‘core’ graded between E10 & E8; Moderately core graded between E7 & E5 and Least exceptional between L4 & L1 graded as a Reserve collections.
Volume 10 No. 11 November 2010
4326
Figure 2: Building a Step 2 and Step 6 Case Study for Data Mining and Capture
of Differences (variation) in Mineral Micronutrient (MMN) Condition among Accessions for Nutrahealth-implied Ionomic Variant (NHIV)
Characterization. (The theoretical eight characterized Ionomic Accessions represented by the horizontal ‘benches’ are shown by light blue colour)
HPLC Analysis For the determination of lutein and β-carotene, the remaining potted plants were transported from University of Nairobi Kabete greenhouse to KARI-Katumani laboratory for further harvest of leaf samples which were subsequently lyophilized and temporarily stored under -1800C, packed in dry ice, and air-freighted to TFNC laboratory in Dares Salaam for HPLC analyses. On arrival to Tanzania, samples were immediately courier –dispatched to the TFNC laboratory while still frozen. A mixed standard solution for construction of a standard curve for all- trans beta-carotene analyses was prepared as follows: A stock β-carotene solution with concentration of about 200 µg/ml was prepared by weighing 10 mg of all-trans β-carotene, transferring into a 50 mL volumetric flask and adding petroleum ether to a 50 ml mark after adding 0.1% of butylated hydroxytoluene (BHT). Two (2) ml of stock solution was transferred to 50 mL volumetric flask and the volume adjusted to 50 mL with petroleum ether to make a working standard with concentration of about 9.45µg/ml. The concentration of working standard solution was confirmed using a spectrophotometer and the extinction (absorption) coefficient value for β-carotene in
Volume 10 No. 11 November 2010
4327
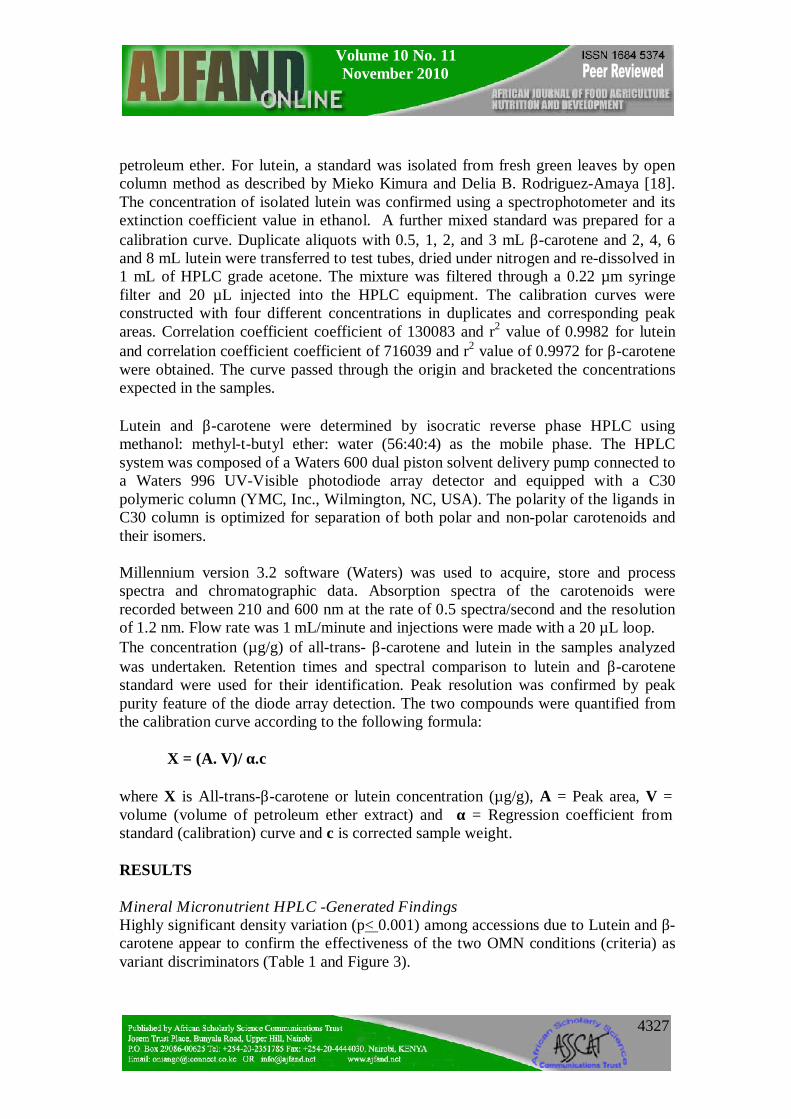
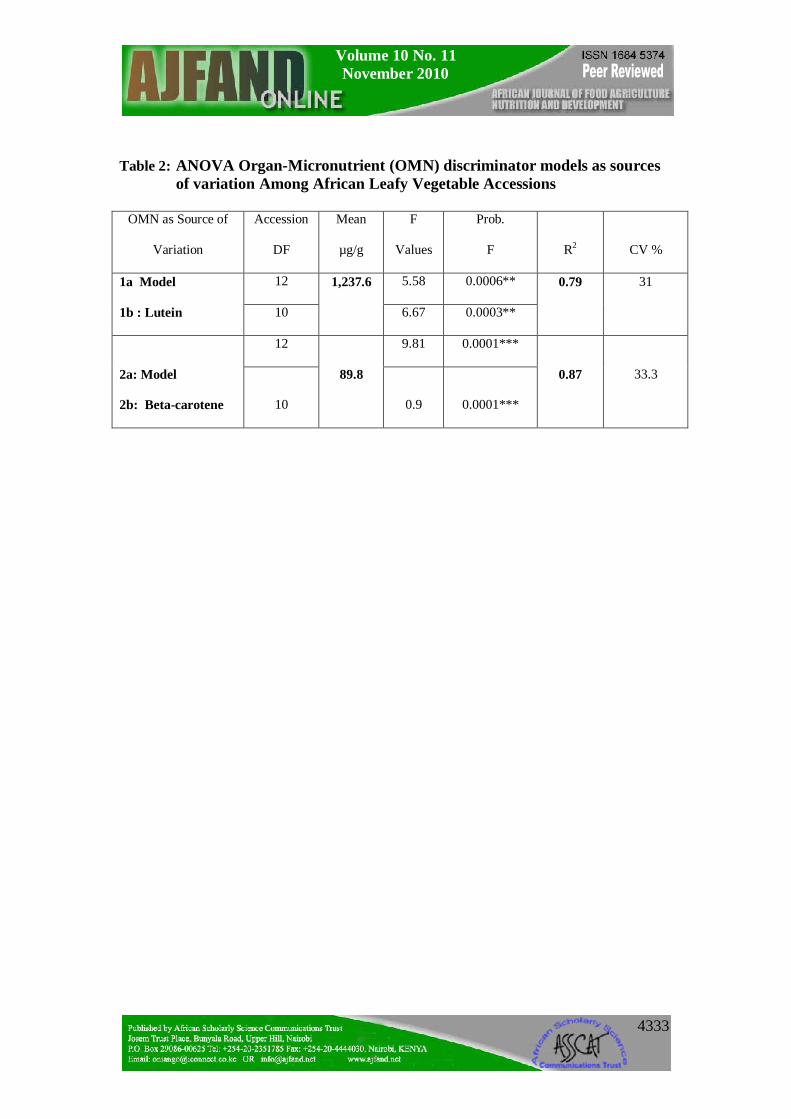
petroleum ether. For lutein, a standard was isolated from fresh green leaves by open column method as described by Mieko Kimura and Delia B. Rodriguez-Amaya [18]. The concentration of isolated lutein was confirmed using a spectrophotometer and its extinction coefficient value in ethanol. A further mixed standard was prepared for a calibration curve. Duplicate aliquots with 0.5, 1, 2, and 3 mL β-carotene and 2, 4, 6 and 8 mL lutein were transferred to test tubes, dried under nitrogen and re-dissolved in 1 mL of HPLC grade acetone. The mixture was filtered through a 0.22 µm syringe filter and 20 µL injected into the HPLC equipment. The calibration curves were constructed with four different concentrations in duplicates and corresponding peak areas. Correlation coefficient coefficient of 130083 and r2 value of 0.9982 for lutein and correlation coefficient coefficient of 716039 and r2 value of 0.9972 for β-carotene were obtained. The curve passed through the origin and bracketed the concentrations expected in the samples. Lutein and β-carotene were determined by isocratic reverse phase HPLC using methanol: methyl-t-butyl ether: water (56:40:4) as the mobile phase. The HPLC system was composed of a Waters 600 dual piston solvent delivery pump connected to a Waters 996 UV-Visible photodiode array detector and equipped with a C30 polymeric column (YMC, Inc., Wilmington, NC, USA). The polarity of the ligands in C30 column is optimized for separation of both polar and non-polar carotenoids and their isomers. Millennium version 3.2 software (Waters) was used to acquire, store and process spectra and chromatographic data. Absorption spectra of the carotenoids were recorded between 210 and 600 nm at the rate of 0.5 spectra/second and the resolution of 1.2 nm. Flow rate was 1 mL/minute and injections were made with a 20 µL loop. The concentration (µg/g) of all-trans- β-carotene and lutein in the samples analyzed was undertaken. Retention times and spectral comparison to lutein and β-carotene standard were used for their identification. Peak resolution was confirmed by peak purity feature of the diode array detection. The two compounds were quantified from the calibration curve according to the following formula: X = (A. V)/ α.c where X is All-trans-β-carotene or lutein concentration (µg/g), A = Peak area, V = volume (volume of petroleum ether extract) and α = Regression coefficient from standard (calibration) curve and c is corrected sample weight. RESULTS Mineral Micronutrient HPLC -Generated Findings Highly significant density variation (p< 0.001) among accessions due to Lutein and β-carotene appear to confirm the effectiveness of the two OMN conditions (criteria) as variant discriminators (Table 1 and Figure 3).
Volume 10 No. 11 November 2010
4328
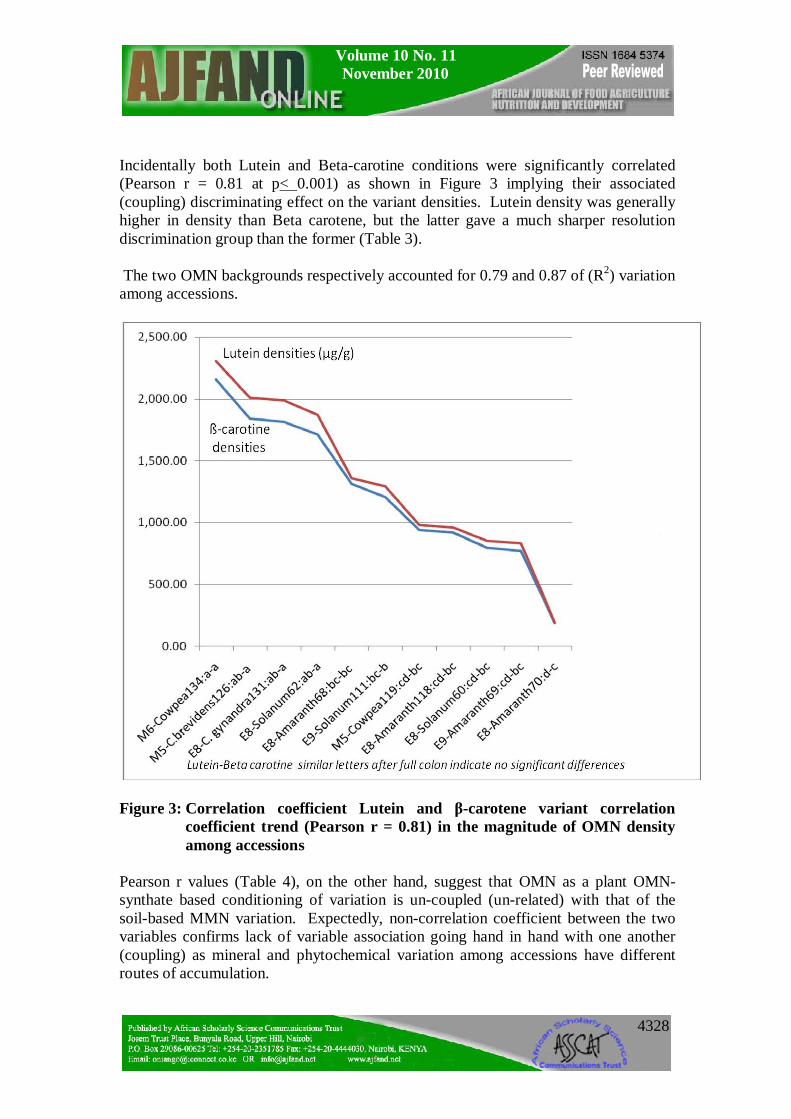
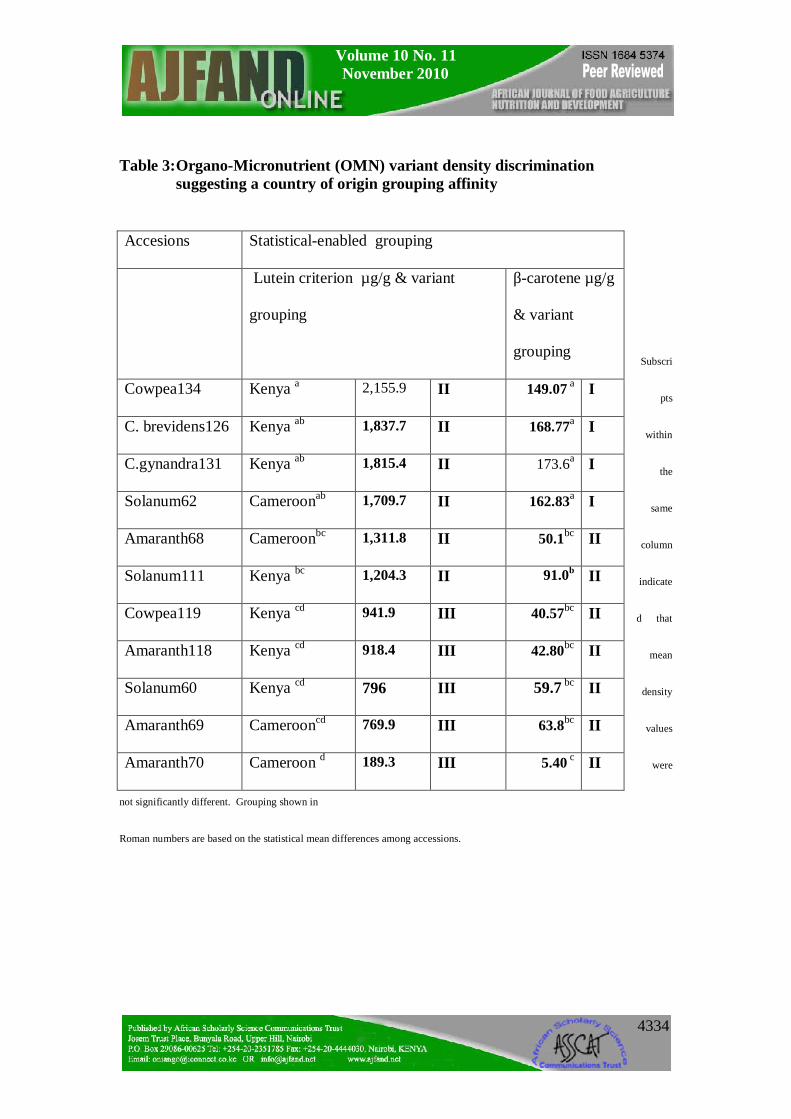
Incidentally both Lutein and Beta-carotine conditions were significantly correlated (Pearson r = 0.81 at p< 0.001) as shown in Figure 3 implying their associated (coupling) discriminating effect on the variant densities. Lutein density was generally higher in density than Beta carotene, but the latter gave a much sharper resolution discrimination group than the former (Table 3). The two OMN backgrounds respectively accounted for 0.79 and 0.87 of (R2) variation among accessions.
Figure 3: Correlation coefficient Lutein and β-carotene variant correlation coefficient trend (Pearson r = 0.81) in the magnitude of OMN density among accessions
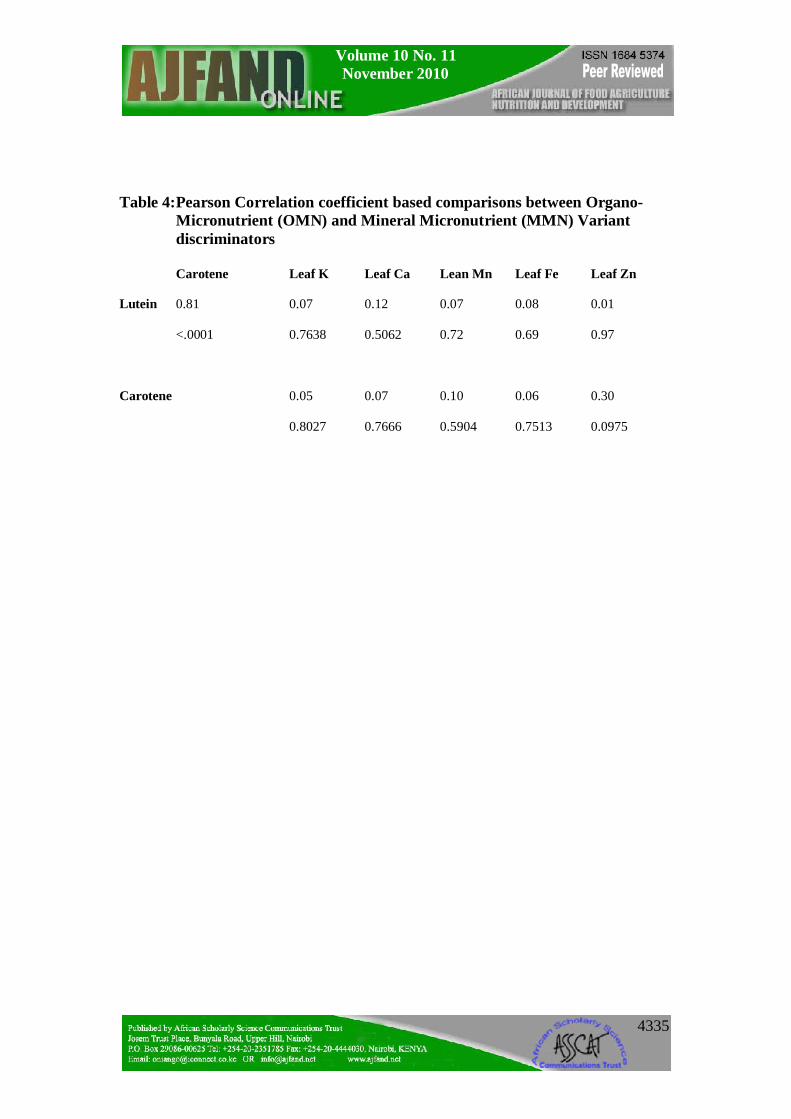
Pearson r values (Table 4), on the other hand, suggest that OMN as a plant OMN- synthate based conditioning of variation is un-coupled (un-related) with that of the soil-based MMN variation. Expectedly, non-correlation coefficient between the two variables confirms lack of variable association going hand in hand with one another (coupling) as mineral and phytochemical variation among accessions have different routes of accumulation.
Volume 10 No. 11 November 2010
4329
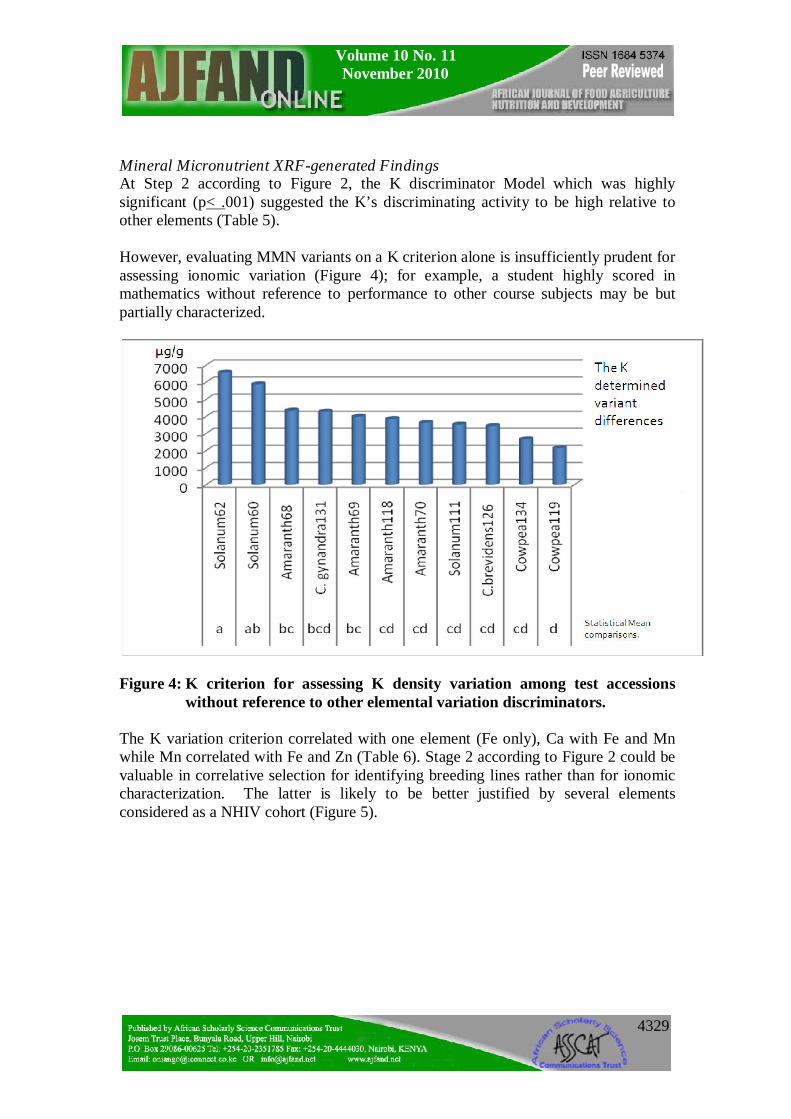
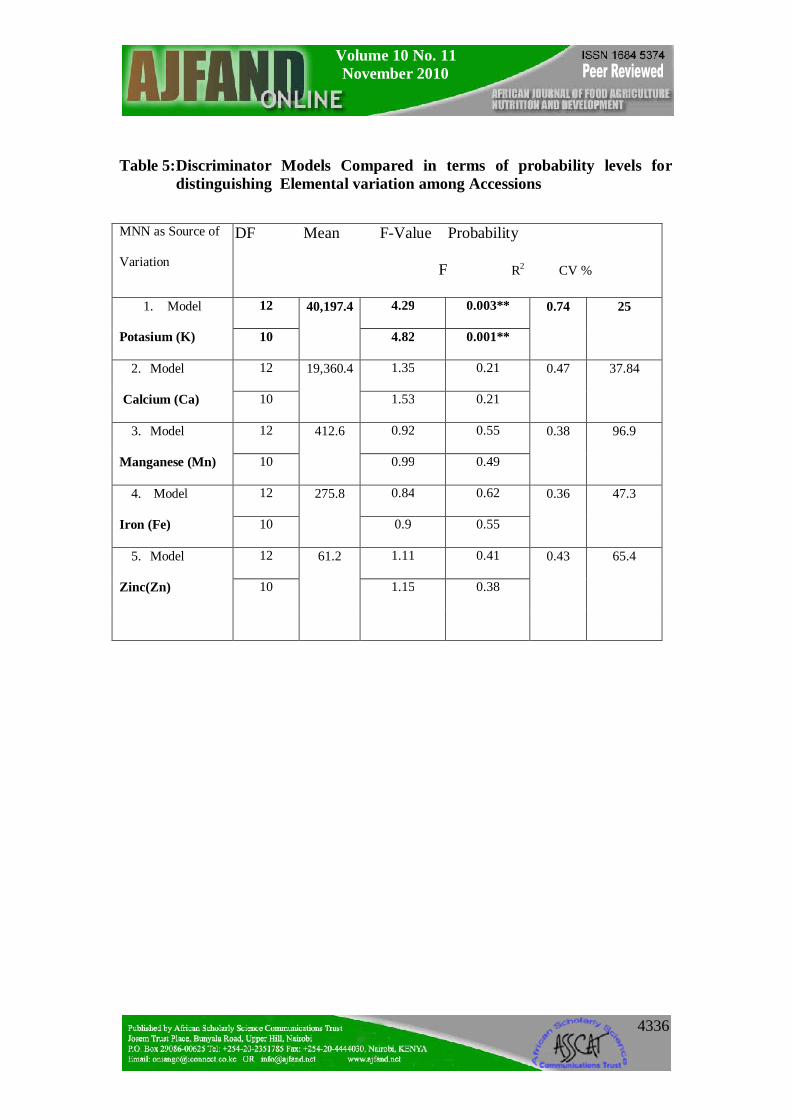
Mineral Micronutrient XRF-generated Findings At Step 2 according to Figure 2, the K discriminator Model which was highly significant (p< .001) suggested the K’s discriminating activity to be high relative to other elements (Table 5). However, evaluating MMN variants on a K criterion alone is insufficiently prudent for assessing ionomic variation (Figure 4); for example, a student highly scored in mathematics without reference to performance to other course subjects may be but partially characterized.
Figure 4: K criterion for assessing K density variation among test accessions without reference to other elemental variation discriminators.
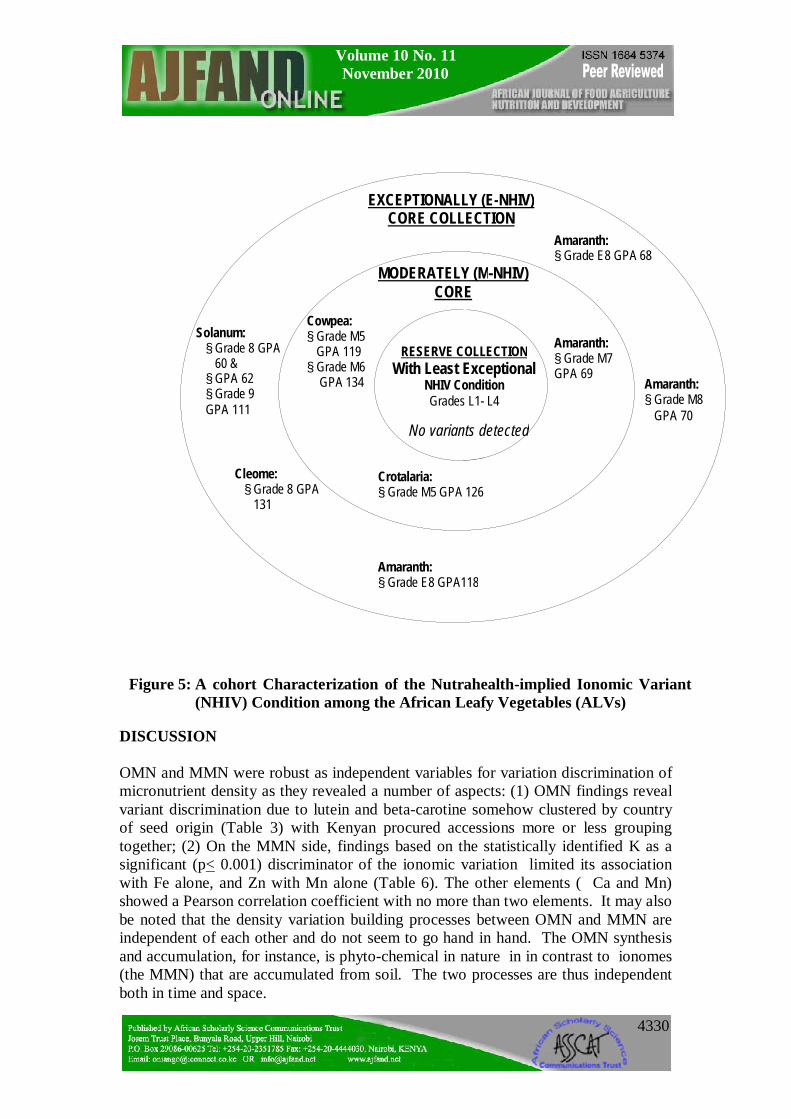
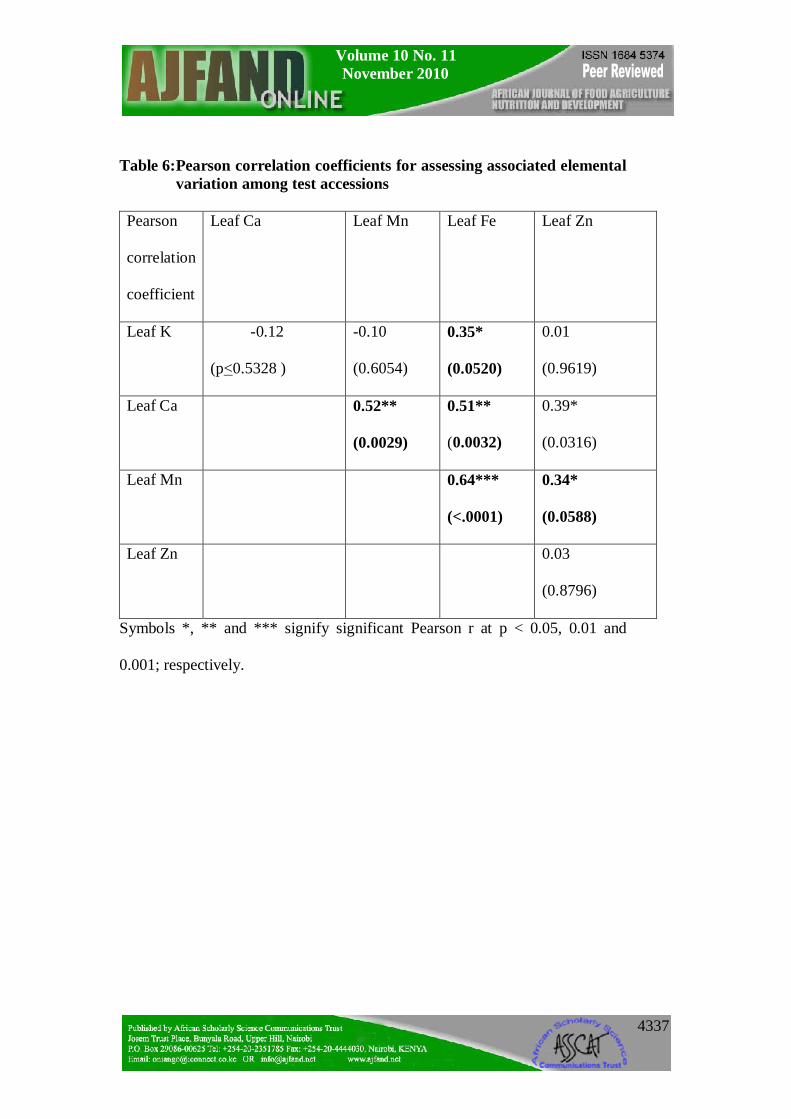
The K variation criterion correlated with one element (Fe only), Ca with Fe and Mn while Mn correlated with Fe and Zn (Table 6). Stage 2 according to Figure 2 could be valuable in correlative selection for identifying breeding lines rather than for ionomic characterization. The latter is likely to be better justified by several elements considered as a NHIV cohort (Figure 5).
Volume 10 No. 11 November 2010
4330
Figure 5: A cohort Characterization of the Nutrahealth-implied Ionomic Variant
(NHIV) Condition among the African Leafy Vegetables (ALVs)
DISCUSSION OMN and MMN were robust as independent variables for variation discrimination of micronutrient density as they revealed a number of aspects: (1) OMN findings reveal variant discrimination due to lutein and beta-carotine somehow clustered by country of seed origin (Table 3) with Kenyan procured accessions more or less grouping together; (2) On the MMN side, findings based on the statistically identified K as a significant (p< 0.001) discriminator of the ionomic variation limited its association with Fe alone, and Zn with Mn alone (Table 6). The other elements ( Ca and Mn) showed a Pearson correlation coefficient with no more than two elements. It may also be noted that the density variation building processes between OMN and MMN are independent of each other and do not seem to go hand in hand. The OMN synthesis and accumulation, for instance, is phyto-chemical in nature in in contrast to ionomes (the MMN) that are accumulated from soil. The two processes are thus independent both in time and space.
RESERVE COLLECTION
With Least Exceptional NHIV Condition Grades L1- L4
No variants detected
MODERATELY (M-NHIV) CORE
Solanum: § Grade 8 GPA
60 & § GPA 62 § Grade 9 GPA 111
Cowpea: § Grade M5
GPA 119 § Grade M6
GPA 134
Crotalaria: § Grade M5 GPA 126
Cleome: § Grade 8 GPA
131
Amaranth: § Grade E8 GPA118
Amaranth: § Grade M7 GPA 69
Amaranth: § Grade M8
GPA 70
Amaranth: § Grade E8 GPA 68
EXCEPTIONALLY (E-NHIV) CORE COLLECTION
Volume 10 No. 11 November 2010
4331
Data shows that the individual elements in their own right, as demonstrated by the XRF densities are effective in discriminating the respective variations among accessions (variants). In cases where the motive of using an analytical technique is to emphasize a single element identification or selection, the association as brought out by Pearson correlation coefficient may be limited to one or two elements. The XRF is a high throughput technique in generating several elements and it offers opportunities for the development of a MMN multi-selection index in which a consideration across several elements can be made. Generating several mineral densities as ionomic variation discriminators in concert gave room to address the concept of Core versus Reserve (NHIV) condition of collections (Figure 5). The value of findings from this study can be concluded as thus: (1) XRF can be be utilized as the first course of action in screening large sized collections as a primary data mining technique [19, 20] for ionomic characterization of ALVs. Once the numbers are NHIV-rationalized into Core and reserve Collection corridors, utilization cum conservation priorities may be made. CONCLUSIONS The findings suggest that in the ALV micronutrient density variation work, the first course of action should focus on ionomic characterization as that can be accomplished through XRF application that offers high-throughput elemental analysis more rapidly, comprehensively, in large numbers and cheaply. Once the NHIV collections are grouped into Core and/or Reserve, germplasm use and conservation efforts can easily be prioritized accordingly. ACKNOWLEDGEMENTS We are grateful to Professor Tim Johns and Mr Patrick Maundu for facilitating the joint arrangement of analyses at both Tanzania Food and Nutritional Centre (TFNC) and University of Nairobi XRF laboratories. Mr. S. Bartilol’s active role in the XRF analysis at the Institute of Nuclear Science and Technology – University of Nairobi is acknowledged. We are grateful for further roles played by the following: Dr. Ndossi, Mr. Stewart Mwanyika and Mr. Amri Juma at TFNC. We thank the Rural Outreach Programme (ROP) for supply of some of the Kenyan germplasm.
Volume 10 No. 11 November 2010
4332
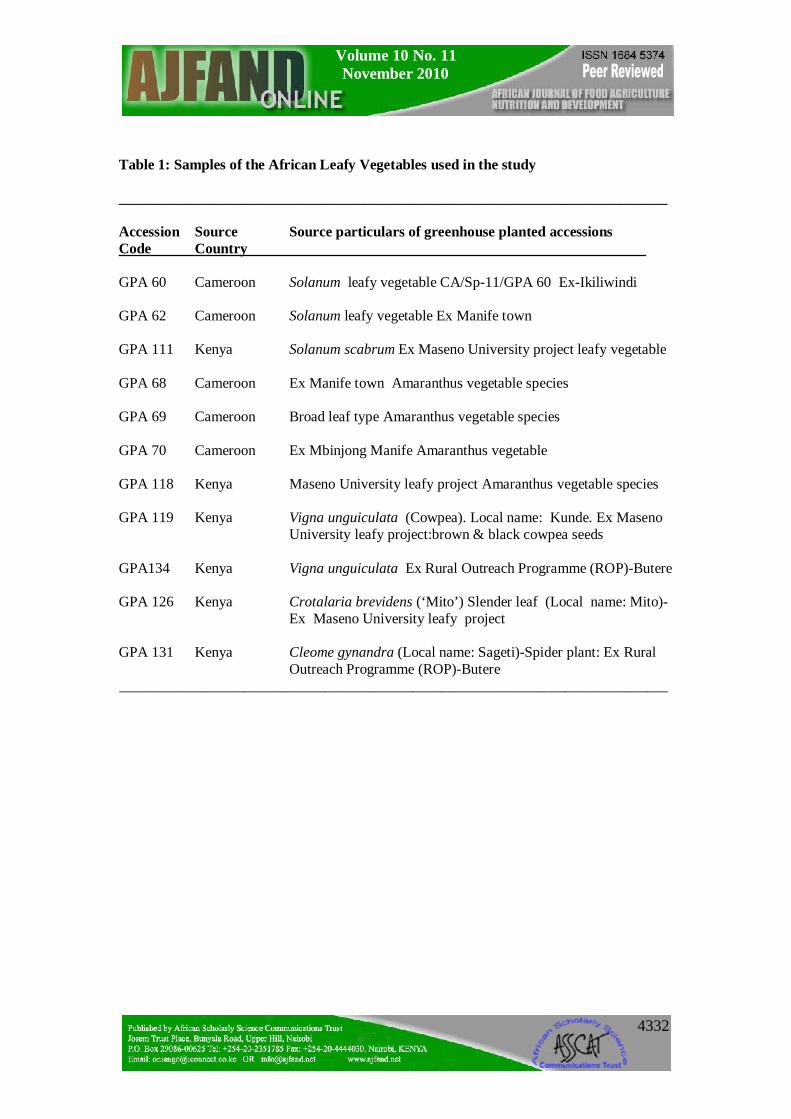
Table 1: Samples of the African Leafy Vegetables used in the study
___________________________________________________________________________
Accession Source Source particulars of greenhouse planted accessions Code Country
GPA 60 Cameroon Solanum leafy vegetable CA/Sp-11/GPA 60 Ex-Ikiliwindi
GPA 62 Cameroon Solanum leafy vegetable Ex Manife town
GPA 111 Kenya Solanum scabrum Ex Maseno University project leafy vegetable
GPA 68 Cameroon Ex Manife town Amaranthus vegetable species
GPA 69 Cameroon Broad leaf type Amaranthus vegetable species
GPA 70 Cameroon Ex Mbinjong Manife Amaranthus vegetable
GPA 118 Kenya Maseno University leafy project Amaranthus vegetable species
GPA 119 Kenya Vigna unguiculata (Cowpea). Local name: Kunde. Ex Maseno University leafy project:brown & black cowpea seeds
GPA134 Kenya Vigna unguiculata Ex Rural Outreach Programme (ROP)-Butere
GPA 126 Kenya Crotalaria brevidens (‘Mito’) Slender leaf (Local name: Mito)- Ex Maseno University leafy project
GPA 131 Kenya Cleome gynandra (Local name: Sageti)-Spider plant: Ex Rural Outreach Programme (ROP)-Butere ___________________________________________________________________________
Volume 10 No. 11 November 2010
4333
Table 2: ANOVA Organ-Micronutrient (OMN) discriminator models as sources of variation Among African Leafy Vegetable Accessions
OMN as Source of
Variation
Accession
DF
Mean
µg/g
F
Values
Prob.
F R2 CV %
1a Model
1b : Lutein
12 1,237.6
5.58 0.0006** 0.79
31
10 6.67 0.0003**
2a: Model
2b: Beta-carotene
12
89.8
9.81 0.0001***
0.87
33.3
10 0.9 0.0001***
Volume 10 No. 11 November 2010
4334
Table 3: Organo-Micronutrient (OMN) variant density discrimination suggesting a country of origin grouping affinity
Subscri
pts
within
the
same
column
indicate
d that
mean
density
values
were
not significantly different. Grouping shown in
Roman numbers are based on the statistical mean differences among accessions.
Accesions Statistical-enabled grouping
Lutein criterion µg/g & variant
grouping
β-carotene µg/g
& variant
grouping
Cowpea134 Kenya a 2,155.9 II 149.07 a I
C. brevidens126 Kenya ab 1,837.7 II 168.77a I
C.gynandra131 Kenya ab 1,815.4 II 173.6a I
Solanum62 Cameroonab 1,709.7 II 162.83a I
Amaranth68 Cameroonbc 1,311.8 II 50.1bc II
Solanum111 Kenya bc 1,204.3 II 91.0b II
Cowpea119 Kenya cd 941.9 III 40.57bc II
Amaranth118 Kenya cd 918.4 III 42.80bc II
Solanum60 Kenya cd 796 III 59.7 bc II
Amaranth69 Camerooncd 769.9 III 63.8bc II
Amaranth70 Cameroon d 189.3 III 5.40 c II
Volume 10 No. 11 November 2010
4335
Table 4: Pearson Correlation coefficient based comparisons between Organo-Micronutrient (OMN) and Mineral Micronutrient (MMN) Variant discriminators
Carotene Leaf K Leaf Ca Lean Mn Leaf Fe Leaf Zn
Lutein 0.81 0.07 0.12 0.07 0.08 0.01
<.0001 0.7638 0.5062 0.72 0.69 0.97
Carotene 0.05 0.07 0.10 0.06 0.30
0.8027 0.7666 0.5904 0.7513 0.0975
Volume 10 No. 11 November 2010
4336
Table 5: Discriminator Models Compared in terms of probability levels for distinguishing Elemental variation among Accessions
MNN as Source of
Variation
DF Mean F-Value Probability
F R2 CV %
1. Model
Potasium (K)
12 40,197.4
4.29 0.003** 0.74
25
10 4.82 0.001**
2. Model
Calcium (Ca)
12 19,360.4
1.35 0.21 0.47
37.84
10 1.53 0.21
3. Model
Manganese (Mn)
12 412.6
0.92 0.55 0.38
96.9
10 0.99 0.49
4. Model
Iron (Fe)
12 275.8
0.84 0.62 0.36
47.3
10 0.9 0.55
5. Model
Zinc(Zn)
12 61.2
1.11 0.41 0.43
65.4
10 1.15 0.38
Volume 10 No. 11 November 2010
4337
Table 6: Pearson correlation coefficients for assessing associated elemental variation among test accessions
Pearson
correlation
coefficient
Leaf Ca Leaf Mn Leaf Fe Leaf Zn
Leaf K -0.12
(p<0.5328 )
-0.10
(0.6054)
0.35*
(0.0520)
0.01
(0.9619)
Leaf Ca 0.52**
(0.0029)
0.51**
(0.0032)
0.39*
(0.0316)
Leaf Mn 0.64***
(<.0001)
0.34*
(0.0588)
Leaf Zn 0.03
(0.8796)
Symbols *, ** and *** signify significant Pearson r at p < 0.05, 0.01 and
0.001; respectively.
Volume 10 No. 11 November 2010
4338
REFERENCES
1 Lahner B, Gong J, Mahmoudian M, Smith EL, Abid KB, Rogers EE, Guerinot ML, Harper JF, Ward JM, McIntyre L, Schroeder JI and DE Salt Genomic scale profiling of nutrient and trace elements in Arabidopsis thaliana. Nat Biotechnol. 2003; 21: 1215-1221.
2 Harada H and RA Leigh Genetic mapping of natural variation in potassium concentrations in shoots of Arabidopsis thaliana. J Exp Bot.2006; 57: 953–960.
3 Alonso-Blanco C and M Koornneef Naturally occurring variation in Arabidopsis: An under exploited resource for plant genetics. Trends Plant Sci.2000; 5: 22–29.
4 International Atomic Energy Agency Sampling, storage and sample preparation procedures for X-ray fluorescence analysis of environmental materials. IAEA TECH DOC- 950. Vienna, Austria 1997: 5-10.
5 FAO and International Life Science Institute Preventing micronutrient malnutrition: a guide to food-based approaches. A manual for policy makers and programme planners. Washington, DC, USA ILSI Press. 1997.
6 Stein JA and M Qaim The human and economic cost of hidden hunger. Food and Nutrition Bulletin 2007; 28: 125 – 134.
7 Graham RD and RM Welch Breeding for staple-food crops with high micronutrient density: Longterm sustainable agricultural solution to hidden hunger in developing countries. Agricultural strategies for micronutrients. Working Paper 3. Washington D.C. International Food Policy Research Institute. 1996.
8 Grusak MA and M Eduardo The physiology of micronutrients homeostasis in field crops. Field Crops Research 1999; 60: 40 – 65.
9 Bone RA, Landrum JT, Dixon Z, Chen Y and CM Llerena Lutein and zeaxanthin in the eyes, serum and diet of human subjects. Exp Eye Res. 2000; 71: 239 – 245.
10 Bone RA, Landrum JT, Friedes LM and CM Gomez Distribution of lutein and zeaxanthin stereoisomers in the human retinal. Exp Eye Res.1997; 64: 211-218.
11 Hammond BR Jr, Wooten BR and DM Snodderly Density of the human crystalline lens is related to the macular pigment carotenoids, lutein and zeaxanthin. Optom Vis Sci.1997; 74: 499-504.
Volume 10 No. 11 November 2010
4339
12 Brown L, Rimm EB, Seddon JM, Giovanmucci EL, Chasan-Taber L, Spiegelman D, Willett WC and SE Hankinson A prospective study of carotenoid intake and risk of cataract extraction in U.S. men. Am J Clin Nutr. 1999; 70: 517 – 524.
13 Chasan-Taber L, Willett WC, Seddon JM, Stampfer MJ, Rosner B, Colditz GA, Speizer FE and SE Hankinson A prospective study of carotenoid and vitamin A intakes and risk of cataract extraction among U.S. women. American Journal of Epidemiology. 1999; 149: S32.
14 National Academy Press Dietary Reference Intakes for Vitamin C, Vitamin E, Selenium, and Carotenoids. 2000 Washington, DC: National Academy Press 2000: 325-382.
15 van het Hof KH, Brouwer IA, West CE, Haddeman E, Steegers-Theunissen RP and M van Dusseldorp Bioavailability of lutein from vegetables is 5 times higher than that of beta-carotene. Am. J. Clin. Nutr.1999; 70: 261 – 268.
16 Akundabweni LS Micronutrient density characterization in African leafy vegetable species using X-ray fluorescence (XRF) analysis. Report submitted to International Plant Genetic Resources (IPGRI) 2005.
17 Cooper DR and PS Schindler Instruments for participant communication. In: Sources and collection of Data pp 354. Business Research Methods. Tata McGraw-Hill Publishing Co. New Delhi. 2005: 354.
18 Kimura M and DB Rodriguez-Amaya A scheme for obtaining standards and HPLC quantification of leafy vegetable carotenoids. Food Chem. 2002; 78: 389 – 398.
19 Gregorio GB Progress in Breeding for Trace Minerals in Staple Crops. J. Nutr. 2002; 132: 500S - 502S.
20 Frankel OH Genetic perspectives of germplasm conservation. In: Arber W, Llimensee K, Peacock WJP (Eds). Genetic Manipulation: Impact on Man and Society, Starlinger Cambridge University Press, 1984.


![Genome-Wide Association Studies Reveal the Genetic Basis ...LARGE-SCALE BIOLOGY ARTICLE Genome-Wide Association Studies Reveal the Genetic Basis of Ionomic Variation in Rice[OPEN]](https://img.pdfslide.net/doc/110x75/5e5eb5092265ae59ce62c695/genome-wide-association-studies-reveal-the-genetic-basis-large-scale-biology.jpg)