Embed Size (px)
Citation preview
Warping Waldseemuller: A Phenomenological andComputational Study of the 1507 World Map
John W. HesslerGeography and Map Division / Library of Congress / Washington / DC / USA
Abstract
The 1507 World Map by Martin Waldseemuller shows, for the first time, a depiction of the New World as a separatelandmass detached from Asia. This study compares the outline of South Ameriea on the Waldseemuller map using severalrelated computational methods. First, the projection Is analysed, modelled, and compared with the modern outline ofSouth America, which is found to be tantalizingly similar in form and location to the 1507 representation. Second,polynomial warping algorithms of the second order are applied to the world map and spatial interpolations are carried outThe newly produced regression surfaces and curves are analysed for inflection-point behaviour, and global and loealcorrelation coefficients are calculated to give some indication of the geometric similarity between the 1507 and modernforms. The shape and location of the South American continent on the 1507 map is chronometrically problematic,since neither Balboa nor Magellan had reached the Pacific Oeean by this time. The study concludes that, based onthese interpolations, it is probable that Waldseemuller had geographic information that is no longer extant or has yet tobe discovered for his 1507 portrayal of the New World.
Keywords; Waldseemiiller, polvnomial warping, bi-dimensional regression, projection modelling
Resume
La Carte mondiale de 1507 de Martin Waldseemuller a ete la premiere a representer le Nouveau Monde en tant quemasse eontinentale independante, detachee de I'Asie. Dans I'etude, on examine la silhouette de I'Amerique du Sud tellequ'elle apparait sur la carte de Waldseemuller a I'aide de plusieurs methodes informatiques connexes. Premierement,la projection est analysee et modelisee, puis comparee a la silhouette moderne de I'Amerique du Sud, qui est etonnammenttres similaire a la forme et a I'emplaeement de celle illustree sur la carte elaboree en 1507. Deuxiemement, on a appliquedes algorithmes de deformation polynomial de second ordre a la Carte mondiale et on a effectue des interpolationsspatiales. Les aires et les courbes de regression ainsi produites ont ete analysees en fonction des points d'inflexion,et des coefficients de correlation globaux et locaux ont ete caleules pour obtenir une eertaine indication des similitudesgeometriques entre la carte de 1507 et les formes modernes. Les contours et I'emplaeement du continent sud-americainsur la carte de 1507 sont problematiques du point de vue chronometrique, puisque ni Balboa ni Magellan n'avaientatteint I'ocean Pacifique a eette epoque. La conclusion de I'etude est que Waldseemuller se serait probablement basesur des renseignements geographiques qui n'existent plus ou qui n'ont pas encore ete decouverts pour elaborer sa cartedu Nouveau Monde en 1507.
Mots des ; Waldseemuller, deformation polynomiale, regression bidimenslonnelle, modele de projection
cartographica (volume 41, issue 2) lOl
John W. Hessler
Introduction
What does it mean to obtain a new concept of the
surface of a sphere? How is it then a concept of the
surface of a sphere? Only in so far as it can be applied
to real spheres.
- Wittgenstein (1983. 259)
The word "phenomenoiogical" in the title of thisarticle is deliberately borrowed from the lexicon of thetwentieth-century logician Edmund Husserl (1970). Theword means "back to the thing itself" and here impliesan inversion in normal historical methodology. Insteadof asking what documentary evidence and historicalcontext can tell us about Waldseemuller's 1507 WorldMap (Figure 1), we can ask what the 1507 map cantell us about itself, its sources, and, most Importantly,its accuracy.
The question of accuracy in historical cartography isa vital one, and, according to M.J. Blakemore andJ.B. Harley (1980, 54), it is also one of the leastunderstood. Questions of accuracy and similarity in thecase of early maps are especially complex, "for as maps arethe end product of a chain of processes, so it is to beexpected that several distinct types of accuracy may haveto be accepted within a single map" (Blakemore andHarley 1980, 55). Blakemore and Harley identifythree types of accuracy that are relevant to this study:(1) chronometric, (2) geodesic and planimetric, and(3) topographic. Chronometric accuracy has two relatedparts: (a) the date of the map's production and (b) thedate of the geographic information that it displays.
Geodesic accuracy and topographic accuracy are broadcategories that take into account the difference in metricdistances between geographic locations on early andmodern maps, the arrangement and shape of the variousspatial entities displayed on the map, and differences indistinctive landscape features that may have changed overtime. Accuracy of any type is especially difficult to defmeand quantify when dealing with early maps of smallscale, such as Waldseemuller's 1507 World Map. Thegeographic sources used to create the map may no longerbe extant, may have had varying scales and differentdegrees of geodetic accuracy, and may themselveshave been made from composite sources. It is intothis quagmire of questions of accuracy that this articleshall wade.
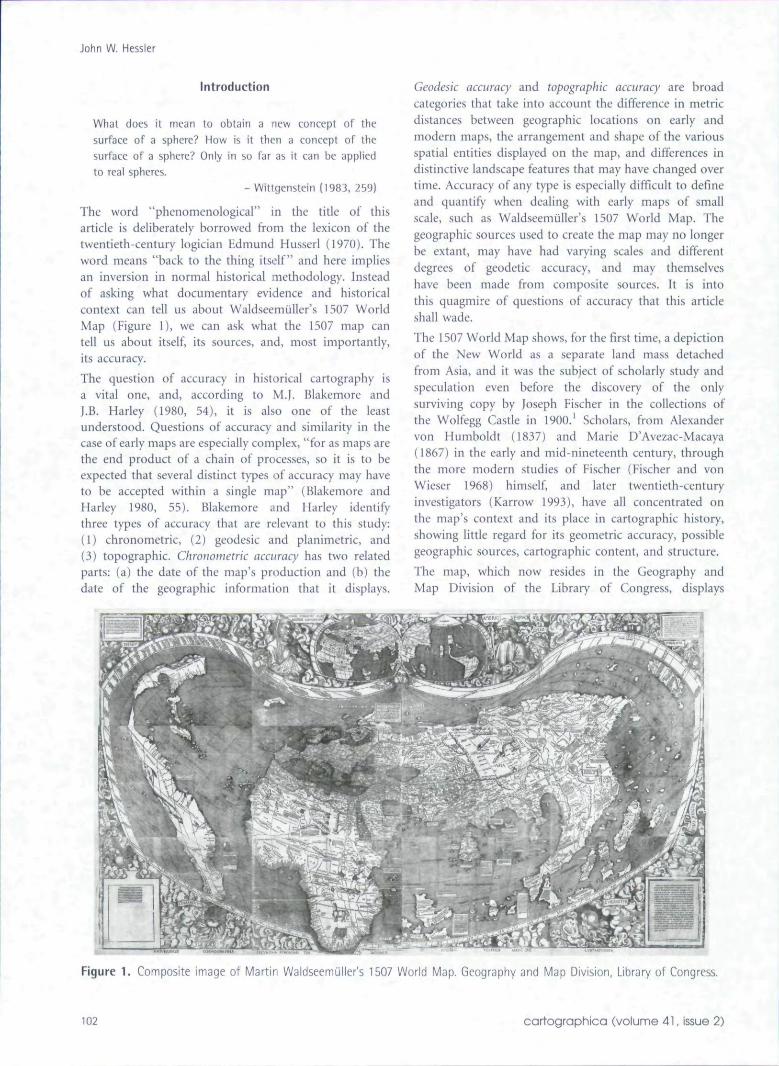
The 1507 World Map shows, for the first time, a depictionof the New World as a separate land mass detachedfrom Asia, and it was the subject of scholarly study andspeculation even before the discovery of the onlysurviving copy by Joseph Fischer in the collections ofthe Wolfegg Castle in 1900.' Scholars, from Alexandervon Humboldt (1837) and Marie D'Avezac-Macaya(1867) in the early and mid-nineteenth century, throughthe more modern studies of Fischer (Fischer and vonWieser 1968) himself, and later twentieth-centuryinvestigators (Karrow 1993), have all concentrated onthe map's context and its place in cartographic history,showing little regard for its geometric accuracy, possiblegeographic sources, cartographic content, and structure.
The map, which now resides in the Geography andMap Division of the Library of Congress, displays
Figure 1. Composite image of Martin Waldseemuller's 1507 World Map. Geography and Map Division, Library of Congress.
102 cartographica (voiume 41, issue 2)
Warping Waldseemuller: A Phenomenological and Computational Study of the 1507 World Map
the continents of the New World with a shape that, whenre-projected, is geometrically similar in form tothe outlines of the continents as we recognize themtoday. The shape and location of these land masses,separated as they are from Asia, are chronologicallyand chronometrically problematic, in that in 1507, themap's supposed creation date, neither Vasco Nufiezde Balboa nor Ferdinand Magellan had reached thePacific Ocean.
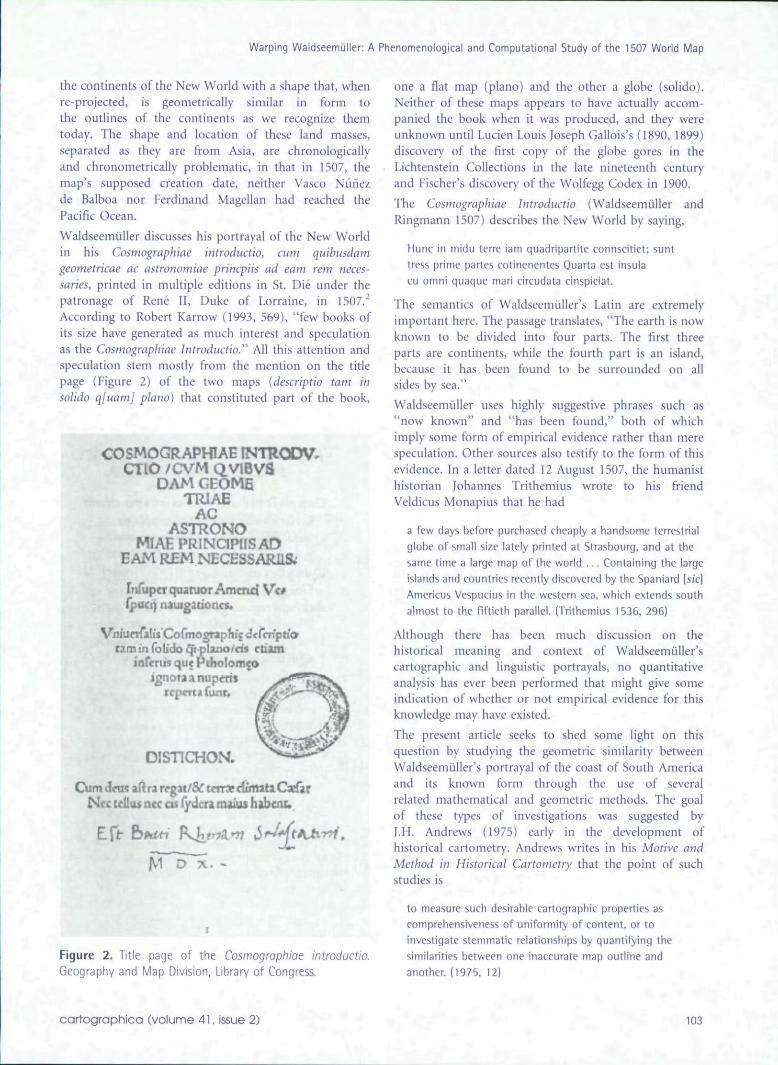
Waldseemuller discusses his portrayal of the New Worldin his Cosmographiae introductio, cum quibusdamgeometricae ac astronomiae princpus ad earn rem neces-saries, printed in multiple editions in St. Die under thepatronage of Rene II, Duke of Lorraine, in 1507.According to Robert Karrow (1993, 569), "few hooks ofits size have generated as much interest and speculationas the Cosmographiae Introductio." All this attention andspeculation stem mostly from the mention on the titlepage (Figure 2) of the two maps [descriptio tam insolido q[uam] piano) that constituted part of the book,
<X)SMOGRAPHIAE INTUODV*
DAM GEOMETRIAE
ACASTRONO
MIAE PRINCIPHSADBAM R£M NECESSAROSi
VniunfalisCofmograpIuf di f b l d f d ctiam
DISnCHON.
Ciim dfus aftra rcgat/& lerr^ di'miU Caefaf
ptitt
^1 D X. -
Figure 2. Title page of the Cosmographiae introductio.
Geography and Map Division, Library of Congress.
one a flat map (piano) and the other a globe (solido).Neither of these maps appears to have actually accom-panied the book when it was produced, and they wereunknown until Lucien Louis Joseph Gallois's (1890, 1899)discovery of the first copy of the globe gores in theLichtenstein Collections in the late nineteenth centuryand Fischer's discovery of the Wolfegg Codex in 1900.
The Cosmographiae Introductio (Waldseemuller andRingmann 1507) describes the New World by saying,
Hunc in midu tcrrc iam quadripartite connsdtiet; sunttress prime partes cotinenentes Quarta est insulacu omni quaquc mari circudata cinspiciat.
The semantics of Waldseemuller's Latin are extremelyimportant here. The passage translates, "The earth is nowknown to be divided into four parts. The first threeparts are continents, while the fourth part is an island,because it has been found to be surrounded on allsides by sea."
Waldseemuller uses highly suggestive phrases such as"now known" and "has been found," both of whichimply some form of empirical evidence rather than merespeculation. Other sources also testify to the form of thisevidence. In a letter dated 12 August 1507, the humanisthistorian Johannes Trithemius wrote to his friendVeldicus Monapius that he had
a few days before purchased cheaply a handsome terrestrialglobe of small size lately printed at Strasbourg, and at thesatne time a large map of the world ... Containing the largeislands and countries recently discovered by the Spaniard [sic]Americus Vespucius in the western sea, which extends southalmost to the fiftieth parallel. (Trithemius 1536. 296)
Although there has been much discussion on thehistorical meaning and context of Waldseemuller'scartographic and linguistic portrayals, no quantitativeanalysis has ever been performed that might give someindication of whether or not empirical evidence for thisknowledge may have existed.
The present article seeks to shed some light on thisquestion by studying the geometric similarity betweenWaldseemuller's portrayal of the coast of South Americaand its known form through the use of severalrelated mathematical and geometric methods. The goalof these types of investigations was suggested byJ.H. Andrews (1975) early in the development ofhistorical cartometry. Andrews writes in his Motive andMethod in Historical Cartometry that the point of suchstudies is
to measure such desirable cartographic properties ascomprehensiveness of uniformity of content, or toinvestigate stemmatic relationships by quantifying thesimilarities between one inaccurate map outline andanother. (1975. 12)
cartographica (volume 41, issue 2) 103
John W. Hessler
First, I shall analyse the projection on Waldseemiiller'1507 map using a mathematical approximation thatresembles a Bonne projection. After calculating thegraticule of this approximation using Mathematical'software, the modern coastline can then be re-projectedon Waldseemiiller's projection for visual comparison.Second, applying polynomial warping algorithms to thedigitized world map and carrying out spatialinterpolations using Java Advanced Imaging Software'*and ArcGIS, the newly produced surfaces and regressioncurves can be analysed for inflection-point behaviour.Global and local correlation coefficients are calculatedto give some measure of the geometric similarity betweenthe 1507 map and modern forms.
Any discussion of the mathematical and statisticalcomparison of ancient and early maps with theirmodern equivalents must necessarily begin with thework of Waldo Tobler. Tobler produced a series ofseminal articles, beginning in 1965 with the"Computation of the Gorrespondence of GeographicalPatterns" and ending with his 1977 article and computerprogram "Bi-dimensional Regression," that presentedand developed the theory of statistical map comparison(see Tobler 1965, 1966, 1994). Bi-dimensional regression,essentially invented by Tobler, is a statistical regressiontechnique that allows inferences tti be made betweentwo planes from point distributions on those planes.Of the many techniques used to analyse point patterns,Tobler's regression is unique in requiring a one-to-onemapping hetween the points on the planes (Tomoki1997). The requirement that the mapping functionbe injective assures that there is a correspondencebetween points on the two planes to be compared andthat both surfaces are topologically genus-0, with noholes or singularities.
Tobler defmed and investigated four kinds ofbi-dimensional regression models; (1) the Euclidiantransformation model, (2) the affine transformationmodel, (3) the projective transformation model, and(4) the curvilinear transformation model. The great utilityof these models is that although they can be consideredas elementary applications of empirical differentialgeometry or as studies of non-linear transformationsin two-dimensional Euclidean space, they are defmed bythe maps that are to be studied rather than by abstracta priori properties. Tobler thought that his curvilinearmodels were of the greatest interest because the regressioncoefficients constitute a spatially varying second-ordertensor field that was defined by the matrix of partialderivatives of the transformation (Akima 1984) betweenthe two sets of points. In his computer program, heused a non-parametric approach that allowed visualiza-tion of the regression by automatically plotting scatterdiagrams, drawing a displacement field, and producinga differential interpolation of warped coordinates that
was essentially equivalent to Tissot's Indicatrix (Tissot1881). Tobler produced two studies using variousforms of these techniques, one on the Hereford Mapand the other on the 1360 Gough map of Great Britain(1965, 1966).
Tobler considered his methods to be prerequisitesfor other studies on ancient and early maps and justone more tool to be used by cartographic historians.Researchers such as Susan Evans and Peter Gould (1982)used these methods to investigate the simple correspon-dence between actual locations of settlements and thosepredicted by theoretical models. Several studies havefocused on exploring the systematic components ofcognitive map distortion and its theoretical explanation(Lloyd and Hevley 1987). Unfortunately, however,only a few cartographic historians have taken up thesemethods and applied them in a quantitative andstatistically rigorous way to real historical problems.Gustav Forstner's study of the errors in longitude onearly maps and atlases (Forstner and Oehfii 1998) andT. Fuse's study on the geometrical correction ofhistorical maps (Fuse and Shimizu 1998) are notableexceptions.
Waldseemuller's Projection
What any picture, of whatever form, must have in common
with reality in order to depict it - correctly or incorrectly -
in any way at all, is logical form, i.e. the form of reality.
-Wittgenstein (1921, 7)
Among the many technical and theoretical problemsthat Waldseemuller faced in the construction of his map,one of the least trivial, mathematically, was the problemof projection. Dealing with a greatly enlarged earth,compared with the Ptolemaic models at his disposal,Waldseemuller modified Ptolemy's second conic projec-tion in a way that, unfortunately, distorted the shape ofthe new continents, as they were forced to the far westernportion of the map and hence greatly elongated(see Figure 1).
In WaldseemuHer's time new ideas were rapidlydeveloping out of the theoretical discussions in Book Iof Ptolemy's Geographiae. Many commentators andcartographers realized that there was no reason toadhere to Ptolemy's restriction of a correct representationof distances on three parallels, a restriction introducedin order to construct circular meridians. They foundthat by altering this arbitrary restriction on the form ofthe meridians and by applying Ptolemy's methodologyto any number of equidistant parallels, one could obtaina map correct on all parallels, with the meridianseasily constructible as curves or polygons connectingpoints of equal longitude (Ptolemy 2000).
This type of generalization was used on Ptolemy'ssecond conic projection by Waldseemuller to extend his
104 cartographica (volume 41, issue 2)
Warping WaldseemiJlkr: A Phenomenologicai and Computational Study of the 1507 World Map
world map, although not smoothly, as can be seen fromthe abruptness of the change in the meridians at theequator. A more continuous extension of the secondconic projection was made in a less ad hoc way byBernardus Sylvanus in a world map contained in his 1511Claudii Ptholemaei Alexandrlni liber geographiae cumtabulis universali fugura et cum additione locorum quae arecentioribus reperta sunt diligenti cura ememiatus etimpressus. Sylvanus's generalization of Ptolemy'smapping represented an extension of the area of theglobe to between —40 and +80 degrees in latitude andbetween 70 west and 290' east in latitude usingundistorted parallels.
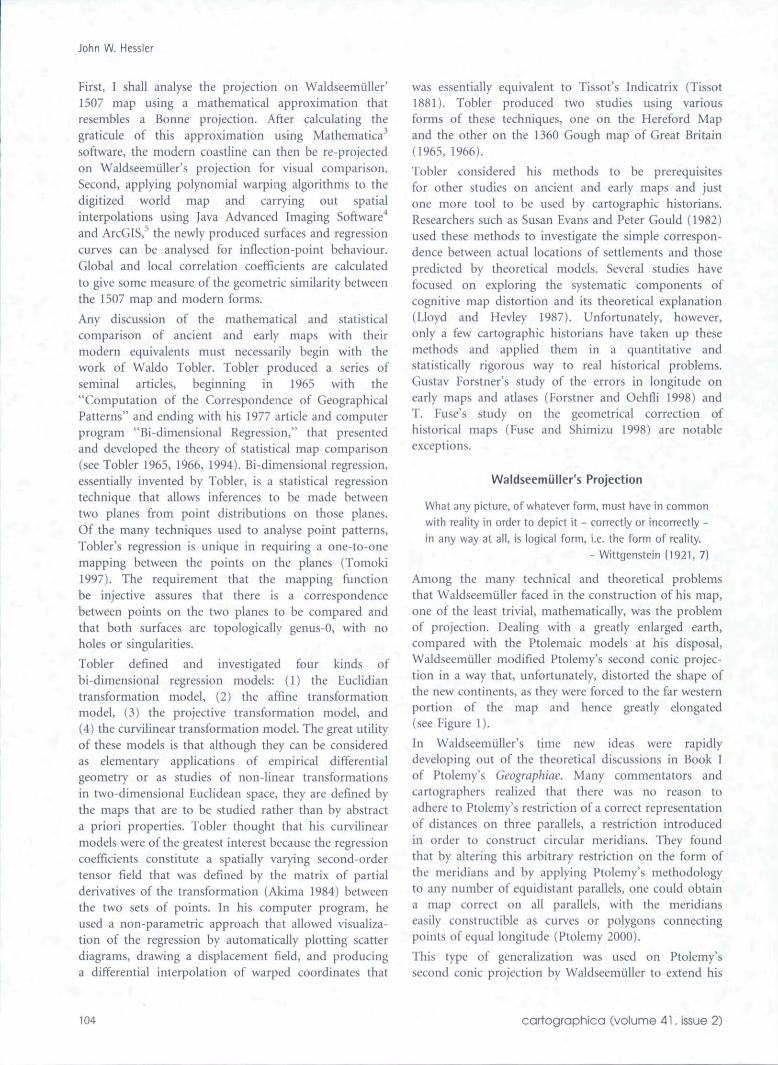
In 1514, Johannes Werner produced his translation ofand commentary on Book 1 of Ptolemy's Geographiae.Werner added to his translation a theoretical discussion oftwo generalizations of Ptolemy's second conic projectionin a section of his book entitled Lihellus de quatorterrarum orbis in piano figurationibus ab codem lanneVerneo tiovissime compertis et enarratis. Werner'sPropositio IV (Figure 3) modifies Ptolemy's methodologyby requiring that lengths be preserved on all parallels,represented by concentric arcs, and on all radii.
Werner further modified the projection in a way thatmakes the North Pole the center of what in modernterms would be called a system of polar coordinates.In Propositio V, he also requires that a quadrant of theequator have the same length as the radius between a poleand the equator.
The modifications of Sylvanus and Werner were thefirst solutions to the problem of representing thesurface of a sphere within a fmite area. Waldseemliller'sprojection can be graphically approximated (Snyder 1993)using the transformation equations that also can beused to represent an infmite series of projections,including Syivanus's, Werner's, and the later Bonneprojection, shown below:
x = psmO
y = A) - pcosO
iiitiiJint'lltlo^oihuftgmcmimilujEiiamijd.nun.-iDilni r jn*tt i) i i Jt p J rilldi In pn fjta n dcTuipo • I gif fuu i u [ ^
(tflFUiupi™urrtHic6n«tai!ninosnHiquo^iBijnicTid.jno^n!iu»liii«&S«.Ho»UlI
p n r i Uniiotdlttinjniculopi™ilinj(honrqufaiin«klpir.Uduiqpd d f t l f l ( f h 4ili
iin>4iEiuilioimipCiu!aB.iiv1i!Drrulin]mdjQrnjlo»(,|,oj&rnmi: fdihinf i^uj fiKniii i i farjUtloi mtndioiulri.Tji,iraffi a rfiifcjrnti Jni proxini4:duiuiij:jp:figurir ptp lunoj diro 1 iimli 5 oriims forjl idosri^umisiLniir, jjjdilj-'iE vni i j i pfj!
1 UL Jl Vi 111 dcfcin A of to l:uiril pj [Ic^ djLi I j fuTftr; aij [ E! ht>j(rjii.bui pjral IrioidinintcKridiuniicjd.aiig.iB. K. bruut .Eiiudt i rup a mitciaininl fupirnii Iji
pdiaii>) If: i.3rculcnnitiu qux .^icio Tjjlucn vcio aiaa riinllHisdaiidunf.Eriiovipnut tkf.'Xibaf Ilipi
r d F r
rcnni r h, rii r. 11) 11 ;]c iij D fi. i * a tnlfn(n.n b. 1 n ic ium citnifl. (rqM i l l ! ipfi J d
ncc! ufdan llbule tmu: fipofinonis hup. Rurfm m abo ptino re
h pen moim d l intnin sq.gndu (loiiui pmmnTi a milieft
d l t r i i 'ono li uf per qui n as niic L] : jci u j k iniirnctofiardiiichii puiildii rui>
i!cbirup|Sjiiokiiii.
lMll^.•^allll i.^^lJltdplmi 1 be. (VpntnEi (]i
pi r in I quil n tnini oiluaa 11«. M Jijaf d a .1 n funcm
nl'iii iplimd\r. r « t i inqinmi: Ju
h f. [il ani a L c d. 0 Iftrio n Fcini irsnd p ^ klmno.
in Hriqi pane ipaliii k I in.it(li;iin™;ii^ILO fill fq.p r.ortillticrii pljiii li 1 m n o.IllI.l^avTrJ^LIqflg|lllllhl.I1l(1IlTC(ntia^pbni a b L": .11^ quibufiji binupiim
pp
5
Figure 3. Johannes Werner's commentary on Book
Congress.
of Ptolemy's Geographioe. Geography and Map Division, Library of
cartographica (volume 41, issue 2) 105
John W. Hessler
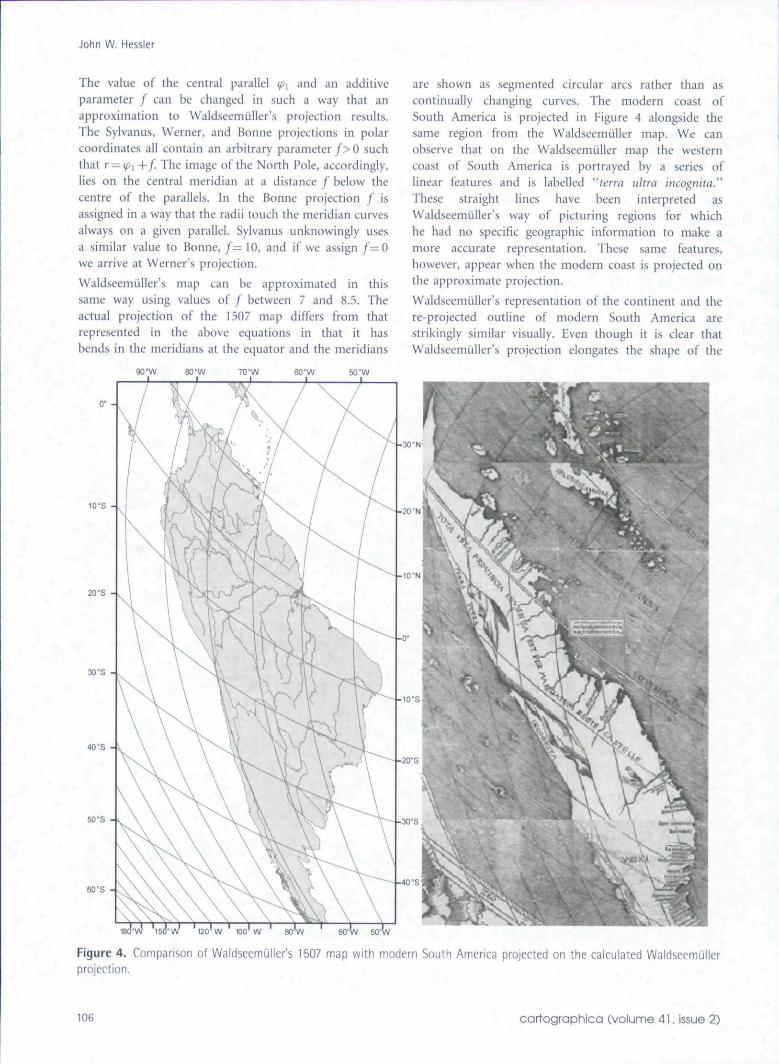
The value of the central parallel (p^ and an additiveparameter / can be changed in such a way that anapproximation to Waldseemuller's projection results.The Sylvanus, Werner, and Bonne projections in polarcoordinates ail contain an arbitrary parameter/>0 suchthat r —^1 +f. The image of the North Pole, accordingly,lies on the central meridian at a distance / below thecentre of the parallels. In the Bonne projection / isassigned in a way that the radii touch the meridian curvesalways on a given parallel. Sylvanus unknowingly usesa similar value to Bonne, / = 10. and if we assign f=0we arrive at Werner's projection.
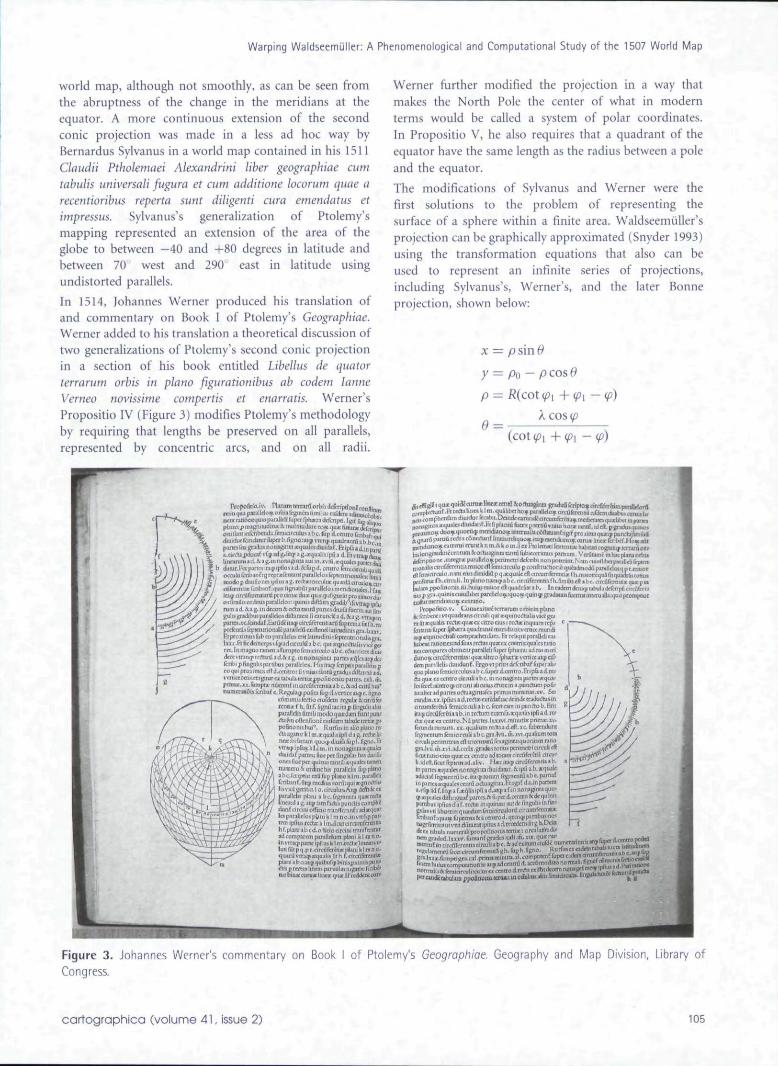
WaldseemuHer's map can be approximated in thissame way using values of / between 7 and 8.5. Theactual projection of the 1507 map differs from thatrepresented in the above equations in that it hasbends in the meridians at the equator and the meridians
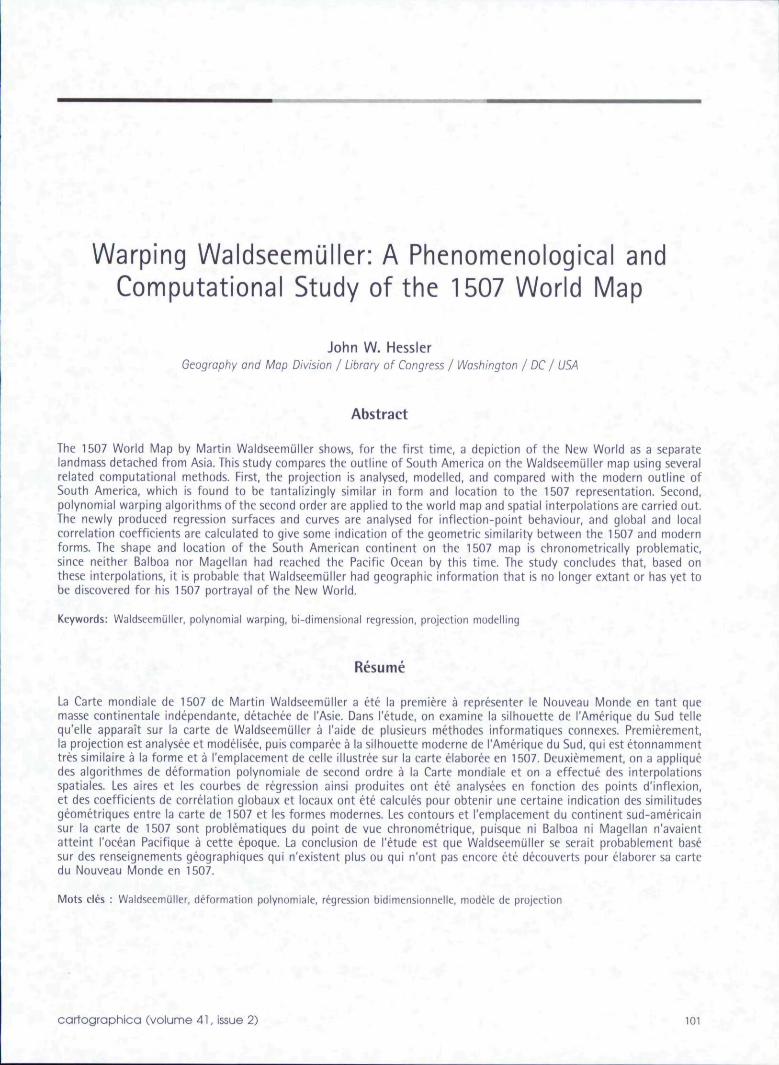
are shown as segmented circular arcs rather than ascontinually changing curves. The modern coast ofSouth America is projected in Figure 4 alongside thesame region from the Waldseemiiller map. We canobserve that on the Waldseemiiller map the westerncoast of South America is portrayed by a series oflinear features and is labelled "terra ultra incognita."These straight lines have been interpreted asWaldseemuller's way of picturing regions for whichhe had no specific geographic information to make amore accurate representation. These same features,however, appear when the modern coast is projected onthe approximate projection.
Waldseemiiller's representation of the continent and there-projected outline of modern South America arestrikingly similar visually. Even though it is clear thatWaldseemiiller's projection elongates the shape of the
7Q°W 50 "W
0° -
10°S -
20°S -
30°S -
AO'B -
50 "S
6O'S -
isd'vv i2o'w loo'w so'w eo w 5o°w
Figure 4. Comparison of Waldseemuller's 1507 map with modern South America projected on the calculated Waldseemullerprojection.
106 cartographica (volume 41. issue 2)
Warping Waldseemijller: A Phenomenological and Computational Study of the 1507 World Map
continent, it is also apparent that its width is close to thatof the modern form.
Polynomial Warping and Spatial Interpolation
We can only substitute a cleaT mathematical symbolism
for an imprecise one by inspecting the phenomena that
we want lo describe, thus trying to understand their
logical multiplicity - not by conjecturing about a priori
possibilities.
-Wittgenstein [1929, 29)
The process of polynomial warping is essentially amathematical transformation or mapping from adistorted image, such as an early map or a map with anunknown scale or geometric grid, to a target image thatis well known. The objective is to perform a spatialtransformation, or warp, so that the corrected image canbe measured or have a metric placed upon it relative to aknown map or grid. The process is ideal for comparingmodern maps with historical representations of the samegeographical area. The mathematical functions used in theprocess are polynomials of an arbitrary order that dependon the amount of distortion in the unknown map.The warping process includes all deformations thatcan be modelled by global bivariate transformations ofthe following form:
N-i
(=0
In the above equations, x and y are the coordinates ofthe reference image, in our case the known map ofSouth America, and u and v are the coordinates on theWaldseemijller image (Wolberg 1990). An example of asecond-order or quadratic transformation using the aboveequations can be written as follows:
V = boo-\--\- +
+ buxy + ^20^' + ^02/^
The constant coefficients a;, in the above polynomialequations can be associated with particular types ofdistortion, as shown in Table 1.
The values for the polynomial coefficients are found bythe use of tie points that represent correspondingpositions in the known and distorted image whoselocations can be defined precisely. In our context, thetie points came from the common latitude and longitudepoints found on the two maps. Tbe coordinates fromthe Waldseemtiller map were normalized to their modernequivalents because the 1507 map employs a coordinate
scheme that runs from 0 to 360 degrees with the280-degree meridian representing the western border ofthe map. Because the number of polynomial coefficientsto be calculated is much less than the number of tiepoints in any reasonable-order polynomial warp, aleast-squares error fit was used (Ahn 2004; Lawson andHanson 1974).
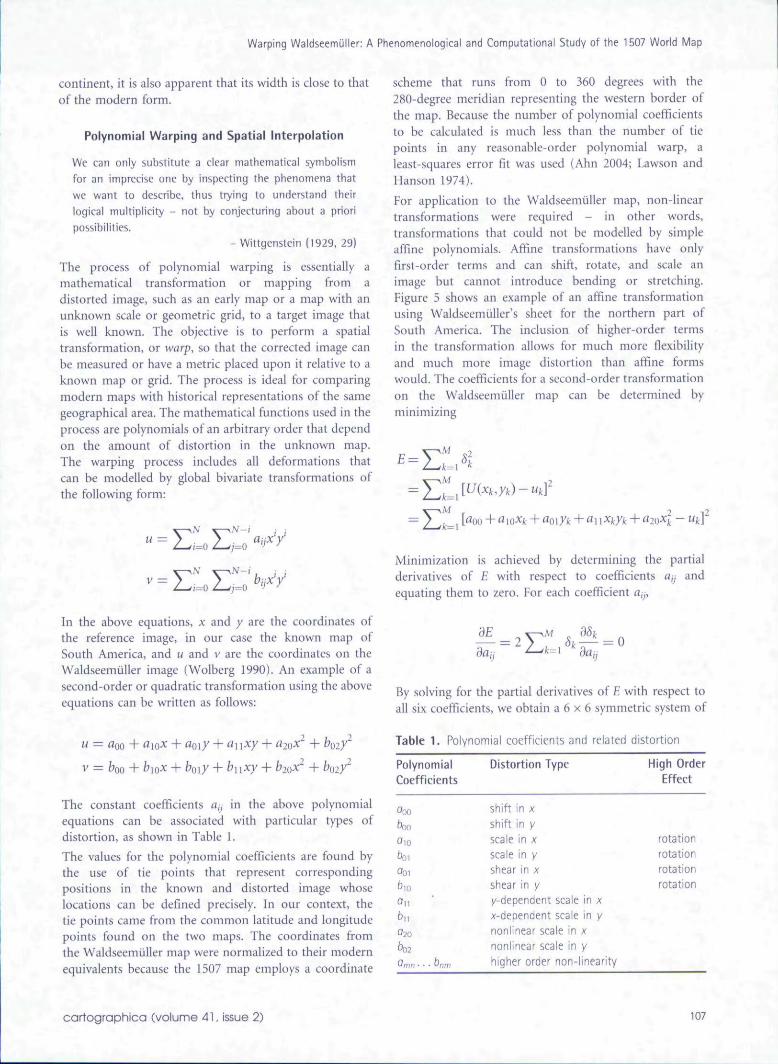
For application to the WaldseemuUer map, non-lineartransformations were required - in other words,transformations that could not be modelled by simpleaffine polynomials. Affine transformations have onlyfirst-order terms and can shift, rotate, and scale animage but cannot introduce bending or stretching.Figure 5 shows an example of an affine transformationusing Waldseemiiller's sheet for the northern part ofSouth America. The inclusion of higher-order termsin the transformation allows for much more fiexibilityand much more image distortion than affine formswould. The coefficients for a second-order transformationon the WaldseemuUer map can be determined byminimizing
=E; 2
+ amXk + aoiyk + auXkyk + a2QXf. -
Minimization is achieved by determining the partialderivatives of E with respect to coefficients an andequating them to zero. For each coefficient fl,j.
()E
By solving for the partial derivatives of £ with respect toall six coefficients, we obtain a 6 x 6 symmetric system of
Table 1. Polynomial coefficients and related distortion
PolynomialCoefficients
Distortion Type High OrderEffect
Ooo
booOlD
60,
bio
bv020
Omn • • • "nni
shift in Xshift in yscale in x5cale in yshear in xshear in yy-dependent scale in xx-dependent scale in ynonlinear scale in xnonlinear scale in yhigher order non-linearity
rotationrotationrotationrotation
carfographica (volume 41, issue 2) 107
John W. He5sler
Figure 5. Affine transformation of the southern portion of South America on Waldseemuller's 1507 map.
linear equations, whose coefficients are summations fromk—\ to M and can be evaluated from the original tiepoints. This system of equations can be written incompact form as
The least-squares procedure in this case is operatingon an overdetcrmlned system of variables and linearequations, meaning that the number of tie points isgreater than the number of coefficients to be calculated.As a result of this overdetermination, we are calculatinga polynomial warp that is only an approximate mappingand hence a best-fit minimization.
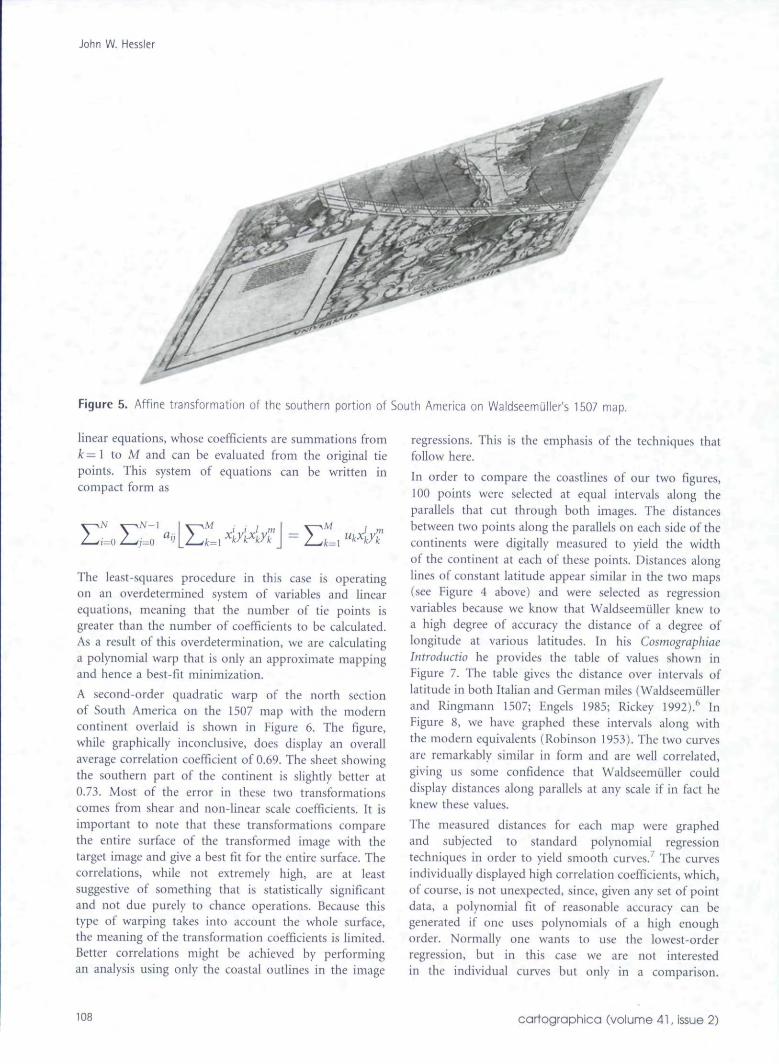
A second-order quadratic warp of the north sectionof South America on the 1507 map with the moderncontinent overlaid is shown in Figure 6. The figure,while graphically inconclusive, does display an overallaverage correlation coefficient of 0.69. The sheet showingthe southern part of the continent is slightly better at0.73. Most of the error in these two transformationscomes from shear and non-linear scale coefficients. It isimportant to note that these transformations comparethe entire surface of the transformed image with thetarget image and give a best fit for the entire surface. Thecorrelations, while not extremely high, are at leastsuggestive of something that is statistically significantand not due purely to chance operations. Because thistype of warping takes into account the whole surface,the meaning of the transformation coefficients is limited.Better correlations might be achieved by performingan analysis using only the coastal outlines in the image
regressions. This is the emphasis of the techniques thatfollow here.
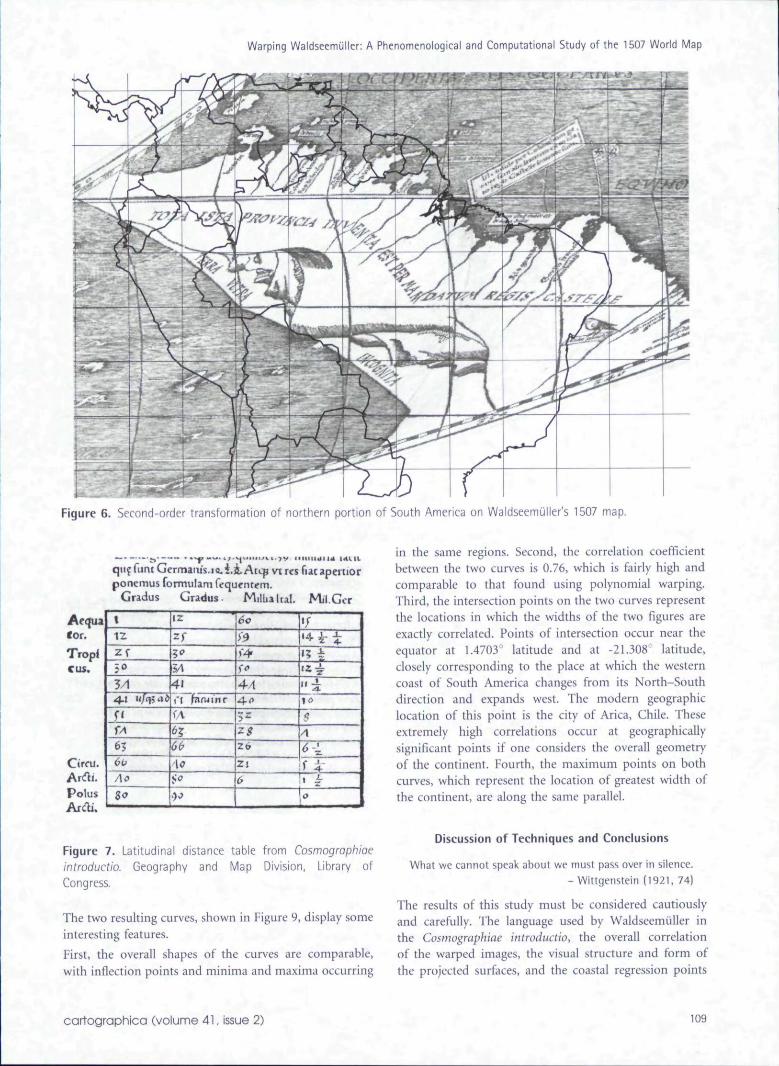
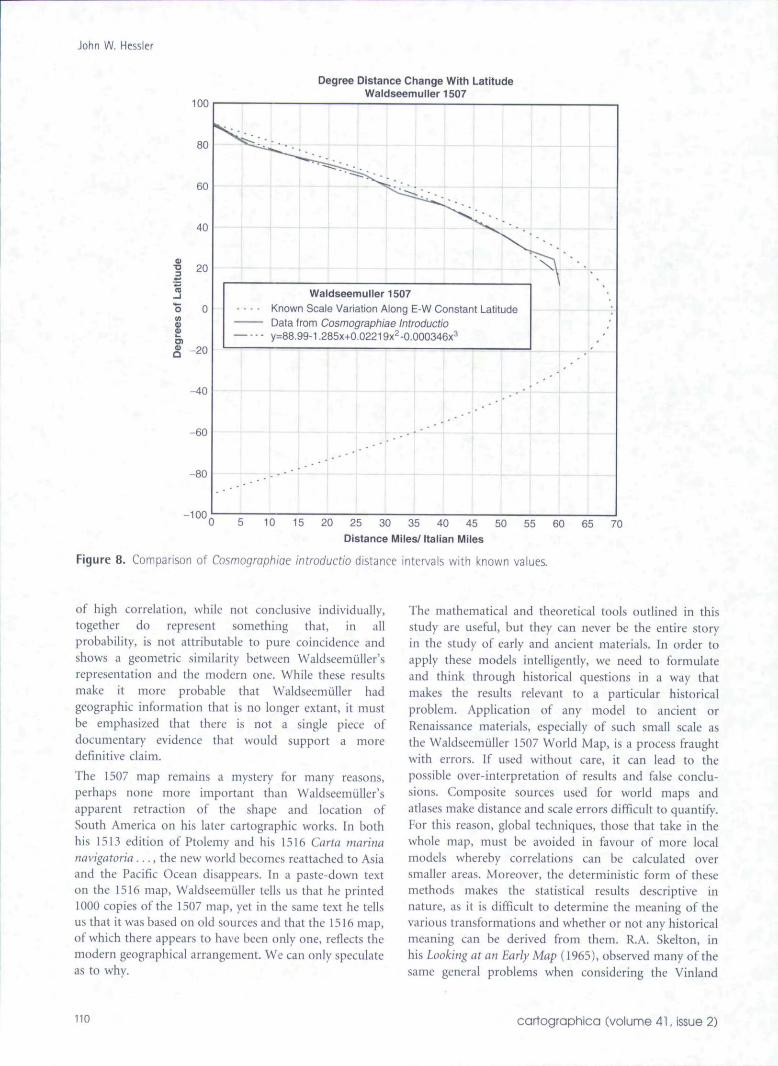
In order to compare the coastlines of our two figures,100 points were selected at equal intervals along theparallels that cut through both images. The distancesbetween two points along the parallels on each side of thecontinents were digitally measured to yield the widthof the continent at each of these points. Distances alonglines of constant latitude appear similar in the two maps(see Figure 4 above) and were selected as regressionvariables because we know that Waldseemiiller knew toa high degree of accuracy the distance of a degree oflongitude at various latitudes. In his CosmographiaeIiJtroductio he provides the table of values shown inFigure 7. The table gives the distance over intervals oflatitude in both Italian and German miles (Waldseemullerand Ringmann 1507; Engels 1985; Rickey 1992). InFigure 8, we have graphed these intervals along withthe modern equivalents (Robinson 1953). The two curvesare remarkably similar in form and are well correlated,giving us some confidence that Waldseemuller coulddisplay distances along parallels at any scale if in fact heknew these values.
The measured distances for each map were graphedand subjected to standard polynomial regressiontechniques in order to yield smooth curves.' The curvesindividually displayed high correlation coefficients, which,of course, is not unexpected, since, given any set of pointdata, a polynomial fit of reasonable accuracy can begenerated if one uses polynomials of a high enoughorder. Normally one wants to use the lowest orderregression, but in this case we are not interestedin the individual curves but only in a comparison.
108 cartographica (volume 41, issue 2)
Warping Waldseemuller: A Phenomenological and Computational Study of the 1507 World Map
Figure 6. Second-order transformation of northern portion of South America on Waldseemuller's 1507 map.
} V i i l t l i t j l Id
poncmusformulamfequfntirm.Gradus Gradus M Mi'l.Gcr
Aequa(or.TropfCUS. '
Cirfu.Ardl.Polus
tI Z
Z f
5/1
M6560
AoZo
\z
sf
IA41ri fnfwmrVA
6?66\o
6c
<^
4-44 ^?^zs2 6
2 l
' /
I? i
^o
$
A
6-1f 41 ^
Figure 7. Latitudinal distance table from Cosmographiaeintroductio. Geography and Map Division, Library ofCongress.
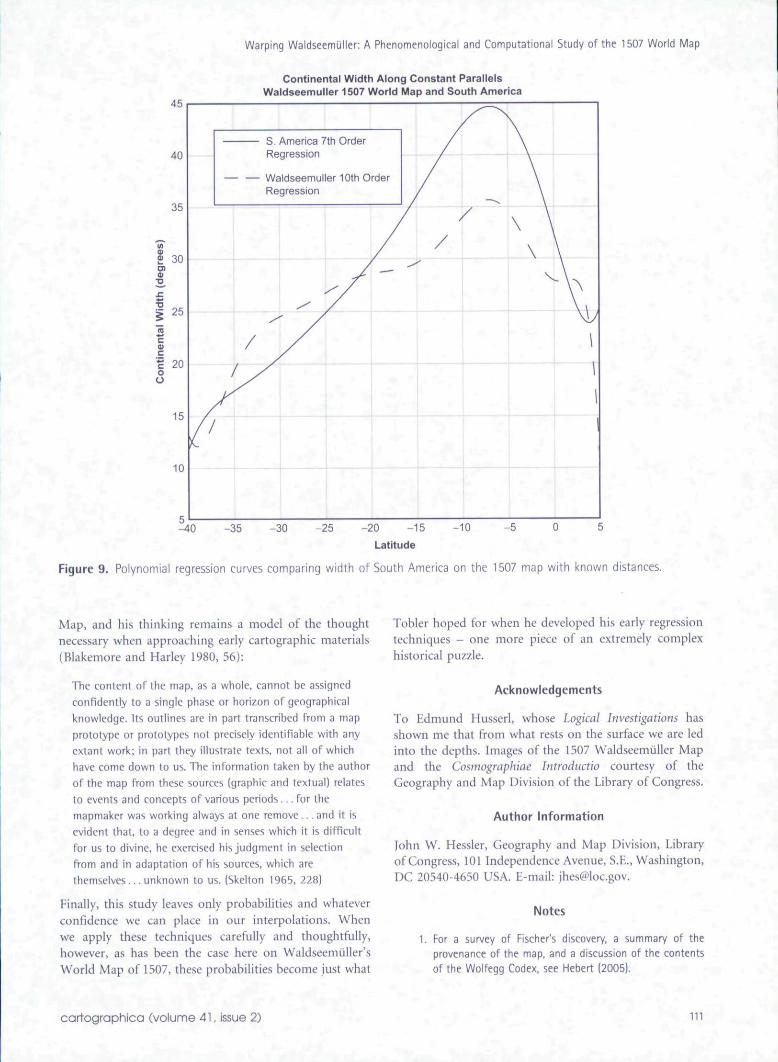
The two resulting curves, shown in Figure 9, display someinteresting features.
First, the overall shapes of the curves are comparable,with inflection points and minima and maxima occurring
in the same regions. Second, the correlation coefficientbetween the two curves is 0.76, which is fairly high andcomparable to that found using polynomial warping.Third, the intersection points on the two curves representthe locations in which the widths of the two figures areexactly correlated. Points of intersection occur near theequator at 1.4703' latitude and at -21.308" latitude,closely corresponding to the place at which the westerncoast of South America changes from its North-Southdirection and expands west. The modern geographiclocation of this point is the city of Arica, Chile. Theseextremely high correlations occur at geographicallysignificant points if one considers the overall geometryof the continent. Fourth, the maximum points on bothcurves, which represent the location of greatest width ofthe continent, are along the same parallel.
Discussion of Techniques and Conclusions
What we cannot speak about we must pass over in silence.
-Wittgenstein (1921, 74)
The results of this study must be considered cautiouslyand carefully. The language used by Waldseemuller inthe Cosmographiae introductio, the overall correlationof the warped images, the visual structure and form ofthe projected surfaces, and the coastal regression points
cartographica Cvoiume 41, issue 2) 109
John W. Hessler
100
80 -
Degree Distance Change With LatitudeWaidseemuiier 1507
CO0)0)D)V
a
40
20
20
-40
-60
-80
-100
—
Waidseemuiier 1507Known Scale Variation Along E-W Constant LatitudeData trom Cosmograptiiae Introductioy-88.99-t.285x+0.02219x2-0.000346x^
_ . . • - • '
5 to 15 20 25 30 35 40 45 50 55 60 65 70
Distance iUiiies/ itaiian Miies
Figure 8. Comparison of Cosmographiae introductio distance intervals with known values.
of high correlation, while not conclusive individually,together do represent something that, in allprobability, is not attributable to pure coincidence andshows a geometric similarity between Waldseemuller'srepresentation and tbe modern one, Wbilc these resultsmake it more probable that Waldseemuller hadgeographic information that is no longer extant, it mustbe emphasized that there is not a single piece ofdocumentary evidence that would support a moredefinitive claim.
The 1507 map remains a mystery for many reasons,perbaps none more important than Waldseemuller'sapparent retraction of tbe shape and location ofSouth America on his later cartographic works. In bothhis 1513 edition of Ptolemy and his 1516 Carta tnarinanavigatoria . . . , the new world becomes reattached to Asiaand the Pacific Ocean disappears. In a paste-down texton the 1516 map, Waldseemuller tell.s us that he printed1000 copies of the 1507 map, yet in the same text he tellsus that it was based on old sources and that the 1516 map,of which there appears to have been only one, reflects tbemodern geographical arrangement. We can oniy speculateas to why.
The mathematical and theoretical tools outlined in thisstudy are useful, but they can never be the entire storyin the study of early and ancient materials. In order toapply these models intelligently, we need to formulateand think through historical questions in a way thatmakes the results relevant to a particular historicalproblem. Application of any model to ancient orRenaissance materials, especially of such small scale asthe Waldseemuller 1507 World Map, is a process fraughtwith errors. If used without care, it can lead to thepossible over-interpretation of results and false conclu-sions. Composite sources used for world maps andatlases make distance and scale errors difficult to quantify.For this reason, global techniques, those that take in thewhole map, must be avoided in favour of more localmodels whereby correlations can be calculated oversmaller areas. Moreover, the deterministic form of thesemethods makes the statistical resuhs descriptive innature, as it is difficult to determine the meaning of thevarious transformations and whether or not any historicalmeaning can be derived from them. R.A, Skelton, inhis Looking at an Early Map (1965}, observed many of thesame general problems when considering the Vinland
110 cartographica (volume 41, issue 2)
45
40
35
n0)
£ 30
25
Warping Waldseemiiller: A Phenomenological and Computational Study of the 1507 World Map
Continentai Width Aiong Constant ParaiieisWaidseemuiier 1507 Worid iViap and South America
20
15
10
/
Re
WaRe
America 7th Ordergression
Idseemuiier 10th Ordergression
/
\\\
1
11
-35 -30 -25 -20 -15 -10
Latitude
-5
Figure 9. Polynomial regression curves comparing width of South America on the 1507 map with known distances.
Map, and his thinking remains a model of the thoughtnecessary when approaching early cartographic materials(Blakemore and Harley 1980, 56):
The content of the map, as a whole, cannot be assigned
confidentty to a single phase or horizon of geographical
knowledge. Its outlines are in part transcribed from a map
prototype or prototypes not precisely identifiable with any
extant work; in part they illustrate texts, not aii of which
have come down to us. The information taken by the author
of the map from these sources (graphic and textual) relates
to events and concepts of various periods... for the
mapmaker was working always at one remove... and it is
evident that, to a degree and in senses which it is difficult
for us to divine, he exercised his judgment in selection
from and in adaptation of his sources, which are
themselves... unknown to us. (Skelton 1955, 228)
Finally, this study leaves only probabilities and whateverconfidence we can place in our interpolations. Whenwe apply these techniques carefully and thoughtfully,however, as has been the case here on Waldseemuller'sWorld Map of 1507, these probabilities become just what
Tobler hoped for when he developed his early regressiontechniques - one more piece of an extremely complexhistorical puzzle.
Acknowledgements
To Edmund Husserl, whose Logical Investigations hasshown me that from what rests on the surface we are ledinto the depths. Images of the 1507 Waldseemuller Mapand the Cosmographiae Introductio courtesy of theGeography and Map Division of the Library of Congress.
Author Infortnation
John W. Hessler, Geography and Map Division, Libraryof Congress, 101 Independence Avenue, S.E., Washington,DC 20540-4650 USA. E-mail: [email protected].
Notes
1. For a survey of Fischer's discovery, a summary of theprovenance of the map, and a discussion of the contentsof the Wolfegg Codex, see Hebert (2005).
cartographico (volume 41, issue 2) 111
John W. Hessler
2. D'Avezac-Macaya, in his Martin Hytacomytus Wattzemut-terses Ouvrages et ses Coiiaborateurs, makes an argumentfor four editions, which he distinguishes based on the firstline of the title and the colophon (1867, 112). Henry C.Murphy, in the catalogue of the Carter-Brown Library(1853, i, 35), opines that two of these are simply made upfrom the original May and September editions of 1507.Henry Harrisse's opinion differs from Murphy's; Harissemaintains that there are in fact three real editions from1507 (see 1958-1960, no. 24).
3. Wolfram (1999). Data were analysed using the FiTfunction in the Mathematica mathematics softwareproduced by Wolfram Associates,
4. Java Advanced Imaging Software, version 1.1.1, bySun Microsystems. Program codes used includedWarpperspective, Warpaffine, Warppolynomial, andWrapquadratic.
5. ArcGIS software, version 9.0, by Environmental SystemsResearch Institute.
6. Waidseemuiier and Ringmann use a value for thecircumference of the earth here that is substantiallylarger than the Ptolemaic value of 180,000 stades,reflecting a value closer to Eratosthenes' 252,000(Engels 1985). For explanation of the effect ofEratosthenes' measurements on age of explorationnotions of the size of the earth, see Rickey (1992).
7. Polynomial and multiple regression analysis was carriedout using the Multivariate Descriptive Statistics Packagein Mathematica.
References
Ahn, Sung Jonn. 2004. Least Squares Orthogonal DistariceFitting of Curves and Surfaces in Space. New York: Springer.
Akima, Hiroshi 1984. "On Estimating Partial Derivatives forBivariate Interpolation of Scattered Data." ACM Transactionson Mathematical Software 9: 41-52.
Andrews, J.H. 1975. "Motive and Method in HistoricalCartography." Paper read at the Sixth InternationalConference on the History of Cartography, 7-11 September,Greenwich, UK.
Blakemore, M.L, and J.B. Harley. 1980. Concepts in theHistory of Cartography: A Review and Perspective.Cartographica 17/4: Monograph 26.
D'Avezac-Macaya, Marie Armand Pascal. 1867, i-iyiacomyiusWaitzemuiier ses Ouvrages et ses Coiiaborateurs. Paris:Challamel Afne.
Engels, Donald. 1985. "The Length of Eratosthene's Stade,"American Journal of Phiiology 106: 298-311.
Evans, Susan, and Peter Gould. 1982. "Settlement Models inArchaeoiogy." Journal of Anthropological Archaeology 1:275-304.
Fischer, Joseph, and Franz von Wieser. 1968. Die alteste Kartemit dem Namen America aus dem Jahre 1507 und die CartaMarina ans dem Jahre 1516... 1903. Reprint, Amsterdam:Theatrum Orbis Terrarum.
Forstner, Gustav, and Markus Oehrli. 1998. "GraphischeDarstellungen der Untersuchungs ergebnisse alter Karten
und Entwicklung der Verrungsgitter." Cartographic Helvetica17:35-43.
Fuse, I , and E. Shimizu. 1998. "A Study of theGeometric Correction of Historical Maps." InternationalArchives of Photogrammetry and Remote Sensing 32:545-48.
Gailois, Lucien Louis Joseph. 1890. Les Geographesatlemandsde la Renaissance. Paris: E. Leroux.
. 1899. Americ Vespuce et les geographes de St. Die.Florence: M. Ricci.
Harrisse, Henry. 1958-1960. Bibliotheca AmericanaVetustissima: A Description of the Worics Relating toAmerica, Published between 1492 and 1551, ed. CarlosSanz. 1866. Reprint, New York: G.P. Phillips.
Hebert, John. 2005. "The Map That Named America."Coordinates (Series B) 4, Avaiiabie at http://www.sunysb.edu/libmap/coordinates/contents.htm
von Humboldt, Alexander. 1837. Examen critique de t'histoirede la geographie du nouveau continent, vol. 4. Paris.
Husserl, Edmund. 1980. Logical Investigations, trans. J.N.Findlay. London: Routledge.
Karrow, Robert. 1993. Bio-bibliographies of theCartographers of Abraham Ortelius, 1570. Chicago:Speculum Orbis / Newberry Library.
Lawson, Charles L, and Richard J. Hanson. 1974. SolvingLeast-Squares Problems. Englewood Cliffs, NJ: Prentice Hall.
Lloyd, R,, and C. Hevley. 1987. "Systematic Distortions inUrban Cognitive Maps." Annals of the American Associationof Geographers 77: 191-207.
Murphy, Henry C. 1853. Catalogue of an American Library.Chronologically Arranged. Brooklyn, NY: Van Alden.
Ptolemy, Claudius. 1511. Claudii Ptholemaei Alexandriniliber geographiae cum tabulis universali fugura etcum additione locorum quae a recentioribus reperta suntdiligenti cura emendatus et impressus. Venice: JocobusPen tin us.
. 2000. Ptolemy's Geography: An AnnotatedTranslation of the Theoretical Chapters, trans. J. LaurentBergsen and Alexander Jones. Princeton: PrincetonUniversity Press.
Rickey, V.F. 1992. "How Columbus Encountered America."Mathematics Magazine 65: 219-25.
Robinson, Arthur. 1953. Elements of Cartography. New York:Wiley.
Skelton, R,A. 1965. Looking at an Early Map. Lawrence:University of Kansas Press.
Snyder, John P. 1993, Flattening the Earth: Two ThousandYears of Map Projections. Chicago: University of ChicagoPress,
Tissot, Nicholas August. 1881. Memoire sur la representationdes surfaces et les projections geographiques. Paris:Gauthier-Villars.
Tobler, Waldo. 1965. "Computation of the Correspondenceof Geographical Patterns." Papers of the Regional ScienceAssociation 15: 131-39.
112 cartographica (volume 41, issue 2)
Warping WaldseemuUer: A Phenomenological and Computational Study of the 1507 World Map
. 1966. "Medieval Distortions: The Projections of AncientMaps." Annals of the Association of American Geographers56: 351-61.
. 1994. "Bi-dimensional Regression." 1977. Reprint,Geographical Analysis 26: 187-212.
Tomoki, Nakaya. 1997. "Statistical Inference inBidimensional Regression Models." Geographical Analysis29: 169-86.
Trithemius, Johannes. 1536. Epistolarum familarium.Hagehau: N. pub.
Waldseemiiller, Martin, and Mathias Ringmann. 1907.Cosmographiae Introductio..., Rudimenta. 1507.Reprinted in Joseph Fischer and Franz von Wieser,The Cosmographiae Introductio of Martin WaldseemuUerin Facsimile, Followed by the Four Voyages ofAmerigo Vespucci, with Their Translation intoEnglish; to whieh Are Added WaldseemuUer'sTwo World Maps of 1507 with an Introduction,
ed. Charles George Hebermann. New York: United StatesCatholic Historical Society. 30.
Werner, Johannes. 1514. Libellus de quatar terrarum orbis inpiano figurationibus ab codem lanne Verneo novlssimecompertis et enarratis. Nuremberg: Johannes Stuchs.
Wittgenstein, Ludwig. 1921. Traetatus Logico-Phitosophieus,trans. D.F, Pears and B.F. McGuinness. London: Routledge.
-—-. 1929. "Remarks on Logical Form." Proceedings of theAristotelian Society 9: 162-71.
. 1983. Remarks on the Foundations of Mathematics, ed.G.H. Wright, trans. G.E.M. Anscombe. 1956. Cambridge, MA:MIT Press.
Wolberg, George. 1990. Digital Image Warping. Los Alamitos,CA: IEEE Computer Society Press.
Wolfram, Stephen. 1999. The Mathematica Book, 4th ed.Cambridge: Cambridge University Press.
carfographica (volume 41, issue 2) 113