Embed Size (px)
Citation preview
Wastewater Treatment in Harbours
Neva Hero
Thesis to obtain the Master of Science Degree in
Civil Engineering
Supervisor: prof.dr. Filipa Maria Santos Ferreira
Examination Committee
Chairperson: prof. dr. António Alexandre Trigo Teixeira
Supervisor: prof.dr. Filipa Maria Santos Ferreira
Member of the committee: Engineer Vera Cristina Ferreira Godinho
July 2014
II
AKNOWLEDGEMENTS
I would like to express my special appreciation and thanks to my advisor
Professor. dr. Filipa Maria Santos Ferreira, who has been a tremendous mentor.
Her advice, suggestions and encouraging helped me a lot during writing this
thesis. She gave me the explanations to all my questions about wastewater
treatment from harbours, which was a completely new area for me.
Moreover, I am grateful to engineer Vera Godinho from Port authority, Port
Lisbon. She gave me many precious practical tips and pointed out to me all the
problems they have to deal with, on a daily basis, in the harbour. She helped me a
lot with arranging the visits to different types of ships which was an unforgettable
experience.
I extend my thanks to chemist mr.sc. Dario Mamilović, who answered my
questions and sent me long e – mails with explanations about chemical and
biological processes and suggested what I should pay attention to in treatments of
different types of wastewater. Along with my professor dr. Filipa Maria Santos
Ferreira, he inspired me to further study this topic and to write this thesis.
Thanks to all crew members who showed me wastewater treatment plants
onboard and explained to me how they deal with wastewater.
My thanks go to captain Damir Tanšek, staff captain Franko Papić, Neven
Hero, Marta Horvatski, Martina Cservenák, Nina Bonefačić and her boyfriend who
helped me with collecting answers on my questionnaire.
A special thanks to my family. Words cannot express how grateful I am to my
mother, father, sister and my grandmother for all the sacrifice that they had made
on my behalf. I would also like to thank all of my friends who supported me in
writing, and encouraged me to strive towards my goal.
Last but not least, I would like express appreciation to my boyfriend who spent
sleepless nights with me on Skype and was always my support in the moments
when there was no one to answer my queries.
III
ABSTRACT
In harbours wastewater can be produced on land – based harbours facilities
(including restaurants, offices, shipyards and washing areas) or can be collected
from different vessels (with different wastewater treatment plants onboard or
without any kind of wastewater treatment plants onboard). To design wastewater
treatment plants in harbours it is of extreme importance to have a very detailed
analysis of the type of wastewater (prediction of quality and quantity) that can be
found in the harbours (taking into account all the different sources previously
mentioned). That is a crucial information to decide which type of WWTP can be
effective (e.g., mechanical including chemical, or biological treatment).
Moreover, port authorities have to deal with two different groups of regulations
for wastewater treatment: with legal requirements for effluent from wastewater
treatment plants based on land and legal requirements for effluent from vessels
(e.g. from WWTP onboard), which are stricter than the requirements for
wastewater treatment on land. In this thesis different types of wastewater that can
be found in harbours are characterized, as well as the problems that might be
related with wastewater treatment of those effluents, considering the legal
requirements and technical solutions. Onboard wastewater treatment is also
studied.
Furthermore, a case study is presented in order to illustrate what typically may
happen in a harbour, present the main problems and constraints they have
regarding ships, as well as wastewater handling and disposal. In addition, the
particular case of Lisbon Port has been analyzed in order to provide a solution for
the wastewater treatment, including study a possible location for the wastewater
treatment plant and the type of treatment that could be implemented.
Keywords: wastewater treatment, harbour, ship, Lisbon Port
IV
RESUMO
Nos Portos, as águas residuais podem ter origem nas respetivas instalações
portuárias terrestres (incluindo restaurantes, escritórios, estaleiros e áreas de
lavagem) ou podem ser coletadas de diferentes embarcações (com diferentes
estações de tratamento de águas residuais (ETAR) a bordo ou sem qualquer tipo
de tratamento de águas residuais a bordo). Para projetar ETAR em zonas
portuárias é de elevada importância conhecer, detalhadamente, o tipo de águas
residuais a tratar (previsão da qualidade e quantidade, tendo em conta todas as
diferentes fontes mencionadas anteriormente). Essa é uma informação crutial
para decidir que tipo de ETAR pode ser eficaz (por exemplo, incluindo tratamento
biológico ou químico).
Além disso, as autoridades portuárias têm que lidar com dois grupos
diferentes de regulamentos para tratamento de águas residuais: os requisitos
legais para efluentes das ETAR localizadas em terra, e os requisitos legais para
efluentes de embarcações, que são mais rigorosos do que os requisitos para a
tratamento de águas residuais em terra. No âmbito da presente dissertação, os
diferentes tipos de águas residuais que podem ser encontrados nos portos são
caracterizados, bem como os problemas que podem estar relacionados com o
tratamento de águas residuais desses efluentes, considerando os requisitos
legais e as possivies soluções técnicas. O tratamento de águas residuais a bordo
é também estudado.
É ainda apresentado um caso de estudo para ilustrar o que normalmente
pode acontecer nos Portos, apresentar os principais problemas e
constrangimentos que têm relativamente às águas residuais de embarcações,
bem como ao manuseamento, trataemnto e destino final desses efluentes.
Adicionalmente, o caso particular do Porto de Lisboa foi analisado a fim de
propor, ainda que teoricamente, uma solução para o tratamento das águas
residuais aí produzidas/coletadas, incluindo o estudo de um local possível para a
implantação da(s) ETAR e o tipo de tratamento que pode ser aplicado.
Palavras–chave: tratamento de águas residuais, portos, embarcações, Porto de Lisboa
V
TABLE OF CONTENTS
1. INTRODUCTION ................................................................................................. 1
1.1. Background and motivation of this thesis ...................................................... 1
1.2. Objective ....................................................................................................... 2
1.3. Outline of the thesis .......................................................................................... 3
2. VARIETY OF WASTEWATERS IN HARBOURS ................................................ 5
2.1. Overview of wastewater characteristics ......................................................... 5
2.2. Sanitary wastewater ...................................................................................... 7
2.3. Industrial wastewater ................................................................................... 10
2.4. Wastewater from ships ................................................................................ 12
2.4.1. Black water ........................................................................................... 13
2.4.2. Graywater ............................................................................................. 15
2.4.3. Ballast water ......................................................................................... 17
3. LEGAL REQUIREMENTS ................................................................................. 20
3.1. Legal regulation on the sea ......................................................................... 20
3.2. Legal regulation on land .............................................................................. 24
3.3. Comparison of discharging requirements on land and on the sea ............... 26
4. TYPE OF TREATMENT .................................................................................... 31
4.1. General comments ...................................................................................... 31
4.2. Physical treatment ....................................................................................... 33
4.2.1. Screening .............................................................................................. 33
4.2.2. Coarse solids reduction ........................................................................ 34
4.2.4. Mixing and flocculation .......................................................................... 36
4.2.5. Grit removal .......................................................................................... 37
4.2.6. Sedimentation ....................................................................................... 37
4.2.7. Flotation ................................................................................................ 38
4.3. Biological treatment ..................................................................................... 39
VI
4.3.1. Aeration systems .................................................................................. 41
4.3.2. Aerated lagoons (aerated basins) ......................................................... 43
4.3.3. Activated sludge .................................................................................... 45
4.3.4. Biotowers (trickling filters) ..................................................................... 47
4.3.5. Rotating biological contactors ............................................................... 48
4.3.6. Sequencing batch reactors (SBR) ......................................................... 48
4.3.7. Membrane bioreactors (MBR) ............................................................... 50
4.4. Chemical treatment ..................................................................................... 51
4.4.1. pH Adjustment ...................................................................................... 51
4.4.2. Chemical oxidation ................................................................................ 52
4.4.3. Chemical reduction ............................................................................... 53
4.4.4. Chemical precipitation and flocculation ................................................. 53
4.4.5. Demulsification ...................................................................................... 54
4.5. Possible treatment diagrams for WWTP in harbours ................................... 55
5. PROBLEMS AND POSSIBLE SOLUTIONS ...................................................... 57
5.1. Contamination by ships ............................................................................... 57
5.2. Problems with wastewater treatment from washing areas ........................... 61
6. CASE STUDY ................................................................................................... 63
6.1. Overview of the work performed .................................................................. 63
6.2. Results and comments on the first questionnaire ........................................ 65
6.3. Results and comments on the second questionnaire .................................. 66
6.3.1. Characterization of the wastewater treatment onboard ......................... 68
6.3.1.1. General ........................................................................................... 68
6.3.1.2. Cruise ships .................................................................................... 71
6.3.1.3. Cargo ships .................................................................................... 78
6.3.1.4. Warships ........................................................................................ 81
6.4. Port authority problems ............................................................................... 82
6.5. Port of Lisbon .............................................................................................. 84
7. CONCLUSION .................................................................................................. 90
VII
REFERENCES ......................................................................................................... 93
APPENDICES ............................................................................................................ A
LIST OF FIGURES
Figure 1. Daily Mass BOD loading – harbour WWTP ................................................ 6
Figure 2. The washing area in a marine/harbour (Mamilović, D.) ............................ 10
Figure 3. Contaminated wastewater from washing areas (left), purified wastewater
(right) (Mamilović, D.) ............................................................................................... 11
Figure 4. Per Capita Sewage Generation as Reported in EPA's 2004 Cruise Ship
Survey (US environmental protection agency,2008) ................................................ 14
Figure 5. Sewage Generation by Persons Onboard as Reported in EPA's 2004
Cruise Ship Survey (US environmental protection agency,2008) ............................. 14
Figure 6. Per Capita Graywater Generation as Reported in EPA's 2004 Cruise Ship
Survey (US environmental protection agency,2008) ................................................ 16
Figure 7. Graywater generation by Persons Onboard as Reported in EPA's 2004
Cruise Ship Survey (US environmental protection agency,2008) ............................. 16
Figure 8. Quality of ballast water samples – Port of Koper, Slovenia, Mediterranean
sea (David M., et al., 2007) ....................................................................................... 19
Figure 9. Mechanically cleaned coarse screens a) flat screen b) arched screen, .... 34
Figure 10. Coarse solid reduction – constat flow of water ........................................ 35
Figure 11. Flow and BOD equalization (based on Tušar, 2009) .............................. 35
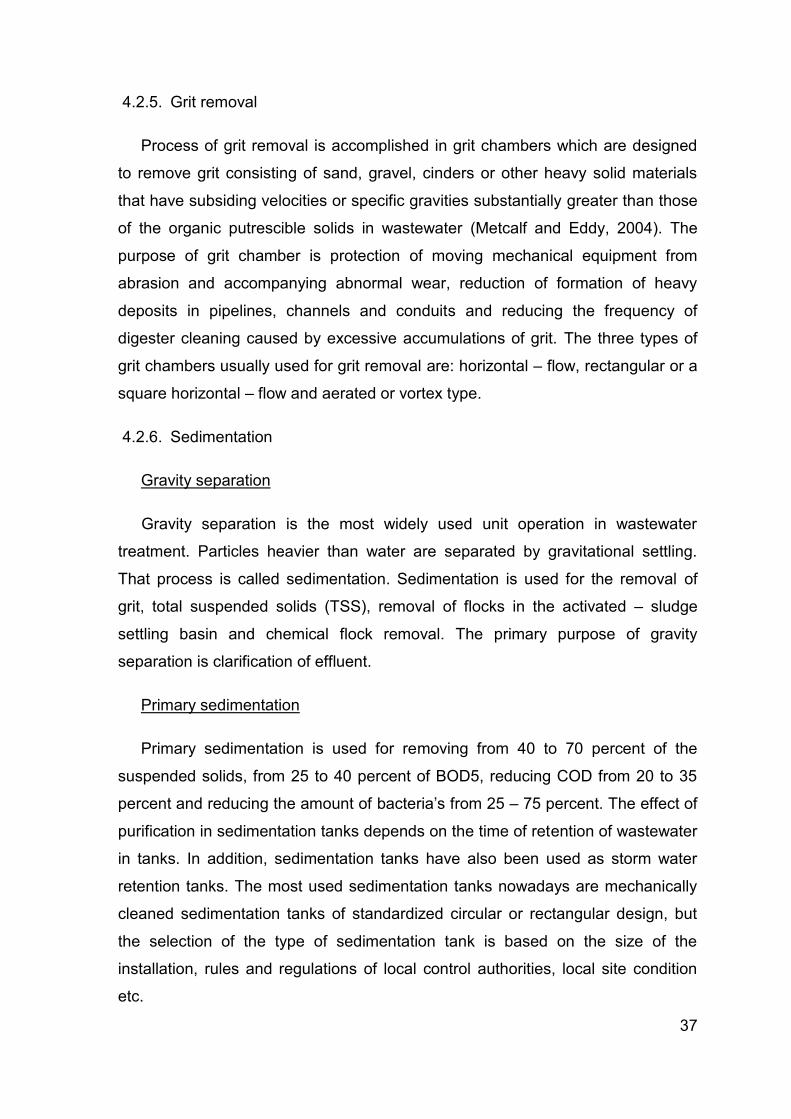
Figure 12. Aerated single – chamber flotator (Vuković, 1994.) ................................ 38
Figure 13. Movement of carbon and energy in aerobic (above) and anaerobic
(below) wastewater treatment (Henze et al., 2008) .................................................. 40
Figure 14. Jet aeration (Adi sales) ........................................................................... 43
Figure 15. Aeration discs/rotors (Evoqua water technologies) ................................. 44
Figure 16. Biotower/trickling filter (Tilley, 2008) ....................................................... 47
Figure 17. Schematic diagram of a rotating biological contactor for wastewater
treatment (Mbeychok, 2007, Wikipedia) ................................................................... 48
Figure 18. SBR process phases (T&D Water technologies and development) ........ 49
Figure 19. MBR maintenance (Hazen & Sawyer) .................................................... 50
Figure 20. Containers into which water is pumped. Coagulant is added into left tank
and alkali is added into the right tank. (Mamilović, D.) .............................................. 52
VIII
Figure 21. Possible WWTP diagrams for wastewater treatment plant in harbours .. 55
Figure 22. A Simplified Schematic of a Scanship Advanced Wastewater Purification
System (Koboević and Kurtela, 2011) ...................................................................... 58
Figure 23. Comparison of concentration in influent and waste biomass from cruise
ship advanced wastewater treatment ....................................................................... 59
Figure 24. Meter that determines the amount of time and reagent addition
(Mamilović, D.) .......................................................................................................... 62
Figure 25. Percentage of collected answers to the first questionnaire ..................... 63
Figure 26. Collected answers to the question "Is there a WWTP in the harbour?" .. 65
Figure 27. Collected answers to the question "Do you have a plan to build in the
harbour a WWTP in the next 10 years?" .................................................................. 66
Figure 28. Collected answers to the question "Do you make effluent analysis?" ..... 67
Figure 29. Simplified Schematic of Traditional Type II Marine Sanitation Device
Using Biological Treatment and Chlorine Disinfection (US environmental protection
agency, 2008) ........................................................................................................... 70
Figure 30. Sewage tank with 2 pumps (red – green) ............................................... 71
Figure 31. MBR Hamworthy water systems key design criteria – cruise ship .......... 72
Figure 32. Screen press operation ........................................................................... 73
Figure 33. General layout of bioreactor stages ........................................................ 73
Figure 34. Biomass Colour chart – Hamworthy MBR .............................................. 74
Figure 35. Simplified schematic for wastewater treatment onboard ......................... 77
Figure 36. Factory certificate for sewage plant onboard – cargo ship ...................... 79
Figure 37. Technology scheme for sewage treatment – cargo ship chemical
treatment .................................................................................................................. 80
Figure 38. Discharging of wastewater from a warship into trucks ............................ 82
Figure 39. Preparing for pumping the wastewater ................................................... 83
Figure 40. Port of Lisbon – map with position of terminals....................................... 84
Figure 41. Scheme for a WWTP from petrochemical industry (Oligae) ................... 86
Figure 42. Possible locations for wastewater treatment plants on both side of river
Tagus – Port of Lisbon.............................................................................................. 87
Figure 43. Distance for complying MARPOL, left – Port of Rijeka, Croatia, right –Port
of Lisbon, Portugal .................................................................................................... 89
IX
LIST OF TABLES
Table 1. Constituents present in wastewater (based on Henze et al., 2001).............. 5
Table 2. Variations in person load (Henze et al., 2001) ............................................. 8
Table 3. Person load in various countries kg/cap.yr (Henze et al., 2002) .................. 8
Table 4. Typical composition of raw municipal wastewater with minor contributions of
industrial wastewater (g/m3) (based on Henze et al., 2008) ....................................... 9
Table 5. Waste and wastewater generation on cruise ships by zone based on data
from the year 2000 (Herz, 2002) ............................................................................... 12
Table 6. Common sources and characteristics of Graywater (US environmental
protection agency, 2008) .......................................................................................... 15
Table 7. Characteristics of ballast water samples – Port of Koper, Slovenia,
Mediterranean sea (David M., et al., 2007) ............................................................... 18
Table 8. Regulations on black and graywater discharges (Chen, 2013) .................. 23
Table 9. Requirements for discharge from urban wastewater treatment plants ....... 25
Table 10. Comparison of requirements for the quality of effluent discharged from
ships and from wastewater treatment plants on land ................................................ 26
Table 11. Comparison of untreated graywater concentrations – Pathogen indicators
(US environmental protection agency, 2008) ............................................................ 27
Table 12. Comparison of untreated graywater concentrations to untreated domestic
wastewater – Conventional pollutants and other common analytes (US environmental
protection agency, 2008) .......................................................................................... 28
Table 13. Comparison of untreated graywater concentrations to untreated domestic
wastewater – Nutrients (US environmental protection agency, 2008) ...................... 30
Table 14. Levels of wastewater treatment (Metcalf and Eddy, 2004) ....................... 32
Table 15. Most common facilities for biological wastewater treatment divided by way
of maintaining microorganisms ................................................................................. 41
Table 16. Description of commonly used devices for wastewater aeration (Metcalf
and Eddy, 2004) ....................................................................................................... 42
Table 17. Comparison of requirements for the quality of effluent from vessels ........ 60
Table 18. Comparison of number of people onboard and capacity of sewage plant
onboard for cargo and cruise ships .......................................................................... 78
X
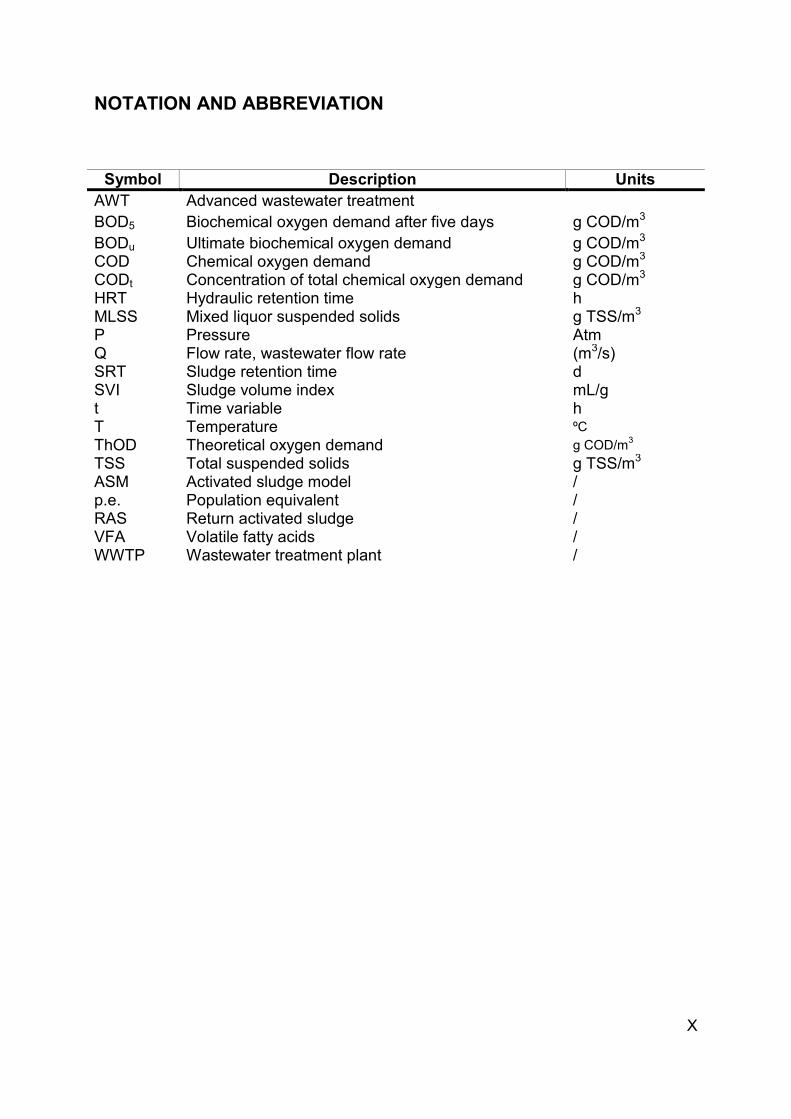
NOTATION AND ABBREVIATION
Symbol Description Units
AWT Advanced wastewater treatment
BOD5 Biochemical oxygen demand after five days g COD/m3
BODu Ultimate biochemical oxygen demand g COD/m3 COD Chemical oxygen demand g COD/m3 CODt Concentration of total chemical oxygen demand g COD/m3 HRT Hydraulic retention time h MLSS Mixed liquor suspended solids g TSS/m3 P Pressure Atm Q Flow rate, wastewater flow rate (m3/s) SRT Sludge retention time d SVI Sludge volume index mL/g t Time variable h T Temperature ºC
ThOD Theoretical oxygen demand g COD/m3
TSS Total suspended solids g TSS/m3
ASM Activated sludge model / p.e. Population equivalent / RAS Return activated sludge / VFA Volatile fatty acids / WWTP Wastewater treatment plant /
1
1. INTRODUCTION
1.1. Background and motivation of this thesis
Nowadays, wastewater treatment has become an important issue of modern
society. Over the past 100 years or so, wastewater treatment on land has been
successfully developed. However, the marine industry is still working to develop
its means of treating wastewater (Chen, 2013.). Into receiving waters (sea, rivers,
and lakes) not only wastewaters from the households are discharged but also
wastewaters from different industries, contaminated with various heavy metals,
pathogens, nutrients, etc. The impact of sewage on marine environment is
concern. Industry that manufactures small treatment plants for marine use has
been significantly improved in the last 10 years. Researching more about
wastewater treatment in harbours and to find answers to the questions like – what
kind of wastewater can be purified on wastewater treatment plant in harbours,
what are the problems that can be encountered in wastewater treatment plants,
which processes of wastewater treatment should be provided, what are obligatory
legal standards required for discharging the wastewater into the natural recipient
whether it is on the ocean or the Mediterranean sea – is important.
Wastewater treatment approaches are aimed at reducing pollution of
wastewater to the quality that is defined by law or to the concentration of pollution
in effluent which will not compromise the quality of the receiving waters and cause
negative effects on human health or environment.
Wastewater treatment processes are divided into three parts, after
pretreatment. Pretreatment includes removing grease, sand and any bigger
particles that can be easily collected before they damage devices in wastewater
treatment plants. The first part is Primary treatment which is mostly a compound
of physical processes that include sedimentation and removing of primary sludge.
Secondary treatment processes generally use bacteria to decompose organic
matters and secondary sedimentation at the end of the process. The potential
pollutants remaining after the secondary sewage treatment include heavy metals,
nutrients and non – biodegradable organic compounds. Tertiary treatment
2
provides the removal of all unwanted particles and further improvement of the
effluent quality if necessary. The tertiary treatment is also called final treatment.
“Advanced sewage treatment” is a generally term covering treatment
designed to remove most substances. A variety of types of Advanced Wastewater
Treatment Systems are available. Some are better proven than others and some
are more complex and expensive, depending on their size and design (Koboević
and Kurtela, 2011). Usually such devices are normal on big ships where it is
necessary, during the voyage, to execute the entire process of purification.
1.2. Objective
The thesis will be focused on the different types of wastewater which can be
found in harbour treatment plants, as well as on the problems that may be
encountered in wastewater treatment plants in harbours, on the oceans and/or
harbours in the Mediterranean and the Adriatic Sea. “Closed Sea“, like the
Mediterranean and the Adriatic Sea, should be stronger protected against a
possible environmental disaster due to lesser – renewable water status and to the
need to assume a high quality of water. An important part of this thesis will be
dedicated to the wastewater treatment onboard. In the thesis possibilities for
wastewater treatment onboard and, in their absence, ways of storing and
transferring wastewater to wastewater treatment plants on land will be discussed.
For the design of wastewater treatment plant it is necessary to determine:
quantity of wastewater;
characteristics of wastewater;
characteristics of receiving waters (ocean, sea, river, etc.);
legal requirements;
processes of wastewater treatment;
processes of sludge treatment and disposal.
These subjects are all covered in the thesis. Furthermore, a case study is
presented in order to illustrate what typically may happen in a harbour, present
3
the main problems and constraints they have regarding ships, as well as
wastewater handling and disposal.
1.3. Outline of the thesis
The thesis is divided into 7 chapter and 5 appendices.
Chapter 1 introduces the problem (why this topic was selected) and
background for it, including the goals and structure of the work.
In Chapter 2 the types of wastewater that can be found in wastewater
treatment plants situated in harbours are described. Wastewater is divided into
domestic wastewater from the narrow coastal area that cannot be treated in
biological wastewater treatment plants connected to the main sewage system;
industrial wastewater which can be present in harbours, on boat washing areas or
in shipyards, etc. and wastewater produced on vessels with focus on big ships
(cruise ships, cargo ships and warships).
Chapter 3 introduces legal requirements on land as well as legal requirements
which vessels on the sea must comply with, including a comparison of legal
regulations and effluent standards on board and on land.
Chapter 4 describes different types of wastewater treatment. This chapter is
divided into three parts (physical treatment, biological and chemical wastewater
treatment), with basic explanations of each of them and where they can be
applied. Also in this chapter, the most commonly used treatment units/devices for
each process or operation are listed.
Chapter 5 reviews problems and possible solutions based on types of
wastewater which can be produced in the harbour or brought by the ship to the
wastewater treatment plant situated inside the harbour. Problems are presented
for each type of wastewater, including the different kind of problems that can
occur on wastewater treatment plants, and possible solutions are given for each
problem.
4
Chapter 6 refers to the case study and includes all aspects of the work carried
out mostly in Lisbon harbour. Characterization of wastewater treatment from
different vessels (warships, cargo ships and cruise ships), problems that occur
onboard as well as problems that occur in harbours, and short description of most
commonly used wastewater treatment plants onboard. In the last subchapter, the
conceptual design of wastewater treatment plant for Port of Lisbon is given.
Chapter 7 is the conclusion of the work. It summarizes all the collected
knowledge about wastewater treatment in harbours and gives perspectives for
future design and construction of wastewater treatment plants, or development
and improvement of already existing wastewater treatment plants.
The form that all vessels have to fill according to Directive 200/59/EC on port
reception facilities for ship – generated waste and cargo residues – FORM is
given in Appendix A.1.
Appendix A.2 shows effluent concentration for traditional type II marine
sanitation device (MSD).
Appendix A.3 introduces first questionnaire that was send to 60 harbours in
Mediterranean sea. List of harbours is given in Appendix A.4.
The second questionnaire, questionnaire for ships, is shown in Appendix A.5.
5
2. VARIETY OF WASTEWATERS IN HARBOURS
2.1. Overview of wastewater characteristics
The most important thing for the design of wastewater treatment plant is a very
detailed analysis of the type of wastewater (prediction of quality and quantity) that
can be found in the harbour. If the analysis of wastewater in not done properly,
wastewater treatment plant will be either oversized or undersized and the output
quality parameters of wastewater will not comply legal standards. Of course,
poorly designed wastewater treatment plants mean big financial loses and
nowadays, this is completely unacceptable.
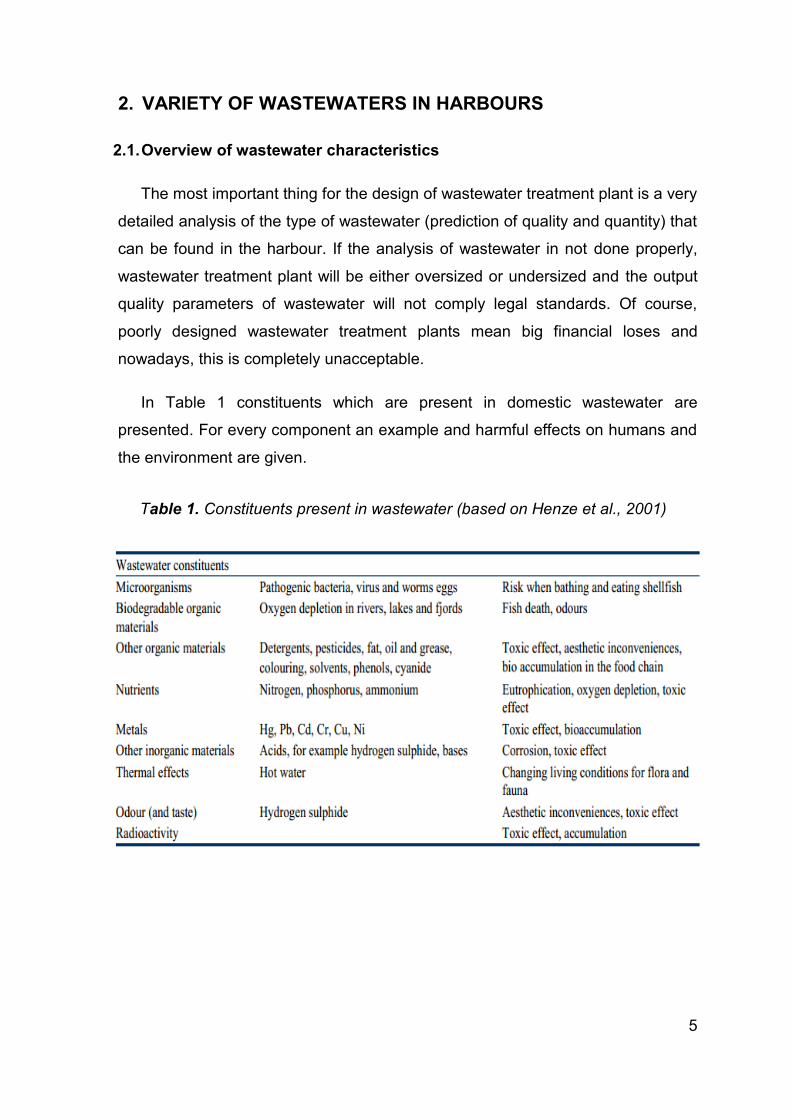
In Table 1 constituents which are present in domestic wastewater are
presented. For every component an example and harmful effects on humans and
the environment are given.
Table 1. Constituents present in wastewater (based on Henze et al., 2001)
6
For a better understanding of the quality of the wastewater it is necessary to
define which are the important parameters for wastewater treatment in the
wastewater treatment plant, focusing on the following:
Dispersed substances are amount of substances dispersed in a
unit of volume of water (mg/l or g/m3)
Biochemical oxygen demand (BOD), which determines the
amount of oxygen required to biologically break down organic matter by
microorganisms (mgO2/l)
Chemical oxygen demand (COD), that determine the amount of
organic pollutants found in wastewater. It is expressed in milligrams per
liter (mg/l) also referred to as pp, (aperts per million) which indicates the
mass of oxygen consumed per liter of solution
Indicator organism, such as coliforms, which presence in
wastewater indicates that water may contain pathogenic organisms.
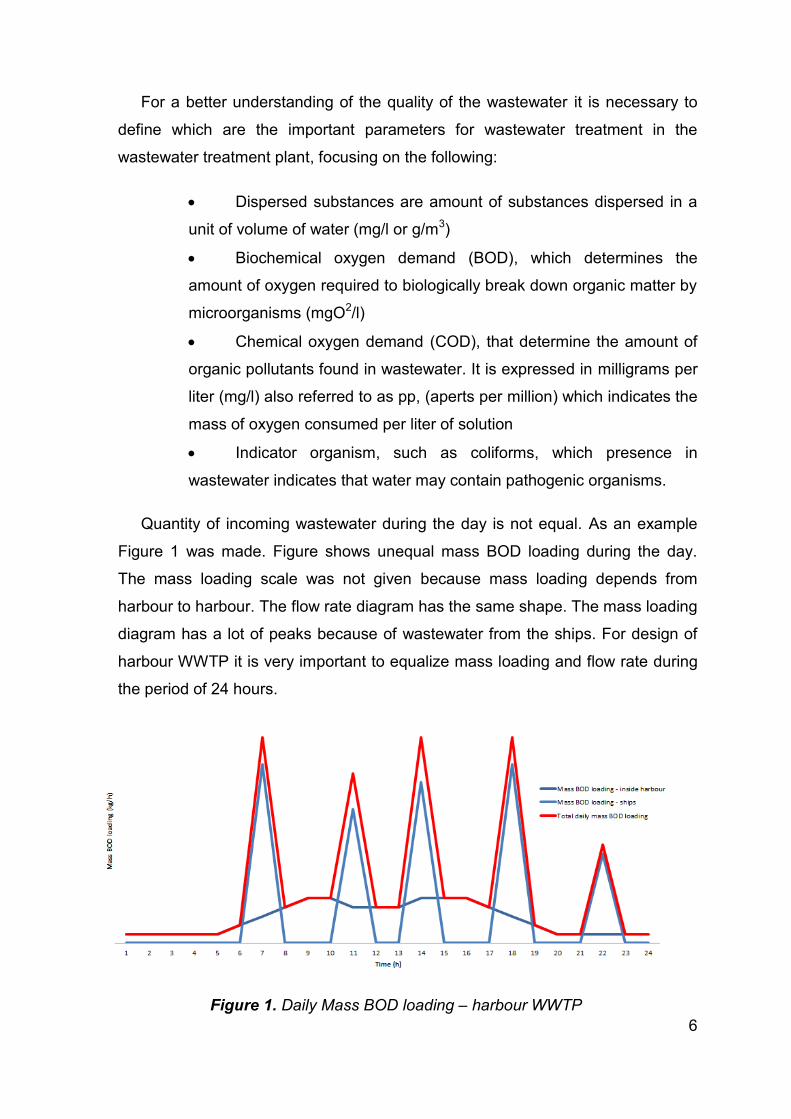
Quantity of incoming wastewater during the day is not equal. As an example
Figure 1 was made. Figure shows unequal mass BOD loading during the day.
The mass loading scale was not given because mass loading depends from
harbour to harbour. The flow rate diagram has the same shape. The mass loading
diagram has a lot of peaks because of wastewater from the ships. For design of
harbour WWTP it is very important to equalize mass loading and flow rate during
the period of 24 hours.
Figure 1. Daily Mass BOD loading – harbour WWTP
7
In the following subchapters typical characteristics of wastewater in harbours
will be presented regarding their average quality but also some information’s
about the quantity of wastewater produced will be given.
2.2. Sanitary wastewater
Domestic wastewater from the harbours is usually fecal water from office
buildings and other buildings with sewage systems which can be found in the
harbours (booths, workshops, locker rooms etc.). Also, domestic wastewater
includes water from showers and the harbour canteens (water from cooking,
washing dishes, sinks etc.) as well as wastewater from restaurants that can be
parts of harbours intended for cruise ship passengers, skippers or tourists.
Domestic wastewater from the harbours has the same quality as wastewater from
domestic sewage systems which simplifies the design of wastewater treatment
plants because the processes of purification are well known and common for
engineers.
To determine the quantity of domestic wastewater it is necessary to
understand the unit Population Equivalent (PE). PE can be expressed in water
volume or BOD. The two definitions used are:
1 PE = 0,2 m3/day
1 PE = 60 g BOD/day
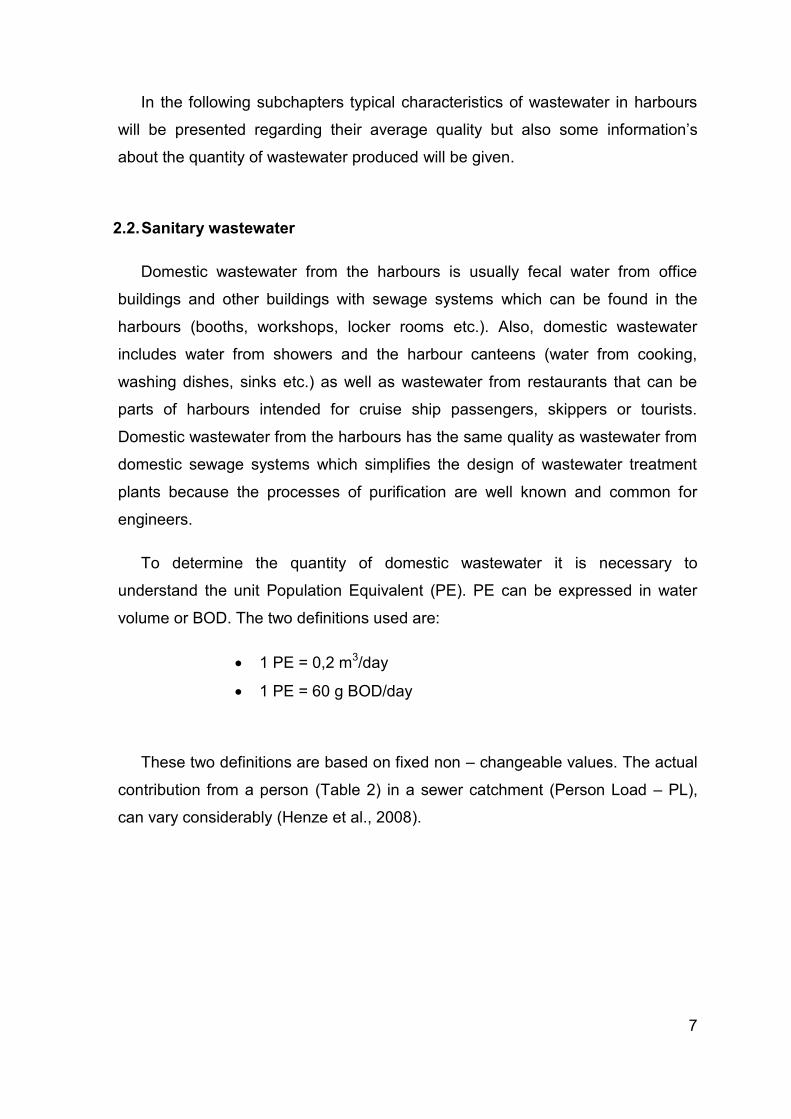
These two definitions are based on fixed non – changeable values. The actual
contribution from a person (Table 2) in a sewer catchment (Person Load – PL),
can vary considerably (Henze et al., 2008).
8
Table 2. Variations in person load (Henze et al., 2001)
Parameter Unit Range
COD g/cap.day 25 -200
BOD g/cap.day 15 – 80
Nitrogen g/cap.day 2 – 15
Phosphorus g/cap.day 1 – 3
Wastewater m3/cap.day 0,05 – 0,40
The reasons for the variations can be working place outside the catchment,
socio – economic factors, lifestyle, types of households’ installations etc. The
Person Load depends from country to country, as demonstrated by the values
given in Table 3.
Table 3. Person load in various countries kg/cap.yr (Henze et al., 2002)
Parameter Brazil Egypt Turkey USA Denmark Germany
BOD 20 – 25 10 – 15 10 – 15 30 – 35 20 – 25 20 – 25
TSS 20 – 25 15 – 25 15 – 25 30 – 35 30 – 35 30 – 35
N total 3 – 5 3 – 5 3 – 5 5 – 7 5 – 7 4 – 6
P total 0,5 – 1 0,4 – 0,6 0,4 – 0,6 0,8 – 1,2 0,8 – 1,2 0,7 – 1
The quality of sanitary (domestic) wastewater varies from location to location.
The concentrations found in wastewater are a combination of pollutant load and
the amount of water with which the pollutant was mixed. In addition, sanitary
wastewater includes the rainwater collected from the open spaces so the quality
of wastewater also depends on weather.
The composition of typical domestic/municipal wastewater is shown in Table 4
where concentrated wastewater (high) represents cases with low water
consumption and/or infiltration. Diluted wastewater (low) represents high water
consumption and/or infiltration. Storm water will further dilute the wastewater as
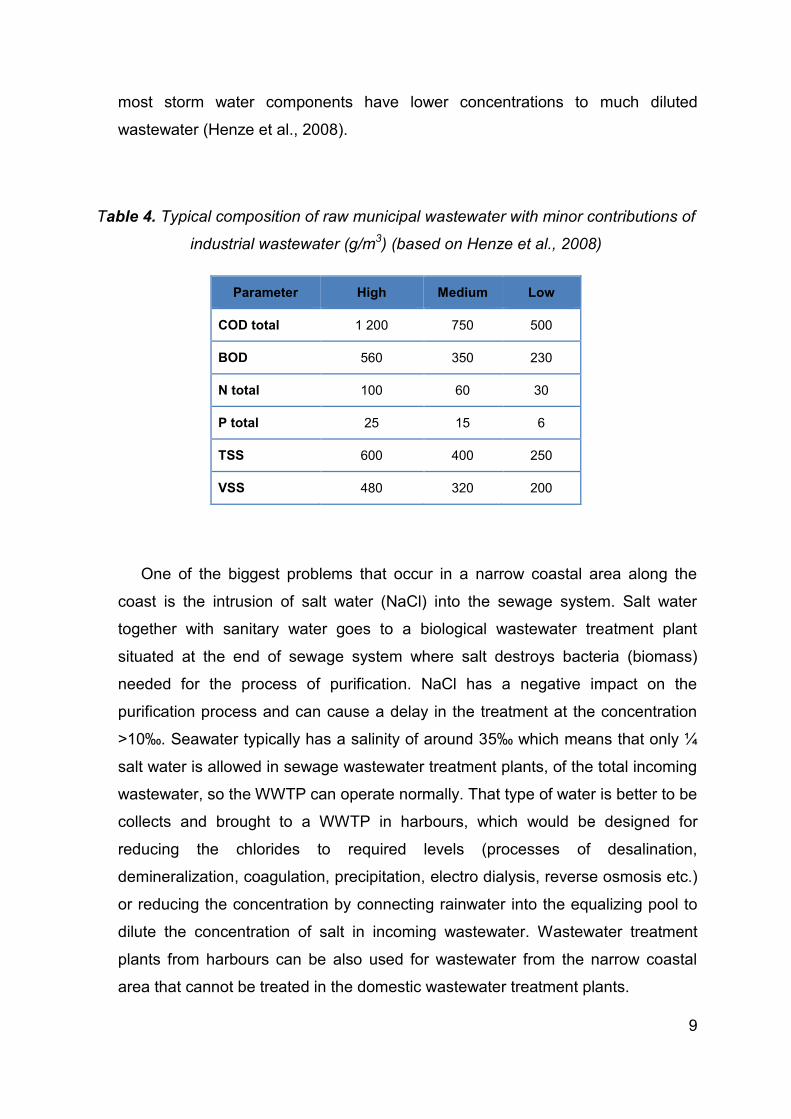
9
most storm water components have lower concentrations to much diluted
wastewater (Henze et al., 2008).
Table 4. Typical composition of raw municipal wastewater with minor contributions of
industrial wastewater (g/m3) (based on Henze et al., 2008)
Parameter High Medium Low
COD total 1 200 750 500
BOD 560 350 230
N total 100 60 30
P total 25 15 6
TSS 600 400 250
VSS 480 320 200
One of the biggest problems that occur in a narrow coastal area along the
coast is the intrusion of salt water (NaCl) into the sewage system. Salt water
together with sanitary water goes to a biological wastewater treatment plant
situated at the end of sewage system where salt destroys bacteria (biomass)
needed for the process of purification. NaCl has a negative impact on the
purification process and can cause a delay in the treatment at the concentration
>10‰. Seawater typically has a salinity of around 35‰ which means that only ¼
salt water is allowed in sewage wastewater treatment plants, of the total incoming
wastewater, so the WWTP can operate normally. That type of water is better to be
collects and brought to a WWTP in harbours, which would be designed for
reducing the chlorides to required levels (processes of desalination,
demineralization, coagulation, precipitation, electro dialysis, reverse osmosis etc.)
or reducing the concentration by connecting rainwater into the equalizing pool to
dilute the concentration of salt in incoming wastewater. Wastewater treatment
plants from harbours can be also used for wastewater from the narrow coastal
area that cannot be treated in the domestic wastewater treatment plants.
10
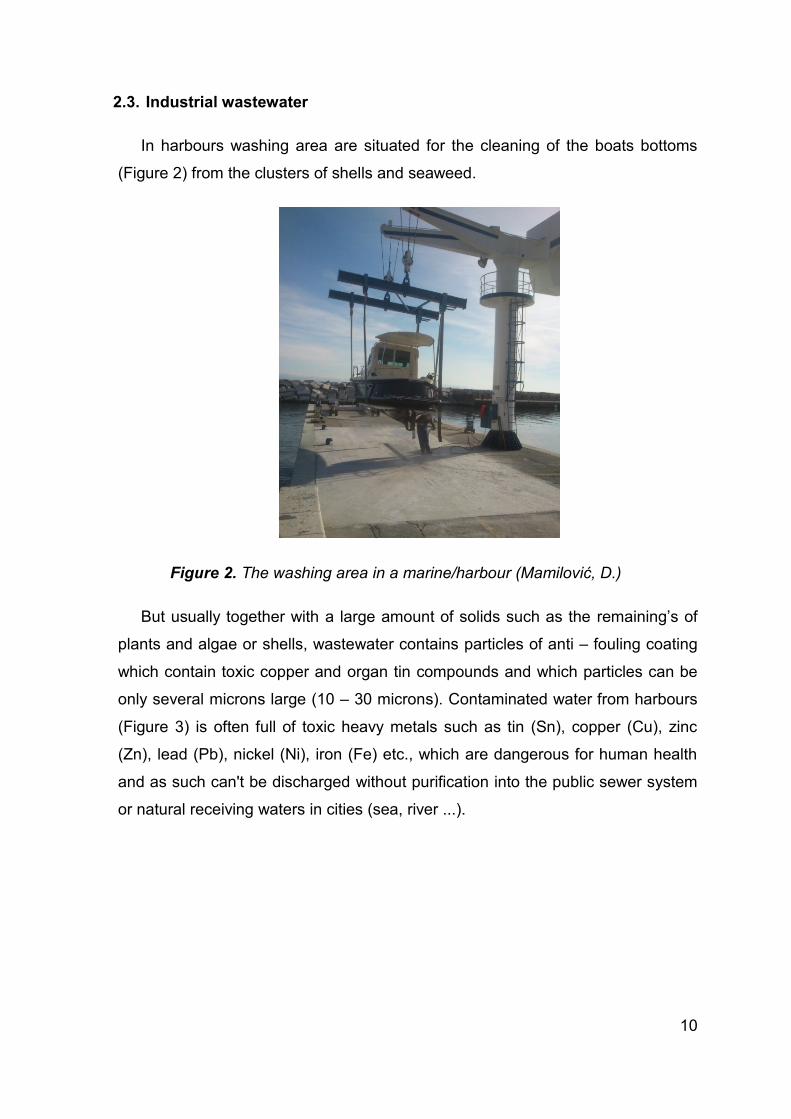
2.3. Industrial wastewater
In harbours washing area are situated for the cleaning of the boats bottoms
(Figure 2) from the clusters of shells and seaweed.
Figure 2. The washing area in a marine/harbour (Mamilović, D.)
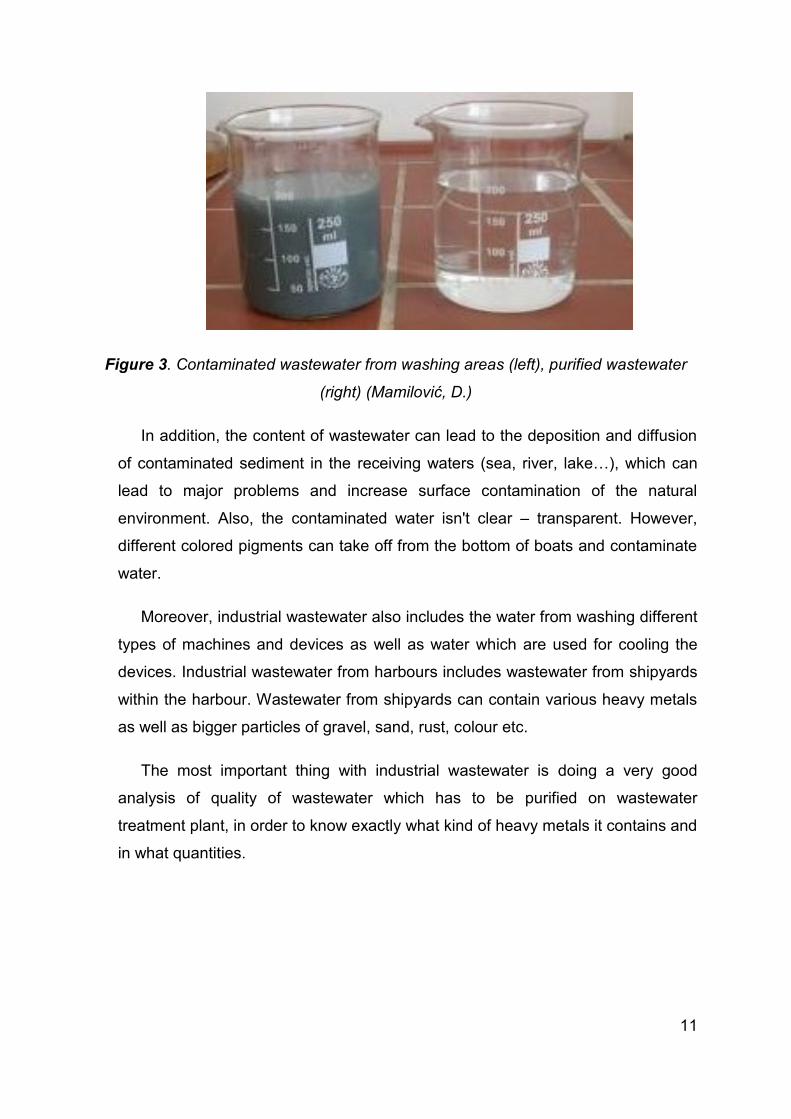
But usually together with a large amount of solids such as the remaining’s of
plants and algae or shells, wastewater contains particles of anti – fouling coating
which contain toxic copper and organ tin compounds and which particles can be
only several microns large (10 – 30 microns). Contaminated water from harbours
(Figure 3) is often full of toxic heavy metals such as tin (Sn), copper (Cu), zinc
(Zn), lead (Pb), nickel (Ni), iron (Fe) etc., which are dangerous for human health
and as such can't be discharged without purification into the public sewer system
or natural receiving waters in cities (sea, river ...).
11
Figure 3. Contaminated wastewater from washing areas (left), purified wastewater
(right) (Mamilović, D.)
In addition, the content of wastewater can lead to the deposition and diffusion
of contaminated sediment in the receiving waters (sea, river, lake…), which can
lead to major problems and increase surface contamination of the natural
environment. Also, the contaminated water isn't clear – transparent. However,
different colored pigments can take off from the bottom of boats and contaminate
water.
Moreover, industrial wastewater also includes the water from washing different
types of machines and devices as well as water which are used for cooling the
devices. Industrial wastewater from harbours includes wastewater from shipyards
within the harbour. Wastewater from shipyards can contain various heavy metals
as well as bigger particles of gravel, sand, rust, colour etc.
The most important thing with industrial wastewater is doing a very good
analysis of quality of wastewater which has to be purified on wastewater
treatment plant, in order to know exactly what kind of heavy metals it contains and
in what quantities.
12
2.4. Wastewater from ships
Big cruise liners can carry up to 5 000 people including a crew. During the one
week they cruise ship capacity of some 2 000 – 3 000 passengers can generate 7
000 tons of waste. Wastewater on board can be sanitary wastewater divided into
“black water“ sewage containing feces and “gray water“ wastewater from washing
of living quarters, and Oily Bilge water mixture of water, oily fluids, lubricants,
cleaning fluids and other similar wastes that accumulate the lowest part of vessel
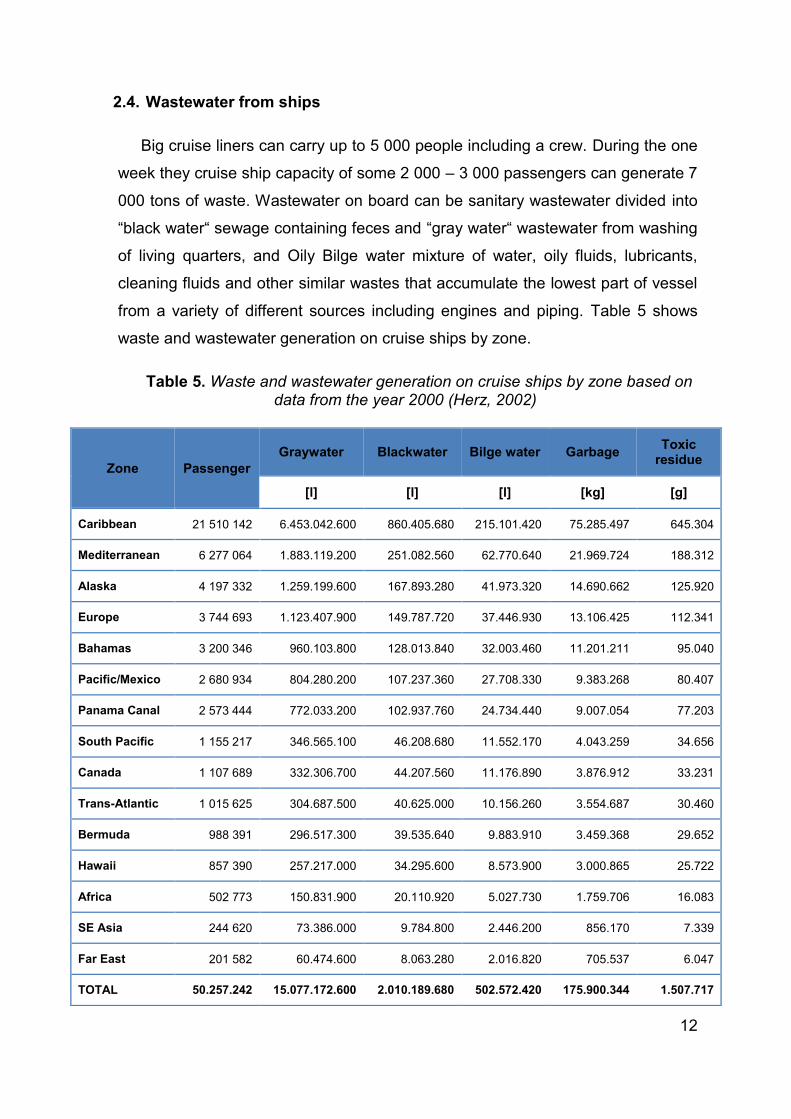
from a variety of different sources including engines and piping. Table 5 shows
waste and wastewater generation on cruise ships by zone.
Table 5. Waste and wastewater generation on cruise ships by zone based on data from the year 2000 (Herz, 2002)
Zone Passenger
Graywater Blackwater Bilge water Garbage Toxic
residue
[l] [l] [l] [kg] [g]
Caribbean 21 510 142 6.453.042.600 860.405.680 215.101.420 75.285.497 645.304
Mediterranean 6 277 064 1.883.119.200 251.082.560 62.770.640 21.969.724 188.312
Alaska 4 197 332 1.259.199.600 167.893.280 41.973.320 14.690.662 125.920
Europe 3 744 693 1.123.407.900 149.787.720 37.446.930 13.106.425 112.341
Bahamas 3 200 346 960.103.800 128.013.840 32.003.460 11.201.211 95.040
Pacific/Mexico 2 680 934 804.280.200 107.237.360 27.708.330 9.383.268 80.407
Panama Canal 2 573 444 772.033.200 102.937.760 24.734.440 9.007.054 77.203
South Pacific 1 155 217 346.565.100 46.208.680 11.552.170 4.043.259 34.656
Canada 1 107 689 332.306.700 44.207.560 11.176.890 3.876.912 33.231
Trans-Atlantic 1 015 625 304.687.500 40.625.000 10.156.260 3.554.687 30.460
Bermuda 988 391 296.517.300 39.535.640 9.883.910 3.459.368 29.652
Hawaii 857 390 257.217.000 34.295.600 8.573.900 3.000.865 25.722
Africa 502 773 150.831.900 20.110.920 5.027.730 1.759.706 16.083
SE Asia 244 620 73.386.000 9.784.800 2.446.200 856.170 7.339
Far East 201 582 60.474.600 8.063.280 2.016.820 705.537 6.047
TOTAL 50.257.242 15.077.172.600 2.010.189.680 502.572.420 175.900.344 1.507.717
13
2.4.1. Black water
Black water – sewage from vessels means human body waste and the waste
from toilets and other receptacles intended to receive or retain body wastes. On
some ships, medical sink and medical floor drain wastewater is co-mingled with
sewage for treatment (US environmental protection agency, 2008). Usually, ship
sewage systems use fresh water to flush the toilets (around 1,5 liter)
(Environmental Protection Agency – EPA, 2001) to reduce corrosion, or use
vacuum flushing if use of water is more expensive. But unfortunately there are still
some vessels that use sea water for flushing which makes the process of
wastewater treatment more difficult (high concentration of salt kills biomass in
biological WWTPs). Usually, vessels that use sea water for system (flushing,
cooling, etc.) are vessels built 30 – 40 years ago and didn't have a possibility for
system upgrade to fresh water.
Human sewage can contain bacteria, pathogens, viruses, parasites (eggs) and
different diseases. It can also contain harmful nutrients, particularly nitrogen. Big
concentration of nutrients can promote harmful algae blooms and decrease
dissolved oxygen in water.
Ships are not allowed to discharge untreated black water within 3 nautical
miles off shore for U.S Territory. At the Mediterranean sea, for example in Spain,
the vessels cannot discharge untreated sewage within Spanish territorial waters
(12 nautical miles) (ORDEN FOM/1144/2003 28. April 2003. The same distance is
required in Turkey.
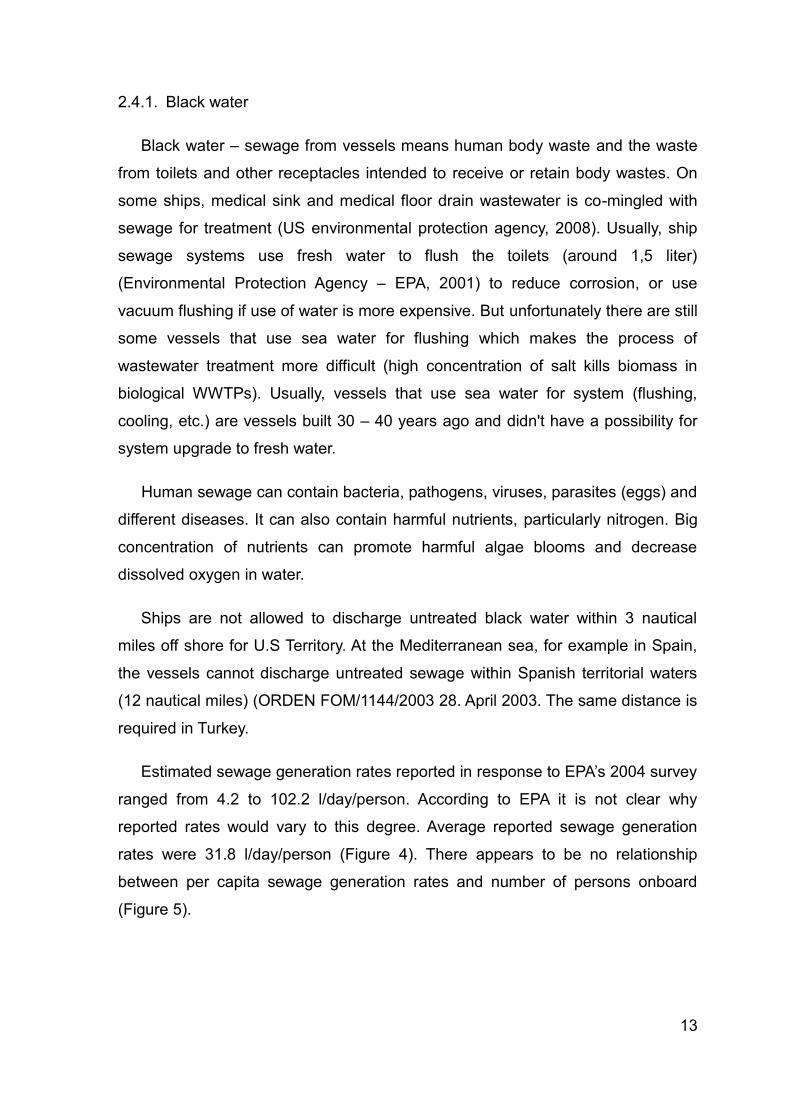
Estimated sewage generation rates reported in response to EPA’s 2004 survey
ranged from 4.2 to 102.2 l/day/person. According to EPA it is not clear why
reported rates would vary to this degree. Average reported sewage generation
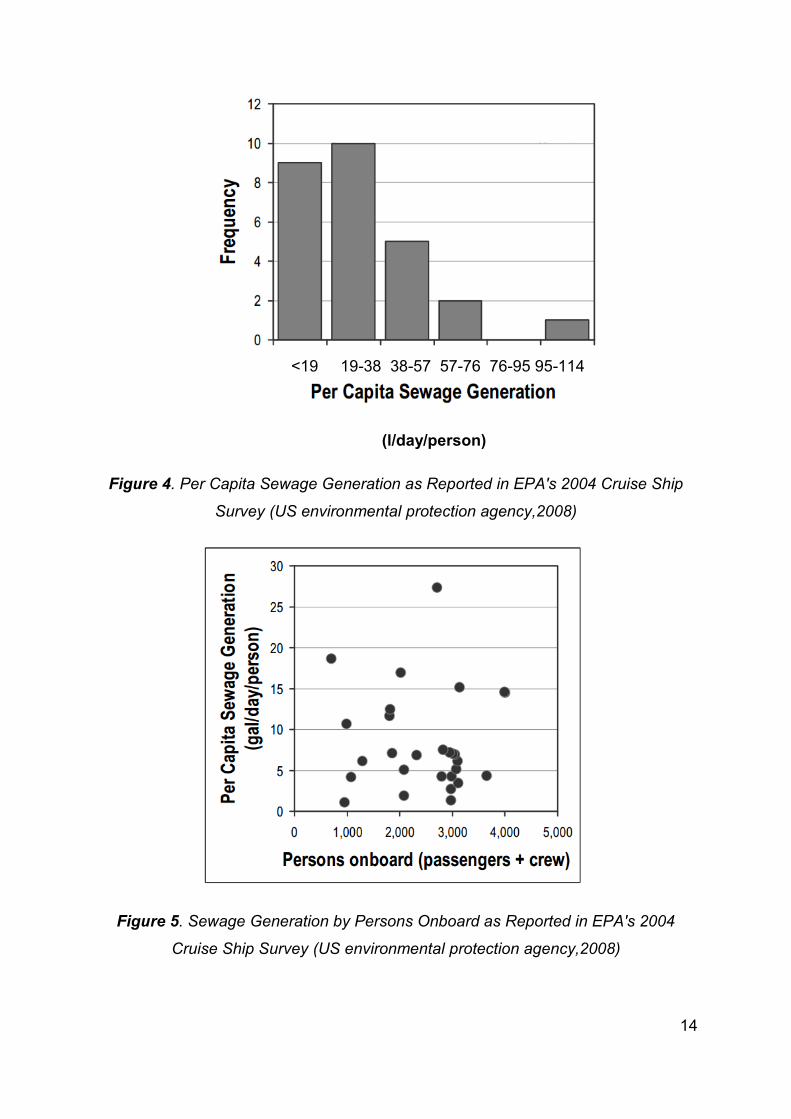
rates were 31.8 l/day/person (Figure 4). There appears to be no relationship
between per capita sewage generation rates and number of persons onboard
(Figure 5).
14
(l/day/person)
Figure 4. Per Capita Sewage Generation as Reported in EPA's 2004 Cruise Ship
Survey (US environmental protection agency,2008)
Figure 5. Sewage Generation by Persons Onboard as Reported in EPA's 2004
Cruise Ship Survey (US environmental protection agency,2008)
<19 19-38 38-57 57-76 76-95 95-114
15
2.4.2. Graywater
Graywater (or gray water) consist of non – sewage wastewater, including
drainage from dishwashers, showers, laundry, baths, galleys and washbasins
(Table 6). It can contain pollutants such as fecal coliform, food waste, oil and
grease, detergents, shampoos, cleaners, pesticides, heavy metals, and
sometimes medical and dental wastes (Herz, 2002).
Table 6. Common sources and characteristics of Graywater (US environmental protection agency, 2008)
Water source Characteristic
Automated Clothes Washer bleach, foam, high pH, hot water, nitrate, oil and grease, oxygen demand, phosphate, salinity, soaps, sodium, suspended solids, turbidity
Automatic Dish Washer
bacteria, foam, food particles, high pH, hot water, odor, oil and grease, organic matter, oxygen demand, salinity, soaps, suspended solids, turbidity
Sinks, including kitchen bacteria, food particles, hot water, odor, oil and grease, organic matter, oxygen demand, soaps, suspended solids, turbidity
Bathtub and Shower bacteria, hair, hot water, odor, oil and grease, oxygen demand, soaps, suspended solids, turbidity
Graywater is essentially unregulated by law and may be discharged almost
everywhere in the oceans but in the Mediterranean sea, Turkey has a legislation
that doesn't permit discharge of either black, gray water or bilge water pumping
within territorial waters (12 nautical miles away from land). For other countries on
Mediterranean sea, information about prohibition of discharge gray water was not
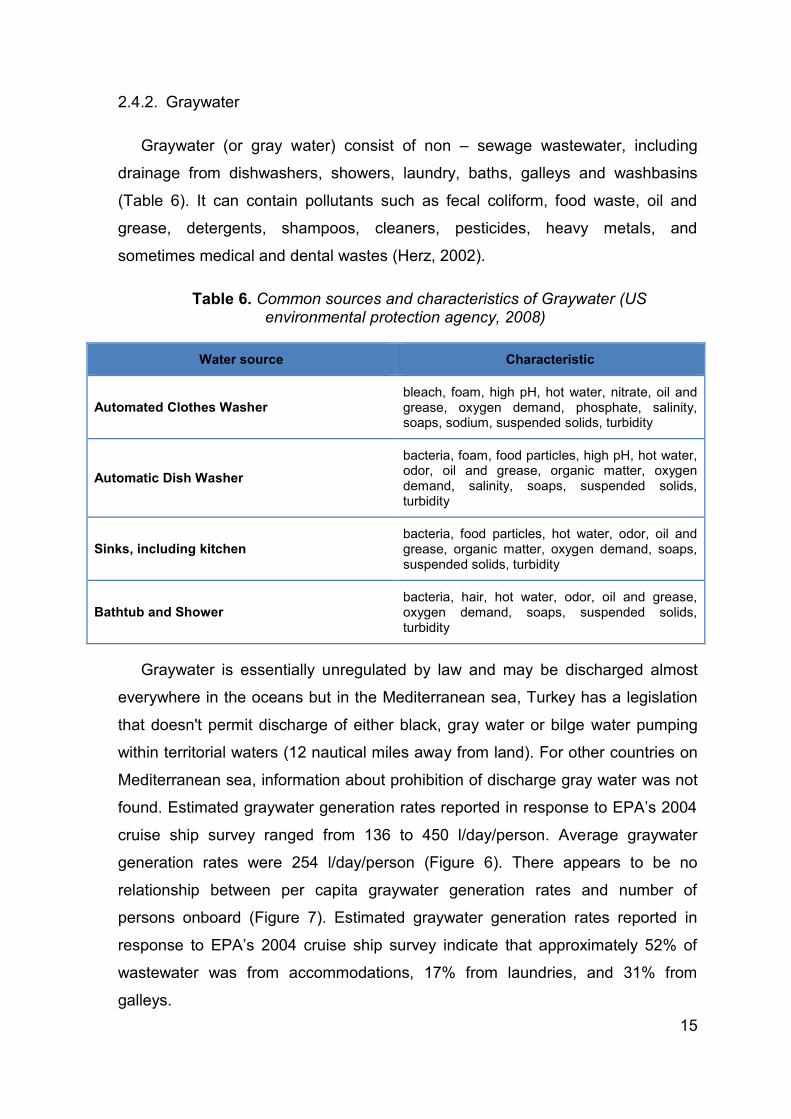
found. Estimated graywater generation rates reported in response to EPA’s 2004
cruise ship survey ranged from 136 to 450 l/day/person. Average graywater
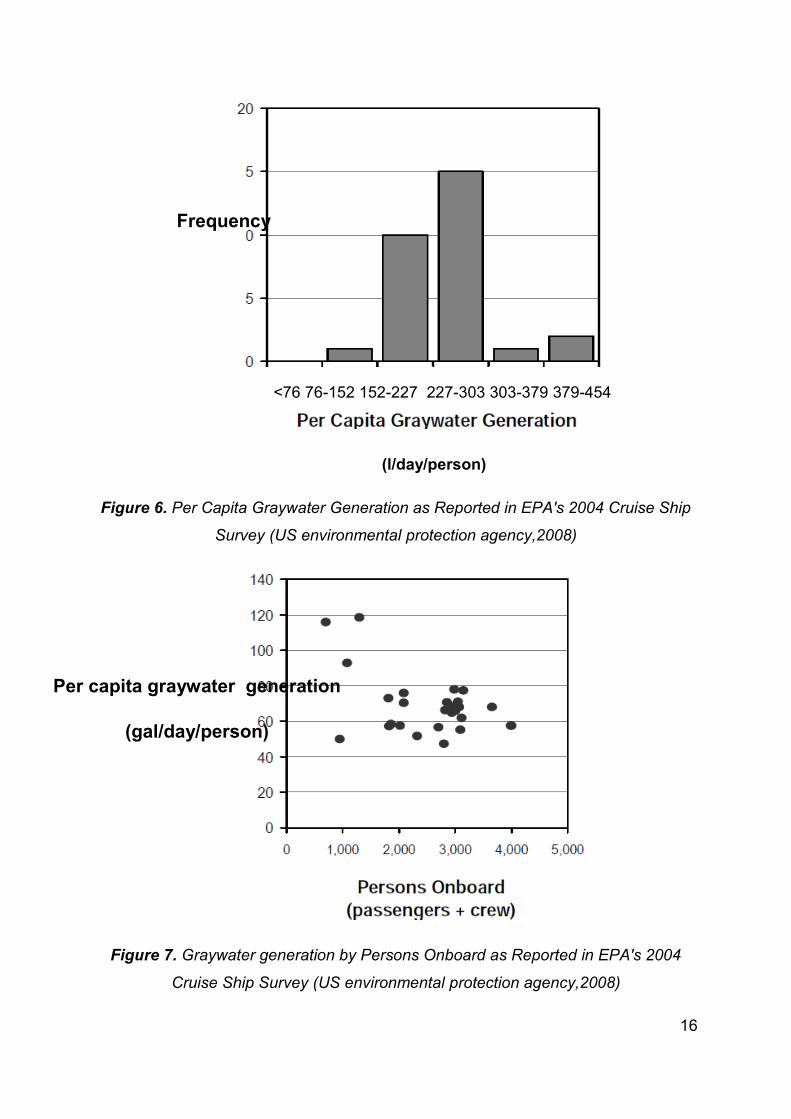
generation rates were 254 l/day/person (Figure 6). There appears to be no
relationship between per capita graywater generation rates and number of
persons onboard (Figure 7). Estimated graywater generation rates reported in
response to EPA’s 2004 cruise ship survey indicate that approximately 52% of
wastewater was from accommodations, 17% from laundries, and 31% from
galleys.
16
(l/day/person)
Figure 6. Per Capita Graywater Generation as Reported in EPA's 2004 Cruise Ship
Survey (US environmental protection agency,2008)
Figure 7. Graywater generation by Persons Onboard as Reported in EPA's 2004
Cruise Ship Survey (US environmental protection agency,2008)
<76 76-152 152-227 227-303 303-379 379-454
Frequency
Per capita graywater generation
(gal/day/person)
17
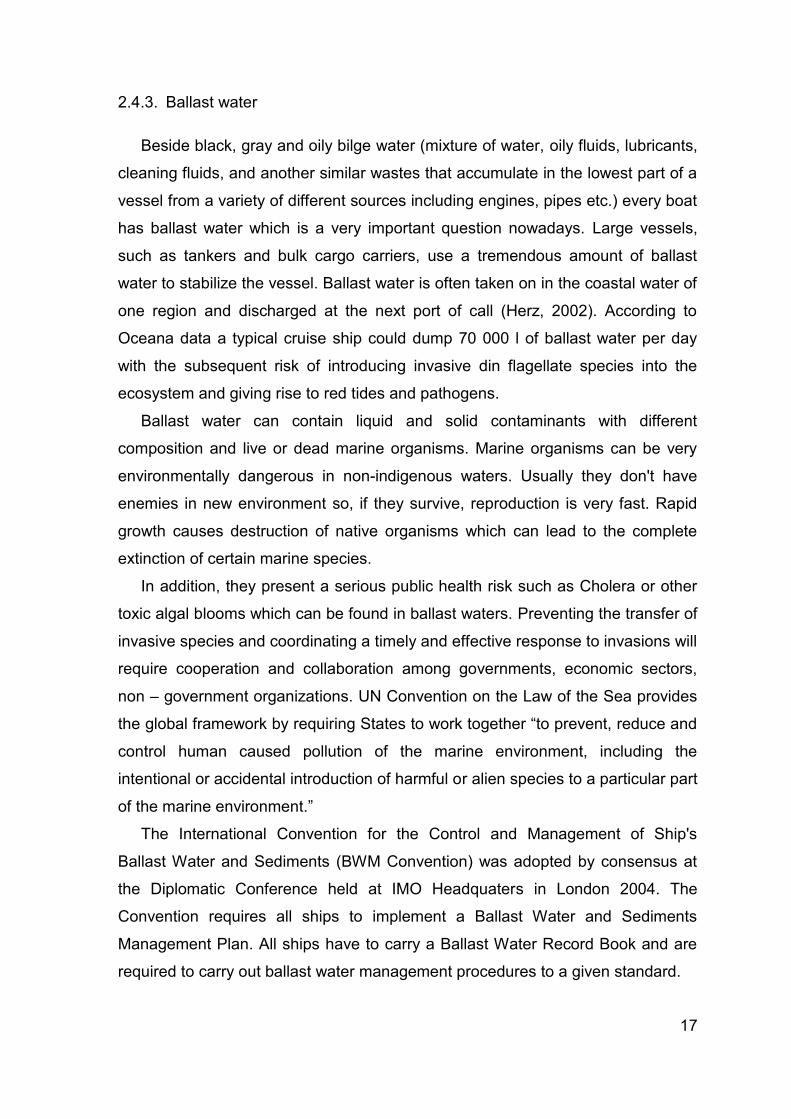
2.4.3. Ballast water
Beside black, gray and oily bilge water (mixture of water, oily fluids, lubricants,
cleaning fluids, and another similar wastes that accumulate in the lowest part of a
vessel from a variety of different sources including engines, pipes etc.) every boat
has ballast water which is a very important question nowadays. Large vessels,
such as tankers and bulk cargo carriers, use a tremendous amount of ballast
water to stabilize the vessel. Ballast water is often taken on in the coastal water of
one region and discharged at the next port of call (Herz, 2002). According to
Oceana data a typical cruise ship could dump 70 000 l of ballast water per day
with the subsequent risk of introducing invasive din flagellate species into the
ecosystem and giving rise to red tides and pathogens.
Ballast water can contain liquid and solid contaminants with different
composition and live or dead marine organisms. Marine organisms can be very
environmentally dangerous in non-indigenous waters. Usually they don't have
enemies in new environment so, if they survive, reproduction is very fast. Rapid
growth causes destruction of native organisms which can lead to the complete
extinction of certain marine species.
In addition, they present a serious public health risk such as Cholera or other
toxic algal blooms which can be found in ballast waters. Preventing the transfer of
invasive species and coordinating a timely and effective response to invasions will
require cooperation and collaboration among governments, economic sectors,
non – government organizations. UN Convention on the Law of the Sea provides
the global framework by requiring States to work together “to prevent, reduce and
control human caused pollution of the marine environment, including the
intentional or accidental introduction of harmful or alien species to a particular part
of the marine environment.”
The International Convention for the Control and Management of Ship's
Ballast Water and Sediments (BWM Convention) was adopted by consensus at
the Diplomatic Conference held at IMO Headquaters in London 2004. The
Convention requires all ships to implement a Ballast Water and Sediments
Management Plan. All ships have to carry a Ballast Water Record Book and are
required to carry out ballast water management procedures to a given standard.
18
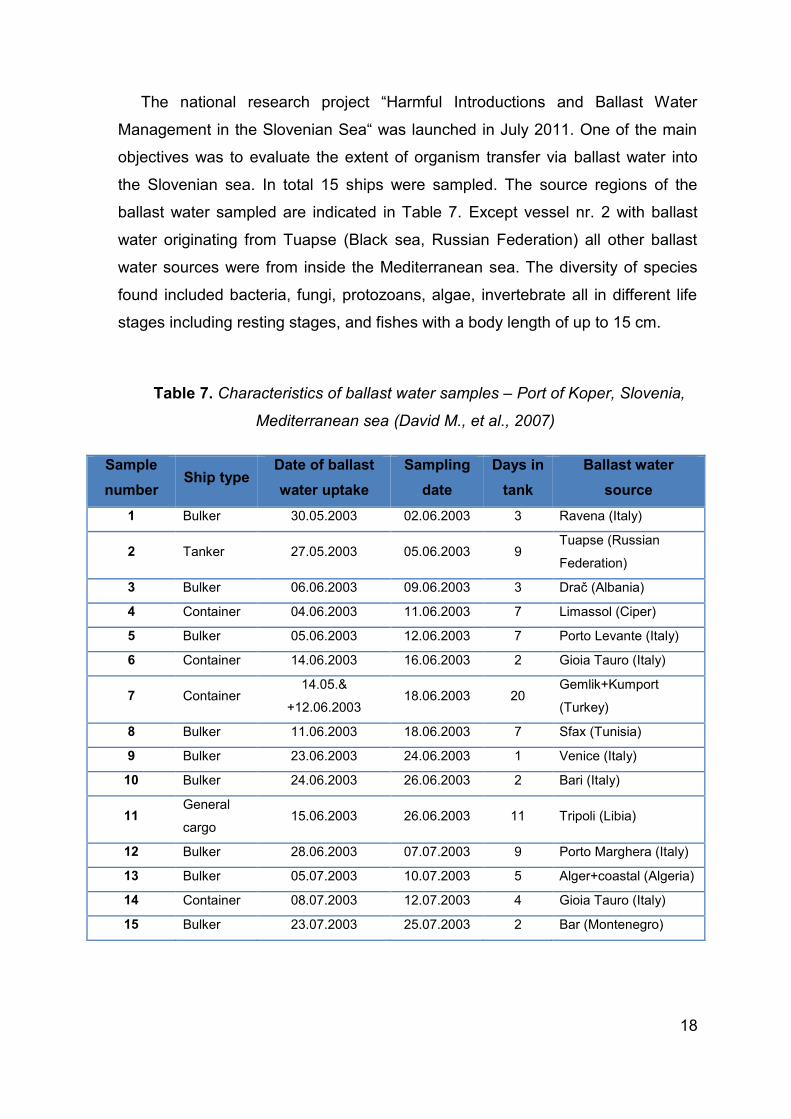
The national research project “Harmful Introductions and Ballast Water
Management in the Slovenian Sea“ was launched in July 2011. One of the main
objectives was to evaluate the extent of organism transfer via ballast water into
the Slovenian sea. In total 15 ships were sampled. The source regions of the
ballast water sampled are indicated in Table 7. Except vessel nr. 2 with ballast
water originating from Tuapse (Black sea, Russian Federation) all other ballast
water sources were from inside the Mediterranean sea. The diversity of species
found included bacteria, fungi, protozoans, algae, invertebrate all in different life
stages including resting stages, and fishes with a body length of up to 15 cm.
Table 7. Characteristics of ballast water samples – Port of Koper, Slovenia,
Mediterranean sea (David M., et al., 2007)
Sample
number Ship type
Date of ballast
water uptake
Sampling
date
Days in
tank
Ballast water
source
1 Bulker 30.05.2003 02.06.2003 3 Ravena (Italy)
2 Tanker 27.05.2003 05.06.2003 9 Tuapse (Russian
Federation)
3 Bulker 06.06.2003 09.06.2003 3 Drač (Albania)
4 Container 04.06.2003 11.06.2003 7 Limassol (Ciper)
5 Bulker 05.06.2003 12.06.2003 7 Porto Levante (Italy)
6 Container 14.06.2003 16.06.2003 2 Gioia Tauro (Italy)
7 Container 14.05.&
+12.06.2003 18.06.2003 20
Gemlik+Kumport
(Turkey)
8 Bulker 11.06.2003 18.06.2003 7 Sfax (Tunisia)
9 Bulker 23.06.2003 24.06.2003 1 Venice (Italy)
10 Bulker 24.06.2003 26.06.2003 2 Bari (Italy)
11 General
cargo 15.06.2003 26.06.2003 11 Tripoli (Libia)
12 Bulker 28.06.2003 07.07.2003 9 Porto Marghera (Italy)
13 Bulker 05.07.2003 10.07.2003 5 Alger+coastal (Algeria)
14 Container 08.07.2003 12.07.2003 4 Gioia Tauro (Italy)
15 Bulker 23.07.2003 25.07.2003 2 Bar (Montenegro)
19
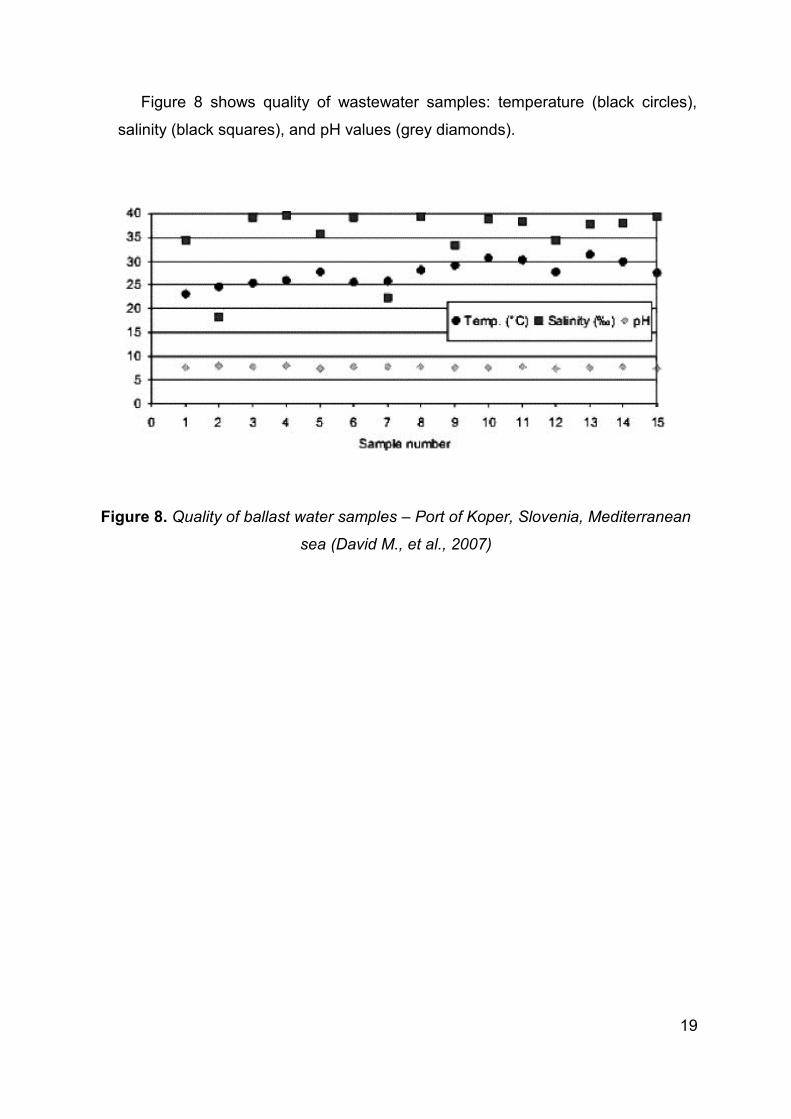
Figure 8 shows quality of wastewater samples: temperature (black circles),
salinity (black squares), and pH values (grey diamonds).
Figure 8. Quality of ballast water samples – Port of Koper, Slovenia, Mediterranean
sea (David M., et al., 2007)
20
3. LEGAL REQUIREMENTS
3.1. Legal regulation on the sea
The problem of discharge and storage of sanitary wastewater from vessels, as
well as equipment and certificates that the vessel must obtain in order to satisfy
the prescribed standards, has been regulated by international rules and regulation
and with national regulations in maritime countries.
The EU has adopted a set of rules to reinforce safety and help prevent
pollution from vessels. The main 2 Directives are:
The Ship – source Pollution Directive (2009/123/EC)
The Port Reception Facilities Directive (2000/59/EC)
The purpose of Port Reception Facilities Directive (2000/59/EC) is to reduce
the discharge of ship – generated waste and cargo residues into the sea,
especially illegal discharges, from ships using ports in all EU ports, by improving
the availability and use of port reception facilities for ship – generated waste and
cargo – residues, thereby enhancing the protection of the marine environment.
This Directive applies to all ships including fishing vessels and recreational crafts,
irrespective of their flag, calling at or operating within, with an exception of any
warship, naval auxiliary or other ship owned or operated by a State and used, for
the time being, only for government non – commercial service; and all ports of the
Member States normally visited by ships written above. This Directive orders that
every vessel shall complete the form (Appendix A.1.) and hand that information to
the authority or body designated for this purpose at least 24 hours prior to arrival,
if the port of call is known, or as soon as port of call is known, if this information is
available less than 24 hours prior to arrival, or at the latest upon departure from
the previous port, if the duration of the voyage is less than 24 hours.
Beside the EU Directives the most important international regulations to the
problem of sea pollution from vessels are MARPOL 73/78 and The London
Convention.
21
MARPOL 73/78 is the International Convention for the Prevention of Pollution
From Ships, 1973. As modified by the Protocol of 1978. „MARPOL“ is short for
marine pollution. This Convention is one of the most important international
marine environmental conventions. MARPOL has VI annexes but for this thesis
the most important annex is Annex IV: Prevention of pollution by sewage from
ships dated 27th September 2003. This Annex has contracted 131 states, 89,65%
of the World Tonnage (MARPOL, 1978). The provision of Annex IV shall apply to:
new ships of 200 tons gross tonnage and above
new ships of less than 200 tons gross tonnage which are certified to
carry more than 10 persons
new ships which do not have a measured gross tonnage and are
certified to carry more than 10 persons
existing ships of 200 tons gross tonnage and above, 10 years after
the date of entry into force of this Annex
existing ships of less than 200 tons gross tonnage which are
certified to carry more than 10 persons, 10 years after the date of
entry into force of this Annex;
existing ships which do not have a measured gross tonnage and are
certified to carry more than 10 persons, 10 years after the date of
entry into force of this Annex
where New ship means a ship:
for which the building contract is placed, or in the absence of a building
contract, the keel of which is laid, or which is at a similar stage of
construction, on or after the date of entry into force of this Annex; or
the delivery of which is three years or more after the date of entry into
force of this Annex.
As well as in Port Reception Facilities Directive MARPOL excludes any
warship, naval auxiliary or other ship owned or operated by a State and used, for
the time being, only on government non – commercial service.
22
According to MARPOL, discharge of sewage into the sea is prohibited, except
when: the ship is discharging comminuted and disinfected sewage, using a
system approved by the Administration at a distance of more than 4 nautical miles
from the nearest land, or sewage which is not comminuted or disinfected at a
distance of more than 12 nautical miles from the nearest land, provided that in
any case, the sewage that has been stored in holding tanks shall not be
discharged instantaneously but at a moderate rate when the ship is en route and
proceeding at not less than 4 knots; the rate of discharge shall be approved by
the Administration based upon standards developed by the Organization, or the
ship is situated in the waters under the jurisdiction of a State and is discharging
sewage in accordance with such less stringent requirements as may be imposed
by such State. When the sewage is mixed with wastes or wastewater having
different discharge requirements, the more stringent requirements shall apply.
The London Convention 1972 and the 1996 Protocol thereto aim to promote
the effective control of all sources of marine pollution and to take all practicable
steps to prevent pollution of the sea by dumping wastes and other matter
generated on land in the sea. (EU Commission staff working document, 2012)
Beside EU regulations each country is governed by regional sea convention.
The Mediterranean Sea Parties according to the 1995 Barcelona Convention are:
Albania, Algeria, Bosnia and Herzegovina, Croatia, Cyprus, Egypt, Frances,
Greece, Israel, Italy, Lebanon, Libya, Malta, Monaco, Morocco, Montenegro,
Slovenia, Spain, Syria, Tunisia, Turkey and the EU.
23
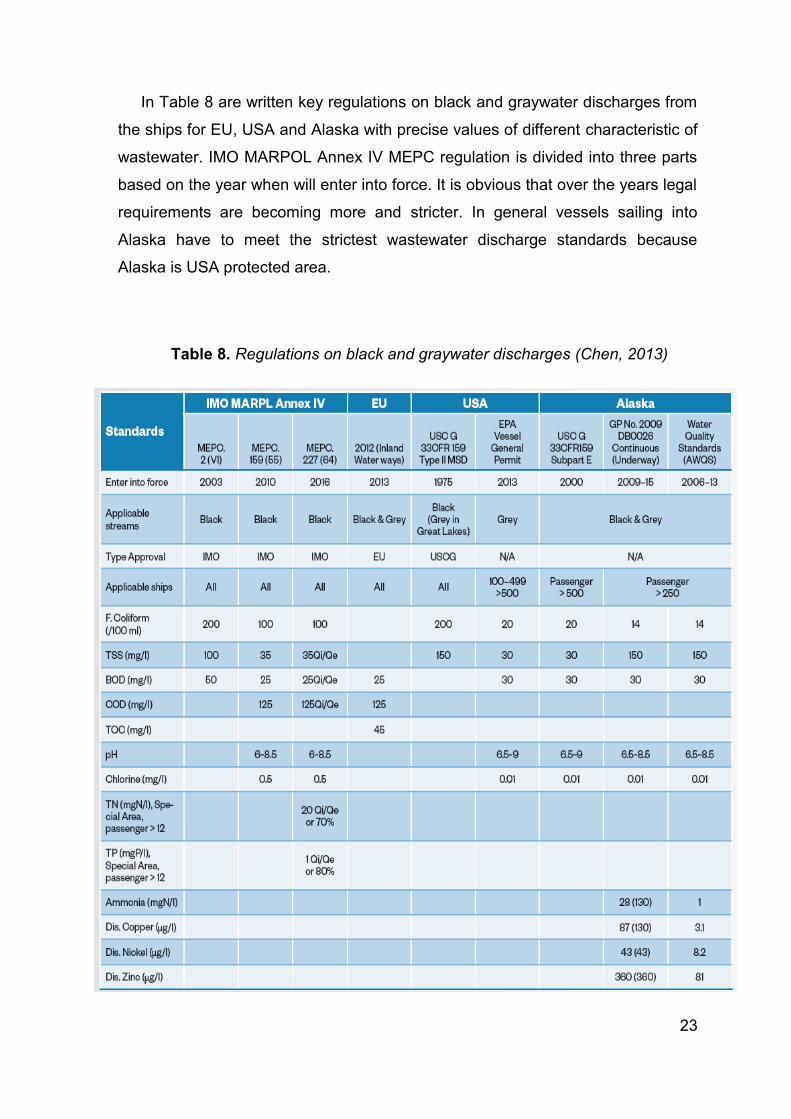
In Table 8 are written key regulations on black and graywater discharges from
the ships for EU, USA and Alaska with precise values of different characteristic of
wastewater. IMO MARPOL Annex IV MEPC regulation is divided into three parts
based on the year when will enter into force. It is obvious that over the years legal
requirements are becoming more and stricter. In general vessels sailing into
Alaska have to meet the strictest wastewater discharge standards because
Alaska is USA protected area.
Table 8. Regulations on black and graywater discharges (Chen, 2013)
24
3.2. Legal regulation on land
Legal requirements on land in general depend on legal requirements from
each country, but for EU member states these are now similar to a large extent.
With regards to technology – based standards for wastewater discharge to
surface water, two EU Directives are of prime significance:
the Urban Wastewater Treatment Directive (UWTD) 91/271/EEC;
the Integrated Pollution Prevention and Control Directive (IPPC)
96/61/EC.
Both are referenced in the Water Framework Directive (WFD) 2000/60/EC.
There are other relevant directives, such as:
Directive 76/464/EEC, controlling the dumping of dangerous
substances (like heavy metals) into water bodies;
Directive 79/869/EEC, concerning the analytic methods and
sampling frequencies;
Directive 80/68/EEC, regarding the discharge of certain dangerous
substances into groundwater and establishing systematic monitoring
of the quality of such water;
Directive 91/676/EEC, concerning the protection of receiving waters
against pollutants of agricultural nature, like certain nitrates;
but in more detail only main Directive will be explained.
Urban Wastewater Treatment Directive (UWTD) 91/271/EEC sets minimum
treatment standards to be met by urban wastewater treatment plants and
industrial activities that generate similar effluents. The Directive is oriented on
collection, treatment and discharge of domestic wastewater, wastewater from the
certain industries and mixture of wastewaters.
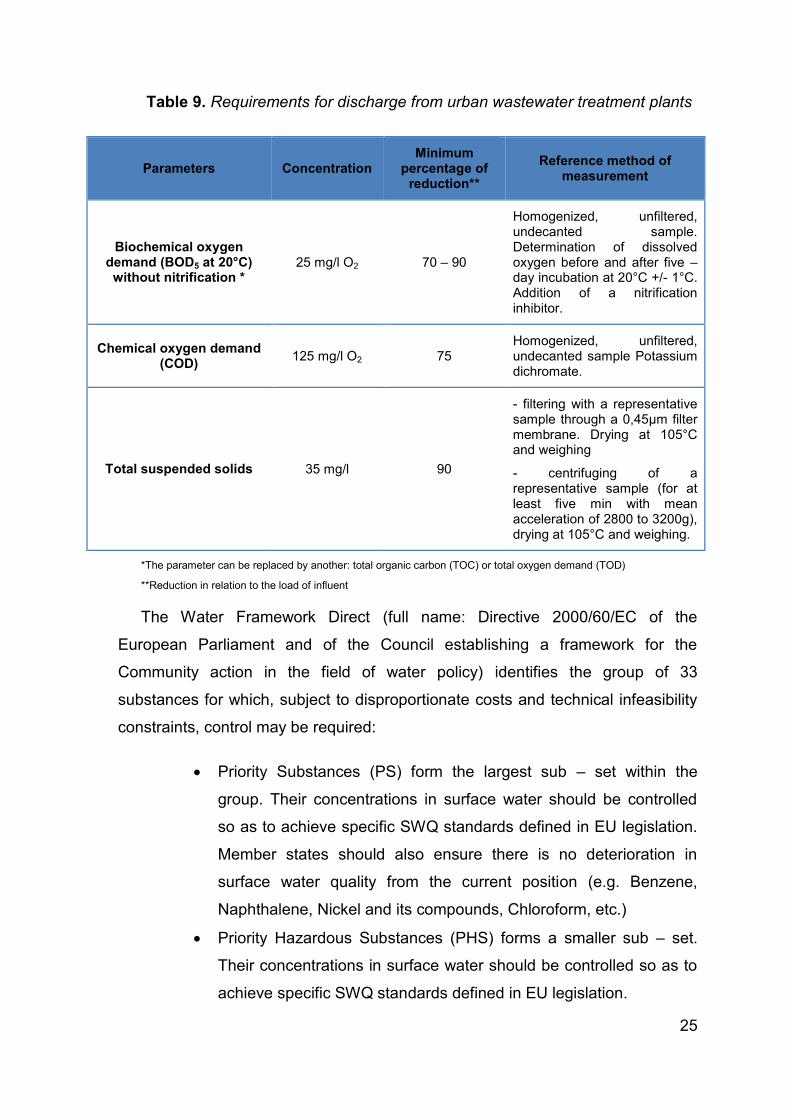
Table 9 presents legal requirements for discharges from urban wastewater
treatment plants into the fresh water and estuaries from agglomeration of more
than 2 000 p.e., as well as minimum percentage of reduction and reference
method of measurement.
25
Table 9. Requirements for discharge from urban wastewater treatment plants
Parameters Concentration Minimum
percentage of reduction**
Reference method of measurement
Biochemical oxygen demand (BOD5 at 20°C) without nitrification *
25 mg/l O2 70 – 90
Homogenized, unfiltered, undecanted sample. Determination of dissolved oxygen before and after five – day incubation at 20°C +/- 1°C. Addition of a nitrification inhibitor.
Chemical oxygen demand (COD)
125 mg/l O2 75 Homogenized, unfiltered, undecanted sample Potassium dichromate.
Total suspended solids 35 mg/l 90
- filtering with a representative sample through a 0,45µm filter membrane. Drying at 105°C and weighing
- centrifuging of a representative sample (for at least five min with mean acceleration of 2800 to 3200g), drying at 105°C and weighing.
*The parameter can be replaced by another: total organic carbon (TOC) or total oxygen demand (TOD)
**Reduction in relation to the load of influent
The Water Framework Direct (full name: Directive 2000/60/EC of the
European Parliament and of the Council establishing a framework for the
Community action in the field of water policy) identifies the group of 33
substances for which, subject to disproportionate costs and technical infeasibility
constraints, control may be required:
Priority Substances (PS) form the largest sub – set within the
group. Their concentrations in surface water should be controlled
so as to achieve specific SWQ standards defined in EU legislation.
Member states should also ensure there is no deterioration in
surface water quality from the current position (e.g. Benzene,
Naphthalene, Nickel and its compounds, Chloroform, etc.)
Priority Hazardous Substances (PHS) forms a smaller sub – set.
Their concentrations in surface water should be controlled so as to
achieve specific SWQ standards defined in EU legislation.
26
3.3. Comparison of discharging requirements on land and on the sea
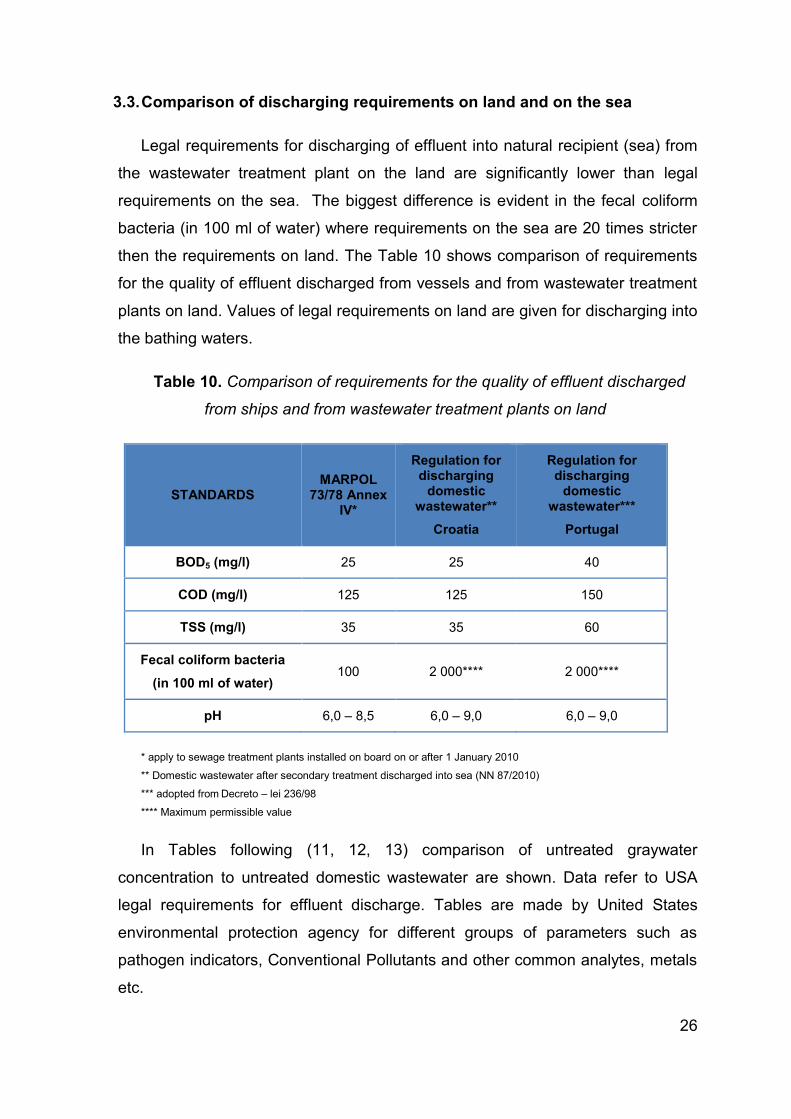
Legal requirements for discharging of effluent into natural recipient (sea) from
the wastewater treatment plant on the land are significantly lower than legal
requirements on the sea. The biggest difference is evident in the fecal coliform
bacteria (in 100 ml of water) where requirements on the sea are 20 times stricter
then the requirements on land. The Table 10 shows comparison of requirements
for the quality of effluent discharged from vessels and from wastewater treatment
plants on land. Values of legal requirements on land are given for discharging into
the bathing waters.
Table 10. Comparison of requirements for the quality of effluent discharged
from ships and from wastewater treatment plants on land
STANDARDS MARPOL
73/78 Annex IV*
Regulation for discharging
domestic wastewater**
Croatia
Regulation for discharging
domestic wastewater***
Portugal
BOD5 (mg/l) 25 25 40
COD (mg/l) 125 125 150
TSS (mg/l) 35 35 60
Fecal coliform bacteria
(in 100 ml of water) 100 2 000**** 2 000****
pH 6,0 – 8,5 6,0 – 9,0 6,0 – 9,0
* apply to sewage treatment plants installed on board on or after 1 January 2010
** Domestic wastewater after secondary treatment discharged into sea (NN 87/2010)
*** adopted from Decreto – lei 236/98
**** Maximum permissible value
In Tables following (11, 12, 13) comparison of untreated graywater
concentration to untreated domestic wastewater are shown. Data refer to USA
legal requirements for effluent discharge. Tables are made by United States
environmental protection agency for different groups of parameters such as
pathogen indicators, Conventional Pollutants and other common analytes, metals
etc.
27
Pathogen indicators
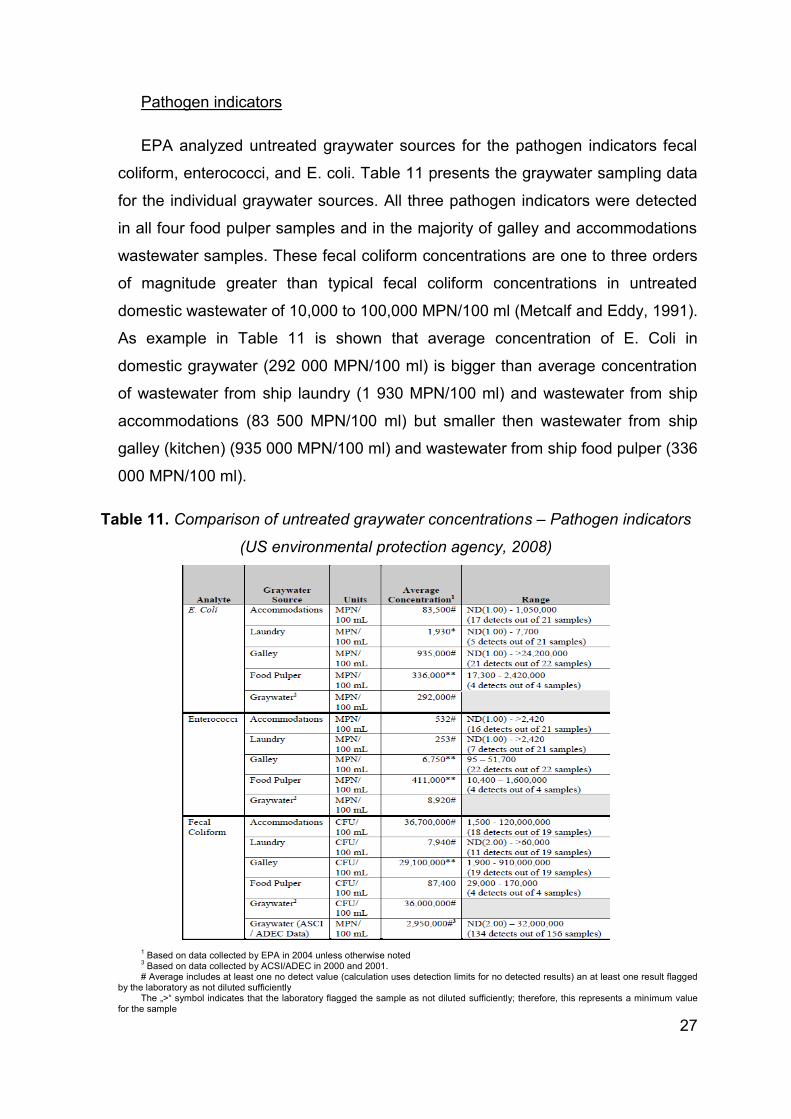
EPA analyzed untreated graywater sources for the pathogen indicators fecal
coliform, enterococci, and E. coli. Table 11 presents the graywater sampling data
for the individual graywater sources. All three pathogen indicators were detected
in all four food pulper samples and in the majority of galley and accommodations
wastewater samples. These fecal coliform concentrations are one to three orders
of magnitude greater than typical fecal coliform concentrations in untreated
domestic wastewater of 10,000 to 100,000 MPN/100 ml (Metcalf and Eddy, 1991).
As example in Table 11 is shown that average concentration of E. Coli in
domestic graywater (292 000 MPN/100 ml) is bigger than average concentration
of wastewater from ship laundry (1 930 MPN/100 ml) and wastewater from ship
accommodations (83 500 MPN/100 ml) but smaller then wastewater from ship
galley (kitchen) (935 000 MPN/100 ml) and wastewater from ship food pulper (336
000 MPN/100 ml).
Table 11. Comparison of untreated graywater concentrations – Pathogen indicators
(US environmental protection agency, 2008)
1 Based on data collected by EPA in 2004 unless otherwise noted
3 Based on data collected by ACSI/ADEC in 2000 and 2001.
# Average includes at least one no detect value (calculation uses detection limits for no detected results) an at least one result flagged by the laboratory as not diluted sufficiently
The „>“ symbol indicates that the laboratory flagged the sample as not diluted sufficiently; therefore, this represents a minimum value for the sample
28
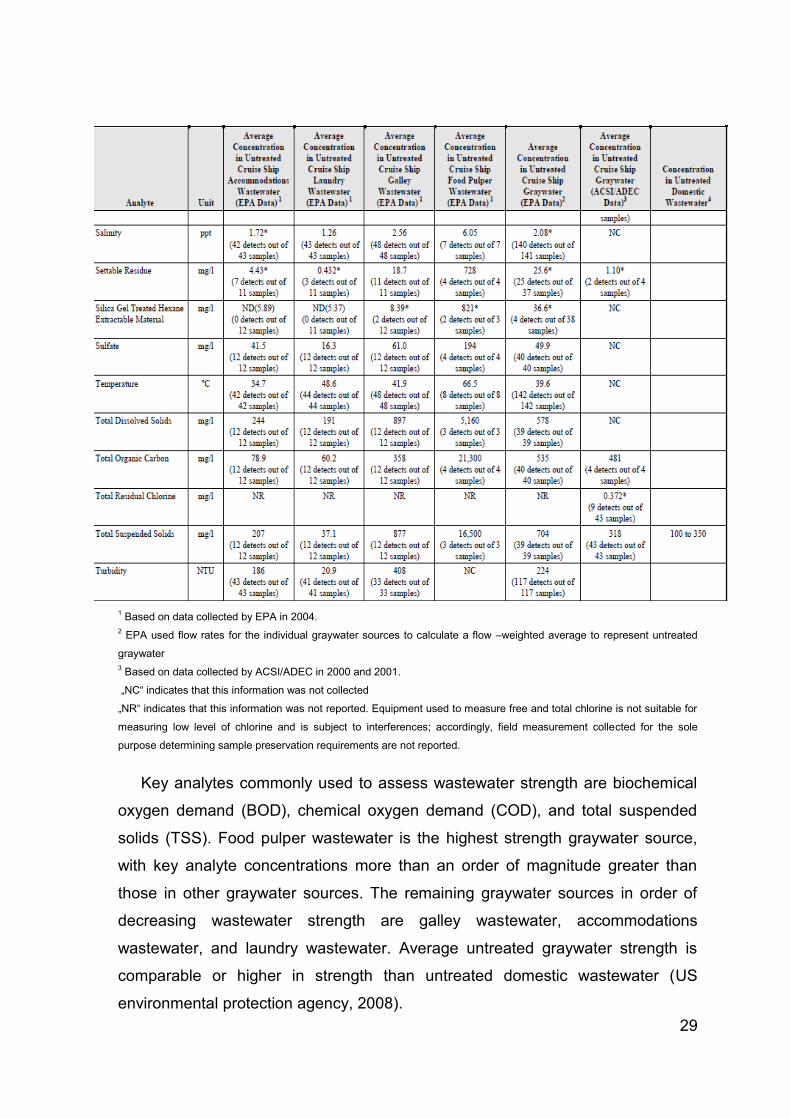
Conventional pollutants and other common analytes
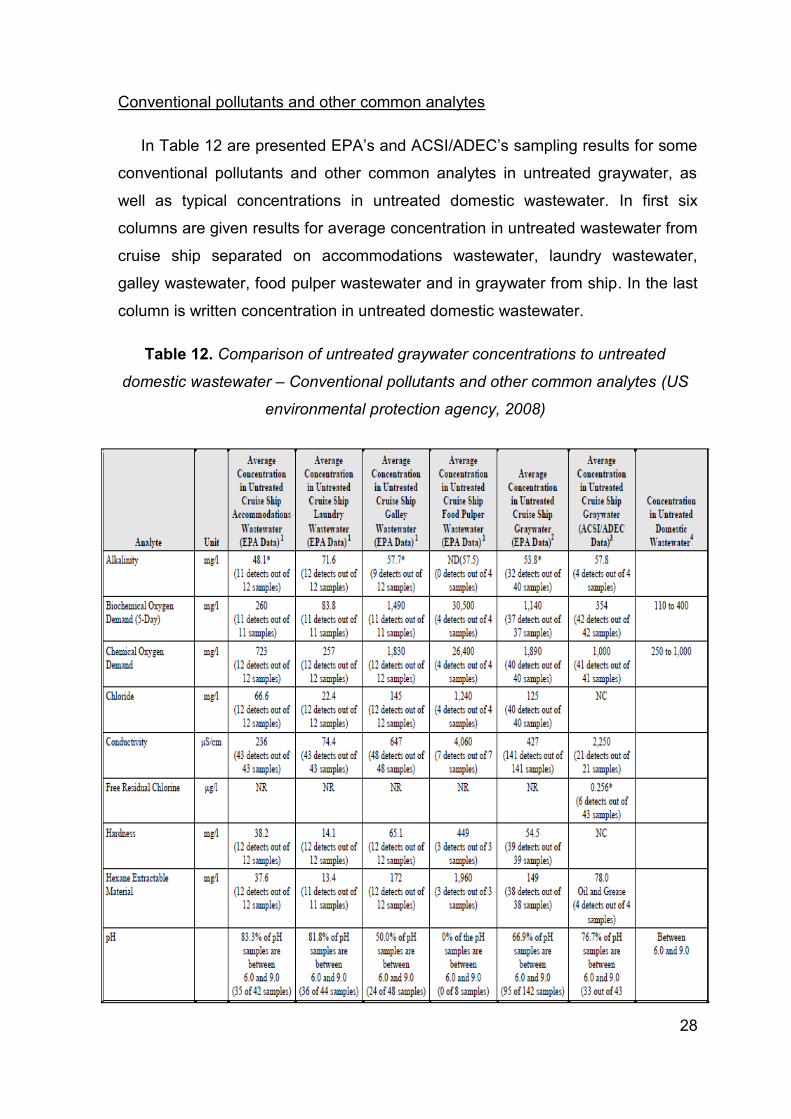
In Table 12 are presented EPA’s and ACSI/ADEC’s sampling results for some
conventional pollutants and other common analytes in untreated graywater, as
well as typical concentrations in untreated domestic wastewater. In first six
columns are given results for average concentration in untreated wastewater from
cruise ship separated on accommodations wastewater, laundry wastewater,
galley wastewater, food pulper wastewater and in graywater from ship. In the last
column is written concentration in untreated domestic wastewater.
Table 12. Comparison of untreated graywater concentrations to untreated
domestic wastewater – Conventional pollutants and other common analytes (US
environmental protection agency, 2008)
29
1 Based on data collected by EPA in 2004.
2 EPA used flow rates for the individual graywater sources to calculate a flow –weighted average to represent untreated
graywater
3 Based on data collected by ACSI/ADEC in 2000 and 2001.
„NC“ indicates that this information was not collected
„NR“ indicates that this information was not reported. Equipment used to measure free and total chlorine is not suitable for
measuring low level of chlorine and is subject to interferences; accordingly, field measurement collected for the sole
purpose determining sample preservation requirements are not reported.
Key analytes commonly used to assess wastewater strength are biochemical
oxygen demand (BOD), chemical oxygen demand (COD), and total suspended
solids (TSS). Food pulper wastewater is the highest strength graywater source,
with key analyte concentrations more than an order of magnitude greater than
those in other graywater sources. The remaining graywater sources in order of
decreasing wastewater strength are galley wastewater, accommodations
wastewater, and laundry wastewater. Average untreated graywater strength is
comparable or higher in strength than untreated domestic wastewater (US
environmental protection agency, 2008).
30
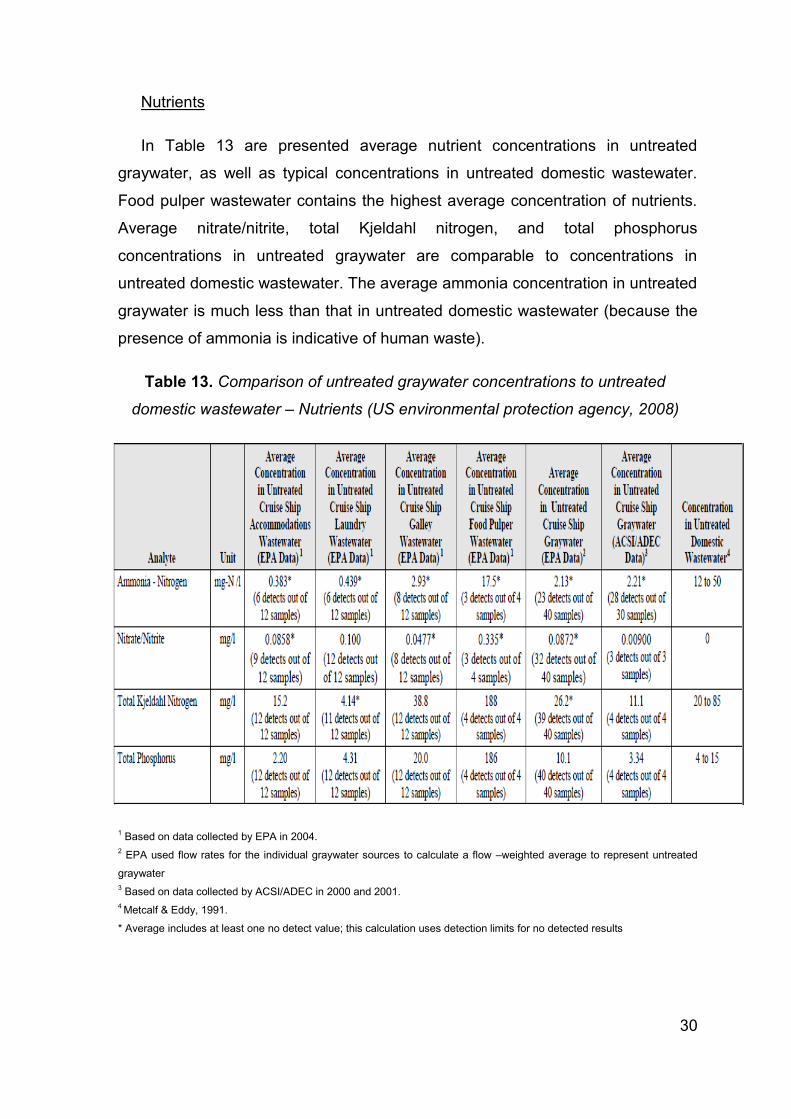
Nutrients
In Table 13 are presented average nutrient concentrations in untreated
graywater, as well as typical concentrations in untreated domestic wastewater.
Food pulper wastewater contains the highest average concentration of nutrients.
Average nitrate/nitrite, total Kjeldahl nitrogen, and total phosphorus
concentrations in untreated graywater are comparable to concentrations in
untreated domestic wastewater. The average ammonia concentration in untreated
graywater is much less than that in untreated domestic wastewater (because the
presence of ammonia is indicative of human waste).
Table 13. Comparison of untreated graywater concentrations to untreated
domestic wastewater – Nutrients (US environmental protection agency, 2008)
1 Based on data collected by EPA in 2004.
2 EPA used flow rates for the individual graywater sources to calculate a flow –weighted average to represent untreated
graywater
3 Based on data collected by ACSI/ADEC in 2000 and 2001.
4 Metcalf & Eddy, 1991.
* Average includes at least one no detect value; this calculation uses detection limits for no detected results
31
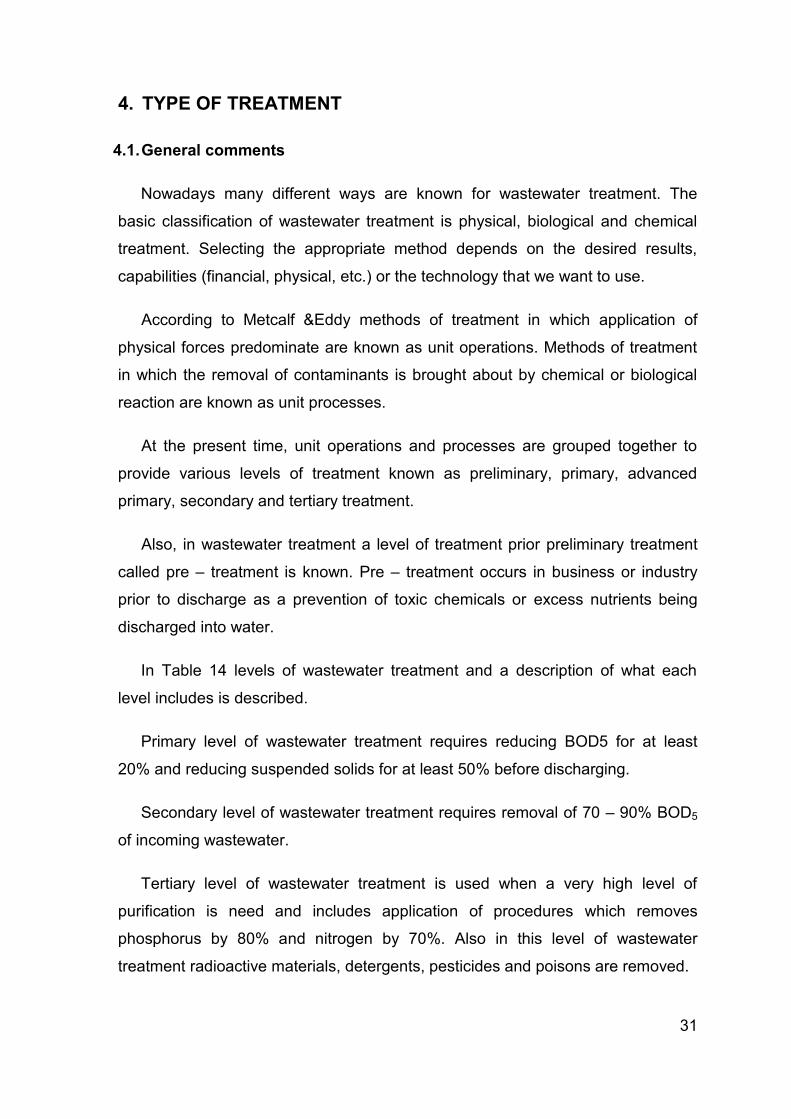
4. TYPE OF TREATMENT
4.1. General comments
Nowadays many different ways are known for wastewater treatment. The
basic classification of wastewater treatment is physical, biological and chemical
treatment. Selecting the appropriate method depends on the desired results,
capabilities (financial, physical, etc.) or the technology that we want to use.
According to Metcalf &Eddy methods of treatment in which application of
physical forces predominate are known as unit operations. Methods of treatment
in which the removal of contaminants is brought about by chemical or biological
reaction are known as unit processes.
At the present time, unit operations and processes are grouped together to
provide various levels of treatment known as preliminary, primary, advanced
primary, secondary and tertiary treatment.
Also, in wastewater treatment a level of treatment prior preliminary treatment
called pre – treatment is known. Pre – treatment occurs in business or industry
prior to discharge as a prevention of toxic chemicals or excess nutrients being
discharged into water.
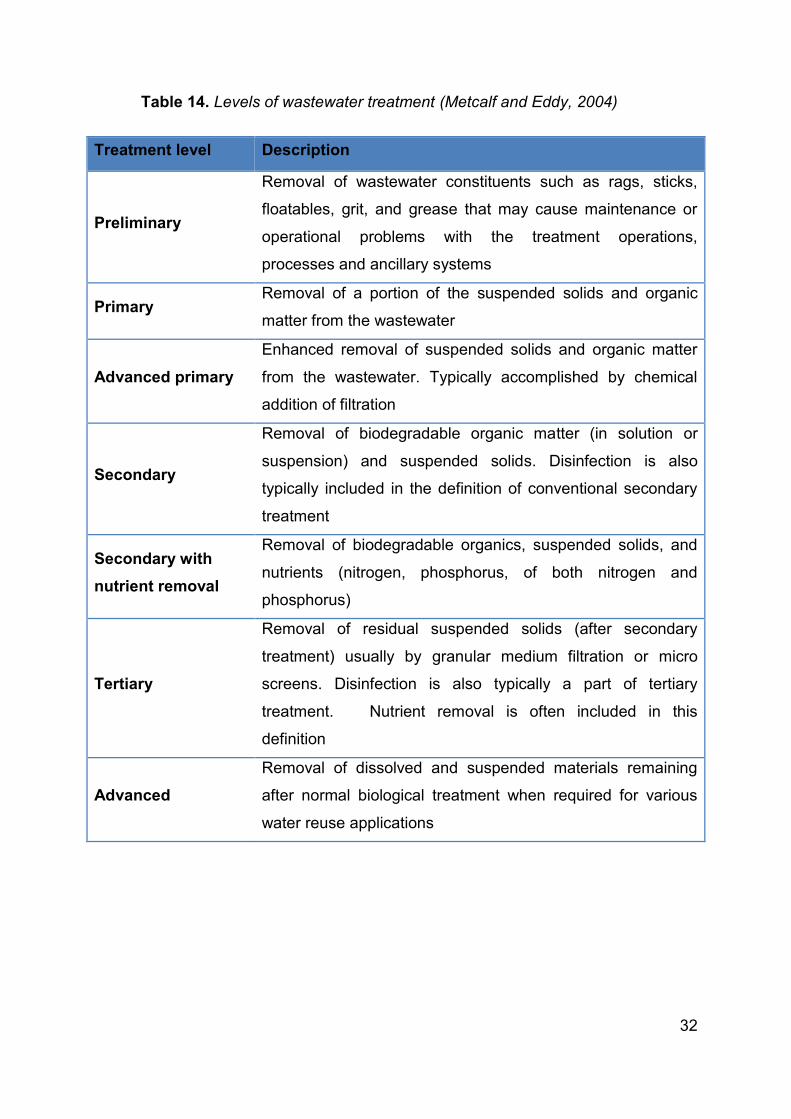
In Table 14 levels of wastewater treatment and a description of what each
level includes is described.
Primary level of wastewater treatment requires reducing BOD5 for at least
20% and reducing suspended solids for at least 50% before discharging.
Secondary level of wastewater treatment requires removal of 70 – 90% BOD5
of incoming wastewater.
Tertiary level of wastewater treatment is used when a very high level of
purification is need and includes application of procedures which removes
phosphorus by 80% and nitrogen by 70%. Also in this level of wastewater
treatment radioactive materials, detergents, pesticides and poisons are removed.
32
Table 14. Levels of wastewater treatment (Metcalf and Eddy, 2004)
Treatment level Description
Preliminary
Removal of wastewater constituents such as rags, sticks,
floatables, grit, and grease that may cause maintenance or
operational problems with the treatment operations,
processes and ancillary systems
Primary Removal of a portion of the suspended solids and organic
matter from the wastewater
Advanced primary
Enhanced removal of suspended solids and organic matter
from the wastewater. Typically accomplished by chemical
addition of filtration
Secondary
Removal of biodegradable organic matter (in solution or
suspension) and suspended solids. Disinfection is also
typically included in the definition of conventional secondary
treatment
Secondary with
nutrient removal
Removal of biodegradable organics, suspended solids, and
nutrients (nitrogen, phosphorus, of both nitrogen and
phosphorus)
Tertiary
Removal of residual suspended solids (after secondary
treatment) usually by granular medium filtration or micro
screens. Disinfection is also typically a part of tertiary
treatment. Nutrient removal is often included in this
definition
Advanced
Removal of dissolved and suspended materials remaining
after normal biological treatment when required for various
water reuse applications
33
4.2. Physical treatment
4.2.1. Screening
A screen is a device with openings that is used for collecting (retaining) solids
from influent wastewater. Openings on screen are usually uniform size and
screen types are divided by the size of the openings. Two general types of
screens are used in preliminary treatment of wastewater. Coarse screens have
clear openings ranging from 6 – 150 mm and fine screens have clear openings
less than 6 mm. In addition, there are micro screens with openings less than 50
µm which are used principally in removing fine solids from treated effluents.
The main role of screening is to remove coarse materials from influent
wastewater in order to protect process equipment from damage, remove big
solids that can reduce overall treatment process efficiency or remove coarse
materials that can contaminate waterways.
Fine screens, besides the removal of waste materials, because of their
openings size, can reduce parts of suspended solids from influent wastewater.
Their effect of BOD5 reduction is 3 – 10 %, reduction in suspended solids 2 – 20
%, reduction of bacteria 10 – 20 % and reduction in the chemical oxygen demand
is 5 – 10 %.
Coarse screens (bar rocks) can be hand – cleaned or mechanically cleaned.
Hand – cleaned screens are usually used ahead of pumps in small wastewater
pumping stations and sometimes ahead of small to medium sized wastewater
treatment plants.
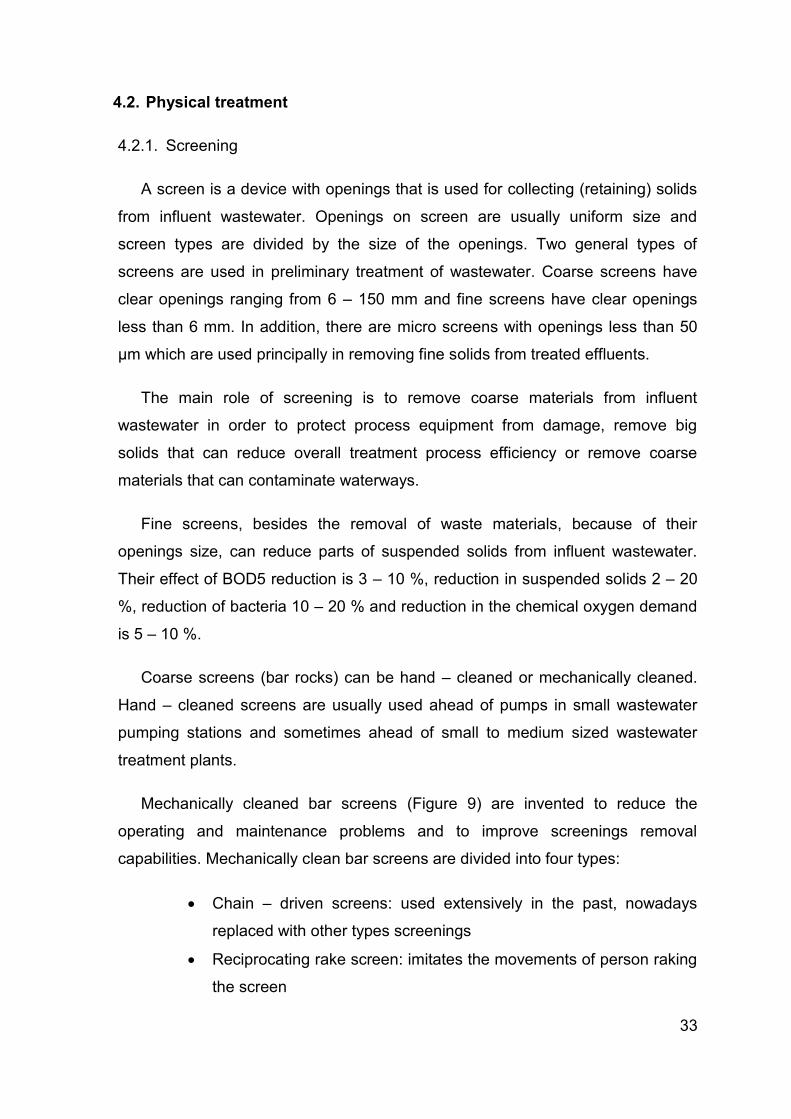
Mechanically cleaned bar screens (Figure 9) are invented to reduce the
operating and maintenance problems and to improve screenings removal
capabilities. Mechanically clean bar screens are divided into four types:
Chain – driven screens: used extensively in the past, nowadays
replaced with other types screenings
Reciprocating rake screen: imitates the movements of person raking
the screen
34
Figure 9. Mechanically cleaned coarse screens a) flat screen b) arched screen,
(Vuković, 1994)
Catenary screen: front cleaned, front return screen with big
“footprint”, requires a lot of space for installation
Continuous belt screen: continuous, self – cleaning screening belt,
can be used as a coarse of a fine screen (screen openings from 0,5
– 30 mm)
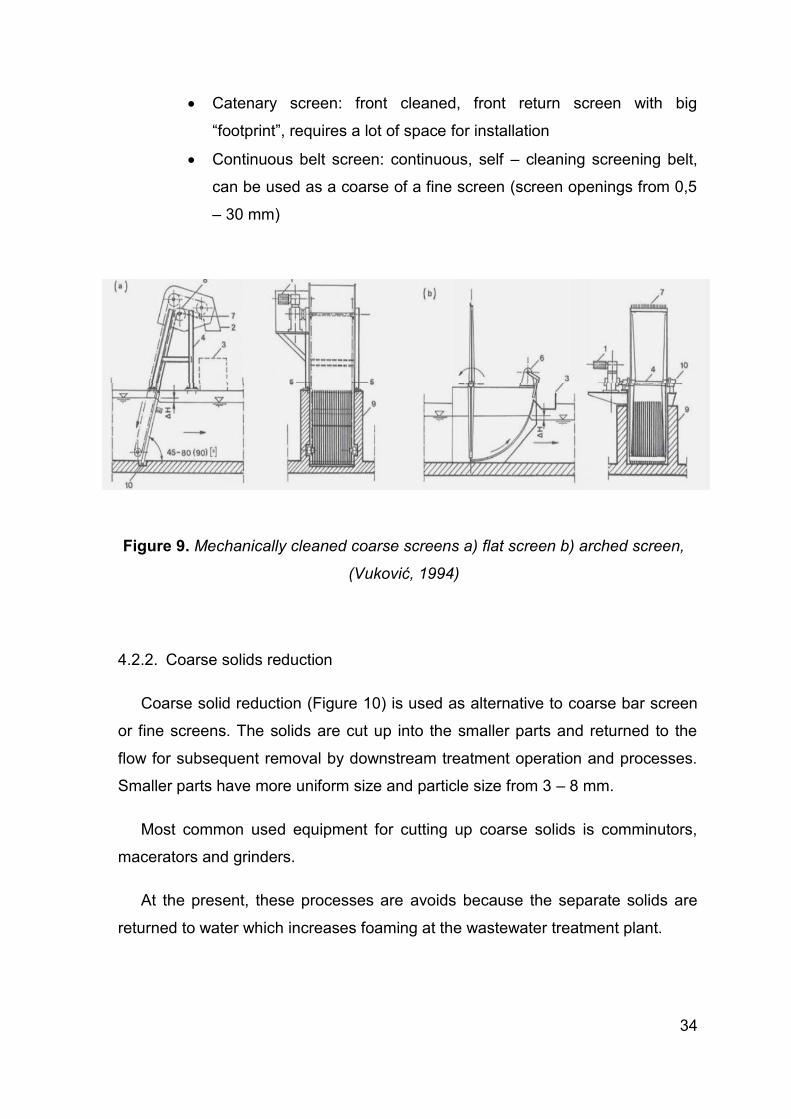
4.2.2. Coarse solids reduction
Coarse solid reduction (Figure 10) is used as alternative to coarse bar screen
or fine screens. The solids are cut up into the smaller parts and returned to the
flow for subsequent removal by downstream treatment operation and processes.
Smaller parts have more uniform size and particle size from 3 – 8 mm.
Most common used equipment for cutting up coarse solids is comminutors,
macerators and grinders.
At the present, these processes are avoids because the separate solids are
returned to water which increases foaming at the wastewater treatment plant.
35
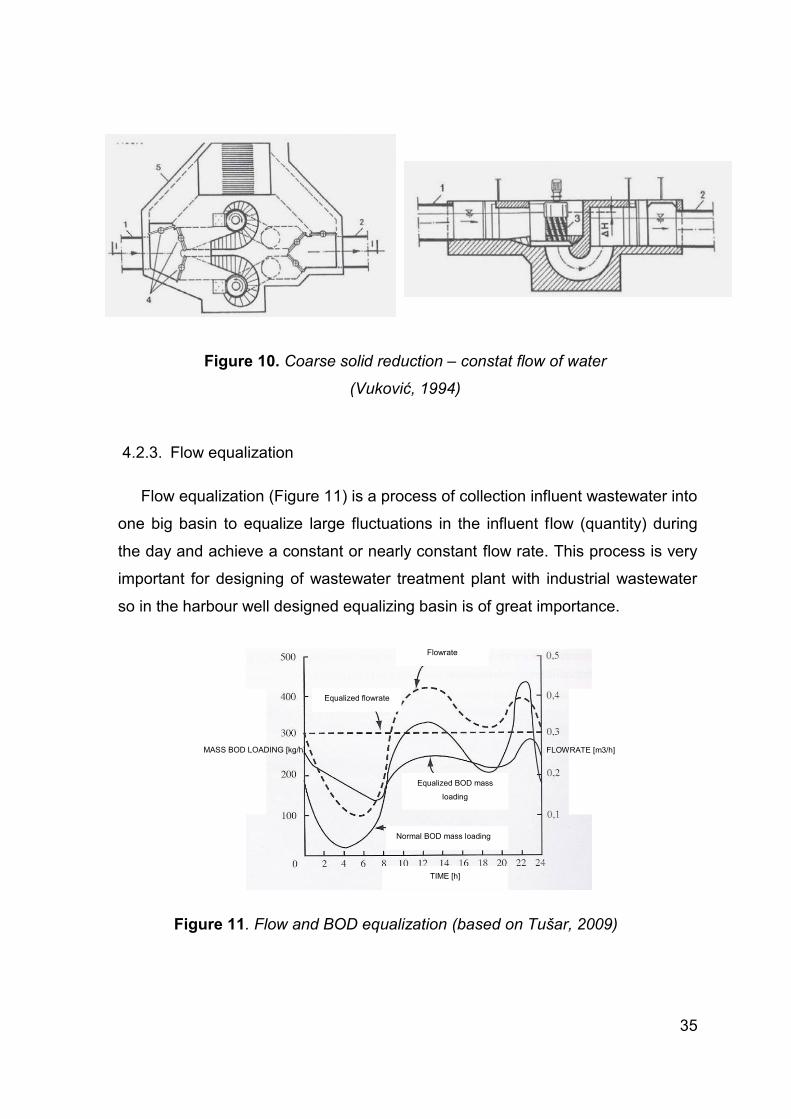
4.2.3. Flow equalization
Flow equalization (Figure 11) is a process of collection influent wastewater into
one big basin to equalize large fluctuations in the influent flow (quantity) during
the day and achieve a constant or nearly constant flow rate. This process is very
important for designing of wastewater treatment plant with industrial wastewater
so in the harbour well designed equalizing basin is of great importance.
Figure 11. Flow and BOD equalization (based on Tušar, 2009)
Figure 10. Coarse solid reduction – constat flow of water
(Vuković, 1994)
TIME [h] [
MASS BOD LOADING [kg/h] [
h
FLOWRATE [m3/h] [
h
Equalized flowrate [
h
Flowrate [
h
Equalized BOD mass
loading [
h
Normal BOD mass loading [
36
According to Metcalf&Eddy (2004) the principal benefits that are cited as
deriving from application of flow equalization are:
Biological treatment is enhanced, because shock loadings are
eliminated or can be minimized, inhibiting substances can be
diluted, and pH can be stabilized
The effluent quality and thickening performance of secondary
sedimentation tanks following biological treatment is improved
thought improved consistency in solids loading
Effluent filtration surface area requirements are reduced, filter
performance is improved, and more uniform filter back – wash
cycles are possible by lower hydraulic loading
In chemical treatment, damping of mass loading improves chemical
feed control and process reliability
Very good option for upgrading the performance of overloaded
wastewater treatment plant
4.2.4. Mixing and flocculation
For a balanced operation of a wastewater treatment plant, the process of
mixing is very important. Mixing as a unit operation is used in many phases of
wastewater treatment. The most common use is for a complete mixing of two
substances, blending of miscible liquids, continuous mixing of liquids suspension
and flocculation of wastewater particles. Mixing devices are various. Usually,
mixing devices are divided into horizontal gravity, vertical gravity and mechanical
mixers (turbine and propeller mixers).
Flocculation is process of forming aggregates/flocs from finely divided particles
and form chemically destabilized particles. Flocculation occurs immediately after
mixing water with a coagulant. The smaller particles are formed into larger
particles that can be easily removed from water by settling or filtration. The time
required to obtain a flocculent size 0,5 – 0,6 mm is 10 – 30 minutes (Vuković,
1994).
37
4.2.5. Grit removal
Process of grit removal is accomplished in grit chambers which are designed
to remove grit consisting of sand, gravel, cinders or other heavy solid materials
that have subsiding velocities or specific gravities substantially greater than those
of the organic putrescible solids in wastewater (Metcalf and Eddy, 2004). The
purpose of grit chamber is protection of moving mechanical equipment from
abrasion and accompanying abnormal wear, reduction of formation of heavy
deposits in pipelines, channels and conduits and reducing the frequency of
digester cleaning caused by excessive accumulations of grit. The three types of
grit chambers usually used for grit removal are: horizontal – flow, rectangular or a
square horizontal – flow and aerated or vortex type.
4.2.6. Sedimentation
Gravity separation
Gravity separation is the most widely used unit operation in wastewater
treatment. Particles heavier than water are separated by gravitational settling.
That process is called sedimentation. Sedimentation is used for the removal of
grit, total suspended solids (TSS), removal of flocks in the activated – sludge
settling basin and chemical flock removal. The primary purpose of gravity
separation is clarification of effluent.
Primary sedimentation
Primary sedimentation is used for removing from 40 to 70 percent of the
suspended solids, from 25 to 40 percent of BOD5, reducing COD from 20 to 35
percent and reducing the amount of bacteria’s from 25 – 75 percent. The effect of
purification in sedimentation tanks depends on the time of retention of wastewater
in tanks. In addition, sedimentation tanks have also been used as storm water
retention tanks. The most used sedimentation tanks nowadays are mechanically
cleaned sedimentation tanks of standardized circular or rectangular design, but
the selection of the type of sedimentation tank is based on the size of the
installation, rules and regulations of local control authorities, local site condition
etc.
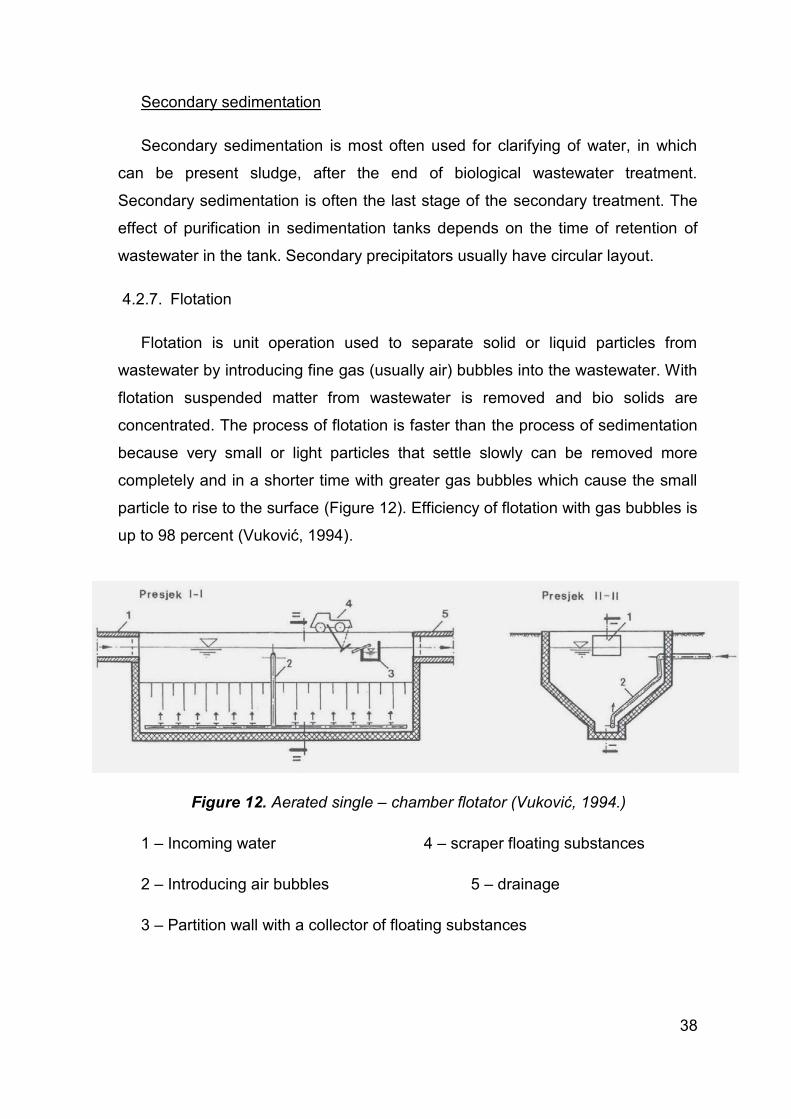
38
Secondary sedimentation
Secondary sedimentation is most often used for clarifying of water, in which
can be present sludge, after the end of biological wastewater treatment.
Secondary sedimentation is often the last stage of the secondary treatment. The
effect of purification in sedimentation tanks depends on the time of retention of
wastewater in the tank. Secondary precipitators usually have circular layout.
4.2.7. Flotation
Flotation is unit operation used to separate solid or liquid particles from
wastewater by introducing fine gas (usually air) bubbles into the wastewater. With
flotation suspended matter from wastewater is removed and bio solids are
concentrated. The process of flotation is faster than the process of sedimentation
because very small or light particles that settle slowly can be removed more
completely and in a shorter time with greater gas bubbles which cause the small
particle to rise to the surface (Figure 12). Efficiency of flotation with gas bubbles is
up to 98 percent (Vuković, 1994).
1 – Incoming water 4 – scraper floating substances
2 – Introducing air bubbles 5 – drainage
3 – Partition wall with a collector of floating substances
Figure 12. Aerated single – chamber flotator (Vuković, 1994.)
39
4.3. Biological treatment
Biological wastewater treatment is based on the activity of bacteria and other
microorganisms that remove contaminants from wastewater by assimilating them.
Microorganisms use soil organic matter as a food for the production of new cells
(reproduction). As a byproduct of biological processes, gases and non –
biodegradable parts are produced. Choosing the right system which will be used
depends primarily on the amount of dissolved oxygen in the effluent and on
condition in microorganism natural habitat but is also very important to understand
various techniques available and evaluate them based on your requirements.
In addition when considering biological wastewater treatment for a particular
application, it is important to understand the sources of the generated wastewater,
typical wastewater composition, discharge requirements, events and practices
within a facility that can affect the quantity and quality of the wastewater (Schultz,
2005). Consideration of these factors will allow maximizing the benefits of
biological wastewater treatment plants. According to Schultz (2005) those benefits
can include:
Low capital and operating costs compared to those of chemical –
oxidation processes
True destruction of organics, versus mere phase separation, such
as with air stripping or carbon adsorption
Removal of reduced inorganic compounds, such as sulfides and
ammonia, and total nitrogen removal possible through denitrification
Operational flexibility to handle a wide range of flows and
wastewater characteristic
Reduction of aquatic toxicity
There are three basic categories of biological wastewater treatment:
Aerobic (with oxygen)
Anaerobic (withouth oxygen)
Anoxic (total depletion in level of oxygen)
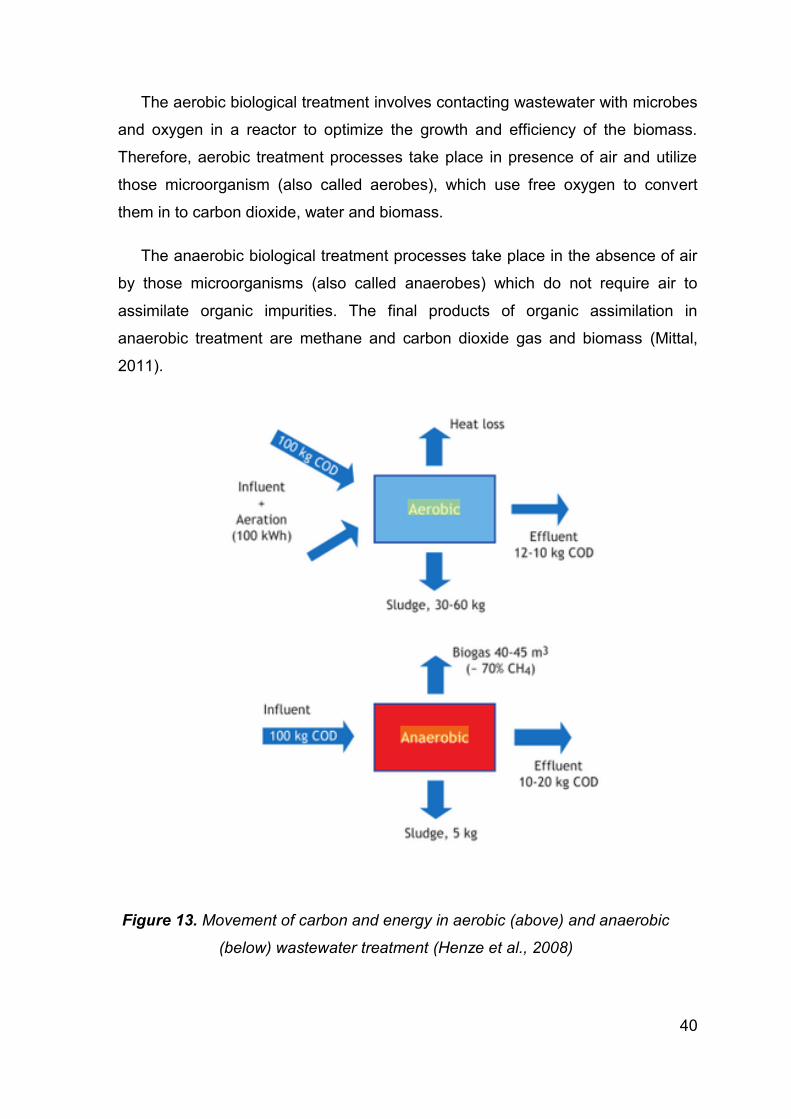
40
The aerobic biological treatment involves contacting wastewater with microbes
and oxygen in a reactor to optimize the growth and efficiency of the biomass.
Therefore, aerobic treatment processes take place in presence of air and utilize
those microorganism (also called aerobes), which use free oxygen to convert
them in to carbon dioxide, water and biomass.
The anaerobic biological treatment processes take place in the absence of air
by those microorganisms (also called anaerobes) which do not require air to
assimilate organic impurities. The final products of organic assimilation in
anaerobic treatment are methane and carbon dioxide gas and biomass (Mittal,
2011).
Figure 13. Movement of carbon and energy in aerobic (above) and anaerobic
(below) wastewater treatment (Henze et al., 2008)
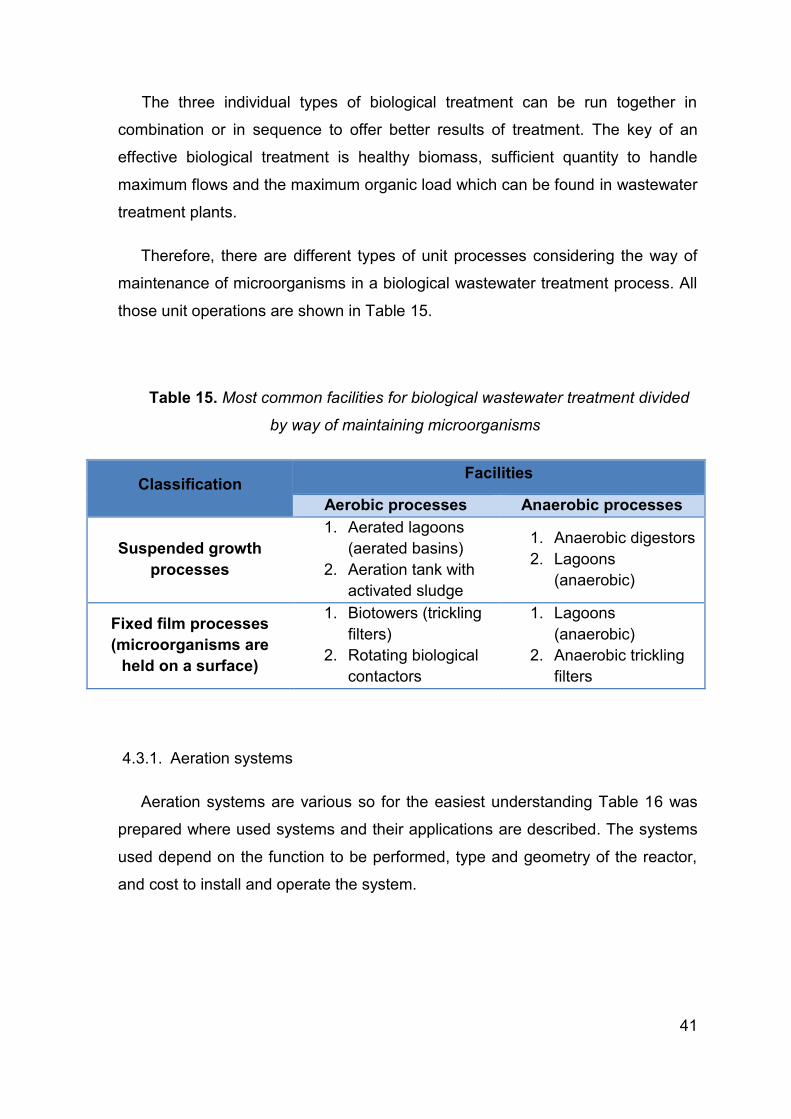
41
The three individual types of biological treatment can be run together in
combination or in sequence to offer better results of treatment. The key of an
effective biological treatment is healthy biomass, sufficient quantity to handle
maximum flows and the maximum organic load which can be found in wastewater
treatment plants.
Therefore, there are different types of unit processes considering the way of
maintenance of microorganisms in a biological wastewater treatment process. All
those unit operations are shown in Table 15.
Table 15. Most common facilities for biological wastewater treatment divided
by way of maintaining microorganisms
Classification Facilities
Aerobic processes Anaerobic processes
Suspended growth
processes
1. Aerated lagoons
(aerated basins)
2. Aeration tank with
activated sludge
1. Anaerobic digestors
2. Lagoons
(anaerobic)
Fixed film processes
(microorganisms are
held on a surface)
1. Biotowers (trickling
filters)
2. Rotating biological
contactors
1. Lagoons
(anaerobic)
2. Anaerobic trickling
filters
4.3.1. Aeration systems
Aeration systems are various so for the easiest understanding Table 16 was
prepared where used systems and their applications are described. The systems
used depend on the function to be performed, type and geometry of the reactor,
and cost to install and operate the system.
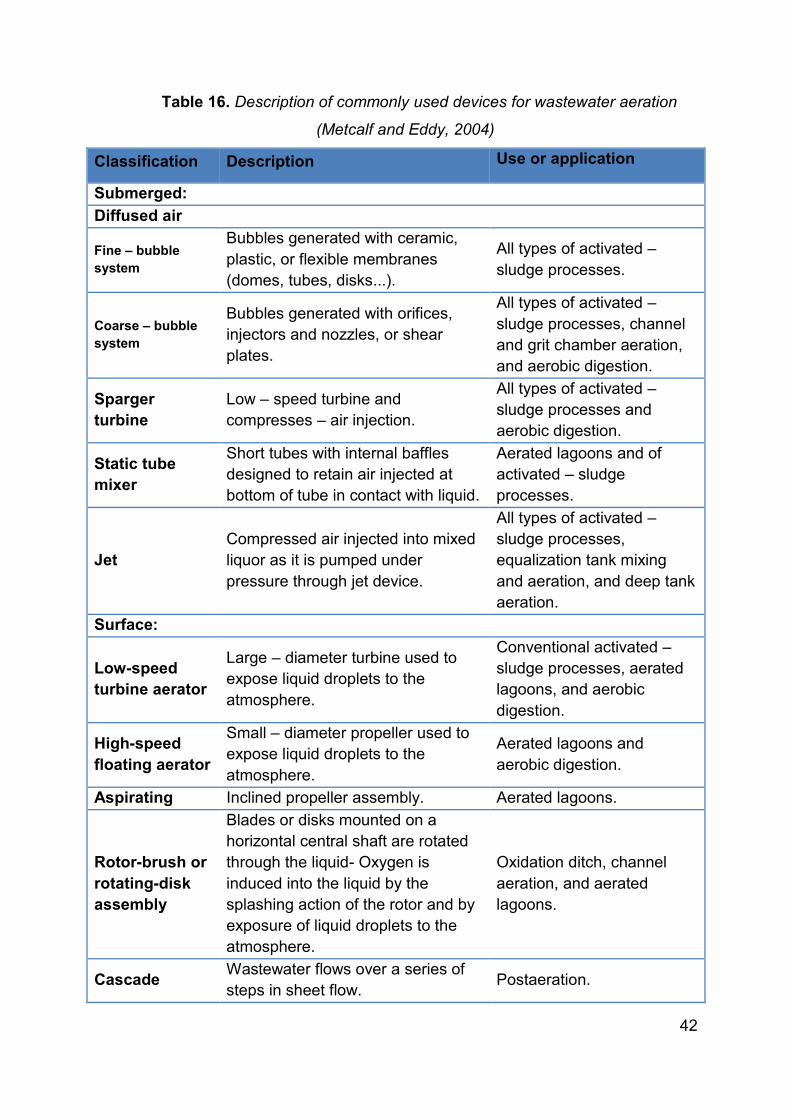
42
Table 16. Description of commonly used devices for wastewater aeration
(Metcalf and Eddy, 2004)
Classification Description Use or application
Submerged:
Diffused air
Fine – bubble
system
Bubbles generated with ceramic,
plastic, or flexible membranes
(domes, tubes, disks...).
All types of activated –
sludge processes.
Coarse – bubble
system
Bubbles generated with orifices,
injectors and nozzles, or shear
plates.
All types of activated –
sludge processes, channel
and grit chamber aeration,
and aerobic digestion.
Sparger
turbine
Low – speed turbine and
compresses – air injection.
All types of activated –
sludge processes and
aerobic digestion.
Static tube
mixer
Short tubes with internal baffles
designed to retain air injected at
bottom of tube in contact with liquid.
Aerated lagoons and of
activated – sludge
processes.
Jet
Compressed air injected into mixed
liquor as it is pumped under
pressure through jet device.
All types of activated –
sludge processes,
equalization tank mixing
and aeration, and deep tank
aeration.
Surface:
Low-speed
turbine aerator
Large – diameter turbine used to
expose liquid droplets to the
atmosphere.
Conventional activated –
sludge processes, aerated
lagoons, and aerobic
digestion.
High-speed
floating aerator
Small – diameter propeller used to
expose liquid droplets to the
atmosphere.
Aerated lagoons and
aerobic digestion.
Aspirating Inclined propeller assembly. Aerated lagoons.
Rotor-brush or
rotating-disk
assembly
Blades or disks mounted on a
horizontal central shaft are rotated
through the liquid- Oxygen is
induced into the liquid by the
splashing action of the rotor and by
exposure of liquid droplets to the
atmosphere.
Oxidation ditch, channel
aeration, and aerated
lagoons.
Cascade Wastewater flows over a series of
steps in sheet flow. Postaeration.

43
4.3.2. Aerated lagoons (aerated basins)
In aerated lagoons, oxygen is supplied mainly through mechanical aeration
rather than by algal photosynthesis. Usually, three processes are used: diffused
aeration, jet aeration and surface aeration.
Diffused aeration
Diffused aerators add air to wastewater, increasing dissolved oxygen content
and supplying microorganism with oxygen necessary for aerobic biological
treatment. Fine – bubble diffused aeration systems are available in various types
including ceramic and membranous, and are highly efficient (Schultz, 2005).
Jet aeration
The jet – aeration system (Figure 14) is designed to provide required aeration
as well as maintain suspension of biological solids, with the flexibility to either
aerate or mix independently without the need for additional equipment. Air – flow
rates in the system can be varied. When aeration requirements decrease and air
is completely shut off, pumps provide the required mixing action to enhance
process control and save energy. The subsurface discharge leads to smooth and
quiet operation, with no misting, splashing or spray from the basin (Schultz,
2005).
Figure 14. Jet aeration (Adi sales)
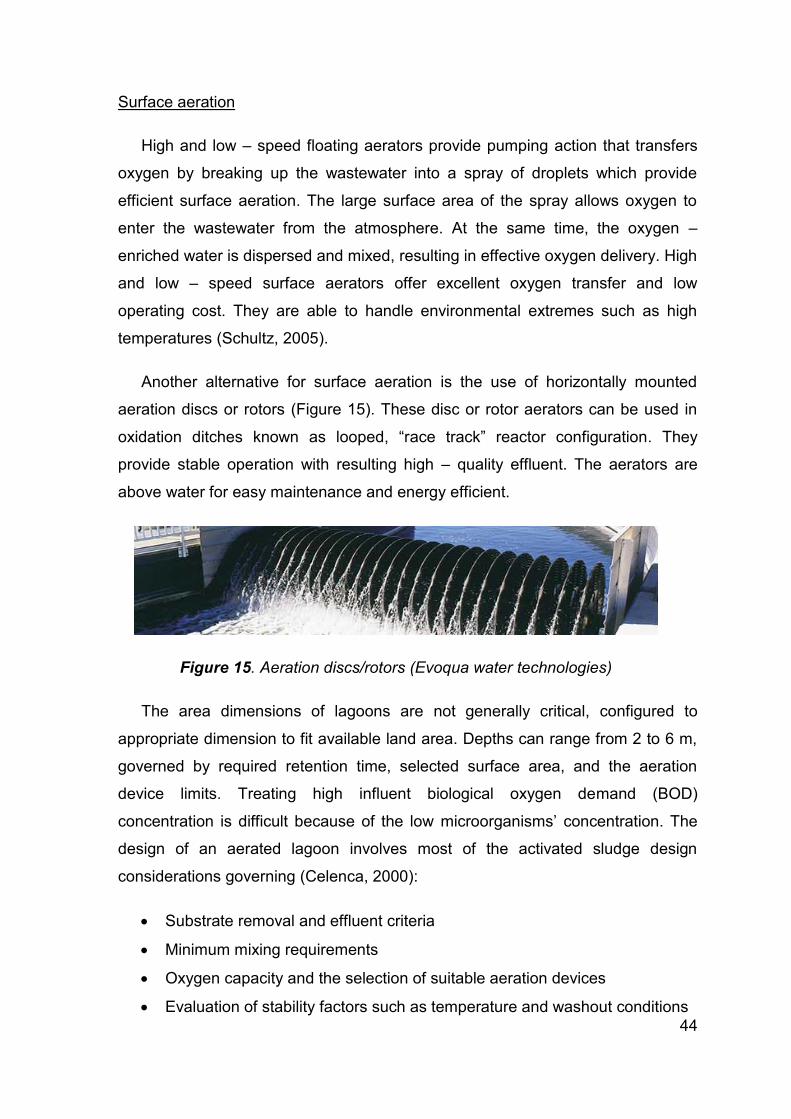
44
Surface aeration
High and low – speed floating aerators provide pumping action that transfers
oxygen by breaking up the wastewater into a spray of droplets which provide
efficient surface aeration. The large surface area of the spray allows oxygen to
enter the wastewater from the atmosphere. At the same time, the oxygen –
enriched water is dispersed and mixed, resulting in effective oxygen delivery. High
and low – speed surface aerators offer excellent oxygen transfer and low
operating cost. They are able to handle environmental extremes such as high
temperatures (Schultz, 2005).
Another alternative for surface aeration is the use of horizontally mounted
aeration discs or rotors (Figure 15). These disc or rotor aerators can be used in
oxidation ditches known as looped, “race track” reactor configuration. They
provide stable operation with resulting high – quality effluent. The aerators are
above water for easy maintenance and energy efficient.
Figure 15. Aeration discs/rotors (Evoqua water technologies)
The area dimensions of lagoons are not generally critical, configured to
appropriate dimension to fit available land area. Depths can range from 2 to 6 m,
governed by required retention time, selected surface area, and the aeration
device limits. Treating high influent biological oxygen demand (BOD)
concentration is difficult because of the low microorganisms’ concentration. The
design of an aerated lagoon involves most of the activated sludge design
considerations governing (Celenca, 2000):
Substrate removal and effluent criteria
Minimum mixing requirements
Oxygen capacity and the selection of suitable aeration devices
Evaluation of stability factors such as temperature and washout conditions
45
4.3.3. Activated sludge
Activated sludge process is a common method of aerobic wastewater
treatment. The purpose of the process is to reduce amounts of dissolved organic
matter from wastewater, using microorganisms growing in aeration tanks.
Microorganisms convert dissolved organic matter into their own biomass,
oxidizing carbonaceous matter, oxidizing nitrogenous matter and removing
phosphates. The formed semi – liquid material (a community of microorganisms
grouped in flocs) is then separated. The treated wastewater runs over the edges
of secondary clarifiers. A part of the settled sludge is being returned into aeration
tanks, where it is mixed with "fresh" primary treated wastewater and the bio
oxidation process goes on (Rech, 2008).
Activated sludge control is based on monitoring sludge blanket level SVI
(Sludge Volume Index), MCRT (Mean Cell Residence Time), F/M (Food/Mass
ratio). Some guidelines that can be applied to a conventional activated sludge
plant are:
There must be sufficient aeration to maintain a dissolved oxygen
concentration of at least two mg/l at all times throughout the aeration
tanks.
Dissolved oxygen should be present at all times in the treated
wastewater in the final settling tanks.
Activated sludge must be returned continuously from the final
settling tanks to the aeration tanks.
Optimum rate of returning activated sludge will vary with each
installation and with different load factors. In general, it will range
from 20 to 40 percent of the influent wastewater flow for diffused air
and 10 to 40 percent for mechanical aeration units.
The optimum mix liquor suspended solids concentration in the
aeration tanks may vary considerably, but usually is in the range of
600 to 3000 mg/l. Optimum MLSS concentrations should be
determined experimentally for each plant.
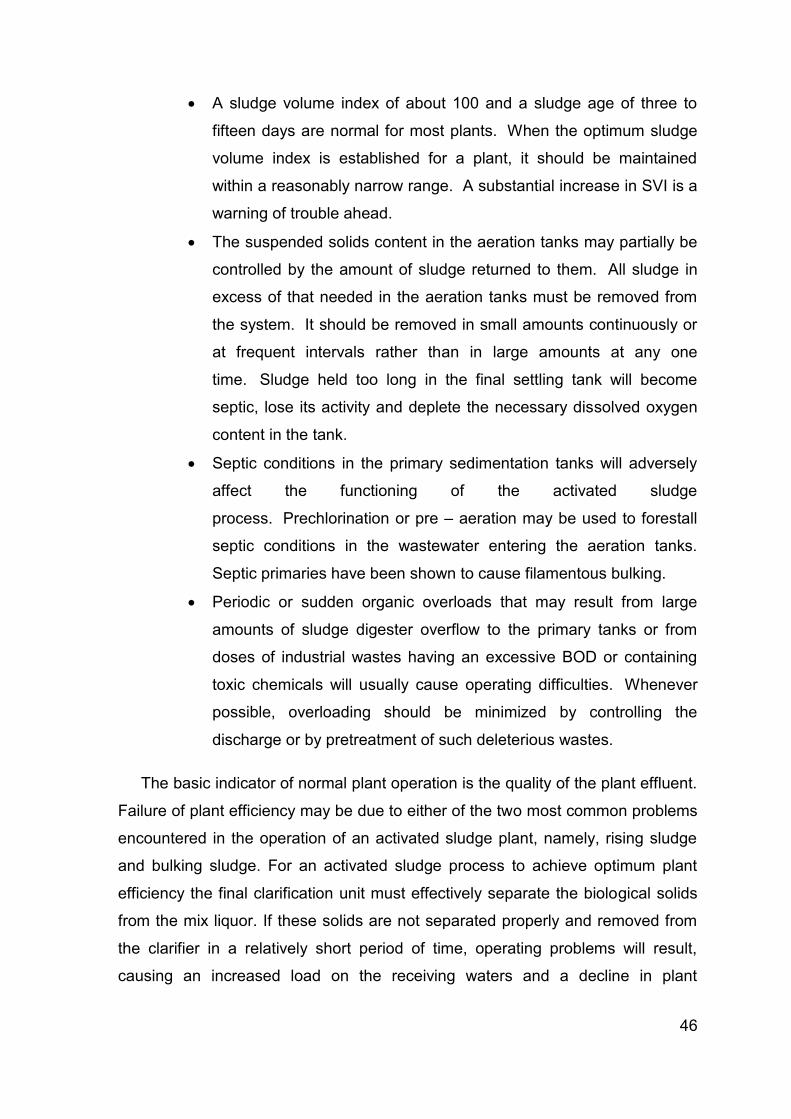
46
A sludge volume index of about 100 and a sludge age of three to
fifteen days are normal for most plants. When the optimum sludge
volume index is established for a plant, it should be maintained
within a reasonably narrow range. A substantial increase in SVI is a
warning of trouble ahead.
The suspended solids content in the aeration tanks may partially be
controlled by the amount of sludge returned to them. All sludge in
excess of that needed in the aeration tanks must be removed from
the system. It should be removed in small amounts continuously or
at frequent intervals rather than in large amounts at any one
time. Sludge held too long in the final settling tank will become
septic, lose its activity and deplete the necessary dissolved oxygen
content in the tank.
Septic conditions in the primary sedimentation tanks will adversely
affect the functioning of the activated sludge
process. Prechlorination or pre – aeration may be used to forestall
septic conditions in the wastewater entering the aeration tanks.
Septic primaries have been shown to cause filamentous bulking.
Periodic or sudden organic overloads that may result from large
amounts of sludge digester overflow to the primary tanks or from
doses of industrial wastes having an excessive BOD or containing
toxic chemicals will usually cause operating difficulties. Whenever
possible, overloading should be minimized by controlling the
discharge or by pretreatment of such deleterious wastes.
The basic indicator of normal plant operation is the quality of the plant effluent.
Failure of plant efficiency may be due to either of the two most common problems
encountered in the operation of an activated sludge plant, namely, rising sludge
and bulking sludge. For an activated sludge process to achieve optimum plant
efficiency the final clarification unit must effectively separate the biological solids
from the mix liquor. If these solids are not separated properly and removed from
the clarifier in a relatively short period of time, operating problems will result,
causing an increased load on the receiving waters and a decline in plant
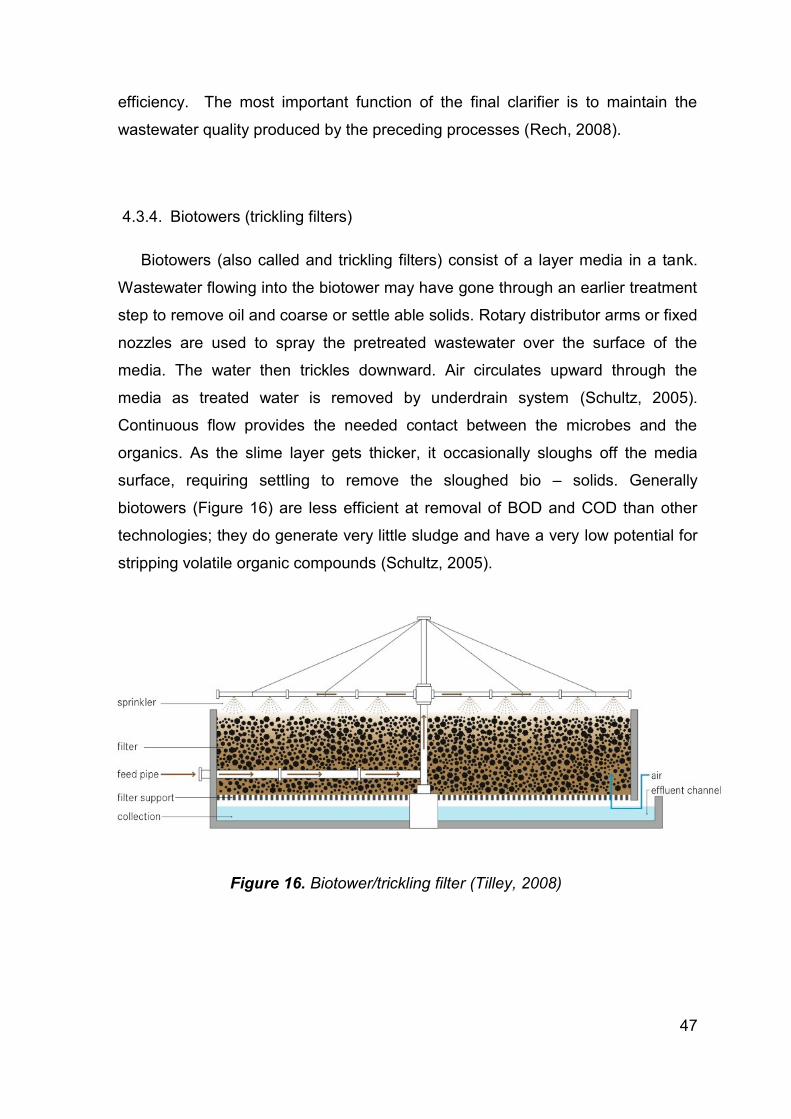
47
efficiency. The most important function of the final clarifier is to maintain the
wastewater quality produced by the preceding processes (Rech, 2008).
4.3.4. Biotowers (trickling filters)
Biotowers (also called and trickling filters) consist of a layer media in a tank.
Wastewater flowing into the biotower may have gone through an earlier treatment
step to remove oil and coarse or settle able solids. Rotary distributor arms or fixed
nozzles are used to spray the pretreated wastewater over the surface of the
media. The water then trickles downward. Air circulates upward through the
media as treated water is removed by underdrain system (Schultz, 2005).
Continuous flow provides the needed contact between the microbes and the
organics. As the slime layer gets thicker, it occasionally sloughs off the media
surface, requiring settling to remove the sloughed bio – solids. Generally
biotowers (Figure 16) are less efficient at removal of BOD and COD than other
technologies; they do generate very little sludge and have a very low potential for
stripping volatile organic compounds (Schultz, 2005).
Figure 16. Biotower/trickling filter (Tilley, 2008)
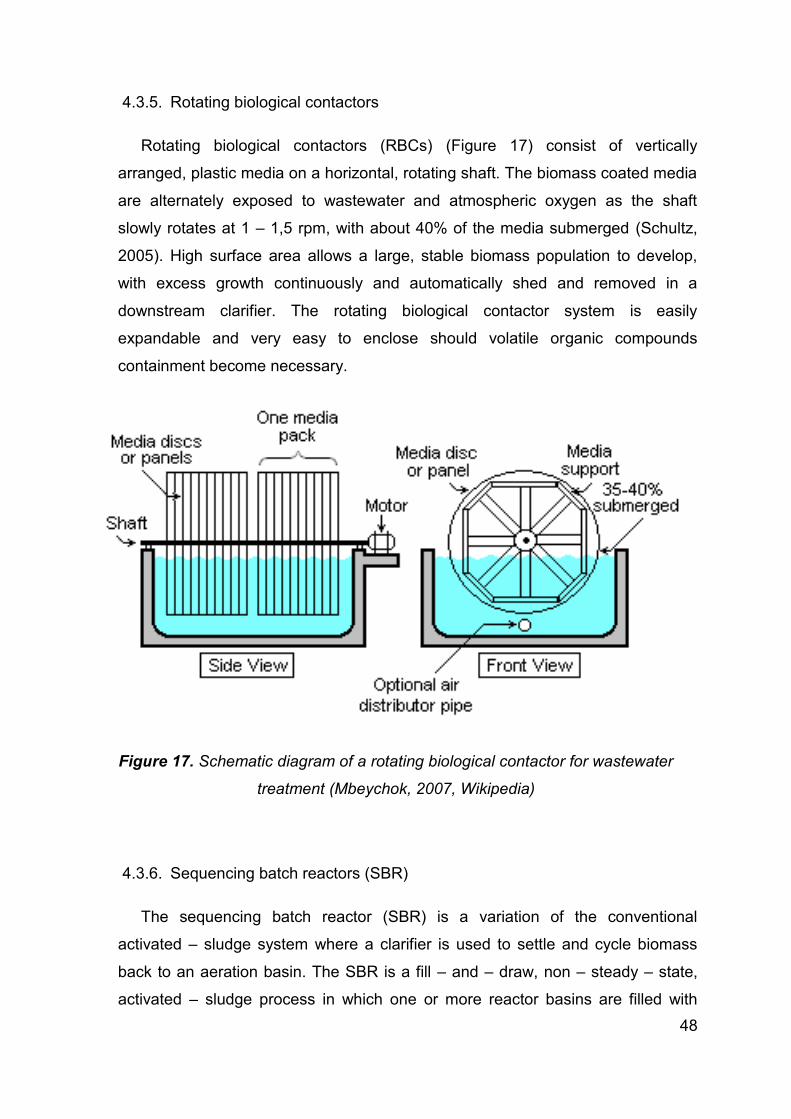
48
4.3.5. Rotating biological contactors
Rotating biological contactors (RBCs) (Figure 17) consist of vertically
arranged, plastic media on a horizontal, rotating shaft. The biomass coated media
are alternately exposed to wastewater and atmospheric oxygen as the shaft
slowly rotates at 1 – 1,5 rpm, with about 40% of the media submerged (Schultz,
2005). High surface area allows a large, stable biomass population to develop,
with excess growth continuously and automatically shed and removed in a
downstream clarifier. The rotating biological contactor system is easily
expandable and very easy to enclose should volatile organic compounds
containment become necessary.
Figure 17. Schematic diagram of a rotating biological contactor for wastewater
treatment (Mbeychok, 2007, Wikipedia)
4.3.6. Sequencing batch reactors (SBR)
The sequencing batch reactor (SBR) is a variation of the conventional
activated – sludge system where a clarifier is used to settle and cycle biomass
back to an aeration basin. The SBR is a fill – and – draw, non – steady – state,
activated – sludge process in which one or more reactor basins are filled with
49
wastewater during a discrete time period and then operated in batch mode
(Schultz, 2005). In a single reactor basins (Figure 19), the SBR accomplished
equalization, aeration and clarification in a timed sequence. Depending on desired
treatment objectives, the SBR can be operated in aerobic, anoxic or anaerobic
conditions to encourage the growth of desirable microorganisms. One of the
advantages of SBRs is good operability in winter, making them well suited for
installations in colder climates. SBRs also take up little space because all of the
treatment steps take place in a single reactor basin (Schultz, 2005).
Figure 18. SBR process phases (T&D Water technologies and development)
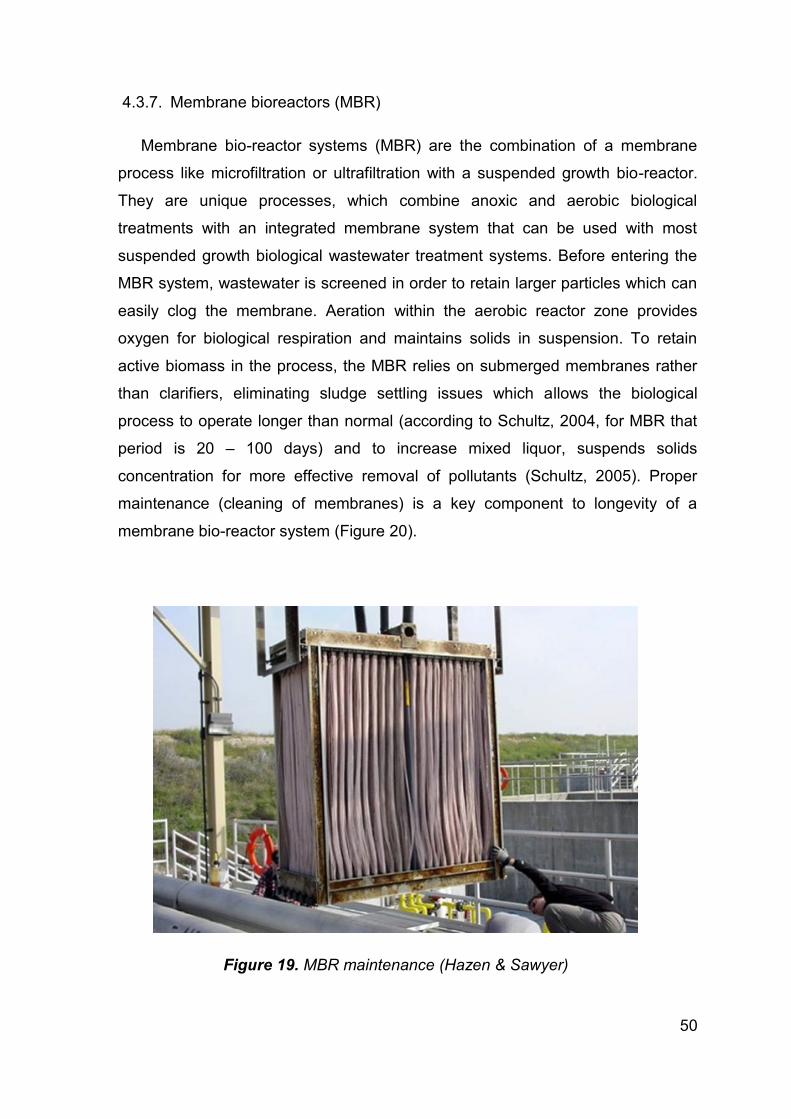
50
4.3.7. Membrane bioreactors (MBR)
Membrane bio-reactor systems (MBR) are the combination of a membrane
process like microfiltration or ultrafiltration with a suspended growth bio-reactor.
They are unique processes, which combine anoxic and aerobic biological
treatments with an integrated membrane system that can be used with most
suspended growth biological wastewater treatment systems. Before entering the
MBR system, wastewater is screened in order to retain larger particles which can
easily clog the membrane. Aeration within the aerobic reactor zone provides
oxygen for biological respiration and maintains solids in suspension. To retain
active biomass in the process, the MBR relies on submerged membranes rather
than clarifiers, eliminating sludge settling issues which allows the biological
process to operate longer than normal (according to Schultz, 2004, for MBR that
period is 20 – 100 days) and to increase mixed liquor, suspends solids
concentration for more effective removal of pollutants (Schultz, 2005). Proper
maintenance (cleaning of membranes) is a key component to longevity of a
membrane bio-reactor system (Figure 20).
Figure 19. MBR maintenance (Hazen & Sawyer)
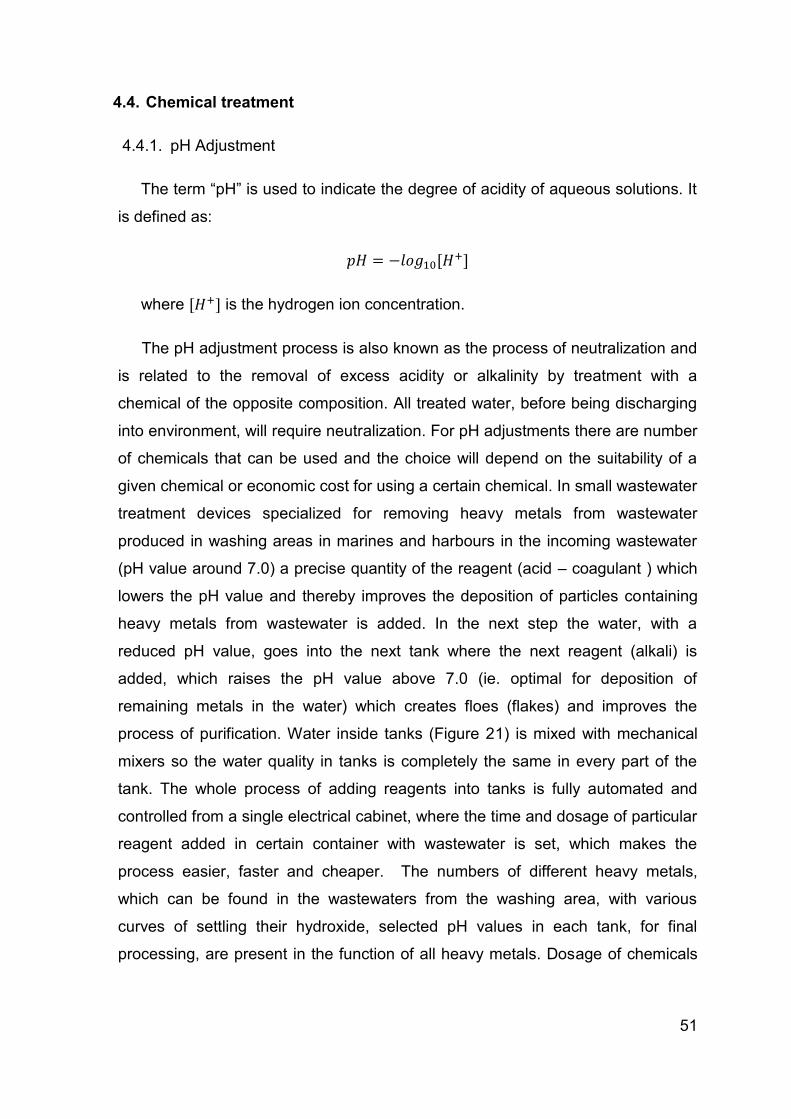
51
4.4. Chemical treatment
4.4.1. pH Adjustment
The term “pH” is used to indicate the degree of acidity of aqueous solutions. It
is defined as:
where is the hydrogen ion concentration.
The pH adjustment process is also known as the process of neutralization and
is related to the removal of excess acidity or alkalinity by treatment with a
chemical of the opposite composition. All treated water, before being discharging
into environment, will require neutralization. For pH adjustments there are number
of chemicals that can be used and the choice will depend on the suitability of a
given chemical or economic cost for using a certain chemical. In small wastewater
treatment devices specialized for removing heavy metals from wastewater
produced in washing areas in marines and harbours in the incoming wastewater
(pH value around 7.0) a precise quantity of the reagent (acid – coagulant ) which
lowers the pH value and thereby improves the deposition of particles containing
heavy metals from wastewater is added. In the next step the water, with a
reduced pH value, goes into the next tank where the next reagent (alkali) is
added, which raises the pH value above 7.0 (ie. optimal for deposition of
remaining metals in the water) which creates floes (flakes) and improves the
process of purification. Water inside tanks (Figure 21) is mixed with mechanical
mixers so the water quality in tanks is completely the same in every part of the
tank. The whole process of adding reagents into tanks is fully automated and
controlled from a single electrical cabinet, where the time and dosage of particular
reagent added in certain container with wastewater is set, which makes the
process easier, faster and cheaper. The numbers of different heavy metals,
which can be found in the wastewaters from the washing area, with various
curves of settling their hydroxide, selected pH values in each tank, for final
processing, are present in the function of all heavy metals. Dosage of chemicals
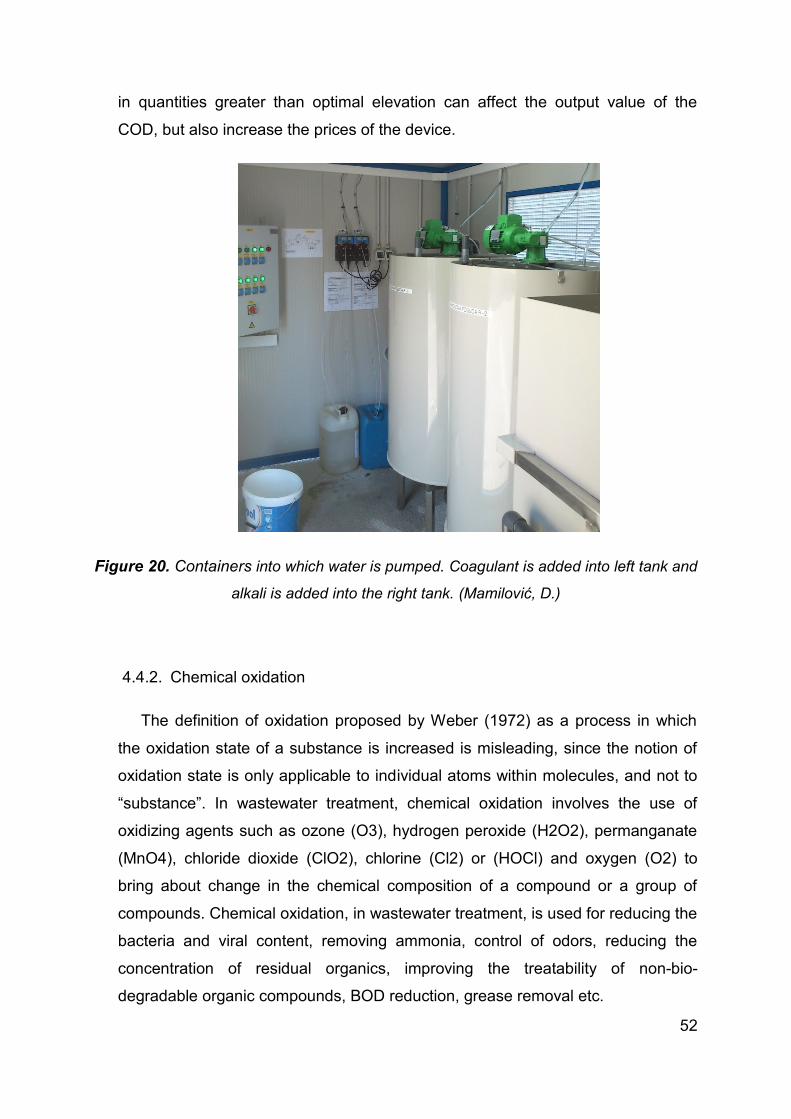
52
in quantities greater than optimal elevation can affect the output value of the
COD, but also increase the prices of the device.
Figure 20. Containers into which water is pumped. Coagulant is added into left tank and
alkali is added into the right tank. (Mamilović, D.)
4.4.2. Chemical oxidation
The definition of oxidation proposed by Weber (1972) as a process in which
the oxidation state of a substance is increased is misleading, since the notion of
oxidation state is only applicable to individual atoms within molecules, and not to
“substance”. In wastewater treatment, chemical oxidation involves the use of
oxidizing agents such as ozone (O3), hydrogen peroxide (H2O2), permanganate
(MnO4), chloride dioxide (ClO2), chlorine (Cl2) or (HOCl) and oxygen (O2) to
bring about change in the chemical composition of a compound or a group of
compounds. Chemical oxidation, in wastewater treatment, is used for reducing the
bacteria and viral content, removing ammonia, control of odors, reducing the
concentration of residual organics, improving the treatability of non-bio-
degradable organic compounds, BOD reduction, grease removal etc.
53
4.4.3. Chemical reduction
According to Eilbeck&Mattock (1987) reduction is conversely defined as the
removal of oxygen or other electronegative elements by adding of hydrogen or
electro – positive elements or, more generally, as a gain of electrons. Oxidation
and reduction are complementary processes and chemical oxidation is impossible
without a chemical reduction. Common reductases are sulphur dioxide (SO2) and
its salts, sodium dithionite (Na2S2O4), ferrous iron (Fe2), metals (iron, zinc,
aluminium ), hydrazine (N2H4), sodium borohydride (NaBH4), hydrogen peroxide
(H2O2) etc.
4.4.4. Chemical precipitation and flocculation
Chemical precipitation converts soluble metallic ions and certain anions to
insoluble forms, which precipitate from solution. Usually chemical precipitation is
used to remove metal compounds from wastewater. The precipitated metals are
subsequently removed from wastewater stream by liquid filtration or clarification.
Chemical precipitation is a two – step process. In the first step, precipitants are
mixed with the wastewater by mechanical devices such as mixers. The detention
time depends on the type of wastewater which is being treated, the treatment
chemicals used and the desired effluent quality. In the second step, the
precipitated metals are removed from the wastewater by processes of filtration or
clarification. Chemicals that are usually for chemical precipitation are sodium
hydroxide, soda ash, sodium sulfide…
Flocculation is the stirring or agitation of chemically – treated water to induce
coagulation. More specifically flocculation is the agglomeration of the destabilized
particles by chemical joining and bridging. Flocculation enhances sedimentation
of filtration treatment system performance by increasing particle size which results
in increased settling rates and filter capture rates.
54
4.4.5. Demulsification
An emulsion is a disperse system in which both the disperse phase and his
dispersion medium are liquids, the two being essentially immiscible. Emulsions all
have hydrophilic and hydrophobic character, and generally are stabile only in the
presence of a third substance, an emulsifier. Emulsifiers are divided into classes
differentiated according to their chemical nature. According to Eilbeck&Mattock
(1987) classes are as follow:
Soaps and detergents constitute a major class of emulsifying agent.
These consist of hydrophobic main structures with hydrophilic end or
side components, and include such examples and sodium and
potassium stearates
Non – ionic hydrophilic materials such as gums, starches and
saponins increase the viscosity of an aqueous phase and so reduce
the rate at which emulsion droplets, once formed, will aggregate and
coalesce. Various synthetically prepared condensates of alcohols or
phenols also display this property
Emulsion may be also stabilized by the presence of finely divided
solid particles, such as preparations of carbon, some silicate and
aluminosilicate materials, and even fine powders of basic salts such
as the sulphates of iron, copper or nickel
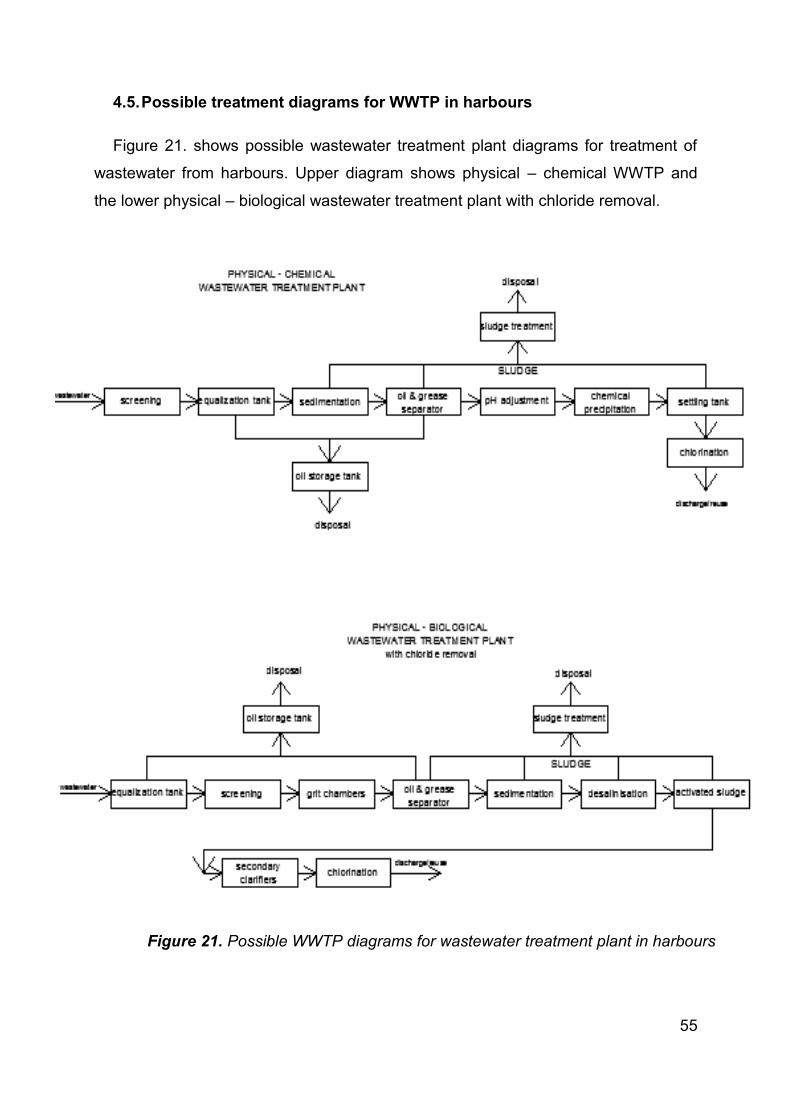
55
4.5. Possible treatment diagrams for WWTP in harbours
Figure 21. shows possible wastewater treatment plant diagrams for treatment of
wastewater from harbours. Upper diagram shows physical – chemical WWTP and
the lower physical – biological wastewater treatment plant with chloride removal.
Figure 21. Possible WWTP diagrams for wastewater treatment plant in harbours
56
Unlike biological, chemical WWTP can treat wastewaters that contain toxic
compounds. In addition, biological treatment requires very big areas which can be
very expensive if the port authorities have to buy the land for construction of
wastewater treatment plant.
But on other side, according to Oneke Tanyi chemical WWTP produces 25%
more sludge per day than biological. The production of sludge is considered a
very important factor in the choice of a wastewater treatment method nowadays.
The economic cost of treatment have to be evaluated based on a summation
of the individual costs associated with sludge production, cost of chemicals,
energy cost and cost associated to volume savings. The cost of volume and
energy savings depend from country to country (each country has specific prices
for electricity, gas etc…) and on quality and quantity of wastewater.
It is very hard to say that any WWTP type is better than the other. Each one
has its own advantages and disadvantages. The choice of which WWTP is to be
construct depend on the society, the discharge requirements, quality and quantity
of wastewater, environmental sensibility, and the most important, costs they are
ready to incur.
57
5. PROBLEMS AND POSSIBLE SOLUTIONS
5.1. Contamination by ships
Wastewater from ships can contain toxic substances, hydrocarbons, organic
residue and pathogen agents. According to ACSI – Alaska cruise ship initiative,
concentration of pathogens in wastewater may exceed federal limits by between
10 000 and 100 000 times.
At present, the ships have a few options for dealing with wastewater. The first
option is to collect the wastewater into holding tanks and dispose of it in the port
facilities. This option is the best from an environmental standpoint, but ships have
to pay for disposal into the port facilities. The second option is to have a
wastewater treatment plant on-board, treat wastewater during the voyage and
discharge into sea according to MARPOL or stricter country regulations. This
option is also suitable from an environmental standpoint, but in this case a vessel
must have a wastewater treatment plan onboard (which can cost, according to the
Royal Caribbean, up to three million US dollars for big cruise ships that have to
comply with legal regulations for sailing in the Alaska area). The third option is
discharging wastewater into the sea/ocean without the treatment, according to
MARPOL, at least 12 nautical miles offshore, released in small amounts while the
ship is sailing at speed not less than 4 knots. Nowadays, most ships have
advanced wastewater treatment systems onboard that purify water to a near
drinking water standard and residual sludge from wastewater systems can be
discharged as waste. Some operators, such as The Royal Caribbean, have
committed to drying and burning all sewage sludge.
Ships which have their own wastewater treatment plants onboard usually have
wastewater treatment plant with 4 stages of treatment (Perić et al.).
Preliminary treatment includes procedures by which large and
dispersed waste matter is removed from the waste water. Grit removal,
Flow equalization, Fat and grease removal)
Primary treatment includes physical and/or chemical cleaning
processes that remove at least 50% of suspended solids and reduce
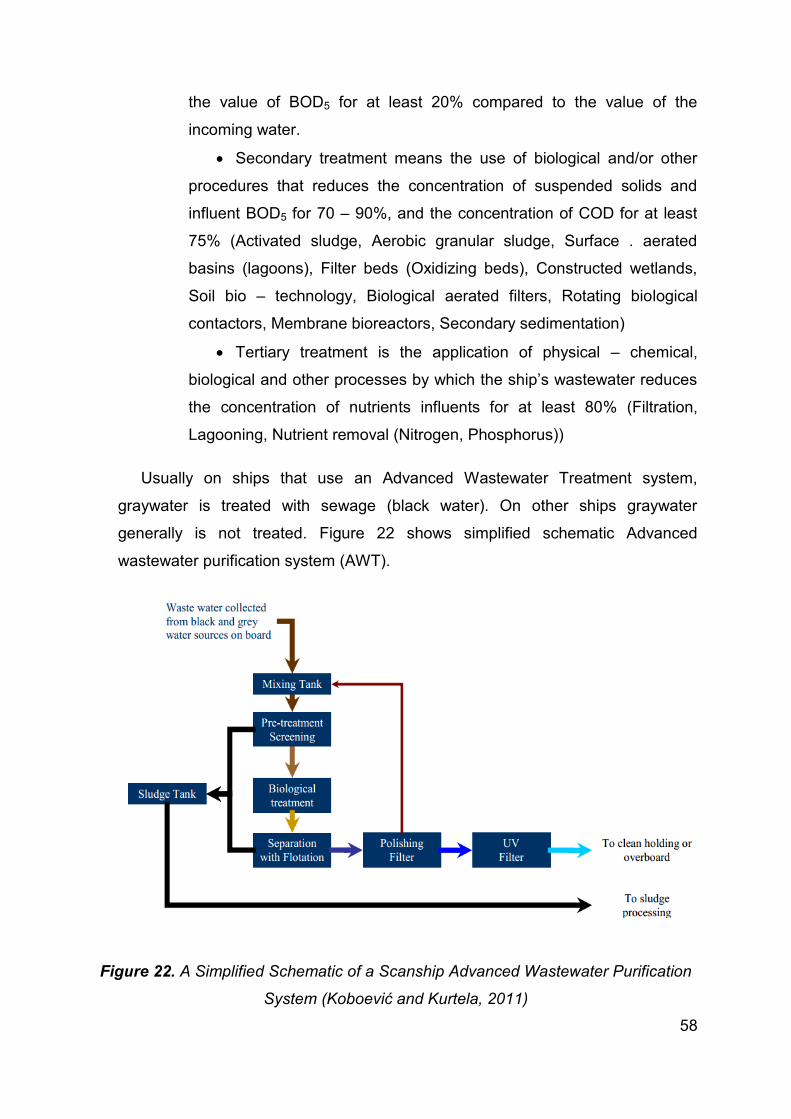
58
the value of BOD5 for at least 20% compared to the value of the
incoming water.
Secondary treatment means the use of biological and/or other
procedures that reduces the concentration of suspended solids and
influent BOD5 for 70 – 90%, and the concentration of COD for at least
75% (Activated sludge, Aerobic granular sludge, Surface . aerated
basins (lagoons), Filter beds (Oxidizing beds), Constructed wetlands,
Soil bio – technology, Biological aerated filters, Rotating biological
contactors, Membrane bioreactors, Secondary sedimentation)
Tertiary treatment is the application of physical – chemical,
biological and other processes by which the ship’s wastewater reduces
the concentration of nutrients influents for at least 80% (Filtration,
Lagooning, Nutrient removal (Nitrogen, Phosphorus))
Usually on ships that use an Advanced Wastewater Treatment system,
graywater is treated with sewage (black water). On other ships graywater
generally is not treated. Figure 22 shows simplified schematic Advanced
wastewater purification system (AWT).
Figure 22. A Simplified Schematic of a Scanship Advanced Wastewater Purification
System (Koboević and Kurtela, 2011)
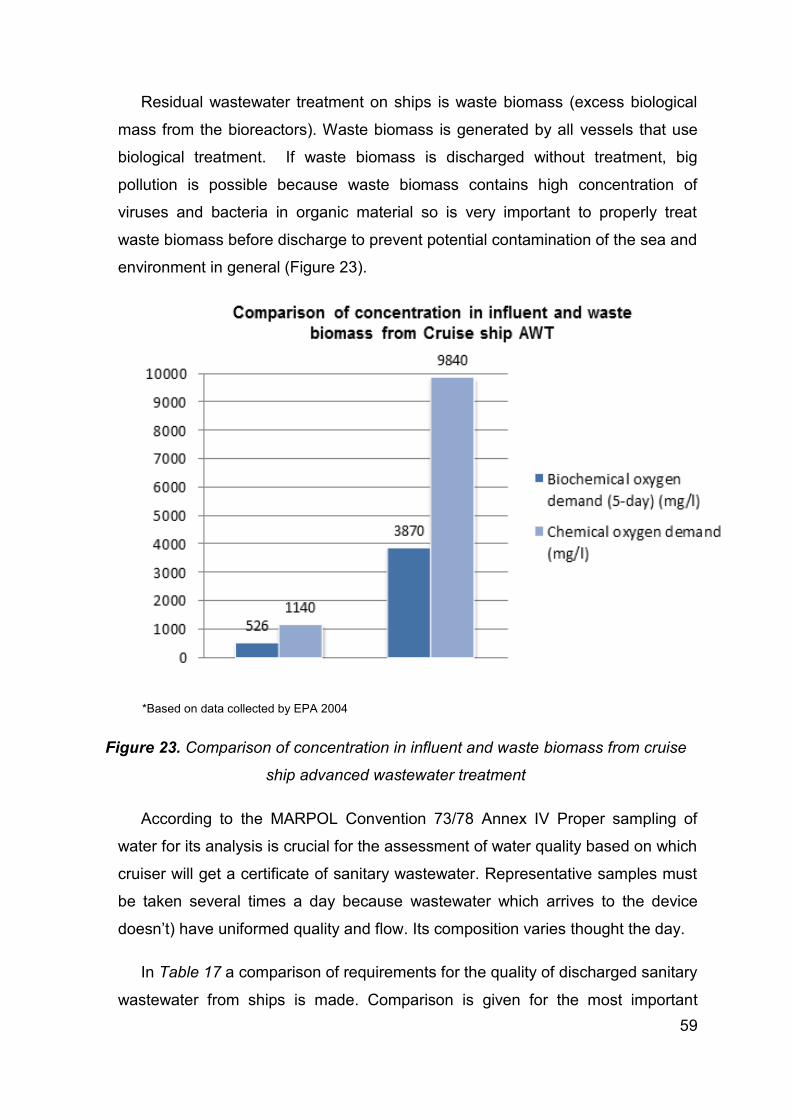
59
Residual wastewater treatment on ships is waste biomass (excess biological
mass from the bioreactors). Waste biomass is generated by all vessels that use
biological treatment. If waste biomass is discharged without treatment, big
pollution is possible because waste biomass contains high concentration of
viruses and bacteria in organic material so is very important to properly treat
waste biomass before discharge to prevent potential contamination of the sea and
environment in general (Figure 23).
*Based on data collected by EPA 2004
Figure 23. Comparison of concentration in influent and waste biomass from cruise
ship advanced wastewater treatment
According to the MARPOL Convention 73/78 Annex IV Proper sampling of
water for its analysis is crucial for the assessment of water quality based on which
cruiser will get a certificate of sanitary wastewater. Representative samples must
be taken several times a day because wastewater which arrives to the device
doesn’t) have uniformed quality and flow. Its composition varies thought the day.
In Table 17 a comparison of requirements for the quality of discharged sanitary
wastewater from ships is made. Comparison is given for the most important
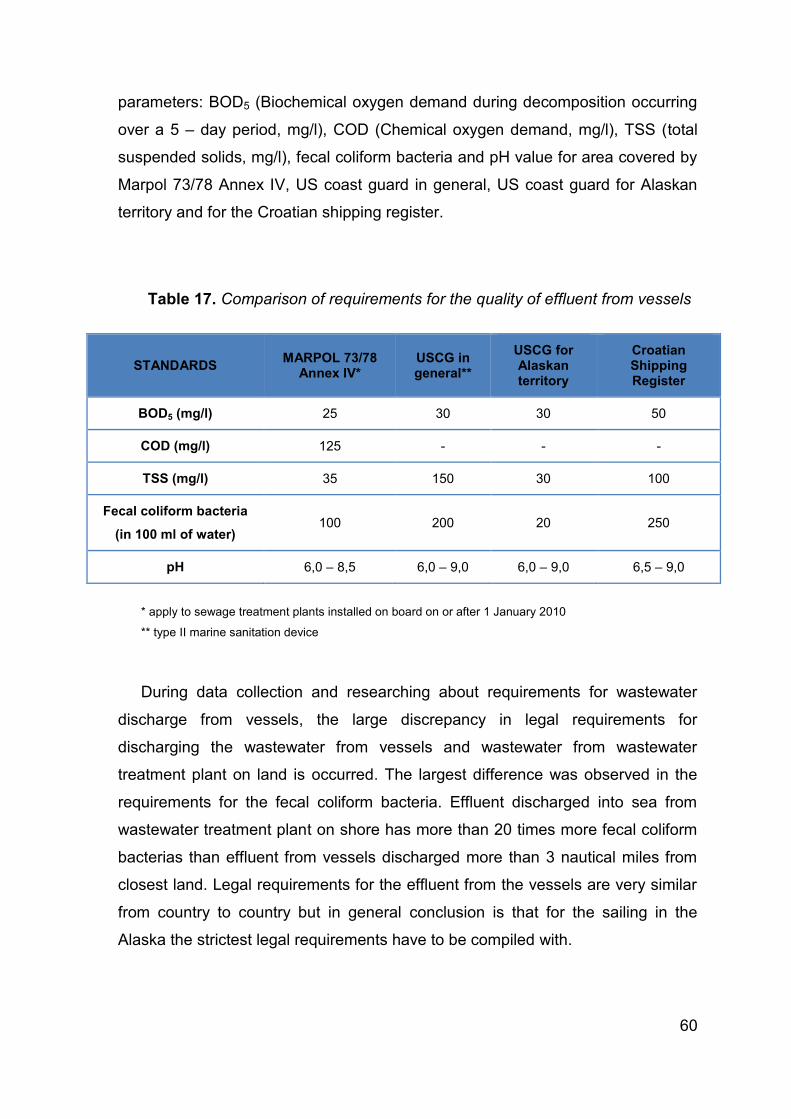
60
parameters: BOD5 (Biochemical oxygen demand during decomposition occurring
over a 5 – day period, mg/l), COD (Chemical oxygen demand, mg/l), TSS (total
suspended solids, mg/l), fecal coliform bacteria and pH value for area covered by
Marpol 73/78 Annex IV, US coast guard in general, US coast guard for Alaskan
territory and for the Croatian shipping register.
Table 17. Comparison of requirements for the quality of effluent from vessels
STANDARDS MARPOL 73/78
Annex IV* USCG in general**
USCG for Alaskan territory
Croatian Shipping Register
BOD5 (mg/l) 25 30 30 50
COD (mg/l) 125 - - -
TSS (mg/l) 35 150 30 100
Fecal coliform bacteria
(in 100 ml of water) 100 200 20 250
pH 6,0 – 8,5 6,0 – 9,0 6,0 – 9,0 6,5 – 9,0
* apply to sewage treatment plants installed on board on or after 1 January 2010
** type II marine sanitation device
During data collection and researching about requirements for wastewater
discharge from vessels, the large discrepancy in legal requirements for
discharging the wastewater from vessels and wastewater from wastewater
treatment plant on land is occurred. The largest difference was observed in the
requirements for the fecal coliform bacteria. Effluent discharged into sea from
wastewater treatment plant on shore has more than 20 times more fecal coliform
bacterias than effluent from vessels discharged more than 3 nautical miles from
closest land. Legal requirements for the effluent from the vessels are very similar
from country to country but in general conclusion is that for the sailing in the
Alaska the strictest legal requirements have to be compiled with.
61
It is very important to regulate the discharge of wastewater from ships because
usually several ships leave harbours at a time so the discharge of one ship can be
on top of the discharge of another, and that can increase growth of nutrient –
deprived algae which can create areas of oxygen – deprived water devoid of
marine life. The problem of pumping wastewater ashore can be eliminated but in
that case the price significantly increases. Of course, that option is better for
„closed“ seas like the Mediterranean. Once the wastewater is on shore,
wastewater treatment plants in harbours can purify the water and sewage sludge
(if possible – no heavy metals in it), prepare for further use in agriculture as
fertilizer. But there is another problem other than high costs – companies have to
pay for the disposal of wastewater and sludge in harbours. At present, companies
can discharge or burn waste, sludge and wastewater at their own discretion but if
they have to pump wastewater and sludge into a harbour, it can be analyzed.
Analysis will precisely show the quality and characteristic of the wastewater and
sludge which, sometimes, big cruise companies don't want because of the
composition and percentage of illicit substances.
5.2. Problems with wastewater treatment from washing areas
Problems that can occur are various. One of the biggest problems can be with
the dosage of reagents for chemical treatment needed for good purification. The
quality of incoming water isn't always the same so dosing of reagent cannot be
always the same because sometimes in tanks will be too much reagents
(expensive!) and sometimes if the water is much polluted standard dosage of
reagent would not be enough. That is why is necessary to place gauges in the
containers that determine when you need to add additional reagents to achieve
the optimum pH value.
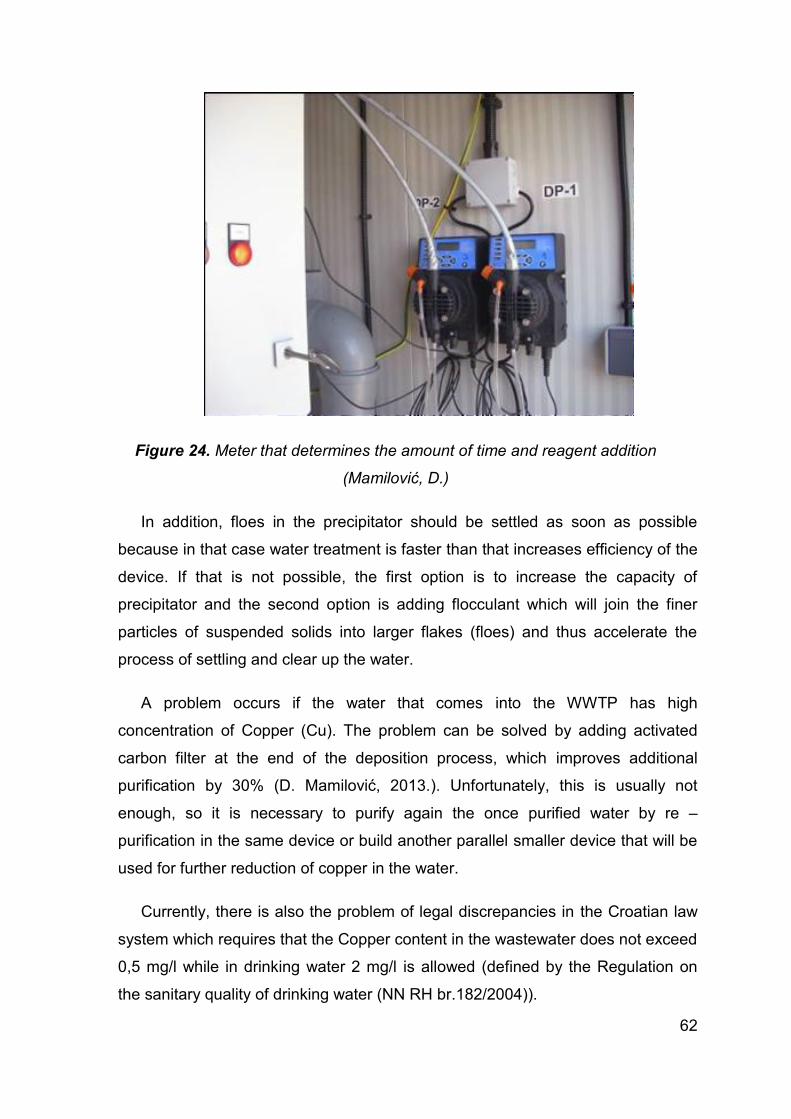
62
Figure 24. Meter that determines the amount of time and reagent addition
(Mamilović, D.)
In addition, floes in the precipitator should be settled as soon as possible
because in that case water treatment is faster than that increases efficiency of the
device. If that is not possible, the first option is to increase the capacity of
precipitator and the second option is adding flocculant which will join the finer
particles of suspended solids into larger flakes (floes) and thus accelerate the
process of settling and clear up the water.
A problem occurs if the water that comes into the WWTP has high
concentration of Copper (Cu). The problem can be solved by adding activated
carbon filter at the end of the deposition process, which improves additional
purification by 30% (D. Mamilović, 2013.). Unfortunately, this is usually not
enough, so it is necessary to purify again the once purified water by re –
purification in the same device or build another parallel smaller device that will be
used for further reduction of copper in the water.
Currently, there is also the problem of legal discrepancies in the Croatian law
system which requires that the Copper content in the wastewater does not exceed
0,5 mg/l while in drinking water 2 mg/l is allowed (defined by the Regulation on
the sanitary quality of drinking water (NN RH br.182/2004)).
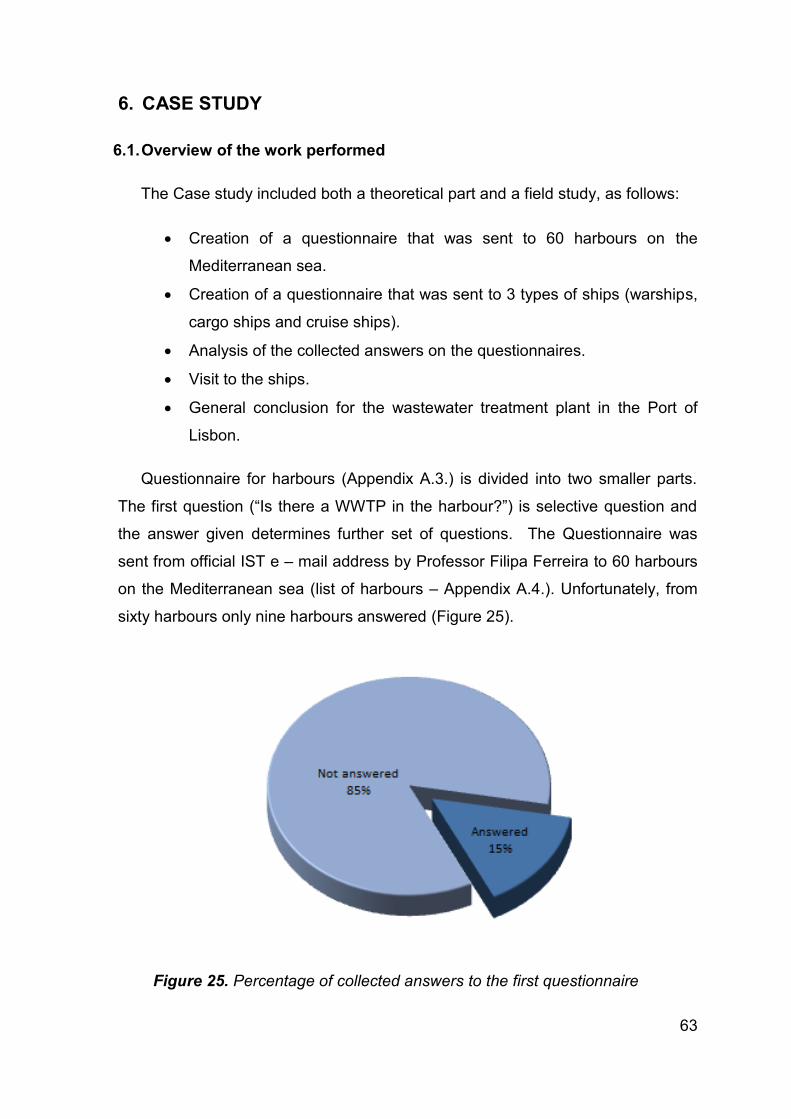
63
6. CASE STUDY
6.1. Overview of the work performed
The Case study included both a theoretical part and a field study, as follows:
Creation of a questionnaire that was sent to 60 harbours on the
Mediterranean sea.
Creation of a questionnaire that was sent to 3 types of ships (warships,
cargo ships and cruise ships).
Analysis of the collected answers on the questionnaires.
Visit to the ships.
General conclusion for the wastewater treatment plant in the Port of
Lisbon.
Questionnaire for harbours (Appendix A.3.) is divided into two smaller parts.
The first question (“Is there a WWTP in the harbour?”) is selective question and
the answer given determines further set of questions. The Questionnaire was
sent from official IST e – mail address by Professor Filipa Ferreira to 60 harbours
on the Mediterranean sea (list of harbours – Appendix A.4.). Unfortunately, from
sixty harbours only nine harbours answered (Figure 25).
Figure 25. Percentage of collected answers to the first questionnaire
64
The Questionnaire for ships (Appendix A.5.) contains 15 questions about
wastewater production onboard, wastewater treatment and discharging. Together
with Engineer Vera Godinho (Port authority, Port of Lisbon) the questionnaire was
send to ship agents and directly to ships. With collected answers from the
questionnaire, an analysis was made for each particular type of ship as well as a
comparison of three basic ship types (warships, cargo ships, cruise ships). The
Questionnaires were answered by crew members and the accuracy of the
answers is of their own responsibility.
During a period of one month six different ships were visited. One warship and
five different size cruise ship (small – approx. 200 passengers, medium - approx.
900 passengers, and big – approx. 3000 passengers). During the visits, the
process of wastewater treatment onboard was explained by the environmental
engineer or mechanical engineer working on the ship. Moreover,
environmental/mechanical ship engineer explained the problems they have
onboard and the problems that can occur during the wastewater disposal in the
port.
In addition, with the Port authority, several meetings were held on at which
engineer Vera Godinho explained in detail all the problems that the port
authorities have during the disposal of wastewater from ships as well as
wastewater treatment and disposal from harbour facilities.
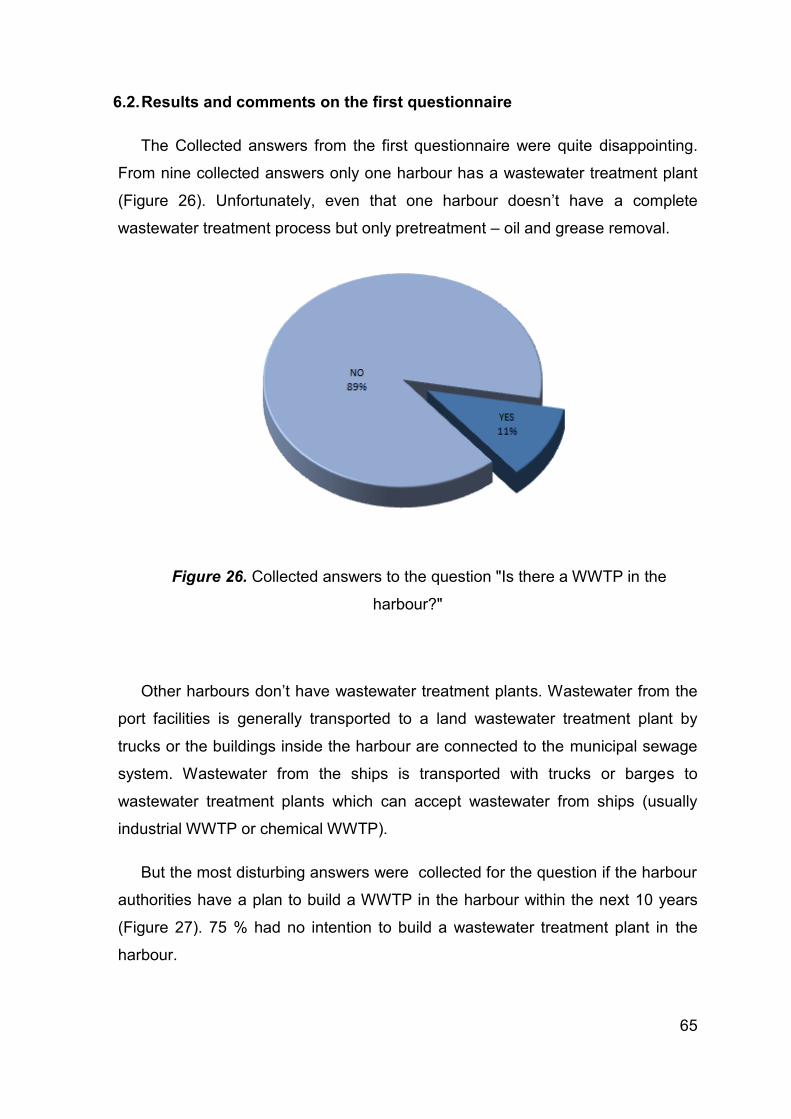
65
6.2. Results and comments on the first questionnaire
The Collected answers from the first questionnaire were quite disappointing.
From nine collected answers only one harbour has a wastewater treatment plant
(Figure 26). Unfortunately, even that one harbour doesn’t have a complete
wastewater treatment process but only pretreatment – oil and grease removal.
Figure 26. Collected answers to the question "Is there a WWTP in the
harbour?"
Other harbours don’t have wastewater treatment plants. Wastewater from the
port facilities is generally transported to a land wastewater treatment plant by
trucks or the buildings inside the harbour are connected to the municipal sewage
system. Wastewater from the ships is transported with trucks or barges to
wastewater treatment plants which can accept wastewater from ships (usually
industrial WWTP or chemical WWTP).
But the most disturbing answers were collected for the question if the harbour
authorities have a plan to build a WWTP in the harbour within the next 10 years
(Figure 27). 75 % had no intention to build a wastewater treatment plant in the
harbour.
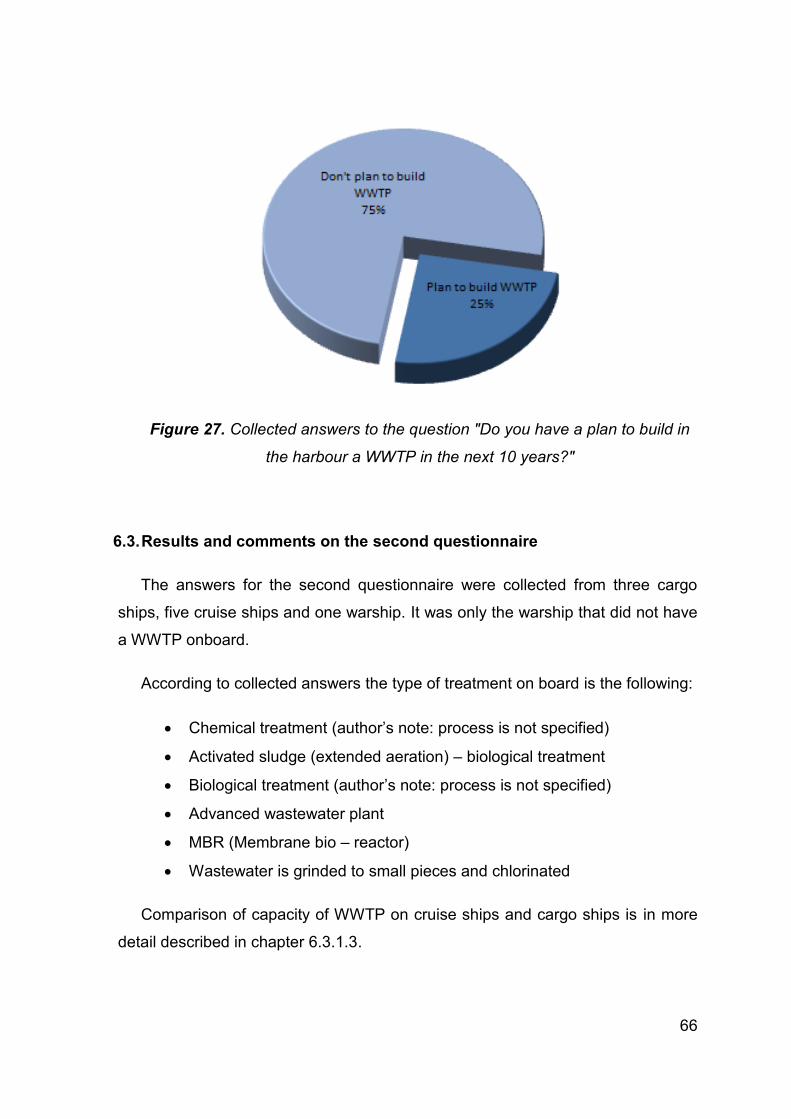
66
Figure 27. Collected answers to the question "Do you have a plan to build in
the harbour a WWTP in the next 10 years?"
6.3. Results and comments on the second questionnaire
The answers for the second questionnaire were collected from three cargo
ships, five cruise ships and one warship. It was only the warship that did not have
a WWTP onboard.
According to collected answers the type of treatment on board is the following:
Chemical treatment (author’s note: process is not specified)
Activated sludge (extended aeration) – biological treatment
Biological treatment (author’s note: process is not specified)
Advanced wastewater plant
MBR (Membrane bio – reactor)
Wastewater is grinded to small pieces and chlorinated
Comparison of capacity of WWTP on cruise ships and cargo ships is in more
detail described in chapter 6.3.1.3.
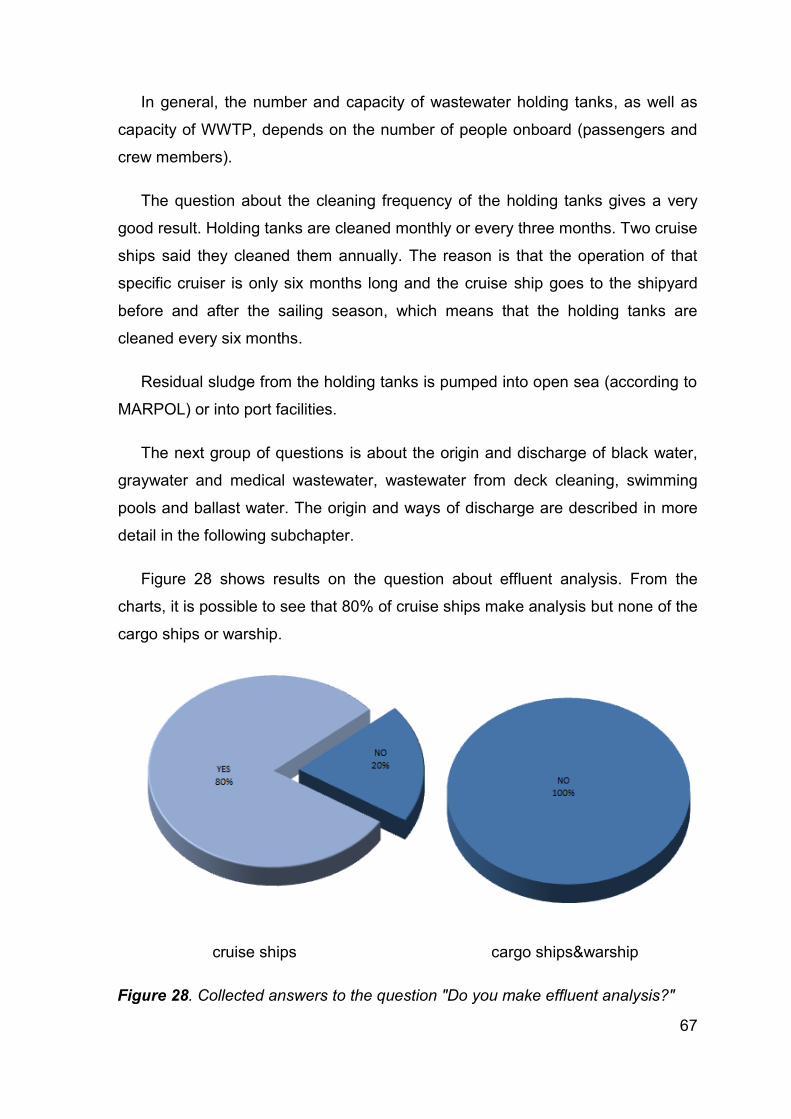
67
In general, the number and capacity of wastewater holding tanks, as well as
capacity of WWTP, depends on the number of people onboard (passengers and
crew members).
The question about the cleaning frequency of the holding tanks gives a very
good result. Holding tanks are cleaned monthly or every three months. Two cruise
ships said they cleaned them annually. The reason is that the operation of that
specific cruiser is only six months long and the cruise ship goes to the shipyard
before and after the sailing season, which means that the holding tanks are
cleaned every six months.
Residual sludge from the holding tanks is pumped into open sea (according to
MARPOL) or into port facilities.
The next group of questions is about the origin and discharge of black water,
graywater and medical wastewater, wastewater from deck cleaning, swimming
pools and ballast water. The origin and ways of discharge are described in more
detail in the following subchapter.
Figure 28 shows results on the question about effluent analysis. From the
charts, it is possible to see that 80% of cruise ships make analysis but none of the
cargo ships or warship.
cruise ships cargo ships&warship
Figure 28. Collected answers to the question "Do you make effluent analysis?"
68
To question No. 14 “Do you use salt or drinking (fresh water) for flushing toilets
cooling devices etc.” all ships, except warship, answered that they use fresh
water. One cruise ship uses combination of a vacuum system and a fresh water
system. Considering that the warship engineer told us that they are planning on
replacing the salt water system with fresh water system, problem of high chloride
concentration can be solved, but only if all ships use fresh water system or a
vacuum system.
The last question “Do you have separated tanks for wastewater and ballast
water?” gives the answer that all ships have separated tanks. Neither cruise ship
has ballast water (they have permanent ballast water – fresh water that is
changed only when the ship goes to the shipyard). The main purpose of this
question was to see if the black and gray wastewater is mixed with large
quantities of ballast water which would mean that all that volume is contaminated
with sewage and must be treated onboard before discharging according to
MARPOL or must be discharged into port facilities.
6.3.1. Characterization of the wastewater treatment onboard
6.3.1.1. General
As described in details in Chapter 4, sewage can be treated with three
principal methods: mechanical, chemical and biological. According to
Koboević&Kurtela the sewage treatment is usually a combination of the three
principal methods, such as mechanical – chemical, mechanical – biological and
chemical – biological. The treatment of sewage includes the following stages:
Wastewater accumulation
Wastewater pre – treatment
Wastewater oxidation
Wastewater clarification and filtration
Wastewater disinfection
Sludge treatment
The term “marine sanitation device” (MSD) means equipment for installation
onboard a vessel which is designed to receive, retain, treat or discharge sewage,
69
and any process to treat such sewage (US environmental protection agency,
2008). There are 3 types of MSDs recognized by the US Coast guard:
1. Type I MSDs are flow – through treatment devices that commonly use
maceration (the use of a machine that reduces solids to small pieces in
order to deal with rags and other solid waste) and disinfection for
treatment of the sewage. Type I devices may be used only on vessels
less than or equal to 20 m (65 feet) in length. EPA’s performance
standard for Type I MSDs is an effluent with a fecal coliform count not
to exceed 1000 per 100 milliliters of water, with no visible floating
solids.
2. Type II MSDs also are flow – through treatment devices, generally
employing biological treatment and disinfection. Some Type II MSDs
use maceration and disinfection. Type II MSDs may be used on vessels
of any size. EPA’s performance standard for Type II MSDs is an
effluent with a fecal coliform count not to exceed 200 per 100 milliliters
of water and total suspended solids no greater than 150 milligrams per
liter of water.
3. Type III MSDs are holding tanks, where sewage is stored until it can be
properly disposed of at a shore – side pump out facility or out at open
sea. Type III MSDs also may be used on vessels of any size. EPA is
not aware of any cruise vessels that use Type III MSDs exclusively.
However, a Type II MSD may be equipped with installed holding tanks
which can be used to store treated sewage until reaching a pump out
facility or discharged overboard according to MARPOL or stricter state
legislation.
Most of a cargo and cruise ships with traditional Type II Marine Sanitation
Devices (MSD) (Figure 29), sewage is treated using biological treatment and
chlorination. Some cruise ships do not treat their sewage biologically, but instead
use maceration and chlorination. Biological – chlorination MSDs operate similarly
to biological wastewater treatment plant on land for municipal wastewater
treatment. The treatment system typically includes aerobic biological treatment to
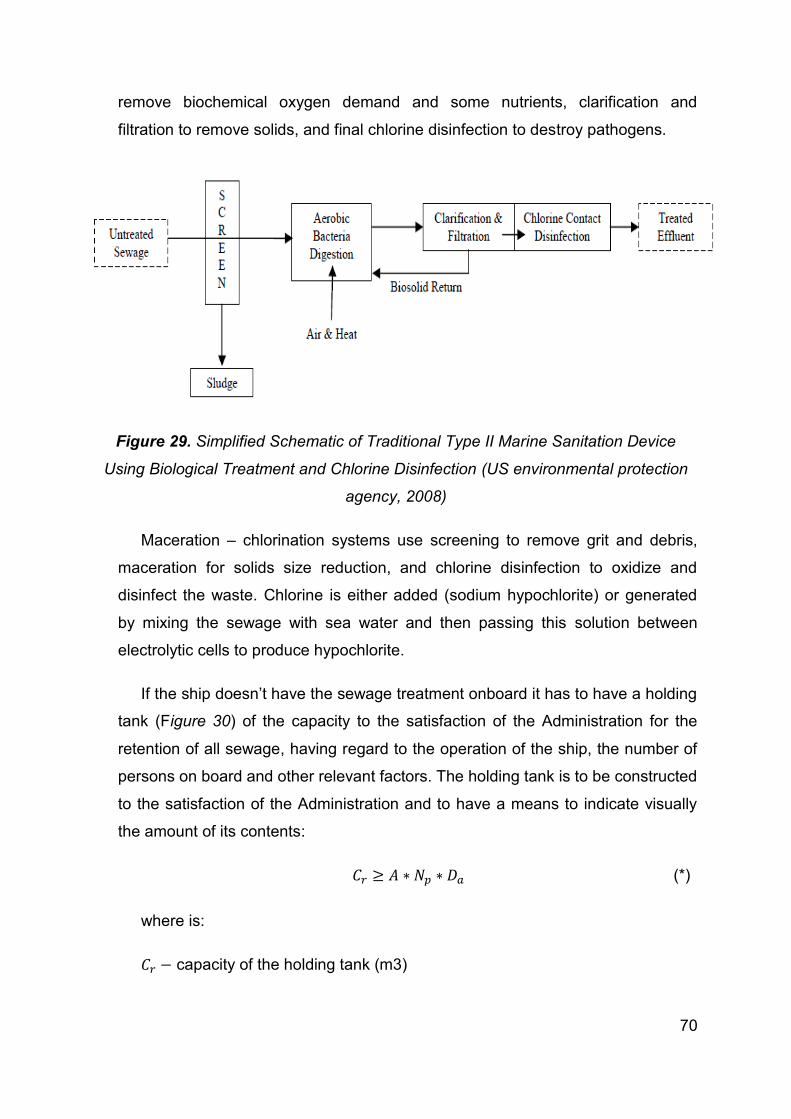
70
remove biochemical oxygen demand and some nutrients, clarification and
filtration to remove solids, and final chlorine disinfection to destroy pathogens.
Figure 29. Simplified Schematic of Traditional Type II Marine Sanitation Device
Using Biological Treatment and Chlorine Disinfection (US environmental protection
agency, 2008)
Maceration – chlorination systems use screening to remove grit and debris,
maceration for solids size reduction, and chlorine disinfection to oxidize and
disinfect the waste. Chlorine is either added (sodium hypochlorite) or generated
by mixing the sewage with sea water and then passing this solution between
electrolytic cells to produce hypochlorite.
If the ship doesn’t have the sewage treatment onboard it has to have a holding
tank (Figure 30) of the capacity to the satisfaction of the Administration for the
retention of all sewage, having regard to the operation of the ship, the number of
persons on board and other relevant factors. The holding tank is to be constructed
to the satisfaction of the Administration and to have a means to indicate visually
the amount of its contents:
(*)
where is:
capacity of the holding tank (m3)
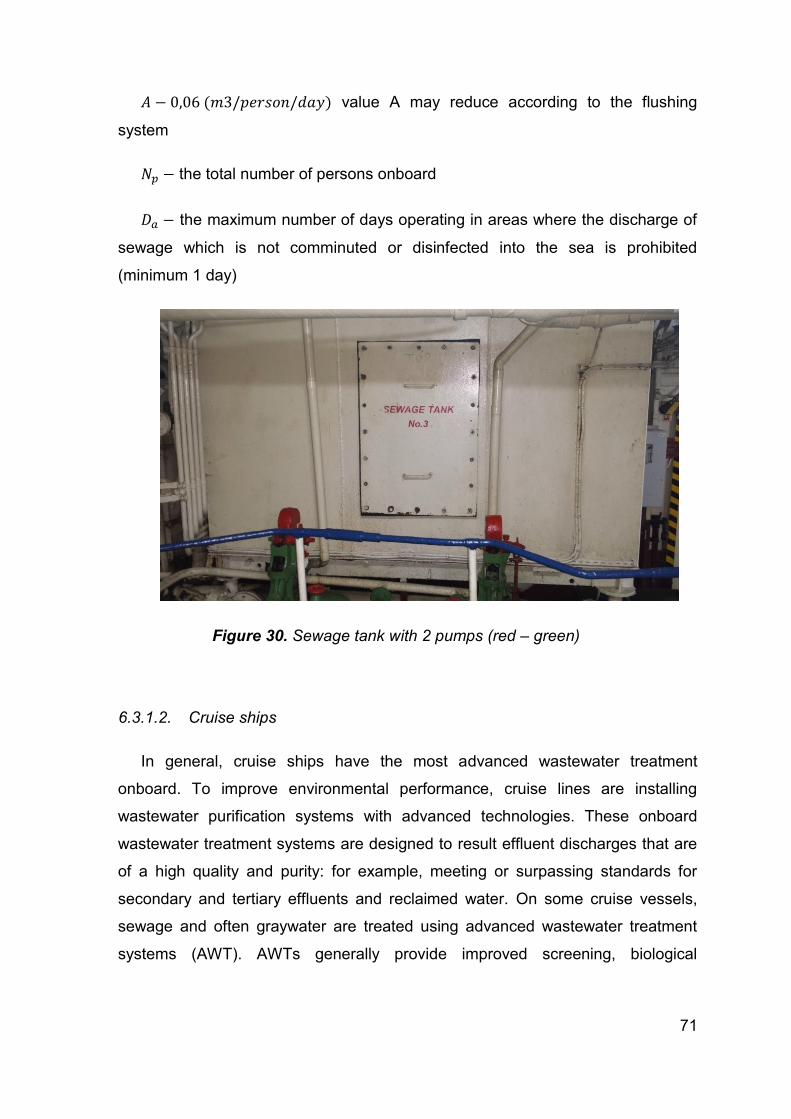
71
value A may reduce according to the flushing
system
the total number of persons onboard
the maximum number of days operating in areas where the discharge of
sewage which is not comminuted or disinfected into the sea is prohibited
(minimum 1 day)
Figure 30. Sewage tank with 2 pumps (red – green)
6.3.1.2. Cruise ships
In general, cruise ships have the most advanced wastewater treatment
onboard. To improve environmental performance, cruise lines are installing
wastewater purification systems with advanced technologies. These onboard
wastewater treatment systems are designed to result effluent discharges that are
of a high quality and purity: for example, meeting or surpassing standards for
secondary and tertiary effluents and reclaimed water. On some cruise vessels,
sewage and often graywater are treated using advanced wastewater treatment
systems (AWT). AWTs generally provide improved screening, biological
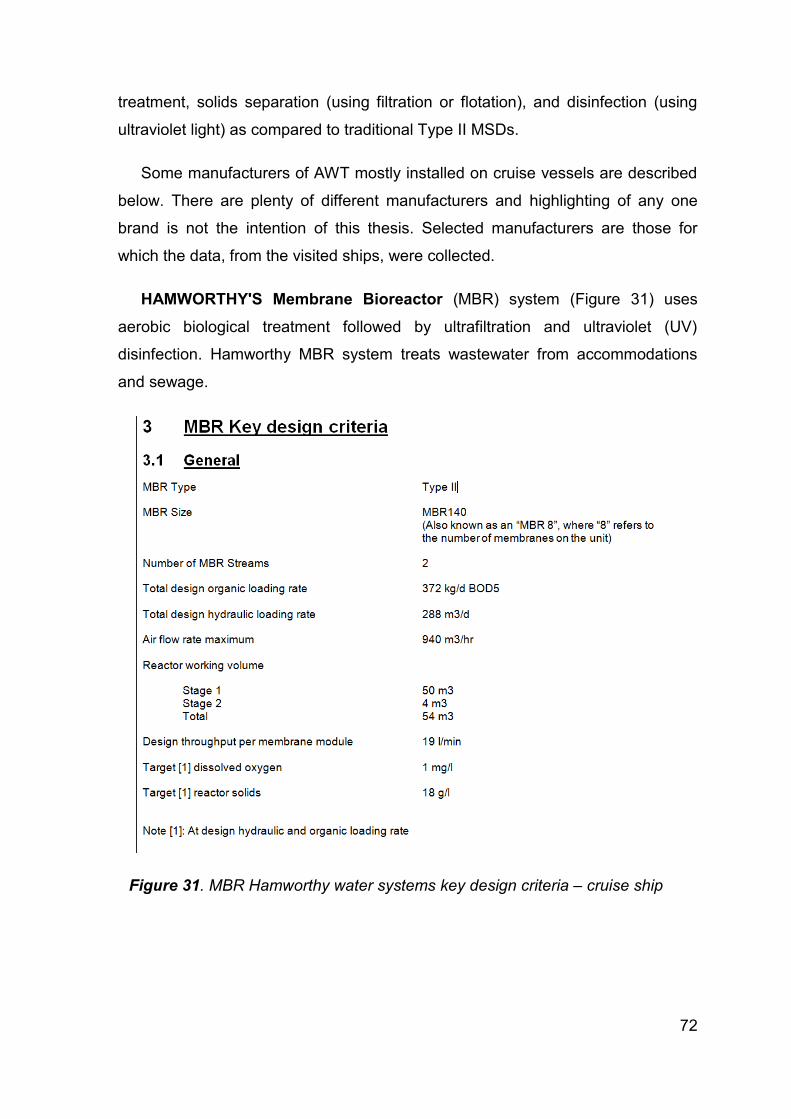
72
treatment, solids separation (using filtration or flotation), and disinfection (using
ultraviolet light) as compared to traditional Type II MSDs.
Some manufacturers of AWT mostly installed on cruise vessels are described
below. There are plenty of different manufacturers and highlighting of any one
brand is not the intention of this thesis. Selected manufacturers are those for
which the data, from the visited ships, were collected.
HAMWORTHY'S Membrane Bioreactor (MBR) system (Figure 31) uses
aerobic biological treatment followed by ultrafiltration and ultraviolet (UV)
disinfection. Hamworthy MBR system treats wastewater from accommodations
and sewage.
Figure 31. MBR Hamworthy water systems key design criteria – cruise ship
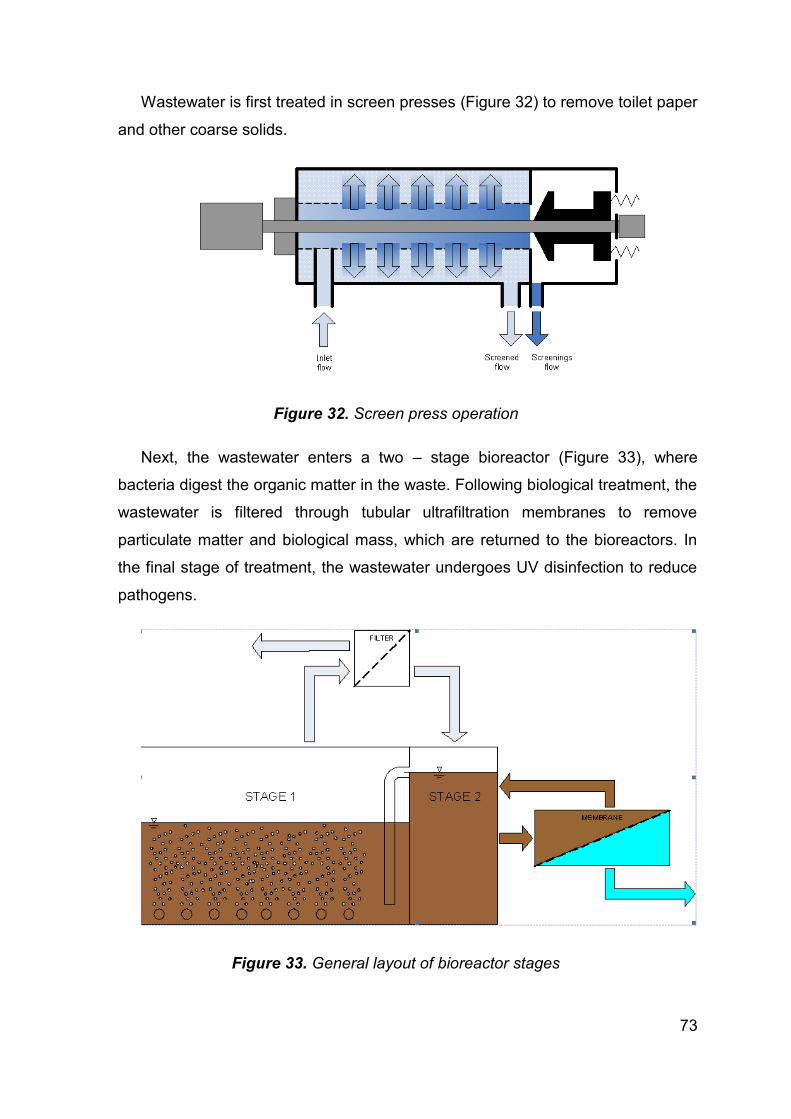
73
Wastewater is first treated in screen presses (Figure 32) to remove toilet paper
and other coarse solids.
Figure 32. Screen press operation
Next, the wastewater enters a two – stage bioreactor (Figure 33), where
bacteria digest the organic matter in the waste. Following biological treatment, the
wastewater is filtered through tubular ultrafiltration membranes to remove
particulate matter and biological mass, which are returned to the bioreactors. In
the final stage of treatment, the wastewater undergoes UV disinfection to reduce
pathogens.
Figure 33. General layout of bioreactor stages
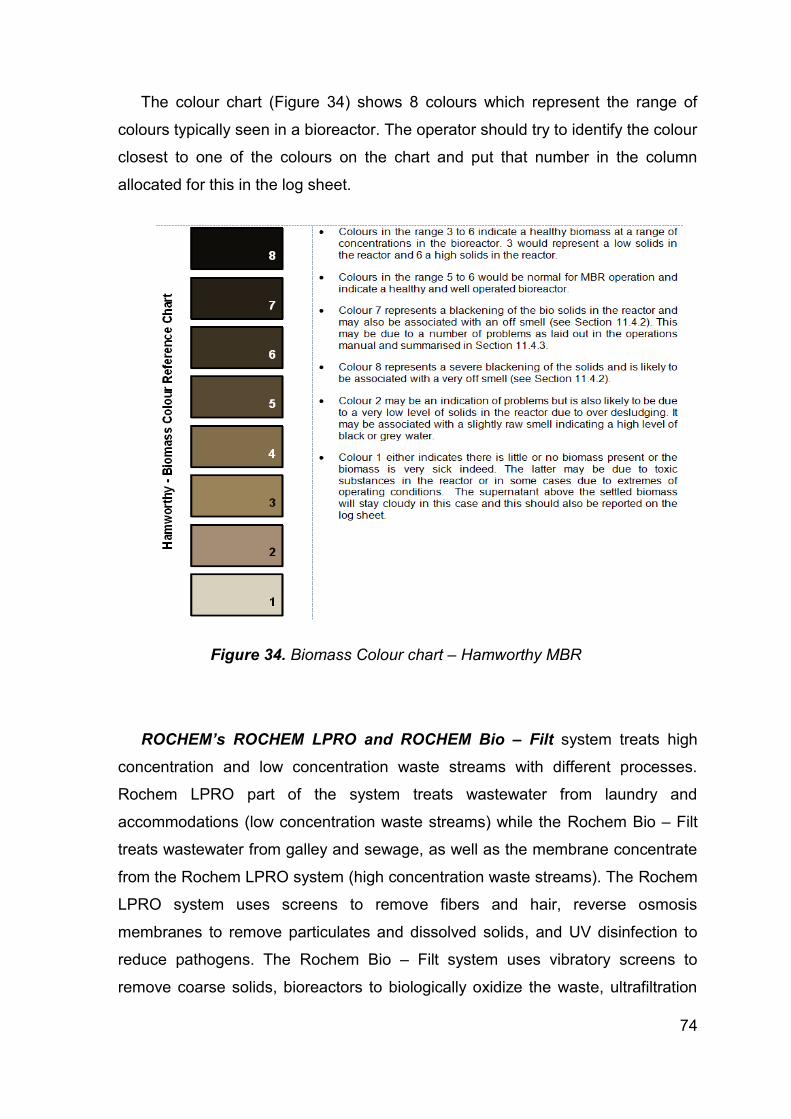
74
The colour chart (Figure 34) shows 8 colours which represent the range of
colours typically seen in a bioreactor. The operator should try to identify the colour
closest to one of the colours on the chart and put that number in the column
allocated for this in the log sheet.
Figure 34. Biomass Colour chart – Hamworthy MBR
ROCHEM’s ROCHEM LPRO and ROCHEM Bio – Filt system treats high
concentration and low concentration waste streams with different processes.
Rochem LPRO part of the system treats wastewater from laundry and
accommodations (low concentration waste streams) while the Rochem Bio – Filt
treats wastewater from galley and sewage, as well as the membrane concentrate
from the Rochem LPRO system (high concentration waste streams). The Rochem
LPRO system uses screens to remove fibers and hair, reverse osmosis
membranes to remove particulates and dissolved solids, and UV disinfection to
reduce pathogens. The Rochem Bio – Filt system uses vibratory screens to
remove coarse solids, bioreactors to biologically oxidize the waste, ultrafiltration
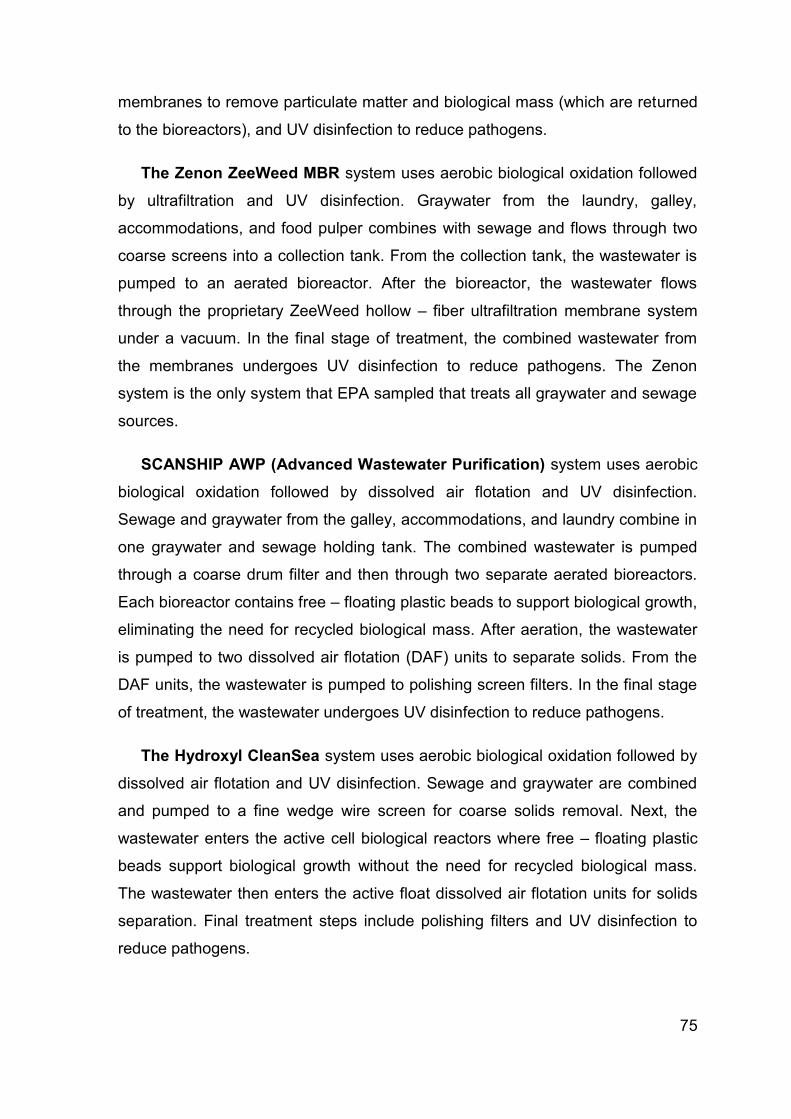
75
membranes to remove particulate matter and biological mass (which are returned
to the bioreactors), and UV disinfection to reduce pathogens.
The Zenon ZeeWeed MBR system uses aerobic biological oxidation followed
by ultrafiltration and UV disinfection. Graywater from the laundry, galley,
accommodations, and food pulper combines with sewage and flows through two
coarse screens into a collection tank. From the collection tank, the wastewater is
pumped to an aerated bioreactor. After the bioreactor, the wastewater flows
through the proprietary ZeeWeed hollow – fiber ultrafiltration membrane system
under a vacuum. In the final stage of treatment, the combined wastewater from
the membranes undergoes UV disinfection to reduce pathogens. The Zenon
system is the only system that EPA sampled that treats all graywater and sewage
sources.
SCANSHIP AWP (Advanced Wastewater Purification) system uses aerobic
biological oxidation followed by dissolved air flotation and UV disinfection.
Sewage and graywater from the galley, accommodations, and laundry combine in
one graywater and sewage holding tank. The combined wastewater is pumped
through a coarse drum filter and then through two separate aerated bioreactors.
Each bioreactor contains free – floating plastic beads to support biological growth,
eliminating the need for recycled biological mass. After aeration, the wastewater
is pumped to two dissolved air flotation (DAF) units to separate solids. From the
DAF units, the wastewater is pumped to polishing screen filters. In the final stage
of treatment, the wastewater undergoes UV disinfection to reduce pathogens.
The Hydroxyl CleanSea system uses aerobic biological oxidation followed by
dissolved air flotation and UV disinfection. Sewage and graywater are combined
and pumped to a fine wedge wire screen for coarse solids removal. Next, the
wastewater enters the active cell biological reactors where free – floating plastic
beads support biological growth without the need for recycled biological mass.
The wastewater then enters the active float dissolved air flotation units for solids
separation. Final treatment steps include polishing filters and UV disinfection to
reduce pathogens.
76
EVAC is a company that designs, manufactures and markets environmentally
friendly waste and wastewater collection and treatment solutions for the marine
industry worldwide. The Evac MBR is a single stream Advanced Waste Water
Treatment system where all the waste streams are treated in one process. The
Evac MBR is based on effective equalizing and mixing of the incoming waste
streams, pre – treatment by screens, an aerated biotank and a membrane
bioreactor. In this proposal, a nutrient removal step is added to the basic process.
The Evac MBR process is fully automated and controlled through a PLC by
vacuum/pressure switches, level switches, DO, TSS and pH sensors, flow meters
and foam detectors. Membranes are of submerged type, supplied by Japanese
company Kubota.
Beside the advanced technologies cruisers have big volume holding tanks.
According to collected answers, the cleaning of tanks from cruises happens
mostly every three months. Sludge from the bottom of the tanks is pumped into
the open sea (12 NM from closest land). In general, cruise ships treat black water
(sewage) as well as graywater but only cruisers that were built in recent past have
separated tanks for graywater and black water. Wastewater from cleaning decks
is discharged into the sea or collected with graywater, treated and discharged.
The problem with wastewater from cruise ships occurs with water from swimming
pools and Jacuzzis. Usually, salt water is used for swimming pools and
chlorinated fresh water for Jacuzzis. Onboard treatment of swimming pool
wastewater can cause problems with biological WWTP, so usually water from the
swimming pools is directly discharged into the sea while fresh sea water is
pumped into the swimming pool. On older cruise ships medical wastewater is
collected together with black water and treated. Newer cruise ships collect black
and medical wastewater separately and treat if possible. If treatment of medical
wastewater is not possible (e.g. infectious, contains hazardous chemicals, etc…),
wastewater is discharged into port facilities.
Most cruise ships do not have ballast water. They have permanent ballast
water tanks filled with fresh water. Ballast water from tanks is changed once a
year when the ship goes to the shipyard.
77
According to collected answers on questionnaire, cruisers have fresh water
(drinking water) for flushing toilets and cooling devices. Some cruisers have
combined vacuum system for flushing toilets and fresh water system for other.
Figure 35 shows simplified schematic for wastewater treatment onboard. This
scheme was made by a main ship engineer from one of the cruise ships. Every
ship has a specific wastewater treatment system, but in general they are based
on this scheme.
Wastewater from ship is collected into five small tanks capacity up to 8 m3
(Figure 30). From small sewage tanks water is pumped into big holding tanks.
Assessment of the capacity of holding tanks is described in details in chapter
6.3.1.1. From holding tanks, wastewater is pumped into treatment plant and
afterwards discharged into the sea according to MARPOL. If the ship is in harbour
for few days or longer, wastewater is pumped from holding tanks into port facilities
(trucks, barges etc.).
To conclude, cruise ships in general have the most sophisticated wastewater
treatment systems onboard. Information about effluent quality and about the type
of wastewater is publicly available and cruise companies are truly environmentally
conscious and this is what the practice should be for all other ship types!
Figure 35. Simplified schematic for wastewater treatment onboard
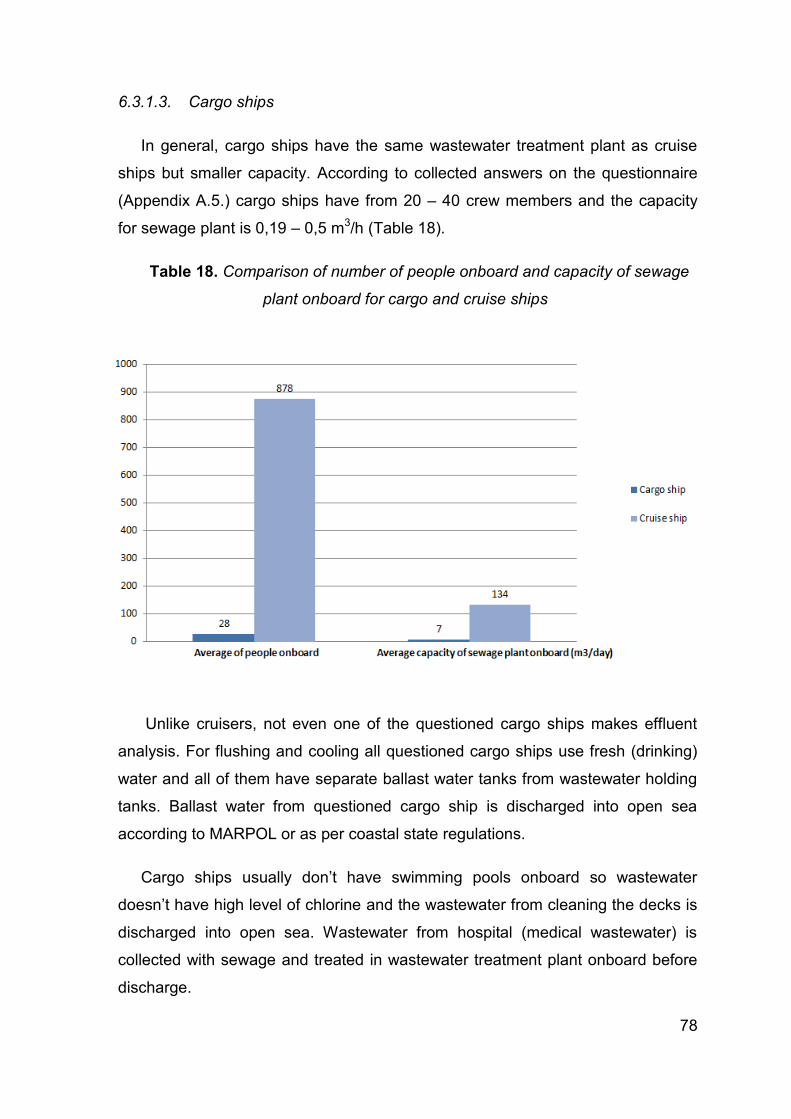
78
6.3.1.3. Cargo ships
In general, cargo ships have the same wastewater treatment plant as cruise
ships but smaller capacity. According to collected answers on the questionnaire
(Appendix A.5.) cargo ships have from 20 – 40 crew members and the capacity
for sewage plant is 0,19 – 0,5 m3/h (Table 18).
Table 18. Comparison of number of people onboard and capacity of sewage
plant onboard for cargo and cruise ships
Unlike cruisers, not even one of the questioned cargo ships makes effluent
analysis. For flushing and cooling all questioned cargo ships use fresh (drinking)
water and all of them have separate ballast water tanks from wastewater holding
tanks. Ballast water from questioned cargo ship is discharged into open sea
according to MARPOL or as per coastal state regulations.
Cargo ships usually don’t have swimming pools onboard so wastewater
doesn’t have high level of chlorine and the wastewater from cleaning the decks is
discharged into open sea. Wastewater from hospital (medical wastewater) is
collected with sewage and treated in wastewater treatment plant onboard before
discharge.
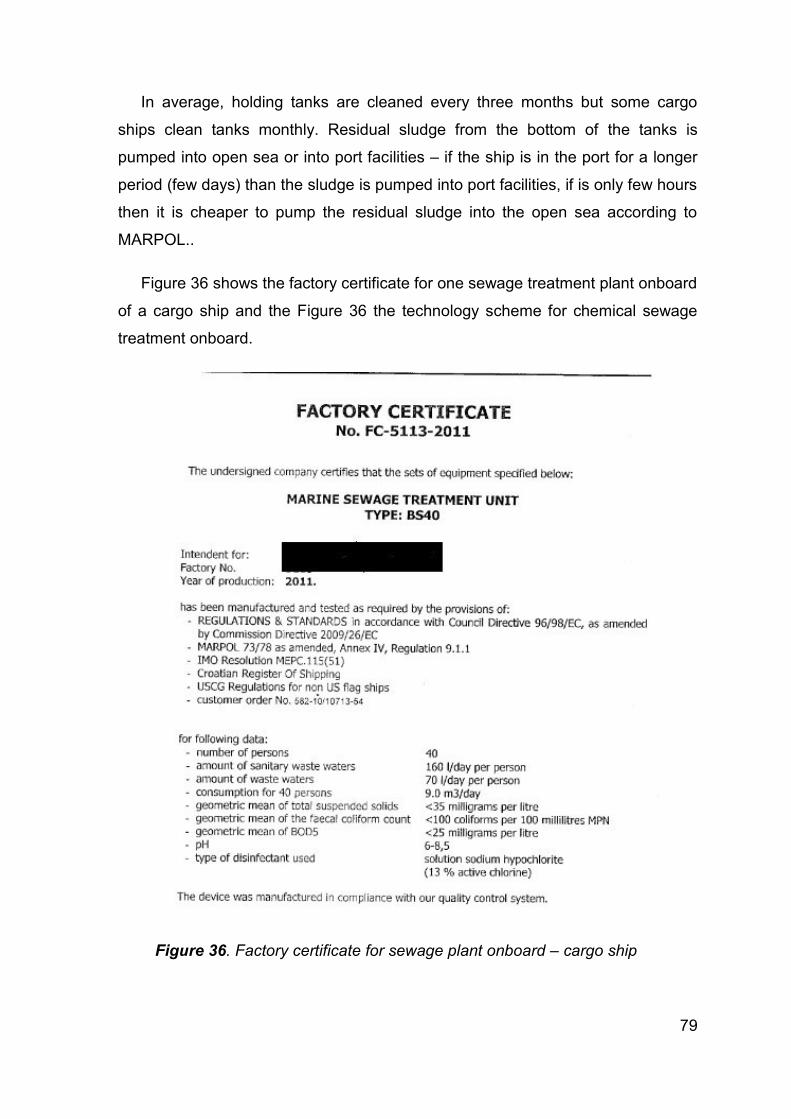
79
In average, holding tanks are cleaned every three months but some cargo
ships clean tanks monthly. Residual sludge from the bottom of the tanks is
pumped into open sea or into port facilities – if the ship is in the port for a longer
period (few days) than the sludge is pumped into port facilities, if is only few hours
then it is cheaper to pump the residual sludge into the open sea according to
MARPOL..
Figure 36 shows the factory certificate for one sewage treatment plant onboard
of a cargo ship and the Figure 36 the technology scheme for chemical sewage
treatment onboard.
Figure 36. Factory certificate for sewage plant onboard – cargo ship
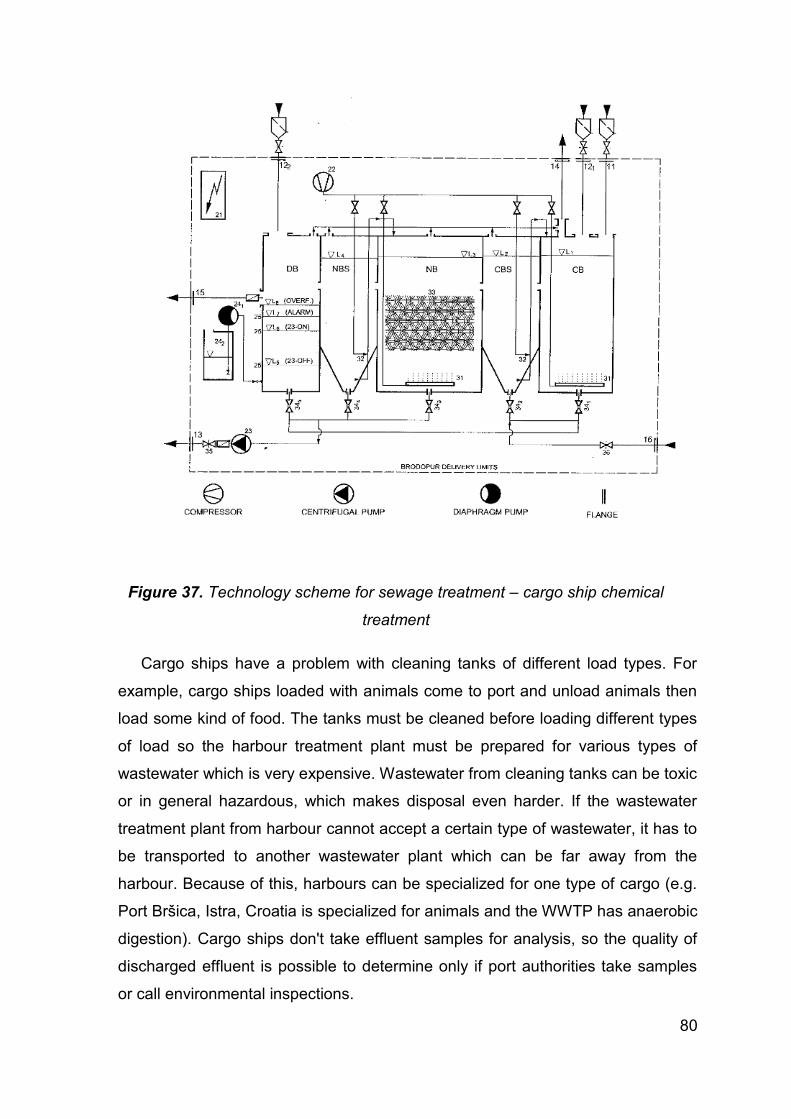
80
Figure 37. Technology scheme for sewage treatment – cargo ship chemical
treatment
Cargo ships have a problem with cleaning tanks of different load types. For
example, cargo ships loaded with animals come to port and unload animals then
load some kind of food. The tanks must be cleaned before loading different types
of load so the harbour treatment plant must be prepared for various types of
wastewater which is very expensive. Wastewater from cleaning tanks can be toxic
or in general hazardous, which makes disposal even harder. If the wastewater
treatment plant from harbour cannot accept a certain type of wastewater, it has to
be transported to another wastewater plant which can be far away from the
harbour. Because of this, harbours can be specialized for one type of cargo (e.g.
Port Bršica, Istra, Croatia is specialized for animals and the WWTP has anaerobic
digestion). Cargo ships don't take effluent samples for analysis, so the quality of
discharged effluent is possible to determine only if port authorities take samples
or call environmental inspections.
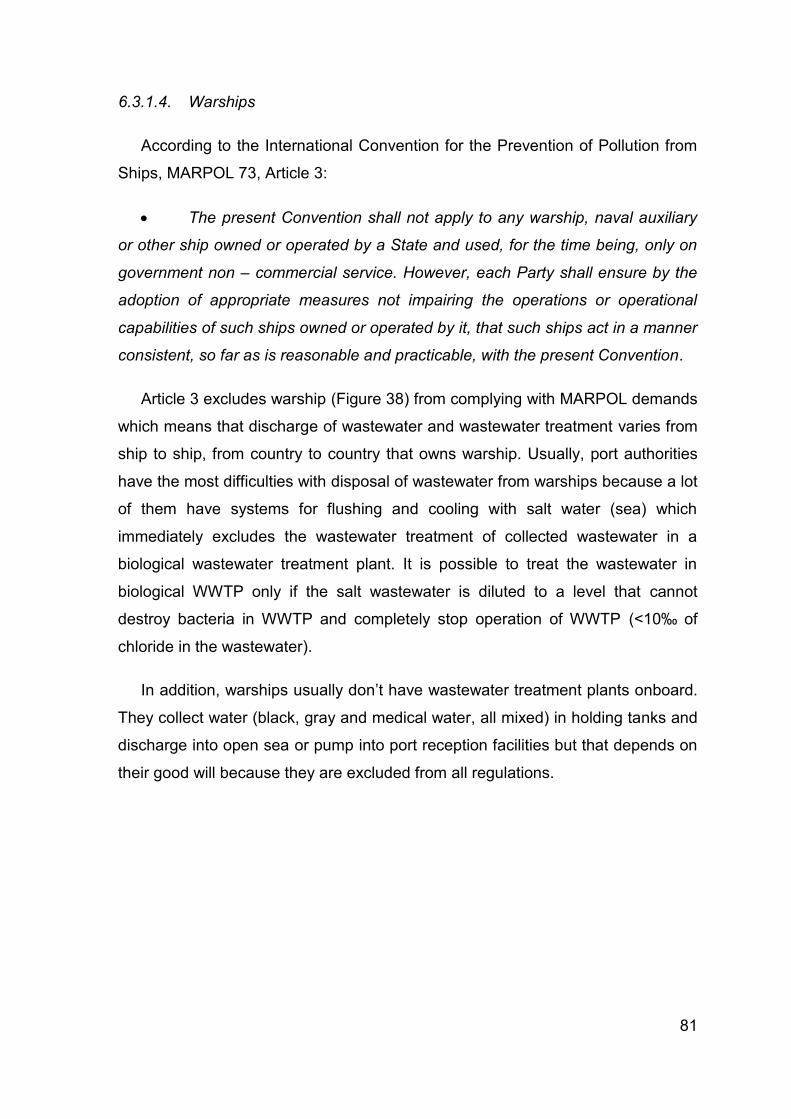
81
6.3.1.4. Warships
According to the International Convention for the Prevention of Pollution from
Ships, MARPOL 73, Article 3:
The present Convention shall not apply to any warship, naval auxiliary
or other ship owned or operated by a State and used, for the time being, only on
government non – commercial service. However, each Party shall ensure by the
adoption of appropriate measures not impairing the operations or operational
capabilities of such ships owned or operated by it, that such ships act in a manner
consistent, so far as is reasonable and practicable, with the present Convention.
Article 3 excludes warship (Figure 38) from complying with MARPOL demands
which means that discharge of wastewater and wastewater treatment varies from
ship to ship, from country to country that owns warship. Usually, port authorities
have the most difficulties with disposal of wastewater from warships because a lot
of them have systems for flushing and cooling with salt water (sea) which
immediately excludes the wastewater treatment of collected wastewater in a
biological wastewater treatment plant. It is possible to treat the wastewater in
biological WWTP only if the salt wastewater is diluted to a level that cannot
destroy bacteria in WWTP and completely stop operation of WWTP (<10‰ of
chloride in the wastewater).
In addition, warships usually don’t have wastewater treatment plants onboard.
They collect water (black, gray and medical water, all mixed) in holding tanks and
discharge into open sea or pump into port reception facilities but that depends on
their good will because they are excluded from all regulations.
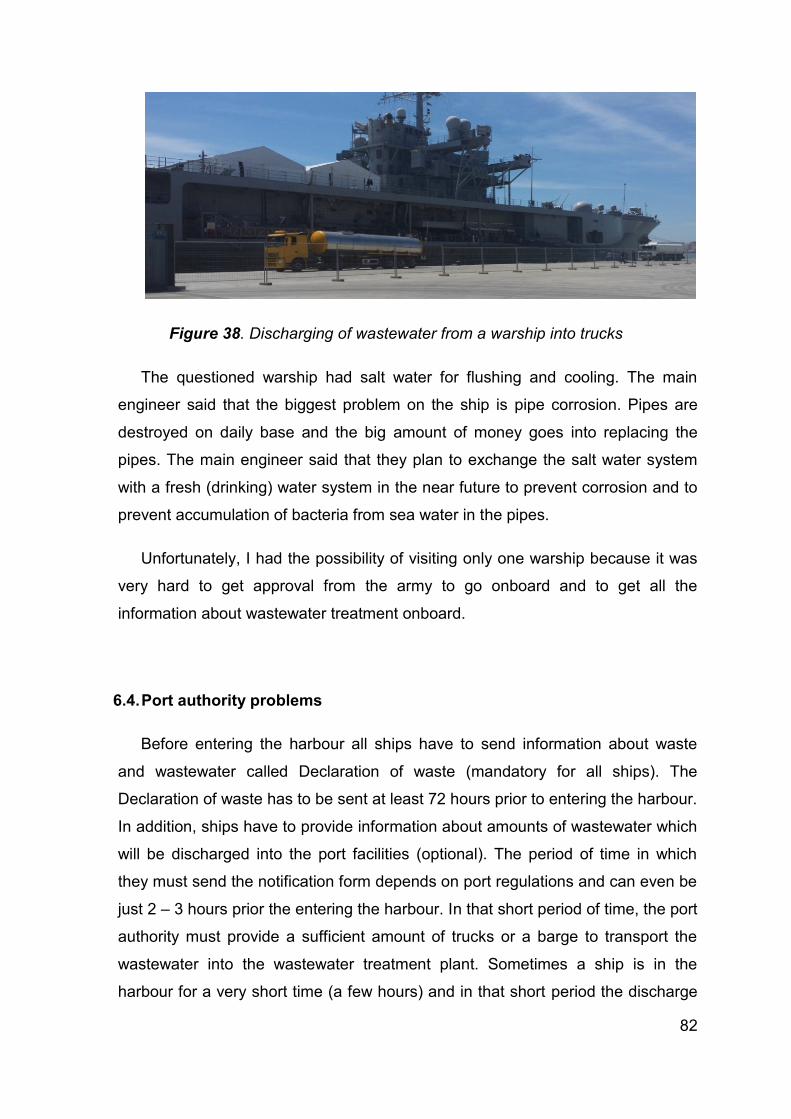
82
Figure 38. Discharging of wastewater from a warship into trucks
The questioned warship had salt water for flushing and cooling. The main
engineer said that the biggest problem on the ship is pipe corrosion. Pipes are
destroyed on daily base and the big amount of money goes into replacing the
pipes. The main engineer said that they plan to exchange the salt water system
with a fresh (drinking) water system in the near future to prevent corrosion and to
prevent accumulation of bacteria from sea water in the pipes.
Unfortunately, I had the possibility of visiting only one warship because it was
very hard to get approval from the army to go onboard and to get all the
information about wastewater treatment onboard.
6.4. Port authority problems
Before entering the harbour all ships have to send information about waste
and wastewater called Declaration of waste (mandatory for all ships). The
Declaration of waste has to be sent at least 72 hours prior to entering the harbour.
In addition, ships have to provide information about amounts of wastewater which
will be discharged into the port facilities (optional). The period of time in which
they must send the notification form depends on port regulations and can even be
just 2 – 3 hours prior the entering the harbour. In that short period of time, the port
authority must provide a sufficient amount of trucks or a barge to transport the
wastewater into the wastewater treatment plant. Sometimes a ship is in the
harbour for a very short time (a few hours) and in that short period the discharge
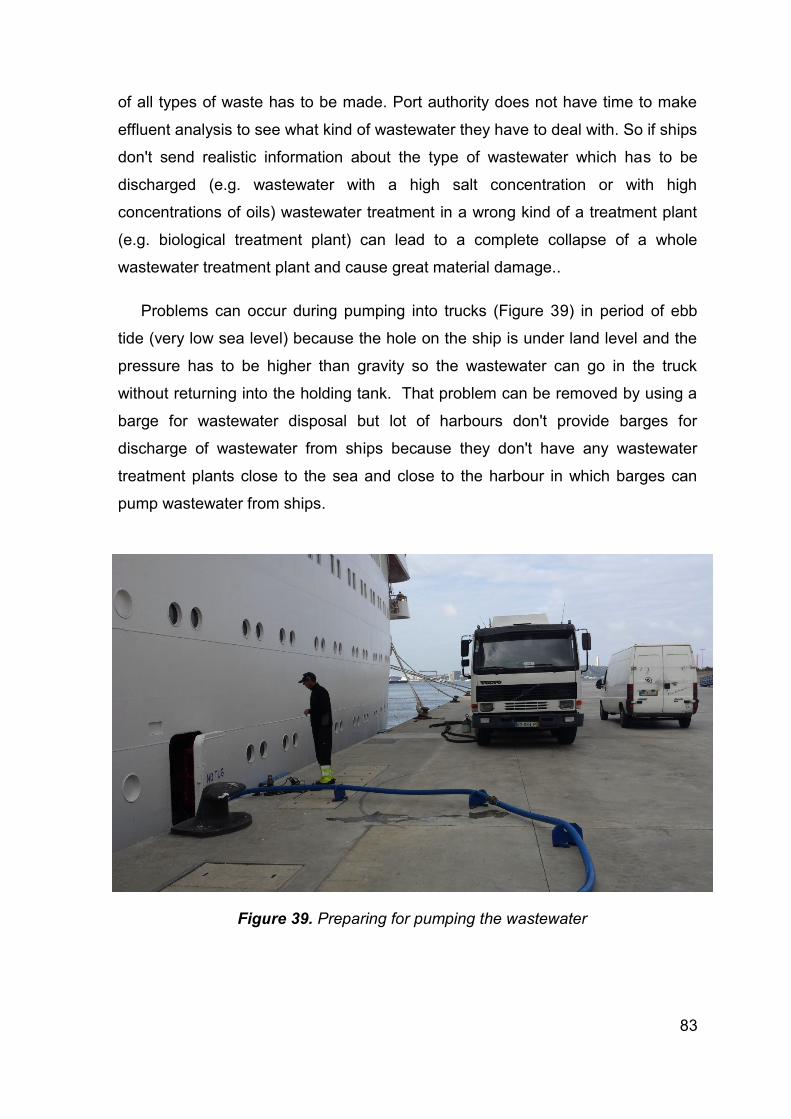
83
of all types of waste has to be made. Port authority does not have time to make
effluent analysis to see what kind of wastewater they have to deal with. So if ships
don't send realistic information about the type of wastewater which has to be
discharged (e.g. wastewater with a high salt concentration or with high
concentrations of oils) wastewater treatment in a wrong kind of a treatment plant
(e.g. biological treatment plant) can lead to a complete collapse of a whole
wastewater treatment plant and cause great material damage..
Problems can occur during pumping into trucks (Figure 39) in period of ebb
tide (very low sea level) because the hole on the ship is under land level and the
pressure has to be higher than gravity so the wastewater can go in the truck
without returning into the holding tank. That problem can be removed by using a
barge for wastewater disposal but lot of harbours don't provide barges for
discharge of wastewater from ships because they don't have any wastewater
treatment plants close to the sea and close to the harbour in which barges can
pump wastewater from ships.
Figure 39. Preparing for pumping the wastewater
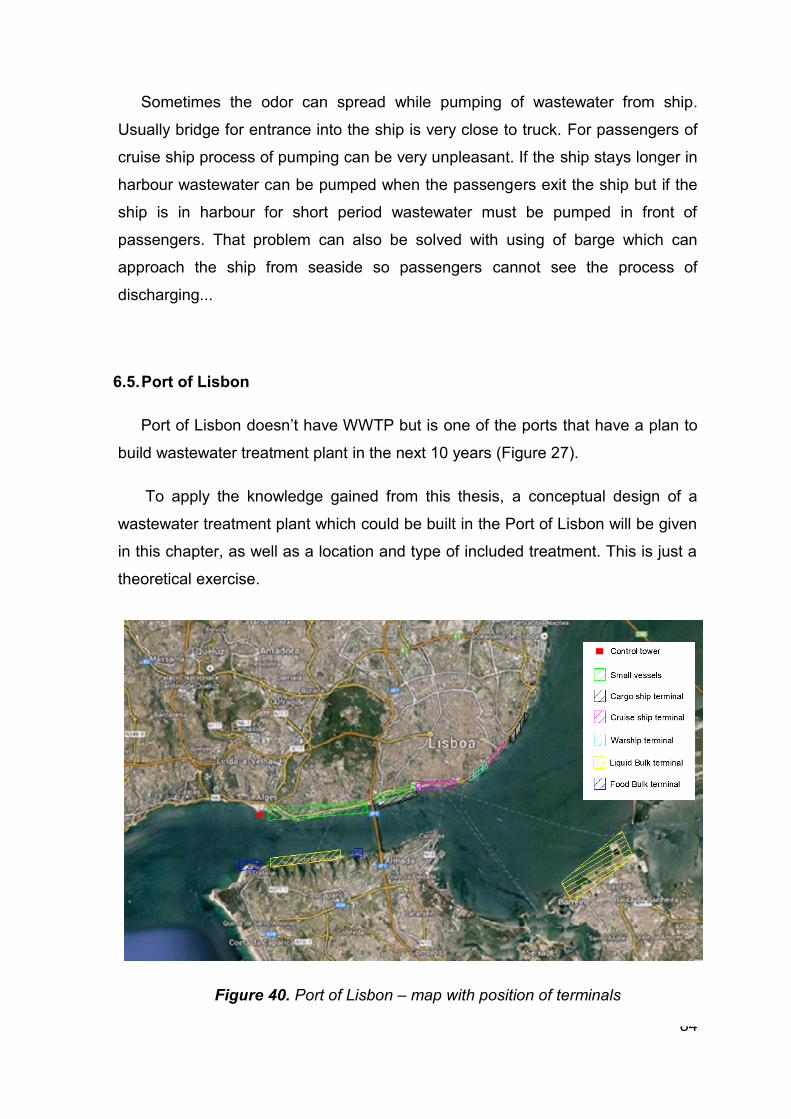
84
Sometimes the odor can spread while pumping of wastewater from ship.
Usually bridge for entrance into the ship is very close to truck. For passengers of
cruise ship process of pumping can be very unpleasant. If the ship stays longer in
harbour wastewater can be pumped when the passengers exit the ship but if the
ship is in harbour for short period wastewater must be pumped in front of
passengers. That problem can also be solved with using of barge which can
approach the ship from seaside so passengers cannot see the process of
discharging...
6.5. Port of Lisbon
Port of Lisbon doesn’t have WWTP but is one of the ports that have a plan to
build wastewater treatment plant in the next 10 years (Figure 27).
To apply the knowledge gained from this thesis, a conceptual design of a
wastewater treatment plant which could be built in the Port of Lisbon will be given
in this chapter, as well as a location and type of included treatment. This is just a
theoretical exercise.
Figure 40. Port of Lisbon – map with position of terminals
85
Figure 40 shows a map of Lisbon harbour. With different colours the positions
of different terminals are hatched (eg. Cruise ship terminal, food bulk terminal
etc.). Lisbon harbour is specific because the terminals are on two different sides
of the Tagus River which geographically separates the harbour in two different
parts.
Based on the distribution of terminals, there is a possibility to build two
wastewater treatment plants, one on each side of the river, or to build one big
wastewater treatment plant on one side of the river and the wastewater from the
other side can be delivered to it by barges. Whether to build two smaller
wastewater treatment plants or one big one depends on economic calculations
e.g. feasibility calculations. Since this is a purely theoretical exercise for the
designing of a wastewater treatment plant in Port of Lisbon, a solution for a
wastewater treatment plant on each side of Port of Lisbon will be given.
On the south side of the river, there are terminals for liquid bulk (fuel oil, diesel,
gasoline, mineral oils, ammonia, phosphoric acid, acrylonitrile, bitumen, LPG and
chemicals) and food bulk. In order to protect the environment and human health
from a possible environmental disaster a wastewater treatment plant designated
to treat wastewater from this side of river is very important. Since wastewater is
full of oil and grease, a very efficient physical treatment is needed. It is important
to use good flocculants (organic flocculants instead of inorganic – can be used in
wider range of pH value, better purification effect, lower waste moisture, does not
increase salt concentration in wastewater…) so the process of removing oil and
grease would be better. Also, there is a need for quality sedimentation to reduce
or eliminate the metal content from wastewater. Since this type of wastewater is
similar to those from petrochemical industry the wastewater treatment plants
number (1) can be the same like those used in the petrochemical industry (Figure
41) with one difference: the processes of removing the possible high percentage
of chlorides have to be included.
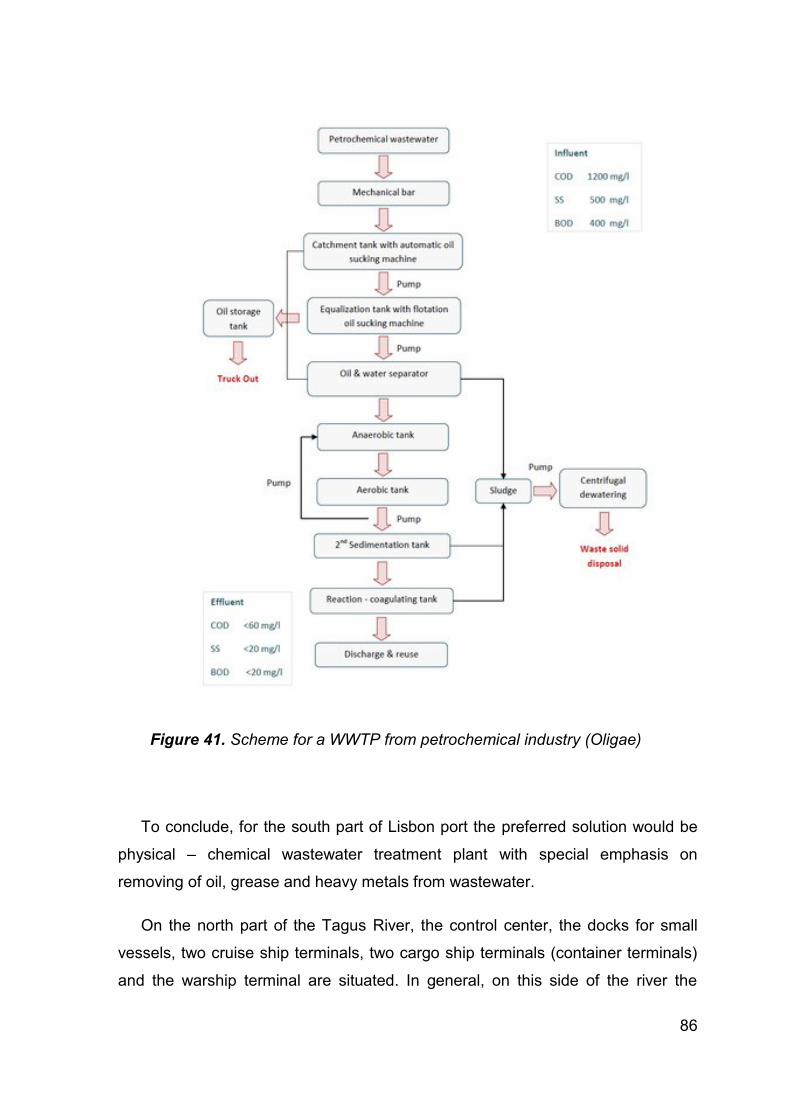
86
Figure 41. Scheme for a WWTP from petrochemical industry (Oligae)
To conclude, for the south part of Lisbon port the preferred solution would be
physical – chemical wastewater treatment plant with special emphasis on
removing of oil, grease and heavy metals from wastewater.
On the north part of the Tagus River, the control center, the docks for small
vessels, two cruise ship terminals, two cargo ship terminals (container terminals)
and the warship terminal are situated. In general, on this side of the river the
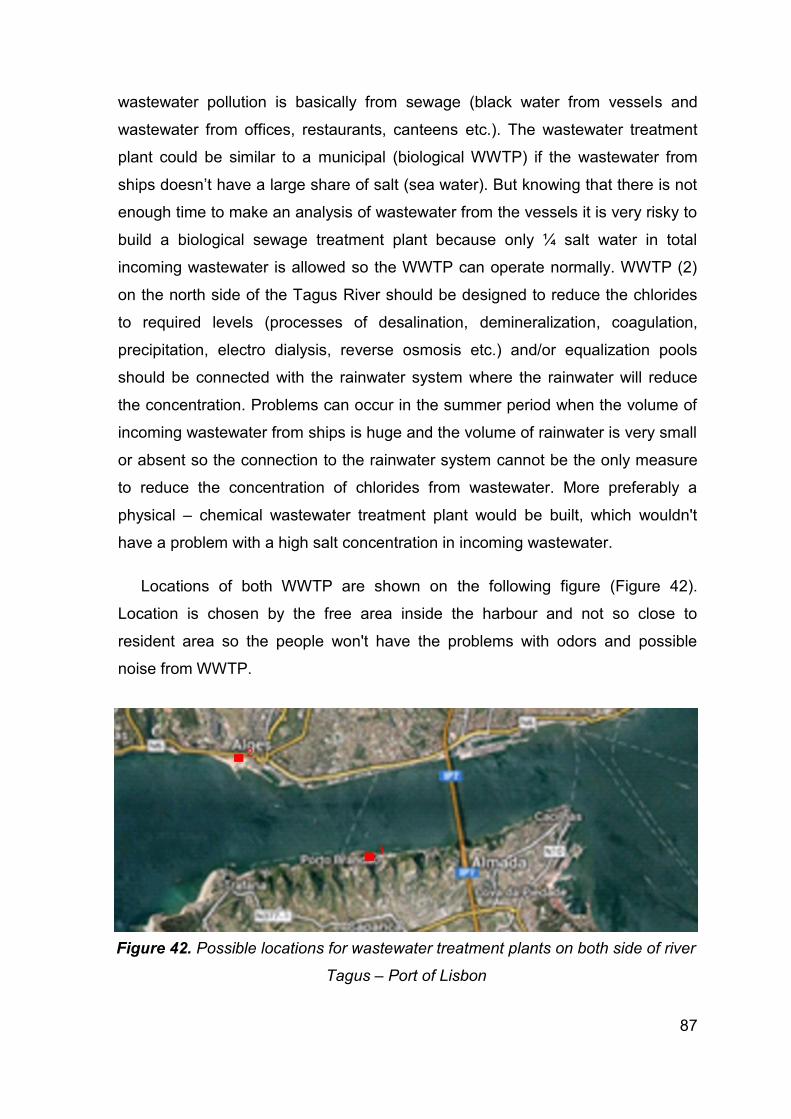
87
wastewater pollution is basically from sewage (black water from vessels and
wastewater from offices, restaurants, canteens etc.). The wastewater treatment
plant could be similar to a municipal (biological WWTP) if the wastewater from
ships doesn’t have a large share of salt (sea water). But knowing that there is not
enough time to make an analysis of wastewater from the vessels it is very risky to
build a biological sewage treatment plant because only ¼ salt water in total
incoming wastewater is allowed so the WWTP can operate normally. WWTP (2)
on the north side of the Tagus River should be designed to reduce the chlorides
to required levels (processes of desalination, demineralization, coagulation,
precipitation, electro dialysis, reverse osmosis etc.) and/or equalization pools
should be connected with the rainwater system where the rainwater will reduce
the concentration. Problems can occur in the summer period when the volume of
incoming wastewater from ships is huge and the volume of rainwater is very small
or absent so the connection to the rainwater system cannot be the only measure
to reduce the concentration of chlorides from wastewater. More preferably a
physical – chemical wastewater treatment plant would be built, which wouldn't
have a problem with a high salt concentration in incoming wastewater.
Locations of both WWTP are shown on the following figure (Figure 42).
Location is chosen by the free area inside the harbour and not so close to
resident area so the people won't have the problems with odors and possible
noise from WWTP.
Figure 42. Possible locations for wastewater treatment plants on both side of river
Tagus – Port of Lisbon
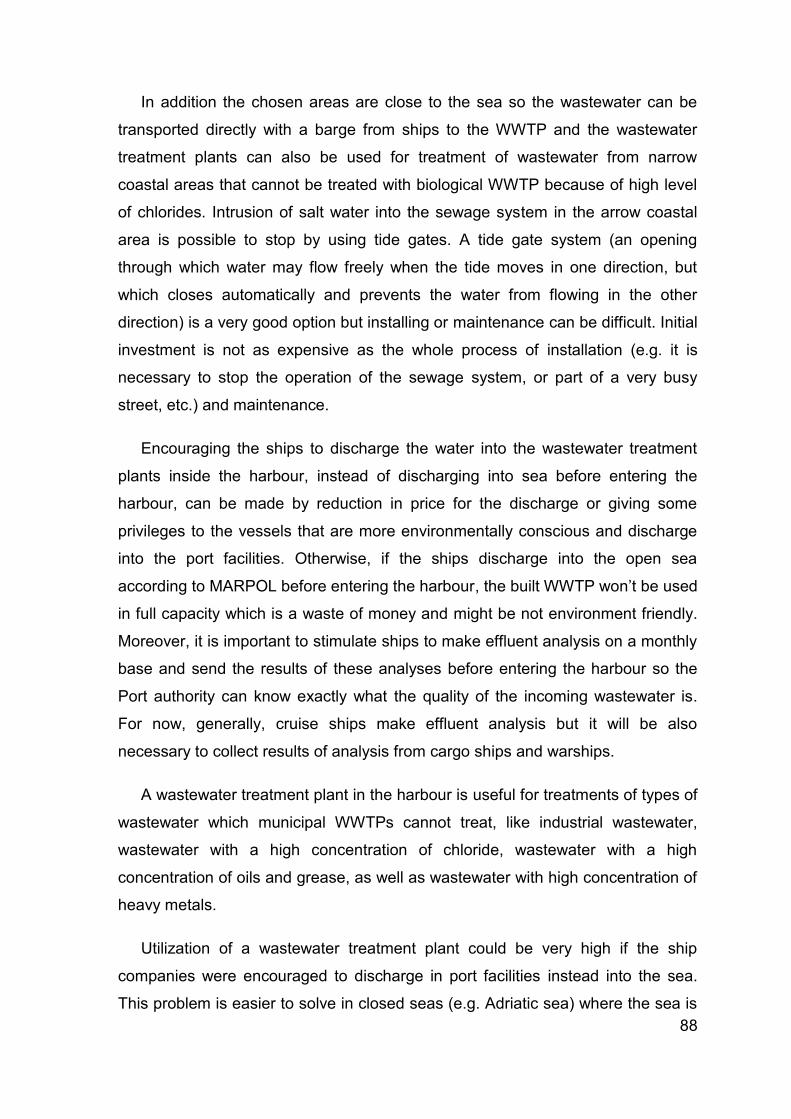
88
In addition the chosen areas are close to the sea so the wastewater can be
transported directly with a barge from ships to the WWTP and the wastewater
treatment plants can also be used for treatment of wastewater from narrow
coastal areas that cannot be treated with biological WWTP because of high level
of chlorides. Intrusion of salt water into the sewage system in the arrow coastal
area is possible to stop by using tide gates. A tide gate system (an opening
through which water may flow freely when the tide moves in one direction, but
which closes automatically and prevents the water from flowing in the other
direction) is a very good option but installing or maintenance can be difficult. Initial
investment is not as expensive as the whole process of installation (e.g. it is
necessary to stop the operation of the sewage system, or part of a very busy
street, etc.) and maintenance.
Encouraging the ships to discharge the water into the wastewater treatment
plants inside the harbour, instead of discharging into sea before entering the
harbour, can be made by reduction in price for the discharge or giving some
privileges to the vessels that are more environmentally conscious and discharge
into the port facilities. Otherwise, if the ships discharge into the open sea
according to MARPOL before entering the harbour, the built WWTP won’t be used
in full capacity which is a waste of money and might be not environment friendly.
Moreover, it is important to stimulate ships to make effluent analysis on a monthly
base and send the results of these analyses before entering the harbour so the
Port authority can know exactly what the quality of the incoming wastewater is.
For now, generally, cruise ships make effluent analysis but it will be also
necessary to collect results of analysis from cargo ships and warships.
A wastewater treatment plant in the harbour is useful for treatments of types of
wastewater which municipal WWTPs cannot treat, like industrial wastewater,
wastewater with a high concentration of chloride, wastewater with a high
concentration of oils and grease, as well as wastewater with high concentration of
heavy metals.
Utilization of a wastewater treatment plant could be very high if the ship
companies were encouraged to discharge in port facilities instead into the sea.
This problem is easier to solve in closed seas (e.g. Adriatic sea) where the sea is
89
full of islands and to achieve the conditions for fulfilling MARPOL is very
demanding because to reach 12 nautical miles from the closest land means to sail
up to 55 nautical miles (Figure 43).
*distances are symbolic, measured with google earth
Figure 43. Distance for complying MARPOL, left – Port of Rijeka, Croatia, right –
Port of Lisbon, Portugal
90
7. CONCLUSION
Treatment of wastewater from the harbours is a very complex question.
Wastewater that has to be treated has different characteristics and quantity. The
main categorization of wastewater from harbours is: the wastewater that is
produced on land in the harbour's facilities, and the wastewater that is produced
on the sea, inside the vessels.
On land, wastewater can be produced in the harbour facilities (e.g. offices,
restaurants, canteens…), in shipyards, in washing areas for vessels etc. On the
sea wastewater is usually black (sewage) or gray water from ships but there can
also be wastewater from washing the holding tanks or from washing transport
tank from different types of cargo.
Legal requirements for wastewater treatment onboard demand very high level
of treatment (MARPOL or stricter). Cruise ships have the most advanced
wastewater treatment plants onboard and on the other hand some warships don't
have a WWTP onboard at all. To improve environmental performance, cruise
lines are installing wastewater purification systems with advanced technologies
such as advanced wastewater treatment systems (AWT). These onboard
wastewater treatment systems are designed to result effluent discharges that are
of a high quality and purity: for example, meeting or surpassing standards for
secondary and tertiary effluents and reclaimed water. Warships and smaller
vessels (boats and yachts) that don’t have any treatment should follow their
example so as not to cause environmental problems. In alternative, they can
collect wastewater into holding tanks and discharge into port facilities (treat
effluents in land WWTP).
In general, harbours nowadays don’t have wastewater treatment plants
installed. They usually provide trucks or barges that transport wastewater from
vessels into wastewater treatment plants outside the harbour. WWTPs, to which
wastewater is transported, are usually industrial (because of wastewater quality)
and can be quite far away from harbours. This can lead to high prices of transport
and disposal.
91
Constructing a wastewater treatment plant inside the harbour might be a better
solution in order to prevent potential environmental problems that can occur
during the transportation of wastewater to the WWTP outside the harbour or
during the discharge of wastewater from vessels into the sea without treatment.
Types of treatment in WWTP inside harbours depends on the quality of
incoming wastewater, but because of possible high concentrations of chloride or
high concentrations of heavy metals in the wastewater, it is safer to design and
construct chemical treatment plants rather than biological (in order to avoid the
complete destruction of biomass (bacteria) by toxic compounds that is necessary
for wastewater treatment). WWTP designed in such a way that can accept
wastewater from narrow coastal areas of cities which cannot be treated in the
municipal biological WWTP because of higher concentration of chlorides, as well
as wastewater that can be toxic (wastewater from washing holding tanks with a
toxic cargo from cargo ships).
As an example, the case of the Port of Lisbon was studied, where different
types of ships were visited and information about wastewater treatment on-board
was collected. Problems that the port authority has to deal with during the process
of accepting wastewater from ships (pumping), transportation to the WWTP and
the whole process of organizing transport of wastewater was highlighted. In
addition, for the Port of Lisbon a possible solution was given – a conception
design of two smaller wastewater treatment plants – that can be constructed
inside the harbour, one on each side of the Tagus River. For the south part of the
Lisbon port the preferred choice would be a physical – chemical wastewater
treatment plant with special emphasis on removing oil, grease and heavy metals
from wastewater and on the northern part of the Tagus River the wastewater
treatment plant could be a physical – biological, which should be designed to
reduce the chlorides to required levels (processes of desalination,
demineralization, coagulation, precipitation, electro dialysis, reverse osmosis etc.)
or can be a physical – chemical WWTP just like the one on the south side of the
river.
To conclude, disposal of wastewater from harbours is a very complex process
which has to be done in a very short period without room for mistakes. It is very
92
hard to say that any WWTP type is better than the other. Each one has its own
advantages and disadvantages. The choice of which WWTP is to be construct
depend on the society, the discharge requirements, quality and quantity of
wastewater, environmental sensibility, and the most important, costs that port
authorities are ready to incur. Construction of wastewater treatment plants is
expensive and a very delicate project but can solve many problems that port
authorities have to deal with during the transportation of wastewater from
harbours to a possibly very distant WWTP and can prevent possible
environmental disasters. WWTP inside the harbour area is particularly needed in
harbours which are very distant from the open sea (e.g. figure 40. Port of Rijeka,
Croatia) or for harbours which have to spend a lot of money on transportation of
wastewater into industrial WWTP, which are very far from the harbour.
93
REFERENCES
ACSI (2000): Interim Report, Alaska Cruise Ship Initiative, Department of
Environmental Conservation. Juneau, Alaska. 13th September 2000
Apte Sagar, S., Apte Shruti, S., Kore, V.S., Kore S.V. (2011): Chloride removal
from wastewater by biosorption with the plant biomass, Universal Journal of
Enviromental Research and Tehnology
Bernotas, Scott (1992): Water quality management of bilge wastes at Pearl
Harbour, Hawaii, Honolulu, Hawaii: University of Hawaii, USA
Bianchi, C.N, Morri, C. (2000): Marine Biodiversity of the Mediterranean Sea:
Situation, Problems and Prospects for Future Research, Marine Pollution Bulletin
40, 367 – 376
BREA (2012): The Contribution of the North American Cruise Industry to the
U.S. Economy in 2011. , prepared for Cruise lines international association
Butt, N. (2007): The impact of cruise ship generated waste on home ports and
ports of call: A study of Southampton, Journal Marine Policy no. 31. , Elsevier Ltd.,
United Kingdom
Bupić, M., Milić, L. (1998): Brodski uređaj za obradu fekalnih voda s osvrtom na
postupke ozračivanja i bistrenja, Naše more 45 (3-4, 5-6), Dubrovnik, Croatia
Carvalho, F.P., Oliviera, J.M., Silva, L., Malta, M. (2013): Radioactivity of
anthropogenic origin in the Tejo Estuary and nee for improved waste management
and enviromental monitoring, International Journal of Enviromental Studies no. 6,
Taylor&Francis 2013
Celenza, G.J. (2000): Biological processes, Volume II, Technomic Publication,
USA
Chang, N., Yeh, S., Chang, C. (2009): Optimal expansion of a cosatal
watewater treatment and ocean outfall system uncertainty (II): optimisation
analysis, Civil engineering and Enviromental Systems no. 28, Informa Ltd., UK
94
Chen, W. (2013): Wastewater treatment in the marine industry, Wartsila tehnical
Journal, 02.2013.
Commission of the European Communities (2009): 5th Commission Summary
on the Implementation of the Urban Waste Water Treatment Directive. Brussels:
Commission of the European Communities
Cukrov, N., Frančišković – Bilinski, S., Hlača, B., Barišić, D. (2011): A recent
history of metal accumulation in the sediments of Rijeka harbor, Adriatic sea,
Croatia, Marine Pollution Bulletin 62 154 – 167
David, M., Gollasch, S., Cabrini, M., Perkovič, M., Bošnjak, D., Virhilio, D.
(2007): Results from the first ballast water sampling study in the Mediterranean
Sea – thePort of Koper study, Marine Pollution Bulletin, Vol. 54, Issue 1, January
2007, 53 – 65
Diez, S., Jover, E., Albaiges, J., Bayona, J.M. (2006): Occurrence and
degradation of butyltins and wastewater marker compunds in sediments from
Barcelona harbor, Spain, Enviromental Internnational 32 (2006) 858 – 865
Droste, R. (1997): Theory and practice of water and wastewater treatment. John
Willey and Sons, Inc.
Elibeck, W.J., Mattock, G. (1987): Chemical processes in waste water
treatment, Ellis Horwod books in water and wastewater technology
Enviromental Protection Agency (2001): Revision to Clean Water Act Ocean
Discharge Criteria Regulations, Office of water 4504-F, EPA-842-F-01-001
Fabiani, M., Marrale, D., Misic, C. (2003): Bacteria and organic matter dynamics
during a bioremediation treatment of organic – rich harbour sediments, Journal
Marine pollution Bulletin no. 46, Great Britain
Group of authors, Edited by Henze, M., Loosdrecht, Van M., Ekama, G.,
Brđanović, D. (2008): Biological wastewater treatment: Principles, Modelling and
Design, IWA publishing, Cambridge University press, United Kingdom
95
Hero, N. (2012.): Zbrinjavanje mulja i drugih nusprodukata pročišćavanja
otpadnih voda, bachelor thesis, University of Rijeka, Faculty of Civil Engineering
Rijeka, Croatia
Hrvatske vode (2012): Uređaj za pročišćavanje otpadnih voda u Trstenom,
Enviromental management plan, made by. Oikon d.o.o. and Faculty of Civil
engineering, University of Zagreb
Ingvertsen S.T., Marcussen, H., Holm, P.E. (2013): Pollution and potential
mobility of Cd, Ni and Pb in the sediments of wastewater – receiving river in Hanoi,
Vietnam, Environ Monit Assess no. 185, Springsten Science + Business Media
Dordrecht 2013
International council of cruise lines (ICCL) (1999): Cruise Industry waste
Management Practices and Procedures, Arlington, VA
Koboević, Ž., Kurtela, Ž. (2011): Comparison of marine sewage tretment
system, Dubrovnik, Croatia
Mamilović, D.: Tretman otpadnih voda s prališta marina fizikalno – kemijskim
postupkom, PPT Presentation, Eko Projekt d.o.o., Rijeka, Croatia
Manual of Naval Preventive Medicine (1995): Wastewater treatment and
disposal ashore and afloat, Chapter 7, Bureau of Medicine and Surgery,
Washington
MARPOL – Marine pollution (1973., 1978.): International Convention for the
Prevention of Pollution From Ships, 1973. As modified by the Protocol of 1978.
http://en.wikipedia.org/?title=MARPOL_73/78
MARPOL – Marine pollution (1973., 1978.): International Convention for the
Prevention of Pollution from Ships, 1973, Annex IV, Regulations for the Prevention
of Pollution by Sewage from Ships
Mediterranean region rewiev N°070201/2006/436133/MAR/E3, Support to DG
Enviroment for Development of Mediterranean De – pollution Initiative „HORIZON
2020“
96
Metcalf&Eddy (2004): Wastewater Engineering Treatment and Reuse,
International edition, Fourth edition, The McGraw – Hill Companies
Misic, C., Covazzi Harriaque, A. (2009): Organic matter characterisation and
turnover in the sediment and seawater of a tourist harbour, Journal Marine
Enviromental Research no. 68., Elsevier Ltd., UK
Mikulić, N., Orešćanin, V., Legović, T., Žugaj, R. (2004): Estimation of heavy
metals (Cu, Zn, Pb) input into Punat Bay, Enviromental Ecology, 46 : 62-70
Mittal, A. (2011): Biological wastewater treatment, Fulltide, Water today, August
2011, 32 – 44
National Research Council (NRC) (1985): Oil in the Sea: Inputs, Fates and
Effects, National Academy Press, Washington DC
Neves, R., Marecos do Monte, H., Santos, C., Quintino, V., Matos, J., Zehna, H.
(2002): Integrated wastewater treatment management in cosatal areas:
Wastewater treatment, Enviromental monitoring and Performance Optimisation of
Costa do Estoril System, 2nd International Conference on Marine Wastewater
discharges, Istanbul
Oceana. org, Protecting the World's Oceans (2005): Contamination by cruise
ships, International organization focused solely on ocean concervation
Opertaion and control, Water/Wastewater distance learning website of the
Mountain Empire Community College in Virginia
http://water.me.vccs.edu/courses/ENV149/operationb.htm#svi
Orešćanin, V., Nađ, K., Kukec, L., Gajski, A., Sudac, D., Valković, V. (2003):
Trace element analysis of water and sediment before/after passing a waste water
treatment plan,Journal Trace Microprobe Techniques 21 (2) : 325 – 334
Perić, T., Kulenović, Z., Dobrota, Đ.: Automated Wastewater Treatment Plant
on Cruises, University of Split, Faculty of Maritime Studies, PPT presentation
97
Renzi, M., Tozzi, A., Baroni, D., Focardi, S., (2011): Factors affecting the
distribution of trace elements in harbour sediments, Chemistry and Ecology no.
27., Informa Ltd.
Sanem Sunlu, F., Sunlu, Ug., Buyukisik, B., Kukrer, S., Aksu, M. (2011): Effects
of Wastewater Treatment Plant on water column and sediment quality in Izmir bay
(Eastearn Aegean Sea), Waste water – Evaluation and Management
Samokovlija Dragičević, J. (2005): Pročišćavanje otpandih voda i kanalizacijski
sustav grada Visa, Zaštita okoliša, Časopis Građevinar br. 57, 2005. Zagreb
Schultz, T.E. (2005): Biological wastewater treatment, Chemical enginieering,
Biotreating process wastewater: Airing the options, October 2005, Access
intelligence, 44 – 49
Activated sludge videos http://www.riparia.org.rs/aqua/activated-sludge.htm
The ocean concervancy by Michael Herz (2002): Cruise control, A report on
how cruise ships affect the Marine Enviroment
United states enviromental protection agency (2008): Cruise ship discharge
assessment report, Oceans and coastal protection division office of Wetlands,
Oceans and Watersheds, Washington D.C.
Wang, J. : Tehnologies that transform pollutants into innocuous components:
Combined biological/chemical methods, Point sources of pollution local effects and
it's control, Vol. II , Department of enviromental science and engineering, Tsinghua
university, Beijinh, P.R. China
Williamson, R.B., Van Dam, L.F., Bell, R.G., Green, M.O., Kim, J,P. (1996):
Heavy metal and suspended sediment fluxes from a contaminated intertidal inlet
(Manukau Harbour, New Zealand), Journal Marine pollution Bulletin no. 16.,
Elsevier Science Ltd.
Wing – yee Tang, C., Ching – man Ip, C., Zhang, G., Shin, P., Qian, P., Li, X.
(2008): The spatial and temporal distribution of heavy metals in sediments of

98
Victoria Harbour, Hong Kong, Journal Marine Pollution Bulletin no. 57, Great
Britain
Xu, W, Zhang, G., Li, X., Zou, S., Li, P., Hu, Z., Li, J. (2007): Occurrence and
elimination of antibiotics at four sewage treatment olants in the Pearl River Delta
(PRD), South China, Water research, a Journal of the International Water
Association

A
APPENDICES
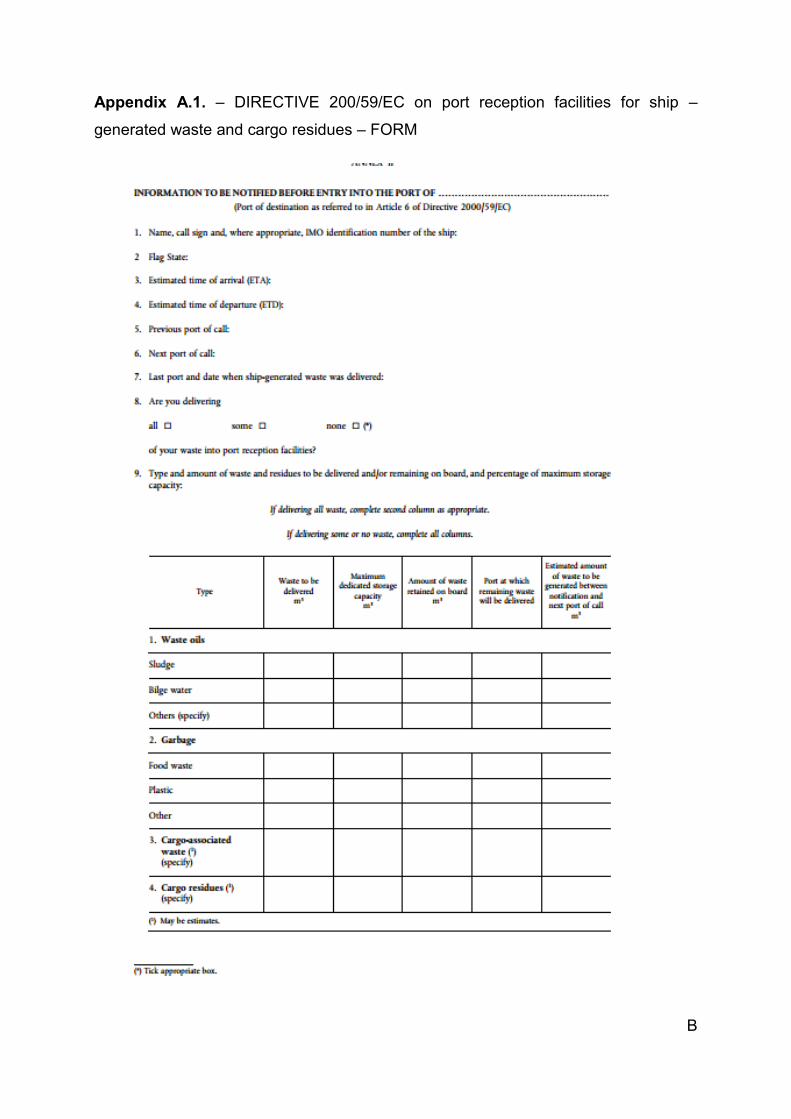
B
Appendix A.1. – DIRECTIVE 200/59/EC on port reception facilities for ship –
generated waste and cargo residues – FORM
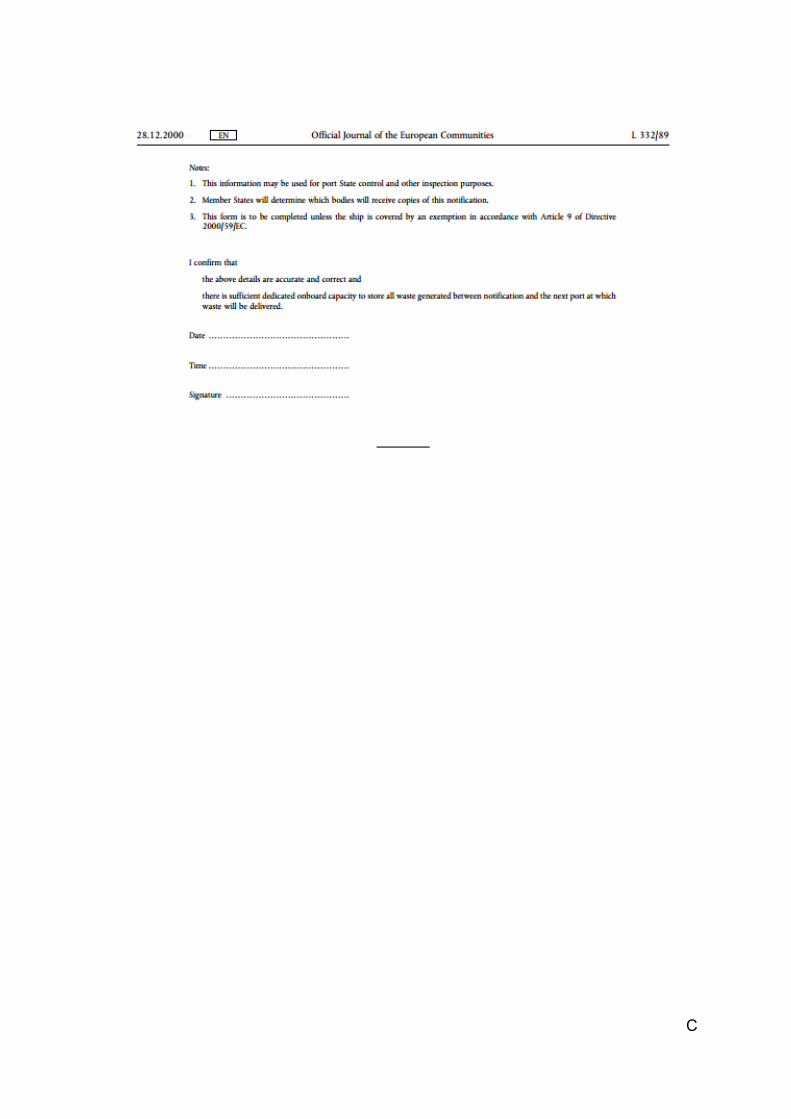
C
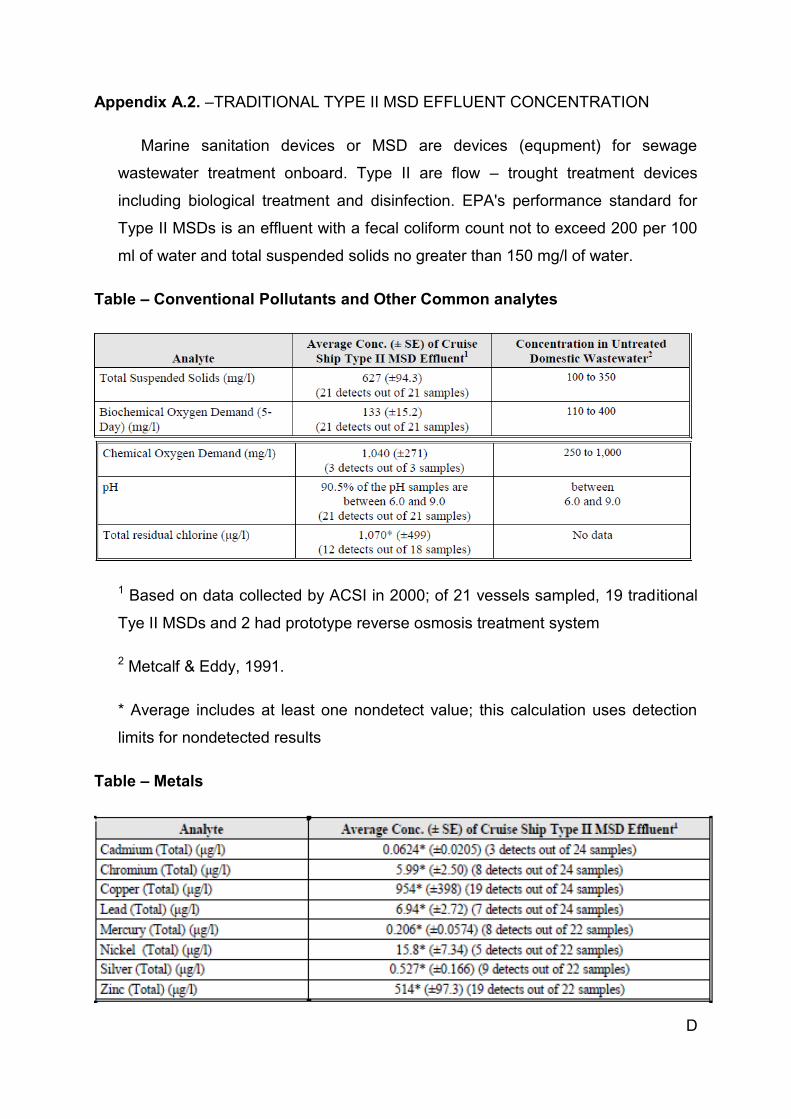
D
Appendix A.2. –TRADITIONAL TYPE II MSD EFFLUENT CONCENTRATION
Marine sanitation devices or MSD are devices (equpment) for sewage
wastewater treatment onboard. Type II are flow – trought treatment devices
including biological treatment and disinfection. EPA's performance standard for
Type II MSDs is an effluent with a fecal coliform count not to exceed 200 per 100
ml of water and total suspended solids no greater than 150 mg/l of water.
Table – Conventional Pollutants and Other Common analytes
1 Based on data collected by ACSI in 2000; of 21 vessels sampled, 19 traditional
Tye II MSDs and 2 had prototype reverse osmosis treatment system
2 Metcalf & Eddy, 1991.
* Average includes at least one nondetect value; this calculation uses detection
limits for nondetected results
Table – Metals
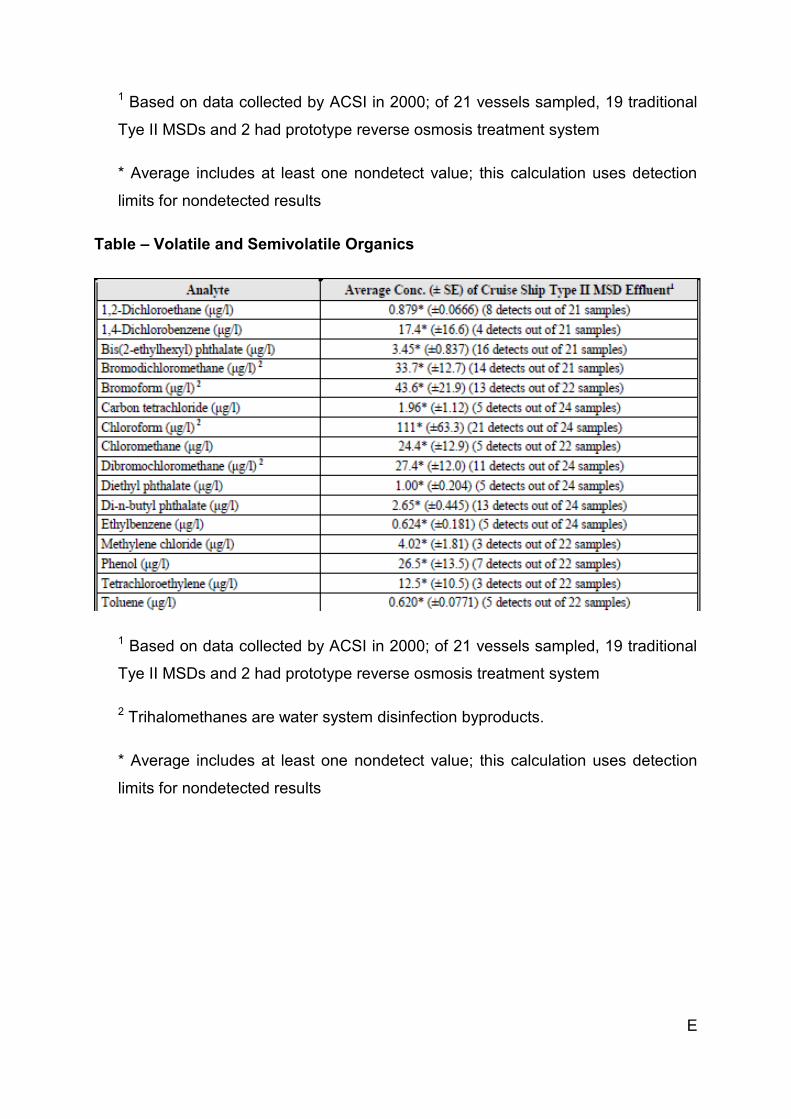
E
1 Based on data collected by ACSI in 2000; of 21 vessels sampled, 19 traditional
Tye II MSDs and 2 had prototype reverse osmosis treatment system
* Average includes at least one nondetect value; this calculation uses detection
limits for nondetected results
Table – Volatile and Semivolatile Organics
1 Based on data collected by ACSI in 2000; of 21 vessels sampled, 19 traditional
Tye II MSDs and 2 had prototype reverse osmosis treatment system
2 Trihalomethanes are water system disinfection byproducts.
* Average includes at least one nondetect value; this calculation uses detection
limits for nondetected results
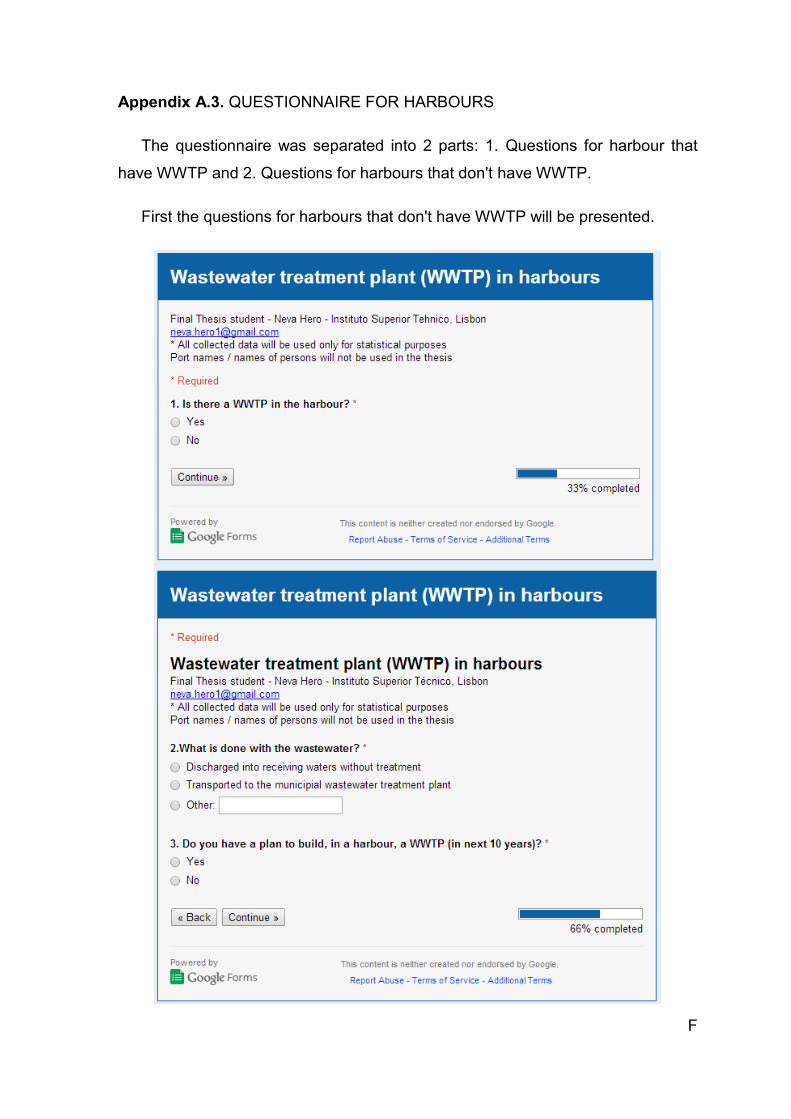
F
Appendix A.3. QUESTIONNAIRE FOR HARBOURS
The questionnaire was separated into 2 parts: 1. Questions for harbour that
have WWTP and 2. Questions for harbours that don't have WWTP.
First the questions for harbours that don't have WWTP will be presented.
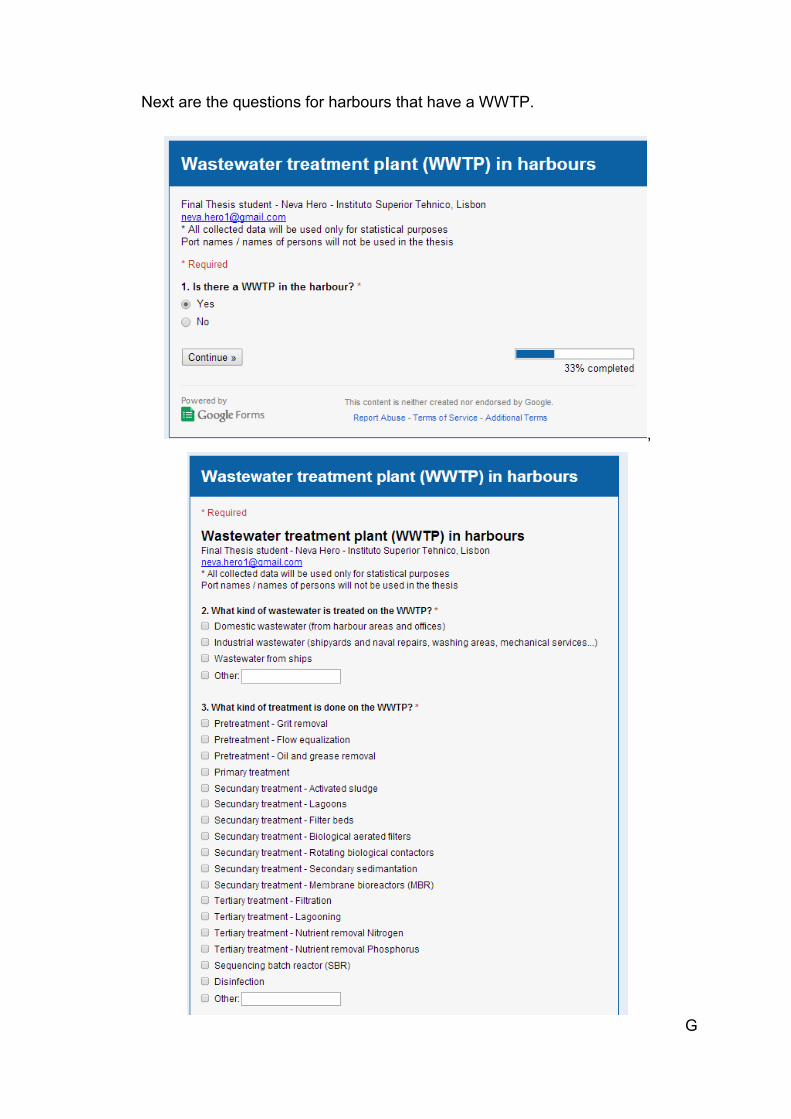
G
Next are the questions for harbours that have a WWTP.
,
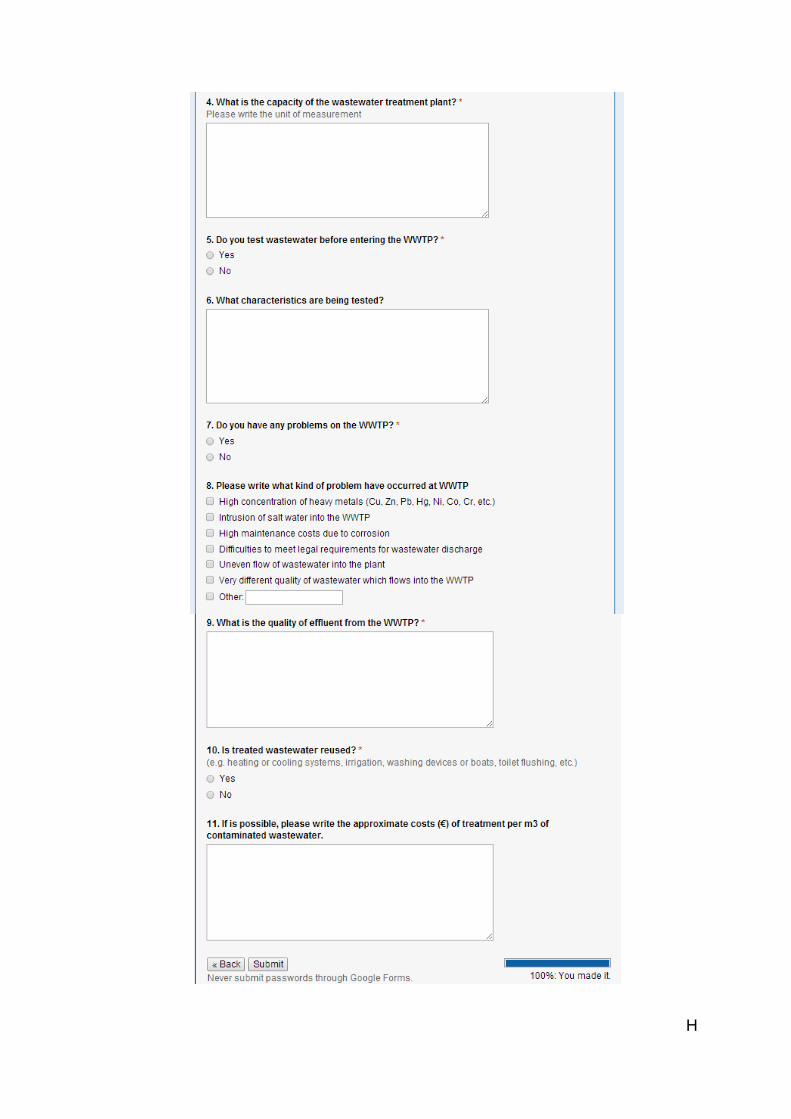
H
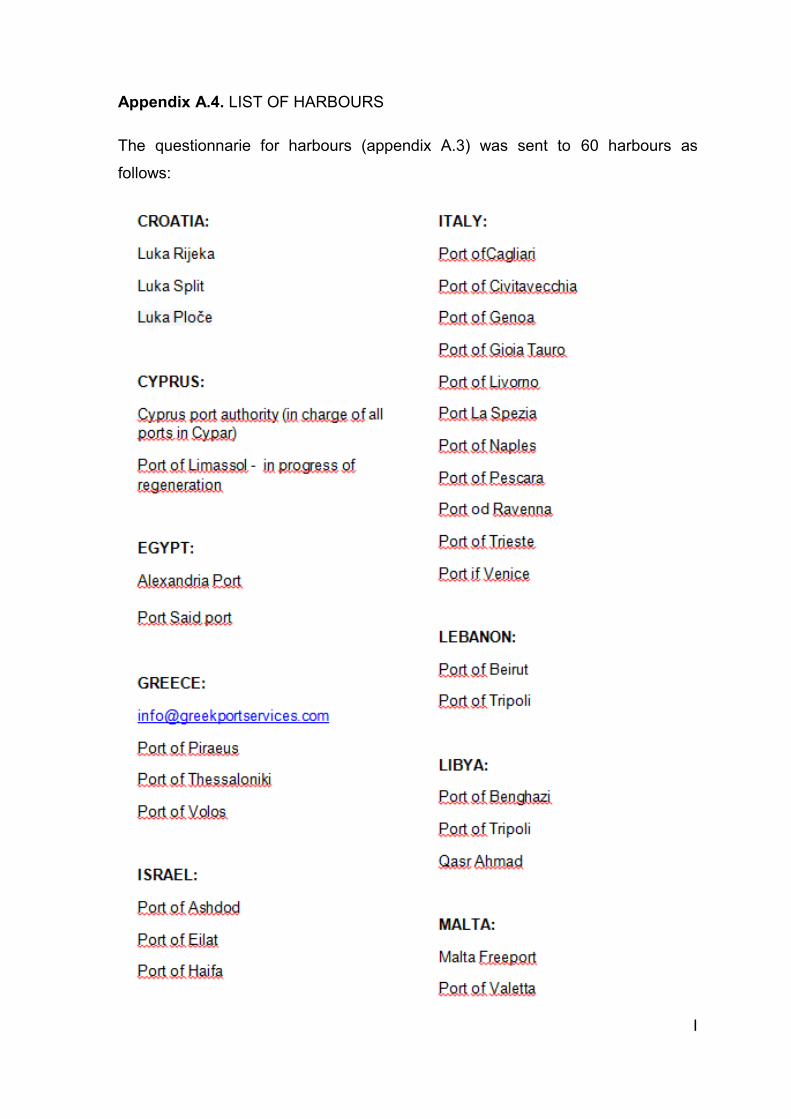
I
Appendix A.4. LIST OF HARBOURS
The questionnarie for harbours (appendix A.3) was sent to 60 harbours as
follows:

J
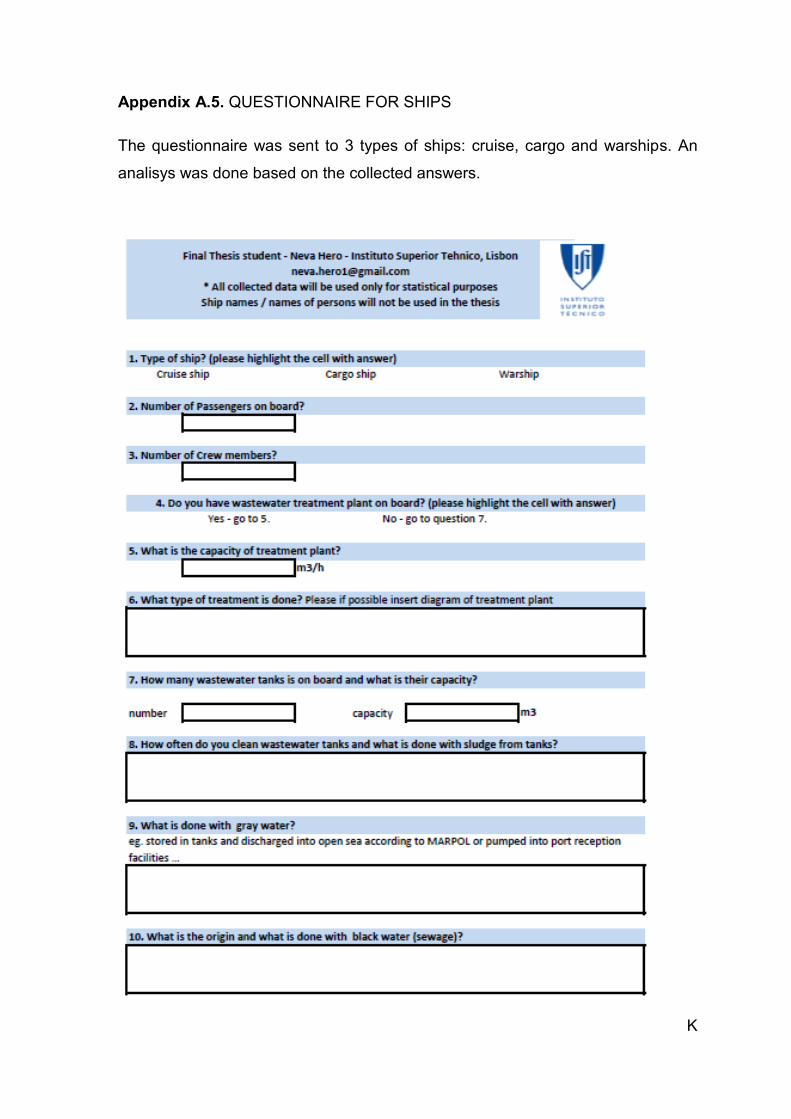
K
Appendix A.5. QUESTIONNAIRE FOR SHIPS
The questionnaire was sent to 3 types of ships: cruise, cargo and warships. An
analisys was done based on the collected answers.
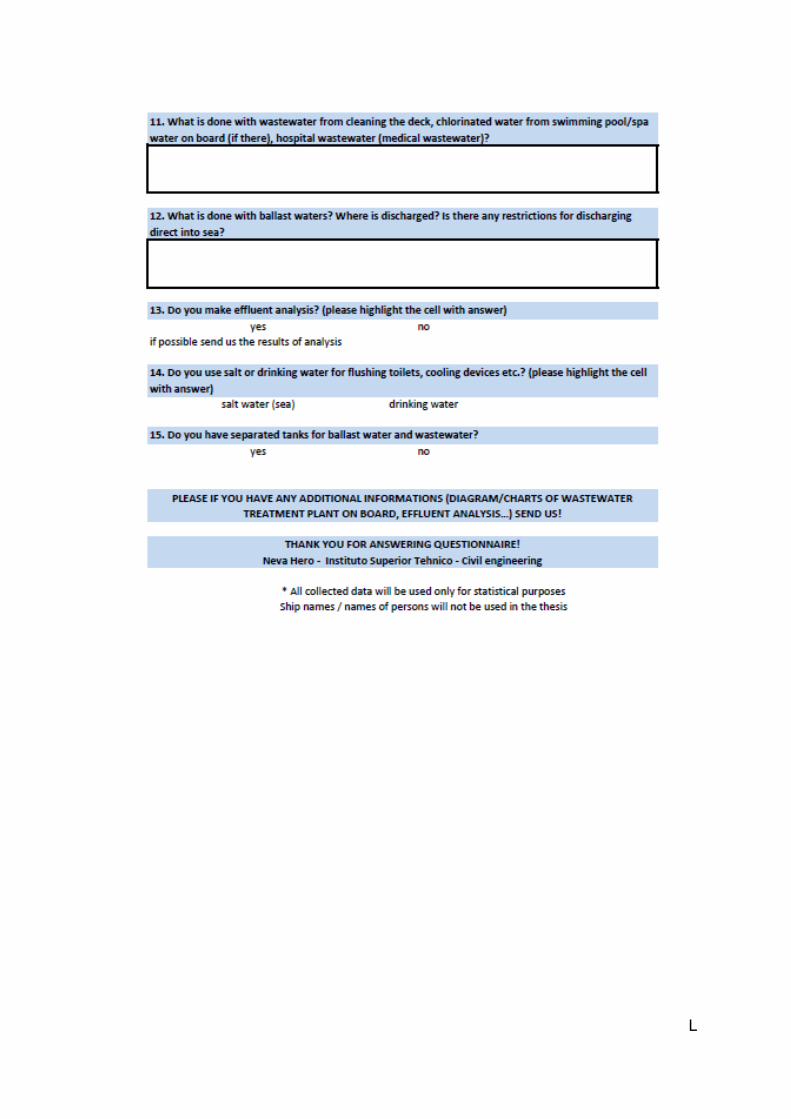
L