Embed Size (px)
Citation preview
Water Quality Monitoring
Sampling and Instruments
CARIWIN Advanced Course in IWRMSeptember 19, 2007
CIMH Barbados
Apurva Gollamudi
Brace Centre for Water Resources Management
McGill University
Discussion
What are the steps needed to
setup a hydrologic and water
quality monitoring program in your
country?
Defining Monitoring
• Monitoring is defined by the International Organization for Standardization
(ISO) as: “the programmed process of sampling, measurement and
subsequent recording or signalling, or both, of various water characteristics,
often with the aim of assessing conformity to specified objectives”.
• This general definition can be differentiated into three types of monitoring
activities that distinguish between long-term, short-term and continuous
monitoring programmes as follows:
• Monitoring is the long-term, standardised measurement and observation of
the aquatic environment in order to define status and trends.
• Surveys are finite duration, intensive programmes to measure and observe
the quality of the aquatic environment for a specific purpose.
• Surveillance is continuous, specific measurement and observation for the
purpose of water quality management and operational activities.
Why Monitor Water Quality?
5 Reasons:
1. Characterize waters and identify changes or trends in water quality over time
2. Identify specific existing or emerging water quality problems
3. Gather information to design specific pollution prevention or remediation programs
4. Determine whether program goals -- such as compliance with pollution regulations or implementation of effective pollution control actions -- are being met
5. Respond to emergencies, such as spills and floods
The Aquatic Environment
• The quality of the aquatic environment is a broader issue which can be described in terms of– water quality,
– the composition and state of the biological life present in the water body,
– the nature of the particulate matter present, and
– the physical description of the water body (hydrology, dimensions, nature of lake bottom or river bed, etc.).
Characteristics• Based on 3 criteria: Physical, Chemical and Biological Characteristics
Physical Characteristics
• Includes turbidity, colour, taste, odour and temperature measurements
– Turbidity: The clearness of the water, as affected by suspended solids
• Measured in nephelometric turbidity units (NTU). Nephelometric means that the measurement has been arrived at through the estimation of light absorption.
• The more turbid a water, the less light there is available for photosynthesis
– Colour: The presence of colour in water
• Ideal colour is colourless for drinking water
• Affected by suspended solids, usually organic constituents
– Taste: The presence of a taste in water
• Drinking water quality measurement
• Is affected by the presence of dissolved inorganic substances (i.e. Mg, Ca, Na, Cu, Fe and Zn)
– Odour: The presence of odour in water
• Often Affected by the presence of organic constituents
– Temperature: The temp. of surface waters at their respected depths
• Effects the level of dissolved oxygen and metabolic rate of aquatic fauna
• Most fish species require a temp. range of 5-20°C and a DO concentration of 5 g m-3
CharacteristicsChemical Characteristics
• Includes all organic and inorganic dissolved and particulate constituents. Dissolved constituents may exist as ions or dissolved gasses. The presence of these compounds in turn effects the pH, salinity and hardness of water.
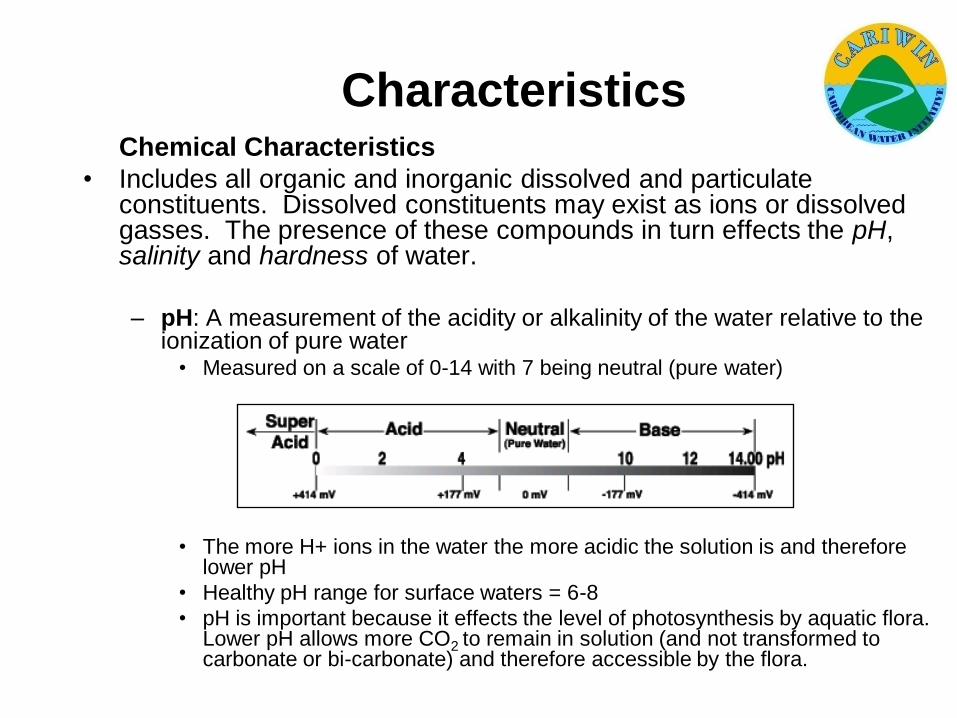
– pH: A measurement of the acidity or alkalinity of the water relative to the ionization of pure water
• Measured on a scale of 0-14 with 7 being neutral (pure water)
• The more H+ ions in the water the more acidic the solution is and therefore lower pH
• Healthy pH range for surface waters = 6-8
• pH is important because it effects the level of photosynthesis by aquatic flora. Lower pH allows more CO2 to remain in solution (and not transformed to carbonate or bi-carbonate) and therefore accessible by the flora.
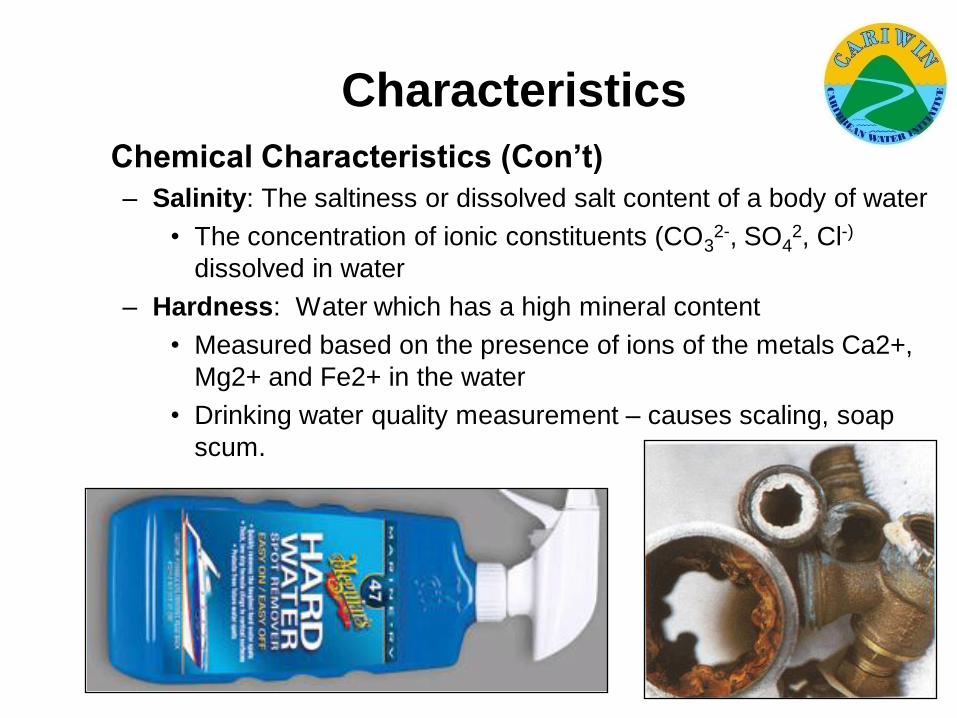
Chemical Characteristics (Con’t)
– Salinity: The saltiness or dissolved salt content of a body of water
• The concentration of ionic constituents (CO32-, SO4
2, Cl-)
dissolved in water
– Hardness: Water which has a high mineral content
• Measured based on the presence of ions of the metals Ca2+,
Mg2+ and Fe2+ in the water
• Drinking water quality measurement – causes scaling, soap
scum.
Characteristics
CharacteristicsBiological Characteristics
• The abundance and distribution of aquatic life (microscopic viruses, bacteria and protozoans; as well as phytoplankton, zooplankton, insects, worms, large plants and fish can be used as indicators to determine the health of a water body.
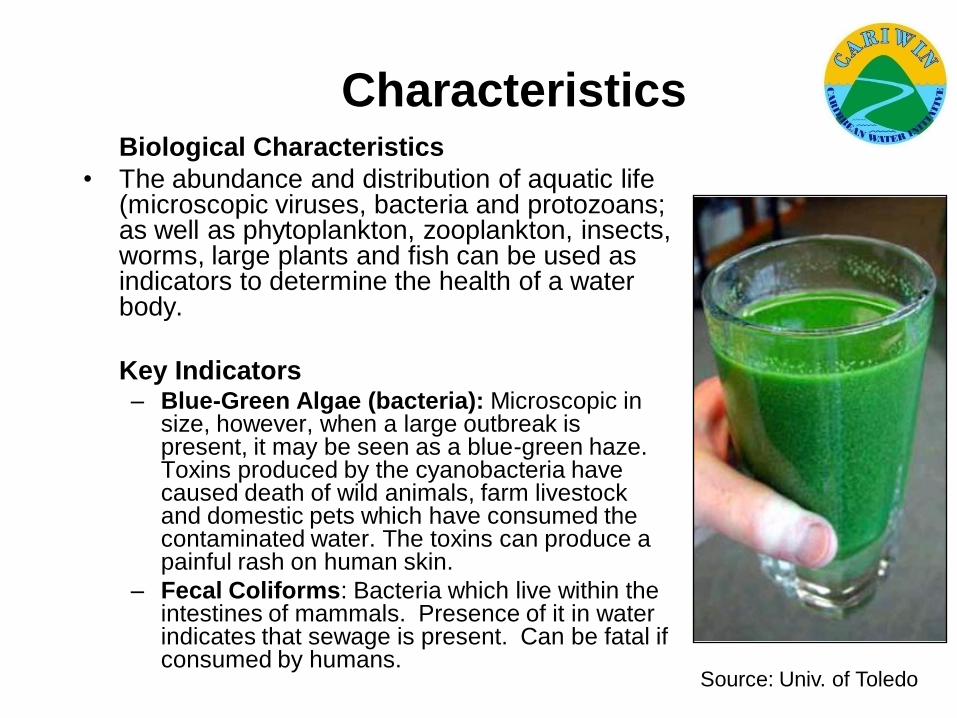
Key Indicators– Blue-Green Algae (bacteria): Microscopic in
size, however, when a large outbreak is present, it may be seen as a blue-green haze. Toxins produced by the cyanobacteria have caused death of wild animals, farm livestock and domestic pets which have consumed the contaminated water. The toxins can produce a painful rash on human skin.
– Fecal Coliforms: Bacteria which live within the intestines of mammals. Presence of it in water indicates that sewage is present. Can be fatal if consumed by humans.
Source: Univ. of Toledo
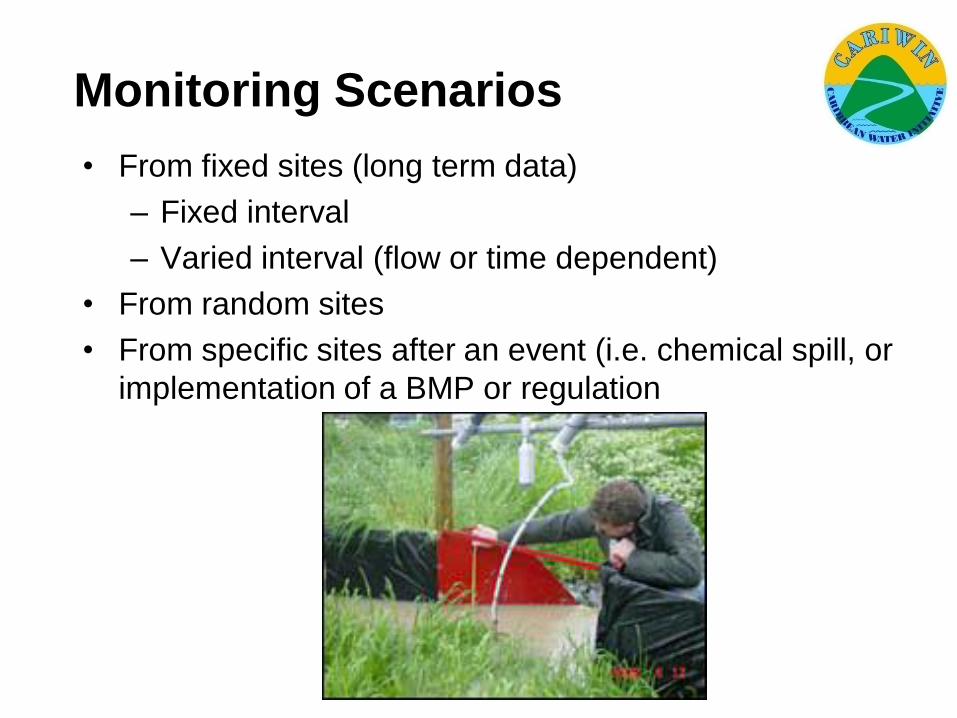
Monitoring Scenarios
• From fixed sites (long term data)
– Fixed interval
– Varied interval (flow or time dependent)
• From random sites
• From specific sites after an event (i.e. chemical spill, or
implementation of a BMP or regulation
Water quality: concentrations vs. loads
• Concentration: standards? thresholds?
• Loads: how much is lost in the end? TMDL?
• Generally both important and monitored
• Loads = concentration X flow
What type of monitoring?
• At intervals (fixed or random)
• Continuous (small intervals)
Concentration data
• Parameters often monitored:
– pH
– Conductivity
– Dissolved oxygen
– Nitrates
– Phosphorus
– Bacteria
– ….
Concentration data
• Traditionally, measurement of concentrations
involves taking water samples
• Sampling:
– Composite
– Discrete
• Grab
• Fixed interval (time, volume)
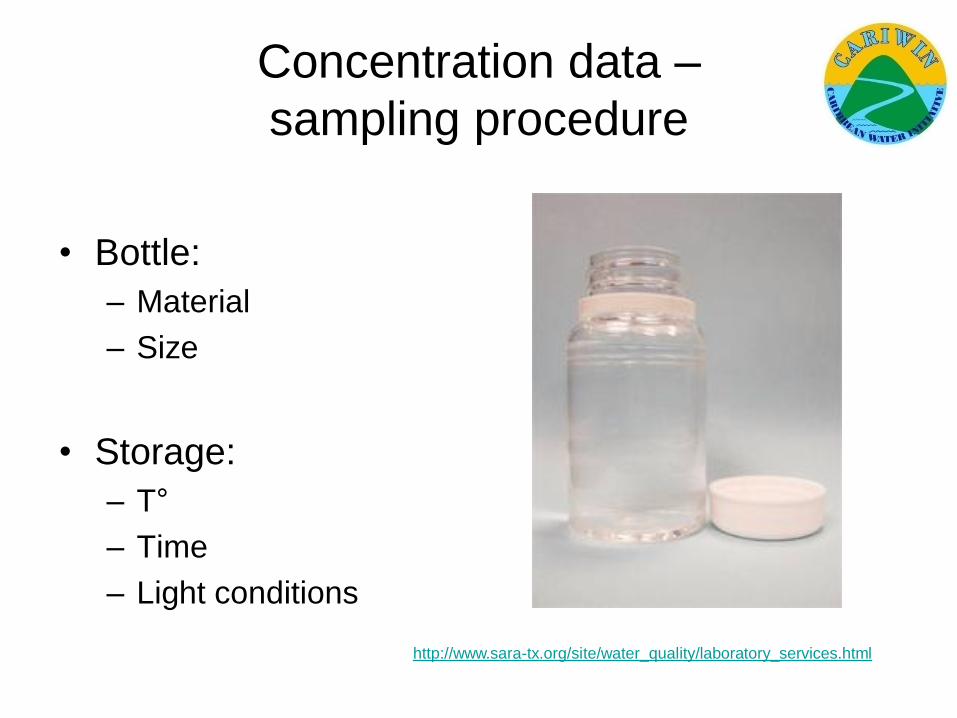
Concentration data –
sampling procedure
• Bottle:
– Material
– Size
• Storage:
– T°
– Time
– Light conditions
http://www.sara-tx.org/site/water_quality/laboratory_services.html
Concentration data –
analysis
• Laboratory vs. on site:
– Parameter
– Instrumentation
– Number of samples
… Time and cost
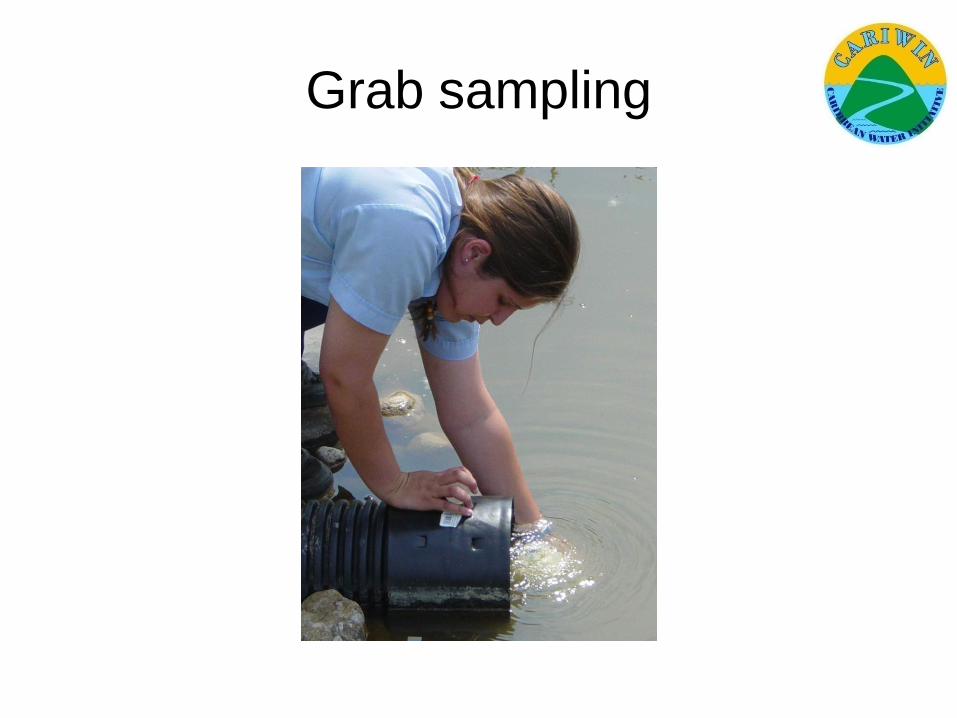
Grab sampling
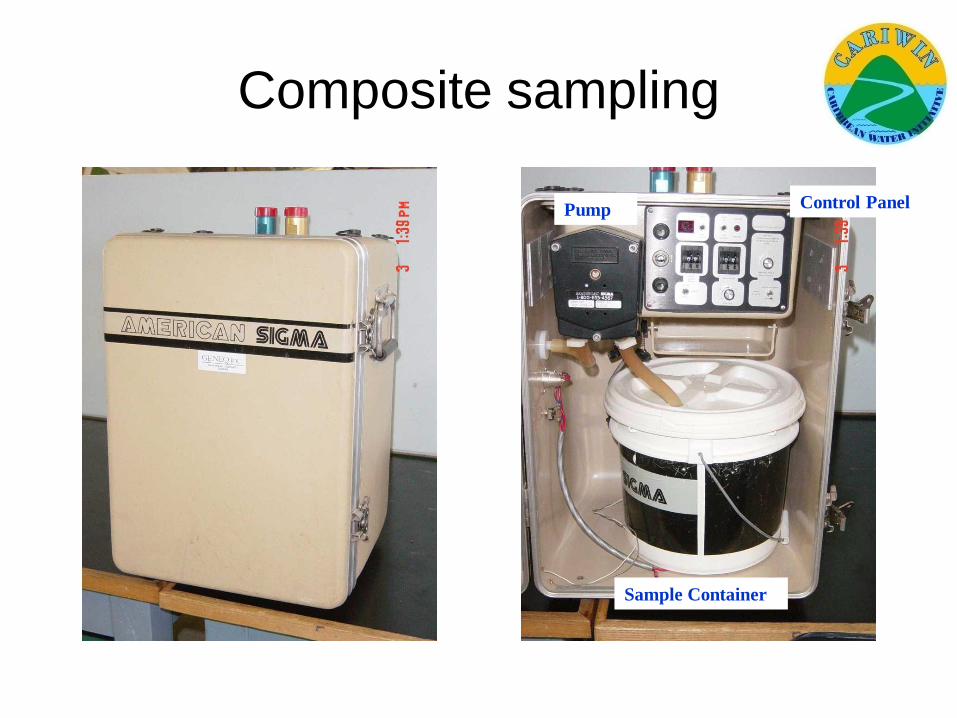
Composite sampling
Control PanelPump
Sample Container
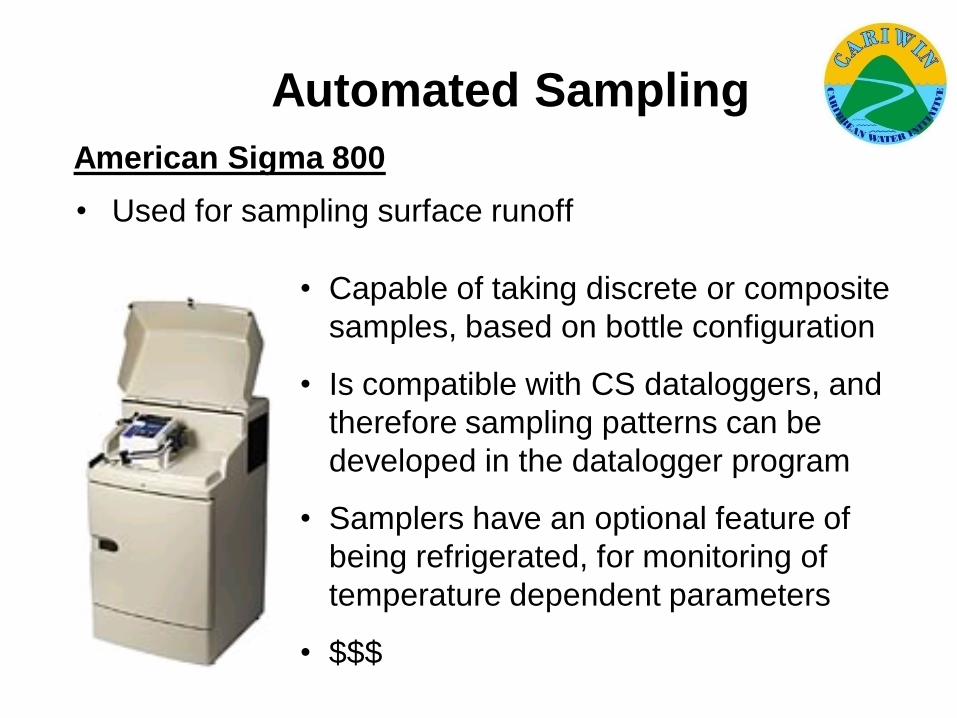
Automated Sampling
• Used for sampling surface runoff
American Sigma 800
• Capable of taking discrete or composite
samples, based on bottle configuration
• Is compatible with CS dataloggers, and
therefore sampling patterns can be
developed in the datalogger program
• Samplers have an optional feature of
being refrigerated, for monitoring of
temperature dependent parameters
• $$$
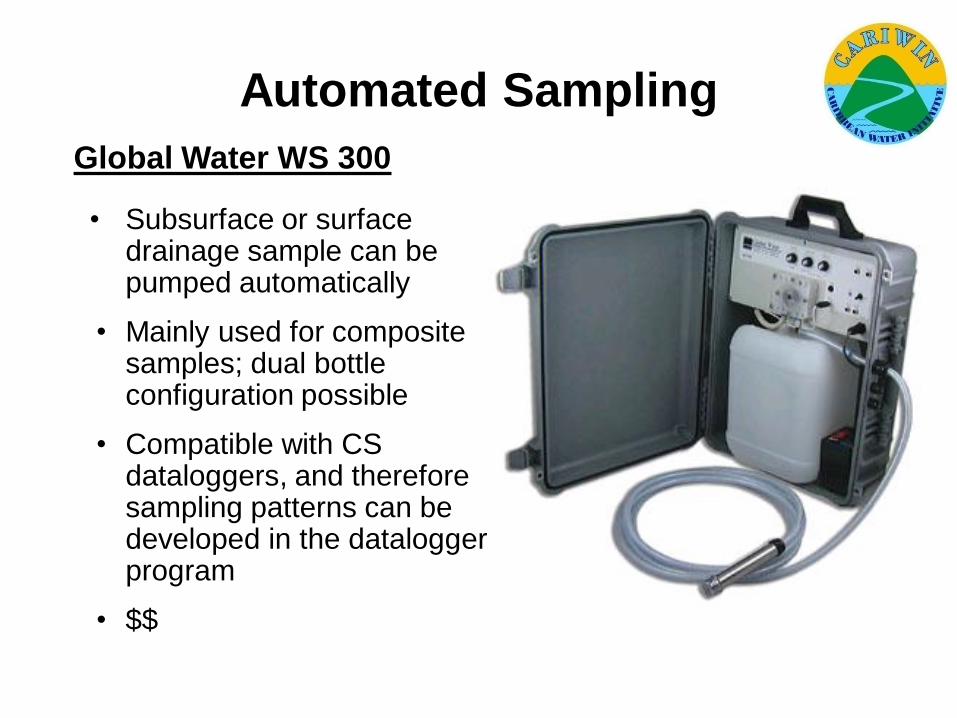
Automated Sampling
• Subsurface or surface drainage sample can be pumped automatically
• Mainly used for composite samples; dual bottle configuration possible
• Compatible with CS dataloggers, and therefore sampling patterns can be developed in the dataloggerprogram
• $$
Global Water WS 300
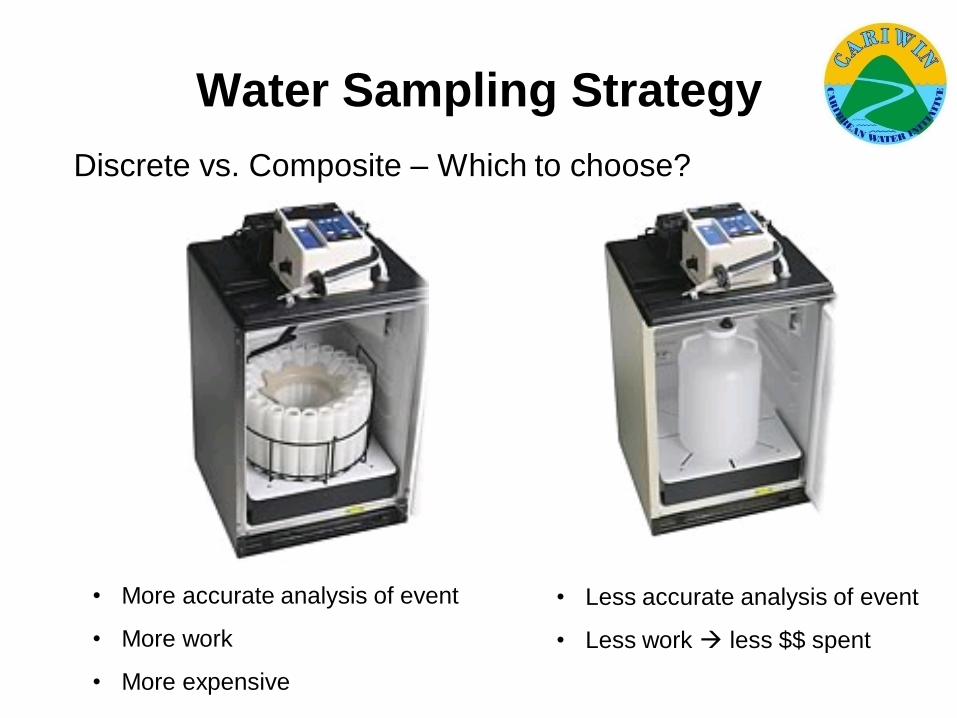
Water Sampling Strategy
Discrete vs. Composite – Which to choose?
• More accurate analysis of event
• More work
• More expensive
• Less accurate analysis of event
• Less work less $$ spent
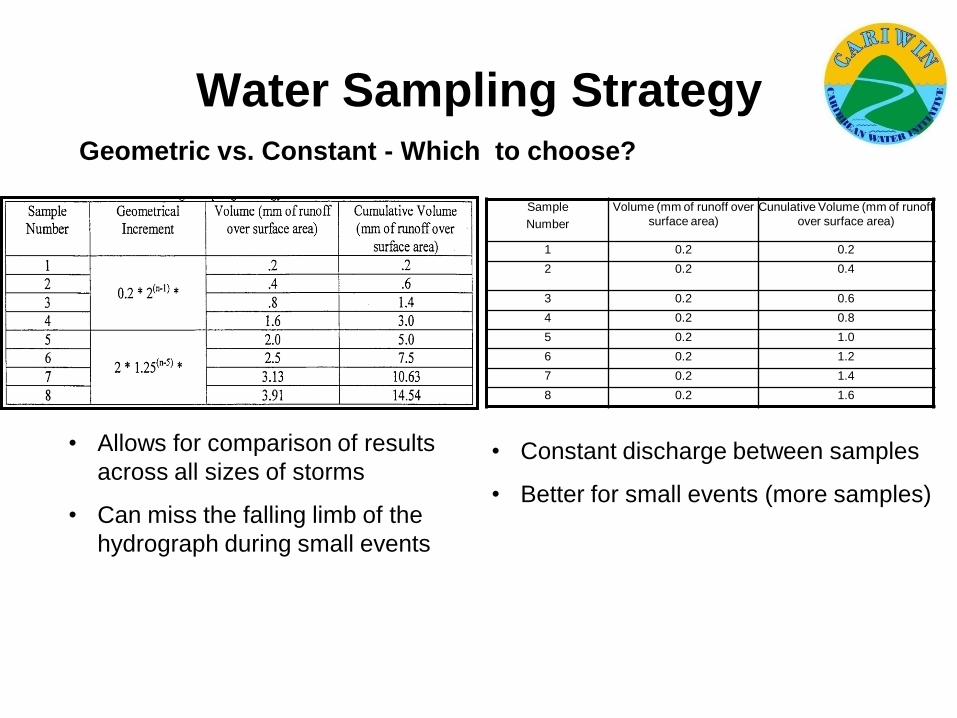
Water Sampling StrategyGeometric vs. Constant - Which to choose?
Sample
Number
Volume (mm of runoff over
surface area)
Cunulative Volume (mm of runoff
over surface area)
1 0.2 0.2
2 0.2 0.4
3 0.2 0.6
4 0.2 0.8
5 0.2 1.0
6 0.2 1.2
7 0.2 1.4
8 0.2 1.6
• Allows for comparison of results
across all sizes of storms
• Can miss the falling limb of the
hydrograph during small events
• Constant discharge between samples
• Better for small events (more samples)
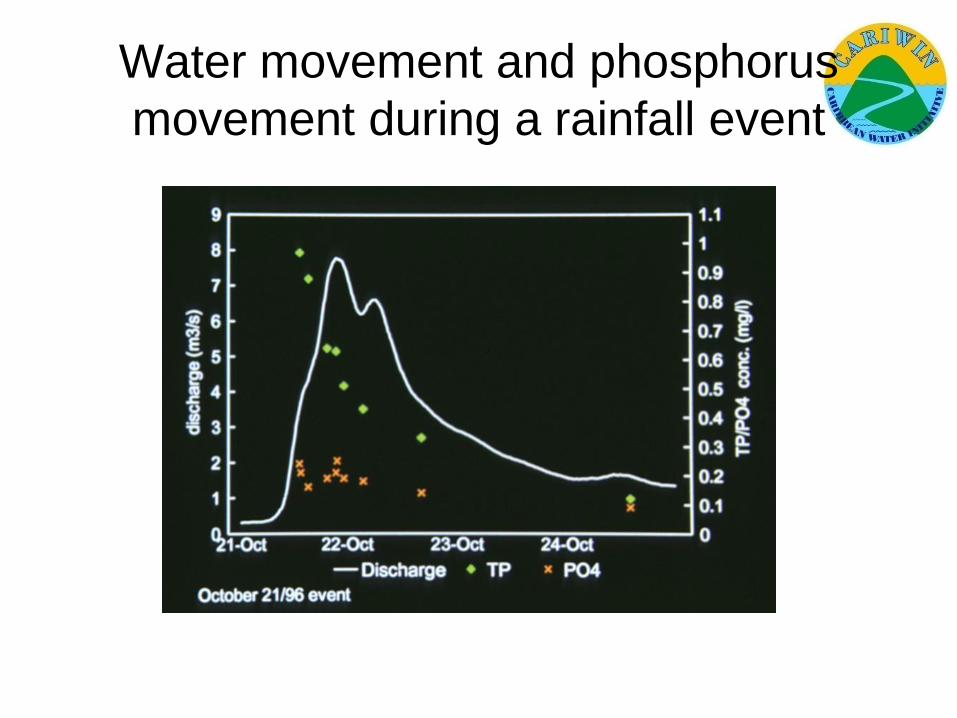
Water movement and phosphorus
movement during a rainfall event
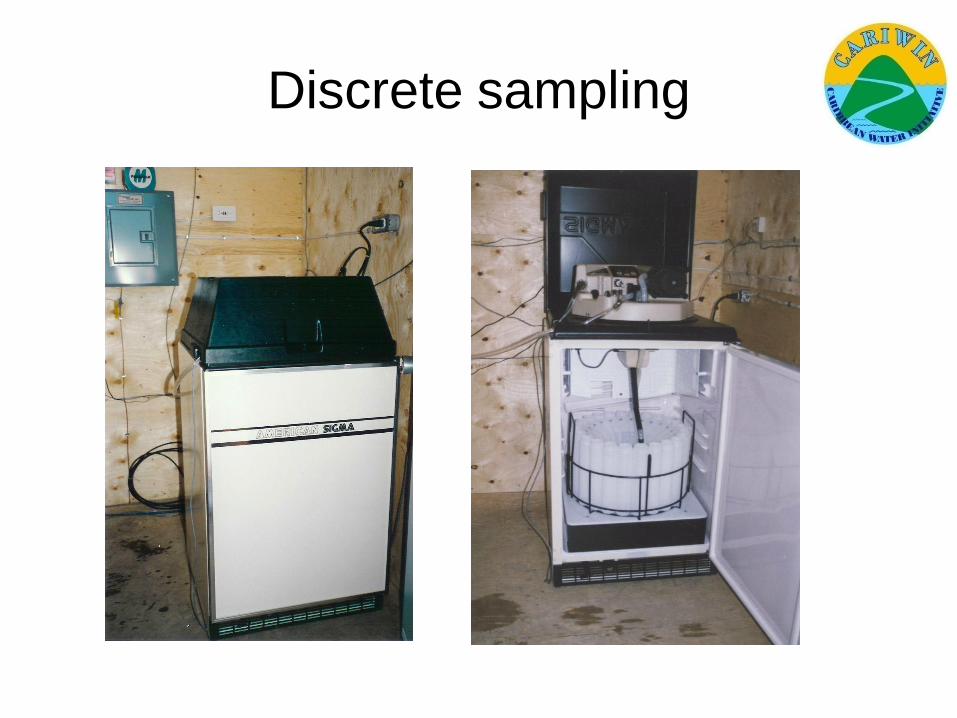
Discrete sampling
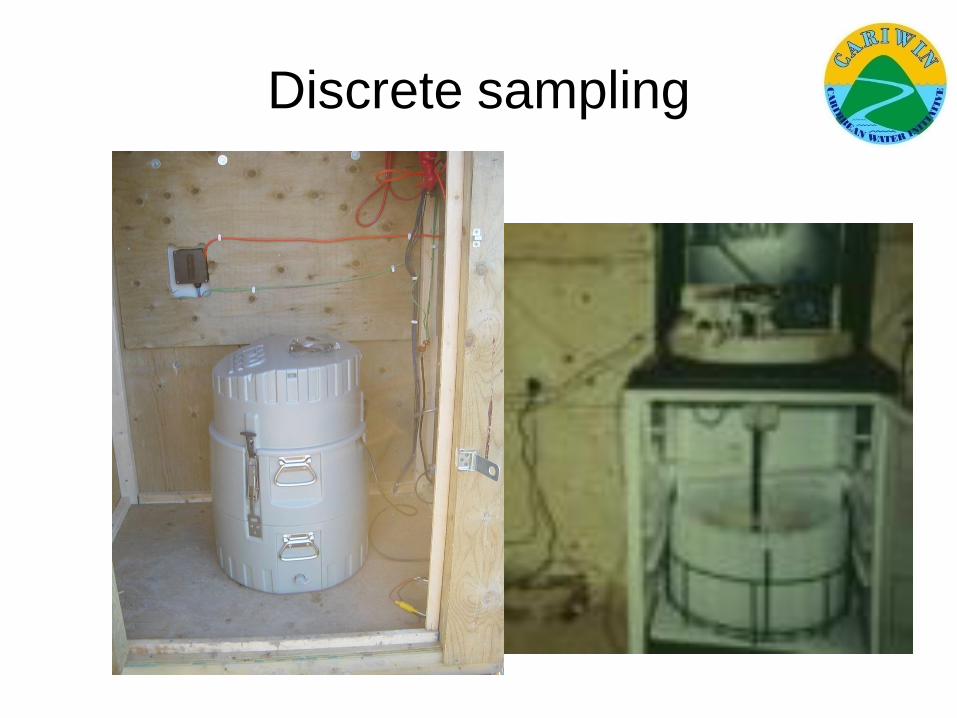
Discrete sampling
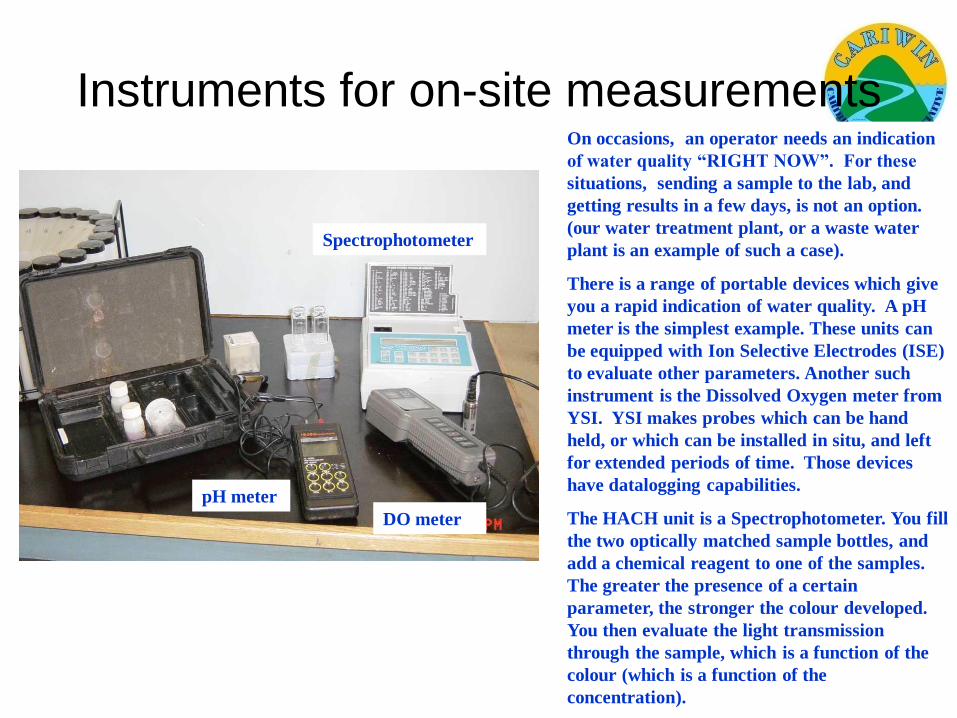
Instruments for on-site measurements
Spectrophotometer
DO meter
pH meter
On occasions, an operator needs an indication
of water quality “RIGHT NOW”. For these
situations, sending a sample to the lab, and
getting results in a few days, is not an option.
(our water treatment plant, or a waste water
plant is an example of such a case).
There is a range of portable devices which give
you a rapid indication of water quality. A pH
meter is the simplest example. These units can
be equipped with Ion Selective Electrodes (ISE)
to evaluate other parameters. Another such
instrument is the Dissolved Oxygen meter from
YSI. YSI makes probes which can be hand
held, or which can be installed in situ, and left
for extended periods of time. Those devices
have datalogging capabilities.
The HACH unit is a Spectrophotometer. You fill
the two optically matched sample bottles, and
add a chemical reagent to one of the samples.
The greater the presence of a certain
parameter, the stronger the colour developed.
You then evaluate the light transmission
through the sample, which is a function of the
colour (which is a function of the
concentration).
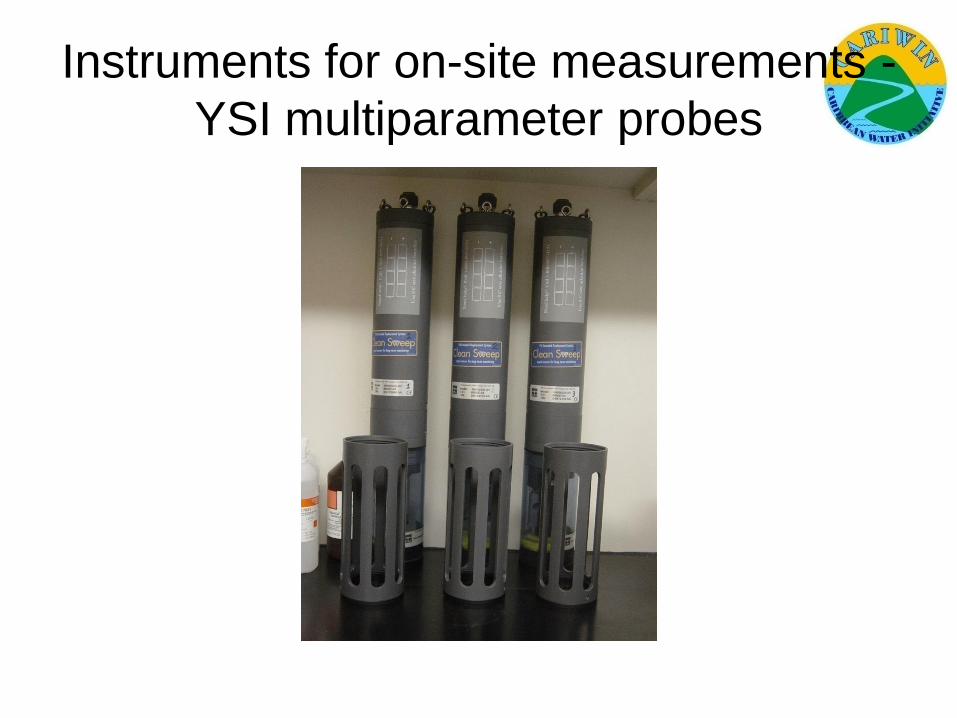
Instruments for on-site measurements -
YSI multiparameter probes
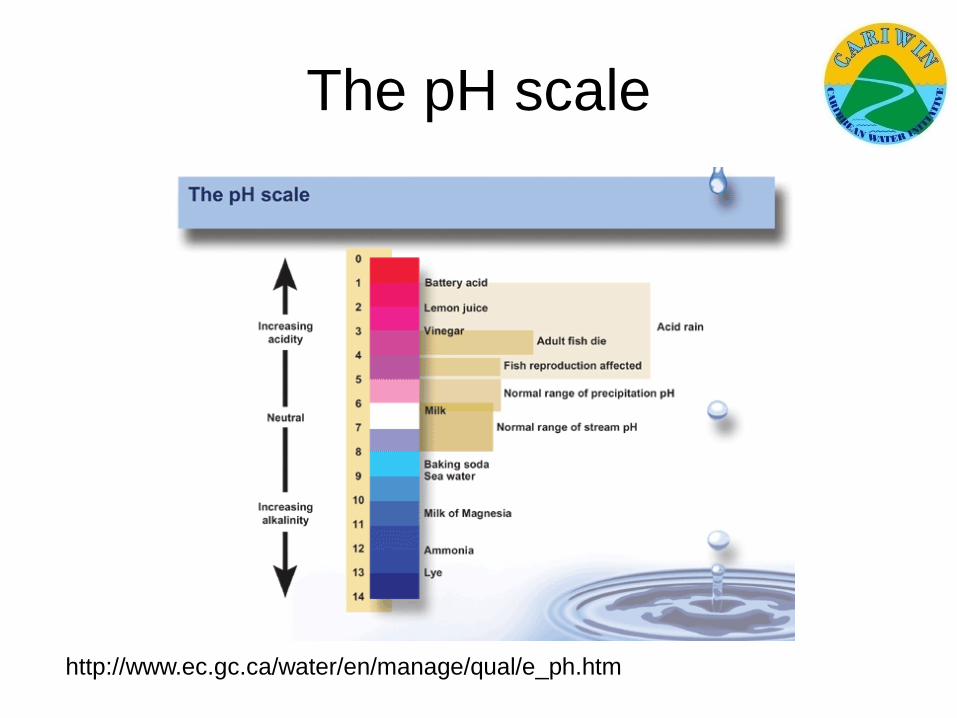
The pH scale
http://www.ec.gc.ca/water/en/manage/qual/e_ph.htm
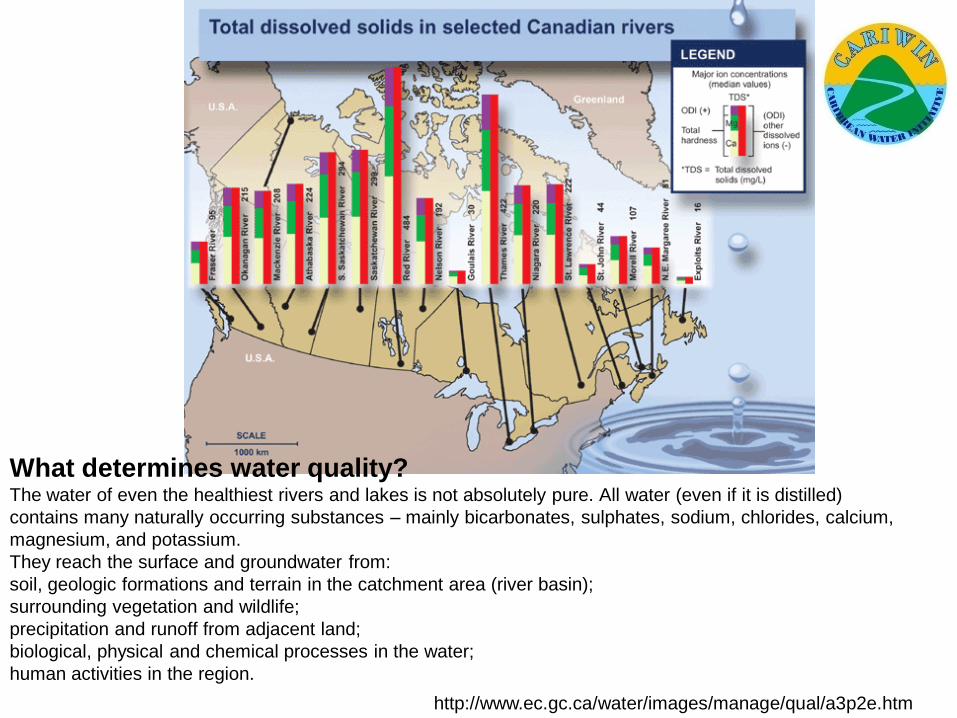
What determines water quality?The water of even the healthiest rivers and lakes is not absolutely pure. All water (even if it is distilled)
contains many naturally occurring substances – mainly bicarbonates, sulphates, sodium, chlorides, calcium,
magnesium, and potassium.
They reach the surface and groundwater from:
soil, geologic formations and terrain in the catchment area (river basin);
surrounding vegetation and wildlife;
precipitation and runoff from adjacent land;
biological, physical and chemical processes in the water;
human activities in the region.
http://www.ec.gc.ca/water/images/manage/qual/a3p2e.htm
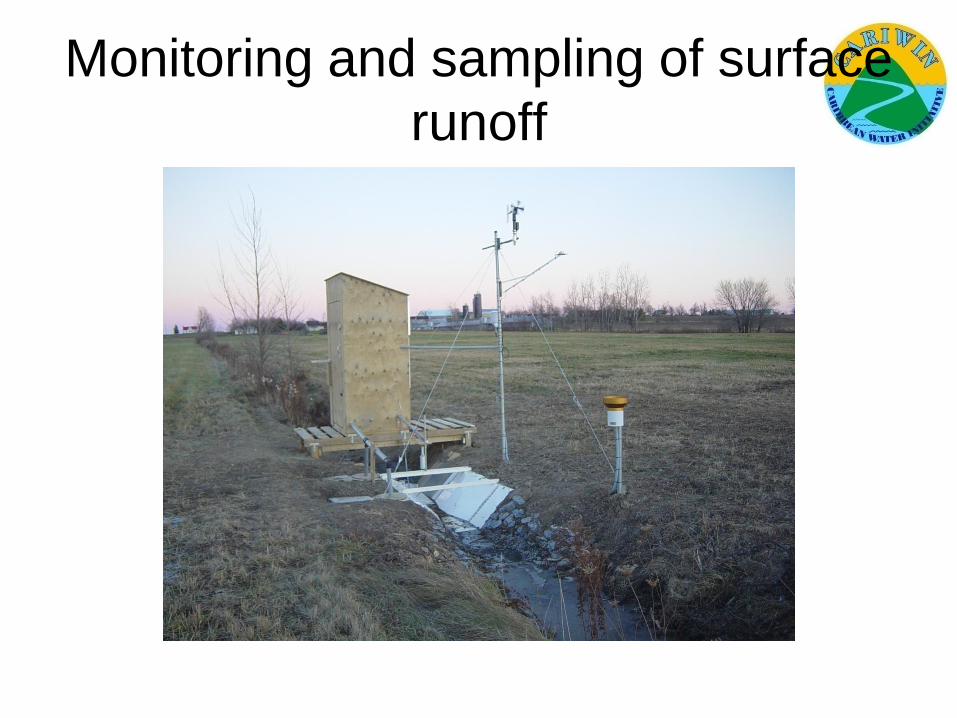
Monitoring and sampling of surface
runoff
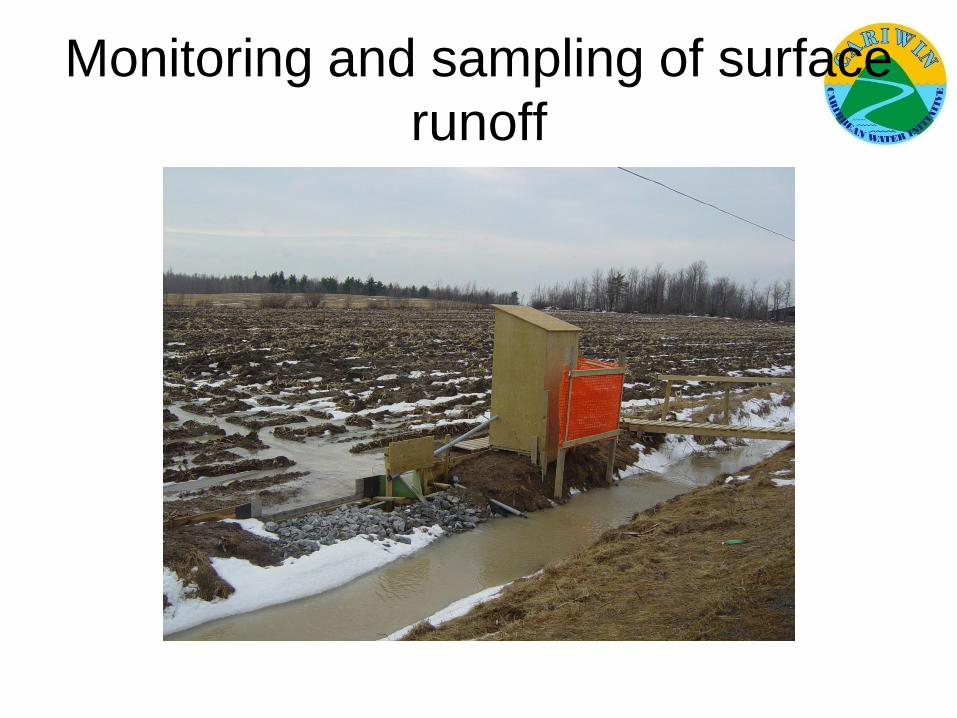
Monitoring and sampling of surface
runoff
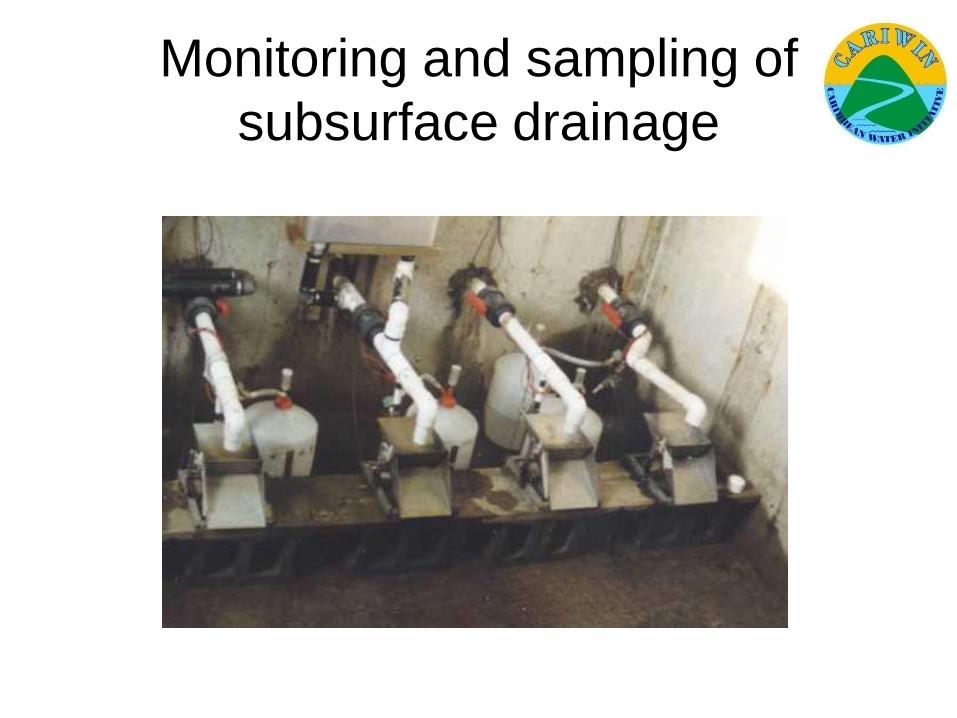
Monitoring and sampling of
subsurface drainage
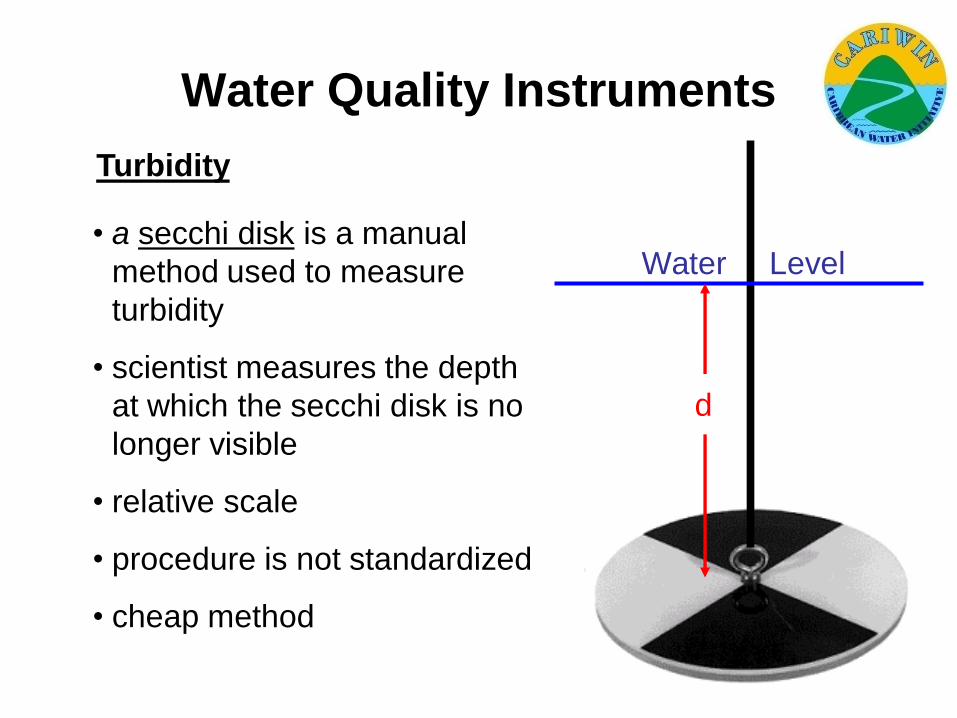
Water Quality Instruments
Turbidity
• a secchi disk is a manual
method used to measure
turbidity
• scientist measures the depth
at which the secchi disk is no
longer visible
• relative scale
• procedure is not standardized
• cheap method
d
Water Level
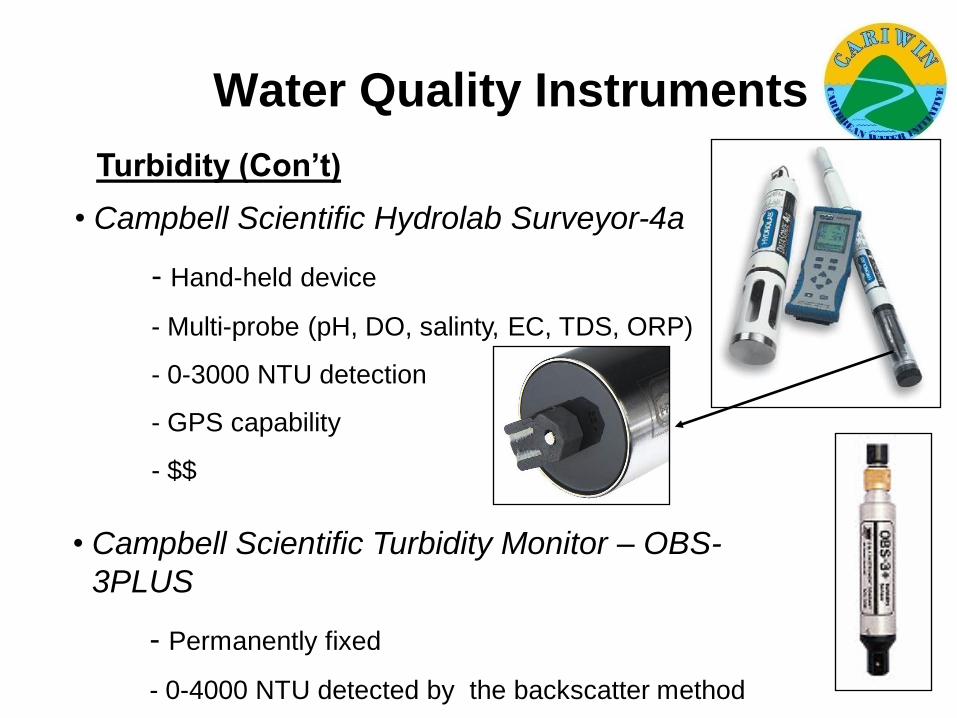
Water Quality Instruments
Turbidity (Con’t)
• Campbell Scientific Turbidity Monitor – OBS-
3PLUS
- Permanently fixed
- 0-4000 NTU detected by the backscatter method
• Campbell Scientific Hydrolab Surveyor-4a
- Hand-held device
- Multi-probe (pH, DO, salinty, EC, TDS, ORP)
- 0-3000 NTU detection
- GPS capability
- $$
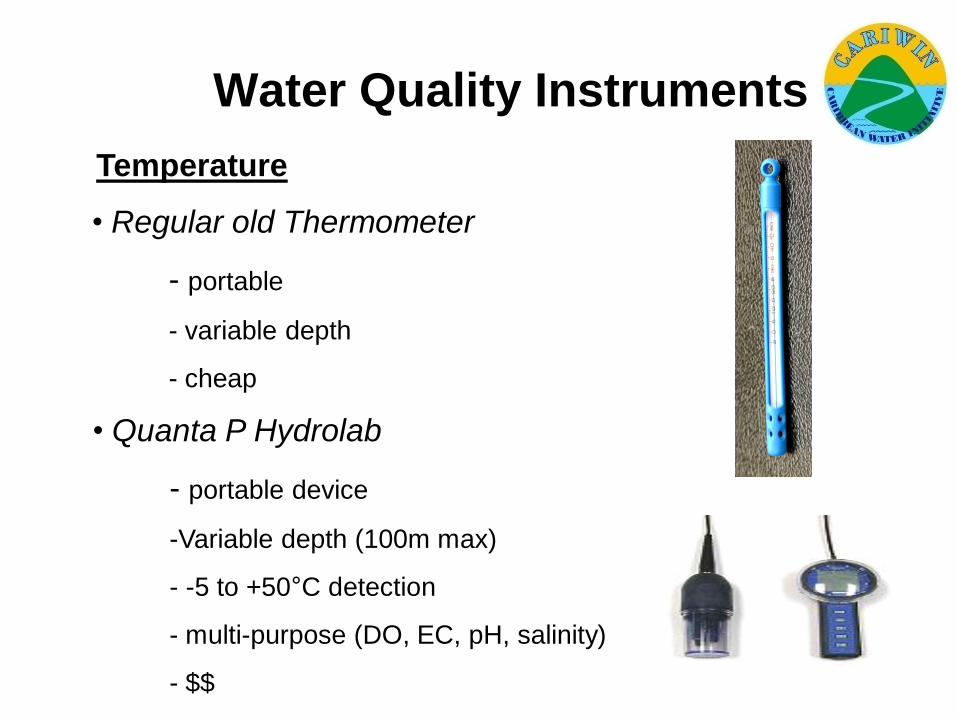
Temperature
• Quanta P Hydrolab
- portable device
-Variable depth (100m max)
- -5 to +50°C detection
- multi-purpose (DO, EC, pH, salinity)
- $$
• Regular old Thermometer
- portable
- variable depth
- cheap
Water Quality Instruments
Water Quality Instruments
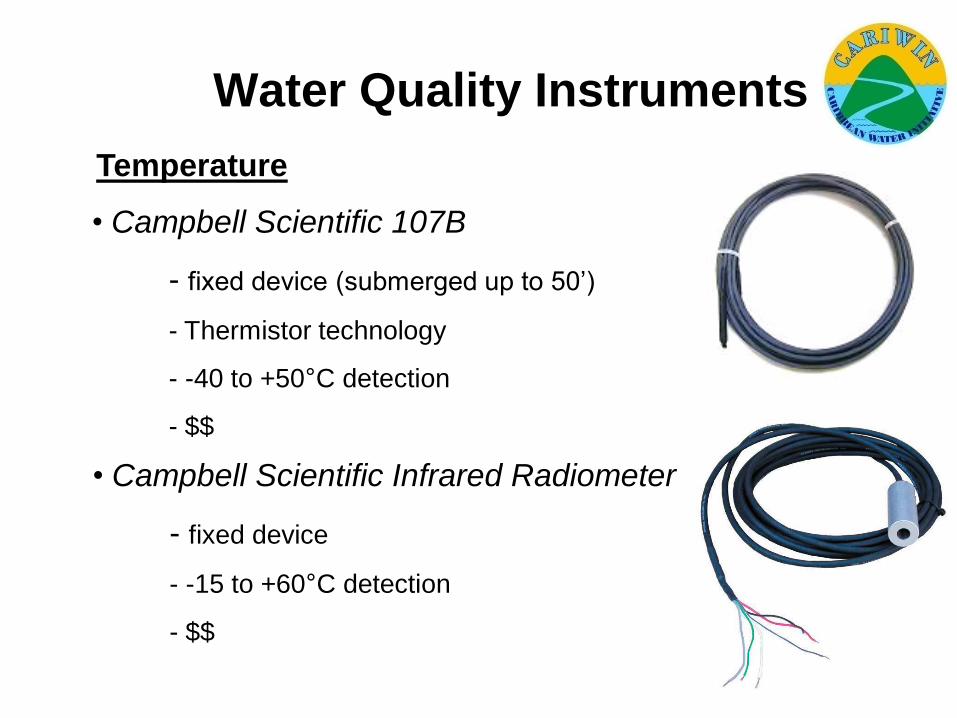
Temperature
• Campbell Scientific Infrared Radiometer
- fixed device
- -15 to +60°C detection
- $$
• Campbell Scientific 107B
- fixed device (submerged up to 50’)
- Thermistor technology
- -40 to +50°C detection
- $$
Water Quality Instruments
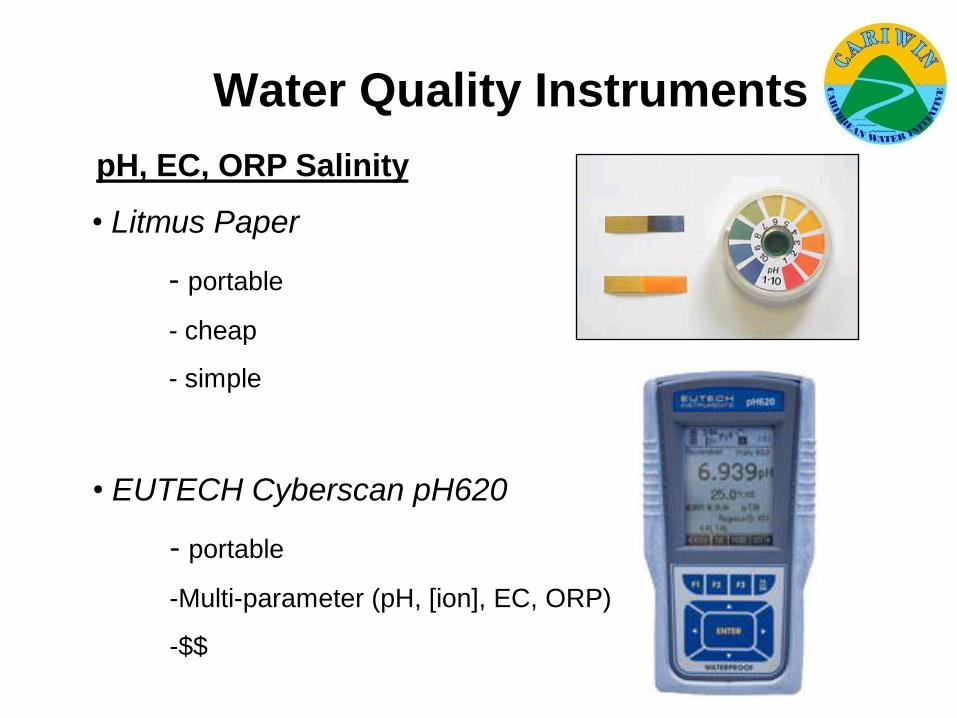
pH, EC, ORP Salinity
• Litmus Paper
- portable
- cheap
- simple
• EUTECH Cyberscan pH620
- portable
-Multi-parameter (pH, [ion], EC, ORP)
-$$
Water Quality Instruments
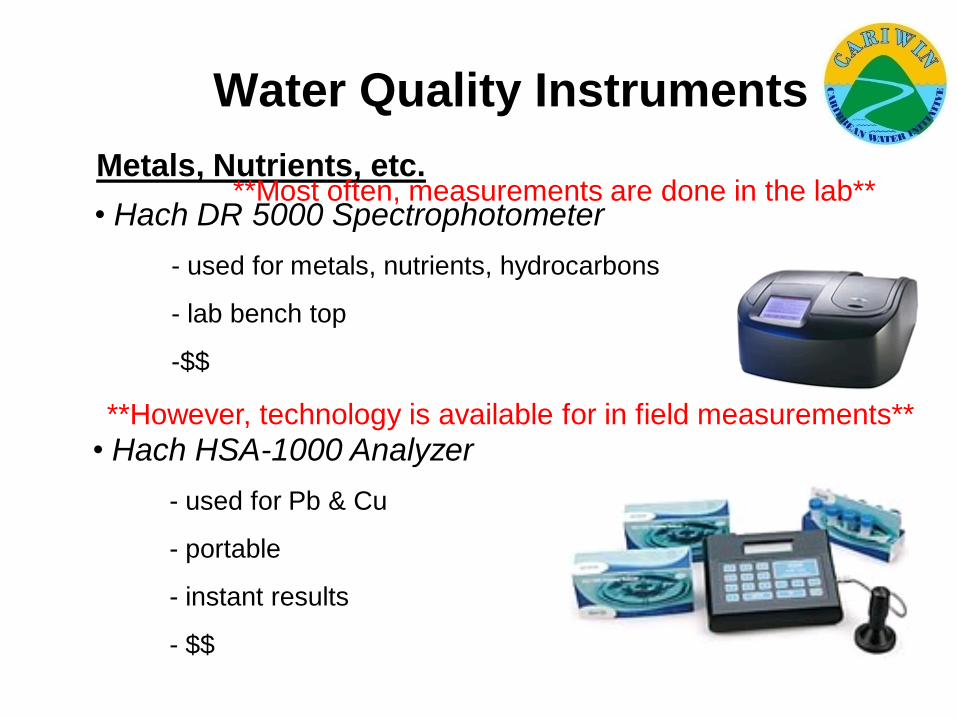
Metals, Nutrients, etc.
• Hach HSA-1000 Analyzer
- used for Pb & Cu
- portable
- instant results
- $$
**Most often, measurements are done in the lab**• Hach DR 5000 Spectrophotometer
- used for metals, nutrients, hydrocarbons
- lab bench top
-$$
**However, technology is available for in field measurements**
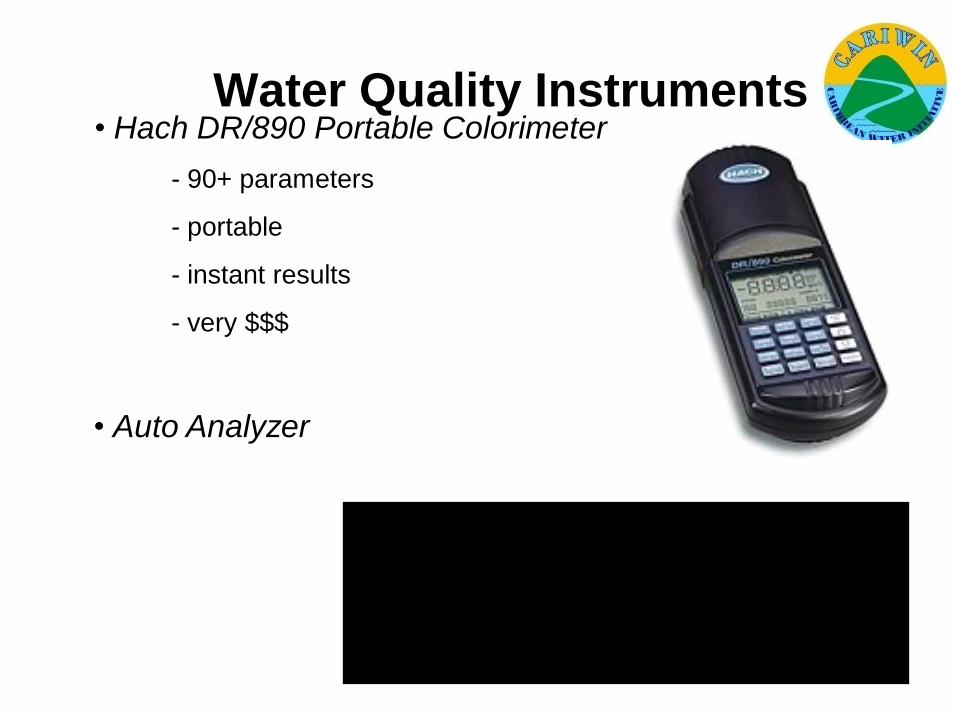
Water Quality Instruments• Hach DR/890 Portable Colorimeter
- 90+ parameters
- portable
- instant results
- very $$$
• Auto Analyzer
Water Quality Instruments
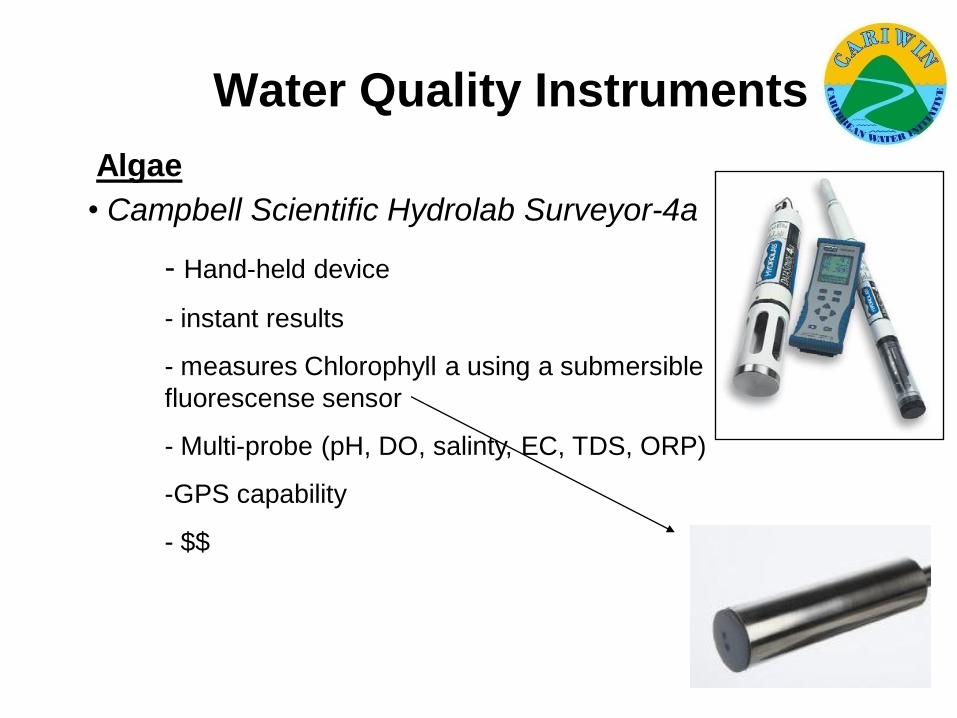
• Campbell Scientific Hydrolab Surveyor-4a
- Hand-held device
- instant results
- measures Chlorophyll a using a submersible
fluorescense sensor
- Multi-probe (pH, DO, salinty, EC, TDS, ORP)
-GPS capability
- $$
Algae
Water Quality Instruments
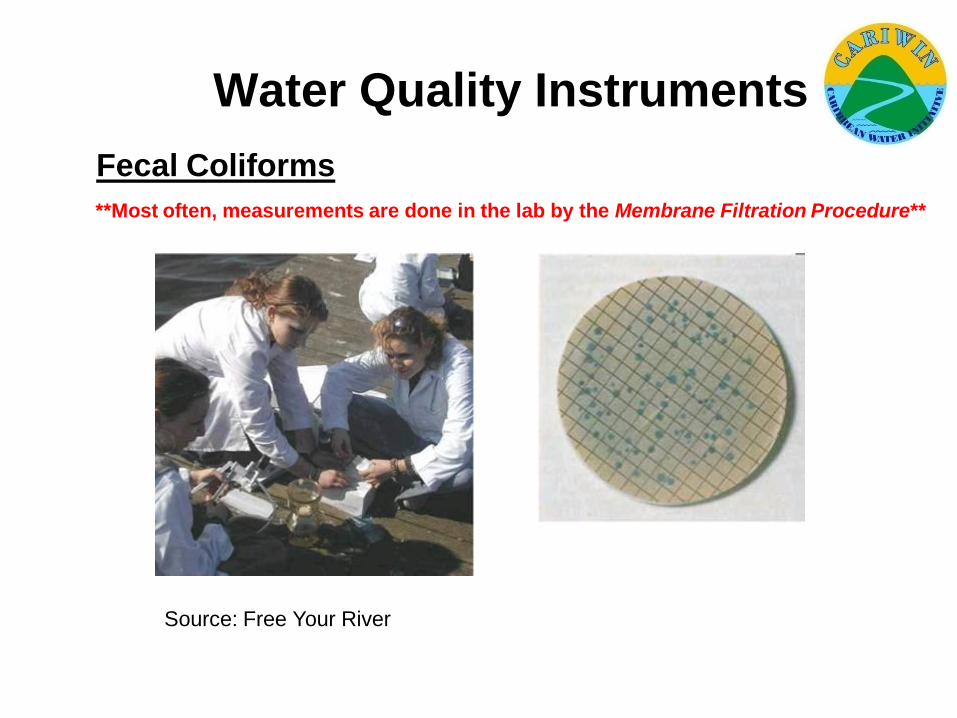
Fecal Coliforms
**Most often, measurements are done in the lab by the Membrane Filtration Procedure**
Source: Free Your River
Water Quality Instruments
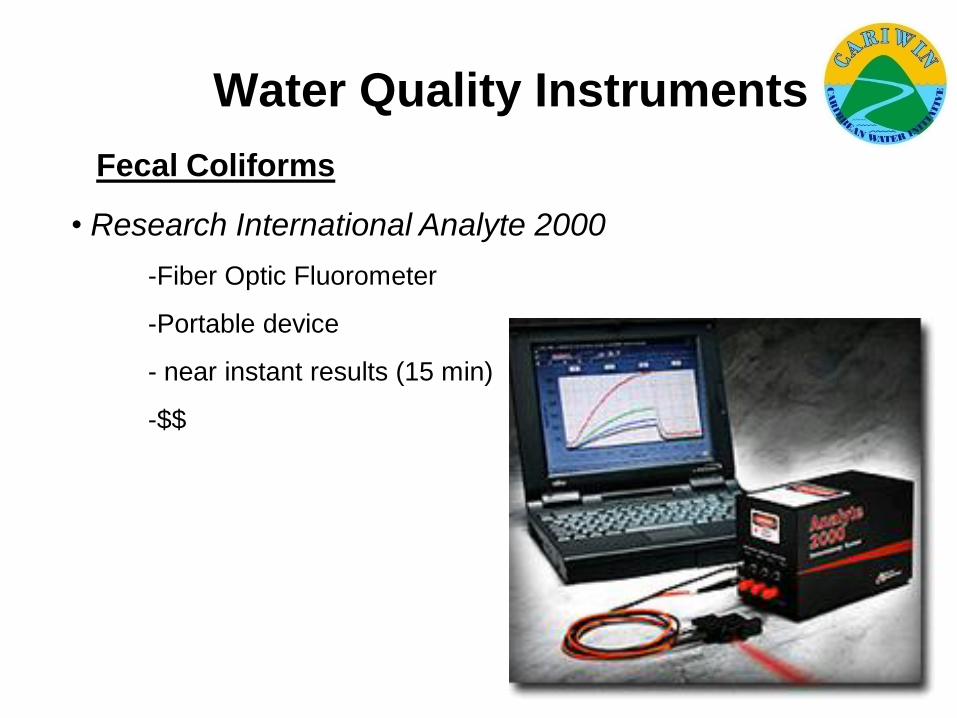
Fecal Coliforms
• Research International Analyte 2000
-Fiber Optic Fluorometer
-Portable device
- near instant results (15 min)
-$$
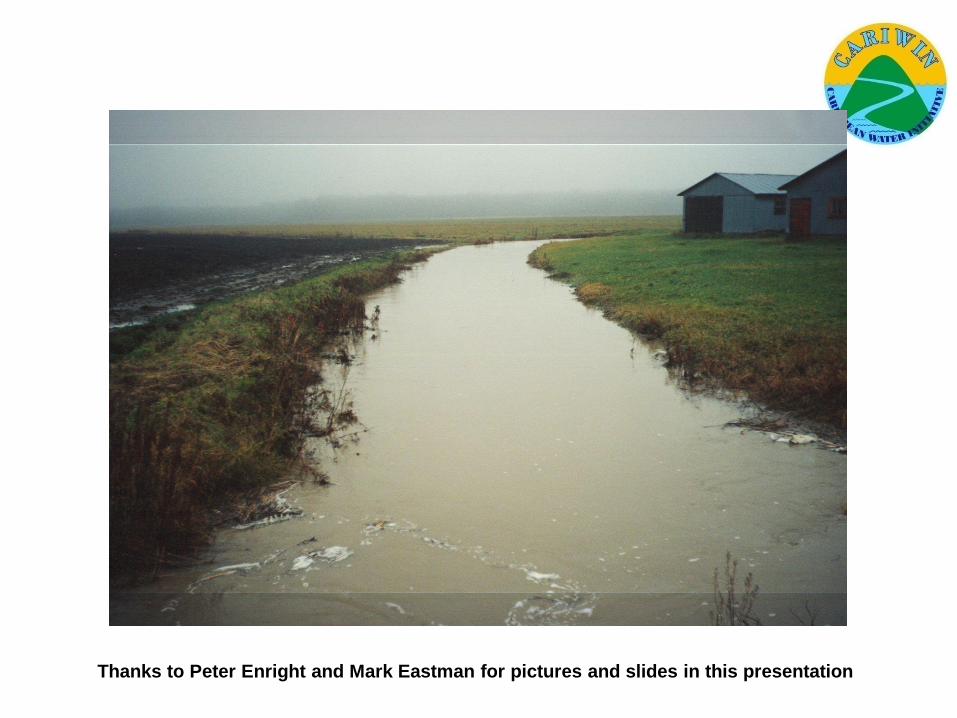
Thanks to Peter Enright and Mark Eastman for pictures and slides in this presentation
References
BBC News. 2001. Sewage Limits Harm Swimmers Health. Available at: http://news.bbc.co.uk/2/hi/science/nature/1672207.stm
Encyclopedia of Earth (EOEarth). 2007. Agricultural Pesticide Contamination. Available at: http://www.eoearth.org
Free Your River. 2007. Fecal Coliform Bacteria. Available at: http://www.freeyourriver.net/index.php?cid=6589&folder=63442&modul=10
Iowa State Univesity. 2007. Healthy Lands, Healthy Streams: Riparian Management Systems. Available at: http://www.buffer.forestry.iastate.edu/Photogallery/illustrations/illustrations-1.htm
Lake Champlain Basin Programs. 2007. Lawn to Lake. Available at: http://www.lcbp.org/
Ministere de Developpement, Durable, de l’Environnement et des Parcs (MDDEP). 2007. Sources of Water Pollution. Available at: http://www.menv.gouv.qc.ca/
Pollution Probe. 2004. Source Water Protection Primer. Available at: http://www.pollutionprobe.org/Reports/swpprimer.pdf
University of Michigan (U of M). 2007. Water Pollution and Society. Available at: http://www.umich.edu/~gs265/society/waterpollution.htm
World Bank Group. 2007. Access to Safe Water Map. Available at: http://www.worldbank.org/depweb/english/modules/environm/water/map1.html
University of Toledo. Microcystis. Available at: http://www.sciencedaily.com