Embed Size (px)
Citation preview
THIS REPORT HAS BEEN PUBLISHED IN PARTNERSHIP WITH
WATER STEWARDSHIP FOR INDUSTRIESTHE NEED FOR A PARADIGM SHIFT IN INDIA
2 33
This publication is funded and supported by WWF International.
© WWF-India 2013
Published by WWF-India
Any reproduction in full or part of this publication must mention the title and credit the above mentioned publisher as the copyright owner.
This Report is prepared by WWF-India and Accenture Services Pvt. Ltd.
Authors:
WWF-India Team: Suresh Babu - Director, River Basins and Water Policy Bhavna Prasad - Director, Sustainable Business Rebecca Aranha - Research Associate
WWF International Team:Stuart Orr - Head, Water Stewardship Oliver Männicke - Water Stewardship Specialist Jochem Verberne - Head, Corporate Relations
Accenture Team: Aditya Sharma - Director, Sustainable OperationsGanesan Ramachandran - Managing Director, APAC Lead for Sustainable OperationsGary L. Hanifan - Managing Director, Global Lead for Sustainable OperationsVishvesh Prabhakar - Managing Director, India Lead – Sustainability Strategy, Operations and IT
Acknowledgements:
WWF-India: Ravi Singh (SG&CEO), Dr. Sejal Worah (Programme Director), Ashish Mishra, Murli Dhar, P. Vamshi Krishna
Accenture Team: Carlos Alvarenga, Serge Younes, Ana Paula Mundim, Melissa Barrett, Dr Annalisa de Munari, Anuj Rikhye, Pooja Bhatt, Anmol Puri, Gloria Vega, Mohit Kumar, Paras Mehta, Vishal Kaushal, William R. Webb, Suraj Nambiar
Edited by: Neha Simlai, WWF-India
Printed by: Lustra Print Process
Cover Photo Credits: Main Photo - Rohit Rattan, WWF-India. Tsomoriri; Vertical Photos - CSE Environment Photo Library and WWF-India
Legal Disclaimer: This Report has been published for information and illustrative purposes only and is not intended to serve as advice of any nature whatsoever. The information contained and the references made in this Report are in good faith, neither Accenture/WWF-India nor any of their directors, agents or employees give any warranty of accuracy (whether expressed or implied), nor accept any liability as a result of reliance upon the content. This Report also contains certain information available in public domain, created and maintained by private and public organizations. Accenture and WWF-India do not control or guarantee the accuracy, relevance, timelines or completeness of such information.
CONTENTS
1. Setting the Context 9
1.1 Global Water Scenario 9
1.2 India’s Water Scenario 10
1.3 Water - A Shared Resource 11
2. Understanding Risks to Indian Industry 13
2.1 Water Risks to Indian Industry 13
2.2 Water Risk Analysis and Methodology 15
2.3 Sectoral Analysis 16
2.3.1 Thermal Power Plant 16
2.3.2 Textile 18
2.3.3 Pulp and Paper Industry 21
2.3.4 Sugar 23
2.3.5 Beverages 25
2.3.6 Steel 26
2.4 Water Risk Assessment for Industries 29
2.4.1 Physical Risks 29
2.4.2 Regulatory Risks 31
2.4.3 Reputational Risks 33
3. Water Stewardship – Path to a Sustainable Future 35
4. Call to Action – Opportunities around Shared Risk 40
© R
OH
IT R
ATTA
N \
WW
F-IN
DIA
55
Water as a resource is central to all aspects of life. The extensive degradation of the world’s ecosystem—land, forest and water, has put severe pressure on the corporate sector, Government and individuals. According to WWF’s Living Planet Report (2012), the tropical freshwater Living Planet Index is deteriorating faster than any other, with 70 per cent biodiversity loss between 1970 and 2008. With rivers and aquifers drying up or getting polluted, millions across the globe (mostly in India, China and Sub-Saharan Africa) do not have access to safe drinking water. It is evident that this is not just an ecological problem, but a societal one. While lives, livelihoods and ecosystems are threatened, industries are also struggling to manage water for direct operations. Growing footprints along with competition for scarce water resources between agriculture, domestic and industrial sectors have worsened the crisis.
India’s rapid economic growth, urbanization and population increase are placing unprecedented pressure on demand. The situation is further exacerbated by supply-side challenges, like poor water management practices, over-abstraction of surface and ground water as well as pollution due to effl uent discharge. A report by the Water Resources Group (WRG) has predicted that demand will outstrip the supply of water by 2015. But the crisis is evident even today; every summer; we are witnessing fl ash points of water confl icts —between various users. In all of this water for the environment or ecology is completely ignored.
WWF-India and Accenture initiated this study to get a macro level overview of the understanding amongst Indian businesses about water-related risks to and from them. We also mapped the responses of businesses towards water management. We found that though businesses in India are realizing the risks related to water, they are grossly underestimating them. Risks across the value chain are not understood holistically and the recognition of water as a shared resource and therefore a shared risk was missing. As a result, risk mitigation strategies are still at a nascent stage—mostly internal and short-term. Such responses may not be enough to insulate the business risk to companies operating in water-scarce or stressed areas. It also increases the vulnerability of ecosystems and communities dependent on the watershed or basin.
This challenge also presents businesses with opportunities for improving their industrial productivity to be at par with the global best, by developing innovative products and services that command premium positioning among consumers. Businesses should work to reduce water consumption per rupee of output as well as working towards the goal of zero discharge by recycling and reusing water, lowering toxic and other contaminants in all operations involving water and changing production processes to be more water effi cient. A rigorous approach to water sustainability and responsibility is part of good risk management for businesses. This would include securing the supply of water-intensive raw materials. It also gives the company a competitive advantage, in delivering business effi ciencies or engaging with consumers, customers or suppliers.
The report proposes a framework for businesses to embark on water stewardship—a journey where business can leapfrog from a beginner level to a leadership role in order to address long-term water security. This will require industry to collaborate with other stakeholders, such as communities, government, NGOs to address these issues and develop approaches for effective water governance at the basin-level.
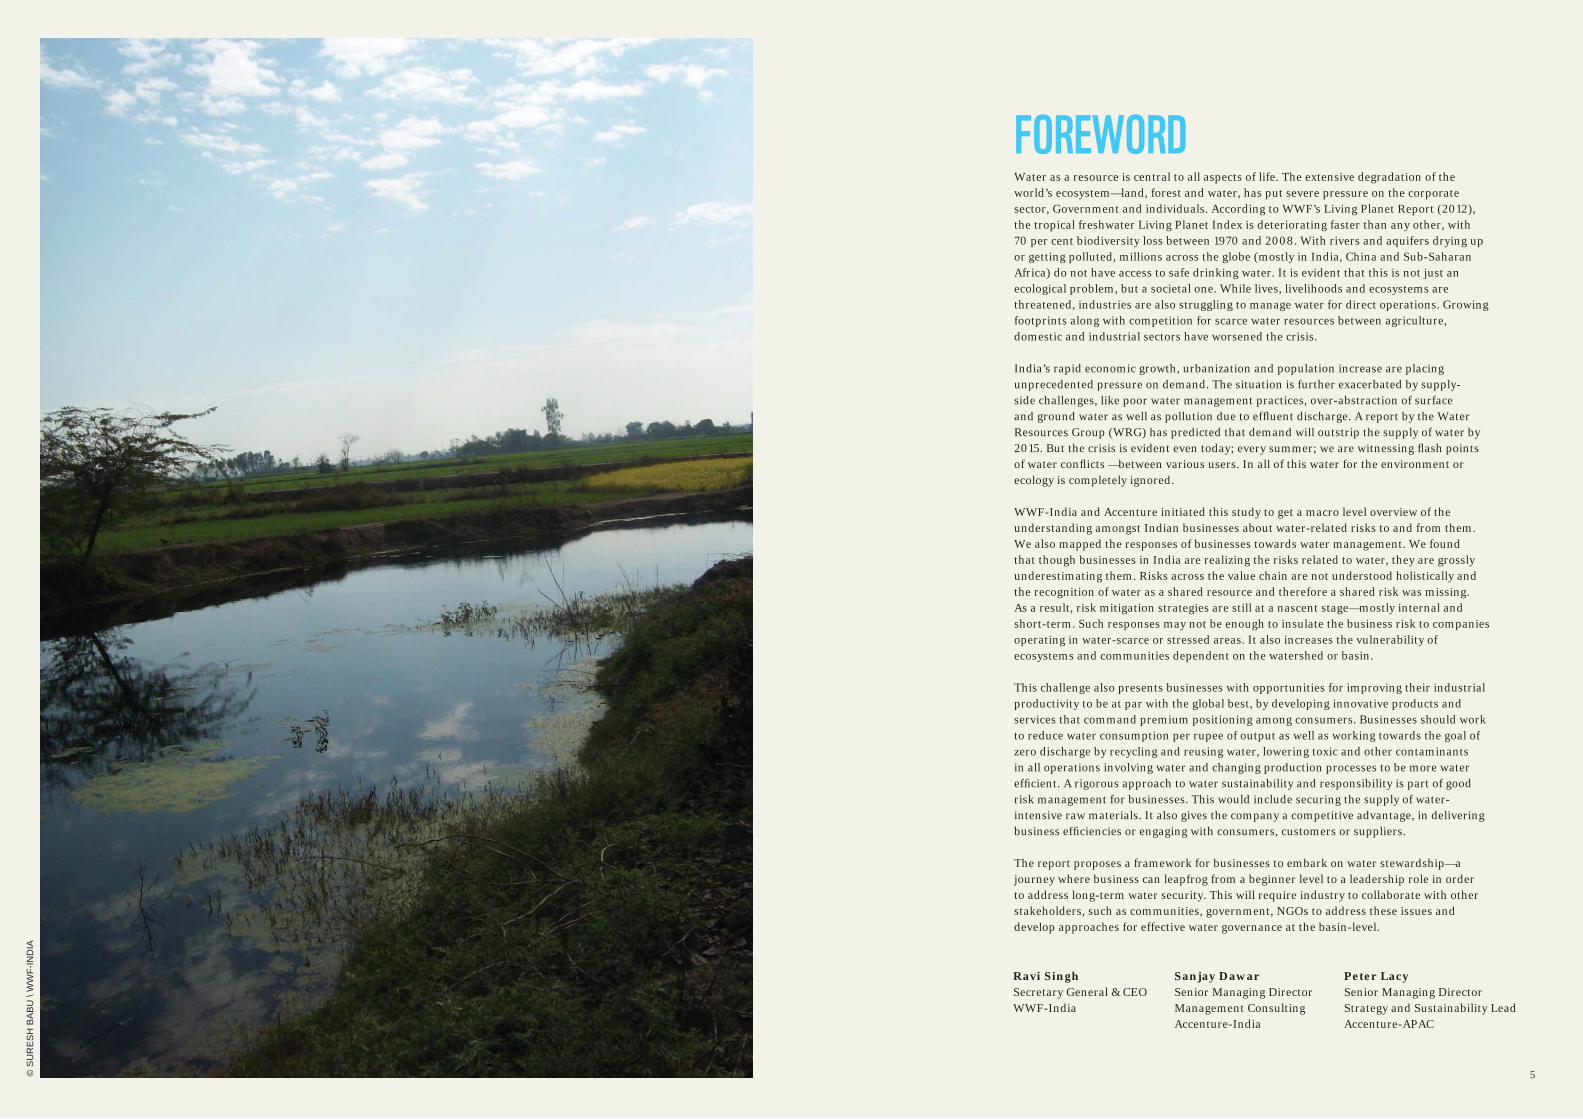
FOREWORD
© S
UR
ES
H B
AB
U \
WW
F-IN
DIA
Ravi Singh Secretary General & CEOWWF-India
Sanjay DawarSenior Managing Director Management Consulting Accenture-India
Peter LacySenior Managing DirectorStrategy and Sustainability Lead Accenture-APAC
6 76 7
India faces some of the gravest water challenges anywhere on earth. Water is a shared resource that is under tremendous strain, as sectors, such as agriculture, industry, domestic and environment/ecology compete with each other for its use. In addition to meeting new demands, most of which will be generated by rapid industrial growth, the needs of 97 million people, who already lack access to safe drinking water and 814 million people without sanitation, must also be balanced .1 As we grow as a nation, industrialize and urbanize rapidly, the needs of all these sectors will grow. Given this scenario, demands for water are predicted to exceed available supply as early as the year 2015.2
India has a network of great rivers; however, these rivers are in a state of crisis, due to over-extraction, fragmentation, pollution and mismanagement. Nearly 80 per cent of untreated urban wastewater ends up in rivers.3 India has already emerged as the largest consumer of groundwater, with over 30 million abstraction wells, with declining groundwater levels. Groundwater in one-third of India’s 600 districts is not fi t for drinking, as the concentration of fl uoride, iron, arsenic and salinity exceed the permissible levels. As a result of all these factors, India ranks 120th among the 122 nations in terms of quality of water available to its citizens.4
In this already dismal water scenario, water scarcity could be one of the constraining factors for India’s growth. Businesses need water in order to grow. In times of crisis, water allocation priority shifts to water for domestic use, followed by agriculture and then industry. Industry is given the last priority, while maintaining ecological balance has traditionally been ignored. There is also a growing demand to reserve water for ecology, which will further aggravates the competition. This will worsen the business risk to companies operating in water-scarce and water-stressed areas, and also increase the vulnerability of ecosystems and people who are dependent on the watershed or basin.
While many industries are responsible for pollution and over-extraction, they are also at risk, as a result of these actions. These include risks not only from disruption of operations, due to water scarcity or escalating costs of water access/treatment, but also from reputational risks and threats to their social license to operate. The key here is to recognize that basins, which sustain lives, livelihoods and environment, all, have a shared risk. Therefore, getting the response right is as much a business imperative, as it is a social and ecological one.
Public outcry, media scrutiny, growing consumer awareness about water-related impacts on their life and health are already being witnessed on multiple scales. While regulatory responses have started to grow, investors and fi nancial institutions will also start reviewing ‘water-dependent’ industries and the risks associated with them. Given the considerable asymmetries in exposure and vulnerability between various sectors, industry response to these imperatives will require innovative and collaborative action at the local and basin-level, in order to sustain strong economic growth, while meeting societal and environmental needs that are equally important.
This report aims to provide a macro level overview of water-related risks to and from Indian businesses, their response mechanisms and the opportunity for businesses to embark on a water stewardship journey. The report addresses a number of questions and concerns related to industries water risk perception, as well as gauge, how industries have responded to mitigate them. The report, also highlights the opportunities that exist for industries to improve their direct operations through better water management and effi ciencies and prospects across their supply chain that help improve their revenues,
EXECUTIVE SUMMARY
© F
RA
NÇ
OIS
XAV
IER
PE
LLE
TIE
R \
WW
F-C
AN
ON
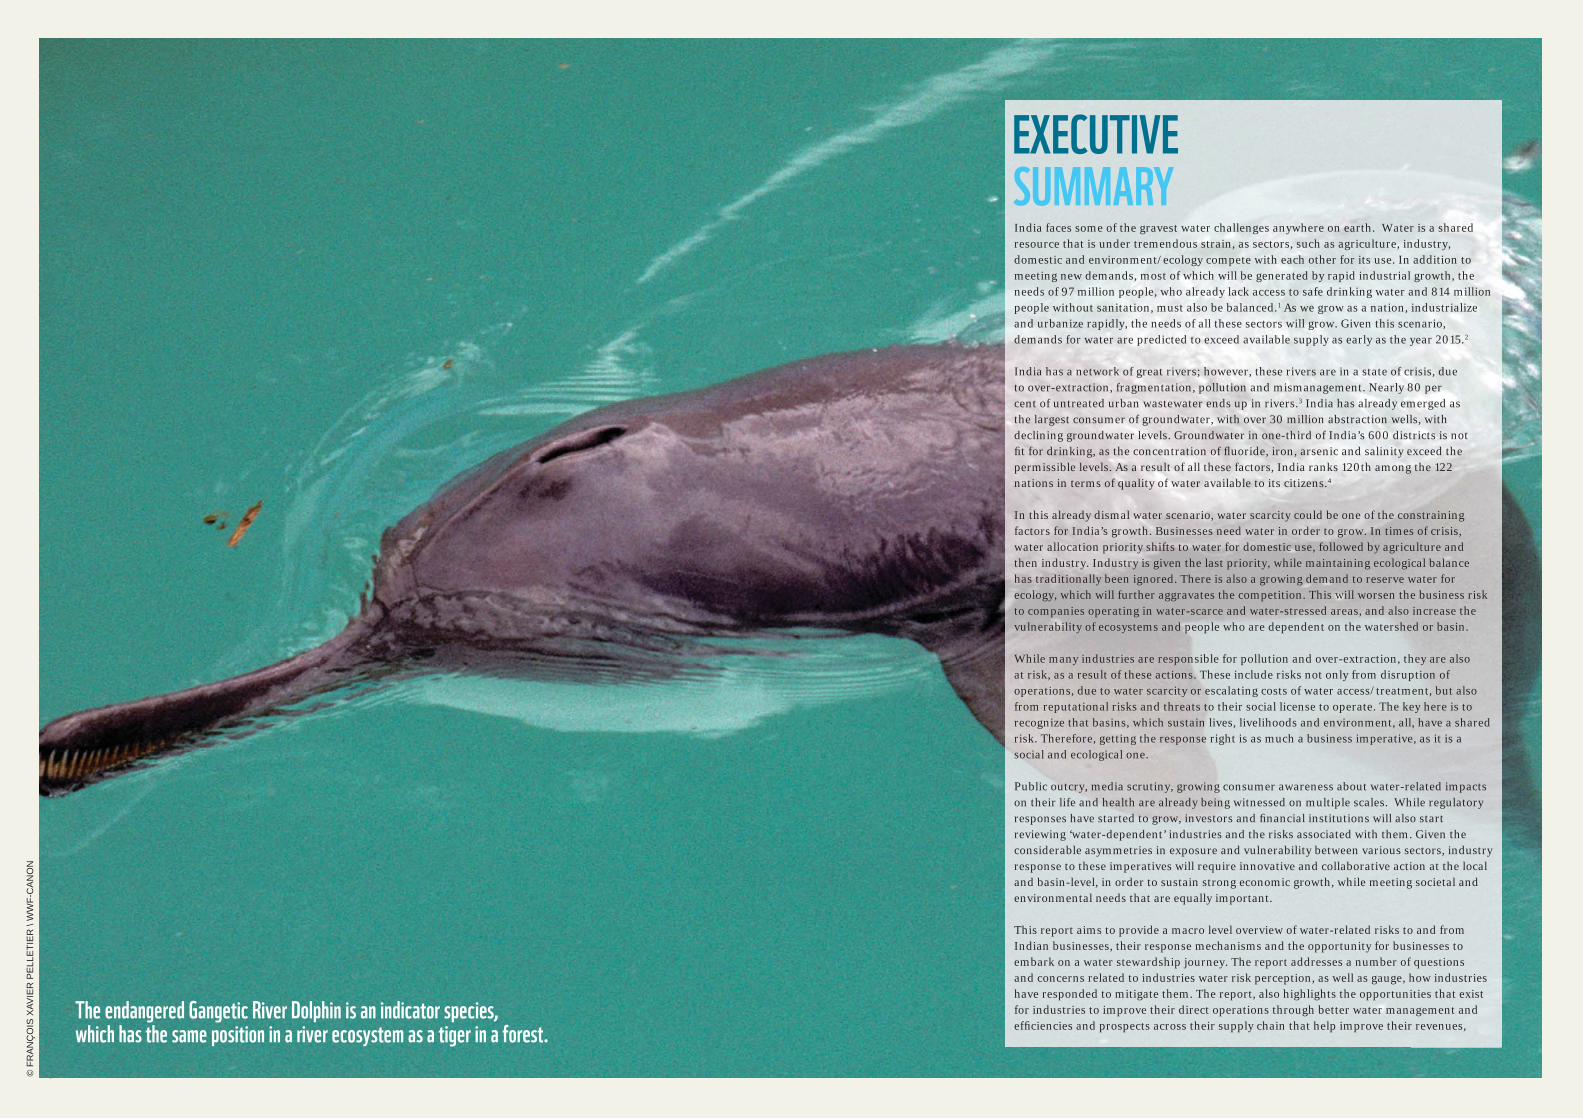
The endangered Gangetic River Dolphin is an indicator species, which has the same position in a river ecosystem as a tiger in a forest.
8 98 9
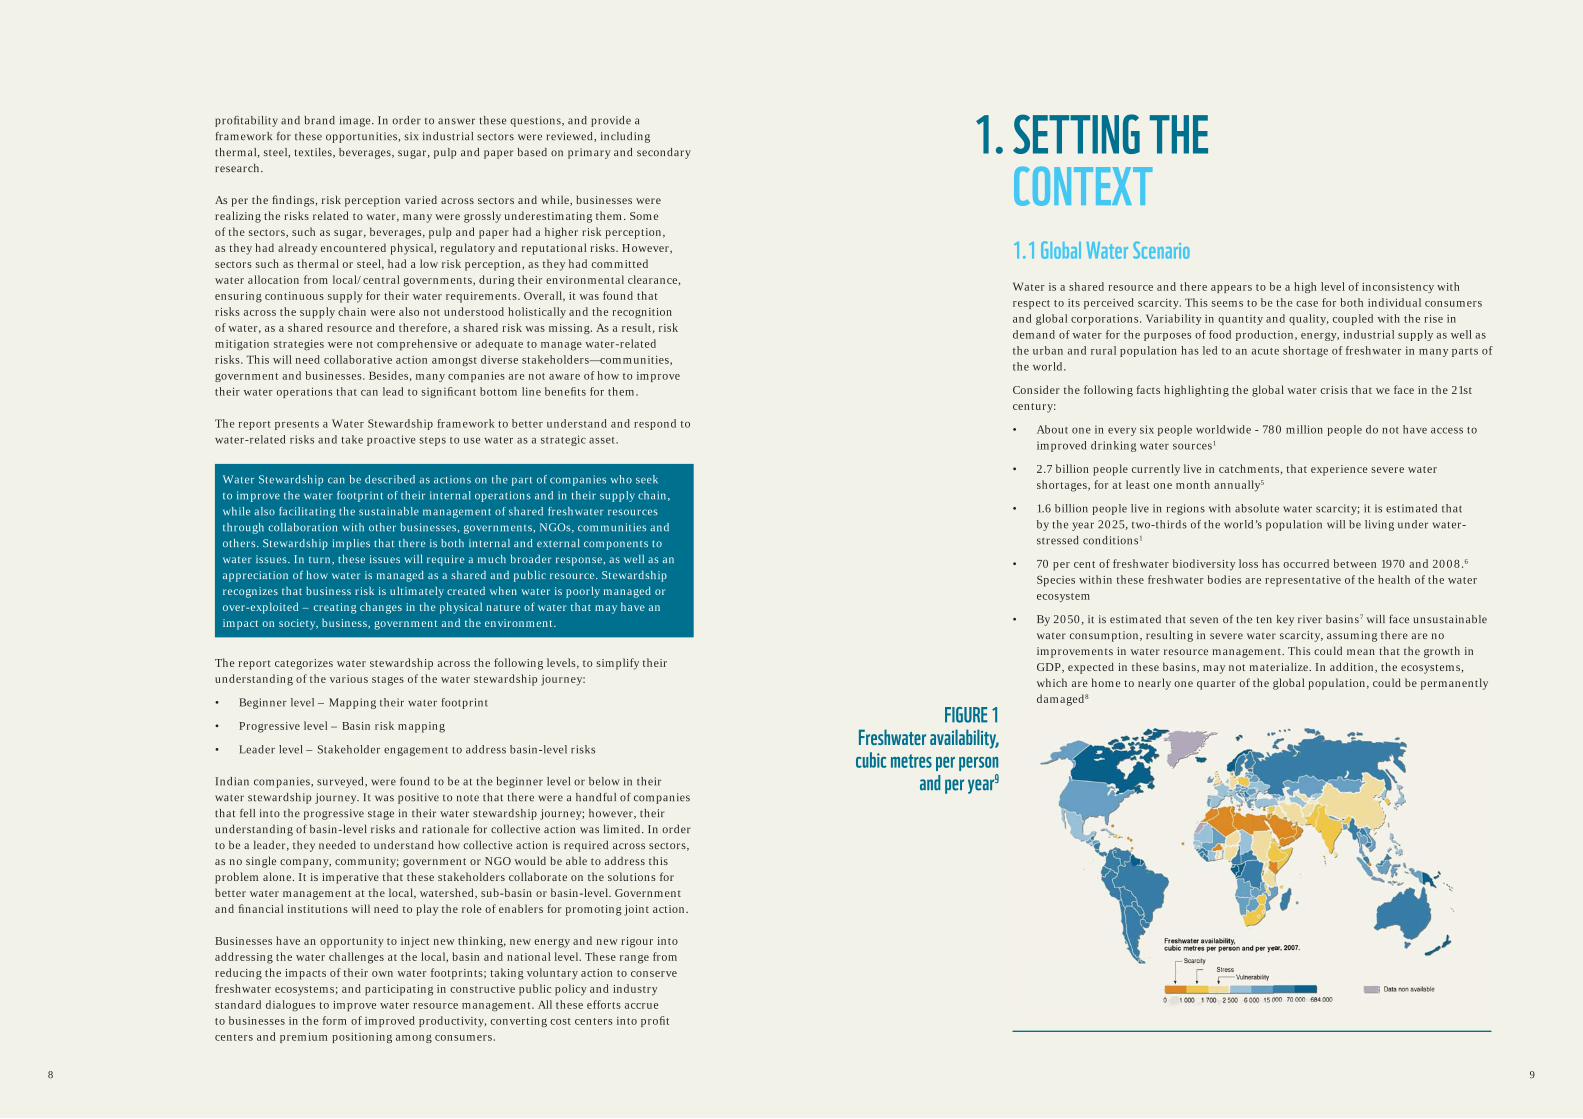
1.1 Global Water Scenario
Water is a shared resource and there appears to be a high level of inconsistency with respect to its perceived scarcity. This seems to be the case for both individual consumers and global corporations. Variability in quantity and quality, coupled with the rise in demand of water for the purposes of food production, energy, industrial supply as well as the urban and rural population has led to an acute shortage of freshwater in many parts of the world.
Consider the following facts highlighting the global water crisis that we face in the 21st century:
• About one in every six people worldwide - 780 million people do not have access to improved drinking water sources1
• 2.7 billion people currently live in catchments, that experience severe water shortages, for at least one month annually5
• 1.6 billion people live in regions with absolute water scarcity; it is estimated that by the year 2025, two-thirds of the world’s population will be living under water-stressed conditions1
• 70 per cent of freshwater biodiversity loss has occurred between 1970 and 2008.6 Species within these freshwater bodies are representative of the health of the water ecosystem
• By 2050, it is estimated that seven of the ten key river basins7 will face unsustainable water consumption, resulting in severe water scarcity, assuming there are no improvements in water resource management. This could mean that the growth in GDP, expected in these basins, may not materialize. In addition, the ecosystems, which are home to nearly one quarter of the global population, could be permanently damaged8
1. SETTING THE CONTEXT
FIGURE 1 Freshwater availability, cubic metres per person
and per year9
profi tability and brand image. In order to answer these questions, and provide a framework for these opportunities, six industrial sectors were reviewed, including thermal, steel, textiles, beverages, sugar, pulp and paper based on primary and secondary research.
As per the fi ndings, risk perception varied across sectors and while, businesses were realizing the risks related to water, many were grossly underestimating them. Some of the sectors, such as sugar, beverages, pulp and paper had a higher risk perception, as they had already encountered physical, regulatory and reputational risks. However, sectors such as thermal or steel, had a low risk perception, as they had committed water allocation from local/central governments, during their environmental clearance, ensuring continuous supply for their water requirements. Overall, it was found that risks across the supply chain were also not understood holistically and the recognition of water, as a shared resource and therefore, a shared risk was missing. As a result, risk mitigation strategies were not comprehensive or adequate to manage water-related risks. This will need collaborative action amongst diverse stakeholders—communities, government and businesses. Besides, many companies are not aware of how to improve their water operations that can lead to signifi cant bottom line benefi ts for them.
The report presents a Water Stewardship framework to better understand and respond to water-related risks and take proactive steps to use water as a strategic asset.
The report categorizes water stewardship across the following levels, to simplify their understanding of the various stages of the water stewardship journey:
• Beginner level – Mapping their water footprint
• Progressive level – Basin risk mapping
• Leader level – Stakeholder engagement to address basin-level risks
Indian companies, surveyed, were found to be at the beginner level or below in their water stewardship journey. It was positive to note that there were a handful of companies that fell into the progressive stage in their water stewardship journey; however, their understanding of basin-level risks and rationale for collective action was limited. In order to be a leader, they needed to understand how collective action is required across sectors, as no single company, community; government or NGO would be able to address this problem alone. It is imperative that these stakeholders collaborate on the solutions for better water management at the local, watershed, sub-basin or basin-level. Government and fi nancial institutions will need to play the role of enablers for promoting joint action.
Businesses have an opportunity to inject new thinking, new energy and new rigour into addressing the water challenges at the local, basin and national level. These range from reducing the impacts of their own water footprints; taking voluntary action to conserve freshwater ecosystems; and participating in constructive public policy and industry standard dialogues to improve water resource management. All these efforts accrue to businesses in the form of improved productivity, converting cost centers into profi t centers and premium positioning among consumers.
Water Stewardship can be described as actions on the part of companies who seek to improve the water footprint of their internal operations and in their supply chain, while also facilitating the sustainable management of shared freshwater resources through collaboration with other businesses, governments, NGOs, communities and others. Stewardship implies that there is both internal and external components to water issues. In turn, these issues will require a much broader response, as well as an appreciation of how water is managed as a shared and public resource. Stewardship recognizes that business risk is ultimately created when water is poorly managed or over-exploited – creating changes in the physical nature of water that may have an impact on society, business, government and the environment.
10 1110 11
1.2 India’s Water Scenario
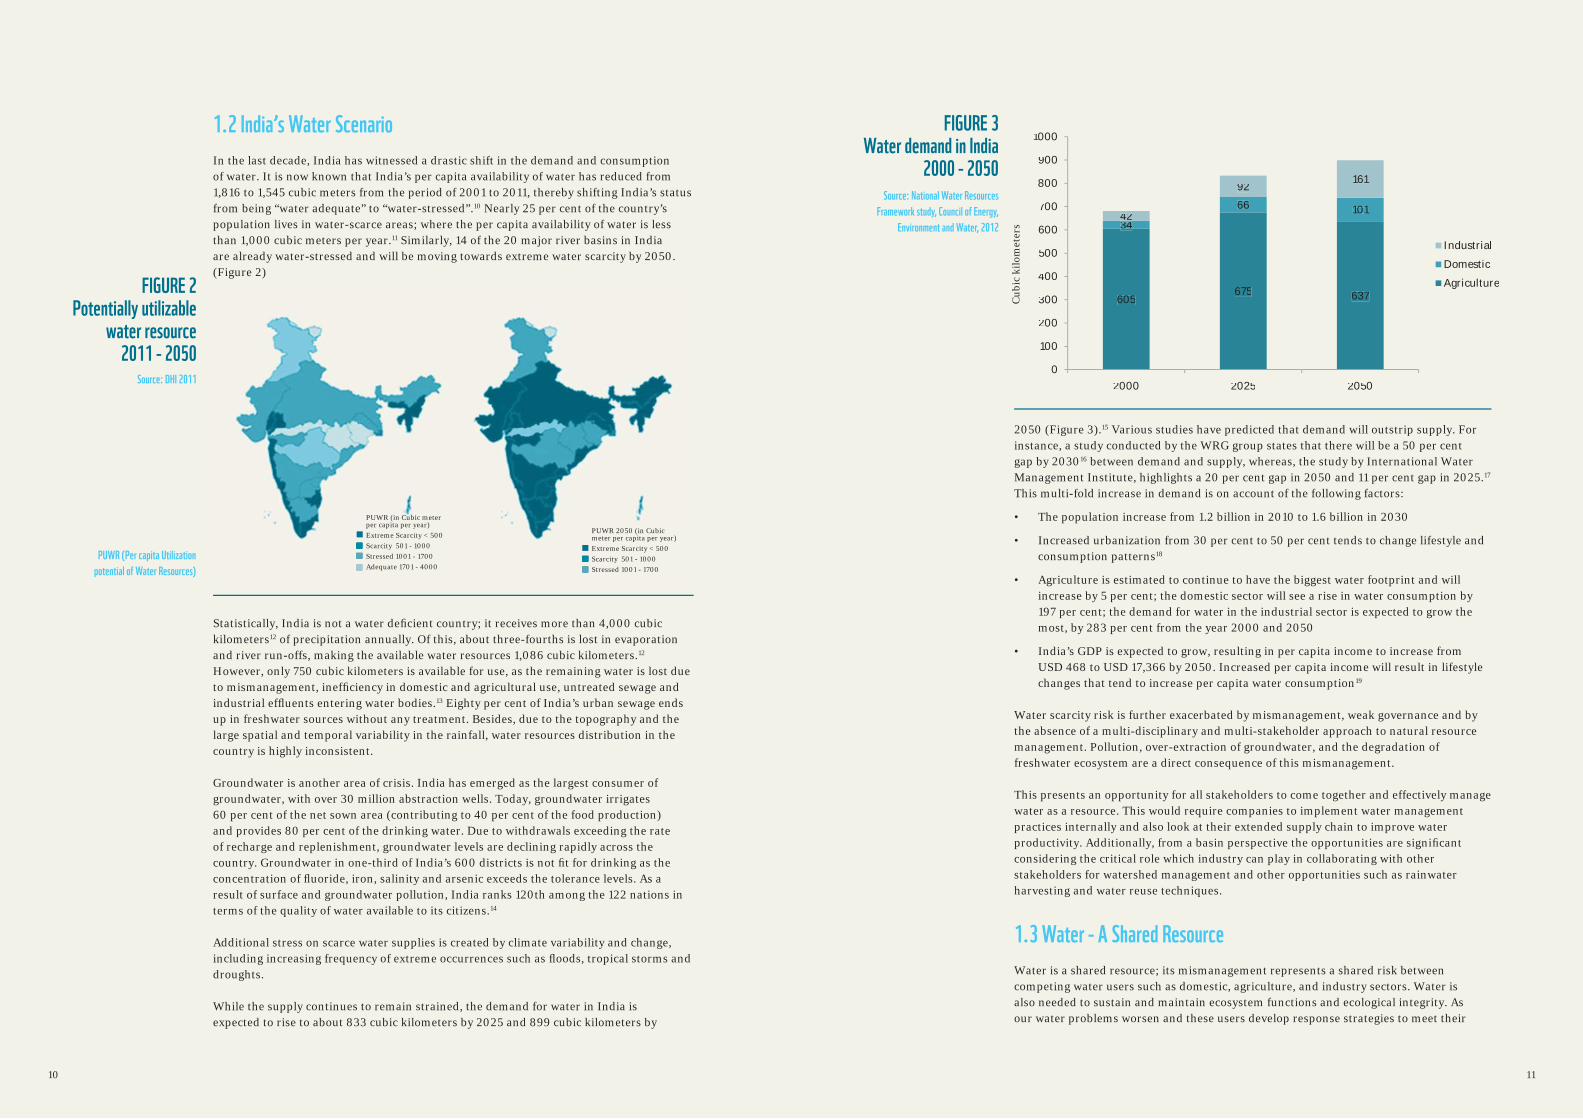
In the last decade, India has witnessed a drastic shift in the demand and consumption of water. It is now known that India’s per capita availability of water has reduced from 1,816 to 1,545 cubic meters from the period of 2001 to 2011, thereby shifting India’s status from being “water adequate” to “water-stressed”.10 Nearly 25 per cent of the country’s population lives in water-scarce areas; where the per capita availability of water is less than 1,000 cubic meters per year.11 Similarly, 14 of the 20 major river basins in India are already water-stressed and will be moving towards extreme water scarcity by 2050. (Figure 2)
Statistically, India is not a water defi cient country; it receives more than 4,000 cubic kilometers12 of precipitation annually. Of this, about three-fourths is lost in evaporation and river run-offs, making the available water resources 1,086 cubic kilometers.12 However, only 750 cubic kilometers is available for use, as the remaining water is lost due to mismanagement, ineffi ciency in domestic and agricultural use, untreated sewage and industrial effl uents entering water bodies.13 Eighty per cent of India’s urban sewage ends up in freshwater sources without any treatment. Besides, due to the topography and the large spatial and temporal variability in the rainfall, water resources distribution in the country is highly inconsistent.
Groundwater is another area of crisis. India has emerged as the largest consumer of groundwater, with over 30 million abstraction wells. Today, groundwater irrigates 60 per cent of the net sown area (contributing to 40 per cent of the food production) and provides 80 per cent of the drinking water. Due to withdrawals exceeding the rate of recharge and replenishment, groundwater levels are declining rapidly across the country. Groundwater in one-third of India’s 600 districts is not fi t for drinking as the concentration of fl uoride, iron, salinity and arsenic exceeds the tolerance levels. As a result of surface and groundwater pollution, India ranks 120th among the 122 nations in terms of the quality of water available to its citizens.14
Additional stress on scarce water supplies is created by climate variability and change, including increasing frequency of extreme occurrences such as fl oods, tropical storms and droughts.
While the supply continues to remain strained, the demand for water in India is expected to rise to about 833 cubic kilometers by 2025 and 899 cubic kilometers by
FIGURE 2Potentially utilizable
water resource 2011 - 2050
Source: DHI 2011
2050 (Figure 3).15 Various studies have predicted that demand will outstrip supply. For instance, a study conducted by the WRG group states that there will be a 50 per cent gap by 203016 between demand and supply, whereas, the study by International Water Management Institute, highlights a 20 per cent gap in 2050 and 11 per cent gap in 2025.17 This multi-fold increase in demand is on account of the following factors:
• The population increase from 1.2 billion in 2010 to 1.6 billion in 2030
• Increased urbanization from 30 per cent to 50 per cent tends to change lifestyle and consumption patterns18
• Agriculture is estimated to continue to have the biggest water footprint and will increase by 5 per cent; the domestic sector will see a rise in water consumption by 197 per cent; the demand for water in the industrial sector is expected to grow the most, by 283 per cent from the year 2000 and 2050
• India’s GDP is expected to grow, resulting in per capita income to increase from USD 468 to USD 17,366 by 2050. Increased per capita income will result in lifestyle changes that tend to increase per capita water consumption19
Water scarcity risk is further exacerbated by mismanagement, weak governance and by the absence of a multi-disciplinary and multi-stakeholder approach to natural resource management. Pollution, over-extraction of groundwater, and the degradation of freshwater ecosystem are a direct consequence of this mismanagement.
This presents an opportunity for all stakeholders to come together and effectively manage water as a resource. This would require companies to implement water management practices internally and also look at their extended supply chain to improve water productivity. Additionally, from a basin perspective the opportunities are signifi cant considering the critical role which industry can play in collaborating with other stakeholders for watershed management and other opportunities such as rainwater harvesting and water reuse techniques.
1.3 Water - A Shared Resource
Water is a shared resource; its mismanagement represents a shared risk between competing water users such as domestic, agriculture, and industry sectors. Water is also needed to sustain and maintain ecosystem functions and ecological integrity. As our water problems worsen and these users develop response strategies to meet their
605675 637
3434
66 101442
92161
0
100
200
300
400
500
600
700
800
900
1000
2000 2025 2050
Industrial
Domestic
Agriculture
FIGURE 3Water demand in India
2000 - 2050
Source: National Water Resources
Framework study, Council of Energy,
Environment and Water, 2012
Cub
ic k
ilom
eter
s
PUWR (Per capita Utilization
potential of Water Resources)
PUWR (in Cubic meter per capita per year)Extreme Scarcity < 500Scarcity 501 - 1000Stressed 1001 - 1700Adequate 1701 - 4000
PUWR 2050 (in Cubic meter per capita per year)Extreme Scarcity < 500Scarcity 501 - 1000Stressed 1001 - 1700
12 1312 13
increasing demand, they will face challenging trade-offs between each other, related to health, food security, energy, industry, biodiversity, energy and climate change.
These sectors compete with each other with other infl uencing factors that complicate their shared risk. From a governance perspective, it provides licenses or designates allocations for abstraction of water across these sectors. In times of drought, the priority shifts to water for domestic use, followed by agriculture and then industry. Industry is given the last priority, while ecology and environment remain entirely ignored. On the one hand, this scenario increases the business risk to companies operating in water-scarce and water-stressed areas, e.g. refer to section 2.1 for Carlsberg Brewery case, while on the other it increases the vulnerability of ecosystems and people who are dependent on the watershed or basin. Water crisis is already putting severe pressure, not just across sectors, but also across regions/countries; e.g. water allocation across the states of Tamil Nadu and Karnataka over Cauvery or between Bangladesh and India over Brahmaputra.20
As detailed previously, the water crisis will worsen and shared water risks will become more evident in the days to come. While water for domestic, agricultural and industrial use is clearly designated, water for ecology is not formally allocated as yet. However, this scenario is likely to change, as there is growing recognition regarding the importance of reserving water for ecology and such an allocation will aggravate the competition. It is therefore imperative for all these sectors to recognize each other and also to understand that the only way they will fi nd meaningful solutions, would be through collaboration. By stimulating a shared response these sectors can help appreciate the shared value of water and promote its sustainable management.
2.1 Water Risks to Indian Industry
Industrial sector will record the fastest growth in water consumption
Agriculture will continue to have the largest water footprint and the industrial demand for water is expected to increase by four-fold in the year 2050. The industrial water demand is not only limited to direct water withdrawal for operational purposes at the facility level, but also spreads across watershed, sub–basin and basin-level. This implies that many industries rely heavily on the agricultural sector for their raw material inputs, as part of their supply chain; for example, sugarcane for the sugar/beverage industry or cotton for the textiles industry. Therefore, it is critical to understand the inter-connectedness of this shared resource.
In addition to water consumption, industrial water use is one of the main causes of water pollution today. 70 per cent of all industrial waste is dumped untreated into water bodies,25 resulting in water quality degradation. These effl uents from industrial plants are toxic and harmful to people and environment.
Water has become an emerging risk for many businesses
Industries require water that is reliable, accessible, and of acceptable quality, for its operations. Water scarcity and deteriorating quality, both pose signifi cant risks for companies. These emerging risks can be in the form of physical, regulatory and reputational risks that have been explained below. These will be discussed in more detail in the next few sections of the report.
Physical risks tend to be those that businesses face, as a result of their direct operations and use of water in their manufacturing or processing. Reduced quantity and quality of water can result in operational issues, low productivity, and increased cost of operations. These risks can also arise from disruptions in availability and the price of water-intensive raw materials in the supply chain. These risks are aggravated by weak water governance and institutional architecture that exist in the country.
Regulatory risks refer to government action (policies, laws, regulation) that address issues related to siting of industries, water use and effl uent discharge. These can potentially affect pricing, supply, rights, standards and license to operate, both at the individual plant level or at the sector level.
2. UNDERSTANDING RISKS TO INDIAN INDUSTRY
• In January 2013, water supply to the Carlsberg brewery in Aurangabad had to be cut off on account of the Maharashtra government’s directive to stop supply of water to breweries and distilleries in Marathwada region, following the extraordinary drought situation prevailing in the area21
• In December 2012, the Uttar Pradesh State Excise Department, following the Uttar Pradesh Pollution Control Board’s directives, had instructed seven distilleries of the state to stop production with immediate effect, in view of the MahaKumbh and with an aim of controlling the pollution caused by effl uents in the Ganga and its tributaries. In addition, four other distilleries were instructed to cut production by 50 per cent22
• In April 2012, water shortage forced Mangalore Refi nery and Petrochemicals Limited (MRPL) to shut down two of its units for 45 days23
• In 2004, civil society campaigns and government action led to the closure of the Coca-Cola plant in Plachimada, Kerala. This was following allegations that the company had excessively pumped out the groundwater in the area24
Some examples of impact of water crisis on businesses
Women struggling to get drinking water in Kundanpur
© C
SE
EN
VIR
ON
ME
NT
PH
OTO
LIB
RA
RY
14 1514 15
Reputational risks tend to damage brand equity and reputation of a company, when the actions of a company are poorly executed, understood or communicated with local stakeholders or when perceptions around water use, pollution and behaviour suffer. These can result in stakeholder unrests, confl icts, lawsuits, media scrutiny or stringent regulatory action. This also affects future business development as well as shareholder value.
Businesses have a shared risk across the basin
The availability and management impacts of water are very local and manifest themselves at the watershed, sub–basin and basin-levels. It also leads to company-related risks which are location and sector-specifi c.
There are likely to be considerable asymmetries in exposure and vulnerability between various stakeholders when it comes to water as a resource. Hence, there is a need to understand physical, regulatory and reputational risks in the context of their shared risk across a basin. Figure 4 details out basin and company-related risks.
• The industry sector has always shared water risks with communities, government, and the environment, but in the past the imperatives to act on these, and the means through which such actions were taken, have differed from those emerging in today’s highly globalized and increasingly water-stressed world.
• Businesses need to understand that they are not operating in isolation; they are operating in the context of a watershed or a basin and therefore have a shared risk.
These risks are multi-fold, and are not evenly shared, bringing out the underlying need for a paradigm shift in water governance in India.
• Many of the physical, reputational and regulatory risks come from this concept of shared risk. This concept is being used to bring water users together to understand these risks collectively and to proactively work together in order to address them at the local or basin-level.
• No amount of individual action to increase effi ciency or better management of water at the facility level will insulate businesses from water risks that are outside their fence.
There is high risk to the industry in view of the limited availability of freshwater, however, the implementation of water management strategies gives industry an opportunity to contribute towards watershed sustainability and bottom line benefi ts.
These concepts will be discussed in further detail later in this report. In order to understand these ideas in the Indian context, the next section provides an analysis of key industrial sectors in India, based on their water use. The following section provides an overview of the challenges these industries are facing and their perceptions regarding current and future risks.
2.2 Water Risk Analysis and Methodology
In order to lay the foundation of the concept of shared risk in the Indian context, a macro level analysis was undertaken across key water-dependent sectors, based on their water use and impacts and also to understand how they were responding to these risks. The two parameters used to identify these sectors were water usage (in direct operation and supply chain) and water pollution. On further analysis, there appeared to be reasonable information, regarding water usage in direct operations. However, data for pollution and water use in the supply chain was inadequate at the sectoral level to run the analysis. It was therefore decided to select the target sectors based solely on their water usage. Figure 5 illustrates high water-intensive sectors, based on their relative water use.
For the purpose of the study, initially all the top six sectors were taken into consideration for a detailed analysis. While the thermal power sector appears to have the highest water usage, not all of it is for consumptive use. It is mostly for cooling towers and then released into the water bodies, primarily resulting in pollution. On the other hand, other industries may appear to use less water; however, their consumptive water use might be high resulting in higher pollution. Also, among these sectors, it was found
Water quantity (scarcity, flooding, droughts) and quality (pollution) within the river basin and the impacts this might have been on society and the environment
Linked to the location of the company
Water quantity and quality issue related to the performance of the company and its supply chain
The potential for changes in pricing, supply, rights, standards and license to operate for a particular company or sector
When the actions of the company are poorly executed, understood or communicated with local stakeholders and where perceptions and brand suffer as a consequence
Strength and enforcement of water regulations and the consequences of restrictions by public institutions. Either felt through direct regulatory action or from neglect, blockage or failure
Perceptions around water use, pollution and behaviour that may have negative impacts in the company brand and influence purchasing decisions. Public perceptions can emerge rapidly when local aquatic systems and community access to water are affected
Physical Risk
Basin related risk:
Linked to the behaviour of the
company
Company related risk:
Regulatory Risk Reputational Risk
Note: This data does not account for water in the supply chain and the
pollution caused by industry. Also, water in thermal plants is largely not for consumptive use, unlike other sectors mentioned.
2.265.05
87.87
100
Total Thermal Power Plants
Pulp & Paper Textiles Steel Sugar OtherEngineering
2.07 1.29 0.49 0.97
FIGURE 4 is based on the Water Risk Filter developed
by WWF and DEG
FIGURE 5Water use by diff erent
sectors in India26
16 1716 17
that engineering as a sector itself, comprises of twenty different industry groups such as ferrous castings, oil fi eld equipment industry, steel forgings, etc. with varying water consumption patterns.27 In order to analyze this sector, it is important to examine the water usage and the challenges related to these sub-sectors as well, all of which, are not necessarily consistent across the board. As a result, engineering was not considered in the fi nal shortlist. In addition, it was decided to include the beverage sector in the analysis, especially given its exposure to physical, regulatory and reputational risks. The following is a list of the shortlisted sectors for the purpose of this study.
• Thermal Power
• Pulp and Paper
• Textiles
• Steel
• Sugar
• Beverages
After shortlisting the sectors, a detailed analysis of each of these sectors was undertaken in section 2.3. This included both secondary research as well as industry interviews within each of these sectors, in order to fully understand their current operations, perception of risk and the actions that these industries were undertaking to mitigate these risks. The analysis was conducted based on physical, regulatory and reputational risks of these sectors, in the context of their operations, and their extended supply chains across the basin.
2.3 Sectoral Analysis
2.3.1 Thermal Power Plants
Given current levels of water supply to industry, by 2050, the thermal power sector’s demand for water will exceed the industry’s supply by 17 per cent
Sixty seven per cent of India’s energy comes from thermal power plants. Of the thermal power generated, 57 per cent is from coal-based plants.28
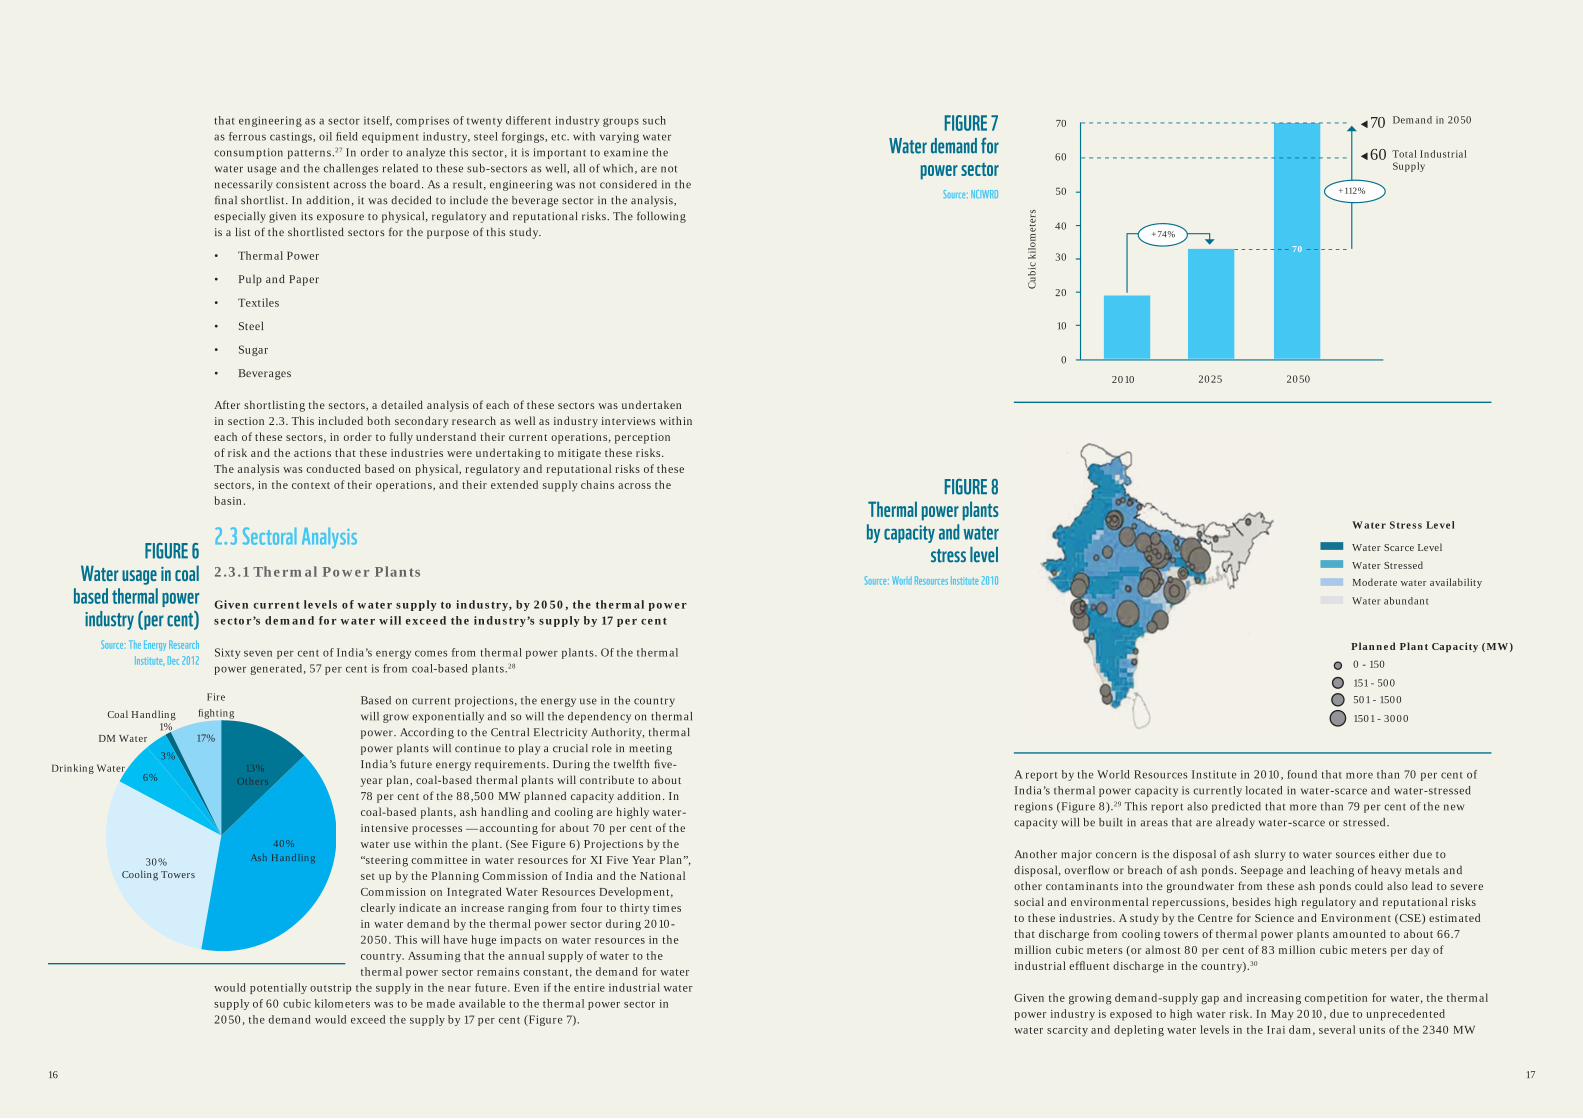
Based on current projections, the energy use in the country will grow exponentially and so will the dependency on thermal power. According to the Central Electricity Authority, thermal power plants will continue to play a crucial role in meeting India’s future energy requirements. During the twelfth fi ve-year plan, coal-based thermal plants will contribute to about 78 per cent of the 88,500 MW planned capacity addition. In coal-based plants, ash handling and cooling are highly water-intensive processes — accounting for about 70 per cent of the water use within the plant. (See Figure 6) Projections by the “steering committee in water resources for XI Five Year Plan”, set up by the Planning Commission of India and the National Commission on Integrated Water Resources Development, clearly indicate an increase ranging from four to thirty times in water demand by the thermal power sector during 2010-2050. This will have huge impacts on water resources in the country. Assuming that the annual supply of water to the thermal power sector remains constant, the demand for water
would potentially outstrip the supply in the near future. Even if the entire industrial water supply of 60 cubic kilometers was to be made available to the thermal power sector in 2050, the demand would exceed the supply by 17 per cent (Figure 7).
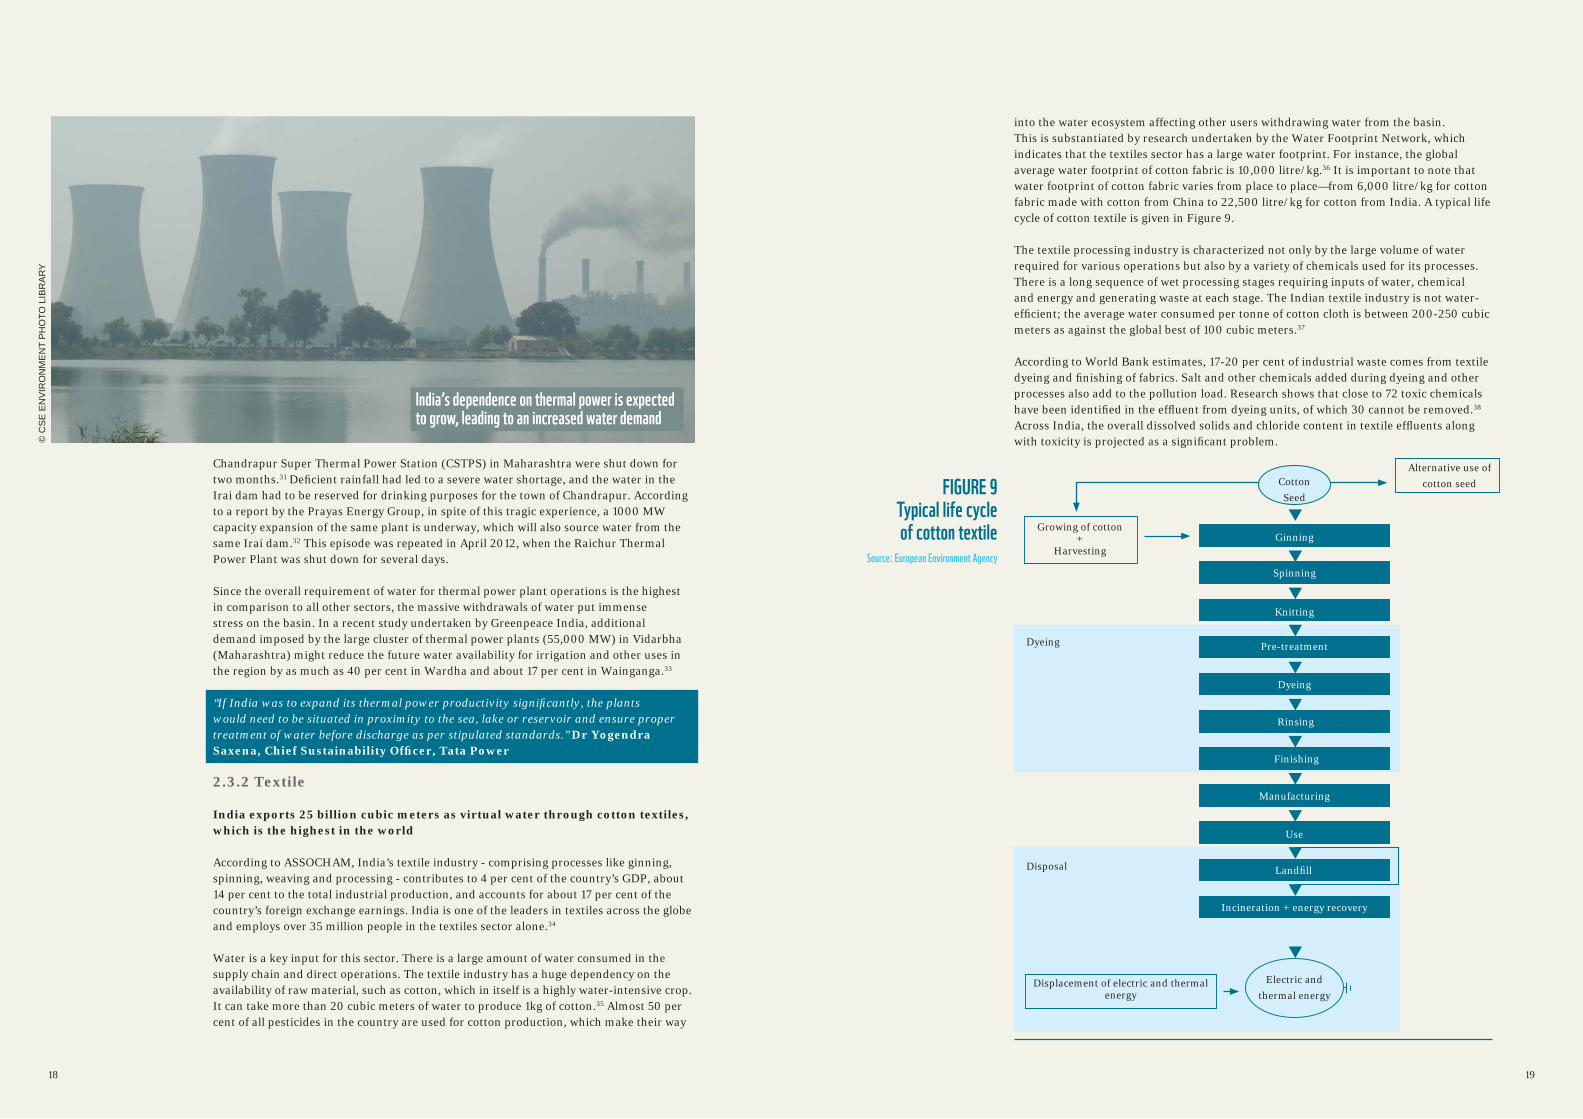
A report by the World Resources Institute in 2010, found that more than 70 per cent of India’s thermal power capacity is currently located in water-scarce and water-stressed regions (Figure 8).29 This report also predicted that more than 79 per cent of the new capacity will be built in areas that are already water-scarce or stressed.
Another major concern is the disposal of ash slurry to water sources either due to disposal, overfl ow or breach of ash ponds. Seepage and leaching of heavy metals and other contaminants into the groundwater from these ash ponds could also lead to severe social and environmental repercussions, besides high regulatory and reputational risks to these industries. A study by the Centre for Science and Environment (CSE) estimated that discharge from cooling towers of thermal power plants amounted to about 66.7 million cubic meters (or almost 80 per cent of 83 million cubic meters per day of industrial effl uent discharge in the country).30
Given the growing demand-supply gap and increasing competition for water, the thermal power industry is exposed to high water risk. In May 2010, due to unprecedented water scarcity and depleting water levels in the Irai dam, several units of the 2340 MW
Ash Handling
Cooling Towers
Drinking Water
DM Water
Coal Handling
Others
Fire fi ghting
40%
13%
17%1%
3%
6%
30%
FIGURE 6Water usage in coal
based thermal power industry (per cent)
Source: The Energy Research
Institute, Dec 2012
FIGURE 7Water demand for
power sector Source: NCIWRD
FIGURE 8 Thermal power plants by capacity and water
stress level Source: World Resources Institute 2010
Demand in 205070
60 Total Industrial Supply
+112%
+74%
70
60
2010 2025 2050
70
50
40
30
20
10
0
Water Scarce Level
0 - 150
151 - 500
501 - 1500
1501 - 3000
Water Stress Level
Planned Plant Capacity (MW)
Water Stressed
Water abundant
Moderate water availability
Cub
ic k
ilom
eter
s
18 1918 19
Chandrapur Super Thermal Power Station (CSTPS) in Maharashtra were shut down for two months.31 Defi cient rainfall had led to a severe water shortage, and the water in the Irai dam had to be reserved for drinking purposes for the town of Chandrapur. According to a report by the Prayas Energy Group, in spite of this tragic experience, a 1000 MW capacity expansion of the same plant is underway, which will also source water from the same Irai dam.32 This episode was repeated in April 2012, when the Raichur Thermal Power Plant was shut down for several days.
Since the overall requirement of water for thermal power plant operations is the highest in comparison to all other sectors, the massive withdrawals of water put immense stress on the basin. In a recent study undertaken by Greenpeace India, additional demand imposed by the large cluster of thermal power plants (55,000 MW) in Vidarbha (Maharashtra) might reduce the future water availability for irrigation and other uses in the region by as much as 40 per cent in Wardha and about 17 per cent in Wainganga.33
“If India was to expand its thermal power productivity signifi cantly, the plants would need to be situated in proximity to the sea, lake or reservoir and ensure proper treatment of water before discharge as per stipulated standards.” Dr Yogendra Saxena, Chief Sustainability Offi cer, Tata Power
2.3.2 Textile
India exports 25 billion cubic meters as virtual water through cotton textiles, which is the highest in the world
According to ASSOCHAM, India’s textile industry - comprising processes like ginning, spinning, weaving and processing - contributes to 4 per cent of the country’s GDP, about 14 per cent to the total industrial production, and accounts for about 17 per cent of the country’s foreign exchange earnings. India is one of the leaders in textiles across the globe and employs over 35 million people in the textiles sector alone.34
Water is a key input for this sector. There is a large amount of water consumed in the supply chain and direct operations. The textile industry has a huge dependency on the availability of raw material, such as cotton, which in itself is a highly water-intensive crop. It can take more than 20 cubic meters of water to produce 1kg of cotton.35 Almost 50 per cent of all pesticides in the country are used for cotton production, which make their way
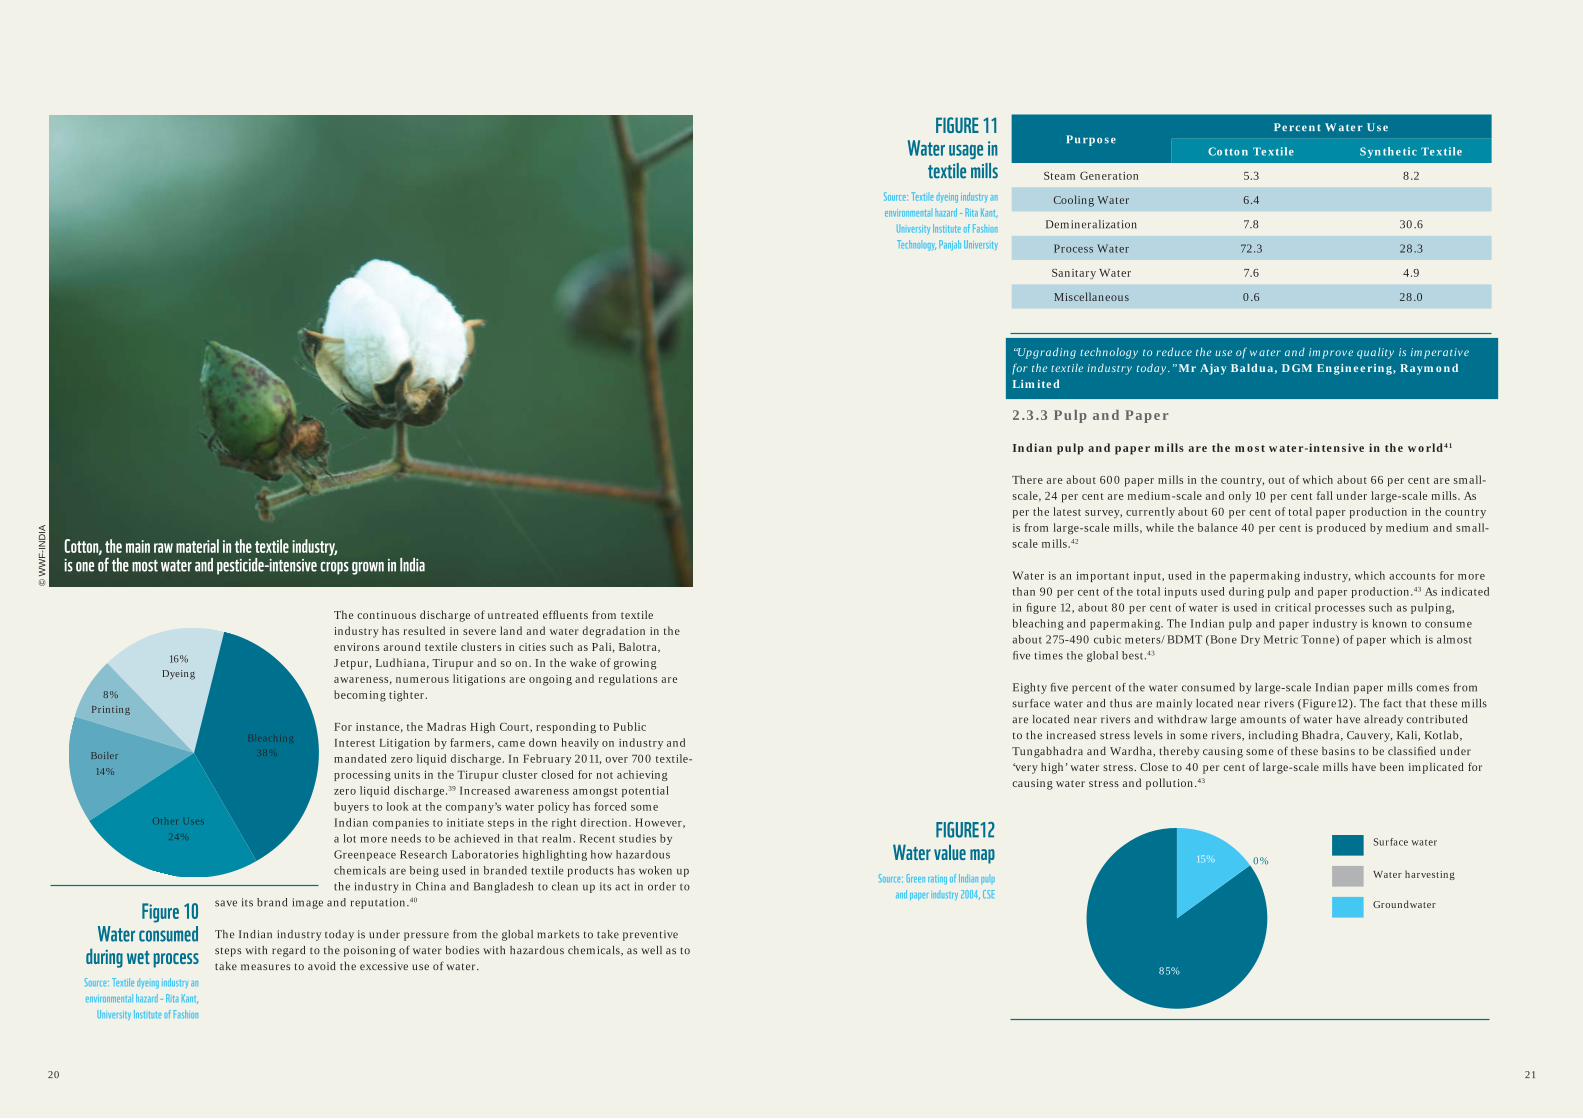
into the water ecosystem affecting other users withdrawing water from the basin.This is substantiated by research undertaken by the Water Footprint Network, which indicates that the textiles sector has a large water footprint. For instance, the global average water footprint of cotton fabric is 10,000 litre/kg.36 It is important to note that water footprint of cotton fabric varies from place to place—from 6,000 litre/kg for cotton fabric made with cotton from China to 22,500 litre/kg for cotton from India. A typical life cycle of cotton textile is given in Figure 9.
The textile processing industry is characterized not only by the large volume of water required for various operations but also by a variety of chemicals used for its processes. There is a long sequence of wet processing stages requiring inputs of water, chemical and energy and generating waste at each stage. The Indian textile industry is not water-effi cient; the average water consumed per tonne of cotton cloth is between 200-250 cubic meters as against the global best of 100 cubic meters.37
According to World Bank estimates, 17-20 per cent of industrial waste comes from textile dyeing and fi nishing of fabrics. Salt and other chemicals added during dyeing and other processes also add to the pollution load. Research shows that close to 72 toxic chemicals have been identifi ed in the effl uent from dyeing units, of which 30 cannot be removed.38 Across India, the overall dissolved solids and chloride content in textile effl uents along with toxicity is projected as a signifi cant problem.
Electric and thermal energy
Displacement of electric and thermal energy
Disposal
Dyeing
Growing of cotton+
Harvesting
Alternative use of cotton seedFIGURE 9
Typical life cycle of cotton textile
Source: European Environment Agency
Cotton Seed
Ginning
Spinning
Knitting
Pre-treatment
Dyeing
Rinsing
Finishing
Manufacturing
Incineration + energy recovery
Use
Landfi ll
© C
SE
EN
VIR
ON
ME
NT
PH
OTO
LIB
RA
RY
India’s dependence on thermal power is expected to grow, leading to an increased water demand
20 2120 21
The continuous discharge of untreated effl uents from textile industry has resulted in severe land and water degradation in the environs around textile clusters in cities such as Pali, Balotra, Jetpur, Ludhiana, Tirupur and so on. In the wake of growing awareness, numerous litigations are ongoing and regulations are becoming tighter.
For instance, the Madras High Court, responding to Public Interest Litigation by farmers, came down heavily on industry and mandated zero liquid discharge. In February 2011, over 700 textile-processing units in the Tirupur cluster closed for not achieving zero liquid discharge.39 Increased awareness amongst potential buyers to look at the company’s water policy has forced some Indian companies to initiate steps in the right direction. However, a lot more needs to be achieved in that realm. Recent studies by Greenpeace Research Laboratories highlighting how hazardous chemicals are being used in branded textile products has woken up the industry in China and Bangladesh to clean up its act in order to
save its brand image and reputation.40
The Indian industry today is under pressure from the global markets to take preventive steps with regard to the poisoning of water bodies with hazardous chemicals, as well as to take measures to avoid the excessive use of water.
“Upgrading technology to reduce the use of water and improve quality is imperative for the textile industry today.” Mr Ajay Baldua, DGM Engineering, Raymond Limited
2.3.3 Pulp and Paper
Indian pulp and paper mills are the most water-intensive in the world41
There are about 600 paper mills in the country, out of which about 66 per cent are small-scale, 24 per cent are medium-scale and only 10 per cent fall under large-scale mills. As per the latest survey, currently about 60 per cent of total paper production in the country is from large-scale mills, while the balance 40 per cent is produced by medium and small-scale mills.42
Water is an important input, used in the papermaking industry, which accounts for more than 90 per cent of the total inputs used during pulp and paper production.43 As indicated in fi gure 12, about 80 per cent of water is used in critical processes such as pulping, bleaching and papermaking. The Indian pulp and paper industry is known to consume about 275-490 cubic meters/BDMT (Bone Dry Metric Tonne) of paper which is almost fi ve times the global best.43
Eighty fi ve percent of the water consumed by large-scale Indian paper mills comes from surface water and thus are mainly located near rivers (Figure12). The fact that these mills are located near rivers and withdraw large amounts of water have already contributed to the increased stress levels in some rivers, including Bhadra, Cauvery, Kali, Kotlab, Tungabhadra and Wardha, thereby causing some of these basins to be classifi ed under ‘very high’ water stress. Close to 40 per cent of large-scale mills have been implicated for causing water stress and pollution.43
Bleaching
Dyeing
Printing
Other Uses
Boiler 38%
24%
14%
16%
8%
Figure 10Water consumed
during wet processSource: Textile dyeing industry an
environmental hazard – Rita Kant,
University Institute of Fashion
FIGURE 11Water usage in
textile millsSource: Textile dyeing industry an
environmental hazard – Rita Kant,
University Institute of Fashion
Technology, Panjab University
PurposePercent Water Use
Cotton Textile Synthetic Textile
Steam Generation 5.3 8.2
Cooling Water 6.4
Demineralization 7.8 30.6
Process Water 72.3 28.3
Sanitary Water 7.6 4.9
Miscellaneous 0.6 28.0
FIGURE12Water value map
Source: Green rating of Indian pulp
and paper industry 2004, CSEGroundwater
Water harvesting
Surface water
85%
15% 0%
© W
WF-
IND
IA
Cotton, the main raw material in the textile industry, is one of the most water and pesticide-intensive crops grown in India
22 2322 23
The wastewater discharged by the Indian pulp and paper industry ranges from 118 cubic meters to 280 cubic meters/BDMT, which is approximately three times more than the European paper and pulp industry.43 The common pollutants from a pulp and paper mill are organic matter characterized by biochemical oxygen demand (BOD) and chemical oxygen demand (COD), total suspended solids (TSS), chlorinated organics measured as Adsorbable Organo-halogens-(AOX), toxic mater and colour. While some large-scale Indian paper mills have achieved the global best levels in terms of water pollutant reduction, on an average the BOD, COD, TSS and AOX levels are 9.3 times, 4.5 times, 15 times and 4.8 times respectively higher than the best practices followed.43
Regulatory interventions have also gained prominence with strict measures being taken against the industry. Taking serious note of the growing degradation of the Elenga Beel – a major water body in the Morigaon district of Assam – caused by Nagaon Paper Mill of Hindustan Paper Corporation (HPC) at Jagiroad, the Pollution Control Board Assam (PCBA) issued a pre-closure notice to HPC for closing the polluting unit of the paper mill.44
Effl uents released into freshwater sources reduce the concentration of dissolved oxygen and increase the toxicity of the receiving water, which affects the overall ecosystem, especially the aquatic life. This has led to a lot of confl icts with the local communities, such as people living in peripheral villages of Sewa Paper Mill and, Gangapur, threatening to close the mill as the unit was releasing toxic water into their areas.45
“The primary focus of all stakeholders should be to create storage mechanism at the basin-level as prevention against shared risks.” Mr K. Nagahari, Unit Head, ITC-PSPD, Bhadrachalam
2.3.4 Sugar
Sugar mills can meet all their operational demand, if they channelize the moisture content in sugarcane.
India accounts for 22 per cent of the global production and 25 per cent of the area under sugarcane cultivation in 2010.46
Sugarcane is primarily grown in nine states of India – Andhra Pradesh, Bihar, Gujarat, Haryana, Karnataka, Maharashtra, Punjab, Uttar Pradesh and Tamil Nadu. This sector
caters to an estimated 12 per cent of the rural population in these states through direct and indirect employment. Additionally, more than 50 million farmers are dependent on sugarcane for their livelihood.
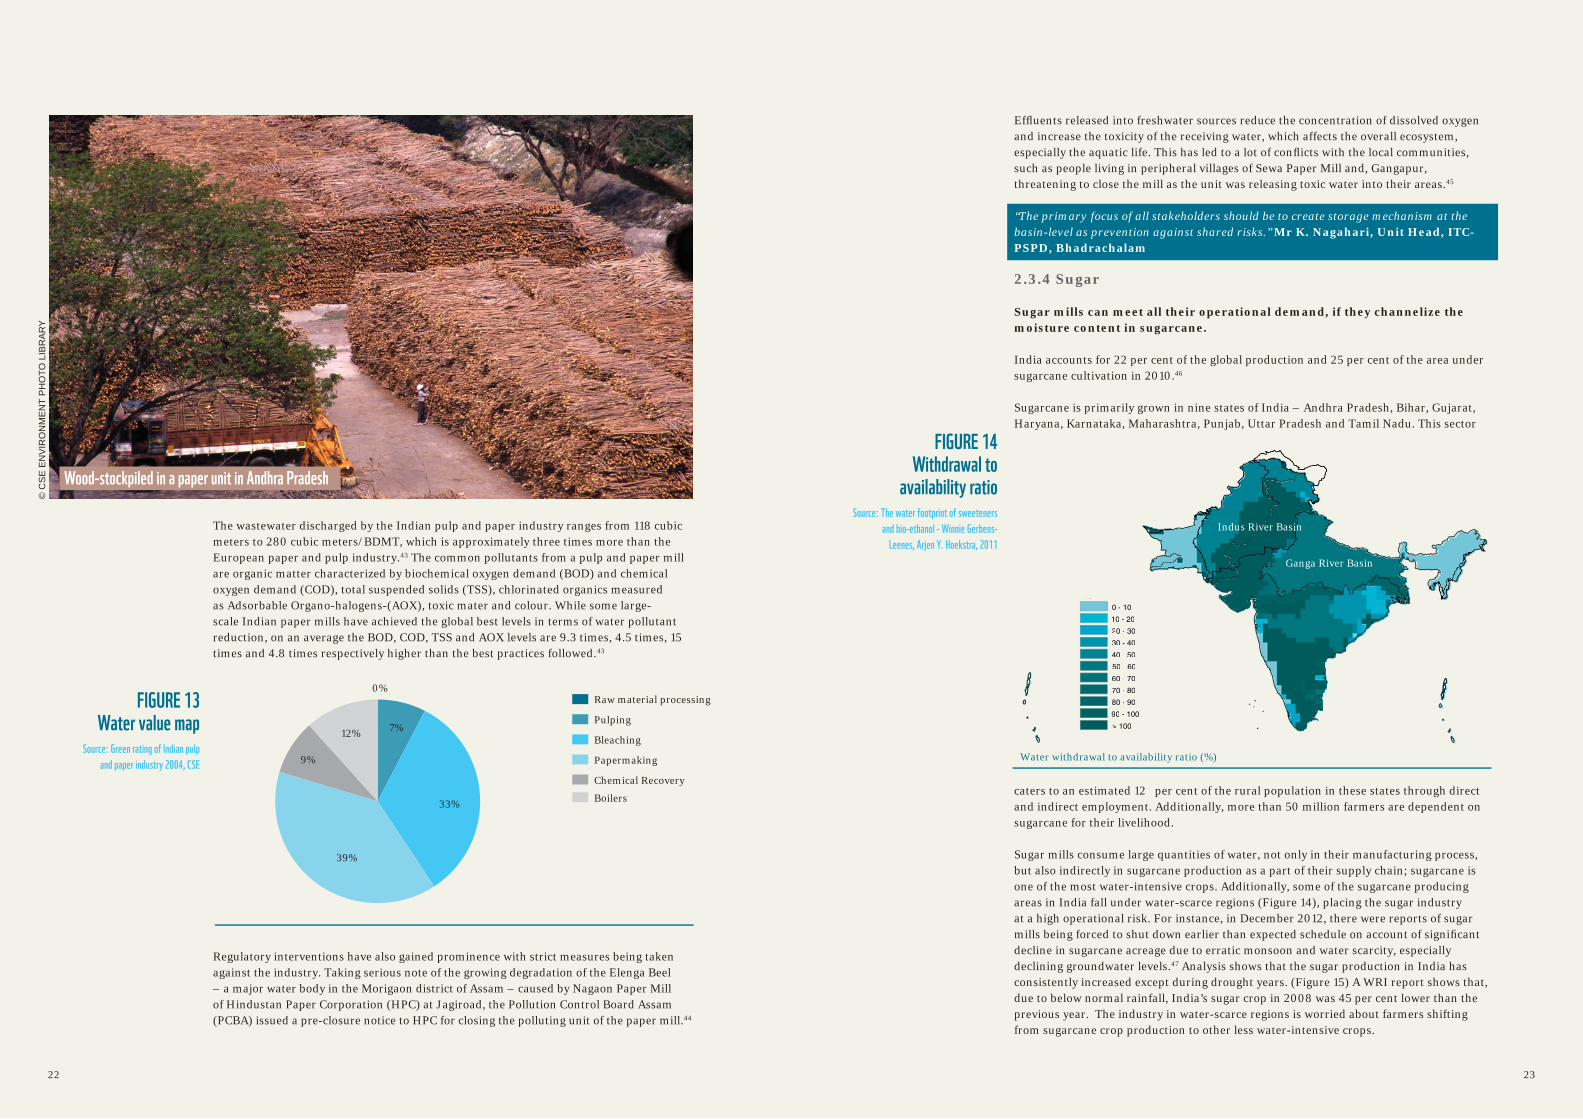
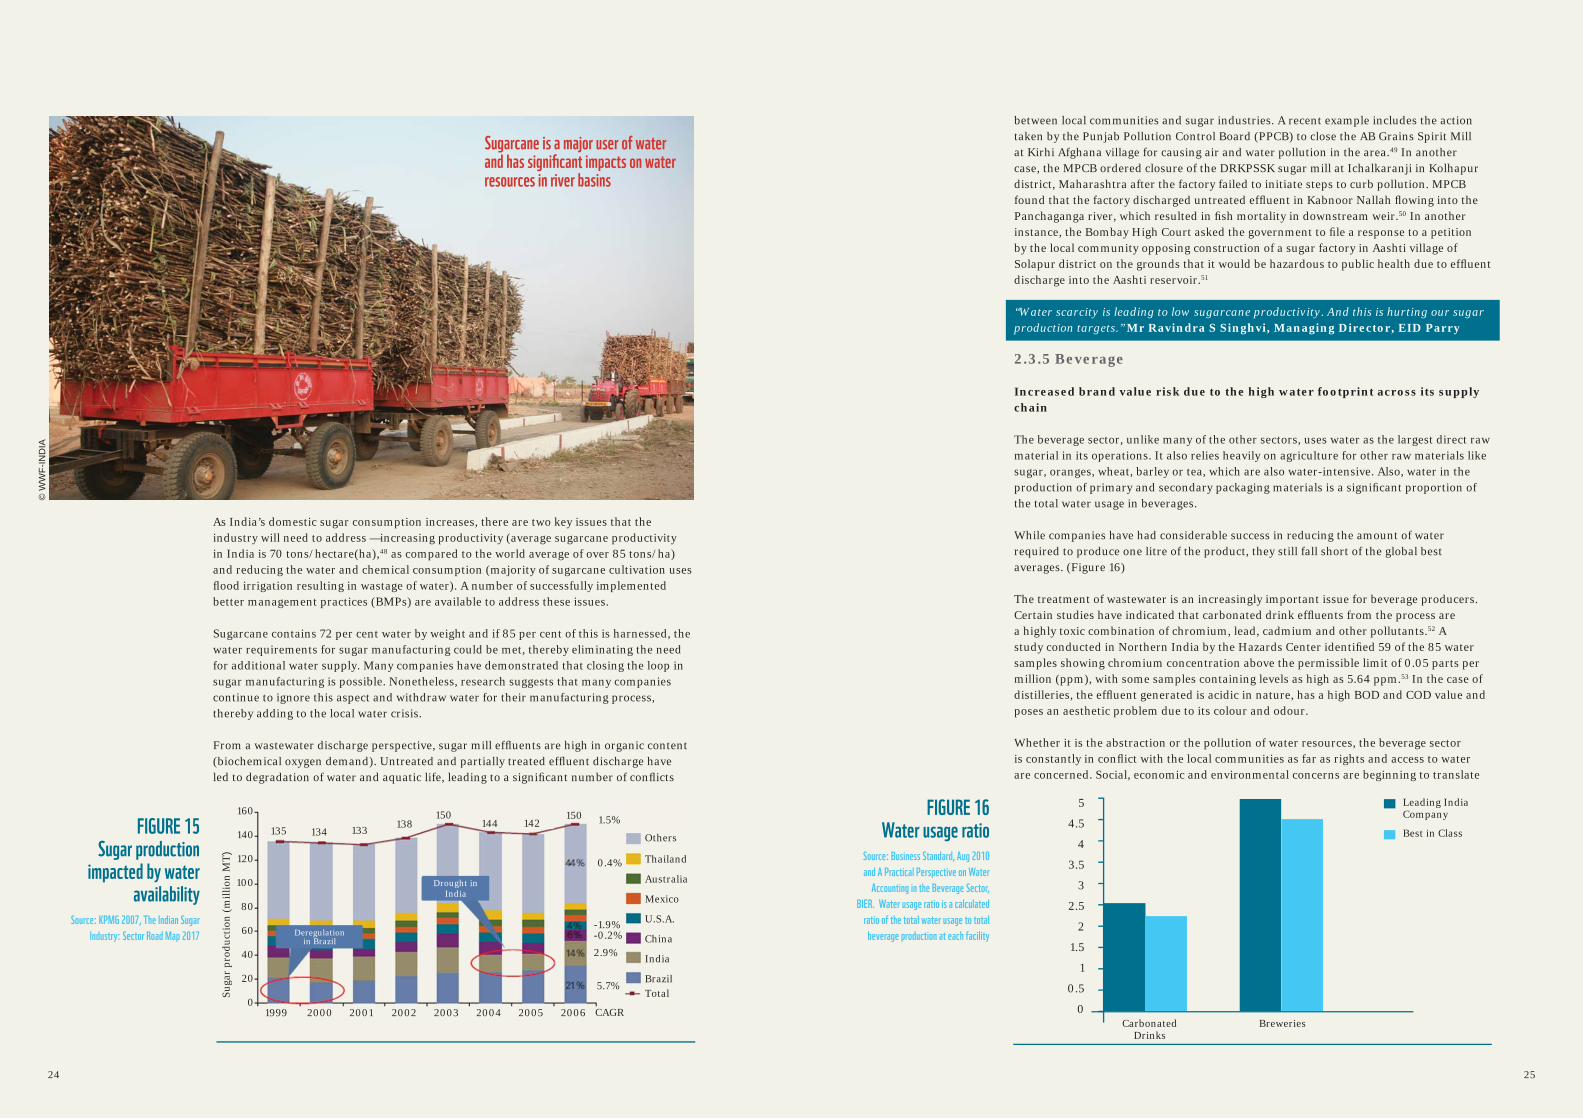
Sugar mills consume large quantities of water, not only in their manufacturing process, but also indirectly in sugarcane production as a part of their supply chain; sugarcane is one of the most water-intensive crops. Additionally, some of the sugarcane producing areas in India fall under water-scarce regions (Figure 14), placing the sugar industry at a high operational risk. For instance, in December 2012, there were reports of sugar mills being forced to shut down earlier than expected schedule on account of signifi cant decline in sugarcane acreage due to erratic monsoon and water scarcity, especially declining groundwater levels.47 Analysis shows that the sugar production in India has consistently increased except during drought years. (Figure 15) A WRI report shows that, due to below normal rainfall, India’s sugar crop in 2008 was 45 per cent lower than the previous year. The industry in water-scarce regions is worried about farmers shifting from sugarcane crop production to other less water-intensive crops.
FIGURE 13Water value map
Source: Green rating of Indian pulp
and paper industry 2004, CSE
Raw material processing
Pulping
Bleaching
Papermaking
Chemical Recovery
Boilers
0%
7%
33%
39%
9%
12%
FIGURE 14Withdrawal to
availability ratioSource: The water footprint of sweeteners
and bio-ethanol - Winnie Gerbens-
Leenes, Arjen Y. Hoekstra, 2011
Water withdrawal-to-availabilit
%
0 - 10
10 - 20
20 - 30
30 - 40
40 - 50
50 - 60
60 - 70
70 - 80
80 - 90
90 - 100
> 100
Water withdrawal to availability ratio (%)
Ganga River Basin
Indus River Basin
© C
SE
EN
VIR
ON
ME
NT
PH
OTO
LIB
RA
RY
Wood-stockpiled in a paper unit in Andhra Pradesh
24 2524 25
As India’s domestic sugar consumption increases, there are two key issues that the industry will need to address —increasing productivity (average sugarcane productivity in India is 70 tons/hectare(ha),48 as compared to the world average of over 85 tons/ha) and reducing the water and chemical consumption (majority of sugarcane cultivation uses fl ood irrigation resulting in wastage of water). A number of successfully implemented better management practices (BMPs) are available to address these issues.
Sugarcane contains 72 per cent water by weight and if 85 per cent of this is harnessed, the water requirements for sugar manufacturing could be met, thereby eliminating the need for additional water supply. Many companies have demonstrated that closing the loop in sugar manufacturing is possible. Nonetheless, research suggests that many companies continue to ignore this aspect and withdraw water for their manufacturing process, thereby adding to the local water crisis.
From a wastewater discharge perspective, sugar mill effl uents are high in organic content (biochemical oxygen demand). Untreated and partially treated effl uent discharge have led to degradation of water and aquatic life, leading to a signifi cant number of confl icts
between local communities and sugar industries. A recent example includes the action taken by the Punjab Pollution Control Board (PPCB) to close the AB Grains Spirit Mill at Kirhi Afghana village for causing air and water pollution in the area.49 In another case, the MPCB ordered closure of the DRKPSSK sugar mill at Ichalkaranji in Kolhapur district, Maharashtra after the factory failed to initiate steps to curb pollution. MPCB found that the factory discharged untreated effl uent in Kabnoor Nallah fl owing into the Panchaganga river, which resulted in fi sh mortality in downstream weir.50 In another instance, the Bombay High Court asked the government to fi le a response to a petition by the local community opposing construction of a sugar factory in Aashti village of Solapur district on the grounds that it would be hazardous to public health due to effl uent discharge into the Aashti reservoir.51
“Water scarcity is leading to low sugarcane productivity. And this is hurting our sugar production targets.” Mr Ravindra S Singhvi, Managing Director, EID Parry 2.3.5 Beverage
Increased brand value risk due to the high water footprint across its supply chain
The beverage sector, unlike many of the other sectors, uses water as the largest direct raw material in its operations. It also relies heavily on agriculture for other raw materials like sugar, oranges, wheat, barley or tea, which are also water-intensive. Also, water in the production of primary and secondary packaging materials is a signifi cant proportion of the total water usage in beverages.
While companies have had considerable success in reducing the amount of water required to produce one litre of the product, they still fall short of the global best averages. (Figure 16)
The treatment of wastewater is an increasingly important issue for beverage producers. Certain studies have indicated that carbonated drink effl uents from the process are a highly toxic combination of chromium, lead, cadmium and other pollutants.52 A study conducted in Northern India by the Hazards Center identifi ed 59 of the 85 water samples showing chromium concentration above the permissible limit of 0.05 parts per million (ppm), with some samples containing levels as high as 5.64 ppm.53 In the case of distilleries, the effluent generated is acidic in nature, has a high BOD and COD value and poses an aesthetic problem due to its colour and odour.
Whether it is the abstraction or the pollution of water resources, the beverage sector is constantly in confl ict with the local communities as far as rights and access to water are concerned. Social, economic and environmental concerns are beginning to translate
5
4.5
4
3.5
3
2.5
2
1.5
1
0.5
0
Leading India Company
Best in Class
Carbonated Drinks
Breweries
FIGURE 16Water usage ratio
Source: Business Standard, Aug 2010
and A Practical Perspective on Water
Accounting in the Beverage Sector,
BIER. Water usage ratio is a calculated
ratio of the total water usage to total
beverage production at each facility
Sugarcane is a major user of water and has signifi cant impacts on water resources in river basins
FIGURE 15 Sugar production
impacted by water availability
Source: KPMG 2007, The Indian Sugar
Industry: Sector Road Map 2017
Others
Thailand
Australia
Mexico
U.S.A.
China
India
BrazilTotal
1999
135
Suga
r pr
oduc
tion
(mill
ion
MT)
160
140
120
100
80
60
40
20
02000
134
2001
133
2002
138
2003
150
2004
144
2005
142
2006
150 1.5%
0.4%
-1.9%-0.2%
2.9%
5.7%
CAGR
© W
WF-
IND
IA
Deregulationin Brazil
Drought in India
26 2726 27
into regulatory action, affecting pricing of water, restrictions in water use and license to operate. For instance, the latest notifi cation by the Central Ground Water Authority in November 2012 indicates that industries using water as raw material, such as packaged drinking water, mineral water industries, distilleries, breweries, and soft drink manufacturing industries will not be allowed to abstract groundwater from over-exploited areas. While in areas which are not over-exploited, permissions to withdraw groundwater are given subject to conditions, such as the withdrawal limits strictly ranging from 50 to 100 per cent of groundwater recharge in critical and semi-critical areas.54 The beverage sector is also impacted by the loss of brand value and reputation because of its impacts on local hydrology and the local communities. One example that best illustrates this idea is the Assembly Committee appointed by the Kerala Government directing the State Groundwater Department in Kerala to monitor and restrict the use of groundwater by PepsiCo against complaints of over-exploitation.55 Studies, including the one by the Central Ground Water Board in India, have confi rmed that massive extraction of water from the common groundwater resource in Rajasthan have caused the wells to run dry leading to signifi cant depletion of the water table. In addition, there are several instances of pollution from distilleries resulting in the degradation of drinking water sources, thereby sparking public interest litigations and local confl icts.
2.3.6 Steel
While the steel sector in developed countries recycles about 95 per cent of the total water used, Indian steel companies dispose 85 per cent of water consumed as effl uents.
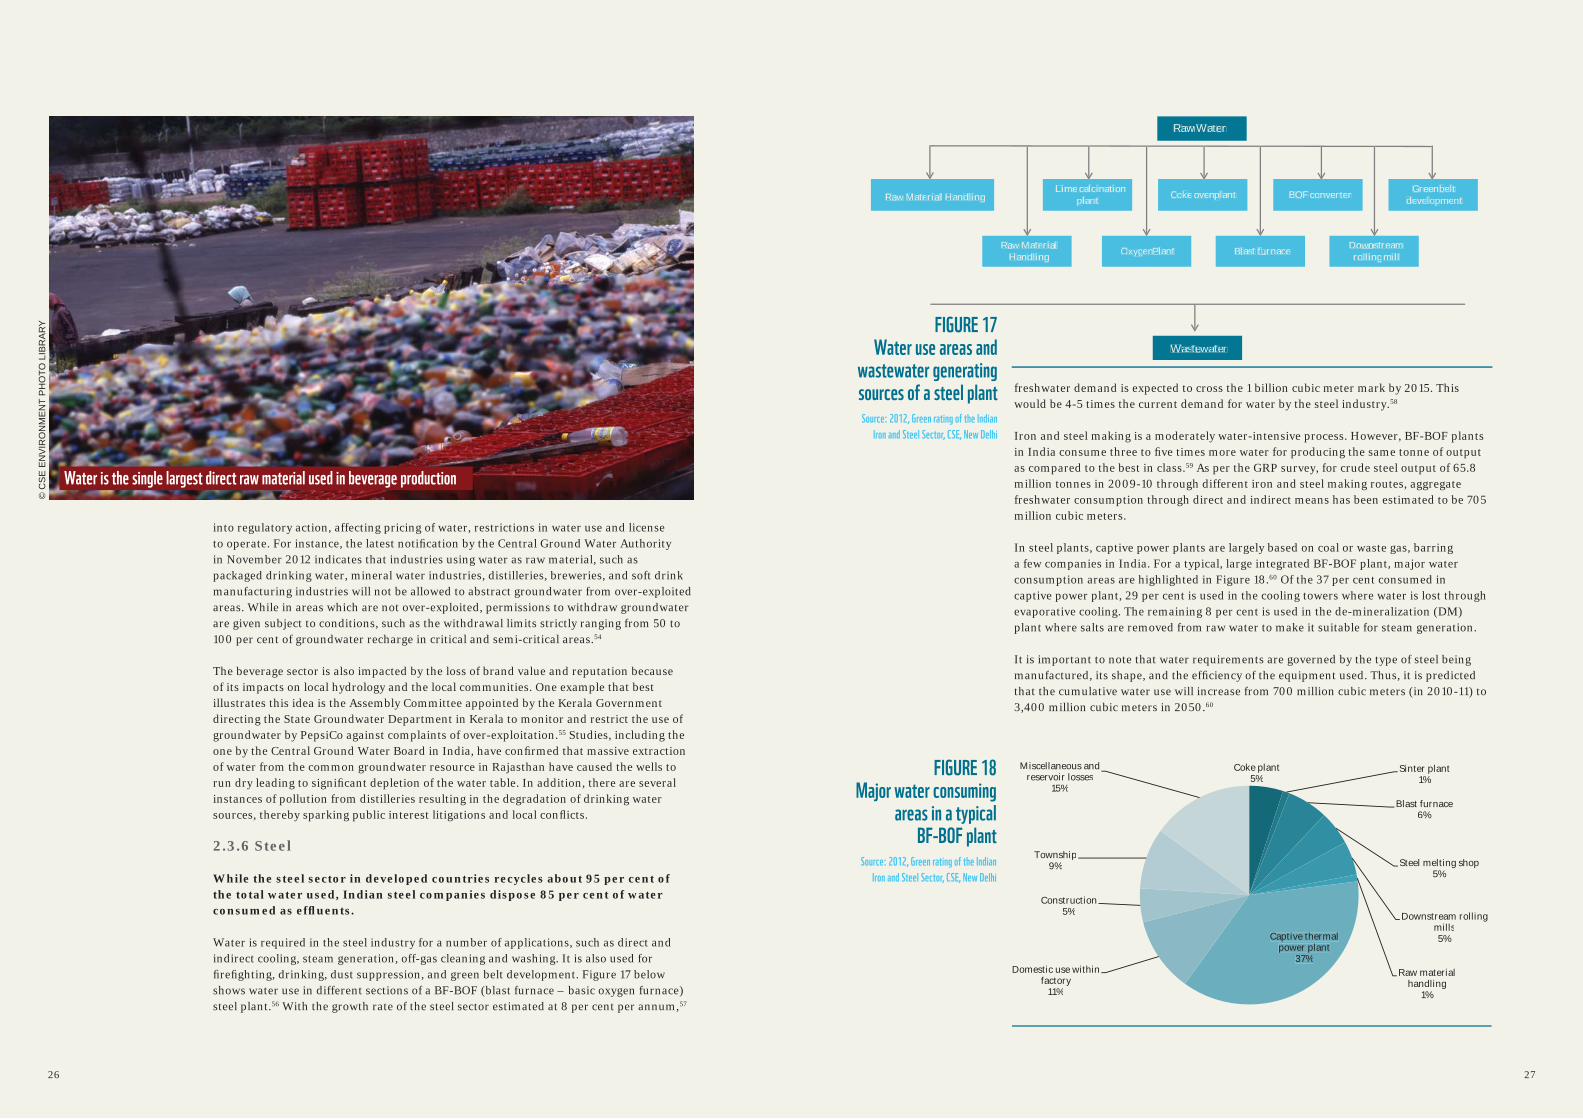
Water is required in the steel industry for a number of applications, such as direct and indirect cooling, steam generation, off-gas cleaning and washing. It is also used for fi refi ghting, drinking, dust suppression, and green belt development. Figure 17 below shows water use in different sections of a BF-BOF (blast furnace – basic oxygen furnace) steel plant.56 With the growth rate of the steel sector estimated at 8 per cent per annum,57
FIGURE 18Major water consuming
areas in a typical BF-BOF plant
Source: 2012, Green rating of the Indian
Iron and Steel Sector, CSE, New Delhi
Coke plant5%
Sinter plant1%
Blast furnace6%
Steel melting shop5%
Downstream rolling mills5%
Raw materialhandling
1%
Captive thermal power plant
37%Domestic use within
factory11%
Construction5%
Township9%
Miscellaneous andreservoir losses
15%
freshwater demand is expected to cross the 1 billion cubic meter mark by 2015. This would be 4-5 times the current demand for water by the steel industry.58
Iron and steel making is a moderately water-intensive process. However, BF-BOF plants in India consume three to fi ve times more water for producing the same tonne of output as compared to the best in class.59 As per the GRP survey, for crude steel output of 65.8 million tonnes in 2009-10 through different iron and steel making routes, aggregate freshwater consumption through direct and indirect means has been estimated to be 705 million cubic meters.
In steel plants, captive power plants are largely based on coal or waste gas, barring a few companies in India. For a typical, large integrated BF-BOF plant, major water consumption areas are highlighted in Figure 18.60 Of the 37 per cent consumed in captive power plant, 29 per cent is used in the cooling towers where water is lost through evaporative cooling. The remaining 8 per cent is used in the de-mineralization (DM) plant where salts are removed from raw water to make it suitable for steam generation.
It is important to note that water requirements are governed by the type of steel being manufactured, its shape, and the effi ciency of the equipment used. Thus, it is predicted that the cumulative water use will increase from 700 million cubic meters (in 2010-11) to 3,400 million cubic meters in 2050.60
© C
SE
EN
VIR
ON
ME
NT
PH
OTO
LIB
RA
RY
Water is the single largest direct raw material used in beverage production
RawRR Wataa er
Coke ovenpnn lant BOF converter Greenbeltdevelopment
Lime cala cinationplantRawaa Materiala Handling
Rawaa MaterialaHandling OxygenPnn lant Blast fuff rnace Downww stream
rolling mill
Wastewe ater
FIGURE 17 Water use areas and
wastewater generating sources of a steel plant Source: 2012, Green rating of the Indian
Iron and Steel Sector, CSE, New Delhi
28 2928 29
In the iron and steel sector, signifi cant quantities of wastewater are discharged mainly from BF-BOF plants. In India, approximately 80-85 per cent of freshwater consumed in this sector is discharged as effl uent. In contrast, in the US over 95 per cent of the water used for steel production and processing is recycled.60 The steel sector discharges wastewater with higher concentration of suspended solids and acids. If not treated properly, the wastewater from the coke manufacturing plant may contain effl uents with high concentration of cyanide, phenols, ammoniac nitrogen and COD. Alternative production methods, like gas and coal-based direct reduced iron-electric furnace (DRI-EF) plants generally have low wastewater discharge. In its Green Rating Report, the Centre for Science and Environment (CSE) reported that, of the top fi ve steel companies, three fared poorly solely on account of wastewater treatment and disposal.
The steel industries are located in the vicinity of surface water bodies such as rivers and the constant demand of water leads to shortage of water, especially in summer, increasing industry and local community confl icts. Generally, the industry creates captive sources of water by constructing dams and barrages, which results in the communities living downstream being deprived of water. Such instances, can pose risks to the company’s operations, as they negatively impact the brand value of the company. In October 2011, the local court passed a restraining order on the steel plant in Raigarh after local villagers had protested against excessive water usage by the plant.60 Similarly, over 5 lakh residents of the city of Bokaro had to battle severe water crisis, being forced to buy water at an exorbitant rate of Rs 25 per gallon because of signifi cant consumption of water by the steel plants in the region.60
If appropriate measures are not put in place to improve water productivity and to close the water loop, water scarcity will impact the industry operations. In October 2009, a steel plant in Bhilai had to seek help from the state government to release more water as the plant’s reservoir had almost dried up because of less rainfall that monsoon.60
“The government has a pivotal role to play as an enabler in water stewardship. It should put economic incentives and disincentives in place at both the corporate and the customer level” G. Udayabhaskar, Chief - Env. Mgmt, Tata Steel Limited
2.4 Water Risk Assessment for Industries
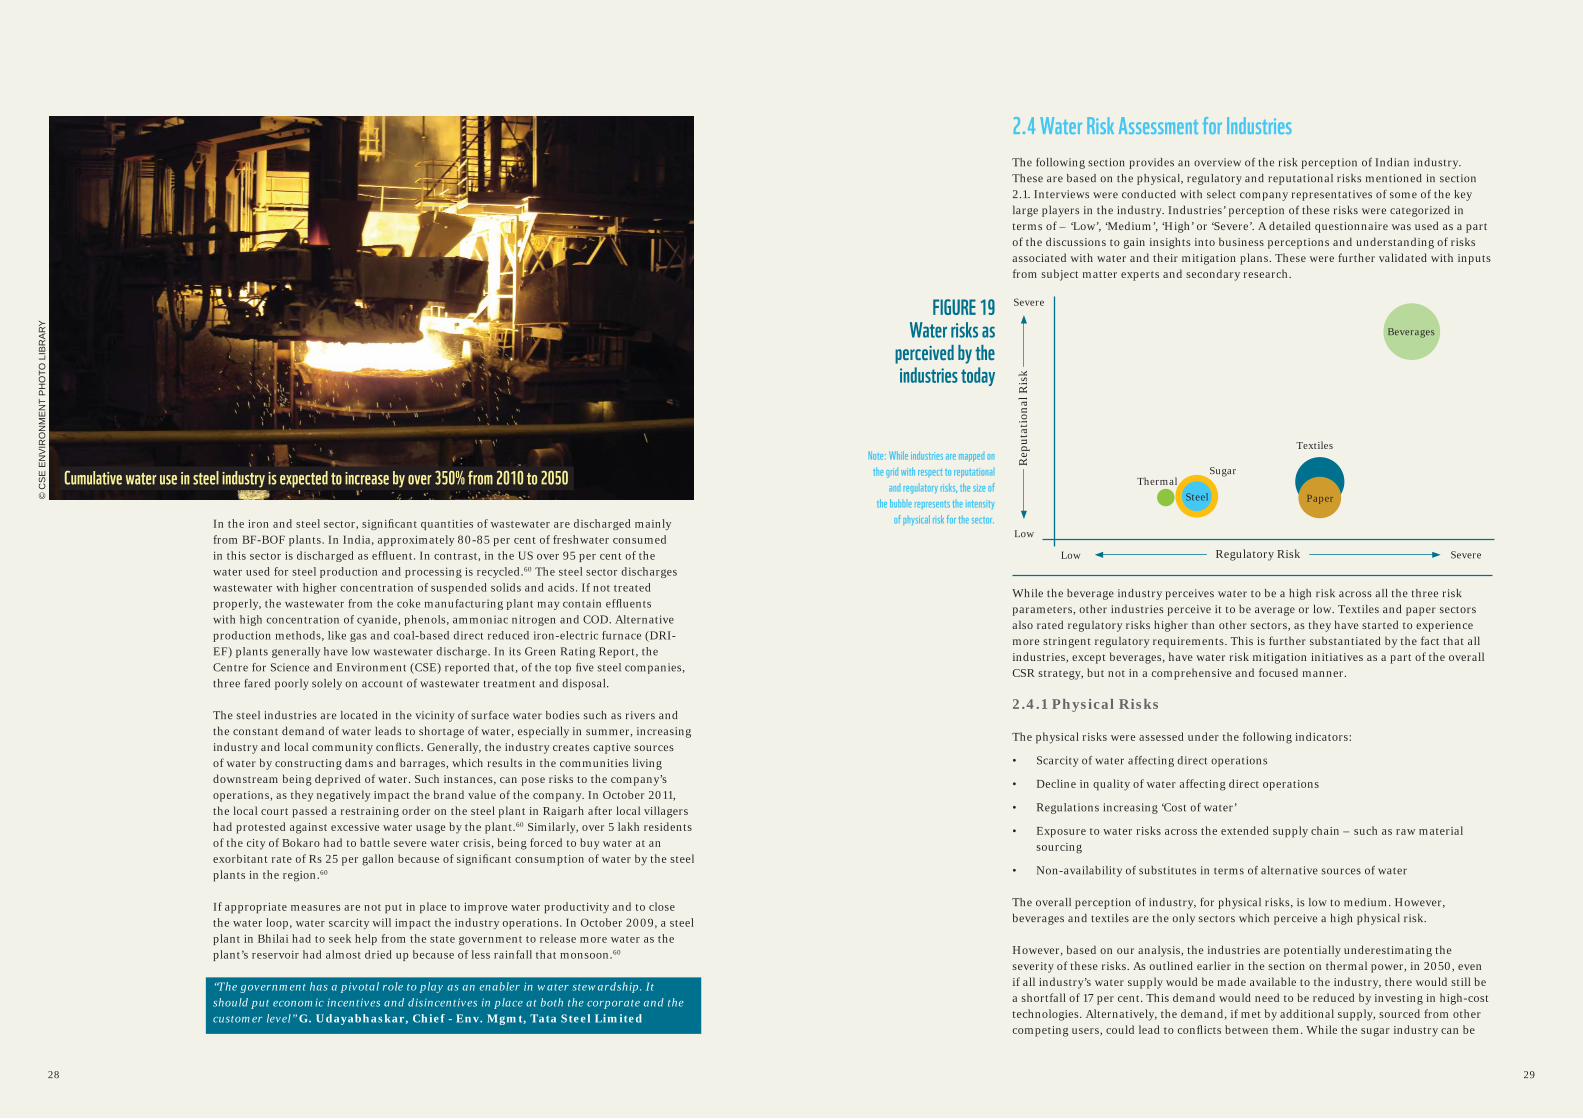
The following section provides an overview of the risk perception of Indian industry. These are based on the physical, regulatory and reputational risks mentioned in section 2.1. Interviews were conducted with select company representatives of some of the key large players in the industry. Industries’ perception of these risks were categorized in terms of – ‘Low’, ‘Medium’, ‘High’ or ‘Severe’. A detailed questionnaire was used as a part of the discussions to gain insights into business perceptions and understanding of risks associated with water and their mitigation plans. These were further validated with inputs from subject matter experts and secondary research.
While the beverage industry perceives water to be a high risk across all the three risk parameters, other industries perceive it to be average or low. Textiles and paper sectors also rated regulatory risks higher than other sectors, as they have started to experience more stringent regulatory requirements. This is further substantiated by the fact that all industries, except beverages, have water risk mitigation initiatives as a part of the overall CSR strategy, but not in a comprehensive and focused manner.
2.4.1 Physical Risks
The physical risks were assessed under the following indicators:
• Scarcity of water affecting direct operations
• Decline in quality of water affecting direct operations
• Regulations increasing ‘Cost of water’
• Exposure to water risks across the extended supply chain – such as raw material sourcing
• Non-availability of substitutes in terms of alternative sources of water
The overall perception of industry, for physical risks, is low to medium. However, beverages and textiles are the only sectors which perceive a high physical risk.
However, based on our analysis, the industries are potentially underestimating the severity of these risks. As outlined earlier in the section on thermal power, in 2050, even if all industry’s water supply would be made available to the industry, there would still be a shortfall of 17 per cent. This demand would need to be reduced by investing in high-cost technologies. Alternatively, the demand, if met by additional supply, sourced from other competing users, could lead to confl icts between them. While the sugar industry can be
Beverages
Textiles
Sugar
SteelThermal
Paper
Low
Low
Severe
Severe
Rep
utat
iona
l Ris
k
Regulatory Risk
FIGURE 19 Water risks as
perceived by the industries today
© C
SE
EN
VIR
ON
ME
NT
PH
OTO
LIB
RA
RY
Cumulative water use in steel industry is expected to increase by over 350% from 2010 to 2050
Note: While industries are mapped on
the grid with respect to reputational
and regulatory risks, the size of
the bubble represents the intensity
of physical risk for the sector.
30 3130 31
water self-suffi cient in its direct operations, ineffi cient agricultural practices in the supply chain, if not dis-incentivized, can potentially lead to less water being available for crop production, thereby negatively affecting the growth of the sugar industry.
None of the respondents raised concerns about the cost of water going up. Traditionally, industry is conditioned to pay little for water. However, increasing scarcity will result in higher costs. It is highly likely that in the future, costs will be levied on account of social and environmental factors being taken into consideration.
Surface and groundwater quality in India has been deteriorating. As a result, quality of input water received by industries has also been on a continuous decline. Given this trend, if no corrective actions are taken, companies will have to install advanced water treatment plants to purify freshwater inputs for their internal operations, thereby further increasing operational costs.
The costs incurred for clean water would go up on account of the higher charges, for treatment and discharge of wastewater. Some countries have already implemented a differential, volumetric pricing structure for industry, paying more per unit than domestic users.61 These impacts on industry will naturally force a response towards greater effi ciency of water use, as the economic realities of the cost of water will increase production costs.
Water shortages translate into higher energy prices, higher insurance and credit costs, and lower investor confi dence, all of which further undermine business profi tability. More common than the risk of not having enough water is the risk that businesses will fi nd their comparative or competitive advantage undermined by the cost infl ation driven by water scarcity. As water becomes scarcer, water tariffs and other pricing mechanisms tend to increase, due to greater competition for water between industries, higher water exploration costs, the need to drill deeper boreholes, higher pumping costs and the need to recoup the cost of expensive schemes for transporting water.
2.4.2 Regulatory Risks
The indicators assessed under regulatory risks were as follows:
• Restriction on water abstraction and stipulated water consumption for direct operations
• Restrictions and penalties on wastewater discharge
• Regulations mandating compliance on technology for water management
IndustryRisk
RatingIndustry Perception of their water risks
Thermal Power
• Committed water allocation from local/central governments during environmental clearance ensuring continuous supply of required amounts of water
• Technological advancements like use of closed loop cooling system which uses substantially less water compared to open loop cooling system
• Availability of alternate sources of water like sea water for internal operations without affecting the output of the plant or causing any damage to the machinery
Steel
• Committed water allocation from local/central governments during environmental clearance ensure reliable supply of water for their operations
• Plants using advanced technology have a much higher productivity in comparison to old plants
Sugar
• Decline in quality and quantity of water that affects the availability of sugarcane for sugar production
• Farmers looking for less water intensive crops as an alternate option, increases threat in raw material sourcing
• The industry realizes that self-suffi ciency is achievable in the manufacturing process if water in sugarcane itself is used optimally
Paper
• Water scarcity and quality continues to remain the points of concern
• Droughts have forced mills to shut down operations. To tackle such issues, mills have been forced to create storage reservoirs
• Decline in quality of water, specifi cally in terms of high conductivity (e.g.: River Cauvery) has made it imperative for companies to invest extensively in high-end technologies to make the water usable for operations
• Alternative sources of water such as seawater are also not viable options as treatment technologies are cost prohibitive
Textiles
• Non availability of good quality water poses signifi cant risks to the industry’s survival
• Unavailability of a perennial, surface water source for withdrawal across some of the textile clusters
• Pumping groundwater in huge quantities leads to high cost because of high TDS (Total Dissolved Solids) levels
• Declining water quality has forced the industry to make substantial investment in high-end technologies, thereby increasing costs of production
• Enormous dependency on the availability of agricultural raw material, such as cotton, which in itself is a highly water-intensive crop, dependent on rains and severely impacted by droughts
Beverages
• Usage of fresh water across supply chain, non-availability of a substitute as an input and usage of raw materials like sugar, molasses etc., which are produced from agricultural products poses a high water scarcity risk
• Water scarcity in the Cauvery basin impacted the operations of a leading distilleries company that forced them to look for alternate water sources, which increased the overall costs. Quality controversies have necessitated high investments in advanced technologies to treat the input water
TABLE 1Perceived Physical Risks
TABLE 2 Perceived
Regulatory Risks
Industry Risk Rating Industry Perception of their water risks
Thermal Power • Specifi c water consumption and discharge norms are being adhered to, especially in the plants adopting new technologySteel
Sugar • Necessary steps are being taken for closure of loop
and that all stipulated norms are being achieved
Paper • Effects of multiple government regulations - with zero discharge being made mandatory and technology compliance
• Restrictions on groundwater abstraction as per the recent CGWA notifi cation
Textiles
Beverages
• Criticism and global outcry on account of reports of overuse of available water has increased regulatory pressures and believes to be one of the fi rst industries to be hit by stringent policies
• Restrictions on groundwater abstraction as per the recent CGWA notifi cation
LowLow
MediumMedium
HighHigh
SevereSevere
32 3332 33
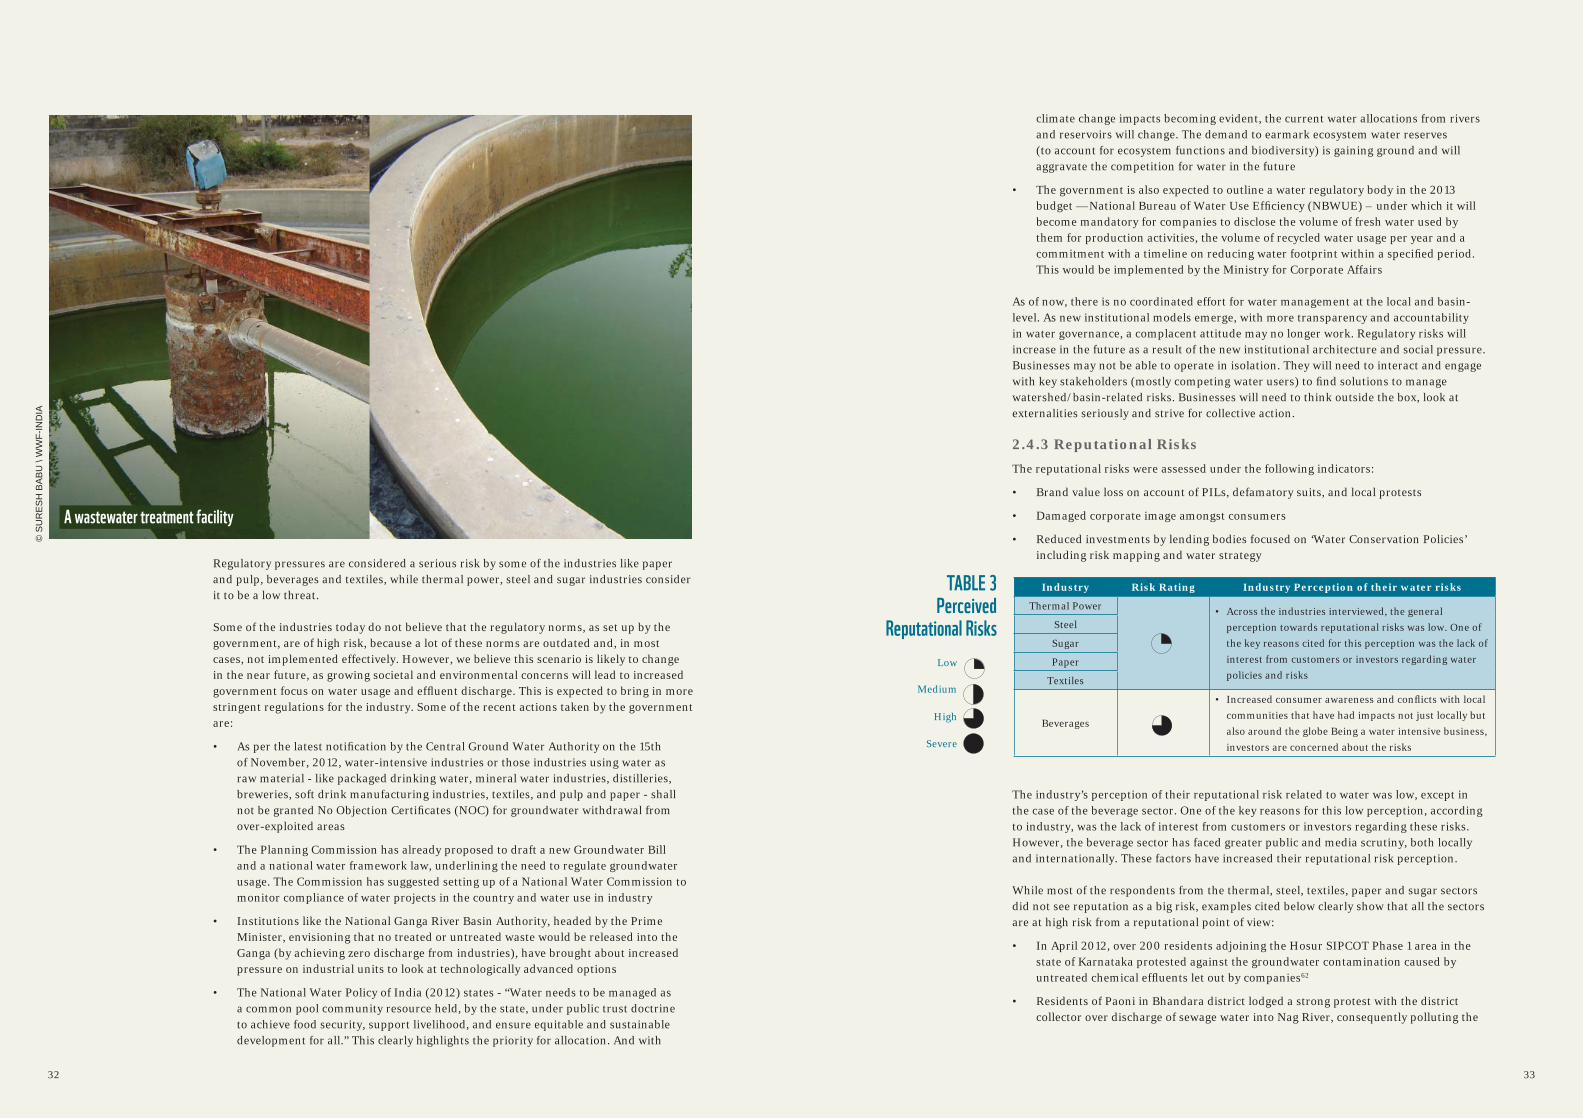
Regulatory pressures are considered a serious risk by some of the industries like paper and pulp, beverages and textiles, while thermal power, steel and sugar industries consider it to be a low threat.
Some of the industries today do not believe that the regulatory norms, as set up by the government, are of high risk, because a lot of these norms are outdated and, in most cases, not implemented effectively. However, we believe this scenario is likely to change in the near future, as growing societal and environmental concerns will lead to increased government focus on water usage and effl uent discharge. This is expected to bring in more stringent regulations for the industry. Some of the recent actions taken by the government are:
• As per the latest notifi cation by the Central Ground Water Authority on the 15th of November, 2012, water-intensive industries or those industries using water as raw material - like packaged drinking water, mineral water industries, distilleries, breweries, soft drink manufacturing industries, textiles, and pulp and paper - shall not be granted No Objection Certifi cates (NOC) for groundwater withdrawal from over-exploited areas
• The Planning Commission has already proposed to draft a new Groundwater Bill and a national water framework law, underlining the need to regulate groundwater usage. The Commission has suggested setting up of a National Water Commission to monitor compliance of water projects in the country and water use in industry
• Institutions like the National Ganga River Basin Authority, headed by the Prime Minister, envisioning that no treated or untreated waste would be released into the Ganga (by achieving zero discharge from industries), have brought about increased pressure on industrial units to look at technologically advanced options
• The National Water Policy of India (2012) states - “Water needs to be managed as a common pool community resource held, by the state, under public trust doctrine to achieve food security, support livelihood, and ensure equitable and sustainable development for all.” This clearly highlights the priority for allocation. And with
climate change impacts becoming evident, the current water allocations from rivers and reservoirs will change. The demand to earmark ecosystem water reserves (to account for ecosystem functions and biodiversity) is gaining ground and will aggravate the competition for water in the future
• The government is also expected to outline a water regulatory body in the 2013 budget — National Bureau of Water Use Effi ciency (NBWUE) – under which it will become mandatory for companies to disclose the volume of fresh water used by them for production activities, the volume of recycled water usage per year and a commitment with a timeline on reducing water footprint within a specifi ed period. This would be implemented by the Ministry for Corporate Affairs
As of now, there is no coordinated effort for water management at the local and basin-level. As new institutional models emerge, with more transparency and accountability in water governance, a complacent attitude may no longer work. Regulatory risks will increase in the future as a result of the new institutional architecture and social pressure. Businesses may not be able to operate in isolation. They will need to interact and engage with key stakeholders (mostly competing water users) to fi nd solutions to manage watershed/basin-related risks. Businesses will need to think outside the box, look at externalities seriously and strive for collective action.
2.4.3 Reputational RisksThe reputational risks were assessed under the following indicators:
• Brand value loss on account of PILs, defamatory suits, and local protests
• Damaged corporate image amongst consumers
• Reduced investments by lending bodies focused on ‘Water Conservation Policies’ including risk mapping and water strategy
The industry’s perception of their reputational risk related to water was low, except in the case of the beverage sector. One of the key reasons for this low perception, according to industry, was the lack of interest from customers or investors regarding these risks. However, the beverage sector has faced greater public and media scrutiny, both locally and internationally. These factors have increased their reputational risk perception.
While most of the respondents from the thermal, steel, textiles, paper and sugar sectors did not see reputation as a big risk, examples cited below clearly show that all the sectors are at high risk from a reputational point of view:
• In April 2012, over 200 residents adjoining the Hosur SIPCOT Phase 1 area in the state of Karnataka protested against the groundwater contamination caused by untreated chemical effl uents let out by companies62
• Residents of Paoni in Bhandara district lodged a strong protest with the district collector over discharge of sewage water into Nag River, consequently polluting the
Industry Risk Rating Industry Perception of their water risks
Thermal Power • Across the industries interviewed, the general perception towards reputational risks was low. One of the key reasons cited for this perception was the lack of interest from customers or investors regarding water policies and risks
Steel
Sugar
Paper
Textiles
Beverages
• Increased consumer awareness and confl icts with local communities that have had impacts not just locally but also around the globe Being a water intensive business, investors are concerned about the risks
TABLE 3 Perceived
Reputational Risks
A wastewater treatment facility
Low
Medium
High
Severe
© S
UR
ES
H B
AB
U \
WW
F-IN
DIA
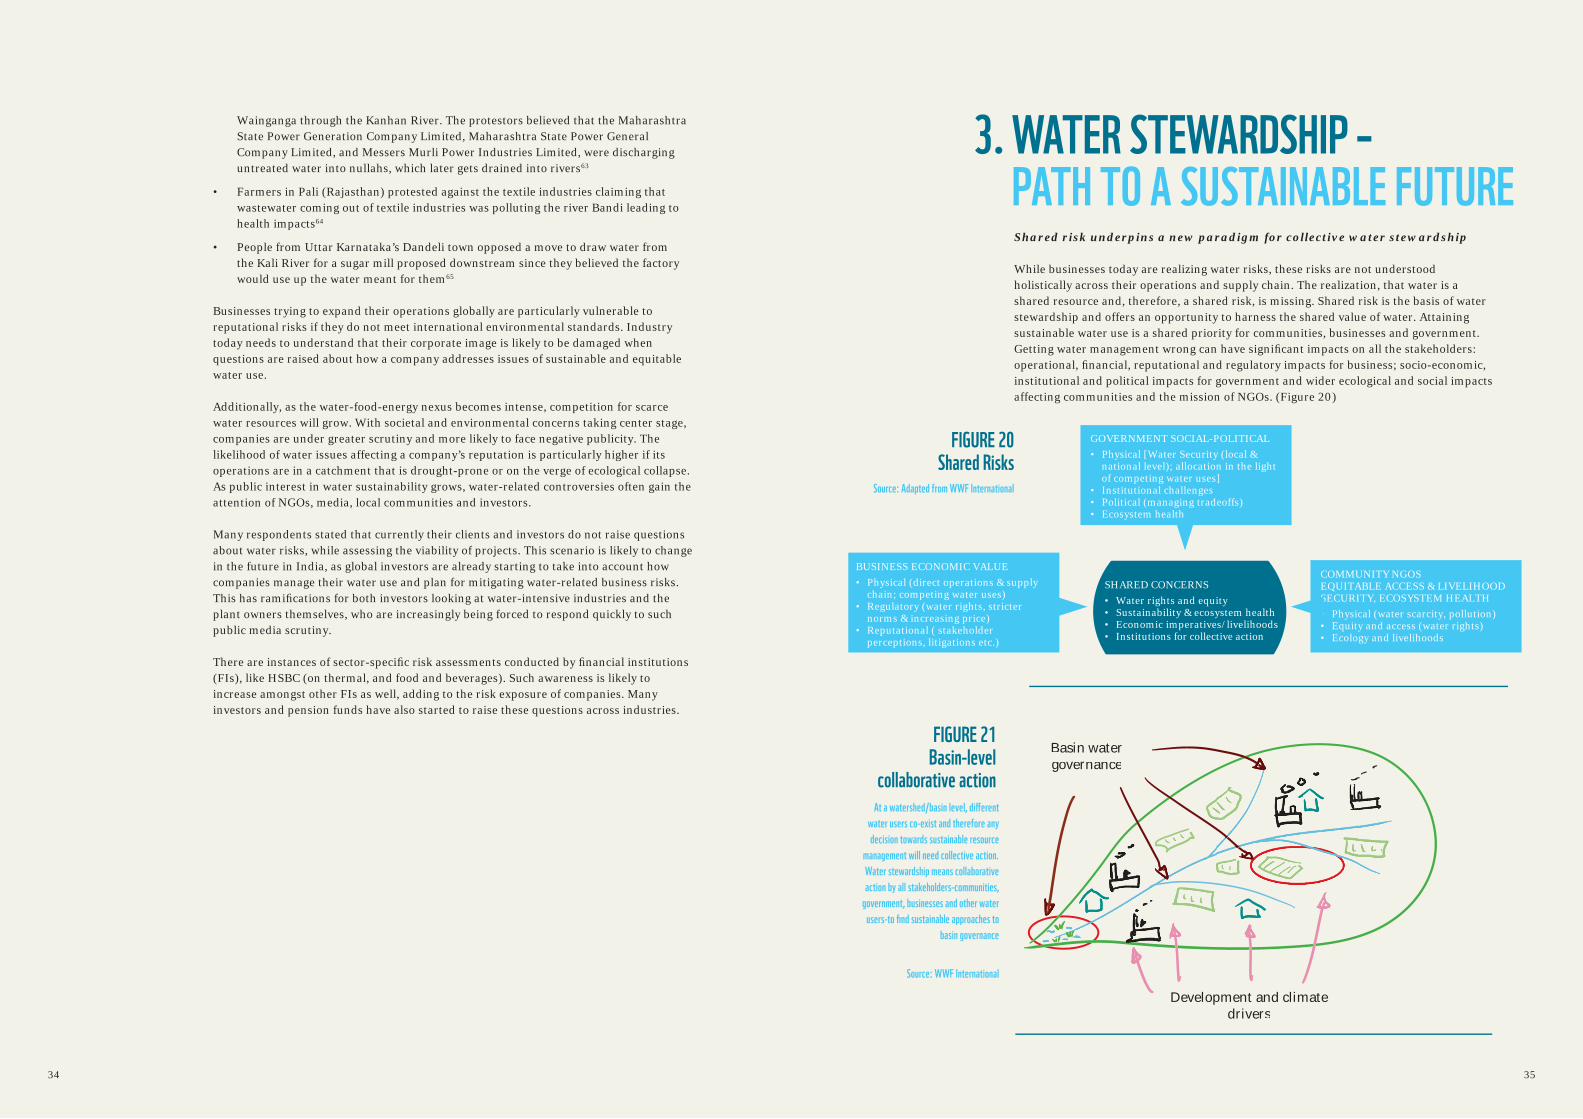
34 3534 35
Shared risk underpins a new paradigm for collective water stewardship
While businesses today are realizing water risks, these risks are not understood holistically across their operations and supply chain. The realization, that water is a shared resource and, therefore, a shared risk, is missing. Shared risk is the basis of water stewardship and offers an opportunity to harness the shared value of water. Attaining sustainable water use is a shared priority for communities, businesses and government. Getting water management wrong can have signifi cant impacts on all the stakeholders: operational, fi nancial, reputational and regulatory impacts for business; socio-economic, institutional and political impacts for government and wider ecological and social impacts affecting communities and the mission of NGOs. (Figure 20)
3. WATER STEWARDSHIP – PATH TO A SUSTAINABLE FUTURE
SHARED CONCERNS• Water rights and equity• Sustainability & ecosystem health• Economic imperatives/livelihoods• Institutions for collective action
BUSINESS ECONOMIC VALUE• Physical (direct operations & supply
chain; competing water uses)• Regulatory (water rights, stricter
norms & increasing price)• Reputational ( stakeholder
perceptions, litigations etc.)
GOVERNMENT SOCIAL-POLITICAL• Physical [Water Security (local &
national level); allocation in the light of competing water uses]
• Institutional challenges• Political (managing tradeoffs)• Ecosystem health
COMMUNITY NGOSEQUITABLE ACCESS & LIVELIHOOD SECURITY, ECOSYSTEM HEALTH• Physical (water scarcity, pollution)• Equity and access (water rights)• Ecology and livelihoods
FIGURE 20Shared Risks
Source: Adapted from WWF International
Wainganga through the Kanhan River. The protestors believed that the Maharashtra State Power Generation Company Limited, Maharashtra State Power General Company Limited, and Messers Murli Power Industries Limited, were discharging untreated water into nullahs, which later gets drained into rivers63
• Farmers in Pali (Rajasthan) protested against the textile industries claiming that wastewater coming out of textile industries was polluting the river Bandi leading to health impacts64
• People from Uttar Karnataka’s Dandeli town opposed a move to draw water from the Kali River for a sugar mill proposed downstream since they believed the factory would use up the water meant for them65
Businesses trying to expand their operations globally are particularly vulnerable to reputational risks if they do not meet international environmental standards. Industry today needs to understand that their corporate image is likely to be damaged when questions are raised about how a company addresses issues of sustainable and equitable water use.
Additionally, as the water-food-energy nexus becomes intense, competition for scarce water resources will grow. With societal and environmental concerns taking center stage, companies are under greater scrutiny and more likely to face negative publicity. The likelihood of water issues affecting a company’s reputation is particularly higher if its operations are in a catchment that is drought-prone or on the verge of ecological collapse. As public interest in water sustainability grows, water-related controversies often gain the attention of NGOs, media, local communities and investors.
Many respondents stated that currently their clients and investors do not raise questions about water risks, while assessing the viability of projects. This scenario is likely to change in the future in India, as global investors are already starting to take into account how companies manage their water use and plan for mitigating water-related business risks. This has ramifi cations for both investors looking at water-intensive industries and the plant owners themselves, who are increasingly being forced to respond quickly to such public media scrutiny.
There are instances of sector-specifi c risk assessments conducted by fi nancial institutions (FIs), like HSBC (on thermal, and food and beverages). Such awareness is likely to increase amongst other FIs as well, adding to the risk exposure of companies. Many investors and pension funds have also started to raise these questions across industries.
Basin water governance
Development and climatedrivers
FIGURE 21Basin-level
collaborative action
At a watershed/basin level, diff erent
water users co-exist and therefore any
decision towards sustainable resource
management will need collective action.
Water stewardship means collaborative
action by all stakeholders-communities,
government, businesses and other water
users-to fi nd sustainable approaches to
basin governance
Source: WWF International
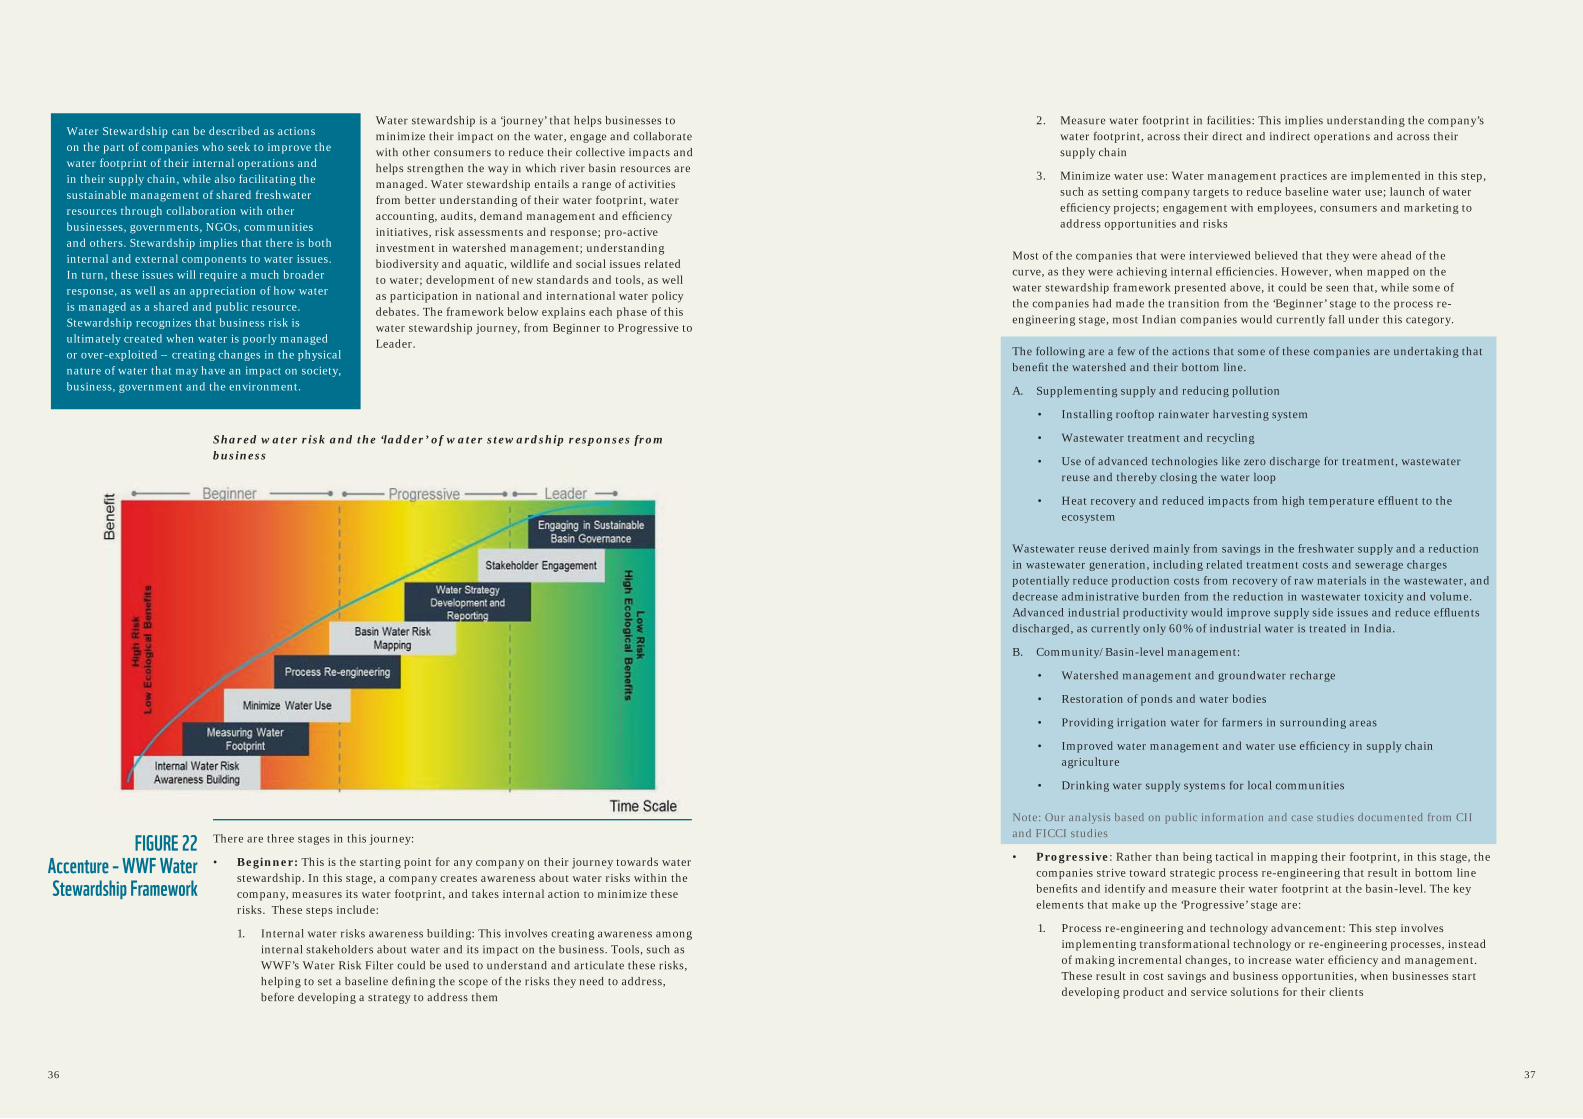
36 3736 37
Water stewardship is a ‘journey’ that helps businesses to minimize their impact on the water, engage and collaborate with other consumers to reduce their collective impacts and helps strengthen the way in which river basin resources are managed. Water stewardship entails a range of activities from better understanding of their water footprint, water accounting, audits, demand management and effi ciency initiatives, risk assessments and response; pro-active investment in watershed management; understanding biodiversity and aquatic, wildlife and social issues related to water; development of new standards and tools, as well as participation in national and international water policy debates. The framework below explains each phase of this water stewardship journey, from Beginner to Progressive to Leader.
Shared water risk and the ‘ladder’ of water stewardship responses from business
There are three stages in this journey:
• Beginner: This is the starting point for any company on their journey towards water stewardship. In this stage, a company creates awareness about water risks within the company, measures its water footprint, and takes internal action to minimize these risks. These steps include:
1. Internal water risks awareness building: This involves creating awareness among internal stakeholders about water and its impact on the business. Tools, such as WWF’s Water Risk Filter could be used to understand and articulate these risks, helping to set a baseline defi ning the scope of the risks they need to address, before developing a strategy to address them
2. Measure water footprint in facilities: This implies understanding the company’s water footprint, across their direct and indirect operations and across their supply chain
3. Minimize water use: Water management practices are implemented in this step, such as setting company targets to reduce baseline water use; launch of water effi ciency projects; engagement with employees, consumers and marketing to address opportunities and risks
Most of the companies that were interviewed believed that they were ahead of the curve, as they were achieving internal effi ciencies. However, when mapped on the water stewardship framework presented above, it could be seen that, while some of the companies had made the transition from the ‘Beginner’ stage to the process re-engineering stage, most Indian companies would currently fall under this category.
The following are a few of the actions that some of these companies are undertaking that benefi t the watershed and their bottom line.
A. Supplementing supply and reducing pollution
• Installing rooftop rainwater harvesting system
• Wastewater treatment and recycling
• Use of advanced technologies like zero discharge for treatment, wastewater reuse and thereby closing the water loop
• Heat recovery and reduced impacts from high temperature effl uent to the ecosystem
Wastewater reuse derived mainly from savings in the freshwater supply and a reduction in wastewater generation, including related treatment costs and sewerage charges potentially reduce production costs from recovery of raw materials in the wastewater, and decrease administrative burden from the reduction in wastewater toxicity and volume. Advanced industrial productivity would improve supply side issues and reduce effl uents discharged, as currently only 60% of industrial water is treated in India.
B. Community/Basin-level management:
• Watershed management and groundwater recharge
• Restoration of ponds and water bodies
• Providing irrigation water for farmers in surrounding areas
• Improved water management and water use effi ciency in supply chain agriculture
• Drinking water supply systems for local communities
Note: Our analysis based on public information and case studies documented from CII and FICCI studies
• Progressive: Rather than being tactical in mapping their footprint, in this stage, the companies strive toward strategic process re-engineering that result in bottom line benefi ts and identify and measure their water footprint at the basin-level. The key elements that make up the ‘Progressive’ stage are:
1. Process re-engineering and technology advancement: This step involves implementing transformational technology or re-engineering processes, instead of making incremental changes, to increase water effi ciency and management. These result in cost savings and business opportunities, when businesses start developing product and service solutions for their clients
FIGURE 22Accenture – WWF Water Stewardship Framework
Water Stewardship can be described as actions on the part of companies who seek to improve the water footprint of their internal operations and in their supply chain, while also facilitating the sustainable management of shared freshwater resources through collaboration with other businesses, governments, NGOs, communities and others. Stewardship implies that there is both internal and external components to water issues. In turn, these issues will require a much broader response, as well as an appreciation of how water is managed as a shared and public resource. Stewardship recognizes that business risk is ultimately created when water is poorly managed or over-exploited – creating changes in the physical nature of water that may have an impact on society, business, government and the environment.
38 3938 39
2. Basin water risk mapping: Estimating the impact of water consumed and discharged by the company in the basin context. This step would also include assessing the company’s exposure towards fl oods, droughts as well as developing and implementing a response mechanism. The response could include fl ood risk contingency plans, as well as plans to respond to supply chain disruptions or increasing raw material price, due to water issues. These risks, though still operational, are assessed in joint discussion with local authorities, communities and government
3. Water Strategy Development and Reporting: This stage fi nally requires the company to develop a Water Policy, aimed at institutionalizing these changes within the organization, instead of being ad hoc. Based on the basin water risk mapping outcomes, a long-term strategy can be developed and implemented to mitigate such risks. This policy is reviewed on an annual basis to re-assess risks and their mitigation plans
Most Indian companies are either below or at the Beginner level. However, there are a few exceptional companies that are at an early Progressive level. To illustrate, some sugar companies are engaging with stakeholders, such as farmers to educate them about water effi ciency, from drip irrigation to other water conservation measures, such as capturing rainwater.
While these measures might work in the short term, longer-term risk mitigation strategy would need a collaborative approach with stakeholders who share these risks.
• Leader: A company can be called a Water Stewardship leader, when it actively engages with the basin in which it operates in order to manage water risks, not only for its own supply chain, but also for the basin in general. The mark of a water stewardship leader is also its ability to work with the stakeholders – communities, government and local institutions – to secure a sustainable water supply for the ecosystem.
1. Stakeholder engagement: Engagement with stakeholders, where company water use and associated risk is high, can help mitigate basin-related risks, boost reputation on water issues, and build brand trust and loyalty. Stakeholders can be anyone from other users in a particular watershed, to other companies across sectors, communities, NGOs, public agencies, and standard setting bodies
2. Engaging in sustainable basin governance: Collaborate in a transparent way with governments and diverse stakeholders in developing activities or responses for sustainable water management and addressing risks to the basin. These could range from self-regulation, taking responsibility for joint action and institutional strengthening - improving the capacity of beginners to progress towards water stewardship; particularly effective where existing institutions and stakeholders require technical-managerial capacity or new institutions are required, at a local or basin-level
Successful collaborative action towards river basin management between communities, companies and local authorities in Lake Naivasha, Kenya
Lake Naivasha, located in Kenya, is a Ramsar site—a wetland of international importance. It provides water for irrigation to an intensive fl ower and vegetable farming industry which generates over 10% of Kenya’s export revenue, contributes 2.1% of the national GDP and employs 75,000 people. A rapidly growing population and economy also depend on Naivasha for water supply, wastewater disposal, needs of small-scale agriculture, tourism and wildlife conservation, cattle ranching and grazing, fi sheries and power generation. Even though the export farmers have driven effi ciency to record levels, the cumulative impact of multiple water users had driven the lake to record low fl ows, creating severe physical risks. The consumer markets and retail companies purchasing Naivasha’s produce faced high reputational risks, due to their poor understanding of the water use of their suppliers and the perceptions of their customers. Severe stress on the Naivasha basin resources brought the diverse stakeholders together to mitigate the shared risks. The joint action of international fl ower growers, local farmers, water user associations and local NGOs - on the shores of Lake Naivasha (Kenya) have led to some path-breaking outcomes. Through a process of consensus-building with basin stakeholders three response areas were identifi ed—improved institutional arrangements and development and implementation of rules regarding resource use; the fostering of innovative partnerships between the government, private sector and civil society; and the development of water stewardship standards to distinguish and incentivize progressive and responsible private sector water users in the basin. Today, the allocation of water for multiple economic, social and environmental purposes has been agreed upon by the local users. It was through collective action with Water User Associations and the National Water Management Authority that companies and local communities have been able to secure the necessary political support to better manage the river basin.
40 4140 41
2. Government
Water in India is a State subject making the government responsible for water management. There are several government institutions and agencies are responsible for different aspects of water management—delivering water supply, allocating scarce water, ensuring quality and protecting watersheds—leading to fragmented management of water. The draft of the National Water Policy for 2012 proposes a framework for creation of an overarching system of laws and institutions and for a plan of action with a unifi ed national perspective. The following are some of the key steps that the government should undertake:
• Central and State governments will need to set policies and incentives that encourage compliance to norms and voluntary action towards water stewardship; also institutionalize cumulative water risk assessments at the basin level
• Incentivize companies to invest in research and development that provides long-term water solutions, through technological solutions for agriculture, industry and environment sectors
• Encourage water stewardship and facilitate stakeholder engagement between government, local authorities, communities, industries and NGOs to work together to effective basin governance; understand and mitigate basin-related risks and develop opportunities in an inclusive and transparent manner; encourage companies in their portfolio to adopt a water stewardship strategy; facilitate promotion of industry-level standards that promote better measurement, analysis, disclosure and auditing
3. Financial institutions
Public and private fi nancial institutions have great transformational power to accelerate the transition towards sustainable water solutions. Financial Institutions (FIs) face bottom line risks, as a result of their clients’ losses from disruption of operations, withdrawal of license to operate; higher operating costs from increase in water treatment for inputs or for wastewater; or cost overruns from delayed regulatory clearance. These risks also present an opportunity for fi nancial institutions to promote water stewardship for mitigating risk and developing opportunities. The following are some actions that FIs should undertake:
• Evaluate their portfolio from a water risk perspective
• Ask asset managers to engage with companies that have a high water risk quotient about their water risk mitigation strategies, disclosure and participation in multi-stakeholder dialogues
• Develop fi nancial mechanisms that incentivize water solutions at the operational and basin level
4. Local Communities
Local communities and local institutions are the custodians of water and natural resources. There is an opportunity to be a water steward in securing catchments/recharge zones to stop degradation of a water source, among others. They can also act as watchdogs for reporting and questioning any action that would threaten water security.
5. NGOs
The role of NGOs, as advocates, facilitators or watchdogs, in driving water stewardship and collaborative action is important. While some NGOs have helped raise awareness regarding water risks and the impacts of business, others have helped shape the water stewardship debate and responses that provide a roadmap for businesses.
4. CALL TO ACTION – OPPORTUNITIES AROUND SHARED RISKWater is essential for life, livelihoods, economy and ecosystems. This makes water management multi-dimensional and multi-disciplinary. In other words, the challenges faced from water will not fi x themselves. Achieving basin-level water security will need collective action by all of those who use and depend on water as a resource. Moreover, water in India is a common property resource and requires that all voices be heard and key stakeholders participate in seeking solutions to shared water problems. The following points are a call to action for various sections of water consumers:
1. Businesses
Growth in demand, combined with competing water interests and widespread water quantity and quality problems, is increasing business risks and also risks to society and environment. However, these risks also present business opportunities for companies to develop sustainable water strategies and innovative solutions for their own operations, for their customers, society and the environment. The following are some of the key steps that they need to undertake:
• Businesses fi rst need to understand the overall scope and scale of their risk, as a baseline, before starting their water stewardship journey (See box on page 42: Water Risk Filter)
• Based on this analysis, they need to map their water footprint across their direct operations and their supply chain and relevant catchments.
• Develop a water stewardship framework that addresses risks and also identifi es incremental and transformative opportunities such as, but not limited to, integrating water effi ciencies, re-use and recycling of water, conservation at the operational and basin-level through advanced technology or process re-engineering
• As part of the stewardship framework, engage with other companies, experts, government agencies, communities, NGOs to help develop collective water strategies and solutions at the basin-level that also strengthen water governance and maintain transparency and rigour in assessing and responding to water issues
• Participate in multi-stakeholder initiatives or dialogues on water, such as CDP Water Disclosure. Alliance for Water Stewardship, CEO Water Mandate, and other such initiatives at the local level
Implementing such a water stewardship framework, not only mitigates risks, but also helps companies to reduce cost and fi nd new business opportunities that emerge as a result of undertaking this exercise. Many companies have benefi tted from developing products and services that provide solutions for their own operations, for their clients and also for society and the environment. This also leads to enhanced brand perception and premium positioning among consumers.
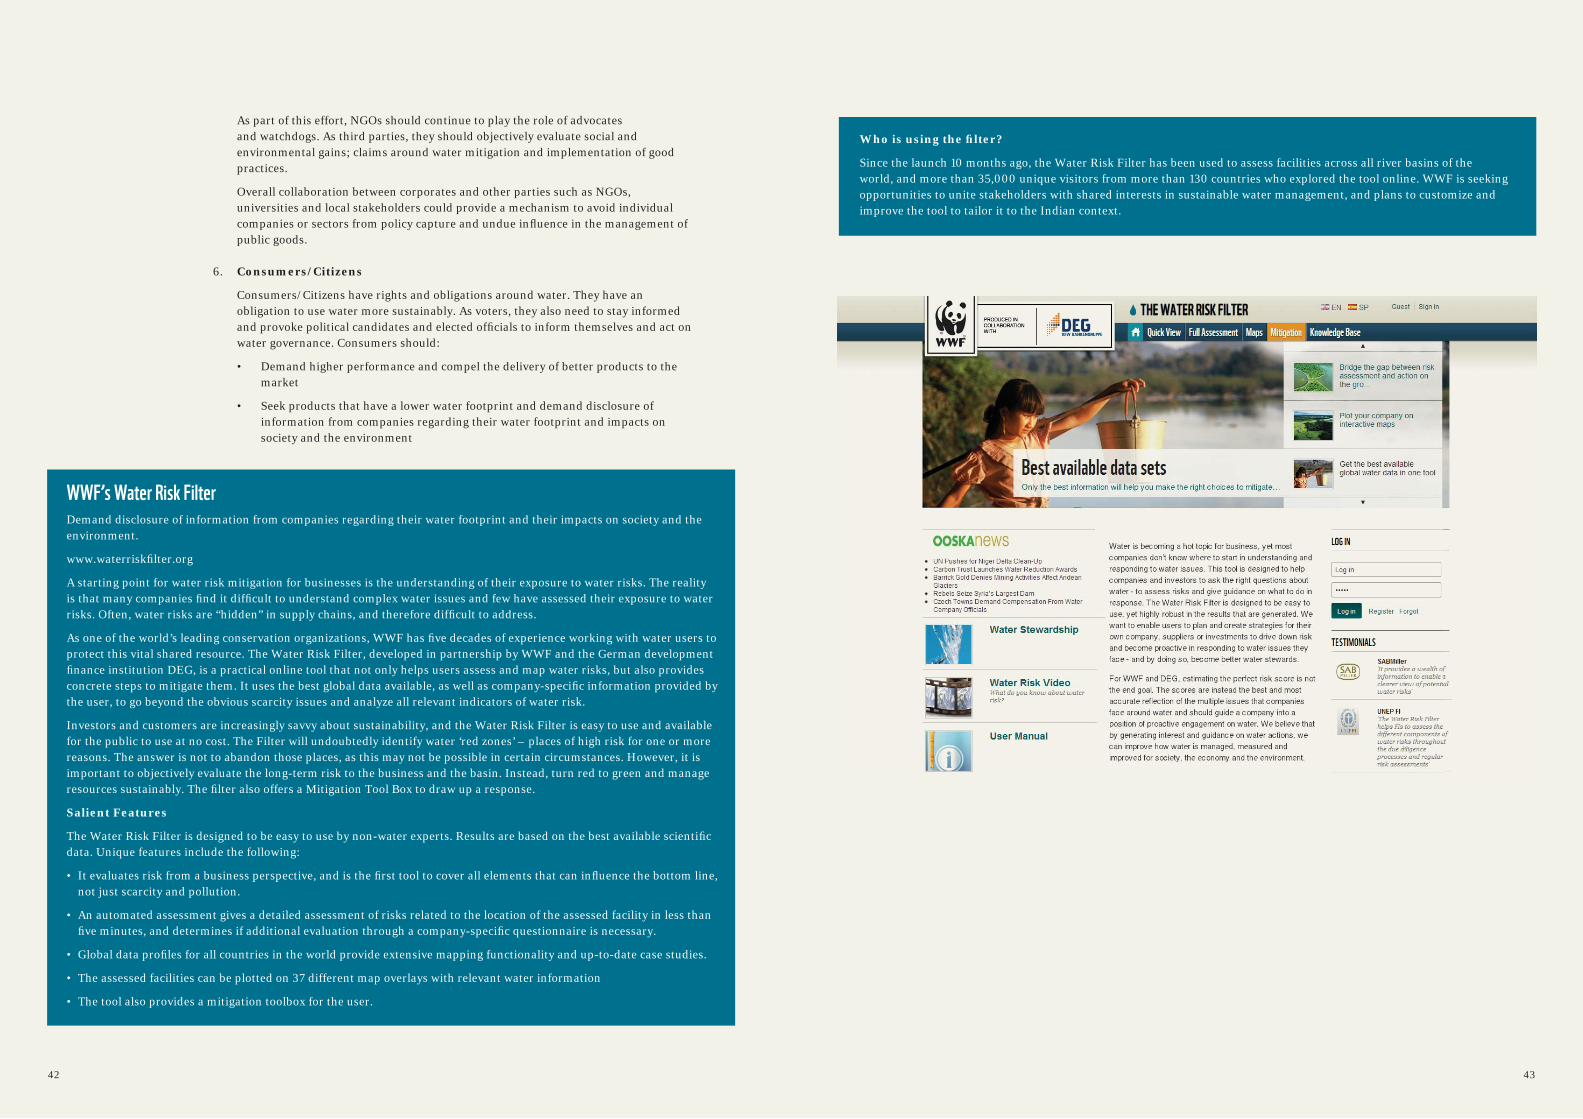
42 4342 43
As part of this effort, NGOs should continue to play the role of advocates and watchdogs. As third parties, they should objectively evaluate social and environmental gains; claims around water mitigation and implementation of good practices.
Overall collaboration between corporates and other parties such as NGOs, universities and local stakeholders could provide a mechanism to avoid individual companies or sectors from policy capture and undue infl uence in the management of public goods.
6. Consumers/Citizens
Consumers/Citizens have rights and obligations around water. They have an obligation to use water more sustainably. As voters, they also need to stay informed and provoke political candidates and elected offi cials to inform themselves and act on water governance. Consumers should:
• Demand higher performance and compel the delivery of better products to the market
• Seek products that have a lower water footprint and demand disclosure of information from companies regarding their water footprint and impacts on society and the environment
WWF’s Water Risk Filter Demand disclosure of information from companies regarding their water footprint and their impacts on society and the environment.
www.waterriskfi lter.org
A starting point for water risk mitigation for businesses is the understanding of their exposure to water risks. The reality is that many companies fi nd it diffi cult to understand complex water issues and few have assessed their exposure to water risks. Often, water risks are “hidden” in supply chains, and therefore diffi cult to address.
As one of the world’s leading conservation organizations, WWF has fi ve decades of experience working with water users to protect this vital shared resource. The Water Risk Filter, developed in partnership by WWF and the German development fi nance institution DEG, is a practical online tool that not only helps users assess and map water risks, but also provides concrete steps to mitigate them. It uses the best global data available, as well as company-specifi c information provided by the user, to go beyond the obvious scarcity issues and analyze all relevant indicators of water risk.
Investors and customers are increasingly savvy about sustainability, and the Water Risk Filter is easy to use and available for the public to use at no cost. The Filter will undoubtedly identify water ‘red zones’ – places of high risk for one or more reasons. The answer is not to abandon those places, as this may not be possible in certain circumstances. However, it is important to objectively evaluate the long-term risk to the business and the basin. Instead, turn red to green and manage resources sustainably. The fi lter also offers a Mitigation Tool Box to draw up a response.
Salient Features
The Water Risk Filter is designed to be easy to use by non-water experts. Results are based on the best available scientifi c data. Unique features include the following:
• It evaluates risk from a business perspective, and is the fi rst tool to cover all elements that can infl uence the bottom line, not just scarcity and pollution.
• An automated assessment gives a detailed assessment of risks related to the location of the assessed facility in less than fi ve minutes, and determines if additional evaluation through a company-specifi c questionnaire is necessary.
• Global data profi les for all countries in the world provide extensive mapping functionality and up-to-date case studies.
• The assessed facilities can be plotted on 37 different map overlays with relevant water information
• The tool also provides a mitigation toolbox for the user.
Who is using the fi lter?
Since the launch 10 months ago, the Water Risk Filter has been used to assess facilities across all river basins of the world, and more than 35,000 unique visitors from more than 130 countries who explored the tool online. WWF is seeking opportunities to unite stakeholders with shared interests in sustainable water management, and plans to customize and improve the tool to tailor it to the Indian context.
44 4544 45
REFERENCES1. UNICEF & WHO, 2012, Progress on drinking water and sanitation 2012 update2. World Bank, 2005, India’s Water Economy: Bracing for a Turbulent Future3. A Case Study of Mysore City, Karnataka, India, Shakunthala Bai, Shivanna
Srikantaswamy, Doddaiah Shivakumar, 15 July 2012, Urban Wastewater Characteristic and its Management in Urban Areas,
4. United Nations Report, India Water Purifi er Market Forecast and Opportunities 2011- 2016
5. WWF, 2012, Living Planet Report6. WWF, 2010, Tropical Freshwater Living Planet Index7. HSBC, June 2012, Exploring the links between water and economic growth,Ganges,
Yangtze, Indus, Nile, Yellow River, Huai He, Niger, Hai, Krishna, and Danube. These ten basins contribute to 10per cent of the GDP in 2010, which is predicted to rise to 25 per cent by 2050. The cumulative GDP will be greater that ofUSA, Japan and Germany combined by 2050
8. HSBC, June 2012, Exploring the links between water and economic growth9. World Resources Institute, 200810. Ministry of Water Resources, 26th April, 2012, Per Capita Water Availability, 11. IDFC, 2011, A River Basin Perspective of Water Resources and Challenges12. Ministry of Water Resources, National Institute of Hydrology, Roorkee13. Ministry of Water Resources, National Institute of Hydrology, Roorkee14. Dr Mihir Shah 2013, Towards a Paradigm shift in the Twelfth Plan, Economic
&Political Weekly, January Anon 2012, National Water Policy, Ministry of Water Resources
15. National Water Resources Framework Study, Council of Energy, Environment and Water, 2012
16. Water Resources Group 2009, Changing Our Water Future17. India Water Management Institute18. 2011, Toward a better appraisal of urbanization in India19. The Hindu, January 5 2007, Economist predicts reduction in poverty ratio by 201220. K.S. Murthy, 2002, River Water Sharing, India’s problems21. The Times of India, 24 Jan 2013 – “Carlsberg brewery in Aurangabad faces dry
daysahead”22. The Times of India, 28 Dec 2012 – “Seven Distilleries to be closed for MahaKumbh”23. Deccan Herald, April 19, 2012 – “MRPL shuts down refi nery due to water shortage”
The Hindu Business Line, April 25, 2012, “Refi nery shut down costs MRPL Rs 20 cr/day; diesel supplies may be hit”
24. Case against Coca Cola Kerala State – India, Available at righttowater.info25. Statistics on Water pollution – unwater.org26. Centre for Science and Environment, 2004 (Figures based on wastewater
dischargedata published by Central Pollution Control Board – CPCB)27. Ministry of Heavy Industries and Department of Industrial Policy and Promotion28. Anon 2012, Power Scenario at a glance, Central Electricity Authority, November
downloaded from http://www.cea.nic.in/reports/planning/power_scenario.pdf29. Water Resources Institute, 2010, Financial Risks from Water Constraints on Power
Generation in Asia30. Centre for Science and Environment, 2004 (Figures based on wastewater
dischargedata published by Central Pollution Control Board – CPCB)31. The Indian Express – 4 July 2010 –“With onset of rains, Chandrapur power
plantback on its feet”32. Anon, Role of Thermal Power Plants and Coal Mining in Local Area Development
and Addressing Regional Imbalance: Conditions and Processes, Prayas Energy Group downloaded from http://www.indiawaterportal.org/sites/indiawaterportal.org/fi les/regional_imbalance_committee_prayas_note_to_gom_june_2012.pdf
33. The Hindu Business Line, 4 December, 2012 , “Proposed power plants may reducewater availability in Wardha, Wainganga rivers”
34. Fibre 2 Fashion news, 15 February 2013, “Indian textile sector to grow 16per cent this year”
35. WWF Global – About_our_earth/about_freshwater/freshwater_problems/thirsty_crops/cotton
36. Alert Net, 24 July 2012, “How much “virtual water” do you use every day “37. KP Nayati, Legislation in India for Management of Water and Waste Waters in
Textiles and Food Industry38. Rita Kant, 14 January 2012, Textile dyeing industry an environmental hazard39. The Hindu – March 11 2012, “Fading fortunes of Tirupur”40. Greenpeace, 2012, Hazardous chemicals in branded textile products on sale in 27
countries during,41. CSE, 2004, Water and Pollution Stress - Green rating of Indian pulp and paper
industry42. Ministry of Environment and Forests, 2010, Technical Guidance Document
for Environmental Clearance in Paper and Pulp, http://environmentclearance.nic.in/writereaddata/Form-1A/HomeLinks/TGM_Pulpper cent20andper cent20Paper_010910_NK.pdf,
43. CSE, 2004, Water and Pollution Stress - Green rating of Indian pulp and paper industry
44. The Assam Tribune, December 17, 2012 –“PCB notice to HPC”45. Times of India, January 18, 2013,“Villagers up in arms against paper mill”46. KPMG, June 2007, “The Indian Sugar Industry: Sector Roadmap”47. The Hindu Business Line Dec 31 2012, “Sugar mills in Maharashtra may crush less
cane this year”48. 80 tons/ha in Tamil Nadu in South India and 58tonnes/ha in UP49. Hindustan Times, December 28, 2012, “Sugar mill sealed for causing pollution”50. Times of India, January 19, 2009, “Sugar factory shut down for violating pollution
Norms”51. Business Standard, January 19, 2013,“Grampanchayat opposes sugar factory
nearreservoir in Maharashtra”52. Report from Mehndiganj near Varanasi - a Coca-Cola affected area. 15th May 2011,
http://www.countercurrents.org/Coca-Cola220511.pdf53. The Hindu, June 5, 2010,“Soft drink plants cause chromium pollution”54. Central Ground Water Authority, November 15, 2012, Guidelines/Criteria for ground
water abstraction55. The Hindu, September 25, 2012, “Assembly panel for keeping tabs on PepsiCo
wateruse”56. CSE, 2012, Green Rating of the Indian Iron and Steel Sector57. Ministry of Steel, India, Anon 2011, Report of the working group on Steel Industry for
Twelfth Five Year Plan,58. Ministry of Steel, India, Anon 2011, Report of the working group on Steel Industry for
Twelfth Five Year Plan,59. CSE, 2012, Green Rating of the Indian Iron and Steel Sector60. CSE, 2012, Green Rating of the Indian Iron and Steel Sector61. The United Nations World Water Development Report 4 – Volume 2 Knowledge Base
– Freshwater for Industry62. The Hindu, April 11, 2012, “Residents protest against ground water pollution”63. Times of India, July 24, 2010, “Paoni residents protest pollution in Wainganga river”64. Times of India, Jan 30, 2012, “Maneka visits Pali to save Bandiriver from pollution”65. Environmental Portal, November 2007, “Protest for Kali river water”
WWF-India is one of the largest conservation organisations engaged in wildlife and nature conservation in the country. Established as a Charitable Trust in 1969, it has an experience of over four decades in the fi eld. Its mission is to stop the degradation of the planet’s natural environment, which it addresses through its work in biodiversity conservation and reduction of humanity’s ecological footprint.
A challenging, constructive, science-based organisation WWF addresses issues like the survival of species and habitats, climate change and energy, sustainable forest management, water resources/river basin management, sustainable agriculture and marine and freshwater conservation. These programmes work across sectors and regions in various parts of the country.
In addition to conservation of biodiversity through fi eld programmes, WWF-India also aims to transform the policies and practices of key industrial sectors to reduce their ecological footprint and develop innovative sustainable solutions.
WWF has been pioneering and developing new water stewardship initiatives to foster genuine, far reaching contributions to responsible water management working closely with governments and the private sector. Water stewardship engagements span a range of activities from better understanding of water, biodiversity and aquatic and other wildlife; water accounting, audits, demand management and effi ciency initiatives; water footprint and risk assessments and response, to pro-active investment in watershed management; development of new international standards and tools, as well as participation in national and international water policy debates. WWF is actively engaged with Indian authorities through fi eld projects and policy advocacy to support basin water management.
ABOUT WWF-INDIA ABOUT ACCENTURE
© R
OH
IT R
ATTA
N \
WW
F-IN
DIA
Accenture is a global management consulting, technology services and outsourcing company, with approximately 259,000 people serving clients in more than 120 countries. Combining unparalleled experience, comprehensive capabilities across all industries and business functions, and extensive research on the world’s most successful companies, Accenture collaborates with clients to help them become high-performance businesses and governments. The company generated net revenues of US$27.9 billion for the fi scal year ended Aug. 31, 2012. Its home page is www.accenture.com.
About Accenture Development PartnershipsAccenture Development Partnerships collaborates with organizations working in the international development sector to help deliver innovative solutions that truly change the way people work and live. Its award-winning business model enables Accenture’s core capabilities—its best people and strategic business, technology and project management expertise—to be made available to clients in the international development sector on a not-for-profi t basis.
About Accenture Sustainability ServicesAccenture Sustainability Services helps organizations achieve substantial improvement in performance and value for their stakeholders. We help clients leverage their assets and capabilities to drive innovation and profi table growth while striving for a positive economic, environmental and social impact. We work with clients across industries and geographies to integrate sustainability approaches into their business strategies, operating models and critical processes. Our holistic approach encompasses strategy, design and execution to increase revenue, reduce cost, manage risk and enhance brand, reputation and intangible assets. We also help clients develop deep insights on sustainability issues based on our ongoing investments in research, including recent studies on consumer expectations and global executive opinion on corporate sustainability and climate change. Find out more at www.accenture.com/sustainability or contact us at [email protected]
48
THIS REPORT HAS BEEN PUBLISHED IN PARTNERSHIP WITH
1961WWF was founded in 1961
WWF has over 5 millionsupporters
+5000WWF has over 5,000staff worldwide
WWF is in over 100 countries, on 5 continents
+100
+5M