Embed Size (px)
Citation preview
Mach Translat (2013) 27:257–280DOI 10.1007/s10590-013-9142-8
Weakly supervised approaches for quality estimation
Erwan Moreau · Carl Vogel
Received: 11 October 2012 / Accepted: 7 May 2013 / Published online: 30 August 2013© Springer Science+Business Media Dordrecht 2013
Abstract Currently, quality estimation (QE) is mostly addressed using supervisedlearning approaches. In this paper we show that unsupervised and weakly supervisedapproaches (using a small training set) perform almost as well as supervised ones, fora significantly lower cost. More generally, we study the various possible definitions,parameters, evaluation methods and approaches for QE, in order to show that thereare multiple possible configurations for this task.
Keywords Quality estimation · Evaluation · Unsupervised learning ·Weakly supervised learning
1 Introduction
Quality estimation (QE) aims to provide a quality indicator for machine translatedsentences. There are many cases where such an indicator would be useful in a trans-lation process: to compare different machine translation (MT) models on a given setof sentences, to tune automatically the parameters of a MT model, to select the badsentences for human translation or post-editing, to select the good sentences for imme-diate publication and try to apply automatic post-editing to the others, or simply toprovide users who are not fluent in the source language information about the fluency
E. Moreau (B)CNGL and Computational Linguistics Group, Centre for Computing and Language Studies,School of Computer Science and Statistics, Trinity College Dublin, Dublin 2, Irelande-mail: [email protected]
C. VogelComputational Linguistics Group, Centre for Computing and Language Studies, School of ComputerScience and Statistics, Trinity College Dublin, Dublin 2, Irelande-mail: [email protected]
123
258 E. Moreau, C. Vogel
of the translated text they are reading. As long as machine translated text cannot be ofreasonably consistent quality, QE is helpful in indicating linguistic quality variability.1
Current approaches in automated QE have naturally focused on supervised learning(for example in Callison-Burch et al. 2012; Gamon et al. 2005; He et al. 2010; Speciaet al. 2011, 2009), since it is usually the best way to obtain optimal results, especially insuch a difficult task which depends on a variety of parameters. Nevertheless we thinkthat it is also interesting to study alternative “weakly supervised” approaches, i.e. eitherunsupervised or supervised with a only small amount of examples. By definition, suchmethods cannot achieve as good results as the “fully supervised” approach, but they areless costly and more flexible. In fact, there is a trade-off between cost and performance,and our main focus in this paper is to show that taking this parameter into account isimportant in the case of QE.
From this perspective we will explore the range of intermediate settings which canbe used, trying to emphasize the differences between those in terms of performance,cost, ease of use and applications. In particular, we will show that the gain in perfor-mance obtained in the fully supervised setting is not very high in general, whereas itscost in terms of data and human expertise is significant. We will start in §2 by present-ing qualitatively the limitations of the fully supervised approach, and by contrast theadvantages of the weakly supervised setting(s). In particular we think that there arenumerous use-cases where the latter is more adequate than the former, for instanceif resources or human expertise/time are missing. Moreover, one of our main focuseswill be the ease of use and the flexibility that the weakly supervised case(s) offer.
In §3 we define formally the different settings that we study, as well as the data andmethods we use in the experiments presented in the following sections. This brings upthe question of evaluation, studied in §4: comparing in detail the different approachesis not trivial, because they correspond to different settings which can not (or nottotally) be evaluated using the same tools; this is one of the reasons why we introducea new evaluation measure, the mean relative rank error (MRRE): this is in fact onlyone of the various ways to use relative rank error, a very simple and intuitive conceptwhich permits comparison of performance in a more meaningful and flexible way thanother metrics. Thus, this metric also serves our purpose of proposing QE tools whichare easy to use and understand. More generally, we conduct a detailed comparisonof the different evaluations methods, showing for each of them their advantages andweaknesses. In particular we observe that the MAE measure, used to evaluate QE asa scoring task and often also to train supervised models, can introduce a bias in thepredicted scores.
Finally, we propose various sets of experiments to validate our assumptions. First,we test our evaluation methods in §5, which also provides some new insights on theresults of the WMT12 Shared Task and more generally on the task of QE. Then wecompare in §6 the fully supervised approach against the totally unsupervised one asranking tasks, and prove that the difference in performance is rather low. Finally in §7we detail how the supervised learning approach performs in the scoring task dependingon the number of examples provided. We show that there is a range of possibilities
1 We focus on translation fluency rather than target language faithfulness to sources.
123
Weakly supervised approaches 259
between the unsupervised and supervised settings which brings flexibility and ease ofuse for a moderate cost. Overall, our aim in this paper is to broaden the scope of QEin terms of possible definitions, approaches, evaluation methods and parameters. Wethink that the current choice in favor of supervised learning approaches in most workson QE results from the focus on performance; this is of course an important criterion,but it should not conceal the others.
2 Motivations
2.1 Different definitions of quality estimation
QE can be defined in several different ways, entailing different approaches:
– As a scoring task, the goal is to provide for every sentence a meaningful scorewhich represents its quality. In the WMT12 Shared Task for instance, scores mustbelong to the range [1,5] and each value can be interpreted according to someprecise predefined guidelines (see §3.1 below);
– As a classification task, the goal is to annotate every sentence with a label takenfrom a predefined set, e.g. good, edit, bad.
– As a ranking task, the goal is only to rank the set of sentences relatively to oneanother. These ranks are less interpretable than a quality score or a label, sincethey do not say if a sentence is good or bad—they only say if it is better or worstthan each other one from the dataset.
It merits mention that it is non-trivial to obtain consistent human evaluation oflinguistic quality, and that the choice of measurement can introduce artifacts. Forexample, a human ranking of sentences among each other for relative grammaticalityon a a pairwise basis may yield a rank ordering that is not transitive; coarse grainedcategories (e.g. {good, edit, bad}) may not sufficiently characterize the range of vari-ability in the data and yield unreliable classifications for items that are at the boundaryof applicability for any label; the scoring task lacks face-validity since people do notappear to operate with a clearly graded grammaticality or acceptability assessmentfunction (Schütze 1996).
Clearly the first two definitions are more helpful in the viewpoint of applications.In theory one can imagine using unsupervised techniques to carry these tasks out (e.g.using unsupervised clustering, like K-means); however it would be very difficult toeffectively predict quality this way, which is why most2 previous works use supervisedlearning in order to provide reliable scores or labels. Thus, these tasks require pre-liminary training, usually using a set of sentences annotated individually with qualityscores (or labels) from a predefined scale.
In contrast, the third definition does not (necessarily) need training: since there isno absolute scale to follow, it is possible to design a system which ranks sentencesbased only on the input data. For example, sentences can be ranked according to theirlength, assuming that longer sentences are more likely to contain errors. In such a case
2 Actually, to the best of our knowledge, all works which study QE in this setting use supervised learning.
123
260 E. Moreau, C. Vogel
the process is totally unsupervised, but in this paper we extend the scope of what wecall “unsupervised” to any system which does not require a training set annotated withquality scores; in particular, this does not exclude the use of other training material,which can typically be some plain text corpus used to train a language model (in thissense the method is actually supervised, but only weakly). Such a distinction makessense here, since there are major differences between these two kinds of training datain terms of applications of QE (see §2.2 below). A ranking permits, for instance,extraction of the N % best or the N % worst sentences, in order to apply a differenttreatment to each such group of sentences. Usually a rank is determined by some kindof numeric value, but this underlying value is different from a quality score: it cannotbe interpreted in a meaningful way in general. Ranking subsumes scoring; i.e., onecan always generate a ranking based on a set of scores, whereas the converse does nothold.3
In the remaining of this study we do not consider the case of classification, whichis less general that the case of scoring. We also only consider the case of simpleunsupervised systems based on a single measure/feature (see §3.3).
2.2 Problems with supervised learning
State of the art QE systems use supervised learning approaches (Callison-Burch et al.2012; He et al. 2010; Specia et al. 2009). Given a corpus of sentences annotated byexperts with quality scores and a set of features, the system is trained using regression(or classification) algorithms, in order to make it able to predict quality scores on anew set of sentences. There are two main constraints in this approach:
– Human expertise is required to annotate the training set with quality scores. Build-ing a good training set is not trivial: given that there can be a high level of dis-agreement between annotators, it is safest to have the same sentences annotatedby more than one expert.4 Often it remains necessary to filter the training data,for example by making scores from different annotators more homogeneous orby discarding items with excessive disagreement (this occurred with the WMT12Shared Task (Callison-Burch et al. 2012) data).
– Lack of reusability is caused by the fact that the target data must be similar tothe training data, as in any supervised learning context. The model can only beapplied to translations tasks with the same pair of source and target languages,but its performance will also depend on target sentences being close to the train-ing data in terms of domain and style (the extent to which this similarity musthold depends a lot on the kind of features used, and possibly on the learning algo-rithm and the guidelines followed by the human annotators). Therefore, the human
3 The transitivity problem mentioned above is averted by ranking sets of sentences in terms of their com-parison to a separate reference corpus. A ranking system can be converted to a classification system byusing thresholds, but in this case it usually requires some supervision. We do not study this case becausewe consider that the main advantage of QE as a ranking task is precisely the fact that it does not needsupervision.4 Further, great care is necessary in setting the terms of the annotation exercise (Schütze 1996, 2005).
123
Weakly supervised approaches 261
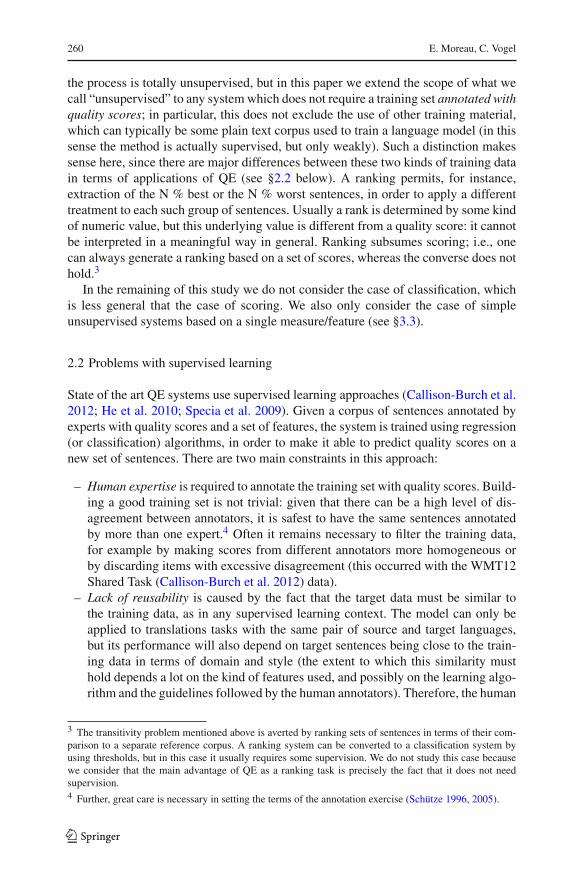
Fig. 1 Predicted score (X)versus actual score (Y) for thebest supervised learning systemin WMT12 (SDLLW). A perfectsystem would be represented asthe diagonal line x = y.Example: the red point at the topcenter represents a very goodsentence (maximum score 5)which is predicted as mediocre(score 3). (Color figure online)
1
2
3
4
5
1 2 3 4 5
SDL (supervised learning, best system WMT12)
Gol
d
0.00.51.01.52.0
Error
expertise required to build the training data will be needed for every distinct kindof document.
These constraints are acceptable if the results allow a significant improvement infinal translation quality. However, currently the scores predicted by a state of the artQE system are not reliable: Fig. 1 shows how predicted and actual quality scores relateto each other for the best supervised learning system (SDLLW Soricut et al. 2012) inthe WMT12 QE Shared Task; a strong correlation is observed, but for a significantnumber of sentences, the predicted quality is far from actual quality. Furthermore,by definition, a QE measure is unlikely to perform better than a (sentence level)MT evaluation metric5 (e.g. HTER, Smooth BLEU, etc.), because the task consistsof doing the same thing with less information. Consequently, even if state-of-the-art performance in QE improves in the future, it can probably never achieve highreliability.6
2.3 The interest of weakly supervised approaches
By definition, weakly supervised approaches cannot perform as well as supervisedapproaches. Their advantage, however, lies in:
– low cost in terms of data and human expertise, as opposed to supervised approaches(see §2.2 above).
– ease of use (unsupervised case only): typically an unsupervised system onlyrequires some reference (monolingual) corpus, which is rather easy to obtain.
5 Assuming the evaluation metric is provided with enough reference sentences (see §5).6 In fact, if it were possible to obtain nearly perfect QE scoring, then nearly perfect MT would not be far,since an ideal MT system could be built in the following way: apply the initial MT system, then start againonly for the output sentences which do not obtain high QE scores, and loop until every sentence obtainsa high score (at each turn the system can be tuned in various ways to improve the quality, possibly usinglearning from the previous results, until convergence).
123
262 E. Moreau, C. Vogel
Additionally, the system is much simpler than in the supervised case and can beused by non-experts.
– flexibility: with an unsupervised measure, the reference corpus can be chosenaccording to the domain/style of the sentences to annotate (it is easier to find anadequate plain text corpus rather than a suitable set of annotated sentences). Thecase of supervised learning is less flexible, but offers the possibility to select thenumber of instances and/or features depending on the ratio quality/cost one wantsto achieve (see §7).
There are a lot of applications where perfect quality is not required (sometimes noteven expected), especially when the customers or users are mainly looking for low costtranslations or products. For example, websites which provide a user forum can offerto their users the possibility to automatically translate a post. As long as the serviceis free, no one expects the translation to be of professional quality. In such a setting,QE does not have to be very reliable, and even a relative ranking by quality can beenough: it can be used to discard or translate manually the N % worst sentences, orto post-edit or publish immediately the N % best sentences. This is why unsupervisedor weakly supervised approaches to QE can be relevant, especially when consideringthe fact that they can perform very well (see §6).
Finally we want to emphasize that the choice between supervised, weakly super-vised or unsupervised QE, as well as the choice of other parameters of the system,depends on the parameters of the application one wants to achieve. In QE, as in manyother tasks, there is a trade-off between cost and quality, and we will show in the nextsections that a large range of strategies is available.
3 Definitions and description of the experimental framework
3.1 Definitions
When considering QE as a scoring task, a predefined scale is given which gives pre-cise indications on how to interpret scores. In the next section we use the WMT12Shared Task (Callison-Burch et al. 2012) dataset, which is based on the followingguidelines:
1. The MT output is incomprehensible, with little or no information transferred accu-rately. It cannot be edited, needs to be translated from scratch.
2. About 50–70 % of the MT output needs to be edited. It requires a significant editingeffort in order to reach publishable level.
3. About 25–50 % of the MT output needs to be edited. It contains different errorsand mistranslations that need to be corrected.
4. About 10–25 % of the MT output needs to be edited. It is generally clear andintelligible.
5. The MT output is perfectly clear and intelligible. It is not necessarily a perfecttranslation, but requires little to no editing.
When considering QE as a ranking task, the sentences are ordered from highestquality to lowest, without any indication of their absolute quality (the first sentence
123
Weakly supervised approaches 263
can actually be very bad or the worst still of high quality). Generally, a ranking isbased on an underlying function which assigns a numerical value7 to every sentence(e.g. the probability of the sentence in a given language model). A ranking assigns arank to every sentence in the input set, usually w.r.t the order of the values sorted inthe appropriate direction. Given a set of sentences S = s1, . . . , sn , a ranking withoutties is a bijection between S and the integers 1, . . . , n. Such a mapping satisfies theranking property:
∑
s∈S
rank(s) =∑
1≤i≤n
i (1)
A ranking taking ties into account is also a function which assigns a rank rank(s) ∈[1, n] to any sentence s, but it is not necessarily a bijection and ranks are not alwaysintegers. We show in §4.1 that taking ties into account (cases where two sentencesare considered of the same quality) can be important in a ranking task. In order tofulfill the ranking property, a set of tied sentences S are all assigned the average rank
r = rmin + rmax
2, where rmin (resp. rmax ) is the lowest (resp. highest) rank that any of
these sentences could have been assigned in a ranking without ties. In order to makerankings comparable, the highest quality sentences are assigned the first (lowest) ranksby convention. Unless otherwise specified, we consider below only rankings with ties.
Spearman’s correlation is the most standard way to compare two rankings. Forany two sets of values, it is defined as Pearson’s correlation applied to the rankingsobtained by sorting these two sets (i.e., using Pearson’s correlation on the ranking isthe same as using Spearman’s correlation on the values).8
3.2 Datasets
The experiments presented in the next sections use the data provided by the the WMT12Shared Task on QE (Callison-Burch et al. 2012). This data consist in:
– The training data is a set of 1,832 sentences translated from English to Spanish;the source and target sentences are provided, as well as a reference translation anda translation obtained by post-editing the output sentence; the quality scores areaveraged over several human annotators, and have been post-processed carefullyto avoid ambiguous cases (Callison-Burch et al. 2012).
– The test data is a set of 422 cases: source and target sentences, reference trans-lations, post-edited translations and quality scores (only the source and targetsentences were available to the participants during the task).
7 We use the generic term value to prevent any confusion with the word score, used only to describe anabsolute indication of quality according to a predefined scale.8 As a consequence, Spearman’s correlation does not make any difference if the two sets of values comefrom different types of distributions.
123
264 E. Moreau, C. Vogel
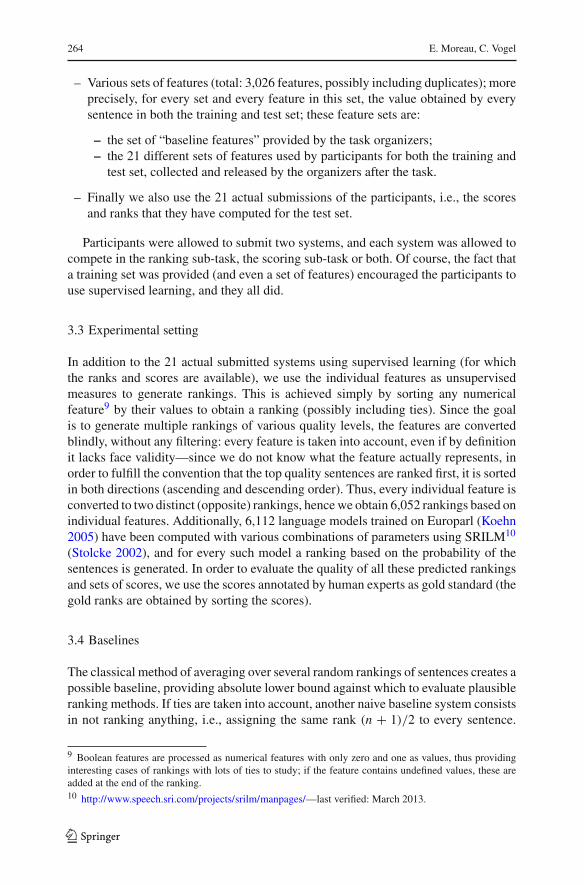
– Various sets of features (total: 3,026 features, possibly including duplicates); moreprecisely, for every set and every feature in this set, the value obtained by everysentence in both the training and test set; these feature sets are:
– the set of “baseline features” provided by the task organizers;– the 21 different sets of features used by participants for both the training and
test set, collected and released by the organizers after the task.
– Finally we also use the 21 actual submissions of the participants, i.e., the scoresand ranks that they have computed for the test set.
Participants were allowed to submit two systems, and each system was allowed tocompete in the ranking sub-task, the scoring sub-task or both. Of course, the fact thata training set was provided (and even a set of features) encouraged the participants touse supervised learning, and they all did.
3.3 Experimental setting
In addition to the 21 actual submitted systems using supervised learning (for whichthe ranks and scores are available), we use the individual features as unsupervisedmeasures to generate rankings. This is achieved simply by sorting any numericalfeature9 by their values to obtain a ranking (possibly including ties). Since the goalis to generate multiple rankings of various quality levels, the features are convertedblindly, without any filtering: every feature is taken into account, even if by definitionit lacks face validity—since we do not know what the feature actually represents, inorder to fulfill the convention that the top quality sentences are ranked first, it is sortedin both directions (ascending and descending order). Thus, every individual feature isconverted to two distinct (opposite) rankings, hence we obtain 6,052 rankings based onindividual features. Additionally, 6,112 language models trained on Europarl (Koehn2005) have been computed with various combinations of parameters using SRILM10
(Stolcke 2002), and for every such model a ranking based on the probability of thesentences is generated. In order to evaluate the quality of all these predicted rankingsand sets of scores, we use the scores annotated by human experts as gold standard (thegold ranks are obtained by sorting the scores).
3.4 Baselines
The classical method of averaging over several random rankings of sentences creates apossible baseline, providing absolute lower bound against which to evaluate plausibleranking methods. If ties are taken into account, another naive baseline system consistsin not ranking anything, i.e., assigning the same rank (n + 1)/2 to every sentence.
9 Boolean features are processed as numerical features with only zero and one as values, thus providinginteresting cases of rankings with lots of ties to study; if the feature contains undefined values, these areadded at the end of the ranking.10 http://www.speech.sri.com/projects/srilm/manpages/—last verified: March 2013.
123
Weakly supervised approaches 265
This is similar to the random ranking, but it is more sophisticated in the sense thatthe middle rank is the optimal choice to minimise the rank error. A more realisticbaseline derives from sentence length, which is a fairly good indicator of quality (thelonger the sentence, the more likely it is to contain errors); Spearman’s correlation oflength against the gold ranking is 0.36 (for the source sentences in English; 0.37 forthe target sentences in Spanish) for the WMT12 test set. As noted by Callison-Burchet al. Callison-Burch et al. (2012), it is also interesting to compare the performance ofrankings against an upper bound (especially for DeltaAvg values, see §4.2): for QE,upper bounds are supplied by sentence-level MT metrics, which compare the outputsentence against the reference (gold standard) translation.
4 Comparison of different evaluation metrics for QE
4.1 The importance of taking ties into account
In the WMT12 Shared Task (Callison-Burch et al. 2012), ties were not allowed forthe sake of simplicity; this is reasonable since the task was mainly designed in asupervised learning perspective, and applying regression techniques with multiplefeatures is unlikely to yield many identical scores. However, ties are more likelyin an unsupervised context, since the ranking is usually a direct function of a setof underlying values.11 Furthermore, there are usually ties in the reference ranking,because human annotators tend to assign integer scores: for the 1,832 sentences thatthe WMT12 training data contains, the annotators have assigned only 23 differentvalues as quality scores.
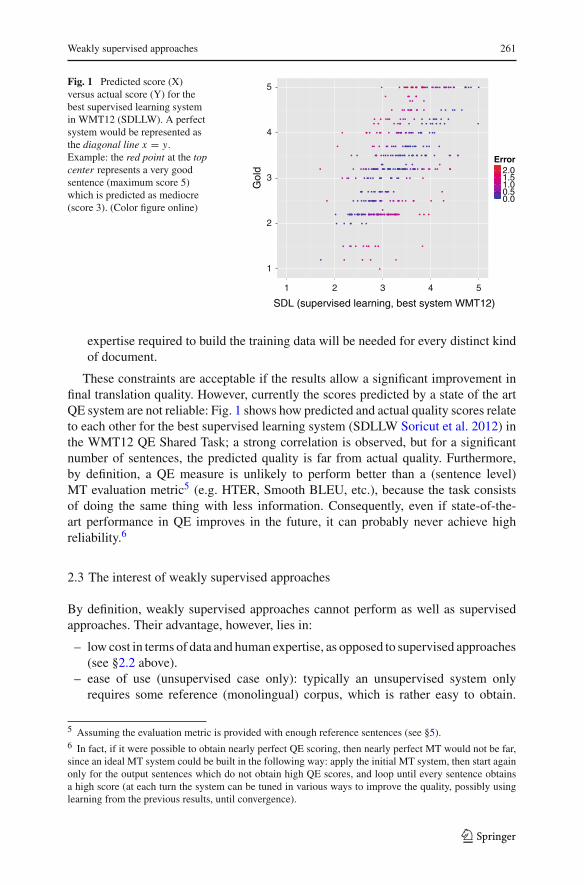
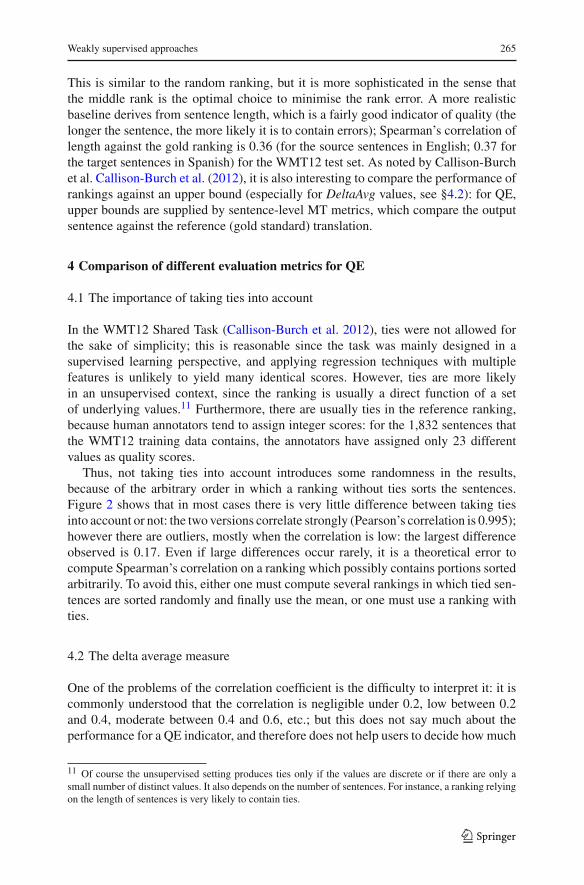
Thus, not taking ties into account introduces some randomness in the results,because of the arbitrary order in which a ranking without ties sorts the sentences.Figure 2 shows that in most cases there is very little difference between taking tiesinto account or not: the two versions correlate strongly (Pearson’s correlation is 0.995);however there are outliers, mostly when the correlation is low: the largest differenceobserved is 0.17. Even if large differences occur rarely, it is a theoretical error tocompute Spearman’s correlation on a ranking which possibly contains portions sortedarbitrarily. To avoid this, either one must compute several rankings in which tied sen-tences are sorted randomly and finally use the mean, or one must use a ranking withties.
4.2 The delta average measure
One of the problems of the correlation coefficient is the difficulty to interpret it: it iscommonly understood that the correlation is negligible under 0.2, low between 0.2and 0.4, moderate between 0.4 and 0.6, etc.; but this does not say much about theperformance for a QE indicator, and therefore does not help users to decide how much
11 Of course the unsupervised setting produces ties only if the values are discrete or if there are only asmall number of distinct values. It also depends on the number of sentences. For instance, a ranking relyingon the length of sentences is very likely to contain ties.
123
266 E. Moreau, C. Vogel
Fig. 2 Spearman correlationwith ties (X) versus without ties(Y) (cor.: 0.995). Relationbetween the different evaluationmeasures. Every predictedranking has been compared tothe gold ranking using differentevaluation measures, and eachpoint represents the result for agiven ranking with two distinctmeasures (12,185 points). Byconstruction some rankings arevery bad (see §3.3), hence thenegative values
−0.50
−0.25
0.00
0.25
0.50
−0.50 −0.25 0.00 0.25 0.50
spearmanCorNoTies
spea
rman
Cor
of the sentences they should post-edit (for instance). In the WMT12 Shared Task, theorganizers introduced a new measure DeltaAvg Callison-Burch et al. (2012), whichdoes not actually compare two rankings together but a ranking against a reference setof scores. This requirement is usually easy to satisfy in an evaluation context (humanannotators provide these scores); however it prevents comparing two (predicted) rank-ings together, and it also prevents comparing two DeltaAvg scores obtained on differ-ent datasets annotated with distinct scoring guidelines/scales. The goal is to make theresulting measure interpretable w.r.t the predefined scale used by the annotators in thefollowing way: “for a given set of ranked entries, a value DeltaAvg of 0.5 means that,on average, the difference in quality between the top-ranked quantiles and the overallquality is 0.5” (Callison-Burch et al. 2012). As a consequence, this measure dependson the distribution of the reference scores: if the evaluated sentences are of similarquality, the DeltaAvg score will be low even if the ranking is correct.12
Delta Avg[n] = 1
n − 1
n−1∑
k=1
V (S1,k) − V (S) (2)
Delta Avg = 1
N − 1
N∑
n=2
Delta Avg[n] (3)
In these equations, V (S) is the average quality score for a set of sentences S, N = |S|2
and for a given number n of quantiles, Si, j is the union of the quantiles Sk for any ksuch that i ≤ k ≤ j .
12 We have tested selecting randomly 200 cases from the WMT12 training set in two cases: among allscores and among scores between two and three. In the first case the maximum DeltaAvg value (obtainedby comparing the ranking to itself) is 0.86, but only 0.28 in the second case.
123
Weakly supervised approaches 267
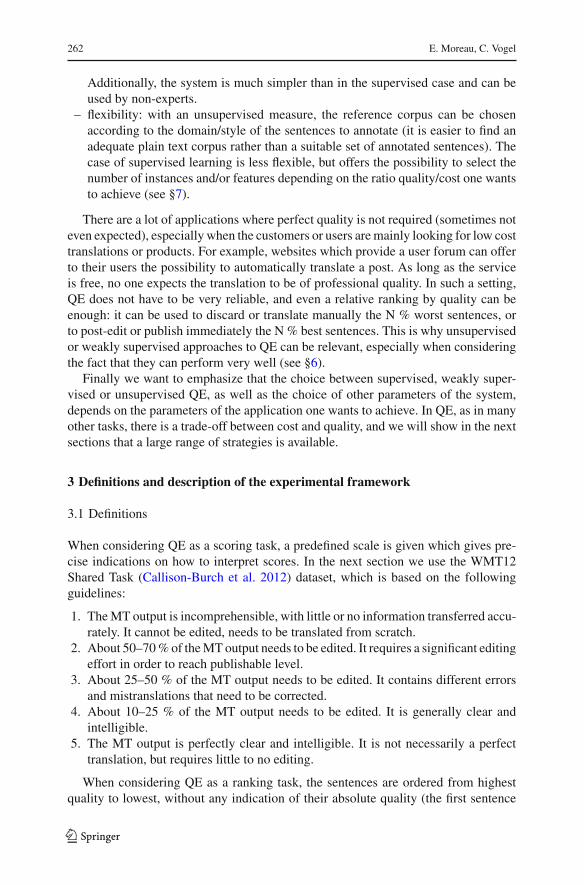
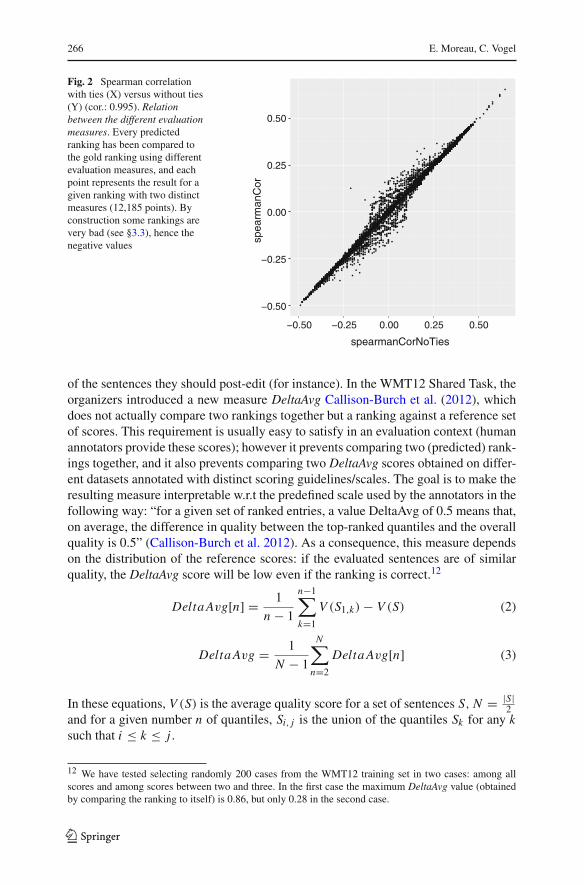
Fig. 3 DeltaAvg (X) versusSpearman correlation with ties(Y) (cor.: 0.986). Relationbetween the different evaluationmeasures. Every predictedranking has been compared tothe gold ranking using differentevaluation measures, and eachpoint represents the result for agiven ranking with two distinctmeasures (12,185 points). Byconstruction some rankings arevery bad (see §3.3), hence thenegative values
−0.50
−0.25
0.00
0.25
0.50
−0.25 0.00 0.25 0.50deltaAvg
spea
rman
Cor
Figure 3 shows that DeltaAvg correlates almost perfectly with Spearman’s coeffi-cient (correlation: 0.98). There can be quite large discrepancies (up to 0.16 between theDeltaAvg value predicted by linear regression and the actual one13), but these appearmostly around zero, whereas better QE methods reach higher scores. Some of thesediscrepancies might be due to the discrete nature of DeltaAvg: the definition statesthat if the number of sentences is not divisible by n when computing Delta Avg[n],the last quantile contains more sentences. This approximation might have an impact,especially on small datasets, but it could be fixed by averaging the quantiles usingappropriate smoothing techniques. The other possible problem of Delta Avg is itsinability to take ties into account, which is also corrigible (in the same way as for theMRRE; see below). Finally, DeltaAvg is computationally intensive since all possiblequantiles must be calculated, which might be an issue for large datasets.
4.3 Relative rank error (RRE) and mean relative rank error (MRRE)
We propose another simple measure to compare two rankings based on the differencebetween the predicted and actual rank. Let S be a set of sentences and rank a rankingon S. First the ranks are normalized in [0, 1] w.r.t the size of the dataset: relative rankR R is defined as in (4) for any s ∈ S.14
R R(s) = rank(s) − 1
|S| − 1(4)
13 That is, if a regression line is drawn on Fig. 3, the maximum vertical distance between a point and theline is 0.16. While in this example the two measures take the same range of values, so that the regressionline is close to the diagonal, this is not true in general.14 Both rank and size are decreased by one to rescale the ranks from [1, n] to [0, 1].
123
268 E. Moreau, C. Vogel
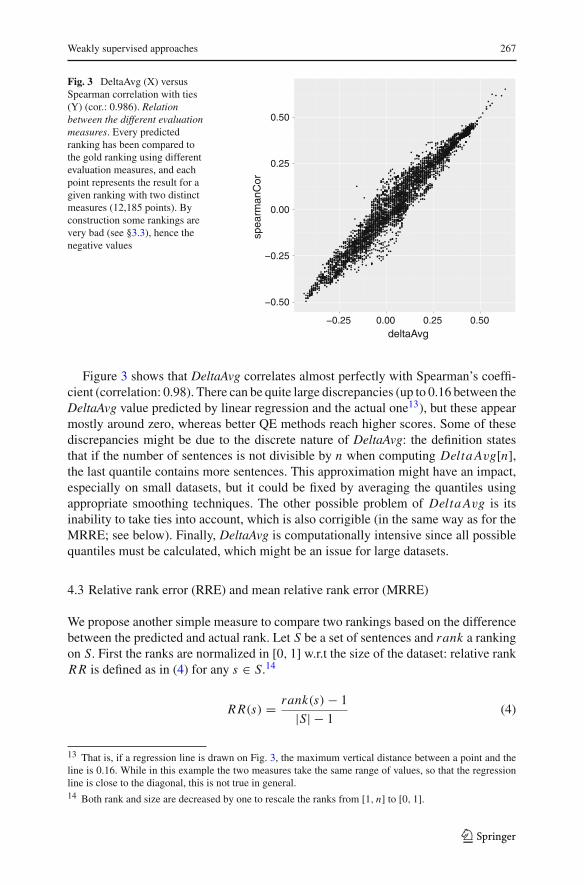
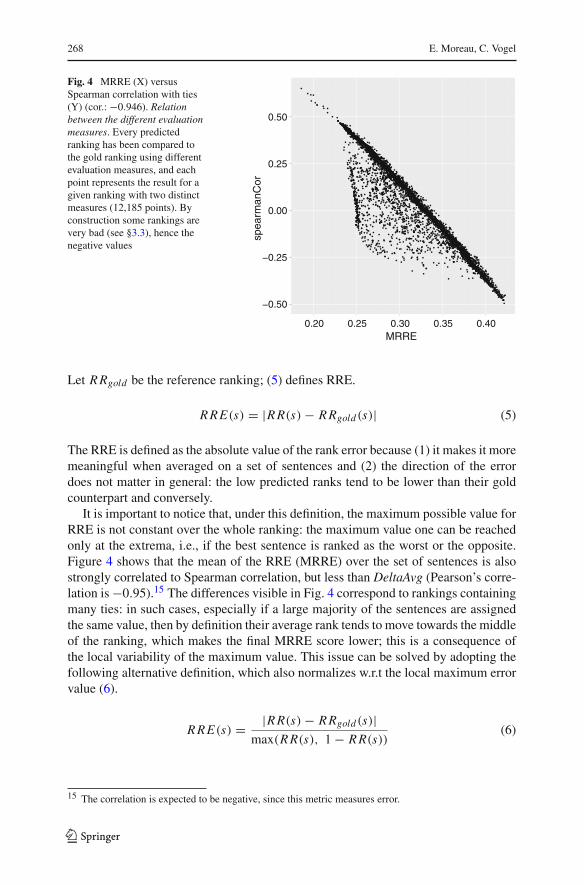
Fig. 4 MRRE (X) versusSpearman correlation with ties(Y) (cor.: −0.946). Relationbetween the different evaluationmeasures. Every predictedranking has been compared tothe gold ranking using differentevaluation measures, and eachpoint represents the result for agiven ranking with two distinctmeasures (12,185 points). Byconstruction some rankings arevery bad (see §3.3), hence thenegative values
−0.50
−0.25
0.00
0.25
0.50
0.20 0.25 0.30 0.35 0.40MRRE
spea
rman
Cor
Let R Rgold be the reference ranking; (5) defines RRE.
R RE(s) = |R R(s) − R Rgold(s)| (5)
The RRE is defined as the absolute value of the rank error because (1) it makes it moremeaningful when averaged on a set of sentences and (2) the direction of the errordoes not matter in general: the low predicted ranks tend to be lower than their goldcounterpart and conversely.
It is important to notice that, under this definition, the maximum possible value forRRE is not constant over the whole ranking: the maximum value one can be reachedonly at the extrema, i.e., if the best sentence is ranked as the worst or the opposite.Figure 4 shows that the mean of the RRE (MRRE) over the set of sentences is alsostrongly correlated to Spearman correlation, but less than DeltaAvg (Pearson’s corre-lation is −0.95).15 The differences visible in Fig. 4 correspond to rankings containingmany ties: in such cases, especially if a large majority of the sentences are assignedthe same value, then by definition their average rank tends to move towards the middleof the ranking, which makes the final MRRE score lower; this is a consequence ofthe local variability of the maximum value. This issue can be solved by adopting thefollowing alternative definition, which also normalizes w.r.t the local maximum errorvalue (6).
R RE(s) = |R R(s) − R Rgold(s)|max(R R(s), 1 − R R(s))
(6)
15 The correlation is expected to be negative, since this metric measures error.
123
Weakly supervised approaches 269
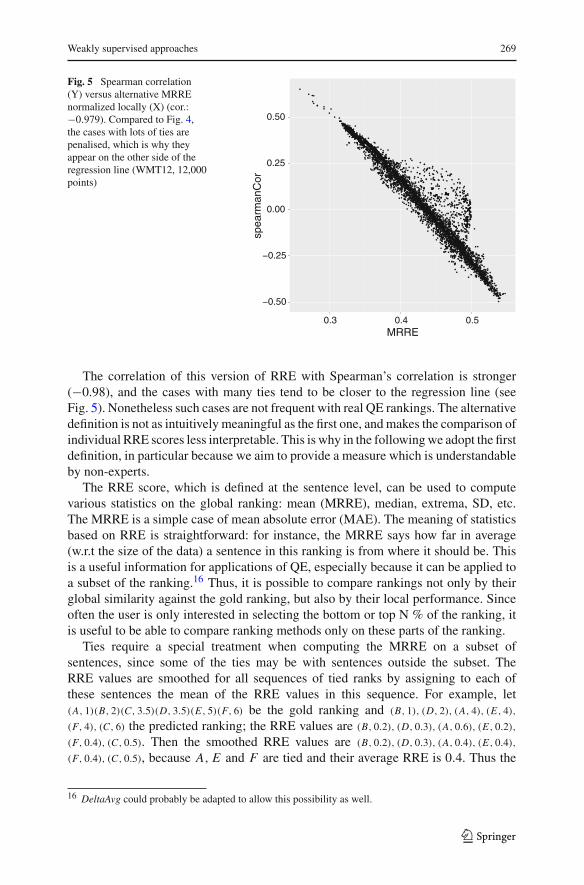
Fig. 5 Spearman correlation(Y) versus alternative MRREnormalized locally (X) (cor.:−0.979). Compared to Fig. 4,the cases with lots of ties arepenalised, which is why theyappear on the other side of theregression line (WMT12, 12,000points)
−0.50
−0.25
0.00
0.25
0.50
0.3 0.4 0.5MRRE
spea
rman
Cor
The correlation of this version of RRE with Spearman’s correlation is stronger(−0.98), and the cases with many ties tend to be closer to the regression line (seeFig. 5). Nonetheless such cases are not frequent with real QE rankings. The alternativedefinition is not as intuitively meaningful as the first one, and makes the comparison ofindividual RRE scores less interpretable. This is why in the following we adopt the firstdefinition, in particular because we aim to provide a measure which is understandableby non-experts.
The RRE score, which is defined at the sentence level, can be used to computevarious statistics on the global ranking: mean (MRRE), median, extrema, SD, etc.The MRRE is a simple case of mean absolute error (MAE). The meaning of statisticsbased on RRE is straightforward: for instance, the MRRE says how far in average(w.r.t the size of the data) a sentence in this ranking is from where it should be. Thisis a useful information for applications of QE, especially because it can be applied toa subset of the ranking.16 Thus, it is possible to compare rankings not only by theirglobal similarity against the gold ranking, but also by their local performance. Sinceoften the user is only interested in selecting the bottom or top N % of the ranking, itis useful to be able to compare ranking methods only on these parts of the ranking.
Ties require a special treatment when computing the MRRE on a subset ofsentences, since some of the ties may be with sentences outside the subset. TheRRE values are smoothed for all sequences of tied ranks by assigning to each ofthese sentences the mean of the RRE values in this sequence. For example, let(A, 1)(B, 2)(C, 3.5)(D, 3.5)(E, 5)(F, 6) be the gold ranking and (B, 1), (D, 2), (A, 4), (E, 4),
(F, 4), (C, 6) the predicted ranking; the RRE values are (B, 0.2), (D, 0.3), (A, 0.6), (E, 0.2),
(F, 0.4), (C, 0.5). Then the smoothed RRE values are (B, 0.2), (D, 0.3), (A, 0.4), (E, 0.4),
(F, 0.4), (C, 0.5), because A, E and F are tied and their average RRE is 0.4. Thus the
16 DeltaAvg could probably be adapted to allow this possibility as well.
123
270 E. Moreau, C. Vogel
0.0
0.2
0.4
0.6
0.8
(−0.001,0.1] (0.1,0.2] (0.2,0.3] (0.3,0.4] (0.4,0.5] (0.5,0.6] (0.6,0.7] (0.7,0.8] (0.8,0.9] (0.9,1]
RelativeRank
RR
E
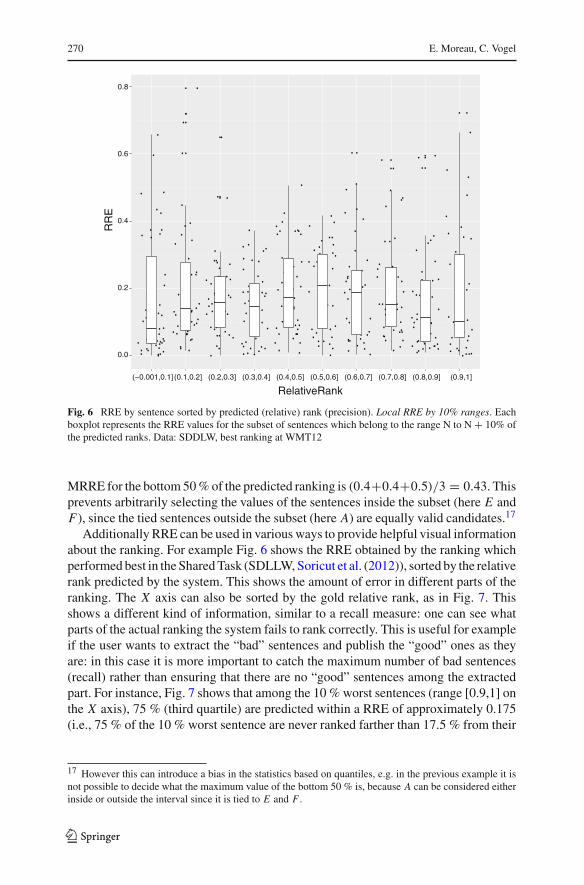
Fig. 6 RRE by sentence sorted by predicted (relative) rank (precision). Local RRE by 10% ranges. Eachboxplot represents the RRE values for the subset of sentences which belong to the range N to N + 10% ofthe predicted ranks. Data: SDDLW, best ranking at WMT12
MRRE for the bottom 50 % of the predicted ranking is (0.4+0.4+0.5)/3 = 0.43. Thisprevents arbitrarily selecting the values of the sentences inside the subset (here E andF), since the tied sentences outside the subset (here A) are equally valid candidates.17
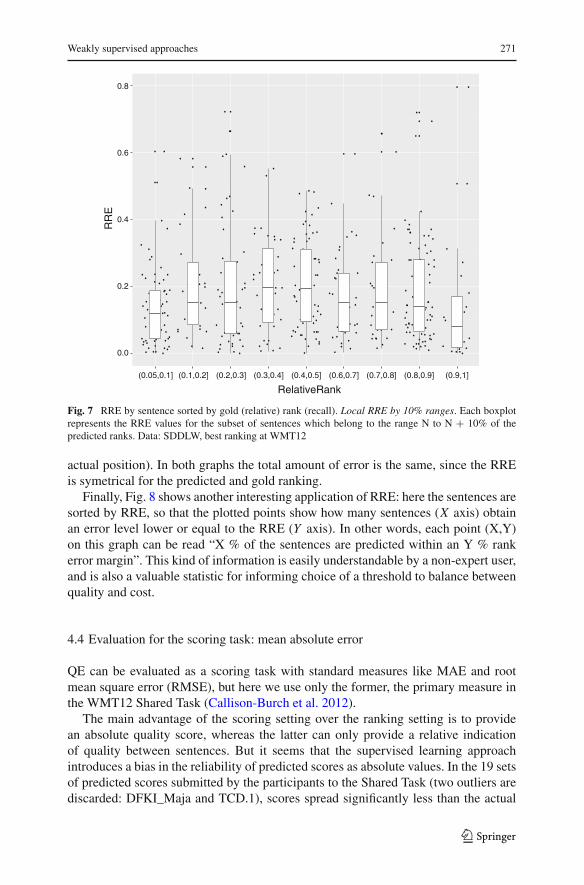
Additionally RRE can be used in various ways to provide helpful visual informationabout the ranking. For example Fig. 6 shows the RRE obtained by the ranking whichperformed best in the Shared Task (SDLLW, Soricut et al. (2012)), sorted by the relativerank predicted by the system. This shows the amount of error in different parts of theranking. The X axis can also be sorted by the gold relative rank, as in Fig. 7. Thisshows a different kind of information, similar to a recall measure: one can see whatparts of the actual ranking the system fails to rank correctly. This is useful for exampleif the user wants to extract the “bad” sentences and publish the “good” ones as theyare: in this case it is more important to catch the maximum number of bad sentences(recall) rather than ensuring that there are no “good” sentences among the extractedpart. For instance, Fig. 7 shows that among the 10 % worst sentences (range [0.9,1] onthe X axis), 75 % (third quartile) are predicted within a RRE of approximately 0.175(i.e., 75 % of the 10 % worst sentence are never ranked farther than 17.5 % from their
17 However this can introduce a bias in the statistics based on quantiles, e.g. in the previous example it isnot possible to decide what the maximum value of the bottom 50 % is, because A can be considered eitherinside or outside the interval since it is tied to E and F .
123
Weakly supervised approaches 271
0.0
0.2
0.4
0.6
0.8
(0.05,0.1] (0.1,0.2] (0.2,0.3] (0.3,0.4] (0.4,0.5] (0.6,0.7] (0.7,0.8] (0.8,0.9] (0.9,1]
RelativeRank
RR
E
Fig. 7 RRE by sentence sorted by gold (relative) rank (recall). Local RRE by 10% ranges. Each boxplotrepresents the RRE values for the subset of sentences which belong to the range N to N + 10% of thepredicted ranks. Data: SDDLW, best ranking at WMT12
actual position). In both graphs the total amount of error is the same, since the RREis symetrical for the predicted and gold ranking.
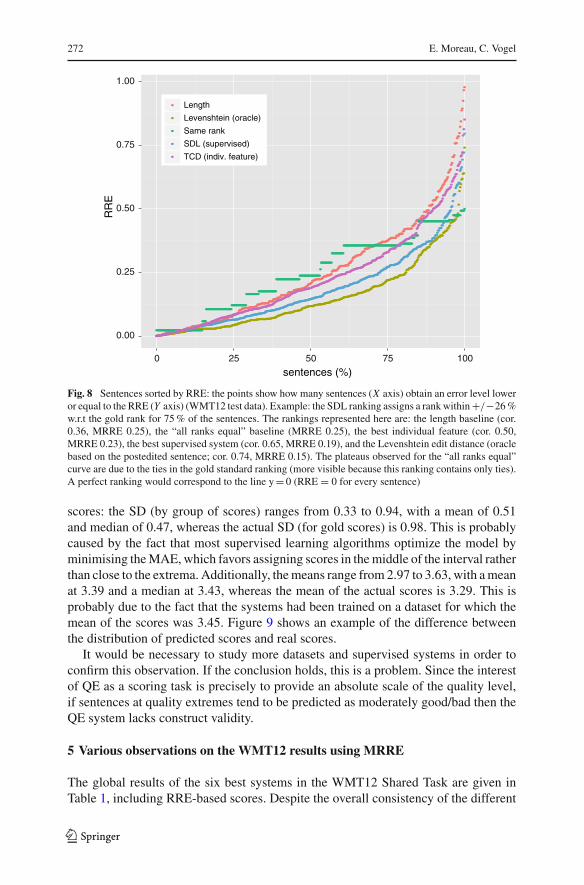
Finally, Fig. 8 shows another interesting application of RRE: here the sentences aresorted by RRE, so that the plotted points show how many sentences (X axis) obtainan error level lower or equal to the RRE (Y axis). In other words, each point (X,Y)on this graph can be read “X % of the sentences are predicted within an Y % rankerror margin”. This kind of information is easily understandable by a non-expert user,and is also a valuable statistic for informing choice of a threshold to balance betweenquality and cost.
4.4 Evaluation for the scoring task: mean absolute error
QE can be evaluated as a scoring task with standard measures like MAE and rootmean square error (RMSE), but here we use only the former, the primary measure inthe WMT12 Shared Task (Callison-Burch et al. 2012).
The main advantage of the scoring setting over the ranking setting is to providean absolute quality score, whereas the latter can only provide a relative indicationof quality between sentences. But it seems that the supervised learning approachintroduces a bias in the reliability of predicted scores as absolute values. In the 19 setsof predicted scores submitted by the participants to the Shared Task (two outliers arediscarded: DFKI_Maja and TCD.1), scores spread significantly less than the actual
123
272 E. Moreau, C. Vogel
0.00
0.25
0.50
0.75
1.00
0 25 50 75 100
sentences (%)
RR
ELength
Levenshtein (oracle)
Same rank
SDL (supervised)
TCD (indiv. feature)
Fig. 8 Sentences sorted by RRE: the points show how many sentences (X axis) obtain an error level loweror equal to the RRE (Y axis) (WMT12 test data). Example: the SDL ranking assigns a rank within +/−26 %w.r.t the gold rank for 75 % of the sentences. The rankings represented here are: the length baseline (cor.0.36, MRRE 0.25), the “all ranks equal” baseline (MRRE 0.25), the best individual feature (cor. 0.50,MRRE 0.23), the best supervised system (cor. 0.65, MRRE 0.19), and the Levenshtein edit distance (oraclebased on the postedited sentence; cor. 0.74, MRRE 0.15). The plateaus observed for the “all ranks equal”curve are due to the ties in the gold standard ranking (more visible because this ranking contains only ties).A perfect ranking would correspond to the line y = 0 (RRE = 0 for every sentence)
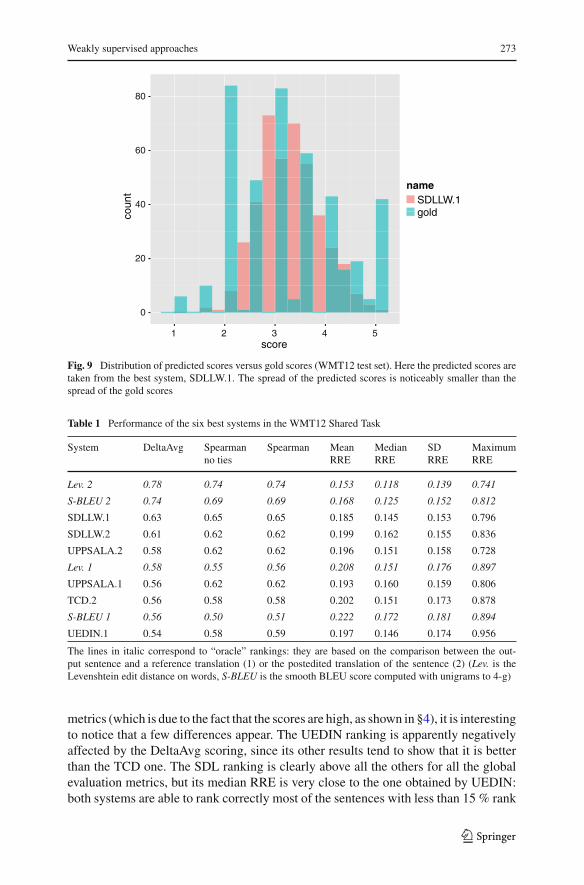
scores: the SD (by group of scores) ranges from 0.33 to 0.94, with a mean of 0.51and median of 0.47, whereas the actual SD (for gold scores) is 0.98. This is probablycaused by the fact that most supervised learning algorithms optimize the model byminimising the MAE, which favors assigning scores in the middle of the interval ratherthan close to the extrema. Additionally, the means range from 2.97 to 3.63, with a meanat 3.39 and a median at 3.43, whereas the mean of the actual scores is 3.29. This isprobably due to the fact that the systems had been trained on a dataset for which themean of the scores was 3.45. Figure 9 shows an example of the difference betweenthe distribution of predicted scores and real scores.
It would be necessary to study more datasets and supervised systems in order toconfirm this observation. If the conclusion holds, this is a problem. Since the interestof QE as a scoring task is precisely to provide an absolute scale of the quality level,if sentences at quality extremes tend to be predicted as moderately good/bad then theQE system lacks construct validity.
5 Various observations on the WMT12 results using MRRE
The global results of the six best systems in the WMT12 Shared Task are given inTable 1, including RRE-based scores. Despite the overall consistency of the different
123
Weakly supervised approaches 273
0
20
40
60
80
1 2 3 4 5score
coun
t
nameSDLLW.1gold
Fig. 9 Distribution of predicted scores versus gold scores (WMT12 test set). Here the predicted scores aretaken from the best system, SDLLW.1. The spread of the predicted scores is noticeably smaller than thespread of the gold scores
Table 1 Performance of the six best systems in the WMT12 Shared Task
System DeltaAvg Spearman Spearman Mean Median SD Maximumno ties RRE RRE RRE RRE
Lev. 2 0.78 0.74 0.74 0.153 0.118 0.139 0.741
S-BLEU 2 0.74 0.69 0.69 0.168 0.125 0.152 0.812
SDLLW.1 0.63 0.65 0.65 0.185 0.145 0.153 0.796
SDLLW.2 0.61 0.62 0.62 0.199 0.162 0.155 0.836
UPPSALA.2 0.58 0.62 0.62 0.196 0.151 0.158 0.728
Lev. 1 0.58 0.55 0.56 0.208 0.151 0.176 0.897
UPPSALA.1 0.56 0.62 0.62 0.193 0.160 0.159 0.806
TCD.2 0.56 0.58 0.58 0.202 0.151 0.173 0.878
S-BLEU 1 0.56 0.50 0.51 0.222 0.172 0.181 0.894
UEDIN.1 0.54 0.58 0.59 0.197 0.146 0.174 0.956
The lines in italic correspond to “oracle” rankings: they are based on the comparison between the out-put sentence and a reference translation (1) or the postedited translation of the sentence (2) (Lev. is theLevenshtein edit distance on words, S-BLEU is the smooth BLEU score computed with unigrams to 4-g)
metrics (which is due to the fact that the scores are high, as shown in §4), it is interestingto notice that a few differences appear. The UEDIN ranking is apparently negativelyaffected by the DeltaAvg scoring, since its other results tend to show that it is betterthan the TCD one. The SDL ranking is clearly above all the others for all the globalevaluation metrics, but its median RRE is very close to the one obtained by UEDIN:both systems are able to rank correctly most of the sentences with less than 15 % rank
123
274 E. Moreau, C. Vogel
bottom10%
bottom20%
top10%
top20%
0.00
0.05
0.10
0.15
0.20
0.25
0.00
0.05
0.10
0.15
0.20
0.25
PR
SDLLW.1SDLLW.2TCD.2UEDIN.1UPPSALA.1UPPSALA.2
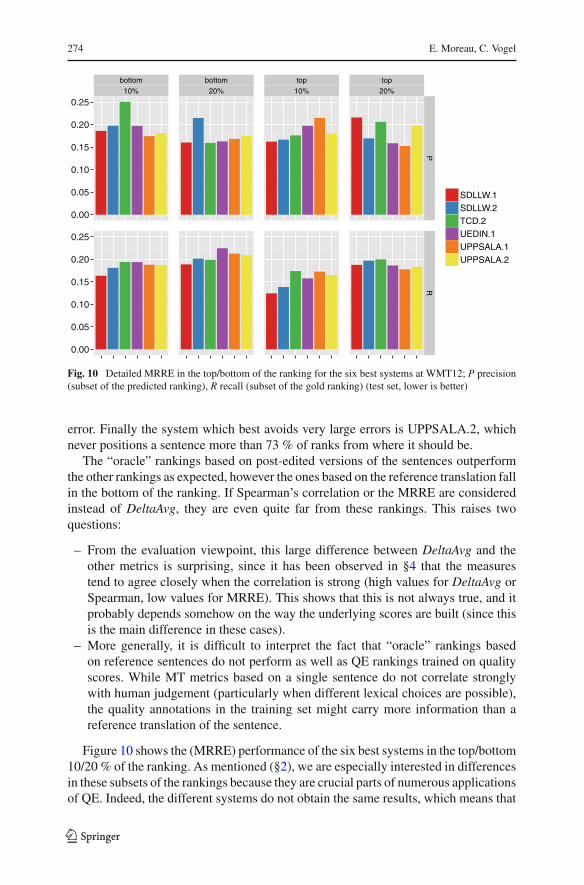
Fig. 10 Detailed MRRE in the top/bottom of the ranking for the six best systems at WMT12; P precision(subset of the predicted ranking), R recall (subset of the gold ranking) (test set, lower is better)
error. Finally the system which best avoids very large errors is UPPSALA.2, whichnever positions a sentence more than 73 % of ranks from where it should be.
The “oracle” rankings based on post-edited versions of the sentences outperformthe other rankings as expected, however the ones based on the reference translation fallin the bottom of the ranking. If Spearman’s correlation or the MRRE are consideredinstead of DeltaAvg, they are even quite far from these rankings. This raises twoquestions:
– From the evaluation viewpoint, this large difference between DeltaAvg and theother metrics is surprising, since it has been observed in §4 that the measurestend to agree closely when the correlation is strong (high values for DeltaAvg orSpearman, low values for MRRE). This shows that this is not always true, and itprobably depends somehow on the way the underlying scores are built (since thisis the main difference in these cases).
– More generally, it is difficult to interpret the fact that “oracle” rankings basedon reference sentences do not perform as well as QE rankings trained on qualityscores. While MT metrics based on a single sentence do not correlate stronglywith human judgement (particularly when different lexical choices are possible),the quality annotations in the training set might carry more information than areference translation of the sentence.
Figure 10 shows the (MRRE) performance of the six best systems in the top/bottom10/20 % of the ranking. As mentioned (§2), we are especially interested in differencesin these subsets of the rankings because they are crucial parts of numerous applicationsof QE. Indeed, the different systems do not obtain the same results, which means that
123
Weakly supervised approaches 275
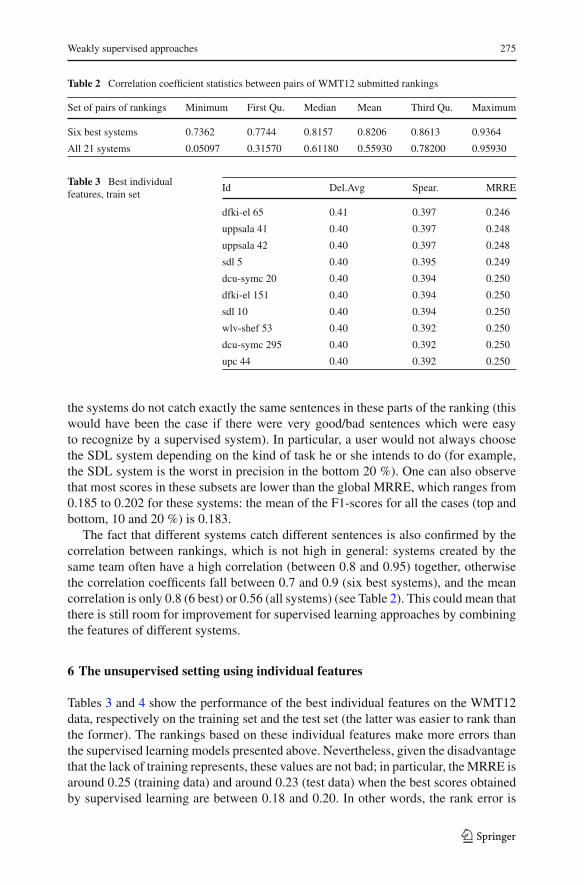
Table 2 Correlation coefficient statistics between pairs of WMT12 submitted rankings
Set of pairs of rankings Minimum First Qu. Median Mean Third Qu. Maximum
Six best systems 0.7362 0.7744 0.8157 0.8206 0.8613 0.9364
All 21 systems 0.05097 0.31570 0.61180 0.55930 0.78200 0.95930
Table 3 Best individualfeatures, train set
Id Del.Avg Spear. MRRE
dfki-el 65 0.41 0.397 0.246
uppsala 41 0.40 0.397 0.248
uppsala 42 0.40 0.397 0.248
sdl 5 0.40 0.395 0.249
dcu-symc 20 0.40 0.394 0.250
dfki-el 151 0.40 0.394 0.250
sdl 10 0.40 0.394 0.250
wlv-shef 53 0.40 0.392 0.250
dcu-symc 295 0.40 0.392 0.250
upc 44 0.40 0.392 0.250
the systems do not catch exactly the same sentences in these parts of the ranking (thiswould have been the case if there were very good/bad sentences which were easyto recognize by a supervised system). In particular, a user would not always choosethe SDL system depending on the kind of task he or she intends to do (for example,the SDL system is the worst in precision in the bottom 20 %). One can also observethat most scores in these subsets are lower than the global MRRE, which ranges from0.185 to 0.202 for these systems: the mean of the F1-scores for all the cases (top andbottom, 10 and 20 %) is 0.183.
The fact that different systems catch different sentences is also confirmed by thecorrelation between rankings, which is not high in general: systems created by thesame team often have a high correlation (between 0.8 and 0.95) together, otherwisethe correlation coefficents fall between 0.7 and 0.9 (six best systems), and the meancorrelation is only 0.8 (6 best) or 0.56 (all systems) (see Table 2). This could mean thatthere is still room for improvement for supervised learning approaches by combiningthe features of different systems.
6 The unsupervised setting using individual features
Tables 3 and 4 show the performance of the best individual features on the WMT12data, respectively on the training set and the test set (the latter was easier to rank thanthe former). The rankings based on these individual features make more errors thanthe supervised learning models presented above. Nevertheless, given the disadvantagethat the lack of training represents, these values are not bad; in particular, the MRRE isaround 0.25 (training data) and around 0.23 (test data) when the best scores obtainedby supervised learning are between 0.18 and 0.20. In other words, the rank error is
123
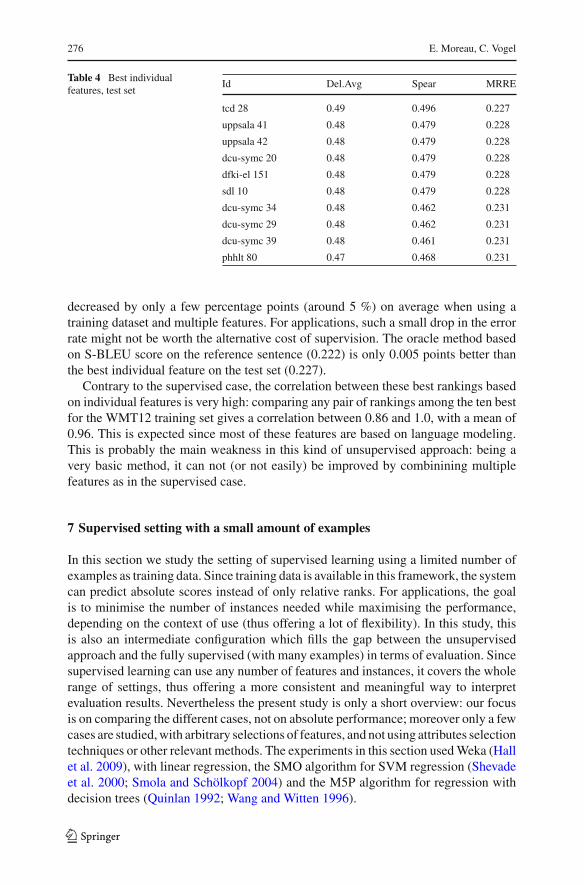
276 E. Moreau, C. Vogel
Table 4 Best individualfeatures, test set
Id Del.Avg Spear MRRE
tcd 28 0.49 0.496 0.227
uppsala 41 0.48 0.479 0.228
uppsala 42 0.48 0.479 0.228
dcu-symc 20 0.48 0.479 0.228
dfki-el 151 0.48 0.479 0.228
sdl 10 0.48 0.479 0.228
dcu-symc 34 0.48 0.462 0.231
dcu-symc 29 0.48 0.462 0.231
dcu-symc 39 0.48 0.461 0.231
phhlt 80 0.47 0.468 0.231
decreased by only a few percentage points (around 5 %) on average when using atraining dataset and multiple features. For applications, such a small drop in the errorrate might not be worth the alternative cost of supervision. The oracle method basedon S-BLEU score on the reference sentence (0.222) is only 0.005 points better thanthe best individual feature on the test set (0.227).
Contrary to the supervised case, the correlation between these best rankings basedon individual features is very high: comparing any pair of rankings among the ten bestfor the WMT12 training set gives a correlation between 0.86 and 1.0, with a mean of0.96. This is expected since most of these features are based on language modeling.This is probably the main weakness in this kind of unsupervised approach: being avery basic method, it can not (or not easily) be improved by combinining multiplefeatures as in the supervised case.
7 Supervised setting with a small amount of examples
In this section we study the setting of supervised learning using a limited number ofexamples as training data. Since training data is available in this framework, the systemcan predict absolute scores instead of only relative ranks. For applications, the goalis to minimise the number of instances needed while maximising the performance,depending on the context of use (thus offering a lot of flexibility). In this study, thisis also an intermediate configuration which fills the gap between the unsupervisedapproach and the fully supervised (with many examples) in terms of evaluation. Sincesupervised learning can use any number of features and instances, it covers the wholerange of settings, thus offering a more consistent and meaningful way to interpretevaluation results. Nevertheless the present study is only a short overview: our focusis on comparing the different cases, not on absolute performance; moreover only a fewcases are studied, with arbitrary selections of features, and not using attributes selectiontechniques or other relevant methods. The experiments in this section used Weka (Hallet al. 2009), with linear regression, the SMO algorithm for SVM regression (Shevadeet al. 2000; Smola and Schölkopf 2004) and the M5P algorithm for regression withdecision trees (Quinlan 1992; Wang and Witten 1996).
123
Weakly supervised approaches 277
0.0
0.3
0.6
0.9
1.2
5 10 20 40 80 160 320 1832nbInstances
mea
n(m
eanA
vgE
rr) name.nbFeatures
baseline−4.1baseline−5.1dcu−symc−21.1uppsala−41.1sdl−11.1baseline.5baseline.10baseline.17sdl.15
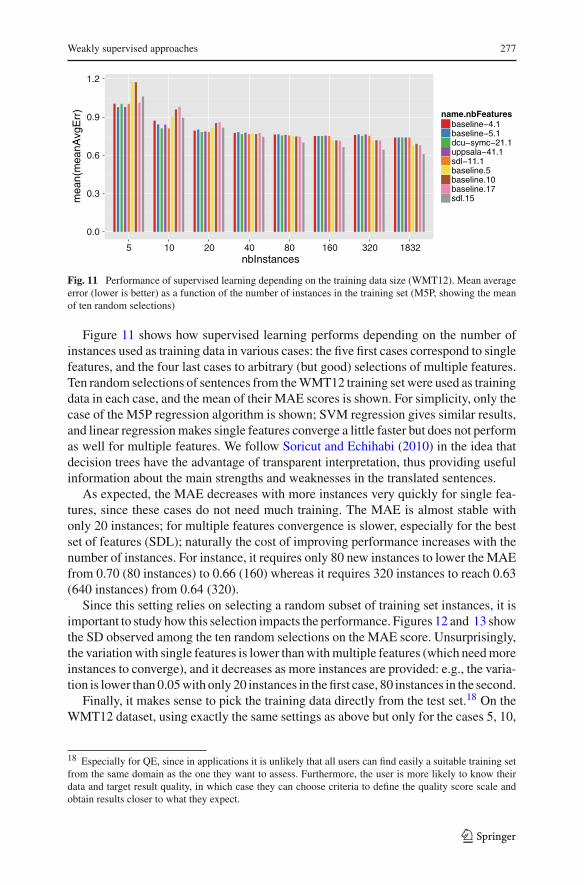
Fig. 11 Performance of supervised learning depending on the training data size (WMT12). Mean averageerror (lower is better) as a function of the number of instances in the training set (M5P, showing the meanof ten random selections)
Figure 11 shows how supervised learning performs depending on the number ofinstances used as training data in various cases: the five first cases correspond to singlefeatures, and the four last cases to arbitrary (but good) selections of multiple features.Ten random selections of sentences from the WMT12 training set were used as trainingdata in each case, and the mean of their MAE scores is shown. For simplicity, only thecase of the M5P regression algorithm is shown; SVM regression gives similar results,and linear regression makes single features converge a little faster but does not performas well for multiple features. We follow Soricut and Echihabi (2010) in the idea thatdecision trees have the advantage of transparent interpretation, thus providing usefulinformation about the main strengths and weaknesses in the translated sentences.
As expected, the MAE decreases with more instances very quickly for single fea-tures, since these cases do not need much training. The MAE is almost stable withonly 20 instances; for multiple features convergence is slower, especially for the bestset of features (SDL); naturally the cost of improving performance increases with thenumber of instances. For instance, it requires only 80 new instances to lower the MAEfrom 0.70 (80 instances) to 0.66 (160) whereas it requires 320 instances to reach 0.63(640 instances) from 0.64 (320).
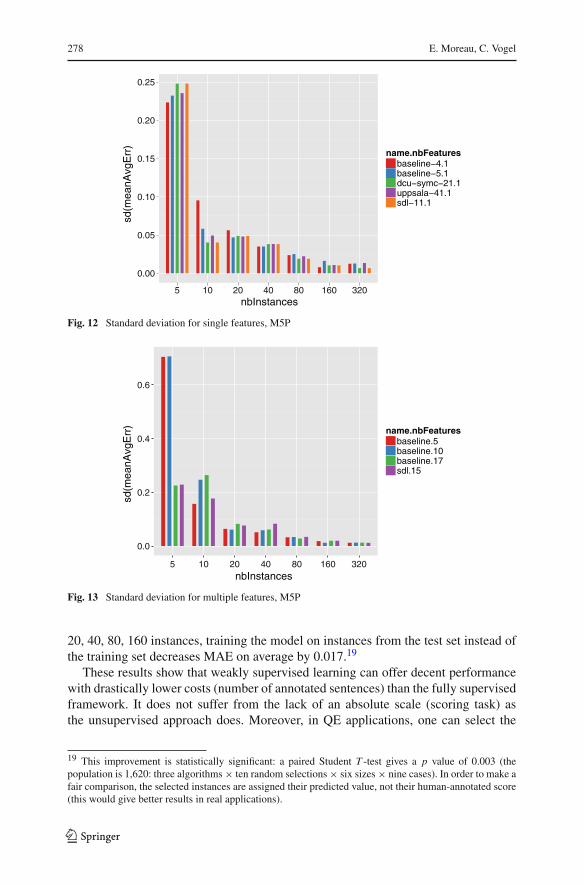
Since this setting relies on selecting a random subset of training set instances, it isimportant to study how this selection impacts the performance. Figures 12 and 13 showthe SD observed among the ten random selections on the MAE score. Unsurprisingly,the variation with single features is lower than with multiple features (which need moreinstances to converge), and it decreases as more instances are provided: e.g., the varia-tion is lower than 0.05 with only 20 instances in the first case, 80 instances in the second.
Finally, it makes sense to pick the training data directly from the test set.18 On theWMT12 dataset, using exactly the same settings as above but only for the cases 5, 10,
18 Especially for QE, since in applications it is unlikely that all users can find easily a suitable training setfrom the same domain as the one they want to assess. Furthermore, the user is more likely to know theirdata and target result quality, in which case they can choose criteria to define the quality score scale andobtain results closer to what they expect.
123
278 E. Moreau, C. Vogel
0.00
0.05
0.10
0.15
0.20
0.25
5 10 20 40 80 160 320nbInstances
sd(m
eanA
vgE
rr)
name.nbFeaturesbaseline−4.1baseline−5.1dcu−symc−21.1uppsala−41.1sdl−11.1
Fig. 12 Standard deviation for single features, M5P
0.0
0.2
0.4
0.6
5 10 20 40 80 160 320nbInstances
sd(m
eanA
vgE
rr) name.nbFeatures
baseline.5baseline.10baseline.17sdl.15
Fig. 13 Standard deviation for multiple features, M5P
20, 40, 80, 160 instances, training the model on instances from the test set instead ofthe training set decreases MAE on average by 0.017.19
These results show that weakly supervised learning can offer decent performancewith drastically lower costs (number of annotated sentences) than the fully supervisedframework. It does not suffer from the lack of an absolute scale (scoring task) asthe unsupervised approach does. Moreover, in QE applications, one can select the
19 This improvement is statistically significant: a paired Student T -test gives a p value of 0.003 (thepopulation is 1,620: three algorithms × ten random selections × six sizes × nine cases). In order to make afair comparison, the selected instances are assigned their predicted value, not their human-annotated score(this would give better results in real applications).
123
Weakly supervised approaches 279
appropriate number of features and instances depending on the target quality, the cost(or available human annotators/time) and the target level of confidence (typically basedon the expected SD), thus offering more flexiblity in the quality/cost trade-off.
8 Conclusion and future work
This paper has shown that there are reasons to study QE not only from the angleof performance. In particular, there are less costly possibilities than learning a modelfrom a large set of annotated sentences which perform decently. We have also exploredvarious ways to evaluate this task, including MRRE which is a very intuitive measureand can provide detail about the most crucial subsets of sentences.
Next steps include study of the framework of active learning for QE. We think thatthis might be an interesting alternative to using a large training dataset, because if thereare not too many sentences these can be annotated directly by the user. This avoidsthe problem of the domain of the training set and gives the user more control over thequality criteria.
Acknowledgments We are grateful to the organizers of the WMT12 Shared Task on QE for not onlyorganizing the task but also collecting and releasing the sets of features of all participants afterwards. We alsothank the reviewers for their valuable comments. This research is supported by Science Foundation Ireland(Grant 07/CE/I1142) as part of the Centre for Next Generation Localisation (www.cngl.ie) funding at TrinityCollege, University of Dublin. Most calculations were performed on the Lonsdale cluster maintained bythe Trinity Centre for High Performance Computing. This cluster was funded through Grants from ScienceFoundation Ireland. The graphics in this paper were created with R Core Team (2012), using the ggplot2library (Wickham 2009).
References
Callison-Burch C, Koehn P, Monz C, Post M, Soricut R, Specia L (2012) Findings of the 2012 workshop onstatistical machine translation. In: Proceedings of the seventh workshop on statistical machine translation.Association for Computational Linguistics, Montréal
Gamon M, Aue A, Smets M (2005) Sentence-level MT evaluation without reference translations: beyondlanguage modeling. In: Proceedings of EAMT, pp 103–111
Hall M, Frank E, Holmes G, Pfahringer B, Reutemann P, Witten I (2009) The weka data mining software:an update. ACM SIGKDD Explor Newsl 11(1):10–18
He Y, Ma Y, van Genabith J, Way A (2010) Bridging SMT and TM with translation recommendation. In:Proceedings of the 48th annual meeting of the association for computational linguistics. Association forComputational Linguistics, Montréal, pp 622–630
Koehn P (2005) Europarl: a parallel corpus for statistical machine translation. In: MT summit, vol 5Quinlan J (1992) Learning with continuous classes. In: Proceedings of the 5th Australian joint conference
on artificial intelligence, Singapore, pp 343–348R Core Team (2012) R: a language and environment for statistical computing. R Foundation for Statistical
Computing, Vienna. ISBN 3-900051-07-0Schütze C (1996) The empirical base of linguistics: grammaticality judgements and linguistic methodology.
University of Chicago Press, ChicagoSchütze C (2005) Thinking about what we are asking speakers to do. In: Kepsar S, Reis M (eds) Linguistic
evidence: empirical, theoretical and computational perspectives. Studies in generative grammar, vol 85.Mouton De Gruyter, Berlin, pp 457–485
Shevade S, Keerthi S, Bhattacharyya C, Murthy K (2000) Improvements to the SMO algorithm for SVMregression. IEEE Trans Neural Netw 11(5):1188–1193
Smola A, Schölkopf B (2004) A tutorial on support vector regression. Stat Comput 14(3):199–222
123
280 E. Moreau, C. Vogel
Soricut R, Echihabi A (2010) Trustrank: inducing trust in automatic translations via ranking. In: Pro-ceedings of the 48th annual meeting of the association for computational linguistics. Association forComputational Linguistics, Montréal, pp 612–621
Soricut R, Bach N, Wang Z (2012) The SDL language weaver systems in the WMT12 quality estimationshared task. In: Proceedings of the seventh workshop on statistical machine translation. Association forComputational Linguistics, Montréal, pp 145–151. http://www.aclweb.org/anthology/W12-3118
Specia L, Turchi M, Cancedda N, Dymetman M, Cristianini N (2009) Estimating the sentence-level qualityof machine translation systems. In: Proceedings of the 13th conference of the European association formachine translation, pp 28–35
Specia L, Hajlaoui N, Hallett C, Aziz W (2011) Predicting machine translation adequacy. In: Machinetranslation summit XIII, Xiamen
Stolcke A et al (2002) SRILM-an extensible language modeling toolkit. In: Proceedings of the internationalconference on spoken language processing, vol 2, pp 901–904
Wang Y, Witten I (1996) Induction of model trees for predicting continuous classes. Working paper series.University of Waikato, Hamilton
Wickham H (2009) Ggplot2: elegant graphics for data analysis. Springer, New York
123