Embed Size (px)
Citation preview
E-18
53 Weather and Climate
The word weather is used to describe what’s happening outsideat a specific time and place, and it can change from day to day
or even within a day. Climate (KLY-met) describes the averageweather in a place over a fairly long period of time (usually at least 30years). Climatologists (kly-muh-TOL-o-jists) are scientists who studythe earth’s climates. They use such factors as temperature and precip-itation to describe different types of climate. For example, think aboutthe climate of a desert as opposed to a tropical rainforest and howtheir temperatures and precipitation vary.
How do climates vary?
CHALLENGE
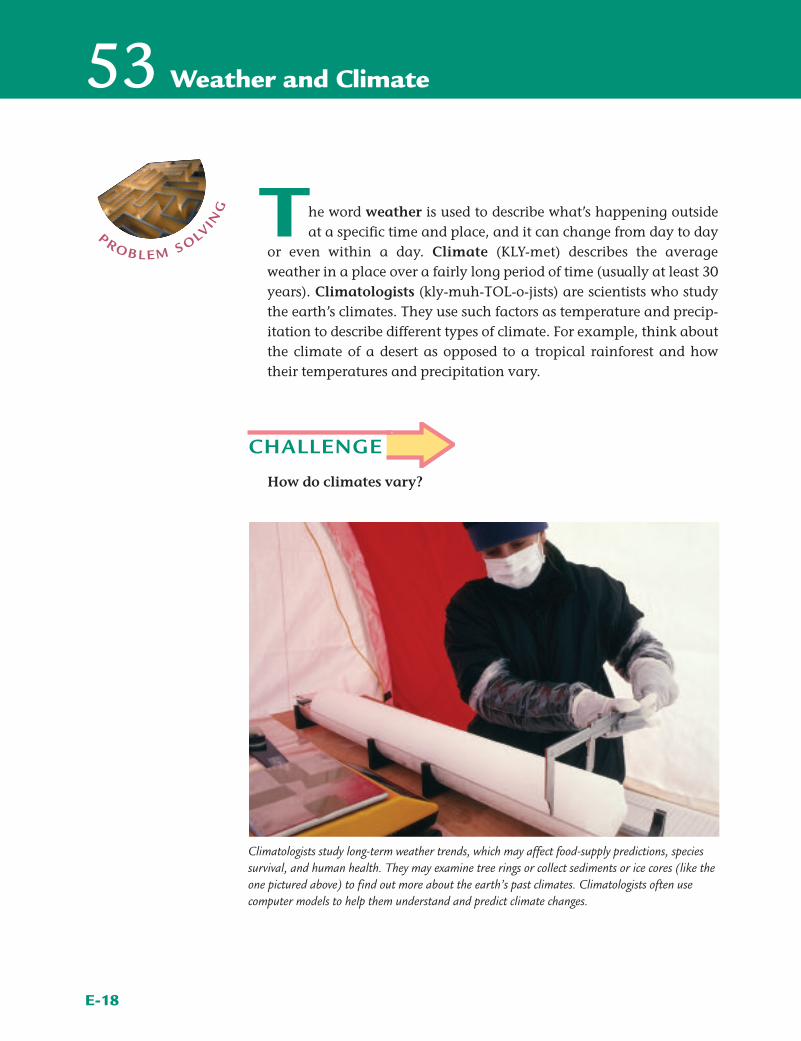
Climatologists study long-term weather trends, which may affect food-supply predictions, speciessurvival, and human health. They may examine tree rings or collect sediments or ice cores (like theone pictured above) to find out more about the earth’s past climates. Climatologists often usecomputer models to help them understand and predict climate changes.
PRO B LE M S OLVING
PROCEDURE
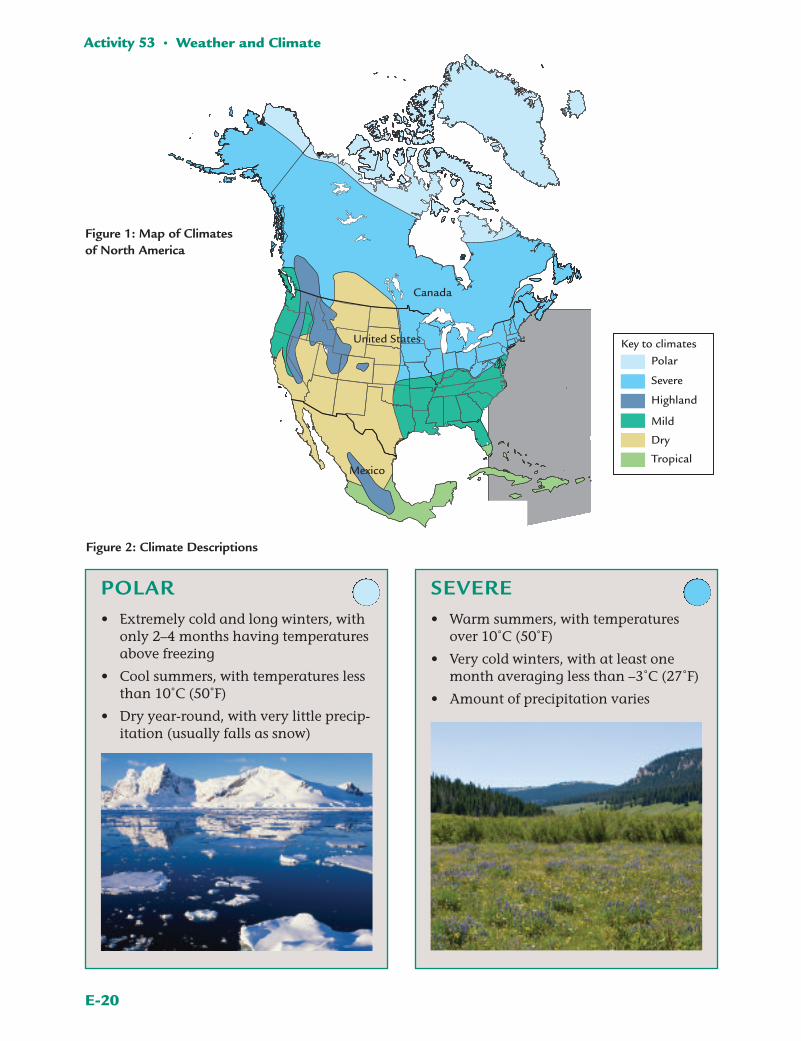
1. Examine Figure 1, “Map of Climates of North America,” shown onthe next page. It shows some of the different climates found in thispart of the earth.
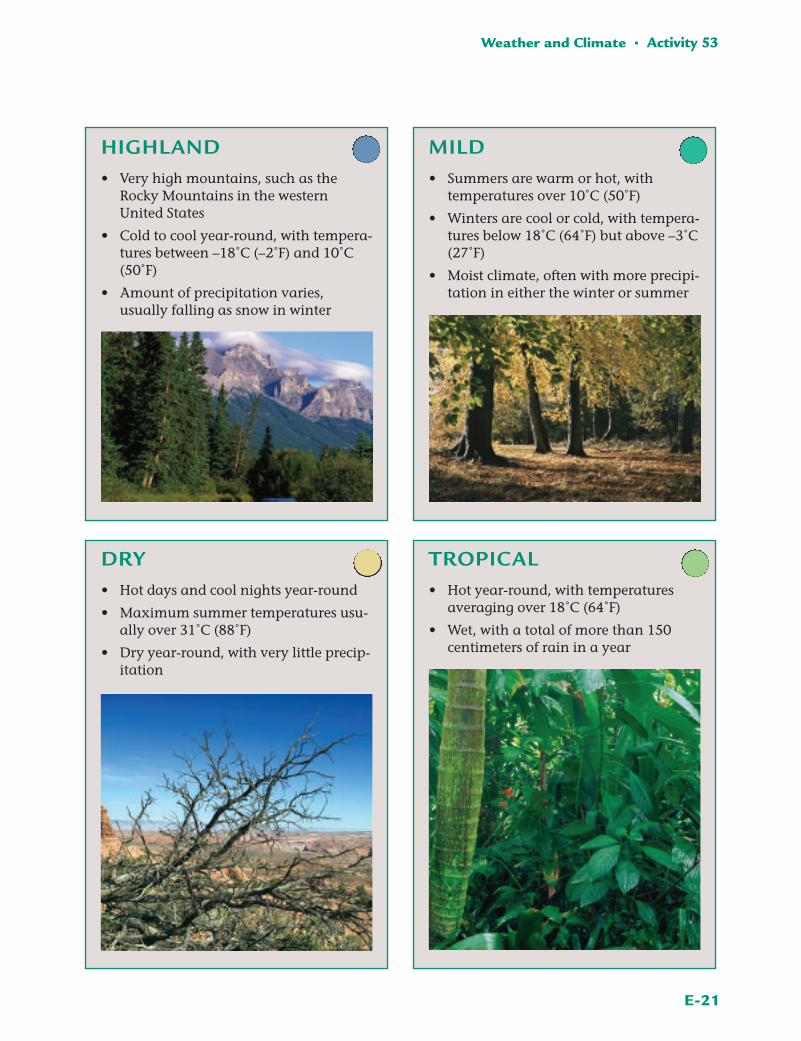
2. Examine the photos and descriptions of the different climate typesshown in Figure 2, “Climate Descriptions,” on the next two pages.On Student Sheet 53.1, “Directed Reading Table: Weather and Cli-mate,” summarize the information about the different types of climates.
3. Work with your partner to:
a. Locate your state on Figure 1.
b. Record the climate type for your area in your science notebook.
c. Determine if your observations and experiences match thisdescription of the climate for your area. In your science note-book, describe any similarities or differences between the cli-mate description for your area and your own observations.
d. Compare the climate description with your data from Table 3,“Monthly Weather Averages,” of Activity 51, “InvestigatingLocal Weather.” In your science notebook, describe any similar-ities or differences between the climate description for your areaand your seasonal weather averages. (Your seasonal weatheraverages will be the average for several months during thesame season. For example, in the United States, the summerseason is typically from June through August.)
(Procedure continues on page E-22)
E-19
Weather and Climate • Activity 53
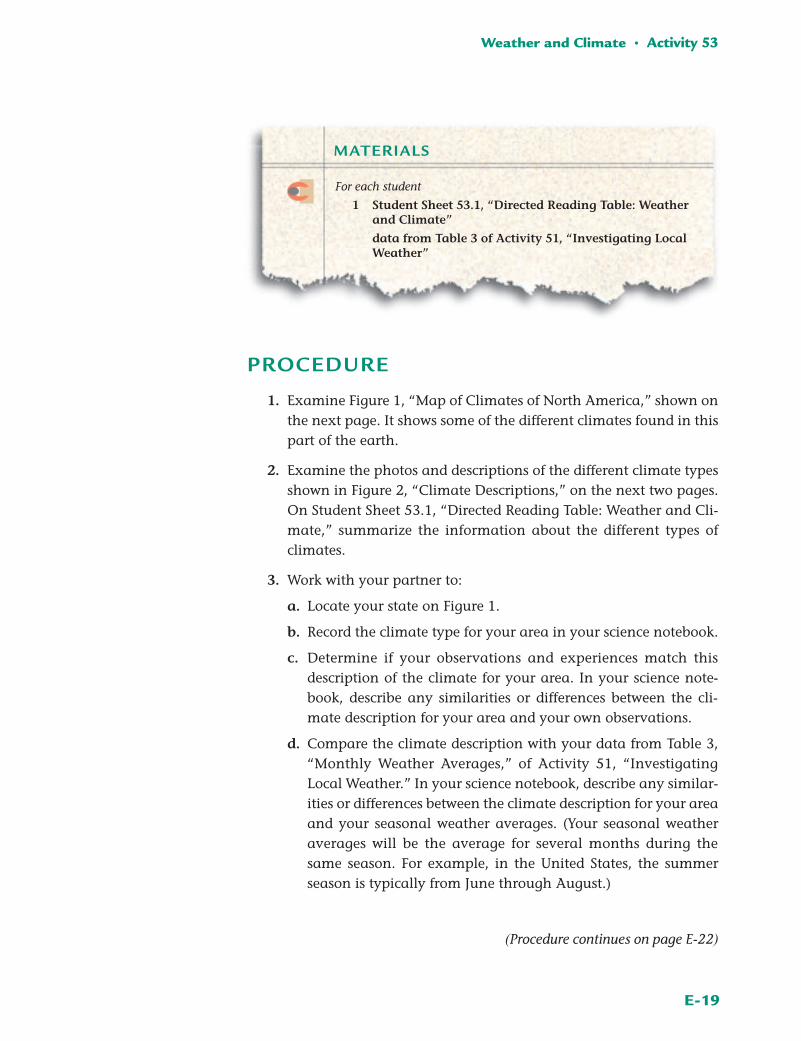
MATERIALS
For each student
1 Student Sheet 53.1, “Directed Reading Table: Weatherand Climate”
data from Table 3 of Activity 51, “Investigating LocalWeather”
2562 LabAids SEPUP Issues Earth Sci SB Figure: EaSB E 53.02 LegacySansMedium 10/11.5
Key to climates
Dry
Polar
Highland
Severe
Tropical
Mild M
E-20
Activity 53 • Weather and Climate
Figure 1: Map of Climates of North America
SEVERE• Warm summers, with temperatures
over 10˚C (50˚F)
• Very cold winters, with at least onemonth averaging less than –3˚C (27˚F)
• Amount of precipitation varies
POLAR• Extremely cold and long winters, with
only 2–4 months having temperaturesabove freezing
• Cool summers, with temperatures lessthan 10˚C (50˚F)
• Dry year-round, with very little precip-itation (usually falls as snow)
2562 LabAids SEPUP Issues Earth Sci SB Figure: EaSB E 53.02 LegacySansMedium 10/11.5
Key to climates
Dry
Polar
Highland
Severe
Tropical
Mild
Canada
Mexico
United States
Figure 2: Climate Descriptions
E-21
Weather and Climate • Activity 53
HIGHLAND• Very high mountains, such as the
Rocky Mountains in the westernUnited States
• Cold to cool year-round, with tempera-tures between –18˚C (–2˚F) and 10˚C(50˚F)
• Amount of precipitation varies,usually falling as snow in winter
MILD• Summers are warm or hot, with
temperatures over 10˚C (50˚F)
• Winters are cool or cold, with tempera-tures below 18˚C (64˚F) but above –3˚C(27˚F)
• Moist climate, often with more precipi-tation in either the winter or summer
DRY• Hot days and cool nights year-round
• Maximum summer temperatures usu-ally over 31˚C (88˚F)
• Dry year-round, with very little precip-itation
TROPICAL• Hot year-round, with temperatures
averaging over 18˚C (64˚F)
• Wet, with a total of more than 150centimeters of rain in a year
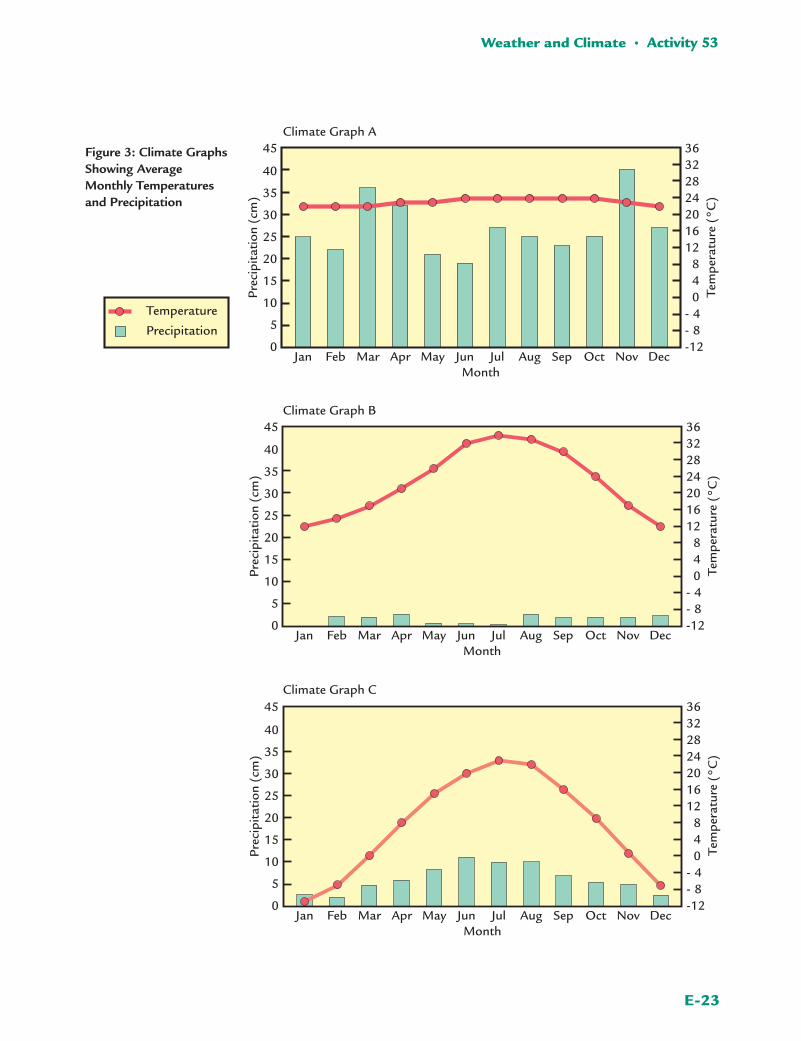
4. Examine the three graphs on the next page. Each graph shows theaverage monthly temperature and precipitation for a specific placein the United States. In your science notebook, record which cli-mate type you think each of the three places has and explain yourreasoning.
5. Share and discuss your findings with the rest of your group.Remember to listen to and consider the ideas of other group mem-bers. If you disagree with someone’s ideas, explain to the rest of thegroup why you disagree.
ANALYSIS
1. What are the most common climate types in the United States?
2. Compare your responses on Student Sheet 53.1 to Figure 1, “Mapof Climates of North America.” How do temperatures vary with lat-itude? Support your answer with evidence from this activity.
3. What is the relationship between weather and climate?
4. Could areas with different climates have the same weather?Explain.
EXTENSIONGraphs showing average temperature and precipitation for a particu-lar area over a certain time period are known as climographs (KLY-moh-grafs). What does a climograph for your area look like? You cancreate your own climograph using the data from Table 3, “MonthlyWeather Averages,” of Activity 51, “Investigating Local Weather.”First calculate the mean temperature for each month. Then use thetemperature and precipitation data to create your own climograph.
E-22
Activity 53 • Weather and Climate
E-23
Weather and Climate • Activity 53
2562 LabAids SEPUP Issues Earth Sci SBFigure: EaSB E 53.04b (Phoenix, AZ)LegacySansMedium 10/11.5
Prec
ipit
atio
n(c
m)
40
20
15
10
0
5
Tem
pera
ture
(°C
)
36
24
12
-12
10
Jan DecNovOctSepAugJulJunMayAprMarFebMonth
2832
1620
1418
- 8- 4
35
30
25
45
2562 LabAids SEPUP Issues Earth Sci SBFigure: EaSB E 53.04c (Minneapolis, MN)LegacySansMedium 10/11.5
Prec
ipit
atio
n(c
m)
40
20
15
10
0
5
Tem
pera
ture
(°C
)36
24
12
-12
10
Jan DecNovOctSepAugJulJunMayAprMarFebMonth
2832
1620
1418
- 8- 4
35
30
25
45
Temperature
Precipitation
2562 LabAids SEPUP Issues Earth Sci SBFigure: EaSB E 53.04a (Hilo, HA)LegacySansMedium 10/11.5
Prec
ipit
atio
n(c
m)
40
20
15
10
0
5
Tem
pera
ture
(°C
)
36
24
12
-12
10
Jan DecNovOctSepAugJulJunMayAprMarFeb
Temperature
Precipitation
Month
2832
1620
1418
- 8- 4
35
30
25
45Figure 3: Climate GraphsShowing AverageMonthly Temperaturesand Precipitation
Climate Graph A
Climate Graph B
Climate Graph C