Embed Size (px)
Citation preview
1/3/2012
1
Physical Geography:Weather and Climate
Chapter 4
Weather vs. Climate
Weather – short-term, day-to-day expression of atmospheric processes Ex. - Today is clear, cold and sunny
Climate – long-term, average conditions Usually at least 30 years of daily weather data
(temperatures and precipitation) Ex. - NY – Humid Continental, warm summer
Meteorology – the scientific study of the atmosphere
Air Temperature
Insolation Solar radiation received at the earth’s surface
Determined by angle of the sun’s rays and number of daylight hours
Modifying variables Amount of water vapor in the air
Cloud cover
Nature of the surface of the earth
Elevation
Degree and direction of air movement
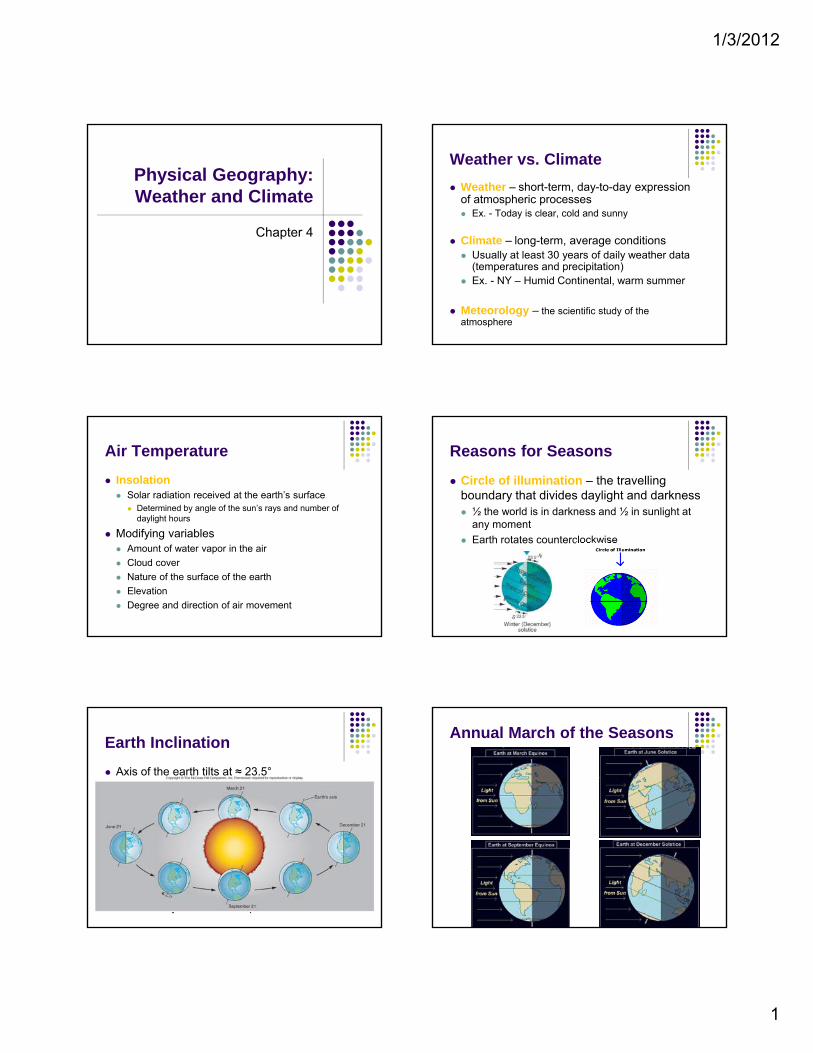
Reasons for Seasons
Circle of illumination – the travelling boundary that divides daylight and darkness ½ the world is in darkness and ½ in sunlight at
any moment
Earth rotates counterclockwise
Earth Inclination
Axis of the earth tilts at ≈ 23.5°
Summer Solstice (about June 21) Northern hemisphere tilted toward the sun
Vertical rays of the sun at 23.5° N
Winter Solstice (about December 21) Northern hemisphere tilted away from the sun
Vertical rays of the sun at 23.5° S
Spring and fall equinoxes (about March 21 and September 21) Vertical rays of the sun at equator
Annual March of the Seasons
1/3/2012
2
Annual March of the Seasons
Earth-Sun Relations
Seasons of the Year
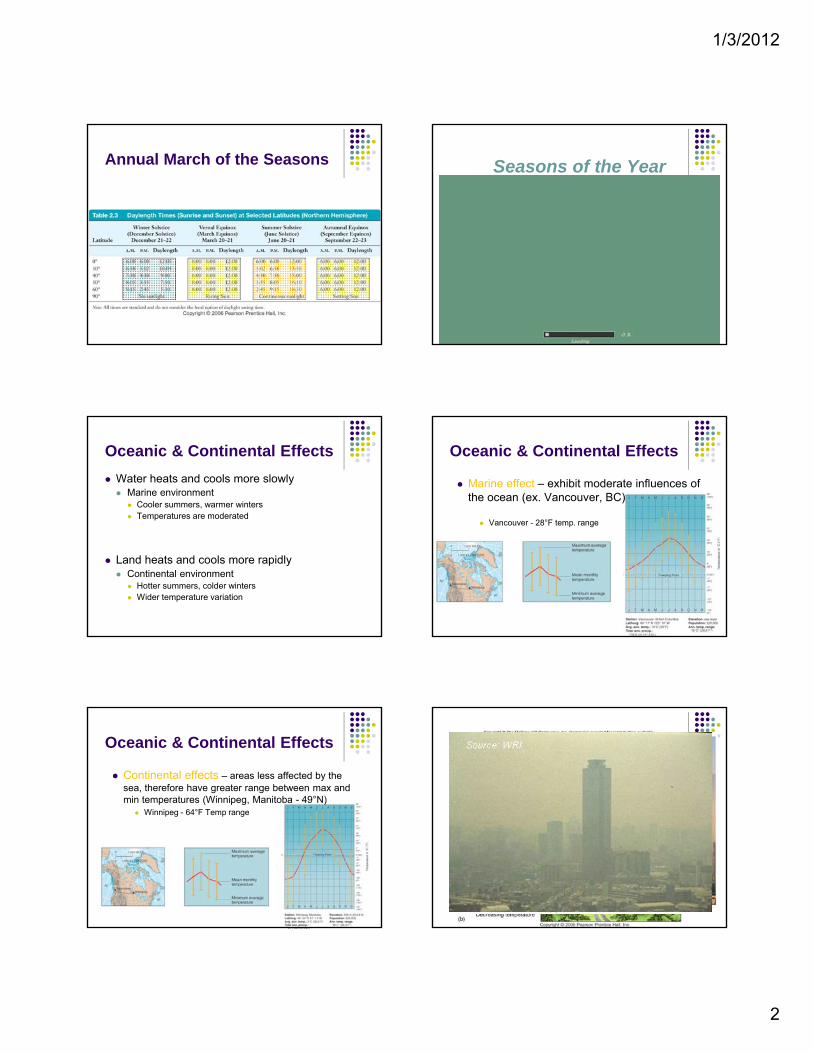
Oceanic & Continental Effects
Water heats and cools more slowly Marine environment
Cooler summers, warmer winters Temperatures are moderated
Land heats and cools more rapidly Continental environment
Hotter summers, colder winters Wider temperature variation
Oceanic & Continental Effects
Marine effect – exhibit moderate influences of the ocean (ex. Vancouver, BC)
Vancouver - 28°F temp. range
Oceanic & Continental Effects
Continental effects – areas less affected by the sea, therefore have greater range between max and min temperatures (Winnipeg, Manitoba - 49°N)
Winnipeg - 64°F Temp range
Temperature generally decreases as altitude increases Lapse rate
Average of 3.5° F per 1000 feet (6.4° C per 1000 m) in the troposphere
Temperature inversion Decrease in temperature less than expected (or an increase)
Main cause - air near the ground rapidly loses its heat on a clear night - the ground becomes cooled quickly while the air above it retains the heat the ground was holding during the day. Contributes to smog problems
The Lapse Rate
1/3/2012
3
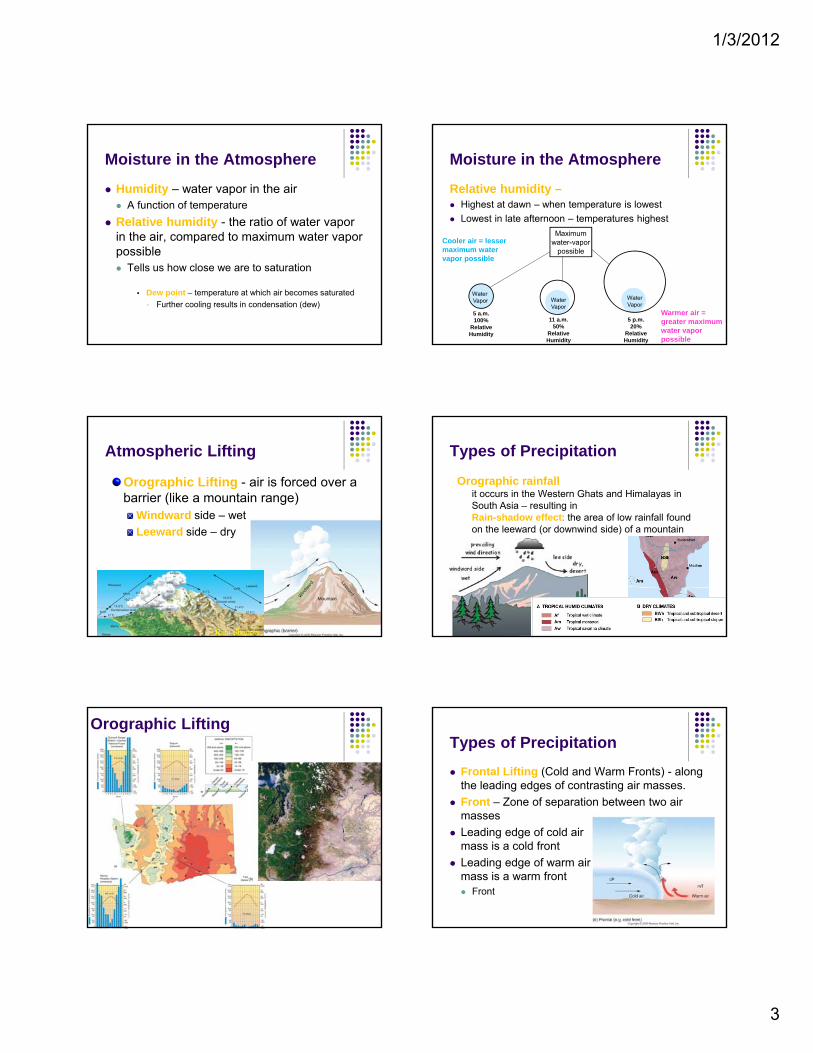
Moisture in the Atmosphere
Humidity – water vapor in the air A function of temperature
Relative humidity - the ratio of water vapor in the air, compared to maximum water vapor possible Tells us how close we are to saturation
Dew point – temperature at which air becomes saturated
Further cooling results in condensation (dew)
Moisture in the Atmosphere
Relative humidity – Highest at dawn – when temperature is lowest
Lowest in late afternoon – temperatures highest
Water Vapor
11 a.m.50%
Relative Humidity
Water Vapor
5 p.m. 20%
Relative Humidity
Warmer air = greater maximum water vapor possible
Cooler air = lesser maximum water vapor possible
Water Vapor
5 a.m. 100%
Relative Humidity
Maximum water-vapor
possible
Atmospheric Lifting
Orographic Lifting - air is forced over a barrier (like a mountain range)
Windward side – wet
Leeward side – dry
Rain Shadow
Types of Precipitation
Orographic rainfallit occurs in the Western Ghats and Himalayas in South Asia – resulting in Rain-shadow effect: the area of low rainfall found on the leeward (or downwind side) of a mountain range
Rain Shadow
Orographic LiftingTypes of Precipitation
Frontal Lifting (Cold and Warm Fronts) - along the leading edges of contrasting air masses.
Front – Zone of separation between two air masses
Leading edge of cold air mass is a cold front
Leading edge of warm airmass is a warm front Front
1/3/2012
4
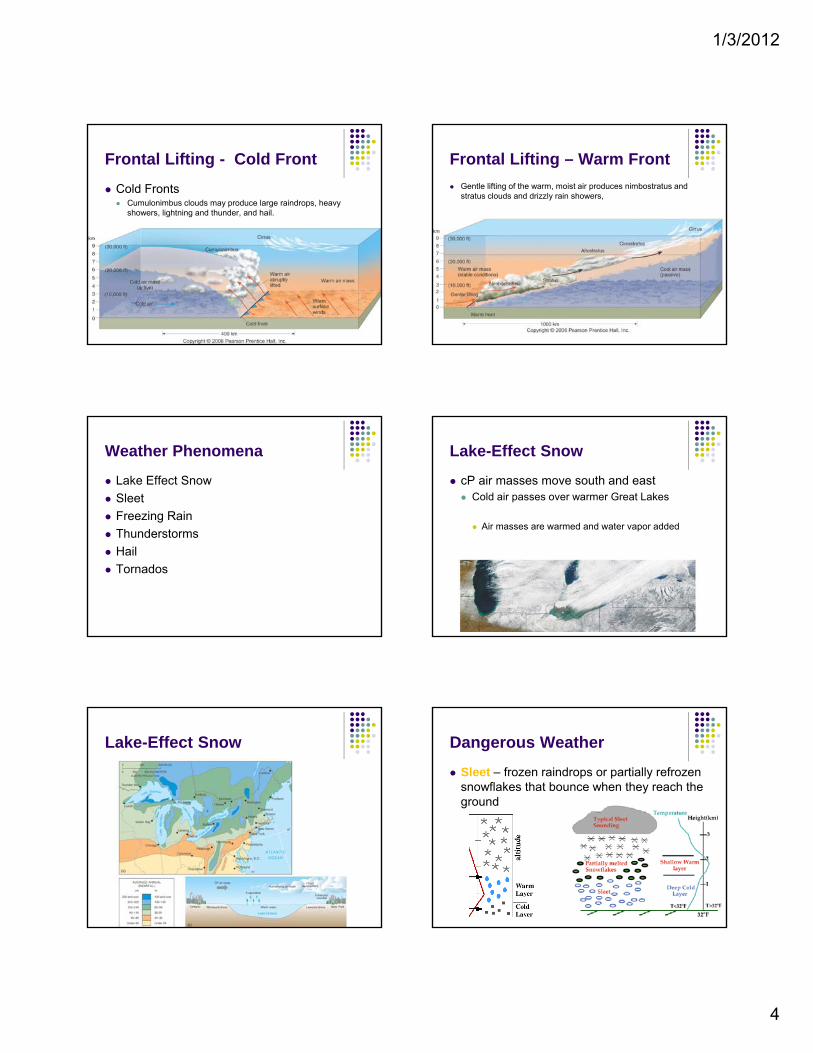
Frontal Lifting - Cold Front
Cold Fronts Cumulonimbus clouds may produce large raindrops, heavy
showers, lightning and thunder, and hail.
Frontal Lifting – Warm Front
Gentle lifting of the warm, moist air produces nimbostratus and stratus clouds and drizzly rain showers,
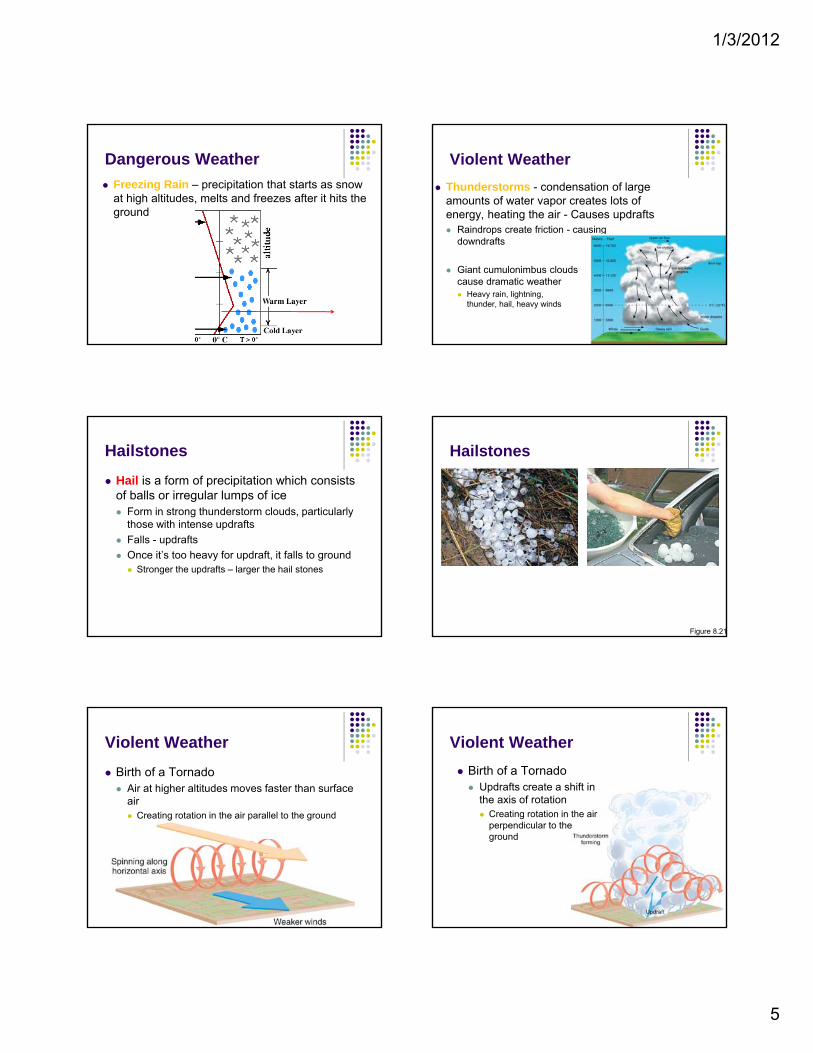
Weather Phenomena
Lake Effect Snow
Sleet
Freezing Rain
Thunderstorms
Hail
Tornados
Lake-Effect Snow
cP air masses move south and east Cold air passes over warmer Great Lakes
Air masses are warmed and water vapor added
Lake-Effect Snow Dangerous Weather
Sleet – frozen raindrops or partially refrozen snowflakes that bounce when they reach the ground
1/3/2012
5
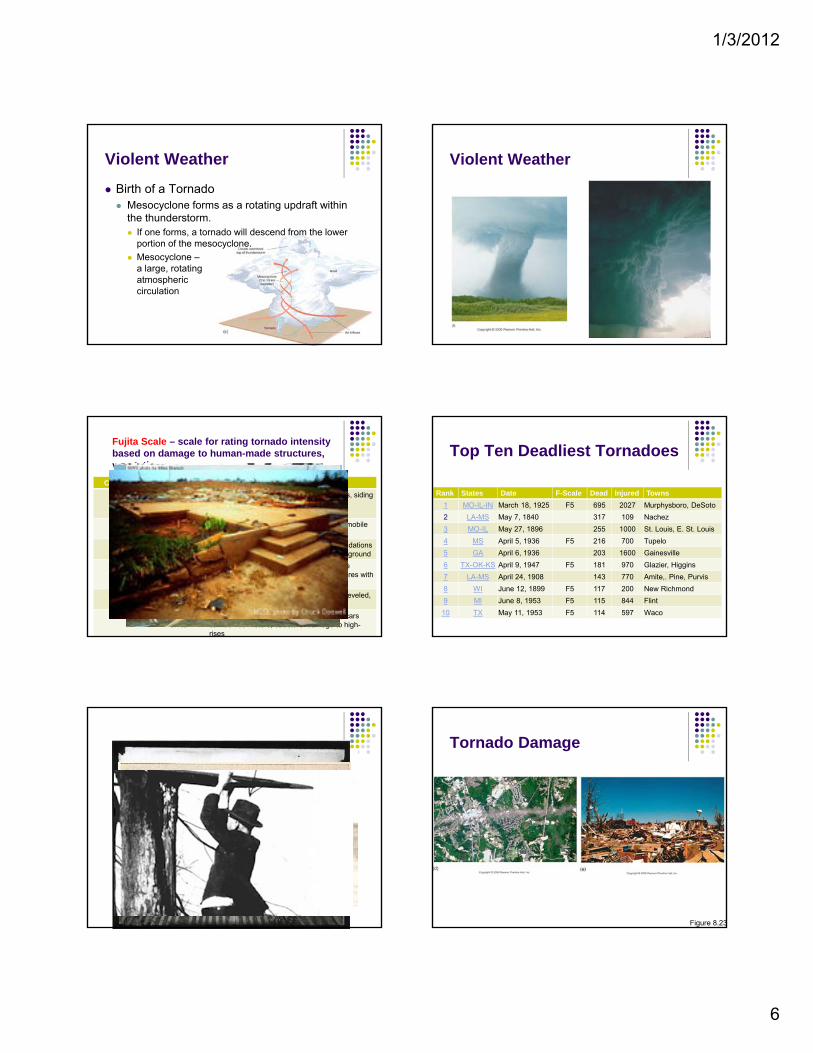
Dangerous Weather
Freezing Rain – precipitation that starts as snow at high altitudes, melts and freezes after it hits the ground
Violent Weather
Thunderstorms - condensation of large amounts of water vapor creates lots of energy, heating the air - Causes updrafts Raindrops create friction - causing
downdrafts
Giant cumulonimbus cloudscause dramatic weather Heavy rain, lightning,
thunder, hail, heavy winds
Hailstones
Hail is a form of precipitation which consists of balls or irregular lumps of ice Form in strong thunderstorm clouds, particularly
those with intense updrafts
Falls - updrafts
Once it’s too heavy for updraft, it falls to ground Stronger the updrafts – larger the hail stones
Hailstones
Figure 8.21
Violent Weather
Birth of a Tornado Air at higher altitudes moves faster than surface
air Creating rotation in the air parallel to the ground
Violent Weather
Birth of a Tornado Updrafts create a shift in
the axis of rotation Creating rotation in the air
perpendicular to the ground
1/3/2012
6
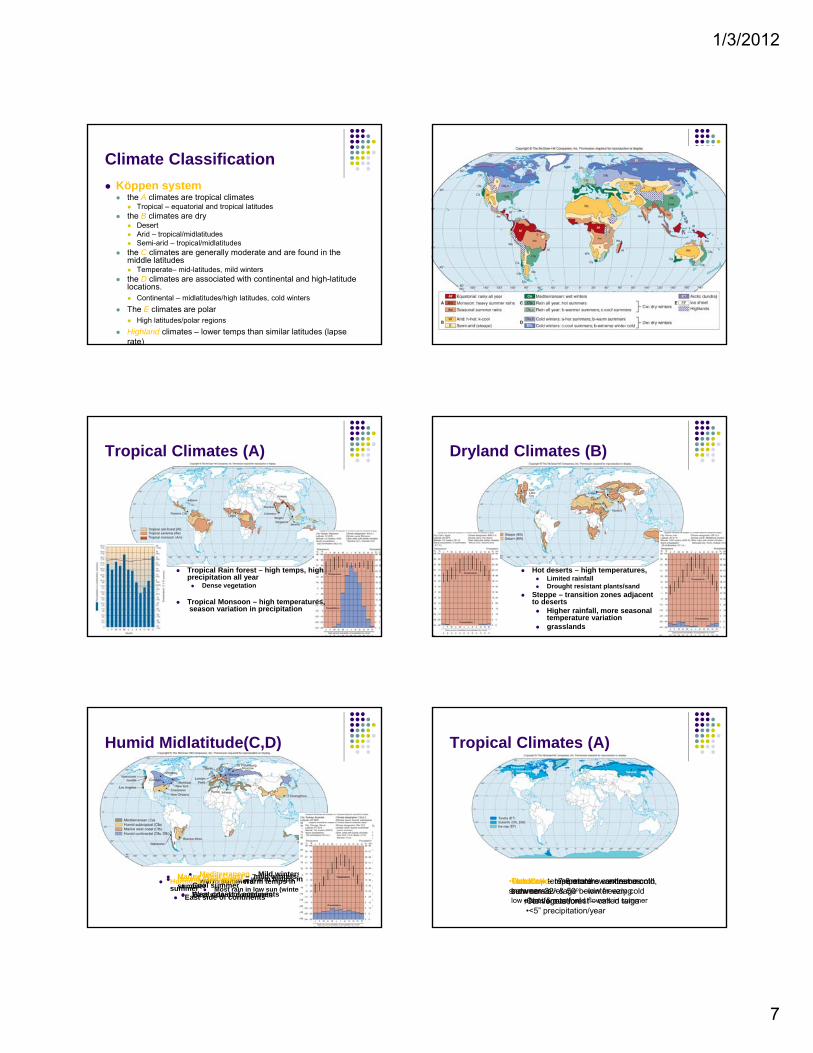
Violent Weather
Birth of a Tornado Mesocyclone forms as a rotating updraft within
the thunderstorm. If one forms, a tornado will descend from the lower
portion of the mesocyclone.
Mesocyclone –a large, rotatingatmosphericcirculation
Violent Weather
Fujita Scale – scale for rating tornado intensity based on damage to human-made structures, vegetation
Category Wind Speed Potential Damage
F0 65-85 mph
39%
Light Damage: Minor roof damage, gutters, sidingdamagedBranches broken off trees
F1 86-110 mph36%
Moderate Damage: severe roof damage, mobile homes overturned, broken glass
F2 111-135 mph19%
Considerable Damage: roofs torn off, foundations shifted, large trees snapped, cars lifted off ground
F3 136 -165 mph
5%
Severe Damage: severe damages to large buildings (malls), trains overturned, structures withweak foundations blown great distances
F4 166-200 mph1%
Devastating Damage: homes completely leveled, cars thrown, small missiles generated
F5 >200 mph<0.1%
Incredible Damage: houses swept away, cars carried 100 meters, structural damage to high-rises
Top Ten Deadliest Tornadoes
Rank States Date F-Scale Dead Injured Towns
1 MO-IL-IN March 18, 1925 F5 695 2027 Murphysboro, DeSoto
2 LA-MS May 7, 1840 317 109 Nachez
3 MO-IL May 27, 1896 255 1000 St. Louis, E. St. Louis
4 MS April 5, 1936 F5 216 700 Tupelo
5 GA April 6, 1936 203 1600 Gainesville
6 TX-OK-KS April 9, 1947 F5 181 970 Glazier, Higgins
7 LA-MS April 24, 1908 143 770 Amite,. Pine, Purvis
8 WI June 12, 1899 F5 117 200 New Richmond
9 MI June 8, 1953 F5 115 844 Flint
10 TX May 11, 1953 F5 114 597 Waco
Tornado Damage
Figure 8.23
1/3/2012
7
Climate Classification
Köppen system the A climates are tropical climates
Tropical – equatorial and tropical latitudes the B climates are dry
Desert Arid – tropical/midlatitudes Semi-arid – tropical/midlatitudes
the C climates are generally moderate and are found in the middle latitudes Temperate– mid-latitudes, mild winters
the D climates are associated with continental and high-latitude locations. Continental – midlatitudes/high latitudes, cold winters
The E climates are polar High latitudes/polar regions
Highland climates – lower temps than similar latitudes (lapse rate)
Generalized Climate Regions
Tropical Climates (A)
Tropical Rain forest – high temps, high precipitation all year Dense vegetation
Tropical Monsoon – high temperatures,season variation in precipitation
Dryland Climates (B)
Hot deserts – high temperatures, Limited rainfall Drought resistant plants/sand
Steppe – transition zones adjacent to deserts Higher rainfall, more seasonal
temperature variation grasslands
Humid Midlatitude(C,D)
Mediterranean – Mild winters, warm summers Most rain in low sun (winter)
Humid Subtropical – warm temps in summer East side of continents
Marine West Coast – mild winters, Cool summer West coast of continents
Humid Continental – warm temps in summer East side of continents
Tropical Climates (A)
Tundra – temperature - warmest month between 32o & 50o, - winter very coldlow plants & many wild flowers in summer
•Subarctic – 7-8 months continuous snow cover
•Coniferous forest – called taiga
• Ice Cap – temperature – extreme cold, summers average below freezing
•No vegetation•<5” precipitation/year
1/3/2012
8
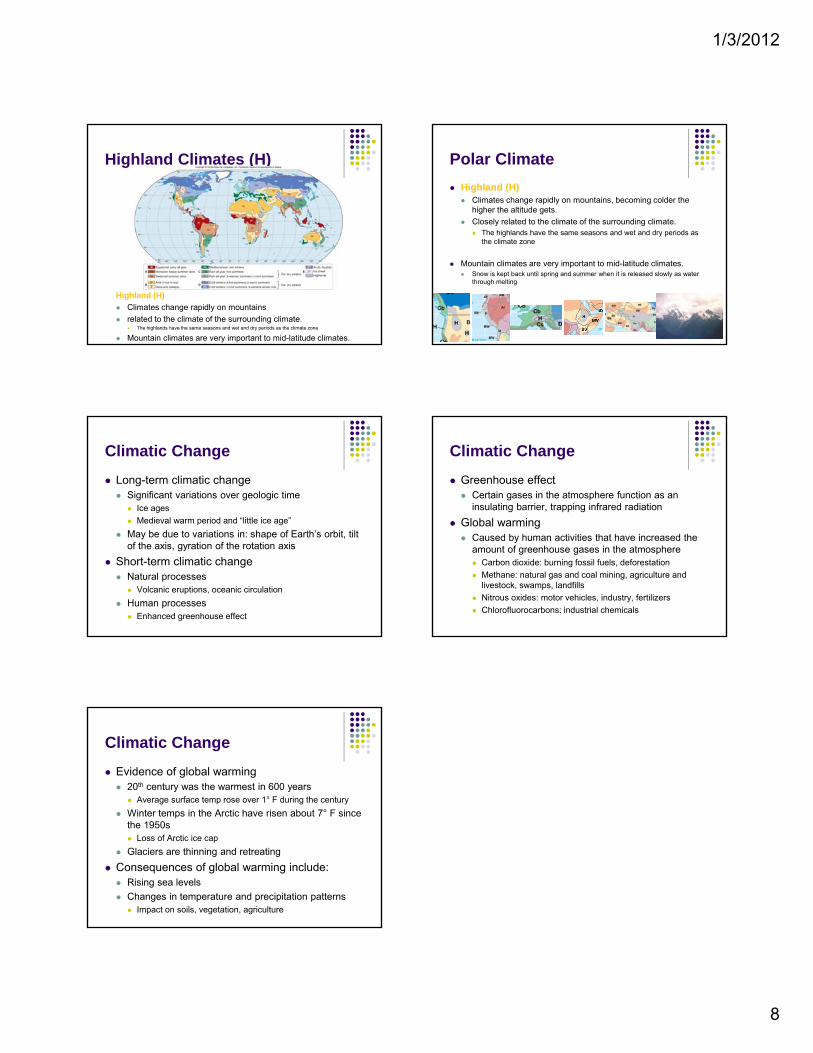
Highland Climates (H)
Highland (H)
Climates change rapidly on mountains
related to the climate of the surrounding climate. The highlands have the same seasons and wet and dry periods as the climate zone
Mountain climates are very important to mid-latitude climates.
Polar Climate
Highland (H) Climates change rapidly on mountains, becoming colder the
higher the altitude gets.
Closely related to the climate of the surrounding climate. The highlands have the same seasons and wet and dry periods as
the climate zone
Mountain climates are very important to mid-latitude climates. Snow is kept back until spring and summer when it is released slowly as water
through melting
Climatic Change
Long-term climatic change Significant variations over geologic time
Ice ages
Medieval warm period and “little ice age”
May be due to variations in: shape of Earth’s orbit, tilt of the axis, gyration of the rotation axis
Short-term climatic change Natural processes
Volcanic eruptions, oceanic circulation
Human processes Enhanced greenhouse effect
Climatic Change
Greenhouse effect Certain gases in the atmosphere function as an
insulating barrier, trapping infrared radiation
Global warming Caused by human activities that have increased the
amount of greenhouse gases in the atmosphere Carbon dioxide: burning fossil fuels, deforestation
Methane: natural gas and coal mining, agriculture and livestock, swamps, landfills
Nitrous oxides: motor vehicles, industry, fertilizers
Chlorofluorocarbons: industrial chemicals
Climatic Change
Evidence of global warming 20th century was the warmest in 600 years
Average surface temp rose over 1° F during the century
Winter temps in the Arctic have risen about 7° F since the 1950s Loss of Arctic ice cap
Glaciers are thinning and retreating
Consequences of global warming include: Rising sea levels
Changes in temperature and precipitation patterns Impact on soils, vegetation, agriculture


![S1%20 Geography%20 Weather[1]](https://img.pdfslide.net/doc/110x75/54b577d14a7959ba478b468b/s120-geography20-weather1.jpg)