Embed Size (px)
Citation preview
CONT
ROL
Webb, Justin, Green Belt Cook, Jason, Project Sponsor
Wilkins, Stephen, MBB, MentorRuder, Christopher, RM
Project Initiation Date: 06 AUG 14Control Tollgate Date: 15DEC14
Lean Six SigmaNTC Eagle Team MILES Tracking
LD 24897
ControlControl
v 3.0
Agenda Project Charter (Updated)
Measure Review
Analyze Review
Improve Review
Revised Process Documentation
Plan for Transition to Process Owner
Process Control Tool
Project Summary
Financial & Operational Benefits
Project Contributors
Completed Storyboard
Control Tollgate checklist
Tollgate Attestations
2
ImproveImprove
v 3.03
Project Summary
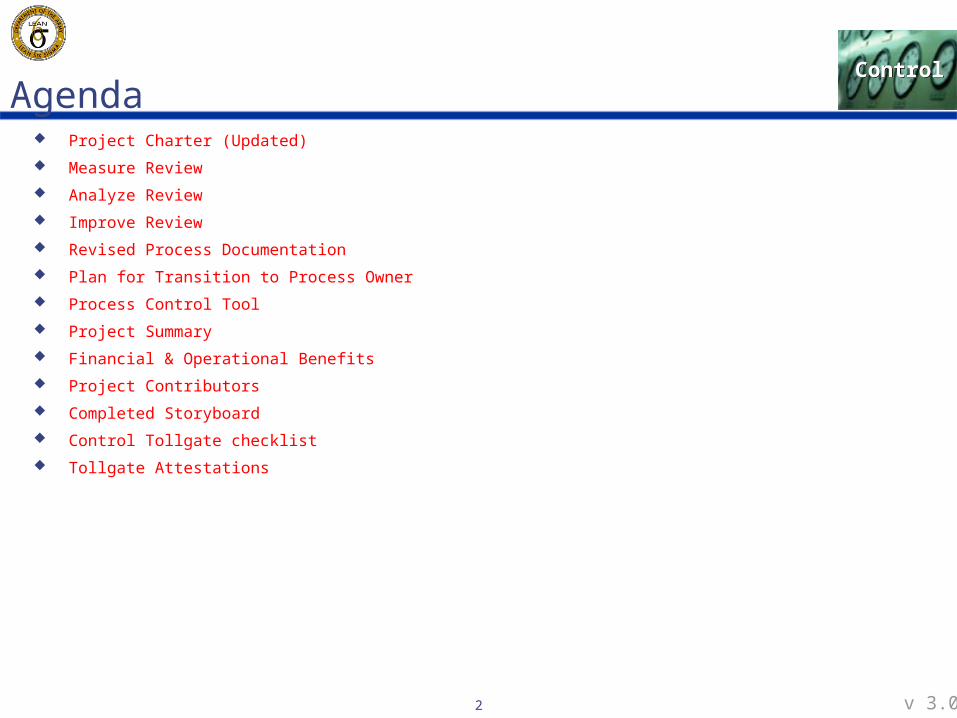
Problem statement
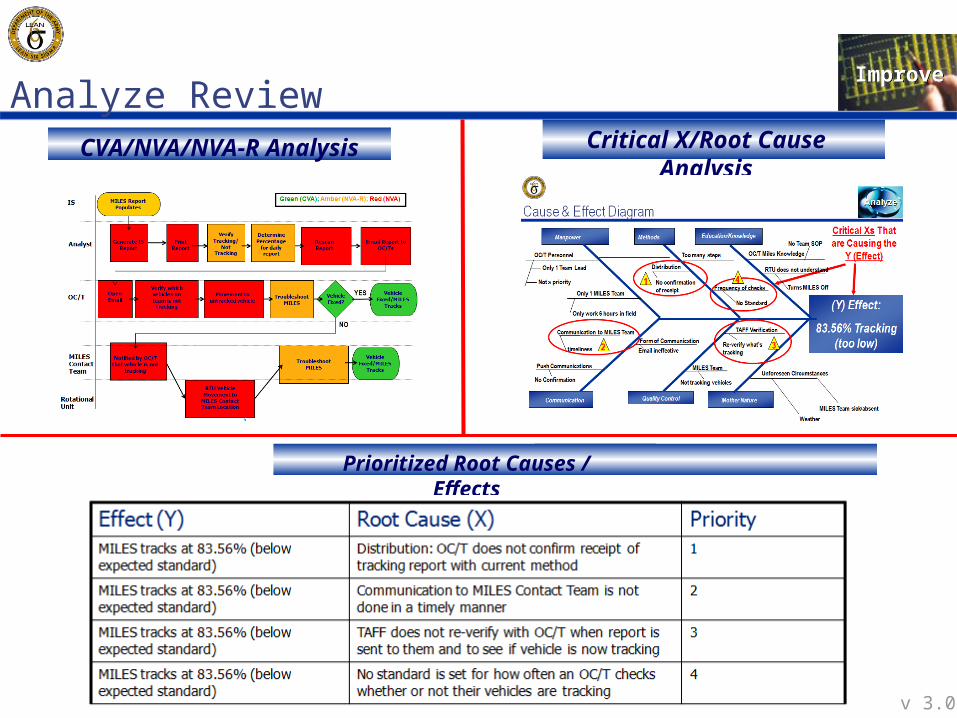
The NTC Eagle Team MILES tracking and reporting process is currently at 83.56%. The expected standard is 90%. The current process lacks quality and is inefficient as the amount of time that MILES systems remain inoperative and not tracking averages 105 hours and can exceed 390 hours in certain cases.
Goal statement
The goal of this project is to increase MILES tracking from 83.56% to 98%.
Scope-in
The first step of the process is the MILES report received from the Fort Irwin IS and the last step is the link up of the non-tracking vehicle with the MILES Contact Team representative at the inoperative and not tracking MILES vehicle to fix the issue.
The following are included: Eagle Team TAFF functions and the process of tracking, notification and reporting of MILES tracking within the Eagle Team and to the MILES contact team.
Scope-out
The following are excluded: NTC MILES maintenance, the actual hands on physical procedures for fixing the MILES systems tracking and anything outside of the Eagle Team’s influence and control.
Problem/Goal Statement
Tollgate Review Schedule
Business Impact
Core Team
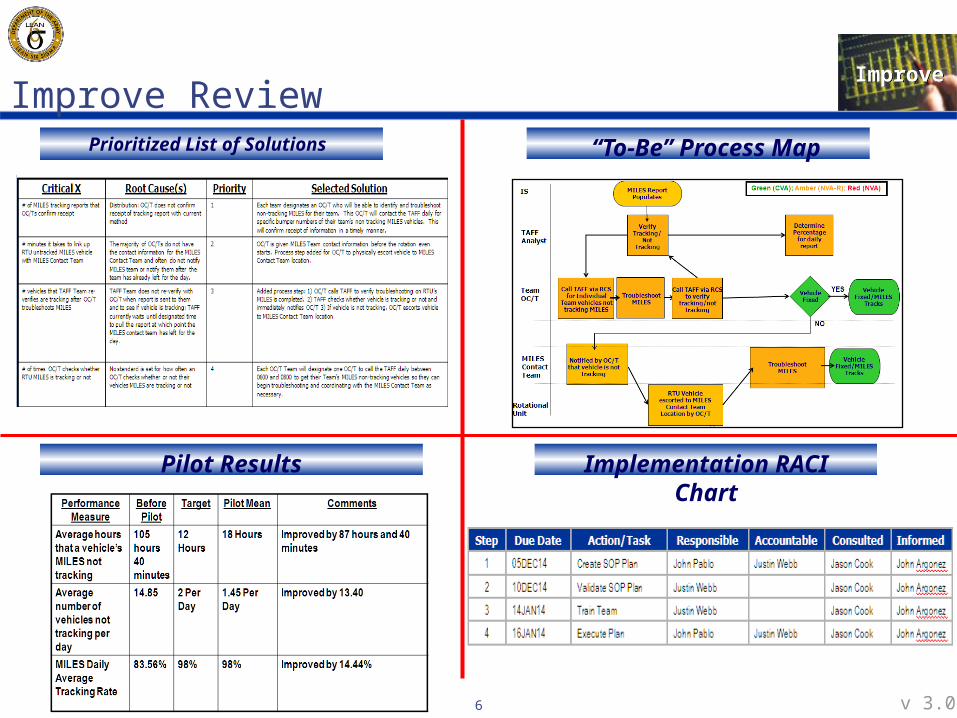
Operational benefit: Improve the efficiency and to minimize the amount of time that a MILES equipped vehicle is not tracking from an average of 105 hours to 12 hours.
Reduce the non tracking vehicles from an average of 14.8 per day to no more than 2 per day.
Improve yield from 83.56% to 98% and sigma quality level from 0 to 3.57
PS Name LTC Jason Cook GBc Name CPT Justin Webb RM CPT Christopher Ruder Mentor Name Stephen WilkinsCore Team Role % Contrib. LSS
Training DAC John Pablo TM 25 None CTR Logan Passig TM 25 None CTR John Argonez TM 10% None
Tollgate Scheduled Revised Complete
Define: 06 AUG 14 15 SEP 14 16 SEP 14
Measure: 23 AUG 14 09 OCT 14 09 OCT 14
Analyze: 11 SEP 14 29 OCT 14 30 OCT 14
Improve: 11 OCT 14 01 DEC 14 01 DEC 14
Control: 1 NOV 14 15DEC14 15 DEC 14
ImproveImprove
v 3.04
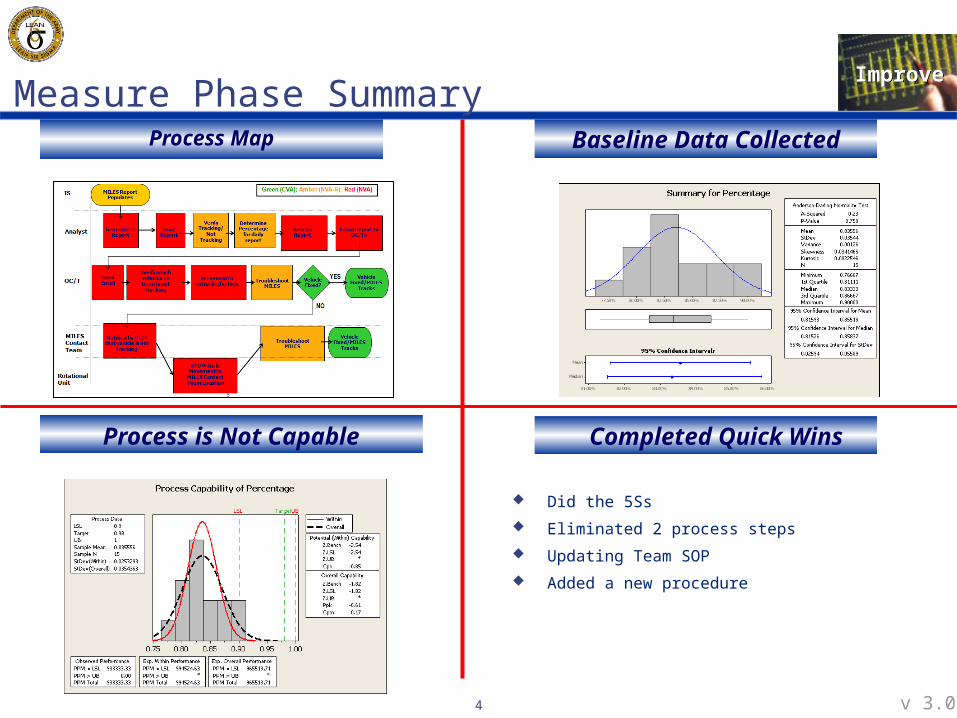
Measure Phase SummaryProcess Map Baseline Data Collected
Process is Not Capable
Did the 5Ss
Eliminated 2 process steps
Updating Team SOP
Added a new procedure
Completed Quick Wins
ImproveImprove
v 3.05
Analyze ReviewCritical X/Root Cause AnalysisCVA/NVA/NVA-R Analysis
Prioritized Root Causes / Effects
ImproveImprove
v 3.06
Improve Review“To-Be” Process Map
Implementation RACI Chart
Prioritized List of Solutions
Pilot Results
ControlControl
v 3.0
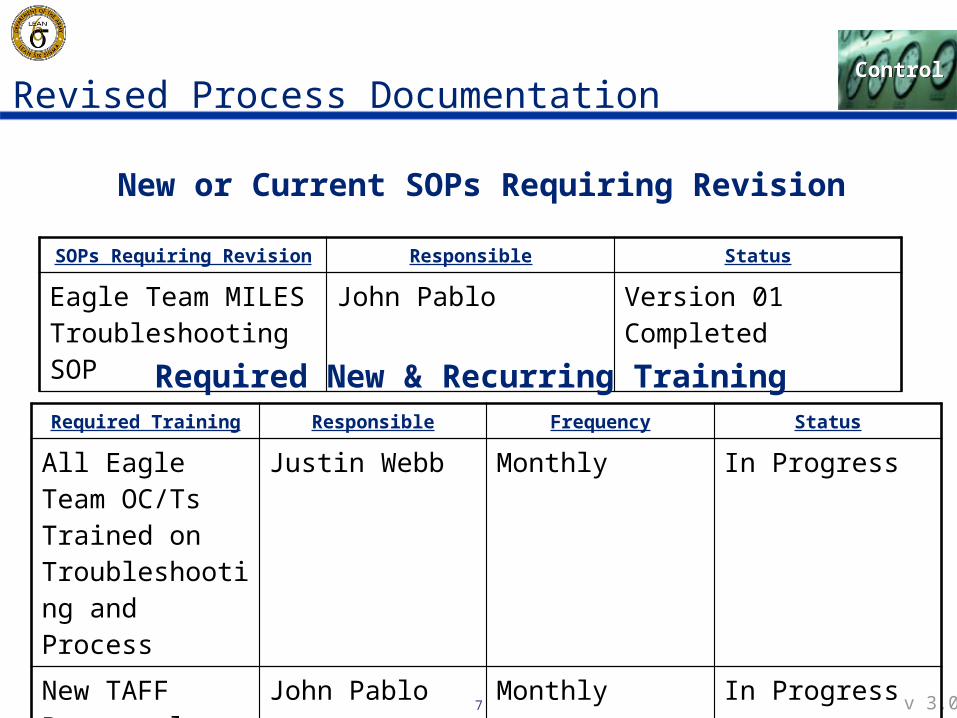
Revised Process Documentation
SOPs Requiring Revision Responsible Status
Eagle Team MILES Troubleshooting SOP
John Pablo Version 01 Completed
Required Training Responsible Frequency Status
All Eagle Team OC/Ts Trained on Troubleshooting and Process
Justin Webb Monthly In Progress
New TAFF Personnel trained on notification process
John Pablo Monthly In Progress
New or Current SOPs Requiring Revision
Required New & Recurring Training
7
ControlControl
v 3.0
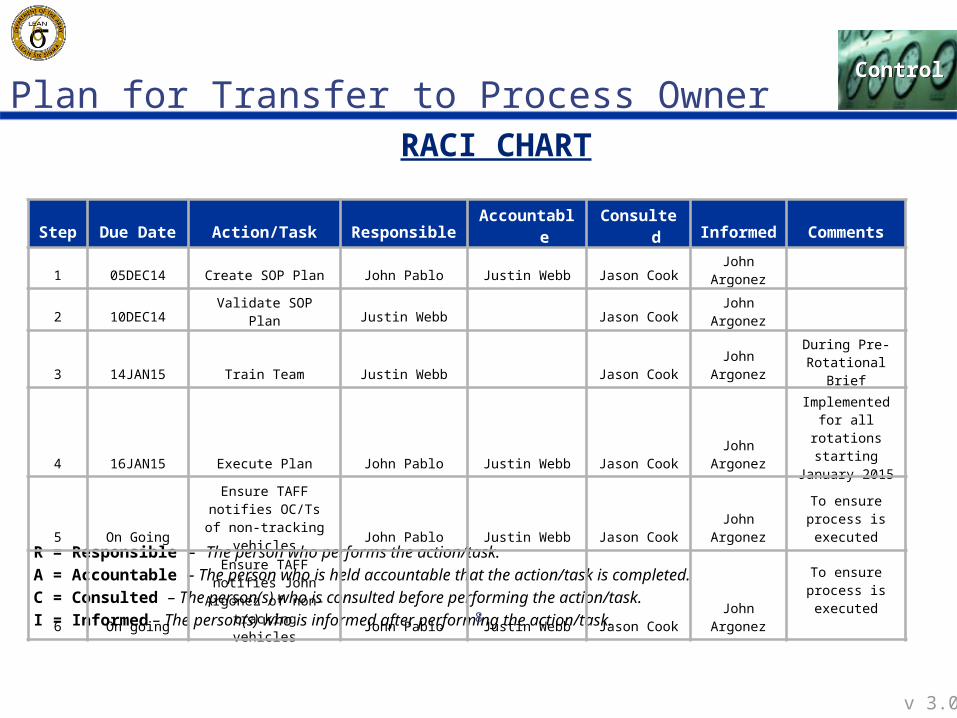
Plan for Transfer to Process Owner
R = Responsible – The person who performs the action/task.A = Accountable – The person who is held accountable that the action/task is
completed.C = Consulted – The person(s) who is consulted before performing the action/task.I = Informed – The person(s) who is informed after performing the action/task.
RACI CHART
8
Step
Due Date Action/Task
Responsible
Accountable
Consulted
Informed Comments
1 05DEC14 Create SOP Plan John Pablo Justin Webb Jason Cook John Argonez
2 10DEC14 Validate SOP Plan Justin Webb Jason Cook John Argonez
3 14JAN15 Train Team Justin Webb Jason Cook John ArgonezDuring Pre-
Rotational Brief
4 16JAN15 Execute Plan John Pablo Justin Webb Jason Cook John Argonez
Implemented for all rotations
starting January 2015
5 On Going
Ensure TAFF notifies OC/Ts of non-tracking
vehicles John Pablo Justin Webb Jason Cook John ArgonezTo ensure process
is executed
6 On going
Ensure TAFF notifies John Argonez of non-
tracking vehicles John Pablo Justin Webb Jason Cook John Argonez
To ensure process is executed
ControlControl
v 3.0
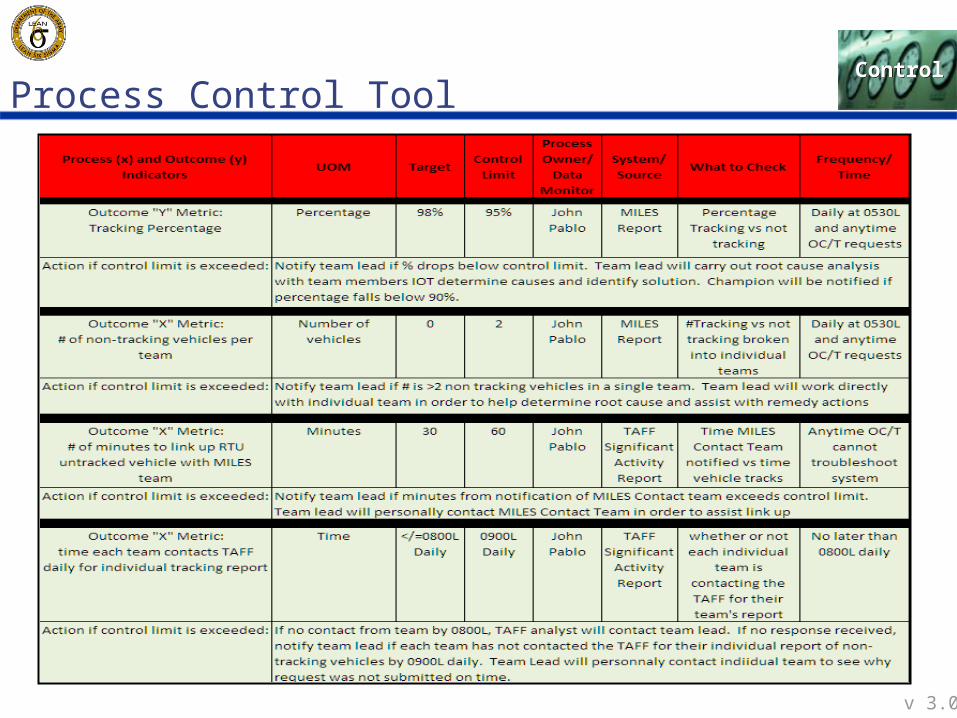
Process Control Tool
ControlControl
v 3.0
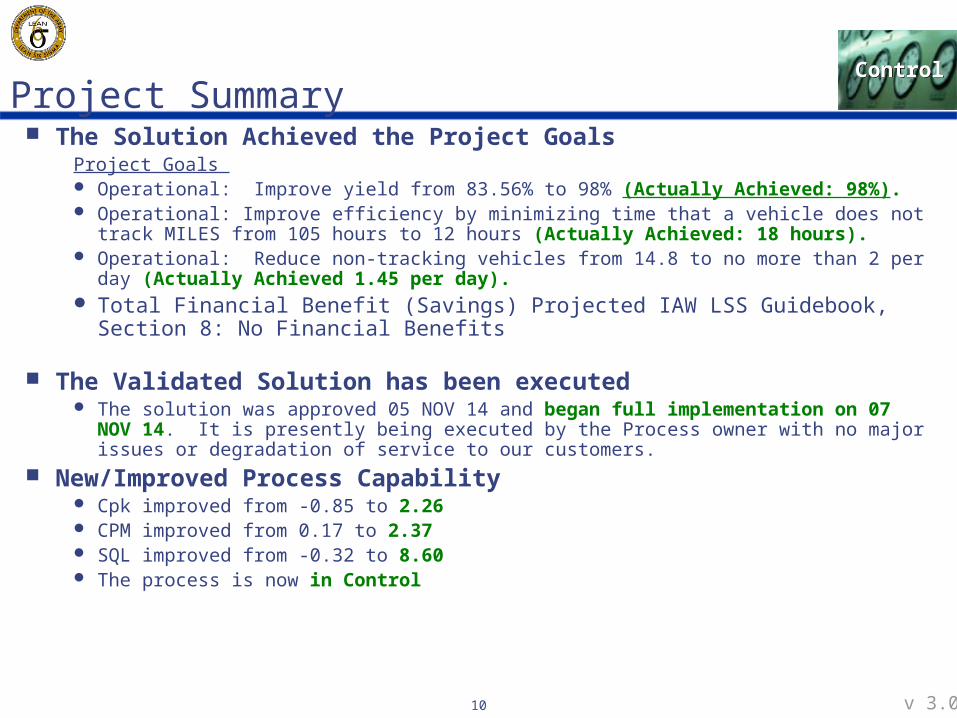
Project Summary The Solution Achieved the Project Goals
Project Goals Operational: Improve yield from 83.56% to 98% (Actually Achieved: 98%). Operational: Improve efficiency by minimizing time that a vehicle does not track MILES
from 105 hours to 12 hours (Actually Achieved: 18 hours). Operational: Reduce non-tracking vehicles from 14.8 to no more than 2 per day
(Actually Achieved 1.45 per day). Total Financial Benefit (Savings) Projected IAW LSS Guidebook, Section 8: No
Financial Benefits
The Validated Solution has been executed The solution was approved 05 NOV 14 and began full implementation on 07 NOV
14. It is presently being executed by the Process owner with no major issues or degradation of service to our customers.
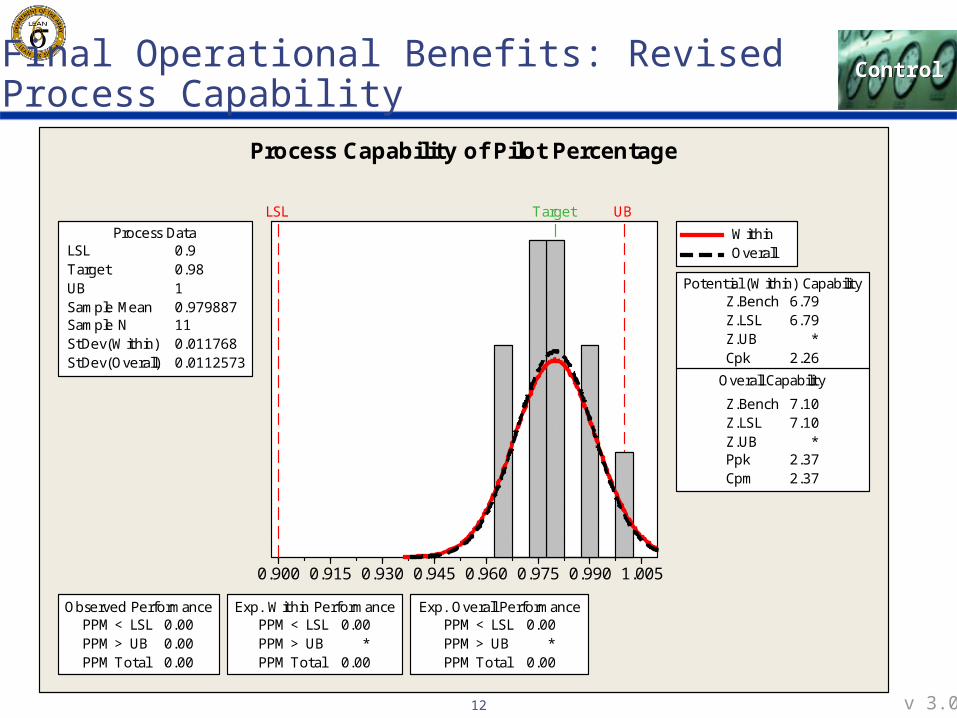
New/Improved Process Capability Cpk improved from -0.85 to 2.26 CPM improved from 0.17 to 2.37 SQL improved from -0.32 to 8.60 The process is now in Control
10
ControlControl
v 3.0
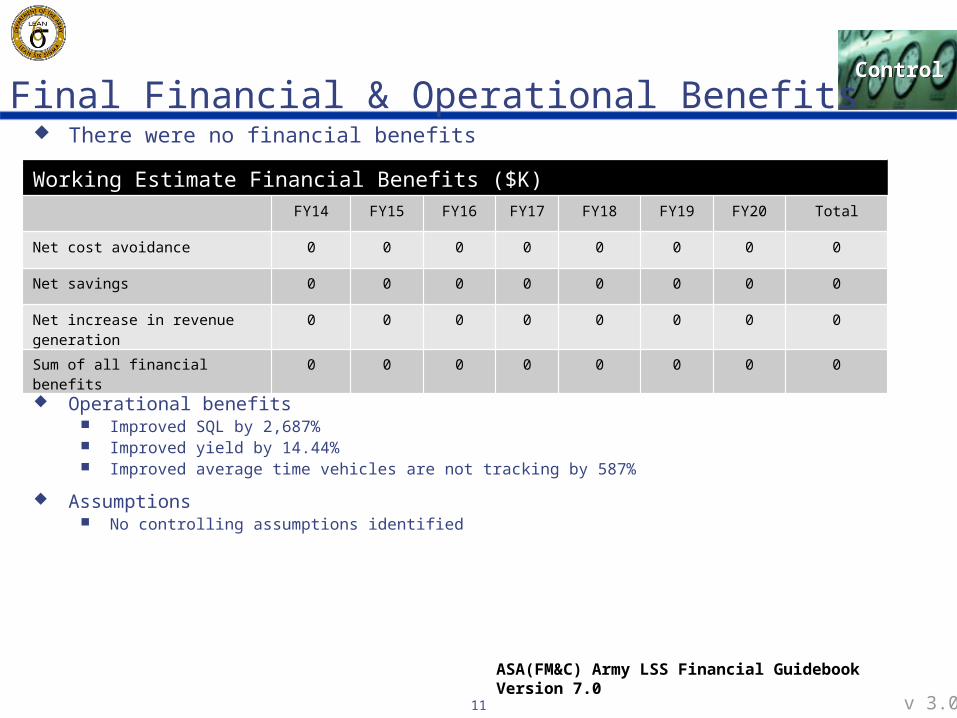
Final Financial & Operational Benefits There were no financial benefits
Operational benefits Improved SQL by 2,687% Improved yield by 14.44% Improved average time vehicles are not tracking by 587%
Assumptions No controlling assumptions identified
11
Working Estimate Financial Benefits ($K)FY14 FY15 FY16 FY17 FY18 FY19 FY20 Total
Net cost avoidance 0 0 0 0 0 0 0 0
Net savings 0 0 0 0 0 0 0 0
Net increase in revenue generation
0 0 0 0 0 0 0 0
Sum of all financial benefits 0 0 0 0 0 0 0 0
ASA(FM&C) Army LSS Financial Guidebook Version 7.0
ControlControl
v 3.012
Final Operational Benefits: Revised Process Capability
1.0050.9900.9750.9600.9450.9300.9150.900
LSL Target UB
LSL 0.9Target 0.98UB 1Sample Mean 0.979887Sample N 11StDev(Within) 0.011768StDev(Overall) 0.0112573
Process Data
Z.Bench 6.79Z.LSL 6.79Z.UB *Cpk 2.26
Z.Bench 7.10Z.LSL 7.10Z.UB *Ppk 2.37Cpm 2.37
Overall Capability
Potential (Within) Capability
PPM < LSL 0.00PPM > UB 0.00PPM Total 0.00
Observed PerformancePPM < LSL 0.00PPM > UB *PPM Total 0.00
Exp. Within PerformancePPM < LSL 0.00PPM > UB *PPM Total 0.00
Exp. Overall Performance
WithinOverall
Process Capability of Pilot Percentage
ImproveImprove
v 3.0
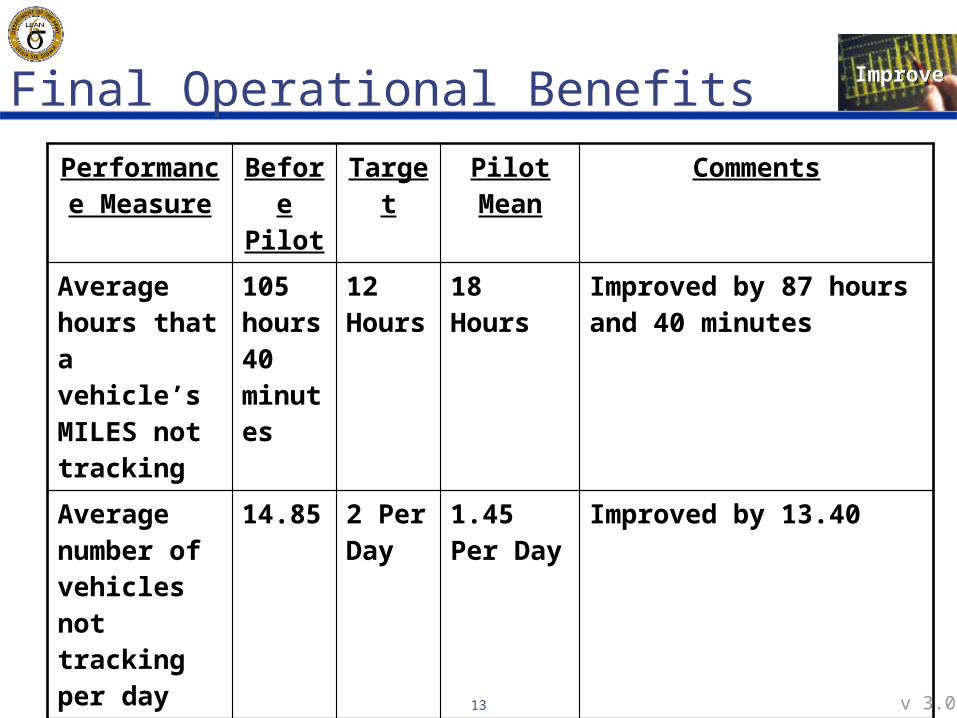
Final Operational Benefits
13
Performance Measure
Before Pilot
Target Pilot Mean Comments
Average hours that a vehicle’s MILES not tracking
105 hours 40 minutes
12 Hours
18 Hours Improved by 87 hours and 40 minutes
Average number of vehicles not tracking per day
14.85 2 Per Day
1.45 Per Day
Improved by 13.40
MILES Daily Average Tracking Rate
83.56% 98% 98% Improved by 14.44%
ControlControl
v 3.014
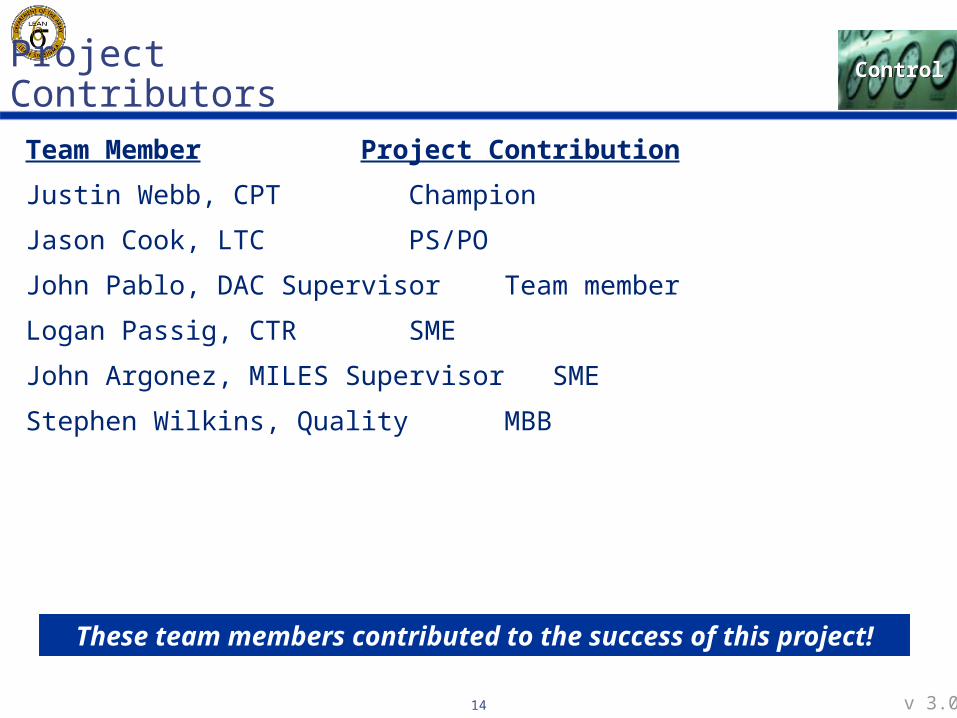
Project ContributorsTeam Member Project Contribution
Justin Webb, CPT Champion
Jason Cook, LTC PS/PO
John Pablo, DAC Supervisor Team member
Logan Passig, CTR SME
John Argonez, MILES Supervisor SME
Stephen Wilkins, Quality MBB
These team members contributed to the success of this project!
AnalyzeAnalyze
v 3.0
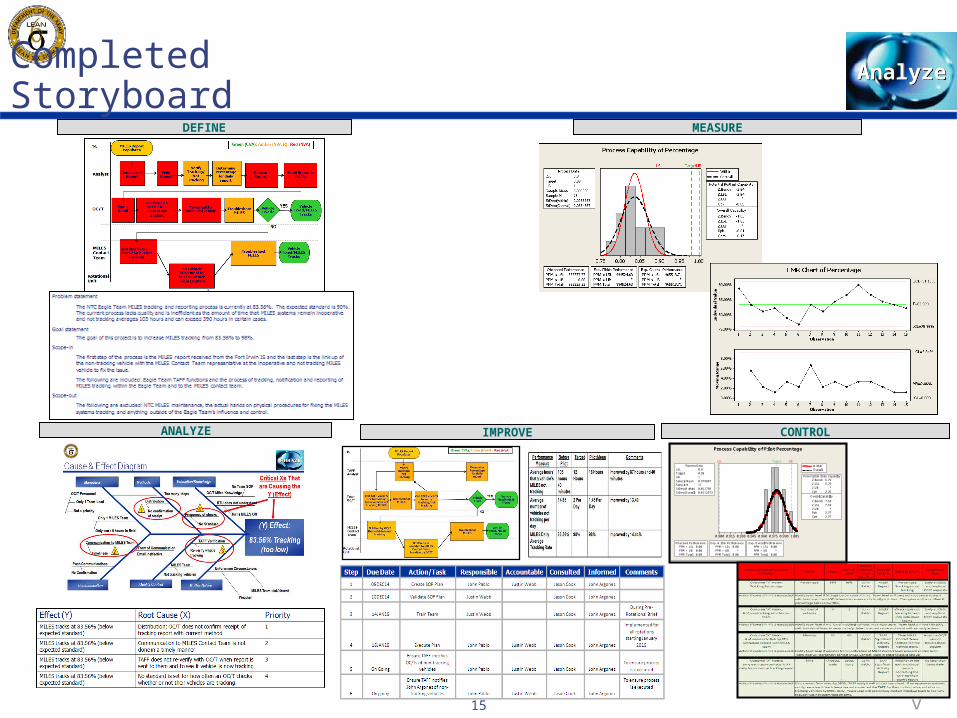
MEASURE
ANALYZE IMPROVE CONTROL
15
DEFINE
Completed Storyboard
1.0050.9900.9750.9600.9450.9300.9150.900
LSL Target UB
LSL 0.9Target 0.98UB 1Sample Mean 0.979887Sample N 11StDev(Within) 0.011768StDev(Overall) 0.0112573
Process Data
Z.Bench 6.79Z.LSL 6.79Z.UB *Cpk 2.26
Z.Bench 7.10Z.LSL 7.10Z.UB *Ppk 2.37Cpm 2.37
Overall Capability
Potential (Within) Capability
PPM < LSL 0.00PPM > UB 0.00PPM Total 0.00
Observed PerformancePPM < LSL 0.00PPM > UB *PPM Total 0.00
Exp. Within PerformancePPM < LSL 0.00PPM > UB *PPM Total 0.00
Exp. Overall Performance
WithinOverall
Process Capability of Pilot Percentage
ControlControl
v 3.016
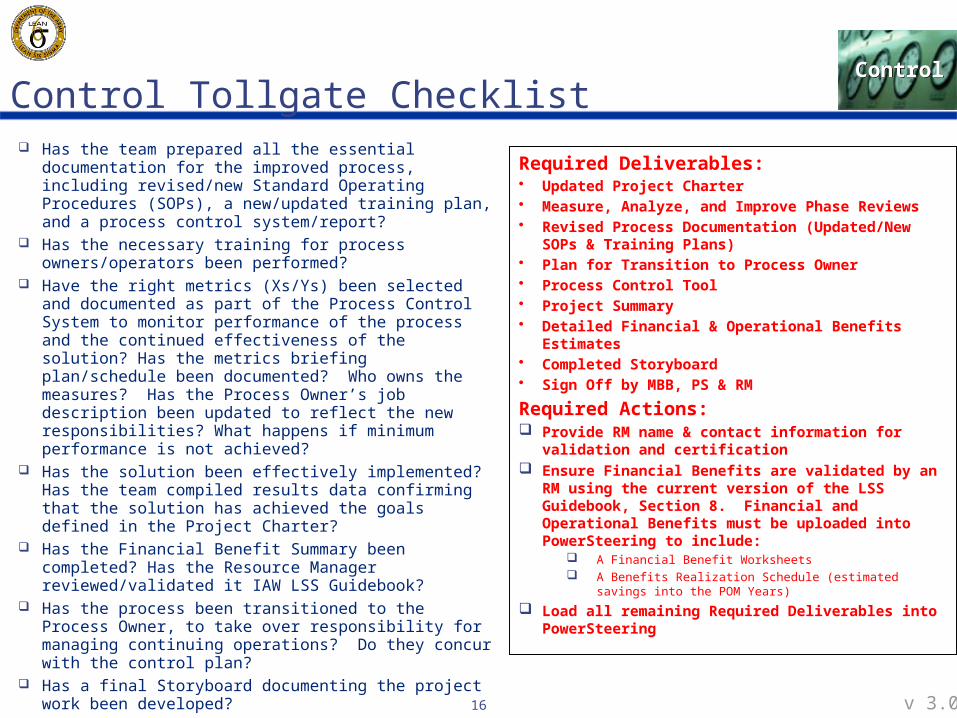
Control Tollgate Checklist Has the team prepared all the essential documentation for the improved
process, including revised/new Standard Operating Procedures (SOPs), a new/updated training plan, and a process control system/report?
Has the necessary training for process owners/operators been performed?
Have the right metrics (Xs/Ys) been selected and documented as part of the Process Control System to monitor performance of the process and the continued effectiveness of the solution? Has the metrics briefing plan/schedule been documented? Who owns the measures? Has the Process Owner’s job description been updated to reflect the new responsibilities? What happens if minimum performance is not achieved?
Has the solution been effectively implemented? Has the team compiled results data confirming that the solution has achieved the goals defined in the Project Charter?
Has the Financial Benefit Summary been completed? Has the Resource Manager reviewed/validated it IAW LSS Guidebook?
Has the process been transitioned to the Process Owner, to take over responsibility for managing continuing operations? Do they concur with the control plan?
Has a final Storyboard documenting the project work been developed? Has the team forwarded other issues/opportunities, which were not able
to be addressed, to senior management? Have “lessons learned” been captured? Have replication opportunities been identified and communicated to
similar agencies (internal and external)? Has the hard work and successful efforts of our team been celebrated?
Required Deliverables:• Updated Project Charter• Measure, Analyze, and Improve Phase Reviews• Revised Process Documentation (Updated/New
SOPs & Training Plans)• Plan for Transition to Process Owner• Process Control Tool• Project Summary• Detailed Financial & Operational Benefits
Estimates• Completed Storyboard• Sign Off by MBB, PS & RM
Required Actions: Provide RM name & contact information for
validation and certification Ensure Financial Benefits are validated by an
RM using the current version of the LSS Guidebook, Section 8. Financial and Operational Benefits must be uploaded into PowerSteering to include:
A Financial Benefit Worksheets A Benefits Realization Schedule (estimated savings into
the POM Years)
Load all remaining Required Deliverables into PowerSteering
ControlControl
v 3.017
• The policies and procedures for the Improve and Control phases have been documented and communicated to all key stakeholders. I understand any new policies, procedures, or training that is required.
• I understand and take responsibility for monitoring and enforcing the Control/Response Plan, recurring reports, & Visual Control Charts, as applicable.
• I concur the project has completed all required deliverables and that the Control Tollgate Review was successfully completed on 15 DEC 14
• I have electronically approved this tollgate in PowerSteering.
• I have validated the operational benefit estimates and those estimates have been uploaded into this Tollgate briefing IAW Section 2 of the ASA (FM&C) LSS Financial Guidebook, Resource Managers validate cost savings and MDEP data elements. I have electronically approved this tollgate in PowerSteering.
• I have validated the financial benefit estimates and those estimates have been entered into PowerSteering and this Tollgate briefing IAW Sections 7 and 8 of the LSS Deployment Guidebook.
• I have electronically approved this tollgate in PowerSteering.
Christopher RuderResource Manager/Finance
Stephen WilkinsMBBc or MBB Mentor
Jason CookSponsor / Process Owner
Tollgate Attestations