Embed Size (px)
Citation preview
Weber, Work Ethic And Well-Being
André van Hoorna,• & Robbert Maselandb,c
a Radboud University Nijmegen, Department of Economics
b Radboud University Nijmegen, Department of Political Science
c Max Planck Institute for the Study of Societies, Cologne
Keywords: values, religion, happiness, preferences, outcomes, culture
JEL Classification: J20; J60; P50; Z12
• Corresponding author, PO Box 9108, 6500 HK, Nijmegen, the Netherlands. Tel: +31 243
612 344, Fax: +31 243 612 379, E-mail: [email protected].
Weber, Work Ethic And Well-Being
Abstract
Following Max Weber’s seminal work, much recent work has turned to religious values to
explain socio-economic developments. We present a test of Weber’s original thesis that
addresses fundamental limitations of previous research. A novel method that builds on
happiness research is used to measure a religious work ethic in terms of the psychic costs of
unemployment. The resulting ‘experienced preferences’ provide strong support for Weber’s
original thesis: for both Protestants and Protestant countries, not having a job has
substantially larger negative happiness effects than for other religious denominations. This
provides a Weber-type channel relating religion to socio-economic outcomes.
More than a century after its publication, Max Weber’s The Protestant Ethic and the Spirit of
Capitalism (1930 [1904-5]) continues to inspire social scientists in many disciplines. A large
stream of work in the social sciences has built on the idea that religious values can explain
social and economic developments. Over the past decades, this research has received an
important impetus by the publication of large scale, cross-cultural values surveys (e.g.
Hofstede, 1980,2001; Inglehart, 1990). The availability of data about value differences
between countries has made it possible to investigate the relations between values and socio-
economic outcomes empirically.
Paradoxically, much of this research has failed to find support for the thesis of Weber
that originally inspired the literature. Any convincing relation between Protestantism on the
one hand and work ethic or economic development on the other has yet failed to materialize
in the data (e.g. Lehmann and Roth, 1993; Iannoccone, 1998; Delacroix and Nielsen, 2001).1
In fact, many researchers have reported evidence that Protestants overall value work less than
people from other religions do (Norris and Inglehart, 2004; Weil, 2008). Furthermore, many
authors have found negative associations between practices and values retrieved from values
surveys, implying that a strong work ethic does not translate into higher employment rates or
longer working hours (Bertrand and Mullainathan, 2001; House et al., 2004; Javidan et al.,
2006).
At the same time, the practice of using values surveys in order to measure cultural or
religious values has come under fire from several directions. Methodological critiques have
been forthcoming ever since values surveys became public (see Hofstede, 2001, p. 73 for an
1 In so far as people have found support for the idea of a link between Protestantism and
economic prosperity, it has been argued that the more plausible route runs via literacy levels
rather than the prevalence of a ‘capitalist spirit’, as Weber wants it (Becker and Wößmann,
2007).
overview). A particular damaging line of criticism has been the revelation that scores in
values surveys turn out to be extremely dependent on societal conditions (e.g. Clarke et al.,
1999; Davis et al. 1999; Duch and Taylor, 1993). Recently, it has been argued that this
problem has its roots in the failure of values surveys to distinguish between deep-rooted value
traits and marginal preferences. Values surveys have been shown to elicit not the importance
attached to objectives such as work, but only the importance attached to a little more or less
work on top of the currently enjoyed quantity (Maseland and van Hoorn, 2008).
In this paper, we argue that these conceptual and methodological issues are
responsible for the failure to find empirical support for the Weber thesis, and we develop an
alternative method to overcome these problems. We show that the counterintuitive results of
earlier studies are intelligible when values surveys are interpreted in terms of marginal
preferences. Moving away from values surveys in favour of an approach focusing on
differences in the effects of situational factors on happiness, we find support for the thesis
that Protestants value work more. We conclude that, when values are measured properly, the
Weber thesis is confirmed by the data.
The structure of our argument is as follows. In the first section we discuss the Weber
thesis in more detail, looking at contemporary interpretations and efforts to find empirical
support for the thesis. Section 2 scrutinizes the values surveys approach to measuring values
and introduces an alternative method, which one might dub ‘experienced preferences’. We
apply this new method to the problem of the relation between Protestantism and work ethic.
Our empirical strategy and the results of the analysis are discussed in Sections 3 and 4. We
round off with a discussion and conclusion, in which we elaborate the methodological and
theoretical implications of our findings for future research into values and the economy.
1. RELIGION AND WORK ETHIC: WEBER’S THESIS
The Protestant Ethic and the Spirit of Capitalism goes into history as one of the most
frequently cited books in social sciences. Weber’s argument about the relation between
Protestantism and capitalism has spawned an extensive and diverse literature dealing with the
effect of religious values on economic performance. Some of this literature has retained
Weber’s original focus on Protestantism. Other contributions have reworked the argument,
applying it to other religions such as Catholicism (Tawney, 1926) or, more recently,
Confucianism (Harrison, 1992; Harrison and Huntington, 2000; Kahn 1979). Still others have
quantitatively assessed the role of non-religiously specified sets of values (e.g. Granato et al.,
1996). More recently, general associations between religion and economic outcomes have
been analysed empirically (Barro and McCleary, 2003; Guiso et al., 2006). Throughout this
literature, Weber is commonly referred to as the person starting the debate about the link
between religious ethics and economic growth.
Before we delve into empirical tests of the Weber thesis, it pays to briefly go back to
the original argument of the Protestant Ethic. As Giddens (2001, p. xx) and many others have
emphasized, Weber’s famous essay can be approached on many different levels. The
Protestant Ethic establishes a historical relation between the emergence of capitalism as a
dominant economic system in Western Europe and North America and the Protestant
reformation centuries earlier. More in particular, Weber draws attention to the peculiar
ascetic ethical system propagated in Protestantism. Here originated the idea of a ‘calling’, a
perception of one’s work and other economic activities as God-given duties. The emphasis on
worldly activity as a means to prove one’s faith eventually evolved, through a process of
rationalization, into what Weber calls the ‘spirit of capitalism’; the idea that working for the
purpose of profit is a moral good in itself. As Weber writes:
‘… one’s duty in a calling, is what is most characteristic of the social ethic of capitalistic
culture, and is in a sense the fundamental basis of it. It is an obligation which the individual
is supposed to feel and does feel towards the content of his professional activity, no matter in
what it consists, in particular no matter whether it appears on the surface as a utilization of
his personal powers. Or only of his material possessions (as capital).’ (Weber, 1930, p. 19).
In contrast to the common interpretation of the Protestant Ethic (e.g. Becker and Wößmann,
2007; Granato et al., 1996; Weil, 2008), there is little in the original text to suggest that
Weber saw a causal relation between being Protestant and enjoying economic prosperity.
Rather than that, he was trying to explain the initial origin of modern industrial capitalism in
Northwest European and North American societies, relating it to values historically
retraceable to a specific religious ethics. Weber argues that modern capitalism’s outstanding
feature—compared to previous capitalist practices—is a set of values that is religious in
origin, but has been rationalized and secularized over time.2 What is more, a link with
economic growth and prosperity is largely absent in the work.3 Nevertheless, the ‘Common
Interpretation’ (Delacroix and Nielsen, 2001) of the Protestant Ethic, seeing in Protestantism
a cause of economic progress, has taken a life of its own.
2 Weber (1930, p. 27) writes: ‘the cultural consequences of the Reformation were to a great
extent, perhaps in the particular aspects with which we are dealing predominantly, unforeseen
and even unwished-for results of the labors of the reformers. They were often far removed
from or even in contradiction to all that they themselves thought to attain.’
3 The awareness of such a link may have been Weber’s motivation to write The Protestant
Ethic, however. In addition, although, the present paper by focussing on Weber’s original
thesis differs from recent quantitative work in economics, it is also strongly motivated by the
possible link between religion and economic performance.
A problem with this common interpretation is that it transforms Weber’s argument
into two controversial theses rather than one, rendering testing difficult. First, it argues that
Protestantism results in a strong work ethic, and second, it claims that a strong work ethic is a
main determinant of economic growth and prosperity. Elsewhere, it has been shown that the
latter relation is not that straightforward. Authors have reported evidence that people in poor
countries attach more importance to work than people in developed countries do (e.g. Weil,
2008). Furthermore, it has been pointed out that inhabitants of some of the most rapidly
growing economies of the past century (for example Japan, South Korea, Malaysia) have
historically been viewed as lacking in work ethic (Alatas, 1977; Chang, 2007; Landes, 1998).
Finally, caution is due as arguments about any relation between a work ethic and economic
prosperity have often been used to legitimise rather than explain inequality (Alatas 1977;
Said 1978).
For this reason, we adopt a more limited focus here, dealing with the relation between
Protestantism and work ethic, without going into the effects on economic performance.
Empirical investigations into this relation have been conducted amongst others by Norris and
Inglehart (2004). In that study, the idea is that if Weber’s thesis is correct, Protestantism
should ‘have left an enduring legacy in values that still remains visible today’ (p. 162). To
test whether this is indeed the case, they first construct a multidimensional measure of work
ethic using a selection of items from the World Values Survey. Specifically, their index
combines questions asking about, amongst others, which aspects people find important in a
job (e.g. ‘an opportunity to use initiative, ‘good hours,’ and ‘good pay’), and the extent to
which people agree with the statement that ‘work is a duty towards society,’ and that ‘people
who don’t work turn lazy’ (p. 163). To their surprise, the analysis shows that people living in
Protestant societies have a weaker work ethic than many individuals from other religious
cultures. Norris and Inglehart (2004) conclude that the Weber thesis is to be dismissed.
However, since this study relies entirely on values survey data for its results, there are doubts
about the validity of this conclusion.
2. MEASURING THE WORK ETHIC
2.1 Why Values Surveys Do Not Work
Equally controversial as the Weber thesis is the use of values surveys to study differences in
values between societies. The assumption of a link between what respondents say in surveys
and their deep-rooted values has long been questioned (e.g. Clarke et al., 1999; Davis et al.,
1999). On top of this methodological criticism, it has been argued recently that values
surveys are likely to be conceptually misguided (Maseland and van Hoorn, 2008). Values
surveys tend to mistake marginal preferences (the importance attached to somewhat more or
less satiation of any objective) for values (the importance attached to an objective in general).
While we can expect a positive relation to exist between values and practices, marginal
preferences are likely to decrease with rising satiation of an objective. Due to the principle of
diminishing marginal utility, the importance attached to work falls with the amount of work
performed.
Elsewhere, it has been shown that a negative relation indeed exists between values
and practices, suggesting that values surveys elicit marginal preferences rather than values
(see, for example, Bertrand and Mullainathan, 2001; House et al., 2004; Javidan et al., 2006).
This puts the results of Norris and Inglehart (2004) in a different light. If the World Values
Survey is interpreted as eliciting marginal preferences rather than values, Norris and
Inglehart’s (2004) findings are actually in line with Weber’s original insight. Were
Protestants to value work higher, they would express this preference by working more, which
causes their marginal preference for work to fall. A lower score on values surveys items
about work is thus not at odds with the argument ascribed to Weber. It merely indicates that
values surveys are not appropriate for testing the Weber thesis. We need a different strategy.
2.2 Well-Being And Unemployment
For an alternative approach to measure a work ethic, we turn towards the literature on
subjective well-being. Subjective well-being, commonly abbreviated as SWB, refers to ‘a
broad category of phenomena that includes people’s emotional responses, domain
satisfactions, and global judgments of life satisfaction’ (Diener et al., 1999, p. 277). The
SWB construct is often used synonymously with happiness, though happiness is generally
associated somewhat more with hedonic experience and the affective part of SWB. There is a
great deal of evidence showing the reliability and validity of indicators of SWB, which often
involves simply asking people how happy or satisfied with life they are (see, for example,
Diener et al., 1999 and Frey and Stutzer, 2002 and references therein). What we are interested
in here is heterogeneity in the structure of SWB.
Various situational factors have been shown to have an impact on SWB, and
unemployment is one of them (Diener et al., 1999 and Frey and Stutzer, 2002). Clark and
Oswald (1994) analyse data from the British Household Panel and find that unemployed
people have much lower levels of mental well-being than those in work. Similar results have
been reported by Helliwell (2003) using data from the World Values Survey. What is more, it
is clear that the effect runs from unemployment to SWB. Using longitudinal data, Clark et al.
(2008) demonstrate that individuals who lose their job find their level of SWB decreasing
substantially upon becoming unemployed, while they do not have lower SWB to begin with.
Unemployment not only affects the well-being of the people losing their jobs, but also has an
indirect impact on the population as a whole. This effect can be linked to notions of
solidarity, fears of getting unemployed, reduced opportunities to change jobs, reduced
chances of obtaining promotions or salary increases, and rising crime rates (e.g. Di Tella and
MacCulloch, 2008).
Although the negative effect of unemployment on SWB is a persistent result in the
literature, the size of this effect has been shown to differ between groups of people. For
instance, there is evidence that being unemployed is easier for people living in a region with
high unemployment or for younger people (Clark and Oswald, 1994; Winkellmann and
Winkellmann, 1998). Clark (2003) explains these results on the basis of reference groups and
social norms, arguing that the more common unemployment is among your peers the weaker
the stigma the unemployed suffer.4 An alternative interpretation of these findings would be
that the causality runs the other way around: groups of people for whom the psychic costs of
unemployment are lower may be making lesser efforts to find or keep jobs. In this
interpretation, lower psychic costs of unemployment are indicative of a weaker work ethic.
2.3 The Protestant Work Ethic And The Psychic Costs Of Unemployment
If we define a work ethic as the importance attached to having a job, differences between
groups in size of the effects of unemployment on well-being can be interpreted as differences
in work ethic. People attaching a lot of importance to work are hurt more by losing their job
than people who think work is unimportant in life. This is what differences in the effect size
of unemployment on SWB indicate.
Religion has been shown to have an impact on these effect sizes. Apart from direct
effects of religiosity on well-being (Diener et al., 1999; Helliwell, 2003), there is evidence
that the impact of economic factors on well-being differs between religious and non-religious
groups. For instance, religious beliefs seem to shield against part of the negative well-being
4 For theoretical work on the relation between unemployment and psychological well-being
see, for example, Hayes and Nutman (1981) and Darity and Goldsmith (1996).
effects of stressors like unemployment (Clark and Lelkes, 2005). Also, Lelkes (2006) reports
that the effect of economic variables including income on happiness is smaller among the
religious than among the non-religious. Apparently, religious people value work and income
less than non-believers do.
The question is whether we can find such differences between Protestants and non-
Protestants as well. Such a finding would allow us to reach a verdict on the Weber thesis.
This results in the following hypothesis.
Hypothesis 1: Holding everything else constant, reported happiness ratings of Protestants
are more influenced by being unemployed than those of people from other religions.
Hypothesis 1 is useful for testing one of the more common interpretations of the Weber
thesis—i.e. that those being Protestants now are likely to have a stronger work ethic than
people currently holding different religious beliefs. However, we have noted that Weber’s
original argument did not so much focus on Protestantism in the present but on a Protestant
ethic as a historical factor, having evolved into a rational, secular ‘spirit of capitalism’. An
hypothesis closer to the original argument is therefore:
Hypothesis 2: Holding everything else constant, reported happiness ratings of people from
historically Protestant regions are more influenced by being unemployed, than those of
people from other regions.
These hypotheses state that there is systematic heterogeneity in the way in which
unemployment is transformed into (un)happiness. The focus hereby is on the direct psychic
costs of unemployment and how this negative happiness effect is moderated by religious
denomination, in particular by Protestantism. To make sure that we measure the pure SWB
effect of unemployment, in the empirical analyses we correct for indirect effects of being
unemployed, which might run through other factors such as income. The next section
discusses our statistical method and data in more detail.
3. DATA AND METHOD
3.1 Description Of The Data
The data we use in our empirical analysis is taken from the European Values Study and
World Values Survey (EVS and WVS) respectively. These surveys interview people mainly
concerning their values and attitudes, and have been carried out in four different ‘waves’: (1)
1981-1984, (2) 1989-1993, (3) 1994-1999 (WVS only), and (4) 1999-2004. Recently the data
from these surveys have been combined in a single dataset comprising all waves (European
Values Study Group and World Values Survey Association, 2006).5 The surveys cover
267,870 individuals in 86 country regions (see Table A.1 for a list of the countries we use in
our analysis).
The dependent variable of interest is given by the answer to the following question:
‘Taking all things together, would you say you are:’ for which the following possible answers
are given: ‘1, very happy’; ‘2, quite happy’; ‘3, not very happy’; ‘4, not at all happy’. To
facilitate the ease of interpretation of the findings, we analyse this happiness variable as
though it is an ordinal variable (range 1 to 4), noting that this drops some information but will
not substantially affect our results (Ferrer-i-Carbonell and Frijters, 2004 and Clark et al.,
2008). Table A.1 provides average happiness scores for selected countries.
5 This dataset is publicly available from http://www.jdsurvey.net. For further discussion of
this dataset, see http://www.europeanvalues.nl and http://www.worldvaluessurvey.org.
To the use of survey questions to assess respondents’ SWB the usual caveats apply (as
to other survey data; Bertrand and Mullainathan, 2001). However, as mentioned, happiness
data obtained through such surveys pass tests of reliability and validity. In addition, as
discussed in Diener and Suh (2000), SWB scales are comparable across societies.
The explanatory variables we are most interested in concern individuals’ employment
status and religious denomination. Regarding employment status, the combined EVS-WVS
dataset discerns 8 categories, ‘Full time’ employed, ‘Part time’ employed, ‘Self employed’,
‘Retired’, ‘Housewife’, ‘Students’, ‘Unemployed’ and ‘Other’. For religious denomination
we use the answers to the question whether people belong to a religious denomination and to
which one they belong. A great number of possible denominations is included in the EVS and
WVS, one of which is Protestant. In the analysis only individuals who indicated they belong
to a religious denomination are included (about 76% of all respondents).
The EVS and WVS have also asked questions on respondents’ backgrounds such as
their marital status, sex, health status and income scale. Controlling for these other situational
factors is important as unemployment is likely to have an indirect impact on self-reported
happiness through its effect on these individual circumstances. Notably, unemployment is
associated with lower income. The negative happiness effect of unemployment may also be
driven by other situational factors associated with unemployment. People with poor health,
for example, have a higher risk of being unemployed so that the effect of unemployment on
happiness is partly a result of employment status proxying for health status.
To address these problems, in almost all of the analyses we present below these
characteristics are included as control variables. We have treated them the same as all other
variables, meaning that individuals with missing answers, or ‘unanswered’ or ‘don’t know’
response on the relevant variable are excluded. For all respondents the country of residence is
available, and the same holds for the survey year. Depending on which explanatory variables
are included in the empirical analysis, this leaves between 130,000 and 250,000 individuals.
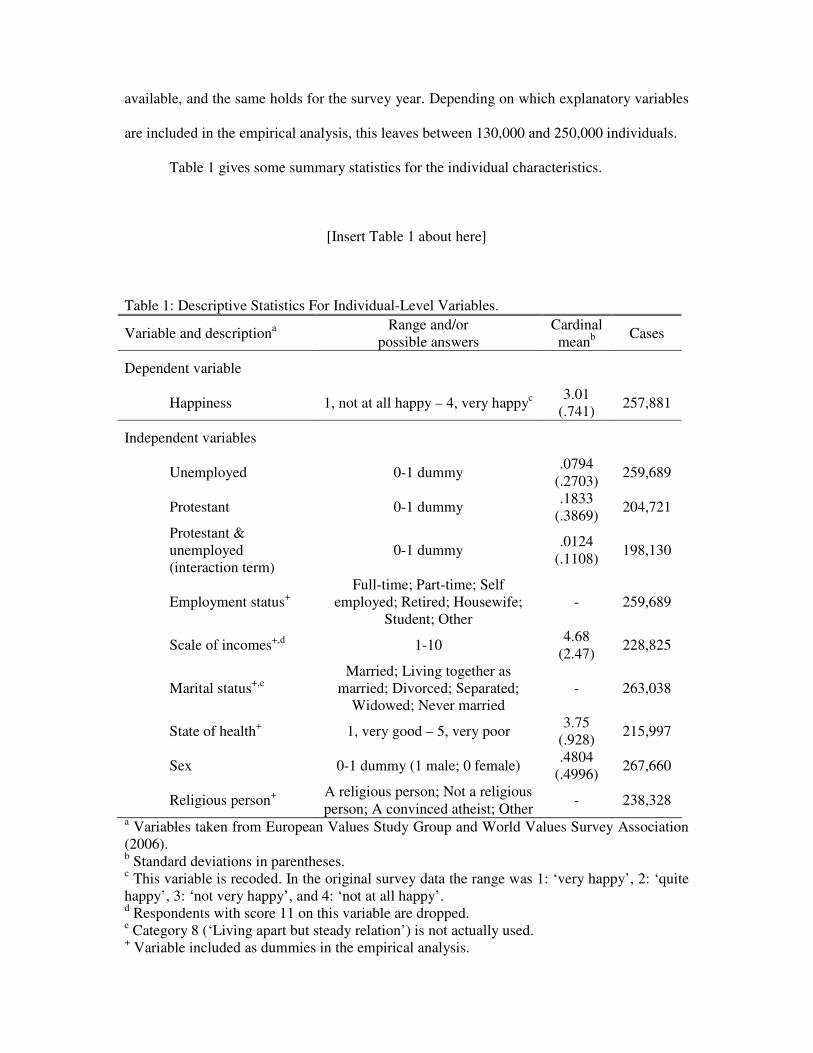
Table 1 gives some summary statistics for the individual characteristics.
[Insert Table 1 about here]
Table 1: Descriptive Statistics For Individual-Level Variables.
Variable and descriptiona Range and/or
possible answers Cardinal meanb Cases
Dependent variable
Happiness 1, not at all happy – 4, very happyc 3.01
(.741) 257,881
Independent variables
Unemployed 0-1 dummy .0794
(.2703) 259,689
Protestant 0-1 dummy .1833
(.3869) 204,721
Protestant & unemployed (interaction term)
0-1 dummy .0124
(.1108) 198,130
Employment status+ Full-time; Part-time; Self
employed; Retired; Housewife; Student; Other
- 259,689
Scale of incomes+,d 1-10 4.68
(2.47) 228,825
Marital status+,e Married; Living together as
married; Divorced; Separated; Widowed; Never married
- 263,038
State of health+ 1, very good – 5, very poor 3.75
(.928) 215,997
Sex 0-1 dummy (1 male; 0 female) .4804
(.4996) 267,660
Religious person+ A religious person; Not a religious person; A convinced atheist; Other
- 238,328
a Variables taken from European Values Study Group and World Values Survey Association (2006). b Standard deviations in parentheses. c This variable is recoded. In the original survey data the range was 1: ‘very happy’, 2: ‘quite happy’, 3: ‘not very happy’, and 4: ‘not at all happy’. d Respondents with score 11 on this variable are dropped. e Category 8 (‘Living apart but steady relation’) is not actually used. + Variable included as dummies in the empirical analysis.
We extend our basic analysis to check at which level the Protestant work ethic operates, at
the level of individuals or at the nation level. Specifically, we look at the impact of
contemporary Protestant domination and countries’ Protestant heritage on the negative
happiness effect of unemployment.
Some other country-level variables are included as control variables when analysing
the robustness of our results. First, formal institutions such as social security benefits may
affect the psychic distress associated with unemployment, possibly biasing our results. To
control for this we include information of the type of welfare state in several of our
regressions. We use the classic typology of Esping-Andersen (1990) which allows us to
identify Liberal, Conservative and Social Democratic welfare state regimes.6
Secondly, we take into account Helliwell’s (2003) finding that unemployment has
higher negative happiness effects in OECD countries than in developing countries to control
for the level of economic development and its possible effect on the psychic costs of
unemployment. For this purpose, we use data on per-capita GDP from The Conference Board
and Groningen Growth and Development Centre (2008). Levels of income per capita in our
sample range from about $600 (Tanzania, 2001) to almost $31,000 (Luxembourg, 1999) (in
1990 PPPs).
Table A.1 in the appendix gives some statistics on the country level variables—as far
as they are available.
6 Australia, Canada, the United States, New Zealand, Ireland and the United Kingdom are the
liberal welfare states (LIB); Italy, Japan, France, Germany, Finland and Switzerland are the
conservative welfare states (CONS); and Austria, Belgium, Netherlands, Denmark, Norway
and Sweden are the social democratic welfare states (SOCD).
3.2 Empirical Strategy
An important feature of the EVS-WVS data is its hierarchical nature with individual
observations (Level 1) nested in countries (Level 2). For statistical analysis, this data
structure poses a special challenge as the individual observations are not independent,
violating a standard assumption regression analysis. Technically, the happiness ratings of
individuals within a country are correlated, meaning that we can partly predict one person’s
happiness score from the happiness score of a fellow citizen, simply because they have a
common context, namely the nation in which they live.7 Using Ordinary Least Squares
regression, standard errors will be underestimated, and there is a need to control for clustering
at the nation level (Moulton, 1990; see also, for example, Helliwell, 2003).
We deal with the hierarchical structure of the data by applying a special technique
called multilevel or hierarchical modelling (e.g. Gelman and Hill, 2007), a statistical method
tailored to be used specifically with this kind of data. This technique is not common in
economics but widely applied in, for instance, medicine—patients nested within treatment
centres—or geography—regions nested in nations.8 Multilevel analysis allows us to not only
address the problem of intraclass correlation, but offers other advantages as well. It allows for
7 The intraclass correlation for individuals within countries in our full sample equals 0.14,
meaning that 14% of all variance between individuals can be attributed to factors operating at
the aggregate level, i.e. between countries. Individual scores within a country are a long way
from being fully independent observations.
8 Schyns (2002) applies multilevel modelling to analyse the effects of individual- and
country-level factors on SWB using data from the second wave of the World Values Survey.
Huisman and Smits (2008) apply (three-level) multilevel analysis to examine the effect of
household-level (level 1) and district-level factors (level 2) on primary school enrolment in
30 developing countries (level 3).
more efficient inference than is possible with complete pooling or no pooling of the data.
Most important for our purposes, with multilevel modelling we can estimate the SWB effect
of individual and contextual (country-level) factors simultaneously and derive a clear picture
of how higher level factors influence lower level relations (cross-level interactions), for
example how the type of welfare state moderates the unemployment-happiness relation.
For the formal empirical model we have an individual j (Level 1) who resides in
country i (Level 2). Letting Hij denote self-reported happiness, Uij unemployment (0-1
dummy), Pij Protestant denomination (0-1 dummy), xij the vector of other individual-level
explanatory variables and zj the vector of country-level variables, for Level 1 and Level 2
separately the model is given by:
3jj31303j
2jj21202j
1jj11101j
0jj01000j
ijij40ijij3jij2jij1j0jij
uγγβ
uγγβ
uγγβ
uγγβ
:2Level
εβPUβPβUββH
:1Level
++=
++=
++=
++=
+++++=
z
z
z
z
x
, (1)
where the effect of unemployment, being a Protestant and the interaction between these two
(but not the effect of other level-1 variables such as marital status) is allowed to vary with
country-level circumstances ( jz ), specifically with Protestant dominance or the generosity of
the welfare state. Since we also include a constant for all countries ( 00γ ), the model is a
varying intercepts, varying-coefficients model in the terminology of Gelman and Hill (2007).
The complete model follows simply from combining the two levels:
[ ]ijijij3jij2jij1j0jijj31ijj21
ijj11ij40ijij30ij20ij10j0100ij
εPUuPuUuuPUγPγ
UγPUγPγUγzγγH
+++++++
++++++=
zz
zxβ, (2)
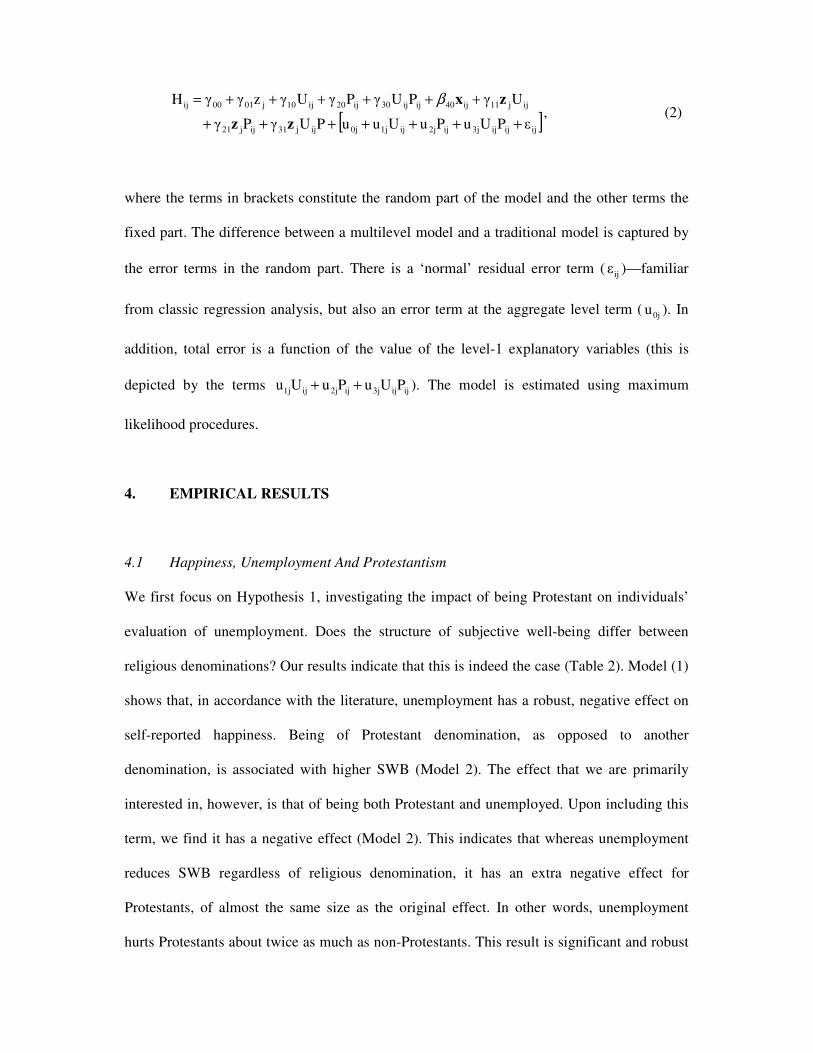
where the terms in brackets constitute the random part of the model and the other terms the
fixed part. The difference between a multilevel model and a traditional model is captured by
the error terms in the random part. There is a ‘normal’ residual error term ( ijε )—familiar
from classic regression analysis, but also an error term at the aggregate level term ( 0ju ). In
addition, total error is a function of the value of the level-1 explanatory variables (this is
depicted by the terms ijij3jij2jij1j PUuPuUu ++ ). The model is estimated using maximum
likelihood procedures.
4. EMPIRICAL RESULTS
4.1 Happiness, Unemployment And Protestantism
We first focus on Hypothesis 1, investigating the impact of being Protestant on individuals’
evaluation of unemployment. Does the structure of subjective well-being differ between
religious denominations? Our results indicate that this is indeed the case (Table 2). Model (1)
shows that, in accordance with the literature, unemployment has a robust, negative effect on
self-reported happiness. Being of Protestant denomination, as opposed to another
denomination, is associated with higher SWB (Model 2). The effect that we are primarily
interested in, however, is that of being both Protestant and unemployed. Upon including this
term, we find it has a negative effect (Model 2). This indicates that whereas unemployment
reduces SWB regardless of religious denomination, it has an extra negative effect for
Protestants, of almost the same size as the original effect. In other words, unemployment
hurts Protestants about twice as much as non-Protestants. This result is significant and robust
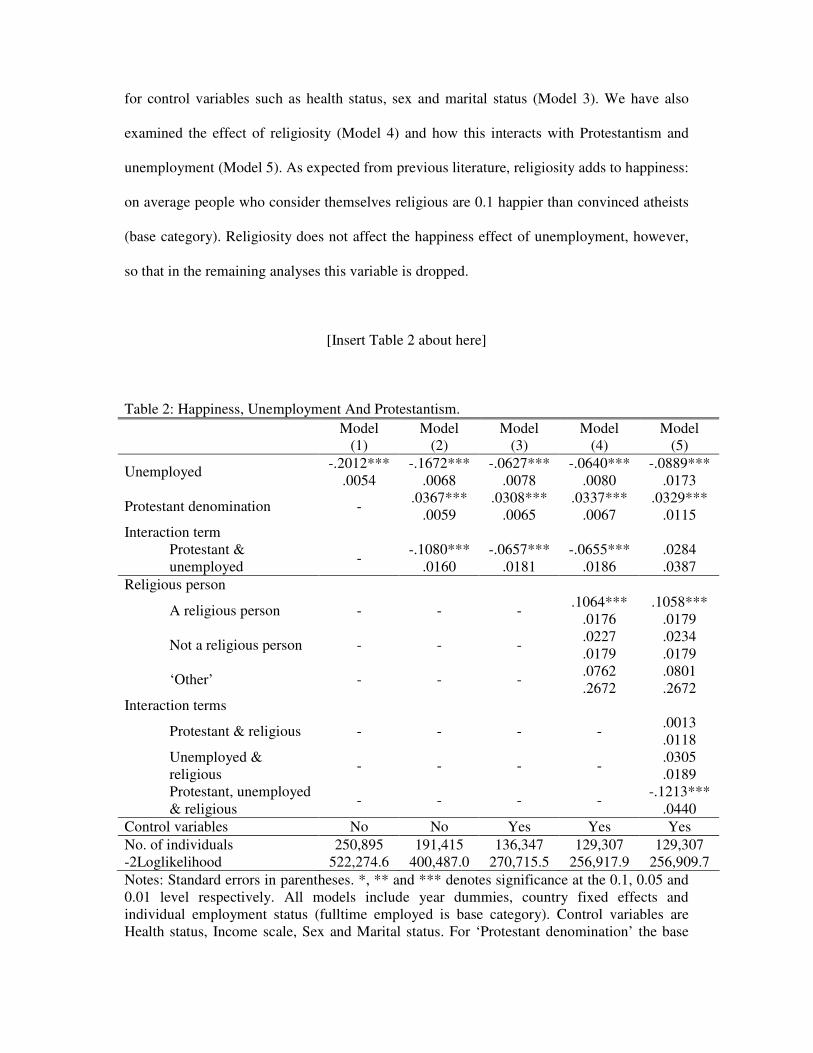
for control variables such as health status, sex and marital status (Model 3). We have also
examined the effect of religiosity (Model 4) and how this interacts with Protestantism and
unemployment (Model 5). As expected from previous literature, religiosity adds to happiness:
on average people who consider themselves religious are 0.1 happier than convinced atheists
(base category). Religiosity does not affect the happiness effect of unemployment, however,
so that in the remaining analyses this variable is dropped.
[Insert Table 2 about here]
Table 2: Happiness, Unemployment And Protestantism.
Model Model Model Model Model (1) (2) (3) (4) (5)
Unemployed -.2012***
.0054 -.1672***
.0068 -.0627***
.0078 -.0640***
.0080 -.0889***
.0173
Protestant denomination - .0367***
.0059 .0308***
.0065 .0337***
.0067 .0329***
.0115 Interaction term
Protestant & unemployed
- -.1080***
.0160 -.0657***
.0181 -.0655***
.0186 .0284 .0387
Religious person
A religious person - - - .1064***
.0176 .1058***
.0179
Not a religious person - - - .0227 .0179
.0234
.0179
‘Other’ - - - .0762 .2672
.0801
.2672 Interaction terms
Protestant & religious - - - - .0013 .0118
Unemployed & religious
- - - - .0305 .0189
Protestant, unemployed & religious
- - - - -.1213***
.0440
Control variables No No Yes Yes Yes
No. of individuals 250,895 191,415 136,347 129,307 129,307 -2Loglikelihood 522,274.6 400,487.0 270,715.5 256,917.9 256,909.7
Notes: Standard errors in parentheses. *, ** and *** denotes significance at the 0.1, 0.05 and 0.01 level respectively. All models include year dummies, country fixed effects and individual employment status (fulltime employed is base category). Control variables are Health status, Income scale, Sex and Marital status. For ‘Protestant denomination’ the base
category is formed by all other religious denominations and for ‘Religious person’ the base category is ‘Convinced atheist’ (see Table 1).
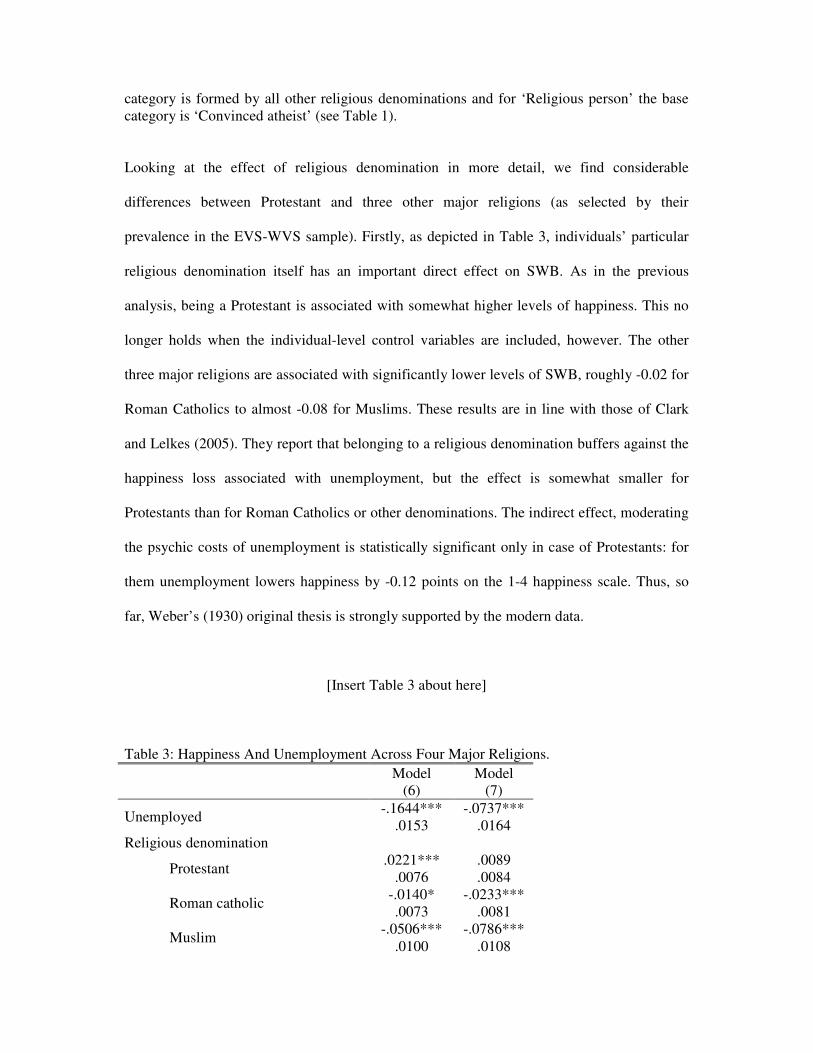
Looking at the effect of religious denomination in more detail, we find considerable
differences between Protestant and three other major religions (as selected by their
prevalence in the EVS-WVS sample). Firstly, as depicted in Table 3, individuals’ particular
religious denomination itself has an important direct effect on SWB. As in the previous
analysis, being a Protestant is associated with somewhat higher levels of happiness. This no
longer holds when the individual-level control variables are included, however. The other
three major religions are associated with significantly lower levels of SWB, roughly -0.02 for
Roman Catholics to almost -0.08 for Muslims. These results are in line with those of Clark
and Lelkes (2005). They report that belonging to a religious denomination buffers against the
happiness loss associated with unemployment, but the effect is somewhat smaller for
Protestants than for Roman Catholics or other denominations. The indirect effect, moderating
the psychic costs of unemployment is statistically significant only in case of Protestants: for
them unemployment lowers happiness by -0.12 points on the 1-4 happiness scale. Thus, so
far, Weber’s (1930) original thesis is strongly supported by the modern data.
[Insert Table 3 about here]
Table 3: Happiness And Unemployment Across Four Major Religions.
Model Model (6) (7)
Unemployed -.1644***
.0153 -.0737***
.0164 Religious denomination
Protestant .0221***
.0076 .0089 .0084
Roman catholic -.0140* .0073
-.0233*** .0081
Muslim -.0506***
.0100 -.0786***
.0108
Orthodox -.0603***
.0119 -.0455***
.0133 Interaction terms
Protestant & unemployed -.1114***
.0210 -.0552**
.0231
Roman catholic & unemployed -.0033 .0179
.0131
.0198
Muslim & unemployed -.0200 .0198
.0171
.0211
Orthodox & unemployed .0276 .0227
.0163
.0254
Control variables No Yes
No. of individuals 191,415 136,347 -2Loglikelihood 400,443.6 270,661.6
Notes: See Table 2. For ‘Religious denomination’, the base category is formed by all other religious denominations.
One explanation for the finding that unemployment seems to hurt Protestants more could be
that they are more materialistic and care more about the income associated with having a job.
In order to investigate this possibility, we have included the effect of income for Protestants
and the remainder of the population in our estimation of SWB (Table 4). We find that it is not
because they care more about income that Protestants are hurt more by joblessness.9
[Insert Table 4 about here]
Table 4: Protestantism And The Happiness Effect Of Income And Unemployment.
Model Model Model (8) (9) (10)
Unemployed -.1101***
.0074 -.1095***
.0074 -.0614***
.0078
Protestant denomination .0337***
.0064 .0592***
.0153 .0570***
.0158 Interaction term
Protestant & unemployed -.0899***
.0177 -.0957***
.0178 -.0766***
.0183
9 Clark et al. (2005) similarly report substantial heterogeneity in the way in which individuals
transform income into satisfaction with their financial situation.
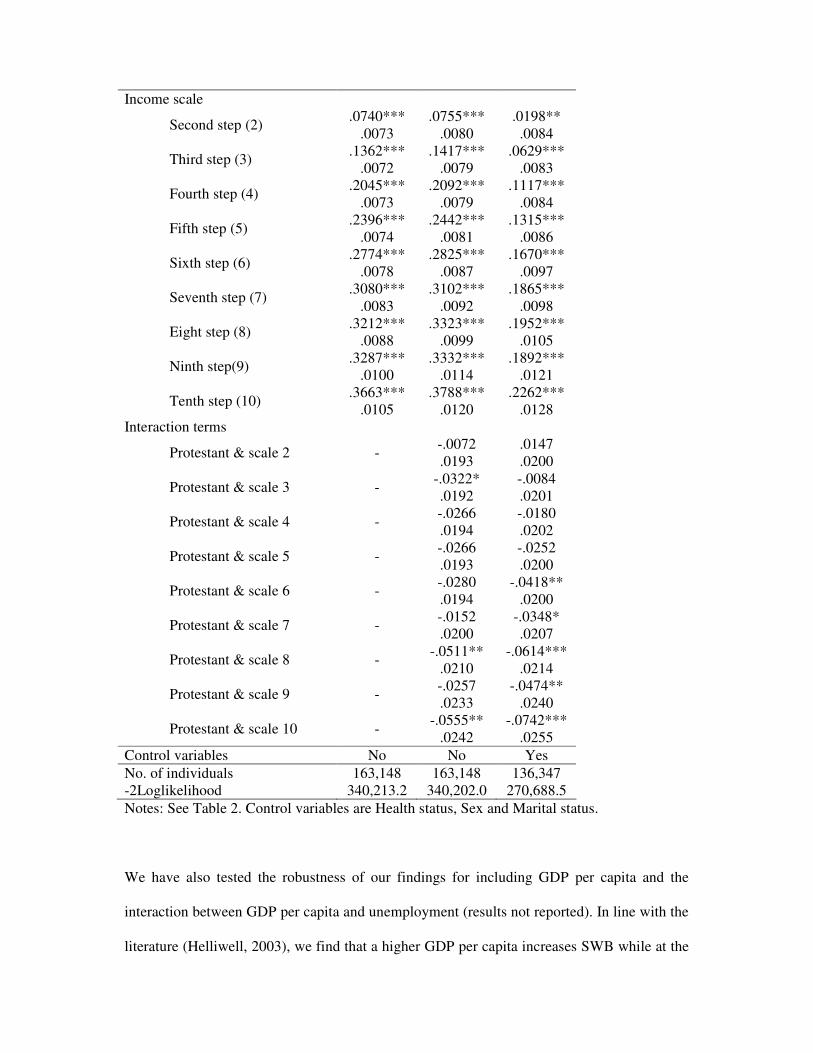
Income scale
Second step (2) .0740***
.0073 .0755***
.0080 .0198**
.0084
Third step (3) .1362***
.0072 .1417***
.0079 .0629***
.0083
Fourth step (4) .2045***
.0073 .2092***
.0079 .1117***
.0084
Fifth step (5) .2396***
.0074 .2442***
.0081 .1315***
.0086
Sixth step (6) .2774***
.0078 .2825***
.0087 .1670***
.0097
Seventh step (7) .3080***
.0083 .3102***
.0092 .1865***
.0098
Eight step (8) .3212***
.0088 .3323***
.0099 .1952***
.0105
Ninth step(9) .3287***
.0100 .3332***
.0114 .1892***
.0121
Tenth step (10) .3663***
.0105 .3788***
.0120 .2262***
.0128 Interaction terms
Protestant & scale 2 - -.0072 .0193
.0147
.0200
Protestant & scale 3 - -.0322* .0192
-.0084 .0201
Protestant & scale 4 - -.0266 .0194
-.0180 .0202
Protestant & scale 5 - -.0266 .0193
-.0252 .0200
Protestant & scale 6 - -.0280 .0194
-.0418** .0200
Protestant & scale 7 - -.0152 .0200
-.0348* .0207
Protestant & scale 8 - -.0511**
.0210 -.0614***
.0214
Protestant & scale 9 - -.0257 .0233
-.0474** .0240
Protestant & scale 10 - -.0555**
.0242 -.0742***
.0255
Control variables No No Yes
No. of individuals 163,148 163,148 136,347 -2Loglikelihood 340,213.2 340,202.0 270,688.5
Notes: See Table 2. Control variables are Health status, Sex and Marital status.
We have also tested the robustness of our findings for including GDP per capita and the
interaction between GDP per capita and unemployment (results not reported). In line with the
literature (Helliwell, 2003), we find that a higher GDP per capita increases SWB while at the
same time increasing the negative effect of unemployment on SWB. In addition, we have run
tests limiting the sample to individuals of working age (15-64 and 18-64). None of this has
been found to affect our results.
A final consideration in interpreting our results is about the direction of causality.
Unemployment lowers happiness (cf. Clark et al., 2008) but it may also be that individuals
with low self-reported happiness are more at risk of being unemployed. Moreover, people
who are hurt relatively little by unemployment are likely to become unemployed more often
than people for whom the negative happiness effect of unemployment is relatively high.
Although such endogeneities may affect the relation between employment and SWB, it
should be noted that it biases our main results only when, for some reason, these effects were
to be different for Protestants and for people coming from other religions. We know of no
theoretical rationale for such a difference, and conclude that endogeneity causes no major
biases in our findings.
4.2 Happiness, Unemployment and Protestantism at the societal level
As noted, the original thesis of Weber refers to a capitalist spirit that has its roots in a
Protestant ethic, but has grown into an independent, even secular worldview over time. On
basis of Weber’s work we would therefore not so much expect a link between one’s work
ethic and being a Protestant now, as a link between one’s work ethic and whether one lives in
a society historically dominated by the Protestant ethic. Hypothesis 2, stating that there
should be a relation between the effect size of unemployment on SWB and living in a society
in which Protestantism is the dominant religion, is therefore a more appropriate test of the
original Weber thesis.
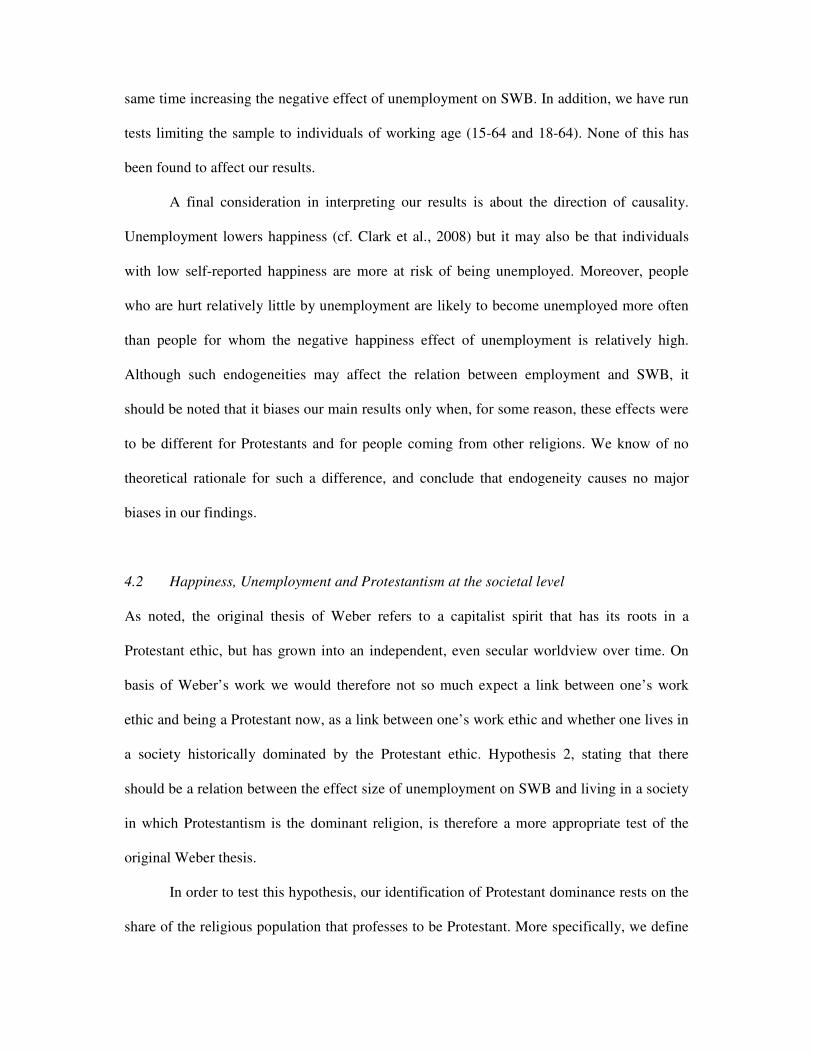
In order to test this hypothesis, our identification of Protestant dominance rests on the
share of the religious population that professes to be Protestant. More specifically, we define
as dominantly Protestant those societies where more than half (50%) of all religious people is
Protestant (0-1 dummy). The countries/regions thus classified as Protestant, are: Australia,
Denmark, Finland, Germany (and West Germany), Iceland, New Zealand, Norway, South
Africa, Sweden and Great Britain (see Table A.1 in the appendix).
Using this criterion, we find that living in a Protestant dominated society tends to
negatively affect one’s well-being considerably. At the same time, our earlier finding that
being a Protestant oneself has a positive effect on subjective well-being remains. Being
unemployed has the expected negative effect, but this effect is not the same for all people. As
Model (15) shows, being unemployed hurts people from Protestant dominated societies
significantly more than others. Moreover, when this cross-level interaction term is included,
we find that individual Protestantism has no significant effect on the psychic costs of
unemployment anymore (Model 16). Apparently, the relation is stronger on the societal than
on the individual level. We have also rerun these regression where the Protestant society
dummy is defined on the basis of the countries covered most extensively in Weber’s original
thesis, namely Denmark, Finland, Germany (and West Germany), Netherlands, Norway,
Sweden, Switzerland, Great Britain and the United States (cf. Inglehart, 1990). Our results
are not sensitive to this specification of (originally) Protestant societies (not reported).
[Insert Table 5 about here]
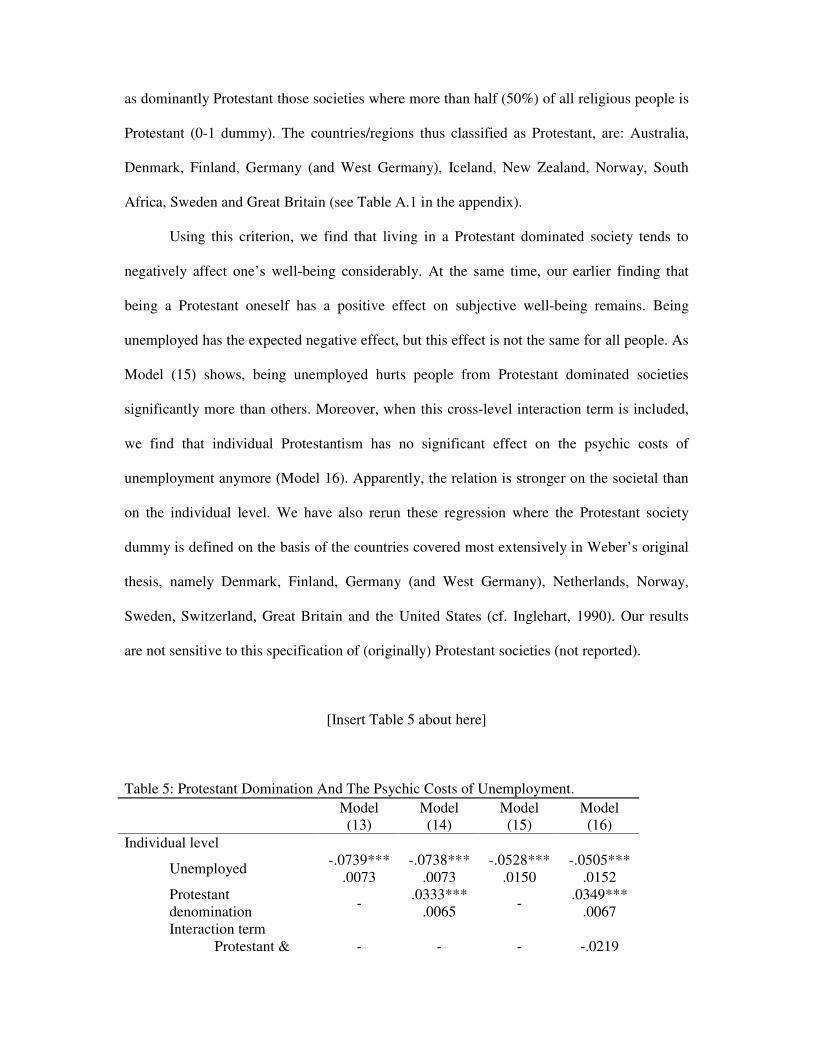
Table 5: Protestant Domination And The Psychic Costs of Unemployment.
Model Model Model Model (13) (14) (15) (16)
Individual level
Unemployed -.0739***
.0073 -.0738***
.0073 -.0528***
.0150 -.0505***
.0152 Protestant denomination
- .0333***
.0065 -
.0349*** .0067
Interaction term Protestant & - - - -.0219
unemployed .0237
Country level
Protestant dominance -.0548***
.0106 -.0654***
.0108 -.0510***
.0110 -.0624***
.0112
Cross-level interaction Unemployed * Protestant dominance
- - -.0892***
.0265 -.0796***
.0283
-2Loglikelihood 270,718.7 270,692.3 270,548.9 270,521.9
Notes: See Table 2. All individual-level control variables are included. Data is on 136,347 individuals from 78 countries.
4.3. Some Further Robustness Checks
We have assessed the robustness of our findings on the effect of Protestantism on the hurt
caused by unemployment throughout. Some open issues are the extent to which , however.
One explanation for these findings might be that predominantly Protestant countries are
perhaps disproportionately Anglo-Saxon and thus characterised by less elaborate welfare
states. Since generous welfare states tend to mitigate the negative (income) effects of
unemployment, the above results may only reflect objectively higher costs of unemployment
in Protestant societies rather than any differences in work ethic. In order to test this
possibility, we add dummies for different types of welfare states to the analysis, following the
classification of Esping-Andersen (1990). In addition, we include interaction terms of types
of welfare states and unemployment in the regression in order to see whether the well-being
effect of unemployment differs between regimes and whether such an effect may be driving
our results (Model 17-19).
[Insert Table 6 about here]
Table 6: Happiness, Unemployment And Protestantism In The Welfare State.
Model Model Model (17) (18) (19)
Individual level
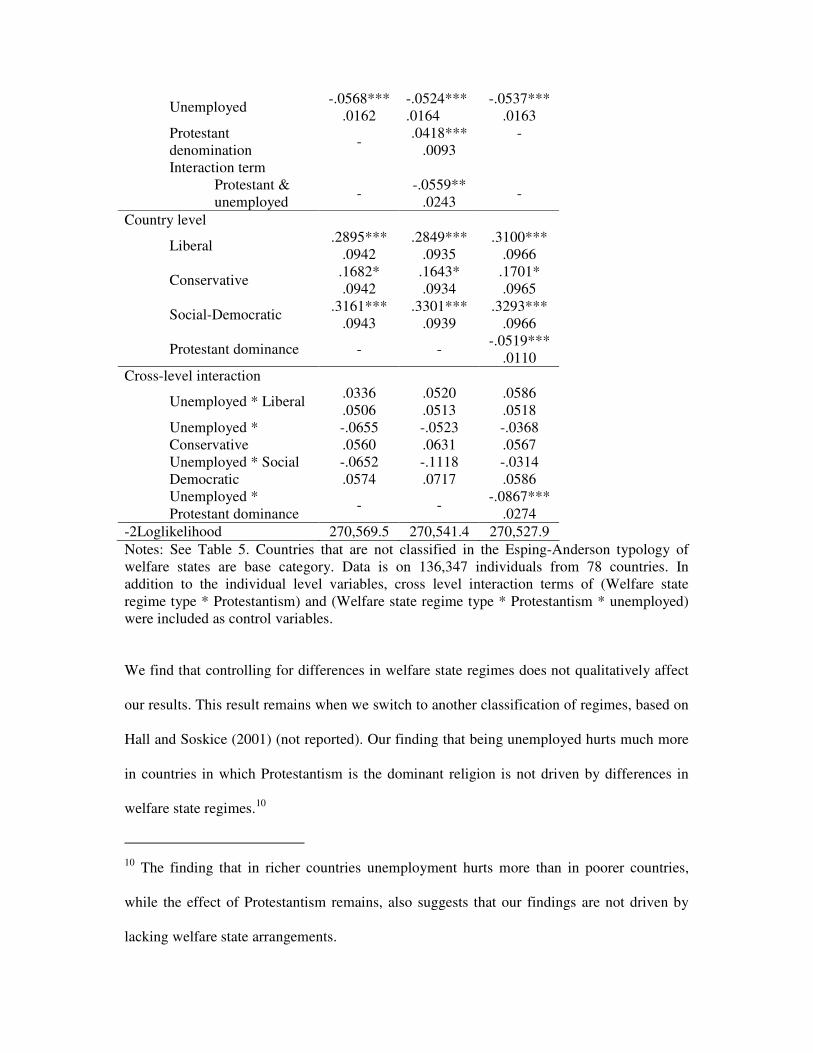
Unemployed -.0568***
.0162 -.0524*** .0164
-.0537*** .0163
Protestant denomination
- .0418***
.0093 -
Interaction term Protestant & unemployed
- -.0559**
.0243 -
Country level
Liberal .2895***
.0942 .2849***
.0935 .3100***
.0966
Conservative .1682* .0942
.1643* .0934
.1701* .0965
Social-Democratic .3161***
.0943 .3301***
.0939 .3293***
.0966
Protestant dominance - - -.0519***
.0110
Cross-level interaction
Unemployed * Liberal .0336 .0506
.0520
.0513 .0586 .0518
Unemployed * Conservative
-.0655 .0560
-.0523 .0631
-.0368 .0567
Unemployed * Social Democratic
-.0652 .0574
-.1118 .0717
-.0314 .0586
Unemployed * Protestant dominance
- - -.0867***
.0274
-2Loglikelihood 270,569.5 270,541.4 270,527.9
Notes: See Table 5. Countries that are not classified in the Esping-Anderson typology of welfare states are base category. Data is on 136,347 individuals from 78 countries. In addition to the individual level variables, cross level interaction terms of (Welfare state regime type * Protestantism) and (Welfare state regime type * Protestantism * unemployed) were included as control variables.
We find that controlling for differences in welfare state regimes does not qualitatively affect
our results. This result remains when we switch to another classification of regimes, based on
Hall and Soskice (2001) (not reported). Our finding that being unemployed hurts much more
in countries in which Protestantism is the dominant religion is not driven by differences in
welfare state regimes.10
10 The finding that in richer countries unemployment hurts more than in poorer countries,
while the effect of Protestantism remains, also suggests that our findings are not driven by
lacking welfare state arrangements.
5. CONCLUSION AND PERSPECTIVE
We have tested Weber’s hypothesis by examining how people experience losses in subjective
well-being due to unemployment. We argued that, if Weber is correct and Protestants / people
from Protestant societies indeed have a relatively stronger work ethic, unemployment should
hurt these groups more than others. The pain caused by unemployment is a measure of
people’s work ethic. When testing this proposition, we find that unemployment has a
negative effect on well being in general, but that this effect is (much) larger for Protestants
and people living in predominantly Protestant societies. We conclude that Weber’s thesis is
confirmed: even today, more than a century since Weber’s original work, there is indeed a
link between Protestantism and work ethic.
Our approach to measure preferences about work differs from the way economists are
used to look at preferences. Traditionally, economists have shunned survey instruments and
relied on observed choices to study preferences instead. The groundwork for this approach
has been laid by the seminal paper in which Samuelson (1948) described how revealed
preferences could be used to derive indifference curves. More recently, economists appear to
look more favourably upon survey data (Bertrand and Mullainathan, 2001) and have turned
towards stated preferences in order to measure people’s opinions on such topics as
redistribution (Luttmer, 2001), and the extent of the state’s responsibility for social security
(Alesina and Fuchs-Schündeln, 2007). Much of the research on values and/or attitudes
differences between societies and religions can also be shelved under this approach.
Both revealed and stated preferences methods place rather strong demands on
people’s cognitive abilities. The revealed preferences method rests on the assumption of
perfect rationality among actors. Only when individuals are making choices that are fully
consistent with their utility functions is it possible to derive preferences from behaviour
(Kőszegi and Rabin, 2007). This claim is widely being discarded even in economics
nowadays (Conlisk, 1996, p. 674; Camerer and Fehr, 2006, p. 47). A common objection to
the use of stated preferences similarly reads that one needs to assume that individuals have
developed clear opinions about the topic under scrutiny, are consciously aware of these
opinions and are able to articulate them. In practice, this often will not be the case. In addition
to these already demanding cognitive tasks, recent contributions have pointed out that
respondents’ present context plays a confusing role in their answers, challenging the validity
of the stated preferences method (Maseland and van Hoorn, 2008).
Our use of SWB data provides a third way for studying preferences that holds the
middle between the revealed and the stated preferences method (cf. Di Tella and
MacCulloch, 2008) and does not place such strong demands on individuals’ cognitive
abilities.11 Instead of asking people about their preferences or deriving them from people’s
actions—assuming they have a pretty clear idea about their preferences beforehand—the
importance attached to certain objectives is measured in our approach by looking at the effect
this objective turns out to have had on a person’s well-being. Analogous to the distinction
Kahneman and collaborators draw between decision utility and experienced utility (e.g.
Kahneman et al., 1997) our framework for the study of preferences could be dubbed
‘experienced preferences’. Decision utility, as Kahneman sees it, can be defined as the weight
an outcome has in a decision, and is fully compatible with the notion of revealed preferences.
Experienced utility, on the other hand, is viewed by Kahneman as the hedonic quality of an
11 We should also acknowledge the contingent valuation method (CVM) used to assess
willingness to pay for non-market goods. See the symposium in the autumn issue of the 1994
Journal of Economic Perspectives.
outcome. Though not without weaknesses, self-reported happiness subsequently can be seen
as a measure of experienced utility (Rabin, 1998; Di Tella and MacCulloch, 2008).
The results of this investigation show that the method of experienced preferences
indeed offers a fruitful third way to measure preferences. The experienced preference for
work turns out to behave in line with the theory; just as the Weber thesis predicts, work ethic
seems stronger among Protestants and people living in Protestant societies than among other
groups. Thus, in addition to being more conceptually sound than values surveys and more
realistic in its assumptions than revealed preferences, the approach also meets the more
pragmatic requirement of being able to deliver.
APPENDIX 1
[Insert Table A.1 here]
APPENDIX 2
[Insert Table A.2 here]
REFERENCES
Alatas, S. H. (1977). The Myth of the Lazy Native, London: Frank Cass.
Alesina, A. and Fuchs-Schündeln, N. (2007). ‘Good Bye Lenin (or Not?) — The Effect of
Communism on People’s Preferences.’ American Economic Review, vol. 97(4), pp.
1507-1528.
Barro, R. J. and McCleary, R. M. (2003). ‘Religion and Economic Growth Across Countries.’
American Sociological Review, vol. 68(5), pp. 760-781.
Becker, S. O. and Wößmann, L. (2007). Was Weber Wrong? A Human Capital Theory of
Protestant Economic History. IZA Discussion Paper No. 2886.
Bertrand, M. and Mullainathan, S. (2001). ‘Do People Mean What They Say? Implications
for Subjective Survey Data.’ American Economic Review, Papers and Proceedings,
vol. 91(2), pp. 67-72.
Camerer, C. and Fehr, E. (2006). ‘When does “economic man” dominate social behaviour?’,
Science, vol. 311(5757), pp. 47-52.
Chang, H.-J. (2007). Bad Samaritans – Rich Nations, Poor Policies, and the Threat to the
Developing World, London: Random House.
Clark, A. E. and Oswald, A. J. (1994). ‘Unhappiness and Unemployment’, Economic
Journal, vol. 104(424), pp. 648-659.
Clark, A.E. (2003). ‘Unemployment as a social norm: Psychological evidence from panel
data’, Journal of Labor Economics, vol. 21(2), pp. 323-351.
Clark, A.E., Diener, E., Georgellis, Y. and Lucas, R. E. (2008). ‘Lags and Leads in Life
Satisfaction: A Test of the Baseline Hypothesis’, Economic Journal, vol. 118(529),
pp. F222-F243.
Clark, A.E., Etilé, F., Postel-Vinay, F., Senik, C. and Van der Straeten, K. (2005).
‘Heterogeneity in Reported Well-Being: Evidence from Twelve European Countries’,
Economic Journal, 115 (March), pp. C118-C132.
Clark, A.E. and Lelkes, O. (2005). Deliver Us From Evil: Religion as Insurance.
Unpublished manuscript, Paris School of Economics.
Clarke, H. D., Kornberg, A., McIntyre, C., Bauer-Kaase, P. and Kaase, M. (1999). ‘The
Effect of Economic Priorities on the Measurement of Value Change’, American
Political Science Review, vol. 93 (September), pp. 637-647.
Conlisk, J. (1996). ‘Why Bounded Rationality?’, Journal of Economic Literature, vol. 34(2),
pp. 669-700.
Darity, W. and Goldsmith, A. H. (1996), ‘Social Psychology, Unemployment and
Macroeconomics’, Journal of Economic Perspectives, vol. 10(1), pp. 121-140.
Davis, D. W., Dowley, K. M. and Silver, B. D. (1999). ‘Postmaterialism in World Societies:
Is It Really a Value Dimension?’, American Journal of Political Science, vol. 43(3),
pp. 935-962.
Delacroix, J. and Nielsen, F. (2001). ‘The Beloved Myth: Protestantism and the Rise of
Industrial Capitalism in Nineteenth-Century Europe’, Social Forces, vol. 80(2), pp.
509-553.
Diener, E. and Suh, E. M., eds. (2000). Culture and Subjective Well-Being, Cambridge, MA /
London: The MIT Press.
Diener, E., Suh, E. M., Lucas, R.E. and Smith, H. L. (1999). ‘Subjective Well-Being: Three
Decades of Progress’, Psychological Bulletin, vol. 125(2), pp. 276-302.
Di Tella, R., and MacCulloch, R. (2008). ‘Gross National Happiness as an Answer to the
Easterlin Paradox’, Journal of Development Economics, vol. 86(1), pp. 22-42.
Duch, R. M. and Taylor, M. A. (1993). ‘Postmaterialism and the Economic Condition’,
American Journal of Political Science, vol. 37(3), pp. 747-779.
Esping-Andersen, G. (1990). The Three Worlds of Welfare Capitalism, Princeton, NJ:
Princeton University Press.
European Values Study Group and World Values Survey Association (2006). European and
World Values Surveys four-wave integrated data file, 1981-2004. Available
electronically from http://www.jdsurvey.net.
Ferrer-i-Carbonell, A. and Frijters, P. (2004). ‘How important is methodology for the
estimates of the determinants of happiness?’, Economic Journal, vol. 114(497), pp.
641-659.
Frey, B. S. and Stutzer, A. (2002). ‘What Can Economists Learn from Happiness Research?’,
Journal of Economic Literature, vol. 40(2), pp. 402-435.
Gelman, A. and Hill, J. (2007). Data Analysis Using Regression and Multilevel/Hierarchical
Models, Cambridge: Cambridge University Press.
Granato, J., Inglehart, R. and LeBlang, D. (1996). ‘The Effect of Cultural Values on
Economic Development: Theory, Hypotheses, and Some Empirical Tests’, American
Journal of Political Science, vol. 40(3), pp. 607-31.
Guiso, L., Sapienza, P. and Zingales, L. (2006). ‘Does Culture Affect Economic Outcomes?’,
Journal of Economic Perspectives, 20(1), pp. 23-48.
Hall, P. A. and Soskice, D. W. (2001). Varieties of Capitalism: The Institutional Foundations
of Comparative Advantage, Oxford University Press.
Harrison, L. E. (1992). Who Prospers? How cultural values shape economic and political
success, New York: Basic Books.
Harrison, L. E. and Huntington, S., eds. (2000). Culture Matters: How values shape human
progress, New York: Basic Books.

Hayes, J. and Nutman, P. (1981). Understanding the unemployed: The psychological effects
of unemployment, London: Tavistock Publications.
Helliwell, J. F. (2003). ‘How’s Life? Combining Individual and National Variables to
Explain Subjective Well-Being’, Economic Modelling, vol. 20(2), pp. 331-360.
Hofstede, G. (1980). Culture’s Consequences: International Differences in Work-Related
Values, Beverly Hills, CA: Sage Publications.
Hofstede, G. (2001). Culture’s Consequences, Second edition, Thousand Oaks, CA: Sage
Publications.
House, R. J., Hanges, P. J., Javidan, M., Dorfman, P. W. and Gupta, V. (2004). Culture,
Leadership and Organizations: The Globe Study of 62 Societies, Thousand Oaks CA:
Sage Publications.
Huisman, J. and Smits, J. (2008). ‘Effects of household and district-level factors on primary
school enrollment in 30 developing countries’, World Development,
doi:10.1016/j.worlddev.2008.01.007.
Iannoccone, L. R. (1998). ‘Introduction to the Economics of Religion’, Journal of Economic
Literature, vol. 36(3), pp. 1465-1496.
Inglehart, R. (1990). Cultural Shift in Advanced Industrial Society, Princeton, NJ: Princeton
University Press.
Javidan, M., House, R. J., Dorfman, P. W., Hanges, P. J. and Sully de Luque, M. (2006).
‘Conceptualizing and Measuring Cultures and their Consequences: A Comparative
Review of GLOBE’s and Hofstede’s Approaches’, Journal of International Business
Studies, vol. 37(6), pp. 897-914.
Kahn, H. (1979). World economic development: 1979 and beyond, London: Croom Helm.
Kahneman, D., Wakker, P. P. and Sarin, R. (1997). ‘Back to Bentham? Explorations of
experienced utility’, Quarterly Journal of Economics, vol. 112(2), pp. 375-405.
Kőszegi, B. and Rabin, M. (2007). ‘Mistakes in Choice-Based Welfare Analysis’, American
Economic Review, Papers and Proceedings, vol. 97(2), pp. 477-481
Landes, D. (1998). The Wealth and Poverty of Nations, New York: Norton.
Lehmann, H. and Roth, G., eds. (1993). Weber’s Protestant Ethic. Origins, evidence,
contexts, German Historical Institute, Washington, DC: Cambridge University Press.
Lelkes, O. (2006). ‘Tasting freedom: Happiness, religion and economic transition’, Journal of
Economic Behavior & Organization, vol. 59(2), pp. 173-194.
Luttmer, E. (2001). ‘Group loyalty and the taste for redistribution’, Journal of Political
Economy, vol. 109(3), pp. 500-529.
Maseland, R. and van Hoorn, A. (2008). ‘Explaining the Negative Correlation Between
Values and Practices: A Note on the Hofstede-GLOBE Debate’, Journal of
International Business Studies, doi:10.1057/jibs.2008.68.
Moulton, B. R. (1990). ‘An illustration of a pitfall in estimating the effects of aggregate
variables on Micro Units’, Review of Economics and Statistics, vol. 72(2), pp. 334-
338.
Norris, P. and Inglehart, R. (2004). Sacred and secular: religion and politics worldwide,
Cambridge: Cambridge University Press.
Said, E. (1978). Orientalism, New York: Random House.
Samuelson, P. (1948). ‘Consumption Theory in Terms of Revealed Preference’,
Econometrica, vol. 15(60), pp. 243-253.
Schyns, P. (2002). ‘Wealth Of Nations, Individual Income and Life Satisfaction in 42
Countries: A Multilevel Approach’, Social Indicators Research, vol. 60(1-3), pp. 5-
40.
Tawney, R. H. (1926). Religion and the Rise of Capitalism, New York: Harper and Row.
The Conference Board and Groningen Growth and Development Centre (2008). Total
Economy Database, January 2008.
Weber, M. (1930) [1904/5]. The Protestant Ethic and the Spirit of Capitalism, Translated by
Talcott Parsons, with and introduction by Anthony Giddens, 1992, London and New
York: Routledge.
Weil, D. N. (2008). Economic Growth, Second edition, Boston: Pearson Addison Wesley.
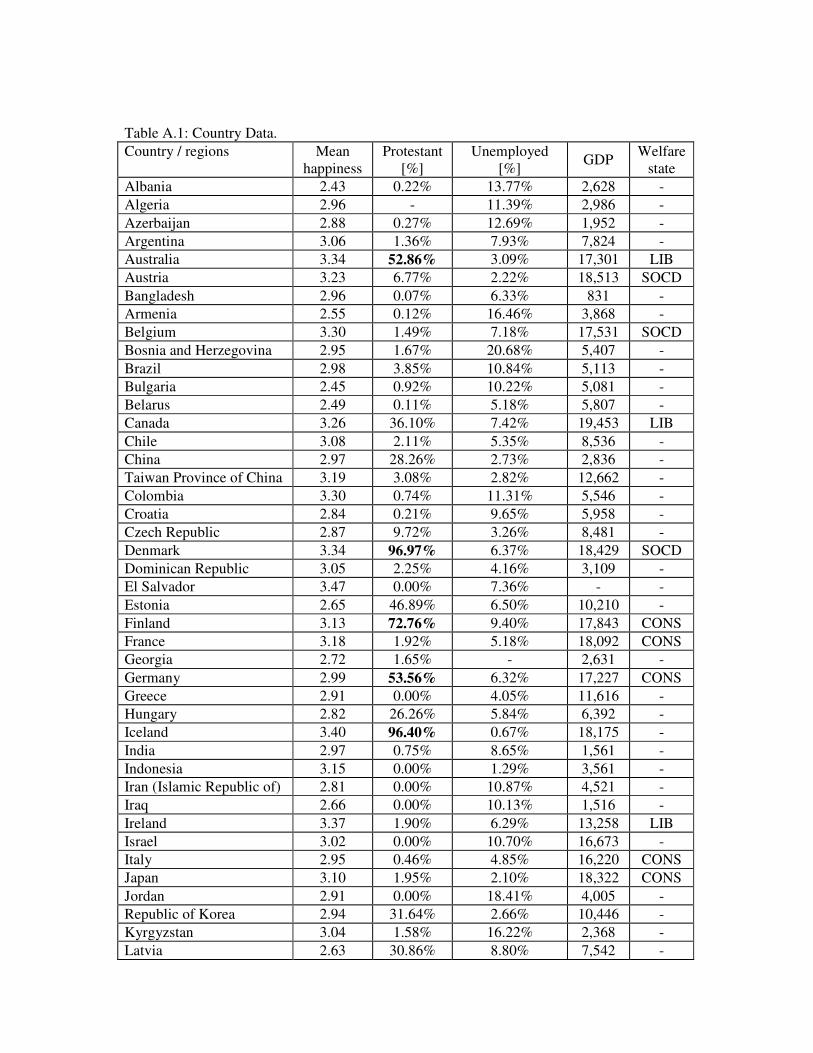
Table A.1: Country Data.
Country / regions Mean happiness
Protestant [%]
Unemployed [%]
GDP Welfare
state
Albania 2.43 0.22% 13.77% 2,628 -
Algeria 2.96 - 11.39% 2,986 -
Azerbaijan 2.88 0.27% 12.69% 1,952 -
Argentina 3.06 1.36% 7.93% 7,824 -
Australia 3.34 52.86% 3.09% 17,301 LIB
Austria 3.23 6.77% 2.22% 18,513 SOCD
Bangladesh 2.96 0.07% 6.33% 831 -
Armenia 2.55 0.12% 16.46% 3,868 -
Belgium 3.30 1.49% 7.18% 17,531 SOCD
Bosnia and Herzegovina 2.95 1.67% 20.68% 5,407 -
Brazil 2.98 3.85% 10.84% 5,113 -
Bulgaria 2.45 0.92% 10.22% 5,081 -
Belarus 2.49 0.11% 5.18% 5,807 -
Canada 3.26 36.10% 7.42% 19,453 LIB
Chile 3.08 2.11% 5.35% 8,536 -
China 2.97 28.26% 2.73% 2,836 -
Taiwan Province of China 3.19 3.08% 2.82% 12,662 -
Colombia 3.30 0.74% 11.31% 5,546 -
Croatia 2.84 0.21% 9.65% 5,958 -
Czech Republic 2.87 9.72% 3.26% 8,481 -
Denmark 3.34 96.97% 6.37% 18,429 SOCD
Dominican Republic 3.05 2.25% 4.16% 3,109 -
El Salvador 3.47 0.00% 7.36% - -
Estonia 2.65 46.89% 6.50% 10,210 -
Finland 3.13 72.76% 9.40% 17,843 CONS
France 3.18 1.92% 5.18% 18,092 CONS
Georgia 2.72 1.65% - 2,631 -
Germany 2.99 53.56% 6.32% 17,227 CONS
Greece 2.91 0.00% 4.05% 11,616 -
Hungary 2.82 26.26% 5.84% 6,392 -
Iceland 3.40 96.40% 0.67% 18,175 -
India 2.97 0.75% 8.65% 1,561 -
Indonesia 3.15 0.00% 1.29% 3,561 -
Iran (Islamic Republic of) 2.81 0.00% 10.87% 4,521 -
Iraq 2.66 0.00% 10.13% 1,516 -
Ireland 3.37 1.90% 6.29% 13,258 LIB
Israel 3.02 0.00% 10.70% 16,673 -
Italy 2.95 0.46% 4.85% 16,220 CONS
Japan 3.10 1.95% 2.10% 18,322 CONS
Jordan 2.91 0.00% 18.41% 4,005 -
Republic of Korea 2.94 31.64% 2.66% 10,446 -
Kyrgyzstan 3.04 1.58% 16.22% 2,368 -
Latvia 2.63 30.86% 8.80% 7,542 -
Lithuania 2.62 1.53% 9.71% 6,908 -
Luxembourg 3.28 0.24% 1.65% 30,731 -
Malta 3.12 0.49% 4.50% 9,844 -
Mexico 3.09 4.17% 5.82% 6,493 -
Republic of Moldova 2.46 0.80% 14.91% 2,372 -
Morocco 3.04 0.00% 9.69% 2,847 -
Netherlands 3.36 25.44% 2.44% 17,530 SOCD
New Zealand 3.28 76.95% 8.38% 15,427 LIB
Nigeria 3.34 39.32% 10.50% 1,134 -
Norway 3.22 94.14% 2.16% 18,796 SOCD
Pakistan 2.96 0.00% 3.11% 1,917 -
Peru 2.93 0.00% 9.26% 3,656 -
Philippines 3.29 1.99% 19.54% 2,355 -
Poland 2.88 0.68% 3.46% 6,092 -
Portugal 2.90 0.33% 4.07% 11,987 -
Puerto Rico 3.39 11.83% 5.43% 13,079 -
Romania 2.52 1.71% 6.75% 2,920 -
Russian Federation 2.48 0.30% 5.94% 5,691 -
Saudi Arabia 3.35 0.00% 5.06% 8,136 -
Singapore 3.30 8.66% 6.48% 21,759 -
Slovakia 2.68 12.27% 7.25% 7,667 -
Viet Nam 3.41 1.12% 5.01% 1,911 -
Slovenia 2.80 0.95% 7.65% 10,735 -
South Africa 3.12 57.77% 19.33% 3,915 -
Zimbabwe 2.67 31.29% 29.47% 1,196 -
Spain 3.04 0.52% 7.36% 12,216 -
Sweden 3.31 68.34% 5.43% 17,606 SOCD
Switzerland 3.32 42.69% 1.32% 20,801 CONS
Turkey 3.05 0.15% 8.03% 5,988 -
Uganda 3.01 43.54% 9.71% 807 -
Ukraine 2.44 1.45% 7.69% 2,610 -
Macedonia (Republic of) 2.82 0.31% 24.24% 3,141 -
Egypt 3.06 0.00% 9.40% 3,107 -
Great Britain 3.26 69.08% 5.79% 16,764 LIB
Tanzania (United Republic of)
3.50 19.18% 24.07% 581 -
United States 3.29 48.67% 6.15% 22,654 LIB
Uruguay 3.00 2.30% 6.00% 7,946 -
Venezuela 3.45 7.94% 16.42% 8,581 -
Serbia and Montenegro 2.80 0.51% 12.12% 2,375 -
Germany West 2.97 54.37% 2.45% - -
Northern Ireland 3.36 23.52% 9.61% - -
Notes: All variables are averaged over all sample years.
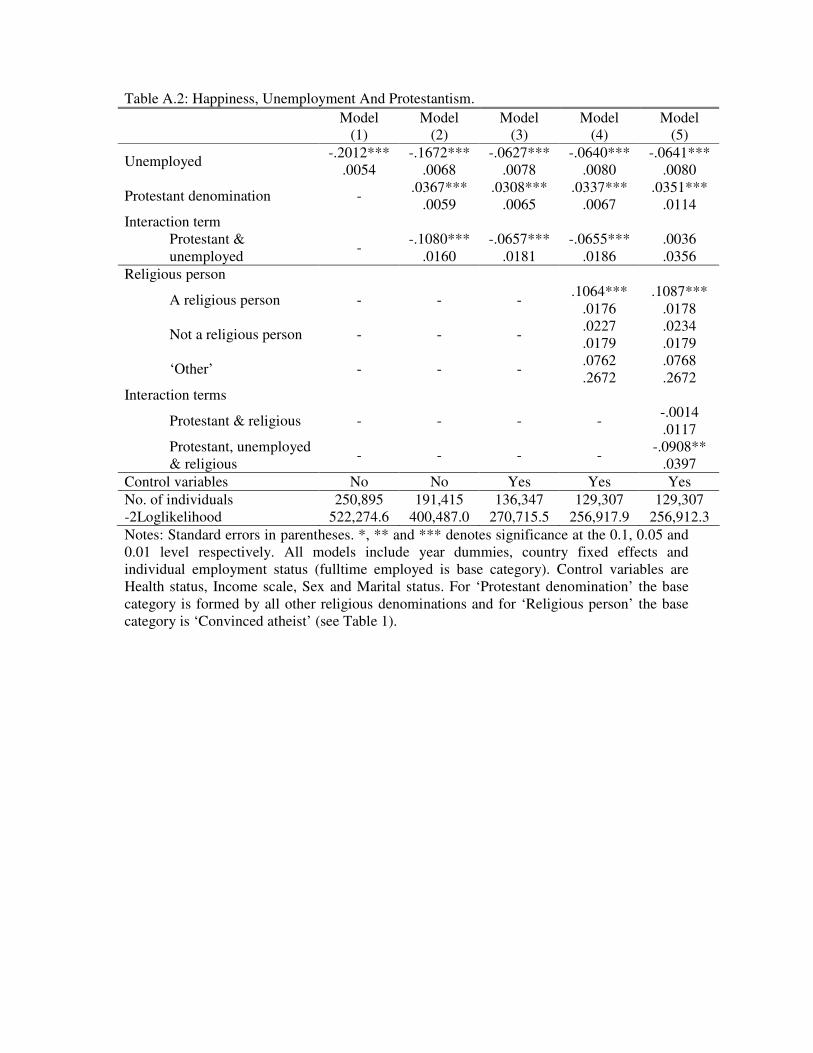
Table A.2: Happiness, Unemployment And Protestantism.
Model Model Model Model Model (1) (2) (3) (4) (5)
Unemployed -.2012***
.0054 -.1672***
.0068 -.0627***
.0078 -.0640***
.0080 -.0641***
.0080
Protestant denomination - .0367***
.0059 .0308***
.0065 .0337***
.0067 .0351***
.0114 Interaction term
Protestant & unemployed
- -.1080***
.0160 -.0657***
.0181 -.0655***
.0186 .0036 .0356
Religious person
A religious person - - - .1064***
.0176 .1087***
.0178
Not a religious person - - - .0227 .0179
.0234
.0179
‘Other’ - - - .0762 .2672
.0768
.2672 Interaction terms
Protestant & religious - - - - -.0014 .0117
Protestant, unemployed & religious
- - - - -.0908**
.0397
Control variables No No Yes Yes Yes
No. of individuals 250,895 191,415 136,347 129,307 129,307 -2Loglikelihood 522,274.6 400,487.0 270,715.5 256,917.9 256,912.3
Notes: Standard errors in parentheses. *, ** and *** denotes significance at the 0.1, 0.05 and 0.01 level respectively. All models include year dummies, country fixed effects and individual employment status (fulltime employed is base category). Control variables are Health status, Income scale, Sex and Marital status. For ‘Protestant denomination’ the base category is formed by all other religious denominations and for ‘Religious person’ the base category is ‘Convinced atheist’ (see Table 1).


![Scholars - McGill University · Wittich (Berkeley: University of California Press, 1978) vol 1 & 2 [Weber, Economy and Society]; Max Weber, The Protestant Ethic and the Spirit of](https://img.pdfslide.net/doc/110x75/5e4bd38eaef4567b01032d85/scholars-mcgill-university-wittich-berkeley-university-of-california-press.jpg)