Embed Size (px)
Citation preview
Water-Supply and Irrigation Paper No. 200 Series M, General Hydrographic Investigations, 24
DEPARTMENT OF THE INTERIOR
UNITED STATES GEOLOGICAL SURVEYCHARLES D. WALCOTT, DlRECTOE
WEIR EXPERIMENTS, COEFFICIENTS,
AND FORMULAS
(REVISION OF PAPER NO. ISO)
BY
ROBERT E. HOUTON
WASHINGTONGOVERNMENT PRINTING OFFICE
1907
Water-Supply and Irrigation Paper No. 200 Series M, General Hydrographic Investigations, 24
DEPARTMENT OF THE INTERIOR
UNITED STATES GEOLOGICAL SURVEYCHARLES D. WALCOTT, DIRECTOR
WEIR EXPERIMENTS, COEFFICIENTS,
AND FORMULAS
(REVISION OF PAPER NO. 15O)
BY
ROBERT E. HORTON
-WASHINGTONGOVERNMENT PRINTING OFFICE
1907
CONTENTS.
Page.Introduction............................................................. 7
Definitions of terms .................................................. 7Notation............................................................. 8Base formulas........................................................ 9Equivalent coefficients................................................. 9Approximate relative discharge over weirs............................. 9References. .......^.................................................. 10
Theory of weir measurements ............................................. 10Development of the weir ............................^................ 10Theorem of TorricellL................................................ 10Elementary deduction of the weir formula .......... .................. 11
Application of the parabolic law of velocity to weirs ................ 12General formula for weirs and orifices ................................. 12Vertical contraction .................................................. 13
Velocity of approach ..................................................... 14Theoretical formulas.................................................. 14Distribution of velocity in channel of approach......................... 16Distribution of energy in channel of approach.......................... 17
The thin-edged weir...................................................... 20Earlier experiments and formulas ..................................... 20
Castel...........................-..-...----........-...........- 20Poncelet and Lesbros............................................. 21Boileau............... ........................................... 21East Indian engineers' formula.................................... 22
Experiments and formula of James B. Francis ................... ..... 23Experiments and formula of Fteley and Stearns........................ 26Bazin's experiments.................................................. 29Bazin's formulas for thin-edged weirs.................................. 31Derived formulas for thin-edged rectangular weirs...................... 34
Fteley and Steams-Francis formula................................ 34Hamilton Smith's formula ........................................ 34Smith-Francis formula............................................ 37Parmley's formula ............................................... 37
Extension of the weir formulas to higher heads ........................ 39Comparison of weir formulas.......................................... 40
Comparison of various velocity of approach corrections............. 40End contractions incomplete contraction ............................. 44Compound weir..................... ................................ 46Triangular weir...................................................... 46
General formula ................................................. 46Thomson's experiments .......................................... 46
3
4 CONTENTS.
The thin-edged weir Continued. Page.Trapezoidal weir ...... ............................................... 47
The Cippoletti trapezoidal weir ................................... 47Cippoletti's formula.............................................. 48
Requirements and accuracy of weir gagings ................................ 49Precautions for standard weir gaging................................... 49Plank and beam weirs of sensible crest width .......................... 52Reduction of the mean of several observations of head.................. 52Effect of error in determining the head on weirs........................ 53Error of the mean where the head varies .............................. 54Weir not level ........................................................ 57Convexity of water surface in leading channel.......................... .58
Results of experiments on various forms of weir cross sections............... 59The use of weirs of irregular section ................................... 59Modifications of the nappe form ....................................... 60Experimental data for weirs of irregular cross section ................... 61
Base formula for discharge over weirs of irregular cross section ...... 62Bazin's experiments on weirs of irregular cross section.............. 63
Bazin's correction for velocity of approach ..................... 63Recomputation of coefficients in Bazin's experiments........... 66
Cornell University hydraulic laboratory ........................... 85Experiments of United States Board of Engineers on Deep Waterways. 86 Experiments at Cornell University hydraulic laboratory on models of
old Croton dam ................................................ 90Experiments of United States Geological Survey at Cornell University
hydraulic laboratory............................................ 95Experiments on model of Merrimac River dam at Lawrence, Mass... 107
Flow over weirs with broad crests ..................................... 110Theoretical formula of Unwin and Frizell.......................... 110Blackwell's experiments on discharge over broad-crested weirs...... 112East Indian engineers' formula for broad-crested weirs.............. 114Fteley and Stearns experiments on broad- crested weirs.............. 116Bazin's formula and experiments on broad-crested weirs............ 117Experiments of the United States Geological Survey on broad-crested
weirs.......................................................... 119Table of discharge over broad-crested weirs with stable nappe....... 121
Effect of rounding upstream crest edge................................. 122Experiments on weirs with downstream slope or apron of varying inclina
tion ............................................................... 124Triangular weirs with vertical upstream face and sloping aprons..... 124Triangular weirs with upstream batter 1:1 and varying slope of apron. 126 Experiments on weirs of trapezoidal section with upstream slope of
J:l, horizontal crest, and varying downstream slopes.............. 127Combination of coefficients for weirs with compound slopes ............. 127Weirs with varying slope of upstream face ............................. 128Dams of ogee cross section, Plattsburg-Chambly type ................... 130Experiments on discharge over actual dams............................ 131
Blackstone River at Albion, Mass ................................. 132Muskingum River, Ohio.......................................... 132Ottawa River dam, Canada........................................ 132Austin, Tex., dam................................................ 133
Roughness of crest............. ...................................... 133Falls ................................................................ 135Weir curved in plan.................................................. 136
CONTENTS. 5
Page.Submerged weirs......................................................... 137
Theoretical formula .................................................. 137Fteley and Stearns submerged-weir formula............................ 138Clemens Herschel's formula .......................................... 139The Chanoine and Mary formula...................................... 140R. H. Rhind's formula............................................... 141Bazin's formulas ..................................................... 141Increase of head by submerged weirs.................................. 142
Rankine's formulas............................................... 142Colonel Dyas's formula ........................................... 143
Submerged weirs of irregular section................................... 143Bazin's experiments.............................................. 143Data concerning East Indian weirs ................................ 144United States Deep Waterways experiments........................ 146
Weir discharge under varying head........................................ 146Prismatic reservoir, no inflow ......................................... 147Approximate time of lowering prismatic or nonprismatic reservoir....... 147Reservoir prismatic, with uniform inflow............................... 148
General formulas................................................. 148Formulas for time of rise to any head H, prismatic reservoir with uni
form inflow .................................................... 149Nonprismatic reservoir, uniform inflow ................................ 153Variable inflow, nonprismatic reservoir................................ 154
Tables for calculations of weir discharge ................................... 156Table 1. Head due to various velocities................................ 157Table 2. Percentage increase in discharge by various rates of velocity of
approach .......................................................... 159Tables 3, 4. Discharge over a thin-edged weir by the Francis formula.... 162Tables 5, 6. Three-halves powers...................................... 171Table 7. Flow over broad-crest weirs with stable nappe................. 177Table 8. Backwater caused by a dam or weir........................... 180Table 9. Discharge over a thin-edged weir by Bazin's formula, by E. C.
Murphy........................................................... 187Tables 10-12. Multipliers for determination of discharge over broad-crested
weirs, by E. C. Murphy............................................. 190Index ...................................................._............ 193
ILLUSTRATIONS.
Pape.PLATE I. Bazin's coefficients ..................................... 32
II. Effect of errors in weir experiments ..................... 54III. Modifications of nappe form............................. 60
IV-XII. Bazin's experiments.................................... 66XIII, XIV. Cornell hydraulic laboratory experiments................ 86XV-XVIII. United States Deep Waterways experiments.............. 90XIX-XXII. Croton dam experiments................................ 94
XXIII-XXXII. United States Geological Survey experiments............. 106XXXIII. Merrimac River dam experiments ....................... 108
XXXIV-XXXV. Cross sections of ogee dams ............................. 130XXXVI. Coefficient diagram for ogee dams ....................... 130
XXXVII. Experiments on actual dams ............................ 132XXXVIII. Diagram of variable discharge........................... 150
FIG. 1. Torricellian theorem applied to a weir............................. 112. Rectangular orifice............................................... 123. Distribution of velocities ......................................... 164. Triangular weir.................................................. 465. Trapezoidal weir................................................. 476. Sections of the Francis weir ...................................... 517. Inclined weir.................................................... 578. Broad-crested weir............................................... 1109. Coefficient curve for triangular weirs ................................ 125
10. Fall............................................................. 13511. Weir curved or angular in plan................................... 13612. Submerged weir .............................----.---.-.....--.-- 13713. East Indian weir section...........................-.-.---------.. 14514. East Indian weir section..............-...--....--.-..----.------. 14515. Concave backwater surface ..-.-...............-...----..-.--..... 18016. Convex backwater surface........................................ 18117. Types of weirs referred to in tables 10, 11, and 12 .................. 191
6
WEIR EXPERIMENTS, COEFFICIENTS, AND FORMULAS.
By ROBERT E. HOKTON.
INTRODUCTION.
DEFINITIONS OF TERMS.
The word "weir" will be used to describe any structure used to determine the volume of flow of water from measurements of its depth on a crest or sill of known length and form. In this general sense timber and masonry dams having various shapes of section, reservoir overflows, and the like may be weirs. Terms, more or less synonymous, used to describe such weirs are "comb," "wasteway," "spillway," "overwash," "rollway," and "overfall."
The French term "nappe," suggesting the curved surface of a cloth hanging over the edge of a table, has been fittingly used to designate the overfalling sheet of water.
The expression "wetted underneath" has been used to describe the condition of the nappe designated by Bazin as "noyees en dessous," signifying that the water level between the nappe and the toe of the weir is raised by vacuum above the general water level below the weir.
"Thin-edged weir" and "sharp-crested^ weir" are used to designate a weir in which the nappe, or overfalling sheet, touches only the smooth, sharp upstream corner or edge of the crest, the thickness of which is probably immaterial so long as this condition is fulfilled.
A "suppressed weir" has a channel of approach whose width is the length of the weir crest.
A "contracted weir" has a crest length that is less than the width of the channel of approach.
The term "channel of approach," or "leading channel," defines the body of water immediately upstream from the weir, in which is located the gage by which the depth of overflow is measured.
"Section of approach" may refer to the cross section of the leading channel, if the depth and width of the leading channel are uniform; otherwise it will, in general, apply to the cross section of the channel of approach in which the gage is located.
8 WEIR EXPERIMENTS, COEFFICIENTS, AND FORMULAS.
" Weir section" refers to the cross section of the overflowing stream in the plane of the weir crest.
"Crest contraction" refers to the diminished cross section of the overflowing stream resulting from the upward curvature of the lower water filaments in passing the crest edge. It does not include the downward curvature of the water surface near the weir crest.
The "vertical contraction of the nappe" includes both the crest contraction and the surface contraction.
"Incomplete contraction" may take place either at the crest or at the ends of a weir, and will occur when the bottom or side walls of the channel of approach are so near the weir as to prevent the com plete curvature of the water filaments as they pass the contracting edge.
Dimensions are uniformly expressed in feet and decimals, velocities in feet per second, and quantities of flow in cubic feet per second, unless otherwise stated in the text.
In the preparation of this paper much computation has been involved and it is expected that errors will appear, which, if attention is called to them, may be corrected in the future. Information concerning such errors will be gratefully received.
NOTATION.
The symbols given below are used in the values indicated. The meaning of additional symbols as used and special uses of those that follow are given in the text:Z>=Measured or actual depth on the crest of weir, usually determined as the differ
ence of elevation of the weir crest and the water level, taken at a point sufficiently far upstream from the weir to avoid the surface curve.
.H"=The head corrected for the effect of velocity of approach, or the observed head where there is no velocity of approach. As will be explained, D is applied in formulas like Bazin's, in which the correction for velocity of approach is included in the coefficient, .ffis applied in formulas where it is eliminated.
w=Mean velocity of approach in the leading channel, usually taken in a cross sec tion opposite which D is determined.
/i=Veloeity
g= Acceleration by gravity. Value here used 32.16.P=Height of weir crest above bottom of channel of approach, where channel is
rectangular.W= Width of channel of approach where D is measured. A= Area of cross section of channel of approach. (7= Area of channel se?tion where D is measured, per unit length of crest.a=Area of weir section of discharge =Di.i=Actual length of weir crest for a suppressed weir, or length corrected for end
contractions, if any.17= Actual length of crest of a weir with end contractions. N= Number of complete end contractions. _B=Breadth of crest of a broad-crested weir.S= Batter or slope of crest, feet horizontal to one vertical.
INTBODUCTION. 9
d=Depth of crest submergence in a drowned or submerged weir. Q=Volume of discharge per unit of time.
C, M, m, /i, a,f, etc., empirical coefficients.
BASE FORMULAS.
The following formulas have been adopted by the engineers named:o _____
Q MLH^ZgH. Hamilton Smith (theoretical).
Bazin, with no velocity of approach. Bazin, with velocity of approach.
= OLII S . Francis a (used here).
= CLH^+fL. Fteley arid Stearns.
EQUIVALENT COEFFICIENTS.
The relations between the several coefficients, so far as they can be given here, are as follows:
M is a direct measure of the relation of the actual to the theoret ical weir discharge.
8.02 /*=5.35 M.
APPROXIMATE RELATIVE DISCHARGE OVER WEIRS.
For a thin-edged weir, the coefficient C in the Francis formula is
3.33=-o-. Let C' be the coefficient for any other weir, and a? the
relative discharge as compared with the thin-edged weir, then
.......... (1)
or, as a percentage,«_=100 x=30 C'.
a The coefficient C of Francis includes all the constant or empirical factors appearing in the formula, which is thus thrown into the simplest form for computation.
10 WEIR EXPERIMENTS, COEFFICIENTS, AND FORMULAS.
This expression will be found convenient in comparing the effect Ou discharge of various modifications of the weir cross section. For a broad-crested weir with stable nappe, £/i=2.64, see p. 121. The dis charge over such a weir is thus seen to be 79.2 per cent of that for a thin-edged weir by the Francis f onnula.
REFERENCES.
The following authorities are referred to by page wherever cited in the text:BAZIN, H., Recent experiments on flow of water over weirs. Translated by Arthur
Marichal and J. C. Trautwine, jr. Proc. Engineers' Club Philadelphia, vol. 7, No. 5, January, 1890, pp. 259-310; vol. 9, No. 3, July, 1892, pp. 231-244; No. 4, October, 1892, pp. 287-319; vol. 10, No. 2, April, 1893, pp. 121-164.
BAZIN, H., Experiences nouvelles sur l'e"coulement en deVersoir, 6me art., Annales des Ponts et Chausse'es, Memoires et Documents, 1898, 2me trimestre, pp. 121-264. This paper gives the results of experiments on weirs of irregular section. Bazin's earlier papers, published in Annales des Ponts et Chausse'es, 1888, 1890, 1891, 1894, and 1896, giving results of experiments chiefly relating to thin-edged weirs and velocity of approach, have been translated by Marichal and Trautwine.
BELLASIS, E. S., Hydraulics.BOVEY, H. T., Hydraulics.FRANCIS, JAMES B., Lowell hydraulic experiments.FRIZELL, JAMES P., Water power.FTELEY, A., and STEARNS, F. P., Experiments on the flow of water, etc. Trans. Am.
Soc. Civil Engineers, January, February, March, 1883, vol. 12, pp. 1-118.MERRIMAN, MANSFIELD, Hydraulics.RAFTER, GEORGE W., On the flow of water over dams. Trans. Am. Soc. Civil Engi
neers, vol. 44, pp. 220-398, including discussion.SMITH, HAMILTON, Hydraulics.
THEORY OF WEIR MEASUREMENTS.
DEVELOPMENT OF THE WEIR.
The weir as applied to stream gaging is a special adaptation of mill dam, to which the term weir, meaning a hindrance or obstruction, has been applied from early times. The knowledge of a definite relation between the length and depth of overflow and the quantity also proba bly antedates considerably the scientific determination of the relation between these elements.
In theory a weir or notch a is closely related to the orifice; in fact, an orifice becomes a notch when the water level falls below its upper boundary.
THEOREM OF TORRICELLI.
The theorem of Torricelli, enunciated in his De Motu Gravium Naturaliter Accelerate, 1643, states that the velocity of a fluid passing through an orifice in the side of a reservoir is the same as that which would be acquired by a heavy body falling freely through the vertical
a Commonly applied to a deep, narrow weir.
THEORY OF WEIR MEASUREMENTS. 11
height measured from the surface of the fluid in the reservoir to the, center of the orifice.
This theorem forms the basis of hydrokinetics and renders the weir and orifice applicable to stream measurement. The truth of this prop osition was confirmed by the experiments of Mariotte, published in 1685. It can also be demonstrated from the laws of dynamics and the principles of energy. 0
ELEMENTARY DEDUCTION OF THE WEIR FORMULA.
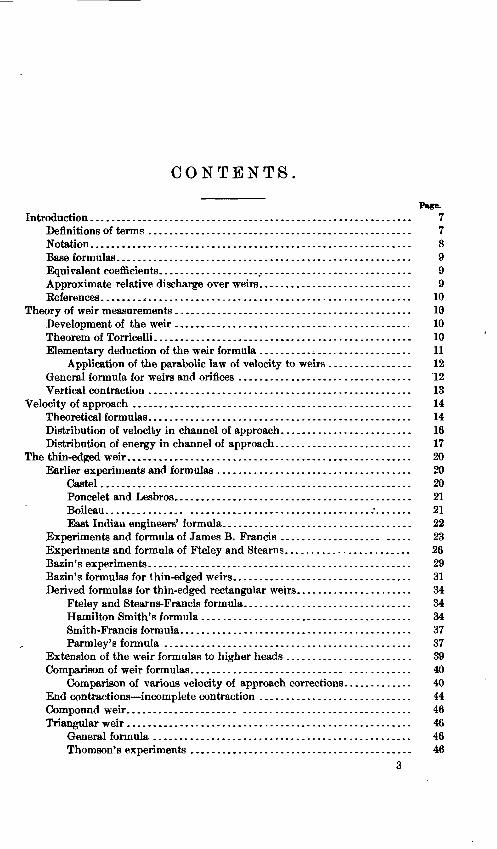
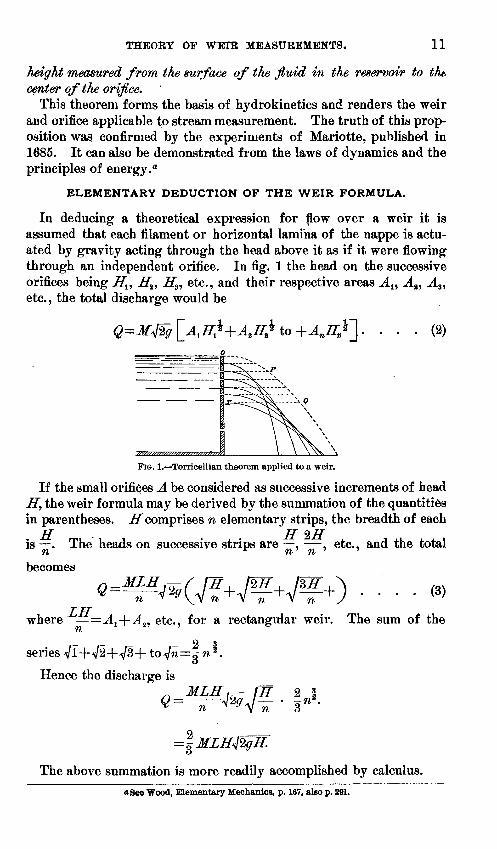
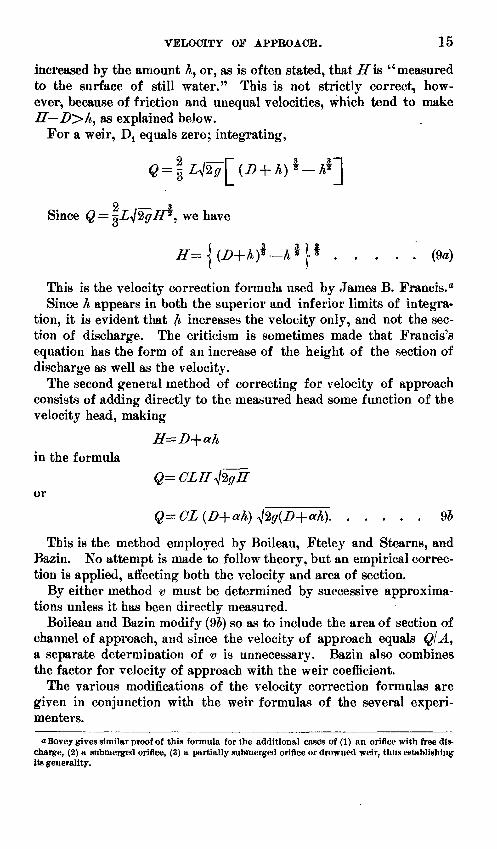
In deducing a theoretical expression for flow over a weir it is assumed that each filament or horizontal lamina of the nappe is actu ated by gravity acting through the head above it as if it were flowing through an independent orifice. In fig. 1 the head on the successive orifices being H^ H^ H^ etc., and their respective areas A^ A%, A3 , etc., the total discharge would be
FIG. 1. Torricellian theorem applied to a weir.
If the small orifices A be considered as successive increments of head If, the weir formula may be derived by the summation of the quantities in parentheses. H comprises n elementary strips, the breadth of each
is . The heads on successive strips are , , etc., and the total
becomes
T JT where = Al -}-A z, etc., for a rectangular weir. The sum of the
21
seres
Hence the discharge is
n * ^V n 3
=f
The above summation is more readily accomplished by calculus.a See Wood, Elementary Mechanics, p. 167, also p. 291.
12 WEIR EXPERIMENTS, COEFFICIENTS, AND FORMULAS.
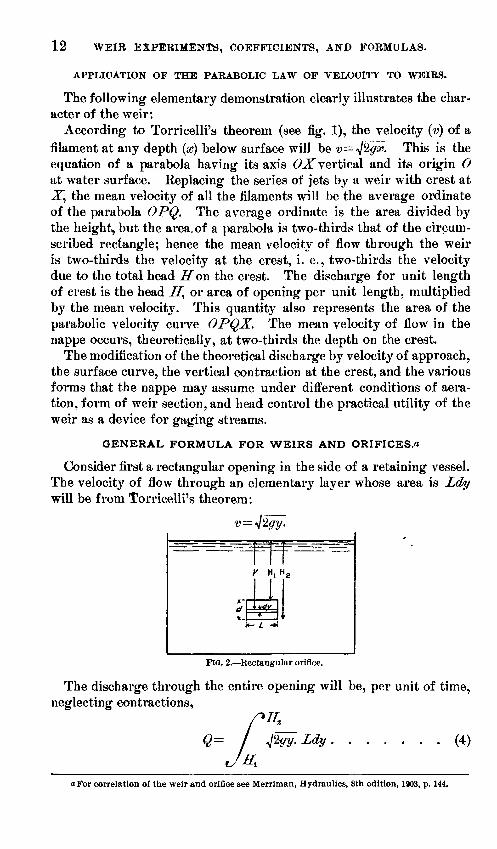
APPLICATION OF THE PARABOLIC LAW OF VELOCITY TO WEIRS.
The following elementary demonstration clearly illustrates the char acter of the weir:
According to Torricelli's theorem (see fig. 1), the velocity (v) of a filament at any depth (so) below surface will be v~ This is theequation of a parabola having its axis OX vertical and its origin 0 at water surface. .Replacing the series of jets by a weir with crest at X, the mean velocity of all the filaments will be the average ordinate of the parabola OPQ. The average ordinate is the area divided by the height, but the area, of a parabola is two-thirds that of the circum scribed rectangle; hence the mean velocity of flow through the weir is two-thirds the velocity at the crest, i. e., two-thirds the velocity due to the total head If on the crest. The discharge for unit length of crest is the head II, or area of opening per unit length, multiplied by the mean velocity. This quantity also represents the area of the parabolic velocity curve OPQX. The mean velocity of flow in the nappe occurs, theoretically, at two-thirds the depth on the crest.
The modification of the theoretical discharge by velocity of approach, the surface curve, the vertical contraction at the crest, and the various forms that the nappe may assume under different conditions of aera tion, form of weir section, and head control the practical utility of the weir as a device for gaging streams.
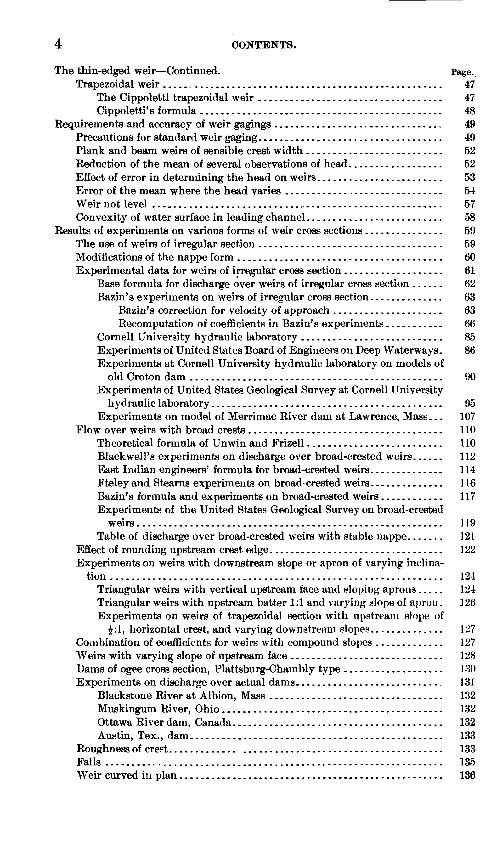
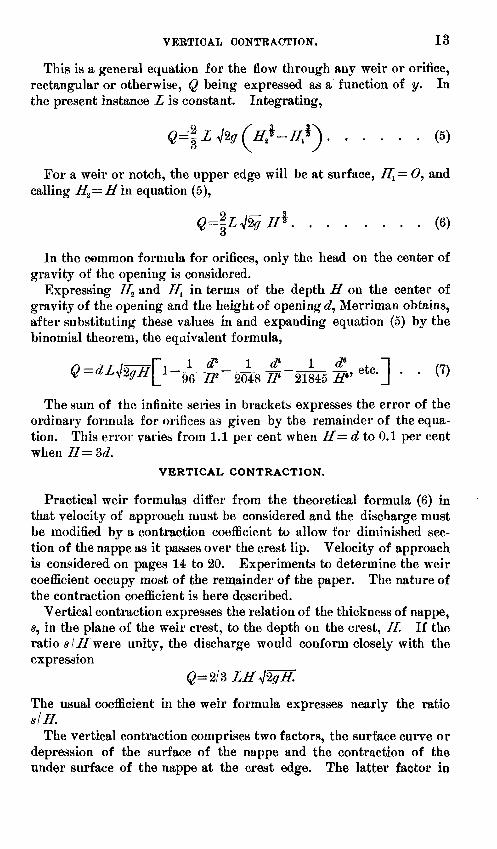
GENERAL FORMULA FOR WEIRS AND ORIFICES.a
Consider first a rectangular opening in the side of a retaining vessel. The velocity of flow through an elementary layer whose area is Ldy will be from Torricelli's theorem:
FIG. 2. Rectangular orifice.
The discharge through the entire opening will be, per unit of time, neglecting contractions,
(4)
a For correlation of the weir and orifice see Merriman, Hydraulics, 8th edition, 1903, p. 144.
VERTICAL CONTRACTION. 13
This is a general equation for the flow through any weir or orifice, rectangular or otherwise, Q being expressed as a function of y. In the present instance L is constant. Integrating,
-- //,* .... (5)
For a weir or notch, the upper edge will be at surface, H^= #, and calling If 2 = IT in equation (5),
(6)
In the common formula for orifices, only the head on the center of gravity of the opening is considered.
Expressing Ha and H^ in terms of the depth H on the center of gravity of the opening and the height of opening d, Merriman obtains, after substituting these values in and expanding equation (5) by the binomial theorem, the equivalent formula,
. (7)
The sum of the infinite series in brackets expresses the error of the ordinary formula for orifices as given by the remainder of the equa tion. This error varies from 1.1 per cent when H= d to 0.1 per cent when H=3d.
VERTICAL CONTRACTION.
Practical weir formulas differ from the theoretical formula (6) in that velocity of approach must be considered and the discharge must be modified by a contraction coefficient to allow for diminished sec tion of the nappe as it passes over the crest lip. Velocity of approach is considered on pages 14 to 20. Experiments to determine the weir coefficient occupy most of the remainder of the paper. The nature of the contraction coefficient is here described.
Vertical contraction expresses the relation of the thickness of nappe, s, in the plane of the weir crest, to the depth on the crest, //. If the ratio s\H were unity, the discharge would conform closely with the expression
The usual coefficient in the weir formula expresses nearly the ratio slH.
The vertical contraction comprises two factors, the surface curve or depression of the surface of the nappe and the contraction of the under surface of the nappe at the crest edge. The latter factor in
14 WEIR EXPERIMENTS, COEFFICIENTS, AND FORMULAS.
particular will vary with form of the weir cross section, and in gen eral variation in the vertical contraction is the principal source of variation in the discharge coefficient for various forms of weirs.
The usual base weir formula, Q=2i3 LHwgH, is elsewhere given for an orifice in which the upper edge is a free surface. If instead the depth on the upper edge of the orifice is d, the surface contraction, there results the formula
(8)
This is considered as the true weir formula by Merriman. a In this formula only the crest-lip contraction modifies the discharge, necessi tating the introduction of the coefficient. The practical difficulties of measuring d prevent the use of this as #, working formula.
Similarly a formula may be derived in which only the effective cross section s is considered, but even this will require some correction of the velocity. Such formulas are complicated by the variation of 8 and d with velocity of approach. 6 Hence, practical considerations included, it has commonly been preferred to adopt the convenient
2 __ base formula for weirs, Q=g MLH^gH, or an equivalent, and throwall the burden of corrections for contraction into the coefficient M.
VELOCITY OF APPROACH.
THEORETICAL FORMULAS.
Before considering the various practical weir formulas in use some general considerations regarding velocity of approach and its effect on the head and discharge may be presented.
In the general formula (4) for the efflux of water when the water approaches the orifice or notch with a velocity -y, then with free dis charge, writing D-\- h in place of H, for a rectangular orifice, we have
(9)
DI and Z>2 being the measured depth on upper and lower edges of the
orifice, and h==~, the velocity head.^
To assume that D-\- h equals H is to assume that the water level is
a Hydraulics, 8th edition, p. 161.&See Trautwine and Marichal's translation of Bazin's Experiments, pp, 231-307, where may also be
found other data, including a resum6 of M. Boussinesq's elaborate studies of the vertical contraction of the nappe, which appeared in Comptes Rendus de 1' Academic des Sciences for October 24, 1887,
VELOCITY OF APPROACH. 15
increased by the amount A, or, as is often stated, that jETis "measured to the surface of still water." This is not strictty correct, how ever, because of friction and unequal velocities, which tend to make H D>h, as explained below.
For a weir, Dj equals zero; integrating,
^ 2
Since Q = L^SgH, we have
. .... (90)
This is the velocity correction formula used by James B. Francis. a Since h appears in both the superior and inferior limits of integra
tion, it is evident that A increases the velocity only, and not the sec tion of discharge. The criticism is sometimes made that Francis's equation has the form of an increase of the height of the section of discharge as well as the velocity.
The second general method of correcting for velocity of approach consists of adding directly to the measured head some function of the velocity head, making
in the formula
or
*). ..... 95
This is the method employed by Boileau, Fteley and Stearns, and Bazin. No attempt is made to follow theory, but an empirical correc tion is applied, affecting both the velocity and area of section.
By either method v must be determined by successive approxima tions unless it has been directly measured.
Boileau and Bazin modify (9J) so as to include the area of section of channel of approach, and since the velocity of approach equals QlA, a separate determination of v is unnecessary. Bazin also combines the factor for velocity of approach with the weir coefficient.
The various modifications of the velocity correction formulas are given in conjunction with the weir formulas of the several experi menters.
o Boyey gives similar proof of this formula for the additional cases of (1) an orifice with free dis charge, (2) a submerged orifice, (3) a partially submerged orifice or drowned weir, thus establishing its generality.
16 WEIR EXPERIMENTS, COEFFICIENTS, AND FORMULAS.
DISTRIBUTION OF VELOCITY IN CHANNEL OF APPROACH.
The discharge over a weir takes place by virtue of the potential energy of the layer of water lying above the level of the weir crest, which is rendered kinetic by the act of falling over the weir. If the water approaches the weir with an initial velocity, it is evident that some part of the concurrent energy will facilitate the discharge.
The theoretical correction formulas may not truly represent the effect of velocity of approach for various reasons:
1. The fall in the leading channel adjacent to the measuring section is the source of the velocity of approach, and this fall will always be greater than that required to produce the existing velocities, because some fall will be utilized in overcoming friction.
2. The velocity is seldom uniform at all parts of the leading chan nel and the energy of the water varies according^. This effect is discussed later (p. 17).
3. It is not certain just what portion of the energy of the water in the section of the leading channel goes to increase the discharge.
t
:r t
c __!---
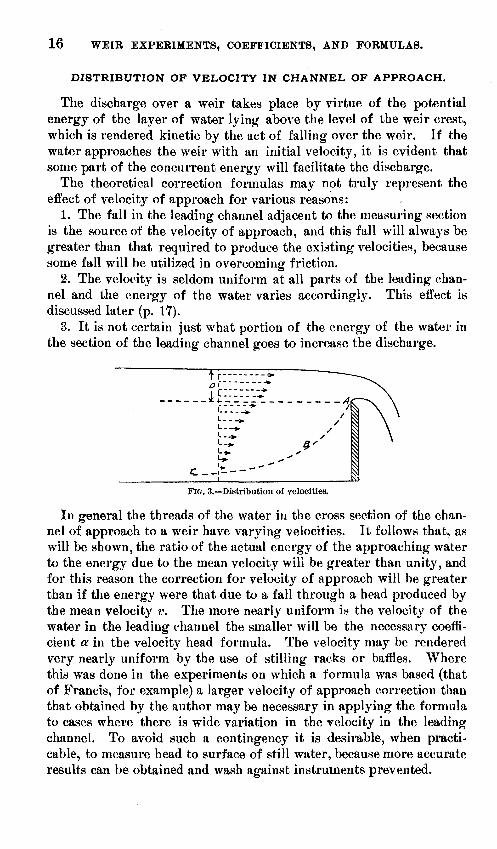
FIG. 3. Distribution of velocities.
In general the threads of the water in the cross section of the chan nel of approach to a weir have varying velocities. It follows that, as will be shown, the ratio of the actual energy of the approaching water to the energy due to the mean velocity will be greater than unity, and for this reason the correction for velocity of approach will be greater than if the energy were that due to a fall through a head produced by the mean velocity v. The more nearly uniform is the velocity of the water in the leading channel the smaller will be the necessary coeffi cient ex in the velocity head formula. The velocity may be rendered very nearly uniform by the use of stilling racks or baffles. Where this was done in the experiments on which a formula was based (that of Francis, for example) a larger velocity of approach correction than that obtained by the author may be necessary in applying the formula to cases where there is wide variation in the velocity in the leading channel. To avoid such a contingency it is desirable, when practi cable, to measure head to surface of still water, because more accurate results can be obtained and wash against instruments prevented.
VELOCITY OF APPROACH. 17
The vertical and horizontal velocity curves in an open channel usu ally closely resemble parabolas. A weir interposes an obstruction in the lower part of the channel, checking the bottom velocities. The velocity is not, however, confined to the filaments in line with the sec tion of the discharge opening of the weir. As a result of viscosity of the liquid, the upper rapidly moving layers drag the filaments under neath, and the velocity may extend nearly or quite to the channel bot tom. There will usually, however, be a line (A B C, fig. 3), rising as the weir is approached, below which there is no forward velocity.
The line A B C is the envelope of the curves of vertical velocity in the channel of approach.
There will be a similar area of low velocity at each side of the chan nel for a contracted weir. The inequality of velocities for such weirs being usually greater than for suppressed weirs, .it follows that a larger coefficient in the formula for velocity of approach may be required. This is confirmed by experiment.
Various assumptions have been made as to what portion of the energy of the approaching stream goes to increase the discharge, (a) that resulting from the mean velocity deduced from the discharge divided by the area of the entire section of the channel of approach; (b) that of the mean velocity obtained by using the sectional area of the moving water, above the line ABC, fig. 3; (c) that of the fila ments lying in line with or nearest to the section of the weir opening, determined approximately by the surface velocity."
DISTRIBUTION OF ENERGY IN CHANNEL OF APPROACH.
Consider unit width of the channel of approach: Let vs Surface velocity.
v^^Mean velocity.vb = Bottom velocity.v = Velocity at a height so above bottom.X= Depth of water in channel of approach.w Weight of unit volume.
The general formula for kinetic energy is
........ (10)
where W= weight of the moving mass.If the velocity increases uniformly from bottom to surface, the
velocity at height so will be
a Smith, Hamilton, Hydraulics, p. 68. 949289 O 51 2
18 WEIR EXPERIMENTS, COEFFICIENTS, AND FORMULAS.
Let dx be the thickness of a lamina one unit wide at height a?» The total kinetic energy for the depth Xwill berx
K.E.= / (t>ft+£ (iv-^)j| <& .... (11) t/0
If the velocity is uniform, the total kinetic energy per unit width is found by integration to be
K. E.=^f^-3 ....... (12)*9
Integrating equation (11) for the case where ^=0 and the velocity
increases uniformly from the bottom to the surface so that vm=^,2
K. K.= ....... (13)9
Comparing this with the expression for kinetic energy of a stream flowing with the uniform velocity v (equation 12), we find the mass energy of the stream with uniformly varying velocity to be twice that of a stream with a uniform velocity of the same measured value.
By a similar integration the ratio of the total kinetic energy to the kinetic energy corresponding to the mean velocity in the channel of approach can be obtained for any assumption as to the distribution of velocities in the leading channel. The resulting ratio will depend upon the relative areas of section with low and high velocities which go to make up the mean, and in practice it will generally exceed unity.
The lowering of the water surface in a still pond will also be greater in the case of unequal velocities than in the case of a uniform velocity equal to their mean. The theoretical weir formula indicates the same discharge for a uniform velocity of approach v as for varying veloci ties whose mean is v, although in the former case the actual drawing down of the head would be greater. If h were the velocity head cor responding to the mean velocity, and if v^ vz ^ v$, etc., vn were the actual velocities in the n unit areas of cross section the discharge in each unit section will be proportional to the velocity, and the head h! will have such a value that
etc- '=^A'=InteralK. E.
Now, vz =^wQh ^i. E. for uniform velocity of the same meanty
value, the friction head being neglected in both cases. As shown above, the integral K. E. is the greater,
It follows that A'>A, If a - y-, then hf ~ak,
VELOCITY OV APPBOACH. 19
Introducing velocity of approach in the discharge formula we sub stitute D-\-k for If, and integrate between the limits zero and D. Hence, for the same discharge, the area of weir section is greater without velocity of approach by nearly the amount JiL.
For a given measured head D, the effect of velocity of approach appears as an increase in the mean velocity of discharge in the plane of the weir. The relation of the mean velocity of discharge for a weir with velocity of approach to that for a weir without such velocity is shown below. The mean head being the same and the mean velocity
in the plane of the weir being -^,
/) /) 3 33then ^ : 4&:: D* : (J9+A)»-A*.
It will be seen that a discharge over a weir with velocity of approach is less than that for the same total head and greater than that for the same measured head without velocity of approach, and that with a given measured head the greater the velocity of approach the greater will be the discharge.
The kinetic energy of a mass of water remains sensibly constant while the water is passing through a leading channel of uniform cross section, for with a constant stage kinetic energy can increase or decrease only through a change of slope or through fluid friction. The former is nearly absent and the latter can cause only a slow trans fer of energy. If in the leading channel the velocities in the vertical plane that are originally unequal become equalized, there must be an increase in the mean velocity of the mass of water, for otherwise the kinetic energy per unit mass will decrease. It follows that the mean velocity will increase although the mean kinetic energy per unit mass remains constant, and hence the total kinetic energy of the water pass ing over the weir will increase in the same proportion as the velocity and discharge. For two cases in which the mean velocity is the same, but in which the velocities in the leading channels are uniform in the first case and nonuniform in the second, let the weights of water pass ing over the weir per second be represented respectively by TFand W1 and the kinetic energies by K. E. and K. E. 1 ; then since K. E.= TFA, A being the head due to the mean velocity -y,
Wh:Wlh: :K. E. : K. E. 1
It follows that an equalization of the velocities in the channel of approach by means of racks or baffles may cause an increase in the discharge, the measured head D remaining the same.
This will be clearer if we consider two contiguous filaments, each having unit section a, one with a velocity of 1 foot, the other of 2 feet
20 WEIR EXPERIMENTS, COEFFICIENTS, AND FORMULAS.
per second. The two will discharge 2+1 units flow per second, having the total kinetic energy indicated below:
,, T-, 1X12 2X22 awK- ®' =-If the velocities are equalized, 9 units of energy will be equally
divided between the two filaments, so that, the new velocity being -y,
%awv X vz Saw
3/0
and v=-5= 1.651.
The average velocity before equalization was 1.5.The discharge from two filaments with equal velocities will be 3.302
units, and 3.00 from two filaments with unequal velocities.
THE THIN-EDGED WEIR.
EARLIER EXPERIMENTS AND FORMULAS.
Prior to 1850 the practice of weir measurement was in a somewhat cnaotic condition, especially in England, Germany, and the United States. Experiments were made on so small a scale that the influ ences affecting the measurements and the lack of proper standards made the results untrustworthy in detail. Greater advancement had been made in France, and some of the work of the early French experi menters has proved to be of considerable value.
EXPERIMENTS OF CASTEL.
The first experiments deserving consideration are of those of M. Castel, conducted at the waterworks of Toulouse in 1835 and 1836." Castel erected his apparatus on a terrace in conjunction with the water tower, which received a continuous supply of 1.32 cubic feet per second, capable of being increased to 1.77 cubic feet per second. The weir consisted of a wooden dam, surmounted by a crest of copper 0.001 foot in thickness, situated in the lower end of a leading channel, 19.5 feet long, 2.428 feet wide, and 1.772 feet deep. Screens were placed across the upper end of the channel to reduce oscillations. The head was measured at a point 1.60 feet upstream from the weir by means of a point gage. The overflow was measured in a zinc-lined tank having a capacity of 113.024 cubic feet. The length of the crest
a Originally published in Memoires Acad. Sei. Toulouse, 1837. See D'Aubuisson's Hydraulics, Ben- nett's translation, pp. 74-77. Data recomputed by Hamilton Smith in his Hydraulics, pp. 80-82 and 138-145. The recomputed coefficients will be found valuable in calculating discharge for very small and very low weirs,
THIN-EDGED WEIE8. 21
for weirs with suppressed contractions varied from 2.393 to 2.438 feet. Heights of weirs varying from 0.105 to 0.7382 were used, and a similar series of experiments was performed on suppressed weirs 1.1844 feet long. The head varied for the longer weirs from about 0.1 to 0.25 foot. Additional experiments were made on contracted weirs having various lengths, from 0.0328 foot to 1.6483 feet, in a channel 2.428 feet wide, and for lengths from 0.0328 to 0.6542 foot in a channel 1.148 feet wide. The experiments on these weirs included depths varying from 0.1 or 0.2 foot to a maximum of about 0.8 foot.
D'Aubuisson gives the following formula, derived from the experi ments of Castel for a suppressed weir:
$=3.4872ZZ>V ^+0.035 TP ..... (14)
where W is the measured central surface velocity of approach, ordi narily about 1.2v.
EXPERIMENTS OF PONCELET AND LESBRO8.
The experiments made by Poncelet and Lesbros, at Metz, in 1827 and 1828, were continued by Lesbros in 1836. The final results were not published, however, until some years later. 0
The experiments of Poncelet and Lesbros and of Lesbros were per formed chiefly on a weir in a fixed copper plate, length 5.562 feet. The head was measured in all cases in a reservoir 11.48 feet upstream, beyond the influence of velocity of approach. The crest depth varied from about 0.05 to 0.60 or 0.80 foot. The experiments of Lesbros are notable from the fact that a large number of forms of channel of approach were employed, including those with contracted and con vergent sides, elevated bottoms, etc. They have been carefully recom puted by Hamilton Smith, and may be useful in determining the discharge through weirs having similar modifications. 5
EXPERIMENTS OF BOILEAU.
The experiments of Boileau c at Metz, in 1846, included 3 suppressed weirs, having lengths and heights as follows:
(1) Length 5.30 feet, height 1.54 feet.(2) Length 2.94 feet, height 1.12 feet.(3) Length 2.94 feet, height 1.60 feet.The depth of overflow varied from 0.19 to 0.72 foot. Boileau
obtained the following formula for a suppressed weir:
a Experiences hydrauliques sur les lois de 1'ecoulement de 1'eau, Paris, 1852.6 Smith, Hamilton, Hydraulics, pp. 96 and 97 and 104-107. Also plates 1-2 and 8.o Gaugeage de cours d'eau, etc., Paris, 1850.
22 WEIR EXPERIMENTS, COEFFICIENTS, AND FORMULAS.
This formula includes the correction for velocity of approach. The coefficient (7, it will be noticed, is given as a constant. Boileau after wards gave a table of corrections varying with the depth, indicating a discharge from 96 to 107 per cent of that obtained with the constant coefficient. Additional experiments by Boileau on suppressed weirs having a crest length of about 0.95 foot have been recomputed by Hamilton Smith. 0 The heights of weirs were, respectively, 2.028, 2.690, 2.018, and 2.638 feet. In these experiments the discharge was determined by measurement through orifices.
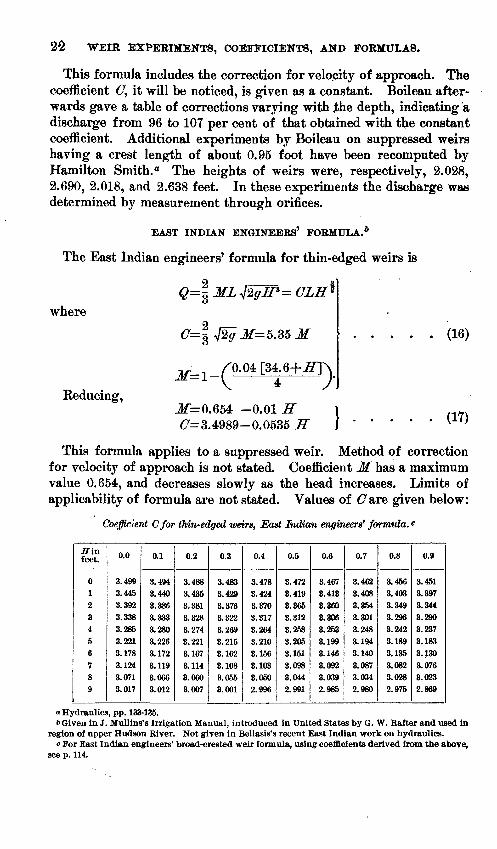
EAST INDIAN ENGINEERS5 FORMULA.*
The East Indian engineers' formula for thin-edged weirs is
~ 2
where
J/=5.35 M
Reducing,/J
(16)
Jf=0.654 -0.01 H #=3.4989-0.0535 H (17)
This formula applies to a suppressed weir. Method of correction for velocity of approach is not stated. Coefficient M has a maximum value 0.654, and decreases slowly as the head increases. Limits of applicability of formula are not stated. Values of C are given below:
Coefficient Cfor thin-edged weirs, East Indian engineers' formula. «
If infeet.
0123456789
0.0
3.4993.4453.3923.3383.2853.2213.1783.1243.0713.017
0.1
3.4943.4403.3863.3333.2803.2263.1723.1193.0663.012
0.2
3.4883.4353.3813.3283.2743.2213.1673.1143.0603.007
0.3
3.4833.4293.3763.3223.2693.2153.1623.1033.0553.001
0.4
3.4783.4243.3703.3173.2643.2103.1563.1033.0502.996
0.5
3.4723.4193.3653.3123.2583.2053.1513.0983.0442.991
0.6
3.4673.4133.3603.3063.2533.1993.1463.0923.0392.985
0.7
3.4623.4083.3543.3013.2483.1943.1403.0873.0342.980
0.8
3.4563.4033.3493.2963.2423.1893.1353.0823.0282.975
0.9
3.4513.3973.3443.2903.2373.1833.1303.0763.0232.969
o Hydraulics, pp. 133-135.hGiven in J. Mullins's Irrigation Manual, introduced in United States by G. W. Rafter and used in
region of upper Hudson River. Not given in Bellasis's recent East Indian work on hydraulics.c For East Indian engineers' broad-crested weir formula, using coefficients derived from the above,
see p. 114.
THIN-EDGED WEIBS. 23
EXPERIMENTS AND FORMULA OF JAMES B. FRANCIS.
The experiments on discharge over thin-edged weirs," upon which the Francis formula is based, were made in October and November. 1852, at the lower locks of the Pawtucket canal, leading from Con cord River past the Lowell dam to slack water of Merrimac River. Additional experiments were made by Francis in 1848 b at the center vent water wheel at the Boott Cotton Mills in Lowell, with gates blocked open and with constant head. A uniform but unknown vol ume of water was thus passed through the turbine and over a weir having various numbers of end contractions, the effect of which was thus determined. Similar experiments were made in 1851 at the Tre- mont turbine,6 where a constant volume of water was passed over weirs of lengths ranging from 3.5 to 16.98 feet and with from two to eight end contractions. These experiments were made to determine the exponent n in the weir formula
Francis here found ?i=1.47, but adopted the value n=~L. 5=3/2, in the experiments of 1852.
The Pawtucket canal lock was not in use at the time of the Lowell experiments in 1852 and the miter gates at the upper lock chamber were removed and the weir was erected in the lower hollow quoin of the gate chamber. The middle gates at the foot of the upper cham ber were replaced by a bulkhead having a sluice for drawing off the water. A timber flume in the lower chamber of the lock was used as a measuring basin to determine the flow over the weir. Its length was 102 feet and its width about 11.6 feet. A swinging apron gate was so arranged over the crest of the weir that, when opened, the water flowed freely into the measuring basin below, and when closed, with its upper edge against the weir, the overflow passed into a wooden diverting channel, placed across the top of the lock chamber, and flowed into Concord River. An electric sounder was attached to the gate framework, by which a signal was given when the edge of the swinging gate was at the center of the nappe, when either opening or closing. By this means the time of starting and stopping of each experimental period was observed on a marine chronometer. The depth on the weir was observed by hook gages. The readings were taken in wooden stilling boxes, 11 by 18 inches square, open at the top, and having a 1-inch round hole through the bottom, which was about 4 inches below the weir crest. The weir was in the lower quoin of the gate recess, and the hook gage boxes were in the upper quoin, projecting slightly beyond the main lock walls. In weirs with end
a Francis, J. B., Lowell Hydraulic Experiments, pp. 103-135. &Idem, pp. 96-102. oldem, pp. 76-95.
24 WEIR EXPERIMENTS, COEFFICIENTS, AND FORMULAS.
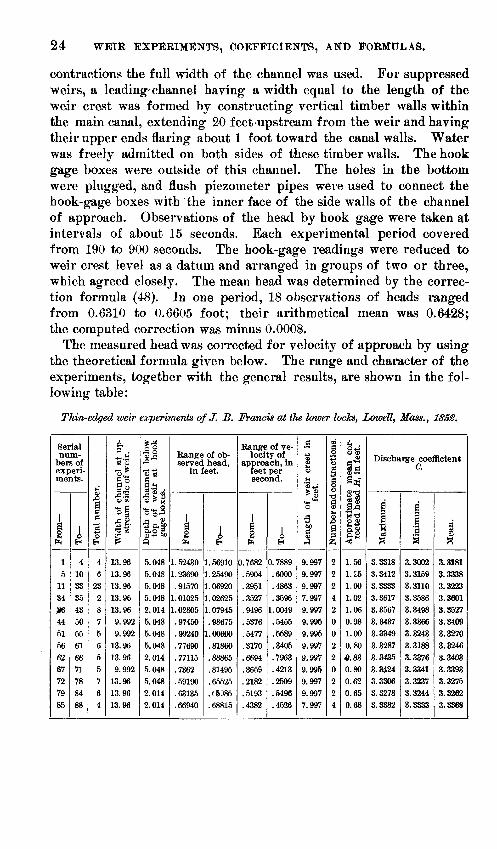
contractions the full width of the channel was used. For suppressed weirs, a leading'channel having a width equal to the length of the weir crest was formed by constructing vertical timber walls within the main canal, extending 20 feet-upstream from the weir and having their upper ends flaring about 1 foot toward the canal walls. Water was freely admitted on both sides of these timber walls. The hook gage boxes were outside of this channel. The holes in the bottom were plugged, and flush piezometer pipes were used to connect the hook-gage boxes with the inner face of the side walls of the channel of approach. Observations of the head by hook gage were taken at intervals of about 15 seconds. Each experimental period covered from 190 to 900 seconds. The hook-gage readings were reduced to weir crest level as a datum and arranged in groups of two or three, which agreed closely. The mean head was determined by the correc tion formula (48). In one period, 18 observations of heads ranged from 0.6310 to 0.6605 foot; their arithmetical mean was 0.6428; the computed correction was minus 0.0008.
The measured head was corrected for velocity of approach by using the theoretical formula given below. The range and character of the experiments, together with the general results, are shown in the fol lowing table:
Thin-edged weir experiments of J. B. Francis at the lower locks, Lowell, Mass., 1852.
Serialnum
bers ofexperiments.
1
|Pt|
1
51134#54451566267727985
£6-1
4103335435055616671788488
1P
a3£H
46
232875655764
ftoj'S
"3 ^g'o
"§'««-i do g^ 4>
_"Oln
^
13.9613.9613.9613.9613.969.9929.992
13.9613.969.992
13.9613.9613.96
||,§*
"3 Idaa .<*
e0<5*
Itsft
5.0485.0485.0485.0482.0145.0485.0485.0482.0145.0485.0482.0142.014
Range of ob served head,
in feet.
1
|1. 524301.23690.91570
1.010251.02805.97450.99240.77690. 77115.7362.59190.63135.66940
£^
1. 569101.254901.069201. 026251. 07945.98675
1.00600.81860.88865. 81495.65525.16385.68815
Range of velocity of
approach, infeet persecond.
1
Ife
0.7682.5904.3951.3527.9496.5376.5477.3170.6694.3659.2182.5193.4382
16-1
0.7889.6000.4863.3596
1.0049.5455.5589.3405.7963.4213.2509.5496.4526
a
tcO
§
w*2
O
aa9.9979.9979.9977.9979.9979.9959.9959.9979.9979.9959.9979.9977.997
00cO
&
10
a0)tc
|fc
2224200220224
§^gl^ SSbq
2$S .^"1*s
If ^1.561.261.001.021.060.981.000.80fi.830.800.620.650.68
Discharge coefficient
a|'R^
3.33183.34123.33333.36173.35673.34373.33493. 32873.34353.34243.33063.32783.3382
d
'a
<%
3.30023.31593.31103.35863.34983.33663.32433.31883.33763.33413.32373.32443.3333
S3.31813.33383.32233.36013.35273.34093.32703. 32463.34033.33933. 32753.32623.3368
If there are end contractions, L=L'-(
If there is velocity of approach,
FRANCIS EXPERIMENTS. 25
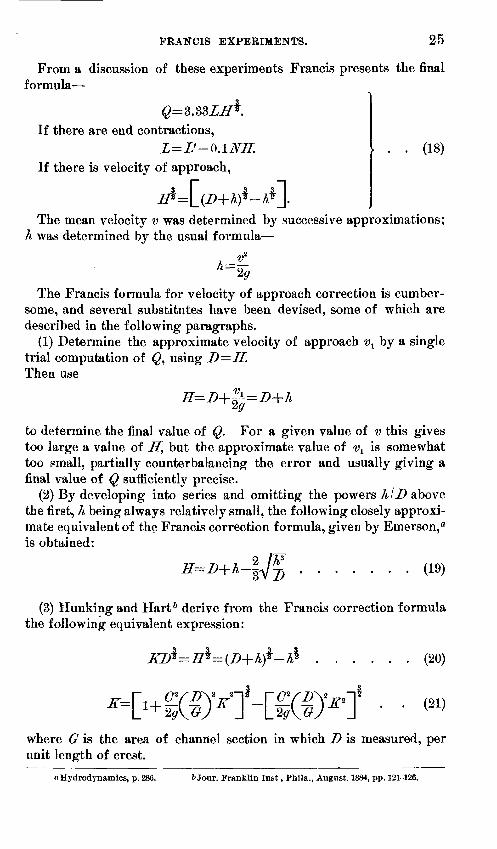
From a discussion of these experiments Francis presents the final formula
. . . (18)
The mean velocity v was determined by successive approximations; h was determined by the usual formula
The Francis formula for velocity of approach correction is cumber some, and several substitutes have been devised, some of which are described in the following paragraphs.
(1) Determine the approximate velocity of approach vt by a single trial computation of Q, using D=H. Then use
to determine the final value of Q. For a given value of v this gives too large a value of If, but the approximate value of -yx is somewhat too small, partially counterbalancing the error and usually giving a final value of Q sufficiently precise.
(2) By developing into series and omitting the powers klD above the first, h being always relatively small, the following closely approxi mate equivalent of the Francis correction formula, given by Emerson,0 is obtained:
(19)
(3) Hunking and Hart 6 derive from the Francis correction formula the following equivalent expression:
(20)
where G is the area of channel section in which D is measured, per unit length of crest.
a Hydrodynamics, p. 286. 6 Jour. Franklin Inst , Phila., August, 1884, pp. 121-126.
6 WEIB EXPERIMENTS, COEFFICIENTS, AND FOBMULAS.
For a suppressed weir,
For a contracted weir,A
(22)
Hunking and Hart have computed values of K by the solution of the above formula for each 0.005 increment in D\ G to 0.36. The results extended by formula (23) are given below.
Velocity of approach correction, factor K, Hunking and Hart formula, H* =
DIG
.000
.005
.010
.015
.020
.025
.030
.035
.040
.045
.050
.055
.060
.065
.070
.075
.080
.085
.090
.095
0.0
1.000001.0000061.0000261.0000581.0001031. 0001611.0002311.0003141.0004091.0005181.0006381.0007721.0009171.0010751.0012461.0014291.0016241.0018321.0020511.002284
0.1
1.0025281.0027851.0030531.0033351.0036281.0039331.0042511.0045811.0049231.0052781.0056441.0060231.0064141.0068171.0072321.0076591.0080991.0085511.0090151.009491
0.2
1.0099801.0104801.0109941.0115191.0120571. 0126071.0131691.0137441.0143311. 0149311. 0155431.0161671.0168051.0174551. 0181071.0187921.0194801.0201801.0208931. 021620
0.3
1.0223591.0231101.0238751.0246531.0254441.0262481.0270651.0278951.0287391.0295961.0304671.0313501.0322481.0331171.0341131.0351091.0358561.0368521. 0378481.038844
0.4
1.0398401.0408361.0418321.042828
.1.0438241.0450691.0460651.0470611. 0483061.0493021.0502981.0515431.0527881.0537841.0550291.0562741.0572701.0585151.0597601.061005
0.5
1.0622501.0634951.0647401.0659851.0672301.0687241.0699691.0712141.0727081.0739531.0751981. 0766921. 0781861.0794311.0809251.0824191.0836641.0851581.0866521.088146
0.6
1.089641.0911341.0926281.0941221.0956161.0973591.0988531.1003471.1020901.1035841. 1050781. 1068211.1085641.1100581. 1118011. 1135441. 1150381.1167811. 1185241.120267
The general formula for K is too complex for common use. The expressions
^=1+0.2489 (j£y ...... (23)and
K=l+(-j^y ........ (24)
are stated to give results correct within one-hundredth and one-fiftieth of 1 per cent, respectively^ for values of K less than 0.36.
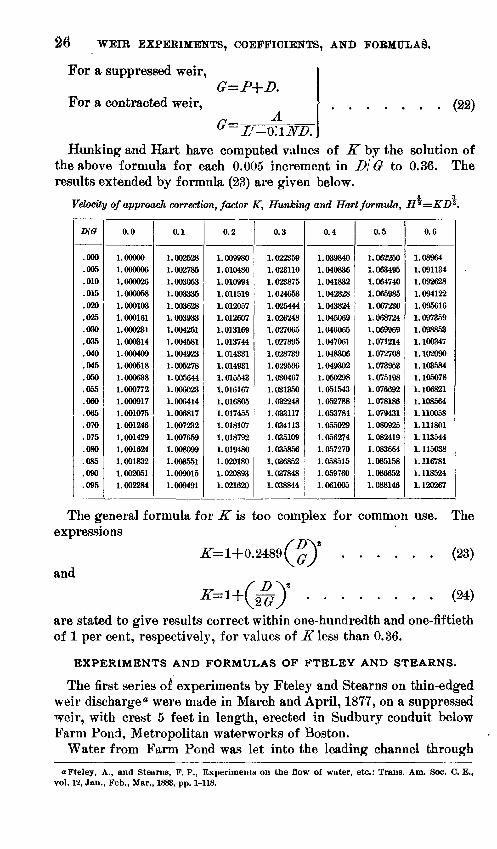
EXPERIMENTS AND FORMULAS OF FTELEY AND STEARNS.
The first series of experiments by Fteley and Stearns on thin-edged weir discharge" were made in March and April, 1877, on a suppressed weir, with crest 5 feet in length, erected in Sudbury conduit below Farm Pond, Metropolitan waterworks of Boston.
Water from Farm Pond was let into the leading channel through
« Fteley, A., and Stearns, F. P., Experiments on the flow of water, etc.: Trana. Am. Soc. C. E., vol. 12, Jan., Feb., Mar., 1883, pp. 1-118.
EXPERIMENTS OF FTELEY AND 8TEABNS. 27
head-gates until the desired level for the experiment, as found by previous trial, was reached. A swinging gate was then raised from the crest of the weir and the water was allowed to flow over. The 'maintenance of a uniform regimen was facilitated by the large area and the consequent small variation of level in Farm Pond, so that the outflow from the gates was sensibly proportional to the height they were raised. The water flowed from the weir into the conduit chan nel below, and was measured volumetrically. For the smaller heads the length of the measuring basin was 22 feet, and for the larger heads 367 feet.
The crest depth was observed by hook gage in a pail below the weir, connected to the channel of approach by a rubber tube entering the top of the side wall, 6 feet upstream from the weir crest. Hook-gage readings of head were taken every half minute until uniform regimen was established, and every minute thereafter. The depths in the meas uring basin were also taken by hook gage. The bottom of the conduit was concave, and was graded to a slope of 1 foot per mile. It was covered with water previous to each experiment, leaving a nearly rectangular section.
The experiments' in 1877 included 31 depths on a suppressed weir of 5 feet crest length, 3.17 feet high. The observed heads varied from 0.0735 to 0.8198 foot.
In 1879 a suppressed weir, with a crest length of 19 feet, was erected in Farm Pond Gate House. Head-gates and screens were close to weir; otherwise the apparatus for measuring head and starting and stopping flow was similar to that used in previous experiments. The crest of the weir was an iron bar 3£ inches wide and one-fourth inch thick, planed and filed and attached to the upper weir timber with screws. No variation in level of the weir crest occurred. As in the preceding experiments, no by-pass was provided, and the entire over flow entered Sudbury conduit below the weir. The conduit was partly filled with water at the start, leaving a nearly rectangular sec tion, 11,300 feet in length and about 9 feet wide. A difference of 3 feet in water level was utilized in measuring discharge, the total capac ity being 300,272 cubic feet. Semipartitions were provided to reduce oscillation of the water. Many observations, covering a considerable period of time, were required to determine the true water level. This series of experiments included 10 depths on a suppressed weir 19 feet long and 6.55 feet high, with measured heads varying from 0.4685 to 1.6038 feet and velocities of approach ranging from 0.151 to 0.840 foot per second.
From measurements on weirs 5 and 19 feet in length, respectively, and from a recalculation of the experiments of James B. Francis, Fteley and Stearns obtained the final formula
...... (25)
28 WEIR EXPERIMENTS, COEFFICIENTS, AND FORMULAS.
In the above, if there is velocity of approach,
of =1.5 for suppressed weirs.a =2.05 for weirs with end contractions.
The value of the velocity head coefficient a was determined from 94 additional experiments on the 5-foot weir in 1878. These involved measured heads ranging from 0.1884 to 0.9443 foot, heights of weir ranging from 0.50 to 3.47 feet, and velocities of approach reaching a maximum of 2.35 feet per second. Also 17 experiments were made on weirs 3, 3.3, and 4 feet long respectively; the first with two and the last two with one end contraction. These experiments included measured heads varying from 0.5574 to 0.8702 foot, and velocities of approach from 0.23 to 1.239 feet per second.
In all experiments on velocity of approach, the head was measured 6 feet upstream from crest. The width of channel was 5 feet."
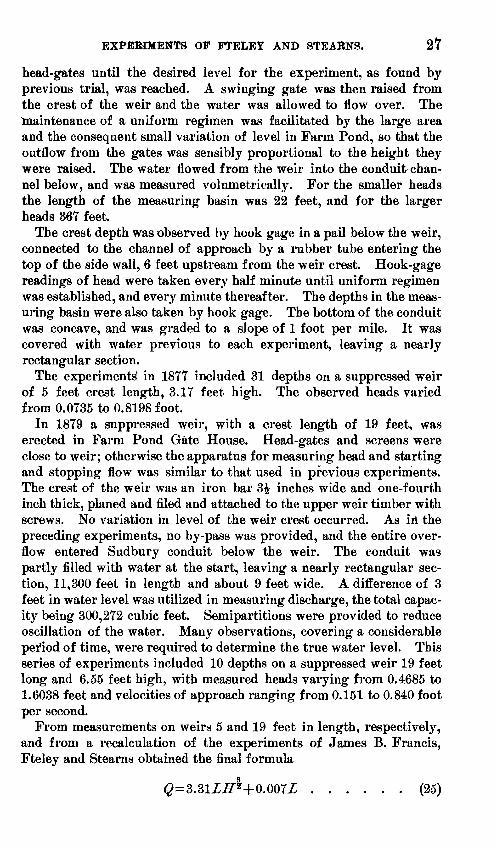
Fteley and Stearns found the following values of a for suppressed weirs:
Fteley and Stearns's value of a for suppressed weirs.
Measured depth on
weir, in feet.
0.2
.3
.4
.5
.6
. 7
> .8
.9
1.0
1.1
1.2
1.3
1.4
1.5
1.6
1.7
1.8
1.9
2.0
Depth of channel of approach below weir crest, in feet.
0.50
1.70
1.53
1.53
1.53
1.52
1.51
d. 50
1.49
1.48
--------
1.00
1.87
1.83
1.79
1.75
1.71
1.68<-1.65
1.63
1.61
1.59
1.57
1.55
1.54
1.52
1.51
1.49
1.70
1.66
1.65
1.63
1.62
1.60
1.59
1.57
1.56
1.54
1.53
1.51
1.49
1.48
1.46
1.44
1.43
1.41
1.40
1.38
2.60 6
1.51
1.50
1.49
1.48
1.47
1.46
1.45
cl.44
1.43
1.42
1.41
1.40
1.39
1.38
1.37
1.36
1.35
1.34
1.33
a Fteley and Stearns, idem, pp 5-23. & Applicable to greater heights of weir. c Limit of experiments.
EXPERIMENTS. 29
Current-meter measurements showed a nearly uniform distribution of velocities in the channel of approach above the 19-foot weir, a fact to be taken account of when the formulas are applied to cases where the velocity of approach varies in different portions of the leading channel.
If there are end contractions, the net length of weir should be deter mined by the Francis formula,
The head should be measured at the surface of the channel of approach, 6 feet upstream from the weir crest.
BAZIN'S EXPERIMENTS.
Bazin's experiments on thin-edged weirs were performed in the side channel of the Canal de Bourgogne, near Dijon, France, and were begun in 1886. Their results were published in Annales des Fonts et Chausse*es and have been translated by Marichal and Trautwine."
The standard weir consisted of horizontal timbers 4 inches square, with an iron crest plate 0.276 inch in thickness. Air chambers were placed at the ends of the weir on the downstream side, to insure full aeration of the nappe. End contractions were suppressed. The height of the first weir was 3.27 feet above channel bottom, and the head was measured in "Bazin pits," one at each side of the channel 16.40 feet upstream from the weir crest. The pit consisted of a lat eral chamber in the cement masonry forming the walls of the canal. The chamber was square, 1.64 feet on each side, and communicated with the channel of approach by a circular opening 4 inches in diameter, placed at the bottom of the side wall and having its mouth exactly flush with the face of the wall. The oscillations of the water surface in the lateral chamber were thus rendered much less prominent than in the channel of approach. The water level in the Bazin pit was observed by dial indicators attached to floats, the index magnifying the variations in water level four times, the datum for the indicators having been previously determined by means of hook gages placed above the crest of the weir and by needle-pointed slide gages in the leading channel.
A drop gate was constructed on the crest of the weir to shut off the discharge at will. In each experiment the head-gates through which the water entered the leading channel were first raised and the water was allowed to assume the desired level. The weir gate was then raised, and the head-gates were manipulated to maintain a nearly con-
« Bazin, H., Eecent experiments on flow of water pver weirs, translated from the French by Mari chal and Trautwine: Proc. Engineers' Club Phila., vol. 7, Jan., 1890, pp. 259-310; vol. 9, pp. 231-244, 287^-319; vol. 10, pp. 121-164.
30 WEIB EXPERIMENTS, COEFFICIENTS, AND FORMULAS.
stant inflow. The arithmetical mean of the observations during each period of uniform regimen was used as the measured head for that experiment.
The overflow passed into a measuring channel, 656.17 feet in length, whose walls were made of smooth Portland cement concrete. The channel was 6.56 feet wide, its side walls were 3.937 feet high, and its lower end was closed by water-tight masonry. Its bottom was graded to a slope of about 1:1,000. The volume of inflow was determined by first covering the channel bottom with water, then noting the change of level during each experimental period, the capacity of the channel at various heights having previously been carefully determined. A slight filtration occurred, necessitating a correction of about one-eighth of 1 per cent of the total volume. The observations for each regimen were continued through a period of 12 to 30 minutes.
Sixty-seven experiments were made on a weir 3.72 feet high, includ ing heads from the least up to 1.017 feet. Above this point the volumetric measuring channel filled so quickly as to require the use of a shorter weir. Thirty-eight experiments were made with a standard weir, 3.28 feet long and 3.72 feet high, with heads varying from the least up to 1.34 feet. For heads exceeding 1.34 feet it was necessary to reduce the height of the weir in order that the depth above the weir should not exceed that of the channel of approach. Forty-eight experiments were made on a weir 1.64 feet long and 3.297 feet high, with heads ranging from the least up to 1.780 feet. These experiments sufficed to calibrate the standard weir with a degree of accuracy stated by Bazin as less than 1 per cent of error.
In order to determine the effect of varying velocities of approach the following additional series of experiments were made on sup pressed weirs 2 meters (6.56 feet) in length.
Experiments on suppressed weirs 2 meters in length.
Number of experi
ments.
28+30
29+29
27+41
44
Range of head in feet.
From
0.489
.314
.298
.296
To
1.443
1.407
1.338
1.338
Height of experimen tal weir, in
feet.
2.46
1.64
1.15
0.79
The standard weir was 3.72 feet high, and the experimental weirs were placed 46 to 199 meters downstream. The discharge was not measured volumetrically. A uniform regimen of flow was established and the depths on the two weirs were simultaneously observed during each period of flow.
BAZIN'S FOEMULAS. 31
These experiments afforded data for the determination of the rela tive effect of different velocities of approach, corresponding to the different depths of the leading channel.
From these experiments Bazin deduces coefficients for a thin-edged weir 3.72 feet high, for heads up to 1.97 feet, stated to give the true discharge within 1 per cent."
BAZIN'S FORMULAS FOR THIN-EDGED WEIRS.
Starting with the theoretical formula for a weir without velocity of approach, in the form
and substituting
for H, in the case of a weir haying velocity of approach, there results,
< +< > Bazin obtained, by mathematical transformation, the equivalent*
or
Bazin writes
for which equation he obtains, by mathematical transformation, the approximate equivalent 0
The calculation of the factor v appearing in this formula requires the discharge Q to be known.
Assuming that the channel of approach has a constant depth P below the crest of the weir, and that its width is equa1. to the length of the
« Bazin, H., Experiences nouvelles sar 1'gcoulement en deVersoir: Ann. Fonts et Chauss^es, Mem. et Doc., 1898, 2=» trimestre. See translation by Marichal and Trautwine in Proc. Eng. Club Phila., vol. 7, pp. 259-310; vol. 9, pp. 231-244.
6 The steps in the derivation of this formula are given by Trautwine and Marichal in their trans lation of Bazin's report of his experiments, in Proc. Eng. Club Phila., vol. 7, p. 280.
cThe steps in detail are given by Trautwine and Marichal in their translation of Bazin, in Proc. Eng. Club Phila., vol. 7, No. 5, p. 281.
32 WEIR EXPERIMENTS, COEFFICIENTS, AND FORMULAS.
weir, v may be expressed in terms of these factors, and of the discharge
O/) X/
Using this value of v, Bazin obtains the expression
...... (28)
3 where ^=0 a ')l^- °° ig a nearly constant factor, varying only with
niz . The value of &? as well as that of a can be determined by com parative experiments on thin-edged weirs of different heights."
From a discussion of his own experiments and those of Fteley and Stearns, Bazin finally obtained the formulas
, no velocity of approach; 1V
^ with velocity of approach.)
1AK , 0.003X3.281 .._ , 0.00984 6 j*= 0.405 H jj = 0.405+ -jj
5 For a weir with velocity of approach a and G?=0.55. Substitut
ing in equations (27) and (28),
m= l+0.55 r ........ (32)
These formulas give values of m agreeing with the results of the experiments within 1 per cent for weirs exceeding about 1 foot in height within the experimental range of head.
Approximately, for heads from 4 inches to 1 foot,
m=0.425+0.21 Y . ..... (33)
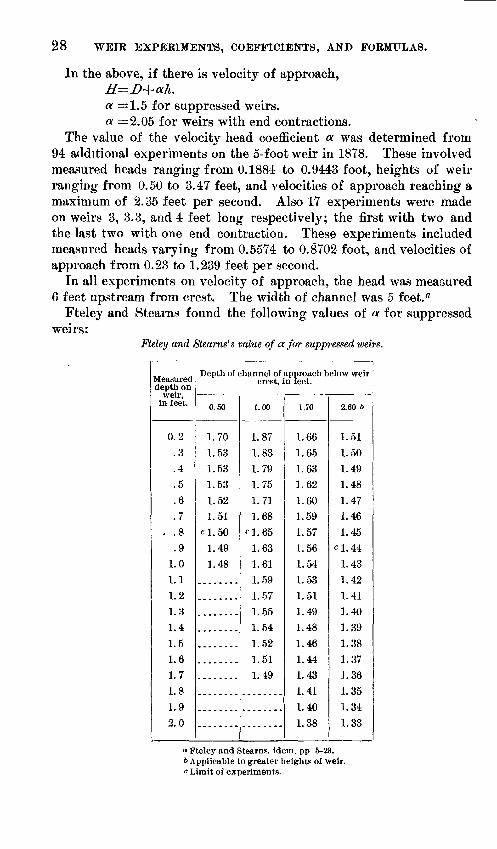
correct within 2 to 3 per cent.The following table gives Bazin's experimental coefficients, the head
and height of weir (originally meters) having been reduced to feet:
aFor detailed analysis see Trautwine and Marichal, Proc. Eng. Club Phila., vol. 7, pp. 282-283. b Experimental tabular values of ^ differing very slightly from the formula within the range of
Bazin's experiments are also given.
U.
8.
GE
OLO
GIC
AL
SU
RV
EY
WA
TE
R-S
UP
PL
Y
PA
PE
R
NO
. 200
PL
.
19:.49
10*
1*£S£=
,4 ft-.73 ^
^S
r
:?e/X e,;
0 .1
.2 .3
.4 .6
.6 .7
BA
ZIN
'S
EX
PE
RIM
EN
TA
L C
OE
FF
ICIE
NT
.8 .9
1.0 1.1
1.8 1.8
1.4 1.6
1.6 1.7
1.8 1.9
2.0 H
eads in
feet.
m
FO
R T
HIN
-ED
GE
D
WE
IRS
O
F V
AR
YIN
G
HE
IGH
T,
FO
R
US
E
IN
TH
E
FO
RM
UL
A
Q=
mL
DV
r29 D.
BAZINS FORMULAS. 33
Values of the Bazin coefficient C in the formula Q CLH* for a thin-edged weir, vnthoutend contraction.
Measured head D.
Feet.
0.164 .197 .230 .262 .295
.328
.394
.469
.525
.591
.656
.722
.787
.853
.919
.984 1.050 1.116 1. 181- 1.247
1.312 1.378 1.444 1.509 1.575
1.640 1.706 1.772 1.837 1.903 1.969
Meters.
Height of crest of weir above bed of channel of approach, in feet.
0.66
C
3.673 3.657 3.649 3.657 3.665
3.681 3.705 3.737 3.777 3.810
3.850 3.882 3.914 3.946 3.978
4.010
0.98
C
3.633 3.609 3.593 3.585 3.585
3.585 3.593 3.609 3.633 3.657
3.681 3.705 3.729 3.753 3.785
3.810 3.834 3.858 3.874 3.898
3.922 3.938 3.962 3.978
!
0.20 0.30
1.31
C
3.617 3.585 3.569 3.653 3.545
3.545 3.545 3.553 3.561 3.569
3.586 3.601 8.625 3.649 3.665
3.689 3.705 '3.721 3.745 3.761
3.785 3.801 3.818 3.834 3.850
3.866 3.874 3.890 3.906 3.922 3.930
0.40
1.64
C
3.609 3.569 3.653 3.537 3.529
3.521 3.513 3.513 3.513 3.521
3.529 3.545 3.561 3.577 3.593
3.609 3.625 3.641 3.657 3.673
3.681 3.697 3.713 3.729 3.745
3.753 3.769 3.785 3.793 3.810 3.818
0.50
1.97
C
3.601 3.569 3.545 3.529 3.513
3.505 3.497 3.489 3.489 3.489
3.497 3.505 3.513 3.529 3.537
3.553 3.561 3.577 3.593 3.601
3.617 3.625 3.641 3.657 3.665
3.681 3.689 3.697 3.713 3.721 3.737
0.60
2.62
C
3.601 3.561 3.537 3.513 3.497
3.489 3.473 3.465 3.457 3.457
3.457 3.457 3.465 3.465 3.473
3.481 3.497 3.505 3.513 3.521
3.529 3.537 3.545 3.553 3.561
3.569 3.577 3.585 3.593 3.601 3.617
0.80
3.28
C
3.601 3.553 3.529 3.513 3.497
3.481 3.465 3.449 3.440 3.432
3.432 3.432 3.432 3.440 3.440
3.449 3.449 3.457 3.465 3.465
3.473 3.481 3.489 3.489 3.497
3.505 3.513 3.513 3.521 3.529 3.537
1.00
4.92
C
3.593 3.553 3.529 3.505 3.489
3.473 3.449 3.432 3.424 3.416
3.408 3.400 3.400 3.400 3.400
3.400 3.400 3.400 3.400 3.400
3.400 3.408 3.408 3.408 3.408
3.416 3.416 3.416 3.424 3.424 3.424
1.50
6.56
C
3.593 3.653 3.521 3.505 3.481
3.473 3.449 3.432 3.416 3.408
3.392 3.392 3.384 3.384 3.384
3.376 3.376 3.376 3.376 3.376
3.376 3.376 3.376 3.376 3.376
3.376 3.376 3.376 3.376 3.376 3.376
2.00
QO
C
3.594 3.550 3.522 3.499 3.481
3.466 3.441 3.422 3.405 3.392
3.380 3.371 3.364 3.358 3.353
3.348 3.343 3.338 3.333 3.328
3.323 3.319 3.316 3.311 3.306
3.303 3.298 3.294 3.289 3.285 3.282
00
Measured head D.
Meters.
0.05 .06 .07 .08 .09
.10
.12
.14
.16
.18
.20
.^2
.24
.26
.23
.30
.32
.34
.36
.38
.40
.42
.44
.46
.48
.50
.52
.54
.56
.58
.60
This table, unfortunately, is inconvenient for interpolation in English units. The values also differ slightly from those computed from the formulas. The table illustrates the difficulty of practical application of a weir formula in which the coefficient varies rapidly both with head and height of weir.
34 WEIB EXPEBIMENTS, COEFFICIENTS, AND FORMULAS.
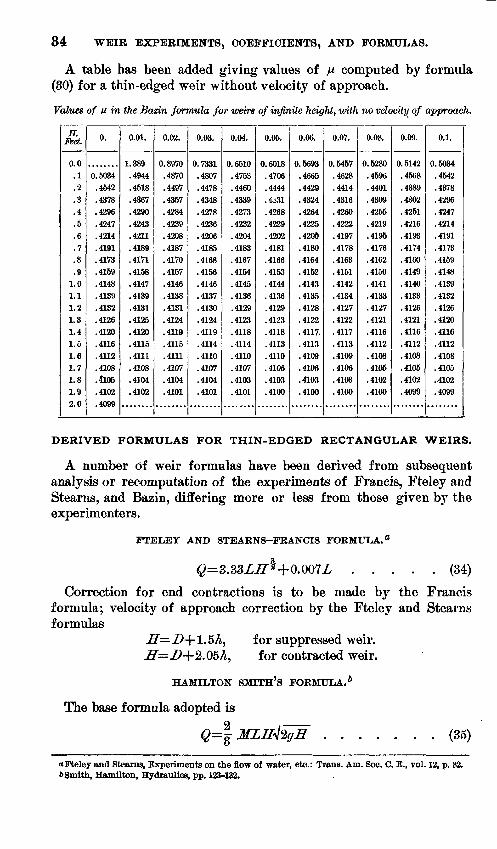
A table has been added giving values of JM computed by formula (30) for a thin-edged weir without velocity of approach.
Values of u in the Bazin formula for weirs of infinite height, with no velocity of approach.
H.Feet.
0.0.1.2.3.4.5.6.7.8.9
1.01.11.21.31.41.51.61.71.81.92.0
0.
0.5034.4542.4378.4296.4247.4214.4191.4173.4159.4148.4139.4132.4126.4120.4116.4112.4108.4105.4102<inoQ *iMUV
0.01.
1.389.4944.4518.4367.4290.4243.4211.4189.4171.4158.4147.4139.4131.4125.4120.4115.4111.4108.4104.4102
0.02.
0.8970.4870.4497.4357.4284.4239.4208.4187.4170.4157.4146.4138.4131.4124.4119.4115.4111.4107.4104.4101
0.03.
0.7331.4807.4478.4348.4278.4236.4206.4185.4168.4156.4146.4137.4130.4124.4119.4114.4110.4107.4104.4101
0.04.
0.6510.4753.4460.4339.4273.4232.4204.4183.4167.4154.4145.4136.4129.4123.4118.4114.4110.4107.4103.4101
0.05.
0.6018.4706.4444.4,531.4268.4229.4202.4181.4166.4153.4144.4136.4129.4123.4118.4113.4110.4106.4103.4100
0.06.
0.5693.4665.4429.4324.4264.4225.4200.4180.4164.4152.4143.4135.4128.4122. 4117..4113.4109.4106.4103.4100
0.07.
0.5457.4628.4414.4316.4260.4222.4197.4178.4163.4151.4142.4134.4127.4122.4117.4113.4109.4106.4103.4100
0.08.
0.5280.4596.4401.4309.4255.4219.4195.4176.4162.4150.4141.4133.4127.4121.4116.4112.4108.4105.4102.4100
0.09.
0. 5142.4568.4389.4302.4251.4216.4193.4174.4160.4149.4140.4133.4126.4121.4116.4112.4108.4105.4102.4099
0.1.
0.5034.4542.4378.42%.4247.4214.4191.4173.4159.4148.4139.4132.4126.4120.4116.4112.4108.4105..4102.4099
DERIVED FORMULAS FOR THIN-EDGED RECTANGULAR WEIRS.
A number of weir formulas have been derived from subsequent analysis or recomputation of the experiments of Francis, Fteley and Stearns, and Bazin, differing more or less from those given by the experimenters.
FTELEY AND STEARNS-FRANCIS FORMULA. a
..... (34)
Correction for end contractions is to be made by the Francis formula; velocity of approach correction by the Fteley and Stearns formulas
ZT=ZM-1.5A, for suppressed weir. ZT=ZH-2.05A, for contracted weir.
HAMILTON SMITH'S FORMULA.*
The base formula adopted is~ 2 (35)
aFteley and Stearns, Experiments on the flow of water, etc.: Trans. Am. Soc. C. E., vol. 12, p. 82. &Smith, Hamilton, Hydraulics, pp. 123-132.
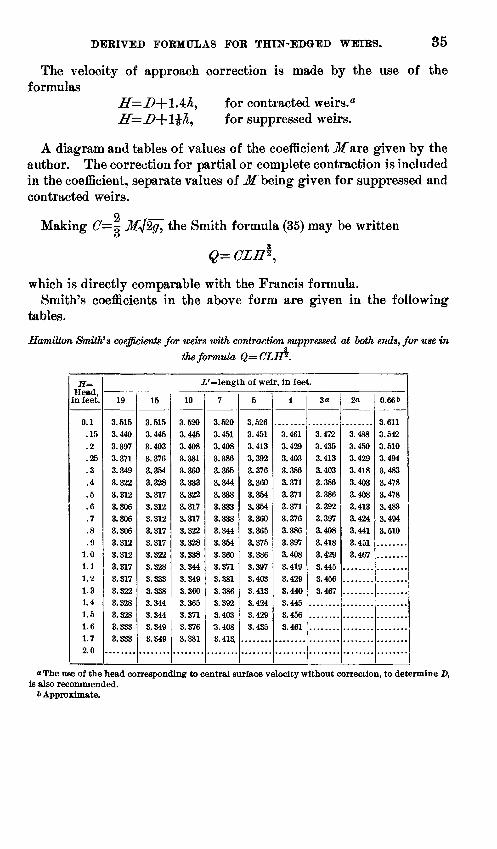
DERIVED FORMULAS FOE THIN-EDGED WEIRS. 35
The velocity of approach correction is made by the use of the formulas
for contracted weirs." for suppressed weirs.
A diagram and tables of values of the coefficient Mare given by the author. The correction for partial or complete contraction is included in the coefficient, separate values of Mbeing given for suppressed and contracted weirs.
2 _Making C=~ M«l%g, the Smith formula (35) may be written o
which is directly comparable with the Francis formula.Smith's coefficients in the above form are given in the following
tables.
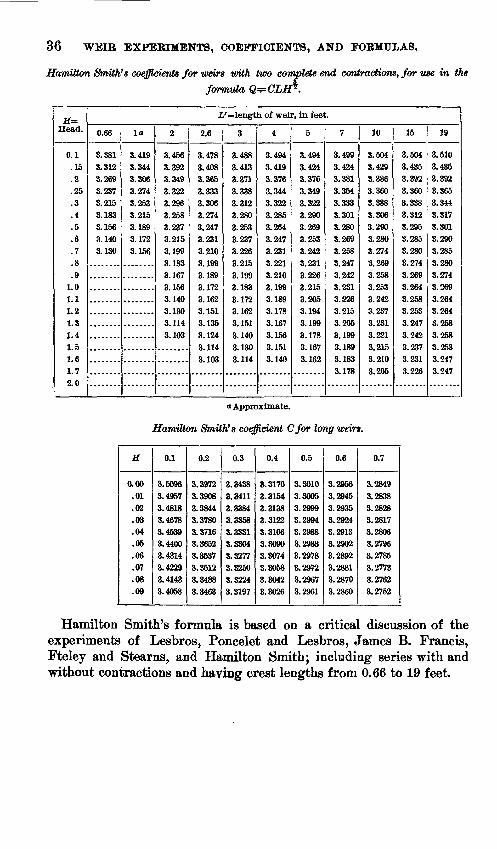
Hamilton Smith's coefficients for weirs with contraction suppressed at both ends, for use inthe formula Q=CLH%.
H= Head,
in feet.
0.1 .15.2.25
.3
.4
.6
.6
.7
.8
.9 1.0 1.1 1.2 1.3 1.4 1.6 1.6 1.7
2.0
i'=length of weir, in feet.
19
3.615 3.440
3.3973.3713.349
3.322
3.3123.3063.3063.306 3.312
3.312 3.317
3.317 3.322 3.328 3.328 3.333
3.333
15
3.615 3.445
3.4033.3763.354
3.328
3.3173.3123.3123.317
3.317 3.322 3.328
3.333 3.338 3.344
3.344 3.349 3.349
10
3.620
3.4463.4083.3813.360
3.333
3.3223.3173.3173.322
3.328 3.338 3.344
3.349 3.360
3.365 3.371
3.376 3.381
7
3.620
3.4513.408
3.3863.365
3.344
3.3383.3333.3383.344 3.354
3.360 3.371
3.381 3.386 3.392 3.403 3.408 3.413,
5
3.626 3.4513.413
3.3923.376
3.3603.3543.3543.360
3.365 3.376
3.386 3.397
3.403
3.413 3.424
3.429 3.435
4
3.4613.4293.403
3.3863. 371
3.3713.3713.3763.386 3.397 3.408
3.419
3.429
3.440 3.445 3.456
3.461
3«
3.472
3.4353.413
3.403
3.3863.3863.392
3.3973.408
3.418 3.429 3.445
3.456
3.467
2<i
3.4883.450
3.4293.4183.403
3.4083.4133.4243.441
3.451 3.467
0.666
3.611 3.542
3.6103.494
3.4833.478
3.478
3.4833.494
3.610
o The use of the head corresponding to central surface velocity without correction, to determine D, is also recommended.
6 Approximate.
36 WEIR EXPERIMENTS, COEFFICIENTS, AND FORMULAS.
Hamilton Smith's coefficients for weirs with two complete end contractions, for use in theformula Q^
Jf=Head.
0.1.15.2.25.3.4.5.6.7.8.9
1.01.11.21.31.41.51.61.72.0
i'=length of weir, in feet.
0.66
3.3813.3123.2693.2373.2153.1833.1563.1403.130
la
3.4193.3443.3063.2743.2533.2153.1893.1723.156.
2
3.4563.3923.3493.3223.2963.2583.2373.2153.1993.1833.1673.1563.1403.1303.1143.103
2.6
3.4783.4083.3653.3333.3063.2743.2473.2313.2103.1993.1893.1723.1623.1513.1353.1243.1143.103
3
3.4883.4133.3713.3383.3123.2803.2533.2373.2263.2153.1993.1833.1723.1623.1513.1403.1303.114
4
3.4943.4193.3763.3443.3223.2853.2643.2473.2313.2213.2103.1993.1893.1783.1673.1563.1513.140
5
3.4943.4243.3763.3493.3223.2903.2693.2533.2423.2313.2263.2153.2053.1943.1993.1783.1673.162
7
3.4993.4243.3813.3543.3333.3013.2803.2693.2583.2473.2423.2313.2263.2153.2053.1993.1893.1833.178
10
3.5043.4293.3863.3603.3S83.3063.2903.2803.2743.2693.2583.2533.2423.2373.2313.2213.2153.2103.205
15
3.5043.4353.3923.3603.3383.3123.2953.2853.2803.2743.2693.2643.2583.2533.2473.2423.2373.2313.226
19
3.5103.4353.3923.3653.3443.3173.3013.2903.2853.2803.2743.2693.2643.2643.2583.2583.2533.2473.247
((Approximate.
Hamilton Smith's coefficient Cfor long weirs.
H
0.00.01.02.03.04.05.06.07.08.09
0.1
3.50963.49573.48183.46783.45393.44003.43143.42293.41433.4058
0.2
3.39723.39083.38443.37803.37163.36523.36373.35123.34883.3463
0.3
3.34383.34113.33843.33583.33313.33043.32773.32503.32243.3197
0.4
8.31703.31543.31383.31223.31063.30903.80743.30583.30423.3026
0.5
3.30103.30053.29993.29943.29883.29833.29783.29723.29673.2961
0.6
3.29563.29453.29353.29243.29133.29023.28923.28813.28703.2860
0.7
3.28493.28383.28283.28173.28063.27963.27853.27733. 27623.2752
Hamilton Smith's formula is based on a critical discussion of the experiments of Lesbros, Poncelet and Lesbros, James B. Francis, Fteley and Stearns, and Hamilton Smith; including series with and without contractions and having crest lengths from 0.66 to 19 feet.
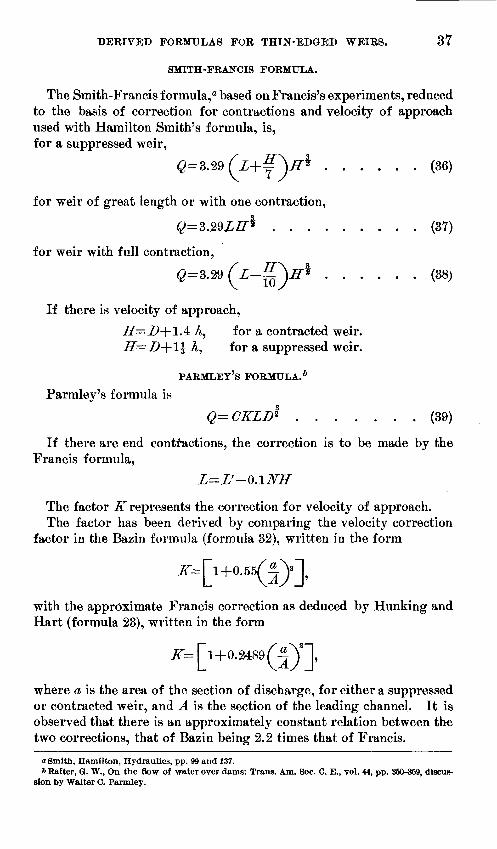
DERIVED FORMULAS FOB THIN-EDGED WEIRS. 37
SMITH-FRANCIS FORMULA.
The Smith-Francis formula, a based on Francis's experiments, reduced to the basis of correction for contractions and velocity of approach used with Hamilton Smith's formula, is, for a suppressed weir,
...... (36)
for weir of great length or with one contraction,
Q=3.29£ff% ......... (37)
for weir with full contraction,
0=8.29 Z-H* ...... (38)
If there is velocity of approach,
II=D+IA h, for a contracted weir. H=D-\-\\ A, for a suppressed weir.
PARMLEY'S FORMULA.* Parmley's formula is
Q=CKLD% ....... (39)
If there are end contractions, the correction is to be made by the Francis formula,
The factor A'' represents the correction for velocity of approach. The factor has been derived by comparing the velocity correction
factor in the Bazin formula (formula 32), written in the form
JT=[I+O.«(£)P],
with the approximate Francis correction as deduced by Hunking and Hart (formula 23), written in the form
where a is the area of the section of discharge, for either a suppressed or contracted weir, and A is the section of the leading channel. It is observed that there is an approximately constant relation between the two corrections, that of Bazin being 2.2 times that of Francis.
a Smith, Hamilton, Hydraulics, pp. 99 and 137.b Rafter, G. W., On the Sow of water over dams: Trans. Am. Soc. G. E., vol. 44, pp. 35&-S59, discus
sion by Walter C. Parmley.

38 WEIR EXPERIMENTS, COEFFICIENTS, AND FORMULAS.
Parmley adopts the Bazin correction and gives the following table, which may also conveniently be applied in computing discharge by Bazin's formula.
The discharge coefficient <7used by Parmley is that for a weir with no velocity of approach, as in the Francis formula. It is not, how ever, constant. Its values have been deduced from a mean curve rep resenting the experiments of Francis, Fteley and Stearns, and Bazin.
Velocity of approach correction, K, Parmley and Bazin formulas.
a A
0.00.01.02.03.04.05.06.07.08.09
0
1.00011.00021.00051.00091.00141.00201.00271.00351.0044
0.1
1.00551.00661.00791.00931.01081. 01241.01411. 01591.01781. 0198
0.2
1.02201.02431.02661.02911.03171.03441.03721.04011.04311.0463
0.3
1.04951.05291.05631.05991.06361.06741.07131. 07531.07941.0837
0.4
1.08801.09251.09701. 10171.10651. 11141.11641.12151. 12671. 1321
0.5
1. 13751. 14311. 14871.15451.16041.16641. 17251. 17871.18501. 1915
Parmley's weir formula, coefficient C.
D, feet.
0.0.1.2.3.4.5.6.7.8.9
1.01.11.21.31.41.51.61.71.81.92.0
0.00
3.5803.4783.4203.3853.3683.3583.3513.3463.3403.3343.3293.3243.3193.3133.3073.3013.2963.2903.2853.280
0.01
3.5683.4713.4163.3833.3673.3573.3513.3453.3393.3343.3283.3243.3183.3123.3063.3013.2953.2903.285
0.02
3.5563.4643.4123.3813.3663.3563.3503.3453.3393.3333.3283.3233.3183.3123.3063.3*003.2953.2893.284
0.03
3.5443.4583.4083.3803.3643.3663.3503.3443.3383.3323.3283.3223.3173.3113.3053.3003.2943.2883.284
0.04
3.5323.4513.4043.3783.3633.3553.3493.3443.3383.3323.3273.3223.3173.3113.3053.2993.2943.2883.283
0.05
3.5203.4443.4003.3763.3623.3643.3493.3433.3373.3323.3263.3223.3163.3103.3043.2983.2933.2883.282
0.06
3.5123.4393.3973.3743.3613.3533.3483.3423 3363.3313.3263.3213.3153.3093.3033.2983.2923.2873.282
0.07
3.5033.4343.3943.3733.3603.3533.3483.3423.3363.3303.3263.3203.3153.3093.3033 2983.2923.2863.282
0.08
3.4953.4303.3913.3713.3603.3523.3473.3413.3353.3303.3253.3203.3143.3083.3023.2973.2913.2863.281
0.09
3.4863.4253.3883.3703.3593.3523.3473.3413.3353.3293.3243.3203.3143.3083.3023.2963.2913.2853.280
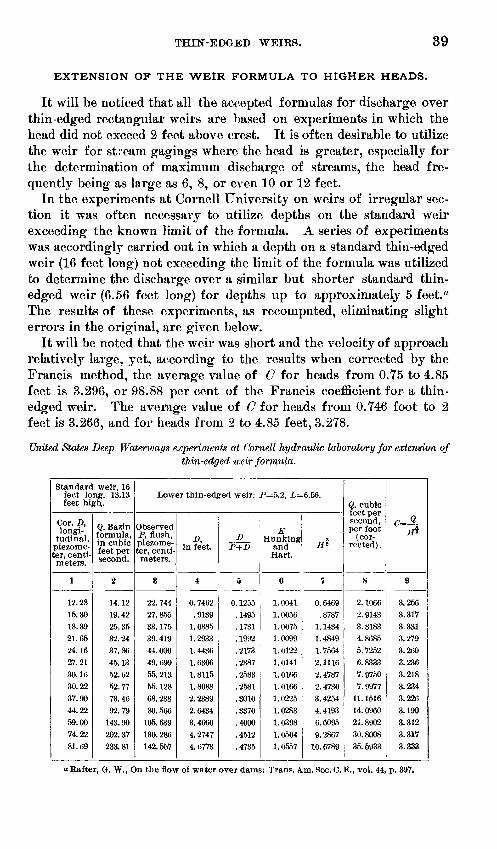
THIN-EDGED WEIRS. 39
EXTENSION OF THE WEIR FORMULA TO HIGHER HEADS.
It will be noticed that all the accepted formulas for discharge over thin-edged rectangular weirs are based on experiments in which the head did not exceed 2 feet above crest. It is often desirable to utilize the weir for stream gagings where the head is greater, especially for the determination of maximum discharge of streams, the head fre quently being as large as 6, 8, or even 10 or 12 feet.
In the experiments at Cornell University on weirs of irregular sec tion it was often necessary to utilize depths on the standard weir exceeding the known limit of the formula. A series of experiments was according^ carried out in which a depth on a standard thin-edged weir (16 feet long) not exceeding the limit of the formula was utilized to determine the discharge over a similar but shorter standard thin- edged weir (6.56 feet long) for depths up to approximately 5 feet. a The results of these experiments, as recomputed, eliminating slight errors in the original, are given below.
It will be noted that the weir was short and the velocity of approach relatively large, yet, according to the results when corrected by the Francis method, the average value of G for heads from O.Y5 to 4.85 feet is 3.296, or 98.88 per cent of the Francis coefficient for a thin- edged weir. The average value of C for heads from O.Y46 foot to 2 feet is 3.266, and for heads from 2 to 4.85 feet, 3.278.
United States Deep Waterways experiments at Cornell hydraulic laboratory for extension ofthin-edged weir formula.
Standard weir, 16feet long, 13.13feet high.
Cor. D, longi
tudinal, piezome ter, centi meters.
1
12.28
15.3018.3921.6524.1627.21
30.1630.2237.9044.2259.0074.22
81.69
Q, Bazin formula, in cubic feet per second.
2
14.1219.42
25. 3532.2437.8645.13
52.6252. 7773.4692.79
143.90202.37
233.81
Lower thin-edged weir: P=5.2, £=6.66.
Observed P, flush, piezome ter, centi meters.
3
22.744
27.85533. 17539. 41944.000
49. 69955. 21355.128
68.23880.566
105.639130. 286142.557
D,in feet.
4
0. 7462.9139
1.08851.2933
1. 44361.63061.8115
1.80882.23892.64343.46604. 27474. 6773
DP+D
a
0. 1255.1495
.1731
.1992
.2173
.2387
.2583
.2581
.3010
.3370
.4000
.4512
.4735
K Hunking
and Hart.
6
1.00411.00561. 00751.00991. 01221. 01411. 01661.01661.02251.0283
1. 03981. 05041.0557
7/i
7
0.6469
.87871. 14341.48491.75642. 1116
2. 47872. 47303.42544.4193
6.60959.2867
10. 6789
Q, cubic
second, per foot
(cor rected) .
8
2. 10662. 91433. 81834.86855. 7252
6. 83337.97507.9977
11. 151614.096021. 8902
30.800835.6933
e~£H§
9
3.2563.3173.3313.2793.260S.2363.2183.234
3.226
3.1903.312
3.3173.333
a Rafter, G. W., On the flow of water over dams: Trans. Am. Soc. C. E., vol. 44, p. 397.
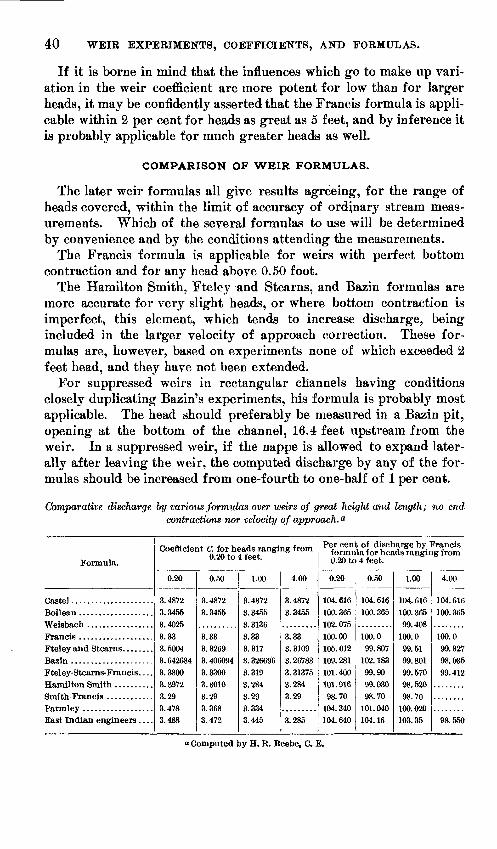
40 WEIR EXPERIMENTS, COEFFICIENTS, AND FORMULAS.
If it is borne in mind that the influences which go to make up vari ation in the weir coefficient are more potent for low than for larger heads, it may be confidently asserted that the Francis formula is appli cable within 2 per cent for heads as great as 5 feet, and by inference it is probabty applicable for much greater heads as well.
COMPARISON OF WEIR FORMULAS.
The later weir formulas all give results agreeing, for the range of heads covered, within the limit of accuracy of ordinary stream meas urements. Which of the several formulas to use will be determined by convenience and by the conditions attending the measurements.
The Francis formula is applicable for weirs with perfect bottom contraction and for any head above 0.50 foot.
The Hamilton Smith, Ftelej^ and Stearns, and Bazin formulas are more accurate for very slight heads, or where bottom contraction is imperfect, this element, which tends to increase discharge, being included in the larger velocity of approach correction. These for mulas are, however, based on experiments none of which exceeded 2 feet head, and they have not been extended.
For suppressed weirs in rectangular channels having conditions closely duplicating Bazin's experiments, his formula is probably most applicable. The head should preferably be measured in a Bazin pit, opening at the bottom of the channel, 16.4 feet upstream from the weir. In a suppressed weir, if the nappe is allowed to expand later ally after leaving the weir, the computed discharge by any of the for mulas should be increased from one-fourth to one-half of 1 per cent.
Comparative discharge by various formulas over weirs of great height and length; no end contractions nor velocity of approach. a
Formula.
Castel.. ...................
Fteley-Steariis-Francis. . . .
East Indian engineers ....
Coefficient C, for heads ranging from 0.20 to 4 feet.
0.20
3. 4872 3.3455 3.4025
3.33 3. 5004 3.642684 3.3800 3. 3972 3.29 3.478 3.488
0.50
3. 4872 3.3455
3.33 3. 3269 3. 406094 3.3300 3. 3010 3.29 3.368 3.472
1.00
3.4872 3. 3455
3. 3136 3.33 3.317 3. 326696 3.319 3.284 3.29 3.334 3.445
4.00
3. 4872
3.3455
3.33 3. 3109 3. 26783 3. 31375 3.284
3.29
3.285
Per cent of discharge by Francis formula for heads ranging from 0.20 to 4 feet.
0.20
104. 616
100.365 102. 075
100.00 105. 012 109.281
101.400 101. 916 98.70
104.340 104.640
0.50
104. 616 100.365
100.0
99.807 102. 183 99.90 99.030 98.70
101.040 104.16
1.00
104. 616
100. 365 99. 408
100.0 99.51 99.801
99.570 98. 520 98.70
100.020
103. 35
4.00
104.616
100. 365
100.0 99. 327 98.035 99.412
98.550
a Computed by H. R. Beebe, C. E.
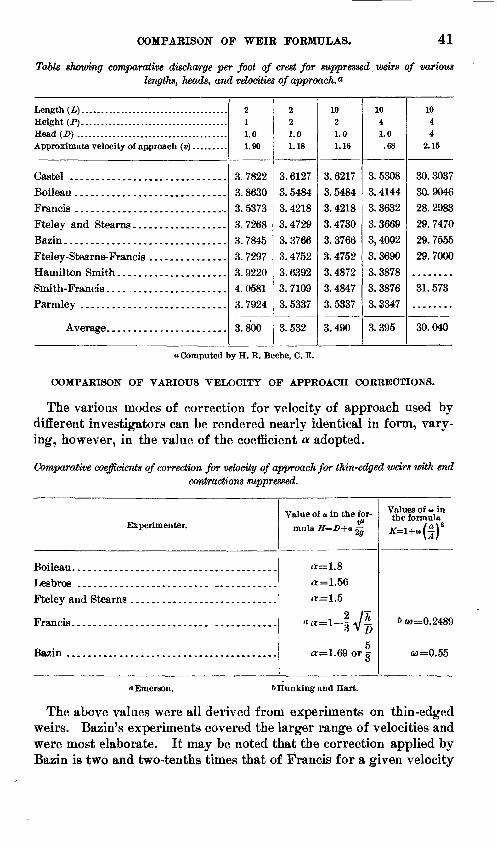
COMPARISON OF WBIK FORMULAS. 41
Table showing comparative discharge per foot of crest for suppressed weirs of various lengths, heads, and velocities ofapproach. a
Height (P). ....................................Head (Z>) ......................................
Castel ..............................Boiieau .............................Francis .............................Ftelev and Stearns........ ..........
Fteley-Stearns-Francis ...............
Smith-Francis .......................
211.01.90
3. 78223.86303. 53733. 72683. 78453.72973. 92204. 05813. 7924
3. 800
221.01.18
3. 61273.54843. 42183.47293.37663. 47523.63923.71093. 5337
3.532
1021.01.16
3. 62173. 54843. 42183. 47303.37663. 47523. 48723.48473.5337
3.490
1041.0
.68
3. 53083. 41443.36323.36693,40023. 36903. 38783. 38763.3347
3.395
1044
2.15
30. 303730.904628. 298329. 747029. 755529.7000
31. 573
30.040
a Computed by H. R. Beebe, C. E.
COMPARISON OF VARIOUS VELOCITY OF APPROACH CORRECTIONS.
The various modes of correction for velocity of approach used by different investigators can be rendered nearly identical in form, vary ing, however, in the value of the coefficient a adopted.
Comparative coefficients of correction for velocity of approach for thin-edged weirs with endcontractions suppressed.
Experimenter.
Boiieau. ......................................Lesbros ......................... ............Fteley and Stearns ............................
Bazin ........................................
Value of o in the for mula H=D+a g-
o:=1.8
a=1.56
«=1.5
«a-l-? J1
5 «=1.69 or Qo
Values of »> in the formula
6 to =0.2489
oo=0.55
Emerson. bHunking and Hart.
The above values were all derived from experiments on thin-edged weirs. Bazin's experiments covered the larger range of velocities and were most elaborate. It may be noted that the correction applied by Bazin is two and two-tenths times that of Francis for a given velocity
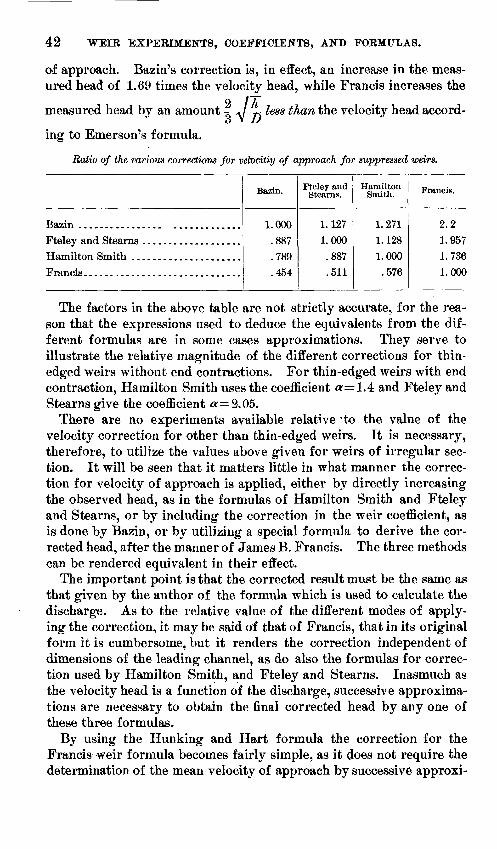
42 WEIR EXPERIMENTS, COEFFICIENTS, AND FORMULAS.
of approach. Bazin's correction is, in effect, an increase in the meas ured head of 1.69 times the velocity head, while Francis increases the
measured head bv an amount - A/-^ less than the velocity head accord-3 V u
ing to Emerson's formula.
Ratio of the various corrections for vetocitiy of approach for suppressed weirs.
Bazin ................ .............Fteley and Stearns ...................Hamilton Smith .....................
Bazin.
1.000.887.789.454
Fteley and Stearns.
1.127
1.000
.887
.511
Hamilton Smith.
1.271
1.128
1.000
.576
Francis.
2.2
1.9571.7361.000
The factors in the above table are not strictly accurate, for the rea son that the expressions used to deduce the equivalents from the dif ferent formulas are in some cases approximations. They serve to illustrate the relative magnitude of the different corrections for thin- edged weirs without end contractions. For thin-edged weirs with end contraction, Hamilton Smith uses the coefficient a=lA and Fteley and Stearns give the coefficient a=2.Q5.
There are no experiments available relative 'to the value of the velocity correction for other than thin-edged weirs. It is necessary, therefore, to utilize the values above given for weirs of irregular sec tion. It will be seen that it matters little in what manner the correc tion for velocity of approach is applied, either by directly increasing the observed head, as in the formulas of Hamilton Smith and Fteley and Stearns, or by including the correction in the weir coefficient, as is done by Bazin, or by utilizing a special formula to derive the cor rected head, after the manner of James B. Francis. The three methods can be rendered equivalent in their effect.
The important point is that the corrected result must be the same as that given by the author of the formula which is used to calculate the discharge. As to the relative value of the different modes of apply ing the correction, it may be said of that of Francis, that in its original form it is cumbersome, but it renders the correction independent of dimensions of the leading channel, as do also the formulas for correc tion used by Hamilton Smith, and Fteley and Stearns. Inasmuch as the velocity head is a function of the discharge, successive approxima tions are necessary to obtain the final corrected head by any one of these three formulas.
By using the Hunking and Hart formula the correction for the Francis weir formula becomes fairly simple, as it <jloes not require the determination of the mean velocity of approach by successive approxi-
COMPARISON OF WEIR FORMULAS. 43
mations, but to apply this formula it is necessary to know the dimen sions of the leading channel and of the weir section. The approxima tion given by Emerson is also much simpler than the original Francis formula.
Bazin's method of including the velocity correction in the coefficient makes the weif coefficients obtained by the experiments comparable one with another only when both the head and velocity of approach are the same in both cases. a His correction also involves the dimen* sions of the leading channel as factors. Obviously, in the case of many broad-crested weirs utilized for measuring flow, the dimensions of the leading channel can not be ascertained accurately and there is great variation of velocity in different portions of the section of ap proach. It becomes necessary that the correction should be in such a form that it is a function of the velocity and not of the channel dimensions.
It is to be noticed that where an attempt has been made in the weir experiments to eliminate velocity of approach effect from the coefficient the velocity has been nearly equalized by screens and has been determined by successive approximations. It is suggested that where the velocities vary widely they be determined by current meter in several subdivisions of the section, the approximate integral kinetic energy estimated, and a value of a selected depending on the
ratio of -r so obtained, where h is the velocity head corresponding to
the mean velocity and h' is the velocity head which would result if the actual velocities were equalized. Inasmuch as the surface velocity usually exceeds the mean velocity in the channel of approach in about the same ratio that h' exceeds h, the suggestion is made by Hamilton Smith 6 that where the velocity of approach is unavoidably variable, or the boundaries of the current are uncertain, the surface velocity vs be measured by floats and applied directly in the determination of the quantity h.
The variations in discharge over a thin-edged weir, by the different formulas, are of ten less than the difference in the correction for velocity of approach would indicate. In the formula of Fteley and Stearns, as compared with Francis, for example, the larger velocity correction is in part compensated by a smaller weir coefficient, and the same is true of the formulas of Hamilton Smith and Bazin for cases where the head is large.
a See special discussion of the point, p. 63. b Smith, Hamilton, Hydraulics, p. 84.
44 WEIR EXPERIMENTS, COEFFICIENTS, AND FORMULAS.
END CONTRACTIONS INCOMPLETE CONTRACTION.
The formula for end contractions deduced by James B. Francis is very generally used. The correction is made to the length of weir, the result obtained being the length of a suppressed weir that will give the same discharge.
L=L'-bNH .............. (40)J> =A coefficient, the value of which, deduced by Francis, is
J=0.1.L'= Actual length of weir crest. L = Length of equivalent suppressed weir crest. N Number of end contractions. H= Effective head, feet.
The experiments of Fteley and Stearns,a while somewhat discordant, indicate an average value of J for heads from 0.3 to 1 foot, of about 0.1. The value of J apparently decreases as the head increases. It also decreases if the end contraction piece is so near the side of the channel as to render the contraction incomplete.
Hamilton Smith shows that side contractions and bottom or crest contraction are mutually related, and that the side width of the chan nel of approach should be at least twice the least dimension of the weir, whether Z or H. Usually L is much greater than ZT, and the side width may be made at least as great as 2ff. The specification of Francis is, side width ^>H. The depth (D) of the leading channel should be at least 2IT.
Smith's rule indicates that to provide complete contraction the area of leading section A must bear a relation to the area of weir section a depending upon the relative head and length of crest.
For two weirs of equal section a the necessary channel-section areas are as follows :
Z' = 12 H=\ a=12 A= 48 Z'= 4 11=3 <z=12 ^4
Hamilton Smith prefers to use separate coefficients for suppressed weirs from those for contracted weirs, the relation between the coeffi cients being expressed by the formula
Op Coefficient for partially suppressed weir, as with complete sup pression on sides and full contraction at bottom.
a Fteley and Stearns, Experiments on the flow of water, etc.: Trans. Am. Soc. C. £., vol. 12, pp. 108-113.
END CONTRACTIONS. 45
Cc = Coefficient for completely contracted weir.JT=Least dimension of weir, whether L or H.R = Wetted perimeter of WQir=L-\-%]T.T = Distance from any side of weir to the respective side of channel,
where there is partial suppression. /S = Length of sides on which there is partial suppression.
Smith's values of contraction coefficient z in formula 31 areY/X z
3 0.000 2 .005 1 .025 i .06 0 .16
The ratio J7 X approximately measures the amount of contraction. aBazin does not give a formula for weirs with end contractions. The
Bazin formula may be applied to weirs in which the height of weir ip,so small that the bottom contraction is partially suppressed. TheBazin coefficient then includes:
1. Effect of contraction from surface curve.2. Effect of crest contraction and its modification by both velocity
of approach and by partial suppression, if any.3. Effect of velocity of approach proper.4. Effect of distribution of velocities in channel of approach.5. Loss of head from friction and eddies.As the Bazin weirs were very low, and these factors go to increase
the correction necessary, it will be seen that the relative!}7 large velocity of approach correction required by Bazin's formula may be readily accounted for.
The experiments of Flinn and Dyer on the Cippoletti weir (see p. 48) indicate that the effect of end contraction may be somewhat greater than that indicated by the Francis formula. Any experiments in which similar volumes of water have been successively passed over weirs with and without end contractions may be utilized to determine the effect of such contractions.
It may be added that a more elaborate study of end contractions is desirable. It is to be borne in mind, however, that to secure greater accuracy in this regard a more complicated or variable correction than that of Francis must probably be used, and the result will be to greatly increase the labor of weir computations in the interest of what is usually a comparatively small matter, the better remedy being prob ably the use of weirs with end contractions suppressed, wherever practicable.
a Smith, Hamilton, Hydraulics, pp. 118-123. Smith's critical discussion of this subject will be found of value in calculating discharge for weirs with partially suppressed contraction eiiher at sides or bottom.
46 WEIR EXPERIMENTS, COEFFICIENTS, AND FORMULAS.
COMPOUND WEIR.
A weir with a low-water notch depressed below the general crest level may sometimes be used to advantage in gaging small, variable streams. The discharge over such a weir, constructed with end con tractions on both sections, can be calculated as for two separate weirs, the lower short section having end contractions for all heads. The flow over the two upper sections is computed as for a suppressed weir.
Such a weir has been used for the determination of the low-water flow of very small streams, for which purpose it is well adapted, the entire stream when at low stages flowing in the central notch, in a stream relatively deep and narrow.
The measurement of very thin sheets of water on a broad weir is subject to peculiar difficulties, including uncertainty of coefficient, adhesion of nappe to weir face, dispersion by winds, and a large per centage error in the results if there is a small error in measuring the head.
TRIANGULAR WEIR.
GENERAL FORMULA.
Referring to fig. 4, we may write
FIG. 4. Triangular weir.
Substituting, in equation (4),
L(H-y)
~ 15 J
THOMSON'S EXPERIMENTS.
(42)
The mean coefficient of contraction for a thin-edged triangular weir deduced experimentally by Prof. James Thomson, of Belfast, is M= 0.617,° the formula being
° ..... (43)
a British Association Report, 1858 (original not consulted). Merriman gives the mean value of M for heads between 0.2 and 0.8 foot as 0.692.
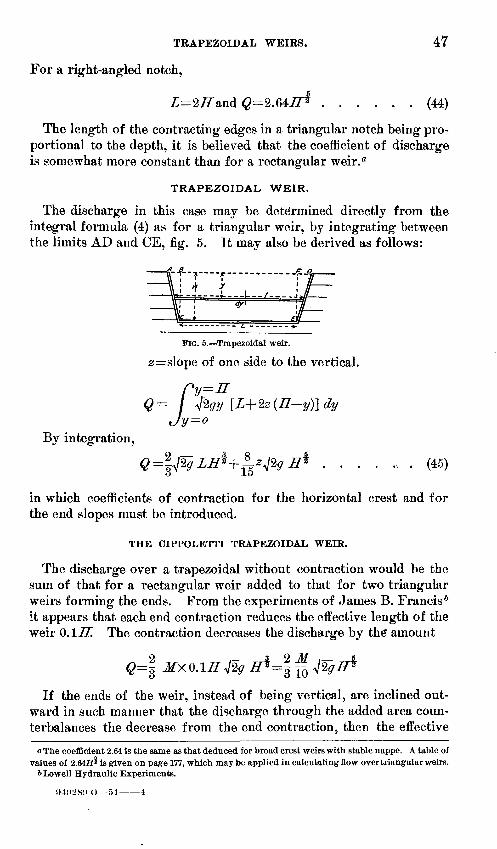
TRAPEZOIDAL WEIRS. 47
For a right-angled notch,
Z=2/fand Q=Z.§±H% ...... (44)
The length of the contracting edges in a triangular notch being pro portional to the depth, it is believed that the coefficient of discharge is somewhat more constant than for a rectangular weir. 0
TRAPEZOIDAL WEIR.
The discharge in this case may be determined directly from the integral formula (4) as for a triangular weir, by integrating between the limits AD and CE, fig. 5. It may also be derived as follows:
?-4-*--\ , ?|: * y__^___i_--/ _
^* /j!,/-<JKI
FIG. 5. Trapezoidal weir.
slope of one side to the vertical.
By integration,
* ...... (45)
in which coefficients of contraction for the horizontal crest and for the end slopes must be introduced.
THE CIPPOLETTI TRAPEZOIDAL WEIR.
The discharge over a trapezoidal without contraction would be the sum of that for a rectangular weir added to that for two triangular weirs forming the ends. From the experiments of James B. Francis 6 it appears that each end contraction reduces the effective length of the weir 0. \H. The contraction decreases the discharge by the* amount
If the ends of the weir, instead of being vertical, are inclined out ward in such manner that the discharge through the added area coun terbalances the decrease from the end contraction, then the effective
« The coefficient 2.64 is the same as that deduced for broad crest weirs with stable nappe. A table of values of 2.64fl^ is given on page 177, which may be applied in calculating flow over triangular weirs.
ftLowell Hydraulic Experiments.
!)4i)2S!) () 51 4
48 WEIR EXPERIMENTS, COEFFICIENTS, AND FORMULAS.
length ot the weir will remain constant as the head increases, the same as in a suppressed weir. The discharge through the end triangle ABC will be, from equation (42),
Where z is the width or base of the end triangle. Equating the two expressions for Q, and solving for 2, we find, assuming M to have the same value in both cases,
*=\H ......... (46)
This condition defines the Oippoletti weir. a
CIPPOLETTl's FORMULA.
Cippoletti derived his formula from a discussion of the experiments of James B. Francis, selecting a coefficient 1 per cent greater, making
#= X 0.629 LHjZgH=Z.ZWLH .... (47)
L is the length of the crest or base of the trapezoid.Flinn and Dyer* experimented at the testing flume of the Holyoke
Water Power Company by passing the same volume of water succes sively over a trapezoidal experimental weir and over the gaging weir of the turbine testing flume 19.7 feet downstream. The latter, it is stated, complied in form with Francis's specifications.
The depths were observed by hook gage; eleven readings, as a rule, being taken and their arithmetical mean used for the determination of a head. The thirty-two series of valid experiments range from 0.3 foot depth on a weir with sill length of 3 feet to a head of 1.25 feet on a sill 9 feet long.
The discharge over the standard weir was calculated by the formulas of J. B. Francis and of Hamilton Smith. The correction for velocity of approach at the experimental weir was made by the formula of Hamilton Smith, for use with contracted rectangular weirs,
Flinn and Dyer's coefficients are as follows:Mean of 32 experiments, C 3.283 Mean after rejecting 5 diminished weights, <7=3.301
In general, the coefficient diminished as the head increased, suggest
ing that the end inclination should slightly exceed -H in the Cippoletti4
weir, to provide complete compensation, and that the end contraction
"First described by Cesare Cippoletti in Canal Villoresi, Modulo per la Dispensa delle Acque, 1887. b Flinn, A. D., and Dyer, C. W. D., The Cippoletti trapezoidal weir: Trans. Am. Soc. C. E., vol. 32,
1894, pp. 9-33.
WEIR GAGING8. 49
coefficient in the trapezoidal weir may be greater than 0.1 H, as used by Francis.
The question is complicated by velocity of approach. For example, had the Francis velocity-correction formula been used by Flinn and Dyer, their values of C would have been larger. As a tentative con clusion it is probable that the application of either the Francis for mula with his velocity-head correction or the Flinn and Dyer coefficient with the Smith velocity correction will, when applied to a Cippoletti weir, give results as accurate as the precision of the coefficients will justify.
REQUIREMENTS AND ACCURACY OF WEIR GAGINGS.
PRECAUTIONS FOR STANDARD WEIR GAGING.
Certain specifications were laid down by James B. Francis as guides in cases where the utmost precision is desired in weir measurements. a The limits of applicability of the weir have been greatly extended since 1852, and some of the uncertainties as to the effect of various modifications of weir construction have been removed.
In general, for standard thin-edged weirs 1. The upstream crest edge should be sharp and smooth.2. The overflowing sheet should touch only the upstream crest
corner.3. The nappe should be perfectly aerated.4. The upstream face of the weir should be vertical.5. The crest should be level from end to end.6. The measurements of head should show the true actual elevation
of water surface above the level of the weir crest.7. The depth of leading channel should be sufficient to provide com
plete crest contractions, and, if they are not suppressed, the width of channel should be sufficient to provide complete end contractions.
8. A weir discharging from a quiet pond is to be preferred. If this is not available, the velocity of approach in the leading channel should be rendered as uniform as possible and correction made therefor by the method employed by the experimenter in deriving the formula.
In order to fulfill these requirements, certain secondary conditions are necessary. The depth on the weir should be measured at a point far enough upstream from the crest to be unaffected by the surface curvature, caused by the discharge.
« Francis, J. B., Lowell Hydraulic Experiments, pp. 133-135.
50 WEIR EXPERIMENTS, COEFFICIENTS, AND FORMULAS.
The distance upstream to the point of measuring the head has been as follows:
Distance upstream from weir to gage used by various experimenters.
Experimenter.
Poncelet and Lesbros. .................................
Francis. ........................... ..................Hamilton Smith, jr. ...................................Fteley and Stearns ....................................Bazin ............ ......j. ............................
Date.
1828
1834
1852
1874-1876
1878
1886
Distance upstream, in
feet.
11.48
11.48
6.00
7.60
6.00
16.40
Six feet upstream from crest is a distance frequently used, but this may be insufficient for suppressed weirs, and also for those having irregular cross sections or upstream slopes. Boileau considered the origin of the surface curvature to be at a distance from the weir equal to about 2.5 times the height of crest above the bottom of the channel of approach, indicating that for a suppressed weir the head should be measured at least this distance from the crest. a For a weir dis charging from a still pond the head can be measured at any consider able distance from the weir. Hamilton Smith 6 states that, for weirs with full contraction, II can be measured at any convenient point from 4 feet to 10 feet from the crest.
The head may be measured directly by a graduated scale or hook gage, or by means of a piezometer tube having its orifice flush with the side wall of the leading channel, and at right angles to the direc tion of flow of the water.
The depth of the leading channel in Francis's experiments was 4.t> feet below crest, and Francis lays down the rule that the depth of the leading canal should be at least three times the head on the weir. Hamilton Smith fixes the minimum depth of the leading channel below the crest at 2/7".
Fteley and Stearns c state that the depth of the leading channel below weir crest should be at least 0.5 foot, in order that correction for velocity of approach may be reliably made for depths occurring in their measurements, and that a greater depth of leading channel is to be preferred.
To provide complete end contractions, Francis states that the dis tance from the side of the channel of approach to the end of the weir overflow should be at least equal to the depth on the weir. Hamilton
oTteley and Stearns, Experiments on the flow of water, etc.: Trans. Am. Soc. C. E., vol. 12, p. 47. & Smith, Hamilton, Hydraulics, pp. 129-131. c Ibid., pp 112-114.

WEIR GAGINGS. 51
Smith considers that the distance from the end of the weir to the side of the channel should be at least 2J7, and that the depth of channel below crest, also the side distance, should in no case be less than 1 foot. Francis further specifies that the length of weir crest should be at least three times the depth of overflow. The nappe should not be allowed to expand laterally immediately below a suppressed weir.
In order that the nappe may be perfectly aerated, Francis considers that the fall below crest level on the downstream side should be not less than $ff, increasing for very long weirs or in cases where the downstream channel is shallow. He found, frowever, no perceptible difference in the discharge for a head of 0.85 foot, whether the water on the downstream side was 1.05 feet or 0.0255 foot below crest level. Fteley and Stearns and Hamilton Smith agree that, if the water is
o.oa'
Crest 4.6 above main channel
FIG. 6. Sections of the Francis weir. A, General section of weir; B, detail of crest.
deep below, it may rise to crest level on downstream side of weir without sensible error, and Fteley and Stearns add that a weir may be submerged to a depth of 15 per cent of the head without an error exceeding 1 per cent.
The thickness of crest lip is immaterial so long as the edge is sharp and square and the nappe cuts free and is freely aerated. The latter conditions require, however, that the crest shall be thin, especially where the head is slight.
Fig. 6 shows cross sections of the crest of the weir used by James B. Francis at the Lower Merrimac locks at Lowell, in 1852, in deriving his formula. The crest consisted of a cast-iron plate 13 inches wide and 1 inch thick, planed true and smooth on all surfaces. Its upper
52 WEIE EXPERIMENTS, COEFFICIENTS, AND FORMULAS.
edge was chamfered on the downstream side at an angle of 45° to a thickness of 0.25 inch at the edge. As shown, the nappe cut clear from the top of the crest in an unbroken sheet. The lowest head used by Francis was over 0.5 foot. For ¥eiy low heads the crest lip should be thinner. A wooden crest tends, by capillary attraction, to cause the nappe to adhere to the flat top surface under low heads. A wooden crest is cheap, easily adjusted, and convenient for tempo rary use, but it will, in time, tend to become somewhat rounded, reducing the vertical contraction of the nappe.
A cast-iron crest will usually have to be made to order. A large steel angle bar may often be obtained from stock sizes of the rolling mills more cheaply. Such a bar, with legs, say 3 and 6 inches, respectively, with the 6-inch flat face planed and its edge trued, will form a rigid and permanent crest. The 3-inch leg may be bolted to the top of the timbers forming the body of the weir.
It may be added that approximate corrections for rounding of upstream corner of the crest, inclination of the weir upstream or downstream, or incomplete contractions can be made from data now available. In constructing gaging weirs preference, however, should be given to those forms which render the determination of the dis charge the most simple, and the extent to which the preceding speci fications may be departed from judiciously will depend upon the exi gencies of the case and the purposes for which the results are desired.
PLANK AND BEAM WEIRS OF SENSIBLE CREST WIDTH.
Experiments on weirs with crest boards 1, 2, or 4 inches in thickness were made by Blackwell, Fteley and Stearns, and Bazin. The results show that for depths exceeding 1.5 to 2 times the crest width the nappe will break free, and if properly aerated the coefficient will then be identical with that for a thin-edged weir.
When the nappe adheres to the crest the coefficients are very uncer tain for such weirs, adhesion of nappe to downstream face of crest and modified aeration entering to give divergent values.
The precise stage at which the change from an adhering to a free nappe or the reverse occurs is not constant, but varies with velocity of approach and with rate of change of the head as the changing point is approached, being different for a sudden and for a gradual change, and also when the point of change is approached by an increasing as com pared with a decreasing head.
REDUCTION OF THE MEAN OF SEVERAL OBSERVATIONS OF HEAD.
In measuring a constant volume of water, several observations of the head on the weir are desirable, the accuracy of the result, according to the theory of least squares, being proportional to the square root of the number of observations.
WEIE GAGINGS. 53
In weir experiments it is often impossible to maintain a perfectly uniform head or regimen. If the variations are minute the arithmet ical mean may be used directly. If the variations are of wider range, or if the utmost precision is required, the following correction formula of Francis may be applied : a
Let Z>j, Dz , Z>3 , etc., Dn represent the several successive observedheads.
Let £15 £j, £3 , etc., tn represent the corresponding intervals of timebetween the several observations.
Let T represent their sum, or the total time interval. $=the total volume of water flowing over the weir in the time T. 2)=the mean depth on the weir that would discharge the quantity
Q in the time T. Z=the length of weir crest. C the weir coefficient.
We have, very nearly,
Q=% OLD* +*+¥2> 2i
Also,
Equating, eliminating the common factor CL, and solving for Z>, we have
(4:8)
EFFECT OF ERROR IN DETERMINING THE HEAD ON WEIRS.
Consider the formula
Q= CLH%.
Differentiating, we have
= GL^HdH.
The error of any gaging when H-\-dH\s, taken as the head instead of the true head H being used will be dQ, and the ratio of this quan tity to the true discharge Q will be
This formula will give nearly the correct value of the error if the increment dH approaches an infinitesimal.
« Francis, J. B., Low ell Hydraulic Experiments, p. 113.&Rafter, G. W., On the flow of water over dams: Trans. Am. Soc. C. E., vol. 44, p. 686; data here
given based on discussion by Walter C. Parmley.
54 WEIR EXPERIMENTS, COEFFICIENTS, AND FORMULAS.
In the following table is shown the effect of errors of one thou sandth, five thousandths, one hundredth, and five hundredths foot, respectively, for various heads. This clearly illustrates both the necessity of proper care and the folly of ultra precision in measuring the relatively large values of H with which we are mainly concerned. The curves of error on PI. II are equilateral hyperbolas, which have been reduced to straight lines by plotting on logarithmic scales.
Percentage error in discharge resulting from various errors in the measured head on weirs.
Head, in feet.
0.1
.51.0
5.0
10.0
Error in measured head, in feet.
0.001
Per cent.
1.5
.3
.15
.03
.015
0.005
Per cent.
7.5
1.5
.75
.15
.075
0.01
Per cent.
15
3
1.5
.3
.15
0.05
Per cent.
15
7.5
1.5
.75
An error of a half-tenth foot under 5 feet head causes the same error in the result as an error of one-half hundredth foot with a head of one-half foot.
In weir experiments it is important to know the effect of an error in head IT on the resultant coefficient of discharge C. The error in C is evidently equivalent to the error in Q found above, where H is constant.
ERROR OF THE MEAN WHERE THE HEAD VARIES.
In determining the volume of flow over dams where gaging records are kept, the method usually pursued has been to have readings taken twice daily, as at morning and evening, showing the depth flowing over the crest of the dam. The average of the two readings for each day has been found and the volume of flow corresponding to this average head has been taken as the mean rate of flow over the dam for the day.
It is evident, however, that as the discharge varies more rapidly than the head (usually considered to be proportional to the three-halves power of the head), the volume of discharge obtained as above described will be somewhat less than the amount which actually passes over the dam. The following analysis has been made to show the magnitude of the error introduced by using the above method.
Assuming that the initial depth on the crest of the dam is zero, but increases at a uniform rate to Hz at the end of a time interval T, the
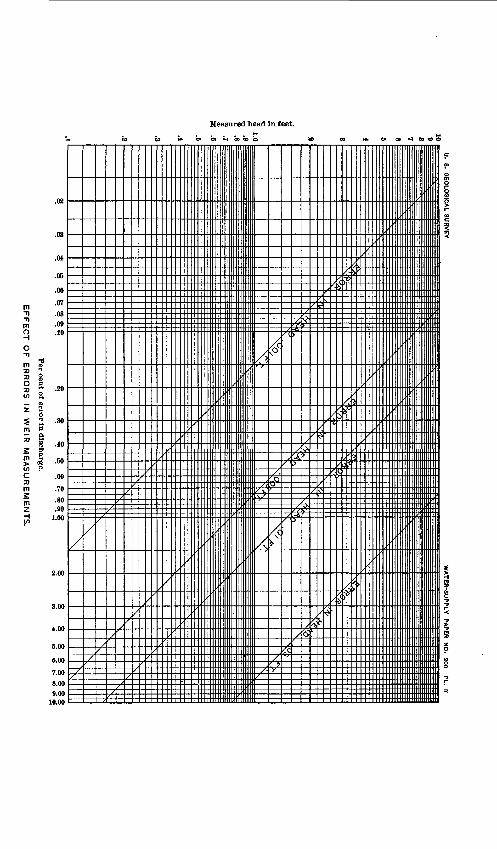
U.
S.
GE
OL
OG
ICA
L S
UR
VE
YW
AT
ER
-SU
PP
LY
P
AP
ER
N
O.
200
PL
. II
1.05
-9 g
.8
S
g
S
S
S S
Sg
g S
SS
8
88
88
88
8oo
*« ia
(0t^
ooo>
c»
Per ce
nt o
f erro
r In discharge.
EF
FE
CT
O
F
ER
RO
RS
IN
W
EIR
M
EA
SU
RE
ME
NT
S.
WEIR G AGINGS. 55
mean head deduced from observations at the beginning and end of the period would be £ J?g, the head at any time t would be
H=ftwhere f is a constant. 3
We may write the usual formula for weir discharge Q CLH* ; then, if the head varies from zero to H^ the total volume of flow in the time Twill be
(50)
.... (51)
The ratio of the discharge is
The total discharge corresponding to the average head - Hz is
Volume by average head _ Qa.v _ \ *J _ Q 054.0 Actual volume ~~ Qt ~ 2
5
or, True discharge =1.13 X discharge by average head.This percentage of error is the same whatever may be the maximum
head (77a), and whether the stream is rising or falling, provided the initial head is zero. If there is an initial depth H^ flowing over the dam, the error from computing the discharge by the mean head will decrease as the ratio H^\HZ increases.
In case the head increases uniformly, and the total discharge Ql is taken from the average of the initial and terminal discharges, and if
then
If the discharge increases at a uniform rate, then the true mean dis charge will be, of course,
&+&2
Conditions similar to those above discussed occur at milldams during the season of low water, when the pond is allowed to fill up at night and the water is drawn down to crest level or below during the day when the mills are running. In some cases the inflow to the pond is nearly uniform and the head and discharge increase at a diminishing
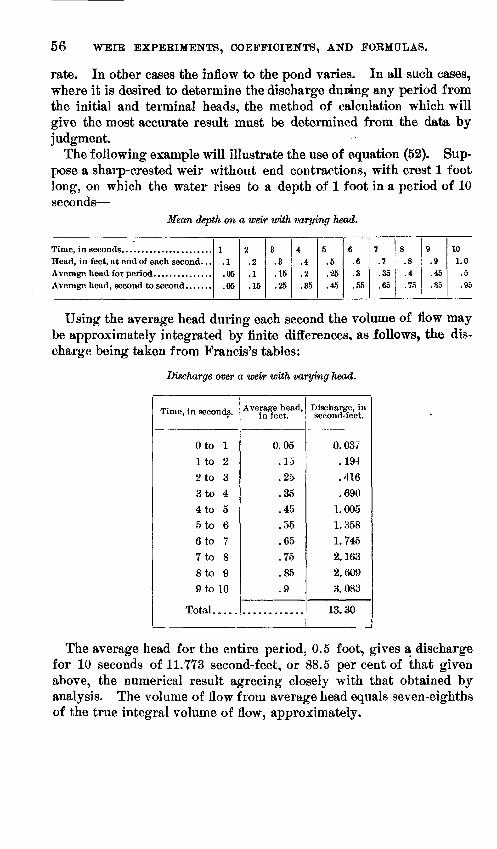
56 WEIR EXPERIMENTS, COEFFICIENTS, AND FORMULAS.
rate. In other cases the inflow to the pond varies. In all such cases, where it is desired to determine the discharge duisang any period from the initial and terminal heads, the method of calculation which will give the most accurate result must be determined from the data by judgment.
The following example will illustrate the use of equation (52). Sup pose a sharp-crested weir without end contractions, with crest 1 foot long, on which the water rises to a depth of 1 foot in a period of 10 seconds
Mean depth on a weir vrith varying head.
Head, in feet, at end of each second. . . Average head for period ...............
1.1.05.05
2.2 .1.15
3.3 .15.25
4.4 .2.35
5.5 .25.45
6.6 .3.55
7.7 .35.65
8.8 .4.75
9.9 .45.85
101.0 .5.95
Using the average head during each second the volume of flow may be approximately integrated by finite differences, as follows, the dis charge being taken from Francis's tables:
Discharge over a weir with varying head.
Time, in seconds.
Oto 1
1 to 2
2 to 3
3 to 4
4 to 5
5to 6
6 to 7
7 to 8
8 to 9
9 to 10
Total.....
Average head, in feet.
0.05
.13
.25
.35
.45
.55
.65
.75
.85
.9
Discharge, in second-feet.
0.037.194
.416
.690
1.005
1.358
1.745
2.163
2.609
3.083
13.30.1
The average head for the entire period, 0.5 foot, gives a discharge for 10 seconds of 11.773 second-feet, or 88.5 per cent of that given above, the numerical result agreeing closely with that obtained by analysis. The volume of flow from average head equals seven-eighths of the true integral volume of flow, approximately.
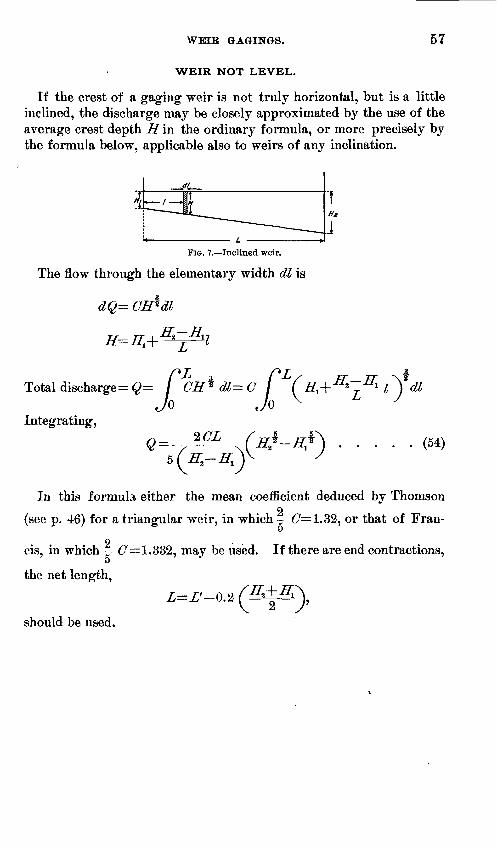
WEIR GAGIUTGS. 57
WEIR NOT LEVEL.
If the crest of a gaging weir is not truly horizontal, but is a little inclined, the discharge may be closely approximated by the use of the average crest depth IT in the ordinary formula, or more precisely by the formula below, applicable also to weirs of any inclination.
FIG. 7. Inclined weir.
The flow through the elementary width dl is
dQ= CH^dl
±1
Total discharge =Q=
Integrating,
dl=C
(54)
In this formula either the mean coefficient deduced by Thomsono
(see p. 4:6) for a triangular weir, in which - (7=1.32, or that of Frail-u
2 cis, in which O = 1.332, may be used. If there are end contractions,
O
the net length,
Z=Z'-0.2
should be used.
58 WEIR EXPERIMENTS, COEFFICIENTS, AND FORMULAS.
The discharge using the average head,
«~ 2 is
(55)
The extent of variation from the true discharge resulting from the use of formula (55) in place of the integral formula (54) is illustrated by the following:
Let Z=10 feet, ffa=1.0 foot, | (7=1.332.
Discharge by (55) for average head =33. 30 cubic feet per second. If HJ-. 77^=0.01 foot true discharge, $=33.30 cubic feet per second. If H<n Hi= 0.10 foot true discharge, $=33.30 cubic feet per second. If H^ H^ 0.50 foot true discharge, $=33.54 cubic feet per second.
In general, since the discharge varies more rapidly than the head, the effect of calculating the discharge from the average head will be to give too small discharge, the error increasing with the variation in crest level.
Hence the discharge obtained by using the average crest level for a weir having an inclined or uneven crest will be somewhat deficient. The magnitude of the variations in height of the crest will determine whether the average profile can be used or whether the crest should be subdivided into sections, each comprising portions having very nearly the same elevation (whether adjacent or not), and the discharge over each section computed as for a separate weir.
In general it may be stated that the error in the value of Ql increases directly in proportion as the ratio of the difference in the limiting heads to the average head is increased.
CONVEXITY OF WATER SURFACE IN LEADING CHANNEL.
If there are wide variations in velocity in the measuring section, the level of the water surface may be affected, since water in motion exerts less pressure than when at rest.
Conditions of equilibrium cause the swift-moving current to rise above the level of the slower-moving portions. If the head is meas ured near still water at the shore, the result may be slightly too small.
The difference in height ° may be expressed in the form,
(56)
The coefficient r is often assumed equal to unity, but evidently varies with the distribution of velocities whose resultant effect it measures.
a Humphreys and Abbot, Physics and Hydraulics of the Mississippi River, 1876, p. 320.
WEIR EXPERIMENTS, COEFFICIENTS, AND FORMULAS. 59
RESULTS OF EXPERIMENTS ON VARIOUS FORMS OF WEIRCROSS SECTIONS.
THE USE OF WEIRS OF IRREGULAR SECTION.
Many cases arise where it is desired to estimate, approximately, at least, the flow over dams of peculiar cross section.
The construction of so-called standard or thin-edged weirs that shall be permanently useful to measure the flow of large and variable streams is so difficult and expensive as to be frequently impracticable. Existing milldams often afford a convenient substitute. In the following pages are presented the results of the leading experiments to determine proper coefficients for '' irregular" weirs, followed by a grouping of experiments on similar models, whether all by one experi menter or not. The data are not always as complete or consistent as could be desired, but the need for fair,working coefficients is very great, and, in the line of making use of all the available information, the several diagrams of comparison and the conclusions therefrom are presented, with the understanding that these are not final, although it is quite certain that the laws of coefficient variation are correctly out lined by the data at present available, and they form, therefore, a safe working hypothesis.
Weir models of irregular section are calibrated in order that exist ing dams of similar cross section may be used for stream gaging. It becomes necessary to calibrate the experimental models for a wider range of heads than has commonly been employed in experiments on standard thin-edged weirs, in order that the range of rise and fall of the stream from low water to high may be included.
While the recent experimental data include heads as great as from 4 to 6 feet, yet it is often necessary to determine the discharge for still greater heads, and experiments on certain forms with heads up to 10 or 12 feet are needed.
In this connection the greater relative facility of securing accurate results with weirs for high than for low heads may be noted.
The proportional error resulting from variations in crest level, as well as uncertainties as to the nappe form and consequent value of the coefficient, largely disappear as the head increases. The effect of form of crest and friction is also relatively diminished. It is probably true that the coefficients for many ordinary forms of weir section would tend toward a common constant value if the head were indefinitely increased. The above facts render milldams especially useful for the determination of the maximum discharge of streams. Dams can be used for this purpose when the presence of logs and drift carried down by the flood preclude the use of current meters or other gaging instruments.
60 WEIR EXPERIMENTS, COEFFICIENTS, AND FORMULAS.
MODIFICATIONS OF THE NAPPE FORM.
The elaborate investigations of Bazin relative to the physics of weir discharge set forth clearly the importance of taking into consideration the particular form assumed by the nappe. This is especially true in weirs of irregular section in which there is usually more opportunity for change, of form than for a thin-edged weir. In general the nappe may
1. Discharge freely, touching only the upstream crest edge.2. Adhere to top of crest.3. Adhere to downstream face of crest.4. Adhere to both top and downstream face.5. Remain detached, but become wetted underneath.6. Adhere to top, but remain detached from face and become wetted
underneath.7. In any of the cases where* the nappe is "wetted underneath" this
condition may be replaced by a depressed nappe, having air imprisoned underneath at less than atmospheric pressure.
The nappe may undergo several of these modifications in succession as the head is varied. The successive forms that appear with an increasing stage may differ from those pertaining to similar stages with a decreasing head. The head at which the changes of nappe form occur vary with the rate of change of head, whether increasing or decreasing, and with other conditions.
The law of coefficients may be greatly modified or even reversed when a change of form takes place in the nappe.
The effect of modifications of nappe form on various irregular weir sections is shown in PI. III. The coefficients are those of Bazin and include velocity of approach. The coefficient curve for any form of weir having a stable nappe is a continuous, smooth line. When the nappe becomes depressed, detached, or wetted underneath during the progress of an experiment, the resulting coefficient curve may consist of a series of discontinuous or even disconnected arcs terminating abruptly in "points cParret" where the form of nappe changes. The modifications of nappe form are usually confined to comparatively low heads, the nappe sometimes undergoing several successive changes as the head increases from zero until a stable condition is reached beyond which further increase of head produces no change. The condition of the nappe when depressed or wetted underneath can usually be restored to that of free discharge by providing adequate aeration.
The weir sections shown in PI. Ill are unusually susceptible of changes of nappe form. Among weirs of irregular section there is a large class for which, from the nature of their section, the nappe can assume only one form unless drowned. Such weirs, it is suggested, may, if properly calibrated, equal or exceed the usefulness of the thin-edged
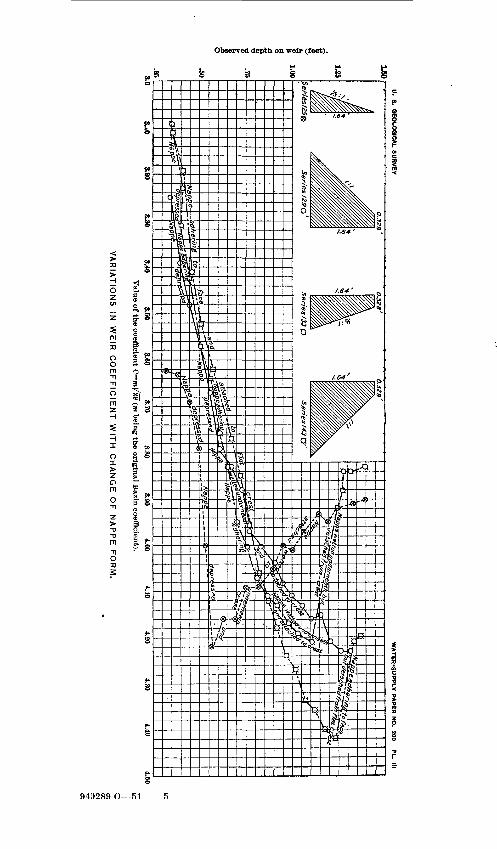
U.
8. G
EOLO
GIC
AL S
UR
VE
Y
3.4
03.40
3.50 3.60
3.70 3.80
3.90 1.00
Valu
e of th
e coefficient C=7B
/2iF(TO
bein
g th
e orig
inal B
azln coefficient).
VA
RIA
TIO
NS
IN
W
EIR
C
OE
FF
ICIE
NT
W
ITH
C
HA
NG
E
OF
N
AP
PE
F
OR
M.
WEIRS OF IRREGULAR SECTION. 61
weir for purposes of stream gaging, because of their greater stability of section and because the thin-edged weir is not free from modifica tion of nappe form for low heads.
As an example, Bazin gives the following coefficients applying to a thin-edged weir 2.46 feet high, with a head of 0.656 foot, under various conditions:
Condition of nappe.
Free discharge, full aeration .....................
Nappe wetted undei-neath, do wr stream water level, 0.42 foot below crest. ....................
Nappe adhering to downstream face of weir, res-
Bazin coeffi cient m.
0.433
.460
.497
.554
C=mV2g
--3.47
3.69
3.99
4.45
Per cent of the Francis coefficient.
104.1
110.7
119.7
133.5
These coefficients include velocity of approach effect, which tends to magnify their differences somewhat. There is, however, a range of 25 per cent variation in discharge between the extremes. 0
The departure in the weir coefficient from that applying to a thin- edged weir, for most forms of weirs of irregular section, results from some permanent modification of the nappe form. Weirs with sloping upstream faces reduce the crest contraction, broad-crested weirs cause adherence of the nappe to the crest, aprons cause permanent adherence of the nappe to the downstream face.
EXPERIMENTAL DATA FOR WEIRS OF IRREGULAR CROSSSECTION.
The only experiments on irregular or broad-crested weirs in which the discharge has been determined volumetrically are those of Black- well on weirs 3 feet broad, of Francis on the Merrimac dam, and of the United States Geological Survey for lower heads, on various forms of section. So far as the writer is aware, all other such experiments have been made by comparison with standard weirs.
In the following pages are included the results of the experiments of Bazin on 29 forms of cross section; also those of the United States Deep Waterways Board under the direction of George W. Rafter, and those of John R. Freeman at Cornell University hydraulic laboratory. The results of 20 series of experiments, chiefly on weirs with broad and ogee crest sections, made under the writer's direction at Cornell Uni versity hydraulic laboratory, are here for the first time published.
a Bazin's general discussion of the above and other modifications of the coefficient has been trans lated by the writer, and may be found in Rafter's paper, On the flow of water over dams: Trans. Am. Soc. C. E., vol. 44, pp. 254-261.
62 WEIE EXPEBIMENTS, COEFFICIENTS, AND FOBMULAS.
As it has been necessary to reduce the experimental data to a uni form basis for purposes of comparison the original data, together with the results obtained by recalculation, have been included for the Bazin, United States Deep Waterways, and Freeman experiments.
BASE FORMULA FOB DISCHARGE OVEK WEIRS OF IRREGULAR CROSS
SECTION.
Precedent to the opening of the hydraulic laboratory of Cornell University the most elaborate experiments on weirs of irregular cross section were those of Bazin. His experiments were all reduced in such manner as to include the velocity of approach correction in the discharge coefficient.
In America the formula most commonly used is that adopted by James B. Francis, in which velocity of approach is eliminated from the coefficient by correcting the head, thus reducing the conditions as nearly as possible to the basis of no velocity of approach before apply ing the formula.
In order to render Bazin's results comparable with the later experi ments, it has been necessary to adopt a standard or base formula to which all the experiments should be reduced. The considerations lead ing to the adoption of the formula of Francis here used are given below.
In the process of gaging streams at dams the head is usually measured in comparatively still water in an open pond. This condi tion could not be duplicated in the Cornell experiments. As the formula of James B. Francis is most simple in form for the case of a weir with no velocity of approach, and as it is often convenient to compare the discharge over a dam with that for a thin-edged weir of standard form, a weir formula of the base form used by Francis has been adopted in reducing the experiments. In this formula,
Q= CLH*.Z, Length of crest corrected for end contractions, if any.^=Head on weir crest corrected for velocity of approach by
the Francis correction formula or an equivalent method.C= A coefficient determined from experiments on a model dam.
In this connection it may be remarked that the formula of Bazin includes the correction for velocity of approach in the weir coefficient; hence the coefficient for a given weir is comparable only with that for another weir under the same head when the velocity of approach is the same in both cases. Bazin's formula also expresses the velocity of approach implicitly by means of the depth and breadth of the leading channel. In actual gagings the leading channel is often of irregular form, hence it becomes necessary to eliminate the depth and breadth of the channel from the formula.

WEIRS OF IRREGULAR SECTION. 63
There is considerable variation in the magnitude of the correction for velocity of approach used by different experimenters. As a rule, the velocity of approach is negligible at gaging stations at dams. It became necessary, therefore, in reducing these experiments to deter mine from the measured discharge and observed head what the head would have been had the same discharge taken place over a weir in a still pond. To accomplish this the formula for correction for velocity of approach adopted by James B. Francis has been used. This being the case, it is to be noted that in applying the coefficients, which, as given, have been reduced as nearly as possible to the basis of no velocity of approach, the same method of velocity correction must be used, and if it is used no error will result where the actual velocitjr of approach is nearly the same as that which occurred in the experiments.
BAZIN'S EXPERIMENTS ON WEIRS OF IRREGULAR CROSS SECTION.
These include a wide variety of forms, many of which will seldom be found in America, and the use of which for purposes of gaging would be ill advised.
The small size of the models used, high velocity of approach, and narrow range of heads covered, limit the application of these results. No effort has been made to present all the results in this paper. a Cer tain series, useful for comparison, have been recomputed as described below, and by grouping similar sections we may determine the gen eral effect of various slope and crest modifications.
BAZIN'S CORRECTION FOR VELOCITY OF APPROACH.
The base formula for weir discharge adopted by Bazin and the method of taking into account the velocity of approach are described in connection with his experiments on thin-edged weirs (p. 31).
The following discussion shows the complex character of the Bazin coefficients, and the fact that they do not express directly the relative discharging capacity of weirs of irregular section.
The effect of velocity of approach is to increase the discharge at a given observed head, Z>, over what it would be if the same head were measured in still water, as in a deep, broad pond.
Bazin's coefficients in the form published are not readily applicable in practice to weirs of other heights, or to weirs in ponds, or otherwise to any but weirs in restricted channels of the depth and width of the weir.
a For complete original data, see Bazin, as translated by Marichal and Trautwine in Proc. Engineers Club Phila., vol. 7, pp. 259-310; vol. 9, pp. 231-244, 287-319; vol. 10, pp. 121-164; also numerous experi ments reduced to English unite by Rafter and others, Trans. Am. Soc. C. E., vol. 44, pp. 220-398.
64 WEIR EXPERIMENTS, COEFFICIENTS, AND FORMULAS.
The Bazin coefficients as published may be considered as- compris ing two principal factors. M being the Bazin coefficient, we may write
M=FC.F= velocity of approach effect. C contraction effect.
Bazin uses a correction formula for velocity of approach, derived from the expression
JT=D+I.W |^ orD+ah.
Consider a standard weir and experimental weir both of the same height, but of different form, the measured depth being the same, and the Bazin coefficients being M and m, the velocity of approach and discharge Trand v and Q and #, respectively, and C and C( the coeffi cients in a formula in which the velocity of approach correction is eliminated from the coefficient and applied to the head; then the dis charge for the standard weir would be,
using the Bazin coefficients,
Q=MLD J1&b=
where M'= J/~V 2g and Z=1.0;
using the coefficient C,
taking roots
D~D+ah'
Bazin does not give the quantities of flow in the tables of results of his experiments, hence to determine h it is necessary to calculate Q. v, and h from the known values M and D and from P, the height of weir.
D being the same for both the standard and the experimental weirs, we have for the experimental weir
(7j being the coefficient for the experimental weir, and h^ the velocity head.
WEIRS OF IRREGULAR SECTION. 65
Hence, by multiplication,
D_ D
and
_Ci(D+(-£}<xh 7I/ 7J \ V °y
or
m_C,,
The velocity of approach for a given depth on a weir is proportional to (7, hence, since h is proportional to -y8 , we have
Hence,
/ Sf\* \*_ SI / -r\ . / Vl \ T \
(57)
The ratio -^ used by Bazin is not, therefore, precisely a measure ofthe relative discharging capacities of the two weirs under similar con ditions of head and velocity of approach, for the reason that the velocity of approach will not be the same for both weirs if the Bazin coefficients are different. The ratio mlM is made up of two factors, one of which, Oj C, expresses the absolute relative discharging capaci ties of the two weirs under similar conditions of head and velocity of approach, and the other expresses the effect of the change in discharg ing capacity on the velocity of approach for a given depth on a weir of given height.
Thus the coefficient J^for any weir has, by Bazin's method of reduc tion, different values for every depth and for every height of weir that may occur.
C For reasons elsewhere stated it is preferred to express by -^ only^i
the relative discharging capacities of the weirs where the velocity of approach is the same in both. It is then practically a measure of the vertical contraction of the nappe, and is constant for a given head for any height of weir, and may be sensibly constant for various depths on the weir.
66 WEIB EXPERIMENTS, COEFFICIENTS, AND FORMULAS.
RECOMPUTATION OP COEFFICIENTS IN BAZIN's EXPERIMENTS.
In reporting the results of his experiments on weirs of irregular section, Bazin gives the observed heads on the standard weir of com parison, the absolute coefficient m applying for each depth on the experimental weir and the ratio mlMoi the experimental and standard weir coefficients.
The results give coefficients which strictly apply only to weirs having both the same form of section and the same heights as those of Bazin. Although weirs of sectional form geometrically similar to Bazin's are common, yet few actual weirs have the same height as his. There appear to be two elements which may render inaccurate the applica tion of Bazin's absolute coefficients to weirs of vary ing height: (1) The difference in velocity of approach; (2) the difference in contraction of the nappe for a higher or lower weir.
In order to render the results of Bazin's experiments comparable one with another and with later experiments, a number of series have been recomputed, the velocity of approach being treated in the same manner as in the computation of experiments at Cornell hydraulic laboratory.
The method is outlined below, the references being to the tables of Bazin's experiments given on pages 68 to 81.
Column 2 gives the observed head reduced to feet for the experi mental weir. _
Column 4 the absolute coefficient C^m ^2g.(These have been reduced from Bazin's original tables.)Column 5 gives the discharge per foot of crest over the experimental
weir calculated by the formula
Q=mLD
quantities in column 3 being taken directly from a table of three-halves powers.
In column 6 the actual velocity of approach, v=- pjf_ is given, y8
and in column 7 the velocity head, li «-.
The discharge over the standard weir was calculated by Bazin by using his own formula and velocity of approach correction. He does not give the discharge, however, and we have been obliged to work back and obtain it from the data given for the experimental weir.
Having determined the actual discharge and the observed head, we are now at liberty to assume such a law of velocity of approach cor rection in deducing our new coefficients as we choose. We will there fore deduce the coefficients in such form that when applied to a weir
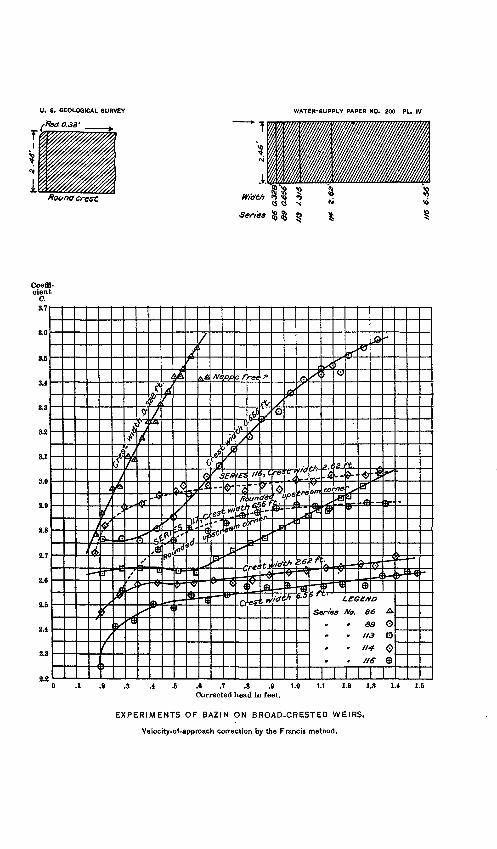
U. S. GEOLOGICAL SURVEY
rRect.0.33' ____
WATER-SUPPLY PAPER NO. 200 PL. IV
Round crest
Series
.3 .4 .6 .7 .8 .9 1.0 Corrected head In feet.
1.1 1.8 1.3 1.* 1.5
EXPERIMENTS OF BAZIN ON BROAD-CRESTED WEIRS.
Velocity-of-approach correction by the Francis method.
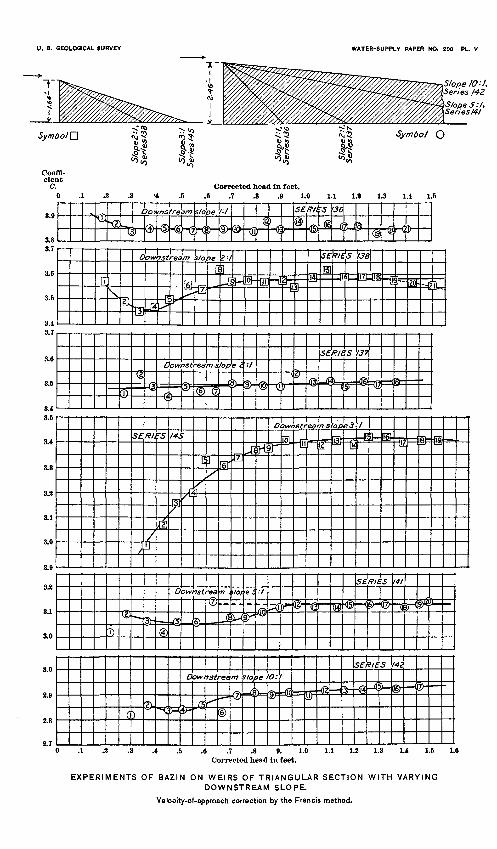
U. S. GEOLOGICAL SURVEY WATER-SUPPLY PAPER NO. 200 PL. V
Corrected head In feet. .6 .7 .8 .9 1.0 1.1 1.2 1.3 1.1 1.5
EXPERIMENTS OF BAZIN ON WEIRS OF TRIANGULAR SECTION WITH VARYINGDOWNSTREAM SLOPE.
Velocity-of-approach correction by the Francis method.
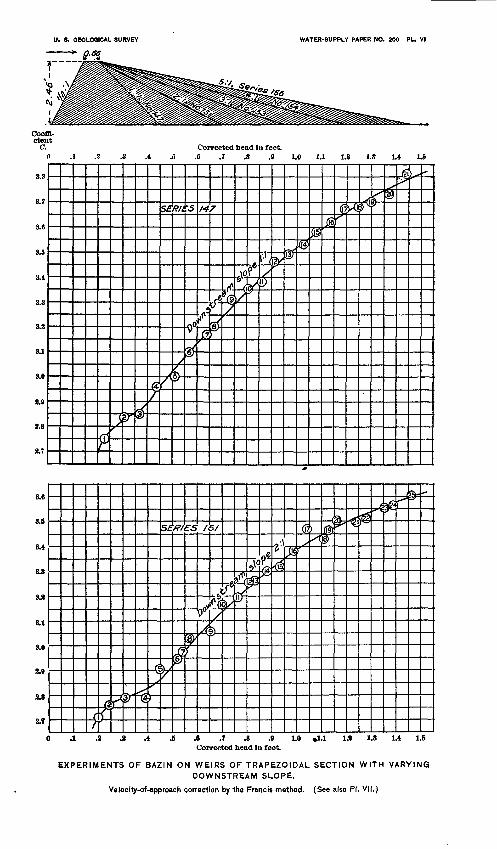
U. 8. GEOLOGICAL SURVEY WATER-SUPPLY PAPER NO. 200 PL. VI
Coeffi cient
C. Corrected head in feet. .1 .2 .3 A .5 .6 .7 .8 .9 1.0 1.1 1.2 1.3 1.1 1.5
Sf/?/£V5 147 @Xp
sc3>
<&
SERIES
30? ^
0 .1 .2 .2 .4 .6 .6 .7 .8 .9 1.0 «1.1 1,9 1.3 1.1 1.5Corrected head in feet.
EXPERIMENTS OF BAZIN ON WEIRS OF TRAPEZOIDAL. SECTION WITH VARYINGDOWNSTREAM SLOPE.
Velocity-of-approach correction by the Francis method. (See also PI. VII.)
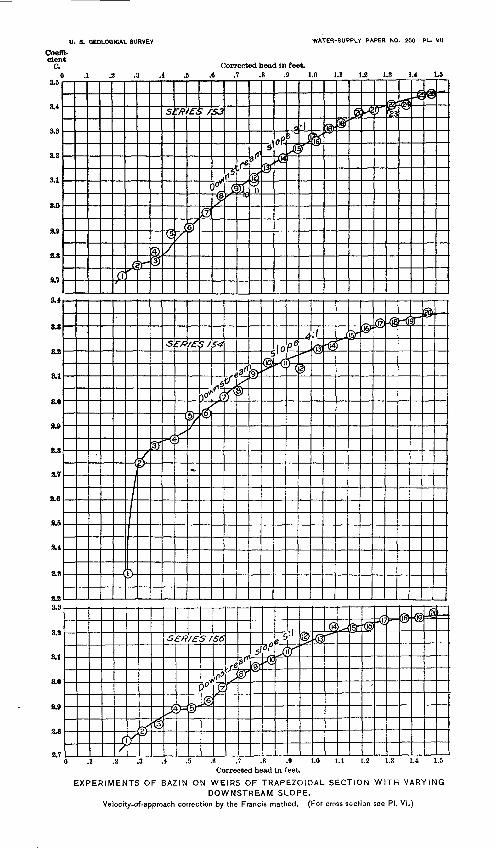
U. S. GEOLOGICAL SURVEY
Coeffi cient
C.0 .1 .2 .3 .4 .5
WATER-SUPPLY PAPER NO. 200 PL. VII
Corrected head in feet. .6 .7 .8 .9 1.0 1.1 1.3 1.3 1.4 1.5
V'
c<
I
1=[-
fn
(
n
./
?)
3f
sJ
(a/
5
~Q
/
if/?
I
tf
/£-.
'
»
' /
{
0
S/.
I0'
|<*S
y sfy\2/
5
^
Efi
^
/£S /
lu '
&
5o
f«
^\
^-LillC"^
54
^
U
ip
56
fiY
IW
3^Lf's»-
ir
,^c?
0
-1J®"
6
0
V
^
-Adj
\°\
^
'/ '
A
Q&
<' C
'&
1d
7
>
^--
d
^
^r
//?%
o
-^
(3+^*
JT#
V
*?r
^
£!£
tjejl
r
/^
gr
4
L
g3|
J_N^r
© <i
Jf>
g
a
jfc i
0 .1 .2 .3 .4 .5 .6 .7 .8 .9 1.0 1.1 1.8 1.3 1.4 1.5 Corrected head in feet.
EXPERIMENTS OF BAZIN ON WEIRS OF TRAPEZOIDAL SECTION WITH VARYING DOWNSTREAM SLOPE.
Ve ocity-of-approach correction by the Francis method. (For cross sect on see PI. VI.)
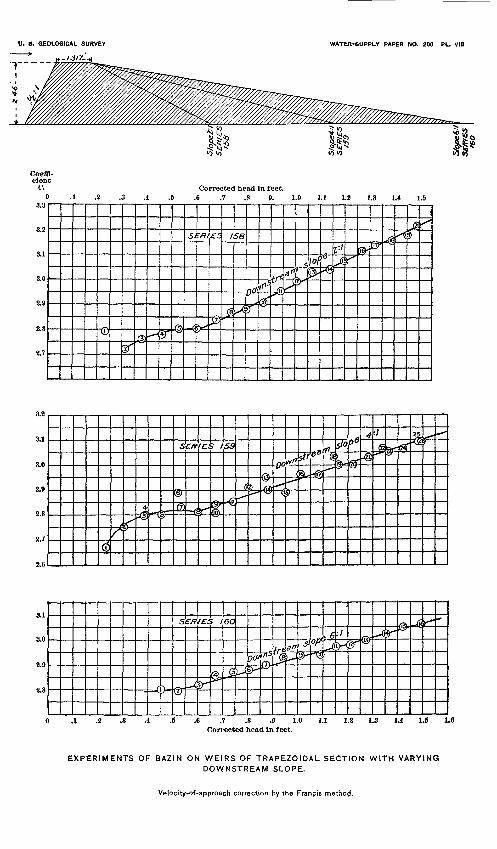
U. S. GEOLOGICAL SURVEY
' -J.3I7-
WATER-SUPPLY PAPER NO. 200 PL. VIII
Coefl cien
C. (
3.3
3.2
3.1
3.0
2.9
2.8
2.7
1- t
Corrected head In feet. .1 .2 .3 .4 .5 .6 .7 .8 9. 1.0 1.1 1.2 1.3 1.4 1.5
(aV
.--- ff" ©
s
-(
7?
X
£S
&
t
(je
58
/<r*
00!^
<i^
*»=«
X®
1
1-5 /Of
£H<i
*>£
l'\
AYfir
p-^H ^r
^
0 .1
EXPERIMENTS OF BAZIN ON WEIRS OF TRAPEZOIDAL SECTION WITH VARYING
DOWNSTREAM SLOPE.
Velocity-of-approach correction by the Francis method.
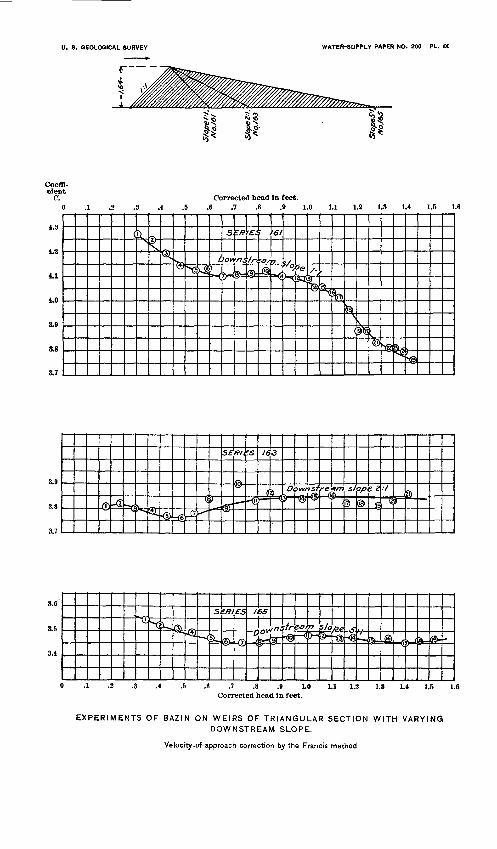
U. 8. GEOLOGICAL SURVEY WATER-SUPPLY PAPER NO. 200 PL. IX
Coefl cien
C.
4.3
4.2
4.1
4.0
3.9
as
S.7
i-t
Corrected head in feet. ) .1 .8 .3 .4 .5 .6 .7 .S .9 1.0 1.1 1.8 1.3 1.4 1.5 1
M-X^
Oj,(&>
1xSt
) 1 ^
s
?OM
| 1
'"J
^
r£T^
//-<
ft
'
ar
&
'61
a^£»e&J
^_j2_fLJOWL
1fa
feS
(^i&
fe>M^ ?
© _<|^ is: ® =d ci
«
\^~
"j
~*
5f
«F
/?/i
rT?Ji_
^^
:s
^!l
16
(T
3
2)H
^P-
y wf ©
7St <&
rgt%"
|
si
b°f®
52
(is.7
*?h
^ ;^ dt <
Sl
L
= /?/
(§>-
£3
®
/
2
S5
O^>=
-in,
M^
r\5/0r" /eeL~^L^ (16)
HS M St- fl>-
1 .8 .3 .4 .5 .6 .7 .8 .9 1.0 1.1 1.8 1.3 1.4 1.5 1.6 Corrected head in feet.
EXPERIMENTS OF BAZIN ON WEIRS OF TRIANGULAR SECTION WITH VARYING
DOWNSTREAM SLOPE.
Velocity-of-approach correction by the Francis method
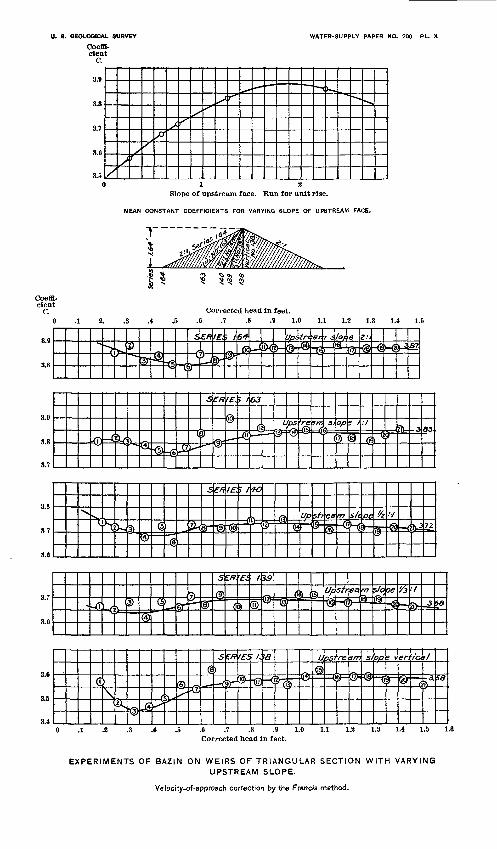
U. 8. GEOLOGICAL SURVEY WATER-SUPPLY PAPER NO. 200 PL. X
Coefi den
C.
3.9
3.8
3.7
3.6
3.5
1-t
//^
/
/*/
s /'^ r* f** < )-~.
-^ ^
Slope of upstream face. Run for unit rise.
MEAN CONSTANT COEFFICIENTS FOR VARYING SLOPE OF UPSTREAM FACE.
.7 .8 .9 1.0 1.1 1.2 1.3 1.4 1.5
sex f£.> 163
Upstr op
V,X,
I>> 3>® _^
)
$
&
3
er
£fi
W
/£.
tycb
? /
_
40
*pp &Up
TgJ-
+
shW-
eafa'
17
-t"
S/t
Npe*-
'/z
w- /
<& U72
J\-
$(*)
^L- zr ^ s>
s
ffihi /,
(U)
39
_" KJ
, 13) ^J
yy^//
<iea
?-s/c ex?
<l
'/3 f
?">- -1 I8
i i \ I I i i i I |-^-i I i r- Z'K'8 Upstream s/on,; vertical
EXPERIMENTS OF BAZIN ON WEIRS OF TRIANGULAR SECTION WITH VARYING UPSTREAM SLOPE.
Ve locity-of-approach correction by the Francis method.
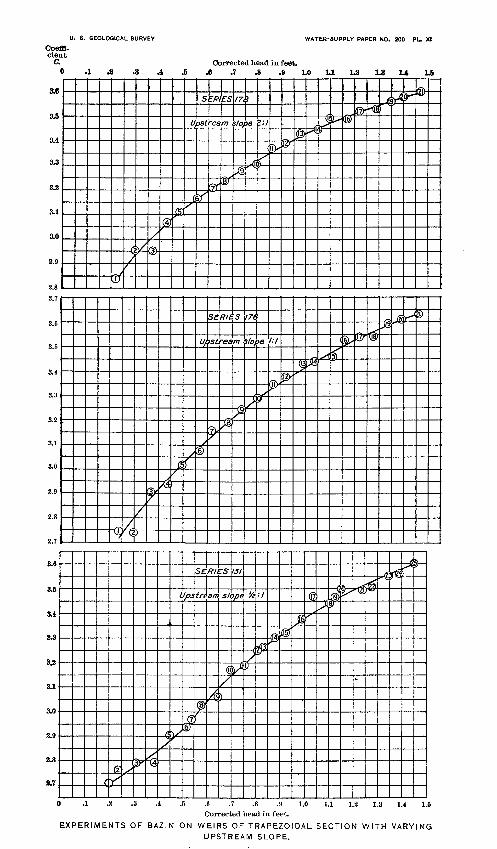
U. S. GEOLOGICAL SURVEY WATER-SUPPLY PAPER NO. 200 PL. XI
Coeffi cient
0.0 .1
Corrected head in feet. .3 - A Jo £ .7 .8 .9 LO LI 13 L4 L6
_/JJ
f/
(
^
@
Y
y
^
/CD
(5)(^
/
)
/&
Ty7
^
y
/3|
ff
c/
i
n
^
,y
ES
44-f>sifes/77
t<
H
D
/»
("7^)
Sf
tr±
(p)/
?r BJ
ISF
S/
r^^
« /,
an.
A
/?/£
H
>S
75
S/
k/)
/7
S/0/
f®
5
/77
^
5/
/°*
^
8
oe
jf.<
Z:l
V
|176
\
i/ope
/
'/e
f-
,
:/
_flj
TV
1:1
y$
(PD**
&
'0-
&
$s>
^^
M
^
La
(TO
^
y^i>
*4
^
^
^
^
Am9
^
«
&
"d
rtli
^
-4-^4§C!
r
jS Jfi
dr &
\)>r
_**wSJ>-
) .1 .2 .3 .4 .5 .6 .7 .8 .9 1.0 1.1 1.2 1.3 1.4 1.5Corrected head in feet.
EXPERIMENTS OF BAZIN ON WEIRS OF TRAPEZOIDAL SECTION WITH VARYINGUPSTREAM SLOPE.
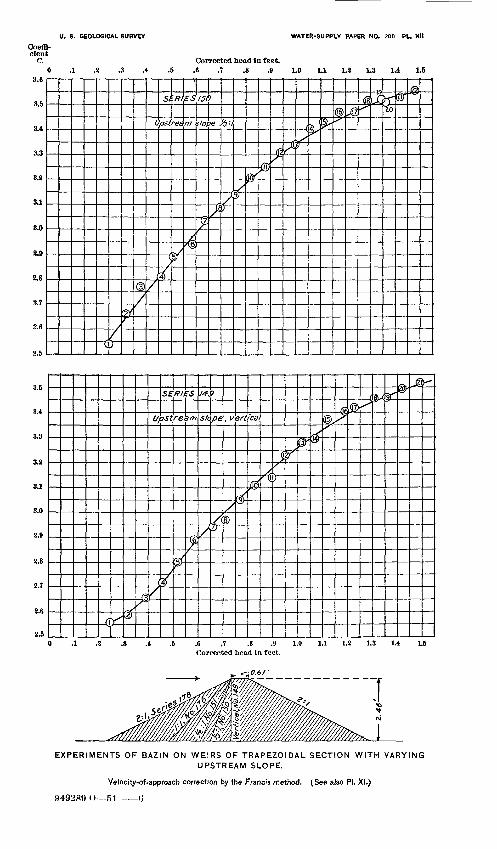
U. 8. GEOLOGICAL SURVEY WATER-SUPPLY PAPER NO. 200 PL. XII
Coeffi cient
C. Corrected head in feet.0 .1 .2 .3 .4 .5 .6 .7 .8 .9 1.0 1.1 1.8 1.3 1.4 1.5
SERIES 150
L ostree m ;/ope*>
h
4
®z
Y
skpe
'O
2
fi0 .1 .2 .3 ,4 .5 .6 .7 .8 .9 1.0 1.1 1.2 1.3 1.4 1.5
Corrected head in feet.
EXPERIMENTS OF BAZlN ON WEIRS OF TRAPEZOIDAL SECTION WITH VARYING UPSTREAM SLOPE.
Velocity-of-approach correction by the Francis method. (See also PI. XI.)
94928!) O 51 (J
WEIRS OF IRKEGULAB SECTION. 67
in which there is velocity of approach we may apply the correction formula of Francis,
A sufficient approximation to this formula for our present purposes may be obtained if we simply make
where v is the velocity of approach corresponding to the trial dis charge for the head D, no successive approximations being made, as would be necessary to determine the true head If by the Francis cor rection formula.
For example, in an extreme case, using a thin-edged weirS 33 ^--^ 1.665
whence f!=Z>+-= 1.0481,
and #=3.547.By the Francis correction formula we find, using three successive
approximations,&=3.5183 giving v= 1.7591#2 =3.5387 giving v= 1.7694#3=3.541 as the final discharge,
that the difference is 0.11 of 1 per cent. We are therefore justified in using this method to determine values of C'to two places decimals, or to within one-fourth to one-half per cent.
We have also used ^2^=8.02, as in the reduction of the Cornell experiments.
Column 8 gives the corrected head,
H=D+h.
Column 10 gives the final coefficient C deduced by the formula
0--&-"-** Pis. IV to XII show the resulting discharge coefficients.
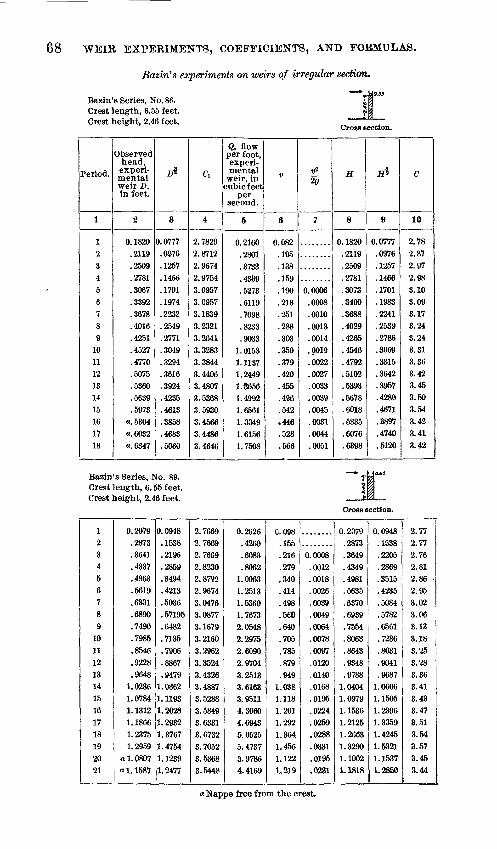
68 WEIB EXPERIMENTS, COEFFICIENTS, AND FORMULAS.
Bazin's experiments on weirs of irregular section.
Bazin's Series, No. 86. Crest length, 6.55 feet.Crest height, 2.46 feet.
Cross section.
Period.
1
12
345
6789
101112131415
161718
Observedhead,experi mentalweir D,in feet.
2
0.1820.2119.2509
.2781
.3067
.3392
.3678
.4016
.4251
.4527
.4770
.5075
.5360
.5639
.5973a. 5304
a. 6032a. 6347
tf
3
0.0777
.0976
.1257
.1466
.1701
.1974
.2232
.2549
.2771
.3049
.3294
.3616
.3924
.4235
.4613
.3858
.4683
.5060
Ci
4
2. 78292. 8712
2.96742.9754
3.09573. 09573.18393.23213.2641
3.32883.38443.44063.4807
3.53683.59303.4566
3.44863.4646
Q, flowper foot,experimental
weir, incubic feet
persecond.
5
0.2160
.2801
.3733
.4369
.5273
.6119
.7098
.8233
.90331. 01531. 11371.24491.86561.49921.65611.33491. 61561.7508
V
6
0.082.105
.138
.159
.190
.218
.251
.288
.303
.350
.379
.420
.455
.496
.542
.446
.528
.566
& 20
7
0.0006.0008.0010
.0013
.0014
.0019
.0022
.0027
.0033
.0039
.0045
.0031
.0044
.0051
H
8
0.1820
.2119
.2509
.2781
.3073
.3400
.3688
.4029
.4265
.4546
.4792
.5102
.5393
.5678
.6018
.5335
.6076
.6398
ffi
9
0.0777
.0976
.1257
.1466
.1701
.1983
.2241
.2539
.2786
.3069
.3315
.3642
.3957
.4280
.4671
.3897
.4740
.5120
C
10
2.78
2.872.97
2.98
3.103.093.173.243.24
3.313.363.423.453.50
3.54
3.423.41
3.42
Bazin's Series, No. 89. Crest length, 6. 55 feet. Crest height, 2.46 feet.
Cross section.
123456789101112131415161718192021
0.2079.2873.3641.4337.4963.5619.6331.6890.7490.7985.8546.9228.9648
1.02361.07841. 13121.18661.23751.2959
a 1.0807a 1. 1587
0.0948.1538.2196.2859.3494.4213.5036.57195.6482.7135.7906.8867.9479
1.03621. 11931.20281.29321. 37671.47541.12391.2477
2.76692. 76692.76C92.82302. 87922.96743.04763.08773. 16793.21603.29623.35243. 43263.48873.52883.58493.63313. 67323. 70523.53683.5448
0.2626.4260.6083.8062
1.00631. 25131.53601.76732.05482. 29752.60902.97043.25133.61633. 95114.30604.69435.05255. 47373.97864.4169
0.098.155.216.279.340.414.498.560.640.705.785.879.949
1.0381.1181.2011.2921.3641.4561.1221.219
0.0008.0012.0018.0026.0039.0049.0064.0078.0097.0120.0140.0168.0195.0224.0259.0288.0331.0195.0231
0. 2079.2873.3649.4349.4981.5635.6370.6939.7554.8063.8643.9348.9788
1.04041.09791.15361. 21251.26631. 32901.10021.1818
0.0948.1538.2205.2869. 3515.4235.5084.5782.6661.7236.8031.9041.9687
1.06061.15061.23961.33591.42451.53211.15371.2850
2.772.772.762.812.86 2.953.023.063.133.183.253.283.363.413.433.473.513.543.573.453.44
a Nappe free from the crest.
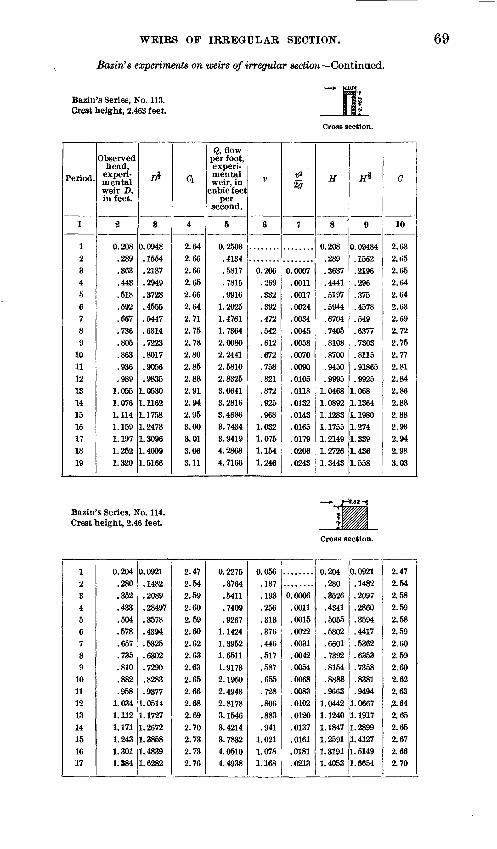
WEIES OF IBBEGCLAB SECTION.
Bazin's experiments on weirs of irregular section Continued.
Bazin's Series, No. 113. Crest height, 2.463 feet.
69
Cross section.
Period.
1
123456789
10111213141516171819
Observed head,
experi mental weir D, in feet.
2
0.208.289.363.443.518.592.667.736.805.863.936.989
1.0551.0761.1141.1591.1971.2521.320
I*
3
0.0948.1554.2187.2949.3728.4555.5447.6314.7223.8017.9056.9835
1.0530I. 11621.17581.24781.30961.40091.5166
d
4
2.642.662.662.652.662.642.712.752.782.802.852.882.912.942.953.003.013.063.11
Q, flow per foot, experi mental weir, in
cubic feet per
second.
5
0.2503.4134.5817.7815.9916
1.20251. 47611.73642.00802.24412.58102.83253.06413. 28163.46863.74343.94194.28684.7166
V
6
0.206.269.332.392.472.542.612.672.758.821.872.925.968
1.0321.0751.1541.246
tfl 20
7
0.0007.0011.0017.0024.0034.0045.0058.0070.0090.0105.0118.0132.0143.0165.0179.0206.0243
H
8
0.208.289.3637.4441.5197.5944.6704.7405.8108.8700.9450.9995
1.04681.08921.12831. 17551. 21491.27261.3443
fl*
9
0.09484.1562.21%.296.375.4578.549.6377.7303.8115.91865.9925
1.0681.13641.19801.2741.3391.4361.558
C
10
2.632.652.652.642.642.632.692.722.752.772.812.842.862.882.882.932.942.983.03
Bazin's Series, No. 114. Crest height, 2.46 feet
Cross section.
1234567891011121314151617
0.204.280.352.433.504.578.657.735.810.882.958
1.0341.1121.1711.2431.3011.884
0.0921.1482.2089.28497.3578.4394.5325.6302.7290.8283.9377
1.05141. 17271. 26721.38581.48391.6282
2.47
2 14 * tr±
2.592.602.592.602.622.632.632.652.662.682.692.702.732.732.76
0.2275.3764.5411.7409.9267
1.14241. 39521.65111.91732.19502.49432. 81783.15463.42143. 78324.05104.4938
0.056.137.193.256.313.376.446.517.587.655.728.806.883.941
1.0211.0781.168
0.0006.0011.0015.0022.0031.0042.0054.0068.0083.0102.0120.0137.0161.0181.0213
0.204.280.3526
, .4341.5055.5802.6601.7392.8154.8888.9663
1.04421.12401.18471.25911. 31911.4053
0.0921.1482.2097.2860.3594.4417.5362.6353.7358.8381.9494
1.06671. 19171.28991.41271.51491.6654
2.472.542.582.592.582.592.602.592.602.622.632.642.652.652.672.662.70
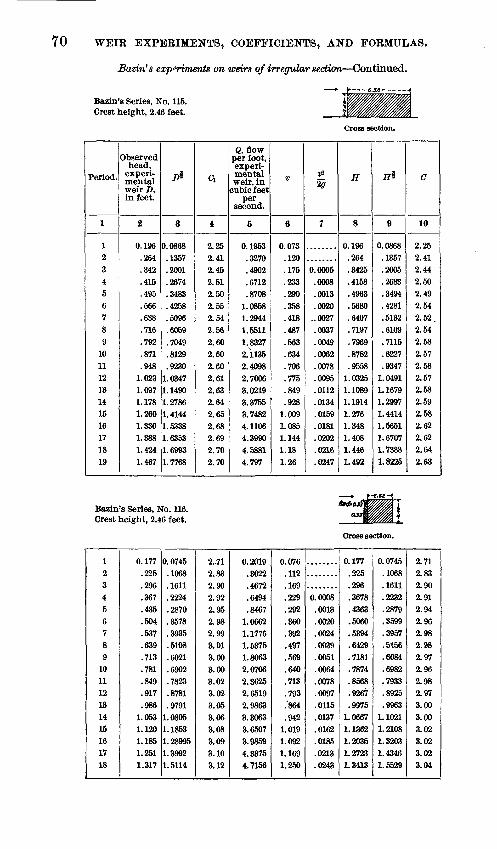
70 WEIR EXPERIMENTS, COEFFICIENTS, AND FORMULAS.
Bazin's experiments on weirs of irregular section Continued.
Bazin's Series, No. 115. Crest height, 2.46 feet.
Cross section.
Period.
1
123456789
10111213141516171819
Observed head,
experi mental weir D, in feet.
2
0.1%.264.342.415.495.566.638.716.792.871.948
1.0231.0971.1781.2601.3301.3881.4241.467
8
0.0868.1357.2001.2674.3483.4258.5096.6059.7049.8129.9230
1.03471.14901.27861.41441.53381.63531.69931.7768
a
4
2.252.412.452.512.502.552.542.562.602.602.602.612.632.642.652.682.692.702.70
Q, flow per foot, experi mental weir, in
cubic feet per
second.
5
0.1963.3270.4902.6712.8708
1.08581.29441.55111.88272.11352.40982.70063.02193.37553.74824.11064.39904.58814.797
V
6
0.073.120.175.233.290.358.418.487.563.634.706.775.849.928
1.0091.0851.1441.181.26
1
7
0.0005.0008.0013.0020
..0027.0037.0049.0062.0078.0095.0112.0134.0159.0181.0202.0216.0247
H
8
0.1%.264.3425.4158.4963.5680.6407.7197.7%9.8782.9558
1.03251.10891.19141.2761.3481.4081.4461.492
-
9
0.0868.1357.2005.2683.3494.4281.5132.6109.7115.8227.9347
1.04911. 16791.29971.44141.56511.67071.73881.8225
C
10
2.262.412.442.502.492.542.52.2.542.582.572.582.572.582.592.582.622.622.642.63
Bazin's Series, No. 116. Crest height, 2.46 feet.
Cross section.
123456789101112131415161718
0.177.225.296.367.435.504.537.639.713.781.849.917.986
1.0531.1201.1851.2511.317
0.0745.1068.1611.2224.2870.3578.3935.5108.6021.6902.7823.8781.9791
1.08051.18531.289951.39921.5114
2.-712.832.902.922.952.982.993.013.003.003.023.023.053.063.083.093.103.12
0.2019<M»9 . <an}£t£i
.4672
.6494
.84671.06621.17761.53751.80632.07062.36252.65192.98633.30633.65073.98594.33754.7156
0.076.112.169.229.292.360.392.497.669.640.713.793.'864.942
1.0191.0921.1691.250
0.0008.0013.0020.0024.0039.0051.0064.0078.0097.0116.0137.0162.0185.0213.0243
0.177.225.296.3678.4363.5060.5394.6429.7181.7874.8568.9267.9975
1.06671.13621.20361.27231.3413
0.0745.1068.1611.2232.2879.3599.3957.5156.6084.6982.7933.8925.9963
1.10211.21081.32031.43461.5629
2.712.832.902.912.942.%2.982.982.972.962.982.973.003.003.023.023.023.04
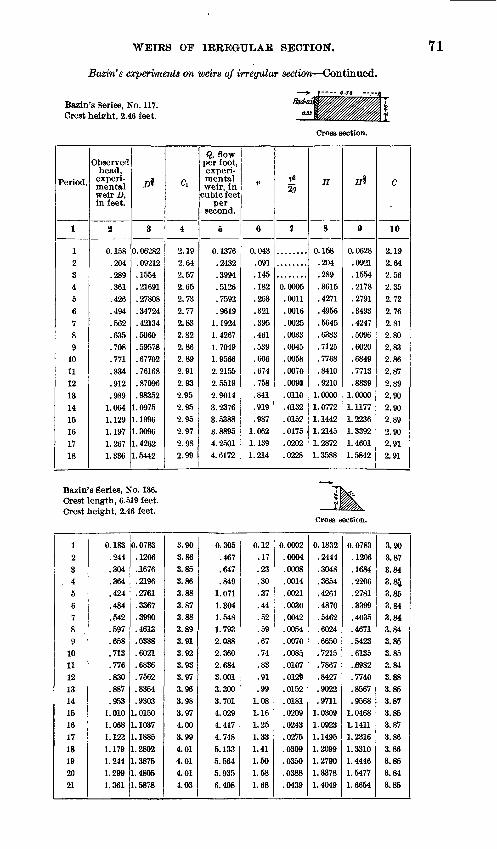
WEIRS OF IRREGULAR SECTION. 71
Bazin's experiments on weirs of irregular section Continued.
r- e.ss --.«
Bazin's Series, No. 117. Crest height, 2.46 feet.
Cross section.
Period.
1
123456789
101112131415161718
Observedhead,
experi mentalweir D,in feet.
2
0.158.204
OCQ. £oy
.361
.426
.494
.662
.635
.708
.771
.834
.912
.9891.0641.1291.1971.2671.336
l>t
3
0.06282.09212.1554. 21691.27808.34724.42134.5060.59578. 67702.76168. 87096.98352
1.09751.19961.30961.42621.5442
Ci
4
2.192.642.572.652.732.772.832.822.862.892.912.932.952.952.952.972.982.99
Q, flowper foot,experi mental weir, in
cubic feetper
second.
5
0. 1376.24321004 Oo«r±
.5126
.7592
.96191.19241.42671.70491.95662.21552.55192.90143.23763.53883.88954.25014. 6172
V
6
0.043.091.145.182.263.321.395.461.539.606.674.758.841.919.987
1.0621.1391.214
& 20
7
0.0005.0011.0016.0025.0033.0045.0058.0070.0090.0110.0132.0152.0175.0202.0228
H
8
0.158.204.289.3615.4271.4956.5645.6383.7125.7768.8410.9210
1.00001.07721.14421. 21451.28721.3588
tf
9
0.0628.0921.1554.2178.2791.3493.4247.5096.6020.6849.7713.8839
1.00001. 11771.22361.33921.46011.5842
C
10
2 10 . ±v
"> fid. ft, \y±
9 fifi£>, tTO
2.352.722.762.812.802.832.862.872.892.902.902.892.902.912.91
Bazin's Series, No. 136. Crest length, 6.519 feet. Crest height, 2.46 feet.
Cross section.
123
. 456789101112131415161718192021
0.183.244.304.364.424.484.542.597.658.713.776.830.887.953
1.0101.0681.122
1.1791.2441.2991.361
0.0783.1206.,1676.2196.2761.3367.3990.4613.5338.6021.6836.7562.8354.9303
1.01501. 10371.18851.28021.38751.48051.5878
3.903.863.853.863.883.873.883.893.913.923.933.973.%3.983.974.003.994.014.014.014.03
0.305.467.647.849
1.0711.3041.5481.7932.0882.3602.6843.0013.3003.7014.0294.4174.7485.1335.5645.9356.408
0.12.17.23.30.37.44.52.59.67.74.83.91.99
1.081.161.251.331.411.501.581.68
0.0002.0004.0008.0014.0021.0030.0042.0054.0070.0085.0107.0129.0152.0181.0209.0243.0275.0309.0350.0388.0439
0.1832.2444.3048.3654.4261.4870.5462.6024.6650.7215.7867.8427.9022.97111.03091.09231. 14951.20991.27901.33781.4049
0.0783.1206.1684.2206.2781.3399.4035.4671.5423.6135.J6982.7740.8567.9568
1.04681. 14111.23161.33101.44461.54771.6664
3.903.873.843.85,3.853.843.843.843.853.853.843.883.853.873.853.873.863.863.853.843.85
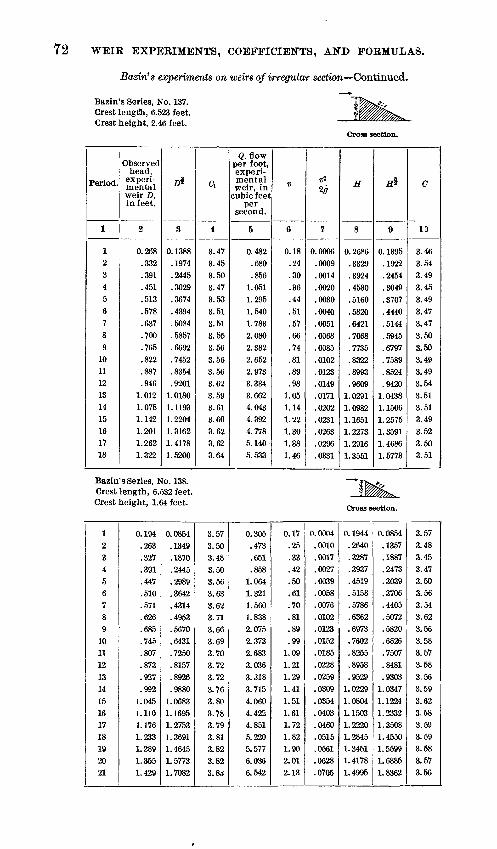
72 WEIR EXPERIMENTS, COEFFICIENTS, AND FORMULAS.
Bazin's experiments on weirs of irregular section Continued.
Bazin's Series, No. 137. Crest lengfti, 6.523 feet. Crest height, 2.46 feet. ~
Cross section.
Period.
1
12
34
567
8
9101112131415161718
Observed head,
experi mental weir D, in feet.
2
0.268.332.391.451.513.578.637.700.765.822.887.946
1.0121.0781.1421.2011.2621. 322
,
3
0.1388.1974
.2445
.3029
.3674
.4394
.5084
.5857
.6692
.7452
.8364
.92011.01801.11931.22041. 31621. 41781.5200
a
4
3.473.453.503.47
3.533.513.51
3.553.56
3.563.563.623.593.613.603.623.623.64
Q, flow per foot, experi mental weir, in
cubic feet per
second.
5
0.482.680
.8561.051
1.2951.540
1.7832.0802.3822.652
2.9733.3343.6624.0434.3924.7785.140
5.533
V
6
0.18.24
.30
.36
.44
.51
.57
.66
.74
.81
.89
.981.051.141.22
1.301.381.46
20
7
0.0006.0009.0014
.0020
.0030
.0040
.0051
.0068
.0085
.0102
.0123
.0149
.0171
.0202
.0231
.0263
.0296
.0331
H
8
0. 2686
.3329
.3924
.4530
.5160
.5820
.6421
.7068
.7735
.8322
.8993
.96091.02911.09821.16511.2273
1.29161.3551
-9
0. 1395.1922.2454.3049
.3707
.4440
.5144
.5945
.6797
.7589
.8524
.9420
1.04381.15061. 2575
1.35911.46861. 5773
C
19
3.463.543.49
3.453.493.47
3.47
3.503.503.493.493.64
3.513.513.493.52
3.503.61
Bazin's Series, No. 138. Crest length, 6.532 feet. Crest height, 1.64 feet.
Cross section.
123456789101112131415161718192021
0.194.263.327.391.447.510.571.626.685.745.807.873.927.992
1.0451.1101.1761.2331.2891.3551.429
0.0864.1349.1870.2445.2989.3642.4314.4953.5670.6431.7250.8157.8926.9880
1.06831. 16951. 27531.36911. 46451. 57731.7082
3.573.503.483.503.563.633.623.713.663.693.703.723.723.763.803.783.793.813.823.823.8rf
0.305.473.651.858
1.0641.3211.5601.8382.0752.3732.6833.0363.3183.7154.0604.4224.8515.2205.5776.0366.542
0.17.25.33.42.50.61.70.81.89.99
1.091.211.291.411.511.611.721.821.902.012.13
0.0004.0010.0017.0027.0039.0058.0076.0102.0123.0152.0185.0228.0259.0309.0354.0403.0460.0515.0561.0628.0705
0. 1944.2640.3287.3937.4519.5158.5786.6362.6973.7602.8255.8958.9529
1.02291. 08041.15031.22201. 28451. 34511.41781.4995
0.0854.1357.1887.2473.3039.3706.4405.5072.5820.6826.7507.8481.9303
1.03471.12241.23321.35081.45501.55991.68851.8362
3.573.483.453.473.503.563.543.623.563.583.573.583.563.593.623.583.593.593.583.573.56
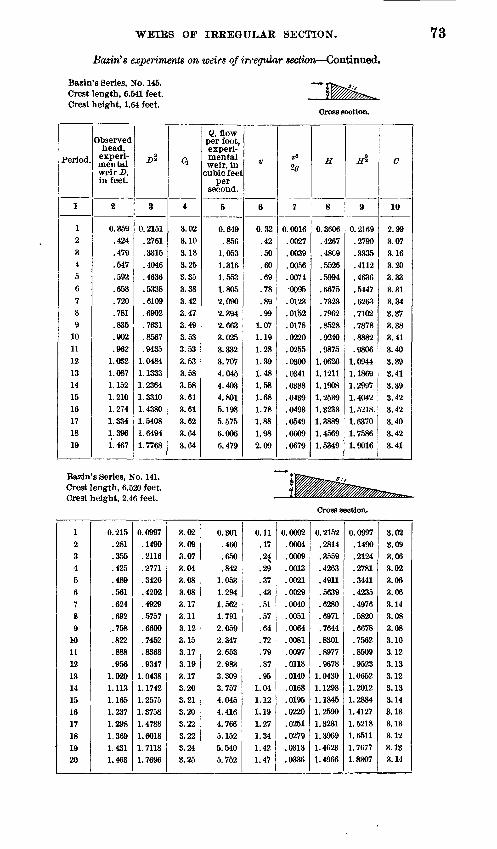
WEIRS OF IRREGULAR SECTION. 73
Bavin's experiments on weirs of irregular section Continued.
Bazin's Series, No. 146. Crest length, 6.541 feet. Crest height, 1.64 feet.
Cross section.
Period.
1
123456789
10111213141516171819
Observed head,
experi mental weir D, in feet.
2
0.359.424.479.547.592.658.720.781.835.902.962
1.0321.0871.1521.2101.2741.3341.3961*. 467
D*
B
0. 2151.2761.3315.4046.4636. 5338.6109.6902.7631.8567.9435
1.04841.13331.23641.33101.43801.64081.64941.7768
c,
4
3.023.103.183.253.353.383.423.473.493.533.533.533.583.683.613.613.623.643.64
Q, flow per foot, experi mental weir, in
cubic feet per
second.
5
0.649.856
1.0531.3161.5531.8062.0902.3942.6633.0253.3323.7074.0454.4034.8015.1985.5756.0066.479
V
6
0.32.42.50.60.69.78.89.99
1.071.191.281.391.481.581.681.781.881.982.09
ti* 20
7
0.0016.0027.0039.0056.0074 0095.0123. 0152.0178.0220.0255.0300.0341.0388.0439.0493.0649.0609.0679
H
8
0.3606.4267.48C9.5526.5994.6675.7323.7962.8528.9240.9875
1.06201. 12111.19081.25391.32331.38891.45691.5349
^
9
0.2169.2790.3335.4112.4636.5447.6263.7102.7878.8882.9806
1.09441.18691.29971.40421. 5218,1.63701.75861.9016
C
10
2.993.073.163.203.333.313.343.373.383.413.403.393.413.393.423.423.403.423.41
Bazin's Series, No. 141. Crest length, 6.520 feet Crest height, 2.46 feet.
Cross section.
123456789M1112
1314151617181920
0.215.281.355.425.489.561.624.692..758.822.888.956
1.0291.1131.1651.2371.2981.3691.4311.463
0.0997.1490. 2116. 2771.3420.4202.4929.5757.6600.7462.8368.9347
1.04381. 17421.25751.37581.47881.60181.71181.76%
3.023.093.073.043.083.083.173.113.123.153.173.193.173.203.213.203.223.223.243.25
0.301.460.650.842
1.0531.2941.5621.7912.0592.3472.6532.9833.3093.7574.0464.4164.7665.1525.5405.752
0.11.17 23.29.37.43.51.57.64.72.79.87.95
1.041.121.191.271.341.421.47
0.0002.0004.0009.0013.0021.0029.0040.0051.0064.0081.0097.0118.0140.0168.0195.0220.0251.0279.0313.0336
0.2152.2814.3559.4263.4911.5639.6280.6971.7644.8301.8977.%78
1.04301.12981.18451.25901.32311.39691.40231.4966
0.0997.1490.2124.2781.3441.4235.4976.6820.6678.7562.8509.9523
1.06521.20121.28841.41271. 52181.65111. 76771.8307
3.023.093.063.023.063.063.143.083.083.103.123.133.123.133.143.133.133.123.133.14
74 WEIR EXPERIMENTS, COEFFICIENTS, AND FORMULAS.
Bazin's experiments on iveirs of irregular section Continued.
Bazin's Series, No. 142. Crest length, 6.523 feet. Crest height, 2.46 feet. "~
Cross section.
Period.
1
12
34567
89
1011
121314151617
Observedhead,
experi mentalweir D,in feet.
2
0.300
.369
.447
.509
.591
.636
.727
.795
.861
.934
1.0071.0791.1491.2221.2851.3621.430
J*
3
0.1643.2242
.2989
.3631
.4544
.5435
.6199
.7089
.7989
.9027
1.01051.12081. 23161.35081.45671.58951.7100
Q
4
2.832.872.872.862.882.862.922.94
2.942.95
2.952.98
2.982.993.00
3.003.01
Q, flowper foot,experimental weir, in
cubic feetper
second.
5
0.464.643.851
1.0381.3081.5541.8102.084
2.3492.6642.980
3.3383.6654.0374.370
4.7705.147
V
6
0.17.23.29.35.43.50.57.64
.71
.78
.86
.941.01
1.101.17
1.251.30
»2
20
7
0.0004..0008.0013.0019.0029.0039.0051.0064.0078
.0095
.0115
.0137
.0159
.0188
.0213
.0243
.0263
H
8
0.3004.3698.4483.5109.5939.6699.7327.8014
.8688
.9435
1. 01851.09271. 16491.24081.30631.38631.4563
B*
9
0.1643.2251.2999.3652.4578.5484.6263.7155
.8101
.91581.02861. 14271. 25751.3824
1.49251.6317
1. 7569
C
10
2.822.86
2.842.842.862.832.892.912.90
2.912.89
2.922.922.922.932.92
2.93
Bazin's Series, No. 139. Crest length, 6.532 feet. Crest height, 1.64 feet. Cross section.
123456789101112131415161718192021
0.190.253.312.375.434.500.552.615.667.733.798.852.915.969
1.0231.0921.1511.2101.2581.3261.394
0.0828.1273.1743.2297.2860.3536.4101.4823.5447.6276.7128.7865.8763.9538
1.03471. 14111.23481.33101. 41101. 52691.6459
3.663.683.723.663.733.723.783.763.823.793.803.843.863. $73.923.903.903.443.953.933.93
0.303.467.647.841
1.0671.3171.5501.8122.0812.3802.7093.0223.3783.6924.0384.4464.8165.2405.5706.0136.484
0.17.25.33.42.52.62.71.80.90
1.001.111.211.321.411.521.631.721.841.922.032.13
0.0004.0010.0017.0027.0042.0060.0078.0099.0126.0155.0192.0228.0271.0309.0359.0413.0460.0526.0573.0641.0705
0.1904.2540.3137.3777.4382.5060.5598.6249.67%.7485.8172.8748.9421.9961
1.05891.13331.19701.26261.31531.39011.4645
0.0828.1280.1759.2323.2899.3600.4191.4941.5607.6482.7385.8185.9143.9940
1.08971.20601.30961.41941.50801.63881. 7714
3.663.653.683.623.683.663.703.673.713.673.673.693.683.713.713.683.683.693.693.673.66
WEIRS OF IRREGULAR SECTION. 75
Basin's experiments on weirs of irregular section Continued.
Bazin's Series, No. 140. Crest length, 6.532 feet. Crest height, 1.64 feet. Cross section.
Period.
1
123456789
101112131415161718192021
Observed head,
experi mental weir D, in feet.
2
0.192.252.308.371.436.488.549.604.664.719.785.837.905.961
1.0231.0801.1431.1951.2541.3161.375
D*
3
0.0835.1265.1709.2260.2879.3399.4068.4694.5411.6096.6956.7658.8610.9421
1.03471.12241.22201.30631. 40431.50971.6123
Oi
4
3.773.743.753.713.77a. 743.813.823.833.843.883.883.923.903.953.933.973.963.973.994.01
Q, flow per foot, experi mental weir, in
cubic feet per
second.
5
0.315.473.641.838
1.0861.2761.5511.7922.0722.3422.7002.9683.3753.6744.0694.4024.8435.1875.5586.0246.456
V
6
0.17.25.33.42.52.60.71.80.90.99
1.111.201.321.411.531.621.741.831.922.032.14
1)8
20
7
0.0004.0010.0017.0027.0042.0056.0078.0099.0126.0152.0192.0224.0271.0309.0364.0408.0471.0521.0573.0641.0712
H
8
0.1924.2530.3097.3727.4402.4936.5568.6139.6766.7342.8042.8594.9321.9919
1.05941.12081.19011.24711.31131.38011.4462
fl*
9
0.0841.1273.1726.2278.2919.3472.4157.4811.5570.6289.7209.7961.8998.9880
1.08981.18691.29811.39251.50111.62111.7388
C
10
3.743.723.713.683.723.663.733.723.723.723.743.733.753.723.733.713.733.723.703.723.71
Bazin's Series, No. 147. Crest length, 6.536 feet. Crest height, 2.46 feet.
dross section.
123456789101112131415161718192021
0.231.308.373.438.503.569.637.681.734.797.845.898.953
1.0151.0631.1151.1651.2171.2651.3321.394
0. 1110.1709.2278.2899.3568.4292.5084.5620.6289.7115.7768.8510.9303
1.02261.09601. 17741.25751.34261.42281.53731.6459
2.752.852.862.973.023.133.20S.-243.343.403.443.533.573.633.673.733.793.833.853.893.98
0.305.485.652.8611.0781.3431.6261.8212.1092.4172.6733.0043.3203.7034.0374.4014.7755.1325.4675.9916.567
0.11.18.23.30.37.44.54.58.66.74.81.89.97
1.061.151.221.311.401.471.581.68
0.0002.0005.0008.0014.0021.0030.0045.0052.0068.0083.0102.0123.0146.0175.0206.0231.0267.0305.0336.0388.0439
0.2312.3085.3738.4394.5051.5720.6415.6862.7408.8053.8552.9103.9676
1.03251.083C1.13811. 19171.24751.29861.37081.4379
0. 1110.1709.2287.2909.3589.4326.5132.5682.6378.7228.7906.8681.9523
1.04841.12861.21401.301B1.39251.48051.60531.7244
2.752.842.852.963.003.103.173.203.313.353.383.463.493.533.583.623.673.683.703.733.81
76 WEIR EXPERIMENTS, COEFFICIENTS, AND FORMULAS.
Bazin's experiments on weirs of irregular section Continued.
Bazin's Series, No. 149. Crest length, 6.518 feet. Crest height, 2.46 feet.
Cross section.
Period.
1
12
34
56789
1011121314
1516
1718192021
Observed head,
experi mental weir D, in feet.
2
0.248.317
.390
.455
.521
.585
.653
.705
.766
.818
.882
.942
.999
1.0511.1031.1651.2091.281
1.3301.3851.446
Z>*
3
0.1235
.1785
.2436
.3070
.3761
.4475
.5277
.5920
.6705
.7398
.8283
.9143
.99851.07741.15841. 25751.3294
1.44991.53381.63001.7388
Ci
4
2.552.58
2.672.732.822.892.973.00
3.083.163.233.303.36
3.393.453.49
3.523.573.603.633.67
Q, flow per foot, experi mental weir, in
cubic feet per
second.
5
0.316.462
.651
.8381.0601.2951.568
1.7762.0672.3382.6743.0163.356
3.6274.0024.3974.682
5.1775.5085.9176.386
V
6
0.12
.17
.23
.29
.36
.43
.51
.56
.64
.71
.80
.89
.971.031.12
1.201.271.381.451.541.64
02 20
7
0.0002.0004
.0008
.0013
.0020
.0030
.0040
.0049
.0064
.0078
.0099
.0123
.0146
.0165
.0195
.0224
.0251
.0296
.0327
.0369
.0418
H
8
0.2482.3174.3908
.4563
.5230
.5850
.6570
.7099
.7724
.8258
.8979
.95431.01561.06651.12251. 1874
1.23411.31061. 36271.42191.4878
I&
9
0.1235
.1785
.2445
.3080
.3782
.4475
.5325
.5983
.6783
.7507
.8509
.93181.0241
1.10061.1885
1.29321.37081.50111. 5912
1.69561.8151
d
10
2.562.59
2.662.72
2.802.892.942.97
3.053.113.143.233.28
3.303.373.403.423.453.463.49
3.52
Bazin's Series, No. 150. Crest length, 6.518 feet. Crest height, 2.46 feet.
Cross section.
12345678910111213141516171819202122
0.248.323.379.459.512.586.637.698.751.814.869.928.982
1.0431.0951.1521.2151.2591.3151.3231.3801.439
0.1235.1836.2333.3110.3664.4486.5084.5832.6508.7344.8101.8940.9732
1. 06521. 14591.23641.33931. 41271.50801. 52181. 62111.7262
2.532.652.782.822.912.963.073.123.183.263.313.373.423.473.513.563.583.633.653.653.683.73
0.314.488.648.877
1.0651.3291.5601.8192.0702.3932.6813.0133.3283.7134.0374.4144.7975.1185.5125.5485.9626.416
0.12.16.23.30.36.43.50.57.64.73.80.89.97
1.061.131.221.301.381.461.471.551.64
0.0002.0004.0008.0014.0020.0029.0039.0051.0064.0083.0099.0123.0146.0175.0199.0231.0263.0296.0331.0336.0374.0418
0. 2482.3234.3798.4604.5140.5889.6409.7031.7574.8223.8789.9403.9966
1.06051. 11491.17511.24131.28561.34811.35661. 41741.4808
0.1235.1836.2342.3120.3685.4521.5132.5895.6587.7452.8241.9114.9955
1.09131. 17741. 27371.38251.45841.56511.58071.68681.8023
2.542.662.772.812.892.943.043.093.143.213.253.313.343.403.433.463.47S.513.523.513.543.56
WEIRS OF IRREGULAR SECTION.
Bazin's experiments on weirs of irregular section Continued.
Bazin's Series, No. 151.. Crest length, 6.650 feet. Crest height, 2.46 feet.
77
Cross section.
Period.
1
123456789
10111213141516171819202122232425
Observed head,
experi mental weir D, in feet.
2
0.201.240.307.391.445.514.537.573.643.695.756.800.826.867.921.975
1.0271.0901.1121.1401.2091.2481.3141.3521.416
D*
3
0.0901.1176.1701.2445.2969.3685.3935.4337.5156.5795.6574.7155.7507.8073.8839.9628
1.04081.13801. 17271. 21721.32941. 39421.50631. 57211.6850
Ci
4
2.712.812.792.792.922.952.983.053.093.203.243.303.313.363.393.463.513.523.573.603.613.643.683.713.75
Q, flow per foot, experi mental weir, in
cubic feel per
second.
5
0.244.329.474.684.867
1.0891.1741.3241.5941.8562.1292.3622.4862.7122.9973.3323.6534.0134.1774.3824.8015.0605.5576.8256.337
V
6
0.09.12.17.24.30.37.39.43.51.59.66.72.76.81.89.97
1.041.131.171.221.311.361.471.521.64
^ 20
7
0.0001.0002.0004.0009.0014.0021.0024.0030.0040.0054.0068.0081.0090.0102.0123.0146.0168.0199.0218.0231.0267.0288.03360359
.0418
H
8
0.2011.2422.3074.3919.4464.5161.5394.5760.6470.7004.7628.8081.8350.8772.9333.9896
1.04381.10991.13331.16311.23571.27681.34761.38791.4578
H*
9
0.0901.1191.1701.2454.2979.3707.3957.4371.5204.5857.6665.7263.7631.8213.9013.9850
1.06671.16951.20601.25431. 37411.44311.56511.63521.7604
C
10
2.712.762.792.792.912.942.973.033.063.173.193.253.263.303.323.383.473.433.46 3.503.493.513.553.563.60
78 WEIR EXPERIMENTS, COEFFICIENTS, AND FORMULAS.
Bazin's experiments on weirs of irregular section Continued.
Bazin's Series, No. 163. Crest length, 6.515 feet. Crest height, 2.46 feet.
Cross section.
Period.
1
12
34
56
789
1011121314151617
1819
2021
222324
2526
Observed head,
experi mental weir D, in feet.
2
0.237
.301
.372
.373
.440
.505
.576
.637
.696
.701
.760
.762
.814
.879
.937
.9931.0011.0551.1021.1701.2261.2901.2891.3471.4041.436
1*
3
0.1154.1651.2269
.2278
.2919
.3589
.4371
.5084
.5807
.5870
.6626
.6652
.7344
.8241
.9071
.98951.00151.0836
1.15691.26561.35751.46521.46351.56341.66361.7208
d
4
2.732.772.792.832.902.93
3.003.073.10
3.10d.153.163.203.253.293.343.33
3.403.413.463.483.513.52
3.533.583.58
Q, flow per foot, experi mental weir, in
cubic feet per
second.
5
0.314.457
.633
.645
.847
1.0521.311
1.5601.8011.820
2.0852.1012.3492.6782.9843.307
3.3303.672
3.9564.3944.7335.1595.1395.5075.943
6.158
V
6
0.12
.16
.22
.23
.29
.35
.43
.60
.67^ .58
.65
.65
.72
.80
.88
.96
.96
1.051.111.211.28
1.381.371.451.54
1.58
V* 20
7
0.0002.0004.0008.0008.0013
.0019
.0030
.0039
.0051
.0052
.0066
.0066
.0081
.0099.0120.0143.0143
.0171
.0192
.0228
.0255
.0296
.0292
.0327
.0369
.0388
H
8
0.2372.3014
.3728
.3738
.4413
.5069
.5790
.6409
.7011
.7062
.7666
.7686
.8221
.8889
.94901.00731.0153
1. 07211. 12121. 1928
1.25151. 31961. 3182
1. 37911.44091. 4748
H*
9
0.1154.1651. 2278
.2287
.2929
.3610
.4406
.5132
.5870
.5933
.6717
.6743
. 7452
.8381
.92451.01051.0226
1.10991.18691.30301.39921.51661. 51321. 61931.72981. 7914
C
10
2.722.77
2.782.822.892.91
2.983.043.073.073.103.123.153.203.233.273.26
3.313.333.373.383.403.403.403.44
3.44
WEIRS OP IRREGULAR SECTION. 79
Bazin's experiments on weirs of irregular section Continued.
Bazin's Series, No. 154. Crest length, 6.516 feet. Crest height, 2.46 feet.
Cross section.
Period.
1
123456789
1011121314151617181920
Observed head,
experi mental weir D, in feet.
2
0.236.308.373.447.508.577.643.706.760.823.888.946
1.0111.0751.1381.1951.2501.3101.3701.430
I*
3
0. 1147.1709.2278.2989.3621.4382.5156.5933.6626.7466.8368.9201
1.01651.11461.21401.30631.39751.49941.60351.7100
Oi
4
2.702.742.832.852.952.973.043.073.173.203.203.243.283.313.363.373.403.433.453.48
Q.flow per foot, experi mental weir, in
cubic feet per
second.
5
0.311.469.645.852
1.0681.3011.5691.8212.1022.3892.6782.9813.3348.6744.0664.4154.7605.1455.5205.951
V
6
0.12.17.23.29.36.37.51.57.65.73.80.87.96
1.031.131.201.281.361.441.53
&tg
7
0.0002.0004.0008.0013.0020.0021.0040.0051.0066.0083.0099.0118.0143.0165.0199.0224.0255.0288.0322.0364
H
8
0.2632.3084.3738.4483.5100.5791.6470.7111.7666.8313.-8979.9578
1.02531.09151.15791.21741.27551.33881.40221.4664
*»
9
0.1349.1709.2287.2999.3642.4406.5204.5996.6717.7576.8509.9376
1.03771.13961. 24611.34261.43971.54941.66011.7750
C
10
2.302.742.822.842.942.953.023.043.113.163.153.183.213.223.263.293.313.323.323.35
80 WEIR EXPERIMENTS, COEFFICIENTS, AND FORMULAS.
Bazin's experiments on weirs of irregular section Continued.
Bazin's Series, No. 156. Crest height, 2.46 feet. Crest width, 0.66 foot. Upstream slope, £ to 1. Downstream slope, 5 to 1.
Period.
1
123456789
1011121314151617181920
Observed head,
experi mental weir D, in feet.
2
0.246.311.382.446.508.576.638.703.764.834.888.956
1.0181.0741.1391.2031.2671.3411.3941.457
Di
3
0.1220.1734.2361.2979.3621.4371.5096.5895.6678.7617.8368.9347
1.02721.11301.21561.31941.42621.55291.64591.7587
ci
4
2.762.802.842.902.912.953.013.063.103.133.173.243.223.303.293.313.343.363.363.39
Q, flow per foot, experi mental weir, in
cubic feet per
second.
5
0.337.486.671.864
1.0541.2891.5341.80S2.0702.3842.6533.0283.3093.6733.9994.3674.7645.2185.5305.962
t>
6
0.12.17.24.30.36.42.49.57.64.72.79.88.95
1.041.111.191.261.371.431.52
lVig
7
0.0002.0004.0009.0014.0020.0027.0037.0051.0064.0081.0097.0120.0140.0168.0192.0220.0247.0292.0318.0359
H
8
0. 2462.3114.3829.4474.5100.5787.6417.7081.7704.8421.8977.9680
1.03201.09081. 15821.22501.29171.37021.42581. 4929
^
9
0. 1220.1734.2370.2989.3642.4406.5144.5958.6757.7727.8510.9524
1.04841.13961. 24621.35581.46861.60351.70281.8241
C
10
2.762.802.832.892.892.922.983.033.063.083.123.183.163.223.213.223.243.253.253.27
Bazin's Series, No. 168. Crest length, 6.520 feet. Crest height, 2.46 feet. Cross section.
123456789
1011121314151617181920
0.234.312.383.457.530.600.672.733.799.860.930.984
1.0551.1251.1771.2431.2971.3611.4121.457
0. 1132.1743.2370.3090.3858.4648.5509.6276.7142.7975.8969.9761
1.08361. 19331.27691.38581.47711.587s1. 67791.7687
2.792.722.772.792.812.822.862.902.912.953.003.043.103.123.153.193.223.253.303.32
0.316.474.656.862
1.0851.3111.5761.8212.0782.3542.6912.9673.3483.7134.0224.4344.7665.1685.5445.839
0.12.17.23.29.36.43.50.57.64.71.79.86.951.041.101.201.27.1.351.431.49
0.0002.0004.0008.0013.0020.0030.0039.0051.0064.0078.0097.0115.0140.0168.0188.0224.0251.0283.0348.0345
0.2342.3124.3838.4583.6320.6030.6759.7381.8054.8678.9397.9955
1.06901. 14181.19681.26541.32211.38931.44681. 4915
0. 1132.1743.2379.3100.3880.4683.5557.6340.7223.8087.9114.9925
1.10531. 22041.30291.42281.52001.63701.74061.8215
2.792.722.762.782.802.802.842.872.882.912.952.993,033.043.083.123.143.163.183.22
WE1R9 OP IRREGULAR SECTION. 81
Bazin's experiments on weirs of irregular section Continued.
Bazin's Series, No. 159. Crest length, 6.511 feet. Crest height, 2.46 feet.
Cross section.
Period.
1
123456789
1011121314151617181920212223242526
Observed head,
experi mental weir D, in feet.
2
Or234.304.379.387.457.516.526.599.664.670.735.797.861.876.935.994
1.0681.1261.1451.1981.2611.3201.3321.3891.4451.456
D»
3
0. 1132.1676.2333.2408.3090.3707.3815.4636.5411.5484.6302.7115.7989.8199.9042.9910
1.10371. 19481.22521. 31121. 41611.51661.53731.63701.73701.7569
fi
4
2 682.752.822.822.812.912.842.822.872.832.882.942.992.942.933.013.033.103.053.083.113.153.133.143.193.19
Q, flow per foot, experi mental weir, in
cubic feet per
second.
5
0.303.462.657.680.868
1.0791.0851.3081.5531.5521.8132.0922.3892.4112.6492.9833.3333.7043.7514.0354.4164.7774.8205.1505.5515.614
V
6
0.11.17.23.24.30.36.36.43.50.19.56.64.72.72.78.86.94
1.03.04.10.19.27.27
1.331.421.43
Ift *9
7
0.0002.0004.0008.0009.0014.0020.0020.0030.0039.0037.0049.0064.0081.0081.0095.0115.0137.0165.0168.0188.0220.0251.0251.0275.0313.0348
H
8
0. 2342.3044.3798.3879.4584.5180.5280.6020.6679.6737.7399.8034.8693.8843.9445
1.00551.08171.14251. 16181.21681.28301 34511.35711. 41651. 47631.4908
ffi
9
0. 1132.1676.2342.2417.3100.3728.3836.4671.5460.5533.6366.7196.8101.8311.9172
1.0091.12551.22041. 25261.34251.45331.55991.58081.68501. 79321.8188
C
10
2.682.742.802.812.802.892.832.812.842.802.852.912.952.902.892.962.963.043.003.003.033.063.053.063.093.09
949289 O 51-
82 WEIR HXPJEiaMEHTS, COKKFIdEHTS, AJTD FORMULAS.
Sazin's experiments on weirs of irregular section Continued.Bazin's Series, No. 160. Crest height, 2.46 feet. Crest width, 1.31 feet. Upstream slope, £ to 1. Downstream slope, 6 to 1.
Period.
1
123456789
10111213141516
Observedhead.
experi mentalweir D,in feet.
2
0.451.522.593.663.735.798.863.930.998
1.0741.1291.1931.2541.3261.3891.457
7)3
3
0.3029.3772.4567.5399.6302.7128.8017.8969.9970
1.11301.19961.30301.40431.52691.63701.7587
<?!
4
2.812.822.842.882.892.912.922.972.993.023.033.063.083.103.143.16
Q, flowper foot,experimental weir, in
cubic feetper
second.
5
0.85401.06371.29701.55491. 82132.07422.34102.66382.98103.33613.63483.98724.32524.73345.14025.5575
V
6
0.29.36.42.50.57.64.70.78.86.95
1.011.091.161.251.341.42
«2
20
7
0.0013.0020.0027.0039.0051.0064.0076.0095.0115.0140.0159.0185.0209.0243.0279.0313
H
8
0.4523.5240.5957.6669.7401.8044.8706.9395
1.00951.08801.14491.21151.27491.35031. 41691.4883
fli
9
0.3039..3793.4601.5447.6366.7209.8129.9100
1.01351. 13491.22521.33341. 43971.56861.68671. 8151
C
10
2.802.802.822.862.862.882.882.932.942.942.972.983.003.023.053.06
Bazin's Series, No. 161. Crest length, 6.543 feet. Crest height, 1.64 feet.
Cross section.
12345678910111213141516171819202122232425
0.298.354.413.472.529.581.639.693.750.804.864.919.960.992
1.0191.0561.0831.1181.1571.1871.2251.2631.2891.3261.359
0. 1627.2107.2654.3243.3847.4429.5108,5770.6495.7209.8031.8810.9406.9880
1.02871.08511.12711. 18211.24451.29321.35581.41941.46351.52691.5843
4.314.304.264.234.224.254.244.264.284.314.314.324.334.304.314.284.274.244.174.164.124.094.114.084.08
0.701.906
1.1311.3711.6251.8832.1672.4582.7823.1073.4613.8064.0734.2484.4344.6654.8255.0035.1715.3805.3785.8086.0016.2426.446
0.36.45.56.65.75.85.95
1.051.161.271.381.491.571.61
1.671.721.781.811.841.901.952.002.052.102.15
0.0020.0031.0049.0066.0087.0112.0140.0171.0209.0251.0296.0345.0383.0403.0434.0460.0493.0509.0526.0561.0591.0622.0658.0686.0719
0.3000.3571.4179.4786.5377.5922.6530.7101.7709.8291.8936.9535.9983
1.03231.06241.10201.13231.16891.20961.24311.28411. 32521.35431.39461.4309
0.1643.2133.2702.3314.3946.4555.5277.5983.6770.7548.8452.9303.99701.04841.09441.15691.20441.26401.33101.38581.45501.52521.57561.64761.7118
4.274.254.194.144.124.134.114.114.114.124.104.094.084.054.054.034.013.963.883.883.833.813.813.793.76
WEIRS OF IRREGULAR SECTION. 83
Bazin's experiments on weirs of irregular section Continued.
Bazin's Series, No. 163. Crest length, 6.635 feet. Crest height, 1.64 feet.
Cross section.
Period.
1
12
3
4
5
6
7
8
9
10
11
12
13
14
15
16
17
18
19
20
21
Observedhead, experi mentalweir D,in feet.
2
0.184.244.303.366.423.486.536.593.653.702.769.827.882.949.998
1.0561.1141.1711.2311.2851.339
/>*
3
0.0790.1206
.1668
.2215
.2751
.3388
.3924
.4567
.5277
.5882
.6744
.7521
.8283
.9245
.9970
1.0851
1.1758
1.2672
1.3658
].4567
1.5495
Ci
4
3.813.833.843.833.833.823.863.943.914.043.984.024.024.044.064.064.054.074.074.124.17
Q, flowper foot,experi mental weir, in
cubic feetper
second.
5
0.301
.463
.641
.850
1.053
1.295
1.513
1.799
2.063
2.376
2.683
3.023
3. 329
3.735
4.048
4.425
4.779
5.169
5.576
6.014
6.464
i'
6
0.17
.26
.33
.42
.51
.61
.69
.81
.90
1.01
1.11
1.22
1.32
1.44
1.53
1.64
1.74
1.84
1.94
2.06
2.17
ifi2g
7
0.0004
.0009
.0017
.0027
.0040
.0058
.0074
.0102
.0126
H
8
0.1844
.2449
.3047
.3687
.4270
.4915
.5434
.6032
.6656
.0159 .7179
.0188
.0231
.0271
.0322
.0361
.0418
.0471
.0526
.0585
.0660
.0732
.7878
.8501
.9091
.9812
1.0344
1.0978
1. 1611
1.2236
1.2895
1.3510
1.4122
Jf*
9
0.0790
.1213
.1684
.2241
.2791
.3441
.4001
.4683
.5435
.6084
.6995
.7837
.8667
.9717
1.0514
1.1505
1. 2510
1.3541
1.4635
1. 5703
1.6779
C
10
3.81
3.82
3.81
3.79
3.77
3.76
3.78
3.84
3.80
3.90
3.84
3.86
3.84
3.84
3.85
3.85
3.82
3.82
3.81
3.83
3.85
Bazin's Series, No. 164. Crest length, 6.534 feet. Crest height, 1.64 feet.
Cross section.
1234567891011121314151617181920
0.244.305.367.425.482.540.592.651.702.766.817.877.939.993
1.0521.1151.1621.2191.2771.330
0.1206.1685.2224.2771.3346.3968.4555.5252.5882.6705.7385. 8213.9100.9896
1.07901. 17741.25261.34591.44311.5338
3.863.913.873.903.873.873.943.943.974.004.034.054.074.104.094.124.134.154.184.19
0.467.659.859
1.0801.2961.5361.7972.0692.3342.6842.9783.3253.7044.0554.4174.8625.1635.6026.0196.411
0.25.34.43.52.61.70.81.90.99l.H1.211.321.441.541.641.761.841.962.062.16
0.0009.0018.0030.0042.0058.0076.0102.0126.0152.0188.0228.0271.0322.0369.0418.0482.0526.0597.0660.0725
0.2449.3068.3700.4292.4878.5476.6022.6636.7172.7848.8398.9041.9722
1.02991.09381. 16321.21461.27871.34301.4025
0. 1213.1701.2251.2810.3409.4057.4671.5410.6071.6955.7699.8595.9583
1.0*531. 14421.25431.33921. 44651.55641.6601
3.853.883.823.843.803.793.853.823.843.863.873.873.863.883.863.883.863.873.873.86
84 WEIR EXPERIMENTS, COEFFICIENTS, AND FORMULAS.
Bazin's experiments on weirs of irregular section Continued.
Bazin's Series, No. 165. Crest length, 6.544 feet. Crest height, 1.64 feet.
Cross rection.
Period.
1
12
3
4
5
6
789
10111213141516171819
Observedhead,
experi mentalweir D,in feet.
2
0.337.401.464.528.593.656.720.783.843.904.969
1.0291.0901.1531.2171.2791.3411.4011.448
&
3
0.1957.2540.3161.3836.4567.5313.6109.6929.7740.8595.9538
1.04381.13801.23811.34261.44651.55291.65831. 7424
OL
4
3.563.563.563.553.543.543.543.553.583.613.633.633.643.653.663.683.683.693.73
Q, flowper foot,experimental weir, in
cubic feetper
second.
5
0.698.904
1.1251.3631.6181.8802.1622.4612.7713.1033.4623.7894.1504.5264.9045.3365.7046.1256.490
V
6
0.35.44.54.63.73.82.92
1.021.111.221.331.421.521.621.711.831.922.022.10
& 19
1
0.0019.0030.0045.0062.0083.0105.0132.0162.0192.0231.0275.0313.0359.0408.0455.0521.0573.0634.0686
H
8
0.3389.4040.4685.6342.6013.6665.7332.7992.8622.9271.9965
1.06031.12591.19381.26251.33111.39831.46441.5166
H*
9
0. 1974.2568.3202.3902.4660.5435.6276.7142.8003.8926.9940
1.09131.19481.30461.41781.53551.65301. 77141.8680
C
10
3.543.623.513.493.473.463.443.453.463.473.483.473.473.473.463.483.453.463.47
Bazin's Series, No. 176. Crest length, 6.519 feet. Crest height, 2.46 feet.
Cross section.
123456789
101112131415161718192021
0.237.2%.365.439.494.565.618.682.733.797.861.910.974
1.0271.0881.1391.1961.2481.3031.3551.420
0.1154.1611.2206.2909.3472.4247.4858.5632.6276.7115.7989.8681.9613
1.04081.13491.21561.30791.39421.48741. 57731.6921
2.762.742.922.953.043.103.193.223.293.353.413.453.513.533.573.623.653.683.733.753.80
0.317.441.645.858
1.0551.3181.5501.8132.0662.3852.7242.9953.3733.6714.0344.4164.7825.1155.5585.9256.422
0.12.16.23.30.36.43.50.58.65.73.82.89.98
1.051.141.231.301.381.471.551.66
0.0002.0004.0008.0014.0020.0030.0039.0052.0066.0083.0105.0123.0149.0171.0202.0235.0263.02%.0336.0374.0428
0.2372.2964.3658.4404.4960.5680.6219.6872.7396.8073.8716.9223.9889
1.04411.10821.16251.2231. 27761.33661.39241.4628
0.1154.1611.2214.2919.3494.4281.4905.5695.6366.7250.8129.8853.9835
1.06671.16631.25261.35081.44481.54601.64231.7695
2.752.742.912.943.023.083.163.183.243.293.353.383.433.443.463.523.543.543.603.613.63
WEIK8 OF IKKEGULAB SECTION. 85
Bazin's experiments on weirs of irregular section Continued.
Bazin'a Series, No. 178. Crest length, 6.518 feet. Crest height, 2.46 feet.
Cross section.
Period.
1
123456789
101112131415161718192021
Observed head
experi mental weir D, in feet.
2
0.222.299.367.431.491.556.614.669.732.789.847.906.966
1.0281.0831.1421.1951.2591.3141.3661.424
rf
3
0.1046.1635.2224.2830.3441.4146.4811.5472.6263.7009.77%.8624.9494
1.04231. 12711.22041.30631.41271.50631.59651.6992
Ci
4
2.832.952.%3.083.133.193.243.283.333.363.433.463.513.533.583.603.643.663.693.723.75
Q, flow per foot, experi mental weir, in
cubic feet per
second.
5
0.297.482.658.872
1.0771.3231.5581.7942.0852.3552.6752.9833.3313.6714.0454.3924.7555.1705.5725.9526.375
V
6
0.11.17.23.30.37.47.51.57.65.78.81.89.97
1.051.141.221.301.391.481.551.65
ifl 20
1
0.0002.0004.0008.0014.0021.0034.0040.0051.0066.0083.0102.0123.0146.0171.0202.0231.0263.0300.0341.0374.0423
H
8
0.2222.2994.3678.4324.4931.5594.6180.6741.7386.7973.8572.9183.9806
1.04511.10321.16511.22131.28901.34811.40341.4663
fl*
9
0.1046.1635.2233.2840.3462.4180.4858.5533.6353.7115.7934.8795.9716
1.06831.15841.25751.34921.46351.56511.66181.7750
C
10
2.842.952.953.073.113.163.213.243.283.313.373.393.433.443.493.493.523.533.563.583.69
CORNELL UNIVERSITY HYDRAULIC LABORATORY."
This laboratory, erected in 1898, includes a reservoir formed by a masonry dam on Fall Creek, at Ithaca, N. Y. An experimental chan nel is supplied with water from the pond and has, as its general dimensions, length, 400 feet; breadth, 16 feet; depth, 10 feet; bottom grade, 1:500. Fall Creek drains an area of 117 square miles, and affords a minimum water supply estimated at 12 second-feet. The hydraulic laboratory is located at Triphammer Falls, where a descent of 189 feet occurs. The weirs used in the experiments here described were erected in the concrete-lined experimental channel. The water supply was regulated by wooden head-gates, operated by lever, rack, and pinion, the outflow from the canal passing over the declivity below.
a In reducing the experiments at Cornell hydraulic laboratory the value of g for Ithaca, latitude_ i 2 _
42° 27', altitude 500 feet, has been taken as 32.16, makingl/2jr=8.02,2^=0.015547, gV2gr=5.36.
86 WEIR EXPERIMENTS, COEFFICIENTS, AND FORMULAS.
EXPERIMENTS OF UNITED STATES BOARD OF ENGINEERS ON DEEP
WATERWAYS.
These experiments were performed at Cornell University hydraulic laborator}' in May and June, 1899, for the United States Board of Engineers on Deep Waterways, under the immediate direction of George W. Rafter, engineer for water supply, in conjunction with Prof. Gardner S. Williams. The results of the original computations were published in Trans. Am. Soc. C. E., vol. 44, together with an extended discussion. In the experiments a closely regulated volume of water was passed over a standard thin-edged weir which was placed near the upper end of the experimental canal and had a height of 13.13 feet and a crest length of 16 feet, end contractions suppressed. The nappe was aerated, but was not allowed to expand on downstream side. The water flowed down the experimental canal past a series of screens and baffles and over the experimental weir placed at the lower end of the channel.
The experimental weirs were about 4.5 feet high and 6.56 feet crest length. A leading channel of planed boards, 6.56 feet wide and 48 feet in length, extended upstream from the experimental weir, having at its upper end flaring sides extending 8.3 feet upstream and meeting the sides of the main channel.
The head on both weirs was read by means of open manometers connected to galvanized-iron piezometer pipes, placed horizontally across the bottom of the narrow leading channel, 37 feet upstream from the weir. At the standard weir two piezometers were used, one termed the middle piezometer, placed across the leading channel, 8 inches above the bottom and 10 feet upstream from the standard weir. A second or upstream piezometer was placed 25 feet upstream from the standard weir. Readings of both piezometers were taken. It was decided, however, to use the middle piezometer as the basis of calcu lation of discharge over the standard weir. Near the close of the experiments it was found that this did not give results agreeing with those which would have been obtained from a piezometer placed flush with the bottom of the channel, as is shown to be necessary from the experiments of H. F. Mills a and others. A correction curve was according!}7 deduced from comparative experiments between the middle piezometer and the flush piezometer, and the readings of the middle piezometer thus corrected were applied in the Bazin formula to calcu late the discharge over the standard weir for heads not exceeding the limit of Bazin's experiments. For depths on the standard weir greater than 2 feet the discharge was computed by using coefficients deduced for higher heads on a shorter experimental weir, on the basis of the Francis formula. Owing to the uncertainty as to the piezometers and
a Mills, H. F., Experiments upon piezometers used in hydraulic investigations, Boston, 1878.
U.
8.
GE
OLO
GIC
AL
SU
RV
EY
WA
TE
R-S
UP
PL
Y
PA
PE
R
NO
. 20
0 P
L.
XIII
.$*
___________
£lev
.J04
**
S )
Re
serv
oir w
all
Elev
. /O
Q'-*
] <Low
erw
eirch
am
ber
.'9'..
. ...
^^^^^^^^^iP
Pl^
t^^^itti^^^tT
O^
W.S
.In re
&er
roir
with
flas
hboa
rd
= /
0<3.
7'
Reg
ulat
ing
gate
s
LO
NG
ITU
DIN
AL
SE
CT
ION
UPP
er
HY
DR
AU
LIC
LA
BO
RA
TO
RY
A
T C
OR
NE
LL
U
NIV
ER
SIT
Y,
ITH
AC
A,
N.
Y.
U. S. GEOLOGICAL SURVEY WATER-SUPPLY PAPER NO. 200 PL. XIV
CORNELL HYDRAULIC LABORATORY, ARRANGED FOR WEIR EXPERIMENTS.
WEIRS OF IRREGULAR SECTION. 87
other conditions, the original results of the experiments were credited with a possible error of 5 or 6 per cent.
In connection with the experiments on models of the Croton dam, a very thorough comparison of the so-called upstream piezometer with other methods of obtaining the head on a standard weir was made by Professor Williams. It was found that the upstream piezometer gave the actual head on the standard weir correctly. These results were com municated to the writer, and a recomputation of the Deep Waterways experiments has been made, using readings of the upstream piezome ter to calculate the standard weir discharge by Bazin's formula. This method of calculation eliminates the necessity for correcting the pie zometer readings at the standard weir, as was necessary in the previous reductions. The discharge over the experimental weir has been cal culated from readings of a piezometer placed 38 feet upstream from the weir and 8 inches above channel bottom, corrected to the basis of a flush piezometer.
The United States Deep Waterways experiments included, for each experimental model, a smaller number of heads or periods than either the Croton or United States Geological Survey experiments. They were also the first experiments of the kind conducted at the Cornell laboratory, and the experience gained has probably contributed to the securing of somewhat greater accuracy in the later experiments. It is believed, however, that, as recomputed, the United States Deep Water ways experiments do not differ much in accuracy from those made on models of the Croton dam, which are stated by John R. Freeman to be reliable within about 2 per cent. The coefficients obtained by recomputation, when compared with the original United States Deep Waterways coefficients, show few differences exceeding 2 per cent. The variations are plus and minus in about equal numbers, and it is believed that these experiments are entitled to greater weight than they have hitherto received.
In the accompanying tables a summary of the recomputation is given.
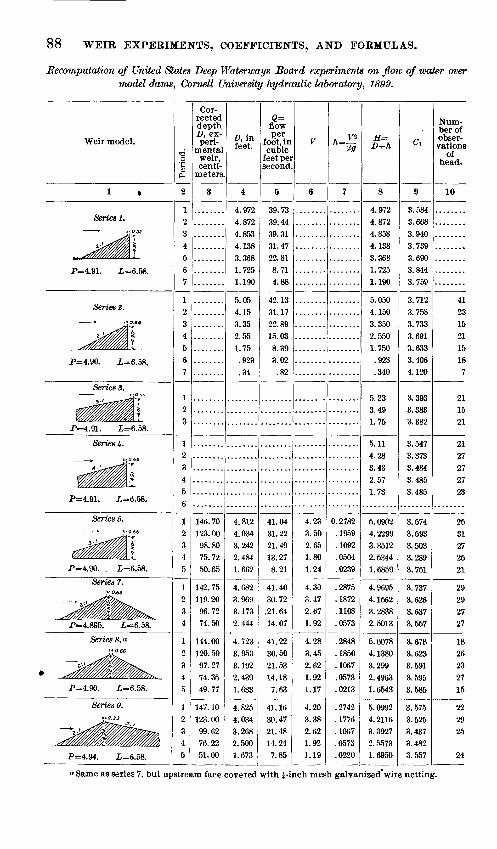
88 WEIR EXPERIMENTS, COEFFICIENTS, AND FORMULAS.
Recomputation of United States Deep Waterways Board experiments on flow of water over model dams, Cornell University hydraulic laboratory, 1899.
Weir model.
1 .
Series 1. * »«o J3
,.t^5|f §
u ^itfiiiiiialP=4.91. i=6.58.
Series 2.__ , ., .
?ug|ljiff?$ji%%j& i
Series 3.
Z%zZ§j%jjJiJjjJli jliliiiilili !
P=4.91. i=6.58.
**^777Z?i%**
V//'/'^//////A*.
P=4.91. i=6.58.
Series 6.
P=4.90. . i=6.58.
Series 7.w 0.66
P=4.886. i=6.58.
Series 8. a" 0.66
P=4.90. £=6.58.
Series 9.<»O.JJ
P=4.94. i=6.58.
Period.
2
1f,34
6
7
1f,3456
7
1f,
1f,3
45
6
12
3
5
12
3 4
1 2
3
5
12 3 45
Cor rected depth D, ex peri
mental weir, centi
meters
3
146. 70 123. 00 98.80 75.72
50.65
142. 75 119.20 96.72
74.50
144.00 120.50 97.27
74.3549.77
147. 10
123.00 99.62 76.2251.00
D, infeet.
4
4.9724.872
4.8534.138
1.7251.190
5.054.15
3.352.551 7"^
.923
.34
4.812
4.034 3.242 2 4841.66?
4.682 3.969 3.173 2.444
4.723 3.953
3.192 2 4391.633
4.825
4.034 3.268 2.5001.673
flow per
foo't, in cubic
feet per second
5
39.7339 44OQ Of
O-l A*]
O*7 $21
8.71
4.88
42.13qi 17
22.8915.03
8 on
3.02.82
41.04 31.22 21.49IS 97
8.21
41.40 30.72
.21.64
14.07
41.22
30.50
21.53 14.187.63
41.16 30.47 21.48 14.247.85
V
6
4.23
3.50 2.65 1.801.24
4.30 3.47 2.67 1.92
4.28
3.45 2.62 1 92
1.17
4.20 3.38 2.62 1.92J.19
-5
7
0. 2782 .1959 .1092
0504.0239
.2875
.1872
.1108
.0573
.2848
.1850
.1067
.0573
.0213
. 2742
.1776
.1067
.0573
.0220
H=D+h
8
4.972
4.8724.8534.1383 0ftC
1.7251.190
5.0504.1503.3502. 5501 7^0
.923
.340
5.233.491 7^
5.11
3.432.571.73
5.0902 4.2299 3.3512 2. 5344
1.6859
4. 9695 4.1562 : (. 2838
2.5013
5.0078
4.1380 3.299
1.6543
5.0992
4. 2116 3.3927 2. 55731. 6950
Ct
9
3. 584
3.6683.9403.739
3 /JQft
3.8443.759
3.7123.758
3.7333.6913.6333.406
4.120
3.3933.3833 O(2O
3.5473.3733.484
3,4853.485
3.574 3.593 3.503q OQQ
3.751
3.737 3.626 3.637 3.557
3.678 3.623 3.5913 CQC
3.585
3.575 3.525 3.437 3.4823.557
Num ber of obser vations
of head.
10
41231521
15187
211521
21
27
272723
25 31
27 2521
29 2927 27
18 26 23 27
15
2229 26
24
a Same as series 7, but upstream face covered with £-inch mesh galvanized*wire netting.
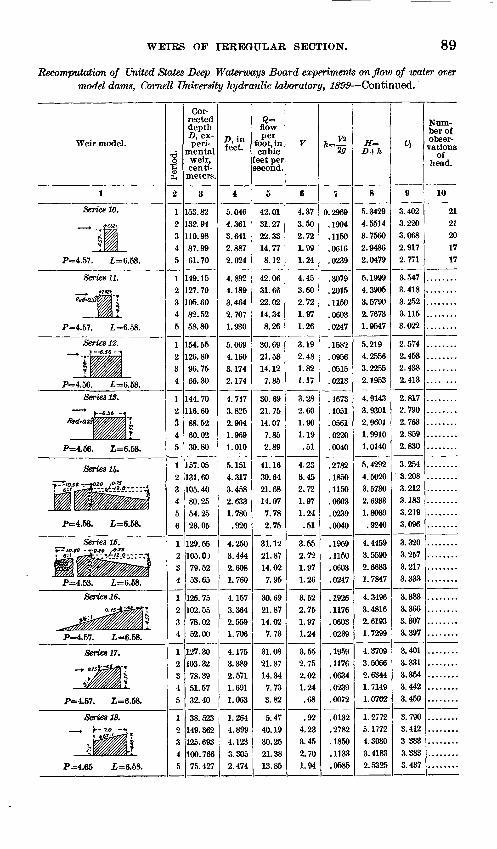
WEIRS OF IRREGULAR SECTION. 89
Recomputation of United States Deep Waterways Board experiments onflow of water over model dams, Cornell University hydraulic laboratory, 1899 Continued.
Weir model.
1
Series 10.
P=4.57. £=6.58.
KaZo^jjjfcl
III?
P=4.57. £=6.58.
Series 12._ » * --*.«- »
kI yym//%w.
P=4.56. £=6.58.Series IS.
'***' %%%%? T
Series Ik.
^'?;5JL;3p-*#*<» -----*^^^^^^^^^_JKm/A w/fflw/y//ffftffjf"m*
P=4.53. L=6.58.
(^11 llPlllii^ZJBjff?J?8j YtfavmtmnwmffilAP=4.53. £=6.58.
J^ife^llllllI^^*rf^ffi/my/y//y//ssffifflLt.P=4.57. L=6.58.
~* * '^HHR^Millllx
P=4.57. L=6.58.
yiil^lfl>-$jjjJlfc[
P=4.65 L=6.58.
Period.
2
1
2
3 45
191
5
12
4
1
A
45
12
4
5
1
4
1
2
4
1
2
4
5
12
45
Cor rected depth D, ex peri
mental weir, centi
meters.
3
153.82 132.94 110.98 87.99 61.70
149.15127. 70105.60
SO f\O
58.80
1KJ CK
96.7566.30
144 70
OQ EO
60.02*>A QA
157.05m fift
105. 40on OP;
54.25Oft AC
129.55105.0)
W to
53.65
126. 75102.55
*7Q AO
52.00
127 30f A;*} Q.>
*7ft $Q
51.5732 40
OQ KOO
14Q OCrt
lot AQQ
75.427
A infeet.
4
5.046 4.361 3.641 2.887 2.024
4.8924 -IQQ
3.4642.7071.930
5.0694.1603 174
2.174
4.747D QOR
2 904
1.9691.010
5.151
4 Q1 P7
3.4582.6331.780
.920
3 444
2 6081.760
4.157
3 3642 559'1.706
4.1753.3892.571
1.691
1 264
4 OQQ
4.1233.3052.474
flow per
foot, in cubic
feet per second.
5
42.01 31.27 22.33 14.77 8.12
42.0631.6622.0214 348.26
30 6991 *\R
14.127.85
QA £Q
21.75
14.077.852 QQ
30 6421 6814.077.782 *7*\
Ql -10
*>1 ft7
14.027.95
Ort £Q
O1 ft*7
14.027.73
31.08O1 ft7
14 *Ll
7 *7Q
3 QO
p; 47
40.19On Ofi
O1 Qft
TO Qt
F
6
4.37 3.50 2.72 1.99 1.24
4.453.602.72i or1.26
3.192.481.821.17
3 0Q
2.601.901.19
.51
4 OQ
3.452.721 Q7
1.24
.51
o te
2.721 Q7
1.26
Q CO
2 »7t
1 Q7
1.24
3.552 >7t
2.021.24
oo
924.233.452.701 94
-5
7
0.2969 .1904 .1150 ,0616 .0239
OA7Q
.20151 ifinACAQ
.0247
.1582
.0515
.0213
icrrQ
.1051
.02200040'
0700
.186011 ^n
.0239 nrun
1QCQ
.1150AAAQ
.0247
1QOC
1 -it?/;
AfiAQ
.0239
1959.11760634/U>OA
n(VJ9
.01320700
icrn
.11330585
H=D+h
S
5.3429 4.5514 3.7560 2.9486 2.0479
5.19994.39053.57902.76731.9547
5.2194.25563.22552.1953
4.91433 QOA1
2 Qftf|1
1.99101.0140
5.42924.50203.57302.69331.8039
9240
4.44593.55902.66831.7847
4 34963.48162. 61931.7299
4.37093.50662 63441.71491.0702
1.27725. 17724.30803.41832 MOfv
d
9
3.402 3.220 3.068 2.917 2.771
3.5473.4183.2523.1153.022
2.5742 4582.4382.413
2.8172.7902.7632.8592.830
3.2543.2083.2123.183
* Z1V
3.0%
3.3203.2573.217
Odd
3.3833.3663.3073.397
3.4013.3313.3543.4423.450
3.7903.4123 3883.3833.437
Num ber of obser vations
of head.
10
21 21 20 17 17
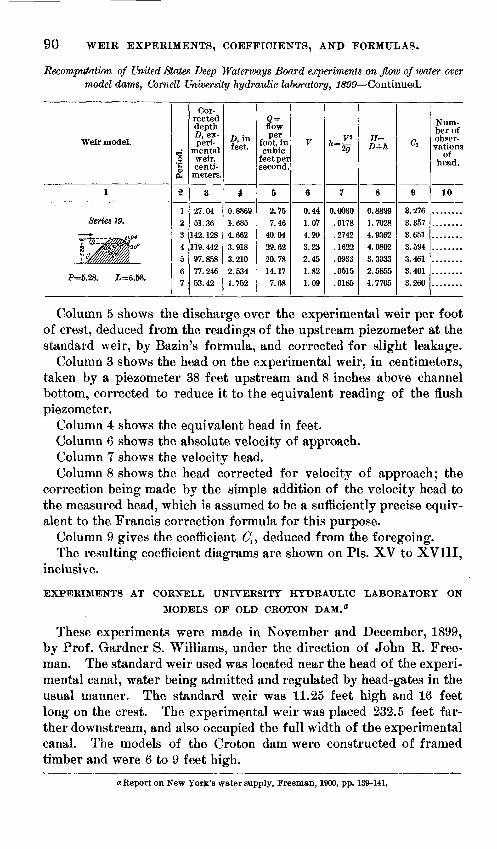
90 WEIR EXPERIMENTS, COEFFICIENTS, AND FORMULAS.
Recomputation of United States Deep Waterways Board experiments on flow of water over model dams, Cornell University hydraulic laboratory, 1899 Continued.
Weir model.
1
Series 19._ *"^ii$liii*»»*3^/Mm
P=6.28. L=6.58.
Period.
2
1?34567
Cor rected depth D, ex peri
mental weir, centi
meters.
3
27 0451.36
142. 128119. 44297.85877.24663.42
D, infeet.
I
O QfifiQ
1,6854.6623.9183.2102 5341.762
Q= flow per
foot, in cubic
feet per second.
5
2.757.46
40.0429.6220.7814.177.68
V
6
0 441.074.203.232.451 QO
1.09
* V2A=27
7
0 0030.0178.2742.1622.0933.0515.0185
H=D+h
8
0.88991.70284. 93624.08023.30332.58551.7705
Ci
9
3.2763.3573.6513.5943.4613.4013.260
Num ber of obser vations
of head.
10
Column 5 shows the discharge over the experimental weir per foot of crest, deduced from the readings of the upstream piezometer at the standard weir, by Bazin's formula, and corrected for slight leakage.
Column 3 shows the head on the experimental weir, in centimeters, taken by a piezometer 38 feet upstream and 8 inches above channel bottom, corrected to reduce it to the equivalent reading of the flush piezometer.
Column 4 shows the equivalent head in feet.Column 6 shows the absolute velocity of approach.Column 7 shows the velocity head.Column 8 shows the head corrected for velocity of approach; the
correction being made by the simple addition of the velocity head to the measured head, which is assumed to be a sufficiently precise equiv alent to the Francis correction formula for this purpose.
Column 9 gives the coefficient deduced from the foregoing.The resulting coefficient diagrams are shown on Pis. XV to XVIII,
inclusive.
EXPERIMENTS AT CORNELL UNIVERSITY HYDRAULIC LABORATORY ON
MODELS OF OLD CROTON DAM. fl
These experiments were made in November and December, 1899, by Prof. Gardner S. Williams, under the direction of John R. Free man. The standard weir used was located near the head of the experi mental canal, water being admitted and regulated by head-gates in the usual manner. The standard weir was 11.25 feet high and 16 feet long on the crest. The experimental weir was placed 232.5 feet far ther downstream, and also occupied the full width of the experimental canal. The models of the Croton dam were constructed of framed timber and were 6 to 9 feet high.
a Report on New Yorlc's water supply, Freeman, 1900, pp. 139-141,
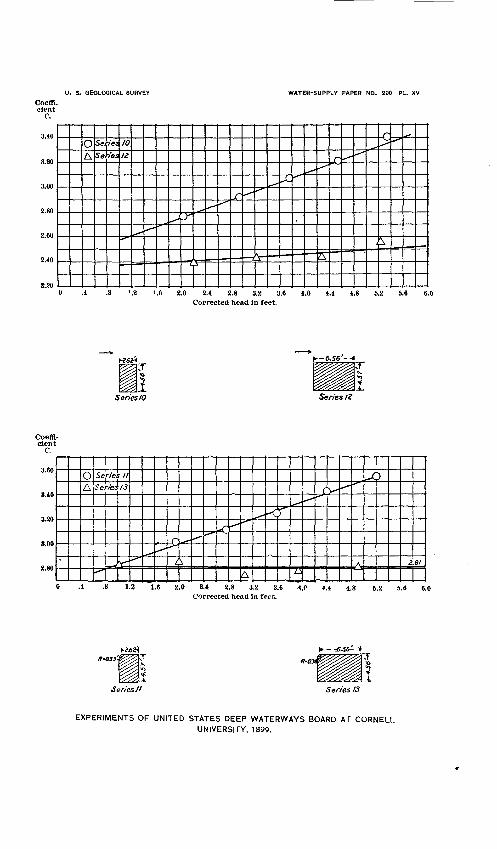
U. S. GEOLOGICAL SURVEY
Coeffi cient
C.
WATER-SUPPLY PAPER NO. 200 PL. XV
Sef/'ea Sen'es
10
'.2 1.6 2.0 2.4 2.8 3.2 3.6 4.0 4.4 4.8 6.2 Corrected head In feet.
h 6.56 -it
Series /2
Coeffl cient
C.
3.60
3.40
3.20
3.00
£.80*
oA
Se
Se
-"
rie,&
0 .4 .8
#*e33
S
f //
T"**
1.2
m
^^^c*>
--
^*^
^
^~ "^ ^f* ****
f\
^ nr^-»
^
*-*
1.6 2.0 2.4 2.8 3.2 3.6 <\.f- Corrected head in feet.
i^ ff-flj 0*i
zrfesJt
^>- ^^ "^
A
4.4 4.8
Series /3
^b
2
5.2 5.6 6
TIS <*A
EXPERIMENTS OP UNITED STATES DEEP WATERWAYS BOARD AT CORNELL. UNIVERSITY, 1899.
U.
8.
GE
OLO
GIC
AL
SU
RV
EY
W
ATE
R-S
UP
PLY
P
AP
ER
N
O.
200
PL.
XV
I
Coeffi
cie
nt
C. 3.80
3.60
3.40
3.20
1i
i
^^prC
^C
II
1 1
1 1
cK
"*
*
( 5k
A
D
?
1 1
lllb
N.
**
x
10 ~
i0
|
... *
*n
1^
II
=Q-
i
« !
1
0.6
7'
1-.
9I'
voss
>
fU
''
Co«
fflc
3.
70
3.60
3.50
3.40
3.30
1
AVE
1 '
1 le
nt
C. rt
Co
rnel\
\^\\
Ss s
/ experim
ent
S£
t?/£
S /
3
L> s /-* s,/8
.\ 99
( \S
, s
.1
8.1
3.1
4.1
5.1
6.1
7.
Batter
upst
ream
fa
ce.
RA
GE
C
ON
ST
AN
T C
OE
FF
ICIE
NT
F
OR
H
EA
DS
E
XC
EE
DIN
G 2
F
E
n
u
i ET
.
bi
**
3.11
3.
70
3.58
3.49
3.39
2.0
3.0
4,0
Cor
rect
ed h
ead
Hin
fee
t.
EX
PE
RIM
EN
TS
O
F
UN
ITE
D
ST
AT
ES
D
EE
P W
AT
ER
WA
YS
B
OA
RD
A
T C
OR
NE
LL
U
NIV
ER
SIT
Y,
1899
.
U. 8. GEOLOGICAL SURVEY WATER-SUPPLY PAPER NO. 200 PL. XVII
Corrected head in feet. 0 .4 .8 1.2 1.6 2.0 2.4 2.8 3.2 3.6 4.0 4.4 4.8 5.2 5.6
-o^_^
(
s
D5e«es t4 & S'eries IS
*-- -IO.S8 -4
ERIESI4. Sharp upstream angle " tS . Upstream angle rounded;
rad.= 0.33 '
«o Q
-,n
'
^IV ^z
0 .4 .8 1.8 1.6 2.0 8.4 2.8 3.8 3.6 4.0 4.4 4.8 5.2 5.6 Corrected head H in feet.
EXPERIMENTS OF UNITED STATES DEEP WATERWAYS BOARD AT CORNELL UNIVERSITY, 1899.
U. S. GEOLOGICAL SURVEY WATER-SUPPLY PAPER NO. 200 PL. XVIII
Crest batter 6:/. , 4.5'
0 .1 .8 1.2 1.6 2.0 2.1 2.8 3.!! 3.6 4.0 4.1 1.8 5.2
1.2 1.6 2.0 2.4 2.8 3.2 3.6 1.0 1.4 1.8 5.2 Corrected head Hin feet.
-U_Fl
f - 7.o'--^
Series /8, /ndian Lake
© *^
St Rl, f5 18
-* ® s&»3 ±2
.1 .8 1.2 1.6 2.0 2.4 2.8 3.2 3.6 1.0 1.1 1.8 5.2 6.6 Corrected head Hin feet.
* '- & T*^$i%30°*/%%/////& 3.Series 19,
submerged weir section
®-==do> -^>.^-- ^^
Si /?/, s /3
*^- ^^« ,»^" CD -0
3.6 3
1.6 2.0 2.1 2.8 3.2 3.6 1.0 4.4 1.8 5.2 5.6 6.0 Corrected head Hin feet.
EXPERIMENTS OF UNITED STATES DEEP WATERWAYS BOARD AT CORNELL
UNIVERSITY, 1899.
WEIRS OF IRREGULAR SECTION. 91
The head on the weirs was measured by means of open glass manom eters connected to piezometer tubes in the channel above each weir. The piezometer tubes were made of 1-inch galvanized-iron pipe with small holes drilled along the sides, the ends being plugged. At the standard weir three piezometers were used, placed parallel to the cur rent, at about mid-depth of the channel, one being near each side and one at mid-width of the channel, the mid-length of the pipes being 26.5 feet upstream from the standard weir. A hook gage in the same section was used to check the observed head.
Experiments on volume of flow over models of old Croton dam, Cornell University hydrau lic laboratory, 1899.
1
Series 1 Modtl A.
Round crest, old Croton dam, smooth pine,crest and slope 16 feet long. Nov. 28-29,1899.
Series la Model A.
Round crest, old Croton dam, unplanedplank, crest 16 feet long, smooth slope.Nov. 6, 1899.
Series % Model A.
Round crest, old Croton dam, 16-foot smoothcrest, rough slope formed of cleats andstone to simulate concrete and riprap. Dt c.4, 1899.
Series 3 Model A.
Round crest, old Croton dam, 16-foot crest,covered with wire cloth of No. 18 wire,J-inch mesh.a rough slope, as in series 2.Nov. 28, 1899.
PeriodNo.
2
123456
1234567
123456789
12345
Ob served depth
on model dam,
in feet.
3
2.72292.18671.4388.9830.5907.1230
2.08971.82931.58781.2562.9929.6301.4871
2.92272.85912.49482.14201.62381.25971. 1419.7196.4873
2.00301.4091.8675.4288.1184
Mean veloc ity of ap
proach, in feet
per ^econd.
4
1.6851.283
.749
.449
.219
.024
.978
.810
.661
.467
.338
.175
.111
1.8391.7941.5161.248.880.623.545.288.166
1.124.712.366.133.020
Correc tion for
velocity of ap
proach, in feet.
5
0.0439.0259.0087.0031.0008.0000
.0149
.0102
.0068
.0034
.0018
.0004
.0002
.0526
.0500
.0357
.0241
.0120
.0060
.0046
.0013
.0004
.0197
.0078
.0021
.0003
.0000
Cor rected headon
model dam,
in feet.
6
2.76682.21161.4475.9861.5915.1230
2.10461.83951.59461.2596.9947.6305.4873
2.97532.90912.53052.16611.63581.26571.1465.7209.4877
2.01871.4129
.8656
.4251
.1144
Discharge
over model dam per
foot of length, in cu
bic feetper second.
7
J4.76210.5625.6043.1541.451.147
9.5787.8836.2844.2873.0061.494.991
16. 17515.96912.93310.2116.7404.5483.913
.1.9451.087
9.0375.3082.527.861.124
8
3.2083.2113.2183.2223.1903.408
3.1373.1603.1213.0323.0302.9882.913
3.8403.2183.2133.2033.2223.1943.1883.1783.192
3.1483.1613.1383.0993.205
a In experiments with wire cloth over crest, 0.004 foot is deducted from observed depth to compensate for thickness of wire,
940289 O 51 8
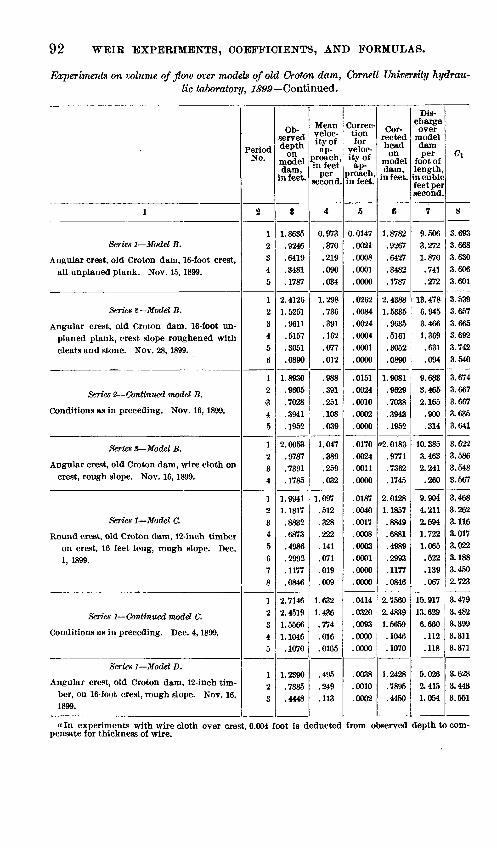
92 WE1E EXPERIMENTS, COEFFICIENTS, AND FORMULAS.
Experiments on volume of floiv over models of old Croton dam, Cornell University hydrau lic Laboratory, 1899 Continued.
1
Series 1 Model B.
Angular crest, old Croton dam, 16-foot crest,all unplaned plank. Nov. 15, 1899.
Series 2 Model B.
Angular crest, old Croton dam, 16-foot unplaned plank, crest slope roughened withcleats and stone. Nov. 28, 1899.
Series % Continued model B.
Conditions as in preceding. Nov. 16, 1899.
Series S Model B.
Angular crest, old Croton dam, wire cloth oncrest, rough slope. Nov. 16, 1899.
Series 1 Model C.
Round crest, old Croton dam, 12-inch timberon crest, 16 feet long, rough slope. Dec.1, 1899.
Series 1 Continued model C.
Conditions as in preceding. Dec. 4, 1899.
Series 1 Model D.
Angular crest, old Croton dam, 12-inch timber, on 16-foot crest, rough slope. Nov. 16,1899.
Period No.
2
12
345
12
345
6
12-3
45
12
34
12
34
567
8
12
345
12
3
Ob served depth
on model dam,
in feet.
3
1.8635.9246.6419.3481.1787
2. 41261.5251
.9611
.5157
.3051
.0890
1.8930.9605.7028.3941.1952
2.0053.9787.7391.1785
Mean veloc ity of ap
proach, in feet
per second.
4
0.973.370.219.090.034
1.298.736.391.162.077.012
.988
.391
.251
.108
.039
1.047.389.259.032
1.9941 1.0971. 1817.8832.6873.4986.2992.1177.0846
2. 71462.45191.55661.1046.1070
1.2390.7885.4448
.512
.328
.222
.141
.071
.019
.009
1.6321.436.774.016.0165
.495
.249
.113
Correc tion for
veloc ity of
ap proach, in feet.
5
0.0147.0021.0008.0001.0000
.0262
.0084
.0024
.0004
.0001
.0000
.0151
.0024
.0010
.0002
.0000
.0170
.0024
.0011
.0000
.0187
.0040
.0017
.0008
.0003
.0001
.0000
.0000
.0414
.0320
.0093
.0000
.0000
.0038
.0010
.0002
Cor rected head on
model dam,
in feet.
6
1.8782.9267.6427.3482.1787
2.43881.5335.9635.5161.3052.0890
1.9081.9629.7038.3943.1952
a2. 0183.9771.7362.1745
2.01281.1837.8849.6881.4989.2993.1177.0846
2.75602.48391.5659.1046.1070
1.2428.7895.4450
Discharge over
model dam per
foot of length, in cubic feet persecond.
7
9.5063.2721.870.741.272
13. 4786.9453.4661.369
.631
.094
9.6833.4652.165
.900
.314
10.3853.4632.241
.260
9.9044.2112.5941.7221.065.522.139.067
15.91713.6296.660.112.118
5.0262.4151.054
Ci
8
3.6933.6683.6303.6063.601
3.5393.6673.6653.6923.7423.540
3.6743.6673.6673.6353.641
3.6223.5863.5483.567
3.4683.2623.1163.0173.0223.1883.4502.723
3.4793.4823.3993.3113.371
3.6283.4433.551
a In experiments with wire cloth over crest, 0.004 foot is deducted from observed depth to com pensate for thickness of wire.
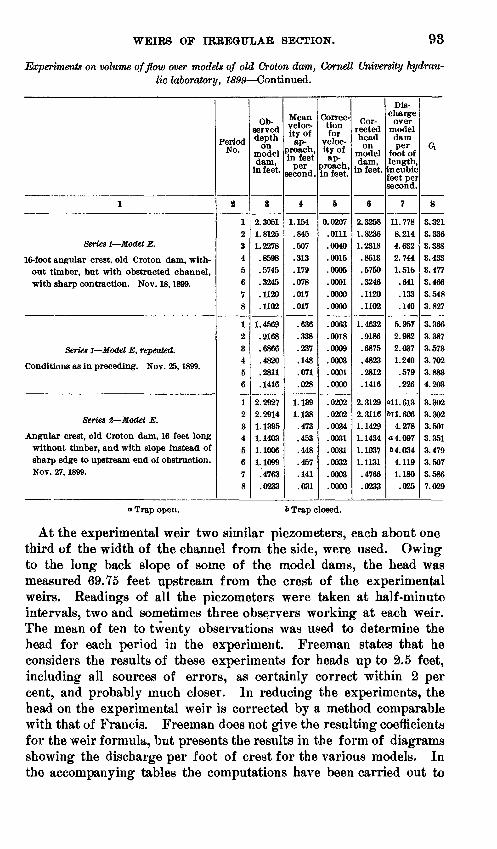
WEIRS OF IRBEGHTLAB SECTION. 93
Experiments on volume of flow over models of old Croton dam, Cornell University hydrau lic laboratory, 1899 Continued.
1
Series I Model E.
16-foot angular crest, old Croton dam, without timber, but with obstructed channel,with sharp contraction. Nov. 18, 1899.
Series l Model E, repeated.
Conditions as in preceding. Nov. 25, 1899.
Series 2 Model E.
Angular crest, old Croton dam, 16 feet longwithout timber, and with slope instead ofsharp edge to upstream end of obstruction.Nov. 27, 1899.
Period No.
2
12345678
1234 56
12345678
Ob served depth
on model dam,
in feet.
3
2.30511.81251.2278.8598.5745.3245.1120.1102
1.4569.9168.6866.4820 .2811.1416
2.29272.29141.13951.14031.10061.1099.4763.0233
Mean veloc ity of
ap proach, in feet
per second.
4
1.154.845.507.313.179.078.017.017
.636
.338
.237
.148
.071
.028
1.1391.138.473.453.448.457.141.031
Correc tion for
veloc ity of
ap proach, in feet.
5
0.0207.0111.0040.0015.0005.0001.0000.0000
.0063
.0018
.0009
.0003
.0001
.0000
.0202
.0202
.0034
.0031
.0031
.0032
.0003
.0000
Cor rected head on
model dam,
in feet.
6
2.32581.82361.2318.8613.5750.3246.1120.1102
1.4632.9186.6875.4823 .2812.1416
2.31292. 31161.14291.14341.10371.1131.4766.0233
Discharge
over model dam per
foot of length, in cubic feet persecond.
7
11.7788.2144.6322.7441.516.641.133.140
5.95T2.9822.0371.240 .579.226
all. 613611.606
4.278a4.09764.034
4.1191.180.025
d
8
3.3213.3363.3883.4333.4773.4663.5483.827
3.3663.3873.5733.702 3.8834.203
3.3023.3023.5013.3513.4793.5073.5867.029
a Trap open. ft Trap closed.
At the experimental weir two similar piezometers, each about one third of the width of the channel from the side, were used. Owing to the long back slope of some of the model dams, the head was measured 69.75 feet upstream from the crest of the experimental weirs. Readings of all the piezometers were taken at half-minute intervals, two and sometimes three observers working at each weir. The mean of ten to twenty observations was used to determine the head for each period in the experiment. Freeman states that he considers the results of these experiments for heads up to 2.5 feet, including all sources of errors, as certainly correct within 2 per cent, and probably much closer. In reducing the experiments, the head on the experimental weir is corrected by a method comparable with that of Francis. Freeman does not give the resulting coefficients for the weir formula, but presents the results in the form of diagrams showing the discharge per foot of crest for the various models. In the accompanying tables the computations have been carried out to
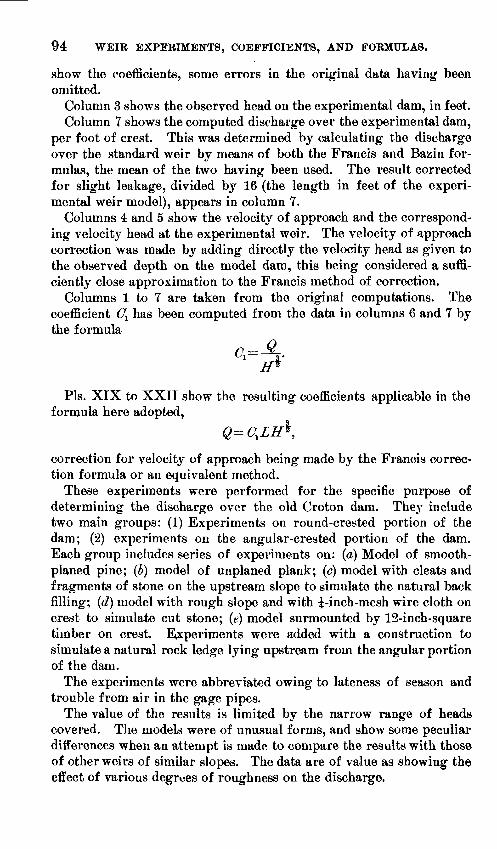
94 WEIR EXPERIMENTS, COEFFICIENTS, AND FORMULAS.
show the coefficients, some errors in the original data having been omitted.
Column 3 shows the observed head on the experimental dam, in feet.Column 7 shows the computed discharge over the experimental dam,
per foot of crest. This was determined by calculating the discharge over the standard weir by means of both the Francis and Bazin for mulas, the mean of the two having been used. The result corrected for slight leakage, divided by 16 (the length in feet of the experi mental weir model), appears in column 7.
Columns 4 and 5 show the velocity of approach and the correspond ing velocity head at the experimental weir. The velocity of approach correction was made by adding directly the velocity head as given to the observed depth on the model dam, this being considered a suffi ciently close approximation to the Francis method of correction.
Columns 1 to 7 are taken from the original computations. The coefficient Ot has been computed from the data in columns 6 and 7 by the formula
Pis. XIX to XXII show the resulting coefficients applicable in the formula here adopted,
correction for velocity of approach being made by the Francis correc tion formula or an equivalent method.
These experiments were performed for the specific purpose of determining the discharge over the old Croton dam. They include two main groups: (1) Experiments on round-crested portion of the dam; (2) experiments on the angular-crested portion of the dam. Each group includes series of experiments on: (a) Model of smooth- planed pine; (J) model of unplaned plank; (<?) model with cleats and fragments of stone on the upstream slope to simulate the natural back filling; (d) model with rough slope and with i-inch-mesh wire cloth on crest to simulate cut stone; (e) model surmounted by 12-inch-square timber on crest. Experiments were added with a construction to simulate a natural rock ledge lying upstream from the angular portion of the dam.
The experiments were abbreviated owing to lateness of season and trouble from air in the gage pipes.
The value of the results is limited by the narrow range of heads covered. The models were of unusual forms, and show some peculiar differences when an attempt is made to compare the results with those of other weirs of similar slopes. The data are of value as showing the effect of various degrees of roughness on the discharge,
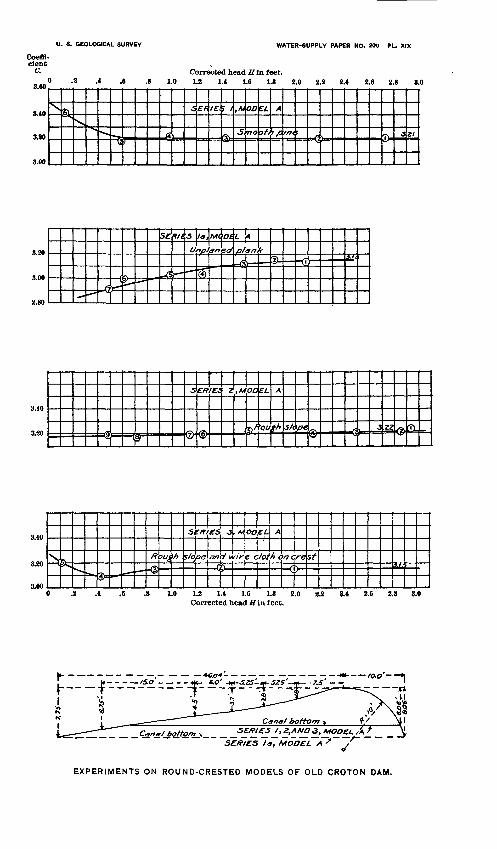
U. 8. GEOLOGICAL SURVEY WATER-SUPPLY PAPER NO. 200 PL. XIX
Coeffi cient
C.
3.60
3.40
3.20
3.00
0
s
Corrected head Hin feet. 2 .1 .6 .8 1.0 1.2 1.1 1.6 1.8 2.0 2.2 2.1 2.6 2.8 3.
rfriN^
"*.
** ' F
i £f IE. f /
n"
,M
St
OD
no
EL
oft
A
*fi t/7t ,v
~ 3 Zl
3.20
3.00
?80^^ *
.,-(\*~
1
y^ **~
_ H>
5 \la\Mt.
Unplan
**~^
O£
id
L 1A
plan.=@
j.'TL -ff
3.40
3.201
1^1
5 etT4-/f 5 2 ,MOO fi
fafad
X
& 3/1pe «^^x 3 .2? (^
""I
>k ^.j^ -- ^**
/?-@
««>h
S,
5/0,
Zffi"pe
£S
an
J
d*
I-
,M
'ir
00£L.'
ec lot
A
he- >ncre
\
sfHi
.6 .8 1.0 1.2 1.1 1.6 1.8 2.0 Corrected head Hin leet.
2.4 2.6 2.8 3.0
S£ff/£S la, MODEL A * /
EXPERIMENTS ON ROUND-CRESTED MODELS OF OLD CROTON DAM.
U. S. GEOLOGICAL SURVEY WATER-SUPPLY PAPER NO. 200 PL. XX
Corrected head Hin feet. 0 .8 .1 .6 .8 1.0 1.8 1.4 1.6 1.8 2.0 8.2 2.4
cientC.
3.10
-d fi>
, -Rl e-s
Ur
1
pi,
M
7/7
OD
W
EL
di'/7>r £ 70
3.80
3.60
8.40
^
d^
P^ <^?>-
oA
-LS£
seffiRl,
Ut
**
-5
rs
P^
z,2,
?/7
MqD£L
MC
r
w/
pA
'i
V7/r
S
fl
®-
cc
*»fo
/V7
"<f|
/»'
«r J
-A
IE
lol
0
>e
^")?
66
<4
/
f
'OA
=
^
=e
&
.s>
/?>
0^
£^
«.
3
Wr
M
r$
00
c/\
EL
\M
B
Ol t G e.
f
if\ 3 02
0 J8 .* .6 .8 1.0 1.2 1.1 1.6 1.8 8.0 2.2 2.1 2.6 Corrected head Hin feet.
SERIES I AND i,MODEL BSERIES J, MODEL B, ROUGH SLOPE
EXPERIMENTS ON ANGULAR-CRESTED MODELS OF OLD CROTON DAM.
U. S. GEOLOGICAL SURVEY WATER-SUPPLY PAPER NO. 200 PL. XX)Coeffi cient
C.
3.60
3.40
3.20
3.00
^
~O
t*v\ ^s
oA
^J
HA
tU
Ur«>/
^
t5ES
fc^
/,/,
fjS
Mt
\4C
<
P£Q£T
&
tti
CC,
f
CO
^
N7
**
IM
A
/ft 1
*** -(.j-_a £
0 .8 .4 .6 .8 1.0 1.2 1.4 1.6 1.8 2.0 9.9 8.4 8.6 8.8 3.0 Corrected head H in feet.
SERIES I, MODEL C
Coeffi cient
C.
3.80
3.60
3.40
-,,\
\@,
si
u^
w,
»K
rs
A
I,-
!
^O
X*
OE
/
)
^y
0 J! .4 .6 .8 1.0 1.8 1.4 1.6 1.8 Corrected head H in feet.
S£tf/£S I, MODEL D
OLD CROTON DAM MODELS WITH CREST TIMBER.
U. 8. GEOLOGICAL SURVEY WATER-SUPPLY PAPER NO. 200 PL. XXII
Coeffl cient
C.
3.80
0 JA
8^0
(
(
r7)^. *^«
<§) ~<i ^^ <?>
5^!f/?J £S
li>-
/, A^
i
[?£)
.
fi £
--< ( V- 3. 3E
0 & A .6 .8 1.0 1.2 1.1 1.6 1.8 8.0Corrected head ff in feet.
8.4 2.6
Coeffi cient
C.
4.40
4.00
3.80
3.60
3.40
a^K
C, CONTINUED
0 .2 .4 .6 .8 1.0 1.2 Li 1.6 1.8 Corrected head Hin feet.
Coeffi cient
C.
3.60
3.40
3.20 .aj Trap
Q.
ope
*«^
,n'
"^*
5£
*w^.
-/?/
».
£-^ 2
C
, A4
^(IT-
If2) f^a
Uoc. EL
* «
y * »
.
* «. * 11-1 "
** 3
la
30
Z
.8 1.0 1.2 1.4 1.6 1.8 8.0 2.2 2.4 Corrected head ff in feet.
SERIES t, MODEL £. End a OpenSERIES Z. MODEL E End & with s/op/ng approach
ANGULAR CROTON DAM MODEL, WITH CONSTRUCTION TO SIMULATE ROCK LEDGE.
WEIKS OF IRREGULAR SECTION. 95
EXPERIMENTS OF UNITED STATES GEOLOGICAL SURVEY AT CORNELL
UNIVERSITY HYDRAULIC LABORATORY.
In April, 1903, the writer was instructed to plan and execute a series of experiments on models of dams similar to those in use at gaging sta tions of the Geological Survey in New York, Michigan, and elsewhere.
The experiments were performed at the hydraulic laboratory of Cornell University, mainly during the months of May and June, 1903, and were conducted, under the supervision of the writer, by Prof. Gardner S. Williams, director of the laboratory.
The various types of dams most commonly occurring were grouped as follows:
1. Weirs with broad horizontal or slightly inclined crests.2. Weirs with vertical downstream faces and inclined upstream
slopes.3. Weirs having compound slopes, including those with inclined
upstream faces and with either broad crests or with sloping aprons.4. Completely or partially curved weir sections, including those of
ogee profile.It was found impossible to include in the experiments all the forms
of section desired, and it was accordingly determined to limit the experiments to the thorough studjT of two classes weirs with broad crests and weirs with ogee sections and to extend, if possible, the measurements to include dams with vertical downstream faces and sloping upstream approaches. The order of operation used in pre vious experiments was transposed, the experimental models being built on a bulkhead forming the standard weir hitherto used and located near the head of the experimental canal.
The quantity of water passing over the experimental weir was meas ured on a standard weir below, 6.65 feet high and having a crest length of 15.93 feet. The head on the standard weir was measured in a Bazin pit, 3 by 4 feet in section, reaching to the depth of the bottom of the canal, and communicating therewith through a pipe 4 inches in diameter and about 3.5 feet long, opening at the bottom of the channel of approach, 29.88 feet upstream from the weir. The head on the stand ard weir was observed in the gage pit by means of a hook gage read ing to millimeters and estimated to about one-fifth millimeter. The conditions at the standard weir were thus closely comparable to those obtained in Bazin's experiments, and his formula for this height and length of weir was applied to determine the discharge. Observations to determine the leakage between the experimental and standard weirs were made, and corrections were applied for whatever leakage was indicated, the amount being usually less than 0.01 cubic foot per second per foot of crest. The discharge over the standard weir was com-
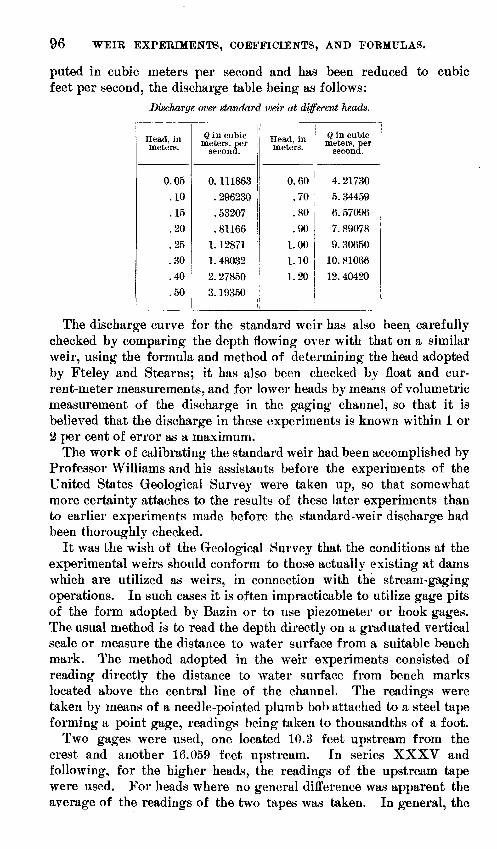
96 WEIR EXPERIMENTS, COEFFICIENTS, AND FORMULAS.
puted in cubic meters per second and has been reduced to cubic feet per second, the discharge table being as follows:
Discharge over standard weir at different heads.
Head, in meters.
0.05
.10
.15
.20
.25
.30
.40
.50
Q in cubic meters, per
second.
0. 111863
. 296230
. 53207
. 81166
1. 12871
1. 48032
2. 27850
3. 19350
Head, in meters.
0.60
.70
.80
.90
1.00
1.10
1.20
Q in cubic meters, per
second.
4. 21730
5. 34459
6. 57096
7. 89078
9. 30650
10. 81066
12. 40420
The discharge curve for the standard weir has also been carefully checked by comparing the depth flowing over with that on a similar weir, using the formula and method of determining the head adopted by Fteley and Stearns; it has also been checked by float and cur rent-meter measurements, and for lower heads by means of volumetric measurement of the discharge in the gaging channel, so that it is believed that the discharge in these experiments is known within 1 or % per cent of error as a maximum.
The work of calibrating the standard weir had been accomplished by Professor Williams and his assistants before the experiments of the United States Geological Survey were taken up, so that somewhat more certainty attaches to the results of these later experiments than to earlier experiments made before the standard-weir discharge had been thoroughly checked.
It was the wish of the Geological Survey that the conditions at the experimental weirs should conform to those actually existing at dams which are utilized as weirs, in connection with the stream-gaging operations. In such cases it is often impracticable to utilize gage pits of the form adopted by Bazin or to use piezometer or hook gages. The usual method is to read the depth directly on a graduated vertical scale or measure the distance to water surface from a suitable bench mark. The method adopted in the weir experiments consisted of reading directly the distance to water surface from bench marks located above the central line of the channel. The readings were taken by means of a needle-pointed plumb bob attached to a steel tape forming a point gage, readings being taken to thousandths of a foot.
Two gages were used, one located 10.3 feet upstream from the crest and another 16.059 feet upstream. In series XXXV and following, for the higher heads, the readings of the upstream tape were used. For heads where no general difference was apparent the average of the readings of the two tapes was taken. In general, the
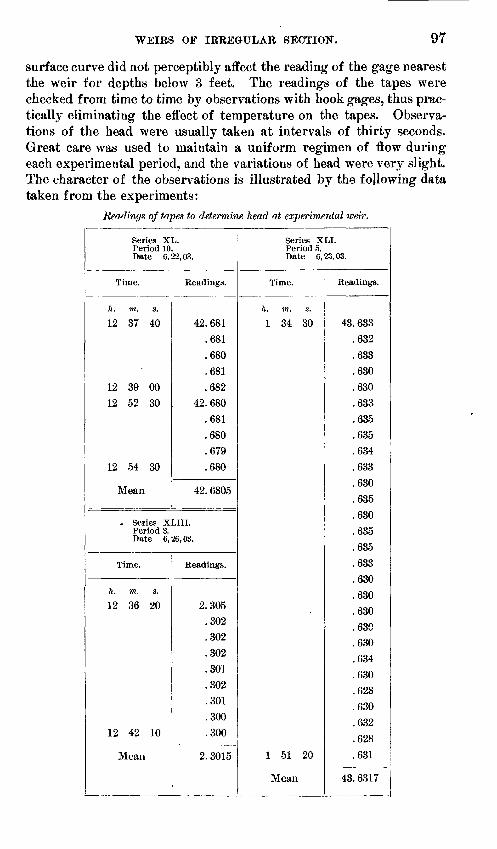
WEIRS OF IRREGULAR SECTION. 97
surface curve did not perceptibly affect the reading of the gage nearest the weir for depths below 3 feet. The readings of the tapes were checked from time to time by observations with hook gages, thus prac tically eliminating the effect of temperature on the tapes. Observa tions of the head were usually taken at intervals of thirty seconds. Great care was used to maintain a uniform regimen of now during each experimental period, and the variations of head were very slight. The character of the observations is illustrated by the following data taken from the experiments:
Readings of tapes to determine head at experimental weir.
Series XL. Period 10. Date 6,22,03.
Time.
ll. TO. S.
12 37 40
12 39 00
12 52 30
12 54 30
Mean
Readings.
42. 681
.681
.680
.681
.682
42. 680
.681
.680
.679
.680
42. 6805
- Series XLIII.Period 3.Date 6,26,03.
Time.
h. m. s.
12 36 20
12 42 10
Mean
Readings.
2.305
.302
.302
.302
.301
.302
.301
.300
.300
2. 3015
Series XLI. Period 5. Date 6,23,03.
Time.
/*.. m. s.
1 34 30
1 51 20
Mean
Readings.
43. 633
.632
.633
.630
.630
.633
.635
.635
.634
.633
.630
.635
.630
.635
.635
.633CO A. boU
.630
.630
.630
.630
.634
.630
.628
.630
.632
.628
.631
43. 6317
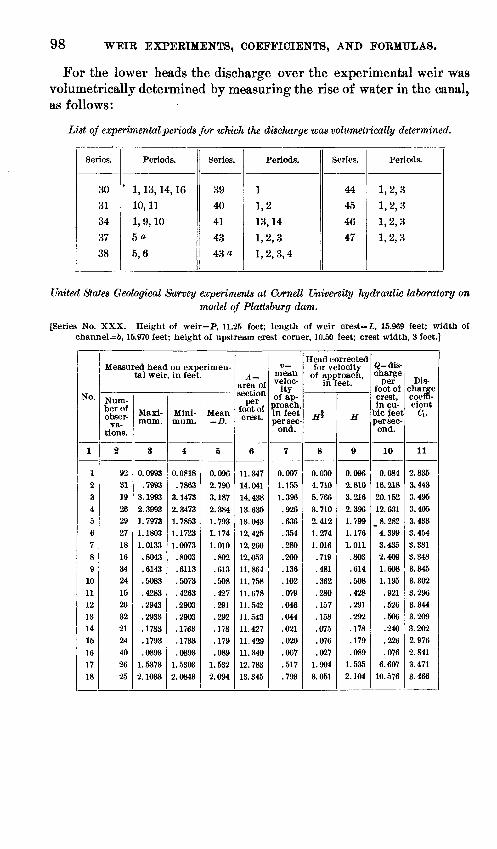
98 WEIE EXPERIMENTS, COEFFICIENTS, AND FORMULAS.
For the lower heads the discharge over the experimental weir was volumetrically determined by measuring the rise of water in the canal, as follows:
List of experimental periods for which the discharge was volumetrically determined.
Series.
30
31
34
37
38
Periods.
' 1, 13, 14, 16
10,11
1, 9, 105«
5,6
Series.
39
40
41
4343 n
Periods.
1
1,2
13,14
1,2,3
1,2,3,4
Series.
44
45
46
47
Periods.
1,2,3
1,2,3
1,2,3
1,2,3
United States Geological Survey experiments at Cornell University hydraulic laboratory onmodel of Plattsburg dam.
[Series No. XXX. Height of weir=P, 11.25 feet; length of weir crest=Z,, 15.969 feet; width of channel=b, 15.970 feet; height of upstream crest corner, 10.50 feet; crest width, 3 feet.]
No.
1
12
3456
789
101112131415
161718
Measured head on experimen tal weir, in feet.
Num ber of obser
vations.
2
92
3119
262927
18163424
1520322124402625
Maxi mum.
3
0.0993.7993
3.1993
2.39931.79731.1803
1.0133.8043
.6143
.5083
.4283
.2943
.2933
.1783
.1793
.08931.53732.1033
Mini mum.
4
0. 0818.7863
3. 14732. 34731.78531. 17231.0073.8003.6113.5073.4263.2903.2903
.1763
.1733
.08931.53032.0843
Mean =D.
5
0.0%
2.7903.1872.3841.7931.1741.010.802.613.508.427.291.292.178.179
..0891.532
2.094
A = area of section
per foot of crest.
6
11.34714.04114. 43813.63513.04312.42512.26012.05311.86411.75811. 67811.54211.54311. 42711.42911, 340
12.78313.345
v= mean veloc
ity of ap
proach, in feet per sec
ond.
1
0.0071.1551.3%.926.636.354.280.200.136.102.079.046.044.021.020.007.517
.793
Head correctedfor velocity
of approach, in feet.
H%
8
0.0304.7105.7663.7102.4121.2741.016.719.481.362.280.157.158.075.076.027
1.9043.051
H
9
0.0%2. 8103.216
2.3961.7991.1761.011.803.614.508.428.291.292.178.179.089
1.5352.104
Q=dis- charge
per foot of crest, in cu
bic feet per second.
10
0.08416. 21820. 15212.631,8.282
4.3993.4352.4091.6081.195.921.526.506.240.226.076
6.60710.576
Dis charge coeffi cienta.
11
2.8353.443
3.4953.4053.4333.454
3.3813.3483.3453.3023.2%3.3443.2093.2022.9762.8413.4713.466
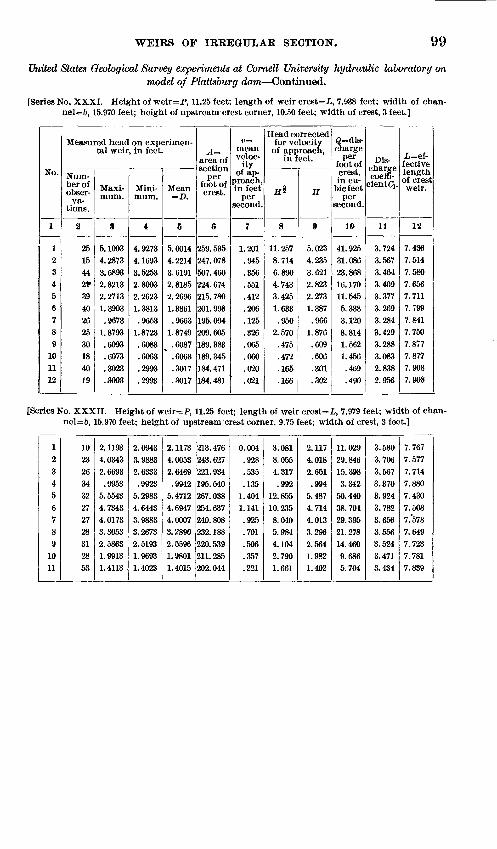
WEIRS OB' IRREGULAR SECTION. 99
United States Geological Survey experiments at Cornell University hydraulic laboratory on model of Plattsburg dam Continued.
[Series No. XXXI. Height of weir=P, 11.25 feet; length of weir crest=Z,, 7.938 feet; width of chan- nel=6,15.970 feet; height of upstream'crest corner, 10.50 feet; width of crest, 3 feet.]
No.
1
123
45
6789
101112
Measured head on experimen tal weir, in feet.
Num ber of obser
va tions.
2
2515
442f39
402625
30184019
Maximum.
3
6.10034.28733.6893
2. 82132.27131.3903
.96731.8793.6093.6073.3023.3003
Minimum.
4
4.92734. 1693
3.52532.80032. 26231.3813.9653
1.8723
.6083
.6063
.2993
.2993
Mean== .D.
5
5.00144. 2214
3. 61912. 81852.26961.3861
.96631.8749
^ .6087.6063.3017.3017
area of section
per foot of crest.
6
259. 535247. 078
507.460224. 674215. 780
201. 998195.094209.605189.383189. 345184. 471
184.481
t>= mean veloc-
of ap proach, in feet
persecond.
7
1.201.945
.356
.551
.412
.206
.125
.826
.065
.060
.020
.021
Head correctedfor velocity
of approach, in feet.
*i
8
11. 2578.714
6.8904.7433.425
1.633.950
2.570.475.472.165.166
H
9
5.0234.235
3.6212.8232.2731.387
.9661.876.609.606
.301
.302
^dis charge
per foot of crest, in cu
bic feetper
second.
10
41.925
31.08623.86816.170
11.5455.3383.120
8.8141.5621.456.469.490
Dis charge coeffi
cient Ci.
11
3.7243.567
3.4643.4093.377
3.2693.2843.4293.288
3.0832.8382.956
Z,=ef- fective length of crest weir.
12
7.4367.5147.580
7.6567.7117.7997.8-41
7.7507.877
7.8777.9087.908
[Series No. XXXII. Height of weir=P, 11.25 feet; length of weir crest=i, 7.979 feet; width of chan- nel=Z>, 15.970 feet; height of upstream'crest corner, 9.75 feet; width of crest, 3 feet.]
12345
67891011
1023263432272728312853
2.11934.03432. 6693.9953
5.55434.73434. 01733.30532.58631.99131.4113
2.09433.98832.6333.9923
5.29834.64433.98833. 26732.51931.96931.4023
2. 11734.00532.6469.9942
5.47124.69474.00073.28902.55961.98011. 4015
213. 476243. 627221.934195.540267.038254.637240.808232.188220. 539211.285202.044
0.004.928.535.135
1.4041.141.925.701.506.357.221
3.0818.0554.317.992
12.85510.2358.0405.9844.1042.7901.661
2.1174.0182.651.994
5.4874.7144.0133.2962.5641.9821.402
11.02929.84615.3983.34250.44038.70429.39521.27814.4609.6865.704
3.5803.7063.5673.3703.9243.7823.6563.6563.5243.4713.434
7.7677.5777.7147.8807.4307.5087.5787.6497.7237.7817.839
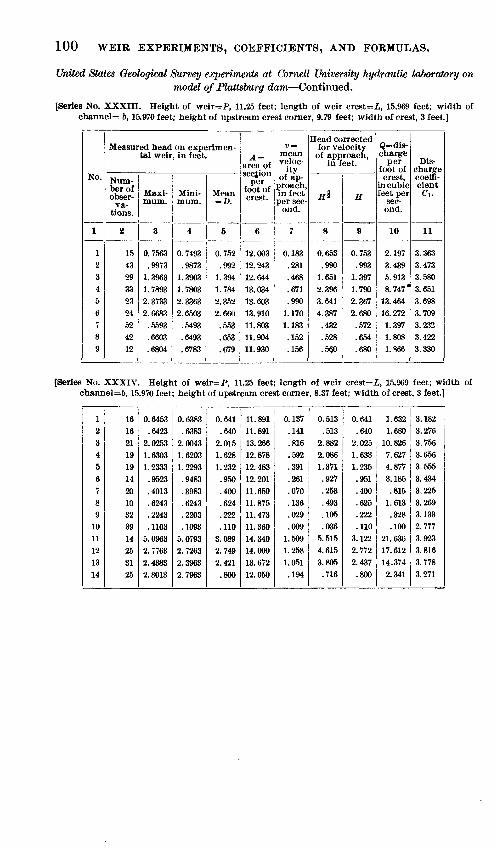
100 WEIK EXPERIMENTS, COEFFICIENTS, AND FORMULAS.
United States Geological Survey experiments at Cornell University hydraulic laboratory on model of Plattsburg dam Continued.
[Series No. XXXIII. Height of weir=P, 11.25 feet; length of weir crest=L, 15.969 feet; width of channel= 6,15.970 feet; height of upstream crest corner, 9.79 feet; width of crest, 3 feet.]
No.
1
123456789
Measured head on experimen tal weir, in feet.
Num ber of obser-
va-tions.
2
154329332324524212
Maxi mum.
3
0.7563.9973
1.39631.78932.37332.6683
.5593
.6603
.6804
Mini mum.
4
0. 7493.9873
1.39031.78032.33632.6503
.5493
.6493
.6783
Mean = D.
5
0. 752.992
1.3941.7842.3522.660
.553
.653
.679
A = area of section
per foot of crest.
6
12. 00312. 24312.64413.03413.60313. 91011.80311.90411.930
v = mean veloc-
ity of ap
proach, in feet per sec
ond.
7
0.183.281.468.671.990
1.1701.183.152.156
Head correctedfor velocity
of approach, iu feet.
H*
8
0.653.990
1.6512.3963.6414.387.432.528.5QO
H
9
0.753.993
1.3971.7902.3672.680
.572
.654
.680
(^dis charge
per foot of crest,
in cubic feet per
second.
10
2.1973.4395.9138.747'
13.46416.2721.3971.8081.S66
Dis charge coeffi cient C,.
11
3.3633.4733.5803.6513.6983.7093.2323.4223.330
[Series No. XXXIV. Height of weir=P, 11.25 feet; length of weir crest=L, 15.969 feet; width of channel=6,15.970 feet; height of upstream crest corner, 8.37 feet; width of crest, 3 feet.]
1234567891011121314
1616211919142010323914253125
0.6453.6423
2.02531.63031.2333.9523.4013.6243.2243.1103
5.09632.77632.43832.8013
0.6383.6383
2.00431.62031.2293.9483.3983.6243.2203.1093
5.07932. 72632.39632.7963
0.641.640
2.0151.6281.232.950.400.624.222.110
3.0892.7492.421.800
11. 89111. 89113.26612. 87812.48312. 20111.65011. 87511. 47311. 36014.34014.00013. 67212.060
0.137.141.816.592.391.261
0.513.513
2.8822.0861.371.927
.070 \ .253
.136
.029
.0091.5091.2581.051.194
.493
.105
.0365. 5154. 6153.805.716
0.641.640
2. 0251.6331.235.951.400.625.222.110
3.1222.7722.437.800
1.6321.680
10. 8267.6274.8773.185.815
1.613.328.100
21.63617. 61214.3742.341
3. 1823.2763.7563.6563.5553.4343.2253.2693.1332.7773.9233.8163.7783.271
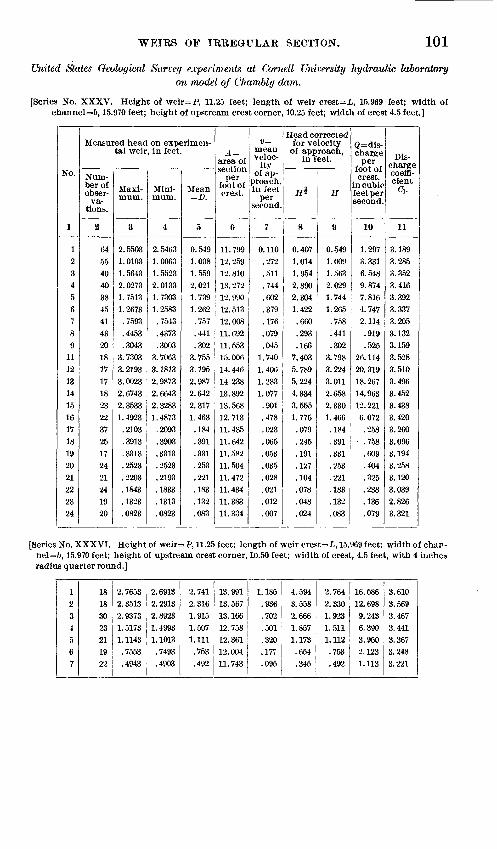
WEIBS OF IRREGULAR SECTION. 101
United States Geological Survey experiments at Cornell University hydraulic laboratoryon model of Chambly dam.
[Series No. XXXV. Height of weir=P, 11.25 feet; length of weir crest=i, 15.969 feet; width of channel=6,15.970 feet; height of upstream crest corner, 10.25 feet; width of crest 4.5 feet.]
No.
1
1234567
89
11121314
15
161718
192021
22
2324
Measured head on experimen tal weir, in feet.
Num ber of obser
va tions.
2
64
554040
384541
4320
18171718
2322
37251724
21241920
Maxi mum.
3
2.55031.01031.5643
2. 02731. 75131. 2673
.7593
.4453
.30433.7303
3. 21933.00232. 6743
2.35331. 4923
. 2103
.3913
.3313
.2523
.2203
.1843
.1323
.0823
Mini mum.
4
2.5463
1.00631. 5523
2. 01331.73031.2583
.7543
.4373
.3003
3.70633. 18132. 98732. 6643
2. 32831. 4873
.2093
.3903
.3313
.2523
.2193
.1833
.1313
.0823
Mean =D.
5
0.5491.0081.5592.0211.7391. 262.757.441.302
3.7553.1952.9872.6422.3171.463.184
.391
.331
.253
.221
.183
.132
.083
A =area of section
per foot of crest.
e
11.79912. 25912. 81013. 272
12.99012. 513
12.00811.69211.55315. 00614. 446
14. 23813.89213.56812.71311. 43511. 64211.582
11.50411.47211.43411.38311. 334
v= mean veloc
ity of ap
proach, in feet
per second.
7
0.110.272.511.744.602.379.176
.079
.045
1.7401.406
1.2831.077
.901
.478
.023
.065
.053
.035
.028
.021
.012
.007
Head corrected for velocity
of approach, in feet.
ffi
8
0.4071.0141.954
2.8902.3041.422.660
.293
.1667.4035.7895. 224
4.3343.5551.775
.079
.245
.191
.127
.104
.078
.048
.024
H
9
0.5491.0091.5632.0291.7441.265.758.441.302
3.7983.2243.011
2.6582.3301.466.184
.391
.331
.253
.221
.183
.132
.083
Q=dis- charge
per foot of crest,
in cubic feet per second.
10
1.297
3.3316.548
9.8747.8164.7472.114
.919
.52526. 114
20. 31918. 26714.96312. 221
6.072.258
.758.609.404.325.238.136.079
Dis charge coeffi cient
Ci.
11
3.1893.2853.3523.4163.3923.3373.2053.1323.1593.528
3.5103.4963.452
3.4383.4203.260
3.0963.1943.2583.120
3.0392.8263.321
[Series No. XXXVI. Height of weir=P, 11.25 feet; length of weir crest=L, 15.969 feet; width of chan- nel=6,15.970 feet; height of upstream crest corner, 10.50 feet; width of crest, 4.5 feet, with 4 iiicheb radius quarter round.]
1234567
18183023211922
2. 76532.35132. 93731.51731. 1143
2. 69132. 29132.89231. 49931. 1013
. 7553 . 7493
.4943 .4903
2.7412.3161.9151.5071.111.753.492
13. 99113.56713.16612. 75812. 36112.00411. 743
1.185.936.702.501.320.177.095
4.5943.5582. 6661.8571.173.654.345
2.7642.3301.9231.5111.112.753.492
16.58612. 6989.2436.3903.9502.1231.113
3.6103.5693.4673.4413.3673.2483.221
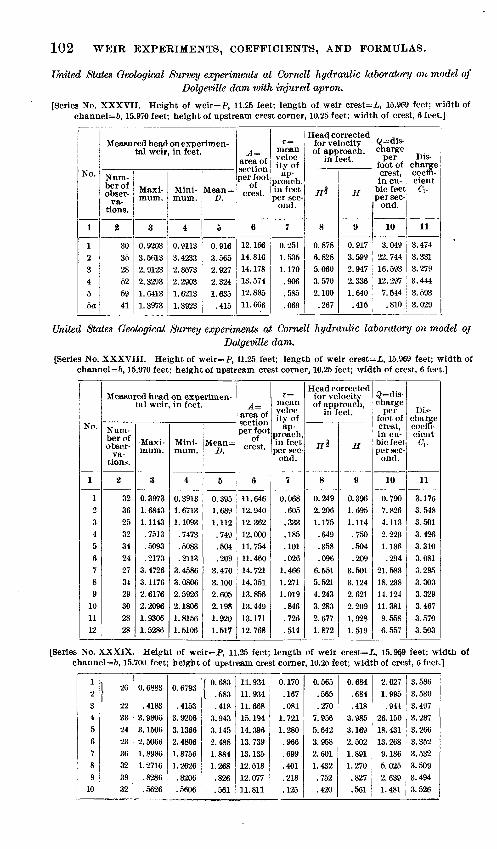
102 WEIR EXPERIMENTS, COEFFICIENTS, AND FORMULAS.
United States Geological Survey experiments at Cornell hydraulic laboratory on model of Dolgeville dam with injured apron.
[Series No. XXXVII. Height of weir=P, 11.25 feet; length of weir crest=A 15.969 feet; width of channel=6,15.970 feet; height of upstream crest corner, 10.25 feet; width, of crest, 6 feet.]
No.
1
123455a
Measured head on experimen tal weir, in feet.
Num ber of obser-
tions.
2
303528525941
Maxi mum.
3
0.92033. 56132. 91232.32931.64131. 3973
Mini mum.
4
0. 91133.42332.85732.29031. 62131.3923
Mean = D.
5
0.9163.5652.9272.3241.635
.415
A = area of section per foot
of crest.
6
12. 16614. 81G14. 17813. 57412.88511.666
I Head corrected
mean veloc ity of
ap proach, in feet per sec
ond.
7
0. 2511.5351.170.906.585.069
for velocity of approach,
in feet.
H%
8
0.8786.8285.0603.5702.100
.267
H
9
0.9173.5992.9472.3361.640.415
Q= dis charge
per foot of crest, in cu
bic feet per sec
ond.
10
3.04922. 74416. 59312. 2977.544.810
Dis charge coeffi cient
Ci.
11
3.4743.3313.2793.4443.5933.029
United States Geological Survey experiments at Cornell hydraulic laboratory on model ojDolgeville dam.
[Series No. XXXVIII. Height of weir=P, 11.25 feet; length of weir crest=A 15.969 feet; width of channel=6,15.970 feet; height of upstream crest corner, 10.25 feet; width of crest, 6 feet.]
No.
1
123456789
101112
Measured head on experimen tal weir, in feet.
Num ber of obser
vations.
2
323625323424273429302828
-Maxi mum.
3
0.39731.68431. 1143.7513.5093.2173
3.47263. 11762. 61762.20961.93061.5286
Mini mum.
4
0. 39131. 67131.1093.7473.5083.2113
3.45863.08062.59262.18061.81561.5106
Mean= D.
5
0.3951.6891.112.749.504.209
3.4703.1002.6052.1981.9201.517
A= area of section per foot
of crest.
6
11.64612. 94012. 36212.00011.75411.46014. 72114.35113.85613.44913. 17112.768
mean veloc ity of
ap proach, in feet per sec
ond.
1
0.068.605.333.185.101.026
1.4661.2711.019.846.726.514
Head correctedfor velocity of approach,
in feet.
H%
8
0.2492.2061J75.649.358.096
6.5515.5214.2433.2832.6771.872
H
9
0.3961.6951.114.750.504.209
3.5013.1242.6212.2091.9281.519
^dis charge
per foot of crest, in cu bic feet per sec
ond.
10
0.7907.8264.1132.2231.186.294
21. 58318.23814. 12411.3819.5586.557
Dis charge coeffi cient
(7,.
11
3.1763.5483.5013.4263.3103.0813.2953.3033.3293.4673.5703.503
[Series No. XXXIX. Height of weir=P, 11.25 feet; length of weir crest=i, 15.96,9 feet; width of channel=6,15.700 feet; height of upstream crest corner, 10.25 feet; width of crest, 6 feet.]
123456789
10
1 261 .33242336323932
0.6883
.41833.98063.15062.50661.89861.2716.8286.5626
0.6793 I 0' 683
.41533.92063. 13662.48061.87561. 2626.8206.5606
[ .683.418
3.9433.1452.4881.8841.268.826.561
11. 93411. 93411.66815. 19414. 39613. 73913. 13512. 51812. 07711.811
0.170.167.081
1.7211.280.966.699.401.218.125
0.565.565.270
0.684.684.418
2.0271.995.944
7.956 , 3.985 26.1505. 6423.9582.6011.432.752.420
3.169 18. 4312.502 ! 13.2681.8911.270.827. 561
9.1865.0252.6391.481
3.5863.5303.4973. 2873.2663.3523.5323.5093.4943.526
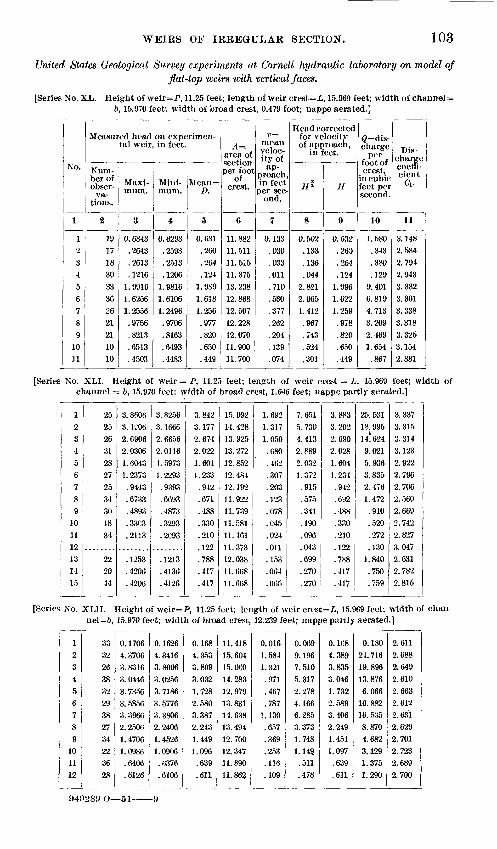
WEIRS OF IRREGULAR SECTION. 103
United States Geological Survey experiments at Cornell hydraulic laboratory on model of fiat-top weirs with vertical faces.
[Series No. XL. Height of weir=P, 11.25 feet; length of weir crest=£, 15.969 feet; width of channel= b, 15.970 feet; width of broad crest, 0.479 foot; nappe aerated.]
No.
1
12
34
56
78
910
n
Measured head on experimental weir, in feet.
Num ber of obser
va tions.
2
19
171830
3336
262121
1010
Maxi mum.
3
0. 6343.2643.2613.1216
1.991G1. 6256
1. 2556.9756.8213. 6513.4503
Mini mum.
4
0. 6293.2593
.2513
.12061. 98161. 6106
1. 2496.9706.8163
.6493
.4483
Mean = D.
5
0.631.260.264.124
1.989
1.6181.256
.977
.820
.650
.449
A = area of section per fool
of crest.
6
11. 88211.51111. 51511.375
13.23812. 86812. 507
12.22812. 07011.90011.700
»=meanveloc ity of
proach in feet
per sec ond.
7
0.133
.030
.033
.011
.710
.530
.377
.262
.204
.139
.074
Head correctedfor velocityof approach,
in feet.
//i
8
0. 502.133.136.044
2.821
2.0651. 412
.967
.743
.524
.301
H
9
0.632.260.264.124
1.9%1.622
1.259.978.820.650.449
Q=dis-charge
per foot of crest,
in cubic feet pel second
10
1.580.343
.380
.1299.401
6.8194.7133.209
2.4691.654
.867
Dis charge coeffi cient ft LI.
11
3.1482.584
2. 79i2.943
3.3323.301
3.3383.3183. 325
3.1542.881
[Series No. XLI. Height of weir = P, 11.25 feet; length of weir crest = L, 15.969 feet; width ofchannel = b, 15.970 feet; width of broad crest, 1.646 feet; nappe partly aerated.]
123456789
]01112131415
25
252631
282725
34
3018
34
222044
3.86063. H'062. 6906
2.03061.60431. 2373
.9443
.6733
.4893
.3303
.2113
.1253
.4206
.4206
3. 82563. 16662. 6656
2.0116
1.59731. 2293
.9393
.6693
.4873
.3293
. 2093
. 1213
.4136
. 4126
3. 842
3.1772.6742.0221.601
1.233.942.671.488
.330
.210
. 122
.788
.417
.417
15. 09214. 428
13. 92513.272
12.85212. 48412. 192
11.92211. 73911. 58111.461
11.37312.03811. 66811.668
1.6921.317
1.050
.680
. 402
.307
.203
.123
.078
.045
.024
.011
.153
.064
. 065
7.651
5.7304.4132.8892. 032
1. 372.915.575
.341
.190
.096
.043
.699
.270
.270
3.8833. 2022.690
2.0281.6041.234.942
. 692
.488
.330
.210
.122
.788
.417
.417
25.53118. 995
1^6249.021
5.9363.8352.4761.472
.910
.520
. 272
.1301.840.750.759
3.3373. 315
3.3143.1232. 922
2. 7962. 7062.560
2.6692.742
2. 8273.0472.6312.7822.815
[Series No. XL1I. Height of weir=P, 11.25 feet; length of weir crest =£, 15.969 feet; width of channel =6, 15.970 feet; width of broad crest, 12.239 feet,; nappe partly aerated.]
123456789
101112
333226
3832293827
34223628
0.1706
4. 37063. 8316
3.04463. 73563. 53563.39662. 2506
1. 4706
1.0986.6406.6126
0. 16264.34163.8006
3. 02563.71863. 57763.38062. 24061.45261.0906.6376
.6106
0.1684.3533.809
3.0321.7282.5803.3872.243
1.449
1.0%.639.611
11.418
15. 60415.06014.283
12. 97913. 83114. 638
13. 49412.70012. 34711. 89011.862
0.0161.5841.321.971
.467
.7871.130.657
.369
.253
.116
.109
0.0699.1967.5105.3172.278
4.1666.2853.3731.748
1.149.511.478
0.1684.3893.8353.0461.7322.5893.4062.249
1.451
1.097.639.611
0.18024. 71619.8%
13. 8766.066
10.88216.5358.8704. 682
3.1291.3751.290
2.611
2.6882. 6492.610
2.6632. 6122. 6312.6292.701
2.7232.689
2.700
5)49289 O 51-
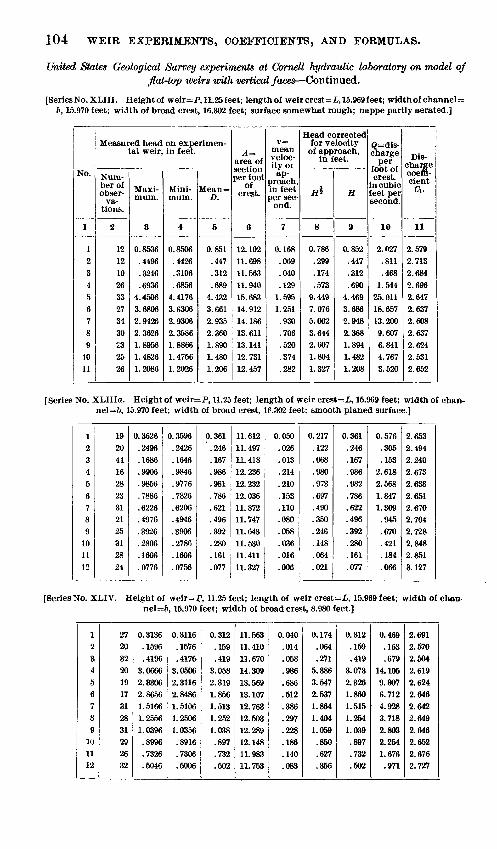
104 WEIR EXPERIMENTS, COEFFICIENTS, AND FORMDLAS.
United States Geological Survey experiments at Cornell hydraulic laboratory on model of fiat-top weirs wtih vertical faces Continued.
[Series No. XLIII. Heightof weir=P, 11.25 feet; length of weir crest=L, 15.969 feet; width of channel= b, 15.970 feet; width of broad crest, 16.302 feet; surface somewhat rough; nappe partly aerated.]
No.
1
12
34
5678
910
11
Measured head on experimen tal weir, in feet.
Num ber of obser
va tions.
2
12121026
33273430232526
Maxi mum.
8
0.8536.44%.3246.6936
4.4506
3.68062.94262. 36261.89561.48261.2086
Mini mum.
4
0.8506.4426
.3106
.6856
4.41763.63062.93062.35861.88661.47561.2026
Mean= D.
5
0.851.447.312
.6894.432
3.6612.9352.3601.8901.4801.206
A = area of section per foot
of crest.
0
12. 10211.698
11.56311.94015.68314. 91214. 18613. 61113. 14112. 73112. 457
v= mean veloc ity or
ap proach, in feet per sec
ond.
7
0.168.069.040.129
1.5951.251
.930
.706
.520
.374
.282
Head correctedfor velocity
of approach, in feet.
fit
8
0.786.299.174
.5739.4497.0765.0623.6442.6071.804
1.327
H
9
0.852.447.312
.6904.4693.6862.9482.3681.8941.482
1.208
(^dis charge
per foot of crest, n cubic
feet per second.
10
2.027.811.468
1.54425.01118.65713.2009.6076.8414.7673.520
Dis charge coeffi cient
Ci.
11
2.5792.7132.6842.6962.6472.6372.6082.6372.6242.5312.652
[Series No. XLIIIa. Height of weir=P, 11.25 feet; length of weir crest=i, 15.969 feet; width of chan nel =b, 15.970 feet; width of broad crest, 16.302 feet; smooth planed surface.]
12345
6789101112
192044162823312125312824
0.3626.2496.1686.9906.9856.7886.6226.4976.3926.2806.1606.0776
0.3596.2426.1646.9846.9776.7826.6206.4946.3906.2786.1606.0756
0.361'.246.167.986.981.786.621.496.392.280.161.077
11. 61211. 49711.41812.23612.23212.03611. 87211.74711.64311.53011.41111.327
0.050.026.013.214.210.153.110.080.058.036.016.006
0.217.122.068.980.973.697.490.360.246.148.064.021
0.361.246.167.986.982.786.622.496.392.280.161.077
0.576.305.153
2.6182.5681.8471.309.945.670.421.184.066
2.6532.4942.2402.6732.6382.6512.6702.7042.7282.8482.8513.127
[Series No. XLIV. Height of weir=P, 11.25 feet; length of weir crest=L, 15.969 feet; width of chan nel=ft, 15.970 feet; width of broad crest, 8.980 feet.]
12
3456789101112
272032201917312831292632
0.3136.15%.4196
3.06662.33062.86561.51661.25561.0396.8996.7326.5046
0. 3116. 1576.4176
3.05062.31162.84861.51061.25061.0356.8916.7306.5006
0.312.159.419
3.0582.3191.8561.5131. 2521.038.897.732.502
11.56311.41011.67014.30913.56913. 10712. 76312.50312.28912.14811.98311.753
0.040.014.058.986.686.512.386.297.228.186.140.083
0.174.064.271
5.3863.5472.5371.8641.4041.059.850.627.356
0.312.159.419
3.0732.3261.8601.5151.2541.039.897.732.602
0.469.163.679
14.1059.3076.7124.9283.7182.8032.2541.676.971
2.6912.5702.5042.6192.6242.6462.6422.6492.6462.6522.6762.727
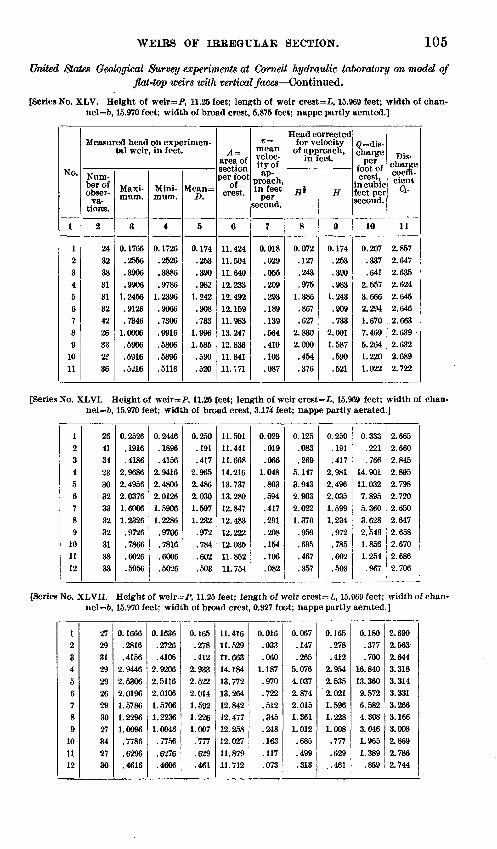
WEIRS OF IRREGULAR SECTION. 105
United States Geological Survey experiments at Cornell hydraulic laboratory on model of flat-top weirs with vertical faces Continued.
[Series No. XLV. Height of weir=P, 11.25 feet; length of weir crest=L, 15.969 feet; width of chan- nel=6,15.970 feet; width of broad crest, 5.875 feet; nappe partly aerated.]
No.
1
123456789
1011
Measured head on experimen tal weir, in feet.
Num ber of obser
va tions.
2
2432383131324226332836
Maxi mum.
8
0.1766.2556.3906.9906
1.2456.9126.7346
1.0006.5906.5916.5216
Mini mum.
4
0. 1726.2526.3886.9786
1.23%.9066.7306.9916.5806.5896.5116
Mean= D.
5
0.174.253.390.982
1.242.908.733
1.9961.585.590.520
A= area of section per foot
of crest.
6
11.42411.50411.64012.23312.49212.15911.98313. 24712.83611.84111. 171
t)= mean veloc ity of ap
proach, in feet
per second.
7
0.018.029.055.209.293.189.139.564.410.103.087
Head correctedfor velocity
of approach, in feet.
H*
8
0.072.127.243.975
1.386.867.627
2.8302.000
.454
.376
H
9
0.174.253.390.983
1. 243.909.733
2.0011.587.590.521
^dis charge
per foot of crest,
in cubic feet per second.
10
0.207.337.641
2.5573.6662.2941.6707.4695.2641.2201.022
Dis charge coeffi cienta.
11
2.8572.6472.6352.6242.6452.6462.6632.639 2.6322.6892.722
[Series No. XLVI. Height of weir=P, 11.25 feet; length of weir crest=L, 15.969 feet; width of chan- nel=6,15.970 feet; width of broad crest, 3.174 feet; nappe partly aerated.]
1234
56789101112
264134
233032333232313833
0.2526.1916.4186
2.96862.49562.03761.60061.2326.9726.7866.6026.5056
0.2446.1896.4156
2.94162.48062.01261.59061.2286
.9706
.7816
.6006
.5026
0.250.191.417
2.9652.4862.0301.5971.232.972.784.602.503
11.50111.44111.66814.21613.73713.28012.84712.48312. 22212.03611. 85211.754
0.029.019.066
1.048.803.594.417.291.208.154.106.082
0.125.083.269
5.1473.9432.9032.0221.370.959.695.467.357
i
0.250.191.417
2.9812.4%2.0351.5991.234.972.785.602.503
0.333.221.766
14.90111.0327.8955.3603.6282.5491.8561.254.967
2.6652.6602.8452.8952.7982.7202.6502.6472.6582.6702.6862.706
<
[Series No. XLVII. Height of weir=P, 11.25 feet; length of weir crest=i, 15.969 feet; width of chan- nel=6,15.970 feet; width of broad crest, 0.927 foot; nappe partly aerated.]
123456789
101112
272931292926293027342730
0.1666.2816.4166
2.94462.53062.01%1.57861.22%1.00%.7786.62%.4616
0.1636.2726.4106
2.92062.51162.01061.57061.22361.0046
.7756
.6276
.4606
0.165.278.412
2.9332.5222.0141.5921.2261.007
.'777
.629
.461
11.41611.52911.66314.18413.77213.26412.84212. 47712.25812.02711. 87911. 712
0.016.033.060
1.187.970.722.512.345.248.163.117.073
0.067.147.265
5.0764.0372.8742.0151.3611.012.685.499.313
0.165.278.412
2.9542.5352.0211.5961.2281.008.777.629
..461
0.180.377.700
16.84013.3609.5726.5824.3083.0461.9651.389.859
2.6902.5632.6443.3183.3143.3313.2663.1663.0082.8692.7862.744
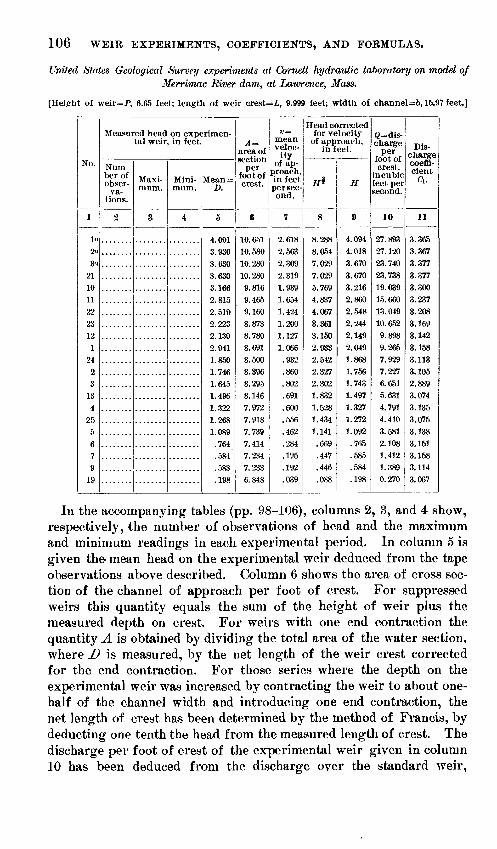
106 WEIR EXPERIMENTS, COEFFICIENTS, AND FORMULAS.
United States Geological Survey experiments at Cornell hydraulic laboratory on model of Merrimac River dam, at Lawrence, Mass.
[Height of weir=P, 6.65 feet; length of weir crest=£, 9.999 feet; width of channel=6,15.97 feet]
No.
1
2o
3o
21
10 11
22 23 12
1 24
2 3
13
4 25
5
6 7 9
19
Measured head on experimen tal weir, in feet.
Num ber of obser
va tions.
2
Maxi mum.
3
Mini mum.
4
Mean = D.
5
4.001 3.930
3.630 3.630 3.166 2.815 2.510
2.223 2.130 2.041 1.850 1.746 1.645 1.496 1.322 1.268
1.089 .764
.584 583
.198
A = area of section
per foot of crest.
6
10. 651 10. 580 10.280 10.280 9.816 9. 465 9.160 8.873 8.780 8.691 8.500 8.396 8.295 8.146 7.972 7.918 7.739 7.414 7.234 7.233 6.848
v= mean veloc-ilyof ap
proach, in feet per sec ond.
7
2.618
2.563 2.309 2.319
1.939 1.654
1. 424 1.200 1.127
1.066 .932
.860
.802
.691
.600
.556
.462
.284
.195
.192
.039
Head corrected for velocity
of approach, in feet.
^
8
8.288 8.054
7.029 7.029
5.769 4.837 4.067 3.361 3.150 2.933 2.542
2.327 2.302 1.832
1.528 1.434 1.141
.669
.447
.446
.088
H
9
4.094 4.018
3.670 3.670
3.216 2.860 2.548 2.244 2.149
2.049 1.868
1.756 1.743 1.497
1.327 1.272
1.092 .765
.585
.584
.198
Q= dis charge
per foot of crest,
in cubic feet per second.
10
27. 893 27.120 23.740 23.738 19.039 15.660 13.049 10.652 9.898 9.265 7.929 7.227 6.651 5.631 4.791 4.410 3.581 2.108 1.412 1.389 0.270
Dis charge coeffi cient
Ci.
11
3.365 3.367 3.377
3.377 3.300 3.237 3.208
3.169 3.142
3.158 3.113 3.105 2.889 3.074 3.135 3. 075
3.138 3.151
3.158 3.114
3.067
In the accompanying tables (pp. 98-106), columns 2, 3, and 4 show, respectively, the number of observations of head and the maximum and minimum readings in each experimental period. In column 5 is given the- mean head on the experimental weir deduced from the tape observations above described. Column 6 shows the area of cross sec tion of the channel of approach per foot of crest. For suppressed weirs this quantity equals the sum of the height of weir plus the measured depth on crest. For weirs with one end contraction the quantity A is obtained by dividing the total area of the water section, where D is measured, by the net length of the weir crest corrected for the end contraction. For those series where the depth on the experimental weir was increased by contracting the weir to about one- half of the channel width and introducing one end contraction, the net length of crest has been determined by the method of Francis, by deducting one tenth the head from the measured length of crest. The discharge per foot of crest of the experimental weir given in column 10 has been deduced from the discharge over the standard weir,
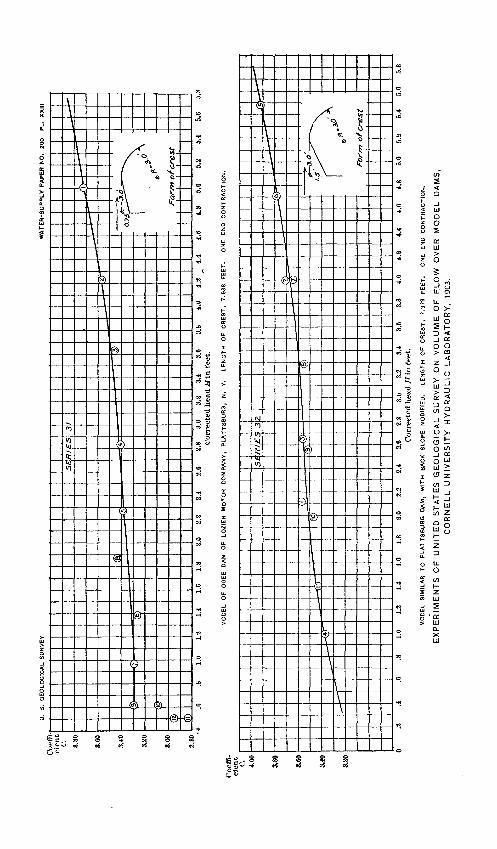
U.
S.
GE
OLO
GIC
AL S
UR
VE
YW
AT
ER
-SU
PP
LY
P
AP
ER
N
O.
200
PL
. X
XII
I
i .0
.8
1.
0 1.
2 1.
1 1.
6 1.
8 2.
0 2.
2 2.
1 2.
6 2.
8 3.
0 3.
2 3.
1 3.
6 3.
8 4.
0 1.
2 1.
1 1.
6 1.
8 5.
0 5.
2 5.
1 5.
6 5.
8C
orr
ecte
d h
ead
Hin
fee
t.
MO
DE
L
OF
O
GE
E
DA
M
OF
L
OZ
IER
M
OT
OR
C
OM
PA
NY
. P
LA
TT
SB
UR
G,
N.
Y.
LE
NG
TH
O
F
CR
ES
T,
7.9
38
FE
ET
. O
NE
E
ND
C
ON
TR
AC
TIO
N.
2.6
2.8
3.0
3.2
3.1
Corr
ecte
d h
ead H
in f
eet.
MO
DE
L
SIM
ILA
R
TO
P
LA
TT
SB
UR
G
DA
M,
WIT
H
BA
CK
S
LO
PE
M
OD
IFIE
D.
LE
NG
TH
O
F
CR
ES
T,
7.9
79
FE
ET
. O
NE
E
ND
C
ON
TR
AC
TIO
N.
EX
PE
RIM
EN
TS
O
F
UN
ITE
D
ST
AT
ES
G
EO
LO
GIC
AL
S
UR
VE
Y
ON
V
OL
UM
E
OF
F
LO
W
OV
ER
M
OD
EL
DA
MS
, C
OR
NE
LL
U
NIV
ER
SIT
Y
HY
DR
AU
LIC
LA
BO
RA
TO
RY
, 19
03.
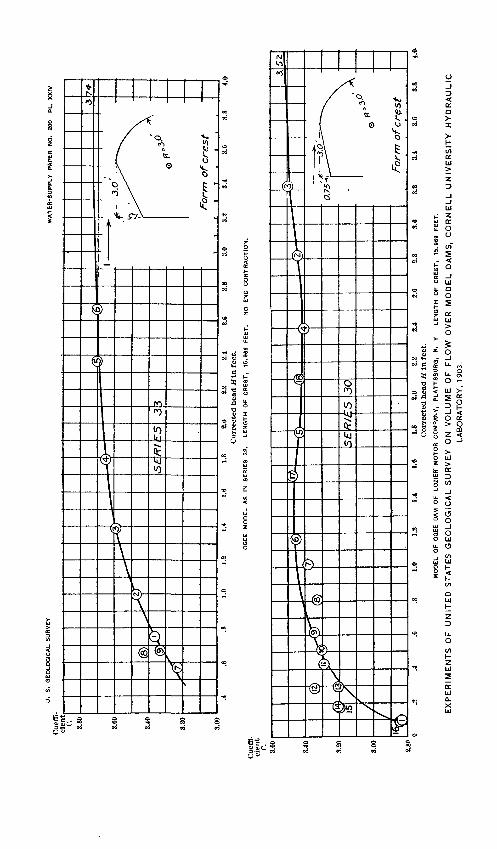
U.
8.
GE
OL
OG
ICA
L S
UR
VE
YW
AT
ER
-SU
PP
LY
P
AP
ER
N
O.
200
PL
. X
XIV
1.8
8.0
2.2
2.4
Cor
rect
ed h
ead
H in
fee
t.
OG
EE
M
OD
EL
A
S
IN
SE
RIE
S
32.
LE
NG
TH
O
F
CR
ES
T.
15
.96
9
FE
ET
. N
O
EN
D
CO
NT
RA
CT
ION
.
.2.4
2.6
2.8
3.6
3.2
3.1
3.6
3.8
4.0.
MO
DE
L
OF
O
GE
E
DA
M
OF
L
OZ
IER
1 M
OT
OR
C
OM
PA
NY
, P
LA
TT
SB
UR
Q,
N.
Y.
LE
NG
TH
O
F
CR
ES
T,
15
.96
9
FE
ET
.
EX
PE
RIM
EN
TS
O
F
UN
ITE
D
ST
AT
ES
G
EO
LO
GIC
AL S
UR
VE
Y
ON
V
OL
UM
E
OF
F
LO
W
OV
ER
M
OD
EL
DA
MS
, C
OR
NE
LL
UN
IVE
RS
ITY
H
YD
RA
ULIC
LA
BO
RA
TO
RY
, 19
03.
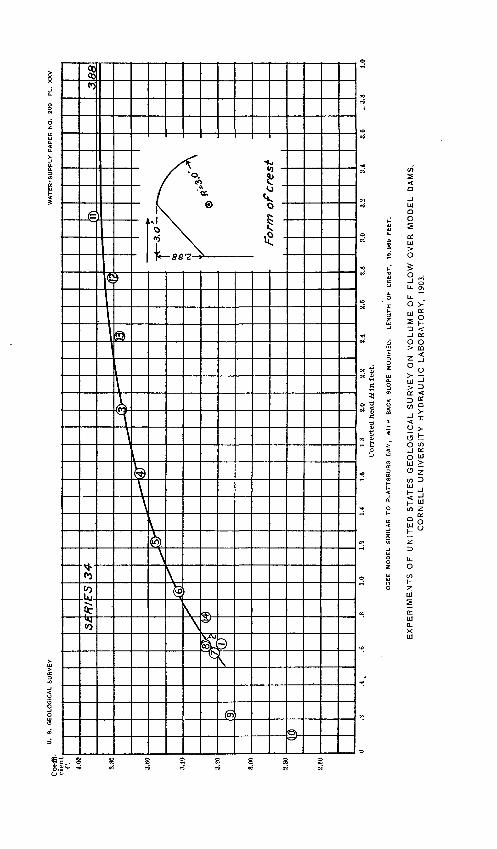
U.
S.
GE
OL
OG
ICA
L
SU
RV
EY
WA
TE
R-S
UP
PL
Y
PA
PE
R
NO
. 200
PL
. X
XV
1.6
1.8
2.0
2
.2
Cor
rect
ed h
ead
Hin
fee
t.
O3E
E
MO
DE
L
SIM
ILA
R
TO
P
LA
TT
SB
UR
G
DA
M,
WIT
H
BA
CK
S
LO
PE
M
OD
IFIE
D.
LE
NG
TH
O
F
CR
ES
T,
16
.96
9
FE
ET
.
EX
PE
RIM
EN
TS
O
F
UN
ITE
D
ST
AT
ES
G
EO
LO
GIC
AL
S
UR
VE
Y
ON
V
OL
UM
E
OF
F
LO
W
OV
ER
M
OD
EL
DA
MS
, C
OR
NE
LL
U
NIV
ER
SIT
Y
HY
DR
AU
LIC
LA
BO
RA
TO
RY
, 19
03.
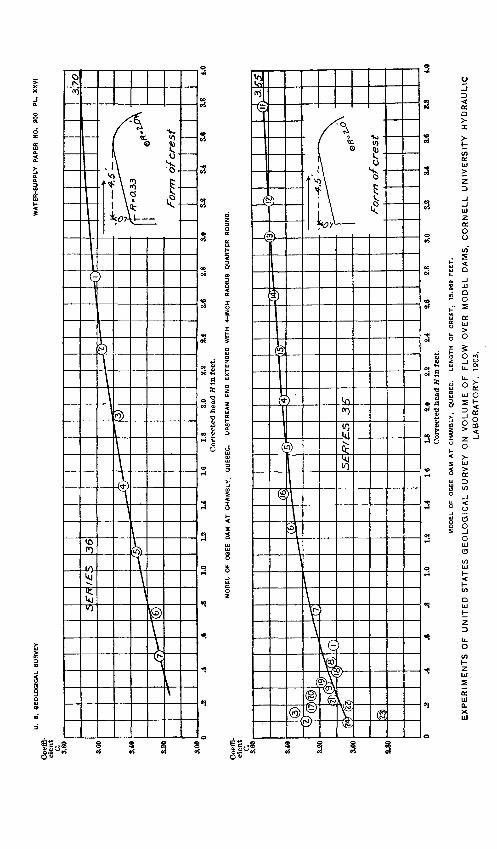
U.
6.
GE
OLO
GIC
AL
SU
RV
EY
WA
TE
R-S
UP
PL
Y
PA
PE
R
NO
. 20
0 P
L.
XX
VI
Coe
ffi
ci
ent
C. 3.10
.5 E
ft f
ES
36
3.00
A
.6
.8
1.0
1.8
1.1
1.6
1.8
2.0
2.2
8.4
£.6
8.8
3.0
3.2
3.4
3.6
3.8
4.0
Corr
ecte
d h
ead
H I
n fe
et.
MO
DE
L
OF
O
GE
E
0AM
A
T
CH
AM
BL
Y,
QU
EB
EC
. U
PS
TR
EA
M
EN
D
EX
TE
ND
ED
W
ITH
4-
INC
H
RA
DIU
S
QU
AR
TE
R
RO
UN
D.
of?
Fo
rm o
f cre
st
.6
.8
1.0
1.2
1.4
16
1.8
8.0
2.2
8.4
2.6
2.8
3.0
3.2
3.4
3.6
3.8
4.0
Corr
ecte
d h
ead H
\n f
eet.
2.80
MO
DE
L
OF
OG
EE
D
AM
A
T
CH
AM
BL
Y,
QU
EB
EC
. L
EN
GT
H
OF
CR
ES
T,
15.9
69
FE
ET
.
EX
PE
RIM
EN
TS
O
F
UN
ITE
D
ST
AT
ES
G
EO
LO
GIC
AL
SU
RV
EY
O
N
VO
LU
ME
O
F
FL
OW
O
VE
R
MO
Dh
L
DA
MS
, C
OR
NE
LL
U
NIV
ER
SIT
Y
HY
DR
AU
LIC
LA
BO
RA
TO
RY
, 19
03.
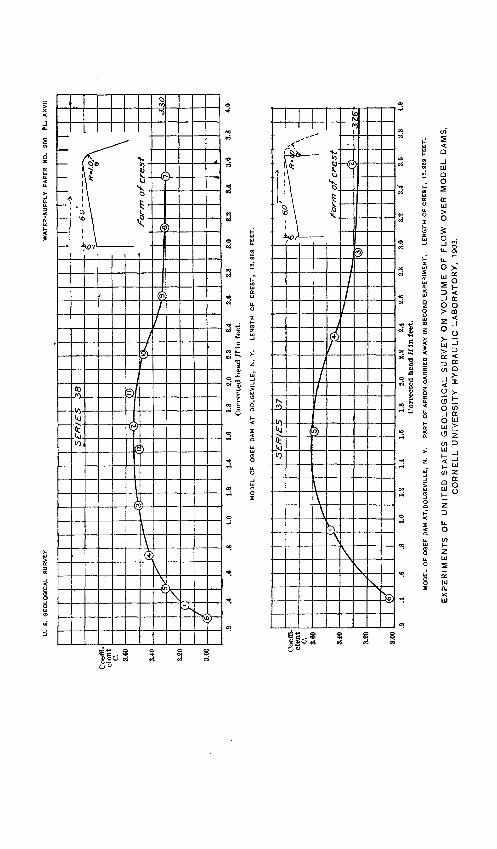
U.
S.
GE
OL
OG
ICA
L
SU
RV
EY
WA
TE
R-S
UP
PLY
P
AP
ER
N
O.
200
PL.
XX
VII
Coe
ffi
ci
ent
C. 3.60
38
K
1.0
1.2
1.4
1.6
1.8
2.0
2.2
2.4
2.6
2.8
3.0
3.2
3.4
3.6
3.8
1.0
Co
rrec
ted
hea
d H
in f
eet.
MO
DE
L
OF
O
GE
E
DA
M
AT
D
OL
GE
VIL
LE
, N
. Y
. LE
NG
TH
O
F
CR
ES
T,
15
.96
9
FE
ET
.
Coe
ffi
ci
ent
C.
3.60
8.40
8.20
8.00
f
©
.
/
/
/
( $
\f~
***
S£f?
(£S
®-
37
-^« «»
-^^
>1^®
*.-~
-, , ®
4 M^S
E
. - "
=
6.0
^
for
-, *
( i
m o
f cre
.st
\$
X
.4
.6
.8
1.0
1.2
1.4
1.6
1.8
2.0
2.2
2.4
2.6
2.8
3.0
3.2
3.4
3.6
3.8
Co
rrec
ted
hea
d H
in f
eet.
MO
DE
L O
F O
GE
E
DA
M A
Ti
DO
LG
EV
ILLE
, N
. Y
. P
AR
T
OF
AP
RO
N
CA
RR
IED
A
WA
Y
IN
SE
CO
ND
E
XP
ER
IME
NT
. L
EN
GT
H
OF
CR
ES
T,
15
.96
9 F
EE
T.
EX
PE
RIM
EN
TS
O
F
UN
ITE
D
ST
AT
ES
G
EO
LO
GIC
AL S
UR
VE
Y
ON
V
OL
UM
E
OF
F
LO
W
OV
ER
M
OD
EL
DA
MS
, C
OR
NE
LL
U
NIV
ER
SIT
Y
HY
DR
AU
LIC
LA
BO
RA
TO
RY
, 19
03.
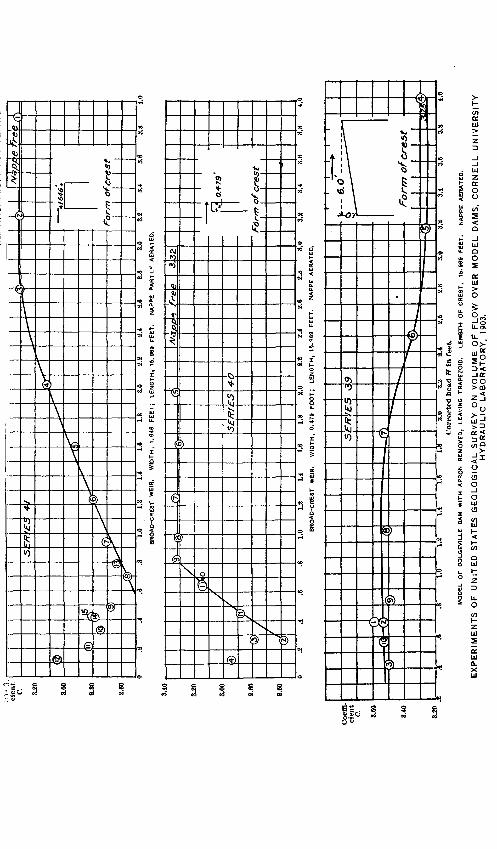
clen
t C. 3.
20
3.00
2.80
2.60
3.20
3.00
2.60
2.60
r<;T)
©
J5 r y>ff
~~
2^
«5 r
-* _
'£6
S*
4-
^
I fTf^
^<
^\f)
^^-
f?r^
^*
,-
*~~
y-
1
=(' 1
rc
~* ?/-
^Pf.
*I6
46*
m o
t
9 .2
.1
.6
.8
1.
0 1.
2 1.
1 1.
6 1.
8 2.
0 2.
2 2.
1 2.
6 2.
8 3.
0 3.
2
BR
OA
D-C
RE
ST
WEI
R.
WID
TH
, 1.
848
FE
ET
; L
EN
GT
H,
15.9
69
FFE
T.
NA
PPE
PA
RT
LY
A
ER
AT
ED
.
§>-@ {£
>
/ t
f
^^
(Ttf\/ 0
^v- 1
i &
5£- f?
/i
& rs4-
C 1
3.3Z
i
cres
t -"
efr
cI fij
3.1
3.6
3.8
1
^r
*6rm
ofc
nest L-
1.0
1.2
1.1
1.6
1.8
2.0
2.2
2.1
2.6
2.6
3.0
3.2
3.1
3.6
3.8
1.0
BR
OA
D-C
RE
ST
W
EIR
. W
IDT
H,
0.4
79
F
OO
T;
LE
NG
TH
, 15.0
83
FE
ET
. N
AP
PE
A
ER
AT
ED
.
Coe
ffi
ci
ent
C.
~L(
-4Z
35
Fo
rm o
f cre
st
1.0
1.2
2.8
1.6
1.8
fc.U
2.2
2^1
2.0
Corr
ecte
d b
ead
H I
n f
eet.
MO
DE
L
OF
D
OL
GE
VIL
LE
D
AM
W
ITH
A
PR
ON
R
EM
OV
ED
, L
EA
VIN
G
TR
AP
EZ
OID
. L
EN
GT
H
OF
C
RE
ST
, 1
5.9
89
F
EE
T.
NA
PP
E
AE
RA
TE
D.
EX
PE
RIM
EN
TS
O
F
UN
ITE
D
ST
AT
ES
G
EO
LO
GIC
AL
SU
RV
EY
O
N
VO
LU
ME
O
F
FL
OW
O
VE
R
MO
DE
L
DA
MS
, C
OR
NE
LL
U
NIV
ER
SIT
YH
YD
RA
UL
IC
LA
BO
RA
TO
RY
, 19
03.
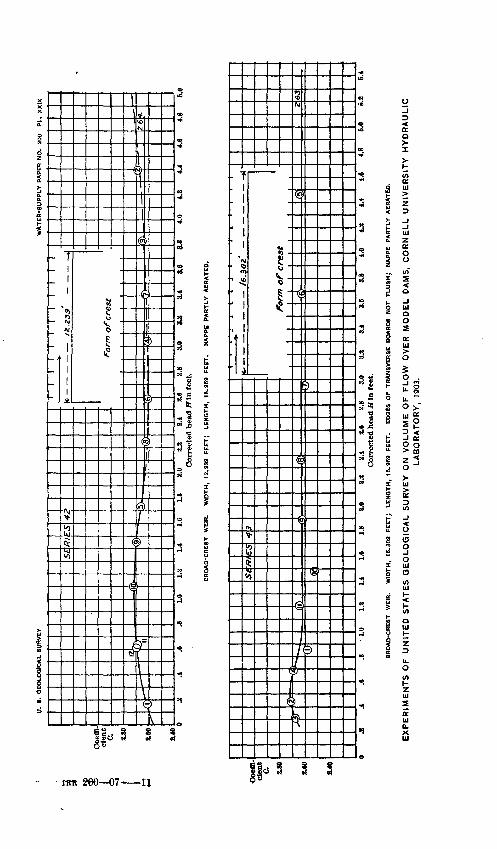
U.
6.
GE
OL
OG
ICA
L S
UR
VE
YW
AT
ER
-SU
PP
LY
P
AP
ER
N
O.
ZOO
P
L.
XX
IX
J i 5 C
oeff
i
cien
t
32.
80
-
2.60
2.10
7"
Cl
-I
-9f*
^ib=
5£
/?/ <D
E5
4i
^> ' i
k<fc
>
11
1 - -<<
1 I
- IZ
.Z3
9
-»|
Far
m o
f cre
st
>
<4>i=
/^
1^1
-r5V
;
?f,*
.
0 .2
.1
.6
.8
1.
03.
1 3.
6 3.
8 1.
0 1.
2 1.
1 1.
6 1.
8 5.
0
BR
OA
D-C
RE
ST
W
EIR
. W
IDT
H,
12.2
39
FE
ET
; L
EN
GT
H,
15.9
69
FE
ET
. N
AP
PE
P
AR
TL
Y
AE
RA
TE
D.
1.1
1.6
1.8
2.0
2.2
2.1
2.6
2.8
3.0
Cor
rect
ed h
ead
Hln
fee
t.
Coe
ffi
cie
nt
C.
2.80
2.60
£.10
<Xr
®="
*^
^ B
,
(I)
(i)
Si (if
Ri
\
ks4
?
J(to
:
UJ
/'bry
?? o
/* c
rest
i rp^
z6
3
Jt
A
.ft
.8
1.0
1.2
1.1
1.6
1.8
2.0
2.2
2.1
2.6
2.8
3.0
3.2
3.1
3.6
3.8
1.0
1.2
1.1
1.6
1.8
6.0
5.2
5.1
Cor
rect
ed h
ead
H In
fee
t.
BR
OA
D-C
RE
ST
W
EIR
. W
IDT
H,
t6.3
02
F
EE
T;
LE
NG
TH
, 15.9
69
FE
ET
. E
DG
ES
O
F
TR
AN
SV
ER
SE
B
OA
RD
S
NO
T
FL
US
H;
NA
PP
E
PA
RT
LY
A
ER
AT
ED
.
EX
PE
RIM
EN
TS
O
F
UN
ITE
D
ST
AT
ES
G
EO
LO
GIC
AL
S
UR
VE
Y
ON
V
OL
UM
E
OF
F
LO
W
OV
ER
M
OD
EL
D
AM
S,
CO
RN
EL
L U
NIV
ER
SIT
Y
HY
DR
AU
LIC
LA
BO
RA
TO
RY
, 19
03.
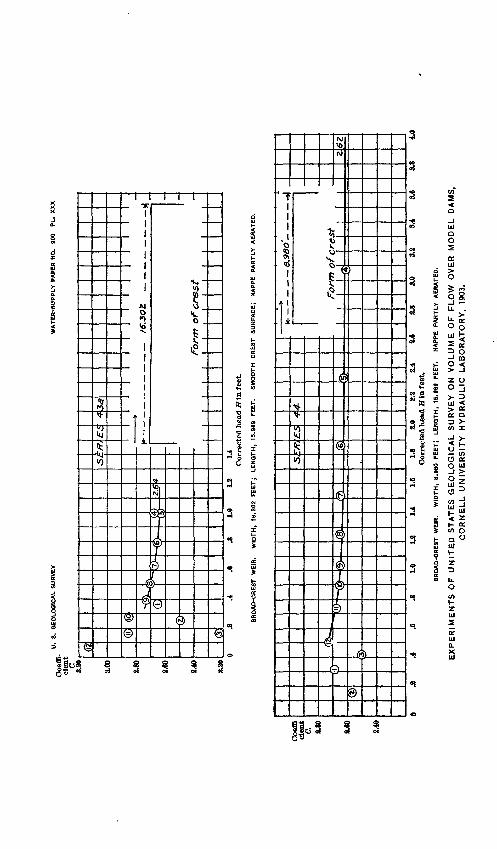
U.
8.
GE
OL
OG
ICA
L S
UR
VE
YW
AT
ER
-SU
PP
LY
PA
PE
R N
O.
200
PL
. X
XX
Coeff
cie
nt
C.
3.20
3.00
8.60
2.40
8.80
ft
© (ft
@
<&
-<s ©^
(z>-
1>
(4)
2£r
.s/ :/?/
£<
4
' K-
3a
t6*O
f
form
of cre
st
- j 1
0 .2
.4
.6
.8
1.
0 1.
8 1.
1C
orre
cted
hea
d H
in. f
eet.
BR
OA
D-C
RE
ST
W
EIR
. W
IDT
H,
18.3
02
FE
ET
) L
EN
GT
H,
15
.98
9
FE
ET
. S
MO
OT
H
CR
ES
T
SU
RF
AC
E;
NA
PP
E
PA
RT
LY
A
ER
AT
ED
.
Coe
fB
den
t 0. 8.
80
8.60
8.10
(s)iD
-(i
D-^K
(!i>
1>~®
-
Af 7
)
3r/r
> (®i£
34
4-
^~
i
t ' ' ' ' i
k-
-
3.9
30
' _»
|
Fo
rm o
f c
res
t
^^
-
2.6
Z
1.0
1.2
1.1
1.6
1.8
8.0
8.8
2.4
Cor
rect
ed h
ead
if in
fee
t.8.
6 8.
8 3.
0 3.
2 3.
4 3.
6 3.
84.
0
BR
OA
D-C
RE
ST
W
EIR
. W
IDT
H,
8.9
80
FE
ET
; L
EN
GT
H,
15
.96
9
FE
ET
. N
AP
PE
P
AR
TL
Y
AE
RA
TE
D.
EX
PE
RIM
EN
TS
O
F
UN
ITE
D
ST
AT
ES
G
EO
LO
GIC
AL
SU
RV
EY
O
N
VO
LU
ME
O
F
FL
OW
O
VE
R
MO
DE
L
DA
MS
, C
OR
NE
LL
U
NIV
ER
SIT
Y
HY
DR
AU
LIC
LA
BO
RA
TO
RY
, 19
03.
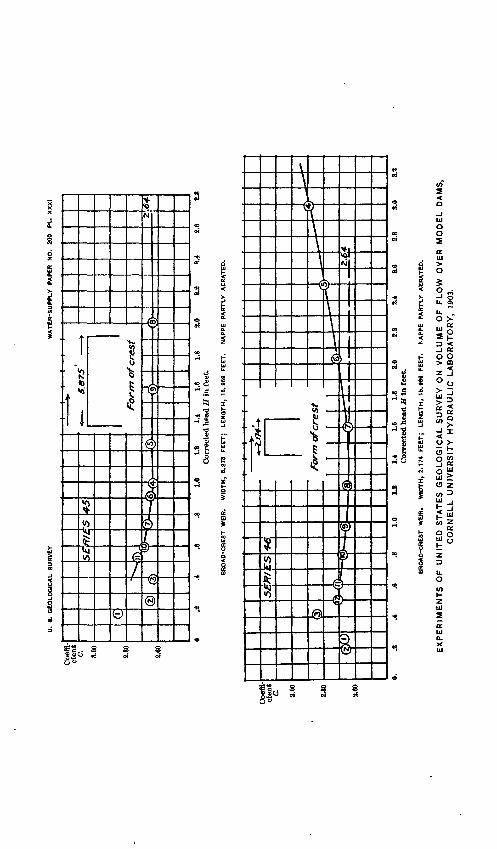
U.
8.
GE
OL
OG
ICA
L
SU
RV
EY
WA
TE
R-S
UP
PL
Y
PA
PE
R
NO
. ZO
O
PL
. X
XX
I
1.0
1.8
1.4
1.6
1.8
2.0
Cor
rect
ed h
ead
H i
n f
eet.
»,.4
2.6
8,8
BR
OA
D-C
RE
ST
W
EIR
. W
IDT
H,
8.S
76
F
EE
T;
LE
NG
TH
, 15.9
69
FE
ET
. N
AP
PE
P
AR
TL
Y
AE
RA
TE
D.
1.0
1.8
1.4
1.6
1.8
8.0
2.2
2.4
2.6
0.
.2
.43.
0 3.
2
BR
OA
D-C
RE
ST
W
EIR
. W
IDT
H,
2.1
74
F
EE
T;
LE
NG
TH
, 15.9
69
FE
ET
. N
AP
PE
P
AR
TL
Y
AE
RA
TE
D.
EX
PE
RIM
EN
TS
O
F
UN
ITE
D
ST
AT
ES
G
EO
LO
GIC
AL
SU
RV
EY
O
N
VO
LU
ME
O
F
FL
OW
O
VE
R
MO
DE
L
DA
MS
, C
OR
NE
LL
U
NIV
ER
SIT
Y
HY
DR
AU
LIC
L
AB
OR
AT
OR
Y,
1903
.
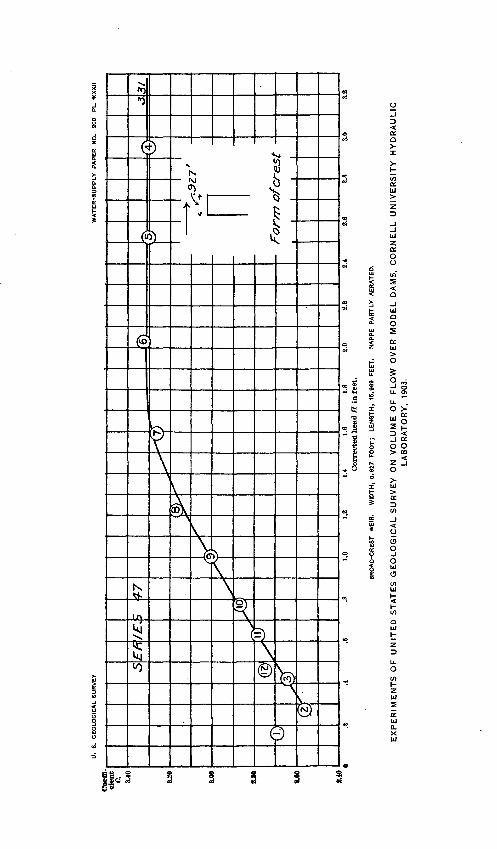
U.
8.
GE
OLO
GIC
AL
SU
RV
EY
den
t C
.
WA
TE
R-S
UP
PL
Y
PA
PE
R
NO
. 20
0 P
L. K
XX
II
S£
-/r/
£o
£
7
V.5
27
-
/or/
?? o
f cre
st
.2
A
.6
.8
1.0
1.2
1.1
1.6
1.8
2.0
2.2
2.1
8.6
2.8
3.0
:C
orre
cted
hea
d H
in
feet
.
BR
OA
D-C
RE
ST
W
EIR
. W
IDT
H,
0.9
27
F
OO
T)
LE
NG
TH
, 16.9
69
FE
ET
. N
AP
PE
P
AR
TL
Y
AE
RA
TE
D.
EX
PE
RIM
EN
TS
O
F
UN
ITE
D
ST
AT
ES
G
EO
LO
GIC
AL S
UR
VE
Y
ON
V
OL
UM
E O
F
FL
OW
O
VE
R
MO
DE
L
DA
MS
, C
OR
NE
LL
U
NIV
ER
SIT
Y
HY
DR
AU
LIC
LA
BO
RA
TO
RY
, 19
03.
WEIRS OF IRREGULAR SECTION. 107
obtained, as described above, by dividing the total discharge by the net length of the experimental weir. The mean velocity of approach y, given in column 7, has been obtained by the formula
Q
The correction for velocity of approach has been carefully computed by the Francis formula
where
3The resulting values of IIs are given in column 8. The correspond
ing values of //, given in column 9, have been obtained by interpola tion from a table of three-halves powers. The discharge coefficient Ol given in column 11 has been obtained by the formula
-°1 3
JI*
This coefficient represents the discharge per linear foot of crest, if the head is 1 foot, with no velocity of approach, it being the coefficient in a weir formula of the same form as that used by J. B. Francis for a thin-edged weir.
Pis. XXIII to XXXII show the coefficient diagrams deduced from these experiments.
EXPERIMENTS ON MODEL OF DAM OF THE ESSEX COMPANY, MERRIMAC
RIVER, AT LAWRENCE, MASS. a
A series of experiments covering five different depths on crest was made by James B. Francis at lower locks, Lowell, Mass., November, 1852. The model had a crest length of 9.999 feet, with end contractions suppressed. Height of water was measured by hook gage in a cham ber at one side of the channel, 6 feet upstream from crest, so arranged as to give substantially the height of the still-water surface above the crest without correction for velocity of approach. The discharge was volumetrically determined as in Francis's thin-edged weir experiments.
The experiments of Francis covered depths on crest ranging from 0.5872 foot to 1.6338 feet. From these experiments he deduced the formula for discharge,
a Francis, J. B., Lowell Hydraulic Experiments, pp. 136-137.
108 WEIE EXPEBIMENTS, COEFFICIENTS, AND FGBMULAS.
If the discharge were expressed in terms of the usual formula,
Q CiLHs, with a vaiying coefficient C^ we should have a continu ously increasing coefficient.
A series of experiments on a similar model dam, 6.65 feet high, with crest length of 15.932 feet, was made at Cornell University hydraulic laboratory in 1903. The model there used differed from that shown by Francis only in the substitution of a flatter upstream slope near the bottom of the canal, as shown in PL XXXIII. The end contractions were suppressed and the depth on crest was measured with steel tape and plumb bob suspended over center of channel at points 14.67 feet and 29.82 feet, respective^, upstream from crest of experimental weir. Discharge was previously measured over the standard weir, calibrated by Bazin's and Fteley and Stearns's formulas, located at head of experi mental canal.
The experiments covered a range of heads varying from 0.198 foot to 4.94 feet. In the majority of the experiments the head was observed at both points. The upper point of measuring depth was at the upstream end of the inclined approach. The lower point was over the incline, where the area of the section of approach was smaller and the velocity larger than in the deeper channel above. The experi ments have been reduced with reference to the heads measured 29.82 feet upstream from crest. By comparison of the depths simultane ously observed at the two points correction factors have been deduced for the reduction of the remaining experiments, in which the head was observed at the downstream point of observation only.
The observed head has been corrected for velocity of approach by the formula of Francis. The resulting mean coefficient curve, based on 19 valid observations, shows a larger coefficient of discharge in the
3formula Q C^LH^ than does that of Francis.
For a head of 1 foot the formula of Francis for the Merrimac dam gives a discharge of 90.3 per cent of that for a thin-edged weir. The Cornell experiments show 94.5 per cent of the discharge over a thin- edged weir under the same head.
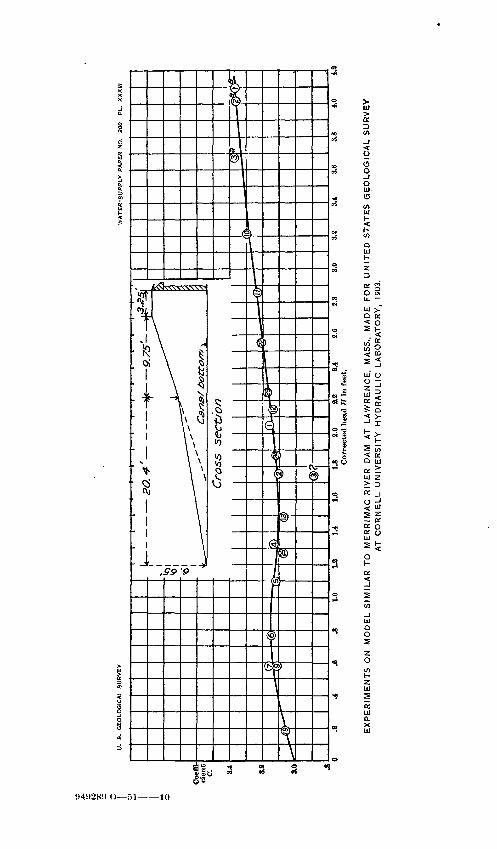
U.
8.
GE
OL
OG
ICA
L S
UR
VE
YW
AT
ER
-SU
PP
LY
P
AP
ER
N
O.
200
PL
. X
XX
III
2O
.4 - -Jfc
9
.75
.6
.8
1.0
1.2
1.4
1.6
1.8
2.0
3.0
3.8
3.4
3.6
3.8
4.0
4.2
EX
PE
RIM
EN
TS
O
N
MO
DE
L S
IMIL
AR
T
O
ME
RR
IMA
C
RIV
ER
D
AM
A
T
LA
WR
EN
CE
, M
AS
S.,
MA
DE
F
OR
U
NIT
ED
S
TA
TE
S G
EO
LO
GIC
AL
SU
RV
EY
AT
C
OR
NE
LL
U
NIV
ER
SIT
Y
HY
DR
AU
LIC
LA
BO
RA
TO
RY
, 19
03.
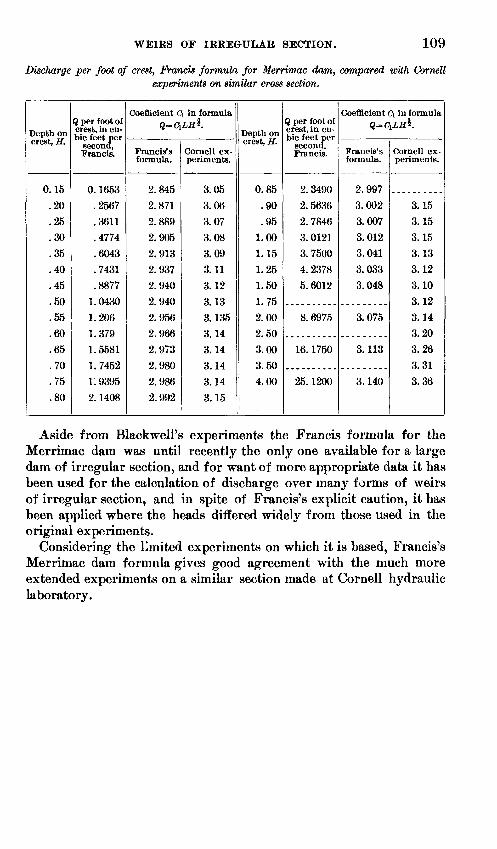
WEIRS OF IRREGULAR SECTION. 109
Discharge per foot of crest, Francis formula for Merrimac dam, compared with Cornell experiments on similar cross section.
Depth on crest, H.
0.15
.20
.25
.30
.35
.40
.45
.50
.55
.60
.65
.70
.75
.80
Q per foot of crest, in cu bic feet per
second, Francis.
0. 1653
.2567
.3611
.4774
.6043
.7431
.8877
1.0430
1.206
1.379 1. 5581
1. 7452
1. 9395
2. 1408
Coefficient Cl in formula Q=CiLH%.
Francis's formula.
2.845
2.871
2.889
2.905
2.913
2.937
2.940
2.940
2.956
2.966
2.973
2.980
2.986
2.992
Cornell ex periments.
3.05
3.06
3.07
3.08
3.09
3.11
3.12
3.13
3.135
3.14
3.14
3.14
3.14
3.15
Depth on crest, H.
0.85
.90
.951.00
1.15
1.25
1.50
1.75
2.00
2.50
3.00
3.50
4.00
Q per foot of crest, in cu bic feet per
second, Francis.
2. 3490
2. 5636
2. 7846
3. 0121
3. 7500
4. 2378
5.6012
8. 6975
16. 1750
25.1200
Coefficient d in formula Q=CiLH%.
Francis's formula.
2.997
3.002
3.007
3.012
3.041
3. 033
3.048
3.075
3.113
3.140
Cornell ex periments.
3.15
3.15
3.15
3.13
3.12
3.10
3.12
3.14
3.20
3.26
3.31
3.36
Aside from Blackwell's experiments the Francis formula for the Merrimac dam was until recently the only one available for a large dam of irregular section, and for want of more appropriate data it has been used for the calculation of discharge over many forms of weirs of irregular section, and in spite of Francis's explicit caution, it has been applied where the heads differed widely from those used in the original experiments.
Considering the limited experiments on which it is based, Francis's Merrimac dam formula gives good agreement with the much more extended experiments on a similar section made at Cornell hydraulic laboratory.
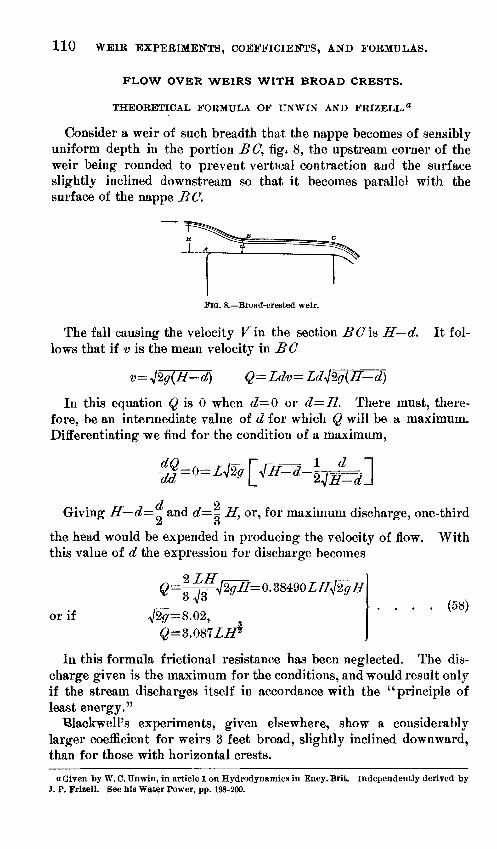
110 WEIR EXPERIMENTS, COEFFICIENTS, AND FORMULAS.
FLOW OVER WEIRS WITH BROAD CRESTS.
THEORETICAL FORMULA OF UNWIN AND FRIZELL."
Consider a weir of such breadth that the nappe becomes of sensibly uniform depth in the portion BC, fig* 8, the upstream corner of the weir being rounded to prevent vertical contraction and the surface slightly inclined downstream so that it becomes parallel with the surface of the nappe B C.
FIG. 8. Broad-crested weir.
The fall causing the velocity Fin the section BC is II d. lows that if v is the mean velocity in B C
It fol
In this equation Q is 0 when d 0 or d=H. There must, there fore, be an intermediate value of d for which Q will be a maximum. Differentiating we find for the condition of a maximum,
^=0= dd
Giving H d - and d=- IT, or, for maximum discharge, one-thirda O
the head would be expended in producing the velocity of flow. With this value of d the expression for discharge becomes
or if..... (58)
In this formula frictional resistance has been neglected. The dis charge given is the maximum for the conditions, and would result only if the stream discharges itself in accordance with the "principle of least energy."
TJlackwell's experiments, given elsewhere, show a considerably larger coefficient for weirs 3 feet broad, slightly inclined downward, than for those with horizontal crests.
a Given by W. C. Unwin, in article 1 on Hydrodynamics in Ency. Brit. Independently derived by 3. P. Frizell. See his Water Power, pp. 198-200.
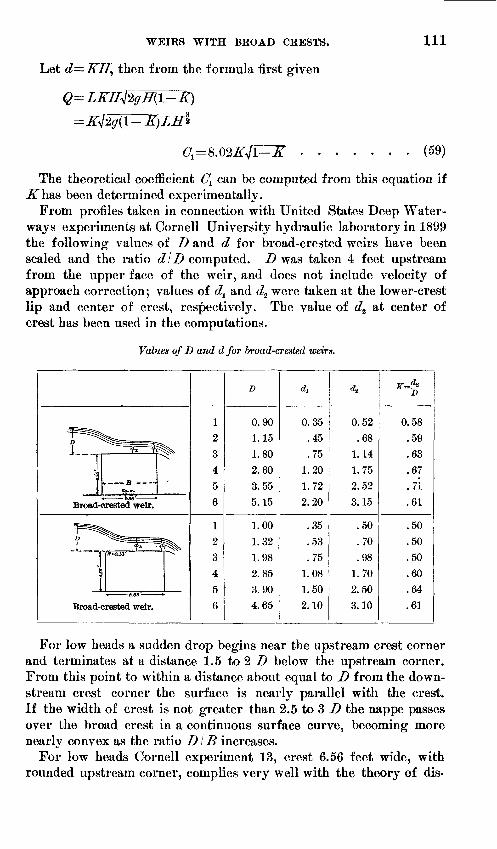
WEIRS WITH BROAD CRESTS.
Let d=KH) then from the formula first given
Ill
(59)
The theoretical coefficient 6^ can be computed from this equation if _5Thas been determined experimentally.
From profiles taken in connection with United States Deep Water ways experiments at Cornell University hydraulic laboratory in 1899 the following values of D and d for broad-crested weirs have been scaled and the ratio dlD computed. D was taken 4 feet upstream from the upper face of the weir, and does not include velocity of approach correction; values of dt and dz were taken at the lower-crest lip and center of crest, respectively. The value of dz at center of crest has been used in the computations.
Values of D and d for broad-crested weirs.
D ^^^^S===t=
\ <& f
I
-1
,. a -- --.
H^
«- fc.56' »
Broad-crested -weir.
^^^f ^^^
J«.ttJ3'
^
Broad-crested weir.
^
12 3 45 6
12 3 4 5 6
D
0.90
1.15
1.80
2.60
3.55
5.15
1.00
1.32
1.98
2.85
3.90
4.65
*
0.35
.45
.75
1.20
1.72
2.20
.35
.53
.75
1.08
1.50
2.10
*
0.52
.68
1.14
1.75
2.52
3.15
.50
.70
.98
1.70
2.50
3.10
K" d% D
0.58
.59
.63
.67
.71
.61
.50
.50
.50
.60
.64
.61
For low heads a sudden drop begins near the upstream crest corner and terminates at a distance 1.5 to 2 D below the upstream corner. From this point to within a distance about equal to D from the down stream crest corner the surface is nearly parallel with the crest. If the width of crest is not greater than 2.5 to 3 D the nappe passes over the broad crest in a continuous surface curve, becoming more nearly convex as the ratio DIB increases.
For low heads Cornell experiment 13, crest 6.56 feet wide, with rounded upstream corner, complies very well with the theory of dis-
112 WEIR EXPERIMENTS, COEFFICIENTS, AND FORMULAS.
charge in accordance of the principle of least energy. The coefficient computed as above is
6;=8.02X 0.585^1-0.585=8.02X0.585X0.6442=3.02
The experimental coefficient with head corrected for velocity of approach is 2.82.
The following additional data may be cited:Trautwine" quotes data of Elwood Morris, C. E., for Clegg's dam,
Cape Fear River, North Carolina. Horizontal crest 8.42 feet wide, vertical faces. .77=1.25 feet, d (throughout central portion of crest) =0.50 foot. dlH=OAQ.
Thos. T. Johnston d gives data of elaborate profiles of the nappe for Desplaines River dam, Illinois. Horizontal planed stone coping, ver tical downstream face; upstream face batter, 1/2:1. 77=0.587 foot. d 0.315 to 0.307 foot in central, nearly level portion at distances 1. to 4 feet from upstream edge of crest. Johnston and Cooley deduce the coefficient (7=1.69 for this case.
BLACKWELL'S EXPERIMENTS ON DISCHARGE OF WATER OVER BROAD- CRESTED WEIRS.
Experiments made by Thomas E. Blackwell,c M. Inst. C. E., are of interest as being probably the first recorded for weirs with broad crests. The discharge was volumetrically measured, and the conditions were generally favorable to accuracy. The experiments were made on a side pond of the Kennet and Avon Canal, 106,200 square feet surface area, closed by a lock at each end, the water being admitted from time to time as required, the relation between area of reservoir and volume of discharge being such that there was no sensible variation in water level during an experiment.
The weir was constructed in a dock to which the water had access through an irregularly shaped channel 40 feet in width, cut off from the main pond by a submerged masonry wall 9 feet wide, situated 25 feet upstream from the weir, having its top 18 inches to 20 inches below water surface.
The water level in the pond being constant when outflow took place, the weir, which had a crest adjustable in a vertical plane, was set with its crest level at the depth below water surface desired for an experi ment, by means of adjusting screws at the ends of the weir; the water
a Engineers' Pocket Book.6 Johnston, T. T., and Cooley, E. L., New experimental data for flow over a broad-crest dam: Jour.
Western Soc. Engrs., vol. 1, Jan., 1896, pp. 80-51.c Original paper before Institution of Civil Engineers of London, reprinted in the Journal of the
Franklin Institute, Philadelphia, March and April, 1852.
WEIRS WITH BROAD CRESTS. 113
was then allowed to waste through the weir until a uniform regimen of flow was established.
A gaging tank having a floor of brick laid in cement, with plank sides, and 449.39 cubic feet capacity, was erected at the foot of the weir. At a given signal the lid of this tank was raised, the time noted, and the rate of filling of the tank recorded by several observ ers. Such leakage from the tank as occurred was separately measured and allowed for. There was no correction for velocity of approach or for end contractions.
The wind was so slight as to be negligible, except during one series when there was a brisk wind blowing downstream. The experimenter states that parallel experiments on a quiet day indicated an increase of about 5 per cent in discharge due to this wind.
The crest of the thin-edged weir consisted of an iron plate barely one-sixteenth inch thick. A square-top plank 2 inches thick was attached to the weir, and an apron of deal boards, roughly planed so as to form an uninterrupted continuation downstream, constituted the wide-crested weir used in the experiments.
The coefficient Ot from Blackwell's experiments has been worked out and is given in the following table. The measured depths taken in inches have also been reduced to feet.
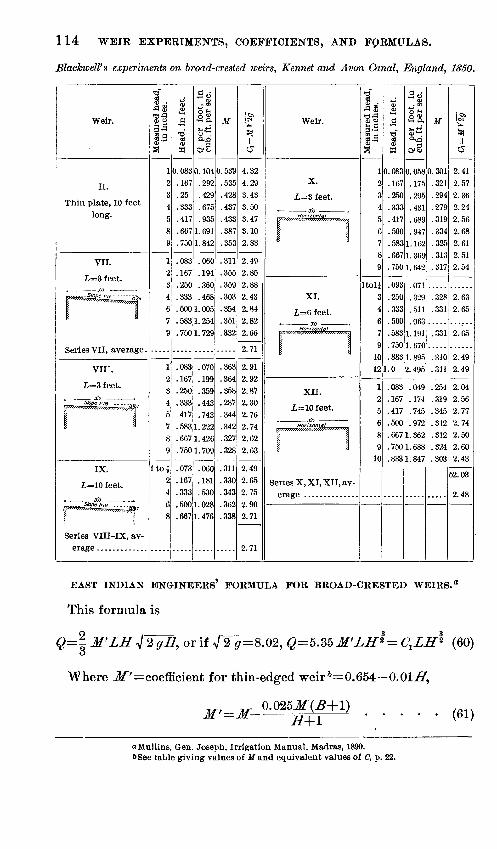
114 WEIR EXPERIMENTS, COEFFICIENTS, AND FpRMULAS.
BlackweWs experiments on broad-crested weirs, Kennet and Avon Canal, England, 1850.
Weir.
II.
Thin plate, 10 feet long.
VII.
£=3 feet.
' Stop?, u
Series VII, average .
vn:.£=3 feet.
OT-- SKfK "la -----\1
1 ' 1
IX.
L=10 feet.
Series VIII-IX, av-
Measured head,
» oo », * 05 to M in inches.
12
3 4 67
9
1 2
3 4 5 7
8 9
2 4
6 8
Head, in feet.
0.083 .167 .25
.333
.417
.667
.750
.083
.167
.250
.333
.500
.583
.750
.083
.167
.250
.333
.417
.583
.667
.750
.073
.167
.333
.500
.667
.So ~- $
<2 &
0.104
.292
.429
.675
.935 1.691 1.842
.060
.194
.360
.468 1.005 1.254
1.729
.070
.199
.359
.443
.743 1.222 1.426 1.709
.060
.181
.530 1.028 1.476
M
0.539 .535 .428 .437
.433
.387
.353
.311
.355
.359
.303
.354
.351
.332
.363
.364
.358
.287
.344
.342
.327
.328
.311
.330
.343
.362
.338
V
1^
4.32
4.29 3.43 3.50 3.47
3.10 2.83
2.49 2.85
2.88 2.43 2.84
2.82 2.66
2.71
2.91 2.92 2.87 2.30 2.76 2.74 2.62 2.63
2.49
2.65 2.75
2.90 2.71
2.71
Weir.
X.
£=3 feet.
Horizontal
^ l
XI.
£=6 feet.
Horizontal
1 l
XII.
J_i J.U ICCv*
Horizontal
Series X, XI, XII, av erage ..............
Measured head, in inches.
12 3 4
5 6 7 8
9
3 4
6 7
9 10 12
12 5 6
8 9
10
Head, in feet.
0.083 .167
.250
.333
.417
.500
.583
.667
.750
.093
.250
.333
.500
.583
.750
.883 1.0
.083
.167
.417
.500
.667
.750
.833
Is
0.058 .175
.295
.431
.689
.947 1. 162 1.369 1.642
.071
.329
.511
.963 1.191
1.670 1.895 2.495
.049
.174
.745
.972 1. 362
1.688 1.847
M
0.301 .321 .294
.279
.319
.334
.325
.313
.317
.328
.331
.331
.310
.311
.254
.319
.345
.312
.312
.324
.303
11^
2.41 2.57
2.36 2.24
2.56 2.68 2.61 2.51 2.54
2.63 2.65
2.65
2.49 2.49
2.04 2.56 2.77 2.74 2.50 2.60 2.43
52.03
2.48
EAST INDIAN ENGINEERS5 FORMULA FOR BROAD-CRESTED WEIRS. a
This formula is
)=- M'LH 4 2 gH, or if V2<7=8.02, Q=5.35M'LJI1S = C\LIT* (60)
Where M' ^coefficient for thin-edged weir b=0.654 0.01 H,
M'=M--S+l (61)
aMullins, Gen. Joseph, Irrigation Manual, Madras, 1890,bSee table giving values of M and equivalent values of C, p. 22.
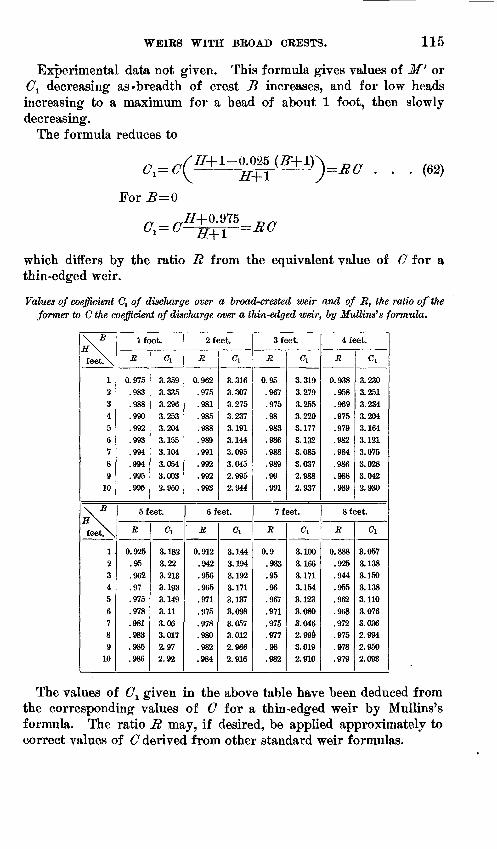
WEIRS WITH BROAD CRESTS. 115
Experimental data not given. This formula gives values of M' or Ol decreasing as 'breadth of crest B increases, and for low heads increasing to a maximum for a head of about 1 foot, then slowly decreasing.
The formula reduces to
(62)For ,8=0
1 Jf+l
which differs by the ratio R from the equivalent value of C for a thin-edged weir.
Values of coefficient C^ of discharge over a broad-crested weir and of R, the ratio of the former to C the coefficient of discharge over a thin-edged weir, by Muttins's formula.
\ Bnr\\
feet\
123456789
10
\ BW N.
\.
feetX,
1 ,23456789
10
Ifoot.
B
0.975.983.988.990.992.993.994.994.995.995
Ci
3.3593.3353.2963.2533.2043.1553.1043.0543.0032.950
5 feet.
R
0.926.95.962.97.975.978.981.983.985.986
Ci
3.1823.223.2133.1933.1493.113.063.0172.972.92
2 feet.
R
0.962.975.981.985.988.989.991.992.992.993
c-i
3.3163.3073.2753.2373.1913.1443.0953.0452.9952.944
6 feet.
' B
0.912.942.956.965.971.975.978.980.982.984
Ci
3.1443.1943.1923.1713.3373.0983.0573.0122.9662.916
3 feet.
R
0.95.967.975.98.983.986.988.989.99.991
Ci
3.3193.2793.2553.2203.1773.1323.0853.0372.9882.937
7 feet.
B
0.9.933.95.96.967.971.975.977.98.982
Ci
3.1003.1663.1713.1543.1233.0803.0462.9993.0192.910
4 feet.
R
0.938.958.969.975.979.982.984.986.988.989
Ci
3.2303.2513.2343.2043.1643.1213.0753.0283.0422.930
8 feet.
B
0.888.925.944.955.962.963.972.975.978.979
Ci
3.0573.1383.1503.1383.1103.0763.0362.9942.9502.093
The values of Ot given in the above table have been deduced from the corresponding values of O for a thin-edged weir by Mullins's formula. The ratio R may, if desired, be applied approximately to correct values of C derived from other standard weir formulas.
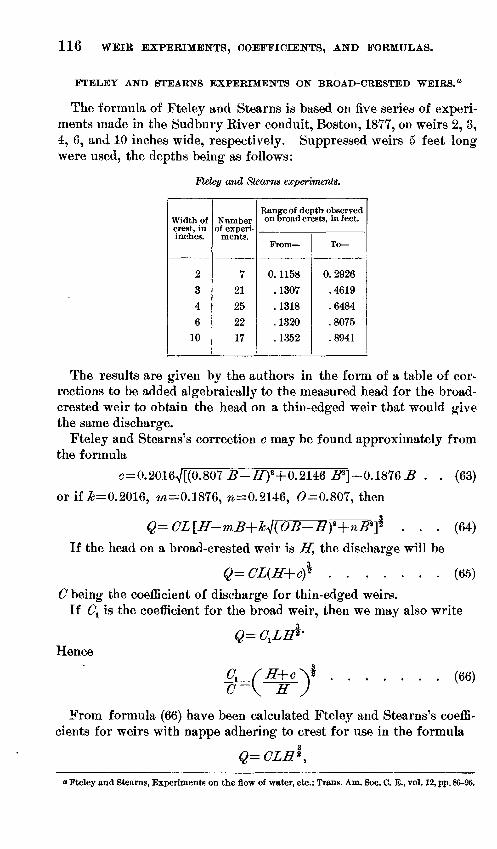
116 WEIR EXPERIMENTS, COEFFICIENTS, AND FORMULAS.
FTELEY AND STEARNS EXPERIMENTS ON BROAD-CRESTED WEIRS."
The formula of Fteley and Stearns is based on five series of experi ments made in the Sudbury Kiver conduit, Boston, 1877, on weirs 2, 3, 4, 6, and 10 inches wide, respectively. Suppressed weirs 5 feet long were used, the depths being as follows:
Fteley and Stearns experiments.
Width of crest, in inches.
2
3
4
6
10
Number of experi
ments.
721
25
22
17
Range of depth observed on broad crests, in feet.
From
0. 1158
.1307
.1318
.1320
.1352
To
0. 2926
.4619
.6484
.8075
.8941
The results are given by the authors in the form of a table of cor rections to be added algebraically to the measured head for the broad- crested weir to obtain the head on a thin-edged weir that would give the same discharge.
Fteley and Stearns's correction c may be found approximately from the formula
s=0.2016V[(0.807 ^-/ P] -0.1876 -B . (63)
or if £=0.2016, m= 0.1 876, ^=0.2146, (9=0.807, then
Q= CL[_H-m£+k^(0£-B}z+n^ . . . (64)
If the head on a broad-crested weir is ff, the discharge will be
Q=CL(H+cY ....... (65)
C being the coefficient of discharge for thin-edged weirs. If C^ is the coefficient for the broad weir, then we may also write
Hence
(66)
From formula (66) have been calculated Fteley and Stearns's coeffi cients for weirs with nappe adhering to crest for use in the formula
Q=
a Fteley and Stearns, Experiments on the flow of water, etc.: Trans. Am. Soc. C. E., vol. 12, pp. 86-96,
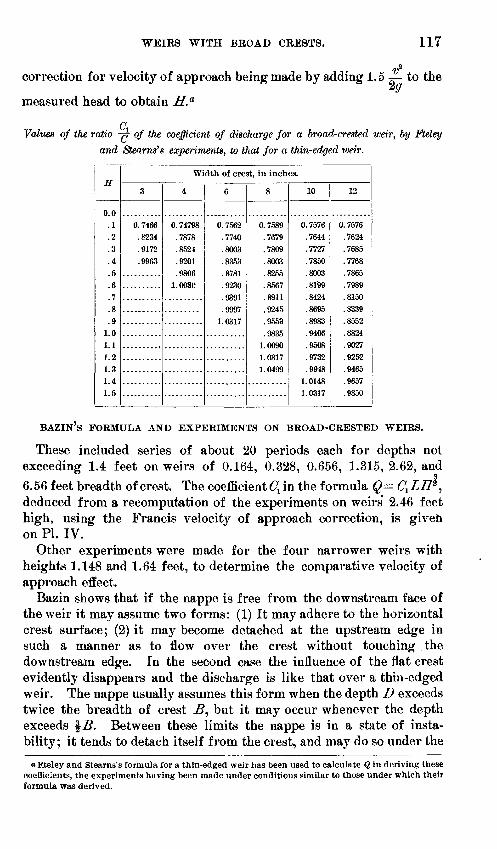
WEIES WITH BBOAD CEESTS. 117
Vcorrection for velocity of approach being made by adding 1.5 to the\f
measured head to obtain H. a
C Values of the ratio ^ of the coefficient of discharge for a broad-crested weir, by Fteley
and Steams's experiments, to that for a thin-edged weir.
H
0.0 .1 .2
.3
.4
.5
.6
.7
.8
.9 1.0 1.1 1.2 1.3 1.4 1.5
Width of crest, in inches.
3
0.7466 .8234 .9172 .9963
4
0. 74798 .7878 .8524 . 9201 .9806
1.0030
6
0.7562 .7740 .8003 .8353 .8781 .9230 .9391 .9997
1.0317
8
0.7589 .7679 .7809 .8003 . 8255 .8567 .8911 .9245 .9553 .9835
1.0090 1.0317 1.0499
10
0. 7576 .7644 .7727 .7850 .8003 .8199 .8424 .8695 .8983 .9406 .9508 .9732 .9948
1.0148 1.0317
12
0. 7576 .7624 .7685 .7768 .7865 .7989 .8150 .8339 .8552 .8824 .9027 .9252 .9465 .9657 .9850
BAZIN's FORMULA AND EXPERIMENTS ON BROAD-CRESTED WEIRS.
These included series of about 20 periods each for depths nol exceeding 1.4 feet on weirs of 0.164, 0.328, 0.656, 1.315, 2.62, and
3
6.56 feet breadth of crest. The coefficient Ol in the formula Q= C^LH*, deduced from a reeomputation of the experiments on weirs" 2.46 feet high, using the Francis velocity of approach correction, is given on PI. IV.
Other experiments were made for the four narrower weirs with heights 1.148 and 1.64 feet, to determine the comparative velocity of approach effect.
Bazin shows that if the nappe is free from the downstream face of the weir it may assume two forms: (1) It may adhere to the horizontal crest surface; (2) it may become detached at the upstream edge in such a manner as to flow over the crest without touching the downstream edge. In the second case the influence of the flat crest evidently disappears and the discharge is like that over a thin-edged weir. The nappe usually assumes this form when the depth D exceeds twice the breadth of crest J?, but it may occur whenever the depth exceeds \B. Between these limits the nappe is in a state of insta bility; it tends to detach itself from the crest, and may do so under the
«F.teley and Stearns's formula for a thin-edged weir has been used to calculate Q in deriving these coefficients, the experiments having been made under conditions similar to those under which their formula was derived.
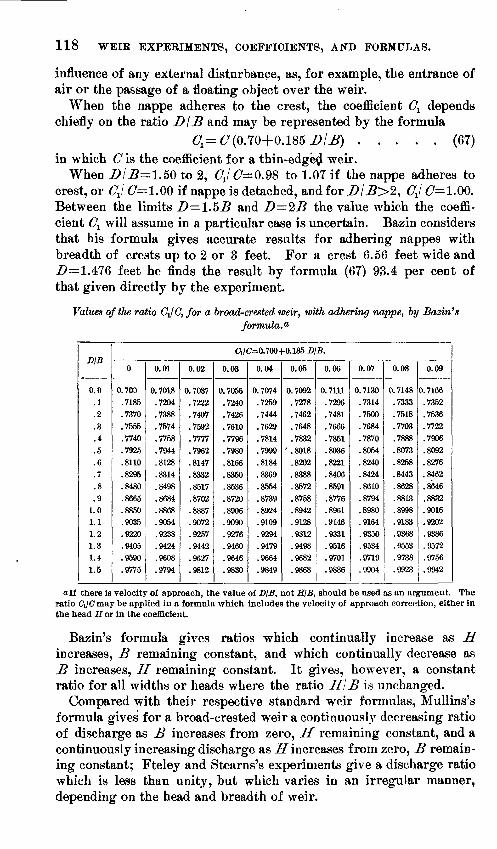
118 WEIR EXPERIMENTS, COEFFICIENTS, AND FORMULAS.
influence of any external disturbance, as, for example, the entrance of air or the passage of a floating object over the weir.
When the nappe adheres to the crest, the coefficient 6^ depends chiefly on the ratio DIB and may be represented by the formula
(71 = C (0.70+0.185 DIB) ..... (67) in which C is the coefficient for a thin-edge^ weir.
When I)I£=1.50 to 2, <71/(7=0.98 to 1.07 if the nappe adheres to crest, or Cj (7=1.00 if nappe is detached, and for DlB>%, CJ (7=1.00. Between the limits D \.^B and D=%B the value which the coeffi cient O1 will assume in a particular case is uncertain. Bazin considers that his formula gives accurate results for adhering nappes with breadth of crests up to 2 or 3 feet. For a crest 6.56 feet wide and D= 1.476 feet he finds the result by formula (67) 93.4 per cent of that given directly by the experiment.
Values of the ratio C-JC, for a broad-crested weir, with adhering nappe, by Bazin'sformula^
DIB
0.0.1.2.3.4.5.6.7.8.9
1.01.11.21.31.41.5
Q/<7=0. 700+0.185 DIB.
0
0.700.7185.7370.7555.7740.7925.8110.8295.8480.8665.8850.9035.9220.9405.9590.9775
0.01
0. 7018.7204.7388.7574.7758.7944.8128.8314.8498.8684.8868.9054.9238.9424.9608.9794
0.02
0.7037.7222.7407.7592.7777.7962.8147.8332.8517.8702.8887.9072.9257.9442.9627.9812
0.03
0.7056.7240.7426.7610.77%.7980.8166.8350.8536.8720.8906.9090.9276.9460.9646.9830
0.04
0.7074.7259.7444.7629.7814.7999.8184.8369.8554.8739.8924.9109.9294.9479.9664.9849
0.05
0.7092.7278.7462.7648.7832
' .8018.8202.8388.8572.8758.8942.9128.9312.9498.9682.9868
0.06
0. 7111.7296.7481.7666.7851.8036.8221.8406.8591.8776.8961.9146.9331.9516.9701.9886
0.07
0.7130.7314.7500.7684.7870.8054.8240.8424.8610.8794.8980.9164.9350.9534.9719.9904
0.08
0. 7148.7333.7518.7703.7888.8073.8258.8443.8628.8813.8998.9183.9368.9553.9738.9923
0.09
0. 7166.7352.7536.7722.7906.8092.8276.8462.8646.8832.9016,9202.9386.9572.9756.9942
a If there is velocity of approach, the value of DIB, not HIB, should be used as an argument. The ratio Ci/Cmay be applied in a formula which includes the velocity of approach correction, either in the head H or in the coefficient.
Bazin's formula gives ratios which continually increase as H increases, B remaining constant, and which continually decrease as B increases, H remaining constant. It gives, however, a constant ratio for all widths or heads where the ratio If IB is unchanged.
Compared with their respective standard weir formulas, Mullins's formula gives for a broad-crested weir a continuously decreasing ratio of discharge as B increases from zero, H remaining constant, and a continuously increasing discharge as II increases from zero, B remain ing constant; Fteley and Stearns's experiments give a discharge ratio which is less than unity, but which varies in an irregular manner, depending on the head and breadth of weir.
WEIRS WITH BROAD CRESTS. 119
On referring to PL IV, in which the Bazin coefficients are given in a form comparable with the experiments of the United States Geological Survey, it will be noticed that, except for the lowest heads, the coeffi cient curves are simple linear functions of the head. The rate of increase of the coefficients as the head increases grows rapidly less as the breadth of the weir increases, indicating that for a very broad weir the coefficient would be sensibly constant throughout the range of stability of the nappe.
For the narrower weirs the coefficients tend to increase rapidly almost from the start toward the value for a thin-edged weir or detached nappe. For the weirs 2.62 and 6.56 feet breadth of crest the total variation in the coefficient for the range of heads covered by the experiments is comparatively small. The average coefficients are as follows:
Average Bazin coefficients, broad-crested weirs.
Bazin series Np.
113
114
115
Crest width, in feet.
1.312
2.624
6.56
Range of head, in feet.
From
Lowest.
0.35
.55
To
0.60
( .85
I 1.32
Highest.
Average con stant coeffi cient, Ci.
2.64
2.59
2.62
« 2. 58
a Coefficient increases slowly throughout.
The average coefficients show a fair agreement with the constant coefficient for broad-crested weirs with stable nappe deduced from the experiments of the United States Geological Survey (page 120).
EXPERIMENTS OF THE UNITED STATES GEOLOGICAL SURVEY ON BROAD-
CRESTED WEIRS.
The method,of conducting these experiments and the detailed results are given on pages 95-107. The coefficient curves are presented on Pis. XXVIII to XXXII. It may be remarked here that the models were larger and the range of breadth of crest and depth of flow experr mented upon was greater than in the earlier experiments described. In general, the laws of behavior of the nappe pointed out by Fteley and Stearns and Bazin were confirmed.
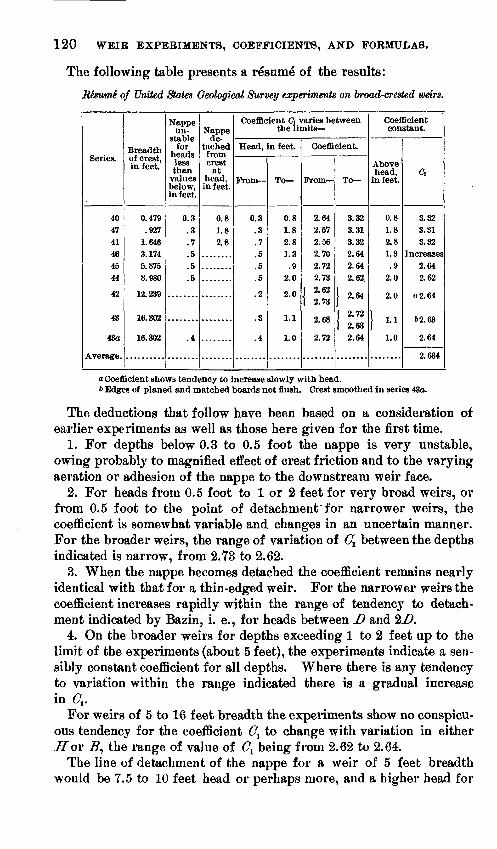
120 WEIR EXPERIMENTS, COEFFICIENTS, AND FORMULAS.
The following table presents a re'sume' of the results:
Pfaume of United States Geological Survey experiments on broad-crested weirs.
Series.
404741464544
42
43
43a
Average.
Breadth of crest, in feet.
0.479.927
1.6463.1745.8758.980
12.239
16.302
16.302
Nappe un-
for heads less than
values below,in feet.
0.3.3.7.5.5.5
.4
Nappe
tached from crest at
head, in feet.
0.81.82.8
Coefficient ft varies between the limits-
Head, in feet.
From
0.3.3.7.5.5.5
.2
.3
.4
To
0.81.82.81.3.9
2.0
2.0
1.1
1.0
Coefficient.
From
2.642.572.562.702.722.73
1 2.62I 2.73
2.68
2.72
To
3.323.313.322.642.642.62
1 2 64
f 2.72 | 2.63
2.64
Coefficient constant.
Above head,
in feet.
0.81.82.81.3.9
2.0
2.0
1 -1.0
Ci
3.323.313.32
Increases2.642.62
a 2. 64
b2.63
2.64
2.634
a Coefficient shows tendency to increase slowly with head.b Edges of planed and matched boards not flush. Crest smoothed in series 43a.
The deductions that follow have been based on a consideration of earlier experiments as well as those here given for the first time.
1. For depths below 0.3 to 0.5 foot the nappe is very unstable, owing probably to magnified effect of crest friction and to the varying aeration or adhesion of the nappe to the downstream weir face.
2. For heads from 0.5 foot to 1 or 2 feet for very broad weirs, or from 0.5 foot to the point of detachment'for narrower weirs, the coefficient is somewhat variable and changes in an uncertain manner. For the broader weirs, the range of variation of C± between the depths indicated is narrow, from 2.73 to 2.62.
3. When the nappe becomes detached the coefficient remains nearly identical with that for a thin-edged weir. For the narrower weirs the coefficient increases rapidly within the range of tendency to detach ment indicated by Bazin, i. e., for heads between D and 2.Z?.
4. On the broader weirs for depths exceeding 1 to 2 feet up to the limit of the experiments (about 5 feet), the experiments indicate a sen sibly constant coefficient for all depths. Where there is any tendency to variation within the range indicated there is a gradual increase in Ov
For weirs of 5 to 16 feet breadth the experiments show no conspicu ous tendency for the coefficient C^ to change with variation in either 7?" or 7?, the range of value of O1 being from 2.62 to 2.64.
The line of detachment of the nappe for a weir of 5 feet breadth would be 7.5 to 10 feet head or perhaps more, and a higher head for
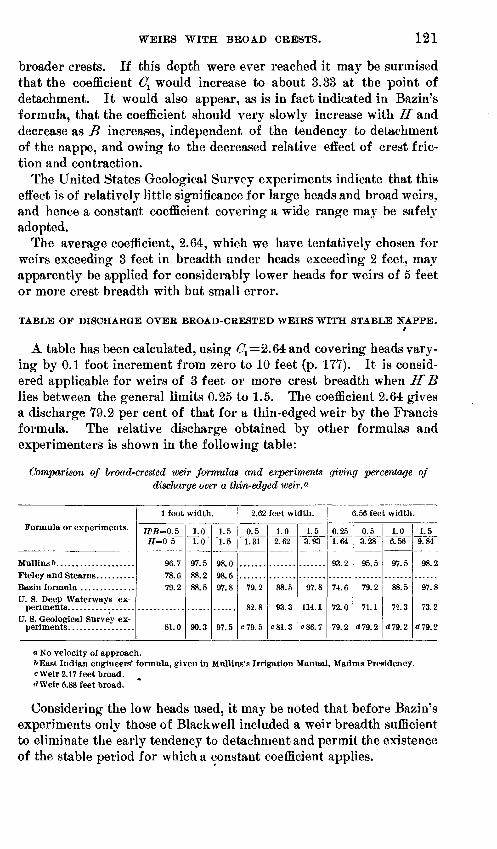
WEIRS WITH BROAD CRESTS. 121
broader crests. If this depth were ever reached it may be surmised that the coefficient C^ would increase to about 3.33 at the point of detachment. It would also appear, as is in fact indicated in Bazin's formula, that the coefficient should very slowly increase with H and decrease as B increases, independent of the tendency to detachment of the nappe, and owing to the decreased relative effect of crest fric tion and contraction.
The United States Geological Survey experiments indicate that this effect is of relatively little significance for large heads and broad weirs, and hence a constant coefficient covering a wide range may be safely adopted.
The average coefficient, 2.64, which we have tentatively chosen for weirs exceeding 3 feet in breadth under heads exceeding 2 feet, may apparently be applied for considerably lower heads for weirs of 5 feet or more crest breadth with but small error.
TABLE OF DISCHARGE OVEK BROAD-CRESTED WEIRS WITH STABLE NAPPE.i
A table has been calculated, using d=2. 64 and covering heads vary ing by 0.1 foot increment from zero to 10 feet (p. 177). It is consid ered applicable for weirs of 3 feet or more crest breadth when If B lies between the general limits 0.25 to 1.5. The coefficient 2.64 gives a discharge 79.2 per cent of that for a thin-edged weir by the Francis formula. The relative discharge obtained by other formulas and experimenters is shown in the following table:
Comparison of broad-crested weir formulas and experiments giving percentage of discharge over a thin-edged weir. a
Formula or experiments.
U. S. Deep Waterways ex-
U. S. Geological Survey ex-
1 foot width.
HIB=0. 5#=0 5
96.7 78.6 79.2
81.0
1.01.0
97.5 88.2 88.5
90.3
1.51.5
98.0 98.5 97.8
97.5
2.62 feet width.
0.51.31
79.2
82.8
c79.5
1.02.62
88.5
93.3
c81.3
1.53.93
97.8
114.1
c86.7
6.56 feet width.
0.251.64
93.2
74.6
72.0
79.2
0.53.28
95.5
79.2
71.1
d79.2
1.06.56
97.5
88.5
72.3
d79.2
1.59.84
98.2
97.8
73.2
<*79.2
a No velocity of approach.6 East Indian engineers' formula, given in Mullins's Irrigation Manual, Madras Presidency.e Weir 2.17 feet broad.rf Weir 5.88 feet broad.
Considering the low heads used, it may be noted that before Bazin's experiments only those of Blackwell included a weir breadth sufficient to eliminate the early tendency to detachment and permit the existence of the stable period for which a constant coefficient applies.
122 WEIR EXPERIMENTS, COEFFICIENTS, AND FORMULAS.
Blackwell's experiments on weirs 8 feet broad indicate a maximum coefficient C^ of 2.65 to 2.77 for a head of about 0.5 foot, decreasing as the head increased.
The experiments of the United States Deep Waterways Board on models with 2.62 and 6.56 foot crest width are shown on PL XV. For the narrower weir the coefficient increased uniformly with the head. The nappe did not leave the crest, although the experiments were continued to the limit H .5=2, at which stage the coefficient exceeded that for a thin-edged weir. For the broader weir the coefficients are much less variable and the curves indicate that the coefficients approach a constant as the breadth of crest is increased.
It will be noted that considerable care must be exercised in deter mining the condition of the nappe for broad-crested weirs of incon siderable width, while for those of greater breadth the wind may exert considerable influence on the nappe on the broad crest under lower heads. The constant coefficient 2.64 has been deduced from experi ments. on weirs with smooth, planed crests and sharp upstream crest angles. The effect of crest roughness on weir discharge is discussed on page 133.
EFFECT OF ROUNDING UPSTREAM CREST EDGE.
Experiments by Fteley and Stearns" indicate that the effect of rounding the upstream crest corner is to virtually lower the weir, by allowing the water to pass over with less vertical contraction. To determine the discharge over a thin-edged weir, with upstream crest corner rounded to a radius R, add to the measured head the quantity
^=0.70.5 ........ (68)The above formula was deduced by Fteley and Stearns from experi
ments on weirs with crest radii of one-fourth, one-half, and 1 inch.For heads not exceeding 0.17, 0.26, and 0.45 foot, respectively, thenappe adhered to the crest, and the formula does not apply.
The correction formula (68) is equivalent to increasing the discharge coefficient in the ratio
/ \
or nearly in the ratio
H+RH '
A second series of experiments was made with rounded upstream edges of similar radii applied to a crest 4 inches wide, giving the cor rection formula for this case,
........ (69)
Experiments on the flow of water, etc.: Trans. Am. Soc. C. E., vol. 12, pp. 97-101.
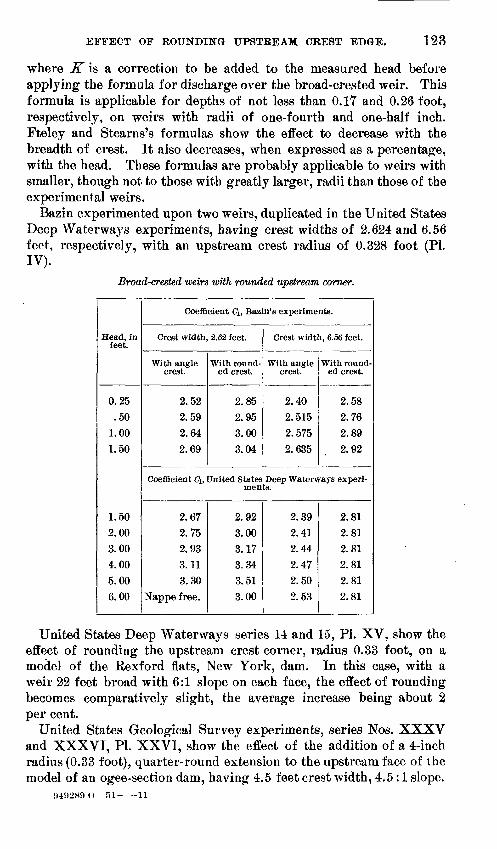
EFFECT OF HOUNDING UPSTREAM CREST EDGE. 123
where JTis a correction to be added to the measured head before applying the formula for discharge over the broad-crested weir. This formula is applicable for depths of not less than 0.17 and 0.26 foot, respectively, on weirs with radii of one-fourth and one-half inch. Fteley and Stearns's formulas show the effect to decrease with the breadth of crest. It also decreases, when expressed as a percentage, with the head. These formulas are probably applicable to weirs with smaller, though not to those with greatly larger, radii than those of the experimental weirs.
Bazin experimented upon two weirs, duplicated in the United States Deep Waterways experiments, having crest widths of 2.624 and 6.56 feel, respectively, with an upstream crest radius of 0.328 foot (PL IV).
Broad-crested weirs with rounded upstream corner.
Head, in feet.
0.25.50
1.001.50
1.502.003.004.005.006.00
Coefficient C\, Bazin' s experiments.
Crest width, 2.62 feet.
With angle crest.
2.522.592.642.69
With round ed crest.
2.852.953.003.04
Crest width, 6.56 feet.
With angle crest.
2.402.5152.5752.635
With round ed crest.
2.582.762.892.92
Coefficient Ci, United States Deep Waterways experi ments.
2.67
2.752.933.113.30
Nappe free.
2.923.003.173.343.513.00
2.392.412.442.472.502.53
2.812.812.812.812.812.81
United States Deep Waterways series 14 and 15, PL XV, show the effect of rounding the upstream crest corner, radius 0.33 foot, on a model of the Kexford flats, New York, dam. In this case, with a weir 22 feet broad with 6:1 slope on each face, the effect of rounding becomes comparatively slight, the average increase being about 2 per cent.
United States Geological Survey experiments, series Nos. XXXV and XXXVI, PL XXVI, show the effect of the addition of a 4-inch radius (0.33 foot), quarter-round extension to the upstream face of the model of an ogee-section dam, having 4.5 feet crest width, 4.5 :1 slope.
!)4'.I2SO <) 51 11

124 WEIR EXPERIMENTS, COEFFICIENTS, AND FORMULAS.
Effect of rounded upstream crest corner on an ogee dam.
Head, in feet.
0.50
1.00
2.00
3.00
Chambly model,
series 85.
3.18
3.30
3.42
3.49
Same, with rounded up stream crest
corner.
3.23
3.34
3.51
3.64
Difference per cent of Francis's
coefficient.
+1.5
+1.2
+2.7
+4.5
EXPERIMENTS ON WEIRS WITH DOWNSTREAM SLOPE, OR APRON, OF VARYING INCLINATION.
Aside from the experiments of Blackwell on weirs with very slight inclination and a few series by other experimenters on weirs of irreg ular section involving aprons, the data on this subject are limited to those of Bazin's experiments.
Bazin selected a number of weir types, each having a constant top width, height, and upstream inclination and applied to each a number of different downstream slopes. 0
TRIANGULAR WEIRS WITH VERTICAL UPSTREAM FACE AND SLOPING
APRONS.
Such weirs are occasionally used, as where the apron slopes to the stream bed in log slides. A similar form in which the downstream slope terminates at a greater or less distance from the vertical upstream face is not uncommon, and to this form the Bazin experiments may probably be applied, provided the breadth of the sloping apron is con siderable. The experiments are of special interest, however, as show ing the effect of attaching a sloping apron to the downstream face of a thin-edged weir, and by inference affording an indication of the effect of a similar apron attached to any form of cross section. The results of Bazin's experiments recomputed on the basis of the Francis" for mula are shown on PL V.
Four series of experiments on weirs 2.46 feet high are included. For all these series the coefficient C tends to remain nearly constant for the range of heads covered, 0.2 foot to 1.5 feet, there being a slight increase in C with the lower heads only.
Two series on weirs 1.64 feet high are also given. In series 145, slope of apron 3:1, there is a general increase in coefficient with head below 0.9 foot. Series 138, for a weir 1.64 feet high, is duplicated on a weir 2.46 feet high, and the latter series is given preference in the general curve. The lower weirs indicate in both cases slightly higher coefficients, possibly owing to the incomplete elimination of the effect of excessive velocity of approach.
a Bazin did not attempt to collate the results extensively. His general resumS has been translated by the writer, and may be found in Kept. U. 8. Board of Engineers on Deep Waterways, pt. 2,1900, pp. 646-658.
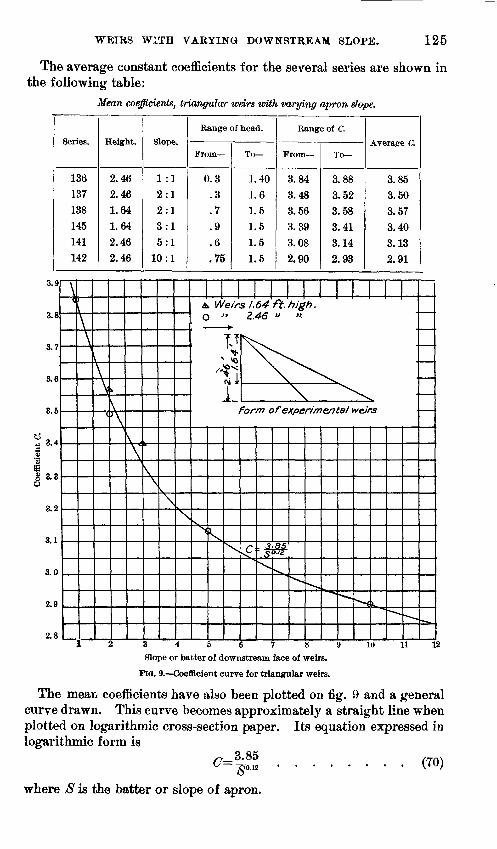
WEIRS WITH VARYING DOWNSTREAM SLOPE. 125
The average constant coefficients for the several series are shown in the following table:
Mean coefficients, triangular weirs with varying apron dope.
3.9
3.8
3.7
3.6
3.5
3.4
3.3
3.2
3.1
3.0
2.9
2.8
Series.
136
137
138
145
141
142
Height.
2.46
2.46
1.64
1.64
2.46
2.46
Slope.
1 :1
2:1
2:1
3:1
5:1
10:1
Range of head-.
From
0.3
.3
.7
.9
.6
.75
To
1.40
1.6
1.5
1.5
1.5
1.5
Range of C.
From
3.84
3.48
3.56
3.39
3.08
2.90
A
\\
I\\
\V
\\
y
\\
A Weir0 "
<v
^
AT ^1
<\| Jr
Li
k,X.
12345
To
3.88
3.52
3.58
3.41
3.14
2.93
Average C.
3.85 3.50 3.57 3.40 3.13 2.91
s 1.64 ft'. high. Z.46 » »r \ ^
?orm of experimental weirs
^' s'o-/z
^ ^
*-^-^ ^
3^-~^. ^
««»_
67 8 9 1U 11 L
Slope or batter of downstream face of weirs.
PIG. 9. Coefficient curve for triangular weirs.
The mean coefficients have also been plotted on fig. 9 and a general curve drawn. This curve becomes approximately a straight line when plotted on logarithmic cross-section paper. Its equation expressed in logarithmic form is
<?=|S ........ (70)
where 8 is the batter or slope of apron.
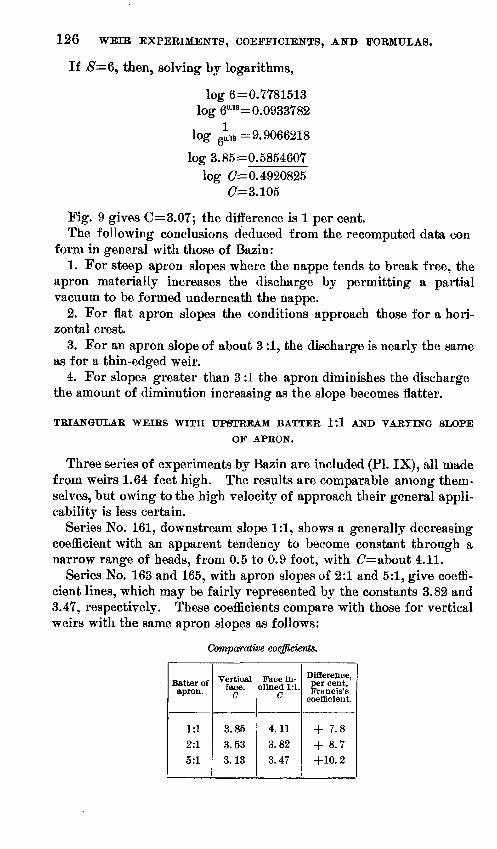
126 WEIR EXPERIMENTS, COEFFICIENTS, AND FORMULAS.
If £=6, then, solving by logarithms,
log 6=0.7781513 log 6°-18 =0.0933782
log goT8 = 9.9066218
log 3.85=0.5854607 log (7=0.4920825
<7=3.105
Fig. 9 gives C=3.07; the difference is 1 per cent. The following conclusions deduced from the recomputed data con
form in general with those of Bazin:1. For steep apron slopes where the nappe tends to break free, the
apron materially increases the discharge by permitting a partial vacuum to be formed underneath the nappe.
2. For flat apron slopes the conditions approach those for a hori zontal crest.
3. For an apron slope of about 3 :1, the discharge is nearly the same as for a thin-edged weir.
4. For slopes greater than 3 :1 the apron diminishes the discharge the amount of diminution increasing as the slope becomes flatter.
TRIANGULAR WEIRS WITH UPSTREAM BATTER 1:1 AND VARYING SLOPE
OF APRON.
Three series of experiments by Bazin are included (PI. IX), all made from weirs 1.64 feet high. The results are comparable among them selves, but owing to the high velocity of approach their general appli cability is less certain.
Series No. 161, downstream slope 1:1, shows a generally decreasing coefficient with an apparent tendency to become constant through a narrow range of heads, from 0.5 to 0.9 foot, with C= about 4.11.
Series No. 163 and 165, with apron slopes of 2:1 and 5:1, give coeffi cient lines, which may be fairly represented by the constants 3.82 and 3.47, respectively. These coefficients compare with those for vertical weirs with the same apron slopes as follows:
Comparative coefficients.
Batter of apron.
1:1
2:1
5:1
Vertical face.
C
3.853.533.13
Face in clined 1:1.
C
4.113.82
3.47
Difference, per cent, Francis's
coefficient.
+ 7.8
+ 8.7+10.2
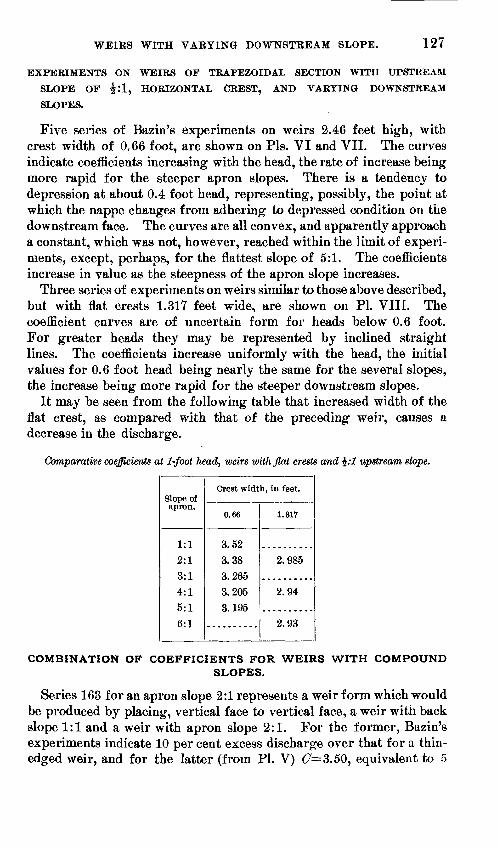
WEIRS WITH VARYING DOWNSTREAM SLOPE. 127
EXPERIMENTS ON WEIRS OF TRAPEZOIDAL SECTION WITH UPSTREAM
SLOPE OF i:l, HORIZONTAL CREST, AND VARYING DOWNSTREAM
SLOPES.
Five series of Bazin's experiments on weirs 2.46 feet high, with crest width of 0.66 foot, are shown on Pis. VI and VII. The curves indicate coefficients increasing with the head, the rate of increase being more rapid for the steeper apron slopes. There is a tendency to depression at about 0.4 foot head, representing, possibly, the point at which the nappe changes from adhering to depressed condition on the downstream face. The curves are all convex, and apparently approach a constant, which was not, however, reached within the limit of experi ments, except, perhaps, for the flattest slope of 5:1. The coefficients increase in value as the steepness of the apron slope increases.
Three series of experiments on weirs similar to those above described, but with flat crests 1.317 feet wide, are shown on PI. VIII. The coefficient curves are of uncertain form for heads below 0.6 foot. For greater heads they may be represented by inclined straight lines. The coefficients increase uniformly with the head, the initial values for 0.6 foot head being nearly the same for the several slopes, the increase being more rapid for the steeper downstream slopes.
It may be seen from the following table that increased width of the flat crest, as compared with that of the preceding weir, causes a decrease in the discharge.
Comparative coefficients at 1-foot Jiead, weirs with flat crests and %:1 upstream slope.
Slope of apron.
1:1 2:1 3:1 4:1 5:1 6:1
Crest width, in feet.
0.66
3.52 3.38 3.265 3.205 3.195
1.317
2.985
2.94
2.93
COMBINATION OF COEFFICIENTS FOR WEIRS WITH COMPOUNDSLOPES.
Series 163 for an apron slope 2:1 represents a weir form which would be produced by placing, vertical face to vertical face, a weir with back slope 1:1 and a weir with apron slope 2:1. For the former, Bazin's experiments indicate 10 per cent excess discharge over that for a thin- edged weir, and for the latter (from PL V) £7=3.50, equivalent to 5
128 WEIR EXPERIMENTS, COEFFICIENTS, AND FORMULAS.
per cent excess over a thin-edged weir. If the discharge over the 1:1 upstream slope was similarly increased by the addition of an apron, C would be 3.66x1.05=3.84. PI. IX indicates (7=3.82.
The above method of determining the coefficient for weir of irregu lar cross section by combining the coefficients for two principal ele ments of which it is composed, as separate weirs, is restricted in its application and may lead to inconsistencies.
WEIRS WITH VARYING SLOPE OF UPSTREAM FACE.
Experiments were made by Bazin on thin-edged weirs inclined at various angles. Bazin found the ratio of the coefficient of discharge to that for a vertical thin-edged weir to be sensibly constant for all heads within the limits of his experiments, 0.0 to 1.5 feet. Bazin's results were expressed in the form of a modulus by which to multiply the coefficient for a vertical weir to obtain that for an inclined weir. Assuming the Francis coefficient 3.33 to apply to a vertical weir, the coefficients for weirs of various inclinations would be as follows:
Coefficients for inclined weirs, Sazin's experiments.
Upstream inclination of the weir _ . . .<
Vertical weir. ......................
Downstream inclination of the weir. .<
'1 horizontal to 1 vertical. . .2 horizontal to 3 vertical. . .
k l horizontal to 3 vertical...
1 horizontal to 3 vertical. . .2 horizontal to 3 vertical. . .1 horizontal to 1 vertical. . .2 horizontal to 1 vertical. . .4 horizontal to 1 vertical. . .
Bazin's modulus.
0.93
.94
.96
1.00
1.04
1.07
1.10
1.12
1.09
C
3.0973.1303.197 3.3303.4633.5633.6633.9963.630
On PL XVI are shown the results of United States Deep Waterways experiments on weirs 4.9 feet high, having horizontal crests 0.67 foot broad, and with various inclinations of the upstream slope. The experiments cover heads from 1.75 to 5.2 feet, but only 3 or 4 points are given on each coefficient curve. The results indicate in a general way, however, nearly constant coefficients for each inclination of the upstream face. The values of the coefficients are considerably smaller than those obtained by Bazin, whose experiments were on weirs 2.46 feet high with sharp crests.
Pis. X, XI, and XII show the results of experiments of Bazin on weirs of irregular section, with various upstream slopes. PI. X includes 5 series of experiments, on weirs 1.64 feet high, with sharp
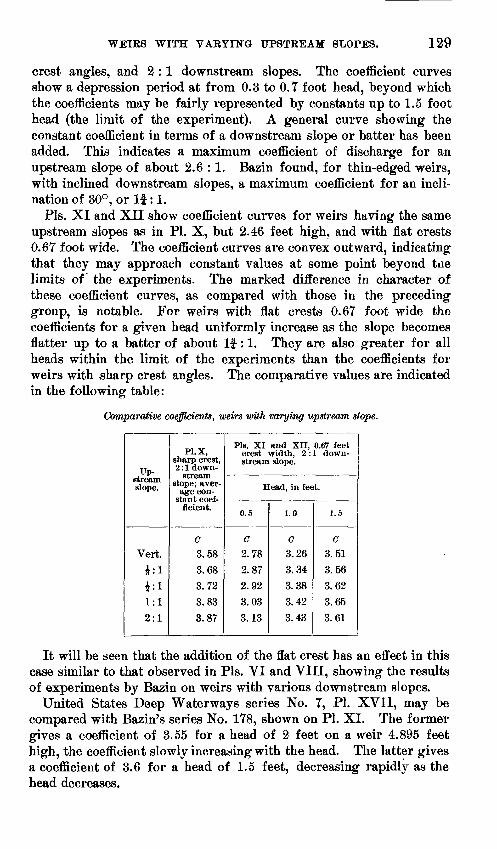
WETES WITH VARYING UPSTREAM SLOPES. 129
crest angles, and 2 :1 downstream slopes. The coefficient curves show a depression period at from 0.3 to 0.7 foot head, beyond which the coefficients may be fairly represented by constants up to 1.5 foot head (the limit of the experiment). A general curve showing the constant coefficient in terms of a downstream slope or batter has been added. This indicates a maximum coefficient of discharge for an upstream slope of about 2.6 :1. Bazin found, for thin-edged weirs, with inclined downstream slopes, a maximum coefficient for an incli nation of 30°, or If :1.
Pis. XI and XII show coefficient curves for weirs having the same upstream slopes as in PI. X, but 2.46 feet high, and with flat crests 0.67 foot wide. The coefficient curves are convex outward, indicating that they may approach constant values at some point beyond tne limits of" the experiments. The marked difference in character of these coefficient curves, as compared with those in the preceding group, is notable. For weirs with flat crests 0.67 foot wide the coefficients for a given head uniformly increase as the slope becomes flatter up to a batter of about If: 1. They are also greater for all heads within the limit of the experiments than the coefficients for weirs with sharp crest angles. The comparative values are indicated in the following table:
Comparative coefficients, weirs with varying upstream slope.
Up stream slope.
Vert.i:l*:11:12:1
Pl.X, sharp crest, 2 : 1 down
stream slope; aver
age con-
C
3.58
3.68
3.72
3.83
3.87
Pis. XI and XII, 0.67 feetcrest width, 2 : 1 down stream slope.
Head, in feet.
0.5
C
2.78
2.87
2.92
3.03
3.13
1.0
C3.26
3.34
3.38
3.42
3.43
1.5
C3.51
3.56
3.62
3.65
3.61
It will be seen that the addition of the flat erest has an effect in this case similar to that observed in Pis. VI and VIII, showing the results of experiments by Bazin on weirs with various downstream slopes.
United States Deep Waterways series No. 7, PI. XVII, may be compared with Bazin's series No. 178, shown on PI. XI. The former gives a coefficient of 3.55 for a head of 2 feet on a weir 4.895 feet high, the coefficient slowly increasing with the head. The latter gives a coefficient of 3.6 for a head of 1.5 feet, decreasing rapidly as the head decreases.
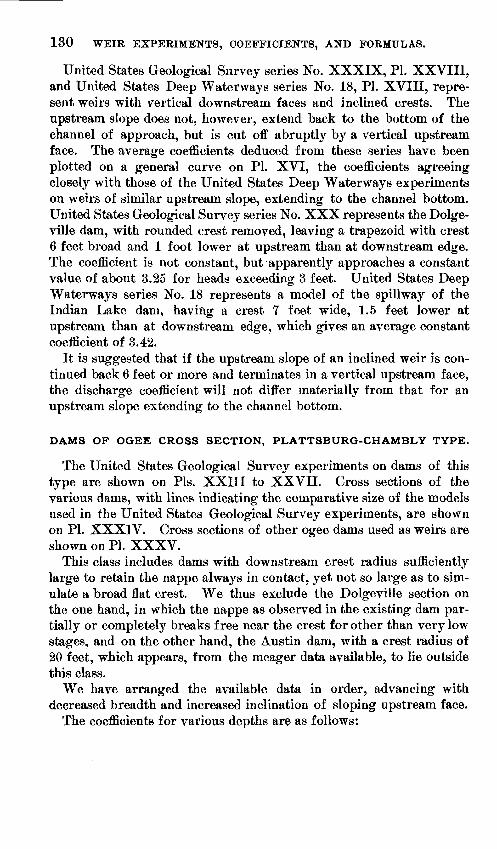
130 WEIR EXPERIMENTS, COEFFICIENTS, AND FORMULAS.
United States Geological Survey series No. XXXIX, PL XXVIII. and United States Deep Waterways series No. 18, PL XVIII, repre sent weirs with vertical downstream faces and inclined crests. The upstream slope does not, however, extend back to the bottom of the channel of approach, but is cut off abruptly by a vertical upstream face. The average coefficients deduced from these series have been plotted on a general curve on PL XVI, the coefficients agreeing closely with those of the United States Deep Waterways experiments on weirs of similar upstream slope, extending to the channel bottom. United States Geological Survey series No. XXX represents the Dolge- ville dam, with rounded crest removed, leaving a trapezoid with crest 6 feet broad and 1 foot lower at upstream than at downstream edge. The coefficient is not constant, but apparently approaches a constant value of about 3.25 for heads exceeding 3 feet. United States Deep Waterways series No. 18 represents a model of the spillway of the Indian Lake dam, having a crest 7 feet wide, 1.5 feet lower at upstream than at downstream edge, which gives an average constant coefficient of 3.42.
It is suggested that if the upstream slope of an inclined weir is con tinued back 6 feet or more and terminates in a vertical upstream face, the discharge coefficient will not differ materially from that for an upstream slope extending to the channel bottom.
DAMS OF OGEE CROSS SECTION, PLATTSBURG-CHAMBLY TYPE.
The United States Geological Survey experiments on dams of this type are shown on Pis. XXIII to XXVII. Cross sections of the various dams, with lines indicating the comparative size of the models used in the United States Geological Survey experiments, are shown on PL XXXIV. Cross sections of other ogee dams used as weirs are shown on PL XXXV.
This class includes dams with downstream crest radius sufficiently large to retain the nappe always in contact, yet not so large as to sim ulate a broad flat crest. We thus exclude the Dolgeville section on the one hand, in which the nappe as observed in the existing dam par tially or completely breaks free near the crest for other than very low stages, and on the other hand, the Austin dam, with a crest radius of 20 feet, which appears, from the meager data available, to lie outside this class.
We have arranged the available data in order, advancing with decreased breadth and increased inclination of sloping upstream face.
The coefficients for various depths are as follows:
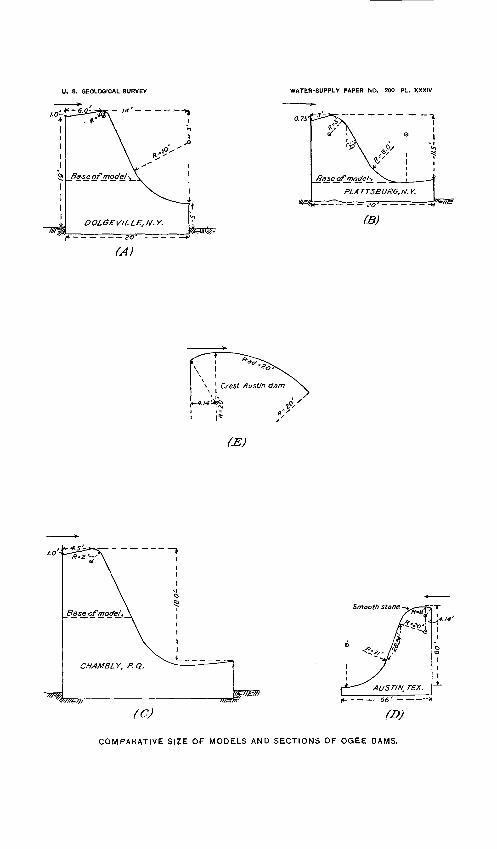
U. S. GEOLOGICAL SURVEY WATER-SUPPLY PAPER NO. 200 PL. XXXIV
(JE)
Smooth stone
AUSTIN, TEX. 66' -
(D)
COMPARATIVE SIZE OF MODELS AND SECTIONS OF OGEE DAMS.
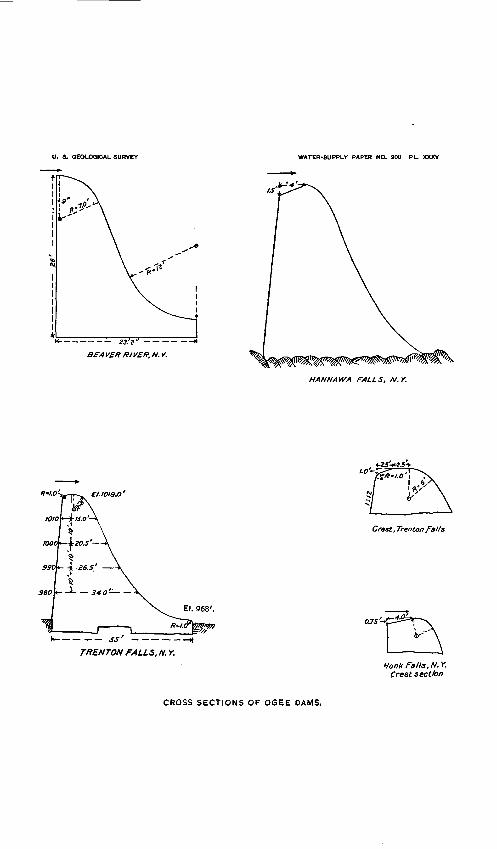
U. 8. GEOLOGICAL SURVEY WATER-SUPPLY PAPER NO. 200 PL. XXXV
BEA VEX RIVER. N. Y.
El. 968'.
TXENTON FALLS, N. Y.
HANN AW A FALLS, N.Y.
Crest, Trenton falJs
Honk Falls,N.Y. Crest section
CROSS SECTIONS OF OGEE DAMS.
O.
-8.
BB
DU
Xa
CA
L
SU
RV
EY
WA
TE
R-S
UP
PL
Y
PA
PE
R
NO
. 200
PL
. X
XX
VI
Exp
erim
en
tal
cfa
taS
eri
es
Sym
bol
Cre
sts/
op
e
Cre
stw
/cft
fyV
.S.G
.S.
30-3
1
A
P/a
ttsburg
(ffe
gJ
4:/
3
"
32-3
3
C "
(Sp
ec)
2
:/
3*
3
4
a
'/
1.0
4:1
3
" 33
o
Cham
b/y
4
.5-7
4.5
3i
He
ad
- fe
et
Note
- C
rest
racf
/us
mu
st
be s
uch
tha
t nappe a
cfhere
s to
face
of d
am
C
rest
Mcft
hB
mu
st
be
at
/east 3
ft
6
7 3
9
IO
C ~
£ 3
.6^
-.I6
(S-I
) } H
^0
Exa
mp/e
S
= <
? v
H<
*4.o
C
=3.4
6 X
4**
o
Lo
g 4
zo =
.O3I
O3
4y*°
= /.
O7/
6 C
-3
.7O
3 com
pute
d
C'fro
m e
xp
erim
en
ts
3.7
O
CO
EF
FIC
IEN
T
DIA
GR
AM
F
OR
O
GE
E
DA
MS
.

DAMS OF OG-EE CROSS SECTION. 131
Comparative coefficients, dams of ogee cross sect-ion.
Approx. constant coeffi cient...................
Breadth of slope, in feet .
Series ....................
HeadO. 5 foot.......1.0 foot. ......2.0 feet.......S.Ofeet. ......4.0feet.......5.0feet. ......6.0 feet. ......
/Cham- 1 bly.
3.435 4.5
4i;l 2.0
3.30
3.42
3.49
3.53
Platts- burg.
3.48 3
4:1 3.0
U.S.G.S. "30
3.22
3.43
3.42
3.47
3.52
Modified Plattsburg.
3.48 3
4:1 3.0
U.S.G.S. 631
3.29
3.35
3.43
3.54
3.62
3.48 3
4:1 3.0
Mean of 30-31
3.36
3.385
3.45
3.53
3.70 3
2:1 3.0
U.S.G.S. 632
3.29
3.37
3.51
3.57
3.67
3.73
3.70 3
2:1 3.0
U.S.G.S. a33
3.22
3.44
3.67
3.72
3.74
3.70 3
2:1 3.0
Mean of 32-33
3.255
3.405
3.59
3.645
3.705
3 1.04:1
3.0U.S.G.S.
34
3.46
3.75
3.87
3.88
«15.969 feet crest length, without end contraction. & 7.979 feet crest length, one end contraction.
It appears that the rounded crest changes the character of the law of coefficient from a value tending toward a constant for each back slope to a slowly increasing function of the head. Compared with the constant coefficients for weirs with similar upstream slopes extending back to canal bottom, and with vertical faces, we find that the con stant values deduced for these cases correspond with the values of the varying coefficients for ogee sections at a medium head of 2 to 4 feet.
By plotting the data for weirs of ogee section on logarithmic cross- section paper the following convenient approximate formula has been deduced, applicable for weirs with 2 or 3 feet crest radius and up stream slopes 3 to 4.5 feet broad. S indicates the batter ratio of the slope, horizontal run
vertical risey = [3.62-0.16 (£-1)] H*1 (71)
If #=2:1 #=4.0 #=3.46X4""
log 4*¥ =0.030103 C- 3.46 X1.0716=3.70. The experiments give £=3.74.
EXPERIMENTS ON DISCHARGE OVER ACTUAL DAMS.
On PL XXXVII are shown the results of a number of experiments made by measuring the discharge over existing dams by means of floats or current meters. Aside from those for the Austin, Tex., dam, the data have been collected by Mr. George T. Nelles. a
aDiscnssion of paper by G. W. Rafter on the flow of water over dams: Trans. Am. Soc. C. E., vol. 44, pp. 359-362.
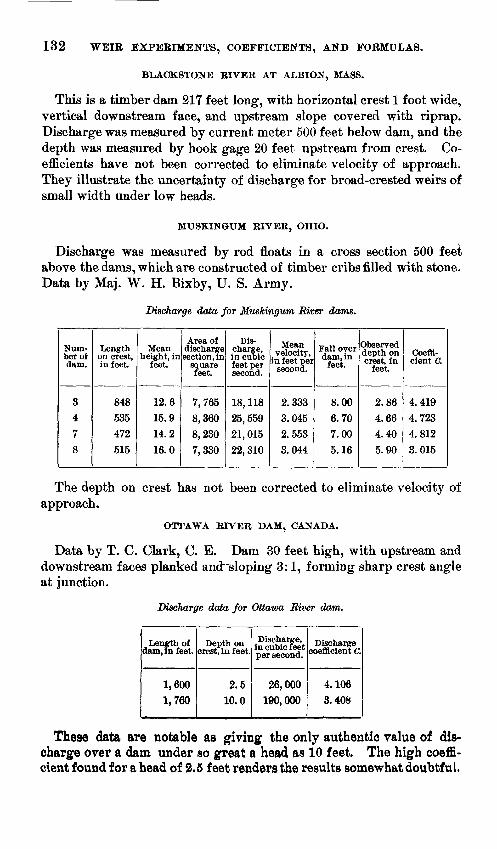
132 WEIR EXPERIMENTS, COEFFICIENTS, AND FORMULAS.
BLACKSTONE RIVER AT ALBION, MASS.
This is a timber dam 217 feet long, with horizontal crest 1 foot wide, vertical downstream face, and upstream slope covered with riprap. Discharge was measured by current meter 500 feet below dam, and the depth was measured by hook gage 20 feet upstream from crest. Co efficients have not been corrected to eliminate velocity of approach. They illustrate the uncertainty of discharge for broad-crested weirs of small width under low heads.
MUSKINGUM RIVER, OHIO.
Discharge was measured by rod floats in a cross section 500 feei above the dams, which are constructed of timber cribs filled with stone. Data by Maj. W. H. Bixby, U. S. Army.
Discharge data for Muskingum River dams.
N lim ber of dam.
3
4
78
Length on crest, in feet.
848
535472515
Mean height, in
feet.
12.6
15.914.216.0
Area of discharge section, in
square feet.
7,7658,3608,2307,330
Dis charge, in cubic feet per second.
18, 118
25, 55921, 01522, 310
Mean velocity,
in feet per second.
2.333
3.0452.5533.044
Fall over dam, in
feet.
8.00
6.70
7.00
5.16
Observed depth on crest, in
feet.
2.86
4.664.405.90
Coeffi cient C.
4.4194.7234.8123.015
The depth on crest has not been corrected to eliminate velocity of approach.
OTTAWA RIVER DAM, CANADA.
Data by T. C. Clark, C. E. Dam 30 feet high, with upstream and downstream faces planked anchsloping 3:1, forming sharp crest angle at junction.
Discharge data for Ottawa River dam.
Length of dam, in feet.
1,600
1,760
Depth on crest, in feet.
2.510.0
Discharge, in cubic feet per second.
26,000190,000
Discharge coefficient C.
4.1063.408
These data are notable as giving the only authentic value of dis charge over a dam under so great a head as 10 feet. The high coeffi cient found for a head of 2.5 feet renders the results somewhat doubtful.
U. S. GEOLOGICAL SURVEY WATER-SUPPLY PAPER NO. 200 PL. XXXVII
Coeffi cient
C.
.2 .4 .6 .8 1.0 1.8 1.4 1.6 Corrected head II in feet.
TAYLOR-HOWARD EXPERIMENTS ON DAM AT AUSTIN, TEX
Coeffi cient
C. 4.00
3.80
3.60
(TV
'
$
&
&/ »
kr
.2 .4 .6 .8 1.0 I. 1: Corrected head H in feet.
EXPERIMENTS OF DWCHT PORTER, BLACKSTONE RIVER, ALBION, MASS.
T,mt)er cribs . stone n/tea
Coeffi cient
C. 6.00
4.50
4.CO
8.60
Q) ""r _ _ - -' - ' - ._=*J)~.
*. . @
xV
x v
X
'x
4.0 6.0Corrected head H In feet.
KUSKINGUM RIVER DAM. DATA BY MAJ, W, H. EIXBY, U. S. A.
6XPERIMENTS TO DETERMINE COEFFICIENT C FROM ACTUAL DAMS.
B.O
ROUGHNESS OF CREST. 133
AUSTIN, TEX., DAM."
A series of current-meter measurements of the discharge over this dam were made in January and March, 1900. Several observations at each depth have been combined. The resulting mean coefficients are given in the following table:
Discharge coefficients for the Austin, Tex., dam.
Date.
1900.
Jan. 15Jan. 18Jan. 26Mar. 28Mar. 28
Average
Num ber.
1
2
3
4
5
H
1.09
.72
.42
1.44
1.32
IT=depth at crest of dam.
0.838
.625
.33
1.04
.96
Ranee of vari ation of C.
From
3.09
3.00
3.06
3.32
3.26
To
3.14
3.11
3.13
3.36
3.33
Number of de
termina tions.
4
11
4
3
5
Average value of C.
3.132
3.053
3.112
3.333
3.302
3.186
ROUGHNESS OF CREST.
The models used in weir experiments have usually been constructed of planed and matched timber. In actual dams a wide variety of con ditions exist, including, in the order of roughness, sheet-steel crests, boards smoothed by wear and rendered slippery by water soaking and fungus growths, unplaned boards, dressed masonry, formed concrete, rubble and undressed ashlar, with earth, cobble, or broken-stone approaches. For the determination of the extent, if any, to which the coefficient applying for a smooth-crested dam must be modified to apply to any of these conditions, the following data are available.
UNITED STATES DEEP WATERWAYS, SERIES 7 AND 8 (PL. XVIl).
Model dams, 4.9 feet high, 2:1 slope on both faces. The mean coeffi cients are about 1 per cent greater for crest of planed boards than for crest covered with one-fourth-inch mesh wire cloth.
a Taylor, T. U., the Austin dam: Water-Sup, and Irr. Paper No. 40, U. S. Geol. Survey, 1900, p. 33.
949289 0 51 12 %
134 WEIR EXPERIMENTS, COEFFICIENTS, AND FORMULAS.
CROTON DAM, ROUND-CREST SECTION, MODEL A (PL. XIX).
Crest rounded, radius 10 feet. Upstream slope about 6:1.
Comparative coefficients with varying roughness, Oroton round crest.
Series .....
Head, in feet.
0.25
.50
1.00
1.50
2.00
2.50
3.00
1
Smooth-pine crest.
3.34
3.24
3.21
3.21
3.21
3.21
3.21
la
Unplaned- plank crest and slope."
2.84
2.91
3.04
3.12
3.15
3.15
2
Broken- stone slope, unplaned
crest.
3.18
3.18
3.19
3.20
3.21
3.22
3.22
3
Broken- stone slope, wire cloth on crest.
3.16
3.09
3.15
3.15
3.15
3.15
3.15
« This series appears doubtful. R. E. H.
CROTON DAM, ANGULAR SECTION, MODEL B (PL. XX).
Apron slope 1.25:1, upstream slope 6.24:1 for 13 feet, then rough, and slope about 4:1 to bottom.
Comparative coefficients, varying roughness, Oroton angular crest.
0.25
.50
1.00
1.50
2.00
2.50
Unplaned plank.
3.61
3.63
3.67
3.68
3.70
3.70
Unplaned plank,
rough -stone approach.
3.66
3.66
3.66
3.66
3.66
Rough-stone approach, wire cloth on crest.
3.56
3.57
3.58
3.60
3.61
3.62
The data given above are somewhat discordant, but indicate that in general the decrease in discharge resulting from the roughness of the various materials forming the crests and approaches of dams will not exceed from 1 to 2 per cent for low heads, and usually decreases as the depth of overflow increases,
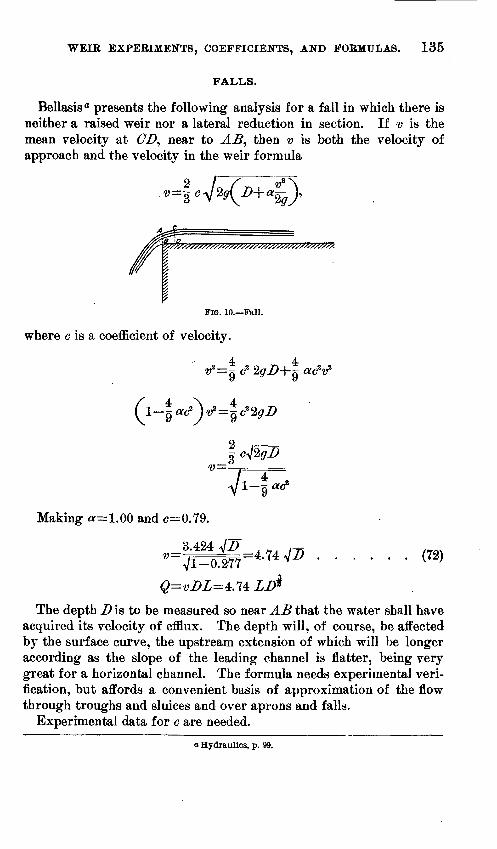
WEIR EXPERIMENTS, COEFFICIENTS, AND FORMULAS. 135
FALLS.
Bellasis® presents the following analysis for a fall in which there is neither a raised weir nor a lateral reduction in section. If v is the mean velocity at <7Z), near to AB, then v is both the velocity of approach and the velocity in the weir formula
FIG. 10. Fall.
where c is a coefficient of velocity.
Making or=1.00 and c=0.79.
3.424v=Vl-0.277
=4.74 (72)
The depth D is to be measured so near AB that the water shall have acquired its velocity of efflux. The depth will, of course, be affected by the surface curve, the upstream extension of which will be longer according as the slope of the leading channel is flatter, being very great for a horizontal channel. The formula needs experimental veri fication, but affords a convenient basis of approximation of the flow through troughs and sluices and over aprons and falls.
Experimental data for c are needed.
a Hydraulics, p. 99.
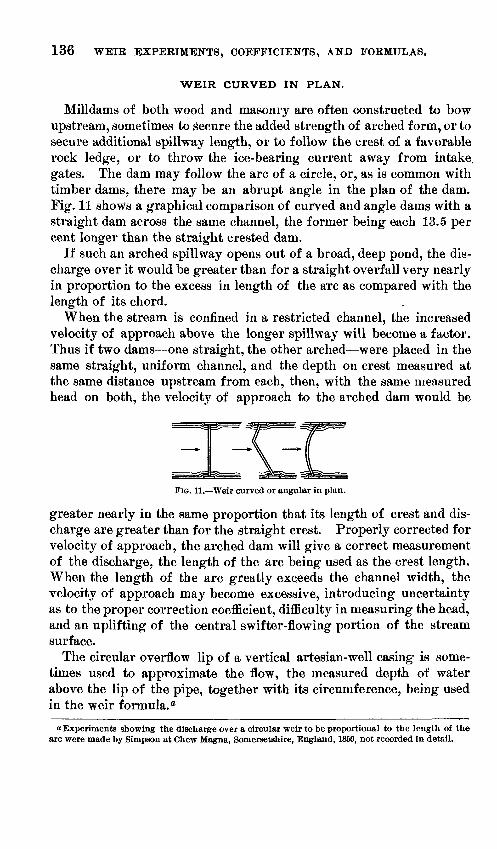
136 WEIR EXPERIMENTS, COEFFICIENTS, AND FORMULAS.
WEIR CURVED IN PLAN.
Mill dams of both wood and mason ry are often constructed to bow upstream, sometimes to Secure the added strength of arched form, or to secure additional spillway length, or to follow the crest of a favorable rock ledge, or to throw the ice-bearing current away from intake, gates. The dam may follow the arc of a circle, or, as is common with timber dams, there may be an abrupt angle in the plan of the dam. Fig. 11 shows a graphical comparison of curved and angle dams with a straight dam across the same channel, the former being each 13.5 per cent longer than the straight crested dam.
If such an arched spillway opens out of a broad, deep pond, the dis charge over it would be greater than for a straight overfall very nearly in proportion to the excess in length of the arc as compared with the length of its chord.
When the stream is confined in a restricted channel, the increased velocity of approach above the longer spillway will become a factor. Thus if two dams one straight, the other arched were placed in the same straight, uniform channel, and the depth on crest measured at the same distance upstream from each, then, with the same measured head on both, the velocit}^ of approach to the arched dam would be
FIG. 11. Weir curved or angular in plan.
greater nearly in the same proportion that its length of crest and dis charge are greater than for the straight crest. Properly corrected for velocity of approach, the arched dam will give a correct measurement of the discharge, the length of the arc being used as the crest length. When the length of the arc greatly exceeds the channel width, the velocity of approach may become excessive, introducing uncertainty as to the proper correction coefficient, difficulty in measuring the head, and an uplifting of the central swifter-flowing portion of the stream surface.
The circular overflow lip of a vertical artesian-well casing' is some times used to approximate the flow, the measured depth of water above the lip of the pipe, together with its circumference, being used in the weir formula. a
a Experiments showing the discharge over a circular weir to be proportional to the length of the arc were made by Simpson at Chew Magna, Somersetshire, England, 1850, not recorded in detail.
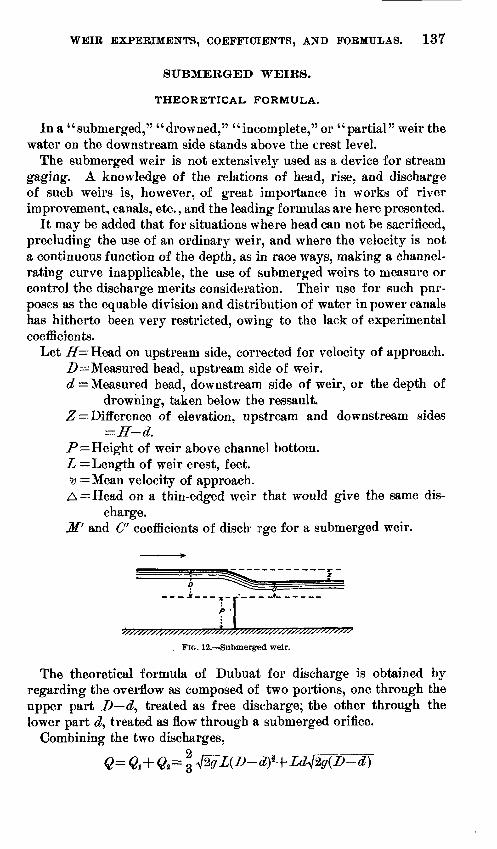
WEIR EXPERIMENTS, COEFFICIENTS, AND FORMULAS. 137
SUBMERGED WEIRS.
THEORETICAL FORMULA.
In a "submerged," "drowned," "incomplete," or "partial" weir the water on the downstream side stands above the crest level.
The submerged weir is not extensively used as a device for stream gaging. A knowledge of the relations of head, rise, and discharge of such weirs is, however, of great importance in works of river improvement, canals, etc., and the leading formulas are here presented.
It may be added that for situations where head can not be sacrificed, precluding the use of an ordinary weir, and where the velocity is not a continuous function of the depth, as in race ways, making a channel- rating curve inapplicable, the use of submerged weirs to measure or control the discharge merits consideration. Their use for such pur poses as the equable division and distribution of water in power canals has hitherto been very restricted, owing to the lack of experimental coefficients.
Let .77= Head on upstream side, corrected for velocity of approach. Z>=Measured head, upstream side of weir. d Measured head, downstream side of weir, or the depth of
drowning, taken below the ressault. Z Difference of elevation, upstream and downstream sides
=H-d.P Height of weir above channel bottom. L Length of weir crest, feet. 'y^Mean velocity of approach.A=Head on a thin-edged weir that would give the same dis
charge. M' and C' coefficients of disctr rge for a submerged weir.
FIG. 12. Submerged weir.
The theoretical formula of Dubuat for discharge is obtained by regarding the overflow as composed of two portions, one through the upper part D d, treated as free discharge; the other through the lower part d, treated as flow through a submerged orifice.
Combining the two discharges,
138 WEIR EXPERIMENTS, COEFFICIENTS, AND FORMULAS.
By reducing, including a coefficient, and us ing the head ZT corrected for velocity of approach, we have the general formula for a submerged weir.
. . . (73)
The head due to the velocity of retreat should in strictness be sub tracted from the depth of submergence d. This is not commonly done. however, in the experiments, where the usual method of producing the submergence is by damming and retarding the water below. In prac tice, if the velocity of retreat is large, the correction should be made.
The theory of formula (73) makes 6" =1.5 times the value of the coefficient C in the free portion of the discharge. 0 This value is adopted by Dubuat and Weisbach.
D'Aubuisson gives 6"=1.43<7.Francis's early experiments make 6" = 1.38*7.From gage records of large rock-filled crib dams on Kentucky
River, having planked upstream slope 3:1 and vertical steps below crest height of dams about 20 feet, heads 4 to 7.5 feet, mean 5.3 feet Nelles found results as follows:
Dam No. 3, water falling slowly 4 days, <7'=1.5<7.Dam No. 2, water falling slowly 3 days, ' G' =1.53 C.Dam No. 1, water rising and falling slowly 5 days, O' IAQO.
FTELEY AND STEARNS SUBMERGED-WEIR FORMULAE
Fteley and Stearns use the base formula
Z ...... (74)
Coefficients for the above formula were derived from experiments on thin-edged weirs, by Fteley and Stearns and by J. B. Francis, and give correct results for weirs for which the free discharge would be correctly calculated by the Francis formula.
The head on upstream side varied from 0.3251 to 0.9704 foot, and
-JT varied from 0.063 to 0.081 with air under nappe, and from 0.077
to 0.975 with no air under nappe, and in applying the formula the same conditions should be complied with. The authors comment that where sufficient head can not be obtained for a weir of the usual free- discharge type, a submerged weir may be used, provided that the head does not vary greatly.
a See valuable discussion of submerged weirs by Geo. T. Nelles in Trans. Am. Soc. C. E., vol. 44, pp. 369-383.
t> Fteley and Stearns, Experiments on the now of water, etc.: Trans. Am. Soc. C. E., vol. 12, pp. 101-108.
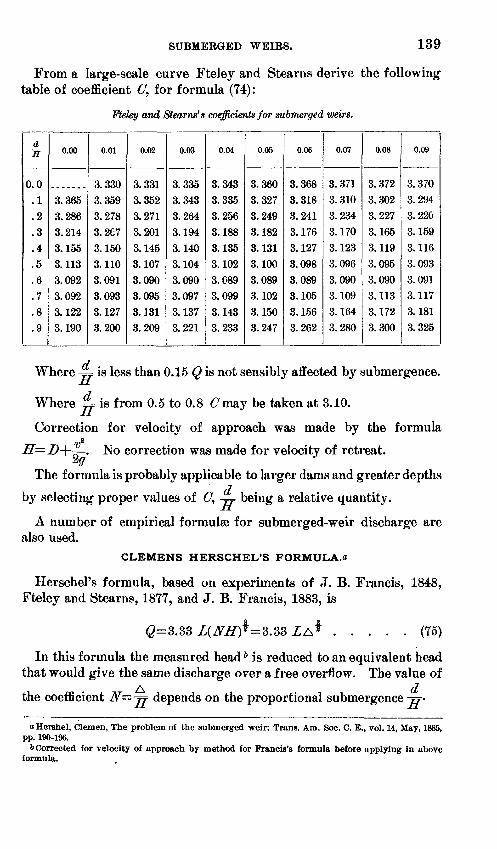
SUBMEKGED WEIBS. 139
From a large-scale curve Fteley and Stearns derive the following table of coefficient 6X, for formula (74):
Fteley and Steams's coefficients for submerged weirs.
d H
0.0
.1
.2
.3
.4
.5
.Q
.7
.8
.9
0.00
3.365
3.286
3.214
3.155
3. 113
3.092
3.092
3.122
3.190
0.01
3. 330
3.359
3.278
3.2C7
3.150
3.110
3.091
3.093
3.127
3.200
0.02
3.331
3.352
3.271
3.201
3.145
3.107
3.090
3.095
3.131
3.209
0.03
3.335
3.343
3.264
3.194
3.140
3.104
3.090
3.097
3.1373.221
0.04
3. 343
3.335
3.256
3.188
3.135
3.102
3. 089
3.099
3.143
3.233
0.05
3.360
3.327
3.249
3.182
3.131
3.100
3.089
3.102
3.150
3.247
0.06
3.368
3.318
3.241
3.176
3.127
3.098
3.089
3.105
3.156
3.262
0.07
3.371
3.310
3.234
3.170
3.123
3.096
3.0903.109
3.164
3.280
0.08
3.372
3.302
3.227
3.165
3.119
3.095
3.090
3.113
3.172
3.300
0.09
3.370
3.294
3. 220
3.159
3.116
3.093
3.091
3.117
3.181
3.325
Where -^ is less than 0.15 Q is not sensibly affected by submergence.
Where -^ is from 0.5 to 0.8 C may be taken at 3.10. Jti
Correction for velocity of approach was made by the formulaa
=D-\-^-. No correction was made for velocity of retreat.
The formula is probably applicable to larger dams and greater depths
by selecting proper values of C, -^ being a relative quantity.
A number of empirical formulae for submerged-weir discharge are also used.
CLEMENS HERSCHEL'S FORMULA.^
Herschel's formula, based on experiments of J. B. Francis, 1848, Fteley and Stearns, 1877, and J. B. Francis, 1883, is
#=3.33 Z(AZO*=3.33 (75)
In this formula the measured head b is reduced to an equivalent head that would give the same discharge over a free overflow. The value of
the coefficient N -JJ depends on the proportional submergence -jr-
oHershel, Clemen, The problem of the submerged weir: Trana. Am. Soc. C. E., vol. 14, May, 1885, pp. 190-196.
& Corrected for velocity of approach by method for Francis's formula before applying in above formula.
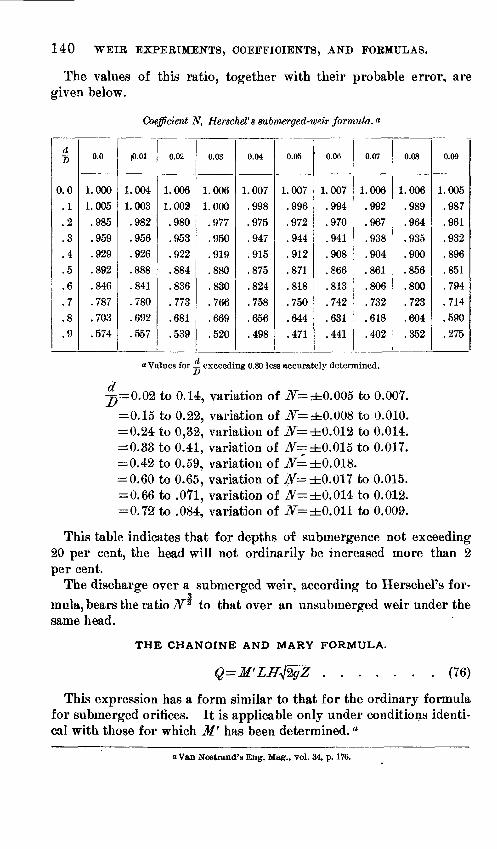
140 WEIR EXPERIMENTS, COEFFICIENTS, AND FORMULAS.
The values of this ratio, together with their probable error, are given below.
Coefficient N, Herschel's submerged-weir formula. «
rfD
0.0
.1
.2
.3
.4
.5
.6
.7
.8
.9
0.0
1.0001.005.985.959.929
.892
.846
.787
.703
.574
|0.01
1.004
1.003
.982
.956
.926
.888
.841
.780
.692
.557
0.02
1.006
1.002
.980
.953
.922
.884
.836
.773
.681
.539
0.03
1.006
1.000
.977
.950
.919
.880
.830
.766
.669
.520
0.04
1.007.998
.975
.947
.915
.875
.824
.758
.656
.498
0.05
1.007
.996
.972
.944
.912
.871
.818
.750
.644
.471
0.06
1.007
.994
.970
.941
.908
.866
.813
.742
.631
.441
0.07
1.006.992
.967
.938
.904
.861
.806
0.08
1.006
.989
.964
.935
.900
.856
.800
. 732 ' . 723
. 618 . 604
.402 .352
0.09
1.005
.987
.961
.932
.896
.851
.794
.714
.590
.275
a Values for exceeding 0.80 less accurately determined.
02 to 0.14, variation of ^=±0.005 to 0.007.
=0.15 to 0.22, variation of ^=±0.008 to 0.010. =0.24 to 0,32, variation of ^=±0.012 to 0.014. =0.33 to 0.41, variation of ^=±0.015 to 0.017. =0.42 to 0.59, variation of ^=±0.018. = 0.60 to 0.65, variation of ^=±0.017 to 0.015. =0.66 to .071, variation of ^=±0.014 to 0.012. =0.72 to .084, variation of N= ±0.011 to 0.009.
This table indicates that for depths of submergence not exceeding 20 per cent, the head will not ordinarily be increased more than 2 per cent.
The discharge over a submerged weir, according to Herschel's for
mula, bears the ratio N* to that over an unsubmerged weir under the same head.
THE CHANOINE AND MARY FORMULA.
(76)
This expression has a form similar to that for the ordinary formula for submerged orifices. It is applicable only under conditions identi cal with those for which M' has been determined. a
a Van Nostrand's Eng. Mag., vol. 34, p. 176.
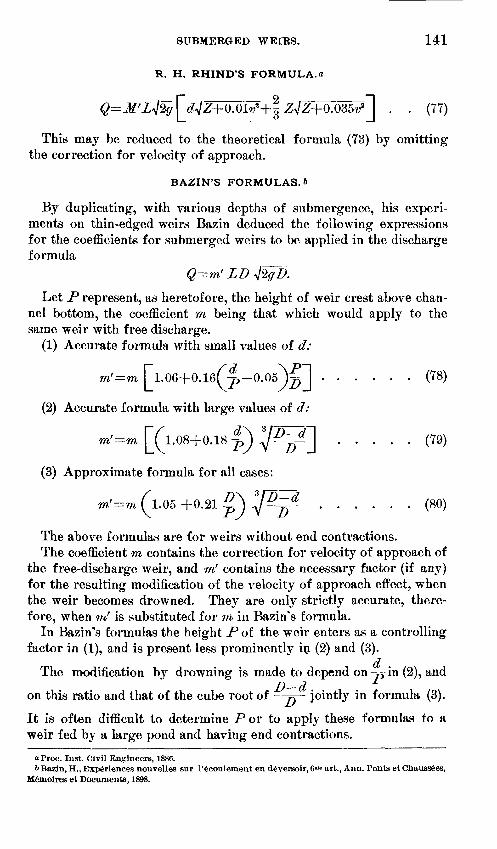
SUBMERGED WEIRS. 141
R. H. RHIND'S FORMULA.a
. . (77)
This may be reduced to the theoretical formula (73) by omitting the correction for velocity of approach.
BAZIN'S FORMULAS. &
By duplicating, with various depths of submergence, his experi ments on thin-edged weirs Bazin deduced the following expressions for the coefficients for submerged weirs to be applied in the discharge formula
Q-m1 LT)
Let P represent, as heretofore, the height of weir crest above chan nel bottom, the coefficient m being that which would apply to the same weir with free discharge.
(1) Accurate formula with small values of d:
m'=m fl. 06+0. lefp- 0.05^1 ...... (78)
(2) Accurate formula with large values of d:
m'=m [(i.08+0.18 -p) l]^jf\ ..... (79)
(3) Approximate formula for all cases:
m'=m 1.05 +0.21 ...... (80)
The above formulas are for weirs without end contractions.The coefficient m contains the correction for velocity of approach of
the free-discharge weir, and m' contains the necessary factor (if any) for the resulting modification of the velocity of approach effect, when the weir becomes drowned. They are only strictly accurate, there fore, when m' is substituted for m in Bazin's formula.
In Bazin's formulas the height P of the weir enters as a controlling factor in (1), and is present less prominently in (2) and (3).
The modification by drowning is made to depend on -^ in (2), andD d on this ratio and that of the cube root of jj- jointly in formula (3).
It is often difficult to determine P or to apply these formulas to a weir fed by a large pond and having end contractions.
a Proc. Inst. Civil Engineers, 1886.& Bazin, H., Experiences nouvelles sur l'6coulement en dgversoir, 6m« art., Ann. Fonts et Chaussees,
Memoires et Documents, 1898.
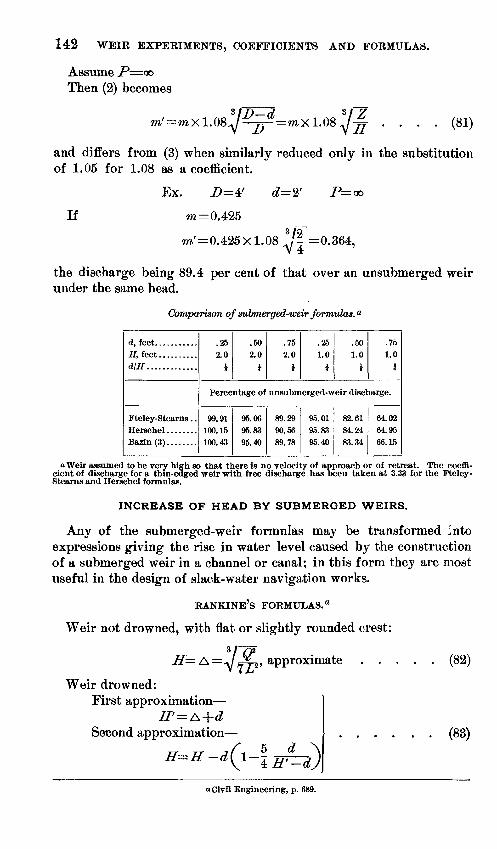
142 WEIB EXPEBIMENTS, COEFFICIENTS AND FOBMULAS.
Assume P=<x> Then (2) becomes
3 / 08 V'D-d
=mXl..08^ .... (81)
and differs from (3) when similarly reduced only in the substitution of 1.05 for 1.08 as a coefficient.
Ex. Z>=4'
If
m'=0.425xl.08 Jl =0.364,
the discharge being 89.4 per cent of that over an unsubmerged weir under the same head.
Comparison of submerged-weir formulas. a
d, feet...........flifeet..........dIH.. ...........
Pteley-Stearns . .
Bazin (3)........
.25 2.0
»
.50 2.0
i
.75 2.0
I
.25 1.0
i
.50 1.0
1
.75 1.0
1
Percentage of unsubmerged-weir discharge.
99.91 100.15 100.43
95.06 95.83 95.40
89.29 90.56 89.78
95.01 95.83 95.40
82.61 84.24 83.34
64.02 64.95 66.15
a Weir assumed to be very high so that there is no velocity of approach or of retreat. The coeffi cient of discharge for a thin-edged weir with free discharge has beeu taken at 3.33 for the Pteley- Stearns and Herschel formulas.
INCREASE OF HEAD BY SUBMERGED WEIRS.
Any of the submerged-weir formulas may be transformed into expressions giving the rise in water level caused by the construction of a submerged weir in a channel or canal; in this form they are most useful in the design of slack-water navigation works.
RANKINE'S FORMULAS."
Weir not drowned, with flat or slightly rounded crest:
, approximate
Weir drowned:First approximation
Second approximation
(82)
(83)
a Civil Engineering, p. 689.
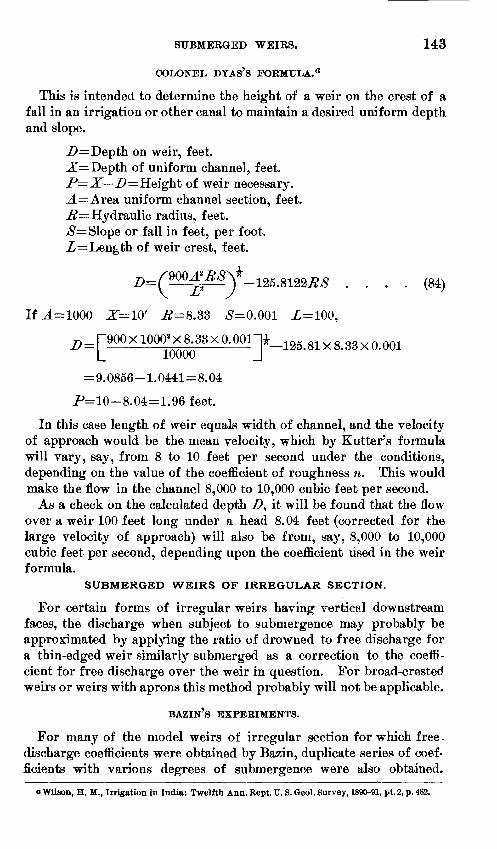
SUBMEEGED WEIES. 143
COLONEL DYAS'S FORMULA. 0
This is intended, to determine the height of a weir on the crest of a fall in an irrigation or other canal to maintain a desired uniform depth and slope.
D= Depth on weir, feet.JL= Depth of uniform channel, feet.P=X D= Height of weir necessary.A=A.re& uniform channel section, feet.R= Hydraulic radius, feet.S= Slope or fall in feet, per foot.L= Length of weir crest, feet.
.... (84)
If J.=1000 X=10' ^=8.33 #=0.001 Z=100,
|_ 10000
=9.0856-1.0441=8.04
P=10-8.04=1.96 feet.
In this case length of weir equals width of channel, and the velocity of approach would be the mean velocity, which by Kutter's formula will vary, say, from 8 to 10 feet per second under the conditions, depending on the value of the coefficient of roughness n. This would make the flow in the channel 8,000 to 10,000 cubic feet per second.
As a check on the calculated depth />, it will be found that the flow over a weir 100 feet long under a head 8.04 feet (corrected for the large velocity of approach) will also be from, say, 8,000 to 10,000 cubic feet per second, depending upon the coefficient used in the weir formula.
SUBMERGED WEIRS OF IRREGULAR SECTION.
For certain forms of irregular weirs having vertical downstream faces, the discharge when subject to submergence may probably be approximated by applying the ratio of drowned to free discharge for a thin-edged weir similarly submerged as a correction to the coeffi cient for free discharge over the weir in question. For broad-crested weirs or weirs with aprons this method probably will not be applicable.
BAZIN'S EXPERIMENTS.
For many of the model weirs of irregular section for which free - discharge coefficients were obtained by Bazin, duplicate series of coef ficients with various degrees of submergence were also obtained.
a Wilson, H. M., Irrigation in India: Twelfth Ann. Kept. U. S. Geol. Survey, 1890-91, pt. 2, p. 482.
144 WEIR EXPERIMENTS, COEFFICIENTS, AND FORMULAS.
Many of these data have been reduced to English units by Nelles. 0 Evidently each form of weir section will require a special formula or table of coefficients, and little more can be done than to refer to the original data for each specific case.
By way of general illustration of the character of submergence effect on weirs of irregular section, the writer has deduced the following roughly approximate formulas from Bazin's experiments on triangular weirs with vertical upstream faces and sloping aprons. The weirs were 2.46 feet high and the end contractions were suppressed. Coeffi cient curves for free discharge are given on PL V.
Three series are included:Series 195, batter of face 1:1.Series 196, batter of face 2:1.Series 197, batter of face 5:1.
Experiments in which the proportional submergence -^ was nearly
the same were grouped, and the average values of A, Z>, and d were
determined. From these the mean values of -=r and -~ were computed
and platted and a straight-line formula deduced.
(85)5=0.08+0.17^.
The initial effect occurs whend 0.17^-0.20D i>rz?_L.nna ........ 100;
In the above formulas A is the measured head on a weir with free overflow, having the same form of cross section, that would give the same discharge. D is the depth on the submerged weir, d is the depth of submergence, and B is the batter or slope of the apron.
DATA CONCERNING EAST INDIAN WEIRS.
The following data compiled by Nelles* are derived from observa tions on actual dams under heads unusually great. The calculated coefficients in the ordinary weir formula (a)
in the theoretical submerged-weir formula (b)
and in the Rhind formula (77) are given in columns 14, 13, and 12, respectively (p. 145), the observed head being corrected for velocity of approach.
oTrans. Am. Soc. C. E., vol. 44, pp. 359-383. »Loc. cit.
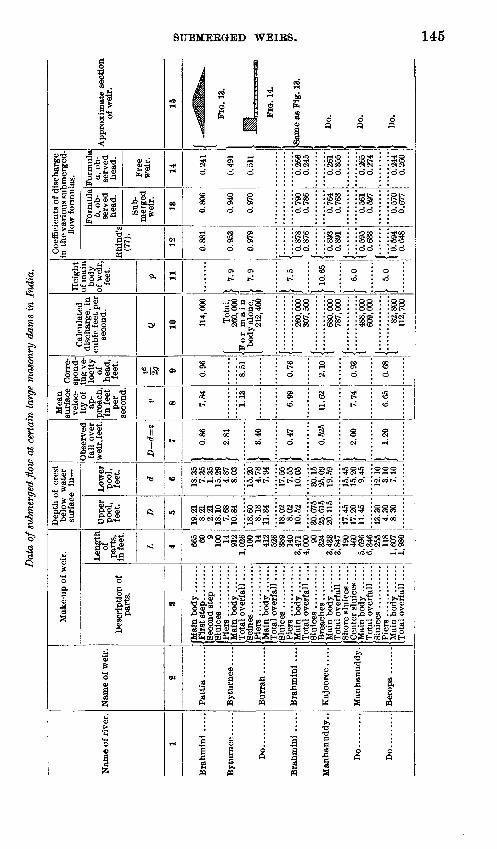
Dat
a of s
ubm
erge
d fl
ow a
t ce
rtai
n la
rge
mas
onry
dam
s in
Ind
ia.
Nam
e of
riv
er.
1
Bra
hmin
i .....
Do.........
Bra
hmin
i .....
Man
hanu
ddy.
.
Do.........
Do
.........
Nam
e of
wei
r.
2
Byt
urne
e .....
Bur
rah
....
...
Bra
hmin
i ..
..
Kaj
oore
e .....
Man
hanu
ddy.
Mak
e-up
of
wei
r.
Des
crip
tion
of
part
s.
3
Pier
s .............
Mai
n bo
dy .
....
..
Tot
al o
verf
all
....
Se
ines
...
....
....
.P
iers
Mai
n bo
dy ...
....
T
otal
ove
rfal
l ..
..
Slui
ces
...........
Tot
al o
verf
all ..
..
Tot
al o
verf
all
....
Sh
ore
slui
ces ..
...
Cen
ter
slui
ces ..
..
Tot
al o
verf
all ..
..
Pie
rs .
............
Mai
n bo
dy .
......
Tot
al o
verf
all ..
..
Len
gth
of
part
s,
in f
eet.
L 4 665 60 9
100 14
912
1,02
6 10
0 14
412
526
389
140
3,47
1 4,
000 90
32
4 3,
433
3,84
7 19
0 46
0 5,
696
6,34
6 25
5 11
8 1,
607
1,98
0
Dep
th o
f cr
est
belo
w w
ater
su
rfac
e in
Upp
er
?ool
, ee
t.
D 5
19.2
1 8.
21
2.21
18
.10
7.68
10
.84
18.6
0 8.
18
11.3
4
18.0
2 8.
02
10.5
2
30. 6
75
25. 6
15
20.1
15
17.4
5 17
.20
11.4
5
13.3
0 4.
30
8.30
Low
er
pool
, fe
et.
d 6
18.3
5 7.
35
1.35
15
.29
4.87
8.
03
15.2
0 4.
78
7.94
17.5
5 7.
65
10.0
5
30. i
s25
.09
19.5
9
15.4
5 15
.20
9.45
12.1
0 3.
10
7.10
Obs
erve
d fa
ll o
ver
wei
r, fe
et.
D-d
=z
1 0.86
2.81
i 3.
40
i 0.
47
1 0.
525
i 2.
00
i 1.
20
Mea
n su
rfac
e ve
loc
it
y of
ap
pr
oach
, in
fee
t pe
r se
cond
.
V 8 7.84
1.13
6.99
11.6
2
7.74
6.65
Cor
re
spon
d -
ing
ve
loci
ty
of
head
, fe
et.
20 9 0.96
8.51
0.76
2.10
0.93
0.68
Cal
cula
ted
disc
harg
e, i
n cu
bic
feet
per
se
cond
.
Q 10 114,
000
1 Tot
al,
260,
000
For
main
bo
dy a
lone
, 21
2,40
0
260,
000
307,
500
1" "
""68
0,' 6
66'
787,
000
1"" "
488,
' 666
"
609,
000
112*
, 700
Hei
ght
of m
ain
body
of
wei
r,
feet
.
P 11 7.9
7.9
Il0.6
5
I 6.
0
I 5.
0
Coe
ffic
ient
s of
dis
char
ge
in t
he
vari
ous
subm
erge
d-
flow
for
mul
as.
Rhin
d's
(77)
.
12 0.88
1
0.95
3
0.97
9
0.87
8 0.
876
|"6."
893"
0.89
1
o!63
3J.......
1 6.
594
0.64
8
For
mul
a b,
ob
se
rved
he
ad.
Sub
m
erge
d w
eir.
13 0.80
6
0.94
0
0.97
0
0.79
0 0.
786
""6.
" 764
"
0.76
3
'" 0.
561
0.59
7
0.57
0 0.
677
For
mul
a a,
ob
se
rved
he
ad.
Fre
e w
eir.
14 0.24
1
0.49
1
0.51
1
0.26
6 0.
245
Oi3
55
""6.
" 265
"
0.27
4
0.24
4 0.
260
App
roxi
mat
e se
ctio
n of
wei
r.
15
f
PIG
. 13.
FIG
. 14
.
Sam
e as
Fig
. 13
.
Do.
Do.
Do.
en
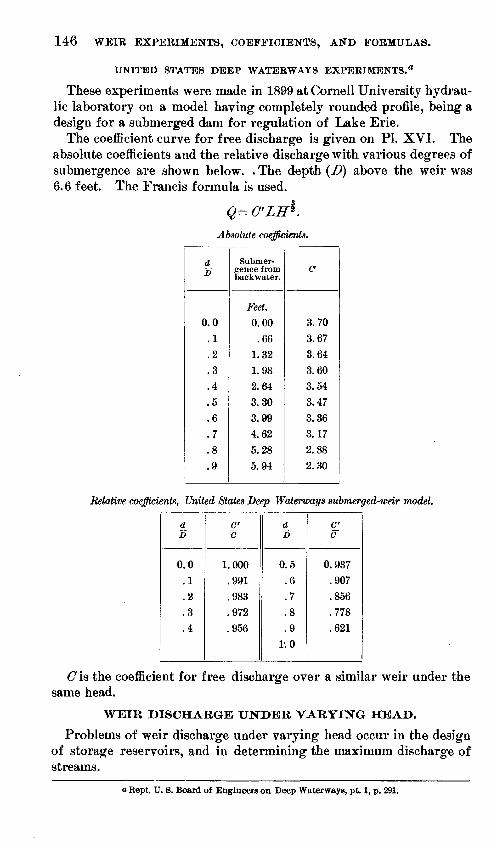
146 WEIR EXPERIMENTS, COEFFICIENTS, AND FORMULAS.
UNITED STATES DEEP WATERWAYS EXPERIMENTS. a
These experiments were made in 1899 at Cornell University hydrau lic laboratory on a model having completely rounded profile, being a design for a submerged dam for regulation of Lake Erie.
The coefficient curve for free discharge is given on PI. XVI. The absolute coefficients and the relative discharge with various degrees of submergence are shown below. , The depth (D) above the weir was 6.6 feet. The Francis formula is used.
Absolute coefficients.
d D
0.0
.1
.2
.3
.4
.5
.6
.7
.8
.9
Submer gence from backwater.
Feet.0.00
.66
1.32
1.98
2.64
3.30
3.994.62
5.28
5.94
<7
3.70
3.67
3.64
3.60
3.54
3.47
3.36
3.17
2.88
2.30
Relative, coefficients, United Stales Deep Waterways submerged-weir model.
d D
0.0
.1
.2
.3
.4
C" C
1.000.991
.983
.972
.956
d D
0.5
.6
.7
.8
.9
1:0
C' C
0.937
.907
.856
.778
.621
C is the coefficient for free discharge over a similar weir under the same head.
WEIR DISCHARGE UNDER VARYING HEAD.
Problems of weir discharge under varying head occur in the design of storage reservoirs, and in determining the maximum discharge of streams.
a Kept. U. 8. Board of Engineers on Deep Waterways, pt. 1, p. 291.
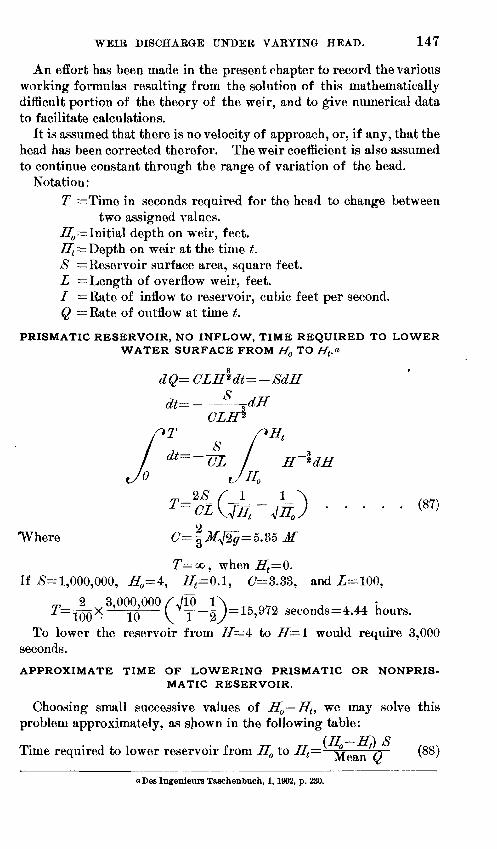
WEIR DISCHARGE UNDER VARYING HEAD. 147
An effort has been made in the present chapter to record the various working formulas resulting from the solution of this mathematically diflBcult portion of the theory of the weir, and to give numerical data to facilitate calculations.
It is assumed that there is no velocity of approach, or, if any, that the head has been corrected therefor. The weir coefficient is also assumed to continue constant through the range of variation of the head.
Notation:T =Time in seconds required for the head to change between
two assigned values. H0 ~ Initial depth on weir, feet. IIt Depth on weir at the time t. S Reservoir surface area, square feet. L = Length of overflow weir, feet. / =Rate of inflow to reservoir, cubic feet per second. Q Rate of outflow at time t.
PRISMATIC RESERVOIR, NO INFLOW, TIME REQUIRED TO LOWER WATER SURFACE FROM H0 TO fft.a
H~*dH
Where
If £=1,000,000, H0-^ Jft =Q.l, (7=3.33, and Z=100,
2 3,000,000 ( J10 1A , K A/yft , , , -,100^ 10 V T~~2/ ' seconds=4.44 hours.
To lower the reservoir from H =4 to Jf=l would require 3,000 seconds.
APPROXIMATE TIME OF LOWERING PRISMATIC OR NONPRIS-MATIC RESERVOIR.
Choosing small successive values of ff0 fft , we may solve this problem approximately, as shown in the following table:
/ TjT __ Tf\ O
Time required to lower reservoir from HQ to Ht Meat//o
a Des Ingenieurs Taschenbuch, 1, 1902, p. 2SO.
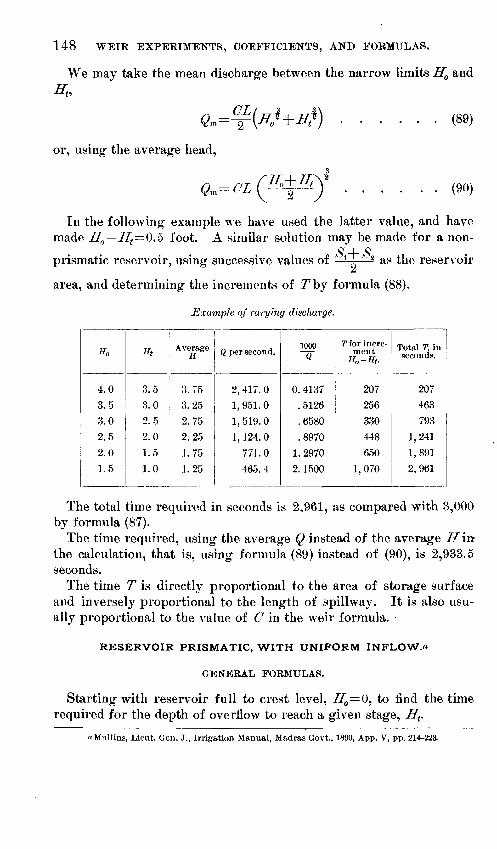
148 WEIR EXPERIMENTS, COEFFICIENTS, AND FORMULAS.
We may take the mean discharge between the narrow limits H0 and
CL(89)
or, using- the average head,
"V 'J (90)
In the following example we have used the latter value, and have made II0 7/^=0.5 foot. A similar solution may be made for a non-
O I aprismatic reservoir, using successive values of ^~ - as the reservoir
area, and determining the increments of Tby formula (88).
Example of varying discharge.
Ho
4.0
3.5
3.0
2.5
2.0
1.5
Ht
3.5
3.0
2.5
2.0
1.5
1.0
Average H
3.75
3.25
2.75
2.25
1.75
1.25
Q per second.
2,417.0
1,951.0
1,519.0
1,124.0
771.0
465.4
1000 Q
0. 4137
. 5126
.6580
.8970
1. 2970
2. 1500
T for incre ment
H0 -Ht .
207
256
330
448
650
1,070
Total T, in seconds.
207
463
793
1,241
1,891
2,961
The total time required in seconds is 2,961, us compared with 3,000 by formula (87).
The time required, using the average Q instead of the average If in the calculation, that is, using formula (89) instead of (90), is 2,933.5 seconds.
The time T is directly proportional to the area of storage surface and inversely proportional to the length of spillway. It is also usu ally proportional to the value of C in the weir formula.
RESERVOIR PRISMATIC, WITH UNIFORM INFLOW.«
GENERAL FORMULAS.
Starting with reservoir full to crest level, H0 ^^ to find the time required for the depth of overflow to reach a given stage, Ht .
aMullins, Lieut. Gen. J., Irrigation Manual, Madras Govt., 1890, App. V, pp. 214-223.
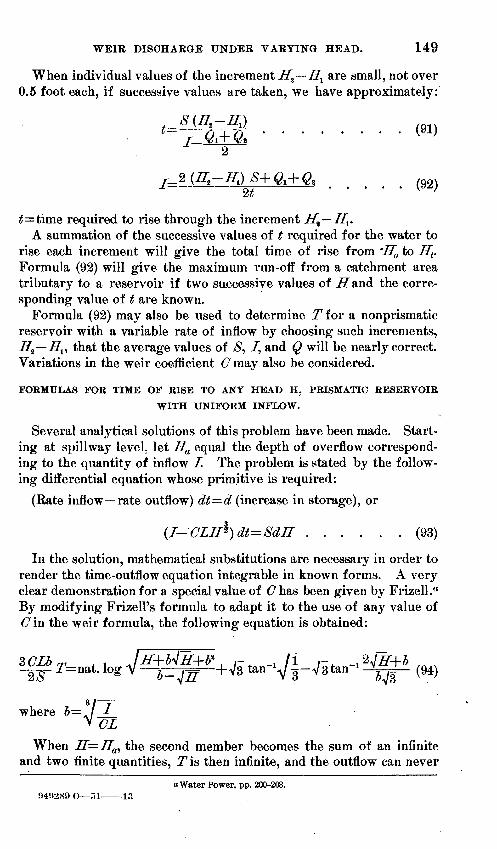
WEIR DISCHARGE UNDER VARYING HEAD. 149
When individual values of the increment HZ H^ are small, not over 0.5 foot each, if successive values are taken, we have approximately:
(92)
required to rise through the increment H^ H^.A summation of the successive values of t required for the water to
rise each increment will give the total time of rise from ~H0 to Ht. Formula (92) will give the maximum run-off from a catchment area tributary to a reservoir if two successive values of .ZTand the corre sponding value of t are known.
Formula (92) may also be used to determine T for a nonprismatic reservoir with a variable rate of inflow by choosing such increments, HZ H^ that the average values of /$, /, and Q will be nearly correct. Variations in the weir coefficient C may also be considered.
FORMULAS FOR TIME OF RISE TO ANY HEAD H, PRISMATIC RESERVOIR
WITH UNIFORM INFLOW.
Several analytical solutions of this problem have been made. Start ing at spillway level, let Ha equal the depth of overflow correspond ing to the quantity of inflow / The problem is stated by the follow ing differential equation whose primitive is required:
(Rate inflow rate outflow) dt d (increase in storage), or
(I-CLH*)dt=Sdff ...... (93)
In the solution, mathematical substitutions are necessary in order to render the time-outflow equation integrable in known forms. A very clear demonstration for a special value of C has been given by Frizell." By modifying Frizell's formula to adapt it to the use of any value of C in the weir formula, the following equation is obtained:
where b=
When H=Ha, the second member becomes the sum of an infinite and two finite quantities, T is then infinite, and the outflow can never
a Water Power, pp. 200-203. n4!)2S9 () 51 IS
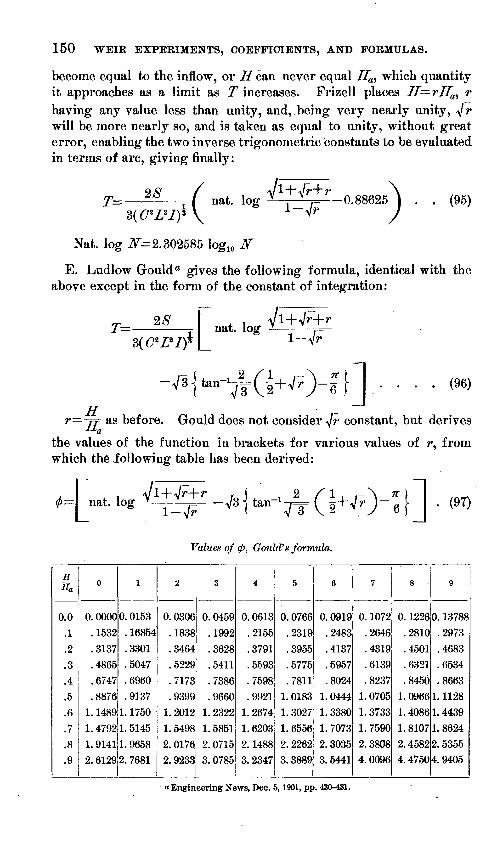
150 WEIR EXPERIMENTS, COEFFICIENTS, AND FORMULAS.
become equal to the inflow, or //can never equal Ha, which quantity it approaches as a limit as T increases. Frizell places H=rHa, r having any value less than unity, and, .being very nearly unity, ^r will be more nearly so, and is taken as equal to unity, without great error, enabling the two inverse trigonometric constants to be evaluated in terms of arc, giving finally:
T 3(0*2,*!)1
nat. log -. p^'-0.88625 ) . . (95)i-V?' /
Nat. log ^=2.302585 Iog10 N
E. Ludlow Gould a gives the following formula, identical with the above except in the form of the constant of integration:
v, * T -JT as before. «-*yi
(96)
Gould does not consider ^r constant, but derives
the values of the function in brackets for various values of r, from which the following table has been derived:
1=1 nat. log (97)
Values of (f), Gould's formula.
H Ha
0.0
.1
.2
.3
.4
.5
.6
.7
.8
.9
0
0.0000.1532.3137.4865.6747.8876
1. 14891. 47921. 91412.6129
l
0. 0153. 16854.3301.5047.6960.9137
1. 17501. 51451.96582. 7681
2
0.0306.1838.3464.5229.7173.9399
1. 20121.54982. 01762. 9233
3
0.0459.1992.3628.5411.7386.9660
1. 23221.58512. 07153.0785
4
0. 0613.2155.3791.5593.7598.9921
1. 26741.62032. 14883. 2347
5
0. 0766.2319.3955.5775.7811
1.01831. 30271. 65562. 22623. 3889
6
0.0919.2483.4137.5957.8024
1.04441.33801. 70732. 30353.5441
7
0. 1072.2646.4319.6139.8237
1. 07051. 37331. 75902.38084.0096
8
0. 1526.2810.4501.6321.84501.09661.40861. 81072. 45824. 4750
9
0. 13788.2973.4683.6534.8663
1. 11281.44391. 86242. 53554.9405
a Engineering News, Dec. 5,1901, pp. 430-431.
U.
8.
GE
OL
OG
ICA
L
SU
RV
EY
WA
TE
R-S
UP
PL
Y
PA
PE
R
NO
. 200
PL
. X
XX
VIII
Coe
ffi
cien
t C.
(H\
\ffj > /f(
'
/
/
/?
// ~
t
/4
//
,H\
\Ha)
/
$
/s/
<u\x f
^^
0- H Ha .1 .2
.3
.4
.5
.6
.7
.8
.9
^
x*-
x--
*G.-
---
-=0-
<J|
" 1
C*x
6
1 (s
in a
:)* s
ec w
da;
w=
sin-
1 ( -
gL )
* Jo
V-
HO/
©'
0. 1
777
.299
.4
053
.594
.6
817
.766
3 .8
459
.924
0
x
Arc
.
0. 1
786
.303
7 .4
174
.750
.8
71
1.00
8 1.
178
1
NO
T
Ang
le.
0
1 II
10 1
4 00
17
240
0 23
250
0
42 5
8 30
49
56
00
57 4
6 00
67
31
00
F,
(sin
a:)*
0.56
2 .6
69
.740
.880
.9
14
.946
.9
74
sec
x
1.01
57
1.04
80
1.09
4
1.36
7 1.
553
1.87
4 2.
613
. : a
-0 =
-
/(w
) = (s
in «
)* s
ec x
.
/(*)
0.57
08
.701
.8
095
1.20
3 1.
423
1.77
2 2.
545
H Ua
0.02
.0
5 .1
1 .1
9 .2
9 .3
7 .4
6 .5
5 .6
4 .7
2 .7
9 .8
5 .8
1
a; ar
c.
0.05
.1
0 .2
.3
.4
.5
.6
.7
.8
.9
1.
0 1.
1 1.
2
m.
0.00
8 .0
20
.053
.0
65
.075
.0
85
.095
.1
06
.121
.1
40
.164
.1
%
.240
2 xf
(x)
0.00
8 .0
28
.081
.1
46
.221
.3
06
.401
.5
07
.628
.7
68
.932
1.
028
1.36
8
in i
"
" T
Val
ues
plot
ted
on l
ogar
ithm
ic c
ross
-sec
tion
pape
r.
' _
I i
I I
I i
r i
i.9
1.
0 1.
1 C
orre
cted
hea
d H
In
feet
.
DIA
GR
AM
O
F
VA
RIA
BLE
D
ISC
HA
RG
E.
WEIE DI8CHABGE UNDEE VABYING HEAD. 151
We may write formula (9)
R. S. Woodward suggests the formula °
where
. . . (99)
This, like the preceding expressions, becomes infinity when the* 57*
integral is carried over the entire range X=0 to X -^, conforming
with the physical conditions.
The writer has evaluated this function for finite values of -^
by mechanical quadrature, as shown in the diagram, PI. XXXVIII. The diagram illustrates the rapid rise until a head closely approaching Ha is attained, occupying a comparatively short time interval, while for further increments of head the time interval is relatively very great.
E. Sherman G6uld * gives the same integral developed as an infinite series
where
( H\ rliT0 K1 K* Kn "1 TTa) = L"^"+"5 +T + " ' " +2+3; J
a Engineering News, December 5, 1901, p. 431.6 Engineering News, November 14, 1901, pp. 362-363.
152 WEIR EXPERIMENTS, COEFFICIENTS, AND FORMULAS.
If we write
-^"(t)( V"\
JT )/H\ ' (102)
Woodward's formula may be written T lFty ( -jr )\-tlay
E. Sherman Gould's formula may be written T=jFx ^ ( 77 )
The formulas are therefore identical, the transcendental facto" bearing the relation,
The E. L. Gould, Woodward, and E. S. Gould formulas are appli
cable for any value of the ratio -ff. That of Frizell can be strictly-"a
TT
applied only when -77 is nearly unity. In the E. S. Gould formula^a
( P7"\ ~jr ) converges very slowly as the argument approaches unity.
For rough calculations E. S. Gould gives the rule
where /* is the coefficient in the weir formula for reducing final head to mean head.
T= ....... (103)
The ratio p of the constant mean head which would give the tots. discharge Sffin the time The finds by trial.
E. S. Gould gives the values
>w=0.67 for small values of H to >w=0.75 for large values of H.
Comparing the formulas, Let #=1,000,000 square feet
tf=3.33=i9 o
Z=1007=10,000 cubic feet per second
feet.
WEIR DISCHARGE UNDER VARYING HEAD. 153
Required the time to rise to a height JSa=0.9j5T=8.6895 feet.
=643.5
Frizell (95) 7=1677.6 seconds. E. L. Gould (96) 7=1681.5 seconds. Woodward (99) 7=1660.2 seconds. E. S. Gould (approximate) (103) 7=1488.3 seconds.
The difference in the value of T by the first three formulas repre sents the difference in the values of the transcendental portions of the equations as evaluated by different methods.
The time required to rise from Ha to Hb will be the difference of the times 7i and Tz by the above formulas.
NONPRISMATIC RESERVOIR, UNIFORM INFLOW.
P. P. L. O'CONNELL. a
Representing the reservoir by a cone having its apex at distance A, below plane of the overflow,
Area at overflow level = S9 = 7c(aA)z Area at any other level =S=7t\a(A-\-H)~\ z
(104)
where a is the slope of the sides, or where there is a foot horizontal run to 1 foot vertical rise. From (104) with S0 and a given, A may be determined.
Where the factor
7=TfOf 1
CL-H*-I* nat.
. log *
,H . . (105)
a Mullins's Irrigation Manual.
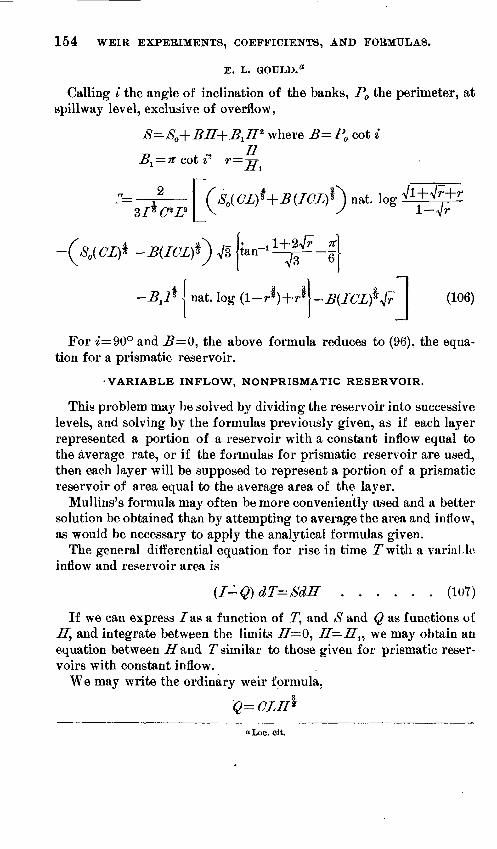
154 WEIR EXPERIMENTS, COEFFICIENTS, AND FORMULAS.
E. L. GOULD."
Calling I the angle of inclination of the banks, P0 the perimeter, at spillway level, exclusive of overflow,
where B= P cot *
(106)
For 2=90° and JB=0, the above formula reduces to (96), the equa tion for a prismatic reservoir.
VARIABLE INFLOW, NONPRISMATIC RESERVOIR.
This problem may be solved by dividing the reservoir into successive levels, and solving by the formulas previously given, as if each layer represented a portion of a reservoir with a constant inflow equal to the average rate, or if the formulas for prismatic reservoir are used, then each layer will be supposed to represent a portion of a prismatic reservoir of area equal to the average area of the lajr er.
Mullius's formula m&y often be more conveniently used and a better solution be obtained than by attempting to average the area and inflow, as would be necessary to apply the analytical formulas given.
The general differential equation for rise in time jTwith a variuUe inflow and reservoir area is
(I-Q)dT=SdH ...... (107)
If we can express /as a function of T7, and S and Q as functions of H, and integrate between the limits ff=0, H H^ we may obtain an equation between ff&nd T similar to those given for prismatic reser voirs with constant inflow.
We may write the ordinary weir formula,
Q= CLH*
a Loc. cit.
WEIR DISCHARGE UNDER VARYING HEAD. 155
The area S can usually be readily expressed in terms of the area at crest level and slope of the reservoir sides (assumed constant within the narrow limits 0, If)-, the inflow /often increases nearly as a linear function of T while a stream is rising rapidly; we have, then,
Qt=CLH*
St J<
Substituting in (107)
(l0+fT-CLff^dT=(S0+2<*jS0ff+cx*Jl^dH . (108)
The complete primitive of this differential equation can be deter mined only as an infinite series."
Rivers during flood usually rise rapidly and fall slowly. The time- inflow function can sometimes be approximated by a modified sinusoid.
.... (109) where w=or>l
T Total duration of flood. ^=Maximum rate of inflow.7^=Time elapsed from beginning of rise to maximum.
The constants are so chosen that the arc value of the duration of the flood from stage I0 through to the same stage is TC, or,
I jfH
(bt)n=7f l = j, ...... (110)
For the maximum we will have, differentiating (109),
= . . . (Ill)
(112)
common logarithms being used. If T=1000 and if 7^=200, then w=3.322 log 5=2.322,
^8.828 -I
' and =
"Seddon, James A., C. E. (Proc. Am. Soc. C. E., vol. 24, June, 1S98, pp. 559-598), has solved equation (108) for the Great Lakes reservoir system, assuming an annual cycle following the law I***Im+A sin T, Im being the mean inflow and T"the time arc on a circle whose circumference represents one year. He also assumes Q= Q^+bH, or a linear function of the height H.
156 WEIR EXPERIMENTS, COEFFICIENTS, AND FORMULAS.
Example of variable flood disdiarge computed by formula (109).
t, in sec onds.
100200300400500600700800900
(«)
1.432.864.295.727.158.5810.0111.4412.87
log (bt)
0. 155336.456366.632457. 757396.854306. 933487
1. 0004341. 0584261. 109578
i log(6t)"
0. 06695. 196694. 27259.32644. 36820.40233. 43100. 45618. 47790
i (W)n
1. 16671.5731. 87322.12062.33462. 52542. 69782. 85883. 0054
Angle.
0 /
66 5590 00
107 21121 08133 49144 42155 00163 52172 12
isin (bt)n
0. 91991.0000.9938.8560.7216.5779.3907.2779.1320
The form of the graph of the flood may be determined by plotting the quantities in the last column of this table in terms of t. The resulting curve rises rapidly to a maximum when £=200, after whichit descends slowly.*
TABLES FOR CALCULATIONS OF WEIR DISCHARGE.
The investigations at Cornell University have greatly extended the limit for which weir coefficients are definitely known. The experi ments of Bazin did not reach beyond 1.8 feet head maximum. The tables of Francis for thin-edged weirs extended to a head of 3 feet.
The experiments at Cornell have furnished the coefficients for a variety of weir forms for heads up to 4, 5, and 6 feet. At such heads the nappe form has become stable for nearly all forms of weirs. We may now predict the probable extension of the coefficient curves for higher heads with more confidence than could be done by starting from a lower datum.
Owing to their usefulness in the approximate determination of flood discharges, the weir tables have been carried up to a head of 10 feet.
In the tables here given the head is uniformly expressed in feet. For computing the flow over irrigation modules and other small weirs where the head is measured in inches, weir tables expressed with the inch as the argument of head are convenient. Numerous tables of this character are available. The following may be referred to:
The Emerson weir tables, computed by Charla A. Adams, pages 251-285 of Emer son's Hydrodynamics, published by J. and W. Jolly, Holyoke, Mass. These give discharge in cubic feet per minute for weirs with two end contractions having lengths of 2, 3, 4,5, 6, 7, 8,10,12,16, and 20 feet. The discharge is computed by the Francis formula for heads from 0.001 foot to 2 feet, advancing by thousandths of a foot, with auxiliary table of decimal equivalents of fractional parts of inches.
TABLES FOR CALCULATING WEIR DISCHARGE. 157
The Measurement and Division of Water, Bulletin No. 27, Agricultural Experi ment Station, Fort Collins, Colo. This publication gives tables of discharge in cubic feet per second, computed by the Francis formula, for a weir 1 foot long, for heads in inches and sixteenths, from T inch to 30 inches, with auxiliary table for end contractions, and for velocity of approach correction by the Fteley and Stearns rule ( H=D-\-%h). A similar weir table for a weir 1 inch long is given. Also a table of discharge for Cippoletti weirs (C=3.36f), for lengths of crest sill of 1, 1.5, 2, 3, 4, 5, and 10 feet. Head in inches and decimals with feet equivalents.
Special Instructions to Watermasters as to Measurements of Water, State Engineer's Office, Salt Lake City, Utah, 1896. Table of discharge, in cubic feet per second, for 1-foot crest, based on the Francis formula, with auxiliary table for end contractions and velocity of approach. The head is expressed in inches and thirty-seconds (with equivalents in feet) for ^ inch to 36 inches. A similar table for heads in inches and sixteenths, from T to 36 inches, gives the discharge in cubic feet per second by the Francis formula for weirs with two end contractions and for the crest lengths of 1, 1£, 2, 2£, 3, 4, 5, 6, 7, 8, 9, 10, 11, and 12 feet. A table for trapezoidal weirs (C=3.367) of various crest lengths is also given.
California Hydrography, by J. B. Lippincott, Water-Supply Paper No. 81, United States Geological Survey. This publication contains a table of weir discharge in cubic feet per second for heads, advancing by sixteenths, from ^ inch to 10 inches (with equivalent decimals of a foot), for weirs with two end contractions having crest lengths as follows: 4, 6, 9, 12, 15, and 18 inches, 2, 2.5, 3, 3.5, 4, 4.5, 5, 6, 7, 8, 9, 10, 12, 14, 16, 18, and 20 feet. Based on the Francis formula. Also published as a circular.
The tables that follow are all original computations, with exception of tables 9-18, which were computed by E. C. Murphy, the "Francis weir tables," page 162, and the table of head due to various velocities, page 158.
TABLE i. HEAD DUE TO VARIOUS VELOCITIES.**
This table gives values of the expression
based on the constanfof gravity for the latitude and altitude of Lowell,Mass.,
^=32.1618 1=0.01554:639. ty
a Francis, Lowell Hydraulic Experiments, extended.
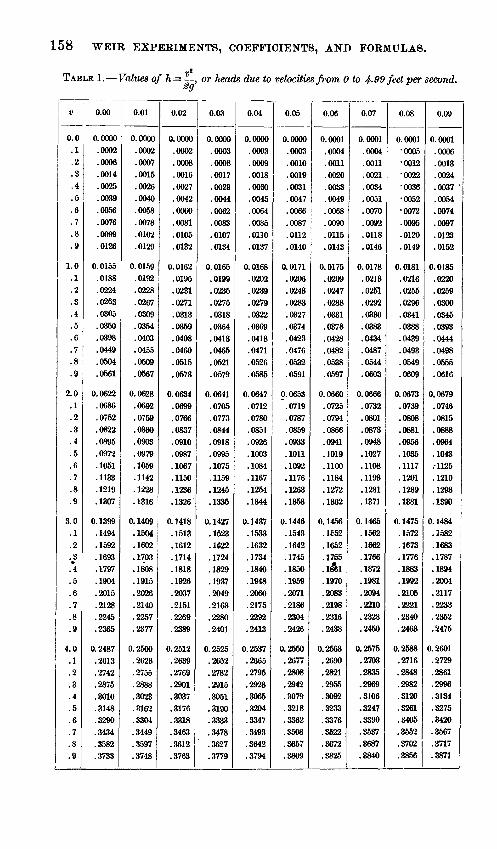
158 WEIR EXPERIMENTS, COEFFICIENTS, AND FORMULAS.
TABLE 1. Values of h= |-, or heads due to velocities from 0 to 4-99 feet per second.
V
0.0.1.2.3.4.5.6.7.8.9
1.0.1.2.3.4.5.6.7.8.9
2.0.1.2.3.4.5.6.7.8.9
3.0.1.2.3*
.4
.5
.6
.7
.8
.9
4.0.1.2.3.4.5.6.7.8.9
0.00
0.0000.0002.0006.0014.0025.0039.0056.0076.0099.0126
0.0155.0188.0224.0263.0305.0350.0398.0449.0504.0561
0.0622.0686.0752.0822.0895.0972.1051.1133.1219.1307
0.1399.1494.1592.1693.1797.1904.2015.2128.2245.2365
0.2487.2613.2742.2875.3010.3148.3290.3434.3582.3733
0.01
0.0000.0002.0007.0015.0026.0040.0058.0078.0102.0129
0.0159.0192.0228.0267.0309.0354.0403.0455.0509.0567
0.0628.0692.0759.0830.0903.0979.1059.1142.1228.1316
0.1409.1504.1602.1703.1808.1915.2026.2140.2257.2377
0.2500.2626.2755.2888.3023.3162.3304.3449.3597.3748
0.02
0.0000.0002.0008.0016.0027.0042.0060.0081.0105.0132
0.0162.0195.0231.0271.0313.0359.0408.0460.0515.0573
0.0634.0699.0766.0837.0910.0987.1067.1150.1236.1326
0. 1418.1513.1612.1714.1818.1926.2037.2151.2269.2389
0. 2512.2639.2769.2901.3037.3176.3318.3463.3612.3763
0.03
0.0000.0003.0008.0017.0029.0044.0062.0083.0107.0134
0.0165.0199.0235.0275.0318.0364.0413.0465:0521.0579
0.0641.0705.0773.0844.0918.0995.1075.1159.1245.1335
0.1427.1523.1622.1724.1829.1937.2049.2163.2280.2401
0.2525.2652.2782.2915.3051.3190.3333.3478.3627.3779
0.04
0.0000.0003.0009.0018.0030.0045.0064.0085.0110.0137
0.0168.0202.0239.0279.0322.0369.0418.0471.0526.0585
0.0647.0712.0780.0851.0926.1003.1084.1167.1254.1344
0. 1437.1533.1632.1734.1840.1948.2060.2175.2292.2413
0.2637.2665.2795.2928.3065.3204.3347.3493.3642.3794
0.05
0.0000.0003.0010.0019.0031.0047.0066.0087.0112.0140
0. 0171.0206.0243.0283.0327.0374.0423.0476.0532.0591
0.0653".0719.0787.0859.0933.1011.1092.1176.1263.1363
0.1446.1543.1642.1745.1850.1959.2071.2186.2304.2426
0.2550.2677.2808.2942.3079.3218.3362.3508.3657.3809
0.06
0.0001.0004.0011.0020.0033.0049.0068.0090.0115.0143
0. 0175.0209.0247.0288.0331.0378.0428.0482.0538.0597
0.0660.0725.0794.0866.0941.1019.1100.1184.1272.1362
0.1456.1E52.1662.1765.l&l.1970.2083.2198.2316.2438
0.2563.2690.2821.2955.3092.3233.3376.3622.3672.3825
0.07
0.0001.0004.0011.0021.0034.0051.0070.0092.0118.0146
0.0178.0213.0251.0292.0336.0383.0434.0487.0544.0603
0.0666.0732.0801.0873.0948.1027.1108.1193.1281.1371
0.1466.1562.1662.1766.1872.1981.2094.2210.2328.2450
0.2576.2703.2836.2969.3106.3247.3390.3637.3687.3840
0.08
0.0001 0005 0012 0022 0036 0052 0072.0095.0120.0149
0. 0181.0216.0265.0296.0341.0388.0439.0493.0549.0609
0.0673.0739.0808.0881.0956.1035.1117.1201.1289.1381
0.1475.1572.1673.1776.1883.1992.2105.2221.2340.2463
0.2588.2716.2848.2982.3120.3261.3405.3562.3702.3856
0.09
0.0001.0006.0013.0024.0037 '.0054.0074.0097.0123.0152
0.0185.0220.0269.0300.0346.0393.0444.0498.0555.0616
0,0679.0746.0815.0888.0964.1043-1126.1210.1298.1390
0.1484.1582.1683.1787.1894.2004.2117.2233.2352.2475
0.2601.2729.2861.29%.3134.3275.3420.3567.3717.3871
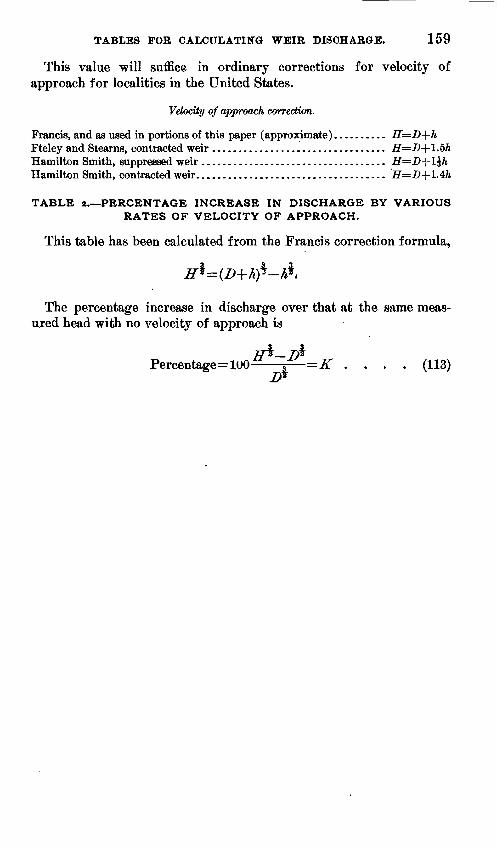
TABLES FOB CALCULATING WEIR DISCHARGE. 159
This value will suffice in ordinary corrections for velocity of approach for localities in the United States.
Velocity of approach correction.
Francis, and as used in portions of this paper (approximate) . ......... H=D+hFteley and Stearns, contracted weir ................................. H=D-\-\.5hHamilton Smith, suppressed weir ...................................Hamilton Smith, contracted weir. ...................................
TABLE a. PERCENTAGE INCREASE IN DISCHARGE BY VARIOUS RATES OF VELOCITY OF APPROACH.
This table has been calculated from the Francis correction formula,
The percentage increase in discharge over that at the same meas ured head with no velocity of approach is
Percentage=luO r~=K .... (113)
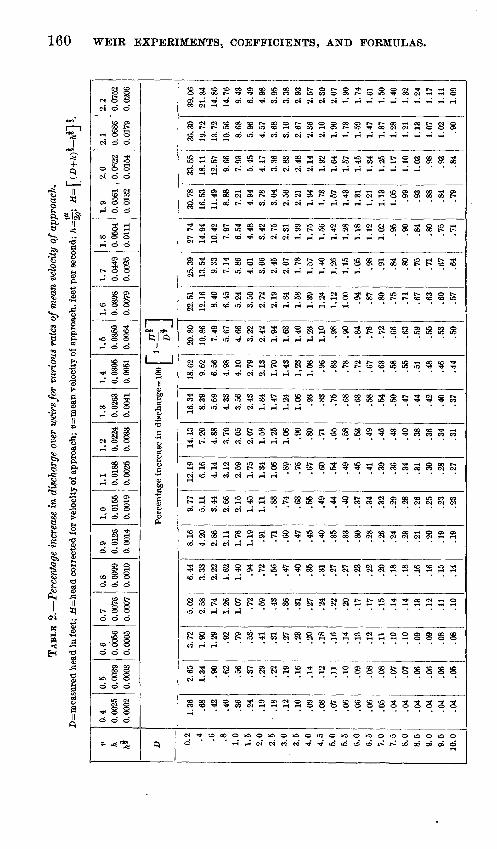
TAB
LE 2
. P
erce
ntag
e in
crea
se i
n di
scha
rge
over
wei
rs fo
r va
riou
s ra
tes
of m
ean
velo
city
of a
ppro
ach.
Z>=m
easu
red
head
in fe
et;
/f=
head
cor
rect
ed fo
r vel
ocity
of a
ppro
ach;
v=m
ean
velo
city
of a
ppro
ach,
fee
t per
sec
ond;
h ^
-; H
= ^
(D+
hfi
$~\'
.
h A* Z> 0.2 .4 .6 .8 1.0
1.5
2.0
2.5
3.0
3.5
4.0
4.5
5.0
5.5
6.0
6.5
7.0
7.5
8.0
8.5
9.0
9.5
10.0
0.4
0.00
250.
0002
0.5
0.00
390.
0003
0.6
0.00
560.
0005
0.7
0.00
760.
0007
00
i O
0. 0
099
0. 0
010
0.9
0. 0
126
0.00
14
1..0
0.
0155
0.00
190.
0188
0.00
250.
0224
0.00
330.
0263
0.00
410.
0305
0.00
51
1.5
0.03
500.
0064
CH
*~~
1- j
D*J
1.36 .68
.42
.40
.36
.24
.19
' .1
8.1
2.1
0.0
9.0
8.0
7.0
6.0
6.0
6.0
5.0
4.0
4.0
4.0
4.0
4.0
4
2.65
1.34 .90
.62
.56
.37
.29
.22
.19
.16
.14
.12
.11
.10
.09
.08
.08
.07
.07
.06
.06
.06
.05
3.72
1.90
1.29 .92
.79
.53
.41
.31
.27
.23
.20
.18
.16
.14
.13
.12
.11
.10
.10
.09
.09
.08
.08
5.02
2.58
1.74
1.26
1.07 .72
.59
.43
.36
.31
.27
.24
.22
.20
.17
.17
.15
.14
.14
.13
.12
.11
.10
6.44
3.33
2.22
1.62
1.40 .9
4.7
2.5
6.4
7.4
0.3
5.3
1.2
7.2
7.2
3.2
2.2
0.1
8.1
8.1
6.1
6.1
5.1
4
8.16
4.20
2.86
2.11
1.76
1.19 .91
.71
.60
.47
.45
.40
.35
.33
.30
.28
.26
.24
.23
.21
.20
.19
.19
9.77
5.11
3.44
2.66
2.15
1.45
1.11 .8
8.7
4.6
3.5
5.4
9.4
4.4
0.3
7.3
4.3
2.2
9.2
8.2
6.2
5.2
3.2
3
12.1
96.
164.
143.
122.
591.
751.
341.
06 .89
.76
.67
.60
.54
.49
.45
.41
.39
.36
.34
.31
.30
.28
.27
14.1
37.
204.
883.
703.
052.
071.
581.
251.
06 .90
.80
.71
.65
.58
.53
.49
.46
.43
.40
.38
.36
.34
.31
16.3
48.
395.
694.
333.
562.
431.
841.
471.
241.
06 .93
.83
.75
.68
.63
.58
.54
.50
.47
.44
.42
.40
.37
18.6
29.
626.
564.
98
20.8
010
.86
7.49
5.67
4. 1
0 4.
66
2.79
2.13
1.70
1.43
1,23
1.08 .9
6.8
3.7
8.7
2.6
7.6
3.5
8.5
5.5
1.4
8.4
6.4
4
3.22
2.42
1.94
1.63
1.40
1.23
1.10 .98
.90
.84
.76
.72
.66
.63
.59
.55
.53
.50
0.03
980,
007
90.
0449
0.00
950.
0504
0.01
110.
0561
0. 0
132
2.0
0.0^
220.
0154
2.1
0.06
860.
017
9
2.2
0. 0
752
0.02
06
22.5
112
.16
8.40
6.45
5.24
3.50
2.72
2.19
1.84
1.58
1.39
1.24
1.12
1.00 .94
.87
.80
.75
.71
.67
.63
.60
.57
25.3
913
.54
9.33
7.H
5.86
4.01
3.06
2.45
2.07
1.78
1.57
1.40
1.26
1.15
1.05 .98
.91
.84
.80
.75
.71
.67
.64
27 7
414
.94
10.4
27.
976.
544.
483.
422.
752.
311.
991.
751.
561.
421.
281.
181.
121.
02 .95
.90
.84
.80
.75
.71
30.7
816
.53
11.4
98.
887.
214.
943.
783.
042.
562.
211.
941.
731.
571.
431.
311.
211.
131.
05 .99
.93
.88
.84
.79
33.5
536
.30
18.1
1 1
19.7
212
.57
9.66
7.93
5.45
4.17
3.36
2.83
2.48
2.14
1.92
1.64
1.57
1.45
1.34
1.25
1.17
1.10
1.03 .9
8.9
3.8
4
13.7
210
.56
8.68
5.96
4.57
3.68
3.10
2.67
2.36
2.10
1.90
1.73
1.59
1.47
1.37
1.28
1.21
1.13
1.07
1.02 .90
39.0
621
.34
14.8
614
.76
9.43
6.49
4.98
3.95
3.38
2.93
2.57
2.30
2.07
1.90
1.74
1.61
1.50
1.40
1.32
1.24
1.17
1.11
1.09
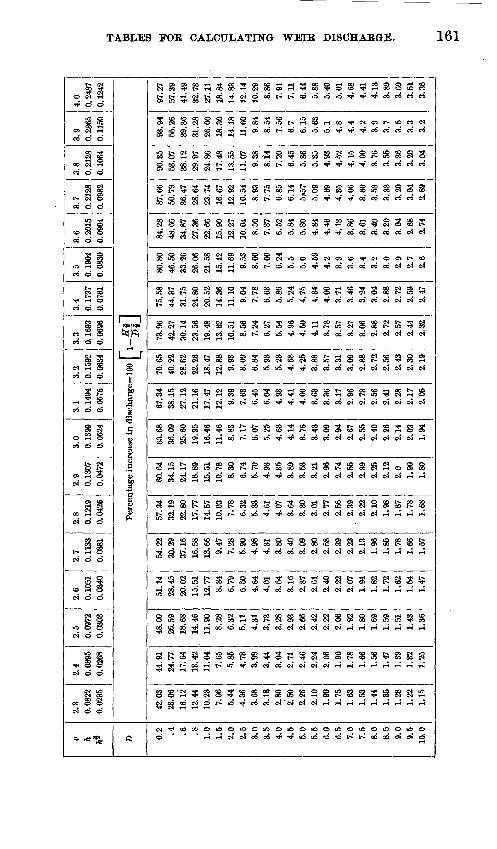
TABLES FOR CALCULATING WEIK DISCHARGE. 161
O CN iH qi o O
co o o
CNrH cpc2oc)g>5Ci>«i-HO>coi>cd>ri>ri'^''^'^i<'*c<5cocococo moo
.. . _i>V«coi>co2i3i$85P:coT^;6 ^ F3 g .._.._..,...-.,.._.,*
co o e»
co o o
CN O> CO GO IQ C4 O 1Q ' ~~
iOiHO O CO CO CO i tco o o 8 * «* S N
K S * IH O
co o c>
S Ss mh
co o o I~ L
CO O C>
^ coOT t-
^ S ^co o o
CO " fl
CoSi S «5COCN^,^
7a¥ aCN O O
CN O O ^
i^^iS Thoi>cdeocj>i>io-<i!'<iicocococNcNo3oic4 (Ndo «55co,-,^
1(5 ^g*
CO T-l O i-lGOOiOdoOCDiO^H^COCCWNCicici C<00 «=ScN^^,
ojcocOTaiTHcocdiO^cococNNCNoieNi-i oi o o
* -qJ t~: co ^H t~.' o TI< co « co cs cs oi c-iCNOCJ ^CN^rt^,
CN lOS
CO O O
oi o o
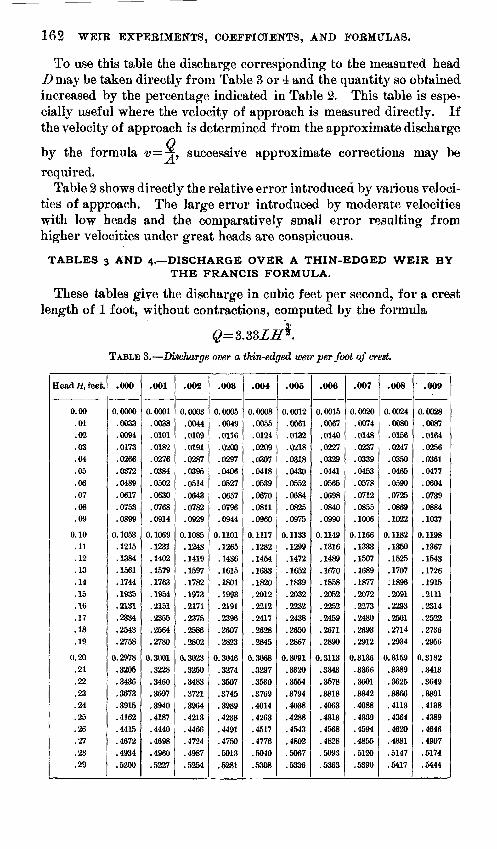
162 WEIR EXPERIMENTS, COEFFICIENTS, AND FORMULAS.
To use this table the discharge corresponding to the measured head I) may be taken directly from Table 3 or 4 and the quantity so obtained increased by the percentage indicated in Table 2. This table is espe cially useful where the velocity of approach is measured directly. If the velocity of approach is determined from the approximate discharge
by the formula ^=^» successive approximate corrections may be required.
Table 2 shows directly the relative error introduced by various veloci ties of approach. The large error introduced by moderate velocities with low heads and the comparatively small error resulting from higher velocities under great heads are conspicuous.
TABLES 3 AND 4. DISCHARGE OVER A THIN-EDGED WEIR BY THE FRANCIS FORMULA.
These tables give the discharge in cubic feet per second, for a crest length of 1 foot, without contractions, computed by the formula
TABLE 3. Discharge over a thin-edged weir per foot of crest.
Headlf, feet.
0.00.01.02.03.04.05.06.07.08.09
0.10.11.12.13.14.15.16.17.18.19
0.20.21.22.23.24.25.26.27.28.29
.000
0.0000.0033.0094.0173.0266.0372.0489.0617.0758.0899
0.1053.1215.1384.1561.1744.1935.2131.2334.2543.2758
0.2978.3205.3436.3673.3915.4162.4415.4672.4934.5200
.001
0.0001.0038.0101.0182.0276.0384.0502.0630.0768.0914
0.1069.1231.1402.1579.1763.1954.2151.2355.2564.2780
0.3001.3228.3460.3697.3940.4187.4440.4698.4960.5227
.002
0.0003.0044.0109.0191.0287.0395.0514.0643.0782.0929
0.1085.1248.1419.1597.1782.1973.2171.2375.2586.2802
0.3023.3250.3483.3721.3964.4213.4466.4724.4987.5254
.003
0.0005.0049.0116.0200.0297.0406.0527.0657.0796.0944
0. 1101.1265.1436. 1615.1801.1993.2191.2396.2607.2823
0.3046.3274.3507.3745.3989.4238.4491.4750.6013.6281
.004
0.0008.0055.0121.0209.0307.0418.0589.0670.0811.0960
0. 1117.1282.1454.1633.1820.2012.2212.2417.2628.2845
0.3068.3297.3630.3769.4014.4263.4517.4776.5040.5308
.005
0.0012.0061.0132.0218.0318.0430.0552.0684.0825.0975
0.1133.1299.1472.1652.1839.2032.2232.2438.2650.2867
0.3091.3320.3654.3794.4038.4288.4543.4802.5067.5336
.006
0.0015.0067.0140.0227.0329.0441.0566.0698.0840.0990
0. 1149.1316.1489.1670.1858.2052.2252.2459.2671.2890
0.3113.3343.3678.3818.4063.4313.4568.4828.5093.5363
.007
0.0020.0074.0148.0237.0339.0453.0578.0712.0855.1006
0.1166.1333.1507.1689.1877.2072.2273.2480.2693.2912
0.3136.3366.3601.3842.4088.4339.4594.4865.5120.5890
.008
0.0024.0080.0156.0247.0350.0465.0590.0725.0869.1022
0. 1182.1350.1525.1707.1896.2091.2293.2501.2714.2934
0.3159.3389.3625.3866.4113.4364.4620.4881.5147.5417
.009
0.0028.0087.0164.0256.0361.0477.0604.0739.0884.1037
0. 1198.1367.1543.1726.1915.2111.2314.2522.2736.2956
0.3182.3413.3649.3891.4138.4389.4646.4907.5174.5444
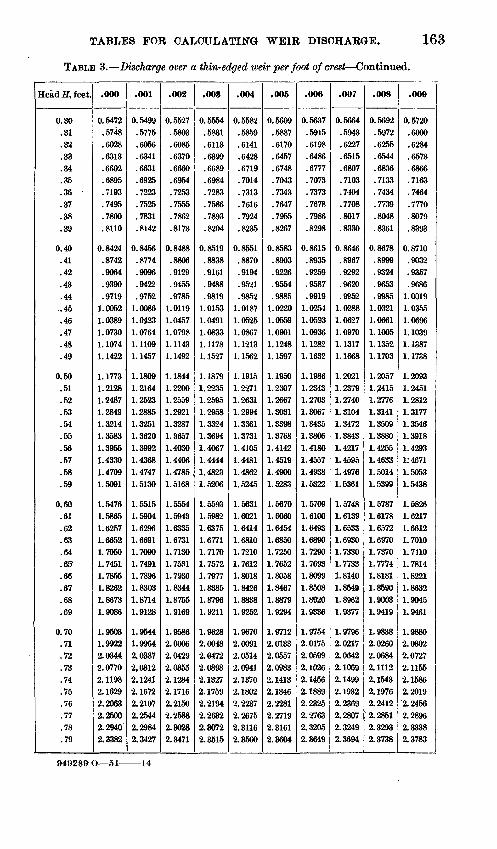
TABLES FOE CALCULATING WEIR DISCHARGE. 163
TABLE 3. Discharge over a thin-edged weir per foot of crest Continued.
Head H, feet.
0.30.31.32.33.34.85.36 .37.38.39
0.40.41.42.43.44..45.46.47.48.49
0.50.51.52.53.54.55.56.57.58.59
0.60.61.62.63.64.65.66.67.68.69
0.70.71.72.73.74.75.76.77.78.79
.000
0.5472.5748.6028.6313.6602.6895.7193.7495.7800.8110
0.8424.8742.9064.9390.97191.00521.0389J.07301.10741.1422
1.17731.21281.24871.28491.32141.35831.39551.43301.47091.5091
1.54761.58651.62571.66521.70501.74511.78551.82621.86731.9086
1.95031.99222.03442.07702.11982.16292.20632.25002.29402.3382
.001
0.5499.5775.6056.6341.6631.6925.7223.7525.7831.8142
0.8456.8774.90%.9422.9752
1.00861.04231.07641.11091.1457
1.18091.21641.25231.28851.32511. 36201.39921.43681. 47471.5130
1.55151.59041.62961.66911.70901. 74911.78%1.83031.87141.9128
1.95441.99642.03872,08122.12412.16722.21072.25442.29842.3427
.002
0.5527.6803.6085.6370.6660.6954.7253.7555.7862.8173
0.8488.8806.9129.9455.9785
1.01191.04571.07981.11431.1492
1.18441.22001.25591.29211.32871.36571.40301.44061.47851.5168
1.55541.59431.63351.67311.71301.75311.79361.83441.87551. 9169
1.95862.00062.04292.08552.12842. 17162.21502.25882.30282.3471
.003
0.5554.5831.6113.6399.6689.6984.7283.7586.7893.8204
0.8519.8838.9161.9488.9819
1.01531.04911.08331. 11781. 1527
1. 18791.22351.25951.29581.33241.36941.40671.44441.48231.5206
1.55931.59821.63751.67711.71701.75721.79771.83851.87%1.9211
1.96282.00182.04722.08982.13272. 17592.21942.26322.30722.3616
.004
0.5582.5859.6141.6428.6719.7014.7313.7616.7924.8235
0.8551.8870.9194.9521.9852
1.01871.05251.08671.12131.1562
1. 19151.22711.26311.29941.33611.37311.41051.44811.48621.5245
1.56311.60211.64141.68101. 72101. 76121.80181.84261.88381.9252
1.96702.00912.05142.09412.13702.18022.22372.26752.31162.3560
.005
0.5609.5887.6170.6457.6748.7043.7343.7647.7955.8267
0.8583.8903.9226.9554.9885
1.02201.05591.09011.12481.1597
1.19501.23071.26671.30311.33981.37681.41421.45191.49001.5283
1.66701.60601.64541.68501.72501.76521.80581.84671.88791.9294
1.97122.01332.05572.09832.14132.18462.22812.27192.31612.3604
.006
0.6637.5915.6198.6486.6777.7073.7373.7678.7986.8298
0.8615.8935.9259.9587.9919
1.02541.05931.09361.12821.1632
1.19861.23431.27031.30671.34351.38061.41801.45571.49381.5322
1.57091.61001.64931.68901.72901. 76931.80991.85081.89201.9336
1.97542.01752.05992.10262.14662.18892.23252.27632.32052.3649
.007
0.5664.5943.6227.6515.6807.7103.7404.7708.8017.8330
0.8646.8967.9292.9620.9962
1.02881.06271.09701.13171.1668
1.20211.23791.27401.31041.34721.38431.42171.45951.49761.6361
1.57481. 61391.65331.69301.73301.77331. 81401.85491.89621.9377
1.97%2.02172.06422.10692.14992.19322.23692.28072.32492.3694
.008
0.569-2.5972.6255.6544.6836.7133.7434.7739.8048.8361
0.8678.8999.9324.9653.9985
1.03211.06611.10051.13521.1703
1.20571.24151.27761. 31411.35091.38801.42551.46331.50141.5399
1.57871.61781.65721.69701. 73701. 77741. 81811.85901.90031.9419
1.98882.02602.06842. 11122.15432.19762.24122.28512.32932.3738
.009
0.5720.6000.6284.6573.6866.7163.7464.7770.8079.8393
0.8710.9032.9367.9686
1.00191.03551.06%1.10391.13871.1738
1.20931.24511.28121.31771.35461.39181.42931:46711.50531.6438
1.58261. 62171.66121. 70101. 74101.78141.82211.86321.90451.9461
1.98802.03022.07272.11552.15862.20192.24662.28%2.33382.3783
949289 O 51- -14
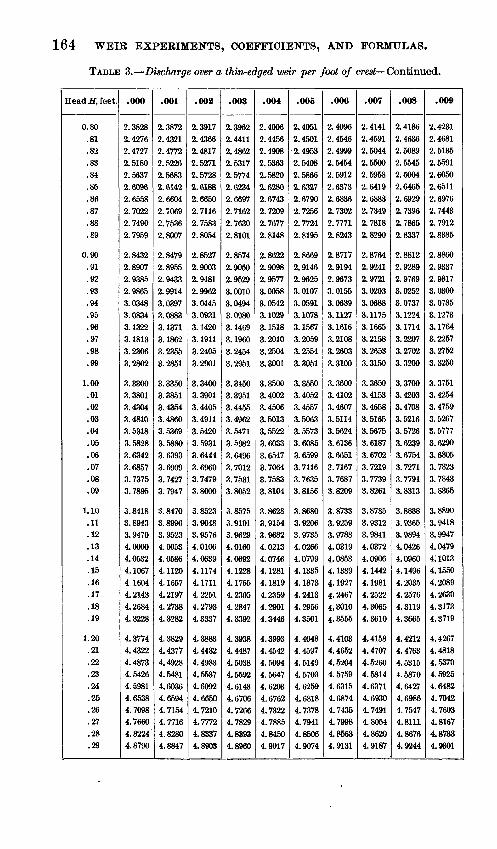
164 WEIR EXPERIMENTS, COEFFICIENTS, AND FORMULAS.
TABLE 3. Discharge over a thin-edged weir per foot of crest Continued.
Head H, feet.
0.80.81.82.83.84.85.86.87.88.89
0.90.91.92.93.94.95.96.97.98.99
1.00.01.02.03.04.05.06.07.08.09
1.10.11.12.13.14.15.16.17.18.19
1.20.21.22.23.24.25.26.27.28.29
.000
2.38282. 42762.47272.51802.56372.60%2.65582.70222.74902.7959
2.84322.89072.93852.98653.03483.08343.13223. 18133.23063.2802
3.33003.38013.43043. 48103. 53183.58283.63423.68573. 73753.7895
3.84183.89433. 94704.00004.05324.10674.16044.21434.26844.3228
4. 37744.43224. 48734.54264.59814.65384.70984.76604. 82244.8790
.001
2. 38722.43212. 47722. 52262.56832. 61422.66042. 70692.75362.8007
2.84792.89552.94332.99143.03973.08833.13713. 18623.23553.2851
3.33503.38513.43543.48603.53693.58803.63933.69093.74273.7947
3.84703.89%3.95234.00534.05864. 11204.16574.21974.27384.3282
4.38294.43774.49284.54814.60364.65944.71544.77164.82804.8847
.002
2.39172.43662.48172.52712.57282.61882.66502.71162.75832.8054
2.85272.90032.94812. 99623.04453.09313.14203. 19113.24053.2901
3.34003.39013.44053.49113.54203. 59313.64443.69608. 74793.8000
3.85233.90483.95764.01064.06394. 11744. 17114.22514.27934.3337
4.38834.44324.49834.65374.60924.66504.72104. 77724.83374.8908
.003
2.3%22.44112. 48622.53172. 57742.62342.66972. 71622.76302. 8101
2. 85742.90502.95293.00103.04943.09803. 14693.19603.24543.2951
3.34503.39513.44553. 49623.54713.59823.64%3.70123. 75313.8052
3.85753.91013.96294.01604.06924.12284.17654.23054.28474.3392
4.39384.44874.50384.55924.61484.67064.72664.78294.83934.8960
.004
2.40062.44562.49082.53632,58202.62802.67432.72092. 76772.8148
2.86222.90982. 95773.00583.05423.10293. 15183.20103.25043.3001
3.35003.40023.45063.50133. 55223.60333.65473.70643.75833.8104
3.86283.91543.96824.02134. 07464.12814.18194.23594.29014.3446
4.39934.45424.50944.56474.62034.67624.73224.78854.84504.9017
.005
2.40512.45012.49532.54082.58662.63272.67902. 72562.77242. 8195
2. 86692. 91462.%253.01073. 05913. 10783.15673.20593.25543.3051
3.35503.40523.45573.50633.55733.60853.65993. 71163.76353.8156
3.86803.92063.97354.02664.07994.13354.18734.24134.29564.3501
4.40484.45974. 51494. 57034. 62594.68184. 73784.79414.85064.9074
.006
2.40962.45462.49992.54542.59122.63732.68362.73022. 77712.8243
2.87172. 91942.%733.01553.06393. 11273. 16163.21083.26033.3100
3.36003.41023.46073.51143.56243.61363. 66513. 71673.76873.8209
3.87333.92593.97884.03194.08534.13894.19274.24674,30104.3555
4.41034.46524.52044. 57594.63154.68744. 74354.79984.85634. 9131
.007
2. 41412.45912.50442.55002.59582.64192.68832.73492. 78182.8290
2.87642.92412. 97213.02033.06883. 11753.16653.21583.26533.3150
3.36503.41533.46583.51653.56753. 61873.67023. 72193.77393.8261
3.87853. 93123. 98414.03724.09064.14424.19814.25224.30654.3610
4.41584.47074.52604.58144.63714.69304. 74914.80544.86204.9187
.008
2.41862.46362.50892.55452.60042.64652.69292.73%2.78652.8337
2.88122.92892. 97693.02523.07373. 12243. 17143.22073.27023.3200
3.37003.42033.47083. 52163.57263.62393.67543. 72713. 77913.8313
3.88883.93653. 98944.04264.09604. 14964. 20354.25764.31194.3665
4.42124.47634.53154.58704.64274.69864.75474.81114. 86764.9244
.009
2.42312.46812.51352.55912.60502. 65112.69762.74432. 79122.8385
2.88602. 93372. 98173.03003.07853. 12733.17643.22573.27523.3250
3.37513.42543. 47593.52673.57773.62903.68053.73233.78433.8365
3.88903.94183.99474.04794.10134.15504.20894.26304.31734.3719
4.42674.48184.53704.59254.64824.70424.76034.81674.87334.9301
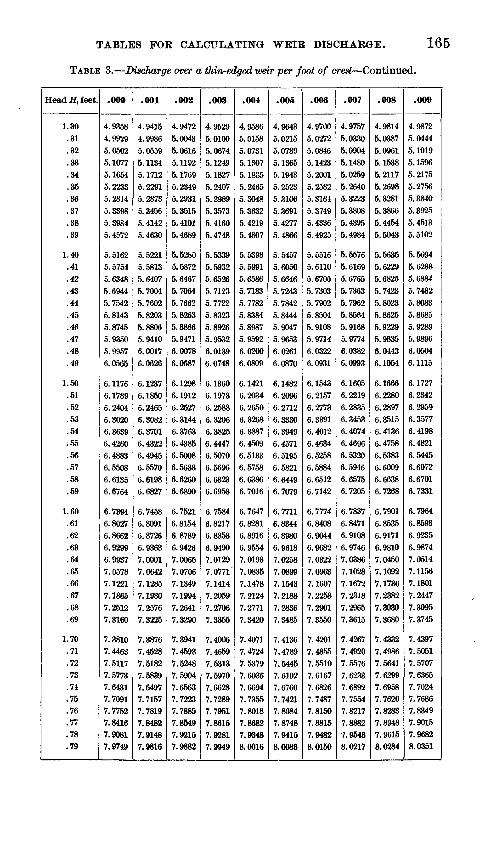
TABLES FOR CALCULATING WEIR DISCHARGE. 165
TABLE 3. Discharge over a thin-edged weir per foot of crest Continued.
Head H, feet.
1.30.31.32.33.34.35.36.37.38.39
1.40.41.42.43.44.45.46.47.48.49
1.50.51.52.53.54.55.56.57.58.59
1.60.61.62.63.64.65.66.67.68.69
1.70.71.72.73.74.75.76.77.78.79
.000
4.93584.99295.05025.10775.16545.22335.28145.33985.39S45.4572
5. 51625.57545.63485.69445.75425. 81435. 87455.93505.99576.0565
6. 11766. 17896.24046.30206.36396.42606.48836.55086. 61356.6764
6.73946.80276.86626.92996.99377.05787.12217.18657.25127.3160
7.38107.44637.51177.57737.64317.70917.77527.84167.90817.9749
.001
4.94154.99865.05595.11345.17125.22915.28735.34565.41425.4630
5.52215.58135.64075.70045.76025.82035.88065.94106.00176.0626
6.12376.18506.24656.30826. 37016.43226.49456.55706.61986.6827
6.74586.80916.87266.93637.00017.06427.12857.19307.25767.3225
7.38767.45287.51827.58397.64977. 71577. 78197.84827.91487.9616
.002
4.94725.00435.06165. 11925. 17695.23495.29315.35155.41015.4689
5.52SO5.58725.64675.70645. 76625.82635.88665.94716.00786.0687
6.12986. 19126.25276.31446.37636.43856.50086.56336.62606.6890
6. 75216. 81546. 87896.94267.00657.07067.13497.19947.26417.3290
7.39417.45937.52487.59047.65637.72237.78857.8549.7.92157.9882
.003
4.95295.01005.06745. 12495. 18275.24075.29895.35735.41605.4748
5.53395.59325.65265.71235.77225.83235.89265.95326.01396.0748
6. 13606. 19736.25886.32066.38256.44476.50706.56966.63236.6953
6.75846.82176.88536.94907.01297. 0771 ~7. 14147.20597.27067.3355
7.40067.46597.53137.59707.66287.72897. 79517.86157.92817.9949
.004
4.95865.01585.07315.13075.18855.24655.30485.36325. 42195.4807
5.53985.59915.65865.71835.77825.83845.89875.95926.02006.0809
6.14216.20346.26506.32686.38876.45096.51336.57586.63866. 7016
6.76476.82816.89166.95547.01937.08357.14787. 21247.27717.3420
7.40717.47247.53797.60367.66947.73557.80187.86827.93488.0016
.005
4.96435.02155.07895.13655.19435.25235.31065.36915.42775.4866
5.54575.60505.66465.72435.78425.84445.90475.96536.02616.0870
6.14826.20%6.27126.33306.39496.45716. 51956.58216.64496. 7079
6.77116.83446.89806.96187.02587.08997.15437.21887.28367.3485
7.41367.47897.54457. 61027.67607.74217.80847. 87487.94158.0083
.006
4.97005.02725.08465.14235.20015.25825. 31645. 37495.43365.4925
5.55165. 61105.67055.73035.79025.85045.91085. 97146.03226.0931
6.15436.21576.27736. 33916.40126.46346.52586.58846.65126.7142
6.77746.84086.90446.96827.03227.09637.16077.22537.29017.3550
7.42017.48557.55107.61677.68267.74877.81507.88157.94828.0150
.007
4.97575.03305.09045.14805.02595.26405.32235.38085.43955.4984
5.55765. 61695.67655.73635.79625.85645.91685.97746.03826.0993
6.16056.22196.28356.34536.40746.46%6.53206.59466.65756.7205
6.78376.84716. 91086. 97467.03867.10287.16727.23187.29657.3615
7.42677.49207.55767.62337.68927.75547.82177.88827.96488.0217
.008
4.98145.03875.0%15.15385.21175.26985.32815.38666.44545.5043
5.56355.62295.68255.74235.80235.86255.92295.98356.04436.1054
6.16666.22806.28976.35156. 41366.47586.53836.60096.66386.7268
6.79016.85356. 91716.98107.04507.10927.17367.23827.30307.3680
7.43327.49867.56417.62997.69587.76207.82837.89487.%158.0284
.009
4.98725.04445. 10195.15%5.21755.27565.33405.39255.45135.5102
5.56945.62885.68845.74825.80835.86855.92895.98%6.05046.1115
6. 17276.23426.29596. 35776.41986.48216.54456.60726.67016.7331
6.79646.85986.92356.98747.05147.11567. 18017.24477.30957.3745
7.43977.50517.57077.63657.70247.76867.83497.90157.96828.0351
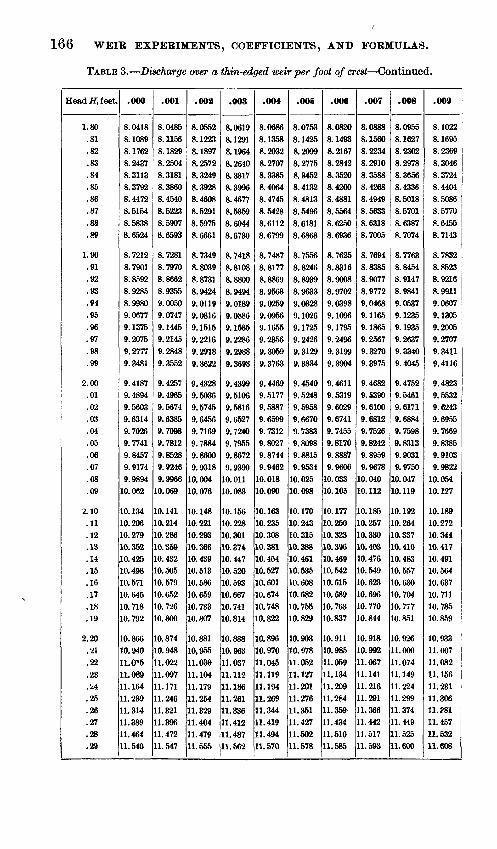
166 WEIR EXPERIMENTS, COEFFICIENTS, AND FORMULAS.
TABLE 3. Discharge over a thin-edged weir per foot of crest Continued.
Head .fiT, feet.
1.80.81.82.83.84.85.86.87.88.89
1.90.91.92.93.94.95.96.97.98.99
2.00.01.02.03.04.05.06.07.08.09
2.10.11.12.13.14.15.16.17.18.19
2.20.21.22.23.^4.25.26.27.28.29
.000
8.04188.10898. 17628.24378. 31138.37928.44728.51648.58388.6524
8. 72128.79018.85928.92858.99809.06779. 13759.20759.27779.3481
9.41879.48949.56039.63149.70269. 77419.84579.91749.989410.062
10.13410.20610.27910. 352JO. 42510.49810. 57110.64510.71810.792
10.86610.94011.01511.08911.16411.23911.31411.38911.46411.540
.001
8.04858.11568.18298.25048.31818.38608.45408.52238.59078.6593
8.72818.79708.86628.93559.00509.07479.14459.21459.28489.3552
9.42579.49659.56749.63859.70989.78129.85289. 92469.9966
10.069
10. 14110.21410.28610.35910.43210.50510. 57910.65210. 72610.800
10.87410.94811.02211.09711. 17111.24611.32111.39611.47211.547
.002
8.05528.12238.18978.25728. 32498.39288.46088.52918. 59758.6661
8. 73498.80398.87318.94249.01199.08169.15159.22169.29189.3622
9.43289.50369.57459.64569.71699.78849.86009.931810.00410.076
10.14810.22110.29310.36610.43910. 51310.58610.65910.73310.807
10.88110,95511.03011.10411. 17911.25411.32911.40411. 47911.556
.003
8.06198.12918.19648.26408.33178.39%8.46778.53598.60448.6730
8.74188.81088.88008.94949.01899.08869.15859.22869.29889.3693
9.43999.51069.58169.65279.72409.79559.86729.939010.01110.083
10.15610.22810.30110. 37410.44710.52010.59310.66710.74110. 814
10.88810.96311.03711.11211.18611.26111.33611.41211. 48711.562
.004
8.06868.13588.20328.27078.33858.40648.47458.54288.61128.6799
8.74878. 81778.88698.95639.02699.09569.16559.23569.30599.3763
9.44699.51779.58879.65999.73129.80279.87449.946210.01810.090
10.16310.23610.30810.38110.45410.52710.60110. 67410.74810.822
10.89610.97011.04511. 11911.19411.26911.34411.41911.49411. 570
.005
8.07538.14258.20998.27758.34528.41328.48138.54968.61818.6868
8.75568.82468.89398.96339.03289.10269.17259.24269.31299.3834
9.45409.52489.69589.66709.73839.80989.88159.953410.02510.098
10.17010.24310. 31510.38810.46110.53510.60810.68210.75510.829
10.90310.97811.05211.12711.20111.27611.36111.42711.50211.578
.006
8.08208.14938.21678.28428.36208.42008.48818.56648.62508.6936
8.76268.83168.90088.97029.03989.10969.17959.24969.31999.3904
9.46119.53199.60299. 67419.74559. 81709.88879.960610.03310.105
10. 17710.26010.32310.39610.46910.54210.61510.68910.76310.837
10. 91110.98511.05911.13411.20911.28411.35911.43411.61011.585
.007
8.08888.15608.22348.29108.35888.42688.49498.56338.63188.7005
8.76948.83858.90778. 97729.04689. 11659.18659.25679.32709.3975
9.46829.63909.61009.68129.75269.82429.89599.9678
10.04010. 112
10.18510.25710.33010.40310.47610.54910.62310.6%10.77010.844
10.91810.99211.06711. 14111.21611.29111.36611.44211.51711.593
.008
8.09658. 16278.23028.29788.36568.43368.50188.57018.63878. 7074
8.77638.84648.91478.98419.05379.12359.19359.26379.33409.4046
9.47529.64619. 61719.68849.75989.83139.90319.975010.04710.119
10.19210.26410.33710.41010.48310.55710.63010.70410.77710.851
10.92611.00011.07411. 14911.22411.29911. 37411. 44911.52511.600
.009
8.10228.16958.23698.30468.37248.44048.50868.57708.64558. 7143
8.78328.85238.92168.99119.06079.13059.20059.27079.34119. 4116
9.48239.65329. 62439.69559.76699.83859. 91039.9822
10.05410.127
10.18910.27210.34410.41710. 49110.56410.63710.71110.78510.859
10.93311.00711.08211.16611.23111.30611.88111. 45711.63211.608
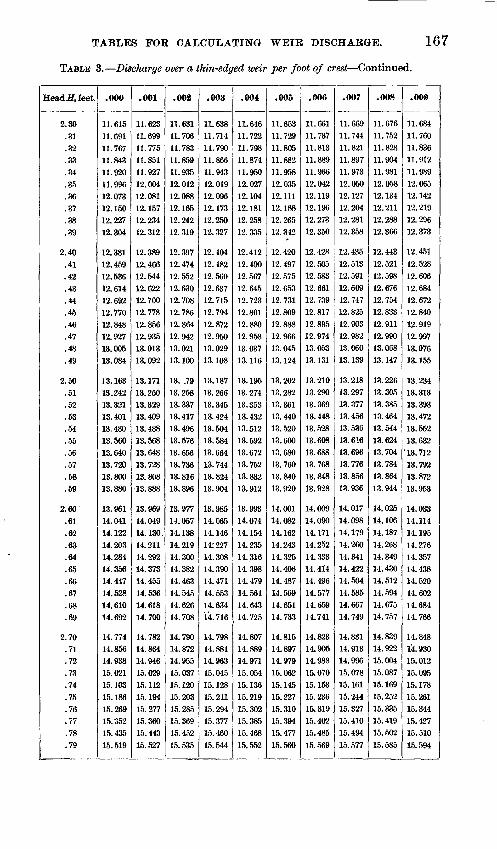
TABLES FOE CALCULATING WEIR DISCHARGE. 167
TABLE 3. Discharge over a thin-edged weir per foot of crest Continued.
Head IT, feet.
2.80.31.32.33.34.35.36.37.38.39
2.40.41.42.43.44.45.46.47.48.49
2.50.51.52.53.54.55.56.57.58.59
2.60.61.62.63.64.65.66.67.68.69
2.70.71.72.73.74.75.76.77.78.79
.000
11.61511.69111. 76711.84311.92011.99612.07312.15012. 22712.804
12.38112.45912.53612. 61412.69212.77012.84812.92713.00513.084
13.16313.24213. 32113. 40113.48013.56013.64013.72013.80013.880
13.96114.04114.12214.20314.28414.35614.44714.52814. 61014.692
14. 77414.85614.93815. 02115.10315.18615.26915.35215.43515. 519
.001
11.62311.69911. 77511.85111.92712.00412. 08112. 15712.23412. 312
12.38912. 46612.54412. 62212.70012. 77812.85612.93513.01313.092
13. 17113.25013.32913.40913.48813.56813.64813. 72813.80813.888
13.96914.04914.130.14.21114.29214. 37314.45514.53614. 61814.700
14. 78214.86414.94615.02915.11215.19415.27715.36015.44315.527
.002
11.63111.70611.78311.85911.93612.01212.08812.16512. 24212. 319
12. 39712. 47412.55212. 63012. 70812.78612. 86412.94213.02113.100
13. .7913.25813.33713. 41713. 49613.57613.65613.73613. 81613.896
13.97714.05714.13814. 21914.30014.38214.46314.54514.62614.708
14.79014. 87214.95515. 03715. 12015.20315.28515.36915.45215. 535
.003
11.63811.71411.79011.86611.94312. 01912.09612. 17312.25012. 327
12.40412. 48212.56(112. 63712.71512. 79412.87212.95013.02913. 108
13. 18713. 26613.34513. 42413.50413.58413.66413.74413. 82413.904
13.98514.06514. 14614:22714.30814.39014.47114.65314.63414. 716
14. 79814.88114.96315.04515.12815. 21115.29415.37715.46015.544
.004
11.64611. 72211.79811.87411. 96012.02712.10412. 18112.25812.335
12.41212.49012. 56712. 64512.72312.80112.88012.95813. 03713. 116
13. 19513. 27413.35313.43213.51213.59213.67213. 75213.83213. 912
13.99314.07414.15414.23514.31614. 39814. 47914.561
14.64314. 725
14.80714.88914.97115.05415.13615.21915.30215. 38515.468
15. 552
.005
11.65311. 72911.80511.88211.95812.03512. Ill12. 18812.26512. 342
12. 42012. 49712. 57512.65312. 73112.80912.88812.96613.04513. 124
13.20213.28213.36113.44013. 52013.60013.68013. 76013.84013.920
14.00114.08214. 16214.24314. 32514.40614.48714.56914. 65114. 733
14. 81514.89714.97915.06215.14515.22715. 31015.39415.477
15.560
.006
11.66111. 73711.81311.88911.96612.04212. 11912.19612.27312.350
12. 42812.60512.58312. 66112. 73912. 81712. 89512.97413.05313. 131
13.21013.29013. 36913.44813.52813.60813.68813.76813.84813.928
14.00914.09014. 17114.25214. 33314. 41414. 49614.57714.65914.741
14.82314.90514.98815.07015.15315.23615. 31915.40215.485
15.569
.007
11.66911.74411. 82111. 89711. 97312.05012. 12712. 20412.28112.358
12.43512. 51312. 59112. 66912. 74712.82512. 90312. 98213.06013. 139
13. 21813.29713. 37713.45613. 53613. 61613.69613. 77613.85613. 936
14.01714.09814. 17914.26014.34114.42214.50414.58514.66714.749
14.83114. 91314.99615.07815. 16115.24415.32715.41015.49415. 577
.008
11. 67611. 75211.82811.90411.98112.05812. 13412.21112.28812.366
12.44312. 52112. 59812. 67612.75412.83312. 91112.99013.06813. 147
13. 22613.30513. 38513.46413.54413.62413. 70413.78413.86413. 944
14.02614.10614. 18714.26814.34914.43014.51214.59414.67514. 757
14.83914.92215.00415.08715. 16915.25215.33515. 41915.502
15.585
.009
11.68411.76011.83611.91211.98912.06512. 14212. 21912.29612. 373
12. 45112.52812.60612.68412. 67212.84012.91912.99713.07613.155
13. 23413. 31313. 39313. 47213. 55213.632'13.71213.79213. 87213. 953
14.03314.11414. 19514. 27614.35714.43814. 52014.60214.68414. 766
14.84814.93015. 01215.09515. 17815.26115.34415.42715. 510
15.594
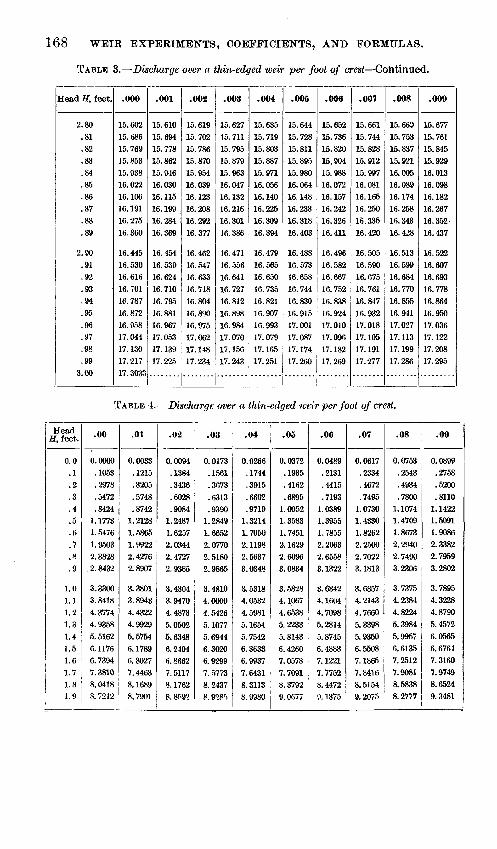
168 WEIR EXPERIMENTS, COEFFICIENTS, AND FORMULAS.
TABLE 3. Discharge over a thin-edged weir per foot of crest Continued.
Head H, feet.
2.80.81.82.83.84.85.86.87.88.89
2.90.91.92.93.94.95.96.97.98.99
3.00
.000
15.60215.68615. 76915.85315.93816.02216.10616.19116.27516.360
16.44516.53016. 61616. 70116. 78716. 87216. 95817.04417.13017. 21717. 3033
.001
15. 61015.69415. 77815.86215. 94616. 03016. 11516. 19916.28416.369
16.46416.53916. 62416. 71016. 79516.88116.96717.05317. 13917.225
.002
15.61915.70215. 78615. 87015.95416. 03916. 12316.20816.29216.377
16.46216. 54716.63316. 71816.80416.89016. 97517. 06217. 14817. 234
.003
15.62715.71115.79515. 87915. 96316.04716. 13216. 21616.30116.386
16.47116. 55616.64116. 72716. 81216. 89816.98417.07017. 15617. 243
.004
15.63515. 71915.80315.88715.97116.05616.14016.22516.30916.394
16.47916.56516.65016.73516.82116.90716. 99317. 07917. 16517. 251
.005
15.64415.72815.81115. 89515.98016.06416. 14816. 23316. 31816.403
16.48816. 57316.65816.74416.83016. 91517.00117. 08717. 17417.260
.006
15.65215.73615.82015,90415.98816.07216. 15716.24216.32616. 411
16.49616. 58216.66716. 75216.83816.92417. 01017. 09617. 18217. 269
.007
15.66115.74415.82815. 91215.99716.08116.16516.25016. 33516.420
16.50516.59016. 67516. 76116. 84716. 93217. 01817.10517. 19117.277
.008
15. 66015.75315.83715.92116.00516.08916. 17416.25816.34316.428
16.51316.59916.68416. 77016.85516. 94117.02717. 11317. 19917.286
.009
15. 67715. 76115.84515.92916. 01316.09816. 18216.26716. 352-16.437
16.52216.60716.69316. 77816.86416.95017. 03617.12217.20817.295
TABLE 4. Discharge, over a, thin-edged weir per foot of crest.
Head H, feet.
0.0.1.2.3.4.5.6.7.8.9
1.01.11.21.31.41.51.61.71.81.9
.00
0.0000.1053.2978.5472.8424
1. 17731.54761.95032.3828
. 2. 8432
3.33003. 84184. 37744.93585. 51626. 11766.73947. 38108.04188. 7212
.01
0.0033.1215.3205.5748.8742
1.21281.58651.99222.42762.8907
3.38013.89434.43224.99295.57546. 17896.80277.44638.16898.7901
.02
0.0094.1384.3436.6028.9084
1.24871. 62572. 03442.47272.9385
3.43043. 94704. 48735.05025.63486.24046. 86627. 51178. 17628. 8P92
.03
0. 0173.1561.3673.6313.9390
1.28491.66522. 07702.51802.9865
3. 48104.00004.54265. 10775.69446.30206. 92997. 57738. 24378.9^8")
.04
0.0266.1744.3915.6602.9719
1.32141.70502.11982.56373.0348
3. 53184.05324.59815.16545.75426.36336.99377.64318.31138.9980
.05
0.0372.1935.4162
.68951.00521.35831. 74512.16292.60963.0834
3.58284.10674.65385. 2233
5. 81436.42607. 05787.70918.37929. 0(577
.06
0.0489.2131.4415
.71931.03891.39551. 78552. 20632.65583.1322
3.63424.16044.70985.28145.87456.48837.12217.77528. 44729. 1375
.07
0.0617.2334.4672
.74951.07301.43301. 82622.25002.70223. 1813
3.68574. 21434.76605.33985.93506.55087. 18657.84168. 51549. 2075
.08
0.0753.2543.4934
.78001. 10741.47091.86732.29402. 74903.2306
3. 73754.23844.82245.39845. 99576.61357.25127.90818.58388. 2777
.09
0.0899.2758.5200.8110
1.14221.50911.90862.33822. 79593.2802
3.78954.32284.87905.45726.05656. 67647. 31607.97498.65249.3481
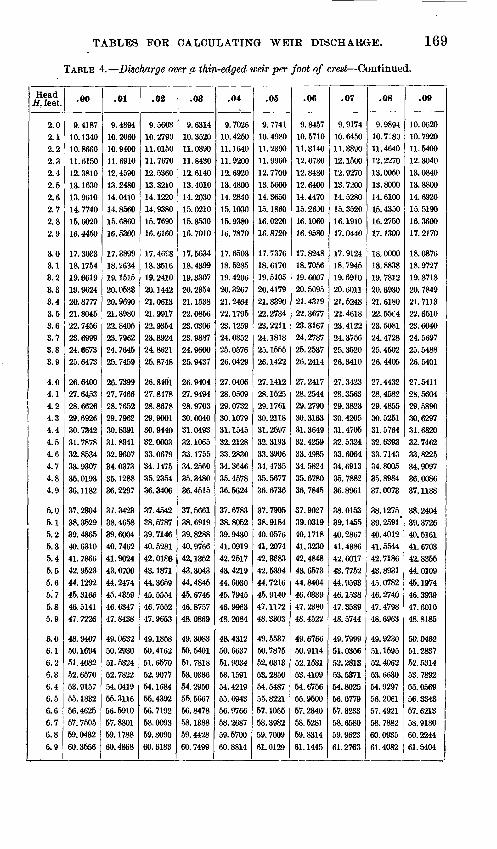
TABLES FOR CALCULATING WEIR DISCHARGE. 169
TABLE 4. Discharge over a thin-edged weir per foot of crest Continued.
Head H, feet.
2.02.12.22.32.42.52.62.72.82.9
3.03.13.23.33.43.53.63.73.83.9
4.04.14.24.34.44.54.64.74.84.9
5.05.15.25.35.45.55.65.' 75.85.9
6.06.16.26.36.46.56.66.76.86.9
.00
9.418710.134010. 866011.615012. 381013. 163013.961014. 774015.602016.4450
17. 303318. 175419.661919. 962420. 877721.804522.745623.699924.667325. 6473
26.640027.645328.662629.692630.734231. 787832.853433. 930735.019336. 1182
37.280438.352939.486540.631041. 786642.952344.129245. 316646. 514147.7226
48.940750.169451.408252.657053.915755.183256.462557. 750559. 0482
60.3556
.01
9.489410.206010.940011. 691012. 459013.248014. 041014.856015.686016.5300
17. 389918.263419. 151520.053320.969021. 898022. 840523. 796224.764625.7459
26.739927.746628. 765229. 796230.839131. 894132.960734.037335.128836.2297
37.342338.465839.600440. 746241.902443. 070044.247445.435946. 634747.8438
49. 063250.293051. 532452. 782254. 041955. 311656. 591057.880159.178860.4868
.02
9. 560310.279011.015011. 767012.536013.321014.122014.938015. 769016. 6160
17. 46S818.351619.241020. 144221. 061321. 991722.935423.892424. 862125. 8748
26.8idl27. 847828.867829.900130.944032.000333.067934. 147535.235436.3406
37.454288. 578739.714640.528142. 018643. 187144.365945.555446. 755247.9653
49.185850.416251. 657052. 907754.168455.439256. 719258.009359. 309060. 6183
.03
9.631410. 352011.089011.843012. 614013. 401014.203015. 021015. 853016. 7010
17.563418.439919.330720. 235421. 153822. 085623.030623.988724.960025. 9437
26. 940427. 949428. 970330.004031. 049332.106533. 175534. 256035.348036.4515
37.566138. 691939.828840, 976642.135243.304344.484545. 674646. 875748.0869
49.308350.540151. 781853.033654.295055.566756.847858.138859.4428
60. 7499
.04
9.702610.425011. 164011.920012. 692013.480014. 284015. 103015.938016. 7870
17. 650318.528519.420620. 326721.246422. 179523. 125924.085225.057626.0429
27.040628.050929.073230. 107931. 154532. 212833.283034. 364635. 457836. 5624
37.678338.805239. 943041. 091942. 251743. 421944.603045. 794546. 996348.2084
48.431250.663751. 903453.159154. 421955. 694356. 976658.268759. 570060.8814
.05
9. 774110. 498011.239011.996012. 770013.560014.365015. 186016.022016. 8720
17.737618. 617019. 510520.417921.339022.273423. 221124. 181825. 155526. 1422
27. 141228.152529. 176130.211831.259732. 319333. 390634. 473535. 567736. 6736
37.790538. 918440. 057641.207442. 368342. 539444.721645. 914047. 117248.3803
49.553750.787552.031353.285054.648755. 822157. 105558. 398259.7009
61.0129
.06
9.845710. 571011. 314012. 073012. 848012. 640014.447015.263016.106016.9580
17. 824818. 705619.600720.509521. 431922. 367723.316724.278725.253726. 2414
27. 241728.254429.279030. 316331. 364932. 425933. 498534.582435.678036. 7845
37.902739.031940. 171841.323042.484843.657344.840446. 033947.238048.4522
49. 676650.911452. 153153. 410954. 675655.950057.234058.528159.831461. 1445
.07
9. 917410.645011.389012.150012. 927013.720014. 528015.352016. 191017.0440
17. 912418. 794519. 691020. 601121. 524822.461823.412224. 375625. 352026. 3410
27. 342328.356329. 382330.420531.470532.532433.606434. 691335.788236.8961
38.015339.145540.286741.438642. 601743.775244.959346. 153847. 358948.5744
49. 799951.035652.281353.537154.802556.077957.323358.658059. 962361.2763
.08
9. 989410.7:8311. 464012.227013.005013.800014.610015. 435016.275017.1300
18.000018.883819. 781220.693021. 618022.55C423.508124. 472825.450226.4405
27.443228.458229.485530.525131. 576432. 639333. 714334.800535.898437. 0073
38.127539. 2591°40.401241.554442. 718643. 893145.078246. 274047. 479848.6963
49.923051.159552.406253.663054.929756. 206157. 492158.788260.093561.4082
.09
10.062010.792011. 540012.304013.084013.880014. 692015. 519016.360017. 2170
18. 087618.972719. 871820. 784921. 711322. 651023.604024. 569725.548826.5401
27..54112S.560429. 589030.629731.682032.746233.822534.909736.008637. 1188
38.240439. 372640.516141. 670342.835544.010945.197446. 393947. 601048. 8185
50.046251.283752. 531453.789255.056956.334357. 621358.918060. 224461.5404
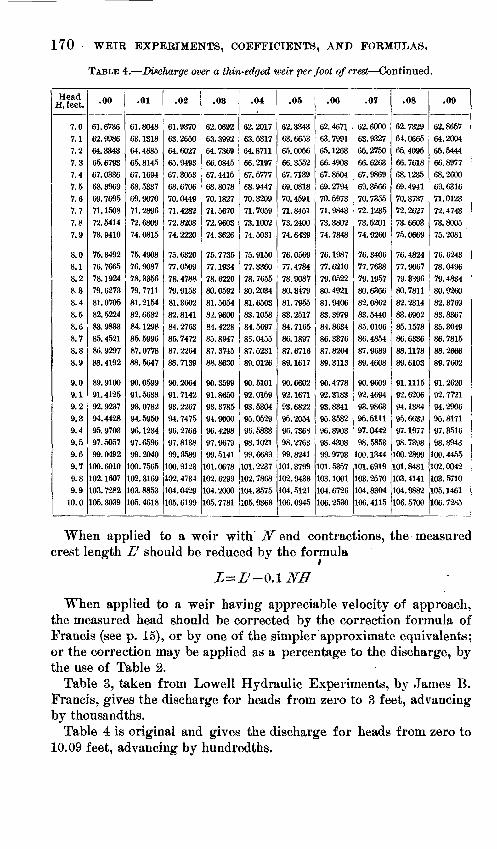
170 WEIR EXPERIMENTS, COEFFICIENTS, AND FORMULAS.
TABLE 4. Discharge over a thin-edged weir per foot of crest Continued.
Head H, feet.
7.07.17.27.37.47.57.67.77.87.9
8.08.18.28.38.48.58.68.78.88.9
9.09.19.29.39.49.59.69.79.89.910.0
.00
61.673662.998664.334365. 679367.033668.396969. 769571.150872.541473. 9410
75. 349276.766578. 192479. 627381.070582. 522483.983385. 452186.929788. 4192
89.910091. 412592.923794.442895. 970397.505799.0492
100. 6010102. 1607103. 7282105. 3039
.01
61.804863. 131864.468565.814567. 169468.533769.907071.289672.680974. 0815
75. 490876.908778.335679. 771181.215482. 668284.129885. 599687. 077888.5647
90. 059991.563393. 078294.595096. 123497.65%99.2040100.7565102. 3169103.8853105. 4618
.02
61.937063.265064.602765.949367.305368.670670.044971.428272.820874.2220
75.632077.050978. 478879. 915381.360282. 814184.276385. 747287.226488.7139
90.206491. 714293. 226794. 747596. 276697.813899.3589100.9323102. 4734104.0429105. 6199
.09
62.069263.399264. 736966.084567.441568.807870. 182771. 567072.960374.3626
75.773577.193478. 622080.059281.505482. 960084.422885.894787. 374588.8630
90.359991.865093.378594.900096.429897. 967999. 5141101.0678102. 6299104.2000105. 7781
.04
62. 201763.531764.871166. 219767. 577768. 944770.320971.705973. 100274. 5031
75. 915077.336078.765580.203481.650383.105884.569785.045587,523189. 0126
90. 510192. 015993.530495.052996.583398. 102199.6689
101. 2237102.7868104. 3575105.9363
.05
62.334363.665365.005666.355267.713969. 081870.459171.845173.240074. 6439
76.056977.478478.908780.317981. 795583. 251784. 716586. 189787. 671689. 1617
90.660292. 167193.682295.205496.736398.276399. 8241101.3799102.9433104. 5121106.0945
.06
62. 467163.799165. 126866. 490867.850469. 279470. 597371.984373.380274.7848
76. 198777. 621079.052280.492181.940683. 397984.863486.337687.820489. 3113
90.477892. 318393.834195. 358296. 890398.430899. 9793
101. 5357103. 1001104. 6726106.2530
.07
62.600063. 932765.275066.626367.986969.356670. 735572. 123573.520174.9260
76.340677.763879. 195780.636682.086283.544085. 010686.485487. 968989.4608
90.960992.469493. 986395. 511197.044298.5853
100. 1344101. 6919103.2570104.8304106. 4115
.08
62. 73296 L 066565.409566. 761868.123569.494170. 873772.262773.660375.0669
76.482477. 906779. 339680. 781182. 231483.690285. 157886.633688. 117889. 6103
91. 111592. 620694. 138495. 663997. 197798. 7398100.2899101.8481103.4141104.9882106. 5700
.09
62.865764.200465.544466. 897768.260069. 631671.012372. 474373. 800575.2081
76. 624378.04%79.483480.926082.376983. 836785.304986. 781588.266689.7602
91.262092. 772194.290695. 817197. 351698. 8943100. 4455102.0042103. 6710105. 1461106. 7285
When applied to a weir with N end contractions, the measured crest length Z' should be reduced by the formula
When applied to a weir having appreciable velocity of approach, the measured head should be corrected by the correction formula of Francis (see p. 15), or by one of the simpler approximate equivalents; or the correction may be applied as a percentage to the discharge, by the use of Table 2.
Table 3, taken from Lowell Hydraulic Experiments, by James B. Francis, gives the discharge for heads from zero to 3 feet, advancing by thousandths.
Table 4 is original and gives the discharge for heads from zero to 10.09 feet, advancing by hundredths.
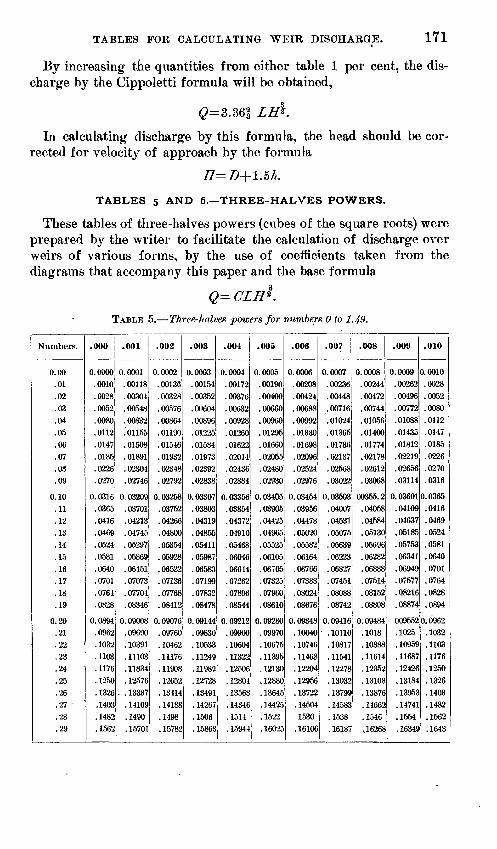
TABLES FOR CALCULATING WEIR DISCHARGE. 171
By increasing the quantities from either table 1 per cent, the dis charge by the Cippoletti formula will be obtained,
0=3.36| LH*.
In calculating discharge by this formula, the head should be cor rected for velocity of approach by the formula
TABLES 5 AND 6. THREE-HALVES POWERS.
These tables of three-halves powers (cubes of the square roots) were prepared by the writer to facilitate the calculation of discharge over weirs of various forms, by the use of coefficients taken from the diagrams that accompany this paper and the base formula
TABLE 5. Three-halves powers for numbers 0 to 1.49.
Numbers.
0.00.01.02.03.04.05
.06
.07
.08
.09
0.10.11.12.13.14.15.16.17.18.19
0.20.21.22
.000
0.0000.0010.0028.0052.0080.0112.0147.0185.0226.0270
0.0316.0365.0416.0469.0524.0581.0640.0701.0764.0828
0.0894.0962.1032
.23 .1103
.24
.25
.26
.27 '
.28
.29
.1176
.1250
.1326
.1403
.1482
.1562
.001
0.0001.00118.00304.00548.00832.'01155.01508. 01891.02304.02746
0.03209.03701.04213. 04745.05297.05869.06151. 07073. 07704.08346
0.09008.09690. 10391. 11103.11834. 12576
- .13337. 14109.1490. 15701
.002
0.0002.00136.00328.00576.00864.01190.01516.01932.02348.02792
0.03258.03752.04266.04800.05354.05928.06522. 07136.07768.08412
0.09076.09760. 10462.11176.11908.12652. 13114.14188.1498. 15782
.003
0.0003.00154
.00352
.00604
.008%
. 01225
.01584
.01973
.02392
.02838
0.03307.03803.04319.04855.05411. 05987.06583.07199.07832.08478
0.09144.09830.10533. 11249.11982. 12728. 13491. 14267.1506.15863
.004
0.0004.00172.00376.00632.00928. 01260. 01622.02014.02436.02884
0.03356.03854.04372.04910.05468.06046.06644. 07262.07896.08544
0. 09212.09900.10604.11322.12506.12804. 13568.14346.1514.15944
.005
0.0005.00190.00400.00660.00960.01295.01660.02055.02480.02930
0.03405.03905.04425.04965.05525.06105.06705. 07325.07960.08610
0.09280.09970.10675.11395. 12130
.12880
. 13645
.14425
.1522
. 16025
.006
0.0006.00208.00424.00688.00992.01330.01698.02096.02524.02976
0.03454.03956.04478.05020.05582.06164.06766.07388.08024.08676
0.09348.10040. 10746.11468.12204.12956.13722.14504.1530.16106
.007
0.0007.00236.00448.00716.01024.01365.01736.02137.02568.03022
0.03503.04007.04531.05075.05639.06223.06827. 07451.08088.08742
0.09416.10110.10817.11541. 12278.13032. 13799.14583.1538. 16187
.008
0.0008.00244.00472.00744.01056.01400.01774.02178.02612.03068
00355.2.04058.04584. 05130.056%.06282.06888.07514.08152.08808
0.09484.1018.10888. 11614.12352. 13108.13876. 14662.1540,16268
.009
0.0009.00262.00496.00772.01088.01435.01812.02219.02656.03114
0.03601.04109.04637.05185.05753.06341.06949.07577.08216.08874
009552.1025.10959.11687. 12426
.13184
.13953
. 14741
.1554
.16349
.010
0.0010.0028.0052.0080.0112.0147.0185.0226.0270.0316
0.0365.0416.0469.0524.0581.0640.0701.0764.0828.0894
0.0962.1032.1103.1176.1250.1326.1403.1482.1562.1643
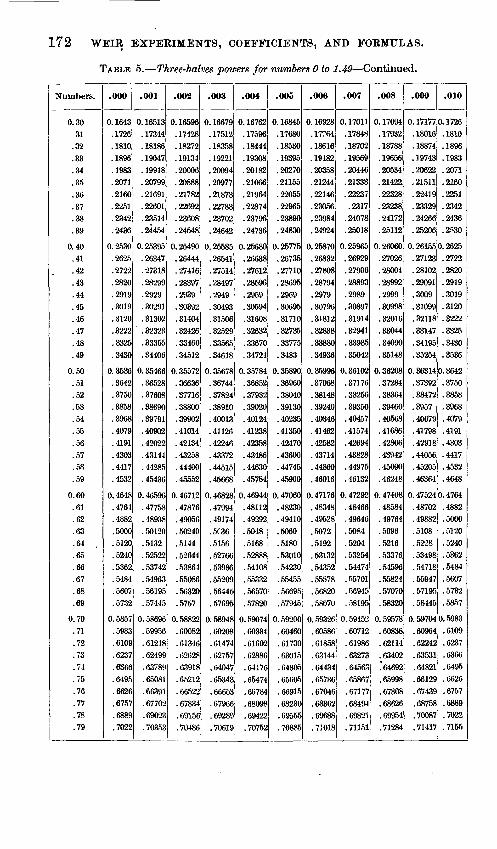
172 WEIR EXPERIMENTS, COEFFICIENTS, AND FORMULAS.
TABLE 5. Three-halves powers for numbers 0 to 1.49 Continued.
Numbers.
0.3031.32.33.34.35.36.37.38.39
0.40.41.42.43.44.45.46.47.48.49
0.50.51.52.53.54.55.56.57.58
.59
0.60.61.62.63.64.65.66.67.68.69
0.70.71.72.73.74.75.76.77.78.79
.000
0.1643.1726.1810.18%.1983.2071.2160. 2251.2342.2436
0.2530.2625.2722.2820.2919.3019.3120.3222.3325.3430
0.3536.3642.3750.3858.3968.4079.4191.4303.4417.4532
0.4648.4761.4882.5000.5120.5240.5362.5484.5607.5732
0.5857.5983.6109.6237.6366.6495.6626.6757.6889.7022
.001
0. 16513.17344. 18186.19047. 19918.20799. 21691.22601.23514. 24454
0.25395.26347. 27318.28299.2929.30291.31302.32323.33355.34406
0.35466.36528.37608.38690. 39791.40902.42022.43144.44285.45436
0. 465%.47758. 48938.50120.5132.52522. 53742.54963.56195. 57445
0. 58696. 59956. 61218. 62499.63789.65081. 66391.67702.69023.70353
.002
0. 16596.17428. 18272. 19134.20006.20888. 21782. 22692.23608.24548
0.25490.26444. 27416. 28397.2939.30392.31404. 32426. 33460.34512
0. 35572. 36636. 37716.38800.39902. 41014.42134.43258.44400.45552
0. 46712. 47876.49056.50240.5144.52644.53864.55086.56320.5757
0.58822.60082. 61346. 62628.63918. 65212.66522. 67834. 69156.70486
.003
0. 16679. 17512.18358.19221.20094.20977. 21873. 22783.23702.24642
0.25585.26541.27514.28497.2949
.30493
.31506
. 32529
.33565
.34618
0. 35678.36744. 37824.38910.40013. 41126.42246.43372.44515.45668
0.46828.47994. 49174.5C36.5156.52766.53986.55209.56445. 57695
0. 58948.60208. 61474. 62757.64047. 65343.66653.67966.69289.70619
.004
0. 16762.175%.18444.19308.20182.21066.21964.22874.23796.24736
0.25680.26638.27612.285%.2959.30594.31608. 32632.33670.34724
0.35784.36852. 37932.39020.40124.41238.42358.43486.44630.45784
0.46944.48112. 49292.5048.5168.52888.54108.55332.56570.57820
0.59074.60334.61602.62886. 64176.65474.66784.68098.69422.70752
.005
0.16845.17680.18530.19395.20270.21155.22055. 22965.23890.24830
0.25775.26735. 27710.28695.2969.30695. 31710.32735.33775.3483
0.35890.36960.38040.39130.40235.41350.42470.43600. 44745.45900
0.47060.48230.49410.5060.5180. 53010.54230.55455.56695.57945
0. 59200.60460. 61730.63015.64305.65605. 66915
.68230
.69555
.70885
.006
0. 16928.177fi4
.18616
. 19482
.20358
.21244
.22146
.23056
.23984
.24924
0.25870.26832.27808.28794.2979.307%.31812.32838.33880.34936
0. 359%.37068.38148.39240.40346.41462.42582.43714.44860. 46016
0.47176.48348. 49528
.6072
.5192
. 53132
.54352
.55578
.56820
.58070
0. 59326.60586.61858.63144.64434.65736.67046.68362.69688. 71018
.007
0. 17011.17848.18702.19569.20446.21333.22237.2317.24078.25018
0.25965.26929.27906.28893.2989.30897.31914.32941
.33985
.35042
0.36102.37176.38256.39350.40457. 41574.42694.43828. 44975. 46132
0. 47292.48466.49646.5084.5204.53254.54474.55701.56945. 58195
0. 59452.60712. 61986.63273.64563.65867. 67177.68494.69821. 71151
.008
0.17094.17932.18788.19656.20534.21422.22328.23238. 24172.25112
0.26060.27026.28004.28992.2999.30998. 32016.33044.34090.35148
0.36208.37284.38364.39460.40568.41686.42806. 43942.45090.46248
0. 47408.48584.49764.5096. 5216.53376.54596.55824.57070.58320
0. 59578.60838. 62114.63402."64692.65998.67308. 68626.69954.71284
.009
0. 17177.18016.18874. 19743.20622.21511. 22419.23329.24266.25206
0. 26155.27123.28102.29091.3009.31099.32118.33147.34195.35254
0.36314.37392.38472.3957.40679. 41798. 42918.44056.45205.46364
0. 47524.48702.49882.5108.5228. 53498.54718.55947. 57195.58445
0.59704.60964. 62242.63531. 64821.66129. 67439.68758.70087. 71417
.010
0. 1726.1810.18%.1983.2071.2160.2251.2342.2436.2*30
0.2625.2722.2820.2919.3019.3120.3222.3325.3430.3536
0.3642.3750.3858.3968.4079.4191.4303.4417.4532.4648
0.4764.4882.5000.5120.5240.5362..5484.5607. 5732.5857
0.5983.6109.6237.6366.6495.6626.6757.6889.7022.7155
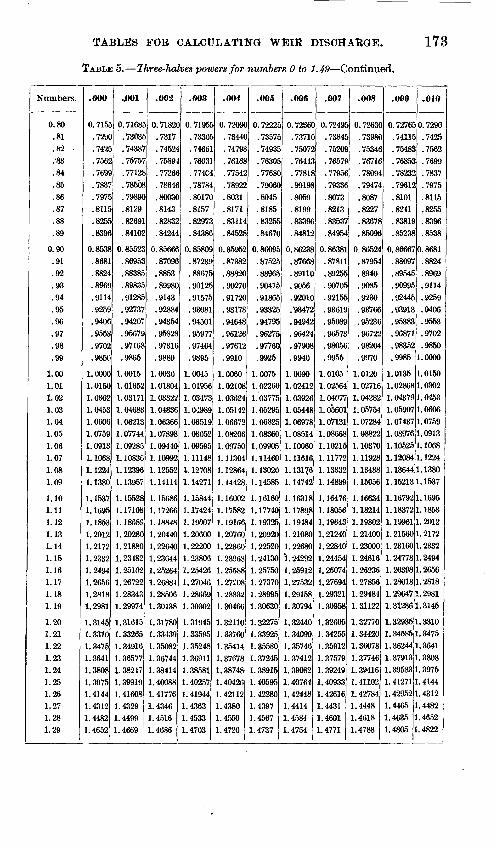
TABLES FOR CALCtTLATlNG WEIB DISCHARGE.
TABLE 5. Three-halves powers for numbers 0 to 1.49 Continued.
173
Numbers.
0.80.81.82 ..'83
.84
.85
.86
.87
.88
.89
0.90.91.92.93.94.95.96.97.98.99
1.001.011.021.031.041.051.061.071.081.09
1.101.111.121.131.141.151.161.171.181.19
1.201.211.221.231.241.251.261.271.281.29
.000
0.7155.7290.7426.756.7699.783.797.811.8255.8396
0.8538.868.8824.8969.9114.9259.9406.9553.9702.9850
1.00001.01501.03021.04531.06061. 07591.09131.10681.1224
1.1380
1.15371. 16951.18531. 20121.21721.23321.24941.26561.28181.2981
1. 31451.33101.34751.86411.38081. 39751.41441.43121.44821. 4652
.jOOl
0.7168S.7303.74387. 7575-.77128.78508.79890.8129. 82691.84102
0.85523.86953.88385.89835.91285.92737. 94207.95679.97168.9865
1.00151. 016521.031711.046831. 062131.077441. 092851.108361.123961. 13957
1. 155281. 171081.186891.202801. 218801. 231821. 251021. 267221.283431.29974
1. 316151.332651. 349161.365771. 382471.399191. 416081.43291. 44991.4669
.002
0. 7182C.7317.7452.7589.77266.78646.80030.8143.82832.84244
0.85666.87096.8853. 89981
. .9143.92884.94354.95828.97316.9880
1.00301. 018041.033221.048361.063661.078981.094401.109921.125521. 14114
1.156861.172661. 188481. 204401.220401. 236441. 252641.268841. 285061.30138
1. 317801.334301.350821. 367441. 384141.400881. 417761.43461.45161.4686
.003
0.7195E.7330E. 74661.76031. 774C4. 78784.80170.8157.8297.84386
0.85809. 8723".88675.90125.91575.93081.94501.95977.97464.9895
1.00451. 019561. 034731.049891.065191. 080521. 095951. 111481. 127081. 14271
1. 158441. 174241. 190071.206001. 222001.238061. 254261.270461.286691.30302
1.319451.335951. 352481. 369111.385811.402571. 419441. 43631.45331.4703
.004
0.7209C.7344.7479.76168.7754.78922.8031.8171.83114.84528
0. 85952.87382.88820.90270.91720.93178.94648. 96126.97612.9910
1.00601.021081. 036241. 051421.066721.082061.097501. 113041.128641. 14428
1.160021. 175821. 191661.207601. 223601. 239681.255881. 272081.288321.30466
1. 321101.337601.354141. 376781.387481.404261. 421121.43801.45501. 4720
.005
0.7222.7357.74935.76306.77680.7906.8045.8185.83255.84670
0.86095.87525.88965.90415.91865.93325.94795.96275.97760.9925
1.00751.022601.037751.052951.068251.083601.099051.114601.130201.14585
1. 161601.177401. 193251.209201.225201.241301. 257501. 273701.289951.30630
1. 322751.339251.355801.372451. 389151. 405951.422801. 43971.45671. 4737
.006
0.7236C.7371.7507.7644.7781.99198.8059.8199.83396.84812
0.86238.87668. 89110.9056.92010.'93472.94942.96424.97908.9940
1.00901. 024121. 039261.054481. 069781.085141.100601. 116161. 1317,61. 14742
1. 163181. 178981.191841.210801.226801.242921.259121.275321. 291581.B0794
1.324401.340901. 357461. 374121.390821. 407641.424481. 44141.45841.4754
.007
0. 7249..7384.75208.7657.77956.79336
.8073
.8213
.83537
.84954
0.86381.87811.89255.90705.92155. 93619.95089.96573.98056.9955
1. 01051.025641.040771.056011. 071311.086681.102151. 117721. 133321. 14899
1.164761.180561.196431. 212401.228401.244541.260741.276941. 293211.30958
1.326051.342551.359121. 375791. 392491.409331.426161.44311.46011.4771
.008
0. 72630.73980.75346. 76716.78094. 79474
.8087
.8227
.83678
.85096
0.86524.87954.8940.9085.9230.93766. 95236.96722.98204.9970
1.01201. 027161.042821.057541.072841.088221.103701.119281.134881.15056
1.166341. 182141.198021.214001.230001. 246161.262361.278561. 2948*1. 31122
1. 327701.344201.360781. 377461. 394161. 411021. 427841.44481.46181.4788
.009
0.72765.74115.75483.76853. 78232. 79612.8101.8241.83819.85238
0.86667.88097.89545.90995.92445. 93913.95383.96871.98352.9985
1.01351.028681. 043791.059071.074371.089761.105251.120841. 136441. 15213
1. 167921. 183721.199611.215601.231601. 247781.263981. 280181. 296471.31286
1.329351. 345851.362441. 379131.395831. 412711.429521.44651.46351.4805
.010
0.7290.7425.7562.7699.7837.7975.8115.8255.8396.8538
0.8681.8824.8969.9114.9259.9406.9553.9702.9850
1.0000
1.01501.03021.04531.06061. 07591.09131.10681.12241.13801.1537
1. 16951.18531.20121.21721.23321. 24941.26561.2818^.29811.3145
1.33101.34751.36411.38081.39751.41441.43121.44821.4652t.4822
174 WEIB, EXPERIMENTS, COEFFICIENTS, AND FORMULAS.
TABLE 5. Three-halves powers for numbers 0 to 1.49 Continued.
Numbers.
1.301.31
1.321.331.341.35
1.36
1.371.38
1.39
1.401.411.42
1.431.441.45
1.461.471.481.49
.000
1. 48221.49941.51661.53381.55121.5686
1.58601.6035
1. 62111.6388
1.65651.6743
1.69211.71001.72801. 74601.7611
1.78231.80051.8188
.001
1.483921.501121. 518321.535541. 55294
1. 570341. 587751.60526
1. 622871. 64057
1. 658281. 676081. 693891. 71181. 72981. 747811. 765921. 784121.80233
.002
1.485641.502841.520041.537281. 55468
1.572081.58950
1. 607021.62464
1.64234
1.660061. 677861.695681. 71361. 73161. 749621.767741.785941. 80416
.003
1. 487361.504561. 521761.53902
1.556421. 573821. 59125
1. 608781. 626411. 64411
1. 661841.679641. 69747
1. 71541. 73341. 75143
1. 769561. 787761. 80599
.004
1. 489081.506281. 523481. 510761.55816
1.57556
1.593001.61054
1. 62818
1.64588
1. 663621.681421.69926
1. 71721. 73521.753241. 77138
1. 789581. 80782
.005
1.490801.50800
1. 525201. 542501.559901.57730
1. 594751.612301. 62995
1.64765
1.665401.68320
1. 701051.71901. 73701.75505
.006
1. 492521. 509721.526921.544241.56164
1. 579041.59650
1. 614061. 63172
1. 64942
1. 667181.684981.70284
1.72081.73881.75686
1.77320| 1.775021. 791401.80965
1. 793221.81148
.007
1. 494241.511441.52864
1.545981.56338
1.580781.598251. 615821.63349
1.65119
1.668961.68676
1.704631. 72261.74061.758671.776841.795041. 81331
.008
1. 495961. 513161.530361.547721. 56512
1.582521.60000
1.617581.635261. 652%
1. 670751.688541.70642
1.72441. 74241. 76048
1. 778661. 79686
1. 81514
.009
1. 497681. 514881. 532081.549461.56686
1.584261. 601751.61934
1.637031. 65473
1. 672521.69032
1. 708211.72621.74421.762291.780481.798681. 81697
.010
1.49941.51661.53381.5512
1.56861.58601.60351. 62111.6388
1.6565
1.67431.6921
1.71001.72801.74601.76411.78231.80051.8188
TABLE 6. Three-halres powers for numbers from 0 to 12.
\0.00.01.02.03.04.05.06.07.08.09
0.10.11.12.13.14.15.16.17.18
0
0.0000.0010.0028.0052.0080.0112.0147.0185.0226.0270
0. 0316.0365.0416.0469.0524.0581.0640.0701.0764
. 19 . 0828
1
1.00001.0150
a
2. 82842.8497
1. 0302^2. 87101.04532.89231. 0606 2. 91371. 0759 !2. 93521. 0913 2. 95671.10681.12241.1380
1.15371. 16951.18531.20121. 21721.23321. 24941.26561.28181. 2981
2.97822.99983. 0215
3.04323.06503.08683. 10863.13063. 1525
3
5. 19625.22225.24825.27435.30045. 32665.35285.37915.40545.4317
5.45815.48455. 51105. 53755.56415.5907
3. 1745 5. 61733.19663. 21873.2409
5.64405. 67085. 6975
4
8.00008.03008.06018.09028. 12038.15058.18078.21098. 24128. 2715
8. 30198. 33238. 36278. 39328.42378.45428.48488. 51548.54608. 5767
5
11. 180311. 213911. 247511. 281111.314811.348511.382211.416011. 449711.4836
11. 517411. 551311. 585211. 619211.653211. 687211. 721311.755411. 789511. 8236
6
14. 696914. 733714. 770514. 807314. 844214.881014. 917914. 954914. 991915.0289
15. 065915. 103015. 140015. 177215. 214315. 251515. 288715. 326015. 363215.4005
7
18.520318.560018. 599718. 639418. 679218. 719018. 758918.798818.838718. 8786
18. 918518.958518. 998519. 038619. 078619.118719.158919.199019.2392
8
122. 627422.669922. 712322.754822. 797322.839922.882522. 925122.967723.0103
23.053023.095723.138423. 1812
9 10
1 27.000031.622827. 0450 31. 670227. 089031. 717727. 1351 31. 765227.180227. 225327. 270527.315627.360827.4060
27. 451227.496527. 541827. 5871
23. 2240 27. 632423.266823.309623.352523.3954
27. 677827. 723227.768627. 8140
19. 2794 23. 4383 27. 8595
31. 812731.860231. 907831.955432.003032.0506
32.098332.146032. 193732. 241432. 289232. 337032. 384832. 432632. 480432.5283
1
11
36.482936.532636. 582436. 632236. 682036. 731936. 781836. 831736.881636. 9315
36. 981537. 031537.081537. 131537. 181637. 231737. 281737.331937.382037.4322
TABLES FOB CALCULATING WEIR DISCHARGE. 175
TABLE 6. Three-halves powers for numbers from 0 to 12 Continued.
\0.20
.21
.22
.23
.24
.25
.26
.27
.28
.29
0.30.31.32.33.34.35.36.37.38.39
0.40.41.42.43.44.45.46.47.48.49
0.60.51.52.53.64.55.56.57.58.59
0.60.61.62.63.64.65.66.67.68.69
0
0.0894 .0%2 .1032.1103.1176.1250.1326.1403.1482.1562
0.1643.1726.1810.18%.1983.2071.2160.2251.2342.2436
0.2530.2625.2722.282.2919.3019.3120.3222.3325.3430
0.3536.3642.3760.3858.3968.4079.4191.4303.4417.4532
0.4648.4764.4882.5000.5120.5240.5362,6484.5607.5782
1
1.3145 1. 3310 1.34751.36411.38081.39751.41441. 43121.44821.4652
1.48221.49941.51661.53381.55121.56861.58601.60351. 62111.6388
1.65651.67431.69211.71001.72801.74601.76411.78231.80051,8188
1.83711.85551.87401.89251.91111.92971.94841.96721.98602.0049
2.02382.04292.06192.08102.10022.11952.13882.15812.17752.1970
2
3.2631 3.2854 3.30773.33013.35253.37503; 39753.42013.44273.4654
3.48813.51093.53373.55663.57953.60253.62553.64863. 67173.6949
3. 71813. 74133.76463.78803. 81143.83493.85843.88193.90553.9292
3.95293.97664.00044.02424.04814.07204.09604.12004.14414.1682
4.19244.21664.24084.26514.28954.31394.33834.36284.38744.4119
3
5. 7243 5. 7512 5. 77815.80505.83205.85905.88615.91325.94035.%75
5.99476.02206.04936.07676.10416.13156.15906.18656. 21416. 2417
6.26936.29706.32476.35256.38036.40816.43606.46396. 49196.5199
6.64796.57606.60416.63236.66056.68876. 71706.74536.77376.8021
6.83056.85906.88756.91616.94476.97337.00207.03077.05957.0883
4
8.6074 8.6382 8.66908.69988.73078. 76168.79258.82358.85458.8856
8. 91678.94788.97909.01029.04149.07269.10409.13539.16679.1981
9.22959.26109.2925
,9.32419.35579.38739.<1899.45069.48249. 5141
9.54599. 57789.60979.64169.67359.70559. 73759. 76959.80169.8337
9.86599.89819.93039.%269.9949
10.027210.05%10.092010.124410. 1569
5
11.8578 11.8920 11.926311.960611.994912.029312.063612.098112. 132512.1670
12.201512. 236112.270612.305312.339912. "74612.409312.444012.478812. 5136
12.548512.583312.618212.653212.688212. 723212.758212.793312.828412.8635
12.898612.933812.%9113.004313.039613.074913.110313. 145713. 181113.2165
13.252013. 287513. 323113.358713. 394313.429913.465613. 501313.537013.5728
6
15.4379 15.4752 15. 512615.550115.586615.625015. 661615. 700115. 737615. 7752
15. 812915.850515.888215.926015. %3716.001516.039316.077216. 115016. 1529
16.190916.228816.266816.304816. 342916. 381016. 419116. 457216.495416.5336
16. 571816.610116.648416.686716. 725016.763416. 801816.840216. 878716. 9172
16.955716. 994317.032817.071417.110117.148817. 187417.217217.264917.3037
7
19. 31% 19.3599 19.400219.440519.480819. 521219.557619.602119.642519.6830
19.723519. 764119.804619.845219.885819.926519. %7220.007920.048620.0894
20.130220. 171020. 211820.252720.293620.334520.375520.416520.457520.4985
20.53%20.580720. 621820.663020.704120.745320.786620.827820.869120.9104
20. 951820.993121.034521.075921.117421.158921.200421. 241921.283421.3250
8
23.4812 23. 5242 23.567223.610223.653323.696323.739423.782523.825723.8689
23.912123.955323.998624.041824.085124.128524. 171824.215224.258624.3021
24.345524.389024.432524. 476124.519624.563224.606824.650524.694124.7378
24. 781524.825324.869124.912924.956725.000525.044425.088325. 132225.1762
25.220225.264225.308225.352225.396325.440425.484525.528725. 572925. 6171
9
27.9050 27. 9514 27.996028.041628.087228.132828.178428.224128.269828.3155
28.361228. 406928.452728.498528.544428.590228.636128.682028. 727928.7739
28.819928.865928. 911928.957929.004029.050129.0%229. 142429.188529.2347
29.281029. 327229.373529.419829.466129.512429.558829.605229.651629.6980
29.744529. 791029.837529.884129.930629.977230.023830.070430. 117130.1638
10
32. 5762 32.6241 32. 672032.720032.768032.816032.864032. 912132.960033.0083
33.056433.104633. 152733.200933.249233.297433. 345733.394033.442333.4906
33.539033.587433.635833.684233.732733.781133.829733.878233.926733.9753
34.023934.072534. 121134. 169834. 218534.267234. 315934.364734.413534.4623
34. 511134.559934.608834.657734.706634.755734.804534.853534.902534. 9516
11
37.4824 37.5326 37.682837.633137.683337.733637.784037.834337.884737.9351
37.985538.035938.086438.136938.187438.237938.288438.339038.38%38.4402
38.490838.541538.592238.642938. 693638.744338.795138.845938.8%738.9475
38.998439.049339.100239. 151139.202039. 253039.304039.355039.406039.4571
39.508239.559339.610439. 661539.712739.763939. 815139.866339. 917639.9689
176 WEIR EXPERIMENTS, COEFFICIENTS, AND FORMULAS.
TABLE 6. Three-halves powers for numbers from 0 to 12 Continued.
\0.70
.71
.72
.73
.74
.75
.76
.77
.78
.79
0.80
.81
.82
.83
.84
.85
.86
.87
.88
.89
0.90.91.92
.93
.94
.95
.96
.97
.98
.991.00
0
0.5857.
.5983
.6109
.6237
.6366
.6495
.6626
.6757
.6889
.7022
0.7155.7290.7425.7562.7699.7837.7975.8115
.8255
.8396
0.8538.8681
.8824
.8969
.9114
.9259
.9406
.9553
.9702
.98501.0000
1
2.2165 2.23612.25582.27552.29522.3150
2.33492.3548
2.37482. 3949
2.41502.43512.45532.4756
2. 49592.51632.53672.55722. 57772.5983
2.6190
2.63972.66042.68122.70212.7230
2.74402.76502.78612.80722.8284
2
4.4366 4.46124.48594.5107
4.53554.56044.58534.6102
4.63524.6602
4.68534.71044.7356
4.76084.78614.8114
4.83674.8621
4.88754.9130
4.93854.9641
4. 98975.01545.0411
5.0668
5.09265.11845.14435.17025.1962
3
7. 1171 7.14607.17497.20387.2328
7.26187.29097.32007.34927.3783
7.40767.43687.46637.49557.52487.55427.58377. 61327.64277. .6723
7.70197.73157.7702
7.79097.82077.8505
7.88037.91027.^94017.97008.0000
4
10. 1894 10.221410.254510.2871
10. 319710.352410.385110. 4178
10.450610.4834
10. 516310.549210. 581210.615010.648010. 681010. 714110. 747210.780310. 8134
10.846610.879810. 913110.946410. 979711.013111.046411.079911. 113311. 146811. 1803
5
13.6086 13.6444
13.680313.716113.7521
13.788013. 824013.860013.896113. 9321
13.9682
6
17.3425 17.381417.420217.459117. 498117. 537017. 576017. 6150
17.654117. 6931
17. 7322
14.004417.771414.040617.8105
14.076817.850714. 1130 17. 888914. 149317. 928214.185614. 221914. 258214.2946
14.331114. 367514.4040
14.440514. 477014. 513614.550214.586914. 623514.660214. 6969
7
21.3666 21.408321.449921. 491621.533321. 5751
8
25.661325. 705625.749925.794225.839525.8828
21.616925.927221. 6587 25. 971621.700526.0161
21. 7423
21. 784221. 826121. 868121.910021.952021.9940
17. 9674 22. 036118.006718.046118.0854
18. 124818. 164218.203718.243218.282718.3222
18. 361718.401318.440918.480618. 5203
22.078122.120222. 1623
22.204522.246722.288922.3311
22.373322.4156
22.457922.500322.542622.585022.6274
26.0605
26. 105026. 149526. 194126.2386
9
30.2105
30.257230.304030.350730.397530.444430.4912
30.538130.585030.6319
10
35.0006 35.0497
35.098835. 147935.197135.246235.295435.3446
35.393935.4431
30. 6789 35. 492430. 7258 35. 541730. 7728 35. 591130. 8198 35. 6404
26.283230.866935.689826. 3278 30. 9139 35. 739226.372526. 417126. 461826. 5065
26.5523
26.590026.640826.6856
26.730526. 7753
26.820226.865126.910026.955027.0000
30.961035.788631.008135.838031.055335.887531.1024
31. 1496
35.9370
35.986531.196836.036031.244136.085631.291336.135231. 3386 36. 184831.385036.2344
31.433236.284131. 4806 36. 333731. 5280 36. 383431.575436.433131. 6228 36. 4829
11
40:0202 40. 071540.122840. 174240.2266
40. 277040.328440. 379840. 431340.4828
40.534340.585940. 637440.6890
40.740640.792240.843940.895540.9472
40.9989
41.050741. 102441.154241.206041. 257841.3097
41.361541. 413441.465341. 517341.5692
The tables of three-halves powers may conveniently be used in conjunction with Crelle's Rechentafeln, or similar tables of the products of pairs of factors. C will usually be constant, or nearly so. Entering Crelle's tables with C or CL as an argument, the discharge
corresponding to values of H^ read from the tables here given may be taken out directly, and usually with sufficient precision at least for 1 foot length,of crest, without any aritnmetical computation. Table 5
3
gives H* for values of Zf from zero to 1.5 feet, advancing by thou sandths. In Table 6 the increment is 0.1 foot, and the range zero to
312 feet. Should H* be required for larger values of H, it may be found from the three-halves power of i/T, by the formula )'
(114)
TABLES FOR CALCULATING WEIR DISCHARGE. 177TABLE 7. FLOW OVER BROAD-CRESTED WEIRS, WITH STABLE
NAPPE.
This table gives values of
whereZ=l
6^=2.64
The derivation of this coefficient is given in connection with discus sion of broad-crested weirs (pp. 119-121). It may be applied to broad- crested weirs of any width of cross section exceeding 2 feet within such limiting heads that the nappe does not adhere to the downstream face of the weir for low heads nor tend to become detached with increased head. Under the latter condition the coefficient increases to a limit near the value which applies for a thin-edged weir, a point being finally reached where the nappe breaks entirely free from the broad crest and discharges in the same manner as for a thin-edged weir. The coefficient, 2.64, may often be applied for weirs exceeding 2-feet crest width and for heads from 0.5 foot up to 1.5 or 2 times the breadth of weir crest. If corrections for the velocity of approach are required the Francis correction formula, or its equivalent, should be used.
TABLE 7. Weir discharge per foot of crest length.
[Coefficient Ci=2.64.]
Head H, feet.
v&m0.00 .01 .02
.03
.04
.05
,06.07.08.09
0.10.11.12.13.14
.15
.16
.17
.18
.19
0
0.000 .003
.007
.014
.021
.030
.039
.049
.060
.071
0.083.096.110.124.138
.153
.169
.186
.202
.218
1
2.64 2.68 2.722.76
2.802.842.882.922.%
3.00
3.043.093.13
3.173.21
3.26
3.303.343.383.43
2
7.47
7.52 7.587.64
7.69
7.767.817.867.927.98
8.038.098.158.21
8.268.32
8.388.448.508.56
3
13.7 13.8
13.813.914.014.114.114.2
14.314.3
14.414.614.514.6
14.7
14.814.8
14.915.015.0
4
21.1 21.2
21.321.4
21.421.521.621.721.821.8
21.922.022.1
22.222.222.322.4
22.522.622.6
5
29.5 29.6 29.7
29.8
29.930.030.030.130.230.3
30.430.530.630.7
30.830.830.9
31.031.131.2
6
38.8 38.9 39.039.139.2
39.339.439.539.6
39.7
39.839.940.040.1
40.2
40.340.4
40.540.640.7
7
48.9
49.0 49.149.2
49.349.449.549.649.749.8
49.950.050.250.3
50.450.550.6
50.750.850.9
8
69.7 69.8 59.960.1
60.260.360.4
60.560.660.7
60.861.061.161.261.3
61.461.5
61.661.861.9
9
71.3 71.4 71.571.6
71.771.972.0
72.172.272.3
72.572.672.772.8
72.973.173.2
73.373.473.5
10
83.5 83.6 83.783.984.0
84.184.284.484.584.6
84.784.985.085.185.2
85.485.5
85.685.786.9
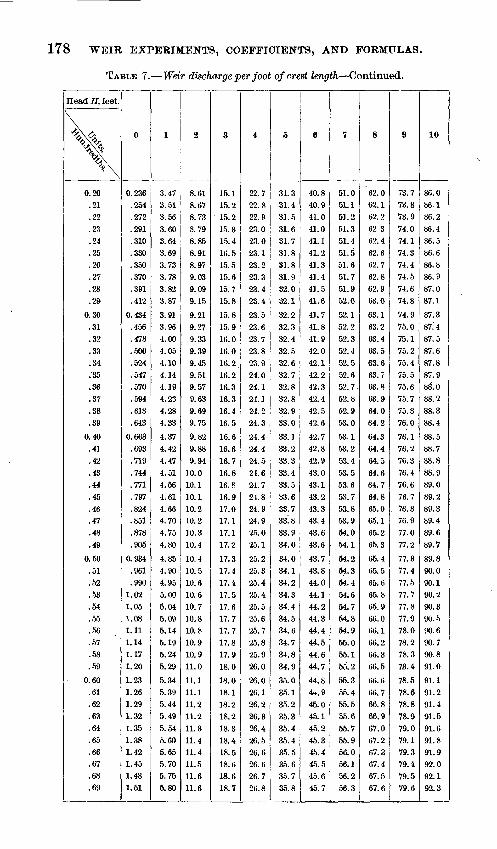
178 WEIR EXPERIMENTS, COEFFICIENTS, AND FORMULAS.
TABLE 7. Weir discharge per foot of crest length Continued.
Head H, feet.
Vx0.20
.21
.22
.23
.24
.25
.26
.27
.28
.29
0.30.31.32
.33
.34
.35
.36
.37
.38
.39
0.40.41.42
.43
.44
.45
.46
.47
.48
.49
0.50
.51
.52
.53
.54
.55
.56
.57
.58
.59
0.60.61.62.63.64.65.66.67.68.69
0
0.236.254.272
.291
.310
.330
.350
.370
.391
.412
0.434.456.478
.500
.524
.547
.570
.594
.618
.643
0.668.693.719
.744
.771
.797
.824
.851
.878
.905
0.934
.961
.9901.021.051.081.111.141.171.20
1.23
1.261.291.32
1.351.381.421.451.481.51
1
3.47 3.513.56
3.603.643.69
3.733.783.823.87
3.913.964.00
4.054.104.144.194.234.284.33
4.374.42
4.474.514.564.614.664.70
4.754.80
4.8§4.904.955.005.045.095.145.195.24
5.29
5.34
5.395.445.49
5.545.605.655.705.755.80
2
8.61 8.678.738.798.858.918.979.03
9.099.15
9.219.27
9.339.399.459.519.579.639.699.75
9.829.889.94
10.0
10.110.110.210.2
10.310.4
10.410.510.610.610.710.810.810.910.911.0
11.111.111.211.2
11.311.411.411.511.611.6
3
15.1 15.215.215.315.416.515.515.615.715.8
15.815.916.0
16.016.216.216.316.316.4
16.5
16.616.6
16.716.816.8
16.917.017.117.117.2
17.317.417.417.517.617.717.717.817.9
18.0
18.018.1
18.218.2
18.318.418.518.618.618.7
4
22.7 22.822.9
23.0
23.023.123.2
23.323.423.4
23.5
23.623.7
23.823.924.024.124.124.224.3
24.424.4
24.524.624.7
24.824.924.925.025.1
25.225.325.425.425.525.625.725.825.926.0
26.026.126.226.326.4
26.526.626.626.726.8
5
31.3 31.431.5
31.631.731.831.8
31.932.032.1
32.232.3
32.432.532.632.732.832.8
32.933.0
33.133.2
33.333.433.533.633.733! 833.934.0
34.0
34.134.2
34.334.4
34.534.634.734.8
34.9
35.035.135.235.3
35.435.435.535.635.735.8
6
40.8 40.941.0
41.041.141.241.341.441.5
41.6
41.741.8
41.9
42.042.142.242.342.4
42.542.6
42.742.8
42.943.043.143.2
43.343.443.643.6
43.743.844.044.144.244.344.444.544.644.7
44.84-±.945.045.1
45.245.345.445.545.645.7
7
51.0 51.151.2
51.351.451.551.651.751.952.0
52.152.252.352.4
52.552.652.7-52.8
52.953.0
53.153.2
53.453.553.6
53.753.853.954.054.1
54.254.354.454.6
54.754.854.955.055.155.2
55.355.455.555.6
55.755.956.0
56.156.2
56.3
8
62.0 62.162.2
62 362.4
62.662.7
62.862.963.0
63.163.263.4
63.563.663.763.8
63.964.064.2
64.364.464.5
64.664.764.865.065.165.265.3
65.465.5
65.665.865.966.060.1
66.266.366.5
66.666.766.866.9
67.067.267.367.467.5
67.6
9
73.7 73.873.974.0
74.174.374.474.574.6
74.8
74.975.0
75.175.2
75.475.575.675.7
75.876.0
76.176.2
76.376.476.6
76.7. 76.8
76.977.0
77.2
77.3
77.477.577.7
77.877.978.078.278.3
73.4
78.5
78.678.878.979.079.179.379.479.5
79.6
10
86.0 86.1
86.2
86.486.586.6
86.886.9
87.087.1
87.3
87.' 487.587.6
87.887.988". 088.2
88.3
88.4
88.588.788.888.989.0
89.289.389.489.6
89.7
89.890.090.190.2
90.390.590.690.790.891.0
91.191.2
91.491.5
91.691.891.992.092.1
92.3i
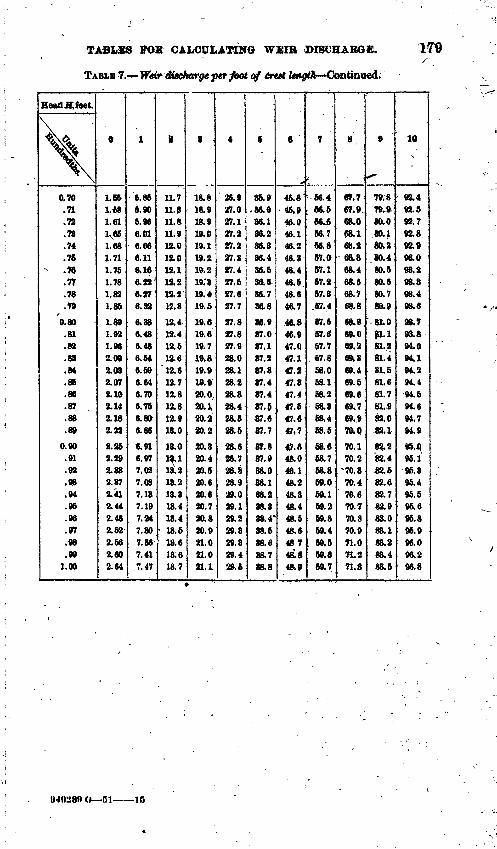
TABLES FOB CALCULATING WEIB DISCHARGE.
TABLE 7. Weir discharge per foot of erest &ȣ<& Continued.
HeadJEf,fe«t,
V<&
^S
0.70.n.72.78.74.76.W.77.78.79
0.80.81.82.88.84.86.86.87.88.89
0.90.91 .92.98.94.96.96.97.98.99
1.00
0
1.661.681.611.661.681,711.761.781.821.86
1.891.921.962.082.082.072.10 2.142.182.22
2.252.29 2.882.872.412.442.482.622.562.602.64
1
6.866.906.966.016.066.118.166.226.276.32
6.886.486.486.546. 596.646.70 6.756.806.86
6.916.97 7.027.087.187.197.247.807.8fr7.417.47
i
n.?11.811.811.912.012.012.111212.212.8
12.412.412.512.612.«12.712.8 12.812.918.0
18.018.118.218.218.818.418.418.518.618.618.7
S
18.818.918.919.019.119.219.2IKS'
19.419.5
19.619.619.719.819.919.920.0, 20.1,20.220.2
20.820.4 20.fi20.620.620.720.820.921.021.021.1
4
26.927.027.127.227.227.827.427.527.627.7
27.827.827.928.028.128.228.828.428.628.6
28.628.7 28.828.929.029.129.229.829.829.429.6
6
36.9.86.086.136.236.886.486.536.6S6.786.8
86.987.087.187.287.887.487.4 87.587.687.7
87,887.9 88.088.188.288.888.4*88.588.688.788.8
8
45.846,946.046.146.246.346.446.646.646.7
46,846.947.047.147.247.847.4 47.647.647,7
47.848.0 48.148.248.848.448.648.648748'. 848.9
7
66.466.666.656.766.867.057.167.257.8
.67.4
67. &57.657.7
. 67.85S.O58.168.2 68.358.468.5
58.658.7 68.869.059.159.259.859.459.559.666.7
8
67.767.9.68.068.168.268*868.468.668.768.8
68.969.069.269,369.469.569.6 69.769.9mo70.170.2
"70.870.470.6TO. 770.870.971.071.271. S
9
ff
7*879,9t80.080.180.280.480.580.680.780,9
81.081.181.281.481.581.681.7 81.982.082.1
82,282,4 82.682.682.782.988.088.188.288.488.5
10
92.492.592.792.892.998.098.298.898.498.6
98.798.894.094.194.294.494.5 94.694.794.9
95.4}95.1 96.895.495.595.696.896.996.096.296.8
t)4»280O 51 15
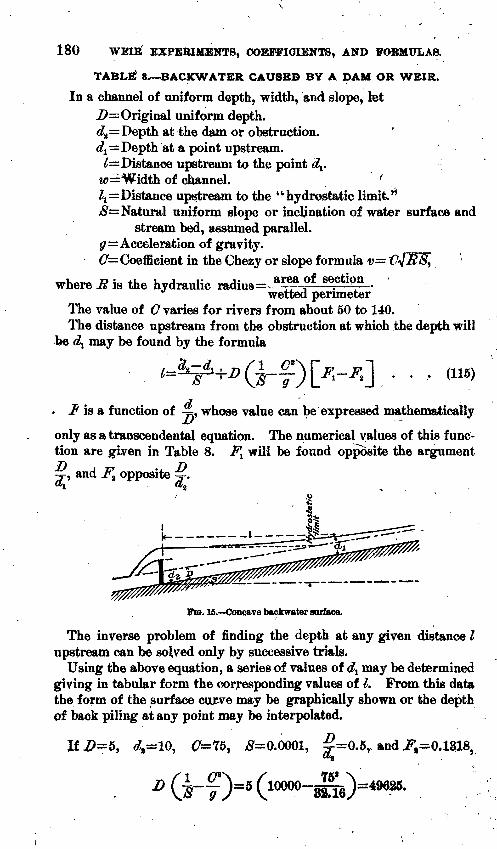
180 WEIK EXPERIMENTS, COEFFICIENTS, AND FORMULAS.
TABLE" s. BACKWATER CAUSED BY A DAM OR WEIR. In a channel of uniform depth, width, and slope, let
D Original uniform depth. d% Depth at the dam or obstruction. <#!=Depth at a point upstream.I Distance upstream to the point dr --
«c==^V?idth of channel. " It Distance upstream to the "hydrostatic limit." £= Natural uniform slope or inclination of water surface and
stream bed, assumed parallel. g=Acceleration of gravity. (7= Coefficient in the Chezy or slope formula v=
where R is the hydraulic radius= *"*?* "!**>* - 'wetted perimeter
The value of G varies for rivers from about 50 to 140. The distance upstream from the obstruction at which the depth will
be dl may be found by the formula
f is a function of -2L whose value can be expressed mathematically
only as a transcendental equation. The numerical values of this func tion are given in Table 8. Fl will be found opposite the argumentD, and
7/5777?
FIG. 15. Concave backwater surface.
The inverse problem of finding the depth at any given distance I upstream can be solved only by successive trials.
Using the above equation, a series of values of may be determined giving in tabular form the corresponding values of 1. From, this data the form of the surface curve may be graphically shown or the depth of back piling at any point may be interpolated.
!£,#=§, <£8=10, #=75, £=0.0001, 5=0.5,x and F*~\
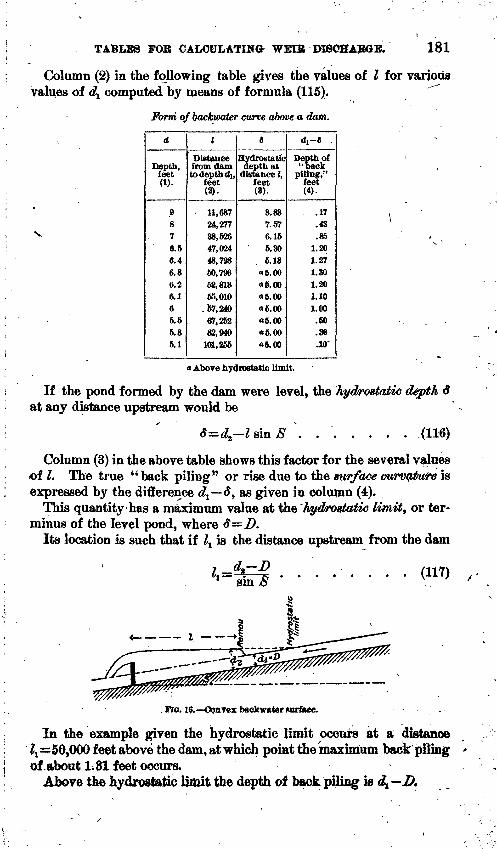
TABLES FOB CALCULATING WEIR DISCHARGE. 181
Column (2) in the following table gives the values of I for various values of d^ computed by means of formula (115). ""
Form of backteater curve above a dam.
d
Depth, feet (1).
9876.56.46.86.26.165.55.85.1
1
Distance from dam to depth dj,
feet (2).
11,68724,27738,52647,02448,79850,79652,8136T..010
.57,24067,25282,940
101,255
8
Hydrostatic depth at
distance I, feet (8).
8.837.576.155.306.18
a 5. 0015.00«5.0015.0015.00a 5. 00a §.00
dj-8 ,
Depth of "back
piling," feet (*)
.17
.43
.851.201.271.301.201.101.00.60.30AST
i Above hydrostatic limit.
If the pond formed by the dam were level, the hydrostatic depth 8 at any distance upstream would be
d=4-Z sin 8 ....... (116)
Column (3) in the above table shows this factor for the several values of I. The true "back piling" or rise due to the surface aurvofatfe is expressed by the difference d^ tf, as given in column (4).
This quantity has a maximum value at th& hydrostatic limit, or ter minus of the level pond, where $=D.
Its location is such that if \ is the distance upstream from the dam
(H7)
. FIG. 16. Convex backwater surface.
In the example given the hydrostatic limit occurs at a distance ^=50,000 feet above the dam, at which point the maximum back piling of about Ii81 feet occurs.
Above the hydrostatic limit the depth of back piling is ^ D,
182 WEIB EXPERIMENTS, COKFlflCISNTB, AND FOBMULAS.
When tf^JL ....... t (118)
the pond surface will not be concave, but a remou or hydraulic jump will occur, having a height
where vl is the mean velocity corresponding to dr To find the dis tance upstream to the point where the jump occurs, solve equation (115) for the value of 4, found by formula {119).
If #=0.004 #=100 ^5=0.008216.
If =5 t0=100
t>i = 100^ 4. 55^A_ = !3t49 f eet ^ second.
Let the depth at the dam be 10 feet; using dt as found above as the terminal depth in formula (115), we obtain
^=0.2578 . ^,=0.1318 Z=630-f (250-311) X 0.126=612.8 feet
The hydrostatic limit in this case is
If the channel above an obstruction consists of successive reaches having different slopes or cross sections, the depth at the head of the first reach or level may be found by the method outlined, and using this as the initial depth <£ a similar solution may be made for the second and succeeding levels.0
a Table 8 has been extended from Breoe'a original tabfe by interpolation. D«noMtratt«» ol tfa» formulas here given may be found in Merriman's or Savvy's Hydmalica. In eueof ft iaU ft 4UtaMB|functioa mast be employed,
TABLES FOB CALCULATING WEIR DISCHARGE. 183
TABLES. Backwater function (F) /or a $QB» or obstruction.
{The colonm headings are hundredtbs for values of from zeraito 0.29, thousandths for values of
torn 0.90 to 0.899, and ten-thousandths for values of -g from 0.909 to 6.999.]
3
0.0:i *^
0.30.31.32.83.34.85.36.87.38.39
0.40741.42.48.44.46.46.47.48.49
0.60.51.62.53.54.56.56.57.58.59
0.60.61.62.63.64.65.66.67.68.69
e
F0.0000.0050.0201
0,0455.0486.0519.0553.0587.0623.0660.0699.0738.0779
0.0821.0865.0909.0995.1003.1052.1102.1154.1207.1262
0.1318' .1376.1485.1497.1560.1625.1692.1761.1832.1905
0.1980.2058.2138.2221.2306.2895.2486.2580.2667.2778
1
F0.0001.0061.0221
0.0458.0489.0522.0556.0591.0627.0664.0703.0742.0783
0.0826.0869.0918.0996.1008.1067.1107.1159.1212.1268
0.1324.1382.1441.1503.1566.1632.1699.1768.1839.1912
0.1988.2066.2146.2230.2315
, .2404.2495.2589.2678.2788
2
F0.0003.0072.0243
0.0461.0493.0526.0560.0594.0630.0668.0707.0746.0787
0.0830.0874.0926.0997.1013.1062.1112.1165.1218.1273
0.1330.1388.1447.1510.1573.1638.1706.1775.1847.1920
0.1996.2074'.2155.2238.2324.2413.2505.2597.2689.2799
9
F0.0005.0085.0266
0.0464.0496.0529.0563.0598.0684.0672.0711.0760.0792
0.0834.0878.0935.0997.1018.1067.1118.1170.1224.1279
0.1335.1394.1454.1516.1580.1645.1713.1782.1854.1928
0.2003.2082.2163.2246.2333.2422.2514.2606.2700-.2810
4
F0.0009.0098.0290
0.0467.0499.0533.0567.0601.0638
, .0676.0715.0754.0796
0.0839.0883.0943.0998.1023.1072.1123.1175.1229.1284
0.1341.1400.1460.1522.1586.1652.1720.1789.1661.1935
0.2011.2090.2171.2255.2342,,2481.2524.2615.2711.2820
S
F0.0013.0113.0314
0.0471.0503.0536.0570.0605.0642.0680.0718.0758.0800
0.0843.0887.0952.0999.1030.1077
".1128.1180.1234.1290
0.1347.1406.1466.1528.1592.1658.1726.1796.1868.1942
0.2019.2098.2180.2264.2350.2440.2533.2624.2722.2830
6
J-
0.0018.0128.0340
0.04740506.6539.0573.0609.0645.0683.0722.0763.0804
0,0847.0891.0961.1000.1032.1082.113d.1186.1240,1296
0.1353^.1411\1472.1535.1599.1665.1733.1804.1876.1950
0.2027.2106.2188.2272.2359.2450.2542.2632.2734.2841
7
F0.0026^045.0367
0.0477.0509.0543.0577.0612.0649.0687.0726.0767.0808
0.0852.0896.0969.1001.'1037.1087.1138.1191.1246.1301
0.1359.1417.1478.1541.1606.1672.1740.1811.1883.1958
0.2035.2114.2196'.2280.2368.2459.2552.2641.2745.2852
8
F0.0034.0162.0395
0.0480.0512.0546.0580.0616.0653.0691.0730.0771.0813
0.0856.0900.0978.1001.1042.1092.1144.1196.1215.1307
0.1364.1423.1485.1547.1612.1679.1747.1818.1890.1965
0.2042.2122.2204.2289.2377.2468.2561.2650.2756.2862
9
F '
0.0042.0181.0425
0.0483.0516.0550.0584.0619.0656.0695.0734.0775.0817
0.0861.0905.0986.1002.1047.1097.1149.1202.1256.1312
0.1370.1429.1491.1554.1618.1685.1754.1825
_.1898.1972
0.5060.2130.2213.2298.2386.2477\2671.2658.2767.2872
J>4»28» O 51-
184 WEIB EXPEKIMENTS, COEFFICIENTS, AHD FORMULAS.
TABLE 8. Baekwater function (F) for a rf#r» or obstruction Continued. "^
[The column headings are httndredths for values of ^ from zero to 0.29, thousandths for values of 5
from 0.30 to 0.899. and ten-tbousandtha for values of ? from 0.90ft4o 0.999, J ^*
D d
0.70.71.72.73.74.75.76.77
-.78
.79
O.SOx.81.82.83.84.85.86.87.88.89
0.900.901,902.903.904.905,906.907.908.909
0.910.911.912.913.914.-$15.916.917.918.919
0.920.921.922.923.924.925.926.927.'928.929.
0
F0.2883.2991.3104.3221.3343,3470.8603.3741.8886.4039
0.4198.4367.4544.4733.4932.5146.5374.5619.5884.6173
0.6489.6522.6556.6590.6626.6660.6695.6730.6766.6802
0.6839.6876.6914.6952.6990.7029.7069.7109.7149.7190
0.7231.7273.7815.7858.7401.7445.7490.7535.7581.7628
1
F0. 2894.3002.3116.3233.3356.3483.8617.3755.3901.4055
0. 4215.4384.4563.4753.4953.5168.5398,5645.5912.6204
0.6492.6525.6559.6594.6629.6664.6698.6784.6770.6806
0.6843.6880.6918.6956.6994.7083.7073.7113.7153.7194
0.7235.7277.7319.7362.7405.7450.7494.7540.7586.7633
2
F0.2905.3013.3127.3245.3368.3496-8680.3770.3916.4070
0.4231.4402.4581.4772.4974.5}91.5422.5671.5940.6235
0.6496.6629.6563.6697.6632.6667.6702.6737.6778.6809
0.6846.6884.6922.6960.6998.7037.7077.7117.7157.7198
0.7239.7281.7324.7367.7410.7454.7499.7544.7590.7637
3
F0.2915.3025.3139.3258.3381.3510.3644.3784.3932.4086
0.4248.4419.4600.4792.4995.5213.5446.5697.5969.6265
0.6499.6532.6566.6600.6636.6670.6706.6741.6777.6813
0.6850.6887.6925.6963.7002.7041-.7081.7121.7161.7202
0.7244.7286.7328.7371.7414.7458.7504.7549.7695.7642
4
F0.2926.3036.3156.3270.3393.3523.3657.3799.3947.4101
0.4264.4437.4618.4811.5016.5236.5470,5723.5997.62%
.6502
.6536
.6570
.6604
.6639
.6674
.6709
.6744
.6780
.6817
0. 6854.6891.6929.6967.7006.7045.7085.2125.7165.7206
0.7248.7290.7832.7375.7419.7463.7508.7553.7600.7647
5
F0.2937.3047.3162.3282.3406.3536.8671.3813.3962.4117
0.4281.4454.4637,4881.5037.5258.6494.6749.6025.6327
0.6506.6539.6573.6608.6642.6678.6712.6748.6784.6820
0.6858.6895.6933.6971.7010.7049.7089.7129.7170.7210
0. 7252.7294.7836.7380.7423.7468.7512.7658.7604.7652
6
F0.2948.3058.3174.3294.8419.3549.3685.3828.3977.4133
0.4298.4472.4666.4851.5059.5281.5519.5776.6055.6859
0.6609.6542v6576.6611.6646.6681.6716.6752.6788.6824
0.6861.6899.6937.6975.7013.7053.7093.7133.7174.7215
fl.7266.7298.7*41.7884.7427..7472.7517.7663.7609.7656
7
F0.2959.3070.3186.8306..3432,3563.3699.3842.3993.4149
0.4315.'4490.4675.4871.5081.5804.5544.5808.6084.6392
0.6512.6646.6580.6614.6650.6684.6720.6755.6791,.6828
0.6866.6903.6941.6979.7017.7057.7097.7187.7178.7219
0.7260.7802.7846.7388.7482.7476.7622.7567.7614.7661
8
F0.2969.3081.3197.3819.8444.3576.8718.3857.4008
K -4166
0.4833.4608.4695.4892.5102.5328.5569.5830.6114.6424
0.6515.6649.6683.6618..6663.6688.6723..6759.6795.6832
0.6869.6906,6944.6982.7021.7081.7101.7141..7182.7223
0.7266.7307.7349.7392.7436.7481.7526.7572.7619.7666
9
F0.2980.8098.8209.3331.3457.3590..3727.3871.4024.4182
0.4850.4526.4714.4912.5124.5851.6694.5857.6148.6457
0.6519.6653.6587.6622.6666.6692.6726.6762.6798.6836
0.6872.6910.6948.6986.7026.7065.7105
^ .7145~ .7186
.7227
0.7269.7811.7854.7397.7441.7486.7530.7576.7623.7670
TABLES FOB CALCULATING WElft DISOHAEGE.1 185
TABLES. Backwater function (F) for a, dam or obstruction Continued.
[Jhe column headings are hundredths for value^of ^from aero to 0.29, thousandths for values of £
frotn 0.30 to 0.899, and ten-thousandths for values of ~ from 0.900 to 0.999.1a
D
0.930.931.932.933.934.935.936.937.938.939
0.940.941.942.943.944.945.946.947.948.949
0.950.951.952.953.954.955.956.957.958
_ .959
0.960.961.962.963.964.965.966.967.968.969
0.970.971.972.973.974.975.976.977.978.979
0
F0.7675.7723.7772.7821.7871.7922.7973.8026.8079.8133
0.8188.8244.8301.8369.8418.8478.8539.8602.8665.8730
0.8795.8863.8931.9002.9073.9147.9221.9298.9876.9457
0.9539.9624.9709.9799.9890.9985
1.00801.01811.02821.0389
1.04971.06101.07271.08481.0974L11051.12411.13831.15311.1686
1
F0.7680.7728.7777.7826%7876.7937.7978.8031.8084,8138
0.8194.8250.8307.8365.8424.8484.8545.8608.^672.8736
0.8802.8870.8938.9009
".9080.9154.9229.9306.9384.9465
0.9548.9632^.9718.9808.9899.99941.00901.01911.0292
'1.0399
1.05081.06221.07891.08611.09871. 11191.12551.13981.15461.1702
2
F0.7685.7724.7782.7831.7881.7932.7984.8037.8090v8144
0.8199.8256.8313.8371.8480.8490.8552.8615.8678.8743
0.8809.8877.8945.9016.9088.9162.9236.9314.9392
^9473
0.9556.9641.9727.9817.9909
1.00041.01001.02011.03031.0410
1.05191.06331.07511.08731.10001.11321.12691.14131.15621.1718
3
F0.7689.7738.7787.7836.7886.7937'.7989.8042.8095.8150
0.8205.8262'.8318'.8377,8436,.8496.8558.8621.8684.8750
.8815
.8883
.8952
.9023 9095.9169.9244.9321.'9400.9482
0.9564.9650.9736.9826.9918
1.00131.01101.02111.03141.0421
1.05301.06461.07631.08861.10131.11481.12841.1427.1. 15781.1735
4
F0.7694.7743.7792.7841.7891.7942.7994.8047.8101.8155
0.8210.8268.8324.8383.8442.8502.8564.b627.8691.8756
0.8822.8890.8959.9030.9103.9177.9252.9329.9408
" .9490
0.9573.9658»9745.9835.9928
1.00231.01201.02211.03241.0432
1.05421.06571.07751.08981.10261.11591.12981.14421.15931.1751
5
F0.7699.7748.7796.7846.7896.7948.8000.8052.8106.8160
0.8216.8274.8330.8388.8448.8508.8670.8634
\869S.8762
0.8829.8897.8966.9038.9110.9184.9260.9337.9416.9498
0.9582.9666.9754.9844.9937
1.00321.01301.02811.03351.0443
1.05531.06681.07881.09111.10401.11781.13121.14571.16081. 1767
6
F0.7704.7752.7801.7851.7902.7^*53.8005.8058.8111.8166
0.8222.8280.8336.8394.8454,8515.8577.8640.8704.8769
0.8886.8904.8974.9045.9117.9191.9267.9345.9425.9506
0.9590.9675
..9763.9854.9947
1.00421.01401.02411.03461.0453
1.05651.06801.08001.09241.1053L11871.13261.14721.16241.1788
7
F0.7709.7757.7806.7856.7907.7958.8010.8063.8117.8172
0.8227.8286.8342.8400.8460.8521.8583.8646.8710.8776
0.8843.8911.8981.9062.9125.9199.9275.9353.9438.9514
0.9598.9684.9772.9863.9956
1.00511.01501.02511.03561.0464
1.05761.06921.08121.0986.1.10861.12001.1340L14871.16401.1799
8.
F0.7713.7762.7811.7861.7912.7963.8015
-.8068.8122.8177
0.8233.8292.8347.8406.8466.8527.8589.8662.8717.8782
0.8849.8917,8988.9059.9132.9206.9283.9360.9441.9523
0.9607.9692.9781.9872.9966
1.00811.01601.02611,03671.0475
1.05871.07041.08241.09491.10791.12141.13S51.15011.16551.1816
9
F0.7718.7767.7816.7866.7917.7968.8021.8074.8128.8182
0.8238.8298.8358,8412.8472.8533.8596.8659.8724.8788
0.8856.8924.8996.9066.9140.9214.9290.9368.9449.9581
0.9616.9700.9790.9881.9976
1.00701.01701.02711.03781.0486
1.05981.07151.08361.09611.1092J..1227L1309 X1.15161.16701.1882
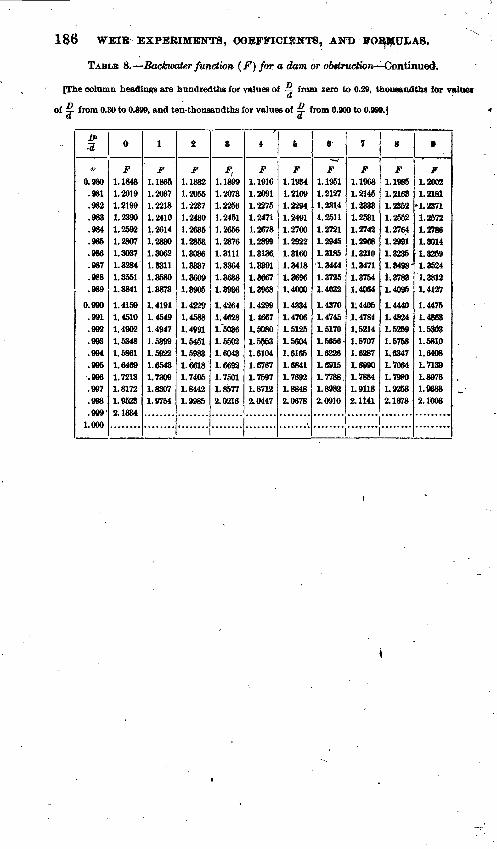
186 WEIB EXPERIMENTS, COEFFICIENTS, AND FORMULAS.
TABLE 8. Backwater function (F) for a dam or obstruction Continued.
[The column headings are hundredths for values of ~ from zero to 0.29, thousandths for values
of £ from 0.30 to 0.899, and ten-thousandths for values of S- from 0.900 to 0.999.1 « a
!*> d
$>
0.980.981.982.983.984.985.986.987.988.989
0.990.991.992.993.994.995.996.997.998
OQO . V9V
1.000
0
F1.18481.20191.21991.23901.25921.28071.30871.32841.35511.3841
1.41591.45101.49021.53481.58611.64691.72131.81721.95239 \93A ft iOO^t
1
F1.18651.20371.22181.24101.26141.28801.30621.83111.35801.3873
1.41941.45491.49471.53991.59221.65431.73091.83071.9754
2
F1.18821.20551.22371.24301.26351.28531.30861.33371.36091.3905
1.42291.45881.49911.54511.59831.66181.74051.84421.9985
8
*,1.18991.20731.22561.24511.26561.28761.31111.33641.36381.3936
1.42641.4628l.~50861.55021.60431.66921.75011.85772.0216
4
F1.19161.20911.22751.24711.26781.28991.31361.33911.36671.3968
1.42991.46671.50801.55531.61041.67671.76971.87122.0447
5
F1.19341.21091.22941.24911.27001.29221.31601.34181.36%1.4000
1.43341.47061.51251.56041.61651.68411.76921.88482.0678
,
6 =3~
F1.19511.21271.23141.25111.27211.29451.31851.34441.37251.4032
1.43701.47451.51701.56561.62261.69151.7788,1.89822.0910
7
F1.19681.21451.23331.25311.27421.29681.32101.84711.37641.4064
1.44053.47841.52141.67071.62871.69901.78841.91182.1141
8
F1.19851.21631.23521.25521.27641.29911.32351,3498-1.37881.4096
1.44401.48241.52691.67681.63471.70641.79SO1.92532.1378
9
F1.20021.2181
'1.28711.25721.27861.30141.82691.35241.38121.4127
1.44751.48681.53031.58101.64081.71891.80761.93682.1608
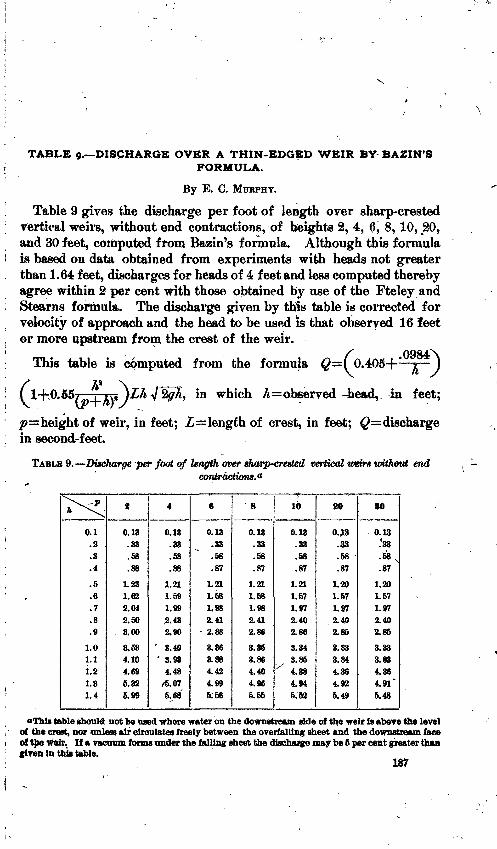
TABLE 9. DISCHARGE OVER A THIN-EDGED WEIR BY BAZIN-SFORMULA.
By E. C. MURPHY.
Table 9 gives the discharge per foot of length over sharp-crested vertical weirs, without end contractions, of heights 2, 4, 6, 8, 10, 20, and 30 feet, computed from Bazin's formula. Although this formula is based on data obtained from experiments with heads not greater than 1.64 feet, discharges for heads of 4 feet and leas computed thereby agree within 2 per cent with those obtained by use of the Fteley and Stearns formula. The discharge given by this table is corrected for velocity of approach and the head to be used is that observed 16 feet or more upstream from the crest of the weir.
This table is computed from the formula
(
<0.40S+.0984\
I-H).55/ ,y JLh «j %gh, in which A = observed -head,
h }
in feet;
p= height of weir, in feet; Z= length of crest, in feet; Q discharge in second-feet.
TABLE 9. Discharge -per foot of length over sharp-crested vertical weirs without end
>-<0.1.2.3.4
.5
.6
.7
.8
.9
1.01.11.21.3L4
it
0.13.33.58.88
1.231.622.042.508.00
8.534.104.695.325.99
4
0.13.38.58.88
1.211.591.99,2.432.90
" 3.40' 3.98
4.48/5.075.68"
6
0.13.33.58.87
1.211.581,982.412.88
3.363.884.424.995:58
8
0.13.33.58.87
1.211.681.982.412.86
3.353.864.404.965.65
~T
10
0.13.33.58.87
1.211.671.972,402.86
3.348.85
X 4.884.945.52
20
043.33.58.87
1.201.571.972.402.85
3.333.844.864.926.49
80
0.13.'38
.68 N
.87
1.20L571.972.402.85
3.383.884.364.91"6.48
«This table should not be used where water on the downstream side of the weir is above the level of the crest, nor unless air circulates freely between the over!ailing sheet and the downstream face of the weir. If a vacuum forms under the falling sheet the discharge may be 6 per cent greater than given in this table.
187
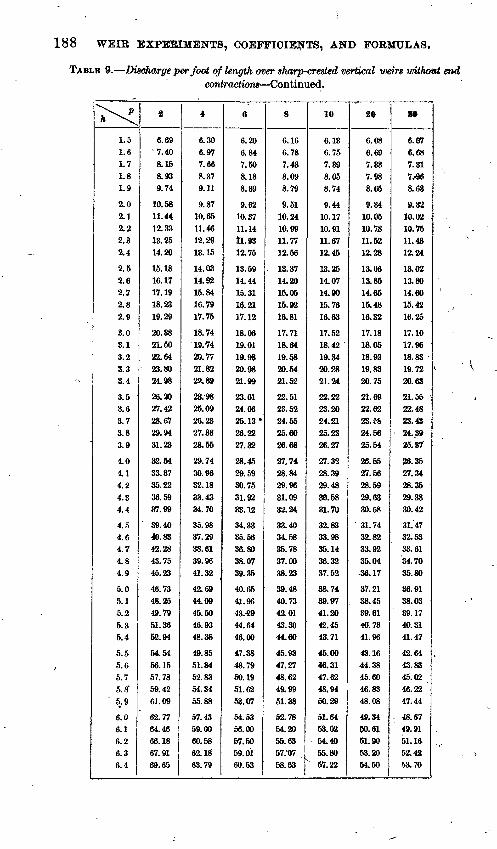
188 WEIR EXPERIMENTS, COEFFICIENTS, AND FORMULAS.
TABLE 9. Discharge per foot of length over sharp-crested vertical weirs withowt end contractions Continued.
"\. p h ^\
1.51.61.71.81.9
2.02.12.22.32.4
2.52.62.72.82.9
3.03.13.2S.3a. 43.53.63.73.83.9
4.04.14.24.34.4
4.54.64.74,84.9
5.05.15.25.35.4
5.55.65.75.8'
5.9
6.06.16.26.36.4
2
6.69'7.40
8.168.939.74
10.5811.4412.3313.2514.20
15.1816.1717.1918.2319.29
20.8821.6022.6423.8024.98
26,2027.4228.6729.9431.23
32.5433.8735.2236.5937.99
39.4040.8342.2843.7545.23
48.7348.2649.7951.8662.94
64.5456.1657.7859.4261.09
62.7764.4666.1867.9169.65
4
6.306.977.668.379.11
9.8710.6511.4612.2913.15
14.0314.9215.8416.7917.75
18.7419.7420.7721.8222.89
28.9826.0926.2327.3828.65
29.7430.%32.1833.4334.70
35.9837.2938.6139.9641.32
42.6944.0945.6046.9348.38
49.8551.8452.8354.3455.88
57.4359.0060.5862.1863.79
6
6.206.847.508.188.89
9.6210.3711.1411.9312.75
13.5914.4415.3116.2117.12
18.0619.0119.9820.9821.99
23.0124.0626.13*26.2227.32
28.4529.5930.7531.9233.12
34.3335.5636.8038.0739.36
40.6541.9643.4944.6446.00
47.3848.7950.1951.6253.07
54.5356.0067.6059.0160.53
8
6.166.787.438.098.79
9.5110.2410.9911.7712.56
. 13.3714.2015.0615.9216.81
17.7118.6419.5820.5421.52
22.5123.5224.5526.6026.66
27,7428.8429.9631.0932.24
33.4034.5835.7837.0038.23
39.4840.7342.0143.3044.60
46.9347.2748.6249.9951.38
52.7854.2055.6357.-0758.53
10
6.136.757.398.058.74
9.4410.1710.9111.6712.45
13.2514.0714.9015.7616.63
17.5218.4219.3420.2821.24
22.2223.2024.2125.2326.27
27.3228.3929.4830.5831.70
32.8333.9836.1436.3237.52
38.7439.9741.2042.4548.71
46.0046.3147.6248.9450.29
51.6453.0254.4066.80
" 57.22
20
6.086.697.337.988.65
9.3410.0510. 7S11.6212.28
13.0613.8514.6515.4816.32
17.1818.0518.9319.8320.75
21.6922:6223. fS24.5626.54
26.6627.6628.5929.6330.68
31.7432.8233.9236.0436.17
37.2138.4539.6140.7841.96
43.1644.38.45.6046.8348.08
49.3450.6151.9053.2054.50
80
6.076.687.317.468.63
9.3210.02 .10.7611.4812.24
13.0213.8014.6015.4216.25
17.1017.9618.8319.7220.63
21.55 '22.4823.4324.3925. sr26.3627.3428.3629.3830.42
31.4732.6333.61'34.7035.80
36.9138.0339.1740.3141.47
42.6443.8345.0246.2247.44
48,6749.9151.1652.4253.70
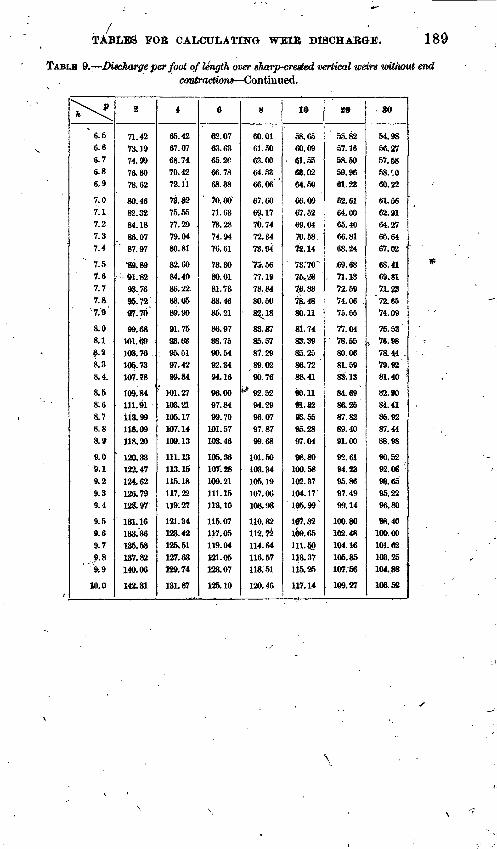
FOB CALCITLATING WEIB DtSCHABGE. 180
TABLE 9. Discharge per foot of length over sharp-crested vertical weirs wtthovA end contractions Continued.
^^" 6.5
6.6C.76.86.9
7.07.17.27.37.4
" 7.51.S7.7?; 87.9
8.Q8.18.28.38.4.
8.58.68.78.88.9
9.09.19,29.39.4
9.59.69.79.89.9
10. 0
2
71.4273.1974. 9976.8078.62
80.4682.3284.1886.0787.97
m89*n.«298.7695.7297.70
99.68101.^9108,70105.7310O8
109.84ui.m118.99116.09118.%
120.33122.47124.62126.79128". 97
181.16133.36135.58137.82140.06
142.31
4
65.4267.0768.7470.4272.11
73.8275.5577.29 .79.0480.81
82.6084.4086.22.88.0589.90
91.7593.6395.5197.4299.34
101.27r 108.21
105.17107.14109.13
11L13113.15115.18117.22119:27
121.34123.42125,51127.63129.74
131.87
6
62.0763.6365.2066.7868.38
' 70.0071.6378.2874.9476.61
78.3080.0181.7383.4685.21
86.9788.7590.5492.3494.16
96.0097.8499.70
101.57103.46
105.3610K48109.21111. 15113.10
115.07117.05119.04121.05123.07
125.10
8
60.0161.5063.0064.5366.06 *
67.6069.1770.7472.3478.94
75.5677.1978.8480.5082^18
88.8785.5787.29
,89.0290.76
** 92.52
94.2996.0797.8799.68
101.60103.34105.19107.06108.93
110.82112.72114.64116.57118.51
120.46
10
58.6560.0961.5563.0264.50
66.0067.5269.0470.58.73.14
73:70'76,28T6.887&4880.11
81.7483.39«5.2586.7288.41
».ll91.8238.5595.2897.04
98.80100.58102.37104.17105.99
If?. 82109.65111.®..113.37116,26
117.14
20
55.8257.1658.5059.96«1.23
62.6164.0065.4066.8168.24
.69.6171. IS72.5974.06 .75.55
77.04; 78.65
80.0681.698&13
84.6986.2587.8289.4091.00
92.6194.2395.8697.4999.14
100. 80102.48104.16105.86107r56
109.27
SO
54.9866.2757.6858. CO60.22
61.5662.9164.2765.6467:02
68.4169,8171.23
"72.6574.09
75.53^ 76.98
78.44 .79.92SI. 40 ''
82.9084.4185.9287.4488.98
90.5292.08 98.6595.2296.80
98.40100.09101.62103.2510488
106.52
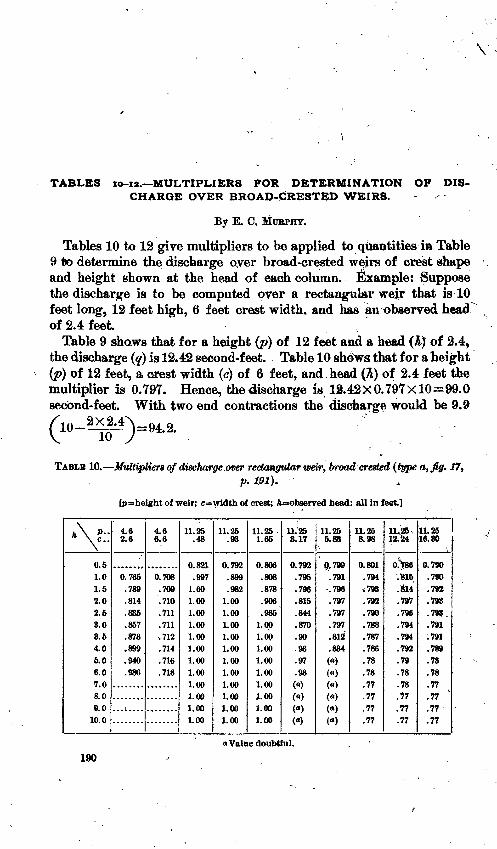
TABLES 10-12. MULTIPLIERS FOR DETERMINATION OP DIS CHARGE OVER BROAD-CRESTED WEIRS. s-
By E. C, MUBPHY.
Tables 10 to 12 give multipliers to be applied to quantities in Table 9 to determine the discharge oyer broad-crested wejirs of crest shape and height shown at the head of each column. Example: Suppose the discharge is to be computed over a rectangular weir that is 10 feet long, 12 feet high, 6 feet crest width, and has an observed head of 2.4 feet ;
Table 9 shows that for a height (p) of 12 feet and a bead (A) of 2.4, the discharge (j) is 12.42 second-feet. Table 10 shews that for a height (p) of 12 feet, a crest width (<?) of 6 feet, and head (A) of 2.4 feet the multiplier is 0.797. Hence, the discharge as, 12.42X0.797x10=99.0 second-feet. With two end contractions the discharge would be 9.9
=94.2.
TABLE 10. Multipliers of discharge. over rectangular weir, broadcrested {type a, fy. ¥7,
[p=height of weir; c= width of crest; ft=observed head: all in feet.] v0.51.01.52.02.63.08.54.06.06.0 7.08.09.0
10.0
4.6 2.6
0.765.789.814.835.857.878.899.940.986
4.6 6.6
0.708.709.710.711.711.712.714.716.718
11.25 .48
0.821.997
1,601.001.001.001.001.001.001.00 1.001.001.001.00
11.25 .93
0.792ftOO
* O00
.9821.001.001.001.001.001.001.00 1.001.001.001.00
11.25 1.65
0.806.808.878.906.985
1.001.001.001.001.00 1.001.001.001.00
11.25 3.17
0.792.795.796.8*5.844.870.90.93.97.98 («)(«)(«)(«)
11.25 5.88
0.799.791
-.796.797.797.797.812.834(«)(«) («)(«)(«)(«»)
11.25 8.98
0.801.794,798.792.790.788.787.786.78.78.77.77.77.77
11,26\ 12.24
O.W.816.814.797.796.794.794.792.79.78 .78.77.77.77
11.25 16.30
0.790.790.792.793.798,791.791.789.78.78 .77.77.77.77
Value doubtful.
190
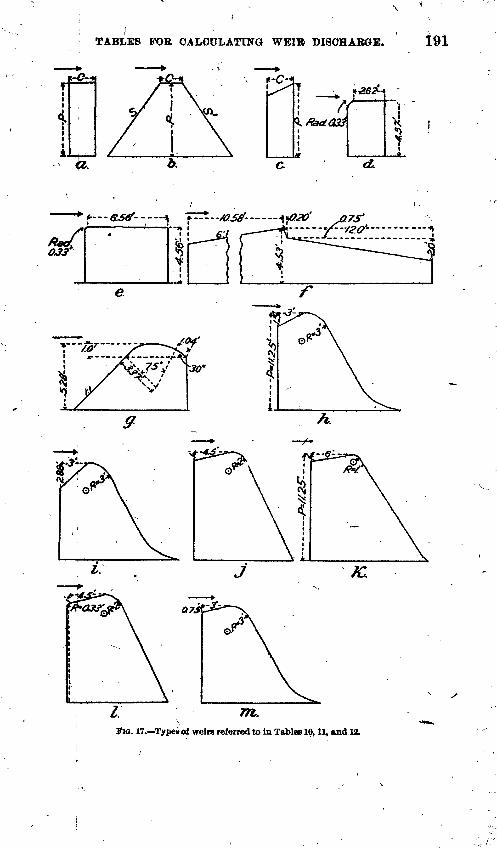
TABLES FOR CALCULATING WEIB DISCHARGE.
Ai
\«Q20' »?3' k '/^--w - - +iV^j.--..^ --------- -- »
FIG. 17. Types of weirs referred to in Tables 10,11, and 12.
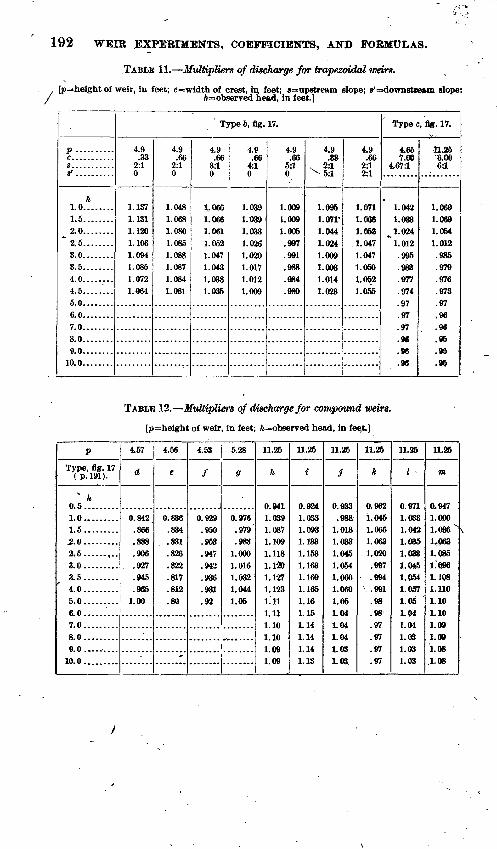
192 WEIR EXPERIMENTS, COEFFICIENTS, AND FORMULAS.
TABLE 11. Multipliers of discharge for trapezoidal weir*.
, [p=height of weir, In feet; e=widtfa of crest, In feet; *=up8tream slope; 8'=downstream slope; / A=observed head, In feet.]
p ..........
«' ..........
h 1.0........1.5........2.0........
"~2.5........3.0........3.6........4.0........4.6........5.0........6.0........7.0........8.0........9.0........
10.0........
Type 6, %. 17.
4.9 .33
2:1 0
1.137 1.131 1.120 1.106 1.094 1.086 1.072 1.064
4.9 .66
2:1 0
1.048 1.068 1.080 1.085 1.088 1.087 1.084 1.081
4.9 .66
3:1 0
1.066 1.066 1.061 1.052 1.047 1.043 1.038 1.035
4.9 .66
4:1 0
1.039 1.039'
1.033 1.026 1.020 1.017 1.012 1.009
4.9 .66
5:1 0
1.009 1.009 1.005 .997 .991 .988 .984 .980
4.9 .83
, 2:1 \5:1
1.095 1.071-
1.044 1.024 1.009 1.003 1.014 1.023
4.9 .66
2:1 2:1
1.071 1.066 1.053 1.047 1.047 1.050 1.052 1.055
Type c, %. 17.v v
4.66 7.00
4.67:1
1.042 1.033
^1.024 * 1.012
.996
.983
.977
.974
.97
.97
.97
.96
.96
.96
n.26 8.00 6:1
1,060 1.069 1.054 1.012 .985 .979 .976 .973 .97 .96 .96 .95 .95 .95
TABLE 12. Multipliers of discharge for compound weirs,
[p=height of weir, In feet; A=observed head, In feejt.J
PType, fig. 17
(p. 191).
" A
0.6.........1.0......... 1.5.........^.0. ........2.5.....,,..3.0.........3.5.........4.0.........6.0.........6.0.........7.0.........8.0.........9.0. .....
10.0.........
4.67
d
0.842 .866.888.906
, .927(Ml
.9651.00
4.56
e
0.836 .834.831.826.822.817.812.80
'
4.53
/
........I0.929
.950
.953
.947
.942936
.931
.92
5.28
ff
0.976 .979.988
1.0001.0161.0321.0441.05
11.25
h
0 011
1.039 1.0871.1091.1181.1ft1.1271.1231.111.111.101.101.091.09
11.25
i
0.9241.033 1.0931.1331.1531.1631.1691.1651.161.161.141.141.141.13
11.26
3
0.933.988
1.0181.0331.0451.0541.0601.0601.05i ni1.041.041.031.03
11.25
k
0.9621.045 1.0661.0631.020
.997
.994V .991
.98
.98
.97
.97
.97
.97
11.26
I
0.9711.033 1.0421.0351.0331.0451 0541.0571.061.041.041.031.031.03
11.26
TO
0.9471.000 1.036"I<fi631.0851.0961.1081.1101.101.101.091.091.081.08
INDEX.
Page. Albion, Mass., dam.at, flow over........... 182Angular w^irs. See Weirs, angular. Approach, channel of. See Channel of ap- proach.
section ;o£, definition of................. 7velocity of. See Velocity of approach.
Austin, Tex., dam at, flow over............ 133Authorities cited, list of ........*........... 10
Backwater,depth of...................... 180-182depth Qf, figures showing ............ 180,181
table showing.................... 183-186Bazin, H., base formula of.................. 9
coefficients of, for thin-edged weirs.... 61plate showing...................... 32
correction of, for velocity of approach. 63-65 experiments of, on effect of rouuding
upstream crest edge............ 123" on submerged weirs of irregular
section ....................... 143-144on thin-edged weitai............... 29-81on trapezoidal weirs............'....' 127on triangular weirs............... 124-126on Weirs of irregular cross section.. 63-85 on weirs with compound slopes.. 127-128 on weirs with Varying, upstream
slopes......................... 128-129pl*te showing.'..................... 66
formula of, comparison of, with otherformulas........................ 40-42
for submerged weirs.............. 141-142for thin-edged weirs........ 31-34,187-189for weirs with end contraction, use
of..................!............- 45formulas and experiments of, on broad-
Crested weM.................. 117-119Bellasis, > on falls................ ...I...... 135Blackstone River, dam on, flow oyer....... 132BJackwell, T. E., experiments of, on broad-
crested weirs...^........ 112-114,122Boileau, P., experiments of, on thin-crested
;weirs ........... ......:'... ...... 21-22formula of, compared with other for
mulas .......................... 40-41Broad-crested weirs. See Weirs, broad-
' crested. /
\ Castel, M., experiments of, on thin-crested
weirs........................... 20-21" formula of, compared with other for
mulas ......./.................. 40-41Chambly dam, model of, experiments on.. 101
Page, Channel, leading, definition of............. 7Channel of approach, definition of......... 7
depth of, for weir gaging............... 50energy in, distribution of .............. 17-20velocity in, distribution of............. 16-17
Chanoine and Mary, formula of, for sub merged weirs................... £40
Cippolettt, Cesare, formula of, for trape zoidal weirs ................... 48-49
weir of, definition of................... 47-48Clegg'sdam, flow over..................... 112Coefficients, relations of.................... 9Compound weirs, flow over............ . 46Contracted weirs, definition of............. 7Contraction, crest, definition of............ 8Contraction, end, formula for.............. 44-45Contraction, vertical, definition of......... 8
effect of................................. 13-14Cornell University, hydraulic laboratory of,
. description of.... .............. 86-87hydraulic laboratory of, experiments. .
at........................... 39,85-107experiments at, plate showing..... 86
Crest,'character of. ..-..................... 52roughness of, corrections for......... 133-134
Crest, contraction, definition of............ . 8Croton dam, crest of, correction for........ 134
model of, flow over, experiments on..". 90-94 flow over, experiments on, plate
showing........................ 94
Dams, backwater caused by, depth of.... 180-182.backwater caused by, depth of, table
showing ...................... 183-186Dams, actual, flow over, experiments oh.. 131-133
flow over, experiments on, plate show ing............................:. 132
Dams, model, crest of, correction for........ 133 flow over, experiments on.............. 88-90
Dams, submerged, data .concerning ......144-145D*Aubuisson, J. F-, formula of ............... 21Deep Waterways, TI. S. Board of Engineers
on, experiments of, on sub merged weirs................... 146
experiments of, on weirs-of irregularsection'......................... 85-80
on weirs with varying upstreamslopes......................... 128-130
plate showing...................... 90formula of, for broad-crested weirs... 121-122
Definitions of terms........................ 7-8Desplaines Elver dam, flow over........... 112Dimensions, methods of expressing........ 8
193
194 INDEX.
Page. Dolgeville dam, model of, experiments
on......................;....... 102Dyas, , formula of, for submerged weirs.. 143 Dyer, C. W. D., and Flinn, A. D., experi
ments of...................._. 45,48
East Indies, engineers of, formulas of, for7brood-crested weirs ...... 114-116,121
formulas of, for thin-edged weirs....... 22,40submerged dams in, data concern
ing ........................... 144-145Energy, distribution of, in channel of ap
proach.......................... 17-20Error, eflEecFbf, in determining head....... 53Essex County, dam of, model of, experiments
on............................ 107-109
Falls, flow over............................. 135flowover, figure showing .............. 135
Farm Pond, Mass., experiments on thin- edged weirs at.................. 28
Flinn, A. D., and Dyer, C. W. D., experi ments of.........I.............. 45,48
Flow, method of expressing................ 8Formulas, comparison of................... 40-42
Itrtof:.................................. 9Francis, J: B., base formula of ............. 9
experiments and formulas of, for thin- crested weirs ................... 23-26
formula of, compared with other formu las.............................. 40
discharge by, table stowing...... 162-171for end contractions................ 44for weirs of irregular cross sections. 62
weir of, diagram showing.............. 51Francis, J. B., and Smith, H., formula of,
for thin-edged weirs............ 87Francis, J. B., Stearns, F. P., and Fteley,
A., formula of, for thin-edged weirs.................. 26,29,84,40-41
Freeman, J.R., experiments of ............ 90-94Frizell, J. P., formula of, for broad-crested
weirs ......................... 110-112Fteley and Steams. See Stearns and Fteley. Fteley, A., Stearns, F. P., and Francis, J.
B., formula of, for thin-edged weirs................_ 26,29,84,40-41
Gaging, accuracy of........................ 58-58requirements for....................... 49-5?
Geological Survey, United States, experi ments of, on broad-crested weirs......................... 119-121
experiments of, on rounding upstreamedge.......................... 123,124
on weirs of irregular section....... 98-107on weirs with varying slopes....... 130plate/showing.............._..... 10B
Gould, B. L., formula of, for dischargefrom nonprismatic reservoir.... 154
formula of, for discharge from pris matic reservoir............... 150-152
Gould, E. 8., formula of, for dischargefrom prismatic reservoir ..... 151-152
Hart and Hunking, formula of, for thin- edged weirs.................... 25-26
Head, determination of, error in, effect of. 53-67 determination of, error in, effect of,
plate showing.................4 54effect of velocities on, table showing. 157-159 increase in, effect of.................... 39-40
from submerged weir............. 142-143variation in ...................... 53-54,97-98
diagram showing............... . 150effect of........................... 146-156
Herschel, C., formula of, for submergedweirs......................... 189-140
Horton, R. E., experiments of............. 95-107Hunking and Hart, formula of, for thin-
edged weirs .................... 25-26
Inclined weirs. See Weirs, inclined.India. See East Indies.Inflow, effect of, on reservoir. ..........^. 148-166
Johnston, T. T., on flow over DesplainesRiver dam...................... 112-
Lawrenee, Mass., dam at, model of, experi-} mentson..................... 107-109
dam at, model of, experiments on, plateshowing........................ 106
Leading channel, definition of.:....... . 7Lesbros, experiments of, on thin-edged
\ weirs....'....................... 21formulas of, compared with other for
mulas........................... 41Lesbros and Poneelet, experiments of, on
thin-edged weirs................ 21Lowell, Mass., experiments at.....'. 23-26,107-109
Merrimac River, dam on, experiments on.. 106 \ dam on, experiments on, plate showing. 108
Metz, Germany, experiments on thin-edgedweirsat........w................ 21-22
Morris, Elwood, on Clegg's dam............ 112Murphy, E. C,, tables by, of discharge over
thin-edged and broad-crested weirs......................... 187-192
Muskingum River, dam on, flow over...... 182
Nappe, definition of............ ........... 7form of, modifications of............... 60-61
modifications of, plate showing.... 60Nelles, George T., data collected by........ 131Notation, explanation of... .......... 8-9
O'Connell, P. P.L., formula of, for dischargefrom nonprismatic reservoir.... 168
Orifice, flow through.............. ...... 12-13flow through, figure showing........... 12
Ottawa River dam, Canada, flow over ..... 182
Parabolic law of velocity, application of, toweirs........................... 12
Parmley, W. C., formula of, compared with v other formulas..... r........... 40-41formula of, for thin-edged weirs.'.. . 87-88
Plattsburg dam, model of, experiments on. 98-100 Poneelet and Lesbros, experiments of, on
thin-edged weirs............... 21Rafter, Q. W., experiments of.............. 85-90Rankine, W. J., formula of, lor submerged
weirs........................... 142
INDEX 195
Reservoirs, loweringof, time required for. 146-166 Rblnd,R.H.,formalaof,forsubmergedweirs . 141
Section of approach definition of.......... 7Sharp-crest ad weirs, definition of.......... 7Smith, Hamilton, base formula of......... i 9
formula of, for thin-edged weirs....... 22,34-86,40-41,44
Smith, H., and Francis, 3. B., formula of,for thin-edged weirs............ 37
Stearns, P.p., and Fteley, A., base formulaOf............................... 9
experiments of, on broad-crestedweirs......................... 116-117
on lonnding upper crest......... 122-124on thin-edged weirs................ 26-29
formula of, compared with other formu las.............................. 40-41
for Submerged weirs ............. 138-139for thin-edged weirs ............... 84
Stearns, F. P., Fteley, A., and Francis, J.B.,formula of, for thin-edged weirs. 26,
29,34,40-41Submerged weirs. See Weirs, submerged. Suppressed weirs, definition of............. 7
Thin-edged weirs. See Weirs, thin-edged.Thomson, James, experiments of, on coeffi
cient of contraction for thin- edged weirs ...... ........^..... 46-47
Three-halves powers, table of............ 171-176TorricellLG.,theory of.................... 10-il
theory of, application of, to weir, figureShowing... .................. 11
Toulouse, France, experiments at, on thin- edged weirs.................... 20-21
Trapezoidal1 weirs. See Weirs, trapezoidal.Triangular weirs. See Weirs, triangular.
United States Board of Engineers on Deep Waterways. See Deep Water ways.
United States Geological Survey. Se? Geo logical Survey.
Unwin, W. C., formula of, for broad-crestedweirs......................... 110-112
Velocities, method of expressing........... "" 8Velocity, parabolic law of, application .of.. 12 Velocity of approach, distribution of.'.... 16-17
distribution of, figure showing......... 16effect of, on weir discharge......... 14-20,58
correction for........... 14-16,41-43,63-66table showing (Hnnking and
Bart formula)................ 26table showing (Parmley and
Bazin formula)............... 38table showing.................... 159-162
energy of,distribution of............... 17-30, formulas for. .. v :...................... 14-20
head due to, table showing........... 167-159Vertical contraction. See Contraction, ver
tical.
Weirs, aprons of, variation in, effect of . . . backwater caused by, depth of . ......
table showing.... ................definltionof. ......... ................discharge over, relative approximate
variation in. ...... .........., .'. diagram showing.... .........
flow over, calculation of, tables for _ measurement of, formulas for
124-127 180-182 183-186
.. 7
.. 10-11 146-154
.. 150 156-192 9-12, .
Weir section, definition of. 8
theory of ............ ............... 10-14gaging at. See Gaging. head on. See Head.
Weirs, angular, flow over .................. 18$flow over, figure showing.... ....... 186
Weirs, broad-crested, edge of, rounding of,effectof.. ....................... 124
flow over.......... ................... 110-122figure showing .......... ........ 110tableshowing. ........... 177-179,190-192
Weirs, compound, flow over.... .... ........ 46Weirs, contracted, definition of ......... ... '7Weirs, eucved,nowover..........i......... 186
flow over, figure showing .............. 136Weirs, East Indian, flow over............ 144-145
flow over, figures showing.............. 145Weirs, flat-top, models of, experiments on. 103-105 Weirs, inclined, flow over. ............... 127-130
flow over, figure showing ... ........... 57Weirs,Irregular,flowover,experimentson. 61-110
flow over, formulas for, basic ... _ . 62-63 use of................................... 59
Weirs, of sensible crest width, flow over... ,52 Weirs* ogee cross-sectioned, flow over. . . . 130-131
flow over, plate showing....... ........ 130Weirs, submerged, flow over .......... 135-146
flow over, figure showing .............. 137Increase of head due to .......... 142-148
Weirs, suppressed, definition of ........ ... . 7Weirs, thin-edged, definition of ............ 7
discharge over, tables ........ 162-171, 187-189flow over, measurement of, experiments
on and formulas for...... 20-29,31-46measurement of, formulas for, compari
son of........................... 40-41formulas. for, extension of.......... 39-40
Weirs, trapezoidal, aprons of, variation in,effectof.. ............ ..... 127
cross-section of. ..................^, 47flow over, formulas for, figures showing. ^~
formulas for . ............ . . 47Weirs, triangular, aprons of, variation .in,
effectof....................... 124-126coefficient curve for, figure showing ... 125 flow over, experiments on, figure show
ing ............................. 46experiments on and formulas for .. 46-47
Weirs, uneven, flow over.. ............ .. 57-58Weisbach, formula of........ ............... 40' ' Wetted underneath," definition of ....... 7Williams, 6. 8., experiments by........... 90-107Woodman, R, S., formula of, for discharge
from prismatic reservoir...... 151-162
CLASSIFICATION OP THi PUBMCAHONS OF THE TOHB STATES GEOLOGICAL £ SURVEY.
[Water-Sui&ply Paper No. 200. J
The serial publications of the United States Geological Survey consist of (1) Annual Reports, (2) Monographs, (3) Professional Papers, (4) Bulletins; (5) Mineral Resources, (6) Water-Supply and Irrigation Papers, (7) Topographic Atlas of United States folios and separate sheets thereof, (8) Geologic Atlas of the United States folios thereof. The classes numbered 2, 7, and 8 are sold at cost of publica tion; the others are distributed free. A circular giving complete lists may be had on application. ' ,#-
Most of the above publications may be obtained or consulted in the following ways:1. A limited number are delivered to the Director of the Survey, from whom thej^
may be obtained, free of charge (except classes 2, 7, and 8),,on application.2. A certain number are delivered to Senators and Representatives in Congress,
for distribution.3. Other copies are deposited with the Superintendent of Documents, Washington,
D. C., from whom they may be had at prices slightly above cost.4. Copies of-all Government publications are furnished to the principal public
libraries in the large cities throughout the United States, where they may be con sulted by those interested. -
The Professional Papers, Bulletins, and Water-Supply Papers treat of a variety of subjects, and the total number issued is large. They have therefore been classifies1 into the following series: A, Economic geology; B, Descriptive geology; C, System atic geology and paleontology; D, Petrography and mineralogy; E, Chemistry and physics; F, Geography; G, Miscellaneous; H, Forestry; I, Irrigation; J, Water storage; K, Pumping water; L, Quality of water; M, 6eneral«hydrographic investi gations; N, Water power; 0, Underground waters; P, Hydrographic progress reports. This paper is the twenty-fourth in Series M, the complete list of which follows (PP=Professional Paper; B=Bulletin; WS= Water-Supply Paper):
SERIES M GENERAL HYDBOGBAPHIC INVESTIGATIONS.~ WS 56. Methods of stream measurement. 1901. 51 pp., 12 pis.
WS 64. Accuracy of stream measurements, by £. C. Murphy. 1902. 99 pp., 4 pis. WS 76. Observations on the flow of rivers in the vicinity of New York City, by%. A. Pressey. 1902.
108pp., IS pis.WS 80. The relation of rainfall to run-off, by G. W. Rafter. 1903. 104 pp. ' WS 81. California hydrography, by J. B. Lipplncott. "1903. 488 pp., 1 pi. WS 88. The Passaic dood of 1902, by 6. B. Hollister and M. O. Leighton. 1903. 56 pp., IS pis. WS 91. Natural features and economfb development of the Sandusky, Maumee, Muskingum, and
~~ Miami drainage areas in Ohio, by B. H. Flynn and H. 8. Flynn. 1904. 130 pp. WS 92. The Passaic flood of 1903, by M, O. Leighton. 1904. 48 pp., 7 pis. WS 94. Hydrographic manual of the United States Geological Survey, prepared by E. C. Murphy,
J.C. Hoyt, and G.B. Hollister. 1904. 76pp., 8 pis.WB 96. Accuracy of stream measurements (second edition), by E. C. Murphy. 1904. 169 pp., 6 pis. WS 96. Destructive floods in the United Slates in 1908, by E. C. Murphy. 1904. 81 pp., IS pis. WS 106. Water resources of the Philadelphia district, by Florence Bascom. 1904. 75 pp., 4 pis. WS 109. Hydrography of the Snsquehanna River drainage basin, by J. C. Hoy* and R. H. Anderaon,
1904. 215 pp., 28 pis.WS 116. Water resources near Santa Barbara, California, by J. B. Lippincott. 1904. 99 pp., 8 pis. WS 147. Destructive floods in ,the United Slates in 1904, by E. C. Murphy and others. 1905. 206 pp.,
18 pis.WS 160. Weir experiments, coefficients, and formulas, by R. E. Horton. 1906. 189 pp., 38 pis. (Oat
of stock. Revised and reprinted as No. 200.)
II SERIES LIST,
WS162. Destructive floods in the United States in 190$ by E. G. Murphy and others. 1906. 105 pp.,4 pis.
W8180. Turbine water-wheel tests and power tables, by Robert E. Hortou. 1906. 184pp., a pie. (Outof stock.)
WS 187. Determination of stream flow during the frozen season, by H. K."Barrows and Robert £.Horton. 1907. 98 pp., 1 pi. ,
WS 192. The Potomac River basin: Geographic history rainfall and stream flow pollution, typhoidfever, and character of water relation of soils and forest co$*r to quality and quantity ofsurface water effect of industrial wastes on fishes, by H. H. Parser, Bailey Willis, R. H.Bolster, W. W. Ashe, and M. G. March. 1907. 364pp., 10 pis.
WS 196. Water supply of Nome region, Seward Peninsula, Alaska, 1906, by J. G. Hoyt and. F. F. Hen-ahaw. 1607. 52 pp., 6 pis. -
WS 197. Water resources of 6eorgia,«by B. M. and H. R. Hall. 1907. pp., 1 pi. WS 198. Water resources of Kennebec River basin, Maine, by H. K. Barrows, with a section on the
quality of Kennebec River water, by George C. Whipple. 1907. pp., 7 pis. W8200. Weir experiments, coefficients, and formulas (second edition), by R.E. Horton. 1907, 196pp.,
38 pis.
Correspondence should be addressed toTHR DIBECTOE,
UNITED STATES GEOLOGICAL SURVEY,WASHINGTON, D. C.
MARCH, 1907.U. S. GOVERNMENT FWNTING OFFICE: O J9SI