Embed Size (px)
Citation preview

Westdale Mall Market Analysis AECOM Economics
October 2013
Executive Summary
Page 2
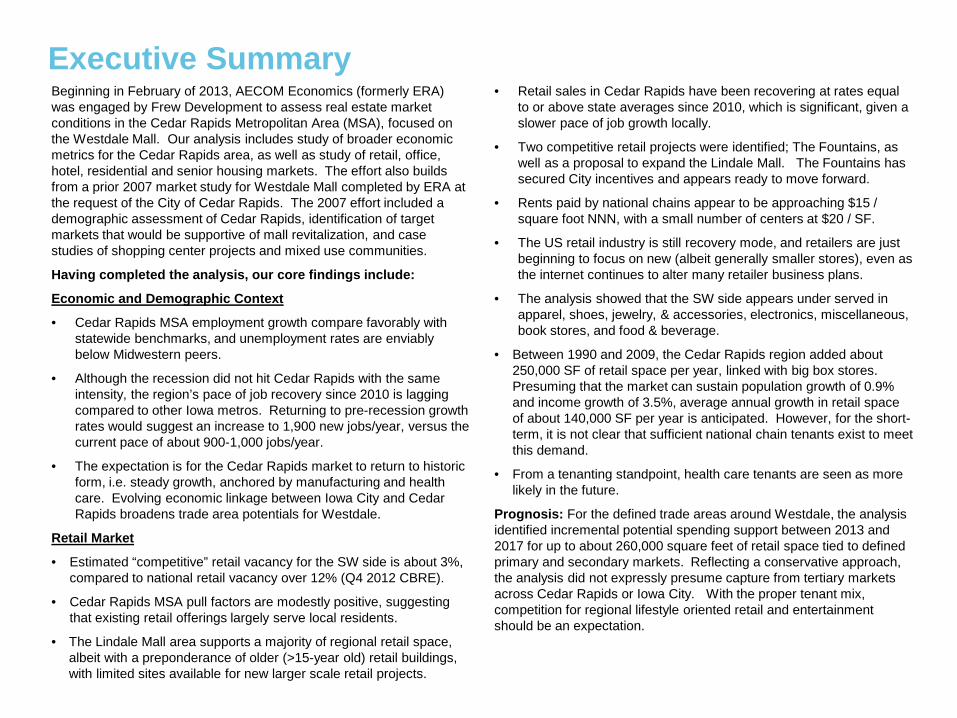
Beginning in February of 2013, AECOM Economics (formerly ERA) was engaged by Frew Development to assess real estate market conditions in the Cedar Rapids Metropolitan Area (MSA), focused on the Westdale Mall. Our analysis includes study of broader economic metrics for the Cedar Rapids area, as well as study of retail, office, hotel, residential and senior housing markets. The effort also builds from a prior 2007 market study for Westdale Mall completed by ERA at the request of the City of Cedar Rapids. The 2007 effort included a demographic assessment of Cedar Rapids, identification of target markets that would be supportive of mall revitalization, and case studies of shopping center projects and mixed use communities.
Having completed the analysis, our core findings include:
Economic and Demographic Context
• Cedar Rapids MSA employment growth compare favorably with statewide benchmarks, and unemployment rates are enviably below Midwestern peers.
• Although the recession did not hit Cedar Rapids with the same intensity, the region’s pace of job recovery since 2010 is lagging compared to other Iowa metros. Returning to pre-recession growth rates would suggest an increase to 1,900 new jobs/year, versus the current pace of about 900-1,000 jobs/year.
• The expectation is for the Cedar Rapids market to return to historic form, i.e. steady growth, anchored by manufacturing and health care. Evolving economic linkage between Iowa City and Cedar Rapids broadens trade area potentials for Westdale.
Retail Market
• Estimated “competitive” retail vacancy for the SW side is about 3%, compared to national retail vacancy over 12% (Q4 2012 CBRE).
• Cedar Rapids MSA pull factors are modestly positive, suggesting that existing retail offerings largely serve local residents.
• The Lindale Mall area supports a majority of regional retail space, albeit with a preponderance of older (>15-year old) retail buildings, with limited sites available for new larger scale retail projects.
• Retail sales in Cedar Rapids have been recovering at rates equal to or above state averages since 2010, which is significant, given a slower pace of job growth locally.
• Two competitive retail projects were identified; The Fountains, as well as a proposal to expand the Lindale Mall. The Fountains has secured City incentives and appears ready to move forward.
• Rents paid by national chains appear to be approaching $15 / square foot NNN, with a small number of centers at $20 / SF.
• The US retail industry is still recovery mode, and retailers are just beginning to focus on new (albeit generally smaller stores), even as the internet continues to alter many retailer business plans.
• The analysis showed that the SW side appears under served in apparel, shoes, jewelry, & accessories, electronics, miscellaneous, book stores, and food & beverage.
• Between 1990 and 2009, the Cedar Rapids region added about 250,000 SF of retail space per year, linked with big box stores. Presuming that the market can sustain population growth of 0.9% and income growth of 3.5%, average annual growth in retail space of about 140,000 SF per year is anticipated. However, for the short-term, it is not clear that sufficient national chain tenants exist to meet this demand.
• From a tenanting standpoint, health care tenants are seen as more likely in the future.
Prognosis: For the defined trade areas around Westdale, the analysis identified incremental potential spending support between 2013 and 2017 for up to about 260,000 square feet of retail space tied to defined primary and secondary markets. Reflecting a conservative approach, the analysis did not expressly presume capture from tertiary markets across Cedar Rapids or Iowa City. With the proper tenant mix, competition for regional lifestyle oriented retail and entertainment should be an expectation.
Executive Summary
Page 3
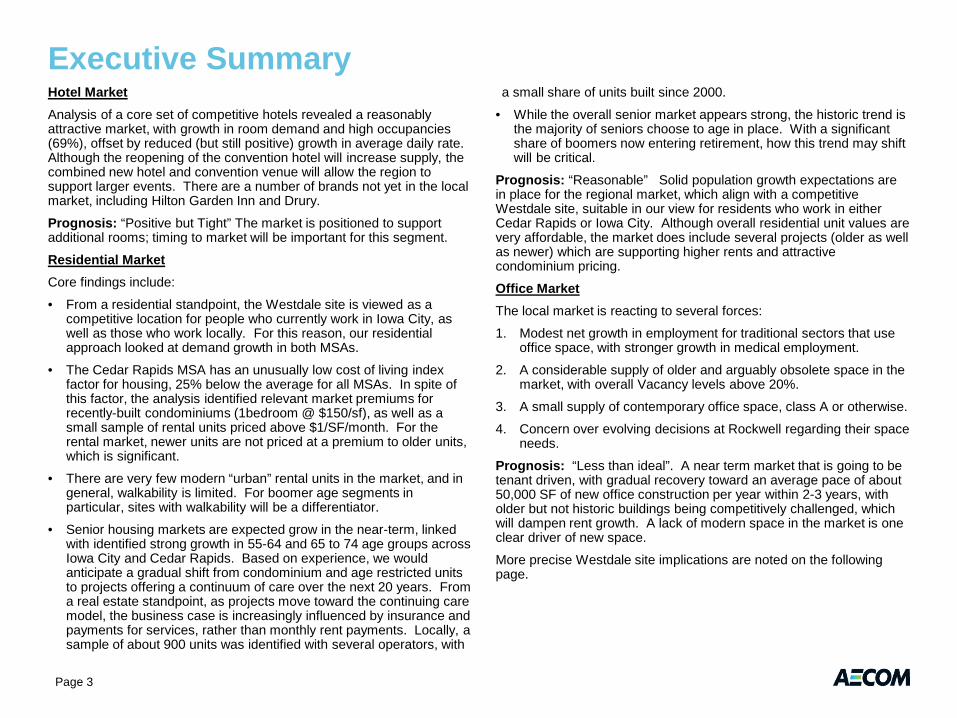
Hotel Market Analysis of a core set of competitive hotels revealed a reasonably attractive market, with growth in room demand and high occupancies (69%), offset by reduced (but still positive) growth in average daily rate. Although the reopening of the convention hotel will increase supply, the combined new hotel and convention venue will allow the region to support larger events. There are a number of brands not yet in the local market, including Hilton Garden Inn and Drury.
Prognosis: “Positive but Tight” The market is positioned to support additional rooms; timing to market will be important for this segment.
Residential Market Core findings include:
• From a residential standpoint, the Westdale site is viewed as a competitive location for people who currently work in Iowa City, as well as those who work locally. For this reason, our residential approach looked at demand growth in both MSAs.
• The Cedar Rapids MSA has an unusually low cost of living index factor for housing, 25% below the average for all MSAs. In spite of this factor, the analysis identified relevant market premiums for recently-built condominiums (1bedroom @ $150/sf), as well as a small sample of rental units priced above $1/SF/month. For the rental market, newer units are not priced at a premium to older units, which is significant.
• There are very few modern “urban” rental units in the market, and in general, walkability is limited. For boomer age segments in particular, sites with walkability will be a differentiator.
• Senior housing markets are expected grow in the near-term, linked with identified strong growth in 55-64 and 65 to 74 age groups across Iowa City and Cedar Rapids. Based on experience, we would anticipate a gradual shift from condominium and age restricted units to projects offering a continuum of care over the next 20 years. From a real estate standpoint, as projects move toward the continuing care model, the business case is increasingly influenced by insurance and payments for services, rather than monthly rent payments. Locally, a sample of about 900 units was identified with several operators, with
a small share of units built since 2000.
• While the overall senior market appears strong, the historic trend is the majority of seniors choose to age in place. With a significant share of boomers now entering retirement, how this trend may shift will be critical.
Prognosis: “Reasonable” Solid population growth expectations are in place for the regional market, which align with a competitive Westdale site, suitable in our view for residents who work in either Cedar Rapids or Iowa City. Although overall residential unit values are very affordable, the market does include several projects (older as well as newer) which are supporting higher rents and attractive condominium pricing.
Office Market The local market is reacting to several forces:
1. Modest net growth in employment for traditional sectors that use office space, with stronger growth in medical employment.
2. A considerable supply of older and arguably obsolete space in the market, with overall Vacancy levels above 20%.
3. A small supply of contemporary office space, class A or otherwise.
4. Concern over evolving decisions at Rockwell regarding their space needs.
Prognosis: “Less than ideal”. A near term market that is going to be tenant driven, with gradual recovery toward an average pace of about 50,000 SF of new office construction per year within 2-3 years, with older but not historic buildings being competitively challenged, which will dampen rent growth. A lack of modern space in the market is one clear driver of new space.
More precise Westdale site implications are noted on the following page.
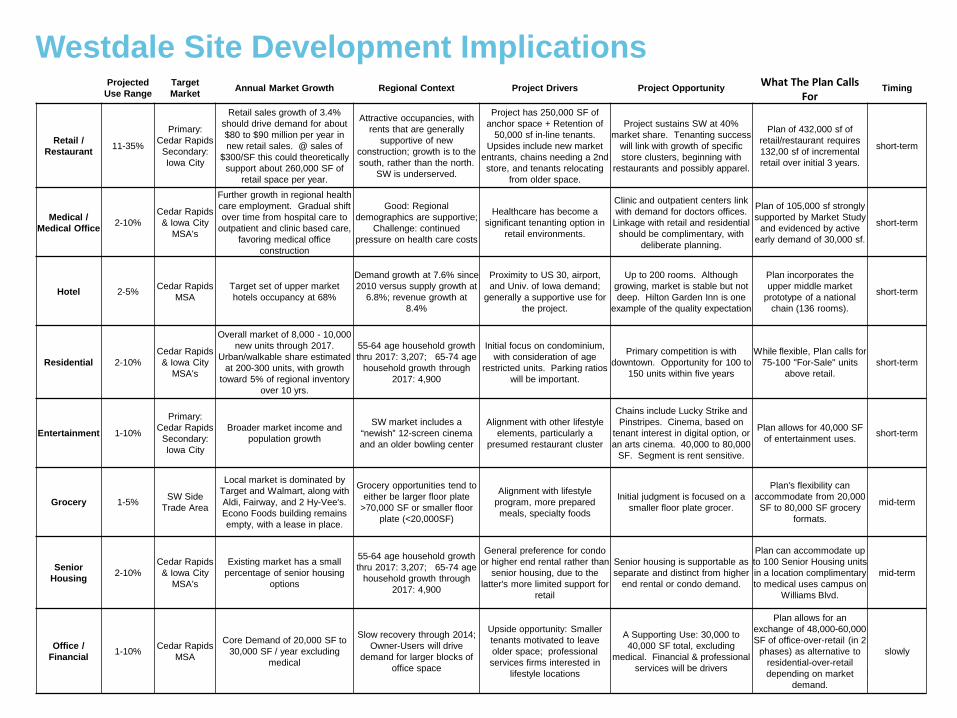
Westdale Site Development Implications
Page 4
Projected Use Range
Target Market Annual Market Growth Regional Context Project Drivers Project Opportunity What The Plan Calls
For Timing
Retail / Restaurant 11-35%
Primary: Cedar Rapids
Secondary: Iowa City
Retail sales growth of 3.4% should drive demand for about $80 to $90 million per year in new retail sales. @ sales of
$300/SF this could theoretically support about 260,000 SF of
retail space per year.
Attractive occupancies, with rents that are generally
supportive of new construction; growth is to the south, rather than the north.
SW is underserved.
Project has 250,000 SF of anchor space + Retention of
50,000 sf in-line tenants. Upsides include new market
entrants, chains needing a 2nd store, and tenants relocating
from older space.
Project sustains SW at 40% market share. Tenanting success
will link with growth of specific store clusters, beginning with
restaurants and possibly apparel.
Plan of 432,000 sf of retail/restaurant requires 132,00 sf of incremental retail over initial 3 years.
short-term
Medical / Medical Office 2-10%
Cedar Rapids & Iowa City
MSA's
Further growth in regional health care employment. Gradual shift over time from hospital care to
outpatient and clinic based care, favoring medical office
construction
Good: Regional demographics are supportive;
Challenge: continued pressure on health care costs
Healthcare has become a significant tenanting option in
retail environments.
Clinic and outpatient centers link with demand for doctors offices.
Linkage with retail and residential should be complimentary, with
deliberate planning.
Plan of 105,000 sf strongly supported by Market Study
and evidenced by active early demand of 30,000 sf.
short-term
Hotel 2-5% Cedar Rapids MSA
Target set of upper market hotels occupancy at 68%
Demand growth at 7.6% since 2010 versus supply growth at
6.8%; revenue growth at 8.4%
Proximity to US 30, airport, and Univ. of Iowa demand;
generally a supportive use for the project.
Up to 200 rooms. Although growing, market is stable but not deep. Hilton Garden Inn is one
example of the quality expectation
Plan incorporates the upper middle market
prototype of a national chain (136 rooms).
short-term
Residential 2-10% Cedar Rapids & Iowa City
MSA's
Overall market of 8,000 - 10,000 new units through 2017.
Urban/walkable share estimated at 200-300 units, with growth
toward 5% of regional inventory over 10 yrs.
55-64 age household growth thru 2017: 3,207; 65-74 age
household growth through 2017: 4,900
Initial focus on condominium, with consideration of age
restricted units. Parking ratios will be important.
Primary competition is with downtown. Opportunity for 100 to
150 units within five years
While flexible, Plan calls for 75-100 "For-Sale" units
above retail. short-term
Entertainment 1-10%
Primary: Cedar Rapids
Secondary: Iowa City
Broader market income and population growth
SW market includes a “newish” 12-screen cinema and an older bowling center
Alignment with other lifestyle elements, particularly a
presumed restaurant cluster
Chains include Lucky Strike and Pinstripes. Cinema, based on
tenant interest in digital option, or an arts cinema. 40,000 to 80,000
SF. Segment is rent sensitive.
Plan allows for 40,000 SF of entertainment uses. short-term
Grocery 1-5% SW Side Trade Area
Local market is dominated by Target and Walmart, along with Aldi, Fairway, and 2 Hy-Vee's. Econo Foods building remains empty, with a lease in place.
Grocery opportunities tend to either be larger floor plate
>70,000 SF or smaller floor plate (<20,000SF)
Alignment with lifestyle program, more prepared meals, specialty foods
Initial judgment is focused on a smaller floor plate grocer.
Plan's flexibility can accommodate from 20,000 SF to 80,000 SF grocery
formats.
mid-term
Senior Housing 2-10%
Cedar Rapids & Iowa City
MSA's
Existing market has a small percentage of senior housing
options
55-64 age household growth thru 2017: 3,207; 65-74 age
household growth through 2017: 4,900
General preference for condo or higher end rental rather than
senior housing, due to the latter's more limited support for
retail
Senior housing is supportable as separate and distinct from higher
end rental or condo demand.
Plan can accommodate up to 100 Senior Housing units in a location complimentary to medical uses campus on
Williams Blvd.
mid-term
Office / Financial 1-10% Cedar Rapids
MSA
Core Demand of 20,000 SF to 30,000 SF / year excluding
medical
Slow recovery through 2014; Owner-Users will drive
demand for larger blocks of office space
Upside opportunity: Smaller tenants motivated to leave older space; professional services firms interested in
lifestyle locations
A Supporting Use: 30,000 to 40,000 SF total, excluding
medical. Financial & professional services will be drivers
Plan allows for an exchange of 48,000-60,000 SF of office-over-retail (in 2
phases) as alternative to residential-over-retail depending on market
demand.
slowly
Table of Contents
Page 5
Demographic and Economic Analysis Page 6
Retail Market Analysis Page 20
Residential Market Analysis Page 39
Hotel Market Analysis Page 61
Office Market Analysis Page 65
Overall Considerations Page 70
General Limiting Conditions Page 72

Demographic and Economic Analysis
Introduction
The Demographic and Economic Analysis places the Cedar Rapids region in a broader context, focused on how the region has performed in terms of:
• Population and income growth
• Gross domestic product
• Employment and unemployment
The analysis is used to judge the competitive position of the region, and any strategic threats and opportunities.
Page 6
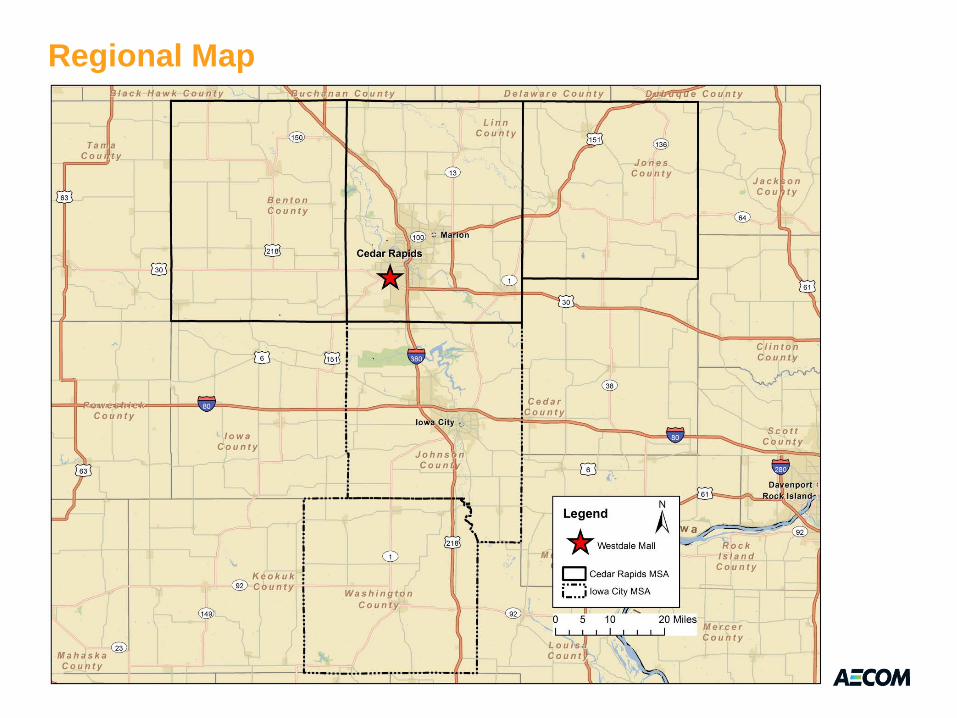
Regional Map
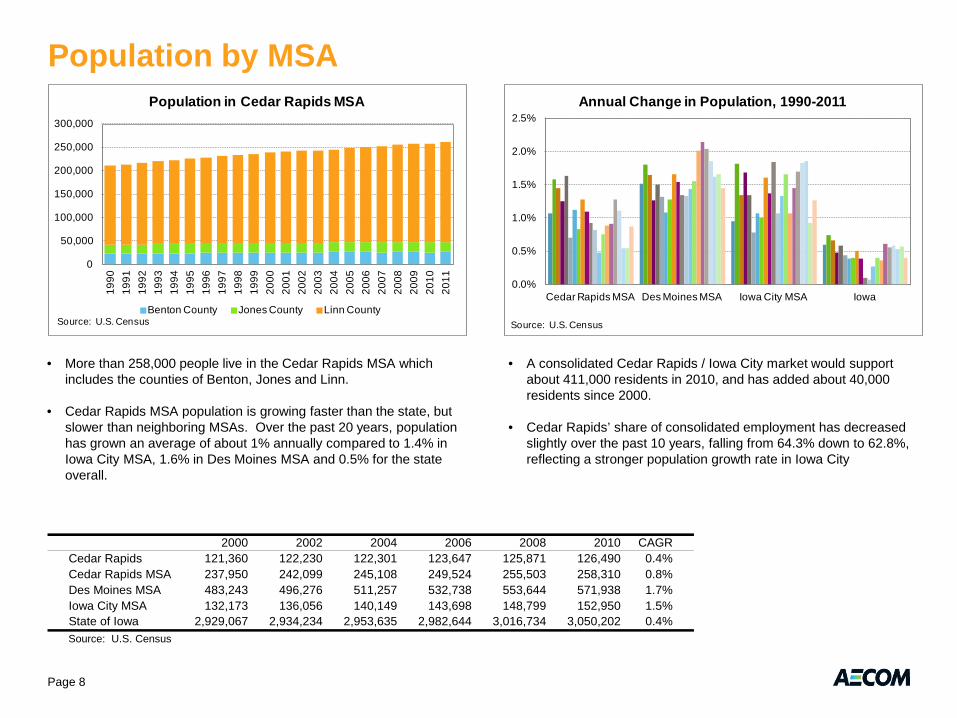
2000 2002 2004 2006 2008 2010 CAGRCedar Rapids 121,360 122,230 122,301 123,647 125,871 126,490 0.4%Cedar Rapids MSA 237,950 242,099 245,108 249,524 255,503 258,310 0.8%Des Moines MSA 483,243 496,276 511,257 532,738 553,644 571,938 1.7%Iowa City MSA 132,173 136,056 140,149 143,698 148,799 152,950 1.5%State of Iowa 2,929,067 2,934,234 2,953,635 2,982,644 3,016,734 3,050,202 0.4%Source: U.S. Census
0.0%
0.5%
1.0%
1.5%
2.0%
2.5%
Cedar Rapids MSA Des Moines MSA Iowa City MSA Iowa
Source: U.S. Census
Annual Change in Population, 1990-2011
Population by MSA
0
50,000
100,000
150,000
200,000
250,000
300,00019
9019
9119
9219
9319
9419
9519
9619
9719
9819
9920
0020
0120
0220
0320
0420
0520
0620
0720
0820
0920
1020
11
Source: U.S. Census
Population in Cedar Rapids MSA
Benton County Jones County Linn County
• More than 258,000 people live in the Cedar Rapids MSA which includes the counties of Benton, Jones and Linn.
• Cedar Rapids MSA population is growing faster than the state, but slower than neighboring MSAs. Over the past 20 years, population has grown an average of about 1% annually compared to 1.4% in Iowa City MSA, 1.6% in Des Moines MSA and 0.5% for the state overall.
• A consolidated Cedar Rapids / Iowa City market would support about 411,000 residents in 2010, and has added about 40,000 residents since 2000.
• Cedar Rapids’ share of consolidated employment has decreased slightly over the past 10 years, falling from 64.3% down to 62.8%, reflecting a stronger population growth rate in Iowa City
Page 8
-0.5%0.0%0.5%1.0%1.5%2.0%2.5%3.0%3.5%4.0%4.5%
2001 2002 2003 2004 2005 2006 2007 2008 2009 2010 2011
Source: US Census
Change in Regional Population, 2001-2011
Cedar Rapids Coralville Hiawatha Marion
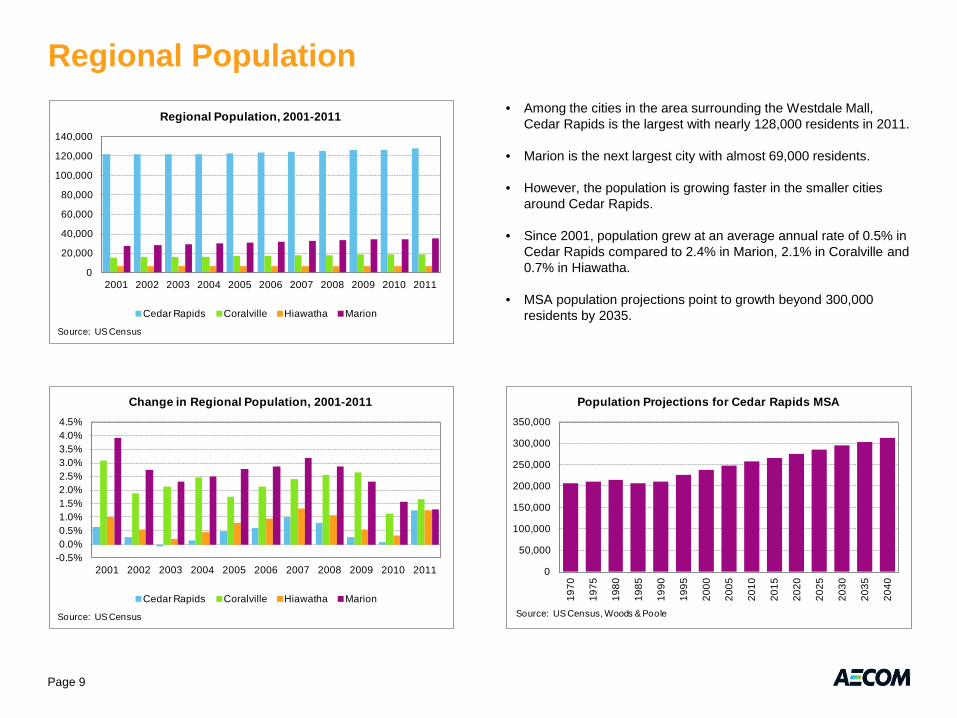
Regional Population • Among the cities in the area surrounding the Westdale Mall,
Cedar Rapids is the largest with nearly 128,000 residents in 2011.
• Marion is the next largest city with almost 69,000 residents.
• However, the population is growing faster in the smaller cities around Cedar Rapids.
• Since 2001, population grew at an average annual rate of 0.5% in Cedar Rapids compared to 2.4% in Marion, 2.1% in Coralville and 0.7% in Hiawatha.
• MSA population projections point to growth beyond 300,000 residents by 2035.
0
20,000
40,000
60,000
80,000
100,000
120,000
140,000
2001 2002 2003 2004 2005 2006 2007 2008 2009 2010 2011
Source: US Census
Regional Population, 2001-2011
Cedar Rapids Coralville Hiawatha Marion
0
50,000
100,000
150,000
200,000
250,000
300,000
350,000
1970
1975
1980
1985
1990
1995
2000
2005
2010
2015
2020
2025
2030
2035
2040
Source: US Census, Woods & Poole
Population Projections for Cedar Rapids MSA
Page 9
Long Range Population Growth Expectations
Page 10
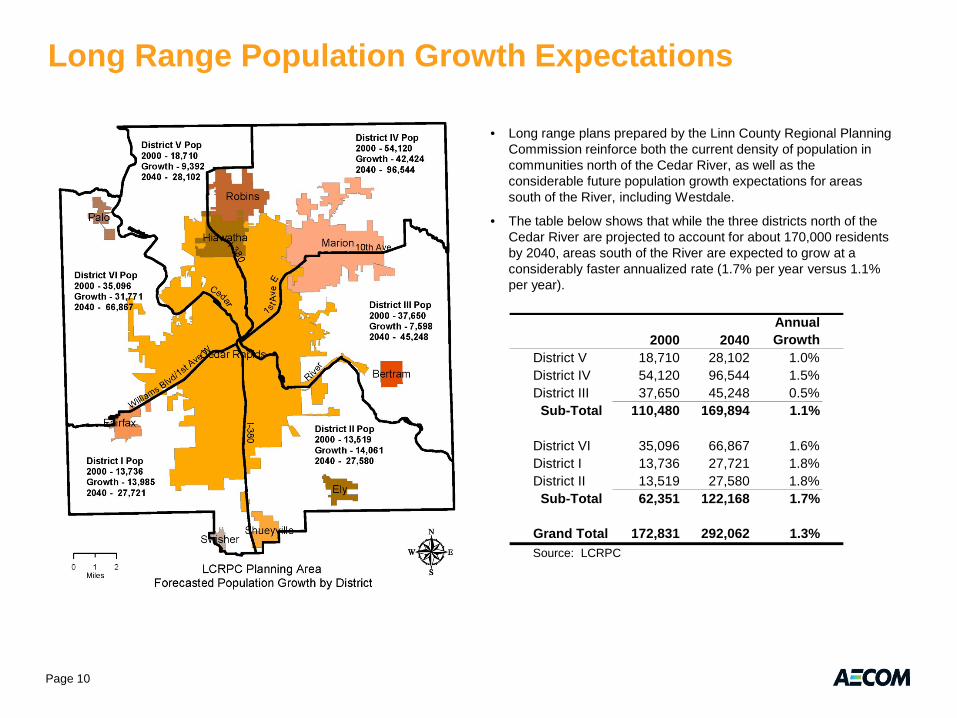
• Long range plans prepared by the Linn County Regional Planning Commission reinforce both the current density of population in communities north of the Cedar River, as well as the considerable future population growth expectations for areas south of the River, including Westdale.
• The table below shows that while the three districts north of the Cedar River are projected to account for about 170,000 residents by 2040, areas south of the River are expected to grow at a considerably faster annualized rate (1.7% per year versus 1.1% per year).
2000 2040Annual Growth
District V 18,710 28,102 1.0%District IV 54,120 96,544 1.5%District III 37,650 45,248 0.5% Sub-Total 110,480 169,894 1.1%
District VI 35,096 66,867 1.6%District I 13,736 27,721 1.8%District II 13,519 27,580 1.8% Sub-Total 62,351 122,168 1.7%
Grand Total 172,831 292,062 1.3%Source: LCRPC
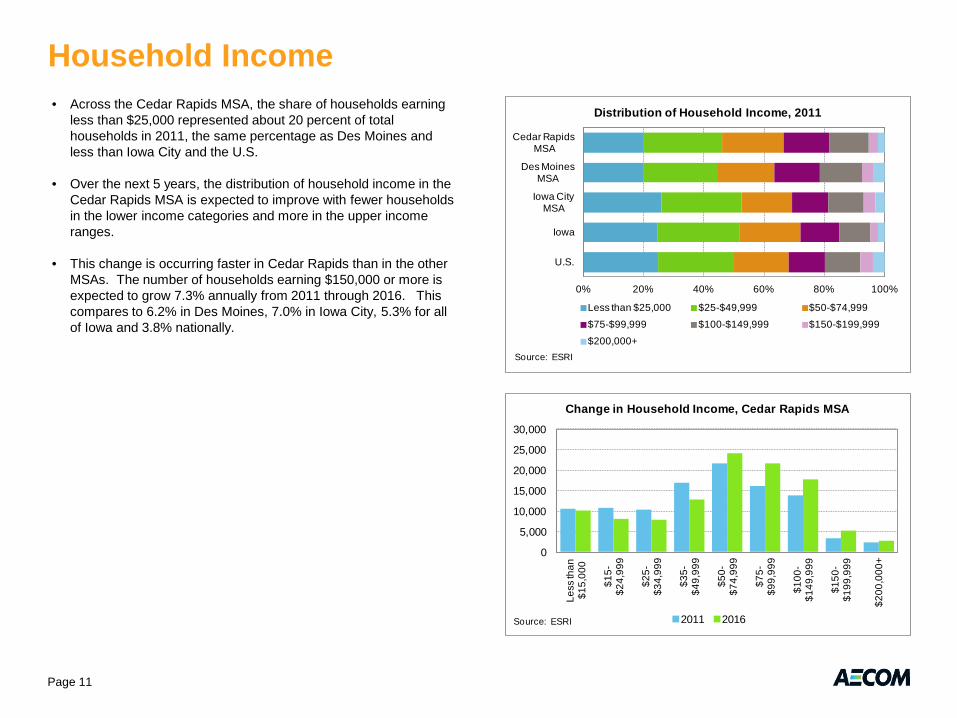
Household Income • Across the Cedar Rapids MSA, the share of households earning
less than $25,000 represented about 20 percent of total households in 2011, the same percentage as Des Moines and less than Iowa City and the U.S.
• Over the next 5 years, the distribution of household income in the Cedar Rapids MSA is expected to improve with fewer households in the lower income categories and more in the upper income ranges.
• This change is occurring faster in Cedar Rapids than in the other MSAs. The number of households earning $150,000 or more is expected to grow 7.3% annually from 2011 through 2016. This compares to 6.2% in Des Moines, 7.0% in Iowa City, 5.3% for all of Iowa and 3.8% nationally.
0
5,000
10,000
15,000
20,000
25,000
30,000
Less
than
$1
5,00
0
$15-
$24,
999
$25-
$34,
999
$35-
$49,
999
$50-
$74,
999
$75-
$99,
999
$100
-$1
49,9
99
$150
-$1
99,9
99
$200
,000
+
Source: ESRI
Change in Household Income, Cedar Rapids MSA
2011 2016
0% 20% 40% 60% 80% 100%
Cedar Rapids MSA
Des MoinesMSA
Iowa City MSA
Iowa
U.S.
Source: ESRI
Distribution of Household Income, 2011
Less than $25,000 $25-$49,999 $50-$74,999$75-$99,999 $100-$149,999 $150-$199,999$200,000+
Page 11
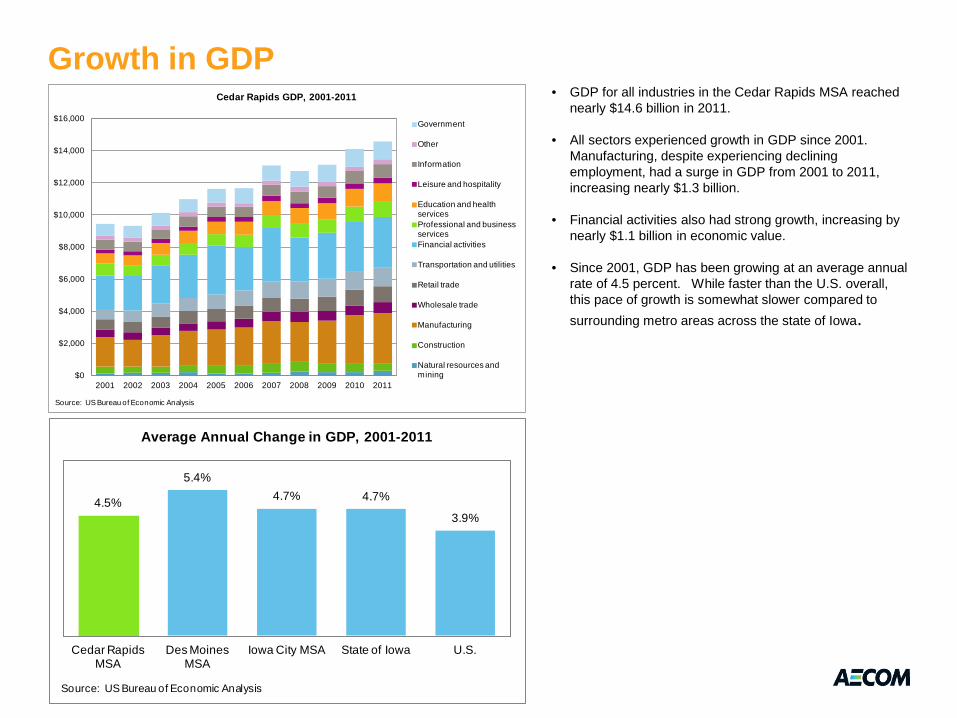
Growth in GDP • GDP for all industries in the Cedar Rapids MSA reached
nearly $14.6 billion in 2011.
• All sectors experienced growth in GDP since 2001. Manufacturing, despite experiencing declining employment, had a surge in GDP from 2001 to 2011, increasing nearly $1.3 billion.
• Financial activities also had strong growth, increasing by nearly $1.1 billion in economic value.
• Since 2001, GDP has been growing at an average annual rate of 4.5 percent. While faster than the U.S. overall, this pace of growth is somewhat slower compared to surrounding metro areas across the state of Iowa.
$0
$2,000
$4,000
$6,000
$8,000
$10,000
$12,000
$14,000
$16,000
2001 2002 2003 2004 2005 2006 2007 2008 2009 2010 2011
Source: US Bureau of Economic Analysis
Cedar Rapids GDP, 2001-2011
Government
Other
Information
Leisure and hospitality
Education and health servicesProfessional and business servicesFinancial activities
Transportation and utilities
Retail trade
Wholesale trade
Manufacturing
Construction
Natural resources and mining
Page 12
4.5%
5.4%4.7% 4.7%
3.9%
Cedar Rapids MSA
Des Moines MSA
Iowa City MSA State of Iowa U.S.
Source: US Bureau of Economic Analysis
Average Annual Change in GDP, 2001-2011
Unemployment
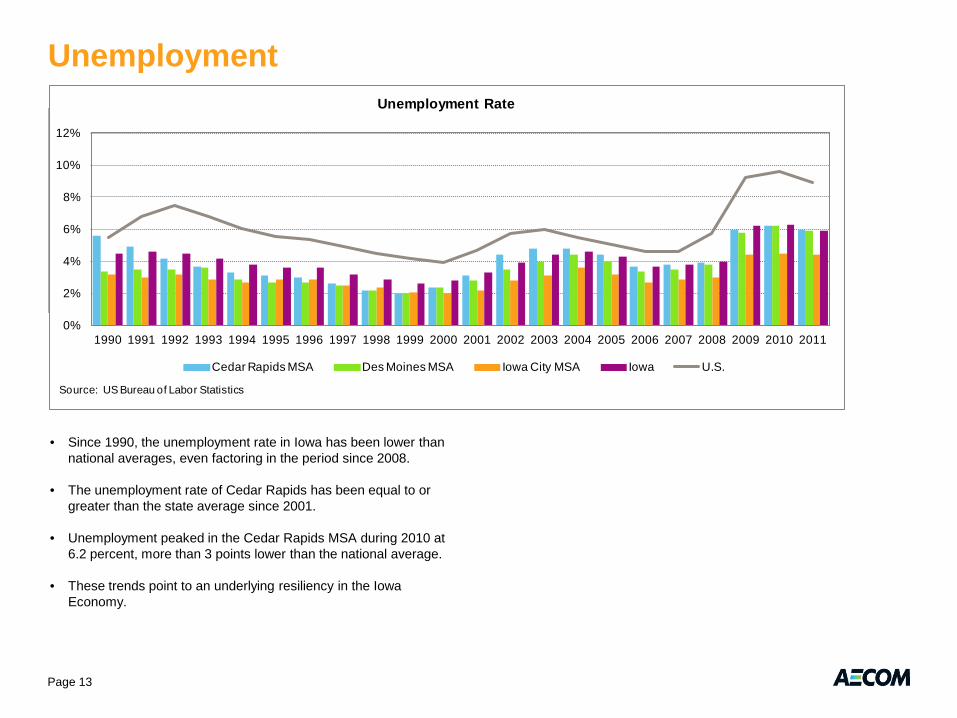
• Since 1990, the unemployment rate in Iowa has been lower than national averages, even factoring in the period since 2008.
• The unemployment rate of Cedar Rapids has been equal to or greater than the state average since 2001.
• Unemployment peaked in the Cedar Rapids MSA during 2010 at 6.2 percent, more than 3 points lower than the national average.
• These trends point to an underlying resiliency in the Iowa Economy.
020,00040,00060,00080,000
100,000120,000140,000160,000
2000 2001 2002 2003 2004 2005 2006 2007 2008 2009 2010 2011
Source: Iowa Workforce Development
Employment in Cedar Rapids MSA
Goods Producing Service Providing
0%
2%
4%
6%
8%
10%
12%
1990 1991 1992 1993 1994 1995 1996 1997 1998 1999 2000 2001 2002 2003 2004 2005 2006 2007 2008 2009 2010 2011
Source: US Bureau of Labor Statistics
Unemployment Rate
Cedar Rapids MSA Des Moines MSA Iowa City MSA Iowa U.S.
Page 13
Broader Economic Considerations
Page 14
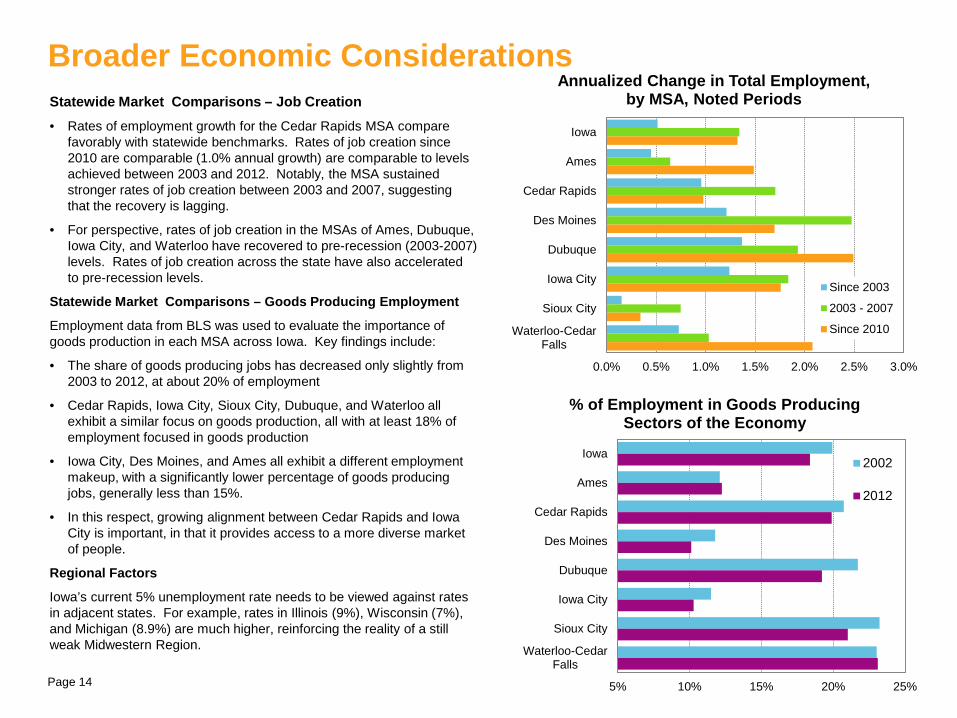
Statewide Market Comparisons – Job Creation • Rates of employment growth for the Cedar Rapids MSA compare
favorably with statewide benchmarks. Rates of job creation since 2010 are comparable (1.0% annual growth) are comparable to levels achieved between 2003 and 2012. Notably, the MSA sustained stronger rates of job creation between 2003 and 2007, suggesting that the recovery is lagging.
• For perspective, rates of job creation in the MSAs of Ames, Dubuque, Iowa City, and Waterloo have recovered to pre-recession (2003-2007) levels. Rates of job creation across the state have also accelerated to pre-recession levels.
Statewide Market Comparisons – Goods Producing Employment
Employment data from BLS was used to evaluate the importance of goods production in each MSA across Iowa. Key findings include:
• The share of goods producing jobs has decreased only slightly from 2003 to 2012, at about 20% of employment
• Cedar Rapids, Iowa City, Sioux City, Dubuque, and Waterloo all exhibit a similar focus on goods production, all with at least 18% of employment focused in goods production
• Iowa City, Des Moines, and Ames all exhibit a different employment makeup, with a significantly lower percentage of goods producing jobs, generally less than 15%.
• In this respect, growing alignment between Cedar Rapids and Iowa City is important, in that it provides access to a more diverse market of people.
Regional Factors
Iowa’s current 5% unemployment rate needs to be viewed against rates in adjacent states. For example, rates in Illinois (9%), Wisconsin (7%), and Michigan (8.9%) are much higher, reinforcing the reality of a still weak Midwestern Region.
0.0% 0.5% 1.0% 1.5% 2.0% 2.5% 3.0%
Iowa
Ames
Cedar Rapids
Des Moines
Dubuque
Iowa City
Sioux City
Waterloo-CedarFalls
Annualized Change in Total Employment, by MSA, Noted Periods
Since 2003
2003 - 2007
Since 2010
5% 10% 15% 20% 25%
Iowa
Ames
Cedar Rapids
Des Moines
Dubuque
Iowa City
Sioux City
Waterloo-CedarFalls
% of Employment in Goods Producing Sectors of the Economy
2002
2012
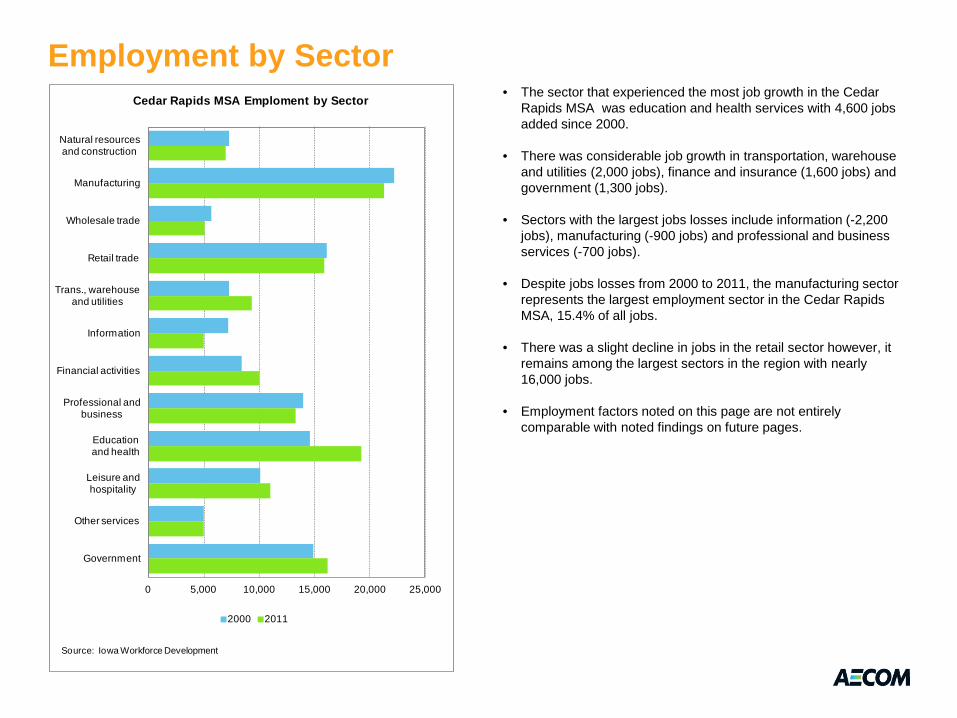
Employment by Sector • The sector that experienced the most job growth in the Cedar
Rapids MSA was education and health services with 4,600 jobs added since 2000.
• There was considerable job growth in transportation, warehouse and utilities (2,000 jobs), finance and insurance (1,600 jobs) and government (1,300 jobs).
• Sectors with the largest jobs losses include information (-2,200 jobs), manufacturing (-900 jobs) and professional and business services (-700 jobs).
• Despite jobs losses from 2000 to 2011, the manufacturing sector represents the largest employment sector in the Cedar Rapids MSA, 15.4% of all jobs.
• There was a slight decline in jobs in the retail sector however, it remains among the largest sectors in the region with nearly 16,000 jobs.
• Employment factors noted on this page are not entirely comparable with noted findings on future pages.
0 5,000 10,000 15,000 20,000 25,000
Natural resources and construction
Manufacturing
Wholesale trade
Retail trade
Trans., warehouse and utilities
Information
Financial activities
Professional and business
Education and health
Leisure and hospitality
Other services
Government
Source: Iowa Workforce Development
Cedar Rapids MSA Emploment by Sector
2000 2011
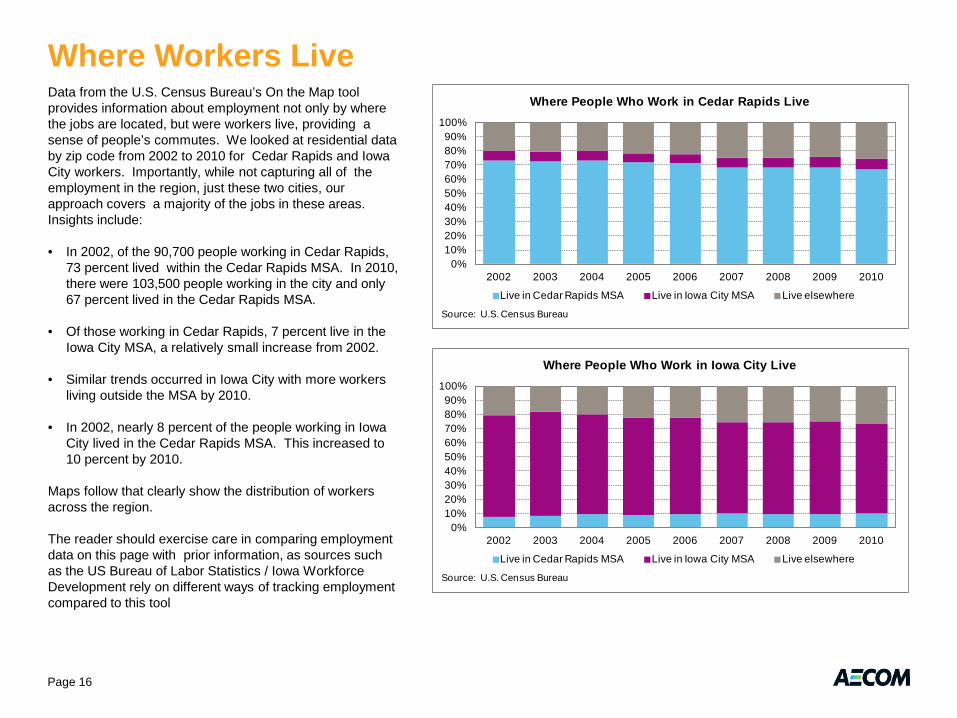
Where Workers Live Data from the U.S. Census Bureau’s On the Map tool provides information about employment not only by where the jobs are located, but were workers live, providing a sense of people’s commutes. We looked at residential data by zip code from 2002 to 2010 for Cedar Rapids and Iowa City workers. Importantly, while not capturing all of the employment in the region, just these two cities, our approach covers a majority of the jobs in these areas. Insights include:
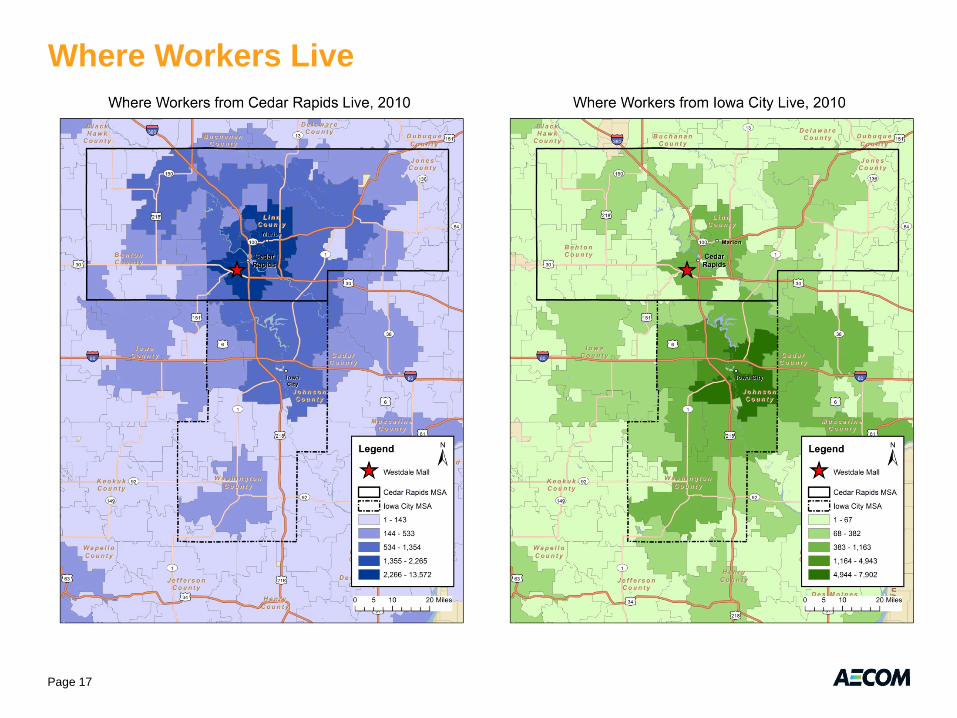
• In 2002, of the 90,700 people working in Cedar Rapids, 73 percent lived within the Cedar Rapids MSA. In 2010, there were 103,500 people working in the city and only 67 percent lived in the Cedar Rapids MSA.
• Of those working in Cedar Rapids, 7 percent live in the Iowa City MSA, a relatively small increase from 2002.
• Similar trends occurred in Iowa City with more workers living outside the MSA by 2010.
• In 2002, nearly 8 percent of the people working in Iowa City lived in the Cedar Rapids MSA. This increased to 10 percent by 2010.
Maps follow that clearly show the distribution of workers across the region.
The reader should exercise care in comparing employment data on this page with prior information, as sources such as the US Bureau of Labor Statistics / Iowa Workforce Development rely on different ways of tracking employment compared to this tool
0%10%20%30%40%50%60%70%80%90%
100%
2002 2003 2004 2005 2006 2007 2008 2009 2010
Source: U.S. Census Bureau
Where People Who Work in Cedar Rapids Live
Live in Cedar Rapids MSA Live in Iowa City MSA Live elsewhere
0%10%20%30%40%50%60%70%80%90%
100%
2002 2003 2004 2005 2006 2007 2008 2009 2010
Source: U.S. Census Bureau
Where People Who Work in Iowa City Live
Live in Cedar Rapids MSA Live in Iowa City MSA Live elsewhere
Page 16
Where Workers Live
Page 17
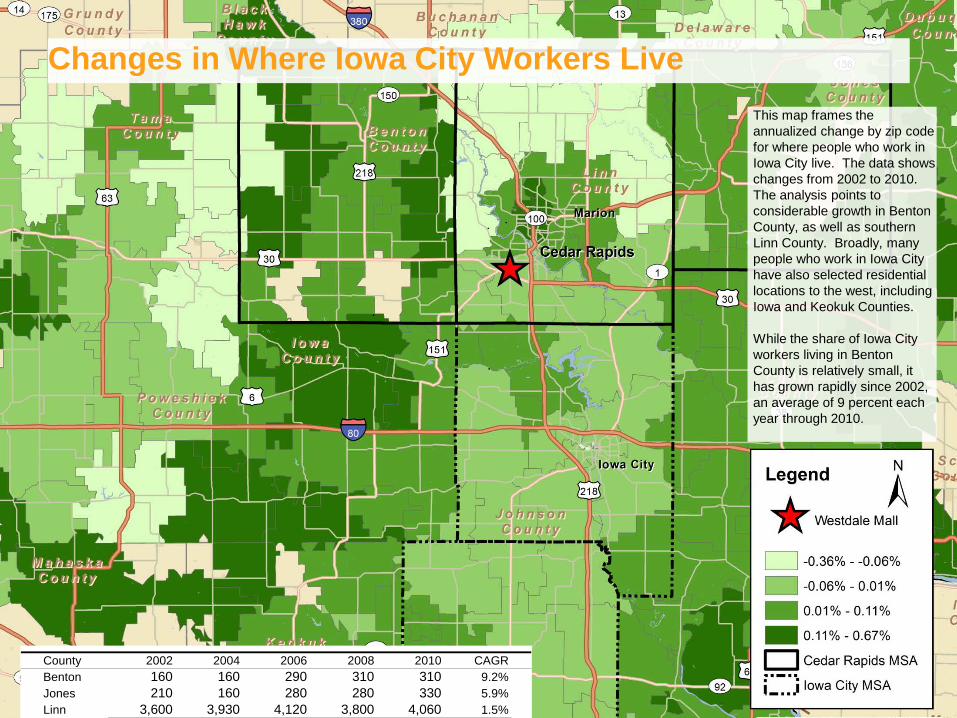
Changes in Where Iowa City Workers Live This map frames the annualized change by zip code for where people who work in Iowa City live. The data shows changes from 2002 to 2010. The analysis points to considerable growth in Benton County, as well as southern Linn County. Broadly, many people who work in Iowa City have also selected residential locations to the west, including Iowa and Keokuk Counties.
While the share of Iowa City workers living in Benton County is relatively small, it has grown rapidly since 2002, an average of 9 percent each year through 2010.
County 2002 2004 2006 2008 2010 CAGRBenton 160 160 290 310 310 9.2%Jones 210 160 280 280 330 5.9%Linn 3,600 3,930 4,120 3,800 4,060 1.5%
Economic / Demographic Findings
Page 19
Findings build from the conclusion that the Cedar Rapids Area, much like the entire state of Iowa, has an established tradition of steady growth, and low unemployment, while avoiding the economic peaks and valleys experienced by other regions. Findings include:
• Rates of employment growth for the Cedar Rapids Metropolitan Statistical Area (MSA) compare favorably with statewide benchmarks. Unemployment rates remain enviably below Midwestern peers.
• Although the recession did not hit Cedar Rapids with an intensity seen elsewhere in the Midwest, the region’s pace of job recovery since 2010 is lagging compared to other Iowa metros. Returning to pre-recession growth rates would suggest an increase to 1,900 new jobs per year, versus the current pace of about 900-1,000 jobs per year.
• The Cedar Rapids Area draws notable strength from a local manufacturing sector which has remained quite resilient comparison with broader declines in manufacturing which have occurred across the Midwest. When combined with other sectors such as health care, it is apparent that the local economy is driven to a relevant extent by private sector activity, which is significant.
• Rockwell Collins is a major regional employer, with a particular concentration of owned and leased space on the NE side of Cedar Rapids. Although they are a diversified aerospace company, concerns about federal spending reductions should be of concern locally over the next 24 months.
• Although Cedar Rapids and Iowa City are defined as separate Metropolitan Statistical Areas by the US Census, interviews reinforce the sense that these two regions are growing closer together economically. US Census data shows that an increasing
number of people who work in Iowa City choose to live in Linn County. For this reason, our study is also presumes a stronger economic “pull” for Cedar Rapids to the south over the long-term, placing the Westdale site in a more favorable regional location.
• A combined Iowa City and Cedar Rapids market is consequential in size, with about 411,000 residents through 2010. While the Cedar Rapids MSA represents 60% of this larger market, the Iowa City MSA growth rate is stronger (1.5% versus 0.8% annually).
• Local voters recently approve a referendum for a new casino in Cedar Rapids, which lays the groundwork for a formal application to the Iowa Gaming Commission. A downtown location appears to be likely. As casinos typically include restaurant and entertainment elements, the evolving nature of this program will need to be monitored in relation to Westdale.
• The flood had a major impact on neighborhoods in and around downtown with a total of about 5,000 housing units that were damaged. Since the flood, City officials indicated that roughly 3,500 have been renovated. Broader Corps of Engineers decision-making regarding flood protection remains a major element, with clearer plans to protect the eastern side of the river. Flood protection for the western side of the river remains in debate locally.
• Further reinforcing the generally positive economic performance for the region, we noted that Eastern Iowa Airport supported about 492,260 enplaned passengers in 2012, an increase of about 30,000 passengers over 2010 levels, reflective of annual growth of about 2%.
Retail Market Analysis Introduction
The Retail Market Analysis folds in several overlapping components:
• Summary of national retail sales trends which have implications for the local market, particularly the impact of internet spending
• Discussion of trends regarding national chains that are expanding or closing stores
• Analysis of local trade area demographics in the Cedar Rapids area
• Review taxable retail sales for Cedar Rapids and Iowa City compared to statewide metrics
• Assessment of retail inventories and vacancy
• Demand and supply implications for Westdale
Page 20
Retail – National Perspective
Page 21
11.3%
2.6%
12.7%
3.5%
8.0%
7.0%
2.8%
15.3%
18.4%
2.9%
6.9%
8.5%
2.8%
3.4%
5.5%
3.9%
6.2%
14.4%
3.6%
14.1%
25.7%
3.0%
8.3%
9.1%
Warehouse clubs and superstores
Sporting goods, hobby, book, and musicstores
Nonstore retailers
Miscellaneous store retailers
Health and personal care stores
General merchandise stores
Furniture, home furnishings, electronicsand appliance stores
Food services and drinking places
Food and beverage stores
Electronics and appliance stores
Clothing and clothing access. stores
Building mat. and garden equip. andsupplies
Source: U.S. Census Bureau
Comparison of Retail Sales, Percentage of Total, By Year, 192 and 2012
1992 2012
$4,000
$6,000
$8,000
$10,000
$12,000
$14,000
$16,000
$18,000
1992
1993
1994
1995
1996
1997
1998
1999
2000
2001
2002
2003
2004
2005
2006
2007
2008
2009
2010
2011
2012
Source: U.S. Census Bureau
Retail Sales Per Person, Noted Years
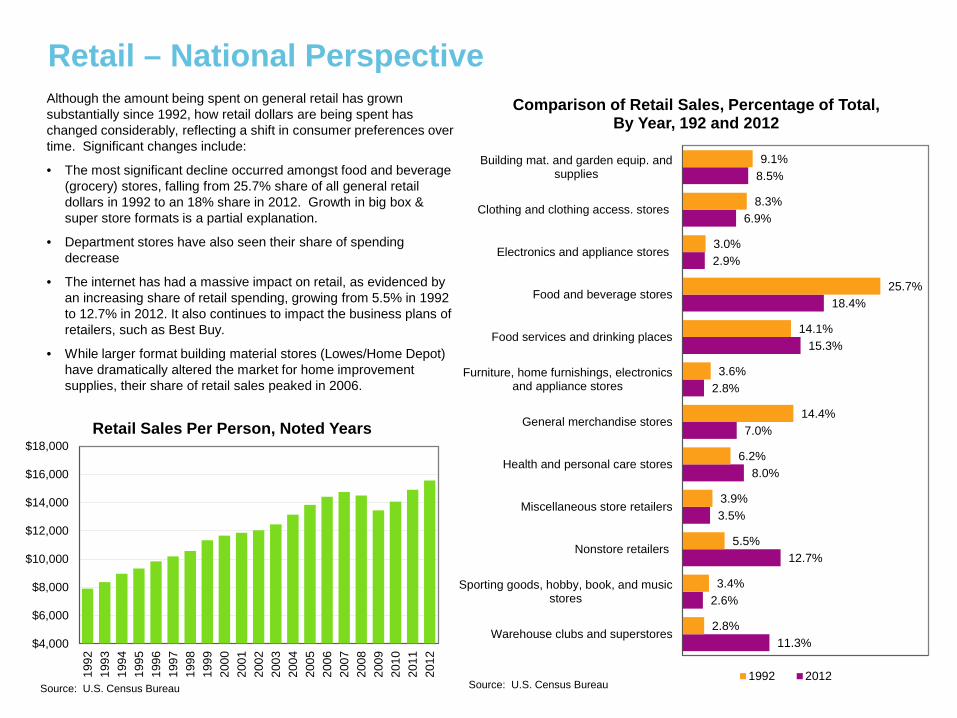
Although the amount being spent on general retail has grown substantially since 1992, how retail dollars are being spent has changed considerably, reflecting a shift in consumer preferences over time. Significant changes include:
• The most significant decline occurred amongst food and beverage (grocery) stores, falling from 25.7% share of all general retail dollars in 1992 to an 18% share in 2012. Growth in big box & super store formats is a partial explanation.
• Department stores have also seen their share of spending decrease
• The internet has had a massive impact on retail, as evidenced by an increasing share of retail spending, growing from 5.5% in 1992 to 12.7% in 2012. It also continues to impact the business plans of retailers, such as Best Buy.
• While larger format building material stores (Lowes/Home Depot) have dramatically altered the market for home improvement supplies, their share of retail sales peaked in 2006.
Retail – National Trends
Page 22
Overall Sales Trajectory • Retail sales spending increased 1.1 percent in February 2013
compared to the previous month. Even after excluding gas, autos and building supply, core retail sales rose 0.4 percent. January sales had been better than expected as well. While two months do not make a trend, 2013 Q1 may perform better than expected in spite of higher taxes and gasoline prices.
• The impact of Federal sequestration and any future changes resulting from Federal budget cuts are still unclear.
• Younger adults are still living at home waiting for the economic recovery to be sustaining. Retail sales depend on household growth and new household formation according to a life cycle pattern. The “normal” pattern has been disrupted due to the “Great Recession”. With small improvements in jobs creation, retail sales will rise.
• Starbucks and Dunkin Donut have announced expansion plans, while others have announced cutbacks. Without solid evidence of consumer demand growth demonstrated by increasing sales, most chains will be slow to grow locations, even as under performing stores are closed.
• Large format retailers continue to look for more market share in saturated areas. Wal-Mart has announced plans to add 115 new outlets at less than 60,000 square feet to put it in position to compete with Dollar General, Walgreens and supermarkets in locations that would not support a superstore format. Wal-Mart will be using its Neighborhood Markets format to compete in smaller towns, its Mercado de Wal-Mart in Hispanic communities and a smaller Wal-Mart on Campus format.
• As a result of the continuing growth of online sales, smart phone ownership and social media, retailers as diverse as Macys, Nordstrom, Saks, Walgreens and Target are using an “omni-channel” strategy in response to the growth of mobile technology and consumer demand for convenience. Omni-channeling presents
a seamless experience model that delivers a consistent shopping experience across all customer touch points.
• Pressure has been growing on Congress to address the sales tax exemption for interstate online retail sales. State and local governments, joined by some business interests, are pressing for the sales tax issue to be addressed as tax receipts for retail sales continue to drop due to the growth of online shopping..
Retail Sector Perspectives
• Spending at health and personal-care stores dropped 0.9% in 2012, perhaps as a function of heavy discounting to increase sales and traffic volume. The industry seems to struggle to increase sales and revenues.
• Chain pharmacies see retail clinics as a way to drive traffic into stores. Visits to retail clinics increased four times from 2007 to 2009. Retail clinic performance varies greatly from chain-to-chain. CVS-owned Minute Clinics represent the most growth in the in-store clinic business, with about 550 locations. Minute Clinics and Walgreens’ Take Care Clinics, with 355 locations, represent two-out-of-three retail clinics in the U.S.
• With the announced merger of Office Depot and OfficeMax, the office supply business will change. The combined business should be in a more competitive position versus sector leader Staples. Both chains had been closing locations already; as the store territories overlap by about 50 percent, additional stores are expected to close. The office supply sector has become a cost-driven commodity business. Linking online sales to in-store, contract sales, and a high sales volume/low costs approach now define success in this sector.
• The Ascena Retail Group’s Fashion Bug women’s apparel stores final 432 closings will happen in 2013. The group will focus on the Lane Bryant and Catherines Plus Sizes stores.
Retail – National Trends
Page 23
Retail Sector Perspectives
• There is considerable consolidation among U.S. apparel retailers in response to weaker sales . Abercrombie & Fitch closed 180 of its under-performing stores in lower tier cities. American Eagle Outfitters and Limited Brands are pursuing a similar strategy.
• Fashion retailer H&M continues its aggressive expansion in the U.S. Currently, the chain has about 200 stores in 30 states and plans to add 325 in beginning 2013. The chain has expanded to the Midwest in the past few years with stores in Illinois, Minnesota and Wisconsin, but has yet to open a store in Iowa.
• JC Penney continues to try to revamp itself through its “shops” merchandising and pricing strategies. The most recent announcement of the introduction of the Canadian Joe Fresh fashion line is an attempt to compete in the “Fast Fashion” approach taken by European retailers Zara and H&M. Penney’s has announced it will roll out the new line in its bigger and more trafficked stores. If successful, this move could help JC Penney re-establish itself as a poplar price point apparel retailer; if unsuccessful, expect more closings to follow.
• Gymboree’s children’s apparel store Crazy 8 has announced plans to open 90 new outlets in 2013. Crazy 8 is already in Iowa with two stores.
• Other stores with significant expansion plans in 2013 include Dollar General, Subway, Five Guys, Pizza Hut, Family Dollar, CVS, Chipotle, Ace Hardware, H&M, and Starbucks.
• According to CoStar, only one traditional enclosed mall has been built since 2006. Malls are physically changing to new formats – “inside-out” with retailers facing outside rather than inward; non-retail uses such as educational and health care; “exploded” formats that reopen the center promenades and courtyards and converting them to Main Street-styles with parking.
• Simon Property is remodeling 15 to 20 malls a year, adding such amenities as electric-car charging stations and stadium-seating theaters. Mega-churches have taken over former anchor spaces.
Restaurant Sector Perspectives • Starbucks has announced major expansion in the U.S., including
adding or expanding 900 drive-through locations over the next five years. Dunkin Donuts plans to add 330-360 total stores in 2013.
• Bob Evans Farms Inc. has sold its Mimi’s Cafe chain to Le Duff America Inc.; Ignite Restaurant Group Inc. acquired Romano’s Macaroni Grill from Golden Gate Capital; and Landry’s Inc. is trying to acquire Ark Restaurants Corp.
• Fast Casual restaurants make up 27.25% of total food service sales. Limited-service restaurants are estimated at $173.8 billion in annual sales (NRA).
• 5 Guys Burgers, Jimmy John’s, Chipotle Mexican Grill, BJs Restaurant & Brewery and Cheddar’s are the top five chains in sales growth in the US.
• Reduced household spending and changing eating habits continue to hurt fine dining. Full-service restaurants saw sales growth last year of 8.1 percent. Most of the shift in sales has been to Quick Service.
• A growing emphasis on Asian food bodes well for restaurants with a pan-Asian orientation such as Pei-Wei Asian Diner (owned by P.F. Chang).
• Many restaurants focus on Millenials, but it's their slower income rise has caused cutbacks in food away spending.
• Baby Boomers continue to work longer, aren’t cutting back as much and have a greater need for convenience.
Retail Trade Area – Regional Perspective
Page 24
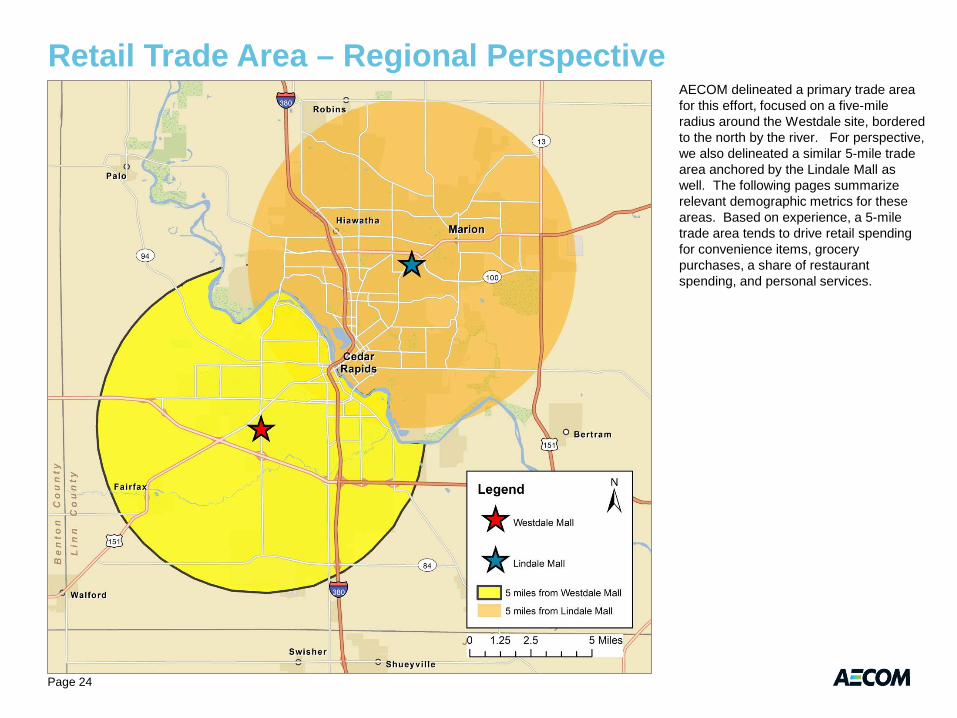
AECOM delineated a primary trade area for this effort, focused on a five-mile radius around the Westdale site, bordered to the north by the river. For perspective, we also delineated a similar 5-mile trade area anchored by the Lindale Mall as well. The following pages summarize relevant demographic metrics for these areas. Based on experience, a 5-mile trade area tends to drive retail spending for convenience items, grocery purchases, a share of restaurant spending, and personal services.
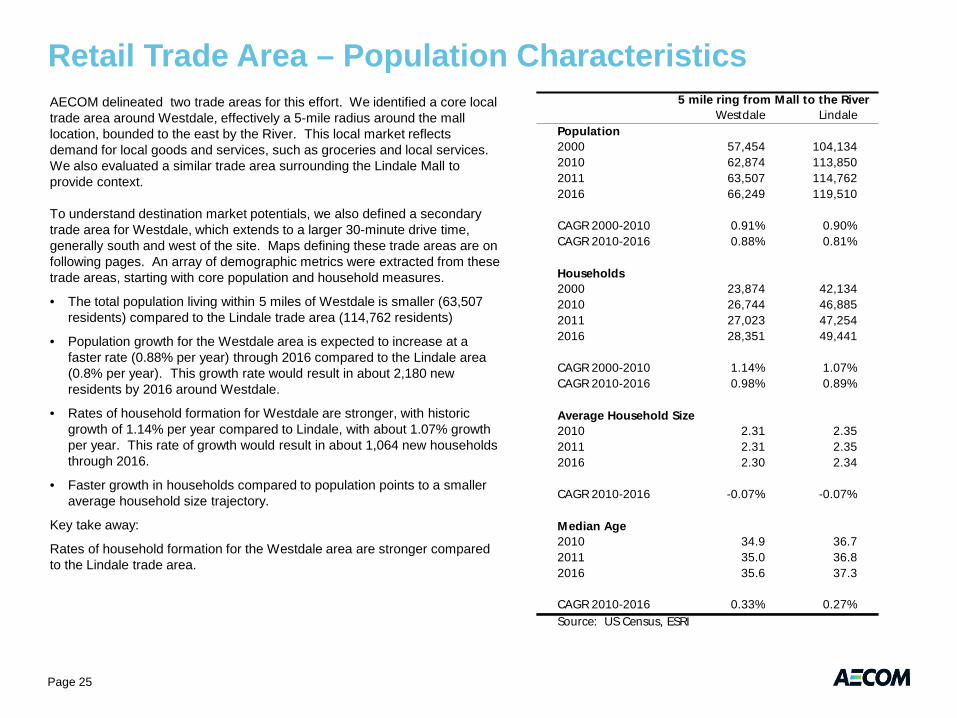
Retail Trade Area – Population Characteristics AECOM delineated two trade areas for this effort. We identified a core local trade area around Westdale, effectively a 5-mile radius around the mall location, bounded to the east by the River. This local market reflects demand for local goods and services, such as groceries and local services. We also evaluated a similar trade area surrounding the Lindale Mall to provide context.
To understand destination market potentials, we also defined a secondary trade area for Westdale, which extends to a larger 30-minute drive time, generally south and west of the site. Maps defining these trade areas are on following pages. An array of demographic metrics were extracted from these trade areas, starting with core population and household measures.
• The total population living within 5 miles of Westdale is smaller (63,507 residents) compared to the Lindale trade area (114,762 residents)
• Population growth for the Westdale area is expected to increase at a faster rate (0.88% per year) through 2016 compared to the Lindale area (0.8% per year). This growth rate would result in about 2,180 new residents by 2016 around Westdale.
• Rates of household formation for Westdale are stronger, with historic growth of 1.14% per year compared to Lindale, with about 1.07% growth per year. This rate of growth would result in about 1,064 new households through 2016.
• Faster growth in households compared to population points to a smaller average household size trajectory.
Key take away:
Rates of household formation for the Westdale area are stronger compared to the Lindale trade area.
5 mile ring from Mall to the RiverWestdale Lindale
Population2000 57,454 104,1342010 62,874 113,8502011 63,507 114,7622016 66,249 119,510
CAGR 2000-2010 0.91% 0.90%CAGR 2010-2016 0.88% 0.81%
Households2000 23,874 42,1342010 26,744 46,8852011 27,023 47,2542016 28,351 49,441
CAGR 2000-2010 1.14% 1.07%CAGR 2010-2016 0.98% 0.89%
Average Household Size2010 2.31 2.352011 2.31 2.352016 2.30 2.34
CAGR 2010-2016 -0.07% -0.07%
Median Age2010 34.9 36.72011 35.0 36.82016 35.6 37.3
CAGR 2010-2016 0.33% 0.27%Source: US Census, ESRI
Page 25
5 mile ring from Mall to the RiverWestdale Lindale
Share of Households by Income, 2011< $15,000 9.8% 8.5%$15,000 - $24,999 10.7% 10.0%$25,000 - $34,999 10.5% 9.5%$35,000 - $49,999 17.4% 15.0%$50,000 - $74,999 22.7% 18.8%$75,000 - $99,999 14.9% 15.3%$100,000 - $149,999 11.2% 15.2%$150,000 - $199,999 1.9% 4.3%$200,000+ 0.9% 3.4%
Share of Households by Income, 2016< $15,000 9.0% 7.9%$15,000 - $24,999 8.0% 7.0%$25,000 - $34,999 7.7% 6.8%$35,000 - $49,999 12.7% 10.9%$50,000 - $74,999 24.5% 19.7%$75,000 - $99,999 19.9% 19.2%$100,000 - $149,999 14.3% 18.0%$150,000 - $199,999 2.9% 6.6%$200,000+ 1.1% 3.8%
CAGR 2011-16< $15,000 -0.6% -0.6%$15,000 - $24,999 -4.8% -5.9%$25,000 - $34,999 -5.1% -5.6%$35,000 - $49,999 -5.2% -5.2%$50,000 - $74,999 2.5% 1.8%$75,000 - $99,999 7.0% 5.7%$100,000 - $149,999 6.0% 4.4%$150,000 - $199,999 9.3% 9.7%$200,000+ 4.0% 3.1%Source: US Census, ESRI
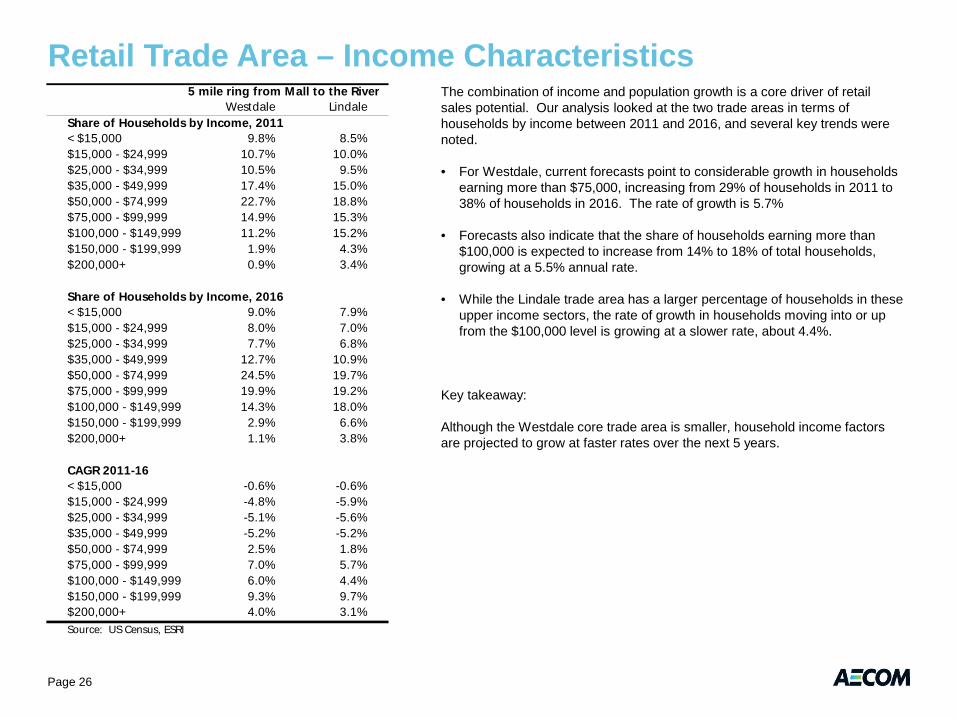
Retail Trade Area – Income Characteristics The combination of income and population growth is a core driver of retail sales potential. Our analysis looked at the two trade areas in terms of households by income between 2011 and 2016, and several key trends were noted.
• For Westdale, current forecasts point to considerable growth in households earning more than $75,000, increasing from 29% of households in 2011 to 38% of households in 2016. The rate of growth is 5.7%
• Forecasts also indicate that the share of households earning more than $100,000 is expected to increase from 14% to 18% of total households, growing at a 5.5% annual rate.
• While the Lindale trade area has a larger percentage of households in these upper income sectors, the rate of growth in households moving into or up from the $100,000 level is growing at a slower rate, about 4.4%.
Key takeaway:
Although the Westdale core trade area is smaller, household income factors are projected to grow at faster rates over the next 5 years.
Page 26
Retail Trade Area – Regional Perspective
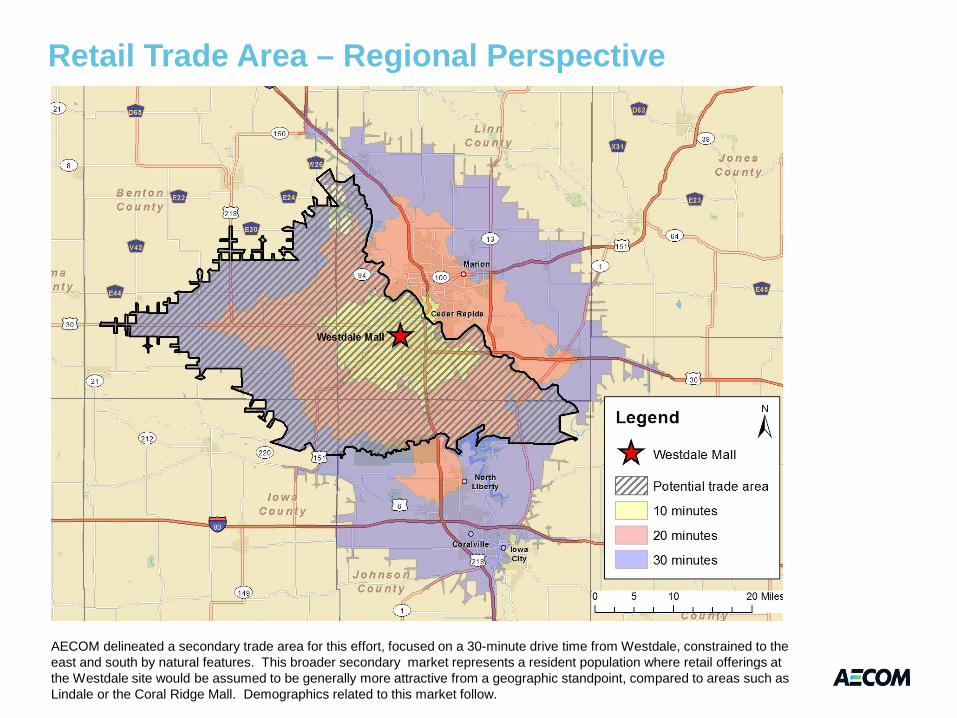
AECOM delineated a secondary trade area for this effort, focused on a 30-minute drive time from Westdale, constrained to the east and south by natural features. This broader secondary market represents a resident population where retail offerings at the Westdale site would be assumed to be generally more attractive from a geographic standpoint, compared to areas such as Lindale or the Coral Ridge Mall. Demographics related to this market follow.
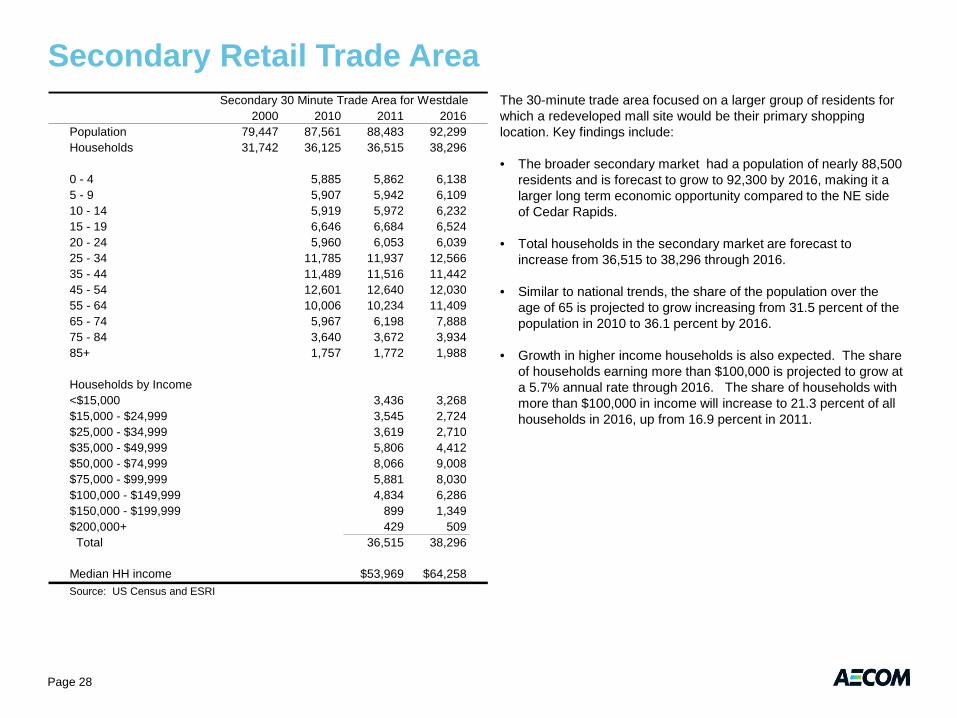
Secondary Retail Trade Area The 30-minute trade area focused on a larger group of residents for which a redeveloped mall site would be their primary shopping location. Key findings include:
• The broader secondary market had a population of nearly 88,500 residents and is forecast to grow to 92,300 by 2016, making it a larger long term economic opportunity compared to the NE side of Cedar Rapids.
• Total households in the secondary market are forecast to increase from 36,515 to 38,296 through 2016.
• Similar to national trends, the share of the population over the age of 65 is projected to grow increasing from 31.5 percent of the population in 2010 to 36.1 percent by 2016.
• Growth in higher income households is also expected. The share of households earning more than $100,000 is projected to grow at a 5.7% annual rate through 2016. The share of households with more than $100,000 in income will increase to 21.3 percent of all households in 2016, up from 16.9 percent in 2011.
2000 2010 2011 2016Population 79,447 87,561 88,483 92,299Households 31,742 36,125 36,515 38,296
0 - 4 5,885 5,862 6,1385 - 9 5,907 5,942 6,10910 - 14 5,919 5,972 6,23215 - 19 6,646 6,684 6,52420 - 24 5,960 6,053 6,03925 - 34 11,785 11,937 12,56635 - 44 11,489 11,516 11,44245 - 54 12,601 12,640 12,03055 - 64 10,006 10,234 11,40965 - 74 5,967 6,198 7,88875 - 84 3,640 3,672 3,93485+ 1,757 1,772 1,988
Households by Income<$15,000 3,436 3,268$15,000 - $24,999 3,545 2,724$25,000 - $34,999 3,619 2,710$35,000 - $49,999 5,806 4,412$50,000 - $74,999 8,066 9,008$75,000 - $99,999 5,881 8,030$100,000 - $149,999 4,834 6,286$150,000 - $199,999 899 1,349$200,000+ 429 509 Total 36,515 38,296
Median HH income $53,969 $64,258Source: US Census and ESRI
Secondary 30 Minute Trade Area for Westdale
Page 28
-4%
-2%
0%
2%
4%
6%
8%
Apparel Buildingmaterials
Eating and
drinking
Food dealers
General merch.
Home furn.
Service Specialty retail
Source: Iowa DOR
Percent Change in Retail Sales by Store Type, 2010 to 2012
Cedar Rapids Area Retail Sales Trends
Page 29
Perspective
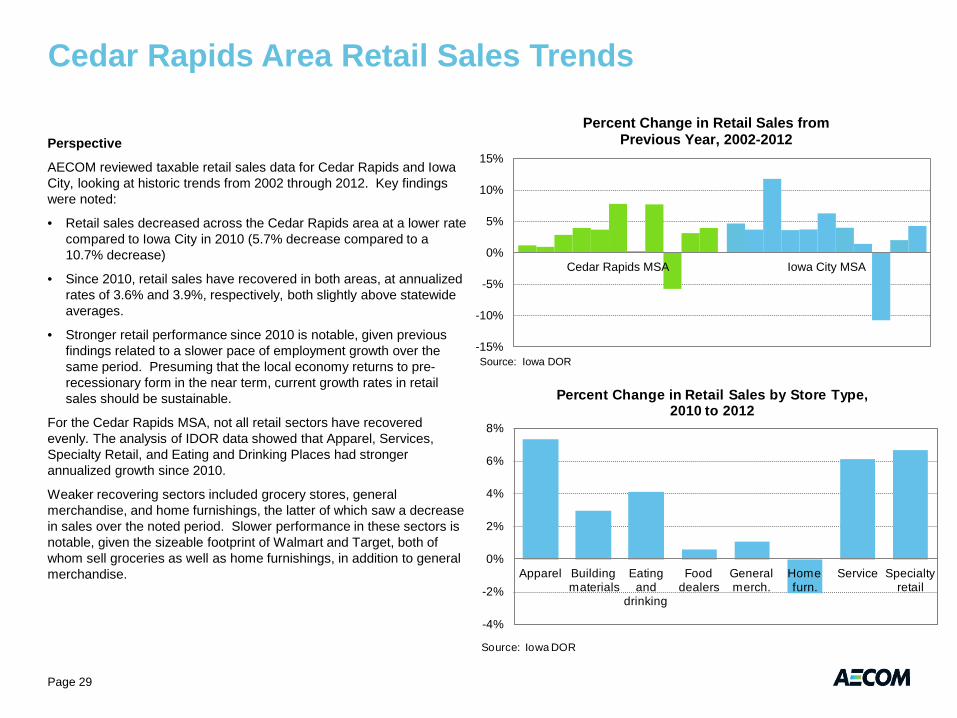
AECOM reviewed taxable retail sales data for Cedar Rapids and Iowa City, looking at historic trends from 2002 through 2012. Key findings were noted:
• Retail sales decreased across the Cedar Rapids area at a lower rate compared to Iowa City in 2010 (5.7% decrease compared to a 10.7% decrease)
• Since 2010, retail sales have recovered in both areas, at annualized rates of 3.6% and 3.9%, respectively, both slightly above statewide averages.
• Stronger retail performance since 2010 is notable, given previous findings related to a slower pace of employment growth over the same period. Presuming that the local economy returns to pre-recessionary form in the near term, current growth rates in retail sales should be sustainable.
For the Cedar Rapids MSA, not all retail sectors have recovered evenly. The analysis of IDOR data showed that Apparel, Services, Specialty Retail, and Eating and Drinking Places had stronger annualized growth since 2010.
Weaker recovering sectors included grocery stores, general merchandise, and home furnishings, the latter of which saw a decrease in sales over the noted period. Slower performance in these sectors is notable, given the sizeable footprint of Walmart and Target, both of whom sell groceries as well as home furnishings, in addition to general merchandise.
-15%
-10%
-5%
0%
5%
10%
15%
Cedar Rapids MSA Iowa City MSA
Source: Iowa DOR
Percent Change in Retail Sales from Previous Year, 2002-2012
Cedar Rapids – Retail Pull Factor Analysis
Page 30
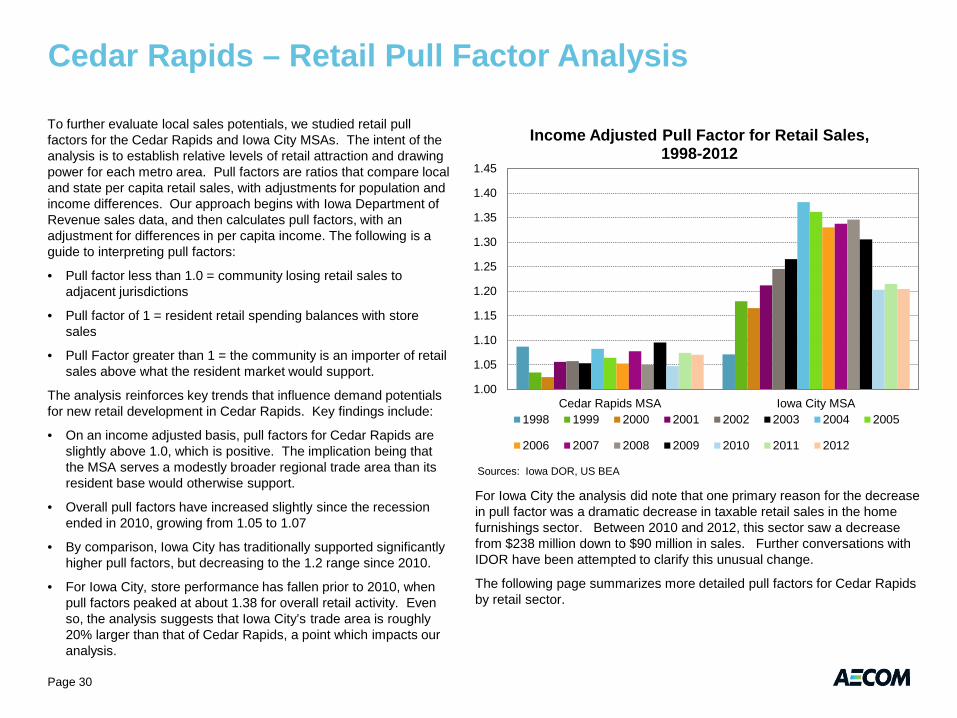
To further evaluate local sales potentials, we studied retail pull factors for the Cedar Rapids and Iowa City MSAs. The intent of the analysis is to establish relative levels of retail attraction and drawing power for each metro area. Pull factors are ratios that compare local and state per capita retail sales, with adjustments for population and income differences. Our approach begins with Iowa Department of Revenue sales data, and then calculates pull factors, with an adjustment for differences in per capita income. The following is a guide to interpreting pull factors:
• Pull factor less than 1.0 = community losing retail sales to adjacent jurisdictions
• Pull factor of 1 = resident retail spending balances with store sales
• Pull Factor greater than 1 = the community is an importer of retail sales above what the resident market would support.
The analysis reinforces key trends that influence demand potentials for new retail development in Cedar Rapids. Key findings include:
• On an income adjusted basis, pull factors for Cedar Rapids are slightly above 1.0, which is positive. The implication being that the MSA serves a modestly broader regional trade area than its resident base would otherwise support.
• Overall pull factors have increased slightly since the recession ended in 2010, growing from 1.05 to 1.07
• By comparison, Iowa City has traditionally supported significantly higher pull factors, but decreasing to the 1.2 range since 2010.
• For Iowa City, store performance has fallen prior to 2010, when pull factors peaked at about 1.38 for overall retail activity. Even so, the analysis suggests that Iowa City’s trade area is roughly 20% larger than that of Cedar Rapids, a point which impacts our analysis.
1.00
1.05
1.10
1.15
1.20
1.25
1.30
1.35
1.40
1.45
Cedar Rapids MSA Iowa City MSA
Sources: Iowa DOR, US BEA
Income Adjusted Pull Factor for Retail Sales, 1998-2012
1998 1999 2000 2001 2002 2003 2004 2005
2006 2007 2008 2009 2010 2011 2012
For Iowa City the analysis did note that one primary reason for the decrease in pull factor was a dramatic decrease in taxable retail sales in the home furnishings sector. Between 2010 and 2012, this sector saw a decrease from $238 million down to $90 million in sales. Further conversations with IDOR have been attempted to clarify this unusual change.
The following page summarizes more detailed pull factors for Cedar Rapids by retail sector.
Cedar Rapids – Retail Pull Factor Analysis
Page 31
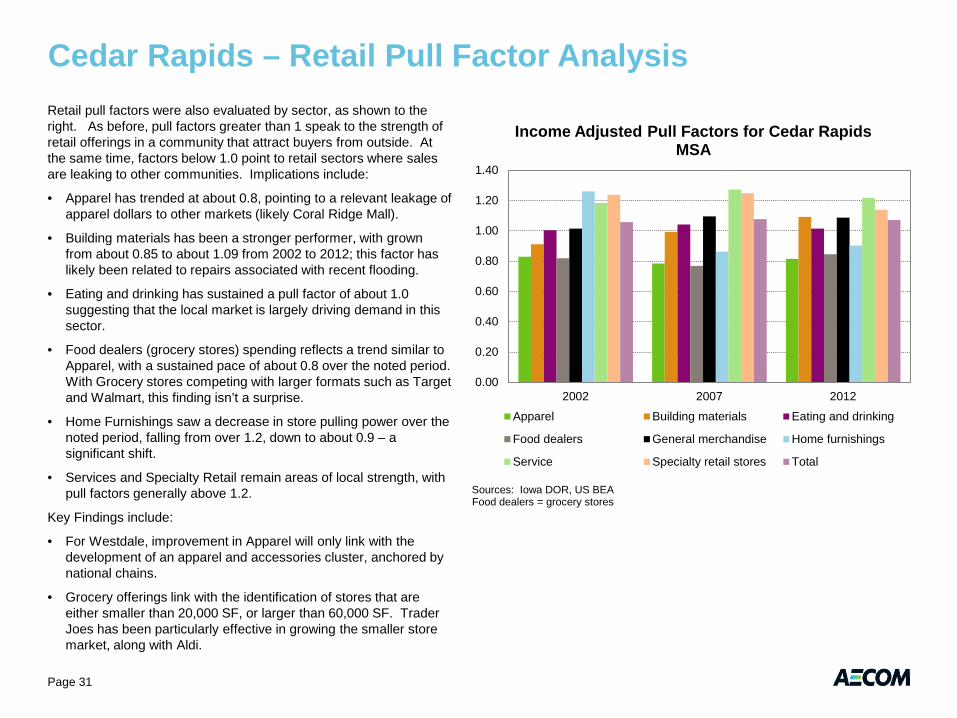
Retail pull factors were also evaluated by sector, as shown to the right. As before, pull factors greater than 1 speak to the strength of retail offerings in a community that attract buyers from outside. At the same time, factors below 1.0 point to retail sectors where sales are leaking to other communities. Implications include:
• Apparel has trended at about 0.8, pointing to a relevant leakage of apparel dollars to other markets (likely Coral Ridge Mall).
• Building materials has been a stronger performer, with grown from about 0.85 to about 1.09 from 2002 to 2012; this factor has likely been related to repairs associated with recent flooding.
• Eating and drinking has sustained a pull factor of about 1.0 suggesting that the local market is largely driving demand in this sector.
• Food dealers (grocery stores) spending reflects a trend similar to Apparel, with a sustained pace of about 0.8 over the noted period. With Grocery stores competing with larger formats such as Target and Walmart, this finding isn’t a surprise.
• Home Furnishings saw a decrease in store pulling power over the noted period, falling from over 1.2, down to about 0.9 – a significant shift.
• Services and Specialty Retail remain areas of local strength, with pull factors generally above 1.2.
Key Findings include:
• For Westdale, improvement in Apparel will only link with the development of an apparel and accessories cluster, anchored by national chains.
• Grocery offerings link with the identification of stores that are either smaller than 20,000 SF, or larger than 60,000 SF. Trader Joes has been particularly effective in growing the smaller store market, along with Aldi.
0.00
0.20
0.40
0.60
0.80
1.00
1.20
1.40
2002 2007 2012
Sources: Iowa DOR, US BEA Food dealers = grocery stores
Income Adjusted Pull Factors for Cedar Rapids MSA
Apparel Building materials Eating and drinking
Food dealers General merchandise Home furnishings
Service Specialty retail stores Total
Cedar Rapids Retail Perspective
Page 32
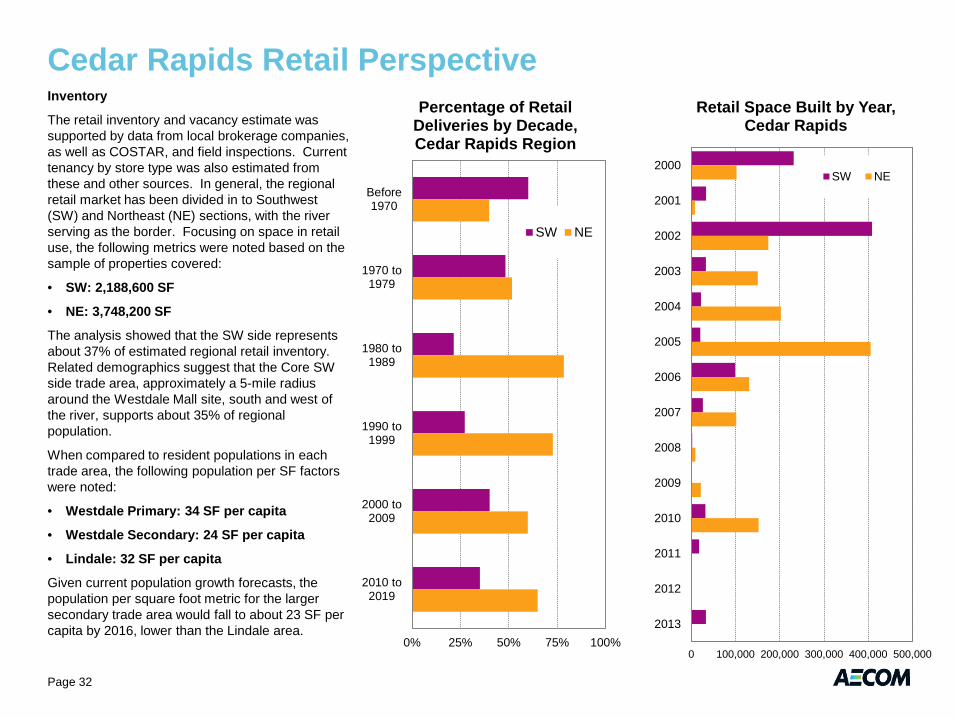
Inventory
The retail inventory and vacancy estimate was supported by data from local brokerage companies, as well as COSTAR, and field inspections. Current tenancy by store type was also estimated from these and other sources. In general, the regional retail market has been divided in to Southwest (SW) and Northeast (NE) sections, with the river serving as the border. Focusing on space in retail use, the following metrics were noted based on the sample of properties covered:
• SW: 2,188,600 SF
• NE: 3,748,200 SF
The analysis showed that the SW side represents about 37% of estimated regional retail inventory. Related demographics suggest that the Core SW side trade area, approximately a 5-mile radius around the Westdale Mall site, south and west of the river, supports about 35% of regional population.
When compared to resident populations in each trade area, the following population per SF factors were noted:
• Westdale Primary: 34 SF per capita
• Westdale Secondary: 24 SF per capita
• Lindale: 32 SF per capita
Given current population growth forecasts, the population per square foot metric for the larger secondary trade area would fall to about 23 SF per capita by 2016, lower than the Lindale area.
0% 25% 50% 75% 100%
Before1970
1970 to1979
1980 to1989
1990 to1999
2000 to2009
2010 to2019
Percentage of Retail Deliveries by Decade, Cedar Rapids Region
SW NE
0 100,000 200,000 300,000 400,000 500,000
2000
2001
2002
2003
2004
2005
2006
2007
2008
2009
2010
2011
2012
2013
Retail Space Built by Year, Cedar Rapids
SW NE
Cedar Rapids Retail Perspective
Page 33
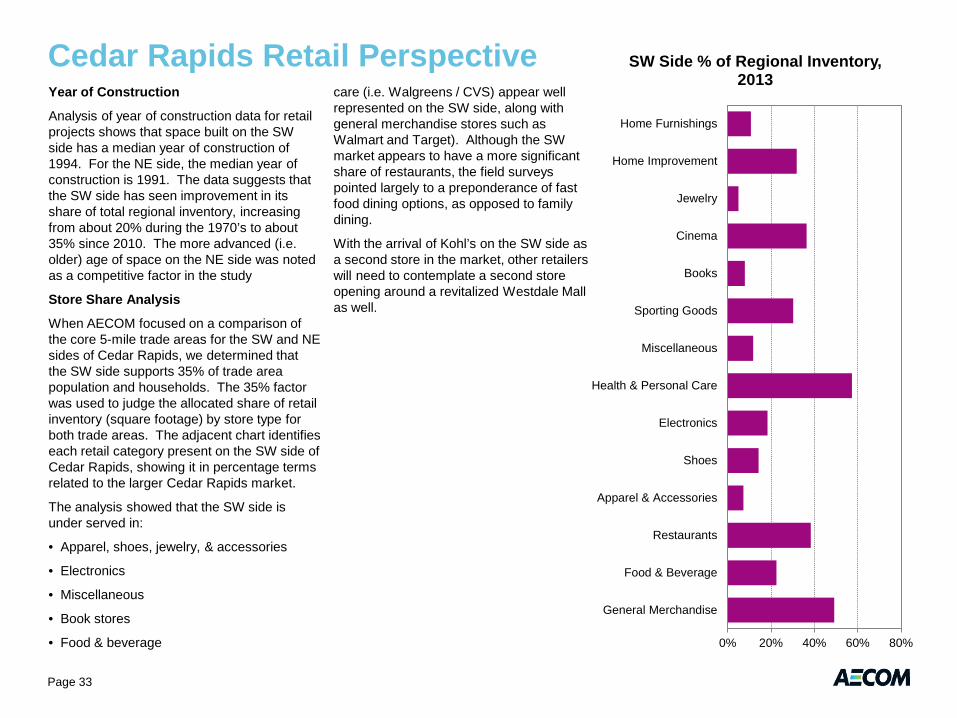
Year of Construction
Analysis of year of construction data for retail projects shows that space built on the SW side has a median year of construction of 1994. For the NE side, the median year of construction is 1991. The data suggests that the SW side has seen improvement in its share of total regional inventory, increasing from about 20% during the 1970’s to about 35% since 2010. The more advanced (i.e. older) age of space on the NE side was noted as a competitive factor in the study
Store Share Analysis
When AECOM focused on a comparison of the core 5-mile trade areas for the SW and NE sides of Cedar Rapids, we determined that the SW side supports 35% of trade area population and households. The 35% factor was used to judge the allocated share of retail inventory (square footage) by store type for both trade areas. The adjacent chart identifies each retail category present on the SW side of Cedar Rapids, showing it in percentage terms related to the larger Cedar Rapids market.
The analysis showed that the SW side is under served in:
• Apparel, shoes, jewelry, & accessories
• Electronics
• Miscellaneous
• Book stores
• Food & beverage
care (i.e. Walgreens / CVS) appear well represented on the SW side, along with general merchandise stores such as Walmart and Target). Although the SW market appears to have a more significant share of restaurants, the field surveys pointed largely to a preponderance of fast food dining options, as opposed to family dining.
With the arrival of Kohl’s on the SW side as a second store in the market, other retailers will need to contemplate a second store opening around a revitalized Westdale Mall as well.
0% 20% 40% 60% 80%
General Merchandise
Food & Beverage
Restaurants
Apparel & Accessories
Shoes
Electronics
Health & Personal Care
Miscellaneous
Sporting Goods
Books
Cinema
Jewelry
Home Improvement
Home Furnishings
SW Side % of Regional Inventory, 2013
Trade Area Retail Potential
Page 34
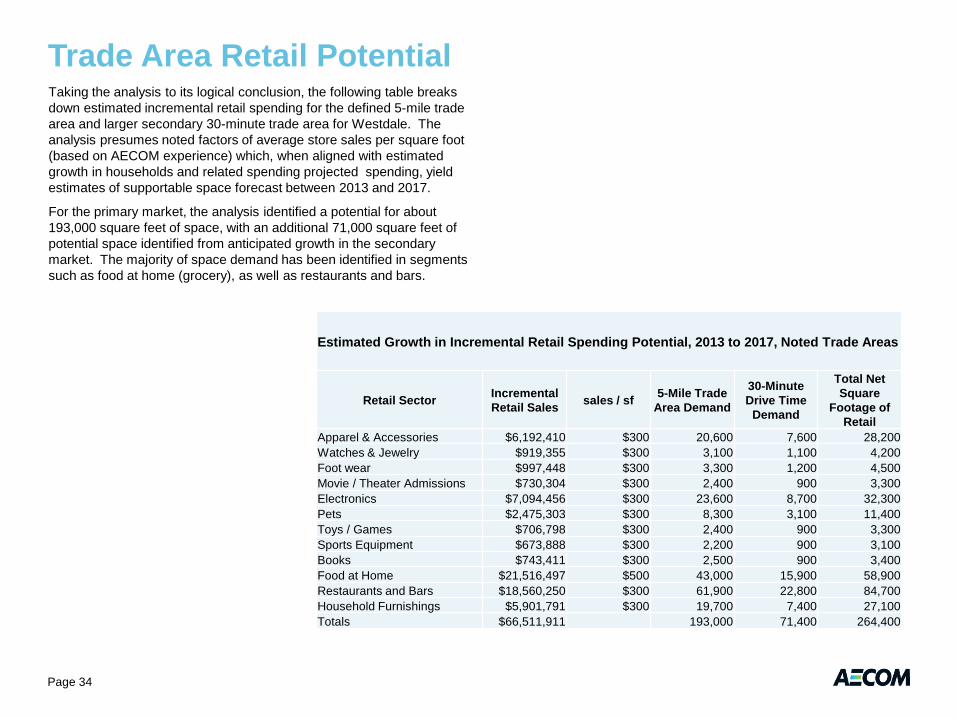
Taking the analysis to its logical conclusion, the following table breaks down estimated incremental retail spending for the defined 5-mile trade area and larger secondary 30-minute trade area for Westdale. The analysis presumes noted factors of average store sales per square foot (based on AECOM experience) which, when aligned with estimated growth in households and related spending projected spending, yield estimates of supportable space forecast between 2013 and 2017.
For the primary market, the analysis identified a potential for about 193,000 square feet of space, with an additional 71,000 square feet of potential space identified from anticipated growth in the secondary market. The majority of space demand has been identified in segments such as food at home (grocery), as well as restaurants and bars.
Estimated Growth in Incremental Retail Spending Potential, 2013 to 2017, Noted Trade Areas
Retail Sector Incremental Retail Sales sales / sf 5-Mile Trade
Area Demand
30-Minute Drive Time
Demand
Total Net Square
Footage of Retail
Apparel & Accessories $6,192,410 $300 20,600 7,600 28,200 Watches & Jewelry $919,355 $300 3,100 1,100 4,200 Foot wear $997,448 $300 3,300 1,200 4,500 Movie / Theater Admissions $730,304 $300 2,400 900 3,300 Electronics $7,094,456 $300 23,600 8,700 32,300 Pets $2,475,303 $300 8,300 3,100 11,400 Toys / Games $706,798 $300 2,400 900 3,300 Sports Equipment $673,888 $300 2,200 900 3,100 Books $743,411 $300 2,500 900 3,400 Food at Home $21,516,497 $500 43,000 15,900 58,900 Restaurants and Bars $18,560,250 $300 61,900 22,800 84,700 Household Furnishings $5,901,791 $300 19,700 7,400 27,100 Totals $66,511,911 193,000 71,400 264,400
Cedar Rapids Cinema Perspective
Page 35
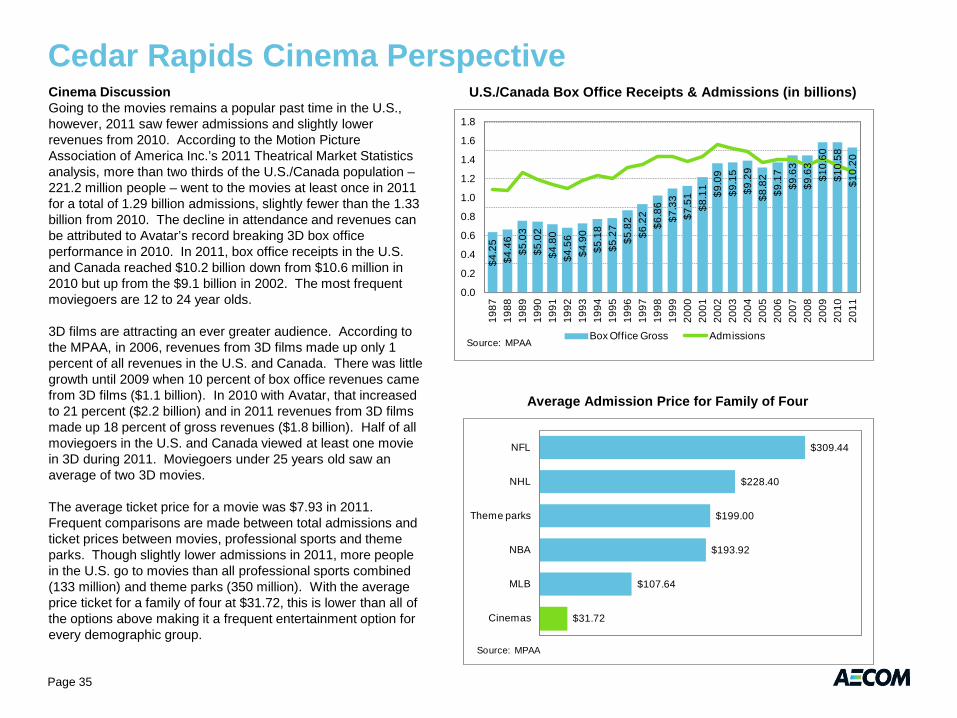
Cinema Discussion Going to the movies remains a popular past time in the U.S., however, 2011 saw fewer admissions and slightly lower revenues from 2010. According to the Motion Picture Association of America Inc.’s 2011 Theatrical Market Statistics analysis, more than two thirds of the U.S./Canada population – 221.2 million people – went to the movies at least once in 2011 for a total of 1.29 billion admissions, slightly fewer than the 1.33 billion from 2010. The decline in attendance and revenues can be attributed to Avatar’s record breaking 3D box office performance in 2010. In 2011, box office receipts in the U.S. and Canada reached $10.2 billion down from $10.6 million in 2010 but up from the $9.1 billion in 2002. The most frequent moviegoers are 12 to 24 year olds. 3D films are attracting an ever greater audience. According to the MPAA, in 2006, revenues from 3D films made up only 1 percent of all revenues in the U.S. and Canada. There was little growth until 2009 when 10 percent of box office revenues came from 3D films ($1.1 billion). In 2010 with Avatar, that increased to 21 percent ($2.2 billion) and in 2011 revenues from 3D films made up 18 percent of gross revenues ($1.8 billion). Half of all moviegoers in the U.S. and Canada viewed at least one movie in 3D during 2011. Moviegoers under 25 years old saw an average of two 3D movies. The average ticket price for a movie was $7.93 in 2011. Frequent comparisons are made between total admissions and ticket prices between movies, professional sports and theme parks. Though slightly lower admissions in 2011, more people in the U.S. go to movies than all professional sports combined (133 million) and theme parks (350 million). With the average price ticket for a family of four at $31.72, this is lower than all of the options above making it a frequent entertainment option for every demographic group.
U.S./Canada Box Office Receipts & Admissions (in billions)
$4.2
5$4
.46
$5.0
3$5
.02
$4.8
0$4
.56
$4.9
0$5
.18
$5.2
7$5
.82
$6.2
2$6
.86
$7.3
3$7
.51
$8.1
1 $9.0
9$9
.15
$9.2
9$8
.82
$9.1
7$9
.63
$9.6
3$1
0.60
$10.
58$1
0.20
0.0
0.2
0.4
0.6
0.8
1.0
1.2
1.4
1.6
1.8
1987
1988
1989
1990
1991
1992
1993
1994
1995
1996
1997
1998
1999
2000
2001
2002
2003
2004
2005
2006
2007
2008
2009
2010
2011
Source: MPAABox Office Gross Admissions
Average Admission Price for Family of Four
$31.72
$107.64
$193.92
$199.00
$228.40
$309.44
Cinemas
MLB
NBA
Theme parks
NHL
NFL
Source: MPAA
Cedar Rapids Cinema Perspective
Page 36
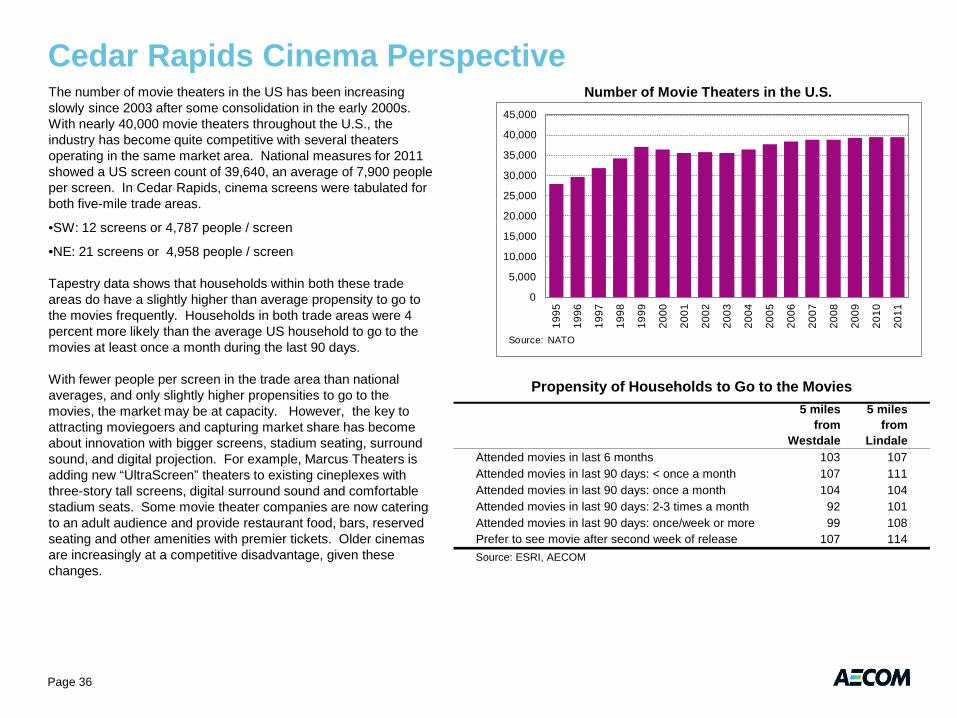
The number of movie theaters in the US has been increasing slowly since 2003 after some consolidation in the early 2000s. With nearly 40,000 movie theaters throughout the U.S., the industry has become quite competitive with several theaters operating in the same market area. National measures for 2011 showed a US screen count of 39,640, an average of 7,900 people per screen. In Cedar Rapids, cinema screens were tabulated for both five-mile trade areas.
•SW: 12 screens or 4,787 people / screen
•NE: 21 screens or 4,958 people / screen Tapestry data shows that households within both these trade areas do have a slightly higher than average propensity to go to the movies frequently. Households in both trade areas were 4 percent more likely than the average US household to go to the movies at least once a month during the last 90 days. With fewer people per screen in the trade area than national averages, and only slightly higher propensities to go to the movies, the market may be at capacity. However, the key to attracting moviegoers and capturing market share has become about innovation with bigger screens, stadium seating, surround sound, and digital projection. For example, Marcus Theaters is adding new “UltraScreen” theaters to existing cineplexes with three-story tall screens, digital surround sound and comfortable stadium seats. Some movie theater companies are now catering to an adult audience and provide restaurant food, bars, reserved seating and other amenities with premier tickets. Older cinemas are increasingly at a competitive disadvantage, given these changes.
Number of Movie Theaters in the U.S.
0
5,000
10,000
15,000
20,000
25,000
30,000
35,000
40,000
45,000
1995
1996
1997
1998
1999
2000
2001
2002
2003
2004
2005
2006
2007
2008
2009
2010
2011
Source: NATO
5 miles from
Westdale
5 miles from
LindaleAttended movies in last 6 months 103 107Attended movies in last 90 days: < once a month 107 111Attended movies in last 90 days: once a month 104 104Attended movies in last 90 days: 2-3 times a month 92 101Attended movies in last 90 days: once/week or more 99 108Prefer to see movie after second week of release 107 114Source: ESRI, AECOM
Propensity of Households to Go to the Movies
Cedar Rapids Retail Perspective
Page 37
Retail Competition
There are a number of competitive retail projects in various planning stages across the Cedar Rapids region. These include the Fountains, which appears to be the primary competitor to Westdale. The proposed program includes about 36,000 SF of retail space, as well as an additional 200,000 SF of office and/or retail space. The project will benefit from a 5-year tax abatement, in part linked with proposed construction of new class A office space. Retail rents are advertised at $14.95 per SF NNN.
Interviews suggest that the Lindale Mall is contemplating an expansion. Conversations with City staff only confirmed that conversations with mall ownership have not started yet.
There are several smaller proposed strip centers across the region, mostly in Marion and Hiawatha. These smaller 8,000 to 15,000 SF projects are viewed as modest competitive threats, only to the extent that specific restaurant chains are evaluating alternative locations on the SW or NE side of the Region; Lincoln View Square in Marion is one example, with quoted rents at $15.95 per SF.
The larger Cedar Rapids / Iowa City Region continues to be influenced by the decision made several years ago to build the Coral Ridge Mall. While resulting impacts on Westdale are known, it is also interesting to watch impacts on the Sycamore Mall in Iowa City. This mall entered bankruptcy in October 2012, related to reports that Von Maur has planned to leave the mall in 2013.
Rents
A majority of older but recently built vacant retail spaces are advertised at between $12 and $14 per SF NNN. One or two projects were identified with rent levels approaching $18 to $20 per SF, located near the Lindale Mall. Rent perspective include:
• Westwood Plaza (70,000 SF) $6-$9/SF
• Marketplace on 1st (6,000 SF) $20-$24/SF
• Collins Road Sq. (36,900 SF) $6-$9/SF
• Marion Square (1,500 SF) $12 per SF
• Town & Country SC (28,600 SF) $6-$9/SF
• Czech Lane Plaza (3,400 SF) $13/SF
The majority of projects noted above with rents below $10 per SF were built before 1990. Newer, post 1990 projects all appear to be sustaining rents above $12 per SF.
Vacancy
The Vacancy analysis considered both the total amount of vacant space, as well as a determination of “competitive” vacant space, which excludes two larger stores in the SW market. These two stores include:
• Econo Foods (65,000 SF)
• Kmart (130,000 SF)
• Old Target (63,000 SF)
Considering these three buildings, our analysis arrived at the following vacancy factors
• SW Total: 321,700 SF (15% Vacant)
• SW Competitive: 63,900 SF (2.9% Vacant
• NE Total: 128,900 SF (3.3%)
The SW side accounts for about 33% of competitive vacant space.
In general, the “competitive” retail vacancy measures noted here are indicative of a healthy market, one that could support new development.
Retail Market Findings
Page 38
Core findings include:
• “Competitive” retail vacancy for the SW side is about 3%, compared to national retail vacancy over 12% (Q4 2012 CBRE).
• Retail pull factors for the Cedar Rapids MSA are modestly positive, suggesting that existing retail offerings largely serve local residents.
• While the Lindale Mall area currently supports the majority of regional retail space, assessments noted a preponderance of older (>15-year old) retail space, with limited sites available for new larger scale retail projects.
• Retail sales in Cedar Rapids have been recovering at rates equal to or above state averages since 2010, which is significant. As the regional economy’s pace of job creation recovers toward historic averages, further support for retail spending is presumed.
• Two competitive retail projects were identified; The Fountains, as well as a proposal to expand the Lindale Mall. The Fountains has secured City incentives and appears ready to move forward in search of tenants
• Current rents for newer space with national chains are driving rents toward $15 per square foot NNN, with a small number of centers at $20 per SF.
• The US retail industry is still recovery mode, and retailers are just beginning to focus on new stores, even as the internet continues to alter many retailer business plans, with one clear result being smaller store sizes. A majority of chains are still weighing closure
of underperforming stores as new sites are considered.
• The analysis showed that the SW side appears under served in apparel, shoes, jewelry, & accessories, electronics, miscellaneous, book stores, and food & beverage.
• Between 1990 and 2009, the Cedar Rapids region added about 250,000 SF of retail space per year, fueled in large part by big box store development. Presuming that the local market can sustain population growth of 0.9% and income growth of 3.5%, we anticipate that future development will unfold at a slower average annual pace, of about 140,000 SF per year. In the short-term, while it is not clear that sufficient national chain tenants exist to meet this demand, one clear offset relates to tenants who choose to vacate older space at the end of their lease-term, to locate in new space at a roughly comparable rent.
• For the defined trade areas around Westdale, the analysis identified incremental potential spending support between 2013 and 2017 for up to about 260,000 square feet of retail space tied to defined primary and secondary markets. Reflecting a conservative approach, the analysis did not expressly presume capture from tertiary markets across Cedar Rapids or Iowa City. With the proper tenant mix, competition for regional lifestyle oriented retail and entertainment spending should be an expectation.
• From a tenanting standpoint, health care tenants are seen as more likely in the future.
Residential Market Analysis Introduction
The Residential Market Analysis folds in several components:
• Analysis of changes in underlying population and household growth for the City and Metropolitan Area.
• Assessment of Building Permit data by quadrant for the City
• Analysis of rental apartment rates on a per SF basis
• Analysis of condominium unit pricing
• Assessment of senior markets
• Evaluation of overall market demand growth in coming years
• Discussion of senior housing trends
Page 39
General Market Perspective
Page 40
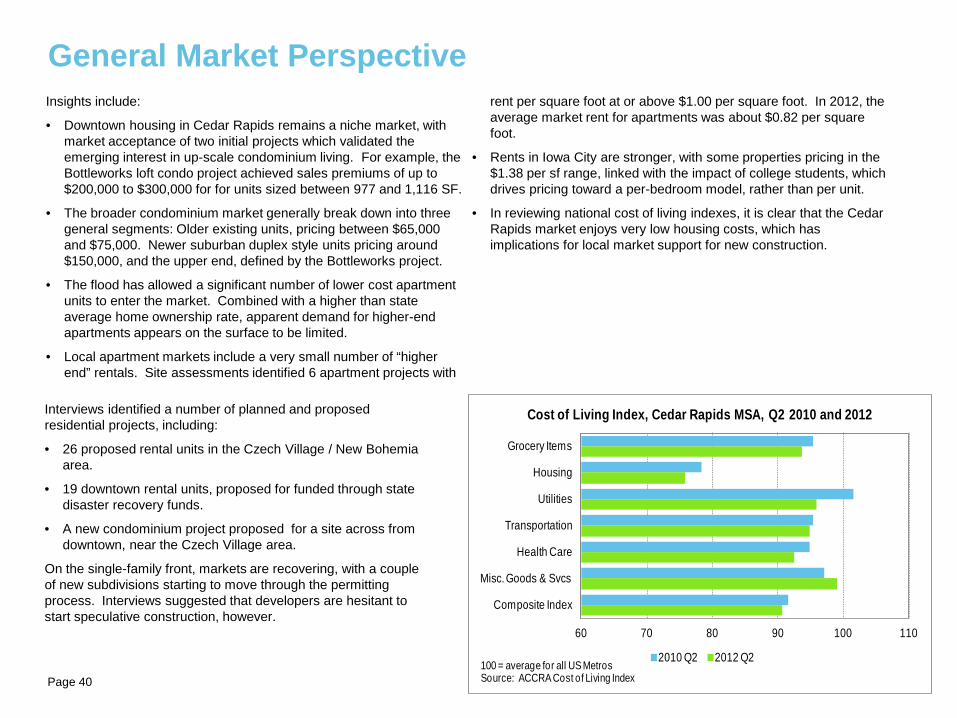
Insights include:
• Downtown housing in Cedar Rapids remains a niche market, with market acceptance of two initial projects which validated the emerging interest in up-scale condominium living. For example, the Bottleworks loft condo project achieved sales premiums of up to $200,000 to $300,000 for for units sized between 977 and 1,116 SF.
• The broader condominium market generally break down into three general segments: Older existing units, pricing between $65,000 and $75,000. Newer suburban duplex style units pricing around $150,000, and the upper end, defined by the Bottleworks project.
• The flood has allowed a significant number of lower cost apartment units to enter the market. Combined with a higher than state average home ownership rate, apparent demand for higher-end apartments appears on the surface to be limited.
• Local apartment markets include a very small number of “higher end” rentals. Site assessments identified 6 apartment projects with
rent per square foot at or above $1.00 per square foot. In 2012, the average market rent for apartments was about $0.82 per square foot.
• Rents in Iowa City are stronger, with some properties pricing in the $1.38 per sf range, linked with the impact of college students, which drives pricing toward a per-bedroom model, rather than per unit.
• In reviewing national cost of living indexes, it is clear that the Cedar Rapids market enjoys very low housing costs, which has implications for local market support for new construction.
Interviews identified a number of planned and proposed residential projects, including:
• 26 proposed rental units in the Czech Village / New Bohemia area.
• 19 downtown rental units, proposed for funded through state disaster recovery funds.
• A new condominium project proposed for a site across from downtown, near the Czech Village area.
On the single-family front, markets are recovering, with a couple of new subdivisions starting to move through the permitting process. Interviews suggested that developers are hesitant to start speculative construction, however.
60 70 80 90 100 110
Grocery Items
Housing
Utilities
Transportation
Health Care
Misc. Goods & Svcs
Composite Index
100 = average for all US MetrosSource: ACCRA Cost of Living Index
Cost of Living Index, Cedar Rapids MSA, Q2 2010 and 2012
2010 Q2 2012 Q2
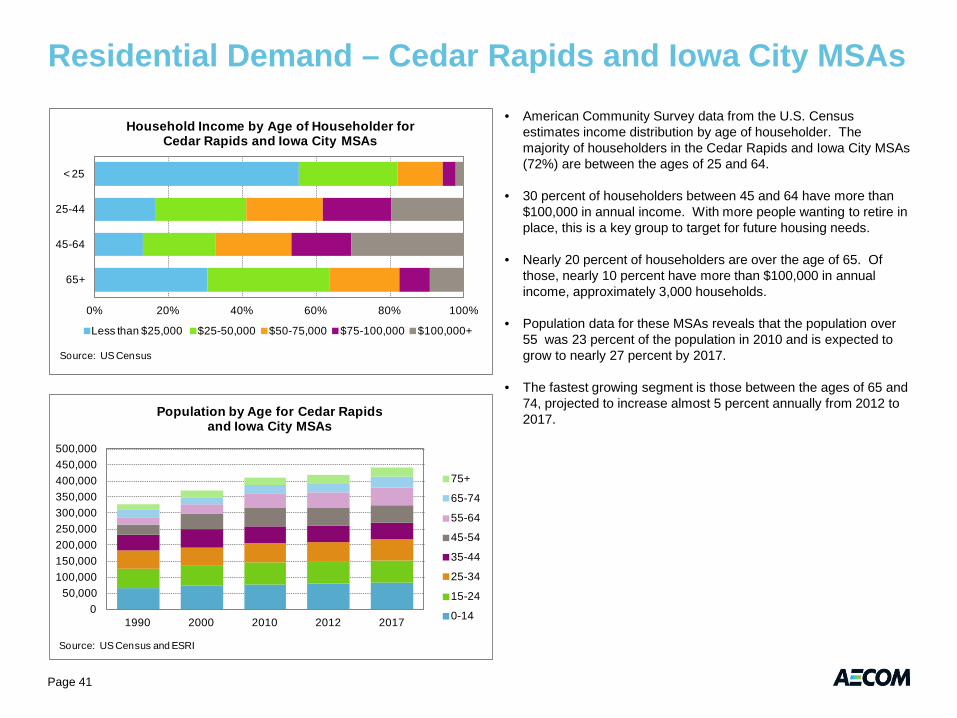
• American Community Survey data from the U.S. Census estimates income distribution by age of householder. The majority of householders in the Cedar Rapids and Iowa City MSAs (72%) are between the ages of 25 and 64.
• 30 percent of householders between 45 and 64 have more than $100,000 in annual income. With more people wanting to retire in place, this is a key group to target for future housing needs.
• Nearly 20 percent of householders are over the age of 65. Of those, nearly 10 percent have more than $100,000 in annual income, approximately 3,000 households.
• Population data for these MSAs reveals that the population over 55 was 23 percent of the population in 2010 and is expected to grow to nearly 27 percent by 2017.
• The fastest growing segment is those between the ages of 65 and 74, projected to increase almost 5 percent annually from 2012 to 2017.
Residential Demand – Cedar Rapids and Iowa City MSAs
0% 20% 40% 60% 80% 100%
< 25
25-44
45-64
65+
Source: US Census
Household Income by Age of Householder for Cedar Rapids and Iowa City MSAs
Less than $25,000 $25-50,000 $50-75,000 $75-100,000 $100,000+
050,000
100,000150,000200,000250,000300,000350,000400,000450,000500,000
1990 2000 2010 2012 2017
Source: US Census and ESRI
Population by Age for Cedar Rapids and Iowa City MSAs
75+
65-74
55-64
45-54
35-44
25-34
15-24
0-14
Page 41
Residential Market Net Demand – 2012 to 2017
Page 42
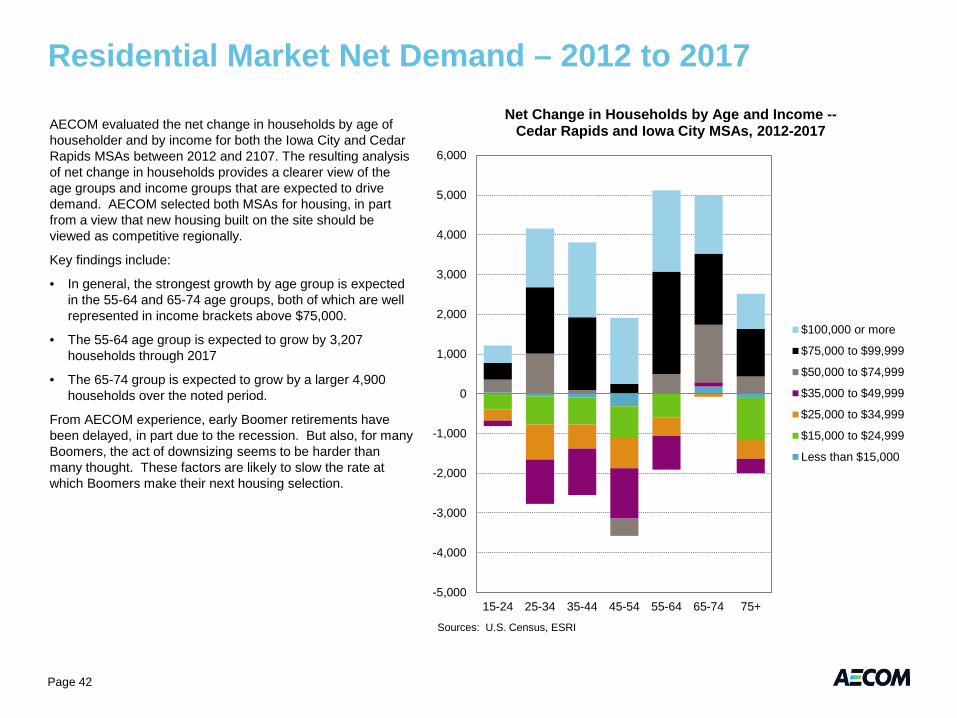
AECOM evaluated the net change in households by age of householder and by income for both the Iowa City and Cedar Rapids MSAs between 2012 and 2107. The resulting analysis of net change in households provides a clearer view of the age groups and income groups that are expected to drive demand. AECOM selected both MSAs for housing, in part from a view that new housing built on the site should be viewed as competitive regionally.
Key findings include:
• In general, the strongest growth by age group is expected in the 55-64 and 65-74 age groups, both of which are well represented in income brackets above $75,000.
• The 55-64 age group is expected to grow by 3,207 households through 2017
• The 65-74 group is expected to grow by a larger 4,900 households over the noted period.
From AECOM experience, early Boomer retirements have been delayed, in part due to the recession. But also, for many Boomers, the act of downsizing seems to be harder than many thought. These factors are likely to slow the rate at which Boomers make their next housing selection.
-5,000
-4,000
-3,000
-2,000
-1,000
0
1,000
2,000
3,000
4,000
5,000
6,000
15-24 25-34 35-44 45-54 55-64 65-74 75+
Sources: U.S. Census, ESRI
Net Change in Households by Age and Income -- Cedar Rapids and Iowa City MSAs, 2012-2017
$100,000 or more
$75,000 to $99,999
$50,000 to $74,999
$35,000 to $49,999
$25,000 to $34,999
$15,000 to $24,999
Less than $15,000
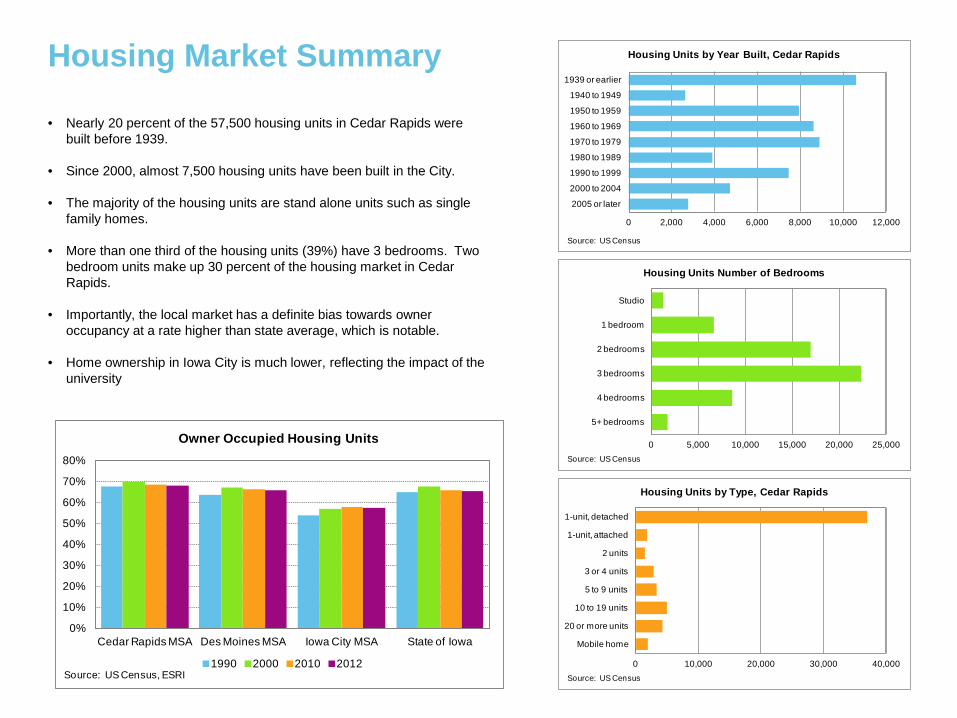
0 5,000 10,000 15,000 20,000 25,000
Studio
1 bedroom
2 bedrooms
3 bedrooms
4 bedrooms
5+ bedrooms
Source: US Census
Housing Units Number of Bedrooms
0 10,000 20,000 30,000 40,000
1-unit, detached
1-unit, attached
2 units
3 or 4 units
5 to 9 units
10 to 19 units
20 or more units
Mobile home
Source: US Census
Housing Units by Type, Cedar Rapids
Housing Market Summary
• Nearly 20 percent of the 57,500 housing units in Cedar Rapids were built before 1939.
• Since 2000, almost 7,500 housing units have been built in the City.
• The majority of the housing units are stand alone units such as single family homes.
• More than one third of the housing units (39%) have 3 bedrooms. Two bedroom units make up 30 percent of the housing market in Cedar Rapids.
• Importantly, the local market has a definite bias towards owner occupancy at a rate higher than state average, which is notable.
• Home ownership in Iowa City is much lower, reflecting the impact of the university
0 2,000 4,000 6,000 8,000 10,000 12,000
2005 or later
2000 to 2004
1990 to 1999
1980 to 1989
1970 to 1979
1960 to 1969
1950 to 1959
1940 to 1949
1939 or earlier
Source: US Census
Housing Units by Year Built, Cedar Rapids
0%
10%
20%
30%
40%
50%
60%
70%
80%
Cedar Rapids MSA Des Moines MSA Iowa City MSA State of Iowa
Source: US Census, ESRI
Owner Occupied Housing Units
1990 2000 2010 2012
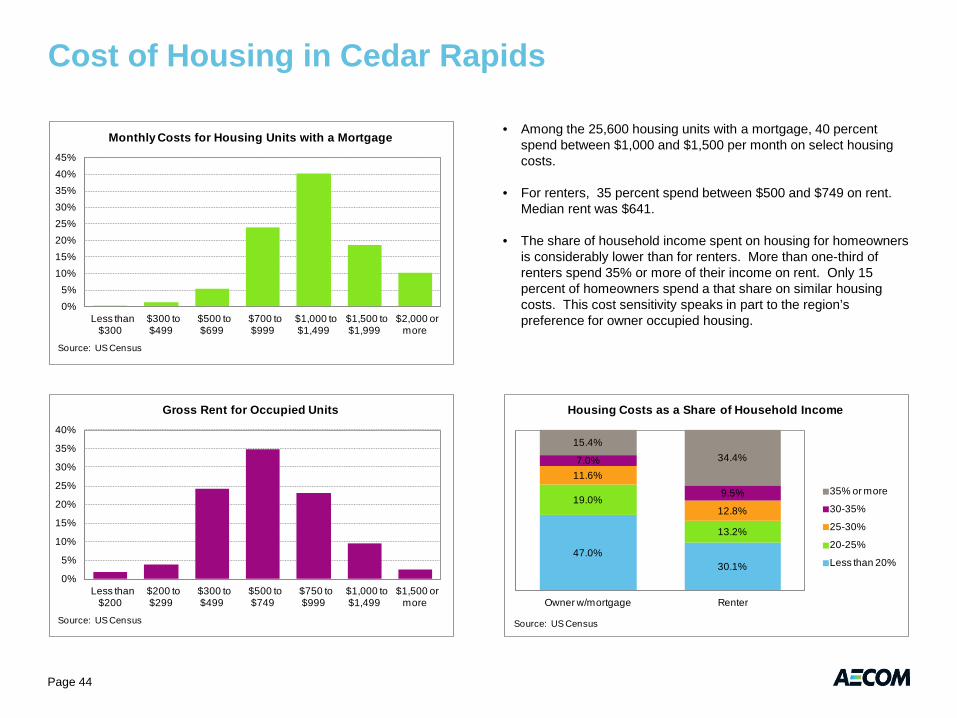
0%
5%
10%
15%
20%
25%
30%
35%
40%
Less than $200
$200 to $299
$300 to $499
$500 to $749
$750 to $999
$1,000 to $1,499
$1,500 or more
Source: US Census
Gross Rent for Occupied Units
Cost of Housing in Cedar Rapids
• Among the 25,600 housing units with a mortgage, 40 percent spend between $1,000 and $1,500 per month on select housing costs.
• For renters, 35 percent spend between $500 and $749 on rent. Median rent was $641.
• The share of household income spent on housing for homeowners is considerably lower than for renters. More than one-third of renters spend 35% or more of their income on rent. Only 15 percent of homeowners spend a that share on similar housing costs. This cost sensitivity speaks in part to the region’s preference for owner occupied housing.
47.0%30.1%
19.0%
13.2%
11.6%
12.8%
7.0%
9.5%
15.4%34.4%
Owner w/mortgage Renter
Source: US Census
Housing Costs as a Share of Household Income
35% or more
30-35%
25-30%
20-25%
Less than 20%
0%5%
10%15%20%25%30%35%40%45%
Less than $300
$300 to $499
$500 to $699
$700 to $999
$1,000 to $1,499
$1,500 to $1,999
$2,000 or more
Source: US Census
Monthly Costs for Housing Units with a Mortgage
Page 44
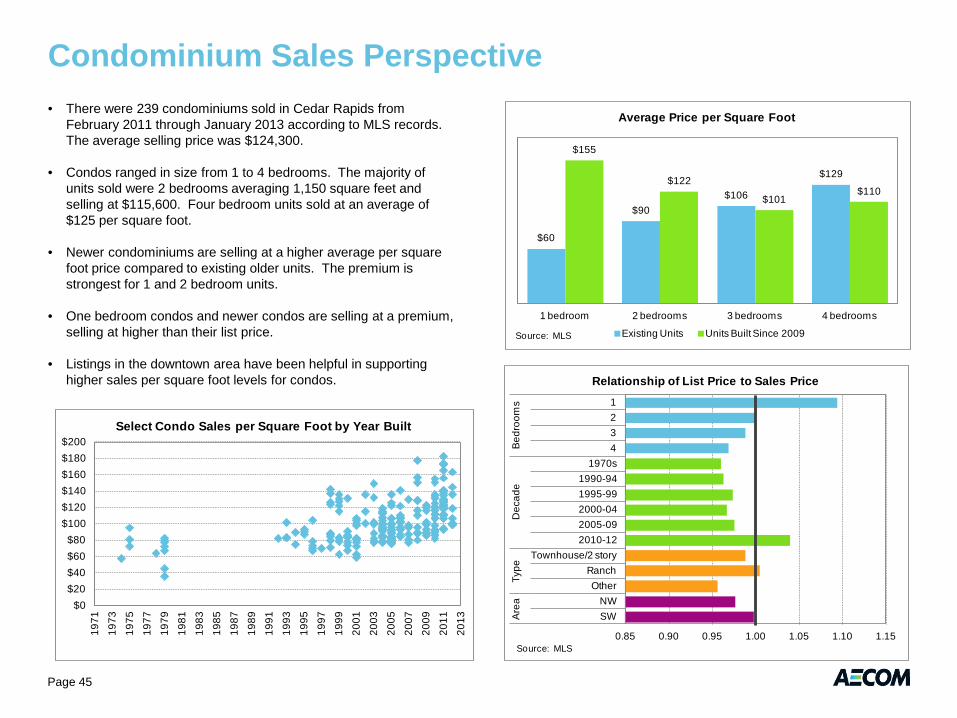
0.85 0.90 0.95 1.00 1.05 1.10 1.15
1234
1970s1990-941995-992000-042005-092010-12
Townhouse/2 storyRanchOther
NWSW
Bed
room
sD
ecad
eTy
peA
rea
Source: MLS
Relationship of List Price to Sales Price
Condominium Sales Perspective
• There were 239 condominiums sold in Cedar Rapids from February 2011 through January 2013 according to MLS records. The average selling price was $124,300.
• Condos ranged in size from 1 to 4 bedrooms. The majority of units sold were 2 bedrooms averaging 1,150 square feet and selling at $115,600. Four bedroom units sold at an average of $125 per square foot.
• Newer condominiums are selling at a higher average per square foot price compared to existing older units. The premium is strongest for 1 and 2 bedroom units.
• One bedroom condos and newer condos are selling at a premium, selling at higher than their list price.
• Listings in the downtown area have been helpful in supporting higher sales per square foot levels for condos.
$0$20$40$60$80
$100$120$140$160$180$200
1971
1973
1975
1977
1979
1981
1983
1985
1987
1989
1991
1993
1995
1997
1999
2001
2003
2005
2007
2009
2011
2013
Select Condo Sales per Square Foot by Year Built
$60
$90$106
$129
$155
$122
$101$110
1 bedroom 2 bedrooms 3 bedrooms 4 bedrooms
Source: MLS
Average Price per Square Foot
Existing Units Units Built Since 2009
Page 45
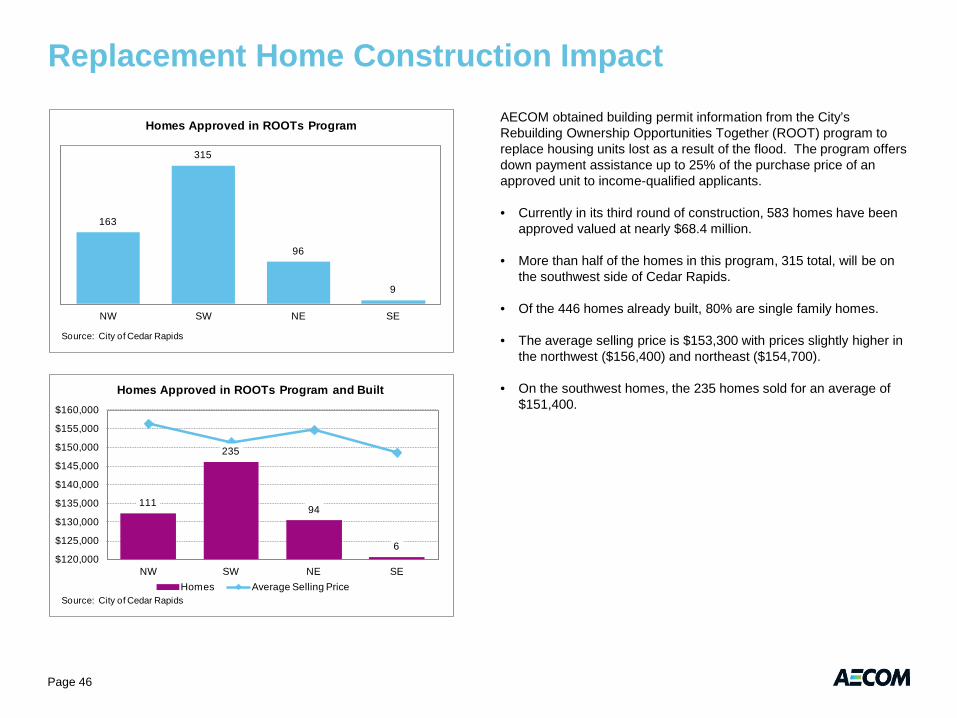
AECOM obtained building permit information from the City’s Rebuilding Ownership Opportunities Together (ROOT) program to replace housing units lost as a result of the flood. The program offers down payment assistance up to 25% of the purchase price of an approved unit to income-qualified applicants.
• Currently in its third round of construction, 583 homes have been approved valued at nearly $68.4 million.
• More than half of the homes in this program, 315 total, will be on the southwest side of Cedar Rapids.
• Of the 446 homes already built, 80% are single family homes.
• The average selling price is $153,300 with prices slightly higher in the northwest ($156,400) and northeast ($154,700).
• On the southwest homes, the 235 homes sold for an average of $151,400.
111
235
94
6$120,000
$125,000
$130,000
$135,000
$140,000
$145,000
$150,000
$155,000
$160,000
NW SW NE SE
Source: City of Cedar Rapids
Homes Approved in ROOTs Program and Built
Homes Average Selling Price
Replacement Home Construction Impact
163
315
96
9
NW SW NE SE
Source: City of Cedar Rapids
Homes Approved in ROOTs Program
Page 46
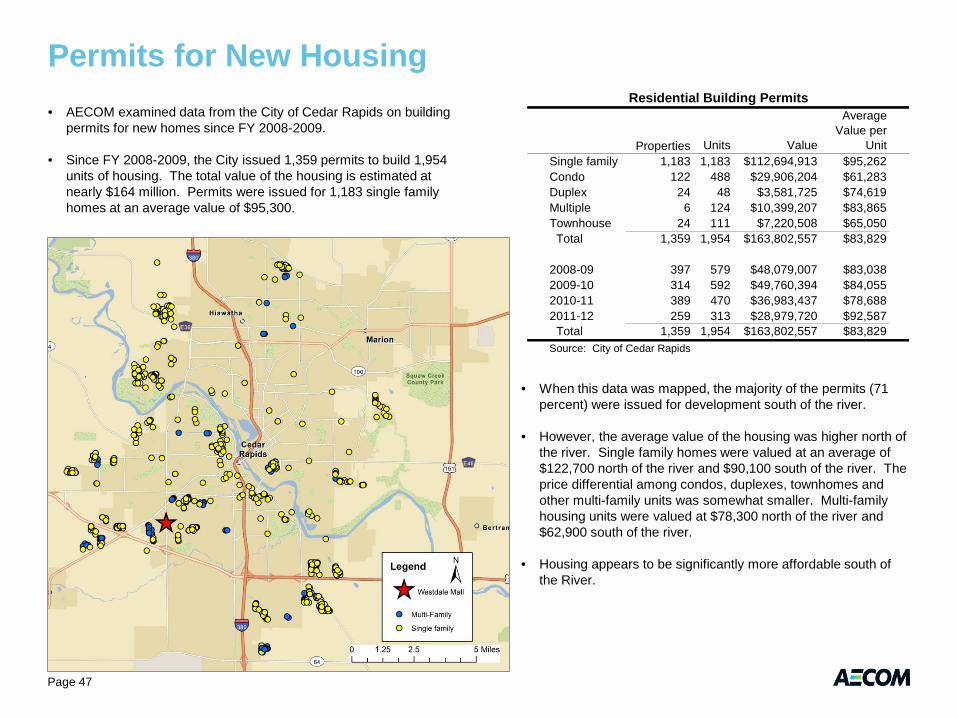
Properties Units Value
Average Value per
UnitSingle family 1,183 1,183 $112,694,913 $95,262Condo 122 488 $29,906,204 $61,283Duplex 24 48 $3,581,725 $74,619Multiple 6 124 $10,399,207 $83,865Townhouse 24 111 $7,220,508 $65,050 Total 1,359 1,954 $163,802,557 $83,829
2008-09 397 579 $48,079,007 $83,0382009-10 314 592 $49,760,394 $84,0552010-11 389 470 $36,983,437 $78,6882011-12 259 313 $28,979,720 $92,587 Total 1,359 1,954 $163,802,557 $83,829Source: City of Cedar Rapids
Residential Building Permits
Permits for New Housing
Page 47
• AECOM examined data from the City of Cedar Rapids on building permits for new homes since FY 2008-2009.
• Since FY 2008-2009, the City issued 1,359 permits to build 1,954 units of housing. The total value of the housing is estimated at nearly $164 million. Permits were issued for 1,183 single family homes at an average value of $95,300.
• When this data was mapped, the majority of the permits (71 percent) were issued for development south of the river.
• However, the average value of the housing was higher north of the river. Single family homes were valued at an average of $122,700 north of the river and $90,100 south of the river. The price differential among condos, duplexes, townhomes and other multi-family units was somewhat smaller. Multi-family housing units were valued at $78,300 north of the river and $62,900 south of the river.
• Housing appears to be significantly more affordable south of the River.
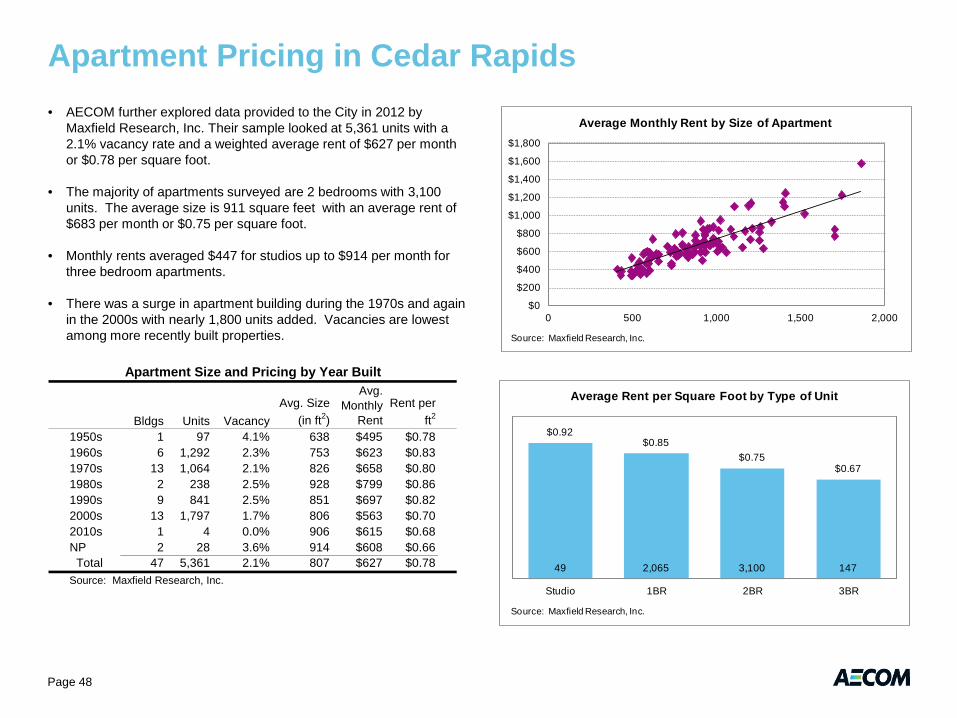
Apartment Pricing in Cedar Rapids • AECOM further explored data provided to the City in 2012 by
Maxfield Research, Inc. Their sample looked at 5,361 units with a 2.1% vacancy rate and a weighted average rent of $627 per month or $0.78 per square foot.
• The majority of apartments surveyed are 2 bedrooms with 3,100 units. The average size is 911 square feet with an average rent of $683 per month or $0.75 per square foot.
• Monthly rents averaged $447 for studios up to $914 per month for three bedroom apartments.
• There was a surge in apartment building during the 1970s and again in the 2000s with nearly 1,800 units added. Vacancies are lowest among more recently built properties.
$0.92$0.85
$0.75$0.67
49 2,065 3,100 147
Studio 1BR 2BR 3BR
Source: Maxfield Research, Inc.
Average Rent per Square Foot by Type of Unit
$0
$200
$400
$600
$800
$1,000
$1,200
$1,400
$1,600
$1,800
0 500 1,000 1,500 2,000
Source: Maxfield Research, Inc.
Average Monthly Rent by Size of Apartment
Page 48
Bldgs Units VacancyAvg. Size
(in ft2)
Avg. Monthly
RentRent per
ft2
1950s 1 97 4.1% 638 $495 $0.781960s 6 1,292 2.3% 753 $623 $0.831970s 13 1,064 2.1% 826 $658 $0.801980s 2 238 2.5% 928 $799 $0.861990s 9 841 2.5% 851 $697 $0.822000s 13 1,797 1.7% 806 $563 $0.702010s 1 4 0.0% 906 $615 $0.68NP 2 28 3.6% 914 $608 $0.66 Total 47 5,361 2.1% 807 $627 $0.78Source: Maxfield Research, Inc.
Apartment Size and Pricing by Year Built
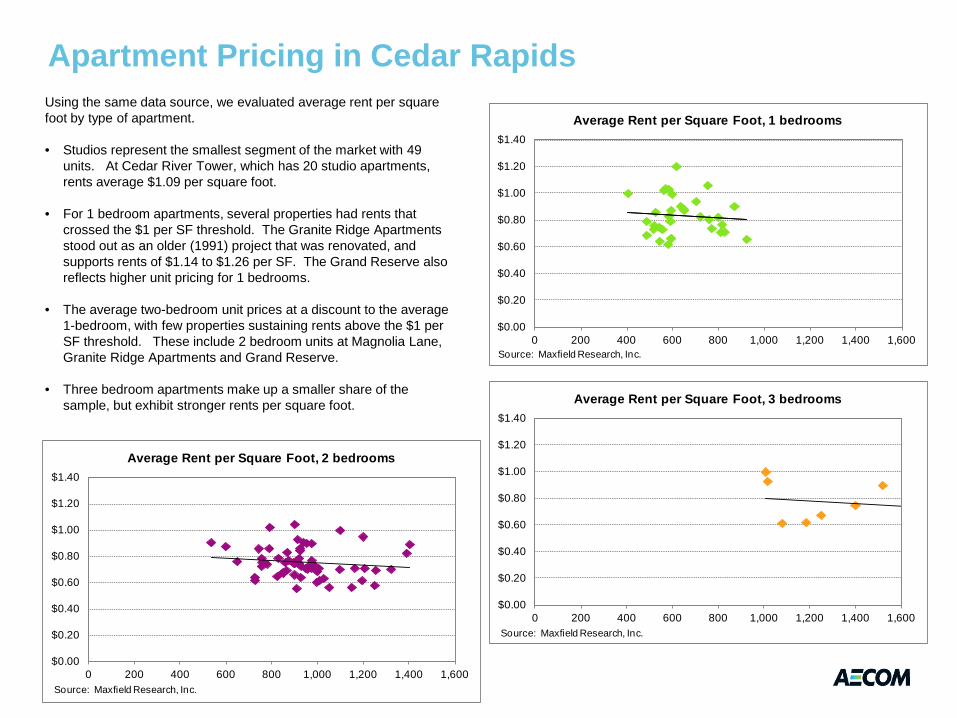
Apartment Pricing in Cedar Rapids
$0.00
$0.20
$0.40
$0.60
$0.80
$1.00
$1.20
$1.40
0 200 400 600 800 1,000 1,200 1,400 1,600Source: Maxfield Research, Inc.
Average Rent per Square Foot, 1 bedrooms
$0.00
$0.20
$0.40
$0.60
$0.80
$1.00
$1.20
$1.40
0 200 400 600 800 1,000 1,200 1,400 1,600Source: Maxfield Research, Inc.
Average Rent per Square Foot, 2 bedrooms
Using the same data source, we evaluated average rent per square foot by type of apartment.
• Studios represent the smallest segment of the market with 49 units. At Cedar River Tower, which has 20 studio apartments, rents average $1.09 per square foot.
• For 1 bedroom apartments, several properties had rents that crossed the $1 per SF threshold. The Granite Ridge Apartments stood out as an older (1991) project that was renovated, and supports rents of $1.14 to $1.26 per SF. The Grand Reserve also reflects higher unit pricing for 1 bedrooms.
• The average two-bedroom unit prices at a discount to the average 1-bedroom, with few properties sustaining rents above the $1 per SF threshold. These include 2 bedroom units at Magnolia Lane, Granite Ridge Apartments and Grand Reserve.
• Three bedroom apartments make up a smaller share of the sample, but exhibit stronger rents per square foot.
$0.00
$0.20
$0.40
$0.60
$0.80
$1.00
$1.20
$1.40
0 200 400 600 800 1,000 1,200 1,400 1,600Source: Maxfield Research, Inc.
Average Rent per Square Foot, 3 bedrooms
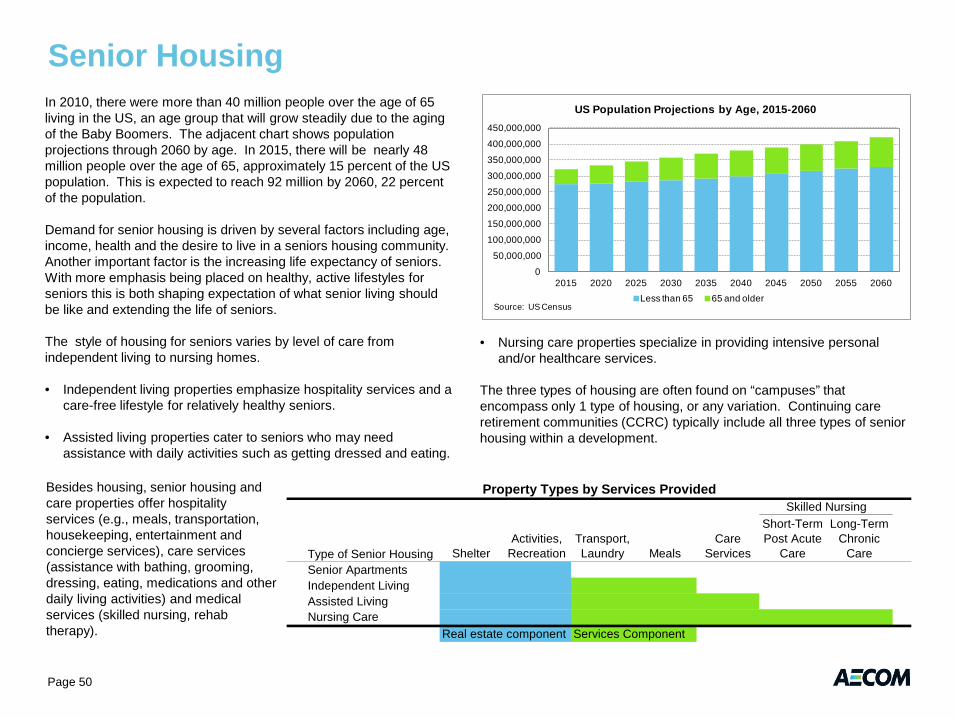
Senior Housing
Page 50
In 2010, there were more than 40 million people over the age of 65 living in the US, an age group that will grow steadily due to the aging of the Baby Boomers. The adjacent chart shows population projections through 2060 by age. In 2015, there will be nearly 48 million people over the age of 65, approximately 15 percent of the US population. This is expected to reach 92 million by 2060, 22 percent of the population.
Demand for senior housing is driven by several factors including age, income, health and the desire to live in a seniors housing community. Another important factor is the increasing life expectancy of seniors. With more emphasis being placed on healthy, active lifestyles for seniors this is both shaping expectation of what senior living should be like and extending the life of seniors.
The style of housing for seniors varies by level of care from independent living to nursing homes.
• Independent living properties emphasize hospitality services and a care-free lifestyle for relatively healthy seniors.
• Assisted living properties cater to seniors who may need assistance with daily activities such as getting dressed and eating.
0
50,000,000
100,000,000
150,000,000
200,000,000
250,000,000
300,000,000
350,000,000
400,000,000
450,000,000
2015 2020 2025 2030 2035 2040 2045 2050 2055 2060
Source: US Census
US Population Projections by Age, 2015-2060
Less than 65 65 and older
Type of Senior Housing ShelterActivities,
RecreationTransport, Laundry Meals
Care Services
Short-Term Post Acute
Care
Long-Term Chronic
CareSenior ApartmentsIndependent LivingAssisted LivingNursing Care
Real estate component Services Component
Skilled NursingProperty Types by Services Provided
• Nursing care properties specialize in providing intensive personal and/or healthcare services.
The three types of housing are often found on “campuses” that encompass only 1 type of housing, or any variation. Continuing care retirement communities (CCRC) typically include all three types of senior housing within a development.
Besides housing, senior housing and care properties offer hospitality services (e.g., meals, transportation, housekeeping, entertainment and concierge services), care services (assistance with bathing, grooming, dressing, eating, medications and other daily living activities) and medical services (skilled nursing, rehab therapy).
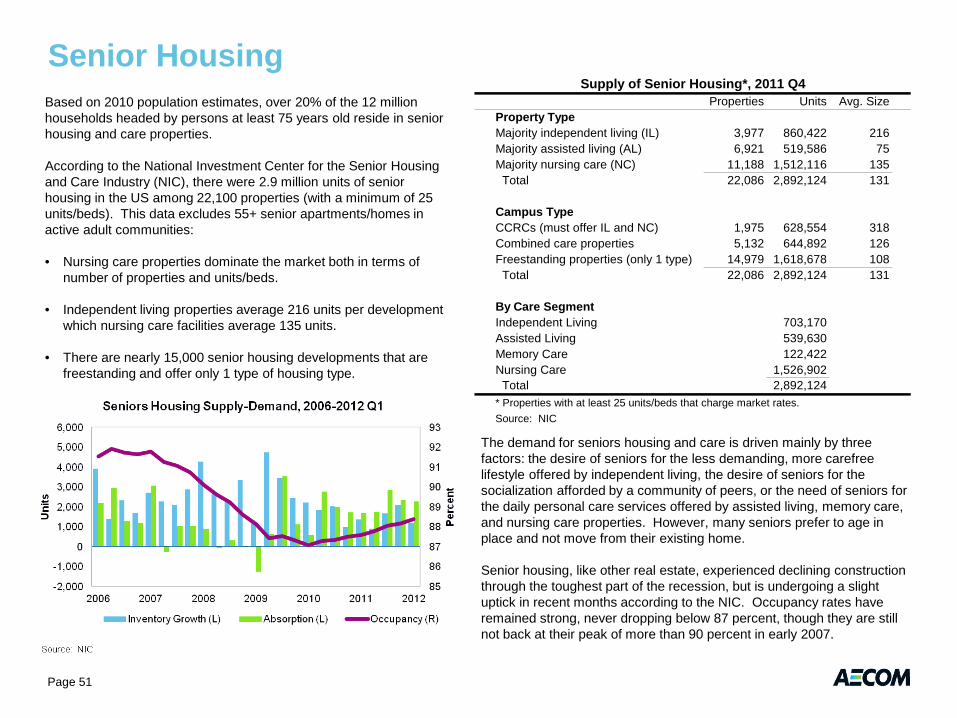
Properties Units Avg. SizeProperty TypeMajority independent living (IL) 3,977 860,422 216Majority assisted living (AL) 6,921 519,586 75Majority nursing care (NC) 11,188 1,512,116 135 Total 22,086 2,892,124 131
Campus TypeCCRCs (must offer IL and NC) 1,975 628,554 318Combined care properties 5,132 644,892 126Freestanding properties (only 1 type) 14,979 1,618,678 108 Total 22,086 2,892,124 131
By Care SegmentIndependent Living 703,170Assisted Living 539,630Memory Care 122,422Nursing Care 1,526,902 Total 2,892,124* Properties with at least 25 units/beds that charge market rates.Source: NIC
Supply of Senior Housing*, 2011 Q4Senior Housing
Page 51
Based on 2010 population estimates, over 20% of the 12 million households headed by persons at least 75 years old reside in senior housing and care properties.
According to the National Investment Center for the Senior Housing and Care Industry (NIC), there were 2.9 million units of senior housing in the US among 22,100 properties (with a minimum of 25 units/beds). This data excludes 55+ senior apartments/homes in active adult communities:
• Nursing care properties dominate the market both in terms of number of properties and units/beds.
• Independent living properties average 216 units per development which nursing care facilities average 135 units.
• There are nearly 15,000 senior housing developments that are freestanding and offer only 1 type of housing type.
The demand for seniors housing and care is driven mainly by three factors: the desire of seniors for the less demanding, more carefree lifestyle offered by independent living, the desire of seniors for the socialization afforded by a community of peers, or the need of seniors for the daily personal care services offered by assisted living, memory care, and nursing care properties. However, many seniors prefer to age in place and not move from their existing home.
Senior housing, like other real estate, experienced declining construction through the toughest part of the recession, but is undergoing a slight uptick in recent months according to the NIC. Occupancy rates have remained strong, never dropping below 87 percent, though they are still not back at their peak of more than 90 percent in early 2007.
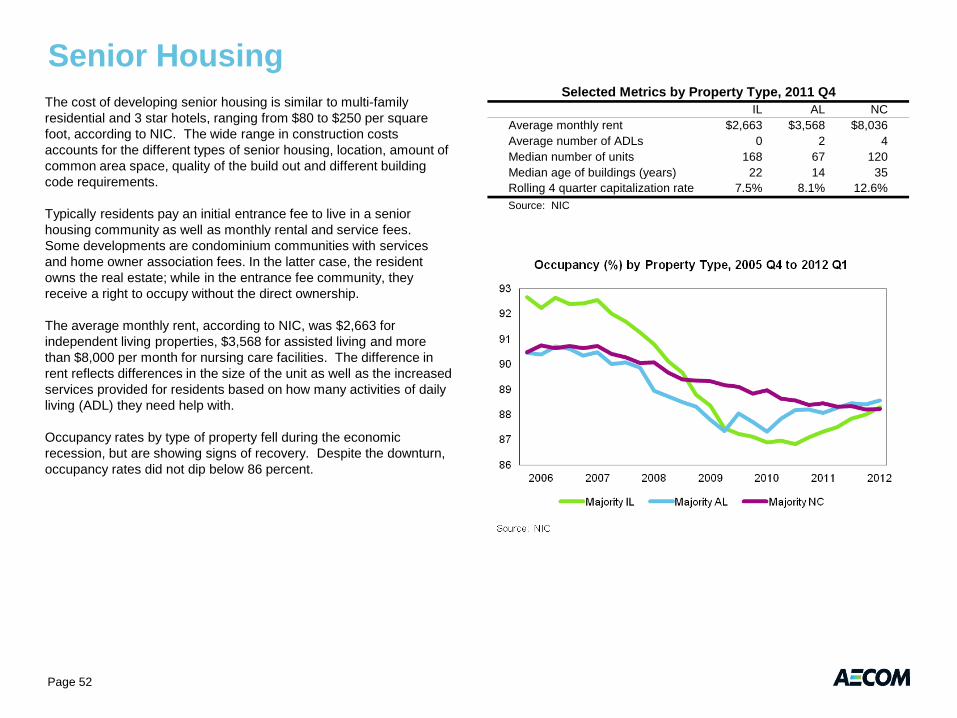
Senior Housing
Page 52
The cost of developing senior housing is similar to multi-family residential and 3 star hotels, ranging from $80 to $250 per square foot, according to NIC. The wide range in construction costs accounts for the different types of senior housing, location, amount of common area space, quality of the build out and different building code requirements.
Typically residents pay an initial entrance fee to live in a senior housing community as well as monthly rental and service fees. Some developments are condominium communities with services and home owner association fees. In the latter case, the resident owns the real estate; while in the entrance fee community, they receive a right to occupy without the direct ownership.
The average monthly rent, according to NIC, was $2,663 for independent living properties, $3,568 for assisted living and more than $8,000 per month for nursing care facilities. The difference in rent reflects differences in the size of the unit as well as the increased services provided for residents based on how many activities of daily living (ADL) they need help with.
Occupancy rates by type of property fell during the economic recession, but are showing signs of recovery. Despite the downturn, occupancy rates did not dip below 86 percent.
IL AL NCAverage monthly rent $2,663 $3,568 $8,036Average number of ADLs 0 2 4Median number of units 168 67 120Median age of buildings (years) 22 14 35Rolling 4 quarter capitalization rate 7.5% 8.1% 12.6%Source: NIC
Selected Metrics by Property Type, 2011 Q4
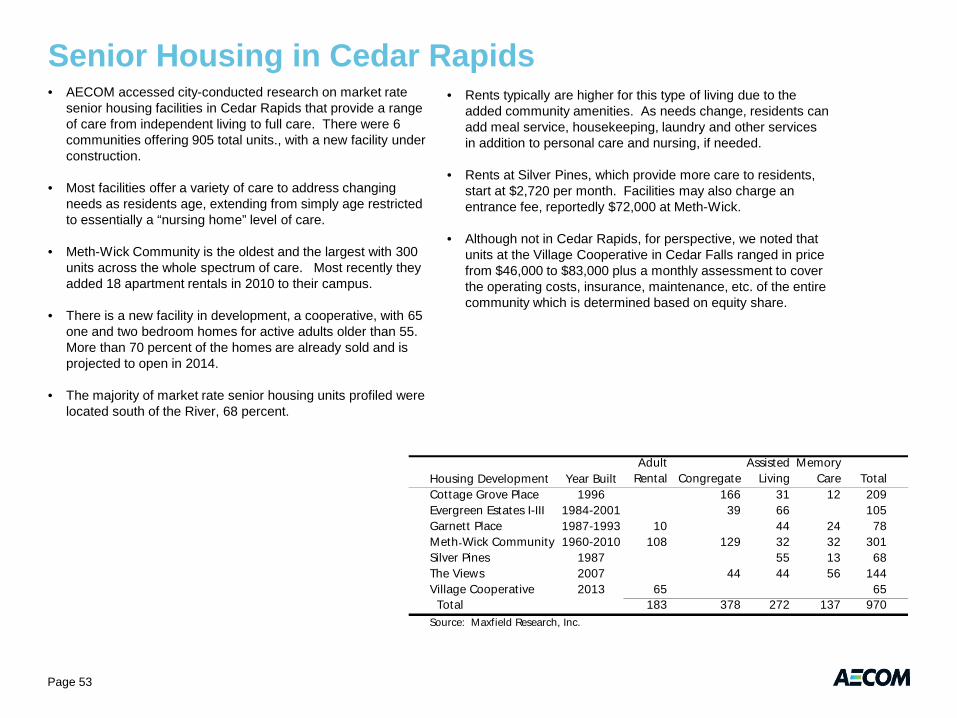
Senior Housing in Cedar Rapids
• AECOM accessed city-conducted research on market rate senior housing facilities in Cedar Rapids that provide a range of care from independent living to full care. There were 6 communities offering 905 total units., with a new facility under construction.
• Most facilities offer a variety of care to address changing needs as residents age, extending from simply age restricted to essentially a “nursing home” level of care.
• Meth-Wick Community is the oldest and the largest with 300 units across the whole spectrum of care. Most recently they added 18 apartment rentals in 2010 to their campus.
• There is a new facility in development, a cooperative, with 65 one and two bedroom homes for active adults older than 55. More than 70 percent of the homes are already sold and is projected to open in 2014.
• The majority of market rate senior housing units profiled were located south of the River, 68 percent.
• Rents typically are higher for this type of living due to the added community amenities. As needs change, residents can add meal service, housekeeping, laundry and other services in addition to personal care and nursing, if needed.
• Rents at Silver Pines, which provide more care to residents, start at $2,720 per month. Facilities may also charge an entrance fee, reportedly $72,000 at Meth-Wick.
• Although not in Cedar Rapids, for perspective, we noted that units at the Village Cooperative in Cedar Falls ranged in price from $46,000 to $83,000 plus a monthly assessment to cover the operating costs, insurance, maintenance, etc. of the entire community which is determined based on equity share.
Housing Development Year BuiltAdult
Rental CongregateAssisted
LivingMemory
Care TotalCottage Grove Place 1996 166 31 12 209Evergreen Estates I-III 1984-2001 39 66 105Garnett Place 1987-1993 10 44 24 78Meth‐Wick Community 1960-2010 108 129 32 32 301Silver Pines 1987 55 13 68The Views 2007 44 44 56 144Village Cooperative 2013 65 65 Total 183 378 272 137 970Source: Maxfield Research, Inc.
Page 53
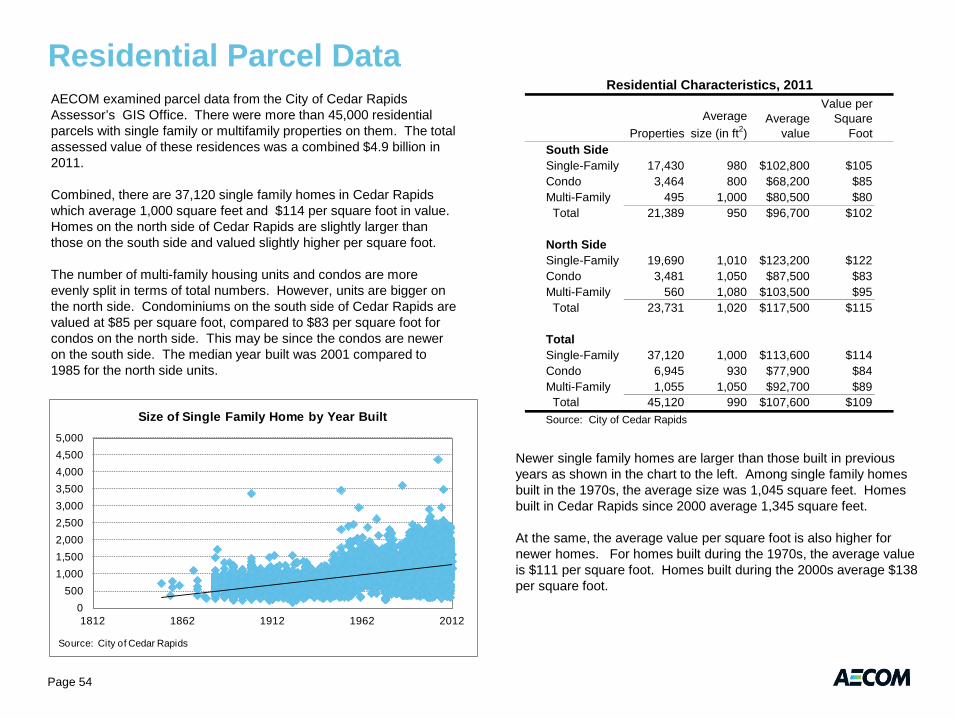
Residential Parcel Data
Page 54
AECOM examined parcel data from the City of Cedar Rapids Assessor’s GIS Office. There were more than 45,000 residential parcels with single family or multifamily properties on them. The total assessed value of these residences was a combined $4.9 billion in 2011.
Combined, there are 37,120 single family homes in Cedar Rapids which average 1,000 square feet and $114 per square foot in value. Homes on the north side of Cedar Rapids are slightly larger than those on the south side and valued slightly higher per square foot.
The number of multi-family housing units and condos are more evenly split in terms of total numbers. However, units are bigger on the north side. Condominiums on the south side of Cedar Rapids are valued at $85 per square foot, compared to $83 per square foot for condos on the north side. This may be since the condos are newer on the south side. The median year built was 2001 compared to 1985 for the north side units.
PropertiesAverage
size (in ft2)Average
value
Value per Square
FootSouth SideSingle-Family 17,430 980 $102,800 $105Condo 3,464 800 $68,200 $85Multi-Family 495 1,000 $80,500 $80 Total 21,389 950 $96,700 $102
North SideSingle-Family 19,690 1,010 $123,200 $122Condo 3,481 1,050 $87,500 $83Multi-Family 560 1,080 $103,500 $95 Total 23,731 1,020 $117,500 $115
TotalSingle-Family 37,120 1,000 $113,600 $114Condo 6,945 930 $77,900 $84Multi-Family 1,055 1,050 $92,700 $89 Total 45,120 990 $107,600 $109Source: City of Cedar Rapids
Residential Characteristics, 2011
0500
1,0001,5002,0002,5003,0003,5004,0004,5005,000
1812 1862 1912 1962 2012
Source: City of Cedar Rapids
Size of Single Family Home by Year Built
Newer single family homes are larger than those built in previous years as shown in the chart to the left. Among single family homes built in the 1970s, the average size was 1,045 square feet. Homes built in Cedar Rapids since 2000 average 1,345 square feet.
At the same, the average value per square foot is also higher for newer homes. For homes built during the 1970s, the average value is $111 per square foot. Homes built during the 2000s average $138 per square foot.
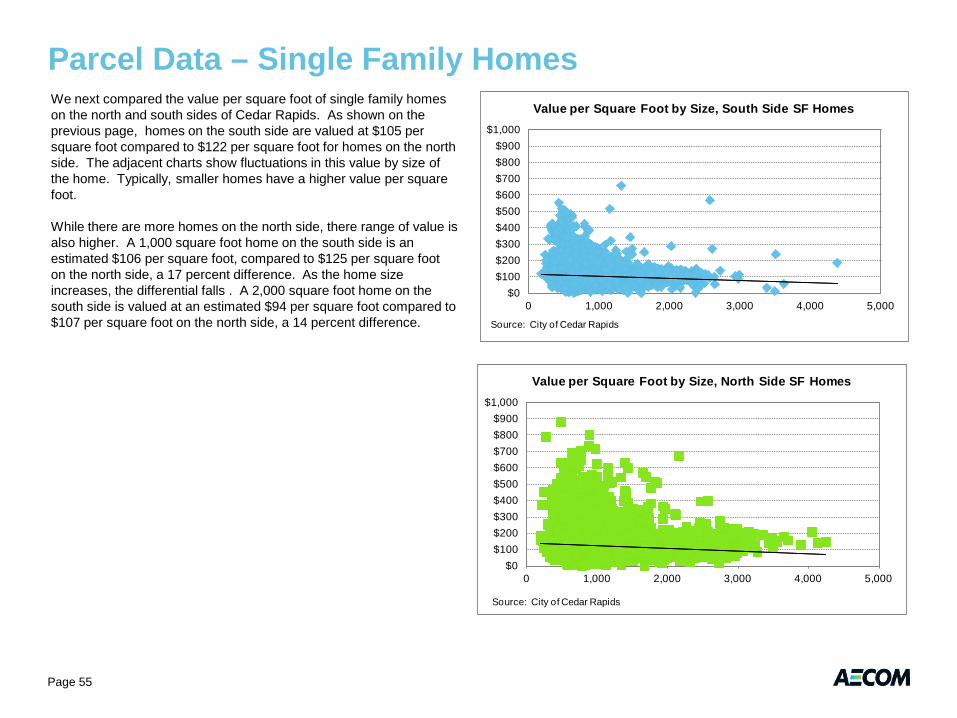
Parcel Data – Single Family Homes
Page 55
We next compared the value per square foot of single family homes on the north and south sides of Cedar Rapids. As shown on the previous page, homes on the south side are valued at $105 per square foot compared to $122 per square foot for homes on the north side. The adjacent charts show fluctuations in this value by size of the home. Typically, smaller homes have a higher value per square foot.
While there are more homes on the north side, there range of value is also higher. A 1,000 square foot home on the south side is an estimated $106 per square foot, compared to $125 per square foot on the north side, a 17 percent difference. As the home size increases, the differential falls . A 2,000 square foot home on the south side is valued at an estimated $94 per square foot compared to $107 per square foot on the north side, a 14 percent difference.
$0$100$200$300$400$500$600$700$800$900
$1,000
0 1,000 2,000 3,000 4,000 5,000
Source: City of Cedar Rapids
Value per Square Foot by Size, South Side SF Homes
$0$100$200$300$400$500$600$700$800$900
$1,000
0 1,000 2,000 3,000 4,000 5,000
Source: City of Cedar Rapids
Value per Square Foot by Size, North Side SF Homes
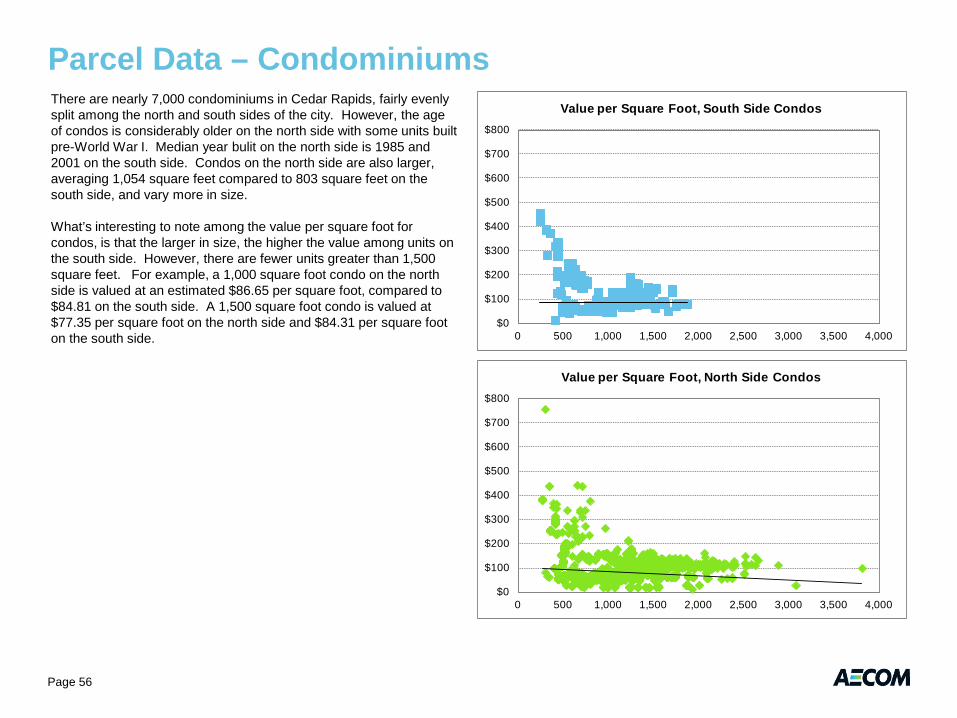
Parcel Data – Condominiums
Page 56
There are nearly 7,000 condominiums in Cedar Rapids, fairly evenly split among the north and south sides of the city. However, the age of condos is considerably older on the north side with some units built pre-World War I. Median year bulit on the north side is 1985 and 2001 on the south side. Condos on the north side are also larger, averaging 1,054 square feet compared to 803 square feet on the south side, and vary more in size.
What’s interesting to note among the value per square foot for condos, is that the larger in size, the higher the value among units on the south side. However, there are fewer units greater than 1,500 square feet. For example, a 1,000 square foot condo on the north side is valued at an estimated $86.65 per square foot, compared to $84.81 on the south side. A 1,500 square foot condo is valued at $77.35 per square foot on the north side and $84.31 per square foot on the south side.
$0
$100
$200
$300
$400
$500
$600
$700
$800
0 500 1,000 1,500 2,000 2,500 3,000 3,500 4,000
Value per Square Foot, South Side Condos
$0
$100
$200
$300
$400
$500
$600
$700
$800
0 500 1,000 1,500 2,000 2,500 3,000 3,500 4,000
Value per Square Foot, North Side Condos
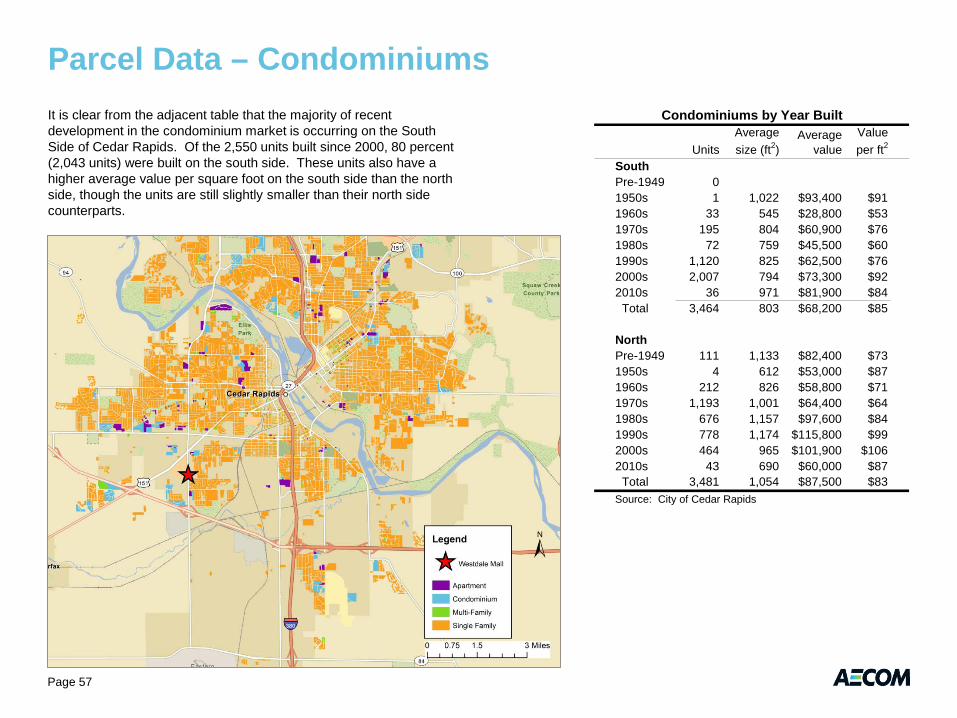
Parcel Data – Condominiums
Page 57
UnitsAverage size (ft2)
Average value
Value per ft2
SouthPre-1949 01950s 1 1,022 $93,400 $911960s 33 545 $28,800 $531970s 195 804 $60,900 $761980s 72 759 $45,500 $601990s 1,120 825 $62,500 $762000s 2,007 794 $73,300 $922010s 36 971 $81,900 $84 Total 3,464 803 $68,200 $85
NorthPre-1949 111 1,133 $82,400 $731950s 4 612 $53,000 $871960s 212 826 $58,800 $711970s 1,193 1,001 $64,400 $641980s 676 1,157 $97,600 $841990s 778 1,174 $115,800 $992000s 464 965 $101,900 $1062010s 43 690 $60,000 $87 Total 3,481 1,054 $87,500 $83Source: City of Cedar Rapids
Condominiums by Year BuiltIt is clear from the adjacent table that the majority of recent development in the condominium market is occurring on the South Side of Cedar Rapids. Of the 2,550 units built since 2000, 80 percent (2,043 units) were built on the south side. These units also have a higher average value per square foot on the south side than the north side, though the units are still slightly smaller than their north side counterparts.
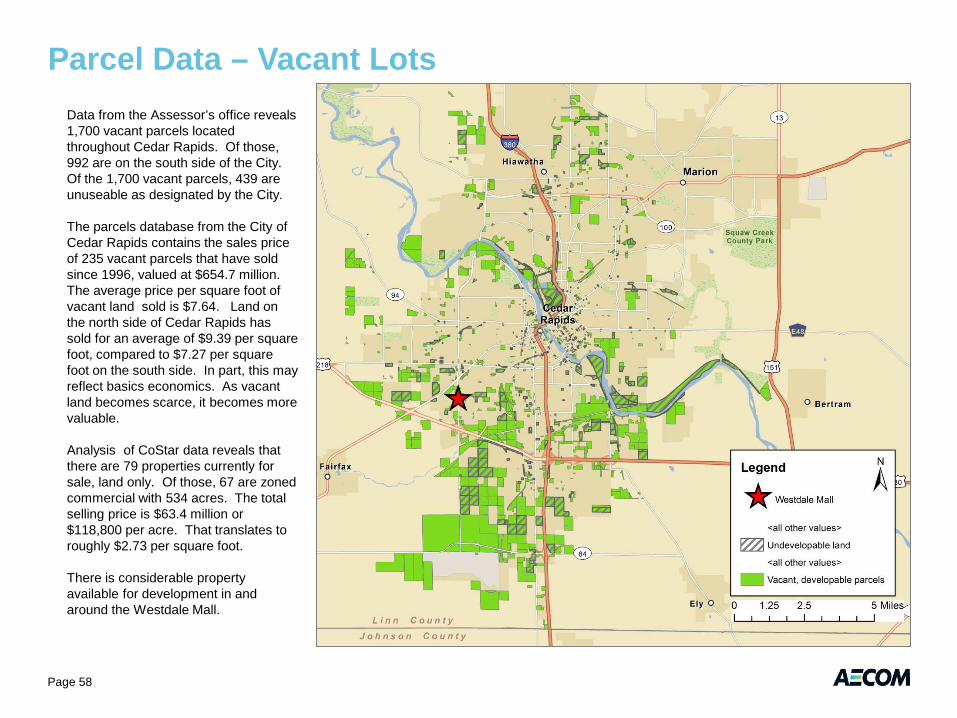
Parcel Data – Vacant Lots
Page 58
Data from the Assessor’s office reveals 1,700 vacant parcels located throughout Cedar Rapids. Of those, 992 are on the south side of the City. Of the 1,700 vacant parcels, 439 are unuseable as designated by the City.
The parcels database from the City of Cedar Rapids contains the sales price of 235 vacant parcels that have sold since 1996, valued at $654.7 million. The average price per square foot of vacant land sold is $7.64. Land on the north side of Cedar Rapids has sold for an average of $9.39 per square foot, compared to $7.27 per square foot on the south side. In part, this may reflect basics economics. As vacant land becomes scarce, it becomes more valuable.
Analysis of CoStar data reveals that there are 79 properties currently for sale, land only. Of those, 67 are zoned commercial with 534 acres. The total selling price is $63.4 million or $118,800 per acre. That translates to roughly $2.73 per square foot.
There is considerable property available for development in and around the Westdale Mall.
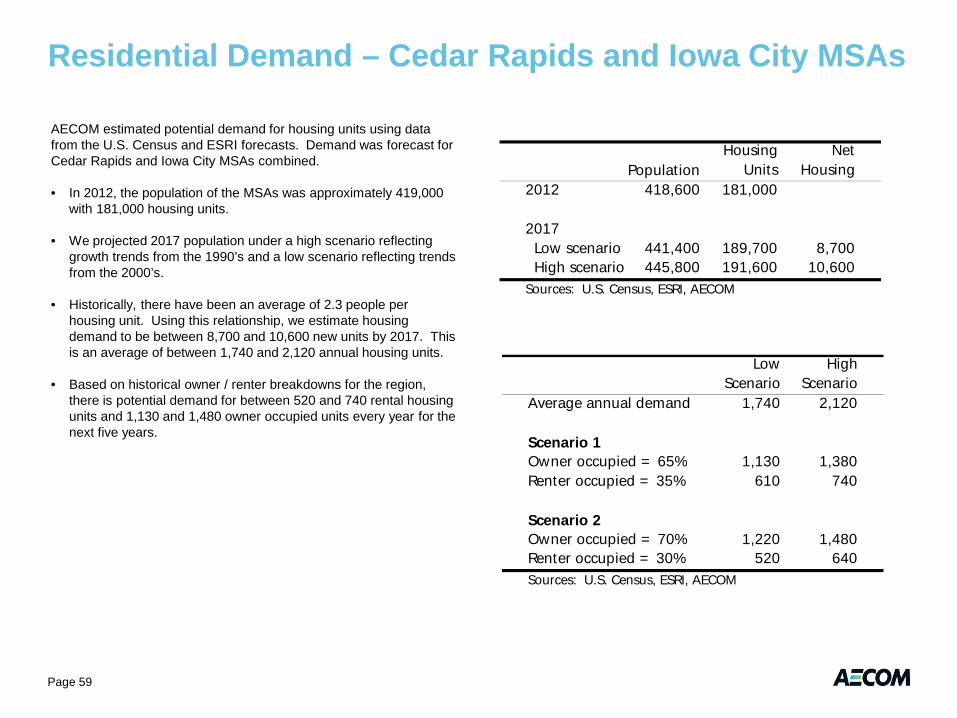
Residential Demand – Cedar Rapids and Iowa City MSAs
AECOM estimated potential demand for housing units using data from the U.S. Census and ESRI forecasts. Demand was forecast for Cedar Rapids and Iowa City MSAs combined.
• In 2012, the population of the MSAs was approximately 419,000 with 181,000 housing units.
• We projected 2017 population under a high scenario reflecting growth trends from the 1990’s and a low scenario reflecting trends from the 2000’s.
• Historically, there have been an average of 2.3 people per housing unit. Using this relationship, we estimate housing demand to be between 8,700 and 10,600 new units by 2017. This is an average of between 1,740 and 2,120 annual housing units.
• Based on historical owner / renter breakdowns for the region, there is potential demand for between 520 and 740 rental housing units and 1,130 and 1,480 owner occupied units every year for the next five years.
PopulationHousing
UnitsNet
Housing2012 418,600 181,000
2017 Low scenario 441,400 189,700 8,700 High scenario 445,800 191,600 10,600Sources: U.S. Census, ESRI, AECOM
Low Scenario
High Scenario
Average annual demand 1,740 2,120
Scenario 1Owner occupied = 65% 1,130 1,380Renter occupied = 35% 610 740
Scenario 2Owner occupied = 70% 1,220 1,480Renter occupied = 30% 520 640Sources: U.S. Census, ESRI, AECOM
Page 59
Residential Market Findings
Page 60
Findings include:
• For Residential, the Westdale mall site should be viewed as a competitive location for people who currently work in Iowa City, as well as Cedar Rapids. For this reason, our approach looked at demand growth in both MSAs.
• The Cedar Rapids MSA has an unusually low cost of living index factor for housing, 25% below the average for all MSAs. In spite of this factor, our analysis did yield relevant market premiums for newer construction condominiums (1bedroom @ $150/sf), as well as a small sample of rental units priced above $1/SF. For the rental market in particular, newer units are not priced at a premium to older units.
• There are very few modern “urban” rental units in the market, and in general, walkability is limited.
• Senior housing markets will grow in the near-term, linked with identified strong growth in 55-64 and 65 -74 age groups across Iowa City and Cedar Rapids through 2017. Based on experience, we would anticipate a shift from condominium and age restricted units to projects offering a continuum of care toward the end of the five year period. From a real estate standpoint, as projects move further into the CCRC model, the business case is more influenced
by insurance and payments for services. Locally, a sample of about 900 units was identified with several operators, with a small share of units built since 2000.
• While the overall senior market appears strong, the historic trend is the majority of seniors choose to age in place. With a significant share of boomers now entering retirement, how this trend may shift will be critical.
Prognosis: “Reasonable” population growth expectations are in place for the regional market, which align with a Westdale site that should be competitive. Although overall residential unit values are very affordable, the market does include several projects (older as well as newer) which are supporting higher rents and attractive condominium pricing.
Hotel Market Analysis The Hotel Market Analysis folds in several overlapping components:
• Interviews with local convention and visitors bureau staff to identify tourism demand drivers
• Analysis of Smith Travel Research data on local hotel conditions, as well as focused study of core competitive hotels.
Page 61
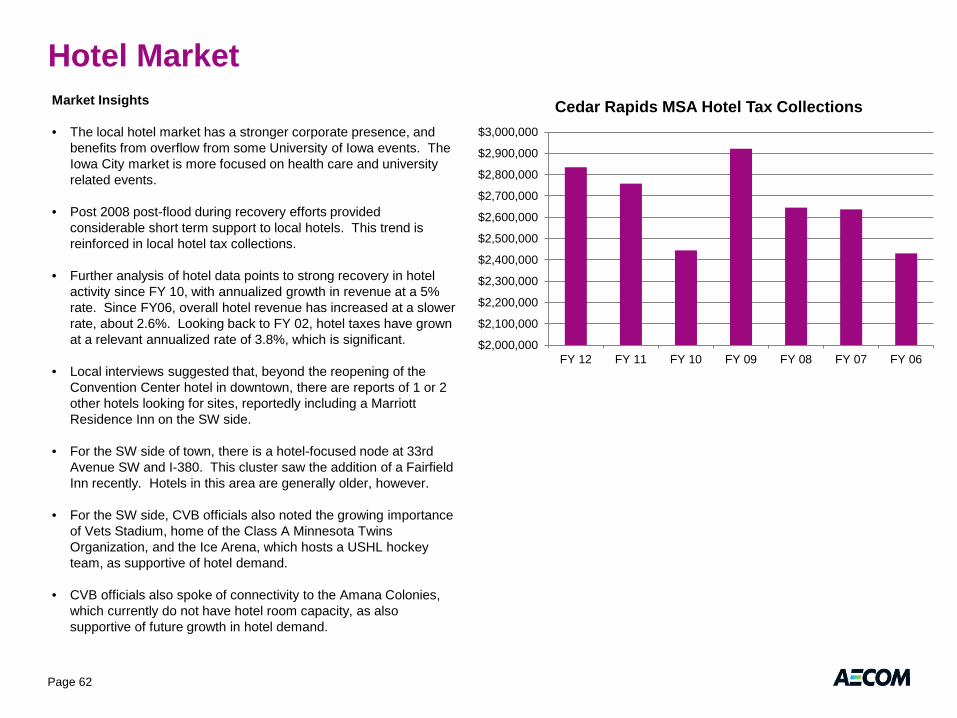
Hotel Market
Market Insights
• The local hotel market has a stronger corporate presence, and benefits from overflow from some University of Iowa events. The Iowa City market is more focused on health care and university related events.
• Post 2008 post-flood during recovery efforts provided considerable short term support to local hotels. This trend is reinforced in local hotel tax collections.
• Further analysis of hotel data points to strong recovery in hotel activity since FY 10, with annualized growth in revenue at a 5% rate. Since FY06, overall hotel revenue has increased at a slower rate, about 2.6%. Looking back to FY 02, hotel taxes have grown at a relevant annualized rate of 3.8%, which is significant.
• Local interviews suggested that, beyond the reopening of the Convention Center hotel in downtown, there are reports of 1 or 2 other hotels looking for sites, reportedly including a Marriott Residence Inn on the SW side.
• For the SW side of town, there is a hotel-focused node at 33rd Avenue SW and I-380. This cluster saw the addition of a Fairfield Inn recently. Hotels in this area are generally older, however.
• For the SW side, CVB officials also noted the growing importance of Vets Stadium, home of the Class A Minnesota Twins Organization, and the Ice Arena, which hosts a USHL hockey team, as supportive of hotel demand.
• CVB officials also spoke of connectivity to the Amana Colonies, which currently do not have hotel room capacity, as also supportive of future growth in hotel demand.
Page 62
$2,000,000
$2,100,000
$2,200,000
$2,300,000
$2,400,000
$2,500,000
$2,600,000
$2,700,000
$2,800,000
$2,900,000
$3,000,000
FY 12 FY 11 FY 10 FY 09 FY 08 FY 07 FY 06
Cedar Rapids MSA Hotel Tax Collections
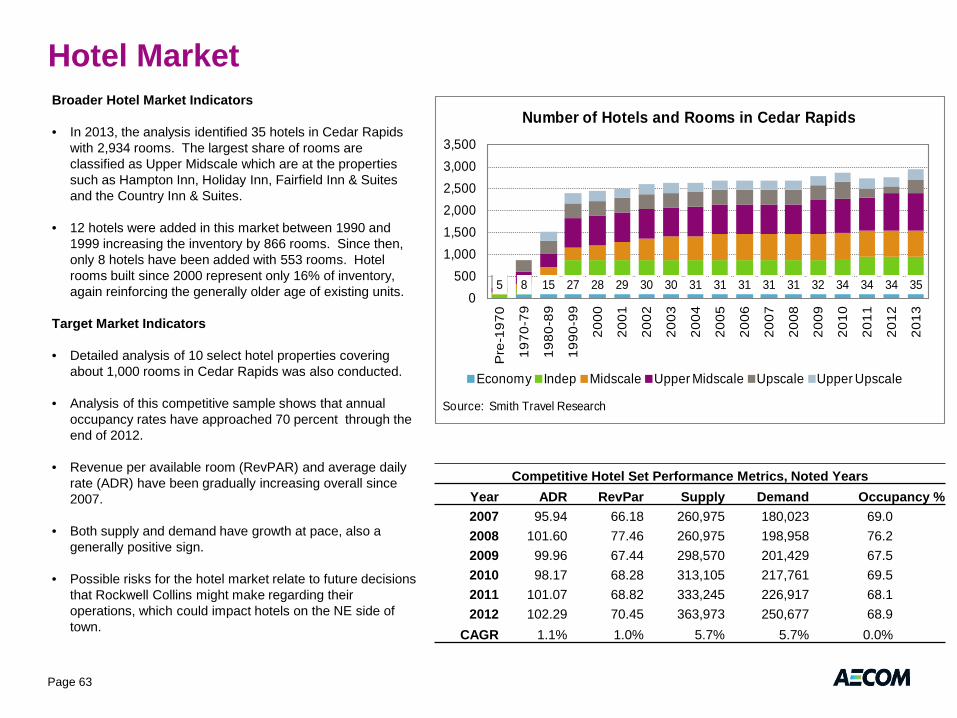
Hotel Market
Broader Hotel Market Indicators
• In 2013, the analysis identified 35 hotels in Cedar Rapids with 2,934 rooms. The largest share of rooms are classified as Upper Midscale which are at the properties such as Hampton Inn, Holiday Inn, Fairfield Inn & Suites and the Country Inn & Suites.
• 12 hotels were added in this market between 1990 and 1999 increasing the inventory by 866 rooms. Since then, only 8 hotels have been added with 553 rooms. Hotel rooms built since 2000 represent only 16% of inventory, again reinforcing the generally older age of existing units.
Target Market Indicators
• Detailed analysis of 10 select hotel properties covering about 1,000 rooms in Cedar Rapids was also conducted.
• Analysis of this competitive sample shows that annual occupancy rates have approached 70 percent through the end of 2012.
• Revenue per available room (RevPAR) and average daily rate (ADR) have been gradually increasing overall since 2007.
• Both supply and demand have growth at pace, also a generally positive sign.
• Possible risks for the hotel market relate to future decisions that Rockwell Collins might make regarding their operations, which could impact hotels on the NE side of town.
5 8 15 27 28 29 30 30 31 31 31 31 31 32 34 34 34 350
5001,0001,5002,0002,5003,0003,500
Pre
-197
0
1970
-79
1980
-89
1990
-99
2000
2001
2002
2003
2004
2005
2006
2007
2008
2009
2010
2011
2012
2013
Source: Smith Travel Research
Number of Hotels and Rooms in Cedar Rapids
Economy Indep Midscale Upper Midscale Upscale Upper Upscale
Page 63
Competitive Hotel Set Performance Metrics, Noted Years Year ADR RevPar Supply Demand Occupancy % 2007 95.94 66.18 260,975 180,023 69.0 2008 101.60 77.46 260,975 198,958 76.2 2009 99.96 67.44 298,570 201,429 67.5 2010 98.17 68.28 313,105 217,761 69.5 2011 101.07 68.82 333,245 226,917 68.1 2012 102.29 70.45 363,973 250,677 68.9
CAGR 1.1% 1.0% 5.7% 5.7% 0.0%
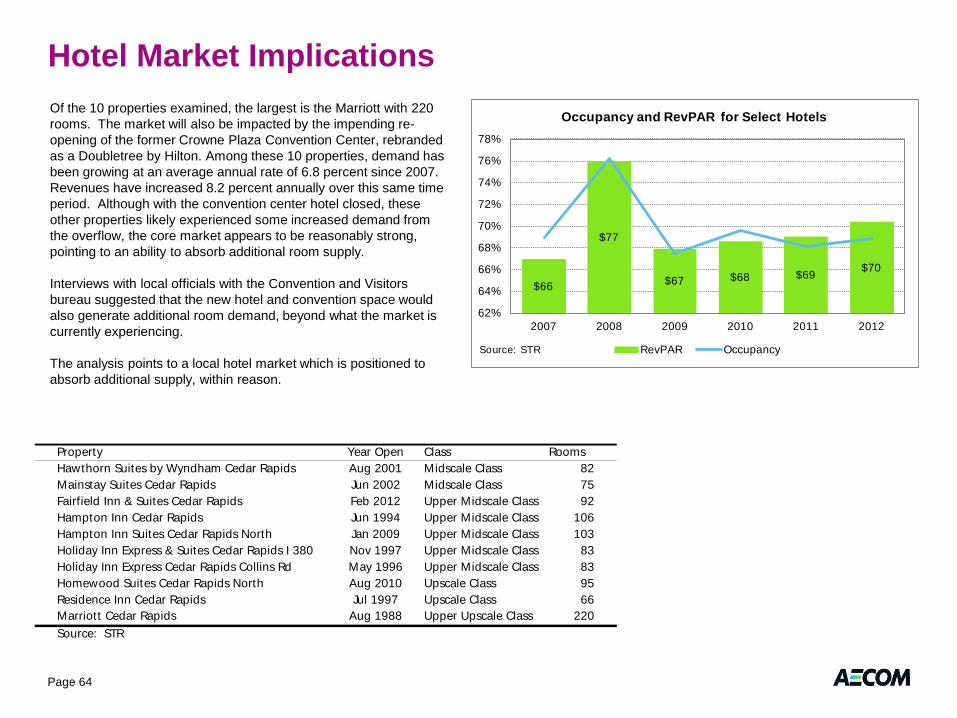
Hotel Market Implications
Of the 10 properties examined, the largest is the Marriott with 220 rooms. The market will also be impacted by the impending re-opening of the former Crowne Plaza Convention Center, rebranded as a Doubletree by Hilton. Among these 10 properties, demand has been growing at an average annual rate of 6.8 percent since 2007. Revenues have increased 8.2 percent annually over this same time period. Although with the convention center hotel closed, these other properties likely experienced some increased demand from the overflow, the core market appears to be reasonably strong, pointing to an ability to absorb additional room supply.
Interviews with local officials with the Convention and Visitors bureau suggested that the new hotel and convention space would also generate additional room demand, beyond what the market is currently experiencing.
The analysis points to a local hotel market which is positioned to absorb additional supply, within reason.
Property Year Open Class RoomsHawthorn Suites by Wyndham Cedar Rapids Aug 2001 Midscale Class 82Mainstay Suites Cedar Rapids Jun 2002 Midscale Class 75Fairfield Inn & Suites Cedar Rapids Feb 2012 Upper Midscale Class 92Hampton Inn Cedar Rapids Jun 1994 Upper Midscale Class 106Hampton Inn Suites Cedar Rapids North Jan 2009 Upper Midscale Class 103Holiday Inn Express & Suites Cedar Rapids I 380 Nov 1997 Upper Midscale Class 83Holiday Inn Express Cedar Rapids Collins Rd May 1996 Upper Midscale Class 83Homewood Suites Cedar Rapids North Aug 2010 Upscale Class 95Residence Inn Cedar Rapids Jul 1997 Upscale Class 66Marriott Cedar Rapids Aug 1988 Upper Upscale Class 220Source: STR
$66
$77
$67 $68 $69 $70
62%
64%
66%
68%
70%
72%
74%
76%
78%
2007 2008 2009 2010 2011 2012
Source: STR
Occupancy and RevPAR for Select Hotels
RevPAR Occupancy
Page 64
Office Market Analysis The Office Market Analysis folds in several components:
• Analysis of office using sectors of the local economy
• Evaluation of vacant office space across the region, as well as trends regarding new construction and supportable lease rates
Page 65
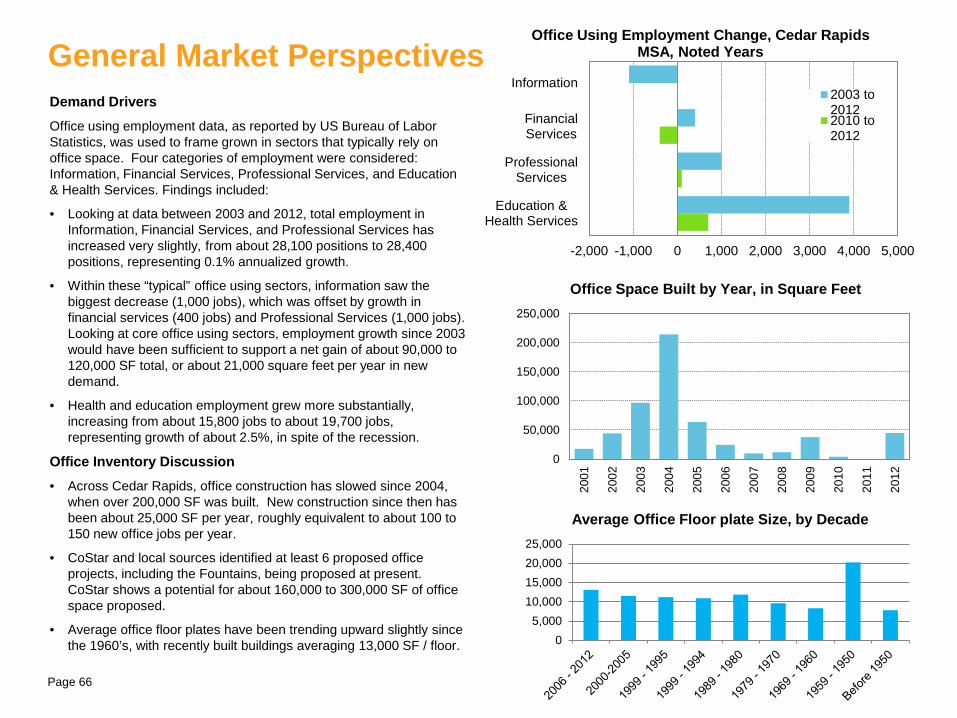
General Market Perspectives
Page 66
Demand Drivers Office using employment data, as reported by US Bureau of Labor Statistics, was used to frame grown in sectors that typically rely on office space. Four categories of employment were considered: Information, Financial Services, Professional Services, and Education & Health Services. Findings included:
• Looking at data between 2003 and 2012, total employment in Information, Financial Services, and Professional Services has increased very slightly, from about 28,100 positions to 28,400 positions, representing 0.1% annualized growth.
• Within these “typical” office using sectors, information saw the biggest decrease (1,000 jobs), which was offset by growth in financial services (400 jobs) and Professional Services (1,000 jobs). Looking at core office using sectors, employment growth since 2003 would have been sufficient to support a net gain of about 90,000 to 120,000 SF total, or about 21,000 square feet per year in new demand.
• Health and education employment grew more substantially, increasing from about 15,800 jobs to about 19,700 jobs, representing growth of about 2.5%, in spite of the recession.
Office Inventory Discussion • Across Cedar Rapids, office construction has slowed since 2004,
when over 200,000 SF was built. New construction since then has been about 25,000 SF per year, roughly equivalent to about 100 to 150 new office jobs per year.
• CoStar and local sources identified at least 6 proposed office projects, including the Fountains, being proposed at present. CoStar shows a potential for about 160,000 to 300,000 SF of office space proposed.
• Average office floor plates have been trending upward slightly since the 1960’s, with recently built buildings averaging 13,000 SF / floor.
-2,000 -1,000 0 1,000 2,000 3,000 4,000 5,000
Information
FinancialServices
ProfessionalServices
Education &Health Services
Office Using Employment Change, Cedar Rapids MSA, Noted Years
2003 to20122010 to2012
0
50,000
100,000
150,000
200,000
250,000
2012
2011
2010
2009
2008
2007
2006
2005
2004
2003
2002
2001
Office Space Built by Year, in Square Feet
05,000
10,00015,00020,00025,000
Average Office Floor plate Size, by Decade
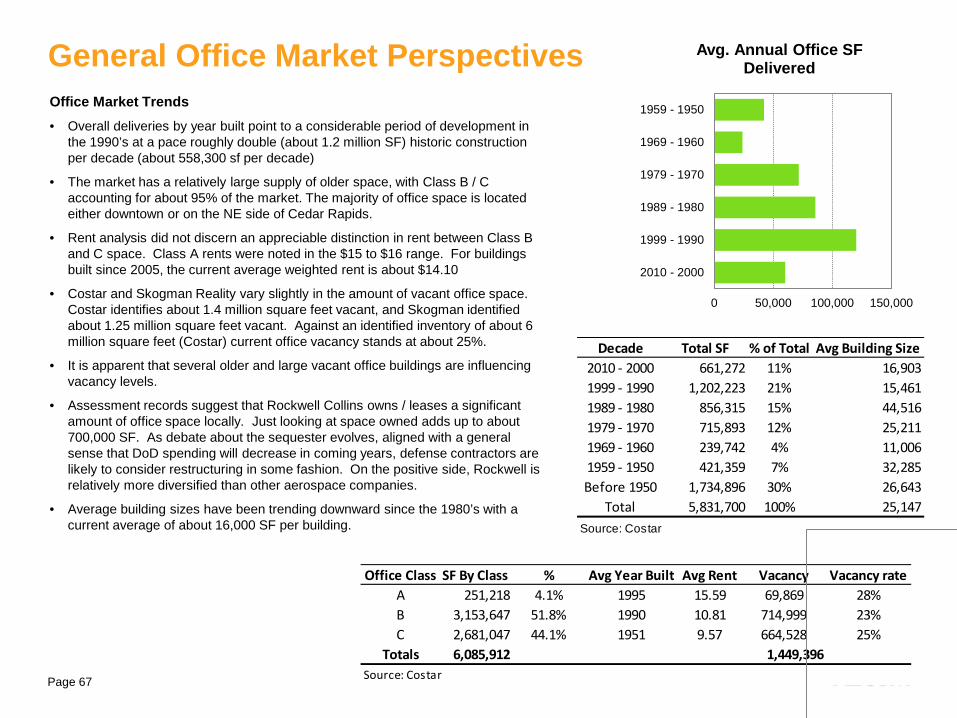
General Office Market Perspectives
Page 67
Office Market Trends • Overall deliveries by year built point to a considerable period of development in
the 1990’s at a pace roughly double (about 1.2 million SF) historic construction per decade (about 558,300 sf per decade)
• The market has a relatively large supply of older space, with Class B / C accounting for about 95% of the market. The majority of office space is located either downtown or on the NE side of Cedar Rapids.
• Rent analysis did not discern an appreciable distinction in rent between Class B and C space. Class A rents were noted in the $15 to $16 range. For buildings built since 2005, the current average weighted rent is about $14.10
• Costar and Skogman Reality vary slightly in the amount of vacant office space. Costar identifies about 1.4 million square feet vacant, and Skogman identified about 1.25 million square feet vacant. Against an identified inventory of about 6 million square feet (Costar) current office vacancy stands at about 25%.
• It is apparent that several older and large vacant office buildings are influencing vacancy levels.
• Assessment records suggest that Rockwell Collins owns / leases a significant amount of office space locally. Just looking at space owned adds up to about 700,000 SF. As debate about the sequester evolves, aligned with a general sense that DoD spending will decrease in coming years, defense contractors are likely to consider restructuring in some fashion. On the positive side, Rockwell is relatively more diversified than other aerospace companies.
• Average building sizes have been trending downward since the 1980’s with a current average of about 16,000 SF per building.
Office Class SF By Class % Avg Year Built Avg Rent Vacancy Vacancy rate
A 251,218 4.1% 1995 15.59 69,869 28%B 3,153,647 51.8% 1990 10.81 714,999 23%C 2,681,047 44.1% 1951 9.57 664,528 25%
Totals 6,085,912 1,449,396Source: Costar
0 50,000 100,000 150,000
2010 - 2000
1999 - 1990
1989 - 1980
1979 - 1970
1969 - 1960
1959 - 1950
Avg. Annual Office SF Delivered
Decade Total SF % of Total Avg Building Size2010 - 2000 661,272 11% 16,9031999 - 1990 1,202,223 21% 15,4611989 - 1980 856,315 15% 44,5161979 - 1970 715,893 12% 25,2111969 - 1960 239,742 4% 11,0061959 - 1950 421,359 7% 32,285Before 1950 1,734,896 30% 26,643
Total 5,831,700 100% 25,147Source: Costar
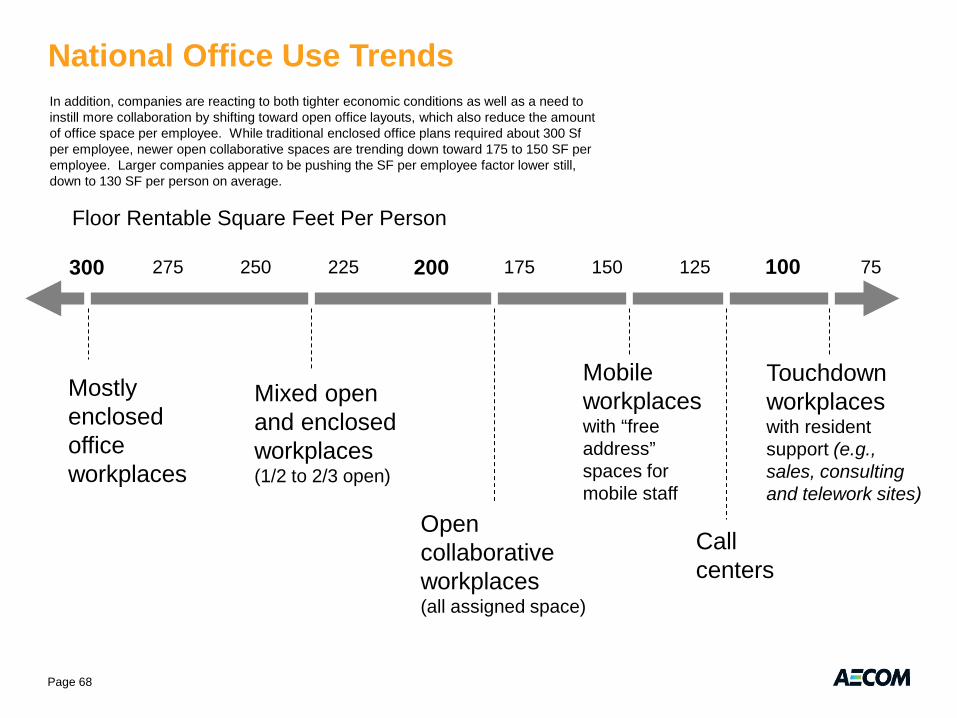
National Office Use Trends
Page 68
In addition, companies are reacting to both tighter economic conditions as well as a need to instill more collaboration by shifting toward open office layouts, which also reduce the amount of office space per employee. While traditional enclosed office plans required about 300 Sf per employee, newer open collaborative spaces are trending down toward 175 to 150 SF per employee. Larger companies appear to be pushing the SF per employee factor lower still, down to 130 SF per person on average.
300 225 150 275 200 250 175
Floor Rentable Square Feet Per Person
125 75 100
Mostly enclosed office workplaces
Mixed open and enclosed workplaces (1/2 to 2/3 open)
Open collaborative workplaces (all assigned space)
Mobile workplaces with “free address” spaces for mobile staff
Call centers
Touchdown workplaces with resident support (e.g., sales, consulting and telework sites)
Office Market Findings
Page 69
Findings include:
The local office market is reacting to several forces:
• Modest net growth in employment for traditional sectors that use office space, with stronger growth in medical employment.
• A considerable supply of older and arguably obsolete space in the market, with overall vacancy levels above 20%.
• A small supply of “contemporary” office space, class A or otherwise.
• Some concern over evolving decisions at Rockwell Collins regarding their space needs.
Our analysis points to a near-term market that is going to be tenant driven, with gradual recovery toward an average pace of about 50,000 SF of new office construction per year within 2-3 years, with older but not historic buildings being competitively challenged, which will dampen rent growth. A lack of modern space in the market is one clear driver of new space.
Overall Considerations
Page 70
• Market conditions in Cedar Rapids need to be viewed in broader context with the pace of economic recovery across the Midwest. From this vantage point, Cedar Rapids (and Iowa) would represent growth market opportunities, given that larger markets (Illinois) appear to be lagging in the recovery.
• The retail assessment noted attractive pace of retail sales, in context with below average employment growth. With a broader recovery under way, support for retail sales seems apparent.
• While the local office market is viewed with trepidation, from a site standpoint, office uses are helpful in supporting the viability of mixed use districts, particularly restaurants. From this perspective, a health care anchor would also be viewed positively.
• For health care specifically, there are few US examples of mixed use projects with truly integrated health care components. At least one town center project in Baton Rouge (Perkins Rowe) was noted for the presence of a health care anchor. Nationally, projects that integrate health care in a lifestyle and wellness setting are moving to the forefront. Careful planning is in order, to ensure that outcomes beneficial to retail align with health care priorities.
• The market study did identify opportunities on the residential side, with an initial focus on condominium development. Considerations
here link with site planning factors, including: 1) the ability to provide a larger average unit size compared to the competition at a similar price point, and 2) the ability to support a larger parking ratio. Particularly for the boomer / retiree segment, 1.5 to 2 cars per unit will be hard to avoid.
• While the senior market is also seen as an opportunity, our clear preference for the mixed use core of the project would be for a condominium offering, rather than age restricted or continuing care models, the latter of which are seen to align better with a health care anchor.
• Lastly, also with respect to senior housing and health care, both models are largely dictated by insurance payments and doctor relationships with hospitals, rather than market lease rates. As such, it is expected that these users should otherwise be generally more willing to pay a premium for a given property, compared to other market driven uses (retail or office).
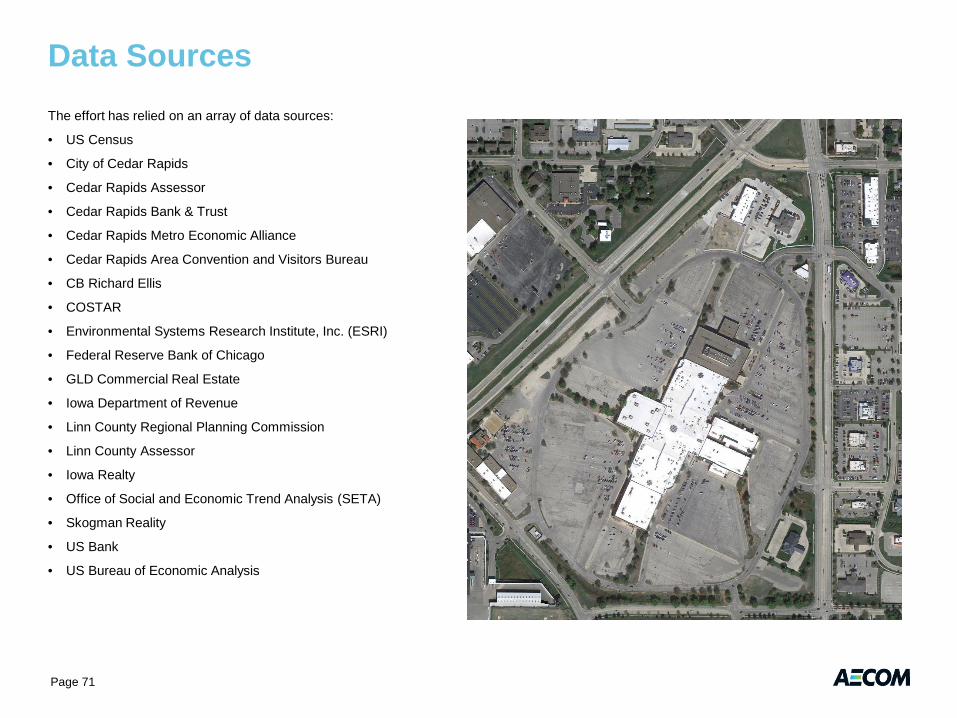
Data Sources The effort has relied on an array of data sources:
• US Census
• City of Cedar Rapids
• Cedar Rapids Assessor
• Cedar Rapids Bank & Trust
• Cedar Rapids Metro Economic Alliance
• Cedar Rapids Area Convention and Visitors Bureau
• CB Richard Ellis
• COSTAR
• Environmental Systems Research Institute, Inc. (ESRI)
• Federal Reserve Bank of Chicago
• GLD Commercial Real Estate
• Iowa Department of Revenue
• Linn County Regional Planning Commission
• Linn County Assessor
• Iowa Realty
• Office of Social and Economic Trend Analysis (SETA)
• Skogman Reality
• US Bank
• US Bureau of Economic Analysis
Page 71
General Limiting Conditions
Every reasonable effort has been made to ensure that the data contained in this report are accurate as of the date of this study; however, factors exist that are outside the control of AECOM and that may affect the estimates and/or projections noted herein. This study is based on estimates, assumptions and other information developed by AECOM from its independent research effort, general knowledge of the industry, and information provided by and consultations with the client and the client's representatives. No responsibility is assumed for inaccuracies in reporting by the client, the client's agent and representatives, or any other data source used in preparing or presenting this study.
This report is based on information that was current as of April 2013 and AECOM has not undertaken any update of its research effort since such date.
Because future events and circumstances, many of which are not known as of the date of this study, may affect the estimates contained therein, no warranty or representation is made by AECOM that any of the projected values or results contained in this study will actually be achieved.
Possession of this study does not carry with it the right of publication thereof or to use the name of "AECOM" or “Economics Research Associates” in any manner without first obtaining the prior written consent of AECOM. No abstracting, excerpting or summarization of this study may be made without first obtaining the prior written consent of AECOM. Further, AECOM has served solely in the capacity of consultant and has not rendered any expert opinions. This report is not to be used in conjunction with any public or private offering of securities, debt, equity, or other similar purpose where it may be relied upon to any degree by any person other than the client, nor is any third party entitled to rely upon this report, without first obtaining the prior written consent of AECOM. This study may not be used for purposes other than that for which it is prepared or for which prior written consent has first been obtained from AECOM. Any changes made to the study, or any use of the study not specifically prescribed under agreement between the parties or otherwise expressly approved by AECOM, shall be at the sole risk of the party making such changes or adopting such use.
This study is qualified in its entirety by, and should be considered in light of, these limitations, conditions and considerations.
Page 72