Embed Size (px)
Citation preview
IOC-UNESCO TS129
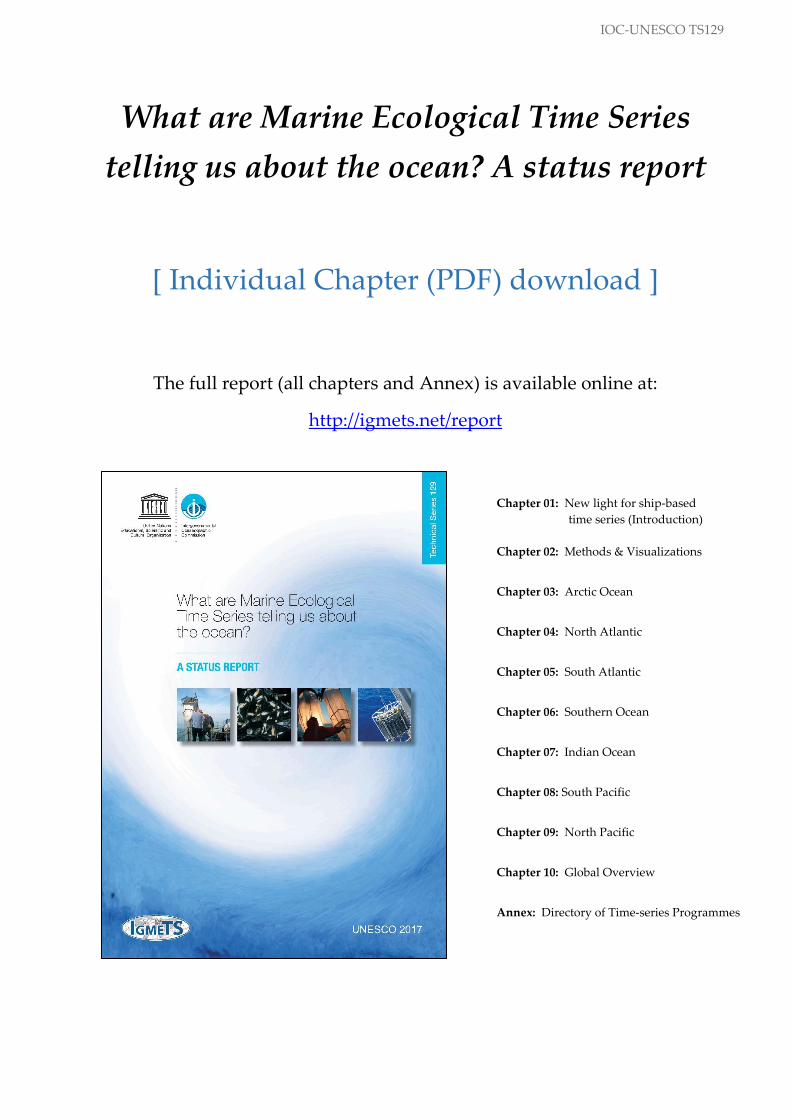
What are Marine Ecological Time Series
telling us about the ocean? A status report
[ Individual Chapter (PDF) download ]
The full report (all chapters and Annex) is available online at:
http://igmets.net/report
Chapter 01: New light for ship-based
time series (Introduction)
Chapter 02: Methods & Visualizations
Chapter 03: Arctic Ocean
Chapter 04: North Atlantic
Chapter 05: South Atlantic
Chapter 06: Southern Ocean
Chapter 07: Indian Ocean
Chapter 08: South Pacific
Chapter 09: North Pacific
Chapter 10: Global Overview
Annex: Directory of Time-series Programmes

2
This page intentionally left blank
to preserve pagination in double-sided (booklet) printing
Chapter 8 South Pacific Ocean
133
8 South Pacific Ocean
Peter A. Thompson, Todd D. O’Brien, L. Lorenzoni, and Anthony J. Richardson
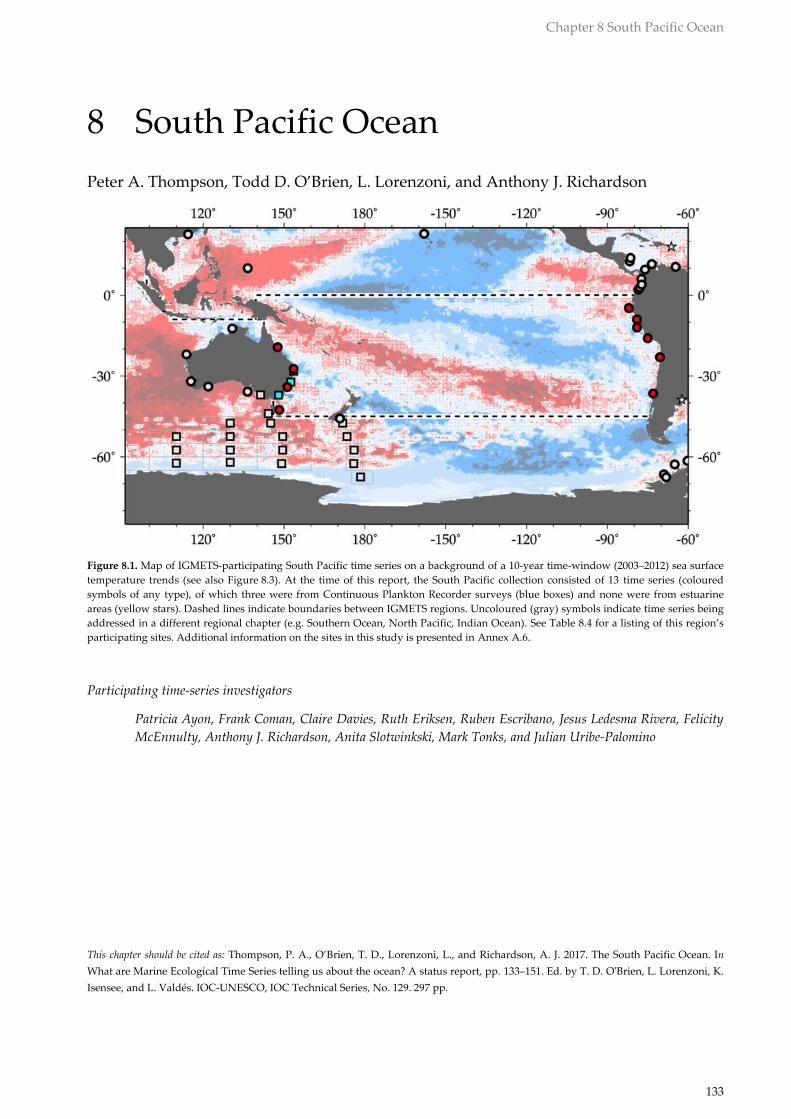
Figure 8.1. Map of IGMETS-participating South Pacific time series on a background of a 10-year time-window (2003–2012) sea surface
temperature trends (see also Figure 8.3). At the time of this report, the South Pacific collection consisted of 13 time series (coloured
symbols of any type), of which three were from Continuous Plankton Recorder surveys (blue boxes) and none were from estuarine
areas (yellow stars). Dashed lines indicate boundaries between IGMETS regions. Uncoloured (gray) symbols indicate time series being
addressed in a different regional chapter (e.g. Southern Ocean, North Pacific, Indian Ocean). See Table 8.4 for a listing of this region’s
participating sites. Additional information on the sites in this study is presented in Annex A.6.
Participating time-series investigators
Patricia Ayon, Frank Coman, Claire Davies, Ruth Eriksen, Ruben Escribano, Jesus Ledesma Rivera, Felicity
McEnnulty, Anthony J. Richardson, Anita Slotwinkski, Mark Tonks, and Julian Uribe-Palomino
This chapter should be cited as: Thompson, P. A., O’Brien, T. D., Lorenzoni, L., and Richardson, A. J. 2017. The South Pacific Ocean. In
What are Marine Ecological Time Series telling us about the ocean? A status report, pp. 133–151. Ed. by T. D. O'Brien, L. Lorenzoni, K.
Isensee, and L. Valdés. IOC-UNESCO, IOC Technical Series, No. 129. 297 pp.
134
8.1 Introduction
After the North Pacific, the South Pacific Ocean (Figure
8.1) is the second largest body of water considered in
this report. The surface currents of the South Pacific are
strongly influenced by the predominantly westerly wind
near the southern boundary (45°S) and easterly winds
near the equator (Figure 8.2). Along the southern
boundary of the South Pacific, strong easterly flow is
found at the subtropical front (STF) and in the Antarctic
Circumpolar Current (ACC). The westward return flow
is primarily by the South Equatorial Current (SEC) (Fig-
ure 8.2; Roemmich and Cornuelle, 1990). A portion of
the easterly flow passes between South America and
Antarctica, but part of it curves northward and flows
along the west coast of South America as the Humboldt
(or Chile–Peru) Current. The quasi stationary South Pa-
cific high atmospheric pressure zone near 100°W, be-
tween 20 and 35°S, deflects winds toward the equator
and contributes to the ~15 Sv (Sv = sverdrup = 106 m3 s–1;
Wijffels et al., 2001) strength of the Humboldt Current
(Wyrtki, 1963), one of the most productive eastern
boundary currents (EBCs) in the global oceans. Strong
wind-induced upwelling along the Peru and Chile coast-
lines results in large phytoplankton blooms, a substan-
tial biomass of zooplankton, and some of the world’s
largest annual fish catches (Fiedler et al., 1991; Daneri et
al., 2000; Pennington et al., 2006; Chavez and Messié,
2009; Correa-Ramirez et al., 2012).
The Humboldt Current bifurcates around 25°S (Fuen-
zalida et al., 2008); the offshore branch heads northwest
and the more coastal branch continues along the coast of
Peru. Both branches eventually turn mainly westward as
part of the SEC that flows from South America to the
western Pacific. The SEC divides as it approaches Aus-
tralia producing at least three major branches, one of the
most important being the East Australian Current
(EAC). The EAC is the Western Boundary Current
(WBC) of the southwestern Pacific and is associated with
the South Pacific subtropical gyre (Mata et al., 2000). The
EAC is significantly weaker than other WBCs in terms of
volume transport, with ca. 15 Sv mean annual flow (Ma-
ta et al., 2000). It flows poleward along the eastern Aus-
tralian coast carrying warm water from tropical to mid
latitudes. It separates from the continent at 30–34°S,
where about two-thirds of the flow moves eastward and
then continues down the east coast of New Zealand be-
fore going farther eastward (Godfrey et al., 1980; Ridg-
way and Godfrey, 1997). In the region where the EAC
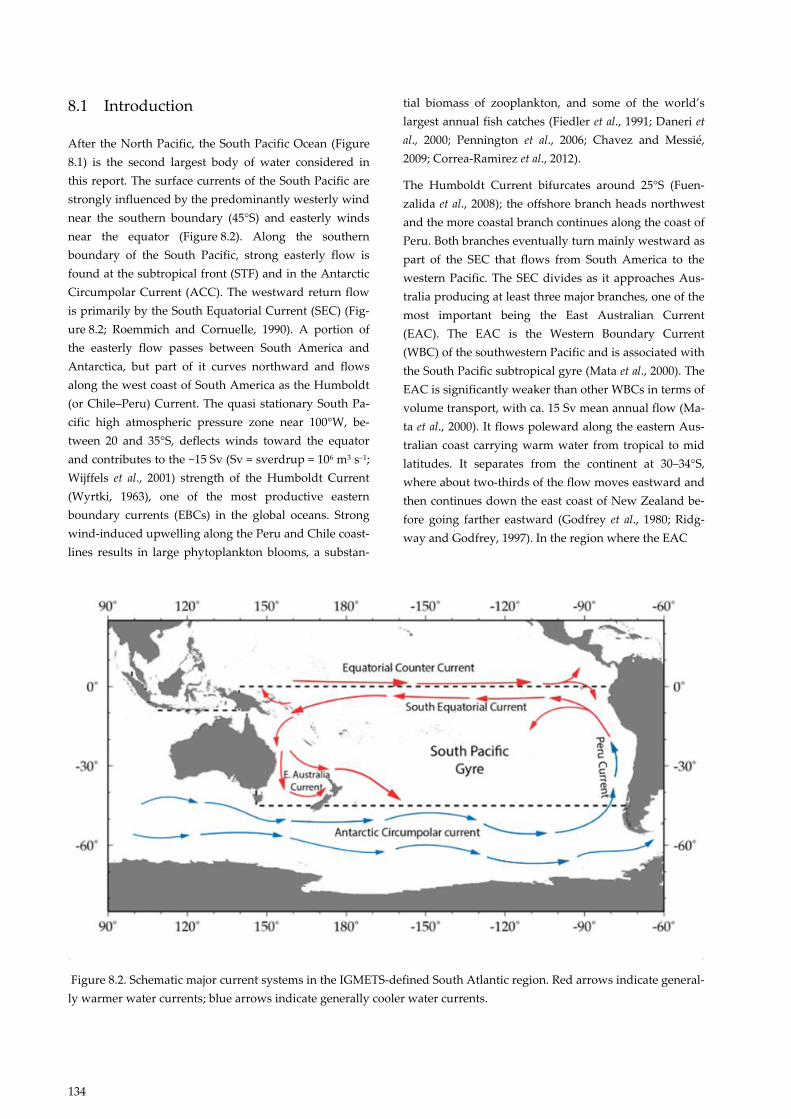
Figure 8.2. Schematic major current systems in the IGMETS-defined South Atlantic region. Red arrows indicate general-
ly warmer water currents; blue arrows indicate generally cooler water currents.
Chapter 8 South Pacific Ocean
135
veers eastward, the remaining ca. one-third of the EAC
continues south past Tasmania as an eddy field (Mata et
al., 2006; O’Kane et al., 2011; Macdonald et al., 2013; Ceti-
na-Heredia et al., 2014). The seasonal, interannual and
decadal changes of the EAC, together with the high var-
iability induced by the mesoscale eddies, dominate cir-
culation features along the east coast of Australia and
influence the biogeochemistry and ecology of the region
(Cetina-Heredia et al., 2014).
In the western tropical Pacific between 10°Nand 10°S
and centred around 170°E, the Pacific Warm Pool (WP)
is characterized by high sea surface temperatures (SST,
28–29°C) and low sea surface salinities (SSS, <35), the
latter induced by heavy rainfall (Wyrtki, 1989). Along
much of the northern edge of the South Pacific and ex-
tending into the central gyre is a large region of very
high solar radiation (ca. 200 W m–2), warming the ocean,
causing considerable evaporation, and producing large
net precipitation along the intertropical convergence
zone (ITCZ) near the equator (Meehl et al., 2008). Farther
south at ca. 15–25°S and centred at ca. 124°W, the warm-
ing produces a region of very high net evaporation and
high surface salinities (SSS >36; Hasson et al., 2013). This
pool of high-salinity water seasonally migrates eastward
during austral summer and westward during austral
winter, driven by changes in the intensity of the South
Pacific Convergence Zone and easterly winds. However,
a net migration westward of the salinity maximum over
the past 20 years has been noted (Hasson et al., 2013).
A high pressure zone tends to persist over Australia
during austral summer (December–February), directing
winds that deflect equatorial trade winds poleward and
creating the strong South Pacific Convergence Zone
(SPCZ) (Vincent, 1994; Vincent et al., 2011). While the
SPCZ is best developed during austral summer, it is
present year-round, extending from New Guinea (0°
150°E) east–southeastward to about 30°S 120°W. In its
northwestern sector, the SPCZ merges with the Inter-
tropical Convergence Zone (ITCZ). This low-level at-
mospheric convergence and precipitation zone is one of
the major components of South Pacific climate and is
responsible for a large fraction of South Pacific precipita-
tion, especially during austral summer (Vincent, 1994;
Brown et al., 2011; Vincent et al., 2011).
Important drivers of oceanic ecology such as currents,
upwelling, tides, irradiance, temperature, and nutrients
show significant variation across a range of time- and
space scales producing a complex spatial and temporal
pattern of trends. This report focuses on time-scales of 5–
30 years and spatial scales from hundreds to millions of
square kilometers. Most of the multiyear and large spa-
tial-scale variability in the physics, biogeochemistry, and
ecology of the South Pacific is modulated by “shorter”
natural climatic cycles such as El Niño Southern Oscilla-
tion (ENSO), the Interdecadal Pacific Oscillation (IPO),
and Southern Annular Mode (SAM). These natural cy-
cles often have a more profound effect on SST differ-
ences between years than the long-term rise of ca. 0.03°C
decade–1 since 1850 (Rayner et al., 2006).
El Niño Southern Oscillation (ENSO) is a coupled ocean
and atmosphere cycle consisting of a weakening and
strengthening of the easterly trade winds over the tropi-
cal Pacific and with a consequent impact on sea surface
temperatures (Wang et al., 2012a). It fluctuates between
warm (El Niño) and cold (La Niña) conditions in the
tropical Pacific (Rayner et al., 2003; McPhaden et al.,
2006; Annex A6). During El Niño, the easterly trade
winds weaken, the reduced westward flow at the equa-
tor results in the migration of warm surface water east-
ward, and the upwelling along the west coast of South
America substantially decreases. La Niña is character-
ized by stronger trade winds, warmer surface waters in
the western Pacific, and cold water at the equator in the
central and eastern Pacific (Rasmusson and Carpenter,
1982; Philander, 1990; Trenberth, 1997; Pennington et al.,
2006). ENSO affects many other regions through tele-
connections in the atmosphere and ocean and tends to
cycle between 2–7 years (McPhaden et al., 2006). De-
pending on the temporal window and region selected,
this cycle can make the surface ocean warmer or colder.
The Interdecadal Pacific Oscillation (IPO) is a pattern of
Pacific climate variability similar to ENSO in character,
but which persists for much longer. It is a robust, recur-
ring pattern centred over the mid-latitude Pacific basin
with a 20–30-year period (Biondi et al., 2001). During
negative IPOs, the SPCZ moves southwest, similar to La
Niña events (Folland et al., 2002). The recent hiatus in
global warming has been associated with a persistent
negative IPO that commenced in about 2000 (Dai et al.,
2015; Trenberth, 2015). In late 2014, there were signs that
the IPO might be shifting to a more positive phase.
During a positive Southern Annular Mode (SAM) event,
the southern hemisphere westerly winds tend to move
farther south and increase in intensity (Thompson and
Wallace, 2000). This results in stronger cold water
upwelling at high latitudes, anomalous downwelling
136
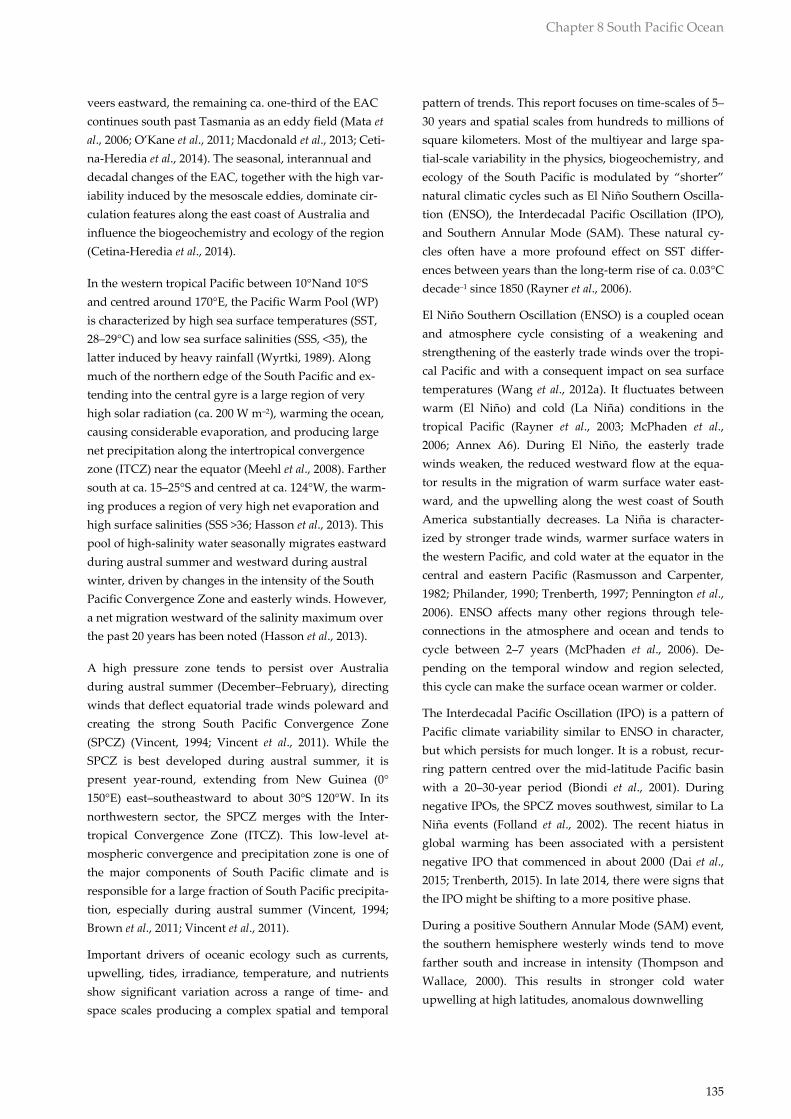
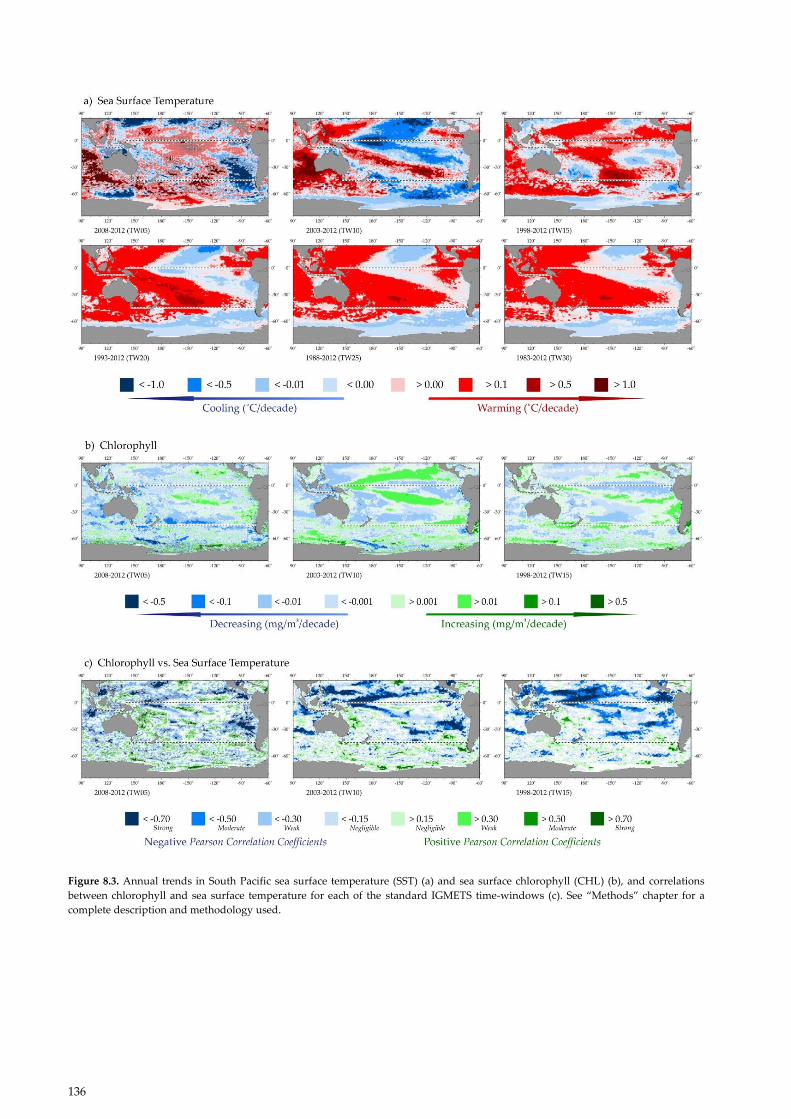
Figure 8.3. Annual trends in South Pacific sea surface temperature (SST) (a) and sea surface chlorophyll (CHL) (b), and correlations
between chlorophyll and sea surface temperature for each of the standard IGMETS time-windows (c). See “Methods” chapter for a
complete description and methodology used.
Chapter 8 South Pacific Ocean
137
around 45°S, and a strengthening of the Antarctic Cir-
cumpolar Current (Hall and Visbeck, 2002; Oke and
England, 2004). Variations in the SAM have been shown
to be correlated with SST anomalies in the central tropi-
cal Pacific (Ding et al., 2012). There is significant tem-
poral variability in the SAM, but over the last 50+ years,
the SAM index has been positive and on the rise
(Thompson and Wallace, 2000; Abram et al., 2014). This
rise has been linked to anthropogenic factors which in-
clude ozone depletion (Fyfe et al., 1999).
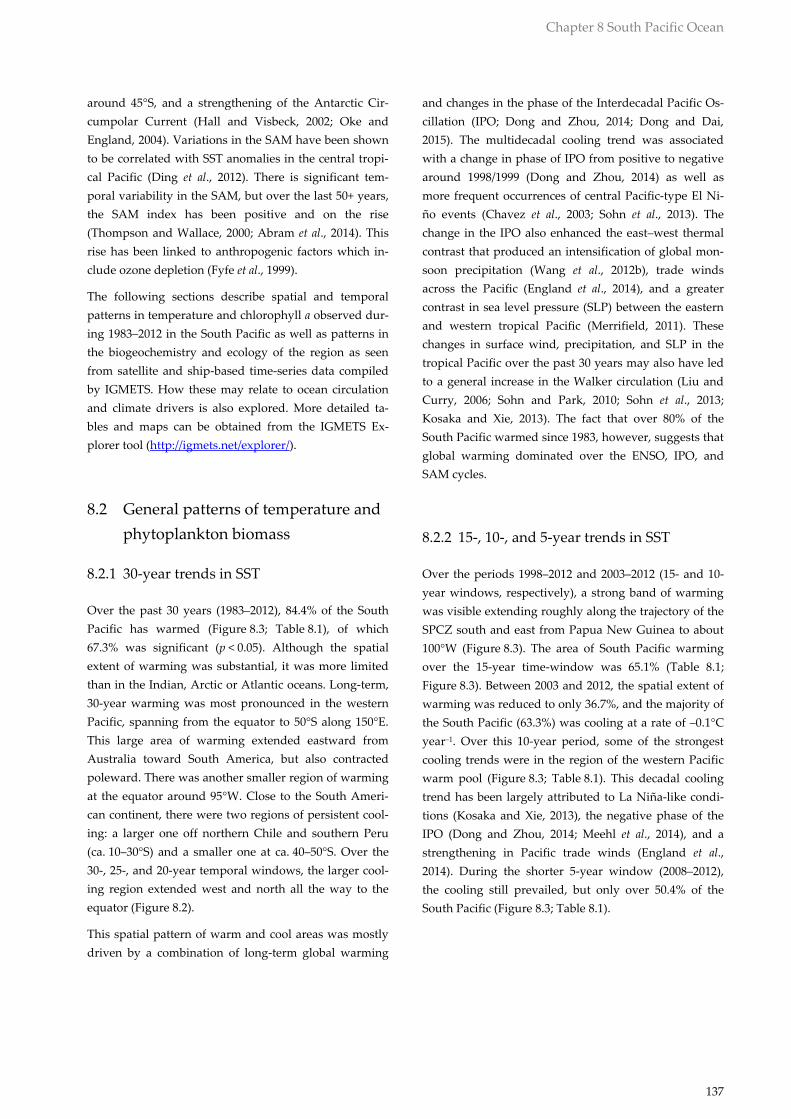
The following sections describe spatial and temporal
patterns in temperature and chlorophyll a observed dur-
ing 1983–2012 in the South Pacific as well as patterns in
the biogeochemistry and ecology of the region as seen
from satellite and ship-based time-series data compiled
by IGMETS. How these may relate to ocean circulation
and climate drivers is also explored. More detailed ta-
bles and maps can be obtained from the IGMETS Ex-
plorer tool (http://igmets.net/explorer/).
8.2 General patterns of temperature and
phytoplankton biomass
8.2.1 30-year trends in SST
Over the past 30 years (1983–2012), 84.4% of the South
Pacific has warmed (Figure 8.3; Table 8.1), of which
67.3% was significant (p < 0.05). Although the spatial
extent of warming was substantial, it was more limited
than in the Indian, Arctic or Atlantic oceans. Long-term,
30-year warming was most pronounced in the western
Pacific, spanning from the equator to 50°S along 150°E.
This large area of warming extended eastward from
Australia toward South America, but also contracted
poleward. There was another smaller region of warming
at the equator around 95°W. Close to the South Ameri-
can continent, there were two regions of persistent cool-
ing: a larger one off northern Chile and southern Peru
(ca. 10–30°S) and a smaller one at ca. 40–50°S. Over the
30-, 25-, and 20-year temporal windows, the larger cool-
ing region extended west and north all the way to the
equator (Figure 8.2).
This spatial pattern of warm and cool areas was mostly
driven by a combination of long-term global warming
and changes in the phase of the Interdecadal Pacific Os-
cillation (IPO; Dong and Zhou, 2014; Dong and Dai,
2015). The multidecadal cooling trend was associated
with a change in phase of IPO from positive to negative
around 1998/1999 (Dong and Zhou, 2014) as well as
more frequent occurrences of central Pacific-type El Ni-
ño events (Chavez et al., 2003; Sohn et al., 2013). The
change in the IPO also enhanced the east–west thermal
contrast that produced an intensification of global mon-
soon precipitation (Wang et al., 2012b), trade winds
across the Pacific (England et al., 2014), and a greater
contrast in sea level pressure (SLP) between the eastern
and western tropical Pacific (Merrifield, 2011). These
changes in surface wind, precipitation, and SLP in the
tropical Pacific over the past 30 years may also have led
to a general increase in the Walker circulation (Liu and
Curry, 2006; Sohn and Park, 2010; Sohn et al., 2013;
Kosaka and Xie, 2013). The fact that over 80% of the
South Pacific warmed since 1983, however, suggests that
global warming dominated over the ENSO, IPO, and
SAM cycles.
8.2.2 15-, 10-, and 5-year trends in SST
Over the periods 1998–2012 and 2003–2012 (15- and 10-
year windows, respectively), a strong band of warming
was visible extending roughly along the trajectory of the
SPCZ south and east from Papua New Guinea to about
100°W (Figure 8.3). The area of South Pacific warming
over the 15-year time-window was 65.1% (Table 8.1;
Figure 8.3). Between 2003 and 2012, the spatial extent of
warming was reduced to only 36.7%, and the majority of
the South Pacific (63.3%) was cooling at a rate of –0.1°C
year–1. Over this 10-year period, some of the strongest
cooling trends were in the region of the western Pacific
warm pool (Figure 8.3; Table 8.1). This decadal cooling
trend has been largely attributed to La Niña-like condi-
tions (Kosaka and Xie, 2013), the negative phase of the
IPO (Dong and Zhou, 2014; Meehl et al., 2014), and a
strengthening in Pacific trade winds (England et al.,
2014). During the shorter 5-year window (2008–2012),
the cooling still prevailed, but only over 50.4% of the
South Pacific (Figure 8.3; Table 8.1).
138
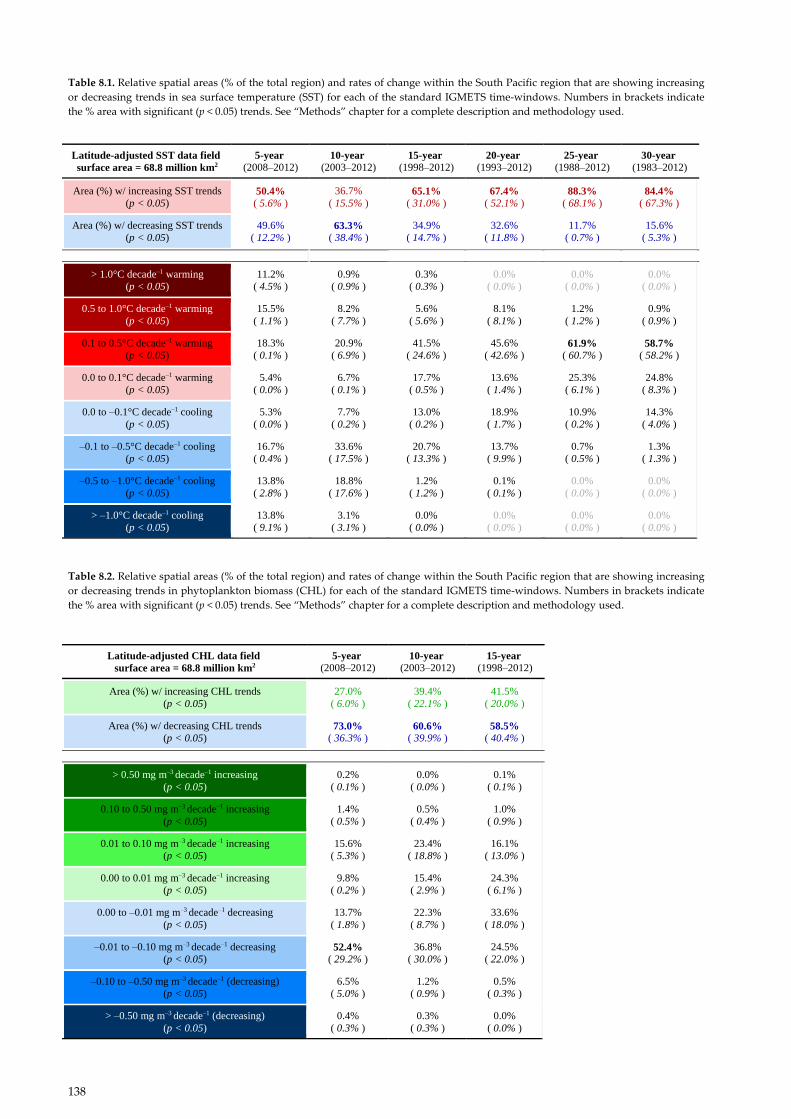
Table 8.1. Relative spatial areas (% of the total region) and rates of change within the South Pacific region that are showing increasing
or decreasing trends in sea surface temperature (SST) for each of the standard IGMETS time-windows. Numbers in brackets indicate
the % area with significant (p < 0.05) trends. See “Methods” chapter for a complete description and methodology used.
Table 8.2. Relative spatial areas (% of the total region) and rates of change within the South Pacific region that are showing increasing
or decreasing trends in phytoplankton biomass (CHL) for each of the standard IGMETS time-windows. Numbers in brackets indicate
the % area with significant (p < 0.05) trends. See “Methods” chapter for a complete description and methodology used.
Latitude-adjusted SST data field
surface area = 68.8 million km2
5-year (2008–2012)
10-year (2003–2012)
15-year (1998–2012)
20-year (1993–2012)
25-year (1988–2012)
30-year (1983–2012)
Area (%) w/ increasing SST trends
(p < 0.05) 50.4% ( 5.6% )
36.7%
( 15.5% ) 65.1%
( 31.0% ) 67.4%
( 52.1% ) 88.3%
( 68.1% ) 84.4%
( 67.3% )
Area (%) w/ decreasing SST trends
(p < 0.05)
49.6%
( 12.2% ) 63.3%
( 38.4% )
34.9%
( 14.7% )
32.6%
( 11.8% )
11.7%
( 0.7% )
15.6%
( 5.3% )
> 1.0°C decade–1 warming
(p < 0.05)
11.2%
( 4.5% )
0.9%
( 0.9% )
0.3%
( 0.3% )
0.0%
( 0.0% )
0.0%
( 0.0% )
0.0%
( 0.0% )
0.5 to 1.0°C decade–1 warming
(p < 0.05)
15.5%
( 1.1% )
8.2%
( 7.7% )
5.6%
( 5.6% )
8.1%
( 8.1% )
1.2%
( 1.2% )
0.9%
( 0.9% )
0.1 to 0.5°C decade–1 warming
(p < 0.05)
18.3%
( 0.1% )
20.9%
( 6.9% )
41.5%
( 24.6% )
45.6%
( 42.6% ) 61.9%
( 60.7% ) 58.7%
( 58.2% )
0.0 to 0.1°C decade–1 warming
(p < 0.05)
5.4%
( 0.0% )
6.7%
( 0.1% )
17.7%
( 0.5% )
13.6%
( 1.4% )
25.3%
( 6.1% )
24.8%
( 8.3% )
0.0 to –0.1°C decade–1 cooling
(p < 0.05)
5.3%
( 0.0% )
7.7%
( 0.2% )
13.0%
( 0.2% )
18.9%
( 1.7% )
10.9%
( 0.2% )
14.3%
( 4.0% )
–0.1 to –0.5°C decade–1 cooling
(p < 0.05)
16.7%
( 0.4% )
33.6%
( 17.5% )
20.7%
( 13.3% )
13.7%
( 9.9% )
0.7%
( 0.5% )
1.3%
( 1.3% )
–0.5 to –1.0°C decade–1 cooling
(p < 0.05)
13.8%
( 2.8% )
18.8%
( 17.6% )
1.2%
( 1.2% )
0.1%
( 0.1% )
0.0%
( 0.0% )
0.0%
( 0.0% )
> –1.0°C decade–1 cooling
(p < 0.05)
13.8%
( 9.1% )
3.1%
( 3.1% )
0.0%
( 0.0% )
0.0%
( 0.0% )
0.0%
( 0.0% )
0.0%
( 0.0% )
Latitude-adjusted CHL data field
surface area = 68.8 million km2
5-year
(2008–2012) 10-year
(2003–2012) 15-year
(1998–2012)
Area (%) w/ increasing CHL trends
(p < 0.05)
27.0%
( 6.0% )
39.4%
( 22.1% )
41.5%
( 20.0% )
Area (%) w/ decreasing CHL trends
(p < 0.05) 73.0%
( 36.3% ) 60.6%
( 39.9% ) 58.5%
( 40.4% )
> 0.50 mg m–3 decade–1 increasing
(p < 0.05)
0.2%
( 0.1% )
0.0%
( 0.0% )
0.1%
( 0.1% )
0.10 to 0.50 mg m–3 decade–1 increasing
(p < 0.05)
1.4%
( 0.5% )
0.5%
( 0.4% )
1.0%
( 0.9% )
0.01 to 0.10 mg m–3 decade–1 increasing
(p < 0.05)
15.6%
( 5.3% )
23.4%
( 18.8% )
16.1%
( 13.0% )
0.00 to 0.01 mg m–3 decade–1 increasing
(p < 0.05)
9.8%
( 0.2% )
15.4%
( 2.9% )
24.3%
( 6.1% )
0.00 to –0.01 mg m–3 decade–1 decreasing
(p < 0.05)
13.7%
( 1.8% )
22.3%
( 8.7% )
33.6%
( 18.0% )
–0.01 to –0.10 mg m–3 decade–1 decreasing
(p < 0.05) 52.4%
( 29.2% )
36.8%
( 30.0% )
24.5%
( 22.0% )
–0.10 to –0.50 mg m–3 decade–1 (decreasing)
(p < 0.05)
6.5%
( 5.0% )
1.2%
( 0.9% )
0.5%
( 0.3% )
> –0.50 mg m–3 decade–1 (decreasing)
(p < 0.05)
0.4%
( 0.3% )
0.3%
( 0.3% )
0.0%
( 0.0% )
Chapter 8 South Pacific Ocean
139
8.2.3 15-year trends in chlorophyll a
The dominant trend for surface chlorophyll a has been to
decline in the South Pacific (Figure 8.3; Table 8.2). The
South Pacific, however, had regions of positive and neg-
ative trends in chlorophyll a, depending on the region
and the temporal window considered. In the tropics,
there was often a relationship between warming and
declining chlorophyll a, while across most of the tem-
poral windows and much of the South Pacific, signifi-
cant relationships between SST and chlorophyll a were
relatively rare (Figure 8.3, bottom). Over the 15-year
time-window, chlorophyll a declined over 58.5% (40.4%,
p < 0.05) of the South Pacific. Most of this decline oc-
curred in the South Pacific gyre or in the tropical eastern
Pacific (Figure 8.3). The South Pacific gyre itself has been
estimated to be growing at 245 766 km2 year–1 (or
1.4% year–1) between 1998 and 2006 (Polovina et al.,
2008). The decline in chlorophyll a within the tropical
eastern Pacific was observed in a similar analysis by
Gregg and Rousseaux (2014) and suggested to be linked
to ENSO. Significant increases in chlorophyll a were
observed at about 10°S and between 20 and 40°S off the
coast of South America, along the Subtropical Front
(STF) stretching from Tasmania to South America, and
along the trajectory of the SPCZ. These observations
agree with other findings based on satellite observations
(Vantrepotte and Melin, 2011; Siegel et al., 2013; Gregg
and Rousseaux, 2014). Greater chlorophyll a concentra-
tions in the Humboldt Current are consistent with sug-
gestions of increasing upwelling intensity as a result of
climate change (Bakun, 1990; Gutiérrez et al., 2011;
Sydeman et al., 2014). The eddies along the STF appear
to support substantial blooms of coccolithophores (Balch
et al., 2011, 2016) during austral summer (December–
January). ENSO may also exert an influence on phyto-
plankton along the STF; for example, when a positive
SAM aligns with a positive ENSO event, the eddy kinet-
ic energy and number of eddies increases significantly
(Langlais et al., 2015). Over the 15-year time-window, the
highest rate of chlorophyll a increase was > 0.01 mg chlo-
rophyll a m–3 year–1 measured in the southern Tasman
Sea. This appears to be associated with greater EAC ed-
dy pumping and an increase in winter intrusions of the
STF into the Tasman Sea (Matear et al., 2013; Kelly et al.,
2015).
8.2.3 10-year trends in chlorophyll a
Between 2003 and 2012, 60.6% (39.9% significant with
p < 0.05) of the South Pacific showed a decline in chloro-
phyll a (Table 8.2; Figure 8.3). At the same time, a
marked increase in chlorophyll a was observed in a band
across the South Pacific from about 0°E and 160°E to
20°S and 100°W. The chlorophyll a increase overlapped
part of the SPCZ, running north of, but parallel to, the
band of strongly warming SST (Figure 8.3). A similar
spatial pattern of increasing chlorophyll a was also evi-
dent over the 15 years between 1998 and 2012. There
was a strikingly similar spatial pattern of temporal
trends in temperature and chlorophyll a in the North
Pacific (see Chapter 9, Figure 9.4) over this 100-year
window. The cooler, more productive waters in the cen-
tral South Pacific have been attributed, in part, to a
strengthening of the Pacific trade winds (England et al.,
2014). At ca. 40–45°S off the coast of southern Chile,
there was another region with a strong positive chloro-
phyll a trend over 10 years. This increase in chlorophyll a
was positively correlated with SST (Figure 8.3).
Despite the cooler equatorial waters during the 10-year
time-window, the upwelling zone of the tropical Pacific
and off the Peruvian coast showed a decline in chloro-
phyll a. It has been suggested that this may be a result of
ENSO (Gregg and Rousseaux, 2014). Finally, chlorophyll
a patterns near the Chilean coast during this period were
heterogeneous, but generally correlated negatively with
temperature (Figure 8.3, bottom).
8.2.4 5-year trends in chlorophyll a
Over the most recent and shortest temporal window
(2008–2012), declining chlorophyll a was observed over
73% (36.3% at p < 0.05) of the South Pacific (Table 8.2).
Over this 5-year period, there were strong declines in
chlorophyll a north of the STF and in the region of the
western Pacific warm pool close to Papua New Guinea.
Although considerably weaker, the spatial pattern of an
increase in chlorophyll a spreading eastward and at an
angle away from the equator across the Pacific was also
evident over this time-window (Figure 8.3). A patchy,
but broad, increase in remotely-sensed chlorophyll a was
evident east of Australia through the southern Coral Sea
and northern Tasman Sea as far east as 160°E (Fig-
ure 8.3). Some of these patches showed a strong positive
140
correlation with SST. Explanations for these positive
correlations in the open ocean are largely hypothetical,
although predicted by some models and potentially at-
tributable to (i) more diazotrophs (Dutkiewicz et al.,
2014), (ii) potential increase in eddy pumping (McGil-
licuddy et al., 1998) associated with increasing eddy ki-
netic energy, and (iii) the strengthening of the EAC
(Matear et al., 2013). Sporadic increases in chlorophyll a
were also observed off Chile in the region where the
current flow along the STF interacts with the subtropical
water mass.
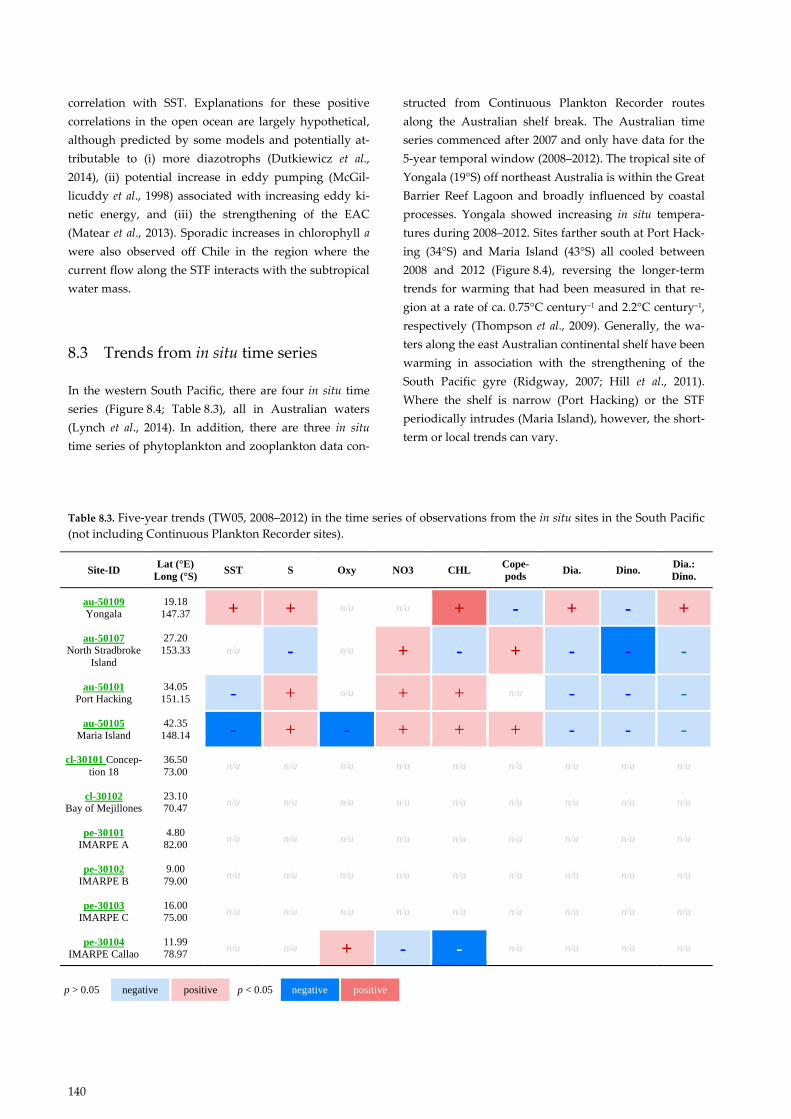
8.3 Trends from in situ time series
In the western South Pacific, there are four in situ time
series (Figure 8.4; Table 8.3), all in Australian waters
(Lynch et al., 2014). In addition, there are three in situ
time series of phytoplankton and zooplankton data con-
structed from Continuous Plankton Recorder routes
along the Australian shelf break. The Australian time
series commenced after 2007 and only have data for the
5-year temporal window (2008–2012). The tropical site of
Yongala (19°S) off northeast Australia is within the Great
Barrier Reef Lagoon and broadly influenced by coastal
processes. Yongala showed increasing in situ tempera-
tures during 2008–2012. Sites farther south at Port Hack-
ing (34°S) and Maria Island (43°S) all cooled between
2008 and 2012 (Figure 8.4), reversing the longer-term
trends for warming that had been measured in that re-
gion at a rate of ca. 0.75°C century–1 and 2.2°C century–1,
respectively (Thompson et al., 2009). Generally, the wa-
ters along the east Australian continental shelf have been
warming in association with the strengthening of the
South Pacific gyre (Ridgway, 2007; Hill et al., 2011).
Where the shelf is narrow (Port Hacking) or the STF
periodically intrudes (Maria Island), however, the short-
term or local trends can vary.
Table 8.3. Five-year trends (TW05, 2008–2012) in the time series of observations from the in situ sites in the South Pacific
(not including Continuous Plankton Recorder sites).
Site-ID Lat (°E)
Long (°S) SST S Oxy NO3 CHL
Cope-
pods Dia. Dino.
Dia.:
Dino.
au-50109
Yongala
19.18
147.37 + + n/a n/a + - + - +
au-50107
North Stradbroke
Island
27.20
153.33 n/a - n/a + - + - - -
au-50101
Port Hacking
34.05
151.15 - + n/a + + n/a - - -
au-50105
Maria Island
42.35
148.14 - + - + + + - - -
cl-30101 Concep-
tion 18
36.50
73.00 n/a n/a n/a n/a n/a n/a n/a n/a n/a
cl-30102
Bay of Mejillones
23.10
70.47 n/a n/a n/a n/a n/a n/a n/a n/a n/a
pe-30101
IMARPE A
4.80
82.00 n/a n/a n/a n/a n/a n/a n/a n/a n/a
pe-30102
IMARPE B
9.00
79.00 n/a n/a n/a n/a n/a n/a n/a n/a n/a
pe-30103
IMARPE C
16.00
75.00 n/a n/a n/a n/a n/a n/a n/a n/a n/a
pe-30104
IMARPE Callao
11.99
78.97 n/a n/a + - - n/a n/a n/a n/a
p > 0.05 negative positive p < 0.05 negative positive
Chapter 8 South Pacific Ocean
141
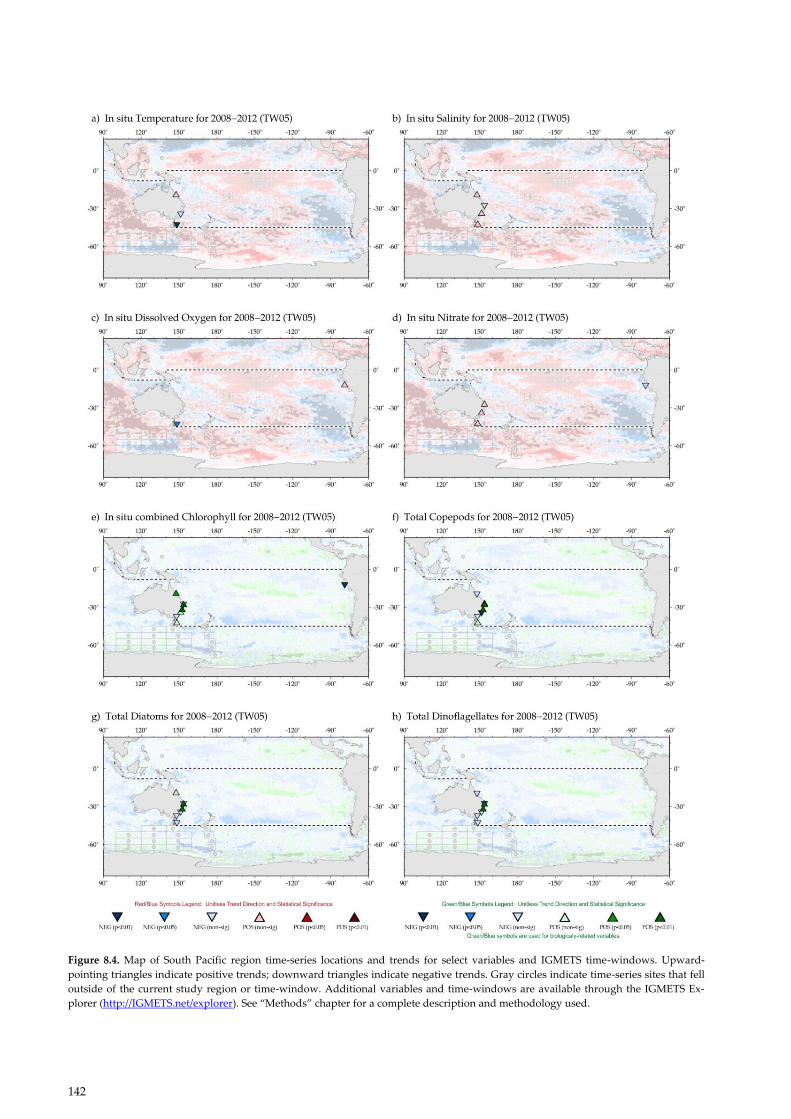
From 2008 to 2012, in situ salinity trends were weak,
tending to increase at three sites and decline at one site
along the east coast of Australia (Figure 8.4). Over the
same time-period, nitrate concentrations increased
weakly at three mid-latitude stations (North Stradbroke
Island, Port Hacking, and Maria Island). Nitrate concen-
trations at Pork Hacking have been rising since the 1950s
(Thompson et al., 2009; Kelly et al., 2015). The strengthen-
ing EAC, a positive IPO, and the La Niña of 2010–2011
are likely to have reduced downwelling and shallowed
the pynocline along the east coast of Australia (Gibbs et
al., 1998), potentially providing more nutrients to the
euphotic zone. Between 2008 and 2012, silicate concen-
trations increased at North Stradbroke Island, Port
Hacking, and Maria Island, reversing strong 30-year
declines at the latter two sites (Thompson et al., 2009).
The La Niña event of 2011 broke the “Millennium
Drought” for eastern Australia (Dijk et al., 2013), with
the second highest rainfalls ever recorded and many
rivers flooding over their banks. The increased silicate
potentially reflects the input of substantial silicate-rich
runoff.
Between 2008 and 2012, the in situ chlorophyll a concen-
trations rose significantly at three sites along the mid to
northeast coast of Australia, while trends were weaker
and mixed at sites farther south (Figure 8.4). The spatial
footprint of Australian sites at North Stradbroke Island
and Maria Island are known to reflect changes in chlo-
rophyll a and temperature over broad regions of the
South Coral Sea and Tasman Sea, respectively (Oke and
Sakov, 2012; Jones et al., 2015). In some cases, the posi-
tive in situ chlorophyll a trends observed along the Aus-
tralian coast contrasted with the weak trends measured
using satellite remote sensing, highlighting the differ-
ence that may exist between these measurements in
coastal areas and the need to use caution when interpret-
ing data from just one source (Pennington et al., 2006).
Zooplankton and phytoplankton data from the east
coast of Australia in 2008–2012 were available from sev-
en sites where trends in total copepod biomass were
mixed: four positive and three negative (Figure 8.3). The
two significant positive trends in zooplankton from the
CPR route on the mid-east coast coincided with in situ
measurements of increasing chlorophyll a by CPR colour
index. On the eastern coast of Australia (North Strad-
broke Island site), a strong trend in increasing copepod
biomass was also found, but with weakly decreasing in
situ chlorophyll a. In addition, all three sites with in-
creasing copepod biomass were in regions of increasing
SST (Figure 8.3).
Off the Australian east coast, diatoms increased at three
of seven sites (Figure 8.4g); the most significant increase
was observed in offshore sites near the separation zone
at about 30°S where most of the EAC turns eastward to
flow across the Tasman Sea. Dinoflagellates also in-
creased at these mid-coast sites. Trends at the more
coastal and the most southerly stations tended to be
weak and negative. The surface nutrient concentrations
along the east coast of Australia are extremely low
(Condie and Dunn, 2006), with low silicate previously
reported to limit diatom blooms (Grant, 1971). Between
the La Niña of 1999, during the millennium drought and
prevailing El Niño conditions, diatoms declined signifi-
cantly along Australia’s east coast (Ajani et al., 2016).
However, the 2008–2012 data suggest that diatoms re-
covered at Yongala, while dinoflagellates declined and
the diatom/dinoflagellate ratio increased (Figures 8.4g, f;
Table 8.3).
In the eastern South Pacific, in situ time series were
scarce. Based on satellite data, the region has been
broadly cooling throughout all temporal windows. At
the Peruvian site of Callao (11°S), nutrients (nitrate,
phosphate, and silicate) have generally declined, with
nitrate and silicate decreasing from 1998 to 2012 (Fig-
ure 8.4). Callao also showed declines in chlorophyll a for
the same time-period. The negative trend is consistent
with satellite data. The recent decline in phytoplankton
has been attributed to warmer conditions induced by the
ENSO. Over the longer period of 15 years, the Callao
time series of chlorophyll a was still negative, while the
Bay of Mejillones showed a positive trend. Satellite data
indicated that, during 1998–2012, the region was experi-
encing spatially heterogeneous increases (Vargas et al.,
2007; Chavez and Messié, 2009; Chavez et al., 2011;
Gutierrez et al., 2011) and decreases (Thomas et al., 2009)
in chlorophyll a (Figure 8.3).
Two zooplankton time series were available along the
west coast of South America from 23°S (Bay of Mejil-
lones) and ca. 36°S (Concepción Station). The temporal
trends in zooplankton biomass were generally weak,
sometimes positive and sometimes negative. For exam-
ple, a weak positive trend in zooplankton biomass was
found over 15 years (1998–2012) in the Bay of Mejillones.
The notable exception was a statistically significant,
negative trend in zooplankton biomass off southern
Chile at the Concepción site between 2003 and 2012.
142
Figure 8.4. Map of South Pacific region time-series locations and trends for select variables and IGMETS time-windows. Upward-
pointing triangles indicate positive trends; downward triangles indicate negative trends. Gray circles indicate time-series sites that fell
outside of the current study region or time-window. Additional variables and time-windows are available through the IGMETS Ex-
plorer (http://IGMETS.net/explorer). See “Methods” chapter for a complete description and methodology used.

Chapter 8 South Pacific Ocean
143
This trend occurred in spite of declining SST and in-
creasing upwelling (Escribano et al., 2012). As noted by
Escribano et al. (2012), zooplankton biomass is sensitive
to the timing and scale of upwelling. Ayon et al. (2008)
suggested that zooplankton biomass is positively corre-
lated with seasonal temperature, and thus persistent
upwelling may be a negative factor for zooplankton
abundance. Zooplankton abundance rose 50% from 1981
to 2002 off Peru, but in 2002, it was still only one-fourth
of the peak biomass observed in 1967 (Ayón et al., 2008).
Ayón et al. (2008) also reported a positive correlation
between zooplankton and anchovy biomass.
Dissolved oxygen (DO) trends were only available from
two sites in the entire South Pacific: off Tasmania and in
the Peruvian upwelling (Callao). Off Tasmania, the
2008–2012 trends were weakly negative. At ca. 11°S off
Peru, DO trends were positive and statistically signifi-
cant over the 15 years between 1998 and 2012. Combined
with the declining SST (satellite data only), the 15 years
of increasing DO observed at Callao support the hy-
pothesis of a more vigorous upwelling in this boundary
current in response to climate change (Bakun, 1990)
and/or a response to the intensification of the trade
winds in the Pacific (England et al., 2014).
8.4 Comparisons with other studies
The long-term rate of warming for southern hemisphere
oceans has been 0.03°C decade–1 (Rayner et al., 2006),
although across the entire South Pacific basin, this trend
was found to be statistically insignificant over the last 60
years (Hoegh-Guldberg et al., 2014). Yet, the IGMETS
analysis for 2008–2012 in the South Pacific showed 11.2%
(4.5% at p < 0.05) of the surface ocean was warming at
> 1.0°C decade–1 and a similar rate of cooling was found
over 13.8% (9.1% at p < 0.05). Clearly, there is a need to
consider subbasin-scale variability and the role of natu-
ral climatic cycles. These regional patterns in SST have
been attributed to both human-induced global warming
(Stott et al., 2010) and natural climatic cycles (e.g. IPO,
ENSO; Dong and Zhou, 2014; England et al., 2014; Dong
and Dai, 2015; Karl et al., 2015). The combination of pro-
gressive global warming, the IPO, and ENSO seem to
account for most of the temporal and spatial patterns in
SST trends observed over the last 30 years in the tropical
Pacific (Dong and Dai, 2015).
The proportion of the South Pacific that is warming is
rising much faster than the proportional increase in SST
(Polovina and Woodworth, 2012). The long-term cooling
SST trend in much of the eastern South Pacific is con-
sistent with suggestions of increasing upwelling intensi-
ty as a result of climate change (Bakun, 1990; Sydeman et
al., 2014), changes in the subtropical gyre circulation (Cai
et al., 2005; Schneider et al., 2007), and changes in the
Pacific wind regime (England et al., 2014). The dramatic
cooling observed in this analysis over large parts of the
South Pacific during the 2003–2012 time-window has
also been noted by several studies and attributed to nat-
ural climate variability, tied specifically to La Niña-like
decadal cooling (Kosaka and Xie, 2013) and wind-
induced cooling (England et al., 2014). Natural climatic
cycles have also affected surface salinity in the region.
The negative IPO and strong La Niña of 2010–2011 saw a
southwest shift in the SPCZ, bringing more precipitation
to the South Pacific (Salinger et al., 2001; Folland et al.,
2002; Cai and Rensch, 2012). At the same time, equatori-
al rainfall moved eastward along the ITCZ. Similarly,
there has been a significant freshening in the western
tropical Pacific, extending eastward under the low-
salinity ITCZ and SPCZ regions (Durack and Wijffels,
2010).
The trends reported herein for satellite-derived chloro-
phyll a are similar to those previously published (Gregg
and Conkright, 2002; Thomas et al., 2012; Siegel et al.,
2013; Gregg and Rousseaux, 2014). For large portions of
the South Pacific, there is a tendency for chlorophyll a to
covary negatively with SST (Martinez et al., 2006; Van-
trepotte and Mélin, 2011), a pattern consistent with
warming SST being associated with a deeper surface
mixed layer and reduced nutrient availability (Thomas
et al., 2009; Hofmann et al., 2011, Doney et al., 2012).
There were also regions of positive covariation between
SST and chlorophyll a previously reported in the tropics
north and west of Australia (Martinez et al., 2006) along
the STF (Vantrepotte and Mélin, 2011) and in parts of the
central gyre (Signorini et al., 2015). For regions where the
mixed-layer depth is too deep for net positive phyto-
plankton growth during most of the year, e.g. along the
STF, a positive relationship of chlorophyll a with SST is
predictable. A similar covariation has been found in
Humboldt Current off Peru and northern Chile (Thomas
et al., 2009), where wind and chlorophyll phenology are
out of phase and mixed-layer depth and light play a
significant role in surface chlorophyll concentrations
(Echevin et al., 2008). The major impacts of these changes
are increasingly evident and amenable to modelling that
accounts for both the physical supply and biological
losses of carbon, oxygen, and nutrients (e.g. Deutsch et
144
al., 2006, 2011). For example, changes in chlorophyll a
within the Tasman Sea are well described in models and
estimated into the future by climatic forcings (Matear et
al., 2013). Climate-related changes to phytoplankton taxa
have also been modelled (Bopp et al., 2005), statistically
estimated (Barnes et al., 2011), extrapolated using remote
sensing (Polovina and Woodworth, 2012; Uitz et al.,
2015), and modelled using a combination of both (Gregg
and Rouseaux, 2014). One general outcome that seems
highly likely is a shift to smaller taxa as the oceans con-
tinue to warm (Barnes et al., 2011).
The tropical Pacific has seen a dramatic decline in oxy-
gen concentration; some of the steepest declines were
measured under the western Pacific warm pool, while
the lowest concentrations were in the eastern tropical
Pacific (Stramma et al., 2010). In 2012, the trend was ob-
served as –1 µmol kg–1 year–1 between 2°N and 8°S at
about 86°W (Czeschel et al., 2015). This oxygen con-
sumption was associated with significantly increased
phosphate and nitrate concentrations in the oxygen-
minimum zone. The biological effects of the declining
oxygen concentrations include vertical compression of
habitat for species with high oxygen requirements such
as tuna (Prince and Goodyear, 2006). The increasing
nutrient concentrations at depth also imply the seques-
tering of more nutrients below a strengthening pycno-
cline, potentially reducing primary production. Howev-
er, the extent of low oxygen regions in the Pacific has
been linked to equatorial Pacific wind regime (Deutsch
et al., 2014).
Previous analysis (Thompson et al., 2009) showed mostly
increasing nutrient concentrations in the shelf waters of
eastern Australia, results which are largely consistent
with IGMETS. A notable exception was the detection of
a change from declining to increasing silicate during
2008–2012 in the more recent IGMETS analysis. The
mixed positive and negative trends observed for in situ
nutrients may be associated with changes in circulation,
thermocline depth, and/or changes in ecosystems in-
duced by the different climate modes operating in the
Pacific (Pennington et al., 2006; Chavez et al., 2011).
8.5 Conclusions
Long-term trends in fundamental characteristics of the
environment, such as temperature and salinity, are in-
creasingly evident. For example, over the past 30 years,
significant surface warming has been recorded over
nearly tenfold more area of the South Pacific than sur-
face cooling (67.3% vs. 5.3%, respectively). A strong
physical coupling with planktonic ecology and biology
is evident in the South Pacific, with a dominant warming
pattern and significantly declining phytoplankton popu-
lations. The southeastern Pacific upwelling system con-
tinues to show intensification (Vargas et al., 2007), while
the tropical Pacific and subtropical gyre mostly exhibit-
ed declining trends in surface chlorophyll a. Prediction
of the future ecological state of this important system
requires understanding the physical drivers and their
ecological consequences throughout the foodwebs, par-
ticularly the impact changes may have on ecosystem
services at a regional scale. Modelling has been used to
predict trends in phytoplankton community composi-
tion within the South Pacific (Polovina and Woodworth,
2012; Rousseaux and Gregg, 2015), but these have very
limited taxonomic resolution. The time series included
in IGMETS provide the means to test, validate, and im-
prove ecological models of trophic links and trophic
efficiency across an ample spectrum of phytoplankton
and zooplankton taxonomic groups and predict poten-
tial changes that may occur within Pacific Ocean food-
webs in response to climate variability.
While “short” climate cycles such as ENSO have been
associated with changes in copepod abundance in the
Pacific (White et al., 1995, Thompson et al., 2015), reports
of long-term trends in macrozooplankton biomass or
taxa in the South Pacific are extremely rare (Ajani et al.,
2016). In other ocean basins, there have been stronger
links established between zooplankton community
composition and climate-related increases in tempera-
ture (Richardson and Schoeman, 2004; Chiba et al., 2006).
Some researchers have also suggested links between the
abundance of some jellyfish (Cnidaria) and climate
(Richardson, 2008), but the hypothesis is supported by
only a few case studies from other oceans (reviewed by
Purcell, 2005). For this section, zooplankton data were
available only in a handful of locations, and the same is
true for most of the other biogeochemical and ecological
variables. Indeed, our understanding of the climatic ef-
fects on marine ecology, such as phytoplankton commu-
nity composition, zooplankton productivity, and fish
populations in the South Pacific remains rudimentary
mostly due to a lack of data. Our knowledge of the spa-
tial scale of ecological changes is limited to a few regions
with time-series data. For example, during the 2010 La
Niña event, there was a poleward extension of some
dominant tropical taxa, such as Prochlorococcus and Syn-
echococcus, and a decline in macrozooplankton (Thomp-
Chapter 8 South Pacific Ocean
145
son et al., 2015). These apparent La Niña effects could
have extended throughout the southwestern Pacific.
Similarly, there have been large range expansions for
some easily observed taxa such as Noctiluca (Thompson
et al., 2009; Harrison et al., 2011; McLeod et al., 2012),
raising concerns about rapid, but unobserved, changes
in the basic ecology of our oceans (Doney et al., 2012).
These very substantial expansions in regions of rapid
warming suggest that physical transport of suitable hab-
itat may be the controlling mechanism. The location of
existing time series in the South Pacific also limits our
knowledge of ecological changes to the continental shelf.
While coastal sites can be used to warn of changes, such
as low oxygen and high carbon dioxide water coming
near shore (Chan et al., 2008), given the rapid rate of
expanding low oxygen zones, it may be beneficial to
have more offshore monitoring (Deutsch et al., 2015).
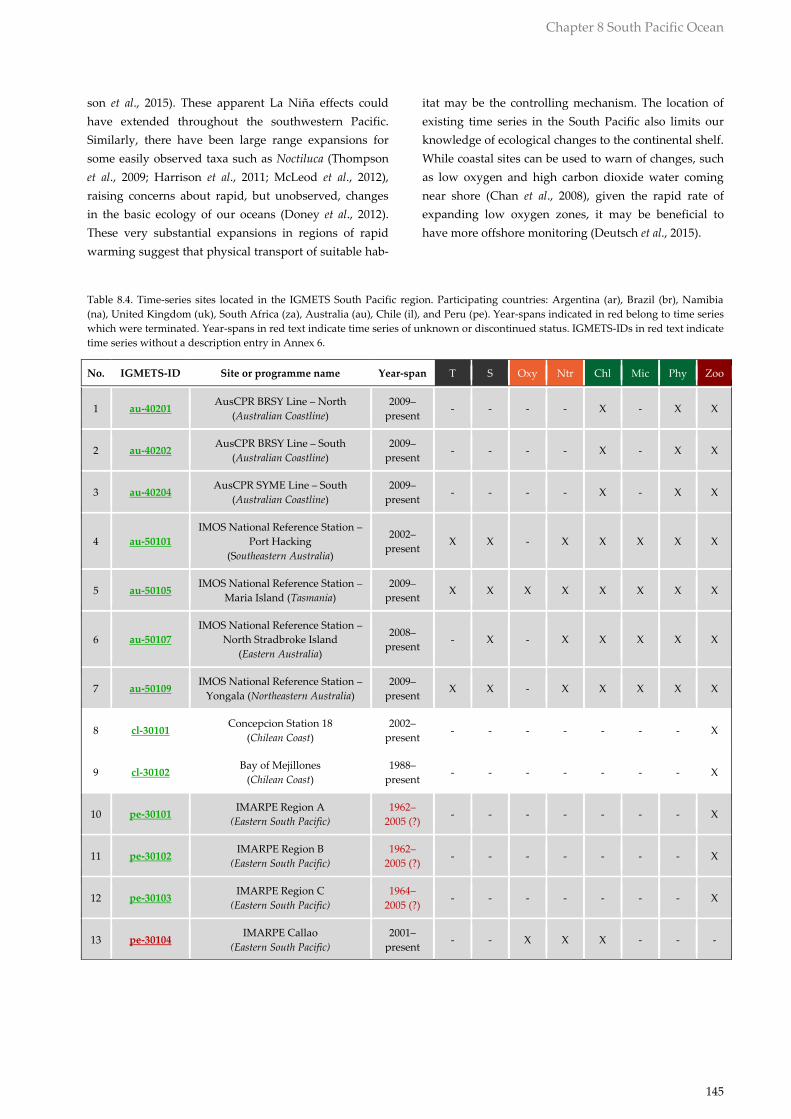
Table 8.4. Time-series sites located in the IGMETS South Pacific region. Participating countries: Argentina (ar), Brazil (br), Namibia
(na), United Kingdom (uk), South Africa (za), Australia (au), Chile (il), and Peru (pe). Year-spans indicated in red belong to time series
which were terminated. Year-spans in red text indicate time series of unknown or discontinued status. IGMETS-IDs in red text indicate
time series without a description entry in Annex 6.
No. IGMETS-ID Site or programme name Year-span T S Oxy Ntr Chl Mic Phy Zoo
1 au-40201
AusCPR BRSY Line – North
(Australian Coastline)
2009–
present - - - - X - X X
2 au-40202
AusCPR BRSY Line – South
(Australian Coastline)
2009–
present - - - - X - X X
3 au-40204
AusCPR SYME Line – South
(Australian Coastline)
2009–
present - - - - X - X X
4 au-50101
IMOS National Reference Station –
Port Hacking
(Southeastern Australia)
2002–
present X X - X X X X X
5 au-50105
IMOS National Reference Station –
Maria Island (Tasmania)
2009–
present X X X X X X X X
6 au-50107
IMOS National Reference Station –
North Stradbroke Island
(Eastern Australia)
2008–
present - X - X X X X X
7 au-50109
IMOS National Reference Station –
Yongala (Northeastern Australia)
2009–
present X X - X X X X X
8 cl-30101
Concepcion Station 18
(Chilean Coast)
2002–
present - - - - - - - X
9 cl-30102
Bay of Mejillones
(Chilean Coast)
1988–
present - - - - - - - X
10 pe-30101 IMARPE Region A
(Eastern South Pacific)
1962–
2005 (?) - - - - - - - X
11 pe-30102 IMARPE Region B
(Eastern South Pacific)
1962–
2005 (?) - - - - - - - X
12 pe-30103 IMARPE Region C
(Eastern South Pacific)
1964–
2005 (?) - - - - - - - X
13 pe-30104
IMARPE Callao
(Eastern South Pacific)
2001–
present - - X X X - - -
146
8.6 References
Abram, N. J., Mulvaney, R., Vimeux, F., Phipps, S. J.,
Turner, J., and England, M. H. 2014. Evolution of
the Southern Annular Mode during the past mil-
lennium. Nature Climate Change, 4: 564–569.
Ajani, P., Hallegraeff, G. M., Allen, D., Coughlan, A.,
Richardson, A. J., Armand, L. K., Ingelton, T., et
al. 2016. Establishing baselines: a review of eighty
years of phytoplankton diversity and biomass in
south-eastern Australia. Oceanography and Ma-
rine Biology: An Annual Review, 54: 387–412.
Ayón, P., Criales-Hernandez, M. I., Schwamborn, R., and
Hirche, H-J. 2008. Zooplankton research off Peru:
A review. Progress in Oceanography, 79(2): 238–
255.
Bakun, A. 1990. Global climate change and intensifica-
tion of coastal ocean upwelling. Science, 247: 198–
201.
Balch, W. M., Bates, N. R., Lam, P. J., Twining, B. S.,
Rosengard, S. Z., Bowler, B. C., Drapeau, D. T., et
al. 2016. Factors regulating the Great Calcite Belt
in the Southern Ocean and its biogeochemical
significance. Global Biogeochemical Cycles, 30:
doi:10.1002/2016GB005414.
Balch, W. M., Drapeau, D. T., Bowler, B. C., Lyczkowski,
E., Booth, E. S., and Alley, D. 2011. The contribu-
tion of coccolithophores to the optical and inor-
ganic carbon budgets during the Southern Ocean
Gas Exchange Experiment: new evidence in sup-
port of the “Great Calcite Belt” hypothesis. Jour-
nal of Geophysical Research, 116: C00F06,
doi:10.1029/2011JC006941.
Barnes, C., Irigoien, X., De Oliveira, J. A. A., Maxwell,
D., and Jennings, S. 2011. Predicting marine phy-
toplankton community size structure from empir-
ical relationships with remotely sensed variables.
Journal of Plankton Research, 33: 13–24.
Biondi, F., Gershunov, A., and Cayan, D. R. 2001. North
Pacific decadal climate variability since 1661.
Journal of Climate, 14(1): 5–10, doi:10.1175/1520-
442(2001)014.
Bopp, L., Aumont, O., Cadule, P., Alvain, S., and Gehlen,
M. 2005. Response of diatoms distribution to
global warming and potential implications: A
global model study. Geophysical Research Let-
ters, 32(19): doi:10.1029/2005GL023653.
Brown, J. R., Power, S. B., Delage, F. P., Colman, R. A.,
Moise, A. F., and Murphy, B. F. 2011. Evaluation
of the South Pacific Convergence Zone in IPCC
AR4 climate model simulations of the twentieth
century. Journal of Climate, 24(6): 1565–1582,
doi:10.1175/2010JCLI3942.1.
Cai, W., and Rensch, P. 2012. The 2011 southeast
Queensland extreme summer rainfall: a confirma-
tion of a negative Pacific Decadal Oscillation
phase? Geophysical Research Letters, 39(8):
doi:10.1029/2011GL050820.
Cai, W. J., Shi, G., Cowan, T., Bi, D. and Ribbe, J. 2005.
The response of southern annular mode, the East
Australian Current, and the southern midlatitude
ocean circulation to global warming. Journal of
Geophysical Research Letters, 32:
doi:10.1029/2005GL024701.
Cetina-Heredia, P., Roughan, M., van Sebille, E., and
Coleman, M. A. 2014. Long-term trends in the
East Australian Current separation latitude and
eddy driven transport. Journal of Geophysical
Research: Oceans, 119: doi:10.1002/2014JC010071.
Chan, F., Barth, J. A., Lubchenco, J., Kirincich, A., Weeks,
H., Peterson, W. T., and Menge, B. A. 2008. Emer-
gence of anoxia in the California Current large
marine ecosystem. Science, 319(5865): 920–920.
Chavez F. P., and Messié, M. 2009. A comparison of
eastern boundary upwelling ecosystems. Progress
in Oceanography, 83: 80–96.
Chavez, F. P., Messié, M., and Pennington, J. T. 2011.
Marine primary production in relation to climate
variability and change. Annual Review of Marine
Science, 3: 227–260.
Chavez, F. P., Ryan, J., Lluch-Cota, S. E., and Ñiquen, M.
2003. From anchovies to sardines and back: mul-
tidecadal change in the Pacific Ocean. Science,
299(5604): 217–221.
Chiba, S., Tadokoro, K., Sugisaki, H., and Saino, T. 2006.
Effects of decadal climate change on zooplankton
over the last 50 years in the western subarctic
North Pacific. Global Change Biology, 12(5): 907–
920.
Condie, S. A., and Dunn, J. R. 2006. Seasonal characteris-
tics of the surface mixed layer in the Australasian
region: implications for primary production re-
gimes and biogeography. Marine and Freshwater
Research, 57(6): 569–590.
Chapter 8 South Pacific Ocean
147
Correa-Ramirez, M. A., Hormazabal, S. E., and Morales,
C. E. 2012. Spatial patterns of annual and interan-
nual surface chlorophyll-a variability in the Peru–
Chile Current System. Progress in Oceanography,
92: 8–17.
Czeschel, R., Stramma, L., Weller, R. A., and Fischer, T.
2015. Circulation, eddies, oxygen, and nutrient
changes in the eastern tropical South Pacific
Ocean. Ocean Science, 11: 455–470, doi:10.5194/os-
11-455-2015.
Dai, A., Fyfe, J. C., Xie, S. P., and Dai, X. 2015. Decadal
modulation of global surface temperature by in-
ternal climate variability. Nature Climate Change,
5(6): 555–559, doi:10.1038/nclimate2605.
Daneri, G., Dellarossa, V., Quiñones, R., Jacob, B., Mon-
tero, P., and Ulloa, O. 2000. Primary production
and community respiration in the Humboldt Cur-
rent System off Chile and associated oceanic are-
as. Marine Ecology Progress Series, 197: 41–49.
Deutsch, C., Berelson, W., Thunell, R., Weber, T., Tems,
C., McManus, J., Crusius, J., et al. 2014. Centennial
changes in North Pacific anoxia linked to tropical
trade winds. Science, 345(6197): 665–668.
Deutsch, C., Brix, H., Ito, T., Frenzel, H., and Thompson,
L. 2011. Climate-forced variability of ocean hy-
poxia. Science, 333(6040): 336–339.
Deutsch, C., Emerson, S., and Thompson, L. 2006. Physi-
cal‐biological interactions in North Pacific oxygen
variability. Journal of Geophysical Research:
Oceans, 111: C09S90, doi:10.1029/2005JC003179.
Deutsch, C., Ferrel, A., Seibel, B., Pörtner, H. O., and
Huey, R. B. 2015. Climate change tightens a meta-
bolic constraint on marine habitats. Science,
348(6239): 1132–1135.
Dijk, A. I., Beck, H. E., Crosbie, R. S., Jeu, R. A., Liu, Y.
Y., Podger, G. M., Timbal, B., et al. 2013. The Mil-
lennium Drought in southeast Australia (2001–
2009): Natural and human causes and implica-
tions for water resources, ecosystems, economy,
and society. Water Resources Research, 49(2):
1040–1057.
Ding, Q., Steig, E. J., Battisti, D. S., and Wallace, J. M.
2012. Influence of the tropics on the Southern An-
nular Mode. Journal of Climate, 25(18): 6330–
6348, doi:http://dx.doi.org/10.1175/JCLI-D-11-
00523.1.
Doney, S. C., Ruckelshaus, M., Duffy, J., Barry, J. P.,
Chan, F., English, C. A., Galindo, H. M., et al.
2012. Climate change impacts on marine ecosys-
tems. Annual Review of Marine Science, 4: 11–37,
doi:10.1146/annurev-marine-041911-111611.
Dong, B., and Dai, A. 2015. The influence of the Interde-
cadal Pacific Oscillation on temperature and pre-
cipitation over the globe. Climate Dynamics, 45(9-
10): 2667–2681, doi:10.1007/s00382-015-2500-x.
Dong, L., and Zhou, T. 2014. The formation of the recent
cooling in the eastern tropical Pacific Ocean and
the associated climate impacts: A competition of
global warming, IPO, and AMO. Journal of Geo-
physical Research: Atmosphere, 119: 11272–11287,
doi:10.1002/2013JD021395.
Durack, P. J., and Wijffels, S. E. 2010. Fifty-year trends in
global ocean salinities and their relationship to
broad-scale warming. Journal of Climate, 23(16):
4342–4362,
http://dx.doi.org/10.1175/2010JCLI3377.1.
Dutkiewicz, S., Ward, B. A., Scott, J. R., and Follows, M.
J. 2014. Understanding predicted shifts in diazo-
troph biogeography using resource competition
theory. Biogeosciences, 11: 5445–5461,
doi:10.5194/bg-11-5445-2014.
Echevin, V., Aumont, O., Ledesma, J., and Flores, G.
2008. The seasonal cycle of surface chlorophyll in
the Peruvian upwelling system: a modelling
study. Progress in Oceanography, 79: 167–176.
England, M. H., McGregor, S., Spence, P., Meehl, G. A.,
Timmermann, A., Cai, W., Gupta, A. S., et al. 2014.
Recent intensification of wind-driven circulation
in the Pacific and the ongoing warming hiatus.
Nature Climate Change, 4(3): 222–227.
Escribano, R., Hidalgo, P., Fuentes, M., and Donoso, K.
2012. Zooplankton time series in the coastal zone
off Chile: Variation in upwelling and responses of
the copepod community. Progress in Oceanogra-
phy, 97–100: 174–186.
Fiedler, P. C., Philbrick, V., and Chavez, F. P. 1991. Oce-
anic upwelling and productivity in the eastern
tropical Pacific. Limnology and Oceanography,
36: 1834–1850.
Folland, C. K., Renwick, J. A., Salinger, M. J., and Mul-
lan, A. B. 2002. Relative influences of the Interde-
cadal Pacific Oscillation and ENSO in the South
Pacific Convergence Zone. Geophysical Research
Letters, 29: 21-1–21-4.
148
Fuenzalida, R., Schneider, W., Garcés-Vargas, J., and
Bravo, L. 2008. Satellite altimetry data reveal jet-
like dynamics of the Humboldt Current. Journal
of Geophysical Research, 113: C07043,
doi:10.1029/2007JC004684.
Fyfe, J. C., Boer, G. J., and Flato, G. M. 1999. Arctic and
Antarctic oscillations and their projected changes
under global warming. Geophysical Research Let-
ters, 26(11): 1601–1604.
Gibbs, M. T., Middleton, J. H., and Marchesiello, P. 1998.
Baroclinic response of Sydney shelf waters to lo-
cal wind and deep ocean forcing, Journal of Phys-
ical Oceanography, 28: 178–190.
Grant, B. R. 1971. Variation in silicate concentration at
Port Hacking station, Sydney, in relation to phy-
toplankton growth. Marine and Freshwater Re-
search, 22(1): 49–54.
Godfrey, J. S., Cresswell, G. R., Golding, T. J., Pearce, A.
F., and Boyd, R. 1980. The separation of the east
Australian current. Journal of Physical Oceanog-
raphy, 10(3): 430–440.
Gregg, W. W., and Conkright, M. E. 2002. Decadal
changes in global ocean chlorophyll. Geophysical
Research Letters, 29(11): 20–21,
doi:10.1029/2002GL014689.
Gregg, W. W., and Rousseaux, C. S. 2014. Decadal trends
in global pelagic ocean chlorophyll: A new as-
sessment integrating multiple satellites, in situ
data, and models. Journal of Geophysical Re-
search: Oceans, 119: 5921–5933,
doi:10.1002/2014JC010158.
Gutiérrez, D., Bouloubassi, I., Sifeddine, A., Purca, S.,
Goubanova, K., Graco, M., Field, D., et al. 2011.
Coastal cooling and increased productivity in the
main upwelling zone off Peru since the
mid‐twentieth century. Geophysical Research Let-
ters, 38: L07603, doi:10.1029/2010GL046324.
Hall, A., and Visbeck, M. 2002. Synchronous variability
in the Southern Hemisphere atmosphere, sea ice,
and ocean resulting from the Annular Mode.
Journal of Climate, 15(21): 3043–3057.
Harrison, P. J., Furuya, K., Glibert, P., Xu, J., Liu, H. B.,
Yin, K., Lee, J. H. W., et al. 2011. Geographical dis-
tribution of red and green Noctiluca scintillans.
Chinese Journal of Oceanology and Limnology,
29: 807–831, doi:10.1007/s00343-011-0510-z.
Hasson, A., Delcroix, T., and Boutin, J. 2013. Formation
and variability of the South Pacific Sea Surface Sa-
linity maximum in recent decades. Journal of Ge-
ophysical Research: Oceans, 118: 5109–5116,
doi:10.1002/jgrc.20367.
Hill, K. L., Rintoul, S. R., Ridgway, K., and Oke, P. R.
2011. Decadal changes in the South Pacific west-
ern boundary current system revealed in observa-
tions and reanalysis state estimates. Geophysical
Research Letters, 116: doi: 10.1029/2009JC005926.
Hoegh-Guldberg, O., Cai, R., Poloczanska, E. S., Brewer,
P. G., Sundby, S., Hilmi, K., Fabry, V. J., et al.
2014. The Ocean. In Climate Change 2014: Im-
pacts, Adaptation, and Vulnerability. Part B: Re-
gional Aspects, pp. 1655–1731. Ed. by V. R. Bar-
ros, C. B. Field, D. J. Dokken, M. D. Mastrandrea,
K. J. Mach, T. E. Bilir, M. Chatterjee, et al. Contri-
bution of Working Group II to the Fifth Assess-
ment Report of the Intergovernmental Panel on
Climate Change, Cambridge University Press,
Cambridge and New York. 688 pp.
Hofmann, M., Worm, B., Rahmstorf, S., and Schellnhu-
ber, H. J. 2011. Declining ocean chlorophyll under
unabated anthropogenic CO2 emissions. Envi-
ronmental Research Letters, 6(3): 034035,
doi:10.1088/1748-9326/3/034035.
Jones, E. M., Doblin, M. A., Matear, R., and King, E.
2015. Assessing and evaluating the ocean-colour
footprint of a regional observing system. Journal
of Marine Systems, 143: 49–61.
Karl, T. R., Arguez, A., Huang, B., Lawrimore, J. H.,
McMahon, J. R., Menne, M. J., Peterson, T. C., et
al. 2015. Possible artifacts of data biases in the re-
cent global surface warming hiatus. Science,
348(6242): 1469–1472.
Kelly, P., Clementson, L., and Lyne, V. 2015. Decadal
and seasonal changes in temperature, salinity, ni-
trate, and chlorophyll in inshore and offshore wa-
ters along southeast Australia. Journal of Geo-
physical Research: Oceans, 120: 4226–4244.
Kosaka, Y., and Xie, S. P. 2013. Recent global-warming
hiatus tied to equatorial Pacific surface cooling.
Nature, 501(7467): 403–407.
Langlais, C., Rintoul, S., and Zika, J. 2015. Sensitivity of
Antarctic circumpolar transport and eddy activity
to wind patterns in the Southern Ocean. Journal
Physical Oceanography, 45: 1051–1067,
doi:10.1175/JPO-D-14-0053.1.
Chapter 8 South Pacific Ocean
149
Liu, J., and Curry, J. A. 2006. Variability of the tropical
and subtropical ocean surface latent heat flux
during 1989–2000. Geophysical Research Letters,
33(5): doi: 10.1029/2005GL024809.
Lynch, T. P., Morello, E. B., Evans, K., Richardson, A. J.,
Rochester, W., Steinberg, C. R., Roughan, M., et al.
2014. IMOS national reference stations: a conti-
nental-wide physical, chemical and biological
coastal observing system. PLoS ONE, 9(12):
e113652, doi:10.1371/journal.pone.0113652.
Macdonald, H. S., Roughan, M., Baird, M. E., and Wil-
kin, J. 2013. A numerical modeling study of the
East Australian Current encircling and overwash-
ing a warm-core eddy. Journal of Geophysical Re-
search: Oceans, 118: 301–315,
doi:10.1029/2012JC008386.
Martinez, P., Lamy, F., Robinson, R. S., Pichevin, L., and
Billy, I. 2006. Atypical δ15N variations at the
southern boundary of the East Pacific oxygen
minimum zone over the last 50 ka. Quaternary
Science Reviews, 25: 3017–3028.
Mata, M. M., Tomczak, M., Wijffels, S., and Church, J. A.
2000. East Australian Current volume transports
at 30 S: Estimates from the World Ocean Circula-
tion Experiment hydrographic sections PR11/P6
and the PCM3 current meter array. Journal of Ge-
ophysical Research: Oceans, 105(C12): 28509–
28526.
Mata, M. M., Wijffels, S. E., Church, J. A., and Tomczak,
M. 2006. Eddy shedding and energy conversions
in the East Australian Current. Journal of Geo-
physical Research, 111: C09034,
doi:10.1029/2006JC003592.
Matear, R. J., Chamberlain, M. A., Sun, C., and Feng, M.
2013. Climate change projection of the Tasman
Sea from an eddy-resolving ocean model. Journal
of Geophysical Research, 118: 2961–2976,
doi:10.1002/jgrc.20202.
McGillicuddy, D. J., Robinson, A. R., Siegel, D. A., Jan-
nasch, H. W., Johnson, R., Dickeys, T., McNeil, J.,
et al. 1998. Influence of mesoscale eddies on new
production in the Sargasso Sea. Nature, 394(6690):
263–266.
McLeod, D. J., Hallegraeff, G. M., Hosie, G. M., and
Richardson, A. J. 2012. Climate-driven range ex-
pansion of the red-tide dinoflagellate Noctiluca
scintillans into the Southern Ocean. Journal of
Plankton Research, 34: 332–337.
McPhaden, M. J., Zebiak, S. E., and Glantz, M. H. 2006.
ENSO as an integrating concept in earth science.
Science, 314(5806): 1740–1745.
Meehl, G. A., Arblaster, J. M., Branstator, G., and van
Loon, H. 2008. A coupled air–sea response mech-
anism to solar forcing in the Pacific region. Jour-
nal of Climate, 21: 2883–2897,
doi:http://dx.doi.org/10.1175/2007JCLI1776.1.
Meehl, G. A., Teng, H., and Arblaster, J. M. 2014. Cli-
mate model simulations of the observed early-
2000s hiatus of global warming. Nature Climate
Change, 4(10): 898–902, doi:10.1038/nclimate2357.
Merrifield, M. A. 2011. A shift in western tropical Pacific
sea level trends during the 1990s. Journal of Cli-
mate, 24(15): 4126–4138.
O’Kane, T. J., Oke, P. R., and Sandery, P. A. 2011. Pre-
dicting the east Australian current. Ocean Model-
ling, 38(3): 251–266,
doi:10.1016/j.ocemod.2011.04.003.
Oke, P. R., and England, M. H. 2004. Oceanic response to
changes in the latitude of the Southern Hemi-
sphere subpolar westerly winds. Journal of Cli-
mate, 17(5): 1040–1054.
Oke, P. R., and Sakov, P. 2012. Assessing the footprint of
a regional ocean observing system. Journal of Ma-
rine Systems, 105–108: 30–51.
Pennington, J. T., Mahoney, K. L., Kuwahara, V. S., Kol-
ber, D. D., Calienes, R., and Chavez, F. P. 2006.
Primary production in the eastern tropical Pacific:
a review. Progress in Oceanography, 69: 285–317.
Philander, S. G. 1990. El Nino, La Niña, and the South-
ern Oscillation. Academic Press, San Diego. 293
pp.
Polovina, J. J., Howell, E. A., and Abecassis, M. 2008. The
ocean's least productive waters are expanding.
Geophysical Research Letters, 35: L03618,
http://dx.doi.org/10.1029/2007GL031745.
Polovina, J. J., and Woodworth, P. A. 2012. Declines in
phytoplankton cell size in the subtropical oceans
estimated from satellite remotely-sensed tempera-
ture and chlorophyll, 1998–2007, Deep-Sea Re-
search II, 77–80: 82–88,
http://dx.doi.org/10.1016/j.dsr2.2012.04.006.
Prince, E. D., and Goodyear, C. P. 2006. Hypoxia‐based
habitat compression of tropical pelagic fishes.
Fisheries Oceanography, 15(6): 451–464.

150
Purcell, J. E. 2005. Climate effects on formation of jelly-
fish and ctenophore blooms: a review. Journal of
the Marine Biological Association of the United
Kingdom, 85: 461–476.
Rasmusson, E. M., and Carpenter, T. H. 1982. Variations
in tropical sea surface temperature and surface
wind fields associated with the Southern Oscilla-
tion/El Nino. Monthly Weather Review, 110: 354–
384.
Rayner, N. A., Parker, D. E., Horton, E. B., Folland, C. K.,
Alexander, L. V., Rowell, D. P., Kent, E. C., et al.
2003. Global analyses of sea surface temperature,
sea ice, and night marine air temperature since
the late nineteenth century. Journal of Geophysi-
cal Research, 108(D14): 4407,
doi:10.1029/2002JD002670.
Rayner, N. A., Brohan, P., Parker, D. E., Folland, C. K.,
Kennedy, J. J., Vanicek, M., Ansell, T. J., et al. 2006.
Improved analyses of changes and uncertainties
in sea surface temperature measured in situ since
the mid-nineteenth century: the HadSST2 dataset.
Journal of Climate, 19: 446–469.
Richardson, A. 2008. In hot water: zooplankton and cli-
mate change. ICES Journal of Marine Science,
65(3): 279–295, doi:10.1093/icesjms/fsn028.
Richardson, A. J., and Schoeman, D. S. 2004. Climate
impact on plankton ecosystems in the Northeast
Atlantic. Science, 305(5690): 1609–1612,
doi:10.1126/science.1100958.
Ridgway, K. R. 2007. Long-term trend and decadal vari-
ability of the southward penetration of the East
Australian Current. Geophysical Research Letters,
34: L13613, doi:10.1029/2007GL030393.
Ridgway, K. R., and Godfrey, J. S. 1997. Seasonal cycle of
the East Australian Current. Journal of Geophysi-
cal Research, 102(C10): 22921–22936,
doi:10.1029/97JC00227.
Roemmich, D., and Cornuelle, B. 1990. Observing the
fluctuations of gyre-scale ocean circulation: a
study of the subtropical South Pacific. Journal of
Physical Oceanography, 20: 1919–1934,
doi:http://dx.doi.org/10.1175/1520-
0485(1990)020<1919:OTFOGS>2.0.CO;2.
Rousseaux, C. S., and Gregg, W. W. 2015. Recent decadal
trends in global phytoplankton composition.
Global Biogeochemical Cycles, 29: 1674–1688,
doi: 10.1002/2015GB005139.
Salinger, M. J., Renwick, J. A., and Mullan, A. B. 2001.
Interdecadal Pacific oscillation and south Pacific
climate. International Journal of Climatology,
21(14): 1705–1721, doi:10.1002/joc.691.
Schneider, W., Fukasawa, M., Garcés‐Vargas, J., Bravo,
L., Uchida, H., Kawano, T., and Fuenzalida, R.
2007. Spin‐up of South Pacific subtropical gyre
freshens and cools the upper layer of the eastern
South Pacific Ocean. Geophysical Research Let-
ters, 34(24): L24606,
doi:10.1029/2007GL031933,2007.
Siegel, D. A., Behrenfeld, M. J., Maritorena, S., McClain,
C. R., Antoine, D., Bailey, S. W., Bontempi, P. S., et
al. 2013. Regional to global assessments of phyto-
plankton dynamics from the SeaWiFS mission.
Remote Sensing of Environment, 135: 77–91.
Signorini, S. R., Franz, B. A., and McClain, C. R. 2015.
Chlorophyll variability in the oligotrophic gyres:
mechanisms, seasonality and trends. Frontiers in
Marine Science, 2(1):
doi:10.3389/fmars.2015.000001.
Sohn, B. J., and Park, S. C. 2010. Strengthened tropical
circulations in past three decades inferred from
water vapor transport. Journal of Geophysical Re-
search: Atmospheres, 115: D15112,
doi:10.1029/2009JD013713.
Sohn, B. J., Yeh, S. W., Schmetz, J., and Song, H. J. 2013.
Observational evidences of Walker circulation
change over the last 30 years contrasting with
GCM results. Climate Dynamics, 40(7–8): 1721–
1732.
Stott, P. A., Gillett, N. P., Hegerl, G. C., Karoly, D. J.,
Stone, D. A., Zhang, X., and Zwiers, F. 2010. De-
tection and attribution of climate change: a re-
gional perspective. Wiley Interdisciplinary Re-
views: Climate Change, 1(2): 192–211.
Stramma, L., Schmidtko, S., Levin, L. A., and Johnson, G.
C. 2010. Ocean oxygen minima expansions and
their biological impacts. Deep-Sea Research I:
Oceanographic Research Papers, 57(4): 587–595.
Sydeman, W. J., García-Reyes, M., Schoeman, D. S.,
Rykaczewski, R. R., Thompson, S. A., Black, B. A.,
and Bograd, S. J. 2014. Climate change and wind
intensification in coastal upwelling ecosystems.
Science, 345(6192): 77–80.
Chapter 8 South Pacific Ocean
151
Thomas, A. C., Brickley, P., and Weatherbee, R. 2009.
Interannual variability in chlorophyll concentra-
tions in the Humboldt and California Current sys-
tems. Progress in Oceanography, 83(1–4): 386–
392, doi: 10.1016/j.pocean.2009.07.020.
Thomas, A. C., Strub, P. T., Weatherbee, R. A., and
James, C. 2012. Satellite views of Pacific chloro-
phyll variability: Comparisons to physical varia-
bility, local versus nonlocal influences and links
to climate indices. Deep-Sea Research II, 77–80:
99–116,
http://dx.doi.org/10.1016/j.dsr2.2012.04.008.
Thompson, D. W., and Wallace, J. M. 2000. Annular
modes in the extratropical circulation. Part I:
Month-to-month variability. Journal of Climate,
13(5): 1000–1016.
Thompson P. A., Baird, M. E., Ingleton, T., and Doblin,
M. A. 2009. Long-term changes in temperate Aus-
tralian coastal waters: implications for phyto-
plankton, Marine Ecological Progress Series, 394:
1–19, doi: 10.3354/meps08297.
Thompson, P. A., Bonham, P., Rochester, W., Doblin, M.
A., Waite, A. M., Richardson, A., and Rousseaux,
C. 2015. Climate variability drives plankton
community composition changes: an El Niño to
La Niña transition around Australia. Journal of
Plankton Research, 37(5): 966–984,
doi: 10.1093/plankt/fbv069.
Trenberth, K. E. 1997. The definition of El Niño. Bulletin
of the American Meteorological Society, 78: 2771–
2777.
Trenberth, K. E. 2015. Has there been a hiatus? Science,
349: 691–692.
Uitz, J., Stramski, D., Reynolds, R. A., and Dubranna, J.
2015. Assessing phytoplankton community com-
position from hyperspectral measurements of
phytoplankton absorption coefficient and remote-
sensing reflectance in open-ocean environments.
Remote Sensing of Environment, 171: 58–74,
doi:10.1016/j.rse.2015.09.027.
Vantrepotte, V., and Mélin, F. 2011. Inter-annual varia-
tions in the SeaWiFS global chlorophyll a concen-
tration (1997–2007). Deep-Sea Research I, 58: 429–
441.
Vargas, G., Pantoja, S., Rutllant, J. A., Lange, C. B., and
Ortlieb, L. 2007. Enhancement of coastal
upwelling and interdecadal ENSO‐like variability
in the Peru‐Chile Current since late 19th century.
Geophysical Research Letters, 34: L13607,
doi:10.1029/2006GL028812.
Vincent, D. G. 1994. The South Pacific convergence zone
(SPCZ): A review. Monthly Weather Review,
122(9): 1949–1970.
Vincent, E. M., Lengaigne, M., Menkes, C. E., Jourdain,
N. C., Marchesiello, P., and Madec, G. 2011. Inter-
annual variability of the South Pacific Conver-
gence Zone and implications for tropical cyclone
genesis. Climate Dynamics, 36(9–10): 1881–1896.
Wang, B., Liu, J., Kim, H. J., Webster, P. J., and Yim, S. Y.
2012b. Recent change of the global monsoon pre-
cipitation (1979–2008). Climate Dynamics, 39(5):
1123–1135.
Wang, C., Deser, C., Yu, J-Y., DiNezio, P., and Clement,
A. 2012a. El Niño and Southern Oscillation (EN-
SO): A Review. In Coral Reefs of the Eastern Pa-
cific: Persistence and Loss in a Dynamic Envi-
ronment, pp. 85–106. Ed. by P. W. Glynn, D. P.
Manzello, and I. C. Enochs. Springer Netherlands.
657 pp.
White, J. R., Zhang, X., Welling, L. A., Roman, M. R., and
Dam, H. G. 1995. Latitudinal gradients in zoo-
plankton biomass in the tropical Pacific at 140 W
during the JGOFS EqPac study: Effects of El Niño.
Deep-Sea Research II: Topical Studies in Ocean-
ography, 42(2): 715–733.
Wijffels, S. E., Toole, J. M., and Davis, R. 2001. Revisiting
the South Pacific subtropical circulation: A syn-
thesis of World Ocean Circulation Experiment
observations along 32°S. Journal of Geophysical
Research, 106: 19481–19513.
Wyrtki, K. 1963. The horizontal and vertical field of mo-
tion in the Peru Current. Bulletin of the Scripps
Institution of Oceanography, 8: 313–344.
Wyrtki, K. 1989. Some thoughts about the west Pacific
warm pool. In Proceedings of the Western Pacific
International Meeting and Workshop on Toga
Coare, Nouméa, New Caledonia, 24-30 May 1989,
pp. 99-109. Ed. by J. Picaut Joël, R. Lukas, and T.
Delcroix. ORSTOM, Centre de Nouméa.

152