Embed Size (px)
Citation preview
Volume 1, Number 9 Empirical Findings 18 AUGUST 2017
What Factors Are Causal to Survival of a Startup?
ByGilbert Gonzalez, University of South Florida
Copyright © 2017, Gilbert Gonzalez. This article is published under a Creative Commons BY-NC license. Permission is granted to copy and distribute this article for non-commercial purposes, in both printed and electronic formats
Survival rates for startups in the United States (U.S.) are disappointingly low and economically inefficient. The data shows
that the U.S. clearly lags its peer countries in the survival rates of startups. While there has been significant investment and support by communities, government, and private founda-tions, startup failure rates remain virtually un-changed in the last two decades. In spite of the many years of research in the field of entrepre-neurship, U.S. failure rates within the first five years average 53% (DOL, 2016), regardless of the industry mem-bership or economic cycles (SBA Office of Advocacy, 2012). Iden-tifying factors that are causal and non-causal to the sustainability of emerging businesses is crucial to the founders and stakeholders.Within this study, both internal and external factors that may be causal to the macro survival rate of U.S. startups were studied. The exter-nal factors were studied quantitatively, using data published by the Bureau of Labor Statis-tics (BLS), Federal Reserve Economic Data (FRED) and the Brookings Institute. A proto-col of regression analysis and visual analytics were applied to evaluate the quantitative data. It demonstrated that external factors such as the change in real gross domestic product (RGDP), interest rates, and expansion of ac-celerators have had no significant effect on U.S.
macro startup survival rates. Further, the find-ings confirm that neither geographic location nor industry membership impacted U.S. macro startup survival rates. Internal factors were studied qualitatively, us-ing a grounded theory protocol. The qualitative research did uncover three internal factors that were causal to survival of the startups studied. Those internal factors were:
• Career Autonomy – The entrepreneurs motivated by career autonomy were signifi-cantly more likely to achieve long-term sus-tainability. • Allies – The entre-preneurs who identify and utilized allies were more likely to survive.
• Purposeful Margin of Safety model – Startups whose founders had a rigorous understand-ing of the margin of safety (MOS) and its underlying elements of pricing and break-even analysis were more likely to survive.
This qualitative study provides significant evi-dence that, when these three causal factors are present, the likelihood of sustainability is high. These findings extend our knowledge on how to improve the probability of sustainability for the firms. This study demonstrates that the U.S. can and should improve its startup surviv-al rates by focusing on the internal factors that are necessary at time zero to ensure sustain-ability and survival.
What factors are present at time zero that increase the probabili-
ty that a startup will achieve long term sustainability? The findings of this study will empower advisors and founders on how to improve
startup survival rates.
Keywords: Business Plan, Sustainability, Startup, Launch, Strategy, Startup Business Plan, Business Model, Business Canvas, Lean Strategy, Lean Canvas, Incubator, Business Creation, Accelerator.
Suvival Factors for Startups
98 Volume 1, Number 9
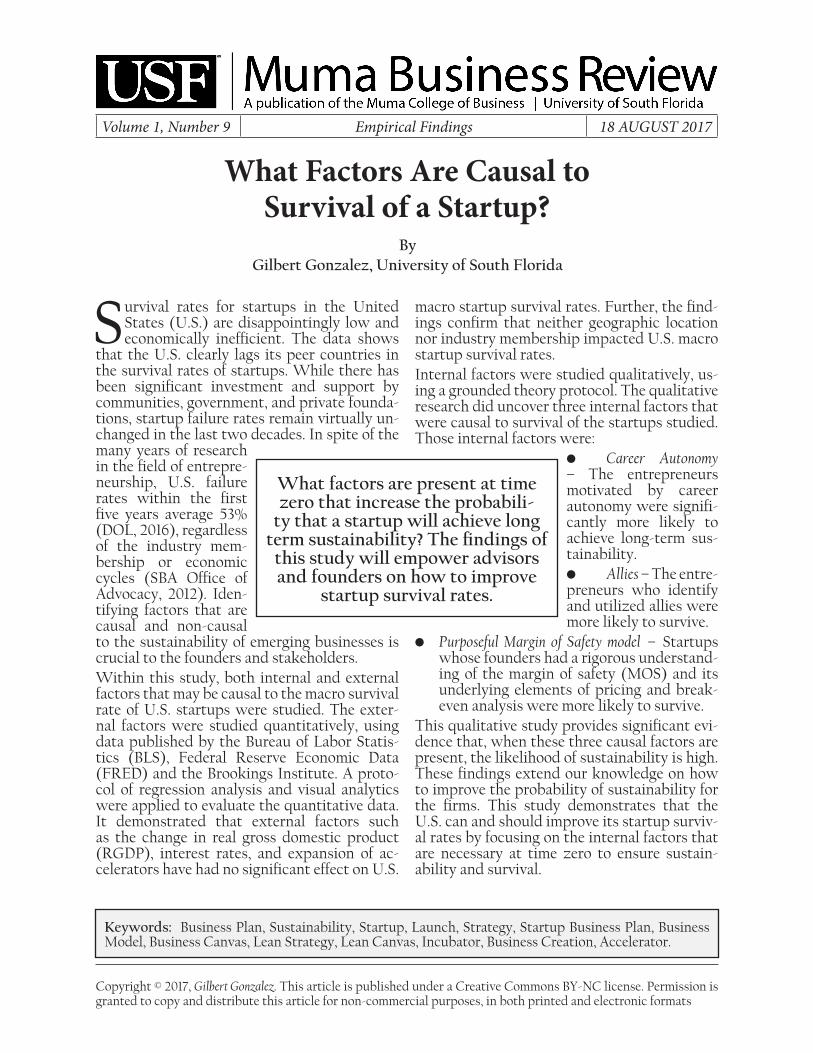
IntroductionThe Bureau of Labor Statistics data found in Figure 1 for the years from 1994 through 2015 clearly illus-trates that the macro survival rates, regardless of in-dustry membership or the strength of the economy, remain virtually unchanged (SBA Office of Advoca-cy, 2016). This is particularly concerning given the enormous efforts and increased capital investment by practitioners, researchers, and local, state, and federal governments (Hathaway, 2016a). • Despite the decades of research and prescrip-
tive findings by the academic community, there have been no measurable improvements in the macro survival rates of U.S. startups.
• Despite the enormous increased investment by local, state, and federal governments in acceler-ator, incubator, educational, and advisory pro-grams, the macro U.S. survival rates are below average when compared to its peer countries.
• Despite the increased availability of entrepre-neurial education, the survival rates remain identical for the last two decades.
• During periods of economic expansion and depression, the early survival rates are remark-ably similar.
These observations demanded a rigorous investiga-tion into the factors that are causal and non-causal to startup survival. This study used both qualitative and quantitative methods to explore factors that were causal and non-causal to startup survival. The quantitative analysis explored external factors that were suspected of impacting U.S. macro survival rates. The qualitative research studied 23 startups, equally distributed among surviving and failed ven-tures, investigating internal factors that were causal to their survival or failure.
Review of ResearchThe literature is rich with broad discussions of en-trepreneurship and startups. Davidsson and Gor-don (2012) identified three broad categories of work within the literature with respect to new venture cre-ation:• Characteristics of nascent entrepreneurs• Antecedents and characteristics of the new
venture creation process• Explaining new venture creation process out-
comes
Characteristics of Nascent Entrepre-neursThere is a rich and significant collection of literature as to the origin, nature, and traits of entrepreneurs. There are two competing schools of thought. There are those who believe that entrepreneurs are created in nature, often referred to as nativists. There are also those who believe that, through nurturing, we can increase the number of individuals willing and able to become entrepreneurs, often referred to as empir-icists (Gonzalez, 2017b). Shane makes significant contributions to under-standing the nativist position in his many written works, describing the genetic markers that are caus-al to personality traits that support the behaviors of an entrepreneur. He asserts that a defined portion of the population has a natural pre-disposition for en-trepreneurial behavior that cannot be taught (Shane, 2010). Empiricist researchers disagree, claiming that en-trepreneurial students attending classes are out per-forming the traditional entrepreneurs (Sandberg, 2009). These researchers contend that entrepreneur-
Figure 1: U.S. Survival Rates (Source: U.S. Bureau of Labor Statistics)
99
Gonzalez
Muma Business Review
ial education positively moderates entrepreneurial intentions, which causes the students to become ca-reer entrepreneurs (Bae, Qian, Miao, & Fiet, 2014; Küttim, Kallaste, Venesaar, & Kiis, 2014). This discussion of nature versus nurture is weaved into many other similar research questions, case studies, and empirical review studies. In the case study “Where Do Entrepreneurs Come From?”, an impartial review of both schools of thought is pro-vided with supporting research from nativists and empiricists (Gonzalez, 2017b). There is no clear consensus within the literature as to whether nature creates the total supply of potential career entrepre-neurs, or if we can expand the total supply of entre-preneurs through nurturing.
Antecedents and Characteristics of the New Venture Creation ProcessThis area of literature brings to light the disagree-ment that exists within the startup support commu-nity as to the value of a startup business plan and the methodology of creating one. There are three distinct positions within the literature:
• Those who assert that little or no planning is best.
• Those who advise deviation from tradition-al planning tools and use of “Lean Strategy” to create a launch plan.
• Those who still advise that a traditional written strategic plan is best practice.
Many authors and researchers advocate for writ-ing little or no business plan at all (Brinckmann, Grichnik, & Kapsa, 2010; Gerber, 2010; Gumpert,
2002; Guttman, 2015). Further research shows that the venture capital community is open to investing in firms with no startup plans (Ashamalla, Orife, & Abel, 2008). Castrogiovanni (1996) argues that many great successes started without business plans. He reported that 51%, or 220, of the Inc. Magazine 500 fast growing firms in 1996 did not have a formal startup plan. Lead by Eric Ries, The Lean Strategy project has grown and has a large following. Many researchers and advisors advocate this conceptual scheme that emphasizes quick iterations of product development and market testing to learn how to create consumer acceptance and commitment with little or no waste of startup resources (Blank, 2013; Blank et al., 2013; Collis, 2016; Fichter, 2015; Ries, 2011). Lastly, some researchers argue that traditional start-up business plans are best. They assert that tradition-al planning serves founders in communicating the strategy to employees, investors, and other stake-holders (Bangs, 1998). Zinger asserts that the time delay created by developing the plan benefits the founder, who may otherwise act too quickly without a well thought out strategy (Zinger & LeBrasseur, 2003). Hormozi, Sutton, McMinn, and Lucio (2002), assert that traditional strategic planning creates ob-jectives and strategies that are crucial to minimizing risk and improving performance.
Explaining New Venture OutcomesLiterature offering empirical observations and hy-potheses on how to improve the survival and success of startups is prevalent (Brüderl, Preisendörfer, &
Qualitative Protocol and MethodsThe qualitative element of the research was a grounded theory study. A systematic approach using the procedures as outlined by Straus and Corbin was undertaken (Corbin & Strauss, 2008a). The interview protocol was designed and submitted to the Institutional Review Board (IRB) for approval. Data collec-tion was conducted by interviewing individuals who had founded startups with both sustainable and unsustainable outcomes. The interviews were coded in search of themes and theory that added under-standing to the research question.The interviews were conducted over approximately 90 days, from February 2017 through April 2017. The interview subjects were all founders or co-founders known to the researcher through academic and business relationships derived from a quarter century career as an entrepreneur. A balance was achieved by selecting both successful and failed startups. The final group was composed of twelve unsustainable startups and eleven sustainable startups. Interviews were conducted until it was determined no new in-sights or other incremental benefits of additional interviews were expected. As described by Quinn and Perelli, this study utilized a constant comparison strategy for inductively identifying themes and theory.
“Employing a comparative methodology of data collection and analysis, including the construction of analytic codes for the data and its categorization based on emergent ideas and themes that are not preconceived and logically deduced hypotheses (Glaser and Strauss, 1977; Charmaz, 2006) is a fundamental characteristic of grounded theory. This allows for the generation of theory that is inductively developed throughout the process” (Quinn & Perelli, 2016).
Suvival Factors for Startups
100 Volume 1, Number 9
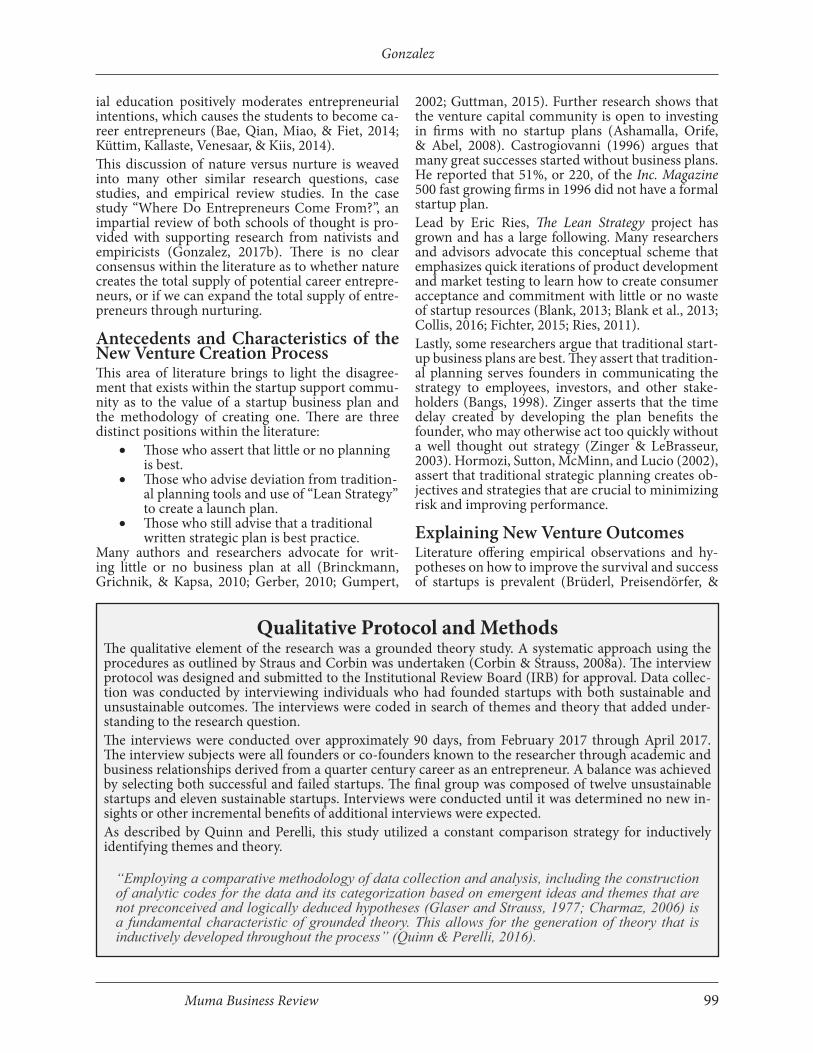
Constant comparative was the method chosen--which is taking the information gathered during each iteration and comparing it to emerging categories as a data analysis technique (Creswell, 2007). The first phase, as specified by Strauss and Corbin (2008a), was the open coding phase. This coding was done after each interview was completed. As anticipated, major patterns emerged from this phase that drove the second phase, axial coding. In this phase, several major categories emerged. The categorical data was then coded, with emphasis on learning specific to the research question of factors causal to startup survival. Lastly, selective coding was conducted, which led to the creation of the findings of importance, or themes. The positive themes found in the sustainable firms were further validated by confirming that opposing themes were present in the non-sustainable subjects. Table 1 shows the major themes and their corre-sponding opposing values that were identified. Table 1: Validation by Opposing Variables
Theme Sustainable theme Non-sustainable themeCareer auton-omy
Founders highly motivated by career autonomy
Career autonomy was not the dominant motivation
Allies Strong and active allies No allies or weak and inactive allies
Purposeful Margin of Safe-ty model
Detailed understanding of cost and pricing strategy, creating an effective Mar-gin of Safety model
Did not demonstrate under-standing of cost, pricing strat-egy, break-even, or the Margin of Safety model
Further, it was found through the qualitative research that there are at least three factors internal to the startups subjects studied that were causal to survival. Those factors are:
• Strong motivation for career autonomy• Utilization of willing and able allies• Purposeful Margin of Safety model
Table 2 lists the combined factors of the qualitative and quantitative study and their corresponding source of evidence. Table 2: Findings TableFactor Evidence of causality Evidence of non-causalityContraction and expansion of the economy as measured by Real Gross Domestic Product
None Statistical proof – Regression Analysis and Visual Analytics
Changes in the cost of capital as measured by the change in the Prime Rate of Interest
None Statistical proof – Regression Analysis and Visual Analytics
Industry membership of the start-up
None Visual Analytics
Geographic location within the United States
None Visual Analytics
Stimulus from the change in the number of accelerators
None Statistical proof – Regression Analysis and Visual Analytics
Utilization of willing and able al-lies
Rigorous qualitative evidence None
Strong motivation for career au-tonomy
Rigorous qualitative evidence None
Purposeful Margin of Safety mod-el
Rigorous qualitative evidence None
The combining of the two research methods gives great insight into the relevant factors both internal and external to startups in the U.S. for the twenty-one year period from 1994-2015.
Muma Business Review 101
Gonzalez
Ziegler, 1992; CB Insights, 2016a, 2016b; Darbyshire, 2016; Wagner, 2016). Perry articulates that existing research is full of anecdotal findings that more often list symptoms of failure. What is not prevalent are empirical studies that show factors during the start-up formation process that are causal to improved outcomes (Perry, 2001).
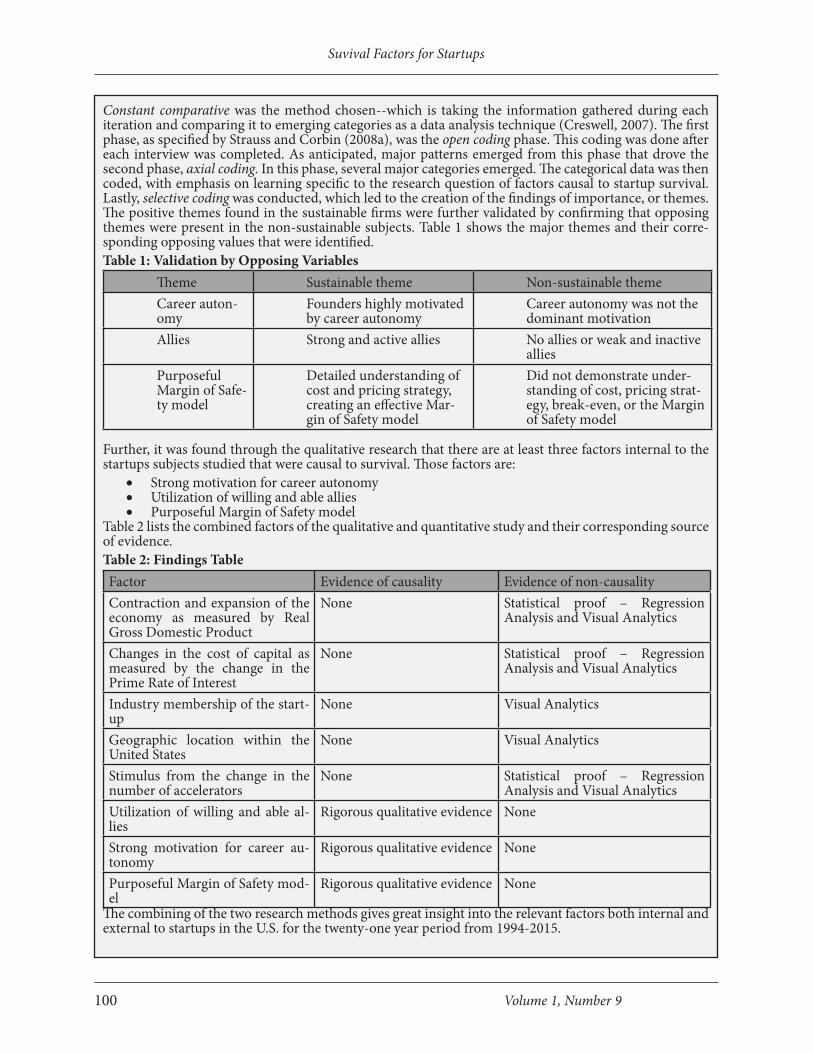
Internal Factors Analysis Table 3 is a summary of the positive or negative measures of the three themes for each separate study member. The table is organized into two groups: the eleven sustainable subjects and the twelve unsustain-able subjects. For each subject, there is a summary of coded observations that resulted in a categorization in support of a positive or negative outcome related to a given theme. The last line is the net outcome, or the difference between positive observations and negative observations of all themes for the individu-al study member. The net outcome is presented as a heat map to illustrate that the sustainable firms were net positive in all cases, and the unsustainable firms were net negative in almost all cases. The average net
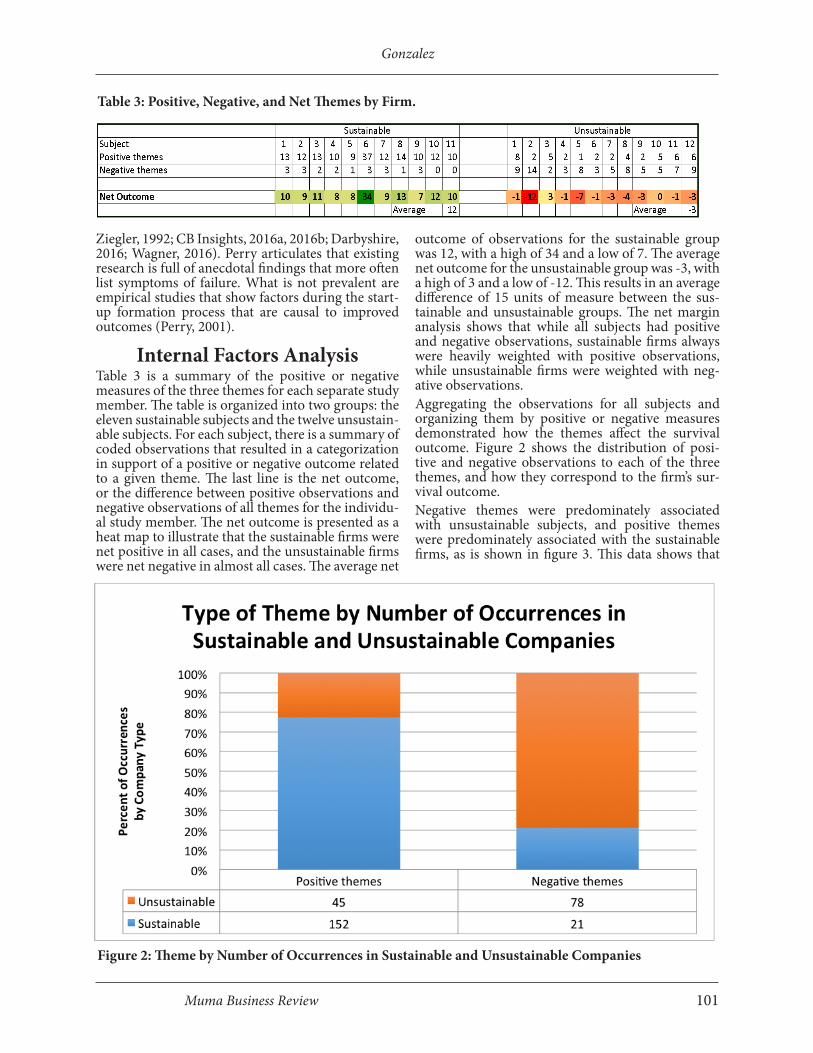
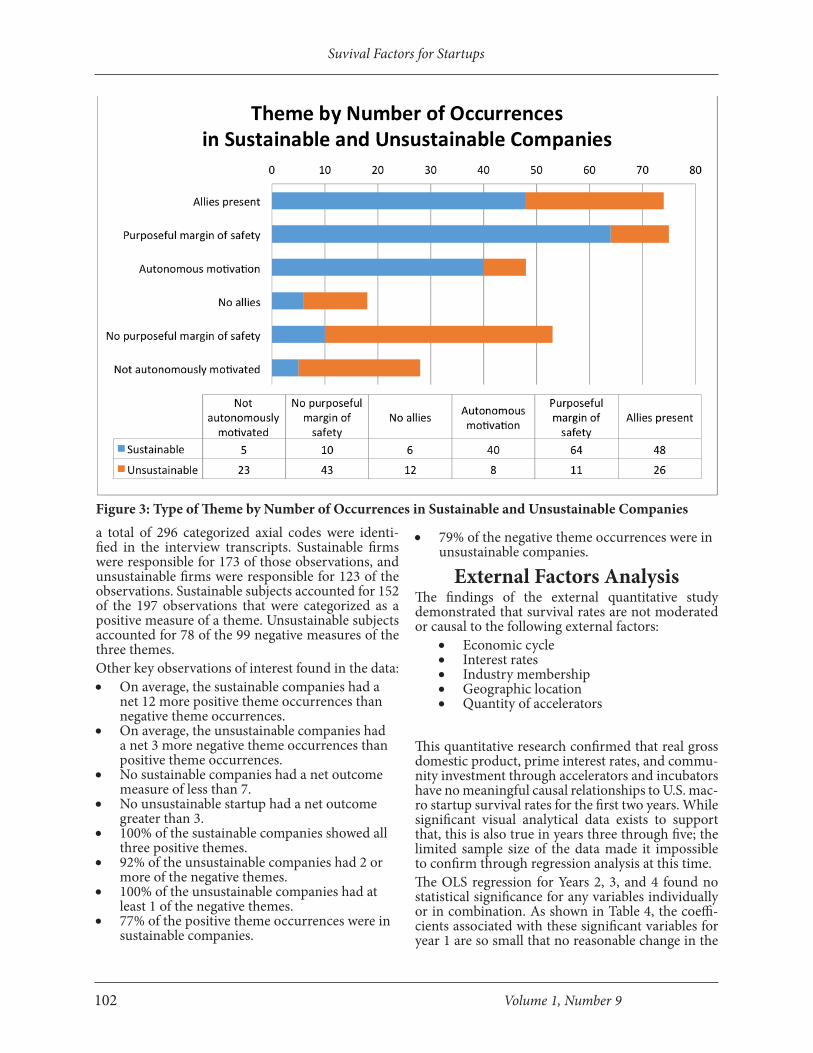
outcome of observations for the sustainable group was 12, with a high of 34 and a low of 7. The average net outcome for the unsustainable group was -3, with a high of 3 and a low of -12. This results in an average difference of 15 units of measure between the sus-tainable and unsustainable groups. The net margin analysis shows that while all subjects had positive and negative observations, sustainable firms always were heavily weighted with positive observations, while unsustainable firms were weighted with neg-ative observations. Aggregating the observations for all subjects and organizing them by positive or negative measures demonstrated how the themes affect the survival outcome. Figure 2 shows the distribution of posi-tive and negative observations to each of the three themes, and how they correspond to the firm’s sur-vival outcome. Negative themes were predominately associated with unsustainable subjects, and positive themes were predominately associated with the sustainable firms, as is shown in figure 3. This data shows that
Table 3: Positive, Negative, and Net Themes by Firm.
Figure 2: Theme by Number of Occurrences in Sustainable and Unsustainable Companies
Suvival Factors for Startups
102 Volume 1, Number 9
a total of 296 categorized axial codes were identi-fied in the interview transcripts. Sustainable firms were responsible for 173 of those observations, and unsustainable firms were responsible for 123 of the observations. Sustainable subjects accounted for 152 of the 197 observations that were categorized as a positive measure of a theme. Unsustainable subjects accounted for 78 of the 99 negative measures of the three themes.Other key observations of interest found in the data:• On average, the sustainable companies had a
net 12 more positive theme occurrences than negative theme occurrences.
• On average, the unsustainable companies had a net 3 more negative theme occurrences than positive theme occurrences.
• No sustainable companies had a net outcome measure of less than 7.
• No unsustainable startup had a net outcome greater than 3.
• 100% of the sustainable companies showed all three positive themes.
• 92% of the unsustainable companies had 2 or more of the negative themes.
• 100% of the unsustainable companies had at least 1 of the negative themes.
• 77% of the positive theme occurrences were in sustainable companies.
• 79% of the negative theme occurrences were in unsustainable companies.
External Factors AnalysisThe findings of the external quantitative study demonstrated that survival rates are not moderated or causal to the following external factors:
• Economic cycle• Interest rates• Industry membership• Geographic location• Quantity of accelerators
This quantitative research confirmed that real gross domestic product, prime interest rates, and commu-nity investment through accelerators and incubators have no meaningful causal relationships to U.S. mac-ro startup survival rates for the first two years. While significant visual analytical data exists to support that, this is also true in years three through five; the limited sample size of the data made it impossible to confirm through regression analysis at this time. The OLS regression for Years 2, 3, and 4 found no statistical significance for any variables individually or in combination. As shown in Table 4, the coeffi-cients associated with these significant variables for year 1 are so small that no reasonable change in the
Figure 3: Type of Theme by Number of Occurrences in Sustainable and Unsustainable Companies
Muma Business Review 103
Gonzalez
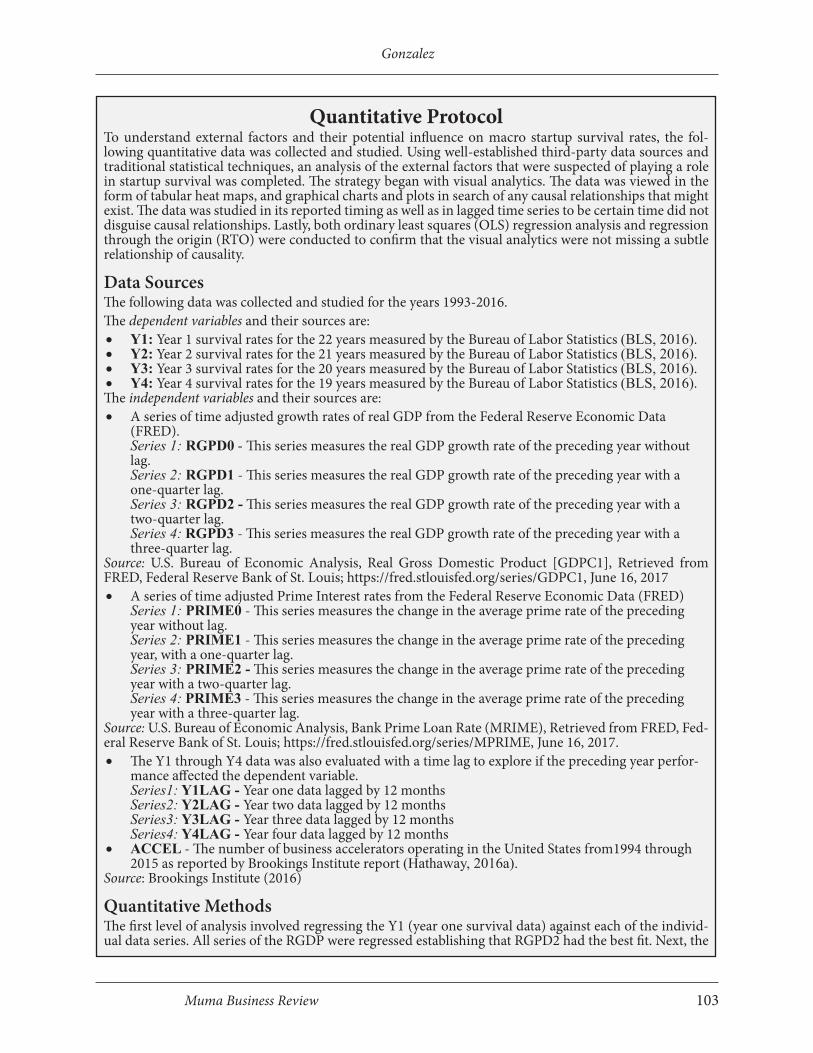
Quantitative ProtocolTo understand external factors and their potential influence on macro startup survival rates, the fol-lowing quantitative data was collected and studied. Using well-established third-party data sources and traditional statistical techniques, an analysis of the external factors that were suspected of playing a role in startup survival was completed. The strategy began with visual analytics. The data was viewed in the form of tabular heat maps, and graphical charts and plots in search of any causal relationships that might exist. The data was studied in its reported timing as well as in lagged time series to be certain time did not disguise causal relationships. Lastly, both ordinary least squares (OLS) regression analysis and regression through the origin (RTO) were conducted to confirm that the visual analytics were not missing a subtle relationship of causality.
Data Sources The following data was collected and studied for the years 1993-2016.The dependent variables and their sources are:• Y1: Year 1 survival rates for the 22 years measured by the Bureau of Labor Statistics (BLS, 2016).• Y2: Year 2 survival rates for the 21 years measured by the Bureau of Labor Statistics (BLS, 2016).• Y3: Year 3 survival rates for the 20 years measured by the Bureau of Labor Statistics (BLS, 2016).• Y4: Year 4 survival rates for the 19 years measured by the Bureau of Labor Statistics (BLS, 2016).The independent variables and their sources are:• A series of time adjusted growth rates of real GDP from the Federal Reserve Economic Data
(FRED). Series 1: RGPD0 - This series measures the real GDP growth rate of the preceding year without lag. Series 2: RGPD1 - This series measures the real GDP growth rate of the preceding year with a one-quarter lag. Series 3: RGPD2 - This series measures the real GDP growth rate of the preceding year with a two-quarter lag. Series 4: RGPD3 - This series measures the real GDP growth rate of the preceding year with a three-quarter lag.
Source: U.S. Bureau of Economic Analysis, Real Gross Domestic Product [GDPC1], Retrieved from FRED, Federal Reserve Bank of St. Louis; https://fred.stlouisfed.org/series/GDPC1, June 16, 2017• A series of time adjusted Prime Interest rates from the Federal Reserve Economic Data (FRED)
Series 1: PRIME0 - This series measures the change in the average prime rate of the preceding year without lag.Series 2: PRIME1 - This series measures the change in the average prime rate of the preceding year, with a one-quarter lag. Series 3: PRIME2 - This series measures the change in the average prime rate of the preceding year with a two-quarter lag. Series 4: PRIME3 - This series measures the change in the average prime rate of the preceding year with a three-quarter lag.
Source: U.S. Bureau of Economic Analysis, Bank Prime Loan Rate (MRIME), Retrieved from FRED, Fed-eral Reserve Bank of St. Louis; https://fred.stlouisfed.org/series/MPRIME, June 16, 2017.• The Y1 through Y4 data was also evaluated with a time lag to explore if the preceding year perfor-
mance affected the dependent variable.Series1: Y1LAG - Year one data lagged by 12 monthsSeries2: Y2LAG - Year two data lagged by 12 monthsSeries3: Y3LAG - Year three data lagged by 12 monthsSeries4: Y4LAG - Year four data lagged by 12 months
• ACCEL - The number of business accelerators operating in the United States from1994 through 2015 as reported by Brookings Institute report (Hathaway, 2016a).
Source: Brookings Institute (2016)
Quantitative MethodsThe first level of analysis involved regressing the Y1 (year one survival data) against each of the individ-ual data series. All series of the RGDP were regressed establishing that RGPD2 had the best fit. Next, the
Suvival Factors for Startups
104 Volume 1, Number 9
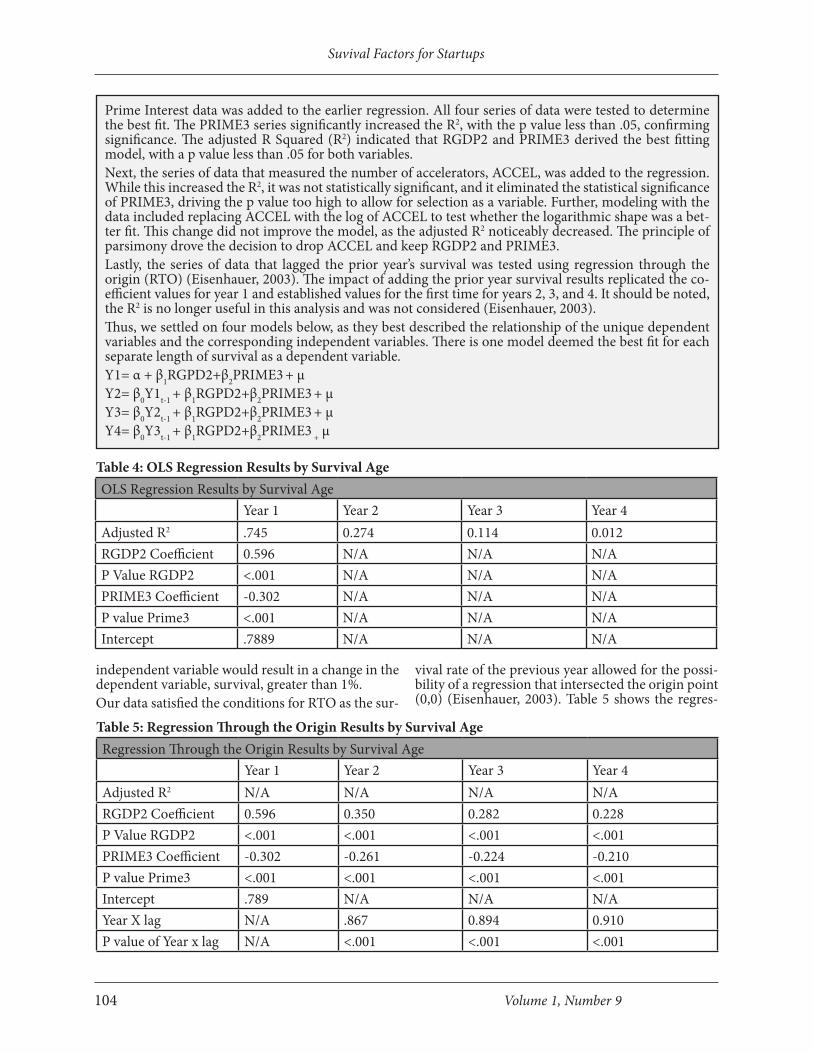
independent variable would result in a change in the dependent variable, survival, greater than 1%. Our data satisfied the conditions for RTO as the sur-
vival rate of the previous year allowed for the possi-bility of a regression that intersected the origin point (0,0) (Eisenhauer, 2003). Table 5 shows the regres-
Prime Interest data was added to the earlier regression. All four series of data were tested to determine the best fit. The PRIME3 series significantly increased the R2, with the p value less than .05, confirming significance. The adjusted R Squared (R2) indicated that RGDP2 and PRIME3 derived the best fitting model, with a p value less than .05 for both variables.Next, the series of data that measured the number of accelerators, ACCEL, was added to the regression. While this increased the R2, it was not statistically significant, and it eliminated the statistical significance of PRIME3, driving the p value too high to allow for selection as a variable. Further, modeling with the data included replacing ACCEL with the log of ACCEL to test whether the logarithmic shape was a bet-ter fit. This change did not improve the model, as the adjusted R2 noticeably decreased. The principle of parsimony drove the decision to drop ACCEL and keep RGDP2 and PRIME3.Lastly, the series of data that lagged the prior year’s survival was tested using regression through the origin (RTO) (Eisenhauer, 2003). The impact of adding the prior year survival results replicated the co-efficient values for year 1 and established values for the first time for years 2, 3, and 4. It should be noted, the R2 is no longer useful in this analysis and was not considered (Eisenhauer, 2003). Thus, we settled on four models below, as they best described the relationship of the unique dependent variables and the corresponding independent variables. There is one model deemed the best fit for each separate length of survival as a dependent variable.Y1= α + β1RGPD2+β2PRIME3 + µY2= β0Y1t-1 + β1RGPD2+β2PRIME3 + µY3= β0Y2t-1 + β1RGPD2+β2PRIME3 + µY4= β0Y3t-1 + β1RGPD2+β2PRIME3 + µ
Table 4: OLS Regression Results by Survival AgeOLS Regression Results by Survival Age
Year 1 Year 2 Year 3 Year 4Adjusted R2 .745 0.274 0.114 0.012RGDP2 Coefficient 0.596 N/A N/A N/AP Value RGDP2 <.001 N/A N/A N/APRIME3 Coefficient -0.302 N/A N/A N/AP value Prime3 <.001 N/A N/A N/AIntercept .7889 N/A N/A N/A
Table 5: Regression Through the Origin Results by Survival AgeRegression Through the Origin Results by Survival Age
Year 1 Year 2 Year 3 Year 4Adjusted R2 N/A N/A N/A N/ARGDP2 Coefficient 0.596 0.350 0.282 0.228P Value RGDP2 <.001 <.001 <.001 <.001PRIME3 Coefficient -0.302 -0.261 -0.224 -0.210P value Prime3 <.001 <.001 <.001 <.001Intercept .789 N/A N/A N/AYear X lag N/A .867 0.894 0.910P value of Year x lag N/A <.001 <.001 <.001
Muma Business Review 105
Gonzalez
sion results for all four years using RTO. While this analysis did report statistical significance of RGDP2 and PRIME3 for all four years, the coefficients of the independent variables were once again too small to create a meaningful change in the dependent
variable, U.S. macro survival rates. Any change in RGDP2 and PRIME3, within the 95% confidence interval range, would result in a less than 1% change in survival rates.
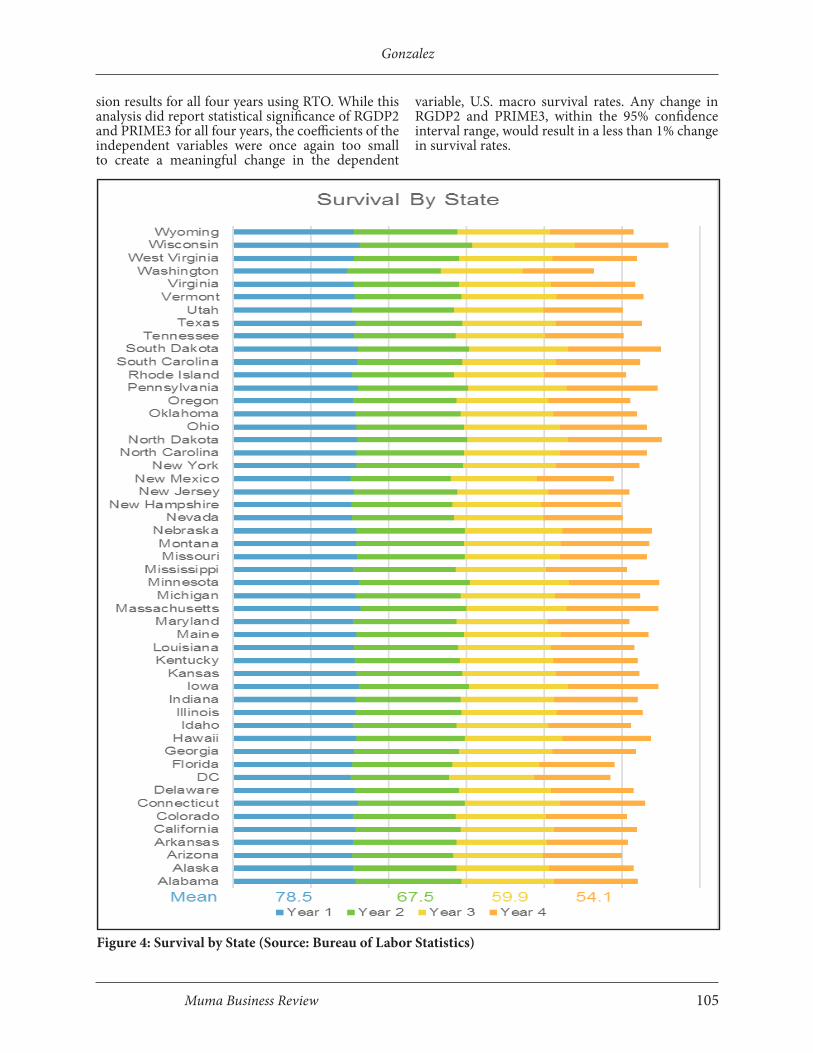
Figure 4: Survival by State (Source: Bureau of Labor Statistics)
Suvival Factors for Startups
106 Volume 1, Number 9
Startup Survival Rates Were Unchanged by Geographic LocationThe BLS also makes available firm survival rates at the statewide and industry membership levels. This allows us to analyze trends in the survival rates of newly formed firms by geographic location and in-dustry group. Analyzing the charts in Exhibit 4, one can see there is little or no fluctuation in survival rates year over year. Figure 4 shows the average survival rates for the pe-riod 1994 to 2015, broken out by state, plus Wash-ington D.C. The chart demonstrates the lack of vari-ability in the survival rate regardless of state. This reaffirms the 1990 study by Buss and Lin, who also found that survival rates are similar for rural and ur-ban areas (Buss & Lin, 1990).
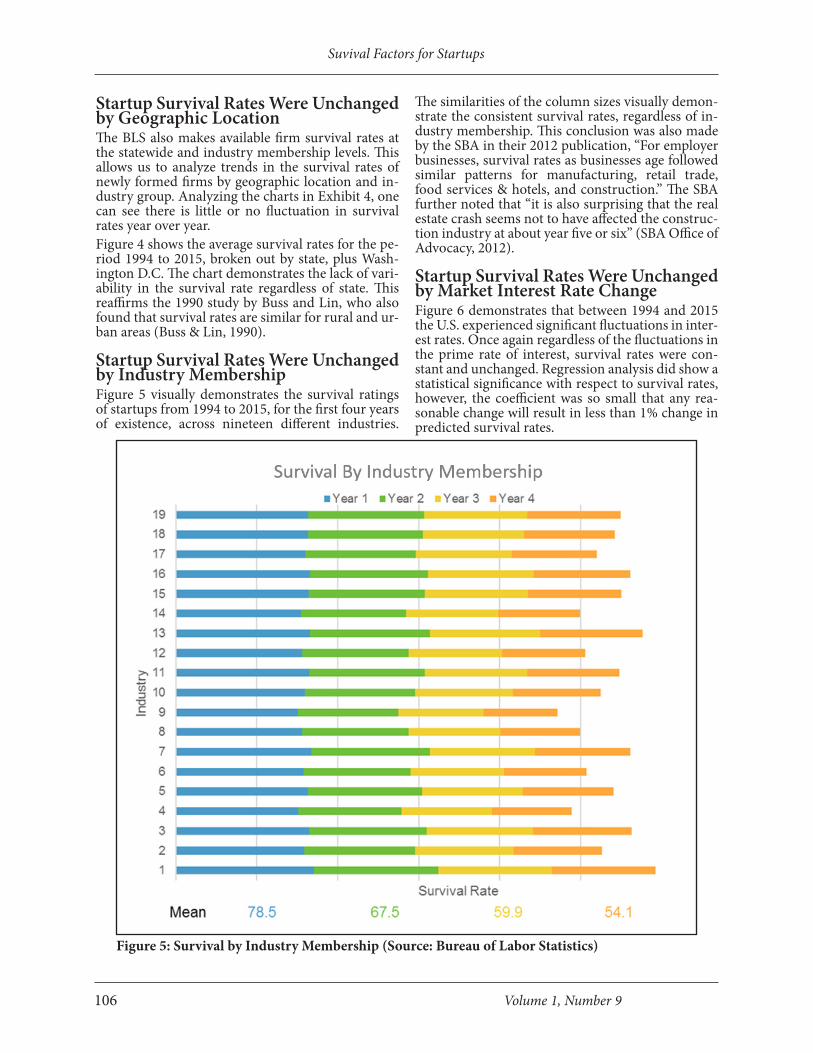
Startup Survival Rates Were Unchanged by Industry MembershipFigure 5 visually demonstrates the survival ratings of startups from 1994 to 2015, for the first four years of existence, across nineteen different industries.
The similarities of the column sizes visually demon-strate the consistent survival rates, regardless of in-dustry membership. This conclusion was also made by the SBA in their 2012 publication, “For employer businesses, survival rates as businesses age followed similar patterns for manufacturing, retail trade, food services & hotels, and construction.” The SBA further noted that “it is also surprising that the real estate crash seems not to have affected the construc-tion industry at about year five or six” (SBA Office of Advocacy, 2012).
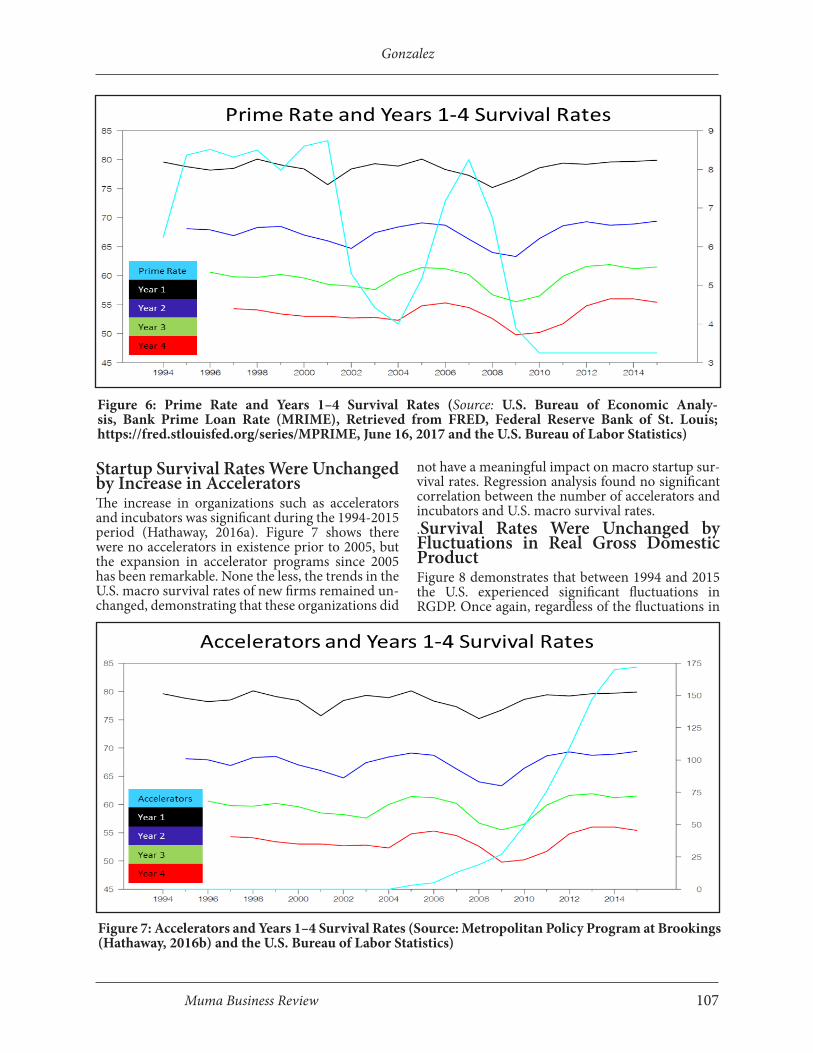
Startup Survival Rates Were Unchanged by Market Interest Rate ChangeFigure 6 demonstrates that between 1994 and 2015 the U.S. experienced significant fluctuations in inter-est rates. Once again regardless of the fluctuations in the prime rate of interest, survival rates were con-stant and unchanged. Regression analysis did show a statistical significance with respect to survival rates, however, the coefficient was so small that any rea-sonable change will result in less than 1% change in predicted survival rates.
Figure 5: Survival by Industry Membership (Source: Bureau of Labor Statistics)
Muma Business Review 107
Gonzalez
Startup Survival Rates Were Unchanged by Increase in AcceleratorsThe increase in organizations such as accelerators and incubators was significant during the 1994-2015 period (Hathaway, 2016a). Figure 7 shows there were no accelerators in existence prior to 2005, but the expansion in accelerator programs since 2005 has been remarkable. None the less, the trends in the U.S. macro survival rates of new firms remained un-changed, demonstrating that these organizations did
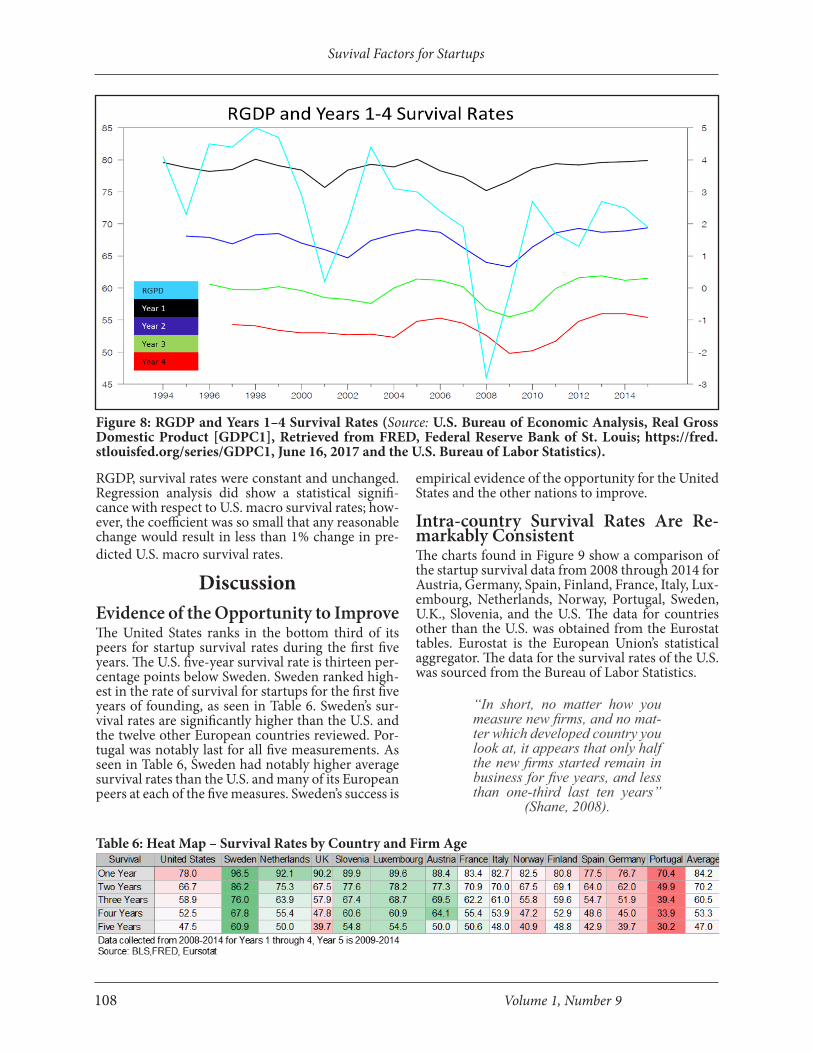
not have a meaningful impact on macro startup sur-vival rates. Regression analysis found no significant correlation between the number of accelerators and incubators and U.S. macro survival rates..Survival Rates Were Unchanged by Fluctuations in Real Gross Domestic ProductFigure 8 demonstrates that between 1994 and 2015 the U.S. experienced significant fluctuations in RGDP. Once again, regardless of the fluctuations in
Figure 6: Prime Rate and Years 1–4 Survival Rates (Source: U.S. Bureau of Economic Analy-sis, Bank Prime Loan Rate (MRIME), Retrieved from FRED, Federal Reserve Bank of St. Louis; https://fred.stlouisfed.org/series/MPRIME, June 16, 2017 and the U.S. Bureau of Labor Statistics)
Figure 7: Accelerators and Years 1–4 Survival Rates (Source: Metropolitan Policy Program at Brookings (Hathaway, 2016b) and the U.S. Bureau of Labor Statistics)
Suvival Factors for Startups
108 Volume 1, Number 9
RGDP, survival rates were constant and unchanged. Regression analysis did show a statistical signifi-cance with respect to U.S. macro survival rates; how-ever, the coefficient was so small that any reasonable change would result in less than 1% change in pre-dicted U.S. macro survival rates.
DiscussionEvidence of the Opportunity to ImproveThe United States ranks in the bottom third of its peers for startup survival rates during the first five years. The U.S. five-year survival rate is thirteen per-centage points below Sweden. Sweden ranked high-est in the rate of survival for startups for the first five years of founding, as seen in Table 6. Sweden’s sur-vival rates are significantly higher than the U.S. and the twelve other European countries reviewed. Por-tugal was notably last for all five measurements. As seen in Table 6, Sweden had notably higher average survival rates than the U.S. and many of its European peers at each of the five measures. Sweden’s success is
empirical evidence of the opportunity for the United States and the other nations to improve.
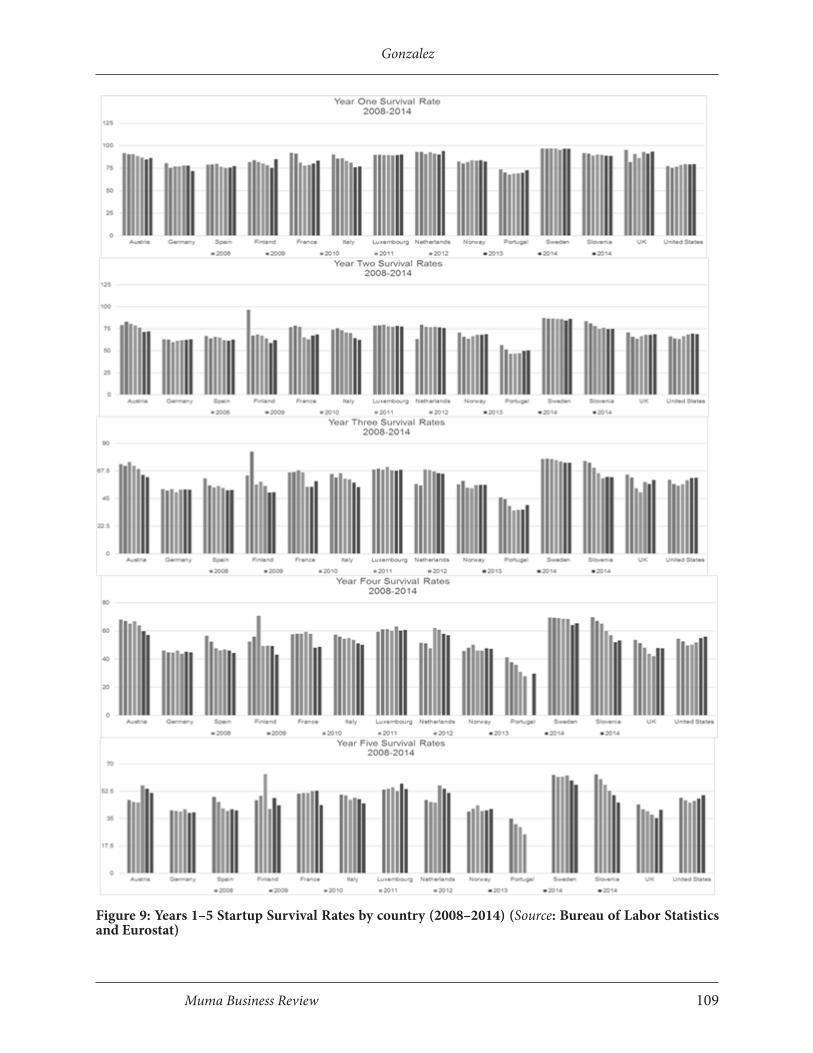
Intra-country Survival Rates Are Re-markably ConsistentThe charts found in Figure 9 show a comparison of the startup survival data from 2008 through 2014 for Austria, Germany, Spain, Finland, France, Italy, Lux-embourg, Netherlands, Norway, Portugal, Sweden, U.K., Slovenia, and the U.S. The data for countries other than the U.S. was obtained from the Eurostat tables. Eurostat is the European Union’s statistical aggregator. The data for the survival rates of the U.S. was sourced from the Bureau of Labor Statistics.
“In short, no matter how you measure new firms, and no mat-ter which developed country you look at, it appears that only half the new firms started remain in business for five years, and less than one-third last ten years”
(Shane, 2008).
Figure 8: RGDP and Years 1–4 Survival Rates (Source: U.S. Bureau of Economic Analysis, Real Gross Domestic Product [GDPC1], Retrieved from FRED, Federal Reserve Bank of St. Louis; https://fred.stlouisfed.org/series/GDPC1, June 16, 2017 and the U.S. Bureau of Labor Statistics).
Table 6: Heat Map – Survival Rates by Country and Firm Age
Muma Business Review 109
Gonzalez
Figure 9: Years 1–5 Startup Survival Rates by country (2008–2014) (Source: Bureau of Labor Statistics and Eurostat)
Suvival Factors for Startups
110 Volume 1, Number 9
While there is variation in the startup survival rates from nation to nation, intra-country survival rates year over year are statistically identical for all the countries reviewed. This pattern of static survival rates is not unique to the United States. The data shows similar patterns of static survival rates for other developed economies (Shane, 2008).The Bureau of Labor Statistics reports the business survival rates as a bi-product of tracking quarterly nationwide gross job gains and losses (BLS, 2016). Beginning in 1994 and continuing to the present day, the BLS has provided data on the year-by-year firm survival rates. It uses firms which reported positive employment for the first time as the unit of measure to remove legal entities that were not created with the intent of founding a business, often referred to as holding companies.It is remarkable that the survival rates are similar, year over year, considering the significant economic events that took place. During this twenty-one year period, the United States experienced two reces-sions, the 2001 recession and 2007–2008 great reces-sion. The 2007–2008 recession was the most severe retraction since the first great depression of 1929. During this same period, the U.S. also experienced both the dot-com boom and housing boom, as well as the banking crisis of 2008. Notwithstand-ing these events, surviv-al rates of newly formed businesses remained re-markably unchanged year over year. The SBA has reported similar conclusions: “About half of all new establishments survive five years or more, and about one-third survive 10 years or more” (SBA Office of Advocacy, 2012). The SBA also reported that “A neg-ative economy has little effect on a given business’s survival” (SBA Office of Advocacy, 2012). “Busi-nesses started in expanding economies in 1995 and 2005, those started just before the downturn in 2000, and those started just after the downturn had almost identical survival paths” (BLS, 2016).Shane effectively summarizes these conclusions in a passage from his 2008 book. “These patterns are amazingly consistent across cohorts of new firms. The one-, two-, three-, and four-year failure rates of new single establishment firms founded in 1997 are identical to the one-, two-, three-. and four-year fail-ure rates of new single establishment firms founded in 1992, and the five-year failure rate is only 1 percent higher. Moreover, the failure rates of the 1989 to 1992 cohorts of new employer firms over their first six years differ from each other by only 1 or 2 percent, and are almost identical to the failure rates for the 1992 to 1997 cohorts of new single establishment firms. And
studies using data drawn from Dun and Bradstreet files for new firms founded between 1977 and 1978, different years of the Census Business Owners, other census data on new businesses founded in 1982, and new employer firms founded in Michigan all show very similar survival patterns” (Shane, 2008). A summary of external environmental factors and their impact on macro startup survival rates demon-strates that, to date, there has been no causal or cor-related relationship between the external societal or tasks environment and survival rates. The data and relevant findings show that, while real GDP, net in-terest rates, and the number of accelerators and in-cubators changed frequently and drastically from 1994 to 2015, startup survival rates had no signifi-cant change. This holds true in the U.S. from 1994 to 2015. Regardless of geographic region or industry membership, survival rates remain similar for the last two decades. Intra-country survival rates for our European peers have also not experienced signifi-cant change for two decades.While there has been expansive investment by com-munities and private sources in education, incuba-tion, and acceleration, there is no change to survival
rates of the nation’s start-ups. The international data demonstrated that improvement is a reason-able and attainable goal. The Swiss and other Eu-ropean countries are out-performing the U.S. with regards to macro startup survival rates.
ConclusionsThe synergy of the qualitative and quantitative re-search gives great insight into the relevant internal and external factors to the macro startup surviv-al rate in the United States for the twenty-one year period from 1994 to 2015. The finding of causality within the qualitative study appears to be supported by existing theory. The finding of career autonomy as causal is directly explained by Goal Setting Theory. The impact of setting a goal to achieve career auton-omy resulted in a high probability of survival. When the goal of autonomy was weak or nonexistent, the probability of survival falls. Goal Setting Theory also supports the finding of causality between survival and margin of safety. Specifically, the study’s finding was that, if the founder had a purposeful revenue and cost goal, survival was more likely. Resource Based Theory would predict that the in-troduction of one or more powerful allies, willing and able to share their resources, creates a compet-itive advantage--removing risk and enhancing the probability of survival. One may alternatively argue that the relationship between allies and survival is a
While there has been expansive investment by communities and
private sources in education, incu-bation, and acceleration, there is no change to survival rates of the
nation’s startups.
Muma Business Review 111
Gonzalez
separate and unique observation not supported di-rectly by existing theory. The identification of and engagement with allies to achieve a goal too large for a single initiating force could be a potential stand-alone paradigm for success in goals of extraordinary scale and complexity. Allies may, in fact, be a the-oretical model to overcome adversity and achieve complex outcomes not possible by a single entity’s own actions. The name itself suggests the examples of countries aligning to accomplish military success that would be overwhelming for any one nation alone. It is possible this theme of allies is grounded in a theory of its own that aggregates the resources of those with a common goal who might not be able to achieve success alone.
Summary of FindingsFinding 1: Entrepreneurs motivated by career au-tonomy are significantly more likely to establish long term sustainability. Desire for career autonomy was a strong and preva-lent theme in the sustainable founders interviewed. This motivation was stronger than competing mo-tives for the founders of sustainable firms. Autonomy was causal to founders choosing to pivot instead of closing when the initial business model was ineffec-tive. Autonomy created the value necessary for these founders to accept the risk of a startup. In founders that were unsustainable, it was not unusual for them to choose to close the business for better or different opportunities. Trading autonomy for improved in-come, status, or safety was acceptable and comfort-able for some unsustainable founders. In some cases, the study showed that they are entrepreneurs of ne-cessity, and that a lack of short term options drove the decision to found the business. Once a better option became available, the decision to close the business was an easy choice for these founders. This is evidence that some businesses are unsustainable simply because the founder prefers not to continue voluntarily. A strong desire for autonomy greatly im-proves the probability of survival by enhancing the odds the founder will endure challenges and pivot through tough times until a business model evolves that is sustainable in the long term.
Finding 2: Entrepreneurs who identify and utilize allies are more likely to survive.Sustainable businesses had one or more ally. For this work, allies are defined as individuals willing and able to provide key resources to the startup with-out interest in profit or fee. Examples found in the study included a spouse who carried the burden of household income during the launch, and a parent who loaned capital, or provided free labor to assist the founder in the early days. Allies could also be industry colleagues who sponsored and supported
the founder despite being new and unproven. In one example, a founder shared that a landlord, who was his ally, agreed to lease a large warehouse to his firm, despite the reality that the firm was not credit worthy. Customers can also be very powerful allies. Customers who not only intentionally support the new business with their own patronage, but assist in marketing and referring others as well, are vital to sustainability. All resources needed must be sourced either from the founder or their allies prior to a positive launch decision. Matching the resource needs with sources is causal to improving the probability of sustainabil-ity through the removal of avoidable risk and miti-gation of inescapable risk (Gonzalez, 2017a). Often unsustainable businesses had few or no allies. In some cases, they had people trying to assist, but the potential ally lacked the ability to share the resourc-es the business needed. To be an ally, the individual must be both willing and able.
Finding 3: Startups whose founders design and un-derstand a margin of safety (MOS) in the initial business model are more likely to survive.For a startup to survive, it must achieve positive cash flow before it runs out of working capital. To ac-complish this in a purposeful way, the founder must have a clear understanding and attainable strategy to achieve a margin of safety for the new venture. Benjamin Graham and David Dodd coined the term “margin of safety” in 1934 in their book Security Analysis (Graham & Dodd, 2009). Margin of safe-ty is defined as the difference between the expected (or actual) sales level and the breakeven sales level. It can be expressed in the equation form below:Margin of Safety = Expected (or) Actual Sales Level (quantity or dollar amount) - Breakeven Sales Level (quantity or dollar amount)To have a purposeful strategy and ensure a sufficient margin of safety, the founder must have a complete understanding of the revenue model, pricing, and forecasted volume. The founder must also under-stand the fixed and variable costs. Accurately fore-casting revenue and total cost, the startup can ensure it meets or exceeds sustainable break-even oper-ations. The purposeful creation of this pricing and cost strategy, or margin of safety model, was found in all the sustainable firms studied. Unsustainable firms often did not demonstrate an understanding of their margin of safety, often not appearing to be aware of the revenue or cost side of their initial busi-ness model.
Finding 4: Real GDP has had no material causal ef-fect on macro survival rates of startups in the Unit-ed States for the period of 1994-2015.
Suvival Factors for Startups
112 Volume 1, Number 9
Finding 5: Interest rates have had no material caus-al effect on macro survival rates of startups in the United States for the period of 1994-2015.
Finding 6: The quantity of accelerators has had no causal effect on macro survival rates of startups in the United States for the period of 1994-2015.
Finding 7: Geographic location has had no materi-al causal effect on macro survival rates of startups in the United States for the period of 1994-2015.
Finding 8: Industry membership has had no mate-rial causal effect on macro survival rates of startups in the United States for the period of 1994-2015.
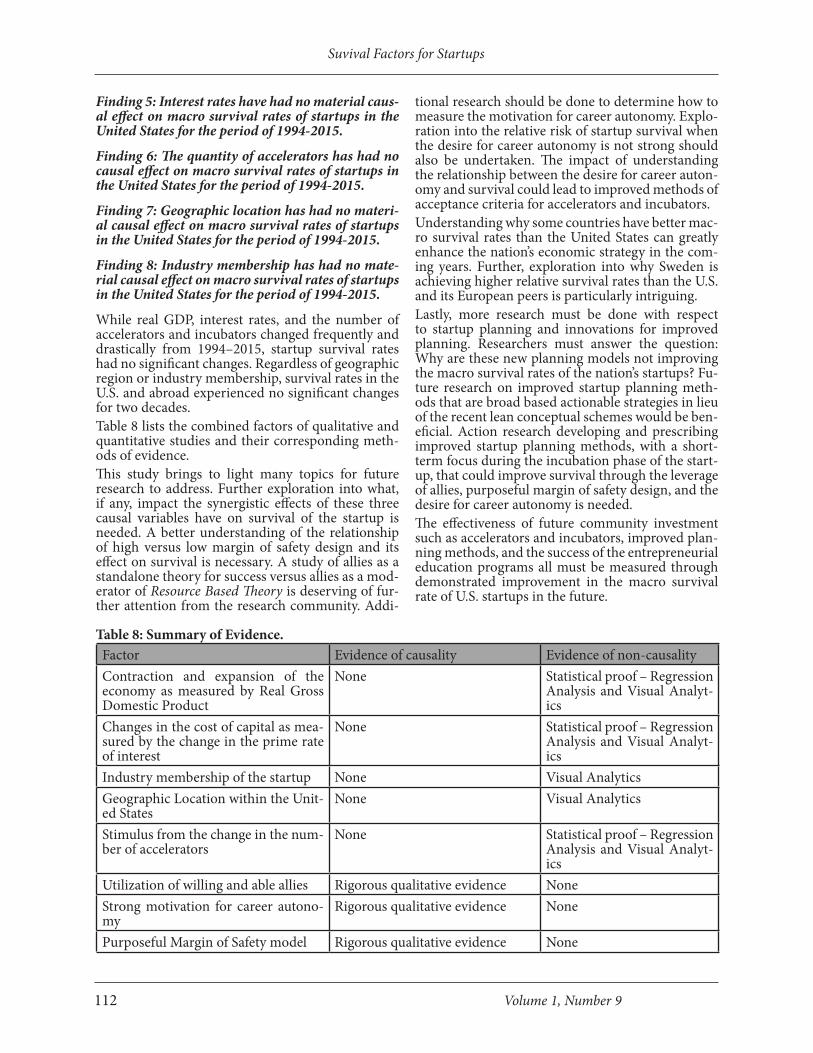
While real GDP, interest rates, and the number of accelerators and incubators changed frequently and drastically from 1994–2015, startup survival rates had no significant changes. Regardless of geographic region or industry membership, survival rates in the U.S. and abroad experienced no significant changes for two decades. Table 8 lists the combined factors of qualitative and quantitative studies and their corresponding meth-ods of evidence. This study brings to light many topics for future research to address. Further exploration into what, if any, impact the synergistic effects of these three causal variables have on survival of the startup is needed. A better understanding of the relationship of high versus low margin of safety design and its effect on survival is necessary. A study of allies as a standalone theory for success versus allies as a mod-erator of Resource Based Theory is deserving of fur-ther attention from the research community. Addi-
tional research should be done to determine how to measure the motivation for career autonomy. Explo-ration into the relative risk of startup survival when the desire for career autonomy is not strong should also be undertaken. The impact of understanding the relationship between the desire for career auton-omy and survival could lead to improved methods of acceptance criteria for accelerators and incubators.Understanding why some countries have better mac-ro survival rates than the United States can greatly enhance the nation’s economic strategy in the com-ing years. Further, exploration into why Sweden is achieving higher relative survival rates than the U.S. and its European peers is particularly intriguing.Lastly, more research must be done with respect to startup planning and innovations for improved planning. Researchers must answer the question: Why are these new planning models not improving the macro survival rates of the nation’s startups? Fu-ture research on improved startup planning meth-ods that are broad based actionable strategies in lieu of the recent lean conceptual schemes would be ben-eficial. Action research developing and prescribing improved startup planning methods, with a short-term focus during the incubation phase of the start-up, that could improve survival through the leverage of allies, purposeful margin of safety design, and the desire for career autonomy is needed. The effectiveness of future community investment such as accelerators and incubators, improved plan-ning methods, and the success of the entrepreneurial education programs all must be measured through demonstrated improvement in the macro survival rate of U.S. startups in the future.
Table 8: Summary of Evidence. Factor Evidence of causality Evidence of non-causalityContraction and expansion of the economy as measured by Real Gross Domestic Product
None Statistical proof – Regression Analysis and Visual Analyt-ics
Changes in the cost of capital as mea-sured by the change in the prime rate of interest
None Statistical proof – Regression Analysis and Visual Analyt-ics
Industry membership of the startup None Visual AnalyticsGeographic Location within the Unit-ed States
None Visual Analytics
Stimulus from the change in the num-ber of accelerators
None Statistical proof – Regression Analysis and Visual Analyt-ics
Utilization of willing and able allies Rigorous qualitative evidence NoneStrong motivation for career autono-my
Rigorous qualitative evidence None
Purposeful Margin of Safety model Rigorous qualitative evidence None
Muma Business Review 113
Gonzalez
ReferencesAshamalla, M. H., Orife, J. N., & Abel, I. (2008).
Business plans: Are they relevant to venture cap-italists? Journal of Small Business and Entrepre-neurship, 21(4), 381-391. doi:http://www.tand-fonline.com/loi/rsbe20
Astrachan, J. H., & Shanker, M. C. (2003). Family businesses’ contribution to the U.S. economy: A closer look. Family Business Review, 16(3), 211-219. doi:https://doi.org/10.1177/08944865030160030601
Bae, T. J., Qian, S., Miao, C., & Fiet, J. O. (2014). The relationship between entrepreneurship education and entrepreneurial intentions: A meta-analyt-ic review. Entrepreneurship: Theory and Practice, 38(2), 217-254. doi:10.1111/etap.12095
Bangs, D. H. (1998). The business planning guide: Creating a plan for success in your own business (8th ed.). Chicago, IL: UPstart Publishing Co.
Blank, S. (2013). Why the lean start-up changes ev-erything. Harvard Business Review, 91(5), 63-72.
Blank, S., Benjamin, S., Turner, E., Eisenberg, I., Warren, H., Telleen-Lawton, D., & Hassin, B. G. (2013). “Lean” is shaking up the entrepreneurial landscape: Interaction. Harvard Business Review, 91(7), 14-15.
BLS. (2016). Entrepreneurship and the U.S. economy. U.S. Bureau of Labor Statistics. Retrieved from http://www.bls.gov/bdm/entrepreneurship/en-trepreneurship.htmBrinckmann, J., Grichnik, D., & Kapsa, D. (2010). Should entrepreneurs plan or just storm the castle? A meta-analysis on contex-tual factors impacting the business planning-per-formance relationship in small firms. Journal of Business Venturing, 25(1), 24-40. doi:https://doi.org/10.1016/j.jbusvent.2008.10.007
Brüderl, J., Preisendörfer, P., & Ziegler, R. (1992). Survival chances of newly founded business or-ganizations. American Sociological Review, 57(2), 227-242.
Buss, T. F., & Lin, X. (1990). Business survival in rural America: A three-state study. Growth & Change, 21(3), 1.
Castrogiovanni, G. J. (1996). Pre-startup planning and the survival of new small businesses: Theo-retical linkages. Journal of Management, 22(6), 801-822.
CB Insights. (2016a). The-20-Reasons-Startups-Fail. Retrieved from https://www.cbinsights.com/research-reports/The-20-Reasons-Start-ups-Fail.pdf?utm_source=hs_automation&utm_medium=email&utm_content=24695183&_hsenc=p2ANqtz-8-LCvYV9ZPlZwen2V0pCY-QCkHkliZhg9EE2yL9dgDdxL0gbcss0kaBIY-
dQ-A7N2UuVzZqXUiwiWQ2ZQjwvR0cNi5N-nCg&_hsmi=24695183
CB Insights. (2016b). 232 startup failure post-mor-tems. Retrieved from https://www.cbinsights.com/blog/startup-failure-post-mortem/.
Collis, D. (2016). Lean strategy [cover story]. Har-vard Business Review, 94(3), 62-68.
Corbin, J., & Strauss, A. (2008a). Basics of qualitative research: Techniques and procedures for developing grounded theory (3rd ed.). Thousand Oaks, CA: Sage Publications, Inc.
Corbin, J., & Strauss, A. (2008b). Basics of qualitative research: Techniques and procedures for developing grounded theory (3rd ed.). Thousand Oaks, CA, US: Sage Publications, Inc.
Creswell, J. W. (2007). Qualitative inquiry & research design: Choosing among five approaches (2nd ed.). Thousand Oaks, CA: Sage Publications.
Darbyshire, M. (2016). The ups and downs of start-ups. Business in Calgary, 26(9), 96.
Davidsson, P., & Gordon, S. R. (2012). Panel stud-ies of new venture creation: A methods-focused review and suggestions for future research. Small Business Economics, 39(4), 853-876. doi:10.1007/s11187-011-9325-8
Eisenhauer, J. G. (2003). Regression through the origin. Teaching Statistics, 25(3), 76. doi:10.1111/1467-9639.00136
Fichter, D. (2015). Learning from lean startups. In-formation Today, Inc., 73.
Frick, W. (2016). The U.S. Startup economy is in both better and worse shape than we thought. Harvard Business Review Digital Articles, March 11, 2-5.
Gerber, S. (2010). The one-paragraph start-up plan. Entrepreneur, December 7, 2010. Retrieved from https://www.entrepreneur.com/article/217696
Gonzalez, G. T. (2017a). Risk analysis for initial needs (RAIN): Improving a time zero startup plan through resource based auditing (RBA) and a launch focused strategy. Muma Business Review, 1(8). 81-95.
Gonzalez, G. T. (2017b). Research debate: Where do entrepreneurs come from? Muma Business Re-view, 1(6). 57-67.
Graham, B., & Dodd, D. L. (2009). Security analysis. [electronic resource]: Principles and technique (6th ed.). New York, NY: McGraw-Hill.
Gumpert, D. E. (2002). Burn your business plan! What investors really want from entrepreneurs. Needham, MA: Lauson Publishing Co.
Guttman, A. (2015). ‘Don’t write business plans’: Advice for startups from one of Silicon Valley’s top seed investors. Forbes. Retrieved from http://
Suvival Factors for Startups
114 Volume 1, Number 9
www.forbes.com/sites/amyguttman/2015/07/21/dont-write-business-plansadvice-for-startups-from-one-of-silicon-valleys-top-seed-investors/
Guzman, J., & Stern, S. (2016). The state of American entrepreneurship: New estimates of the quantity and quality of entrepreneurship for 15 US states, 1988-2014: National Bureau of Economic Re-search, Inc. NBER Working Papers: 22095.
Hathaway, I. (2016). Accelerating growth: Startup accelerator programs in the United States. Ad-vanced Industry Series, (81).
Hathaway, I. (2016b). Accelerating growth: Startup accelerator programs in the United States. Ad-vanced Industry Series, (21).
Hormozi, A. M., Sutton, G. S., McMinn, R. D., & Lucio, W. (2002). Business plans for new or small businesses: Paving the path to success. Manage-ment Decision, 40(8), 755-763.
Küttim, M., Kallaste, M., Venesaar, U., & Kiis, A. (2014). Entrepreneurship education at universi-ty level and students’ entrepreneurial intentions. Procedia - Social and Behavioral Sciences, 110, 658-668. doi:10.1016/j.sbspro.2013.12.910
Perry, S. C. (2001). The relationship between written business plans and the failure of small businesses in the U.S. Journal of Small Business Management, 39(3), 201-208. doi:10.1111/1540-627X.00019
Quinn, J. F., & Perelli, S. (2016). First and foremost, physicians: The clinical versus leadership identi-ties of physician leaders. Journal of Health Orga-nization & Management, 30(4), 711.
Ries, E. (2011). The lean startup: How today’s entre-preneurs use continuous innovation to create rad-ically successful businesses (1st ed.). New York: Crown Business.
Sandberg, M. E. (2009). Nurture vs. nature: Can en-trepreneurial skills be taught? Research finds stu-dents who take entrepreneurial training and start businesses more innovate than company founders who skip the class [Press release]. Retrieved from http://www.marketwired.com/press-release/nur-ture-vs-nature-can-entrepreneurial-skills-be-taught-1203607.htm
SBA Office of Advocacy. (2012). Do economic or in-dustry factors affect business survival? Retrieved from https://www.sba.gov/sites/default/files/Business-Survival.pdf
SBA Office of Advocacy. (2016). Do Economic or In-dustry factors affect business survival? Retrieved from https://www.sba.gov/sites/default/files/Business-Survival.pdf.
Shane, S. A. (2008). The illusions of entrepreneurship: The costly myths that entrepreneurs, investors, and policy makers live by. New Haven: Yale University Press.
Shane, S. A. (2010). Born entrepreneurs, born leaders how your genes affect your work life. Oxford: Ox-ford University Press, USA.
Wagner, E. T. (2016). 9 lessons from a 10-time start-up failure. Forbes. Retrieved from http://www.forbes.com/sites/ericwagner/2013/10/22/9-les-sons-from-a-10-time-startup-failure/.
Zinger, J. T., & LeBrasseur, R. (2003). The benefits of business planning in early stage small enterprises. Journal of Small Business and Entrepreneurship, 17(1), 1-15.
ReviewThis article was accepted under the constructive peer review option. For futher details, see the de-scriptions at:http://mumabusinessreview.org/peer-review-op-tions/
Gilbert Gonzalez is founder and president of Mission Critical Solutions, Inc., a leading-edge technology solutions provider.and a two-time finalist for the Great-er Tampa Bay Chamber of Commerce Small Business of the Year. In 2005, Gon-zalez was named the Small Business Person of the Year for Florida by the U.S. Small Business Administration. He is a frequent lecturer at business forums and, in addition to his service at MCS; Gonzalez has published software and case stud-ies related to strategic management and business policy. He received an MBA from University of South Florida (USF) in Tampa, FL, doing so with honors and with concentrations in management of information systems and economics and is currently completing his DBA at USF.
Author


![Bayesian Causal Inference - uni-muenchen.de...from causal inference have been attracting much interest recently. [HHH18] propose that causal [HHH18] propose that causal inference stands](https://img.pdfslide.net/doc/110x75/5ec457b21b32702dbe2c9d4c/bayesian-causal-inference-uni-from-causal-inference-have-been-attracting.jpg)