Embed Size (px)
Citation preview
What Influences the Relationship Between Customer Satisfaction andRepurchase Intention?Investigating the Effects ofAdjusted Expectations andCustomer LoyaltyYoujae Yi and Suna LaSeoul National University
ABSTRACT
This study examines how loyalty influences the relationship betweencustomer satisfaction (CS) and repurchase intention (RPI). Consider-ing the effect of time, the study introduces adjusted expectations,which are expectations updated after consumption experience. Thepresent study investigates the role of adjusted expectations in theCS–RPI link. With structural-equation analysis, the proposed modelwas tested in the family-restaurant setting. The results show thatadjusted expectations can mediate the effect of CS on RPI. Theresults also indicate that processes underlying the CS–RPI link aredifferent between low-loyalty and high-loyalty customers. Specifi-cally, the transient route, which reflects the indirect path from CS toRPI via adjusted expectations, has a greater impact for nonloyalsthan for loyals. On the other hand, the chronic route, which repre-sents the direct path from CS to RPI, has a greater impact for loyalsthan for nonloyals. CS is found to have no direct influence on RPI forlow-loyalty customers. © 2004 Wiley Periodicals, Inc.
Psychology & Marketing, Vol. 21(5): 351–373 (May 2004)Published online in Wiley InterScience (www.interscience.wiley.com)© 2004 Wiley Periodicals, Inc. DOI: 10.1002/mar.20009
351
Because the importance of customer loyalty has been emphasized recently,many companies have been trying to enhance their customers’ loyaltythrough retention programs and relationship marketing strategies (Hal-lowell, 1996). Customer loyalty is so important because loyal customersbring many benefits to a firm. According to Reichheld and Teal (1996),the various advantages of customer loyalty include a continuous streamof profit, reduction of marketing costs, growth of per-customer revenue,decrease in operating costs, increase in referral, increase in price pre-mium, and switching barriers among loyal customers who will not eas-ily surrender to competitors’ promotion efforts. Considering these bene-fits, customer loyalty cannot be overemphasized in the severelycompetitive business world of today (Reichheld & Teal, 1996; Reinartz &Kumar, 2000; Yi & Jeon, 2003).
Most research tacitly assumed loyal customers’ characteristics bymeasuring loyalty as a high proportion of the same brand choice, a highintention of positive word-of-mouth, and high repurchase intention. Sim-ilarly, in the practical perspective, the difference between the cost of get-ting new customers and the cost of keeping existing customers is oftendemonstrated as the evidence for justifying how important it is to enhanceexisting customers’ loyalty (Reichheld & Teal, 1996).
Prior research on loyalty has mainly focused on the relationship betweencustomer satisfaction and repurchase (Reichheld & Teal, 1996). Customersatisfaction has been regarded as an antecedent of repurchase, but todaysuch a traditional belief has begun to be challenged as counterargumentsarise that higher CS does not necessarily result in higher repurchase(Jones & Sasser, 1995; Stewart, 1997). The link between customer satis-faction (CS) and repurchase intention (RPI) seems to be more complexthan expected (R. E.Anderson & Srinivasan, 2003; Hennig-Thurau & Klee,1997; Söderlund, 2002). Some studies examined trust and commitment asdeterminants of loyalty from the perspective of relationship marketing(Garbarino & Johnson, 1999; Singh & Sirdeshmukh, 2000). Such studiescontributed to the understanding of the CS–RPI link to a certain extent.
These research streams, however, do not explain why loyal customersgive a firm such advantages as mentioned earlier. Little is known aboutfundamental reasons for the difference between loyals and nonloyals.Some studies suggest that highly loyal customers follow different mech-anisms in evaluating consumption experiences compared with less loyalcustomers (Garbarino & Johnson, 1999; Mittal & Katrichis, 2000). How-ever, there is still little research unveiling the reasons for the differencesbetween loyal and nonloyal customers.
The objective of this study is to compare customers’ processing of con-sumption experiences between high-loyalty and low-loyalty groups. Thisstudy will thus examine how loyalty moderates the relationships amongthe variables in the CS–RPI link. A dimension of time is considered toexamine how adjusted expectations mediate the impact of CS on RPI. Thefindings of this study will give useful implications for the CS–RPI link.
YI AND LA352
LITERATURE REVIEW
CS–RPI Link
In the 1980s, achieving a higher CS rating was a goal in itself (Mittal &Kamakura, 2001). During the 1990s, there was a widespread realizationthat CS ratings are a means to strategic ends, such as repurchase, thatdirectly affect profits (Jones & Sasser, 1995; Mittal & Kamakura, 2001;Reichheld & Teal, 1996). Recently, however, researchers and practition-ers began to question the link between CS and repurchase (Jones &Sasser, 1995; Reichheld, 1993; Reichheld & Teal, 1996; Stewart, 1997).Enormous investment in CS programs has revealed that higher CS doesnot guarantee higher repurchase. Even after achieving a desirable levelof CS, firms have often found that having satisfied customers is not suf-ficient (Jones & Sasser, 1995; Neal, 1999; Stewart, 1997). According to astudy of auto owners, although 85–90% of customers were satisfied withthe chosen brand, only 40% of customers repurchased the brand (Reich-held, 1993).
To gain a better understanding of the CS–RPI link, researchers beganto examine moderators of the CS–RPI relationship. For example, Rustand Zahorik (1993) adopted length of patronage, whereas Homburg andGiering (2001) considered personal characteristics such as variety seek-ing, age, and income. Some recent studies suggest that evaluationprocesses might differ between loyal and nonloyal customers. In a studyof banking service, Mittal and Katrichis (2000) found that the importanceof attributes was different between new customers and loyal customers.Garbarino and Johnson (1999) showed that trust and commitment affectfuture intentions for loyal customers but not for nonloyal customers.
These circumstances motivated the present study to examine loyaltyas a moderator of the CS–RPI link. It is primarily based on the idea thatloyal customers may have a different tendency in evaluating CS and deter-mining whether or not to repatronize in comparison with nonloyals.
Loyalty
Although loyalty has been defined in various ways, there are two mainapproaches: behavioral and attitudinal approaches (Dekimpe, Steenkamp,Mellens, & Vanden, 1997; Dick & Basu, 1994). In earlier days, mostresearchers had focused on the behavioral concept. For example, Newmanand Werbel (1973) defined loyal customers as “those who rebought abrand, considered only that brand, and did no brand-related informa-tion seeking.” Similarly, Tellis (1988) measured loyalty as “repeat purchasefrequency” or “relative volume of same brand purchasing.”
Recently, loyalty has been defined from the attitudinal perspective aswell. Attitudinal loyalty includes cognitive, affective, and conative aspects(Oliver, 1997), and Oliver (1999) posited four phases for a customer to
CUSTOMER SATISFACTION AND REPURCHASE INTENTION 353
become loyal. First, loyalty in the cognitive phase is based on either priorknowledge or experience-based information about a brand. Second, loy-alty in the affective phase is a liking or attitude toward a brand. Basedon cumulatively satisfying usage occasions, it implies feelings toward abrand. Nevertheless, this form of loyalty remains subject to switching.Third, conative loyalty is defined as a customer’s behavioral intention tokeep on purchasing a product in the future, and therefore it is harder todislodge than affective loyalty (Oliver, 1999; Pedersen & Nysveen, 2001).Action loyalty is the final stage among loyalty phases, in which moti-vated intention is transformed into readiness to act. Action loyalty isrelated to the behavioral approach. Oliver’s view sheds light on the devel-opment of loyalty from attitude to behavior.
Based on the review of loyalty concepts, Oliver’s definition, whichincludes attitudinal and behavioral aspects of loyalty, was adopted. Cus-tomer loyalty is “a deeply held commitment to rebuy or repatronize apreferred product or service consistently in the future, despite situa-tional influences and marketing efforts having the potential to causeswitching behavior” (Oliver, 1997, p. 392).
To measure loyalty in the behavioral sense, researchers use a repur-chase probability, a long-term choice probability for a brand (Carpenter& Lehmann, 1985; Colombo, Morrison, & Green, 1989; Dekimpe et al.,1997), or switching (Raju, Srinivasan, & Lal, 1990). On the other hand,attitudinal loyalty is operationalized as brand preference or emotionalcommitment, and thus it is measured with “repeat purchase intention”(E. W. Anderson & Sullivan, 1993; Cronin & Taylor, 1992), “resistanceagainst better alternatives” (Narayandas, 1996), “intention of word-of-mouth (WOM)” (Boulding, Kalra, Staelin, & Zeithaml, 1993), or “will-ingness to pay premium price” (Narayandas, 1996; Zeithaml, Berry, &Parasuraman, 1996). Such measures of loyalty provide insights into thenature of loyal customers. Namely, loyal customers tend to show a spe-cial preference, attachment, commitment, positive WOM, low switchingto competitive brands, and willingness to pay premium price.
It should be noted that repurchase is affected by cumulative satisfac-tion rather than individual episodic satisfaction. According to Oliver(1999), “[f]or satisfaction to affect loyalty, frequent or cumulative satis-faction is required so that individual satisfaction episodes become aggre-gated or blended.” Johnson, Anderson, and Fornell (1995) also arguedthat cumulative CS is a fundamental indicator of a firm’s current andlong-run performance.
Adjusted Expectations
Many CS studies are based on Oliver’s (1980) expectation–disconfirma-tion paradigm. Oliver conceptualized expectations as belief probabilitiesof what the consequences of an event will be. In contrast, the gap-basedservice-quality model developed by Parasuraman, Zeithaml, and Berry
YI AND LA354
(1988) has defined expectations in terms of what customers feel theyshould be offered (Devlin, Gwynne, & Ennew, 2002). The former has beenrestated as “predictive expectations” and the latter as “desired expecta-tions” (Yi, 1990). Although the definitions of two types of expectations aredifferent, there has been little consensus on whether the nature of theexpectation standards used is appropriate (Devlin et al., 2002).
Zeithaml, Berry, and Parasuraman (1993) presented adequate serviceand desired service by employing the tolerance zone. Predictive expec-tations are closely related to the concept of adequate service, and desiredexpectations are almost the same as desired service. Desired servicemeans the expectations that customers think they deserve taking theprice-benefit fairness or other reasons into account.
Learning is continually taking place in the market, and initial beliefsand expectations are updated as information is accumulated over time(Johnson et al., 1995). Consumers learn from experiences of product/serv-ice usage (Hoch & Deighton, 1989). Such experiences give some infor-mation to consumers and contribute to the update of existing beliefs.Therefore, expectations imply a dynamic nature of change as consump-tion experiences are accumulated.
As mentioned earlier, the concept of expectations broadly used in theCS literature is “prior expectations” or “predictive expectations” thatplay a role of standards in evaluating satisfaction about consumptionexperience (Yi, 1990, 1993). Prior expectations can be viewed as adynamic construct continually affected by cumulative consumption expe-riences, alternatives, and marketing communication (Johnson et al.,1995), whereas CS is a static concept defined as a cognitive and affec-tive response that is obtained through a current transaction or currentconsumption experience (Oliver, 1997). Boulding et al. (1993) mentionthat predictive expectations are likely to alter with experience and canchange in either direction, whereas desired expectations can remainunchanged or increase. Episodic or transactional CS as well as cumu-lative CS can influence future expectations and thus repurchase inten-tions. In this context, expectations updated through cumulated or cur-rent consumption experiences will be called adjusted expectations inthe present study.
As post hoc expectations after the consumption experience, adjustedexpectations will guide purchase behavior in the next period and serveas an anchor in evaluating future CS. Rust and Oliver (2000) argue thatprograms that exceed a customer’s expectations to a surprising degreecan heighten repurchase expectations and make it more difficult to sat-isfy the customer in the future. This argument also indicates a dynamicnature of expectations. It means that the degree of satisfaction at eachtransaction will affect postpurchase expectations. Adjusted expectationsare updated from prior expectations on the basis of newly acquired infor-mation, and they are affected by CS, an overall evaluation of the con-sumption experience.
CUSTOMER SATISFACTION AND REPURCHASE INTENTION 355
According to the adaptive expectation model, expectations may changein the process of anchoring and adjusting (Johnson & Plott, 1989; Johnsonet al., 1995; Oliver & Winer, 1987;Tversky & Kahneman, 1974). Hence, theadaptive expectation model is useful for explaining the change of individ-ual-level expectations, whereas the rational expectation model is usefulfor explaining the change of aggregate market-level expectations (Johnsonet al., 1995). Johnson et al. (1995) mentioned that individuals’ expecta-tions rather than market-level expectations change quickly and are adap-tive to current information.A revision of individual expectations can occureven during consumption (Oliver, 1997, p. 88; Szajna & Scamell, 1993).
Oliver (1997, p. 68) argued that “the expectation, not the need, is whatconsumers bring to the purchase.” Kalwani, Yim, Rinne, and Sugita (1990)argued that adding expectations could increase predictability of brandchoice behavior. Especially in service industries, expectation managementis important because services have their own characteristics, such asintangibility, inseparability, heterogeneity, and perishability (Zeithaml etal., 1996). Therefore, marketers in service industries need to enhance con-sumers’ expectations in order to lead them to repurchase even when theyalready have needs for the brand (Zeithaml, Berry, & Parasuraman, 1993).
On the basis of the preceding discussion, this study focuses on indi-viduals’ post hoc expectations and conceptualizes adjusted expectationsas a mediator in the CS–RPI link. Adjusted expectations are posited tobe affected by CS and to be a predictor of repurchase behavior.
HYPOTHESES
A widely accepted model of the CS–RPI link posits a path from discon-firmation to RPI via CS. Although the CS–RPI link is intuitively andtheoretically evident, studies have often produced inconsistent results.Some studies found that CS influenced RPI, whereas others did not (Szy-manski & Henard, 2001; Yi, 1990). Given such inconsistent results, thereis a need to investigate the CS–RPI link in more depth.
The present study proposes that the CS–RPI link can be decomposedinto two routes. One is a direct route in which CS influences RPI directly,and the other is an indirect route in which CS influences RPI indirectlythrough adjusted expectations. The two routes will be compared betweenlow-loyalty and high-loyalty customers.
The indirect route is affected by adjusted expectations reflecting thecurrent experience, and thus it must have a changeable nature accord-ing to each transactional anecdote. Hence, the indirect route is calledthe transient route. On the other hand, the direct route is not affected bychanges of existing beliefs, so that it must be relatively stable. The directroute is thus called the chronic route. The following sections will exam-ine the relevant literature on the key constructs and present the hypothe-ses pertaining to their relationships.
YI AND LA356
Transient Route
Disconfirmation Sensitivity. Disconfirmation-sensitive consumers aredefined as those who are more satisfied (dissatisfied) when products per-form better (worse) than expected (Kopalle & Lehmann, 2001). Conse-quently, the impact of disconfirmation on CS should be higher for dis-confirmation-sensitive consumers. Then, who are more disconfirmationsensitive: loyals or nonloyals?
As loyal consumers buy a particular brand more frequently and havemore reliable knowledge about the brand, they must have relatively moreaccurate and realistic expectations about the brand. Therefore, loyal con-sumers may tend to ignore disconfirmation to some extent and regard itas an episodic product/service failure (or success) rather than as a last-ing problem (or enhancement).
In contrast, nonloyals may have less knowledge of the brand and holdmore inaccurate or unrealistic expectations, which will probably resultin high disconfirmation between prior expectations and perceived per-formance. Even when the same amount of disconfirmation occurs, non-loyals may regard it as an important indicator in evaluating the brand.Hence, nonloyal consumers will tend to use disconfirmation more sen-sitively in judging satisfaction than loyal consumers will.
Cognitive Consistency. Cognitive dissonance theory (Festinger, 1957)explains the tendency of consumers to justify decisions post hoc (Harmon-Jones & Mills, 1999; Kopalle & Lehmann, 2001). When the consumptionexperience is not as good as expected, customers probably feel cognitivedissonance. Then, who would feel more dissonance: loyals or nonloyals?
Loyal customers tend to make more repurchase of the same brand.Such a consistent repurchase behavior will form an experiential knowl-edge related to a specific brand so that loyal consumers are likely to relyincreasingly on the brand’s or the service provider’s trust expectations(Singh & Sirdeshmukh, 2000). Subjective knowledge acquired throughaccumulated consumption experiences will be accompanied by higherconfidence (Herr, Kardes, & Kim, 1991; Park, Mothersbaugh, & Feick,1994). So consumers with higher confidence in expectations will sufferfrom cognitive dissonance when they face experiences or informationdisconfirming their strong beliefs. In this situation, trust will act as aninformation source, and on that ground consumers will attribute thecauses of cognitive dissonance and thus resolve their mental conflict(Folkes, 1984; Oliver & DeSarbo, 1988).
Therefore, loyal consumers who would have high confidence in expec-tations are likely to attribute cognitively inconsistent experience to exter-nal sources, and they are likely to think of disconfirmation as a tempo-rary or uncontrollable episode (Fournier, 1998). Consequently, loyalconsumers will consider episodic factors relatively less compared withnonloyal consumers.
CUSTOMER SATISFACTION AND REPURCHASE INTENTION 357
Even with the same level of adjusted expectations, nonloyal consumersmay think of episodic experience as a more important guide to deter-mine whether to repurchase the same brand or not. On the other hand,loyal consumers are likely to stick to their accumulated experientialknowledge and not to change their prior attitudes easily after an episodicconsumption experience.
When disconfirmation occurs, it will affect CS. CS will, in turn, influ-ence adjusted expectations, and then adjusted expectations will influ-ence RPI. In sum, these paths in the transient route must be weaker forloyals than for nonloyals.
H1: The impact of disconfirmation on CS will be higher for low-loy-alty consumers than for high-loyalty consumers.
H2: The impact of CS on adjusted expectations will be higher forlow-loyalty consumers than for high-loyalty consumers.
H3: The impact of adjusted expectations on RPI will be higher forlow-loyalty consumers than for high-loyalty consumers.
Chronic Route
Trust and Commitment. As mentioned earlier, new information caninfluence consumers’ information processing in two ways: transient andchronic routes. The transient route of information processing occurs whennew information is persuasive enough to change existing beliefs or whenexisting beliefs are not robust enough to endure information discon-firming existing beliefs. On the other hand, the chronic route of infor-mation processing will maintain existing beliefs when new informationis not convincing enough to change existing attitudes or when existingattitudes are strong due to robust buttress of trust or commitment to aparticular brand/service provider (Bendapudi & Berry, 1997).
Considering this from the perspective of relationship marketing, loyalconsumers seem to be more relational to a particular brand than nonloyalconsumers. In contrast, nonloyal consumers seem to be relatively lessrelational, transaction oriented, and short-term oriented. Garbarino andJohnson (1999) found that consistent subscribers of performance artsdetermined future intentions (attend/subscribe/donate in the future)based on trust and commitment.
Trust is defined as confidence in reliability and integrity of the prod-uct/service provider (Morgan & Hunt, 1994). According to the definition,trust comes from the product/service provider’s behavior such as fulfillingexpectations and maintaining quality offerings for customers. Rousseau,Sitkin, Burt, and Camerer (1998) argue that trust is a psychological statecomprising the intention to accept vulnerability based on positive expec-tations of the intentions or behaviors of another. This definition has two
YI AND LA358
important implications. One implication is that trust is based on positiveexpectations, and the other is that trust is a psychological state that will-ingly accepts situational vulnerability (Singh & Sirdeshmukh, 2000).According to such a perspective, loyal consumers will build positive priorexpectations of the specific brand and be relatively unaffected by tempo-rary transactional experiences. That is, loyal customers tend to maintaintheir positive expectations relatively longer than low-loyalty consumers,so they are not likely to adjust expectations based on episodic factors. Inthis sense, trust acts as the glue that holds the relationship together acrossdifferent encounters (Singh & Sirdeshmukh, 2000). Such aspects of trustmay result in higher stability of the chronic route.
Commitment is also recognized as an essential ingredient for long-term relationships (Garbarino & Johnson, 1999; Morgan & Hunt, 1994).Commitment is defined as an enduring desire to maintain a valued rela-tionship (Moorman, Zaltman, & Deshpandé, 1992). Commitment isregarded as a construct with three components: an instrument compo-nent that is some form of investment, an attitudinal component thatmay be described as affective commitment or psychological attachment,and a temporal dimension indicating that the relationship exists overtime (Gundlach, Achrol, & Mentzer, 1995). Customers’ commitment mayprovide various benefits to a firm (Pedersen & Nysveen, 2001). For exam-ple, it may protect a firm under service failure, make customers lessprice-sensitive (Krishnamurti & Raj, 1991), give some time to reactagainst the competitor’s attack, and build entry barriers (Sharp & Sharp,1997). Commitment should reflect deep ongoing relational interdepend-ency (Bendapudi & Berry, 1997; Morgan & Hunt, 1994). Therefore, sim-ilar to trust, commitment may bring about higher stability on the chronicroute from CS to RPI.
Customer satisfaction can have two aspects. One aspect stems fromencounter-specific disconfirmation, and the other stems from the expe-rience of cumulative encounters that cannot be easily destroyed byepisodic factors. There are two general conceptualizations of satisfactionin the literature: transaction-specific satisfaction and cumulative satis-faction (Boulding et al., 1993). The transient route may reflect transac-tion-specific CS, whereas the chronic route may reflect cumulative CS thatseems to be fortified by trust and commitment.
In sum, as loyal customers are likely to ignore encounter-specific dis-confirmation, their satisfaction is less likely to be influenced by disconfir-mation. Their CS should be relatively stable and be a more reliable pre-dictor of RPI. Furthermore, loyal customers’ tendency to keep their ongoingrelationship will make the chronic route from CS to RPI relatively stronger.
Satisfaction Threshold. Consumers may have different thresholds ortolerance levels toward repurchase that are not fully captured in satis-faction ratings (Mittal & Kamakura, 2001). Even with the same CS rat-ings, consumers with lower thresholds are more likely to repurchase the
CUSTOMER SATISFACTION AND REPURCHASE INTENTION 359
brand than those with higher thresholds. Brand knowledge may be oneconsumer characteristic that affects the difference in CS threshold (Mit-tal & Kamakura, 2001; Ratchford, 1999). Accumulated investments inknowledge of a particular brand may lead consumers to repurchase thesame brand because repurchase means a more economic behavior thanstarting to search for a new brand and then making a new investment innew-brand–specific knowledge. Hence, loyal consumers may not want togive up the accumulated investment in their brand-specific knowledge, andthus they tend to repurchase the same brand.As loyal consumers may havelower CS thresholds, their repurchase intention will be higher.
As determinants of customer–brand relationship stability (durabil-ity), Fournier (1998) proposed tendencies such as “‘accommodation,” “tol-erance/forgiveness,” “biased partner perceptions,” “devaluation of alter-natives,” and “attribution biases.” These tendencies can be found in loyalcustomers’ attitudes and behaviors. That is, these are typical character-istics that distinguish loyals from nonloyals. According to Fournier’s con-ceptual model, loyal customers tend to perceive a particular brand morefavorably and tolerantly so that they repurchase the same brand con-tinuously. This tendency can be explained by the difference in CS thresh-old because a lower CS threshold implies a higher level of tolerance andconsequently higher retention (Mittal & Kamakura, 2001). Thus, loyalswill have a relatively stable CS–RPI link compared with nonloyals.
H4: The impact of CS on RPI will be higher for high-loyalty con-sumers than for low-loyalty consumers.
METHOD
Sample
An empirical study was conducted to compare the processes underlyingthe CS–RPI link between low-loyalty and high-loyalty groups. A naturalservice setting (rather than a laboratory setting) was used in order toenhance the external validity of the study. The proposed model was testedin the family-restaurant market in Korea. A survey was conducted withcustomers of family restaurants in a metropolitan area. They were askedto respond to a customer-satisfaction survey regarding family restau-rants. They were first asked to state the name of the family restaurantthat they had most recently visited. They were then asked to answer thesurvey questions with regard to that restaurant.
The sample consisted of 256 respondents including 93 undergraduatestudents, 55 graduate students, and 108 business workers.The male/femaleratio of the sample was 54% and 46%, respectively, and the age range wasfrom 19 to 51.The sample consisted of 93 undergraduate students, 55 grad-uate students, and 108 business workers. The responses to the frequencyof visit were as follows: less than once a year (14%), once or twice a year
YI AND LA360
(14%), 3–5 times a year (26%), 6–8 times a year (12%), 9–11 times a year(12%), once or twice a month (16%), more than 3 times a month (5%).
Measures
Disconfirmation was defined as perceived discrepancy between priorexpectations and performance. The construct was measured by asking fourquestions: “Did you feel the family restaurant overprovided/underpro-vided the quality food and service compared with your prior expecta-tions?” “Did you feel the family restaurant over-provided/under-providedbenefits corresponding to its price compared with your prior expecta-tions?” “Did you feel the family restaurant overfulfilled/underfulfilledyour needs and objectives compared with your prior expectations?” and“Did you feel the family restaurant was better/worse overall comparedwith your prior expectations?” Seven-point scales were used for theresponses. They were anchored by much worse than expected, and muchbetter than expected, with exactly as expected for the midpoint.
Customer satisfaction was defined here as a cognitive and affectiveresponse to the consumption experience (Oliver, 1997; Yi, 1990). CS wasmeasured with two indicators: “the degree of satisfaction” and “the degreeof happiness” (Oliver, 1997, p. 299, p. 343). The first question was “Did youfeel satisfied after visiting the family restaurant?” and the second ques-tion was “Did you feel happy after visiting the family restaurant?” Theseven-point scale for CS was anchored as not at all/quite a lot.
According to the information-integration theory (N. H. Anderson, 1981)and information-processing model (Tversky & Kahneman, 1974), adjustedexpectations were defined as post hoc predictive expectations updated onthe basis of information acquired through current consumption experi-ence as well as past cumulative consumption experience (Johnson et al.,1995; Rust & Oliver, 2000). For measurement, five questions were used.The first four questions were intended to measure the absolute level ofadjusted expectations after a restaurant visit, and the last question wasused to measure the relative level of adjusted expectations comparedwith prior expectations. It was emphasized that these questions wereasked with regard to postconsumption expectations.
To measure the absolute level of adjusted expectations, the followingquestions were used:
• After visiting the family restaurant, now I expect the family restau-rant will provide quality food and service that I want to be offered.
• After visiting the family restaurant, now I expect the family restau-rant will provide benefits corresponding to its price.
• After visiting the family restaurant, now I expect that my needsand objectives will be fulfilled by visiting the family restaurant.
• After visiting the family restaurant, how good do you expect now thefamily restaurant to be overall?
CUSTOMER SATISFACTION AND REPURCHASE INTENTION 361
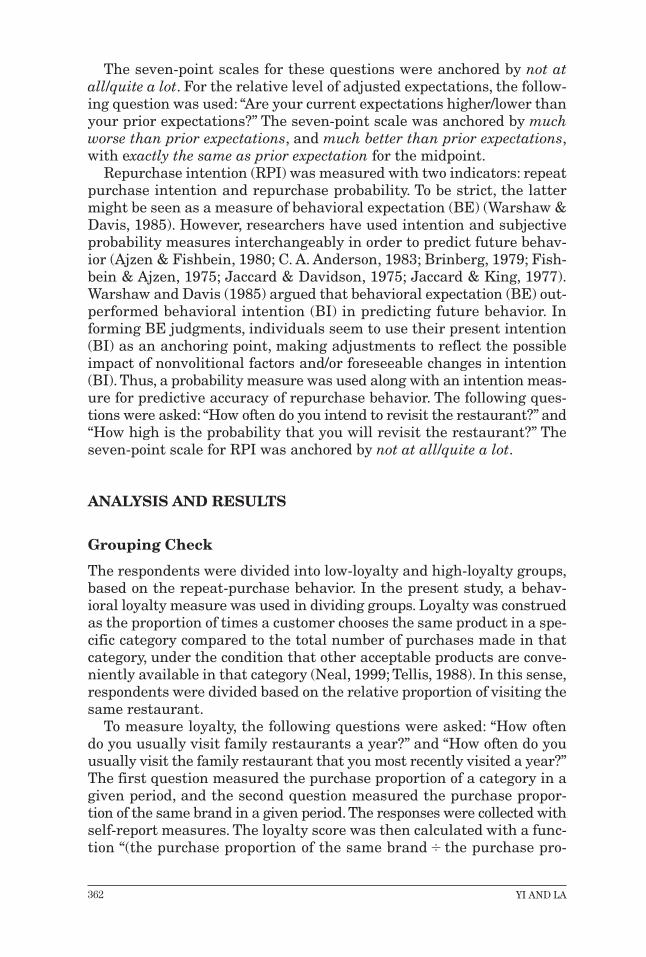
The seven-point scales for these questions were anchored by not atall/quite a lot. For the relative level of adjusted expectations, the follow-ing question was used: “Are your current expectations higher/lower thanyour prior expectations?” The seven-point scale was anchored by muchworse than prior expectations, and much better than prior expectations,with exactly the same as prior expectation for the midpoint.
Repurchase intention (RPI) was measured with two indicators: repeatpurchase intention and repurchase probability. To be strict, the lattermight be seen as a measure of behavioral expectation (BE) (Warshaw &Davis, 1985). However, researchers have used intention and subjectiveprobability measures interchangeably in order to predict future behav-ior (Ajzen & Fishbein, 1980; C. A. Anderson, 1983; Brinberg, 1979; Fish-bein & Ajzen, 1975; Jaccard & Davidson, 1975; Jaccard & King, 1977).Warshaw and Davis (1985) argued that behavioral expectation (BE) out-performed behavioral intention (BI) in predicting future behavior. Informing BE judgments, individuals seem to use their present intention(BI) as an anchoring point, making adjustments to reflect the possibleimpact of nonvolitional factors and/or foreseeable changes in intention(BI). Thus, a probability measure was used along with an intention meas-ure for predictive accuracy of repurchase behavior. The following ques-tions were asked: “How often do you intend to revisit the restaurant?” and“How high is the probability that you will revisit the restaurant?” Theseven-point scale for RPI was anchored by not at all/quite a lot.
ANALYSIS AND RESULTS
Grouping Check
The respondents were divided into low-loyalty and high-loyalty groups,based on the repeat-purchase behavior. In the present study, a behav-ioral loyalty measure was used in dividing groups. Loyalty was construedas the proportion of times a customer chooses the same product in a spe-cific category compared to the total number of purchases made in thatcategory, under the condition that other acceptable products are conve-niently available in that category (Neal, 1999; Tellis, 1988). In this sense,respondents were divided based on the relative proportion of visiting thesame restaurant.
To measure loyalty, the following questions were asked: “How oftendo you usually visit family restaurants a year?” and “How often do youusually visit the family restaurant that you most recently visited a year?”The first question measured the purchase proportion of a category in agiven period, and the second question measured the purchase propor-tion of the same brand in a given period. The responses were collected withself-report measures. The loyalty score was then calculated with a func-tion “(the purchase proportion of the same brand � the purchase pro-
YI AND LA362
portion of a category) � 100.” Grouping was done by a median-split ontheir loyalty scores. The high-loyalty group consisted of 115 subjects, andthe low-loyalty group consisted of 123 subjects. The subjects on the medianwere excluded for more accurate analyses.
For validation of grouping, group means were compared on severaldimensions: prior expectations, subjective knowledge, and confidence inexpectation. The mean difference of prior expectations was checked to con-firm whether the high-loyalty group had relatively more positive atti-tudes toward the family restaurant that he/she had recently visited thanthe low-loyalty group (Rousseau et al., 1998; Singh & Sirdeshmukh,2000). Customers who are loyal to one brand expect more from their cur-rent brand than alternatives (Fornell, 1992). If the high-loyalty grouphas relatively higher prior expectations than the low-loyalty group, onecan infer that high-loyalty consumers have relatively more positive atti-tudes than low-loyalty consumers before visiting the family restaurant.
The objective of comparing subjective knowledge and confidence inexpectation is to test whether the high-loyalty group indeed has moreknowledge and higher confidence in prior expectations about the recentlyvisited family restaurant than the low-loyalty group (Herr et al., 1991;Park et al., 1994), because the theoretical background for proposedhypotheses implicitly makes such assumptions.
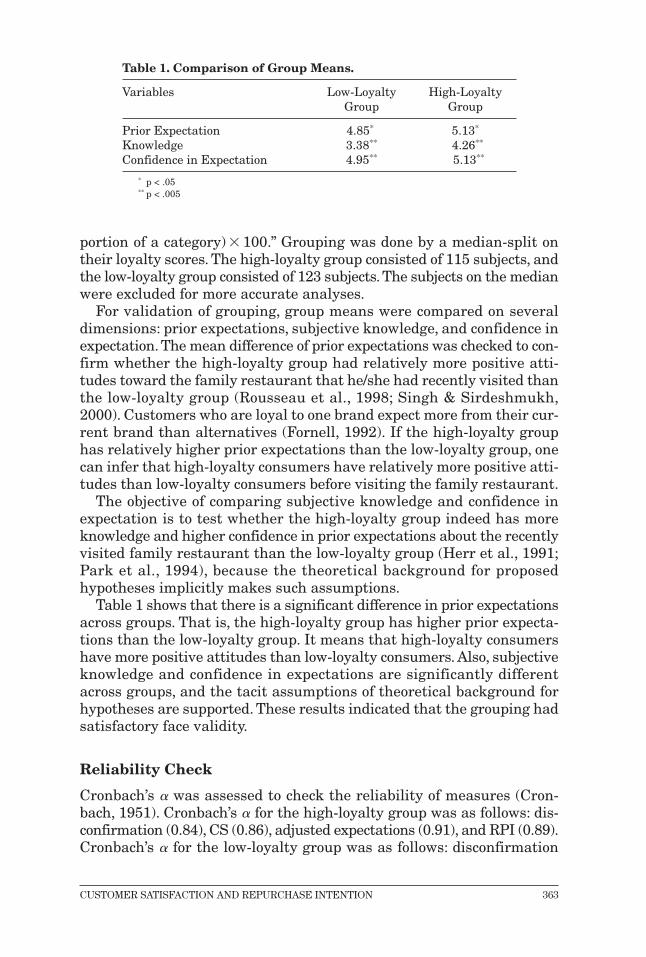
Table 1 shows that there is a significant difference in prior expectationsacross groups. That is, the high-loyalty group has higher prior expecta-tions than the low-loyalty group. It means that high-loyalty consumershave more positive attitudes than low-loyalty consumers. Also, subjectiveknowledge and confidence in expectations are significantly differentacross groups, and the tacit assumptions of theoretical background forhypotheses are supported. These results indicated that the grouping hadsatisfactory face validity.
Reliability Check
Cronbach’s � was assessed to check the reliability of measures (Cron-bach, 1951). Cronbach’s � for the high-loyalty group was as follows: dis-confirmation (0.84), CS (0.86), adjusted expectations (0.91), and RPI (0.89).Cronbach’s � for the low-loyalty group was as follows: disconfirmation
CUSTOMER SATISFACTION AND REPURCHASE INTENTION 363
Table 1. Comparison of Group Means.
Variables Low-Loyalty High-LoyaltyGroup Group
Prior Expectation 4.85* 5.13*
Knowledge 3.38** 4.26**
Confidence in Expectation 4.95** 5.13**
* p < .05** p < .005
(0.89), CS (0.90), adjusted expectations (0.92), and RPI (0.92). In sum, allthe measures showed a satisfactory level of reliability.
Test for Metric Invariance
Before comparing key paths across groups, the equality of factor loadingsbetween the two groups was assessed. With covariance matrix as input,confirmatory factor analysis (CFA) was conducted in the form of multi-ple sample analysis. The full metric invariance was not supported, asthe chi-square difference between the nonrestricted model and the fullmetric invariance model was significant (�2
d(9) � 24.39, p � .01). Fol-lowing the recommended procedures of Steenkamp and Baumgartner(1998) and Yoo (2002), the invariance constraints were relaxed step bystep on the basis of modification indices and expected parameter changes.Finally, a partial metric invariance model with three of nine invarianceconstraints relaxed was supported. The chi-square difference betweenthe nonrestricted model and the partial metric invariance model wasinsignificant (�2
d(6) � 9.52, p � .10). The invariant items were measuresof X1, X2, X3, X4 for disconfirmation, Y1 for CS, Y3, Y4, Y6, Y7, for adjustedexpectations, and Y8 for RPI. Table 2 shows the procedure and results.This partial invariance model was used in subsequent analyses.
Hypothesis Testing
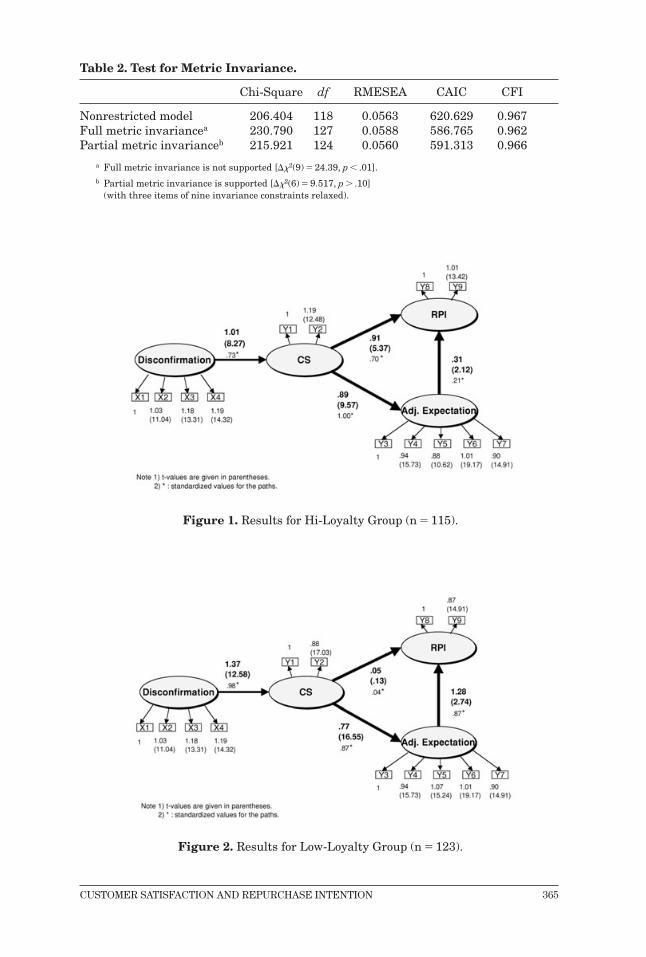
The entire structural model was run in the form of multiple sampleanalysis. The results for the high-loyalty group are presented in Figure1, and those for the low-loyalty group are presented in Figure 2. Theoverall model showed satisfactory fit: �2(128) � 229.30 (p � .00), the non-normed-fit index (NNFI) = 0.95, the comparative-fit index (CFI) � 0.96,and the standardized root-mean-squared residual (SRMR) � 0.050. Takentogether, the findings indicated that there was a satisfactory fit betweenthe proposed model and the data (Bagozzi & Yi, 1988).
The explained variance in dependent variables for the low-loyaltygroup was as follows: CS (67%), adjusted expectations (69%), and RPI(87%). The explained variance in dependent variables for the high-loy-alty group was as follows: CS (82%), adjusted expectations (74%), andRPI (93%). In general, all the explained variances in the dependent vari-ables seemed to be satisfactory.
The estimates for individual path coefficients on the transient routewere then compared between the two groups. For the path from discon-firmation to CS, the estimate was higher in the low-loyalty group thanin the high-loyalty group (low � 1.37, t � 12.58, versus high � 1.01, t �8.27). This result was consistent with H1. The path coefficient from CSto adjusted expectations was 0.77 (t � 16.55) in the low-loyalty groupand 0.89 (t � 9.57) in the high-loyalty group. This result was not con-sistent with H2. The path coefficient from adjusted expectations to RPI
YI AND LA364
CUSTOMER SATISFACTION AND REPURCHASE INTENTION 365
Table 2. Test for Metric Invariance.
Chi-Square df RMESEA CAIC CFI
Nonrestricted model 206.404 118 0.0563 620.629 0.967Full metric invariancea 230.790 127 0.0588 586.765 0.962Partial metric invarianceb 215.921 124 0.0560 591.313 0.966
a Full metric invariance is not supported [��2(9) � 24.39, p � .01].b Partial metric invariance is supported [��2(6) � 9.517, p � .10]
(with three items of nine invariance constraints relaxed).
Figure 1. Results for Hi-Loyalty Group (n � 115).
Figure 2. Results for Low-Loyalty Group (n � 123).
was higher in the low-loyalty group (low � 1.28, t � 2.74, versus high �0.31, t � 2.12). This result was consistent with H3.
Next, the estimates for path coefficients on the chronic route werecompared across groups. For the path from CS to RPI, the estimatewas higher in the high-loyalty group than in the low-loyalty group(high � 0.91, t � 5.37, versus low � 0.05, t � 0.13). This result wasconsistent with H4.
Chi-square difference tests were then conducted in order to test for-mally whether the differences in parameter estimates were statisticallysignificant. The initial baseline model was estimated by allowing allmodel parameters to be free estimates. In the nested model, a particu-lar path (e.g., from disconfirmation to CS) was fixed to be equal acrossgroups. The difference in the chi-square value between the baseline modeland the restricted model computed for 1 degree of freedom permits thetest of a significant difference in path coefficient across the two groups.The nested procedures were implemented for the paths pertaining tothe hypotheses.
Regarding the path from disconfirmation to CS, there was a significantdifference between the two groups (low �1.37 versus high � 1.01; �2
d(1)� 6.36, p � .05). H1 was thus supported. The path from CS to adjustedexpectations was not statistically different across groups (low � 0.77versus high � 0.89; �2
d(1) � 1.48, p � .10). Accordingly, H2 was not sup-ported. The path from adjusted expectations to RPI was found to be sig-nificantly different across groups (low = 1.28 versus high = .31; �2
d(1) =3.99, p � .05). The effect of adjusted expectations on RPI was greater inthe low-loyalty group, and H3 was supported. Regarding the chronicroute, the path from CS to RPI was found to be significantly differentacross groups (low = 0.05 versus high = 0.91; �2
d(1) = 4.40, p � .05). Thus,H4 was supported.
According to these results, one can conclude that the transient routefrom disconfirmation to CS and CS to RPI via adjusted expectations isstronger for the low-loyalty group than for the high-loyalty group.Although one of the three paths (i.e., from CS to adjusted expectations)is not different across groups, one can say that the transient route isstronger for nonloyals, because the other two paths (i.e., from disconfir-mation to CS and from adjusted expectations to RPI) are stronger forthe low-loyalty group. On the other hand, the chronic route from CS toRPI is stronger for the high-loyalty group.
In additional analyses, the structural model including both the pathfrom disconfirmation to adjusted expectations and the path from dis-confirmation to RPI was run to validate the implicit assumptions of theproposed model. For the path from disconfirmation to adjusted expecta-tions, the estimate was not significant for both groups [low � 0.81 (t =1.60) versus high � 0.29 (t � 1.32)]. The path coefficient from discon-firmation to RPI was also insignificant for the two groups [low = 0.16 (t= 0.04) versus high � .46 (t � 1.89)]. These results showed that theproposed model seemed to be appropriate and parsimonious.
YI AND LA366
DISCUSSION
The present study extends previous research on the CS–RPI link by pro-posing a theoretical model that includes adjusted expectations. Adjustedexpectations are post hoc expectations that are updated on the basis of con-sumption experiences. It is proposed that adjusted expectations may medi-ate the relationship between CS and RPI. The results show that adjustedexpectations do indeed mediate the effect of CS on RPI. In addition tothis indirect impact mediated by adjusted expectations, CS has a directimpact on RPI by itself for the high-loyalty group. As a consequence, thepresent study has decomposed the CS–RPI link into two paths. One isthe transient route containing adjusted expectations as a mediator betweenCS and RPI. The other is the chronic route from CS directly to RPI. Thisstudy thus deepens our understanding of how satisfaction is transformedinto repurchase intentions by delineating the process.
This study also extends previous research on CS by examining themoderating role of loyalty. The study has proposed that the mechanismsunderlying the CS–RPI link can differ according to the level of loyalty.The results indicate that processes pertaining to the CS–RPI link areindeed different between low-loyalty and high-loyalty customers. Specif-ically, an episodic factor such as disconfirmation had a greater influenceon CS for the low-loyalty group than for the high-loyalty group. The influ-ence of CS on adjusted expectations was found to be equal across groups.However, the impact of adjusted expectations on RPI was greater fornonloyals than for loyals. These results imply that the transient route ofinformation processing as to the current consumption experience has agreater impact for nonloyals than for loyals. Regarding the direct impactof CS on RPI, loyal customers used CS in deciding to repatronize, whereasnonloyals did not. Loyal customers seem to maintain coherent attitudi-nal and behavioral tendency toward a preferred brand over time. This ten-dency is supported by the finding that CS at time t influences RPI attime t 1 (Mittal, Kumar, & Tsiros, 1999).
The results imply that nonloyals are more influenced by episodic factorsand that nonloyals consider the current transactional experience as animportant factor in forming future intention. On the other hand, loyals areless affected by transactional experience. In updating expectations based oncurrent satisfaction, loyals and nonloyals do not seem to differ. However, loy-als are less sensitive to adjusted expectations in determining RPI; rather,they use satisfaction directly in building repurchase intention.
One implication of such results is that the nature of satisfaction issomewhat different between the two groups. For nonloyals, satisfaction isformed mostly based on the current transaction so that it has intrinsicinstability and fragility. For loyals, however, satisfaction seems to have twoaspects; one aspect is related to the current transaction, and the other isrelated to accumulated experiences.The latter aspect of CS can be thoughtto provide stability and robustness in the CS–RPI link for loyal customers,because loyals tend to consider disconfirmation less than nonloyals.
CUSTOMER SATISFACTION AND REPURCHASE INTENTION 367
Why should a company increase its loyal customer base? It is becauseloyal customers are advocates for the company; that is, they have morefavorable attitude and higher intention to repatronize. Even when episodicdisconfirmation occurs, loyal customers seem to be relatively less affectedin judging their satisfaction. Furthermore, loyal customers tend to insiston repatronizing, whereas nonloyals may change their beliefs even aftera single transaction. In other words, loyal customers use the chronicroute as well as the transient route in forming future intention. Non-loyals, however, use only the transient route. These distinct characteristicsbetween high-loyalty customers and low-loyalty customers may accountfor the difference in a firm’s revenue in the long run.
Given that adjusted expectations play a dominant role in formingrepurchase intentions for nonloyals, it would be important for managersto pay their attention to adjusted expectations. They should design mar-keting programs that can improve adjusted expectations among non-loyals. In this regard, it would be beneficial for managers to understandwhat affects adjusted expectations.
There are several limitations of the present study and areas for futureresearch. As there is little prior research on adjusted expectations, itsconceptualization needs more clarification. Five items were used tomeasure adjusted expectations. As adjusted expectations imply a processof change over time, an attempt was made to capture the amount ofchange in expectations after consumption. The fifth measure was adoptedfor this purpose, but one might argue that it was qualitatively differentfrom the other measures.
It was expected that CS especially for the high-loyalty group couldreflect cumulative satisfying consumption experiences. Then, the CS–RPIrelationship could be stronger for loyals than for nonloyals. However,cumulative CS was not measured in the analysis. In fact, the constructof cumulative CS needs more refinement in terms of conceptualizationand measurement.
One may consider the role of perceived service quality in futureresearch. Service quality is a more specific judgment and a componentof CS, whereas CS is a broader evaluation (Iacobucci, Ostrum, & Grayson,1995; Oliver, 1993). In the service context, service quality has often beenexamined as an antecedent of repurchase intention (Bitner, 1990; Bolton& Drew, 1991; Cronin & Taylor, 1992). Cronin and Taylor (1992) investi-gated the relationships among customer satisfaction, service quality, andrepurchase intention. They showed that service quality was an antecedentof satisfaction, and satisfaction had a significant effect on repurchaseintention, whereas service quality had less effect on repurchase intention.It might be useful to investigate the roles of customer satisfaction andservice quality simultaneously.
Loyalty was not used as a mediator or a predictor of future behaviorin the proposed model of CS and RPI relationship. However, because
YI AND LA368
past behavior can be considered as a predictor of future behavior, onemight view loyalty as a mediator of RPI in future research.
In addition, it will be interesting to investigate nonloyals’ processingof consumption experience in depth (Coulter & Ligas, 2000; Rowley &Dawes, 2000). Rowley and Dawes (2000) provide an interesting catego-rization of nonloyals based on behavioral and attitudinal dimensions. Intheir study, each dimension was either inertial or negative. When atti-tude and behavior are both inertial, customers are categorized into “dis-engaged loyals.” They have never been the firm’s customers, and they arerelatively uninterested in the firm. Customers with negative attitude butinertial behavior are called “disturbed loyals” who are currently thefirm’s customers but temporarily have negative attitudes because ofproduct/service failure. So they are vulnerable to competitors’ promotion.Customers showing inertial attitude but negative behavior are “disen-chanted loyals,” who were the firm’s customers before but currently areless loyal due to repeated service failure, positive experience with com-petitors, or changed needs that can no longer be fulfilled by the firm’sofferings. The worst category, having negative attitude and behavior,are “disruptive loyals.” They were once the firm’s customers but becameterrorists or betrayers. Such customers might have had very negativeexperiences, or they have been left unrecovered from cumulated servicefailures for a long time. It may be interesting to adopt such categoriza-tion and investigate the characteristics across types of nonloyals. Suchresearch will provide a deeper understanding of how various types of non-loyals respond to consumption experiences. It can also provide usefulinsights for designing service recovery programs or customer revital-ization programs.
REFERENCES
Ajzen, I., & Fishbein, M. (1980). Understanding attitudes and predicting socialbehavior. Englewood Cliffs, NJ: Prentice-Hall.
Anderson, C. A. (1983). Imagination and expectation: The effect of imaging behav-ioral scripts on personal intentions. Journal of Personality and Social Psy-chology, 45, 293–305.
Anderson, E. W., & Sullivan, M. W. (1993). The antecedents and consequencesof customer satisfaction for firms. Marketing Science, 12, 125–143.
Anderson, N. H. (1981). Foundation of information integration theory. New York:Academic Press.
Anderson, R. E., & Srinivasan, S. S. (2003). E-satisfaction and e-loyalty: A con-tingency framework. Psychology & Marketing, 20, 123–138.
Bagozzi, R. P., & Yi, Y. (1988). On the evaluation of structural equation models.Journal of the Academy of Marketing Science, 16, 74–94.
Bendapudi, N., & Berry, L. L. (1997). Customers’ motivations for maintaining rela-tionships with service providers. Journal of Retailing, 73, 15–37.
CUSTOMER SATISFACTION AND REPURCHASE INTENTION 369
Bitner, M. J. (1990). Evaluating service encounters: The effects of physical sur-roundings and employee responses. Journal of Marketing, 54, 69–82.
Bolton, R. N., & Drew, J. H. (1991). A multistage model of customers’ assess-ments of service quality and value. Journal of Consumer Research, 17,375–384.
Boulding, W., Kalra, A., Staelin, R., & Zeithaml, V. A. (1993). A dynamic processmodel of service quality: From expectations to behavioral intentions. Jour-nal of Marketing Research, 30, 7–27.
Brinberg, D. (1979). An examination of the determinants of intention and behav-ior: A comparison of two models. Journal of Applied Social Psychology, 9,560–575.
Carpenter, G. S., & Lehmann, D. R. (1985). A model of marketing mix, brandswitching, and competition. Journal of Marketing Research, 22, 318–329.
Colombo, R. A., Morrison, D. G., & Green, J. D. (1989). A brand switching modelwith implications for marketing strategies: Relaxing the loyalty condition inthe Colombo/Morrison model; Commentary; Reply. Marketing Science, 8,89–106.
Coulter, R. A., & Ligas, M. (2000). The long good-bye: The dissolution of cus-tomer-service provider relationships. Psychology & Marketing, 17, 669–695.
Cronin, J. J., & Taylor, S. A. (1992). Measuring service quality: A reexaminationand extension. Journal of Marketing, 56, 55–68.
Dekimpe, M. G., Steenkamp, J.E.M., Mellens, M., & Vanden, A. P. (1997). Declineand variability in brand loyalty. International Journal of Research in Mar-keting, 14. 405–420.
Devlin, J. F., Gwynne, A. L., & Ennew, C. T. (2002). The antecedents of serviceexpectations. Service Industries Journal, 22, 117–136.
Dick, A. S., & Basu, K. (1994). Customer loyalty: Toward an integrated concep-tual framework. Journal of the Academy of Marketing Science, 22, 99–113.
Festinger, L. (1957). A theory of cognitive dissonance. Stanford, CA: StanfordUniversity Press.
Fishbein, M., & Ajzen, I. (1975). Belief, attitude, intention and behavior: Anintroduction to theory and research. Reading, MA: Addison-Wesley.
Folkes, V. S. (1984). Consumer reactions to product failure: An attributionalapproach. Journal of Consumer Research, 10, 398–409.
Fornell, C. (1992). A national customer satisfaction barometer: The Swedishexperiences. Journal of Marketing, 56, 6–21.
Fournier, S. (1998). Consumers and their brands: Developing relationship the-ory in consumer research. Journal of Consumer Research, 24, 343–373.
Garbarino, E., & Johnson, M. S. (1999). The different roles of satisfaction, trust,and commitment in customer relationship. Journal of Marketing, 63, 70–87.
Gundlach, G. T., Achrol, R. S., & Mentzer, J. T. (1995). The structure of commit-ment in exchange. Journal of Marketing, 59, 78–92.
Hallowell, R. (1996). The relationship of customer satisfaction, customer loy-alty and profitability: An empirical study. International Journal of ServiceIndustries Management, 7, 27–42.
Harmon-Jones, A., & Mills, J. (1999). Cognitive dissonance: Progress on a piv-otal theory in social psychology. Washington, DC: American PsychologicalAssociation.
Hennig-Thurau, T., & Klee, A. (1997). The impact of customer satisfaction andrelationship quality on customer retention: A critical reassessment and modeldevelopment. Psychology & Marketing, 14, 737–764.
YI AND LA370
Herr, P. M., Kardes, F. R., & Kim, J. (1991). Effects of word-of-mouth and prod-uct attribute information on persuasion: An accessibility-diagnosticity per-spective. Journal of Consumer Research, 17, 454–462.
Hoch, S. J., & Deighton, J. (1989). Managing what consumers learn from expe-rience. Journal of Marketing, 53, 1–20.
Homburg, C., & Giering, A. (2001). Personal characteristics as moderators ofthe relationship between customer satisfaction and loyalty—An empiricalanalysis. Psychology & Marketing, 18, 43–66.
Iacobucci, D., Ostrom, A., & Grayson, K. (1995). Distinguishing service qualityand customer satisfaction: The voice of the consumer. Journal of Consumer Psy-chology, 4, 277–303.
Jaccard, J., & Davidson, A. R. (1975). A comparison of two models of social behav-ior: Results of a survey sample. Sociometry, 38, 497–517.
Jaccard, J., & King, G. (1977). A probabilistic model of the relationship betweenbeliefs and behavioral intentions. Human Communication Research, 3,332–342.
Johnson, M. D., Anderson, E., & Fornell, C. (1995). Rational and adaptive per-formance expectations in a customer satisfaction framework. Journal of Con-sumer Research, 21, 695–707.
Johnson, M. D., & Plott, C. R. (1989). The effect of two trading institutions on priceexpectations and stability of supply-response lag market. Journal of EconomicPsychology, 10, 189–216.
Jones, T. O., & Sasser, W. E., Jr. (1995). Why satisfied customers defect. HarvardBusiness Review, 73, 88–99.
Kalwani, M. U., Yim, C. K., Rinne, H. J., & Sugita, Y. (1990). A price expectationsmodel of customer brand choice. Journal of Marketing Research, 27, 251–262.
Kopalle, P. K., & Lehmann, D. R. (2001). Strategic management of expectations:The role of disconfirmation sensitivity and perfectionism. Journal of Mar-keting Research, 38, 386–394.
Krishnamurti, L., & Raj, S. P. (1991). An empirical analysis of the relationshipbetween brand loyalty and customer price elasticity. Marketing Science, 10,172–183.
Mittal, V., & Kamakura, W. A. (2001). Satisfaction, repurchase intent, and repur-chase behavior: Investigating the moderating effect of customer characteris-tics. Journal of Marketing Research, 38, 131–142.
Mittal, V., & Katrichis, J. M. (2000, Spring). New and loyal customers. Market-ing Research, 27–32.
Mittal, V., Kumar, P., & Tsiros, M. (1999). Attribute-level performance, satisfac-tion, and behavioral intentions over time: A consumption-system approach.Journal of Marketing, 63, 88–101.
Moorman, C., Zaltman, G., & Deshpandé, R. (1992). Relationships betweenproviders and users of market research: The dynamics of trust within andbetween organizations. Journal of Marketing Research, 29, 314–329.
Morgan, R. M., & Hunt S. D. (1994). The commitment-trust theory of relation-ship marketing. Journal of Marketing, 58, 20–38.
Narayandas, N. (1996).The link between customer satisfaction and customer loy-alty: An empirical investigation. Working paper, Harvard Business School.
Neal, W. D. (1999, Spring). Satisfaction is nice, but value drives loyalty. Mar-keting Research, 21–23.
Newman, J. W., Werbel, R. A. (1973). Multivariate analysis of brand loyalty formajor household appliances. Journal of Marketing Research, 10, 404–409.
CUSTOMER SATISFACTION AND REPURCHASE INTENTION 371
Oliver, R. L. (1980). A cognitive model of the antecedents and consequences ofsatisfaction decisions. Journal of Marketing Research, 17, 46–49.
Oliver, R. L. (1993). A conceptual model of service quality and service satisfac-tion: Compatible goals, different concepts. In T. A. Swartz, D. E. Bowen, & S.W. Brown (Eds.), Advances in services marketing and management: Researchand practice, 2. Greenwich, CT: JAI Press.
Oliver, R. L. (1997). Satisfaction: A behavioral perspective on the consumer. NewYork: McGraw-Hill.
Oliver, R. L. (1999). Whence consumer loyalty? Journal of Marketing, 63, 33–44.Oliver, R. L., & DeSarbo, W. S. (1988). Response determinants in satisfaction
judgment. Journal of Consumer Research, 41, 495–507.Oliver, R. L., & Winer, R. S. (1987). A framework for the formation and structure
of consumer expectations: Review and propositions. Journal of Economic Psy-chology, 8, 469–499.
Parasuraman, A., Zeithaml, V. A., & Berry, L. L. (1988). SERVQUAL: A multi-ple item scale for measuring consumer perceptions of service quality. Journalof Retailing, 64, 12–40.
Park, C. W., Mothersbaugh, D. L., & Feick, L. (1994). Consumer knowledge assess-ment. Journal of Consumer Research, 21, 71–82.
Pedersen, P. E., & Nysveen, H. (2001). Shopbot banking: An exploratory studyof customer loyalty effects. International Journal of Bank Marketing, 19,146–155.
Raju, J. S., Srinivasan, V., & Lal, R. (1990). The effect of brand loyalty on com-petitive price promotional strategies. Management Science, 36, 276–304.
Ratchford, B. T. (1999). The economics of consumer knowledge. Working paper,Marketing Department, SUNY Buffalo.
Reichheld, F. F. (1993, March/April). Loyalty-based management. Harvard Busi-ness Review, 64–73.
Reichheld, F. F., & Teal, T. (1996). The loyalty effect. Boston, MA: Harvard Busi-ness School Press.
Reinartz, W. J., & Kumar, V. (2000). On the profitability of long-life customersin a noncontractual setting: An empirical investigation and implications formarketing. Journal of Marketing, 64, 17–35.
Rousseau, D., Sitkin, S. B., Burt, R., & Camerer, C. (1998). Not so different afterall: A cross-discipline view of trust. The Academy of Management Review, 23,255–271.
Rowley, J., & Dawes, J. (2000). Disloyalty: A closer look at non-loyals. Journal ofConsumer Marketing, 17, 538–549.
Rust, R. T., & Oliver, R. L. (1994). Service quality: Insights and managerial impli-cations from the frontier. In R.T. Rust & R. L. Oliver (Eds.), Service quality: Newdirections in theory and practice (pp. 1–19). Thousand Oaks, CA: Sage.
Rust, R. T., & Oliver, R. L. (2000). Should we delight the customer? Journal ofthe Academy of Marketing Science, 28, 86–94.
Rust, R. T., & Zahorik, A. J. (1993). Customer satisfaction, customer retention,and market share. Journal of Retailing, 69, 193–215.
Sharp, B., & Sharp, A. (1997). Loyalty programs and their impact on repeat-purchase loyalty patterns. International Journal of Research in Marketing,14, 473–486.
Singh, J., & Sirdeshmukh, D. (2000). Agency and trust mechanisms in consumersatisfaction and loyalty judgment. Journal of the Academy of Marketing Sci-ence, 28, 150–167.
YI AND LA372
Söderlund, M. (2002). Customer familiarity and its effects on satisfaction andbehavioral intentions. Psychology & Marketing, 19, 861–879
Steenkamp, J. E. M., & Baumgartner, H. (1998). Assessing measurement invari-ance in cross-national consumer research. Journal of Consumer Research,25, 78–90.
Stewart, T. A. (1997, July 21). A satisfied customer isn’t enough. Fortune, 136,pp. 112–113.
Szajna, B., & Scamell, R. W. (1993). The effects of information system user expec-tations on their performance and perceptions. MIS Quarterly, 17, 493–516.
Szymanski, D. M., & Henard, D. H. (2001). Customer satisfaction: A meta-analy-sis of the empirical evidence. Journal of the Academy of Marketing Science,29, 16–35.
Taylor, S. A., & Baker, T. L. (1994). An antecedent of the relationship between serv-ice quality and customer satisfaction in the formation of consumers’ purchaseintentions. Journal of Retailing, 70, 163–178.
Tellis, G. J. (1988). Advertising exposure, loyalty, and brand purchase: A two-stage model of choice. Journal of Marketing Research, 25, 134–144.
Tversky, A., & Kahneman, D. (1974). Judgment under uncertainty: Heuristicsand biases. Science, 185, 1124–1131.
Warshaw, P. R., & Davis, F. D. (1985). Disentangling behavioral intention andbehavioral expectation. Journal of Experimental Social Psychology, 21,213–228.
Yi, Y. (1990). A critical review of consumer satisfaction. Review of Marketing,68–123.
Yi, Y. (1993). The antecedents of consumer satisfaction: The moderating role ofambiguity. In L. McAlister & M. Rothschild (Eds.), Advances in consumerresearch (Vol. 20, pp. 502–506). Provo, UT: Association for Consumer Research
Yi, Y., & Jeon, H. (2003). Effects of loyalty programs on value perception, pro-gram loyalty, and brand loyalty. Journal of the Academy of Marketing Sci-ence, 31, 229–240.
Yoo, B. (2002). Cross-group comparisons: A cautionary note. Psychology & Mar-keting, 19, 357–368.
Zeithaml, V. A., Berry, L. L., & Parasuraman, A. (1993). The nature and deter-minants of customer expectation of service. Journal of Academy of MarketingScience, 21, 1–12.
Zeithaml, V. A., Berry, L. L., & Parasuraman, A. (1996). The behavioral conse-quences of service quality. Journal of Marketing, 60, 31–46.
This research was supported by the Institute of Management Research, SeoulNational University.
Correspondence regarding this article should be sent to: Youjae Yi, College ofBusiness Administration, Seoul National University, Kwanak-Ku Shinlim-Dong56-1, Seoul, Korea ([email protected]).
CUSTOMER SATISFACTION AND REPURCHASE INTENTION 373