Embed Size (px)
Citation preview
What You Can Find Out By
Hitting Things
And a bunch of other stuff I’ve been doing lately that may or may not be interesting
Don Noon
Oberlin Acoustics 2011
Since wood properties are very important to how a violin sounds, it makes sense to know the properties of the wood before you start… and at other stages in the making process
Since (as most violinmakers) I don’t have the money for fancy instrumentation and the time spent taking measurements is time not spent making violins, it makes sense to do it as fast and cheaply as possible
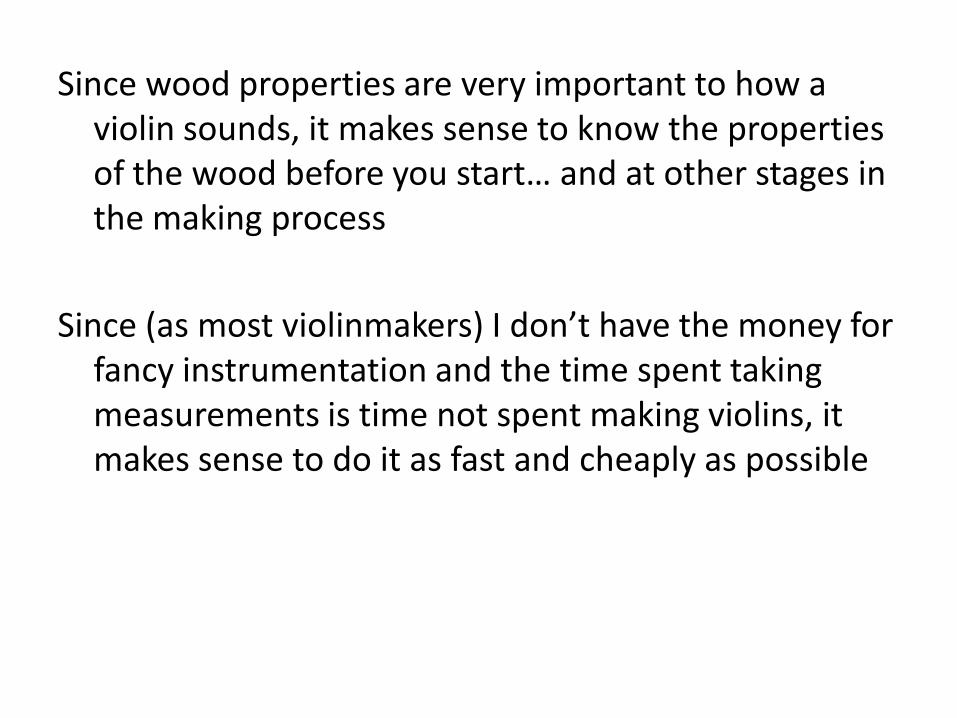
Equipment to measure speed of sound in a slab of wood:
Computer (+Audacity)
Tape measure
“Hammer”
~3g mass + handle
Microphone
Optional foam
Wood
Length >> width
Relatively parallel ends
Not too thin at edge
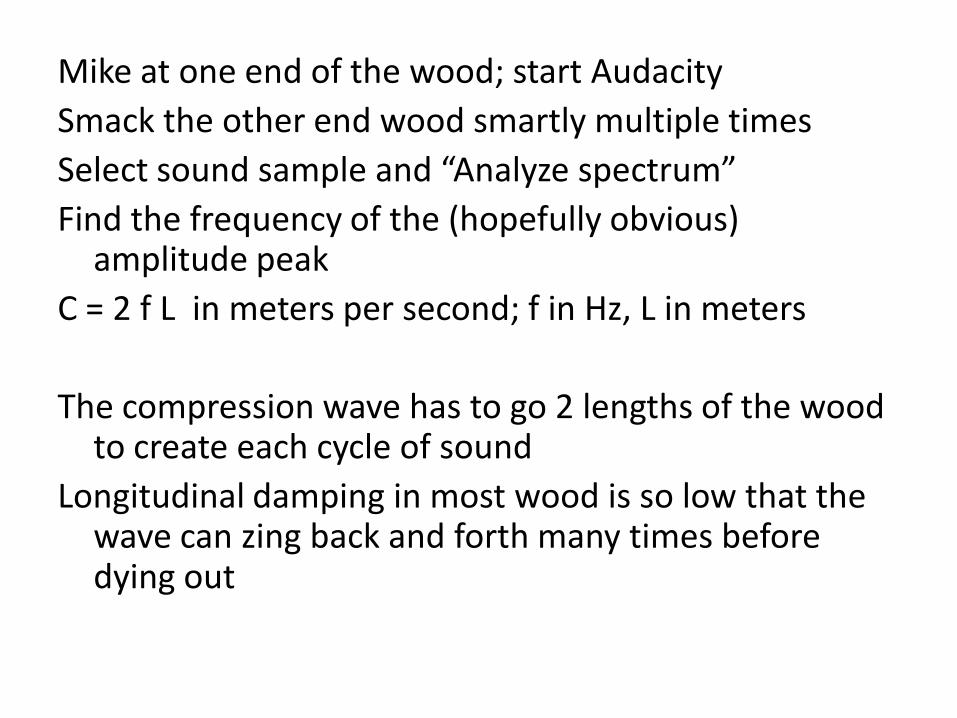
Mike at one end of the wood; start Audacity
Smack the other end wood smartly multiple times
Select sound sample and “Analyze spectrum”
Find the frequency of the (hopefully obvious) amplitude peak
C = 2 f L in meters per second; f in Hz, L in meters
The compression wave has to go 2 lengths of the wood to create each cycle of sound
Longitudinal damping in most wood is so low that the wave can zing back and forth many times before dying out
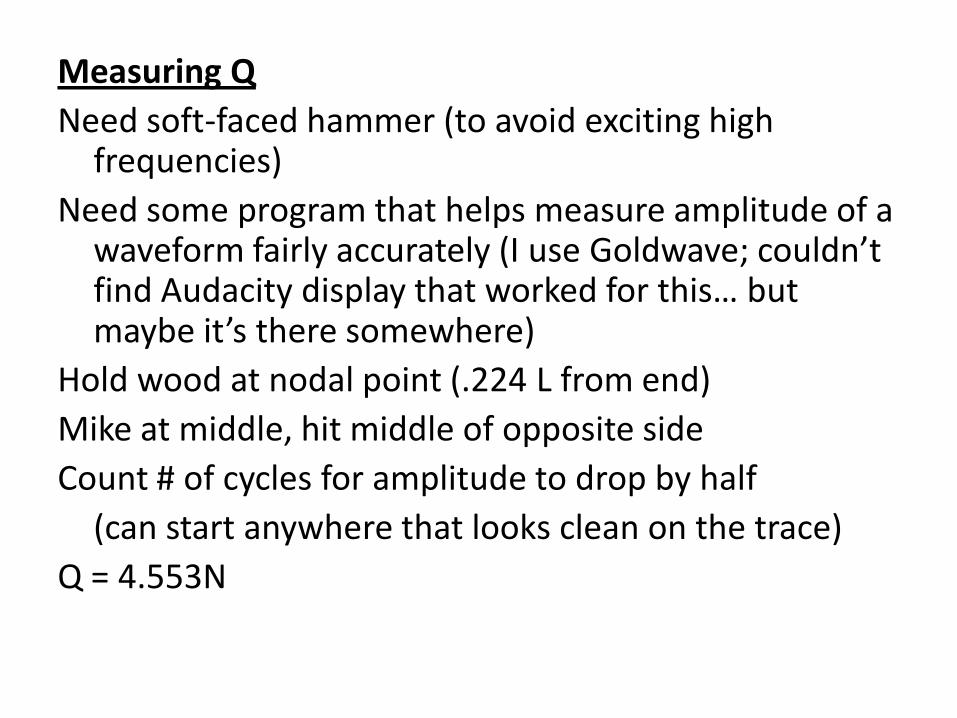
Measuring Q
Need soft-faced hammer (to avoid exciting high frequencies)
Need some program that helps measure amplitude of a waveform fairly accurately (I use Goldwave; couldn’t find Audacity display that worked for this… but maybe it’s there somewhere)
Hold wood at nodal point (.224 L from end)
Mike at middle, hit middle of opposite side
Count # of cycles for amplitude to drop by half
(can start anywhere that looks clean on the trace)
Q = 4.553N
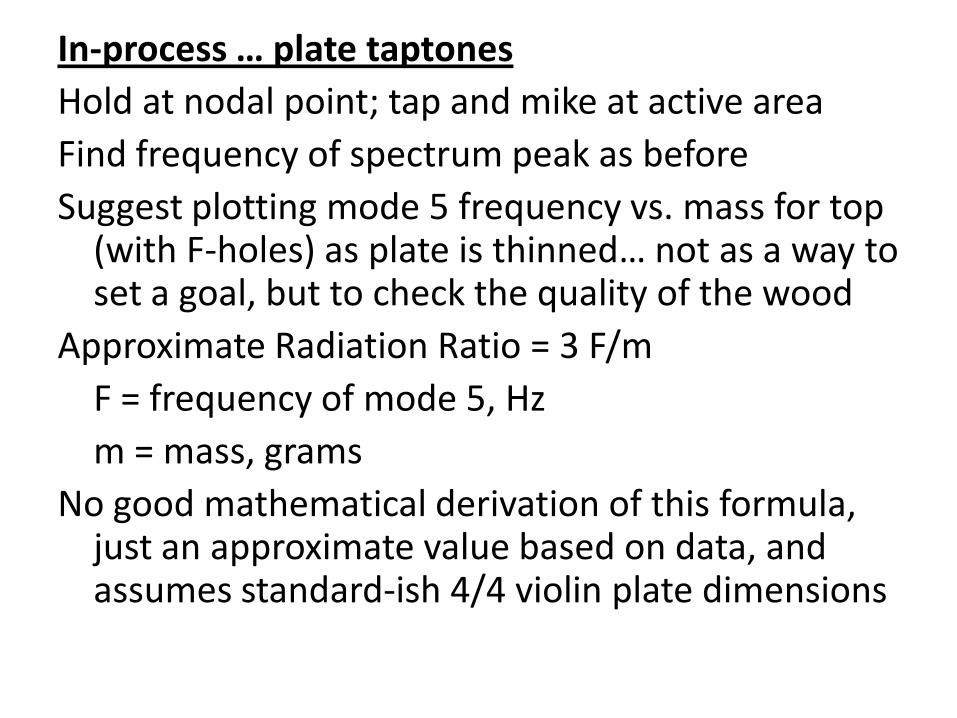
In-process … plate taptones
Hold at nodal point; tap and mike at active area
Find frequency of spectrum peak as before
Suggest plotting mode 5 frequency vs. mass for top (with F-holes) as plate is thinned… not as a way to set a goal, but to check the quality of the wood
Approximate Radiation Ratio = 3 F/m
F = frequency of mode 5, Hz
m = mass, grams
No good mathematical derivation of this formula, just an approximate value based on data, and assumes standard-ish 4/4 violin plate dimensions
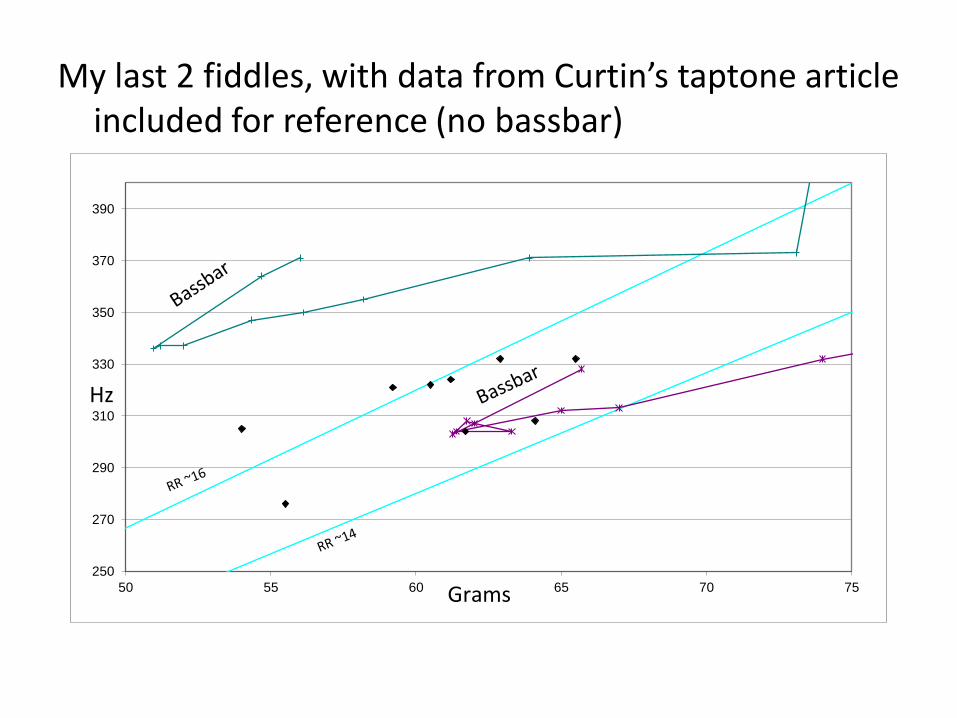
My last 2 fiddles, with data from Curtin’s taptone article included for reference (no bassbar)
250
270
290
310
330
350
370
390
50 55 60 65 70 75 Grams
Hz
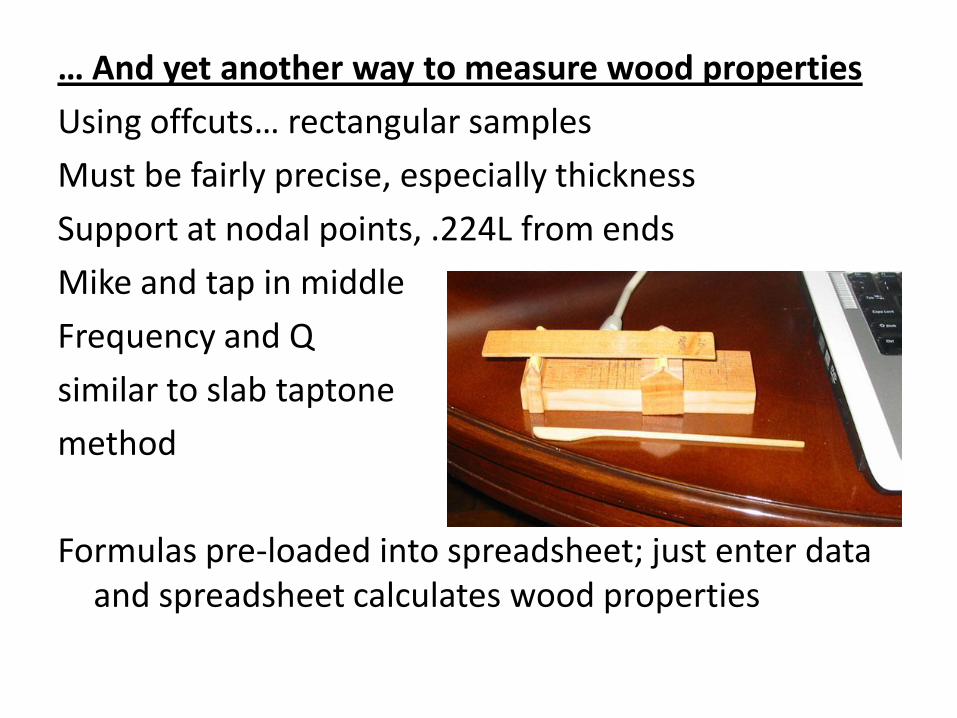
… And yet another way to measure wood properties
Using offcuts… rectangular samples
Must be fairly precise, especially thickness
Support at nodal points, .224L from ends
Mike and tap in middle
Frequency and Q
similar to slab taptone
method
Formulas pre-loaded into spreadsheet; just enter data and spreadsheet calculates wood properties
Just a few notes before starting the next topic…
Humidity will have a definite effect on wood properties …probably should note that information with each measurement
Q can vary significantly with frequency as well as humidity
Very thick and/or short samples might be affected by shear and rotational inertia; L/t = 10 should be OK
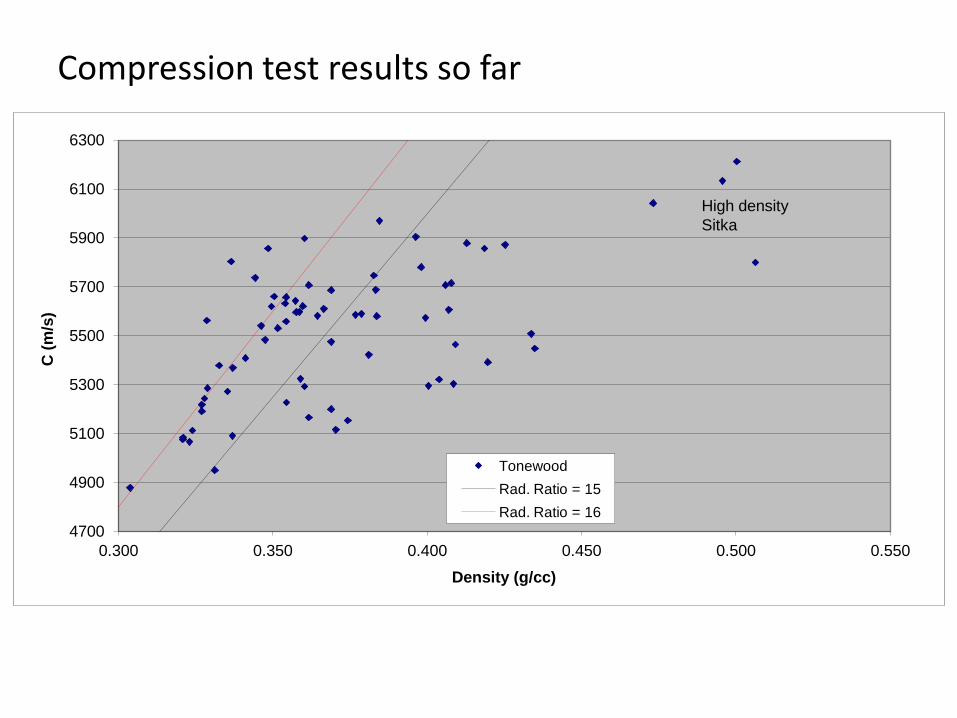
Compression test results so far
4700
4900
5100
5300
5500
5700
5900
6100
6300
0.300 0.350 0.400 0.450 0.500 0.550
C (
m/s
)
Density (g/cc)
Tonewood
Rad. Ratio = 15
Rad. Ratio = 16
High density
Sitka
Impact Spectrum of the Assembled Instrument
Brief theory:
Infinitely short impulse to bridge will contain equal energy across the frequency range, thereby exciting all vibration modes in a uniform way
The resulting sound from the impulse is a fairly good representation of the frequency response
Instrumented hammers are used to correct the effects of the imperfect impact
A lighter hammer, higher speed impact, should give closer to the ideal impulse… “good enough” results?
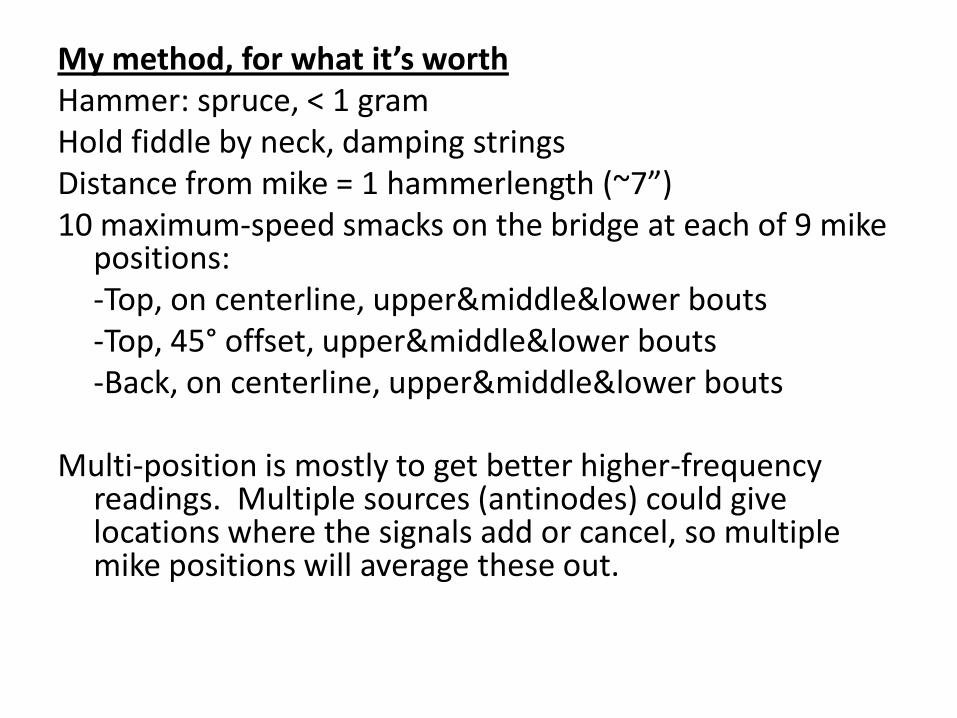
My method, for what it’s worth Hammer: spruce, < 1 gram Hold fiddle by neck, damping strings Distance from mike = 1 hammerlength (~7”) 10 maximum-speed smacks on the bridge at each of 9 mike
positions: -Top, on centerline, upper&middle&lower bouts -Top, 45° offset, upper&middle&lower bouts -Back, on centerline, upper&middle&lower bouts Multi-position is mostly to get better higher-frequency
readings. Multiple sources (antinodes) could give locations where the signals add or cancel, so multiple mike positions will average these out.
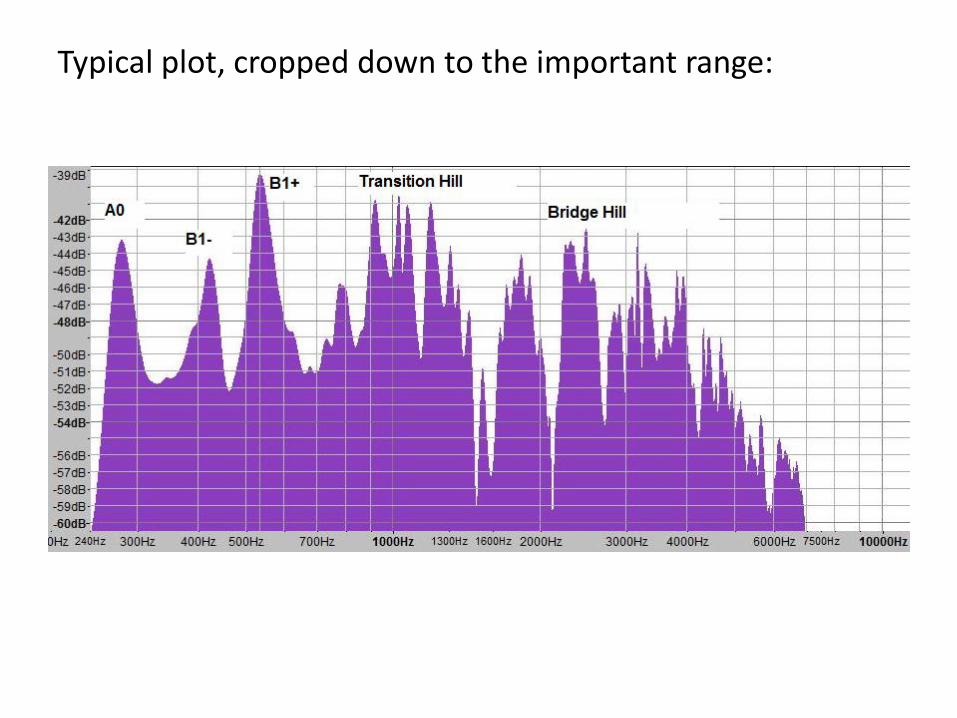
Typical plot, cropped down to the important range:
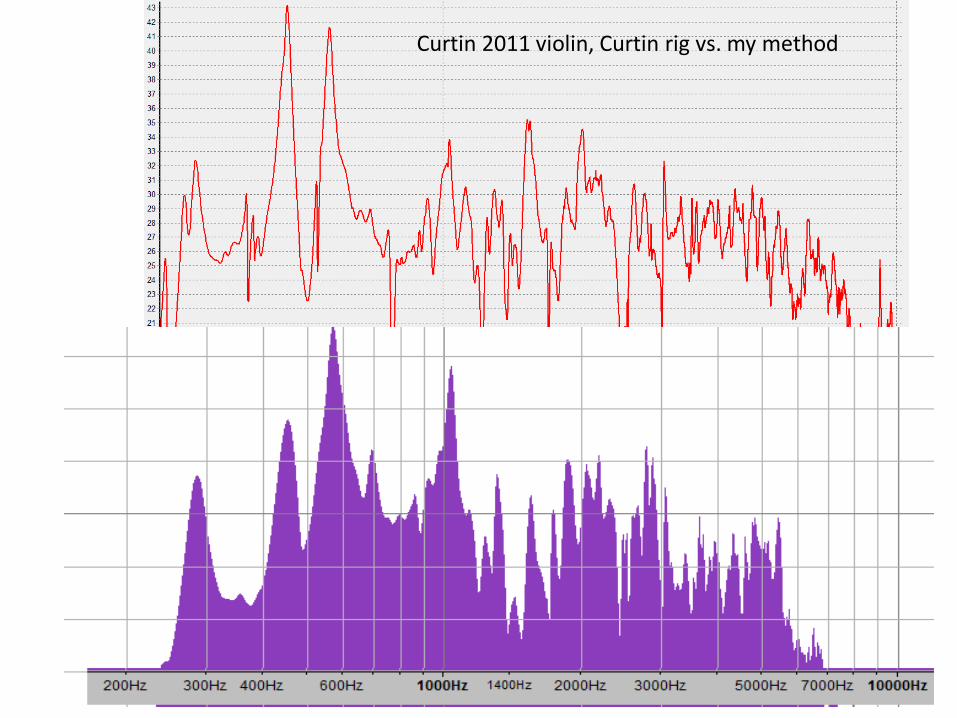
Curtin 2011 violin, Curtin rig vs. my method
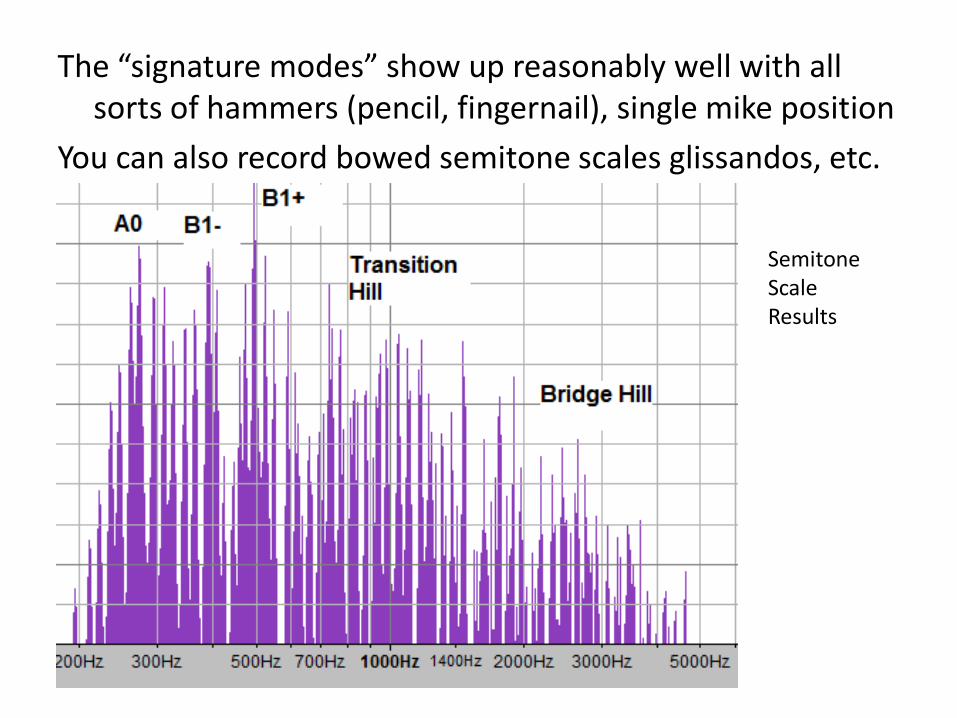
The “signature modes” show up reasonably well with all sorts of hammers (pencil, fingernail), single mike position
You can also record bowed semitone scales glissandos, etc.
Semitone Scale Results
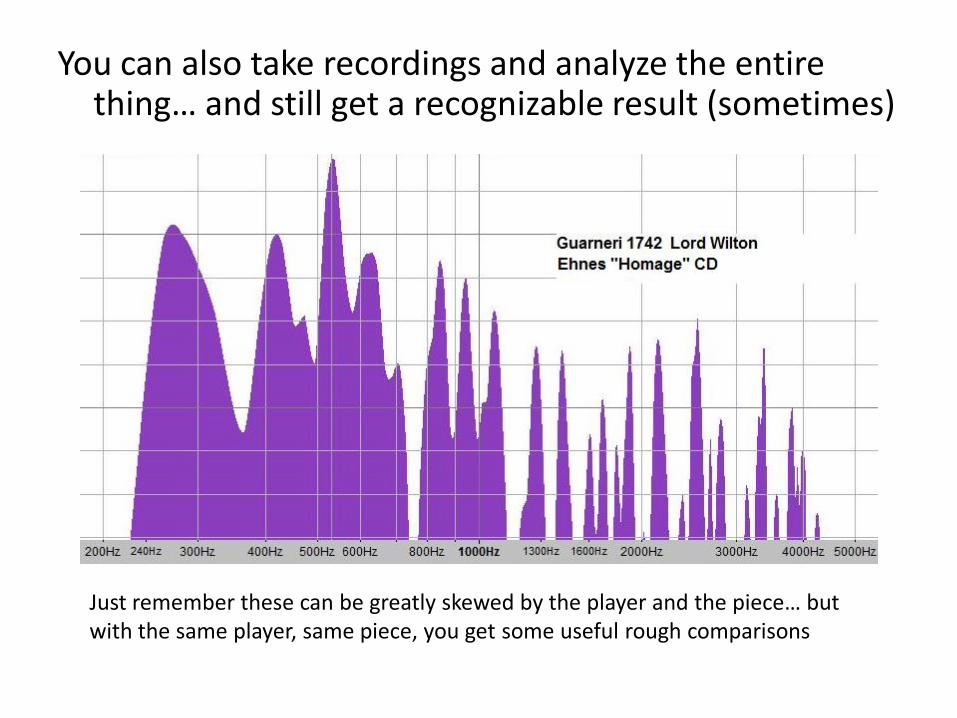
You can also take recordings and analyze the entire thing… and still get a recognizable result (sometimes)
Just remember these can be greatly skewed by the player and the piece… but with the same player, same piece, you get some useful rough comparisons
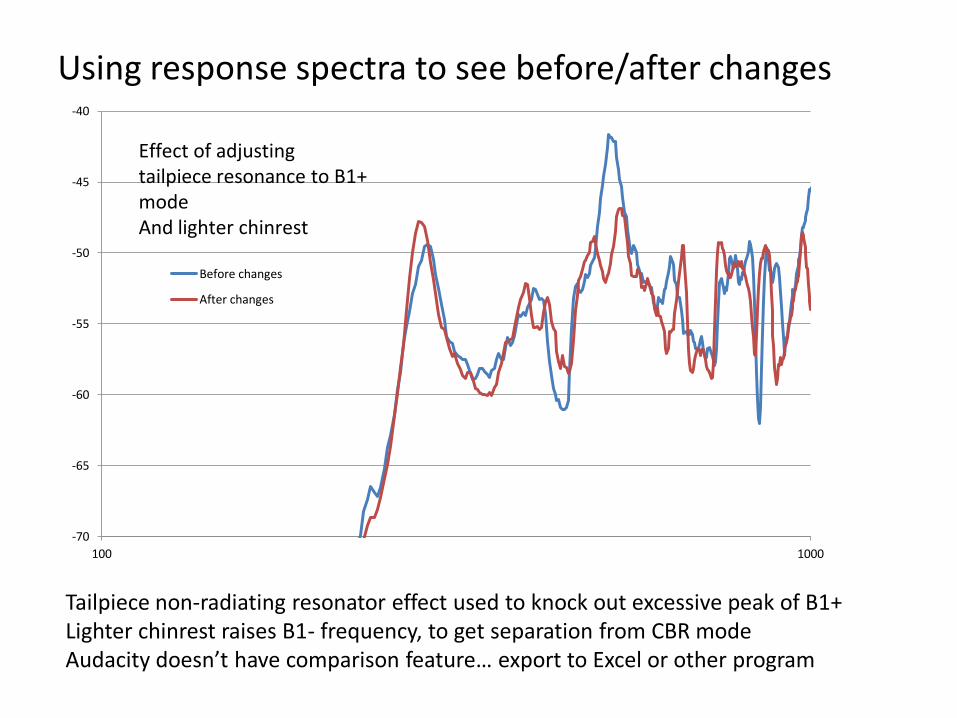
Using response spectra to see before/after changes
-70
-65
-60
-55
-50
-45
-40
100 1000
Before changes
After changes
Effect of adjusting tailpiece resonance to B1+ mode And lighter chinrest
Tailpiece non-radiating resonator effect used to knock out excessive peak of B1+ Lighter chinrest raises B1- frequency, to get separation from CBR mode Audacity doesn’t have comparison feature… export to Excel or other program
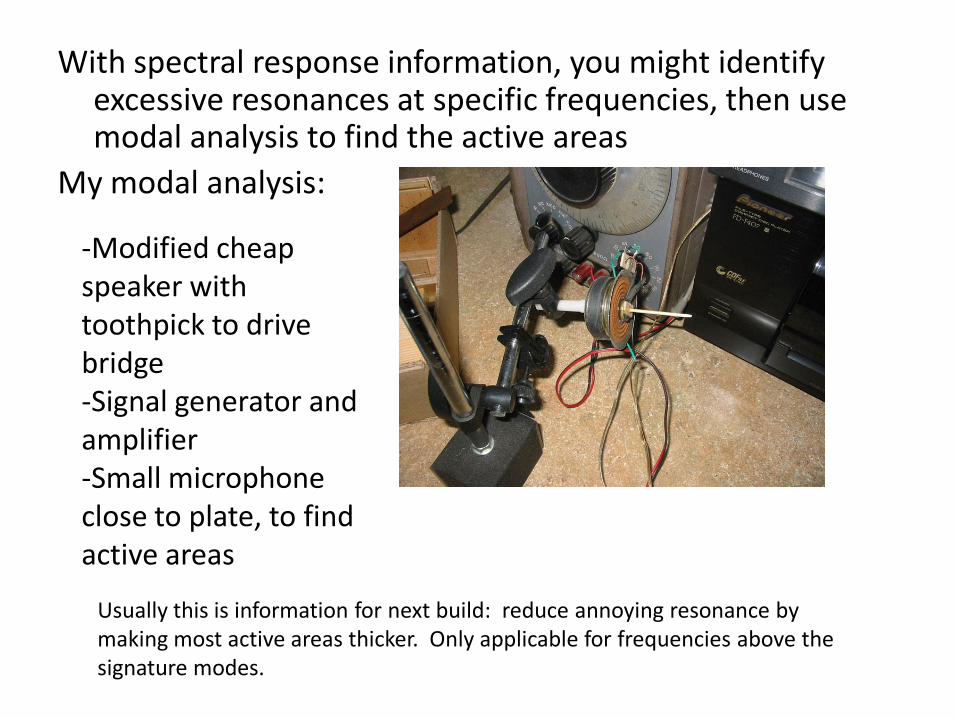
With spectral response information, you might identify excessive resonances at specific frequencies, then use modal analysis to find the active areas
My modal analysis:
-Modified cheap speaker with toothpick to drive bridge -Signal generator and amplifier -Small microphone close to plate, to find active areas
Usually this is information for next build: reduce annoying resonance by making most active areas thicker. Only applicable for frequencies above the signature modes.