Embed Size (px)
Citation preview
1
When State Responses Fail: Religion and Secessionism in India 1952-2002
ON-LINE APPENDIX
In this Appendix we first provide additional information to that provided in the paper on
the data and variables. Next, we discuss the Cox proportional hazard model of which the
estimates are reported in the paper, as well as the results from alternative specifications and
several robustness checks. The section that follows includes a more in-depth discussion of the
manuscript’s dynamic panel-data model. We then discuss briefly the potential impact that the
size of a religious minority at the state level may have on religious mobilization and resilience of
territorial demands. In the final section, we discuss two alternative models that use the type of
demand and the type of conflict, rather than the territorial actors, as the unit of analysis, and
show that our findings about the resilience of religiously-framed territorial demands are not
driven by the level of fragmentation of political actors in subnational conflicts.
Additional Information on Data and Variables
Regional political actors
To qualify for inclusion in the dataset, a party or group has to be present in one Indian
state or part thereof, or in several states but representing a self-defined cultural, linguistic,
territorial, or tribal unit, sometime during the period 1952-2002. This gives a total of 363 regional
political parties or groups, and excludes the regional breakaway factions of the Congress Party
and the Janata Dal, about twenty in total, which result from personal clashes within the
leadership of these larger parties rather than express regional grievances (moreover, these splinter
actors do not pose territorial demands). For 310 of the 363 regional parties and groups full
information is available on their exact period of existence. Of these, 181 have posed territorial
demands at some point during their life span. Territorial demands can be of different intensity:
2
the most intense involve secession, i.e. the creation of a new sovereign polity out of the territory
of the pre-existing state. Less intense territorial demands may refer instead to increased forms of
autonomy for specific regions within the existing polity. In the Indian case, this has generally
meant demanding the creation of a new federated state within the Indian Union, carved out of
the boundaries of existing ones—a quite demanding request both politically and bureaucratically.
These 181 actors constitute the units of our analysis.
Of the 363 regional political actors, full information on the period of existence is not
available for 18 of the 114 religious actors, and for 35 of the 249 non-religious actors; a non-
significant difference (chi2 = .188, Pr = .664). Moreover, only 7 of the 53 actors for which full
information is lacking posed a territorial demand; of these 7, 4 are religious, 1 operated in
Gujarat, 3 in Jammu and Kashmir, and 3 in Manipur. If we assume that actors with missing data
are more similar to actors missing from the data altogether, this comparison of actors with and
without missing data suggests that there is little systematic bias in terms of religion or state as a
result of missing cases.
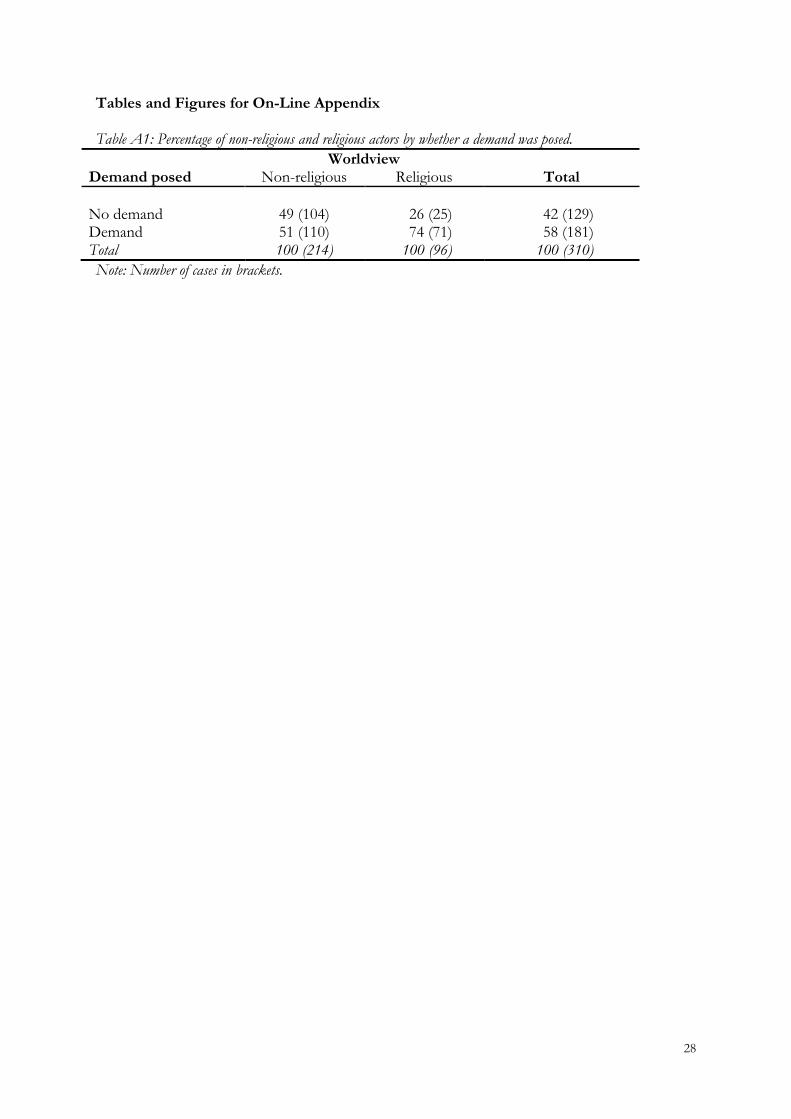
To provide the reader with some background information, Table A1 shows the
percentage of non-religious and religious actors by whether a territorial demand was posed.
Although religious actors more often pose territorial demands, it is important to note that our
population of interest is actors that pose demands; that is, we condition on the fact that actors have
a demand in the first place. Our aim is not to make inferences about regional political actors in
general; consequently our conclusions apply only to regional political actors that pose territorial
demands. In the last part of this Appendix we discuss two alternative models that use the type of
demand and the type of conflict, rather than the actors, as the unit of analysis.
The dataset also includes information on characteristics of the regional political parties
and groups, on policy and institutional responses by the Indian national governments over the
years affecting the groups and parties, and on structural characteristics related to the geographical
area in which the party or group operates.
3
Data sources on regional political actors and their territorial demands
1. Primary and internet sources, electoral reports
Basic information on regional political parties and their characteristics is taken from the
Election Commission of India website, available at <www.eci.gov.in>. For supplemental
electoral data from 1952-1985, see V.B. Singh and Shankar Bose, State Elections in India, Data
Handbook on Vidhan Sabha Elections. Vol 1-5. (New Delhi: Sage 1987). For supplemental electoral
data from 1952-1991, see David Butler, Ashok Lahiri, and Prannoy Roy, India Decides, 2nd ed.
(New Delhi: Living Media India, 1991). The information on regional political non-party groups and
their characteristics is taken from the South Asia Terrorism Portal, available at <www.satp.org>,
the Government of India, Ministry of Home Affairs website, available at <mha.nic.in>, as well
as from the secondary sources listed below. The same secondary sources provided the necessary
information on the temporal dynamics of the territorial demands of all political actors studied:
2. Secondary sources
Punjab
Ahmed Masood, Maqsood and Peter Stockdale, The Khalistan Riddle. Islamabad: Modern Book Depot, 1988;
Chander Arora, Subhash, Strategies to Combat Terrorism: A Study of Punjab. New Delhi: Har-Anand Publications, 1999;
Chima, Jugdep, The Sikh Separatist Insurgency in India: Political Leadership and Ethnonationalist Movements. New Delhi: Sage, 2010.
Dang, Satyapal, Genesis of Terrorism: An Analytical Study of Punjab Terrorists. New Delhi : Patriot, 1988;
Deol, Harnik, Religion and Nationalism in India: The Case of Punjab. London: Routledge, 2000;
Dhillon, Kirpal, Identity and Survival: Sikh Militancy in India (1978-1993). New Delhi: Penguin Books India, 2006;
Jain, Sharda, Politics of Terrorism in India: The Case of Punjab. New Delhi : Deep & Deep Publications, 1995;
Joshi, Manoj, Combating Terrorism in Punjab: Indian Democracy in Crisis. London : Research Institute for the Study of Conflict, 1993;
Kaushal, Rachana, Terrorism and Militancy: A Case Study of Political Development in Punjab. Delhi: Kalinga Publications, 1999;
Kumar, Ram Narayan, Terror in Punjab: Narratives, Knowledge, and Truth. Delhi : Shipra Publications, 2008;
Narayanan, V.N., Tryst with Terror: Punjab's Turbulent Decade. Delhi: Ajanta, 1996;
Rudra, Kalyan, Rise and Fall of Punjab Terrorism (1978-1993). Delhi : Bright Law House, 2005;
4
Singh Barapind, Buta, Rise and Fall of Khalistan Movement. Jalandhar : International Research Centre, 2007;
Singh, Gopal, Politics of Sikh Homeland, 1940-1990. Delhi: Ajanta Publications, 1994;
Singh, Gurharpal, Ethnic Conflict in India: A Case-Study of the Punjab. New York: Palgrave Macmillan, 2000;
Singh, Joginder, Myth and Reality of the Sikh Militancy in Punjab. New Delhi : Shree, 2006;
Singha, Satindara, Khalistan: An Academic Analysis. New Delhi, 1982;
Kashmir
Bloeria, Sudhir, Pakistan’s Insurgency vs India’s Security: Tackling Militancy in Kashmir. New Delhi: Manas Publications, 2000;
Bose, Sumantra, Kashmir: Roots of Conflict. Cambridge, Massachusetts: Harvard University Press, 2003.
Chandran, Suba, “India and Armed Non State Actors in the Kashmir Conflict.” In Waheguru Pal Singh Sidhu, Bushra Asif, and Cyrus Samii, eds., Kashmir. Boulder, Colorado: Lynne Rienner, 2006;
Ganguly, Sumit, “Explaining the Kashmir Insurgency: Political Mobilization and Institutional Decay.” International Security, 21, 2 (1996): 76-107.
Ganguly, Sumit, The Crisis in Kashmir: Portents of War, Hopes of Peace. New York: Woodrow Wilson Center Press and Cambridge University Press, 1997.
Khurshid, Salman, Beyond Terrorism: New Hope for Kashmir. New Delhi: UBS Publishers' Distributors, 1994;
Santhanam, K., Jihadis in Jammu and Kashmir: A Portrait Gallery. New Delhi: Sage, 2003;
Schofield, Victoria, Kashmir in Conflict: India, Pakistan and the Unending War. London: I. B. Tauris, 2003;
Schofield, Victoria, Kashmir in the Crossfire. London : I. B. Tauris, 1996;
Sharma, Rajeev, Pak Proxy War. New Delhi: Kaveri Books, 1999;
Thakur, Pradeeep, Militant Monologues: Echoes from the Kashmir Valley. New Delhi: Parity, 2003;
Northeastern states
Baruah, Sanjib, “The State and Separatist Militancy in Assam: Winning the Battle and Losing the War?” Asian Survey, 34, 10 (1994);
Baruah, Sanjib, Durable Disorders: Understanding the Politics of Northeast India. Delhi: Oxford University Press, 2005;
Bhattacharya, H.K., The Silent Invasion, New Delhi, Spectrum Publications 2001;
Chandra, Sudhir, “Understanding the Problem of Northeast India.” India Review, 6, 1 (2007);
Dasgupta, Jyotirindra, “Community, Authenticity and Autonomy: Insurgence and Institutional Development in India’s Northeast.” In Amrita Basu and Atul Kohli, Community Conflicts and the State in India. Delhi: Oxford University Press, 1998, pp. 183-214.
Dommen A.J., “Separatist Tendencies in Eastern India.” Asian Survey, 7, 10 (1967): 726-739;
Hazarika, Sanjay, Strangers in the Mist. New Delhi: Viking, 1994;
5
Lacina, Bethany, “Does Counterinsurgency Theory Apply in Northeast India?' 2007. India Review, 6, 3 (2007): 165-183.
Ray, Asok Kumar and B.J. Deb (eds.), Terrorism and Human Rights in North East India. New Delhi: Om Publications, 2007;
Saikia, Jaideep, Terror Sans Frontiers: Islamic Militancy in North East India. ACDIS Occasional Paper 1 (2003);
Sareen H.K., Insurgency in North East India. New Delhi: Sterling Publishers, 1980;
Sharma S.C., Insurgency or Ethnic Conflict. New Delhi: Magnum, 2000.
Upadhyay, Archana, India’s Fragile Borderlands: The Dynamics of Terrorism in North East India. London: I.B. Tauris, 2008;
Verghese B.G., India's Northeast Resurgent: Ethnicity, Insurgency, Governance, Development. New Delhi: Konark, 1997;
Zhimomi, Kuhoi, Politics and Militancy in Nagaland, New Delhi, Deep and Deep Publications, 2004
Tamil Nadu/South India
Chandran, Subramaniam “From Separatism to Coalition: Variants in Language Politics and Leadership Pattern in Dravidian Movement.” World Academy of Science, Engineering and Technology, 75, 107 (2011);
Chidambaram M., “Cultural Entrepreneurs and Language Strategists: DMK in Tamil Nadu.” The Indian Journal of Political Science, 48, 3 (1987);
Forrester D.B., “The Madras Anti-Hindi Agitation, 1965: Political Protest and Its Effects on Language Policy in India.” Pacific Affairs, 39, 1/2 (1966);
Hardgrave R.L., “The DMK and the Politics of Tamil Nationalism.” Pacific Affairs, 37, 4 (1964);
Hardgrave R.L., The Dravidian Movement. Bombay: Popular Prakashan, 1965;
Irshick, Eugene, Politics and Social Conflict in South India: The Non-Brahman Movement and Tamil Separatism. Berkeley: University of California Press, 1969;
Omvedt, Gail, Dalit Visions: The Anti-caste Movement and the Construction on an Indian Identity. Bombay: Orient Longman, 2006;
Ram, Mohan, Hindi Against India: The Meaning of DMK. New Delhi: Rachna Prakashan, 1968;
Sattanathan A.N., The Dravidian Movement in Tamil Nadu and its Legacy. Madras: University of Madras Press, 1982;
Others/Comparative case studies
Barnett M.R., The Politics of Cultural Nationalism. Princeton: Princeton University Press, 1976;
Basu Sajal, Regional Movements, Politics of Language, Ethnicity-Identity. New Delhi: Manohar Publications, 1992;
Bhatnagar Ved, Challenges to India's Integrity: Terrorism, Casteism, Communalism. Jaipur: Rawat Publications, 1998;
Chadda Maya, Ethnicity, Security, and Separatism in India. New York: Columbia University Press, 1997;
Chandhoke Neera, “A State of One’s Own: Secessionism and Federalism in India.” Crisis States Programme Working Paper Series, no. 1, Working Paper no. 80. Development Studies Institute (DESTIN), London School of Economics, 2006;
6
Connor Walker, Ethnonationalism: The Quest for Understanding. Princeton: Princeton University Press, 1993;
Ganguly Sumit and David Fidler (eds.), India and Counterinsurgency: Lessons Learned. London: Routledge, 2009;
McHenry Dean, "The Weakened State Explanation for the Rise of Separatist Movements: The Experience of India," unpublished manuscript 1998.
Muni S.D., “Ethnic Conflict, Federalism and Democracy in India.” In Kumar Rupesinghe and Valery Tishkov (eds.), Ethnicity and Power in the Contemporary World. Tokyo: United Nations University Press, 1996;
Phadnis Urmila, Ethnicity and Nation-Building in South Asia. New Delhi: Sage, 2001;
Prakash Karat, Language and Nationality Politics in India. Bombay: Orient Longman, 1973
Prakash Ved, Terrorism in Northern India: Jammu and Kashmir and the Punjab. Delhi: Kalpaz Publications, 2008;
Rajagopalan Rajesh, “Force and Compromise: India’s Counter-Insurgency Grand Strategy.” South Asia, 30, 1 (2007): 75-91;
Sáez Lawrence, Federalism Without a Center. New Delhi: Sage, 2002;
Singh Bhawani, Regionalism and Politics of Separatism in India. London Routledge, 1993;
Telford Hamish, “Counter-Insurgency in India: Observations from Punjab and Kashmir.” Journal of Conflict Studies (2001);
Wallace Paul, “Countering Terrorist Movements in India: Kashmir and Khalistan.” In Robert Art and Louise Richardson (eds.), Democracy and Counterterrorism: Lessons from the Past. Washington, D.C.: USIP Press, 2006, pp. 425-482;
Widmalm Sten, Kashmir in Comparative Perspective: Democracy and Violent Separatism in India. London: Routledge, 2002;
Dependent Variable: Moderation of Territorial Demands (“demand moderation”)
The dependent variable, demand moderation, is a dichotomous variable that measures any
move downward along the “demand intensity scale” -- including “secessionist demands” as the most
intense, “less-than-secessionist” demands (in most cases consisting of the demand for a new
federated state) as the middle item (less intense demands such as the creation of a “Union
Territory” or of an “autonomous council” within a state, or the endowment of a state with
special competencies, have been much rarer), and “no demands” as the bottom of the scale -- by
indicating whether in a given year an actor reduced the intensity of its territorial demand (1) or
not (0). “Reducing the intensity” of demands might occur for different reasons: 16 out of the 49
actors (33%) that moderated their demand did so because the demand had been granted, 6 (12%)
7
were forcefully disbanded in response to their territorial demands, and the remaining 27 actors
(55%) moderated their demand because of some other reason. In most instances of “demand
moderation”, therefore, the regional party or group continued its existence after having
voluntarily changed its territorial demands. However, actors are only included in the data until
their demand is moderated; or, alternatively, until they cease to exist or because they reach the
end of the time span of our analysis.
The “demand moderation” variable described above captures with good approximation a
complex dynamic of territorial demands on the part of dozens of Indian regional political actors.
Our results are robust to different specifications of this variable. Below we give more detailed
information on the trajectories of territorial demands posed by the regional actors in our dataset.
Moderating demands
Demand moderation is the typical trajectory that we observe in our data, and occurs in two ways:
by dropping a territorial demand altogether, or by shifting from a more intense demand to a less
intense one. The overwhelming majority of actors moderated their territorial demand to posing
no demand at all. Only in a few cases did actors moderate their demand for independence to a
demand of a separate state, or less than a separate state:
Bodo Liberation Tiger (BLT): Shifts from a demand for independence to a demand for less
than a state in 2001.
Kuki Defense Force (KDF): Shifts from a demand for independence to a demand for a
separate state in 1996.
Kuki National Assembly (KNA): Demand for the maintenance of a separate state of
Manipur, which it moderates in favour of a separate revenue district in 1975. It is coded
as moderating its demand in 1975.
Plains Tribals Council of Assam (PTCA): It moderates its demand for a separate state of
Udyachal in 1977 and demands an autonomous region (or union territory) instead. It is
coded as moderating its demand in 1977.
8
United Mizo Front Organization (UMFO): Shifts from a demand for independence to a
demand for a separate state in 1953.
Finally, only one actor, Mizo National Front (MNF), moderated its territorial demands twice, at
separate time points, along the three-item scale. In this case, only the first move downward in
1971 was coded.
The dynamics discussed above —i.e. different forms of demand moderation— are
typical of almost the whole universe of our cases. A few actors in our dataset, however, were
characterized by more complex demand dynamics. Below we account for our coding decisions in
these cases.
Moving from no demand to posing a demand
Very little evidence exists of escalation of territorial demands (as opposed to escalation of
violence): only nine actors moved upwards on the scale, posing no demand in the first phase of
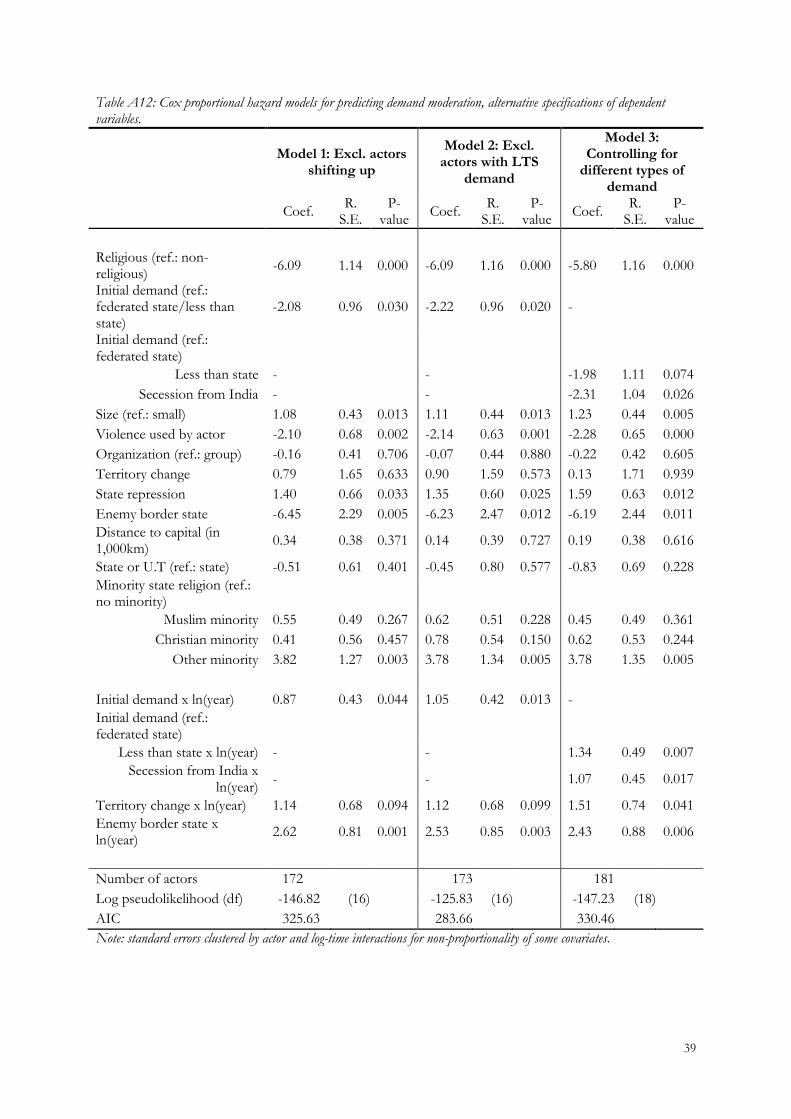
their existence, and ‘escalating’ to posing territorial demands later on. We have included these in
the analysis from the first time they posed a demand. Excluding them from the analysis
altogether does not change the overall results (see Table A12, Model 1). This applies to the
following parties and groups:
All Bodoland Student Union (ABSU): Shifts up from no demand to demanding a separate
state in 1980. It is only included in the dataset from 1980 onwards.
All Bodoland Student Union (Upen Brahma faction) (ABSU (UB)): Initially demands the
division of the Brahmaputra valley. In 1988 it replaces this demand in favour of one
calling for the creation of a separate state. It is included in the dataset from 1988
onwards.
Jamaat-e-Islami (JeI): Shifts up from no demand to a demand for independence in 1987. It
is included in the dataset from 1987 onwards.
9
Jammu and Kashmir Islamic Front (JKLF): Shifts from no demand to a demand for
independence in 1988. It included in the dataset from then onwards.
Jammu and Kashmir People’s League (JKPL): Shifts from no demand to a demand for
independence in 1975. It is included from then onwards in the dataset.
Lashkar-e-Toiba (LeT): Shifts from no demand to a demand for independence in 1995. It
is included in the dataset from then onwards.
Muslim United Front (MUF): Shifts from no demand to a demand for independence in
1989. It is included in the dataset from then onwards.
Tripura Rajya Multi Parishad (TRMP): Shifts from no demand to a demand for the creation
of an autonomous district council for tribals (i.e. less than a state) in 1967. It is included
in the dataset from 1967 onwards as demanding a separate state.
Tripura Upajati Juba Samiti (TUJS): Initially demands formation of autonomous districts
councils. In 1998 it presses for the creation of a separate state composed of the existing
Tripura Tribal Area Autonomous District Council. Included in the dataset from 1998
onwards.
Finally, Shiromani Akali Dal (Amristar) (SAD(A)) shifted up from a demand for a separate
state to demand for independence in 1994. It is coded on the basis of its first demand and
the shift up is not recorded.
Re-posing demands
Only two regional actors re-posed a demand after having initially moderated it. These actors are
only included in the dataset until the moderation of their first demand:
All India Gorkha League (AIGL): Moderated its demand for a separate state in 1950, but
intensified its demand again from no demand to a demand for a separate state in 1973. It
is only included in the dataset until 1950.
10
Garo National Council (GNC): Moderated its demand for a separate state in 1970, but
intensified its demand again from no demand to a demand for a separate state in 1992. It
is only included in the dataset until 1970.
Demands for less than a state
All territorial demands which are short of secessionism, even though they do not have as their
object the creation of a separate state within India (e.g. demand for the creation of a new Union
Territory, or the demand for special cultural rights) have been coded as being of the same
intensity as the demand for a new federated state. The vast majority of regional parties and
groups in that category of demand intensity, however, have posed a demand for a separate state
within the Indian Union. Exceptions:
Hmar People's Convention (HPC): Demands an autonomous district for Hmar tribals, which
it moderates to no demand on 1994.
Hmar People's Convention (Democratic) (HPC (D)): Demands an autonomous district for
Hmar tribals.
Khasi Jaintia National Federated States National Conference (KJF): Demands the creation of an
autonomous district council for Khasis, which it moderates to no demand in 1950.
Mizoram People's Conference (MPC): Demands a separate administrative unit linking all
Mizos living in Mizoram, which it moderates to no demand in 1986.
Mizo Union (MUL): Demands the creation of an autonomous tribal district for Mizos
living in Assam, which it moderates in 1972.
Tripura National Volunteers (TNV): Demands autonomous district councils, which it
moderates to no demand in 1988.
Tripura Resurrection Army (TRA): Demands the creation of autonomous district councils in
Tripura, which it moderates in 1997.
11
Zoram Nationalist Party (ZNP): Demands the creation of a single administrative unit for all
Mizos living in Mizoram.
Excluding these parties and groups from the analysis altogether does not change the
overall results (see Table A12, Model 2).
Explanatory Variables
Religious actor:
The worldview of the regional political actor posing territorial demands. It takes the value (1) if
the actor has a religious identity and (0) if not. To code a regionally-based party or group as
“religious”, we refer to its self-definition as it emerges from the party or group’s own sources or
to unquestioned descriptions in the secondary literature. Although this variable is allowed to vary
over time, only two actors changed their official worldview in the period under consideration. In
both cases the actors changed from a non-religious worldview to a religious one.
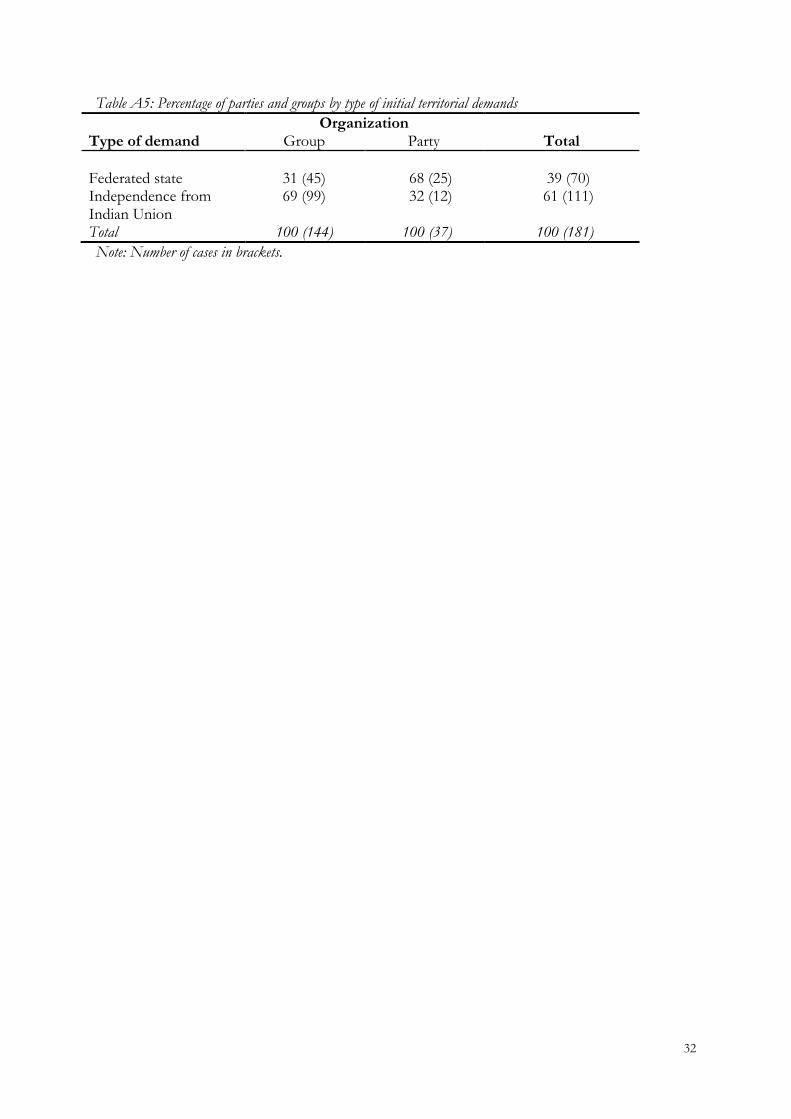
Initial demand intensity:
The kind of territorial demand first posed by a regional political actor. It takes the value (0) for
regional actors with a demand for a separate state, or lesser forms of autonomy, within the
Indian Union, and (1) for regional actors with a demand for independence from the Indian
Union. Table A5 shows the percentage of parties and groups by the intensity of the territorial
demand initially posed. A separate Cox proportional hazard model (see below) was run in which
initial demand intensity was coded trichotomously, with demands for lesser forms of autonomy
as a separate category. The results of this model are reported in Table A12 (Model 3). The results
show that actors demanding lesser forms of autonomy, and actors demanding independence are
less likely to moderate their demand than actors demanding a separate state; however, in both
cases this difference decreases significantly as actors exist longer.
12
Size:
The size of a regional political actor. A political party’s size is measured by the average
percentage of votes it polled in all the state legislative assembly elections where it has participated
and for which information is available. The size of a political group is measured by the number
of members. The size of a group or party was originally coded trichotomously: small (<5% of
the vote in the target territory for parties and <1,000 members for groups), medium (5-20% of
the vote in the target territory for parties and 1,000 to 10,000 members for groups), and large
(>20% of the vote in the target territory for parties and >10,000 members for groups). However,
as small and medium actors do not significantly differ in their likelihood of moderating territorial
demands we opted for a dichotomous measure in the final analysis by combining the small and
medium categories. Due to shortage of information on many groups or parties the values refer to
one point in time only during their existence. When more than one data point was available, we
have averaged them, to determine the classification of the party or group. The data on group size
are from Santhanam et al. (2003) and the South Asia Terrorism Portal (http://www.satp.org).
Electoral data are published by the Electoral Commission of India
(http://eci.nic.in/eci_main/StatisticalReports/ElectionStatistics.asp). Both accessed 29 March
2011.
Violence:
Whether in a given year a regional political actor used violence (1) or not (0). Information on this
comes from the following sources: the South Asia Terrorism Portal (http://www.satp.org) and
the India Subnational Problems Dataset (http://www.systemicpeace.org/inscr/inscr.htm). Both
accessed 29 March 2011. From the India Subnational Problems Dataset the following variables
were used: conflict number (CNUM), conflict tag number (CTAG), conflict type (CTYPE),
conflict actor (ACTOR1-3) and conflict target group (TARGET1-2). For CNUM, we selected
those variables where the conflict was violent and inherently political. For CTAG, we selected
those conflicts which were tagged as being mega-conflicts and “nested” meta-conflicts, discreet
13
meta-conflicts, meta-conflict events, and discreet micro-conflict events. For CTYPE, we selected
those conflict types that were coded as being ethnic/identity warfare, political/economic
warfare, anti-government terrorist campaign, and communal terrorism campaign, or terrorist
incidents. Finally, we selected those conflict actors and conflict target groups where the dyads
were confessional groups and ethno-identity groups vs. government authorities.
Organization:
Whether the organizational form of the regional political actor is a group or a party. A regional
political actor changes from being a ‘group’ to a ‘party’ at its first state or national election, unless
it only came into being a few years before its first election (thus clearly intending to be a party),
or is banned from participating in elections, but would clearly do so if not banned. This variable
is allowed to vary over time. Only five actors changed their organizational form, and all do so by
becoming a party.
Territory change:
Any change in a Union Territory or state’s geographical territory or in its status that might affect
a regional political actor’s demand moderation. It is coded (1) for years in which states are newly
created from other states, in which an autonomous region obtains the status of a Union
Territory, or in which a Union Territory become a state; and is coded (0) when there is no such
change. States that lose part of their territory in the formation of a second state; states that
change their name, but of which the territory remains essentially unchanged; and states of which
the territory is newly incorporated into the Indian Union are not coded as changing territory.
State or U.T.:
A time-varying measure of whether the ‘state’ a regional political actor operated in has the
official status of a state (0) or of a Union Territory (UT) or less (1). For instance, Meghalaya was
an autonomous region within Assam from 1970 to 1971, when it became a state. It is coded (1)
for 1970 and 1971. It is important to note that several changes of the state boundaries occurred
14
in India since its independence in 1947. The biggest change occurred in 1956 when the States
Reorganisation Act came into effect. States and Union Territories are coded on the basis of this
Act. The few regional political actors that came into existence before 1956 in a region that
became or remained a state or Union Territory (UT) in 1956 are coded as continuously operating
in that state or UT. There are only 2 regional political actors that solely existed before 1956.
They are coded as operating in Tamil Nadu (named Madras State until 1969) and in Assam,
respectively. Since 1956 several territories joined the Indian Union, gained a substantial amount
of autonomy, or became new UTs or states. Goa joined the Indian Union in 1961. The first
territorial demand was posed in 1963. Gujarat was formed from part of Bombay state in 1960,
and experienced its first territorial demand in 1967. We consider Maharashtra the continuation of
what was formerly Bombay state, but code it as changing its territory (see previous variable) in
1960. The one actor operating in Bombay state until 1960 moderated its demand when
Maharashtra was formed. Formerly known as the North East Frontier Agency (NEFA),
Arunachal Pradesh became a UT in 1972. The first territorial demand was not posed until 1990.
Haryana was formed out of Punjab in 1966. The one regional actor demanding a separate state
of Haryana is coded as operating in Punjab until 1965 and in Haryana in 1966, when it
moderated its demand. Meghalaya became an autonomous region within Assam in 1970. The
three political actors demanding a separate state of Meghalaya are coded as operating in Assam
until 1969 and in Meghalaya from 1970 onwards. In 1952 Mizo Hills obtained a certain amount
of autonomy from Assam and in 1972 became a UT. The two political actors making territorial
demands on behalf of the Mizos living in Assam are coded as operating in Assam until 1951 and
in Mizoram from 1952 onwards. Nagaland, formerly part of Assam, became a UT in 1957, but
no territorial demand was posed until 1962. Source: National Informatics Centre, Government
of India. National Portal of India: States and Union Territories. Available at
http://india.gov.in/knowindia/state_uts.php. [Accessed 9 April 2007]
15
Presidential rule:
Whether Presidential Rule (PR) was officially applied in a given year in a state in which a regional
political actor was active as a result of insurgent activities and/or movements posing territorial
demands (1); or not (0). In the North-eastern states the imposition of AFSPA (Armed Forces
Special Powers Act) in 1958 is coded as (1). Our sources of information on Presidential Rule are:
Adeney, Katharine, Federalism and Ethnic Conflict Regulation in India and Pakistan. New York: Palgrave Macmillan, 2007;
Arora, Subhash Chander President’s Rule in Indian States. New Delhi: Mittal Publications, 1990;
Bernstorff, Dagmar “Eclipse of ‘Reddy-Raj’? The Attempted Restructuring of the Congress Party Leadership in Andhra Pradesh.” Asian Survey, 13, 10 (1973), pp. 959-979;
Bhatt S.C. and Gopal Bhargava (eds.), Land and People of Indian States and Union Territories. 36 volumes. New Delhi: Gyan Publishing, 2005;
Grover Verinder and Ranjana Arora (eds.), Encyclopaedia of India and her States. 10 volumes. New Delhi: Deep and Deep Publications, 1998;
Hartmann, Horst “Changing Political Behaviour in Kerala.” Economic and Political Weekly, 3, 1/2 (1968), pp. 163-78;
Maheshwari, Shriram. President’s Rule in India. Delhi: MacMillan, 1977;
Shah, Ghanshyam “The Upsurge in Gujarat.” Economic and Political Weekly, 9, 32/34 (1974), pp. 1429-54;
Windmiller, Marshall “The Andhra Election.” Far Eastern Survey, 24, 4 (1955), pp. 57-64;
State repression:
This variable provides an alternative measure of state repression experienced by a regional
political actor in a given year. It is derived from the India Subnational Problems Dataset (ISPD),
available at http://www.systemicpeace.org/inscr/inscr.htm. The entries in ISPD were matched
to correspond with the variable as follows: we coded (1) for years in which one of the actors or
targets in the conflict (columns M-Q in the ISPD) was a government authority (actors 71-92 in the
ISPD) and the other actor in the conflict was either an ethno-identity group (actors 11-27), a
regionally-based political party (actor 49 in ISPD), or a communist and Naxalite group (actors
65, 68). The ISPD labels these latter two groups as being political groups and econo-caste groups. The
variable was coded (0) in all other instances.
16
Enemy border state:
Whether a regional political actor operated in a state that borders with a friendly (1) or an enemy
(2) foreign country, or does not border any foreign country (0). As enemy foreign countries are
coded Pakistan (1947 to 2002), China (1962 to 1988) and East Pakistan (1947 to 1971). States
bordering Nepal, Burma (Myanmar) or Bhutan are coded as bordering with friendly states, unless
they also bordered with an enemy state in the same time period. States bordering China or East
Pakistan (Bangladesh) in time periods during which these were not considered enemy states are
also coded as bordering with friendly states. Mainly for reasons of parsimony, the variable was
recoded into a dichotomous variable by merging the first two categories, thus indicating whether
or not a state borders with an adversary in a given year.
Distance to capital:
The distance, expressed per 1,000 kilometer, between the capital of the state where a regional
political actor operated, and the national capital (New Delhi). The main data source used for
most observations is: Maps of India. City distance search engine [online]. Available at
http://www.mapsofindia.com/distance/index.html. [Accessed 9 September 2011]. The distance
between Gandhinagar (Gujarat) and New Delhi is derived from information available at
http://www.distancebetweencities.co.in [Accessed 9 September 2011]. The distance between
Itanagar (Arunachal Pradesh) and New Delhi, and between Dispur (Assam) and New Delhi is
calculated through: FCm Travel Solutions. Distance calculator, available at
http://in.fcm.travel/travel-kit/distance-calculator.html [Accessed 9 September 2011]. The state
of Jammu and Kashmir has two capitals, Srinagar and Jammu. For legislative purposes, the city
Jammu serves as the capital during the winter months (November through April) and the city of
Srinagar serves as the capital during the summer months (May through October). For the
purpose of our analysis, Srinagar is considered the capital of Jammu and Kashmir since the main
legislative business is undertaken here.
17
State Relative Income (SRI):
A measure of the state per capita income in each year of existence of a regional political actor,
divided by the national per capita income in the same year. Data for this measure are only
available since 1960 and come from the yearly figures of the per capita net state domestic
product (NSDP) available from the Reserve Bank of India (RBI). NDSP figures were estimated
at both current and constant (1948-1949) prices. In 1994, the Indian Government recalculated
NDSP at both current and constant prices with base year 1993-1994 (see the websites of the RBI
www.reservebank.org.in and of the Central Statistical Organisation at www.mospi.nic.in). For the
analysis, we compiled data on NSDP for two broad time periods: 1960-1993 and 1993-2002.
For 1960-1993, NSDP figures at current prices were derived from EPW, Domestic Product of States
of India. (EPW 2003: 191-266). NSDP data for all states published in EPW (2003) has been
compiled by the Central Statistical Organisation (CSO) from the respective state government
statistical bureaus. Until recently, there were no unified methodological guidelines issued by the
CSO on how to compile NSDP data, and the methodological problems inherent in this method
of compilation are well documented (Lakshminarayana, Rao and Rao, 1995; Report of the National
Statistical Commission, 2001). Hence, other sources may use slightly different figures. Data
presented here for this time period correspond with a matching dataset used in Tim Besley and
Robin Burgess, (Besley and Burgess 2004) and available at:
http://sticerd.lse.ac.uk/eopp/research/indian.asp. Data from EPW and Besley and Robbins
cease to match after 1997. Data from the CSO are the most up-to-date for all states in India.
Sources:
Besley, Tim, and Robin Burgess. 2004. “Can Labor Regulation Hinder Economic Performance? Evidence From India.” Quarterly Journal of Economics, 119, 1: 91-134.
Central Statistical Organisation (CSO). 2002. Statistical Abstract: India. Delhi: Manager of Publications, Central Statistical Organisation. Available at mospi.nic.in
EPW Research Foundation. 2003. Domestic Product of States of India. Mumbai: EPW Research Foundation.
18
Lakshminarayana, S., Saroja Rama Rao, and Shrinivasa Rao. 1995. "Data Gaps in the Estimation of State Domestic Product." Journal of Income and Wealth, 17:1.
Report of the National Statistical Commission, (2001), Volumes I and II. New Delhi, National Statistical Commission.
Reserve Bank of India. NSDP data available at http://rbidocs.rbi.org.in/rdocs/Publications/PDFs/80185.pdf
Minority state religion:
A measure of the presence of any large non-dominant, i.e. non-Hindu, religious group in the
state in which a regional political actor operated. States are coded as follows: (0) no minority; (1)
Muslim (states with ≥ 25% of the population subscribing to Islam); (2) Christian (states with ≥
25% of the population subscribing to Christianity); (3) Other (states with ≥ 25% of the
population subscribing to the Sikh or Buddhist faith). In Arunachal Pradesh 31% of the
population subscribes to religions other than Hindu, Muslim, Christian, Sikh, Buddhist or Jain. It
is coded as (0). Source: Census of India 2001: The First Report on Religion Data. New Delhi, India:
Registrar General and Census Commissioner, 2004.
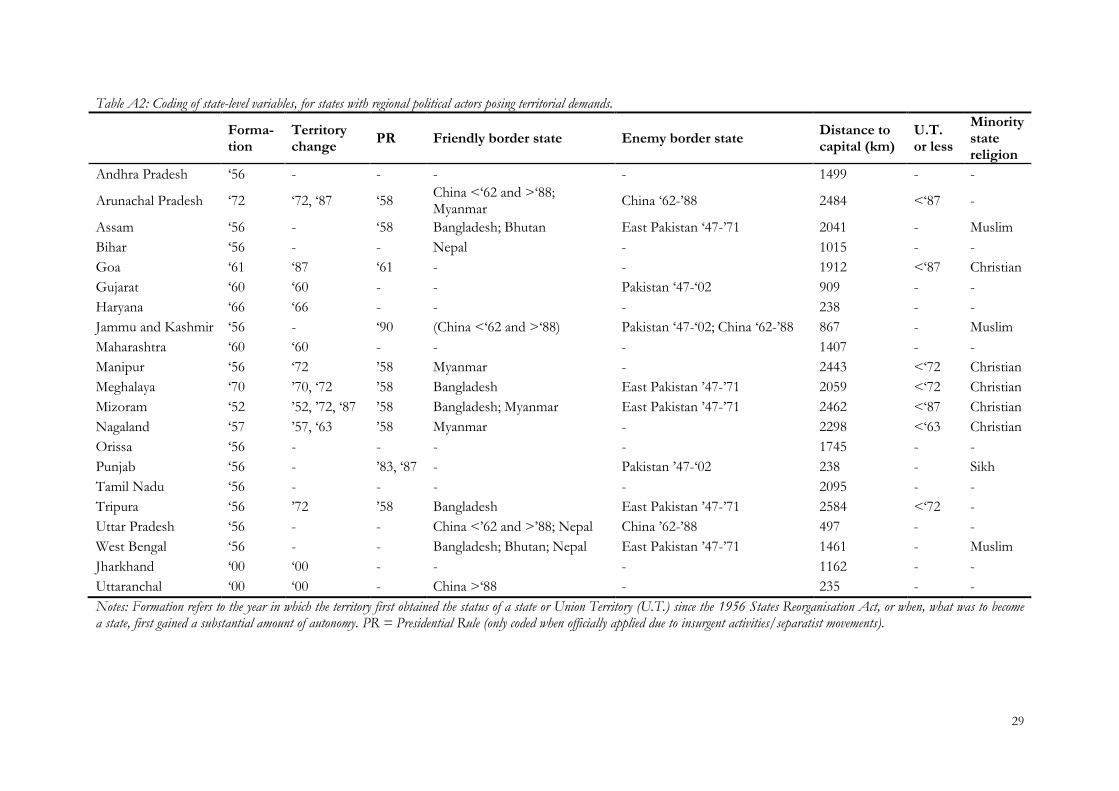
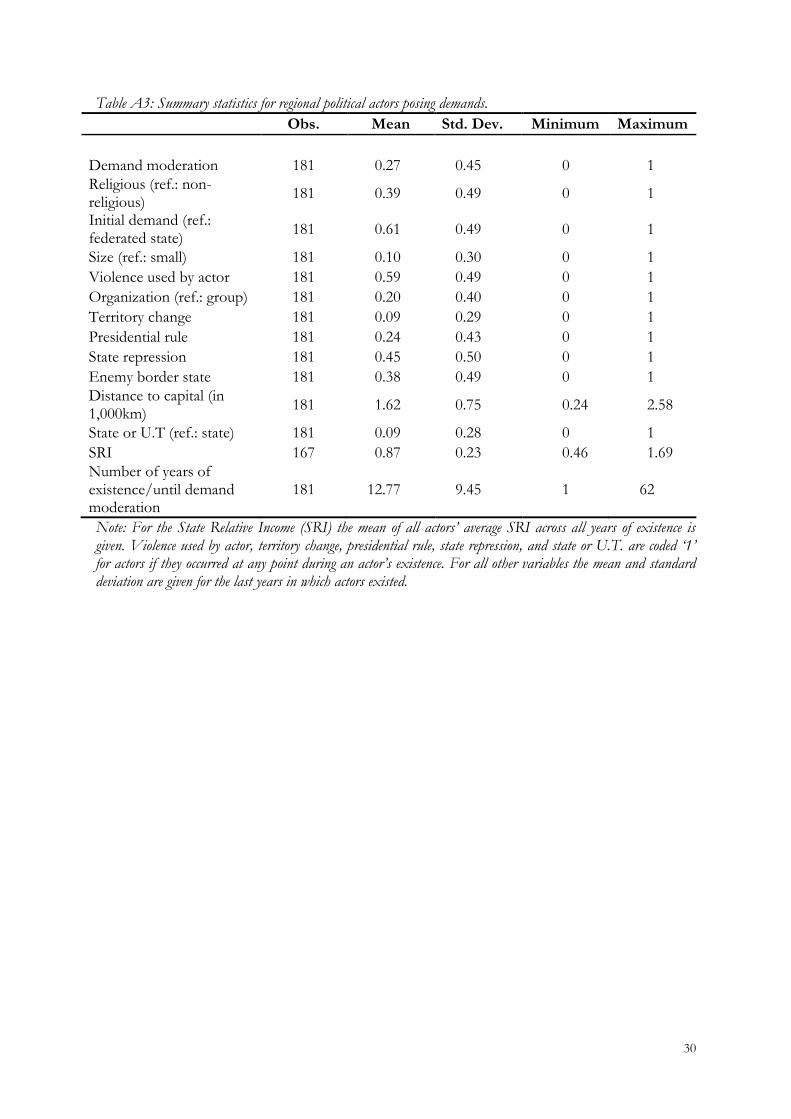
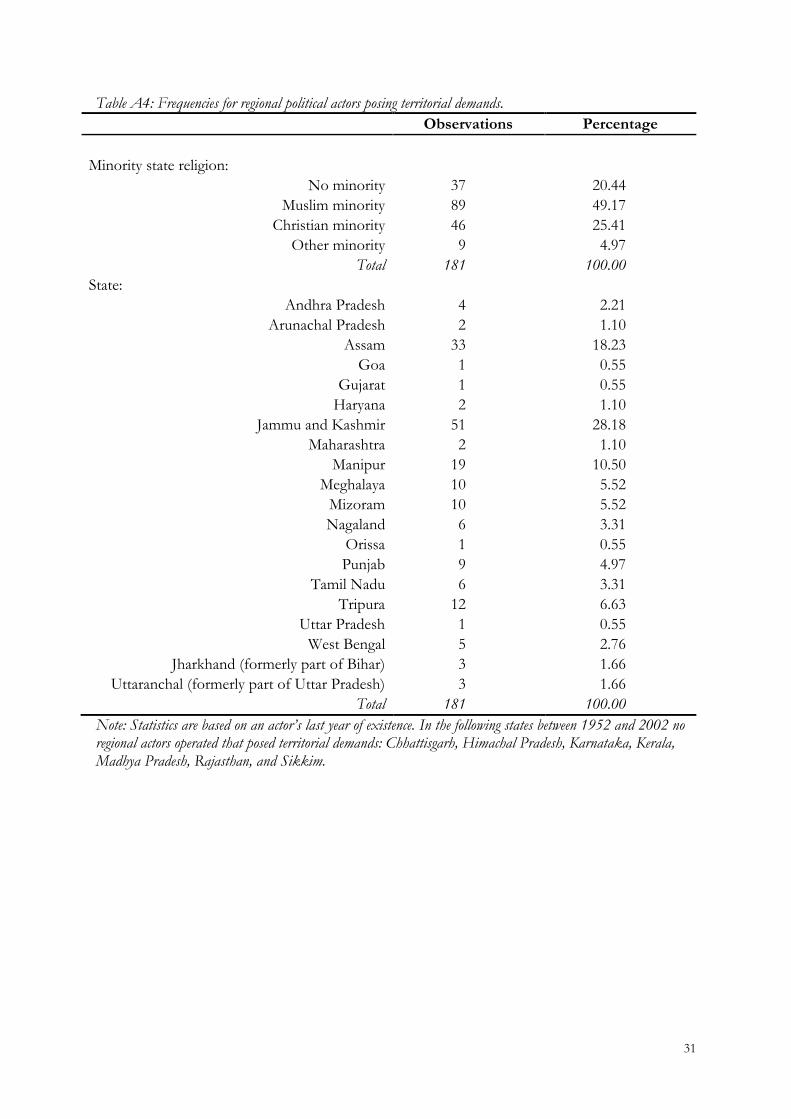
An overview of the coding of the state-level variables is shown in Table A2 below. Table
A3 provides the summary statistics for all variables, and Table A4 reports the frequencies of
regional political actors for the different variables.
Cox Proportional Hazard Model (Analysis of the impact of religious worldviews on
demand moderation):
The choice of a Cox model derives from the fact that we are not specifically interested in, nor do
we have any preconceived idea about, the function of the time dependency in our model (Box-
Steffensmeier and Jones 2004). Although often in survival analysis the distinction between
continuous and discrete is not so clear-cut (Box-Steffensmeier and Jones 2004, 83), our model
19
presumes that the time until an actor moderates its demand (or alternatively ceases to exist, or
reaches the end of our measured period, i.e. is “censored”) can be thought of as continuous.
The Cox proportional hazard model is a semi-parametric model that allows us to
estimate the effect of our covariates on the baseline hazard, without assuming any specific
distributional form of this hazard. In the Cox model the hazard rate of moderating a demand at
time t for the ith regional political actor can be summarized as follows: ( ) ( ) ( ),
where h0(t) is the baseline hazard function and β'x are the covariates and regression parameters.
The hazard ratio of two hazards, e.g. one for religious actors and one for non-religious actors, is
given by: ( )
( ) ( ( )). This ratio is presumed to be proportional, which means that
the effect of a covariate remains stable over time. The survival function is given by: ( )
( ), where H(t) is the integrated or cumulative hazard rate at time t. This is equivalent to:
( ) ( ) ( ), where exp(β'x) are the exponentiated Cox coefficients or the hazard ratios
(Box-Steffensmeier and Jones 2004, 65).
Before estimating the Cox model, we first estimated the survival rate of regional political
actors using the Kaplan-Meier estimator. Figure A1 plots this survival rate at specific intervals of
years of existence of political actors and takes into account the number of actors which have
ceased to exist (have been censored). The Figure shows that, for instance, after approximately 30
years of existence just over fifty per cent of regional political actors are estimated to have
moderated their territorial demand.
In estimating the Cox model, we used the Efron method to deal with the ties in our data,
i.e. two or more events happening in the same year. In order to control for temporal dependency
of observations within each actor (Box-Steffensmeier and Jones 2004, 115), the model has been
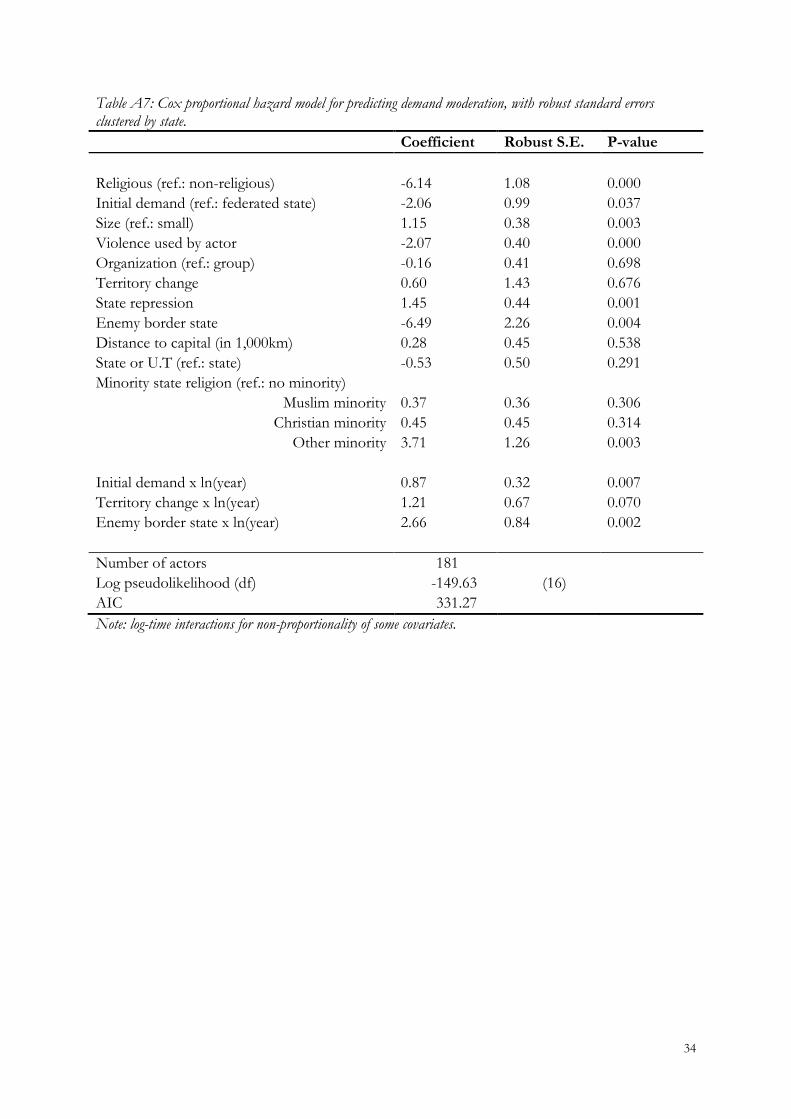
estimated with robust standard errors clustered by actor. The final model has also been estimated
with robust standard errors clustered by state, to control for within state dependency of
observations (see Table A7). We opted for the former as it proved the more conservative test.
20
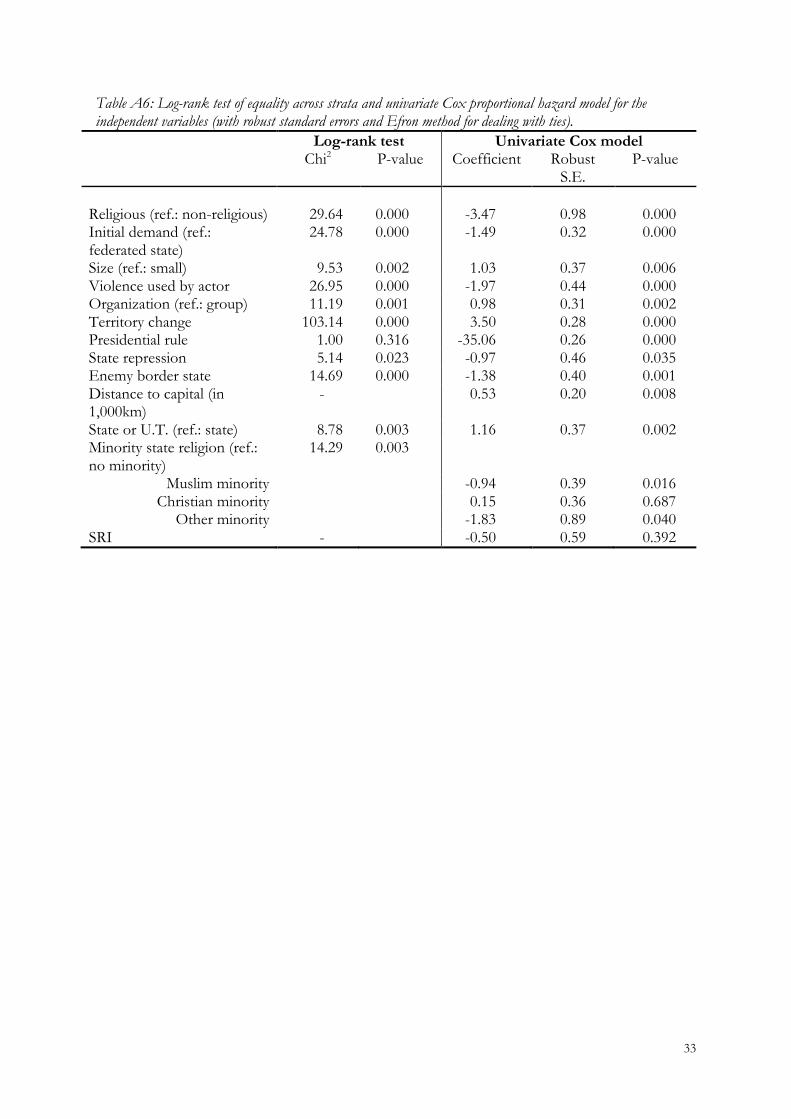
Log-rank tests of equality across strata show that all but one of the categorical variables,
namely presidential rule, should be considered for inclusion in the final model as the p-values are
all .2 or less (Box-Steffensmeier and Jones 2004) (see Table A6). Although the coefficient for
presidential rule in a univariate Cox model (also reported in Table A6) is significantly and negatively
related to demand moderation, we do not include it in the final model based on the results of the
log-rank test, and due to difficulties in estimating the model resulting from the fact that no
demands were moderated during years in which presidential rule was applied for reasons related
to secessionism. Due to the non-significant coefficient for SRI in a univariate Cox model
predicting demand moderation, as well as missing data points for the earlier years, this
continuous variable is also not included in the final model.
Graphical and statistical residual-based tests using Schoenfeld residuals (Box-
Steffensmeier and Zorn 2001) showed that the basic assumption of a Cox model that the hazard
is proportional was violated for three variables. To correct for this, we included interactions
between the three covariates and the natural logarithm of survival time (Box-Steffensmeier and
Zorn 2001).
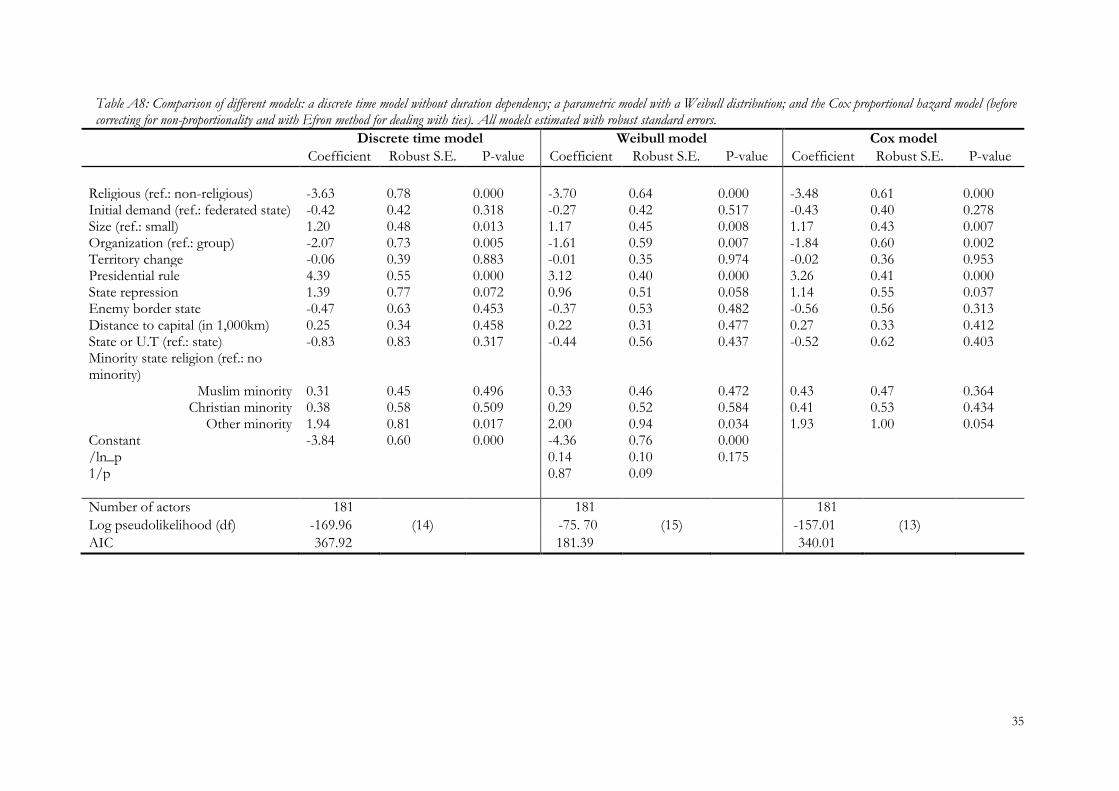
Different specifications:
The final model was estimated in several different ways. First, we estimated a discrete
time model with and without duration dependency (of which the latter was both modeled with
dummies for each year of duration and with a lowess smoother for the relation between demand
moderation and duration). Testing the latter two models against the null model of no duration
dependency showed no significant improvement of the fit. Next, we estimated a parametric
(Weibull) model. The Weibull and the exponential distribution proved the most appropriate
distributions for the parametric model as they showed the best fit of the commonly used
distributions (exponential, Weibull, Gompertz, log-logistic and log-normal were tried). The same
Weibull model was also estimated as a frailty model with a gamma distribution: theta was near to
0 and the model did not have a better fit. No substantial differences were found between the
21
estimates obtained from these models and those obtained from the semi-parametric Cox
proportional hazards model (before correcting for non-proportionality). The estimates for this
model together with the discrete time model and the Weibull model are reported in Table A8.
To assess the functional form of the model, martingale residuals can be calculated and
plotted against the covariates in the model. However, as all but one of the variables in the model
are dichotomous, nonlinearity is not an issue. The plot for the only continuous variable in the
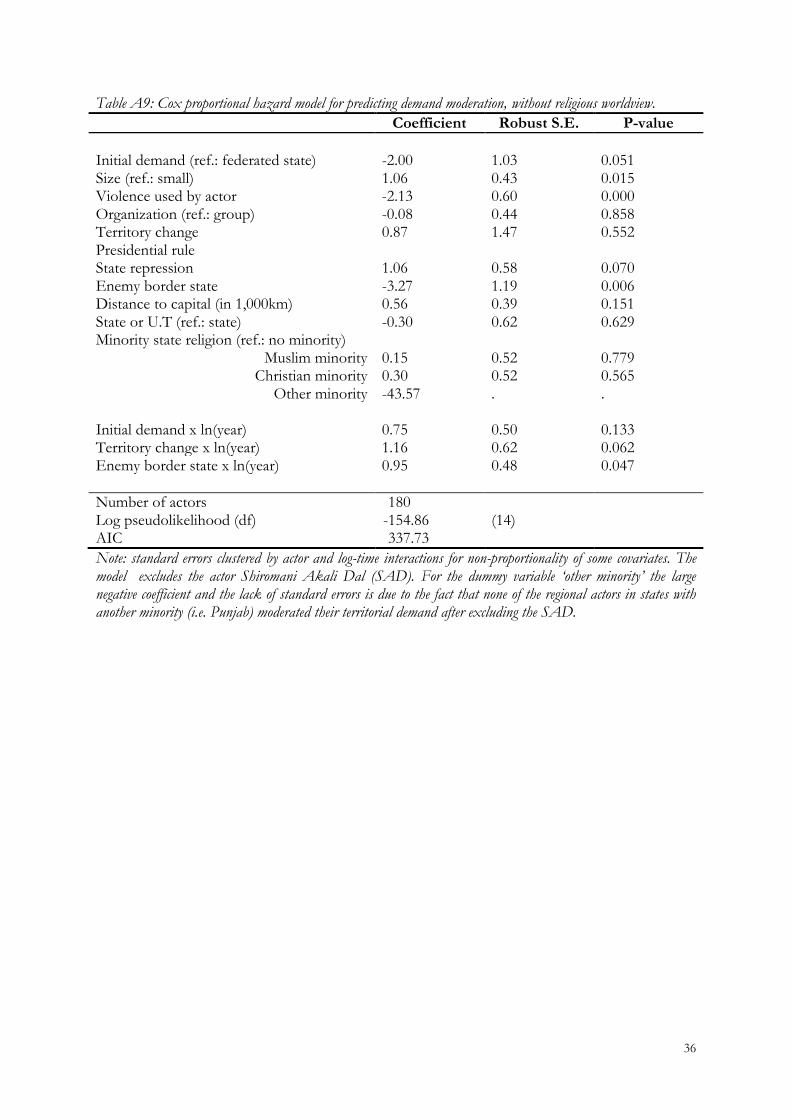
model, distance to capital, shows no indication of nonlinearity. Next, we tested for outliers and
influential cases using deviance residuals and score residuals. Although, not surprisingly, the one
religious actor (Shiromani Akali Dal, SAD) that moderates its territorial demand substantially
influences the coefficient for religious worldview, removing the actor and re-estimating the
model without religious actor results in similar estimates for the other covariates (see Table A9),
with the exception of the other minority dummy variable (see note to Table A9). Finally, we
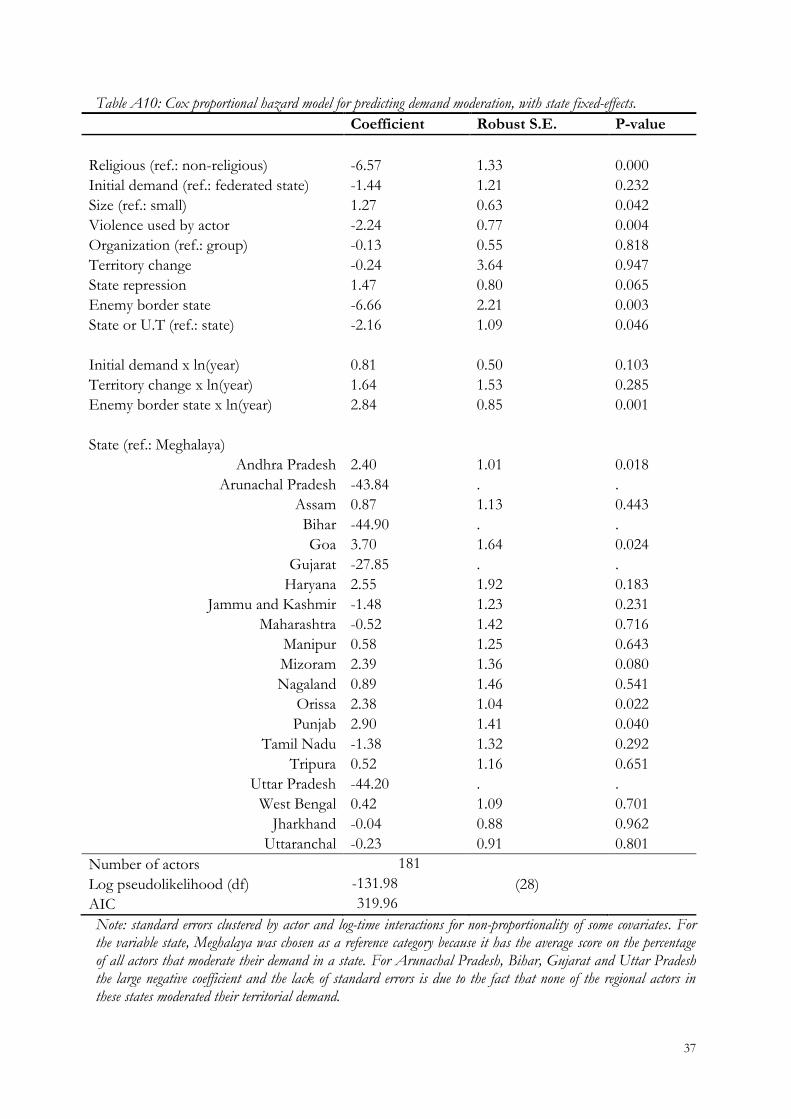
estimated the final model with fixed-effects for the states. In this model, the results of which are
shown in Table A10, the variable distance to capital and the dummies for minority state religion are
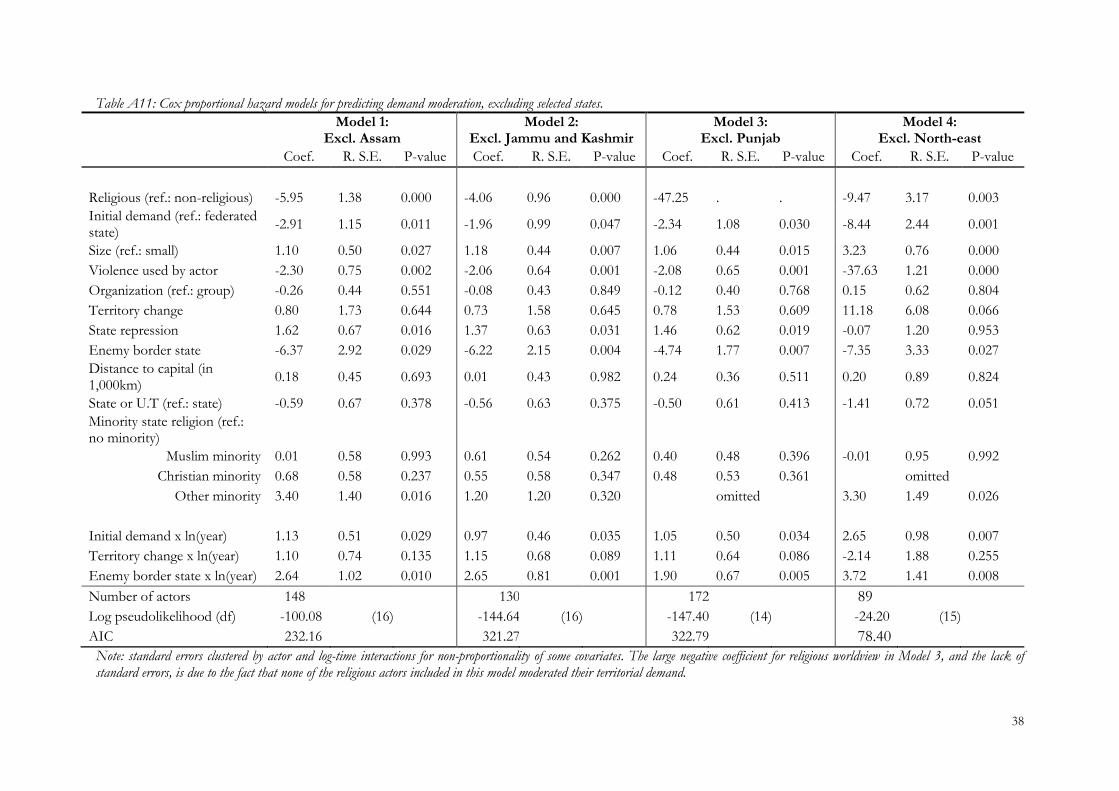
excluded because they are collinear with some of the state dummies. The final model was also
estimated excluding one of the following (groupings of) states at a time: Assam, Jammu and
Kashmir, Punjab, and all seven North-eastern states (Arunachal Pradesh, Assam, Manipur,
Meghalaya, Mizoram, Nagaland, and Tripura). The results of these four models are shown in
Table A11. In addition, a model excluding only the states in the North-east with relatively large
Christian populations, and a model excluding both Jammu and Kashmir, and Punjab were
estimated (not shown). Most importantly for our argument is that the negative and highly
significant coefficient for religious actor remains in all models, including those shown in Table
A10 and Table A11.
22
Dynamic Panel-data Model (Analysis of the impact of state repression on religious
mobilization)
We model the number of religious actors posing territorial demands in State (or Union Territory)
i in year t (that is, yit) by fitting a dynamic panel-data model. Year t ranges anywhere from 1950 to
2002, depending on when a state or Union Territory was formed. For example, for Assam t
ranges from 1950 to 2002, but for Goa t only ranges from 1961 to 2002. The model can be
summarized as follows:
( ) ( )
In which yi(t-1) is the lagged dependent variable, namely the number of religious parties
and groups posing territorial demands in the previous year, and xi(t-1) is the number of continuous
years of repression in state i in the previous year. The terms νi and εit, respectively, refer to the
unit (the state) effects and the error for each state i at time t. These are assumed to be
independent for each i over all t. Finally, α1 and β1 are the parameters to be estimated.
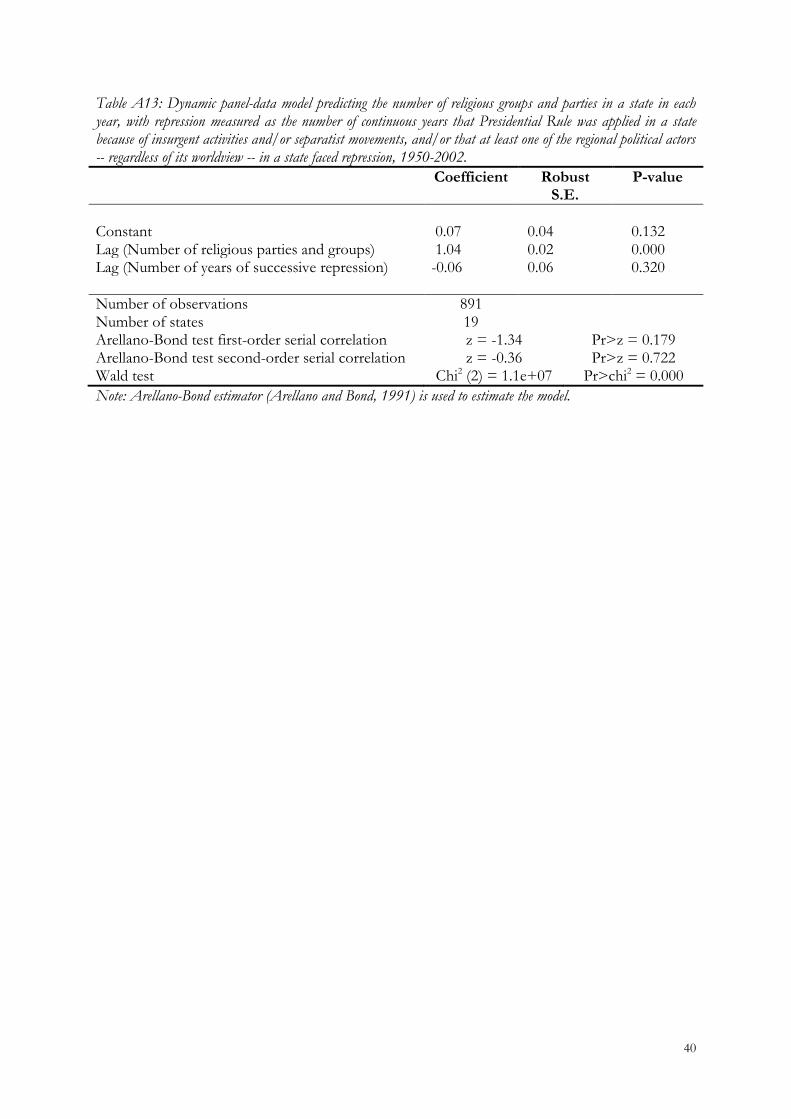
The variable repression used in this model measures the number of continuous years that
Presidential Rule was applied in a state because of insurgent activities and/or separatist
movements, and/or that at least one of the religious actors in a state faced repression. We ran a
separate model using a different specification of this variable, namely the number of continuous
years that Presidential Rule was applied in a state because of insurgent activities and/or separatist
movements, and/or that at least one of the regional political actors -- regardless of its worldview
-- in a state faced repression. The results derived from this model are shown in Table A13. The
findings show that even with the alternative measure of repression, controlling for the number of
religious parties and groups in the previous year, the number of successive years of repression in
a state in the previous year has no significant impact on the number of religious parties and
groups posing territorial demands in that state.
The variable repression is treated as strictly exogenous. If we do not assume strict
exogeneity, but instead allow repression to be predetermined (that is, the error at time t affects
23
future values of repression), or even endogenous (in addition allowing for a correlation between
current values of repression and the error), the reported estimation results in Table 3 in the paper
do not change: repression in the previous year has a negative and non-significant impact on the
number of religious parties and groups in the following year in a state.
By first-differencing the above mentioned equation the unit effects (νi) are removed.
Next, the equation can be estimated using lagged levels of the dependent variable and differences
of the strictly exogenous variable as potential instruments for the lagged endogenous variable
(Halaby 2004, 539).
We use the Arellano-Bond estimator (Arellano and Bond 1991) to estimate the model.
Arellano and Bond’s particular estimation technique relies on the Generalized Methods of
Moments (GMM) approach. This method assumes that there is no second-order serial
correlation in the first-differenced residuals (Arellano and Bond 1991: 282).
Although, based on the Sargan test, we have to reject the null hypothesis that the over-
identifying restrictions of the model are valid, Arellano and Bond (1991: 291) point out that the
test has a tendency to over-reject in the presence of heteroskedasticity. Sadly, no robust chi-
squared Sargan test is available (Arellano and Bond 1991: 282). Including all possible lags of the
dependent variable avoids rejecting the null hypothesis that the over-identifying restrictions are
valid (chi2 = 14.33, df = 7, pr. > chi2 = 0.046), but does not change the results of the model
substantively. We therefore opt for this more easily interpretable specification.
The Arellano-Bond tests for first- and for second-order autocorrelation in the first-
differenced residuals show that we cannot reject either the null hypothesis of no first-order or
the null hypothesis of no second-order autocorrelation. Rejecting the latter would indicate that
the estimates are inconsistent (Arellano and Bond 1991).
The Wald test reported in Table 3 in the paper tests the null hypothesis that all the
coefficients, except the coefficient for the constant, equal zero. This hypothesis is rejected.
24
We tried different specifications of the model, e.g. a random intercept model and a
standard fixed effects model using the same variables, but no substantive differences were found.
Finally, we also conducted the same analysis including the state relative income, but the results did
not change (this analysis was conducted only for the years 1960-2001 due to a lack of data for
the previous years).
Position of Religious Minorities in a State
Both religious mobilization and the resilience of territorial demands to state responses may be
the consequence of the “structural” disadvantage of a religious minority in a certain state: In
states in which a religious minority constitutes a relatively small group, they might be more
inclined to pose territorial demands, since changing the territorial organization of power, or even
changing the national boundaries would be more likely to give these minorities a stronger voice.
Alternatively, it might be the case that in states in which a religious minority constitutes a
relatively large group, they might be more inclined to frame their territorial demands in a religious
way, as a state or independent nation consisting of a large minority might be more viable.
Although the estimated relationship between religious worldview and demand moderation in the
main model presented in Table 2 in the paper holds constant states having a large religious
minority, we provide some additional insight into the relationship between the size of a religious
group and the extent of religious mobilization in Table A14.
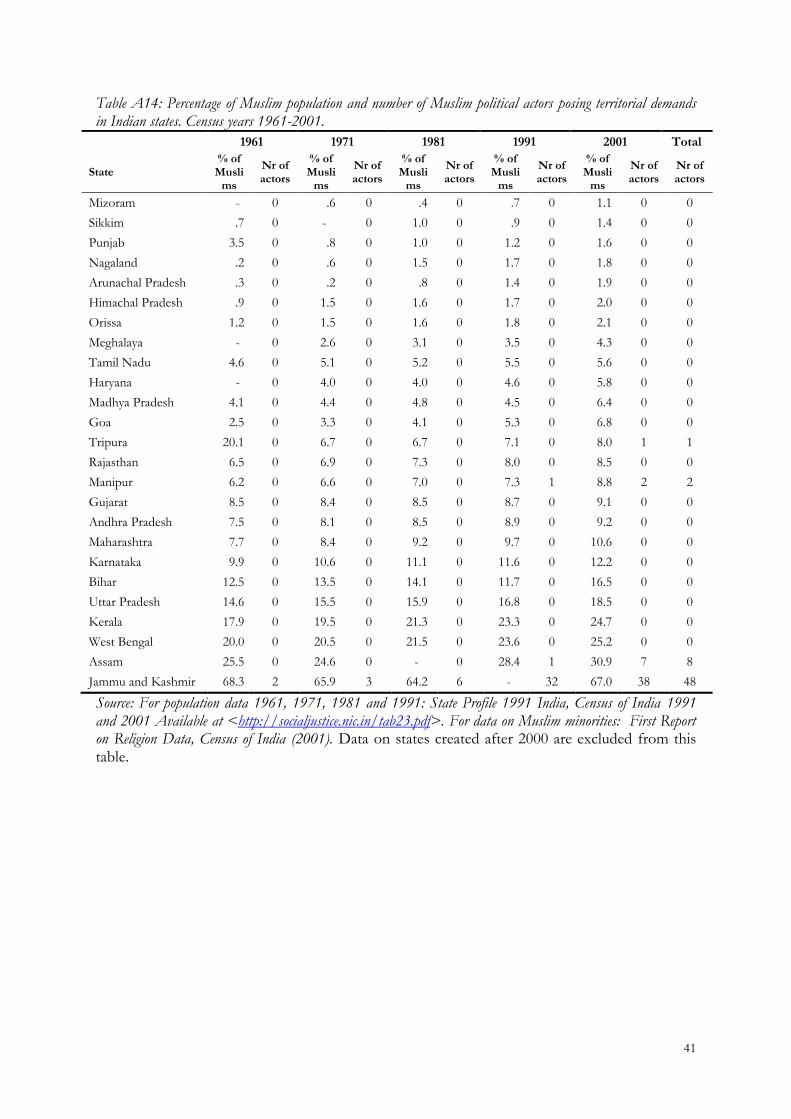
Table A14 reports census data on the size of the Muslim minority for all states for each
census between 1961 and 2001 and on the number of Muslim regional political actors in each
state (we choose to look only at Muslim groups, as they constitute the majority of the religious
actors in our data), and shows that there is little or no relationship between the size of the
Muslim minority in a state and the number of Muslim regional political actors posing territorial
demands. The two states with the largest Muslim minorities, Jammu and Kashmir, and Assam,
have the highest number of Muslim regional political actors. However, in Kerala and West-Bengal,
25
two other states with a substantial Muslim minority, no Muslim actors posing territorial demands
have emerged in the half-century covered by our analysis. The two other states in which Muslim
political organizations have posed territorial demands, Tripura and Manipur, have only a
relatively small Muslim minority (less than 10% of the state population); however, in states such
as Gujarat and Rajasthan, which include a Muslim minority of a similar size, no Muslim
organizations posing territorial demands have emerged. Although this analysis is limited due the
small number of Indian states, it provides some support for the idea that there is no systematic
relationship between the size of a religious minority in a state and the number of regional actors
framing their territorial demands in a religious way.
Types of or Secessionist Conflicts or Demands as the Unit of Analysis
Our unit of analysis is the regional political actors that pose territorial demands. Several of the
tests discussed above aim to control for possible state effects (actors will share characteristics
based on the state they operate in) and, as we have shown, our main finding of the negative
impact of an actor’s religious worldview is robust to these different specifications. In this final
section we discuss the possible effects of the particular territorial conflict (for example, the
conflict in Punjab, or over Jammu and Kashmir, or the other many subnational conflicts of post-
independence India, each of which included several actors) on our findings. We show that our
main finding, namely that demands for autonomy or secession put forward by religious
organizations are likely to prove much more resilient over time than identical demands advanced
by non-religious organizations, is not driven by characteristics of the regional conflict of which
the actor was a part.
To begin with, we believe that there is a reason why regional groups and parties
concerned with the same conflict are fragmented rather than cohesive —that is, although
individual regional political actors may be parties to a broader conflict, their specific demands may
still differ. Moreover, the reasons for moderating demands differ across actors within the same
26
conflict—e.g. some actors are more open to participating in the electoral process, or some are
less prone to use violence as a means of pursuing their territorial demand, ultimately making
them more likely to moderate their demand—as do their periods of existence. Indeed, we often
find that groups and parties moderate their demands at very different points in time, indicating
distinct dynamics for each party and group. For instance, the 3 of a total of 12 actors in Tripura
that moderate their (similar) demand all do so in different years (1983, 1988 and 1997).
Table A15 groups actors by the (broadly similar) conflict on a disputed territory. The most
famous of such conflicts are those that have erupted in Punjab and Jammu and Kashmir, but, as
the table shows, there are many other such territorial conflicts involving more than one
subnational actor posing territorial demands. Table A16 groups actors by the (broadly similar)
territorial demand posed within each territorial conflict that the actor was involved in. To clarify,
even though several actors can be involved in a certain territorial conflict, each of them may have
territorial demands of different intensity, some of them aiming at territorial autonomy, others at
fully-fledged independence. We should note here though that it is not straightforward to
aggregate groups and parties into broadly similar demands or conflicts, because all demands
differ slightly. We must therefore acknowledge a certain degree of subjectivity in our coding.
Table A17 shows the results from two OLS regression analyses of the percentage of
actors moderating their demands within each broadly defined conflict (Model 1) and demand
(Model 2) on the religious nature of the conflict/demand (actors with the same conflict/demand
tend to be overwhelmingly either non-religious or religious), as well as on the other explanatory
variables. The models are estimated with robust standard errors clustered by state, to take
account of the fact that neither conflicts nor demands in the same state are necessarily
independent of each other. The main finding is entirely in line with our main analysis, namely
that the broadly defined territorial conflicts and demands in which the regional actors share a
religious identity are significantly less likely to see moderation of demands than the broadly
27
defined territorial conflicts and demands in which the regional actors do not share a religious
identity.
References
Arellano, Manuel, and Stephen Bond. 1991. “Some Tests of Specification for Panel Data: Monte Carlo Evidence and an Application to Employment Equations.” Review of Economic Studies 58: 277-297.
Box-Steffensmeier, Janet, and Bradford Jones. 2004. Event History Modeling: A Guide for Social Scientists. Cambridge: Cambridge University Press.
Box-Steffensmeir, Janet, and Zorn, Christopher. 2001 “Duration Models and Proportional Hazards in Political Science.” American Journal of Political Science, 45, 4: 972-988.
Halaby, Charles. 2004. “Panel Models in Sociological Research: Theory into Practice.” Annual Review of Sociology, 30: 507-544.
28
Tables and Figures for On-Line Appendix Table A1: Percentage of non-religious and religious actors by whether a demand was posed.
Worldview Demand posed Non-religious Religious Total
No demand 49 (104) 26 (25) 42 (129) Demand 51 (110) 74 (71) 58 (181) Total 100 (214) 100 (96) 100 (310)
Note: Number of cases in brackets.
29
Table A2: Coding of state-level variables, for states with regional political actors posing territorial demands.
Forma-tion
Territory change
PR Friendly border state Enemy border state Distance to capital (km)
U.T. or less
Minority state religion
Andhra Pradesh ‘56 - - - - 1499 - -
Arunachal Pradesh ‘72 ‘72, ‘87 ‘58 China <‘62 and >‘88; Myanmar
China ‘62-’88 2484 <‘87 -
Assam ‘56 - ‘58 Bangladesh; Bhutan East Pakistan ‘47-’71 2041 - Muslim
Bihar ‘56 - - Nepal - 1015 - -
Goa ‘61 ‘87 ‘61 - - 1912 <‘87 Christian
Gujarat ‘60 ‘60 - - Pakistan ‘47-‘02 909 - -
Haryana ‘66 ‘66 - - - 238 - -
Jammu and Kashmir ‘56 - ‘90 (China <‘62 and >‘88) Pakistan ‘47-‘02; China ‘62-’88 867 - Muslim
Maharashtra ‘60 ‘60 - - - 1407 - -
Manipur ‘56 ‘72 ’58 Myanmar - 2443 <‘72 Christian
Meghalaya ‘70 ’70, ‘72 ’58 Bangladesh East Pakistan ’47-’71 2059 <‘72 Christian
Mizoram ‘52 ’52, ’72, ‘87 ’58 Bangladesh; Myanmar East Pakistan ’47-’71 2462 <‘87 Christian
Nagaland ‘57 ’57, ‘63 ’58 Myanmar - 2298 <‘63 Christian
Orissa ‘56 - - - - 1745 - -
Punjab ‘56 - ’83, ‘87 - Pakistan ’47-‘02 238 - Sikh
Tamil Nadu ‘56 - - - - 2095 - -
Tripura ‘56 ’72 ’58 Bangladesh East Pakistan ’47-’71 2584 <‘72 -
Uttar Pradesh ‘56 - - China <’62 and >’88; Nepal China ’62-’88 497 - -
West Bengal ‘56 - - Bangladesh; Bhutan; Nepal East Pakistan ’47-’71 1461 - Muslim
Jharkhand ‘00 ‘00 - - - 1162 - -
Uttaranchal ‘00 ‘00 - China >‘88 - 235 - -
Notes: Formation refers to the year in which the territory first obtained the status of a state or Union Territory (U.T.) since the 1956 States Reorganisation Act, or when, what was to become a state, first gained a substantial amount of autonomy. PR = Presidential Rule (only coded when officially applied due to insurgent activities/separatist movements).
30
Table A3: Summary statistics for regional political actors posing demands.
Obs. Mean Std. Dev. Minimum Maximum
Demand moderation 181 0.27 0.45 0 1
Religious (ref.: non-religious)
181 0.39 0.49 0 1
Initial demand (ref.: federated state)
181 0.61 0.49 0 1
Size (ref.: small) 181 0.10 0.30 0 1
Violence used by actor 181 0.59 0.49 0 1
Organization (ref.: group) 181 0.20 0.40 0 1
Territory change 181 0.09 0.29 0 1
Presidential rule 181 0.24 0.43 0 1
State repression 181 0.45 0.50 0 1
Enemy border state 181 0.38 0.49 0 1
Distance to capital (in 1,000km)
181 1.62 0.75 0.24 2.58
State or U.T (ref.: state) 181 0.09 0.28 0 1
SRI 167 0.87 0.23 0.46 1.69
Number of years of existence/until demand moderation
181 12.77 9.45 1 62
Note: For the State Relative Income (SRI) the mean of all actors’ average SRI across all years of existence is given. Violence used by actor, territory change, presidential rule, state repression, and state or U.T. are coded ‘1’ for actors if they occurred at any point during an actor’s existence. For all other variables the mean and standard deviation are given for the last years in which actors existed.
31
Table A4: Frequencies for regional political actors posing territorial demands.
Observations Percentage
Minority state religion:
No minority 37 20.44
Muslim minority 89 49.17
Christian minority 46 25.41
Other minority 9 4.97
Total 181 100.00
State:
Andhra Pradesh 4 2.21
Arunachal Pradesh 2 1.10
Assam 33 18.23
Goa 1 0.55
Gujarat 1 0.55
Haryana 2 1.10
Jammu and Kashmir 51 28.18
Maharashtra 2 1.10
Manipur 19 10.50
Meghalaya 10 5.52
Mizoram 10 5.52
Nagaland 6 3.31
Orissa 1 0.55
Punjab 9 4.97
Tamil Nadu 6 3.31
Tripura 12 6.63
Uttar Pradesh 1 0.55
West Bengal 5 2.76
Jharkhand (formerly part of Bihar) 3 1.66
Uttaranchal (formerly part of Uttar Pradesh) 3 1.66
Total 181 100.00
Note: Statistics are based on an actor’s last year of existence. In the following states between 1952 and 2002 no regional actors operated that posed territorial demands: Chhattisgarh, Himachal Pradesh, Karnataka, Kerala, Madhya Pradesh, Rajasthan, and Sikkim.
32
Table A5: Percentage of parties and groups by type of initial territorial demands
Organization Type of demand Group Party Total
Federated state 31 (45) 68 (25) 39 (70) Independence from Indian Union
69 (99) 32 (12) 61 (111)
Total 100 (144) 100 (37) 100 (181)
Note: Number of cases in brackets.
33
Table A6: Log-rank test of equality across strata and univariate Cox proportional hazard model for the independent variables (with robust standard errors and Efron method for dealing with ties).
Log-rank test Univariate Cox model Chi2 P-value Coefficient Robust
S.E. P-value
Religious (ref.: non-religious) 29.64 0.000 -3.47 0.98 0.000 Initial demand (ref.: federated state)
24.78 0.000 -1.49 0.32 0.000
Size (ref.: small) 9.53 0.002 1.03 0.37 0.006 Violence used by actor 26.95 0.000 -1.97 0.44 0.000 Organization (ref.: group) 11.19 0.001 0.98 0.31 0.002 Territory change 103.14 0.000 3.50 0.28 0.000 Presidential rule 1.00 0.316 -35.06 0.26 0.000 State repression 5.14 0.023 -0.97 0.46 0.035 Enemy border state 14.69 0.000 -1.38 0.40 0.001 Distance to capital (in 1,000km)
- 0.53 0.20 0.008
State or U.T. (ref.: state) 8.78 0.003 1.16 0.37 0.002 Minority state religion (ref.: no minority)
14.29 0.003
Muslim minority -0.94 0.39 0.016 Christian minority 0.15 0.36 0.687
Other minority -1.83 0.89 0.040 SRI - -0.50 0.59 0.392
34
Table A7: Cox proportional hazard model for predicting demand moderation, with robust standard errors clustered by state.
Coefficient Robust S.E. P-value
Religious (ref.: non-religious) -6.14 1.08 0.000
Initial demand (ref.: federated state) -2.06 0.99 0.037
Size (ref.: small) 1.15 0.38 0.003
Violence used by actor -2.07 0.40 0.000
Organization (ref.: group) -0.16 0.41 0.698
Territory change 0.60 1.43 0.676
State repression 1.45 0.44 0.001
Enemy border state -6.49 2.26 0.004
Distance to capital (in 1,000km) 0.28 0.45 0.538
State or U.T (ref.: state) -0.53 0.50 0.291
Minority state religion (ref.: no minority)
Muslim minority 0.37 0.36 0.306
Christian minority 0.45 0.45 0.314
Other minority 3.71 1.26 0.003
Initial demand x ln(year) 0.87 0.32 0.007
Territory change x ln(year) 1.21 0.67 0.070
Enemy border state x ln(year) 2.66 0.84 0.002
Number of actors 181
Log pseudolikelihood (df) -149.63 (16)
AIC 331.27
Note: log-time interactions for non-proportionality of some covariates.
35
Table A8: Comparison of different models: a discrete time model without duration dependency; a parametric model with a Weibull distribution; and the Cox proportional hazard model (before correcting for non-proportionality and with Efron method for dealing with ties). All models estimated with robust standard errors.
Discrete time model Weibull model Cox model
Coefficient Robust S.E. P-value Coefficient Robust S.E. P-value Coefficient Robust S.E. P-value
Religious (ref.: non-religious) -3.63 0.78 0.000 -3.70 0.64 0.000 -3.48 0.61 0.000 Initial demand (ref.: federated state) -0.42 0.42 0.318 -0.27 0.42 0.517 -0.43 0.40 0.278 Size (ref.: small) 1.20 0.48 0.013 1.17 0.45 0.008 1.17 0.43 0.007 Organization (ref.: group) -2.07 0.73 0.005 -1.61 0.59 0.007 -1.84 0.60 0.002 Territory change -0.06 0.39 0.883 -0.01 0.35 0.974 -0.02 0.36 0.953 Presidential rule 4.39 0.55 0.000 3.12 0.40 0.000 3.26 0.41 0.000 State repression 1.39 0.77 0.072 0.96 0.51 0.058 1.14 0.55 0.037 Enemy border state -0.47 0.63 0.453 -0.37 0.53 0.482 -0.56 0.56 0.313 Distance to capital (in 1,000km) 0.25 0.34 0.458 0.22 0.31 0.477 0.27 0.33 0.412 State or U.T (ref.: state) -0.83 0.83 0.317 -0.44 0.56 0.437 -0.52 0.62 0.403 Minority state religion (ref.: no minority)
Muslim minority 0.31 0.45 0.496 0.33 0.46 0.472 0.43 0.47 0.364 Christian minority 0.38 0.58 0.509 0.29 0.52 0.584 0.41 0.53 0.434
Other minority 1.94 0.81 0.017 2.00 0.94 0.034 1.93 1.00 0.054 Constant -3.84 0.60 0.000 -4.36 0.76 0.000 /ln_p 0.14 0.10 0.175 1/p 0.87 0.09
Number of actors 181 181 181 Log pseudolikelihood (df) -169.96 (14) -75. 70 (15) -157.01 (13) AIC 367.92 181.39 340.01
36
Table A9: Cox proportional hazard model for predicting demand moderation, without religious worldview.
Coefficient Robust S.E. P-value
Initial demand (ref.: federated state) -2.00 1.03 0.051 Size (ref.: small) 1.06 0.43 0.015 Violence used by actor -2.13 0.60 0.000 Organization (ref.: group) -0.08 0.44 0.858 Territory change 0.87 1.47 0.552 Presidential rule State repression 1.06 0.58 0.070 Enemy border state -3.27 1.19 0.006 Distance to capital (in 1,000km) 0.56 0.39 0.151 State or U.T (ref.: state) -0.30 0.62 0.629 Minority state religion (ref.: no minority)
Muslim minority 0.15 0.52 0.779 Christian minority 0.30 0.52 0.565
Other minority -43.57 . .
Initial demand x ln(year) 0.75 0.50 0.133 Territory change x ln(year) 1.16 0.62 0.062 Enemy border state x ln(year) 0.95 0.48 0.047
Number of actors 180 Log pseudolikelihood (df) -154.86 (14) AIC 337.73
Note: standard errors clustered by actor and log-time interactions for non-proportionality of some covariates. The model excludes the actor Shiromani Akali Dal (SAD). For the dummy variable ‘other minority’ the large negative coefficient and the lack of standard errors is due to the fact that none of the regional actors in states with another minority (i.e. Punjab) moderated their territorial demand after excluding the SAD.
37
Table A10: Cox proportional hazard model for predicting demand moderation, with state fixed-effects.
Coefficient Robust S.E. P-value
Religious (ref.: non-religious) -6.57 1.33 0.000
Initial demand (ref.: federated state) -1.44 1.21 0.232
Size (ref.: small) 1.27 0.63 0.042
Violence used by actor -2.24 0.77 0.004
Organization (ref.: group) -0.13 0.55 0.818
Territory change -0.24 3.64 0.947
State repression 1.47 0.80 0.065
Enemy border state -6.66 2.21 0.003
State or U.T (ref.: state) -2.16 1.09 0.046
Initial demand x ln(year) 0.81 0.50 0.103
Territory change x ln(year) 1.64 1.53 0.285
Enemy border state x ln(year) 2.84 0.85 0.001
State (ref.: Meghalaya)
Andhra Pradesh 2.40 1.01 0.018
Arunachal Pradesh -43.84 . .
Assam 0.87 1.13 0.443
Bihar -44.90 . .
Goa 3.70 1.64 0.024
Gujarat -27.85 . .
Haryana 2.55 1.92 0.183
Jammu and Kashmir -1.48 1.23 0.231
Maharashtra -0.52 1.42 0.716
Manipur 0.58 1.25 0.643
Mizoram 2.39 1.36 0.080
Nagaland 0.89 1.46 0.541
Orissa 2.38 1.04 0.022
Punjab 2.90 1.41 0.040
Tamil Nadu -1.38 1.32 0.292
Tripura 0.52 1.16 0.651
Uttar Pradesh -44.20 . .
West Bengal 0.42 1.09 0.701
Jharkhand -0.04 0.88 0.962
Uttaranchal -0.23 0.91 0.801
Number of actors 181
Log pseudolikelihood (df) -131.98 (28)
AIC 319.96
Note: standard errors clustered by actor and log-time interactions for non-proportionality of some covariates. For the variable state, Meghalaya was chosen as a reference category because it has the average score on the percentage of all actors that moderate their demand in a state. For Arunachal Pradesh, Bihar, Gujarat and Uttar Pradesh the large negative coefficient and the lack of standard errors is due to the fact that none of the regional actors in these states moderated their territorial demand.
38
Table A11: Cox proportional hazard models for predicting demand moderation, excluding selected states.
Model 1:
Excl. Assam Model 2:
Excl. Jammu and Kashmir Model 3:
Excl. Punjab Model 4:
Excl. North-east
Coef. R. S.E. P-value Coef. R. S.E. P-value Coef. R. S.E. P-value Coef. R. S.E. P-value
Religious (ref.: non-religious) -5.95 1.38 0.000 -4.06 0.96 0.000 -47.25 . . -9.47 3.17 0.003
Initial demand (ref.: federated state)
-2.91 1.15 0.011 -1.96 0.99 0.047 -2.34 1.08 0.030 -8.44 2.44 0.001
Size (ref.: small) 1.10 0.50 0.027 1.18 0.44 0.007 1.06 0.44 0.015 3.23 0.76 0.000
Violence used by actor -2.30 0.75 0.002 -2.06 0.64 0.001 -2.08 0.65 0.001 -37.63 1.21 0.000
Organization (ref.: group) -0.26 0.44 0.551 -0.08 0.43 0.849 -0.12 0.40 0.768 0.15 0.62 0.804
Territory change 0.80 1.73 0.644 0.73 1.58 0.645 0.78 1.53 0.609 11.18 6.08 0.066
State repression 1.62 0.67 0.016 1.37 0.63 0.031 1.46 0.62 0.019 -0.07 1.20 0.953
Enemy border state -6.37 2.92 0.029 -6.22 2.15 0.004 -4.74 1.77 0.007 -7.35 3.33 0.027
Distance to capital (in 1,000km)
0.18 0.45 0.693 0.01 0.43 0.982 0.24 0.36 0.511 0.20 0.89 0.824
State or U.T (ref.: state) -0.59 0.67 0.378 -0.56 0.63 0.375 -0.50 0.61 0.413 -1.41 0.72 0.051
Minority state religion (ref.: no minority)
Muslim minority 0.01 0.58 0.993 0.61 0.54 0.262 0.40 0.48 0.396 -0.01 0.95 0.992
Christian minority 0.68 0.58 0.237 0.55 0.58 0.347 0.48 0.53 0.361 omitted
Other minority 3.40 1.40 0.016 1.20 1.20 0.320 omitted 3.30 1.49 0.026
Initial demand x ln(year) 1.13 0.51 0.029 0.97 0.46 0.035 1.05 0.50 0.034 2.65 0.98 0.007
Territory change x ln(year) 1.10 0.74 0.135 1.15 0.68 0.089 1.11 0.64 0.086 -2.14 1.88 0.255
Enemy border state x ln(year) 2.64 1.02 0.010 2.65 0.81 0.001 1.90 0.67 0.005 3.72 1.41 0.008
Number of actors 148 130 172 89
Log pseudolikelihood (df) -100.08 (16) -144.64 (16) -147.40 (14) -24.20 (15)
AIC 232.16 321.27 322.79 78.40
Note: standard errors clustered by actor and log-time interactions for non-proportionality of some covariates. The large negative coefficient for religious worldview in Model 3, and the lack of standard errors, is due to the fact that none of the religious actors included in this model moderated their territorial demand.
39
Table A12: Cox proportional hazard models for predicting demand moderation, alternative specifications of dependent variables.
Model 1: Excl. actors
shifting up
Model 2: Excl. actors with LTS
demand
Model 3: Controlling for
different types of demand
Coef. R.
S.E. P-
value Coef.
R. S.E.
P-value
Coef. R.
S.E. P-
value
Religious (ref.: non-religious)
-6.09 1.14 0.000 -6.09 1.16 0.000 -5.80 1.16 0.000
Initial demand (ref.: federated state/less than state)
-2.08 0.96 0.030 -2.22 0.96 0.020 -
Initial demand (ref.: federated state)
Less than state - - -1.98 1.11 0.074
Secession from India - - -2.31 1.04 0.026
Size (ref.: small) 1.08 0.43 0.013 1.11 0.44 0.013 1.23 0.44 0.005
Violence used by actor -2.10 0.68 0.002 -2.14 0.63 0.001 -2.28 0.65 0.000
Organization (ref.: group) -0.16 0.41 0.706 -0.07 0.44 0.880 -0.22 0.42 0.605
Territory change 0.79 1.65 0.633 0.90 1.59 0.573 0.13 1.71 0.939
State repression 1.40 0.66 0.033 1.35 0.60 0.025 1.59 0.63 0.012
Enemy border state -6.45 2.29 0.005 -6.23 2.47 0.012 -6.19 2.44 0.011
Distance to capital (in 1,000km)
0.34 0.38 0.371 0.14 0.39 0.727 0.19 0.38 0.616
State or U.T (ref.: state) -0.51 0.61 0.401 -0.45 0.80 0.577 -0.83 0.69 0.228
Minority state religion (ref.: no minority)
Muslim minority 0.55 0.49 0.267 0.62 0.51 0.228 0.45 0.49 0.361
Christian minority 0.41 0.56 0.457 0.78 0.54 0.150 0.62 0.53 0.244
Other minority 3.82 1.27 0.003 3.78 1.34 0.005 3.78 1.35 0.005
Initial demand x ln(year) 0.87 0.43 0.044 1.05 0.42 0.013 -
Initial demand (ref.: federated state)
Less than state x ln(year) - - 1.34 0.49 0.007
Secession from India x ln(year)
- - 1.07 0.45 0.017
Territory change x ln(year) 1.14 0.68 0.094 1.12 0.68 0.099 1.51 0.74 0.041
Enemy border state x ln(year)
2.62 0.81 0.001 2.53 0.85 0.003 2.43 0.88 0.006
Number of actors 172 173 181
Log pseudolikelihood (df) -146.82 (16) -125.83 (16) -147.23 (18)
AIC 325.63 283.66 330.46
Note: standard errors clustered by actor and log-time interactions for non-proportionality of some covariates.
40
Table A13: Dynamic panel-data model predicting the number of religious groups and parties in a state in each year, with repression measured as the number of continuous years that Presidential Rule was applied in a state because of insurgent activities and/or separatist movements, and/or that at least one of the regional political actors -- regardless of its worldview -- in a state faced repression, 1950-2002.
Coefficient Robust S.E.
P-value
Constant 0.07 0.04 0.132 Lag (Number of religious parties and groups) 1.04 0.02 0.000 Lag (Number of years of successive repression) -0.06 0.06 0.320
Number of observations 891 Number of states 19 Arellano-Bond test first-order serial correlation z = -1.34 Pr>z = 0.179 Arellano-Bond test second-order serial correlation z = -0.36 Pr>z = 0.722 Wald test Chi2 (2) = 1.1e+07 Pr>chi2 = 0.000
Note: Arellano-Bond estimator (Arellano and Bond, 1991) is used to estimate the model.
41
Table A14: Percentage of Muslim population and number of Muslim political actors posing territorial demands in Indian states. Census years 1961-2001.
1961 1971 1981 1991 2001 Total
State % of
Muslims
Nr of actors
% of Musli
ms
Nr of actors
% of Musli
ms
Nr of actors
% of Musli
ms
Nr of actors
% of Musli
ms
Nr of actors
Nr of actors
Mizoram - 0 .6 0 .4 0 .7 0 1.1 0 0
Sikkim .7 0 - 0 1.0 0 .9 0 1.4 0 0
Punjab 3.5 0 .8 0 1.0 0 1.2 0 1.6 0 0
Nagaland .2 0 .6 0 1.5 0 1.7 0 1.8 0 0
Arunachal Pradesh .3 0 .2 0 .8 0 1.4 0 1.9 0 0
Himachal Pradesh .9 0 1.5 0 1.6 0 1.7 0 2.0 0 0
Orissa 1.2 0 1.5 0 1.6 0 1.8 0 2.1 0 0
Meghalaya - 0 2.6 0 3.1 0 3.5 0 4.3 0 0
Tamil Nadu 4.6 0 5.1 0 5.2 0 5.5 0 5.6 0 0
Haryana - 0 4.0 0 4.0 0 4.6 0 5.8 0 0
Madhya Pradesh 4.1 0 4.4 0 4.8 0 4.5 0 6.4 0 0
Goa 2.5 0 3.3 0 4.1 0 5.3 0 6.8 0 0
Tripura 20.1 0 6.7 0 6.7 0 7.1 0 8.0 1 1
Rajasthan 6.5 0 6.9 0 7.3 0 8.0 0 8.5 0 0
Manipur 6.2 0 6.6 0 7.0 0 7.3 1 8.8 2 2
Gujarat 8.5 0 8.4 0 8.5 0 8.7 0 9.1 0 0
Andhra Pradesh 7.5 0 8.1 0 8.5 0 8.9 0 9.2 0 0
Maharashtra 7.7 0 8.4 0 9.2 0 9.7 0 10.6 0 0
Karnataka 9.9 0 10.6 0 11.1 0 11.6 0 12.2 0 0
Bihar 12.5 0 13.5 0 14.1 0 11.7 0 16.5 0 0
Uttar Pradesh 14.6 0 15.5 0 15.9 0 16.8 0 18.5 0 0
Kerala 17.9 0 19.5 0 21.3 0 23.3 0 24.7 0 0
West Bengal 20.0 0 20.5 0 21.5 0 23.6 0 25.2 0 0
Assam 25.5 0 24.6 0 - 0 28.4 1 30.9 7 8
Jammu and Kashmir 68.3 2 65.9 3 64.2 6 - 32 67.0 38 48
Source: For population data 1961, 1971, 1981 and 1991: State Profile 1991 India, Census of India 1991 and 2001 Available at <http://socialjustice.nic.in/tab23.pdf>. For data on Muslim minorities: First Report on Religion Data, Census of India (2001). Data on states created after 2000 are excluded from this table.
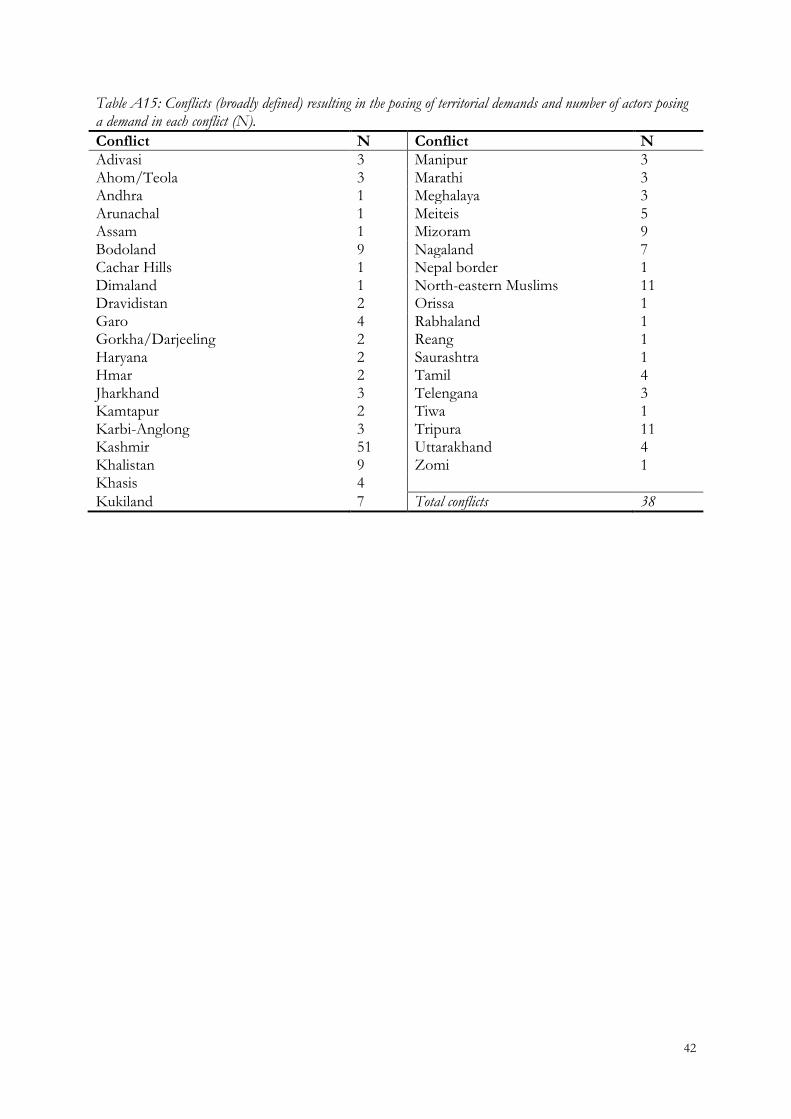
42
Table A15: Conflicts (broadly defined) resulting in the posing of territorial demands and number of actors posing a demand in each conflict (N).
Conflict N Conflict N
Adivasi 3 Manipur 3 Ahom/Teola 3 Marathi 3 Andhra 1 Meghalaya 3 Arunachal 1 Meiteis 5 Assam 1 Mizoram 9 Bodoland 9 Nagaland 7 Cachar Hills 1 Nepal border 1 Dimaland 1 North-eastern Muslims 11 Dravidistan 2 Orissa 1 Garo 4 Rabhaland 1 Gorkha/Darjeeling 2 Reang 1 Haryana 2 Saurashtra 1 Hmar 2 Tamil 4 Jharkhand 3 Telengana 3 Kamtapur 2 Tiwa 1 Karbi-Anglong 3 Tripura 11 Kashmir 51 Uttarakhand 4 Khalistan 9 Zomi 1 Khasis 4
Kukiland 7 Total conflicts 38
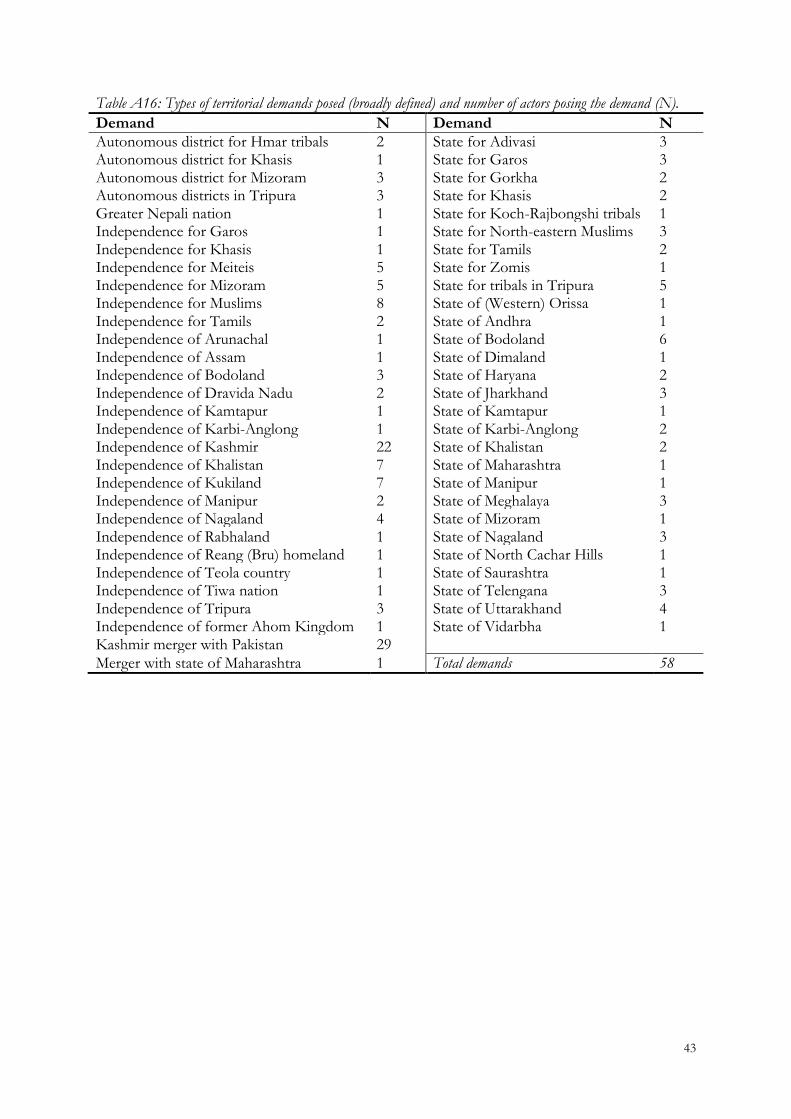
43
Table A16: Types of territorial demands posed (broadly defined) and number of actors posing the demand (N).
Demand N Demand N
Autonomous district for Hmar tribals 2 State for Adivasi 3 Autonomous district for Khasis 1 State for Garos 3 Autonomous district for Mizoram 3 State for Gorkha 2 Autonomous districts in Tripura 3 State for Khasis 2 Greater Nepali nation 1 State for Koch-Rajbongshi tribals 1 Independence for Garos 1 State for North-eastern Muslims 3 Independence for Khasis 1 State for Tamils 2 Independence for Meiteis 5 State for Zomis 1 Independence for Mizoram 5 State for tribals in Tripura 5 Independence for Muslims 8 State of (Western) Orissa 1 Independence for Tamils 2 State of Andhra 1 Independence of Arunachal 1 State of Bodoland 6 Independence of Assam 1 State of Dimaland 1 Independence of Bodoland 3 State of Haryana 2 Independence of Dravida Nadu 2 State of Jharkhand 3 Independence of Kamtapur 1 State of Kamtapur 1 Independence of Karbi-Anglong 1 State of Karbi-Anglong 2 Independence of Kashmir 22 State of Khalistan 2 Independence of Khalistan 7 State of Maharashtra 1 Independence of Kukiland 7 State of Manipur 1 Independence of Manipur 2 State of Meghalaya 3 Independence of Nagaland 4 State of Mizoram 1 Independence of Rabhaland 1 State of Nagaland 3 Independence of Reang (Bru) homeland 1 State of North Cachar Hills 1 Independence of Teola country 1 State of Saurashtra 1 Independence of Tiwa nation 1 State of Telengana 3 Independence of Tripura 3 State of Uttarakhand 4 Independence of former Ahom Kingdom 1 State of Vidarbha 1 Kashmir merger with Pakistan 29
Merger with state of Maharashtra 1 Total demands 58
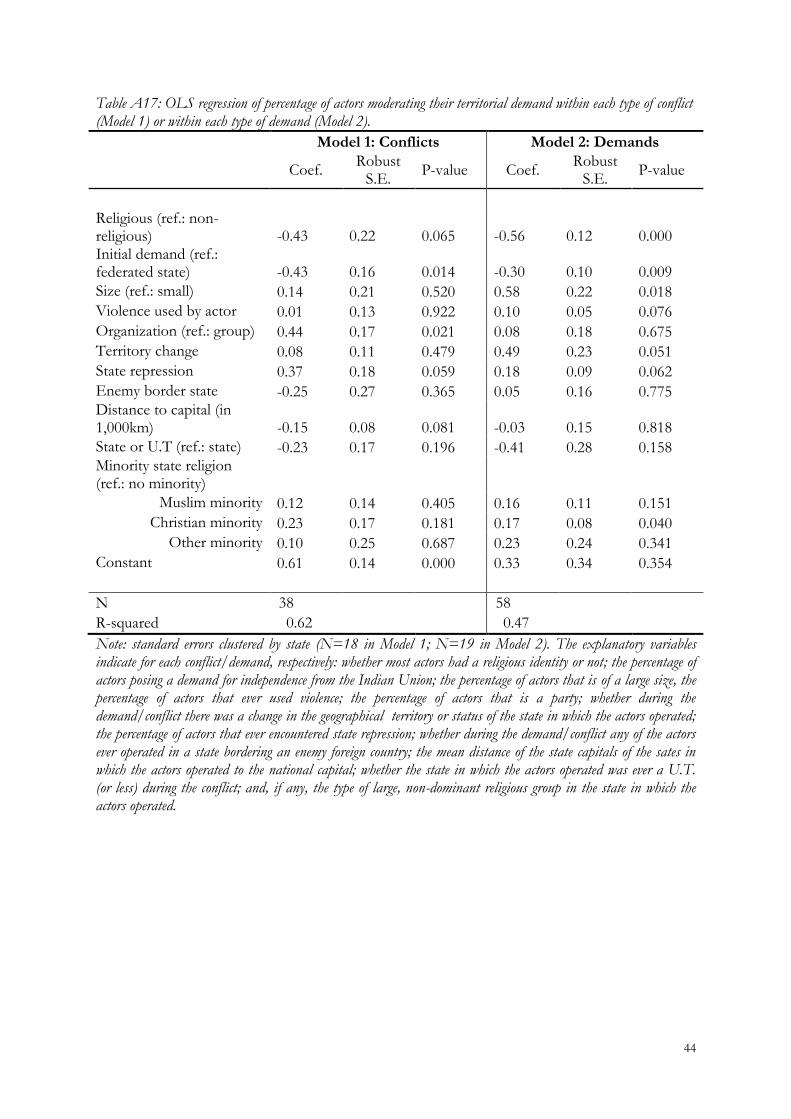
44
Table A17: OLS regression of percentage of actors moderating their territorial demand within each type of conflict (Model 1) or within each type of demand (Model 2).
Model 1: Conflicts Model 2: Demands
Coef. Robust
S.E. P-value Coef.
Robust S.E.
P-value
Religious (ref.: non-religious) -0.43 0.22 0.065 -0.56 0.12 0.000 Initial demand (ref.: federated state) -0.43 0.16 0.014 -0.30 0.10 0.009
Size (ref.: small) 0.14 0.21 0.520 0.58 0.22 0.018
Violence used by actor 0.01 0.13 0.922 0.10 0.05 0.076
Organization (ref.: group) 0.44 0.17 0.021 0.08 0.18 0.675
Territory change 0.08 0.11 0.479 0.49 0.23 0.051
State repression 0.37 0.18 0.059 0.18 0.09 0.062
Enemy border state -0.25 0.27 0.365 0.05 0.16 0.775 Distance to capital (in 1,000km) -0.15 0.08 0.081 -0.03 0.15 0.818
State or U.T (ref.: state) -0.23 0.17 0.196 -0.41 0.28 0.158 Minority state religion (ref.: no minority)
Muslim minority 0.12 0.14 0.405 0.16 0.11 0.151
Christian minority 0.23 0.17 0.181 0.17 0.08 0.040
Other minority 0.10 0.25 0.687 0.23 0.24 0.341
Constant 0.61 0.14 0.000 0.33 0.34 0.354
N 38 58
R-squared 0.62 0.47
Note: standard errors clustered by state (N=18 in Model 1; N=19 in Model 2). The explanatory variables indicate for each conflict/demand, respectively: whether most actors had a religious identity or not; the percentage of actors posing a demand for independence from the Indian Union; the percentage of actors that is of a large size, the percentage of actors that ever used violence; the percentage of actors that is a party; whether during the demand/conflict there was a change in the geographical territory or status of the state in which the actors operated; the percentage of actors that ever encountered state repression; whether during the demand/conflict any of the actors ever operated in a state bordering an enemy foreign country; the mean distance of the state capitals of the sates in which the actors operated to the national capital; whether the state in which the actors operated was ever a U.T. (or less) during the conflict; and, if any, the type of large, non-dominant religious group in the state in which the actors operated.
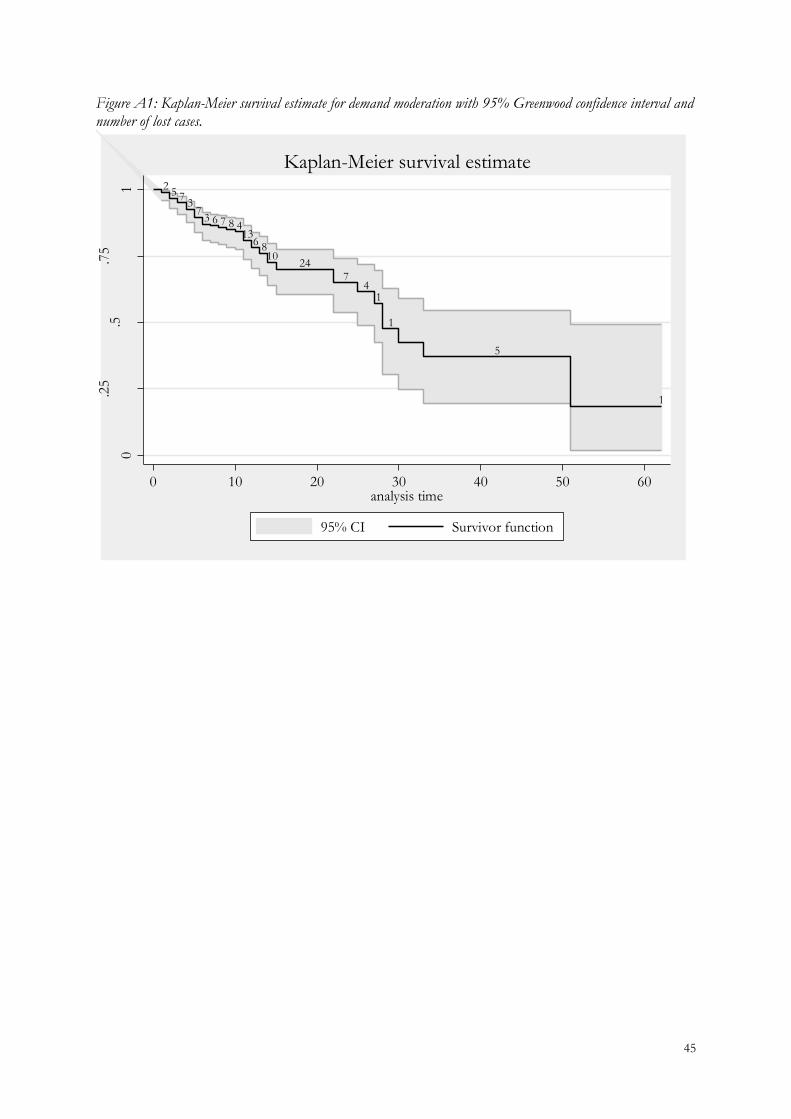
45
Figure A1: Kaplan-Meier survival estimate for demand moderation with 95% Greenwood confidence interval and number of lost cases.
25 7
37
3 6 7 8 413
6 810
24
74
1
1
5
1
0
.25
.5.7
5
1
0 10 20 30 40 50 60analysis time
95% CI Survivor function
Kaplan-Meier survival estimate