Embed Size (px)
Citation preview
When Van Gogh meets Mandelbrot:Multifractal Classification of Painting’s Texture
P. Abry(1), H. Wendt(2), S. Jaffard(3)
(1) Physics Dept., ENS Lyon, CNRS, Lyon, France,(2) IRIT - ENSEEIHT, Toulouse Univ., CNRS, Toulouse, France
(3) Math. Dept., Paris Est Univ., Creteil, France,[email protected], perso.ens-lyon.fr/patrice.abry
Abstract
Recently, a growing interest has emerged for examining the potential of Image Processingtools to assist Art Investigation. Simultaneously, several research works showed the interestof using multifractal analysis for the description of homogeneous textures in images. In thiscontext, the goal of the present contribution is to study the benefits of using the wavelet leaderbased multifractal formalism to characterize paintings. After a brief review of the underlying keytheoretical concepts, methods and tools, two sets of digitized paintings are analyzed. The firstone, the Princeton Experiment, consists of a set of seven paintings and their replicas, made by thesame artist. It enables examination of the potential of multifractal analysis in forgery detection.The second one is composed of paintings by Van Gogh and contemporaries, made availableby the Van Gogh and Kroeller-Mueller Museums (Netherlands) in the framework of the Imageprocessing for Art Investigation research program. It enables us to show various differencesin the regularity of textures of Van Gogh’s paintings from different periods, or between VanGogh’s and contemporaries’ paintings. These preliminary results plead for the constitution ofinterdisciplinary research teams consisting of experts in art, image processing, mathematics andcomputer sciences.
Keywords: Image Processing, Texture Classification, Regularity, Multifractal Analysis,Wavelet Leaders, Paintings, Van Gogh, Forgery Detection, Period Dating.
1. Introduction
Image Processing for Art Investigation. The ever growing power of digital devices (fasterprocessors, better computers, higher resolution scanners, larger storage facilities,. . . ) naturallyand unavoidably gave birth to the desire of using such tools for Art Investigation. Yet, it is onlyrecently, at the turn of the 3rd millennium, that conditions were met to transform this desireinto some form of reality. Various research groups started to apply standard image processingtools to digitized painting, to develop new procedures, or to customize existing ones to meet thespecificities of such an application (cf. [19] for an example of early an contribution, [17, 20] forreview notes, and [12, 21, 22, 8] for presentations of state-of-the-art and/or joint recent researchcontributions). With the development of computer-assisted and statistical signal-image process-ing tools, it is not the aim of scientists to supplant art historians, but rather to provide them withadditional attributes that can be extracted automatically using objective and reproducible criteria.
This will allow progress by diversification of the tools at hand. For paintings, it may for instancehelp to assess quantitative measures related to stylometry, brushstrokes, texture, etc. (cf. e.g.[24] and [13], where digital texture and brushstroke features are used to characterize paintings ofVan Gogh). This may contribute to the formulation of answers to questions such as, what periodwas a painting created, is a painting authentic or a forgery, and has it been correctly attributed toan artist.
Wavelet and Fractal for Image Processing. Over the last 15 years, elaborating on multireso-lution decomposition and filter banks, wavelet analysis has become one of the inescapable imageprocessing tool. In essence, wavelet coefficients evaluate the content of an image at a givenspace position x = (x1, x2) and a given analysis scale a. Wavelet coefficients usually take largevalues when the corresponding wavelet is located on any of the contours of the image, whilethey fluctuate around small values when the wavelet is located inside smooth textures. For anintroduction, review and examples, the reader is referred to e.g., [14]. The statistical propertiesof wavelet coefficients have already been successfully used in stylistic analysis of paintings andforgery detection, cf. e.g., [9, 12, 15].
Fractal geometry refers to an analysis paradigm that relies on the idea that the richest part ofthe information to be extracted from an image lies in the way the statistics of some space-scaledependent quantities vary as a function of the analysis scale a. In other words, instead of basingthe analysis on the search of specific features of space-scales, it is preferred to postulate that allspace-scales are jointly and equally important and that the key information lies in the mecha-nisms relating them to each other. This dependence is usually postulated in the form of powerlaws: aζ (with ζ referred to as the scaling exponent) which explains why fractal is also termedscaling or scale invariance. Wavelet analysis consists in decomposing an image on elementaryshapes (the wavelet basis) which are all deduced from three fundamental functions, the motherwavelets, by translation and dilation, see Eq. (1). Scaling invariance properties of the image willimply power-law behaviors of the wavelet coefficients. Therefore, in essence, wavelets consti-tute a natural decomposition system for characterizing fractal properties of images. Fractal toolscan be used both for the analysis of contours and textures. There is a rich literature discussingthe relevance of fractal paradigms to analyze or model natural images, a recent and interestingreview can be consulted in [4]. In the context of Art, it was used in [18] to characterize some ofJackson Pollock’s masterpieces.
Goals, contributions and outline. Beyond fractal analysis, essentially aiming at character-izing how irregular an object is globally by means of a single scaling exponent, multifractalanalysis consists of a signal/image processing tool that concentrates on describing the fluctua-tions along space of the local regularity of the object, which requires the use of whole collectionsof scaling exponents. While popular for the analysis of 1D signals, multifractal analysis re-mained rarely used in image processing applications for both theoretical and practical reasons(cf. a contrario [2]). However, this situation has recently been changed when it was shown thata theoretically sound and practically efficient formulation of multifractal analysis could be ob-tained on the basis of wavelet leaders, a simple construction elaborating on 2D discrete wavelettransform coefficients, cf. [10, 11, 28, 30, 1]. This wavelet leader multifractal analysis consti-tutes a powerful tool for the analysis of textures in images, as detailed theoretically in [30] andexplored practically in [29].
The present contribution aims at exploring the potential of the wavelet leader multifrac-tal analysis for art painting texture classification. First (cf. Section 2), the principles and
2
practical procedures underlying the wavelet leader multifractal analysis will be presented ina manner geared towards practitioners (hence avoiding theoretical developments and proofs,for which the reader will be referred to earlier publications). These procedures will be illus-trated on several paintings. Then (cf. Section 3), it will be shown when and how the waveletleader multifractal analysis enables to discriminate between original paintings and replicas. Thiswill be embedded in the context of an original experiment conducted by the Machine Learn-ing and Image Processing for Art Investigation Research Group at Princeton University (cf.www.math.princeton.edu/ipai/index.html). Finally (cf. Section 4), the wavelet leadermultifractal analysis will be applied to a set of Van Gogh’s and contemporaries’ paintings, madeavailable by the Van Gogh and Kroller-Muller Museums (The Netherlands) within the ImageProcessing for Art Investigation research project (cf. www.digitalpaintinganalysis.org/).
2. Multifractal Analysis
2.1. Wavelet Coefficients and Global Regularity
2.1.1. 2D Discrete Wavelet TransformAn orthonormal wavelet basis in two dimensions is constructed from three smooth, com-
pactly supported functions ψ(1), ψ(2), ψ(3), which are chosen such that the system
ψ(m)j,(k1,k2)(x1, x2) = 2− jψ(m)(2− jx1 − k1, 2− jx2 − k2), j, k1, k2 ∈ Z,m = 1, 2, 3 (1)
constitutes an orthonormal basis of L2(R2). This system is called a wavelet basis, and the threefunctions ψ(1), ψ(2), ψ(3) its mother wavelets. Let X(x) (with x = (x1, x2)) denote a gray levelimage. We denote by D(m)
X ( j,k) (with k = (k1, k2), m = 1, 2, 3) the coefficients of the image Xon this wavelet basis, which are given by the inner product with the basis functions, D(m)
X ( j,k) =
〈X|ψij,k〉. Note that in practice these wavelet coefficients are not computed as integrals, but using
the classical pyramidal recursive algorithm supplied by the fast wavelet transform. Qualitatively,the coefficient D(m)
X ( j,k) measures the amount of energy of the image X that is contained, inthe spatial neighborhood of width ∼ 2 j located at position (2 jk1, 2 jk2), in the frequency bandslocalized around ±2− j. For an introduction to the 2D Discrete Wavelet Transform (2D DWT),the reader is referred to e.g., [14].
In the present contribution, it has been chosen to work with mother wavelets obtained as ten-sor products of the minimal compact support Daubechies wavelet families, which are parametrizedby their number of vanishing moments Nψ [5]. It has been discussed elsewhere that this familyhas ideal theoretical and practical properties with respect to scaling and fractal analysis (cf. e.g.,[26]).
While the standard 2D DWT naturally outputs L2 normalized wavelet coefficients, for scal-ing or fractal analysis, the L1 normalization d(m)
X ( j, k1, k2) = 2− jD(m)X ( j, k1, k2) is better suited and
will hence be used from now on: Indeed, this normalization implies that scale invariance andpointwise regularity properties in data are reflected by scale invariance properties in wavelet co-efficients with same scaling exponents (cf. e.g., [2, 28]). More technically, pointwise Holderregularity is defined by a local L∞ decay condition; the wavelet normalization should thereforebe of L∞-type for the function considered and, by duality, of L1 type for its wavelet coefficients.Using the correct normalization plays a key-role in the definition of wavelet leaders (cf. Section2.2.1) [10].
3

2.1.2. Global regularityThe wavelet coefficients d(m)
X ( j,k) enable to define and measure a property of X which playsa key role for fractal analysis: Its global regularity hm, defined as
hm = sup{ε : X ∈ Cε}, (2)
where X(x) is said to belong to Cε , ε ∈ R, iff:
∃C > 0 : ∀ j, k1, k2,m |d(m)X ( j, k1, k2)| ≤ C2 jε . (3)
An intuitive interpretation of hm is postponed to Section 2.3.It follows from (3) that
hm = lim inf2 j→0
log(
supm,k1,k2
|d(m)X ( j, k1, k2)|
)log(2 j)
. (4)
Practically, this implies that hm can be measured by performing linear regressions of the log ofthe magnitudes of the largest wavelet coefficients at scales 2 j versus the log of the scales a = 2 j
[28, 30].
2.2. Wavelet leader multifractal formalismThe purpose of multifractal analysis is to enable image classification based on exponents
characterizing the power-law behaviors of (space-averaged) space-scale quantities with respectto scale. Various such quantities were proposed in the past; however, a natural interpretation ofmultifractal analysis (in terms of a multifractal spetrum, see Section 2.3) requires it to be basedon wavelet leaders, which we define now.
2.2.1. Wavelet leadersLet λ j,k1,k2 denote the dyadic square
λ j,k1,k2 = [k12 j, (k1 + 1)2 j) × [k22 j, (k2 + 1)2 j),
and denote by 3λ j,k1,k2 the union of λ j,k1,k2 and its 8 closest neighbours,
3λ j,k1,k2 = [(k1 − 1)2 j, (k1 + 2)2 j) × [(k2 − 1)2 j, (k2 + 2)2 j).
Let γ ≥ 0 be defined as, with ε > 0,
γ =
{0 if hm > 0,−hm + ε if hm ≤ 0. (5)
The wavelet leaders L(γ)X are defined as [10, 11, 28]:
L(γ)X ( j, k1, k2) = sup
m, λ′⊂3λ j,k1 ,k2
|2γ jd(m)X (λ′)|. (6)
In words, this means that for each node ( j, k1, k2) of the dyadic grid, the corresponding waveletleader L(γ)
X ( j, k1, k2) is obtained by replacing the wavelet coefficient d(m)X ( j, k1, k2) by the largest
4
of all the |2γ jd(m)X (λ′)| that are located at scales finer or equal to 2 j within a small neighborhood
around the position (x1 = 2 jk1, x2 = 2 jk2). This construction is illustrated in Fig. 1. Mathemat-ically, the renormalization of the wavelet coefficients by a pre-factor 2γ j in Eq. (6) is equivalentto replacing the initial image by its fractional integral of order γ and amounts to increasing itsglobal regularity exponent hm by γ. This renormalization ensures that wavelet Leaders, as de-fined in Eq. (6) above, are mathematically well defined (cf. [28, 30, 1]). The precise practicalselection of parameter γ is detailed in Section 2.5.
2.2.2. Multifractal FormalismMultifractal analysis consists in measuring the exponents of power-laws of the space averages
of wavelet leaders across the scales available in the data. One introduces an additional parameterq and computes space averages of the q-th order of the wavelet leaders at a given scale a = 2 j,
S (2 j, q, γ) =1n j
∑k1,k2
L(γ)X ( j, k1, k2)q, (7)
where n j is the number of wavelet leaders actually computed at scale a = 2 j. The scaling functionof the image is then defined as
ζ(q, γ) = lim inf2 j→0
log(S (2 j, q, γ))log(2 j)
. (8)
Note that, by construction, the scaling function is concave with respect to q [11]. Hence, it isassumed that the S (2 j, q, γ) behave as power laws with respect to the analysis scale a = 2 j, in thelimit of fine scales 2 j → 0:
S (2 j, q, γ) ∼ λq2 jζ(q,γ) when j→ −∞, (9)
From a practical perspective, it is expected that this power law behavior is not limited to finescales only, but holds over a broad range of scales. Therefore, the quantities ζ(q, γ) are alsoreferred to as the scaling exponents. These power law behaviors constitute the founding relationconnecting the concepts of (multi)fractal and scale invariance. Moreover, it is fundamental tonote that multifractal analysis requires the use of both positive and negative values of q to fullycharacterize the fractal properties of X. This will be further discussed in Section 2.3 (cf. e.g.,[10, 11, 28]).
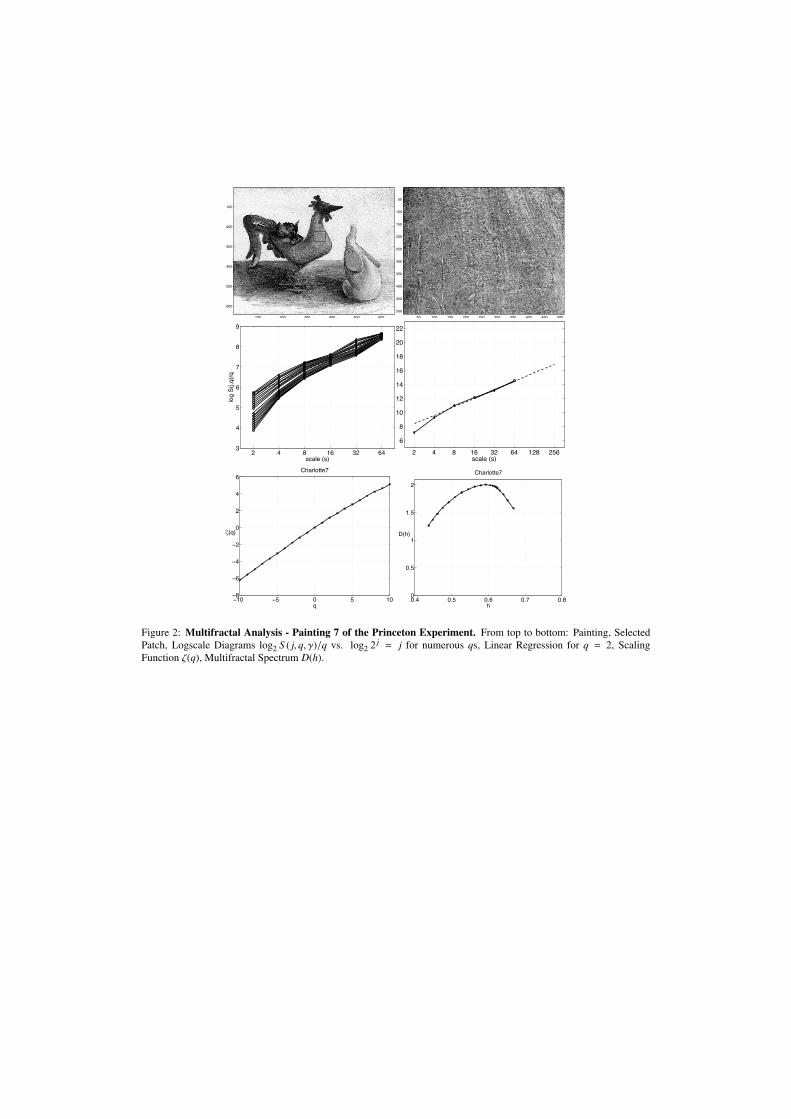
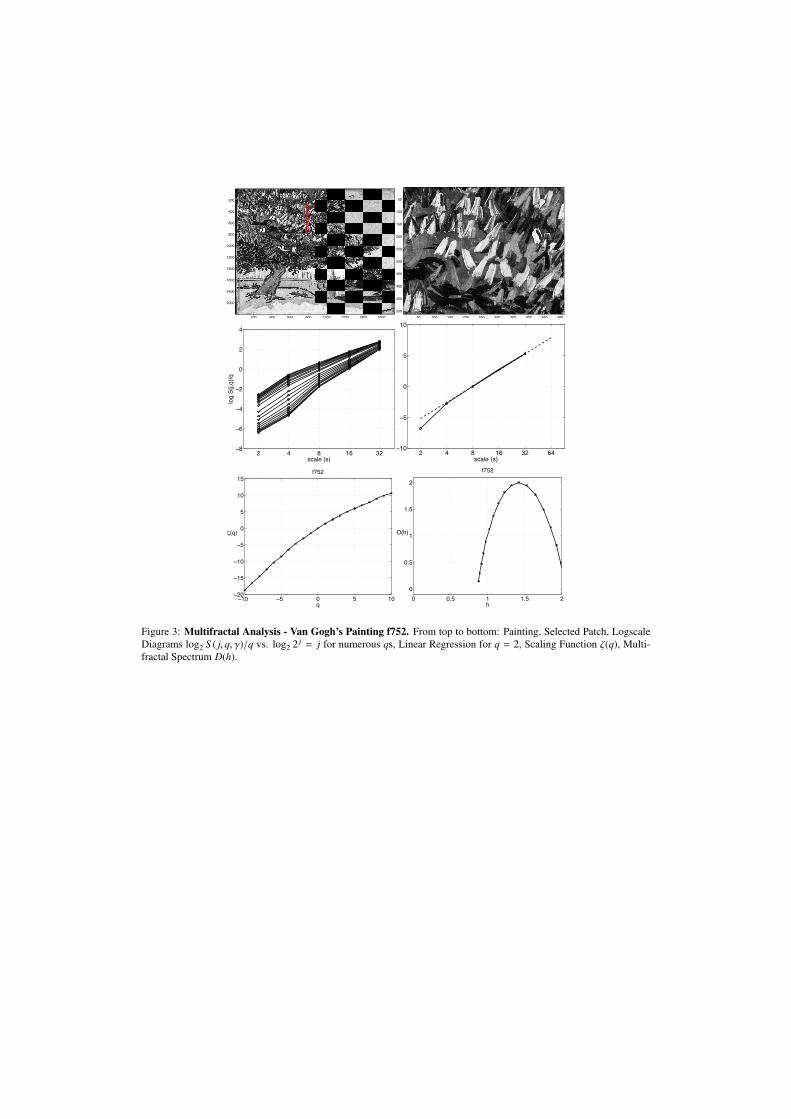
The scaling function ζ(q, γ) characterizes the fractal properties of the image X [28] and canbe involved in any of the usual image processing tasks, such as characterization, model selection,classification, detection, etc. This fractal characterization has been successfully adopted in imageclassification procedures (cf. e.g., [30]). Scaling functions obtained from one of the Princetonpaintings and one of the Van Gogh’s paintings are illustrated in Figs. 2 and 3, bottom row.
Because the practical measure of the function ζ(q, γ) for all q can be tedious and its use forhypothesis testing intricate, it has been proposed to use a polynomial expansion in the neigh-boorhood of q = 0 by [3, 6]:
ζ(q, γ) =∑p≥1
c(γ)p
qp
p !. (10)
Though this expansion may not be valid in certain specific cases, its power still lies in the factthat, when well-defined, the coefficients c(γ)
p can be estimated directly (without the burden of5
estimating the ζ(q, γ) themselves), as they relate to the scale dependence of the cumulant oforder p of the quantities ln L(γ)
X ( j, k1, k2) (cf. [3, 6]). Therefore, in practice, it is often preferred todirectly estimate the first values of the c(γ)
p s and work with a truncated version of the expansionEq. (10) as an approximation of ζ(q, γ). (By concavity of the scaling function, note that c(γ)
2 ≤ 0.)
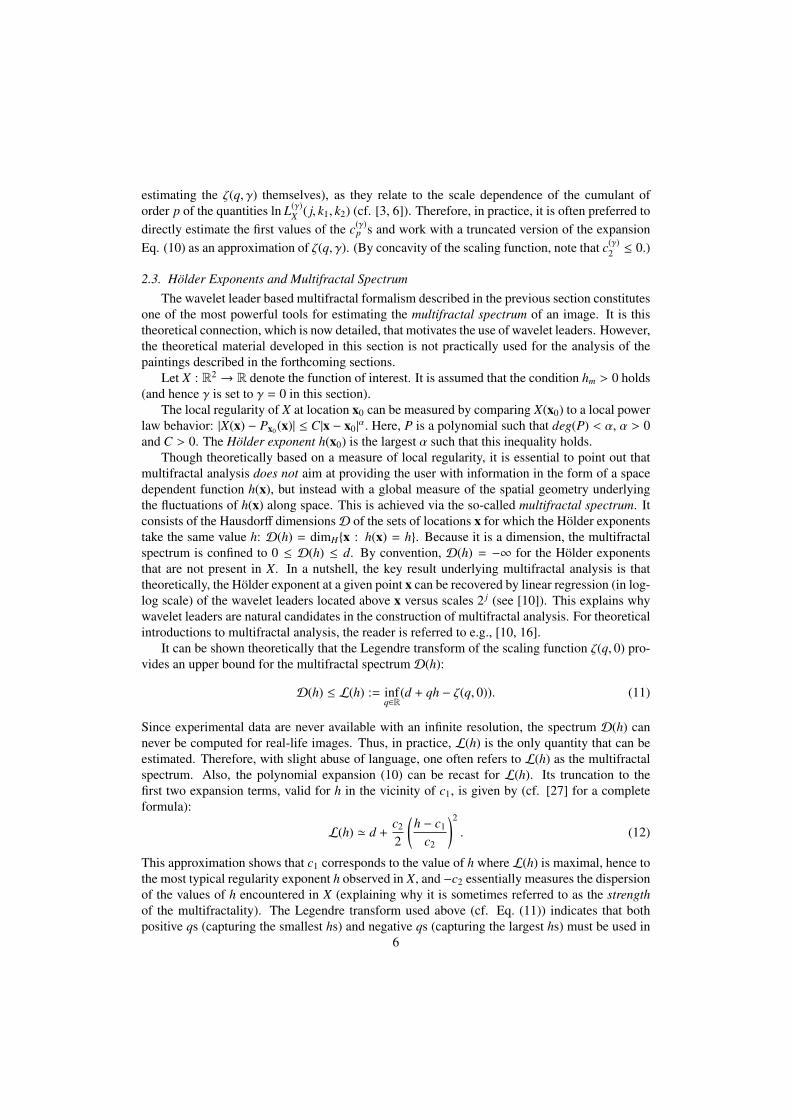
2.3. Holder Exponents and Multifractal SpectrumThe wavelet leader based multifractal formalism described in the previous section constitutes
one of the most powerful tools for estimating the multifractal spectrum of an image. It is thistheoretical connection, which is now detailed, that motivates the use of wavelet leaders. However,the theoretical material developed in this section is not practically used for the analysis of thepaintings described in the forthcoming sections.
Let X : R2 → R denote the function of interest. It is assumed that the condition hm > 0 holds(and hence γ is set to γ = 0 in this section).
The local regularity of X at location x0 can be measured by comparing X(x0) to a local powerlaw behavior: |X(x) − Px0 (x)| ≤ C|x − x0|
α. Here, P is a polynomial such that deg(P) < α, α > 0and C > 0. The Holder exponent h(x0) is the largest α such that this inequality holds.
Though theoretically based on a measure of local regularity, it is essential to point out thatmultifractal analysis does not aim at providing the user with information in the form of a spacedependent function h(x), but instead with a global measure of the spatial geometry underlyingthe fluctuations of h(x) along space. This is achieved via the so-called multifractal spectrum. Itconsists of the Hausdorff dimensionsD of the sets of locations x for which the Holder exponentstake the same value h: D(h) = dimH{x : h(x) = h}. Because it is a dimension, the multifractalspectrum is confined to 0 ≤ D(h) ≤ d. By convention, D(h) = −∞ for the Holder exponentsthat are not present in X. In a nutshell, the key result underlying multifractal analysis is thattheoretically, the Holder exponent at a given point x can be recovered by linear regression (in log-log scale) of the wavelet leaders located above x versus scales 2 j (see [10]). This explains whywavelet leaders are natural candidates in the construction of multifractal analysis. For theoreticalintroductions to multifractal analysis, the reader is referred to e.g., [10, 16].
It can be shown theoretically that the Legendre transform of the scaling function ζ(q, 0) pro-vides an upper bound for the multifractal spectrumD(h):
D(h) ≤ L(h) := infq∈R
(d + qh − ζ(q, 0)). (11)
Since experimental data are never available with an infinite resolution, the spectrum D(h) cannever be computed for real-life images. Thus, in practice, L(h) is the only quantity that can beestimated. Therefore, with slight abuse of language, one often refers to L(h) as the multifractalspectrum. Also, the polynomial expansion (10) can be recast for L(h). Its truncation to thefirst two expansion terms, valid for h in the vicinity of c1, is given by (cf. [27] for a completeformula):
L(h) ' d +c2
2
(h − c1
c2
)2
. (12)
This approximation shows that c1 corresponds to the value of h where L(h) is maximal, hence tothe most typical regularity exponent h observed in X, and −c2 essentially measures the dispersionof the values of h encountered in X (explaining why it is sometimes referred to as the strengthof the multifractality). The Legendre transform used above (cf. Eq. (11)) indicates that bothpositive qs (capturing the smallest hs) and negative qs (capturing the largest hs) must be used in
6
order to obtain the full curve L(h). Moreover, note that the global regularity exponent hm, whenpositive, corresponds to the smallest value of h that exists in X (i.e., the leftmost point of L(h)for which L(h) , −∞).
Multifractal spectra obtained from one of the Princeton paintings and one of Van Gogh’spaintings are displayed in Figs. 2, and 3 bottom row.
2.4. Estimation Procedures
The procedures to estimate the ζ(q, γ), the c(γ)p and the function L(h) from data have been
presented and studied in detail in [28, 29, 30], and are hence not further recalled here. In essence,they rely on weighted linear regressions in suited log-log diagrams, as illustrated in Figs. 2 and3 (middle row) for one of the Princeton paintings and one of Van Gogh’s paintings.
2.5. The Role and Selection of Parameter γ
Multifractal analysis makes sense in terms of fractal or scaling properties only for functionsfor which hm > 0. This limitation is alleviated by the introduction of the parameter γ in Eq. (6):Indeed, as mentioned in Section 2.2, when analyzing an image for which hm < 0, one could firstperform a fractional integration of order larger than −hm (which ensures that the global regular-ity exponent of the integrated image is positive) and then apply the wavelet leader multifractalformalism (with γ = 0) to it. Alternatively, one can avoid actual computation of the fractionalintegral and instead apply the wavelet leader multifractal formalism with γ > −hm directly to theoriginal image. It has been shown theoretically that both analyses yield the same multifractalproperties (cf. [28, 29] for details).
In practice, the multifractal parameters associated with X can be related to those computedusing various choices of γ > hm as follows (cf. [30]):
ζX(q) = ζ(q, γ) − γq, (13)cX,1 = c(γ)
1 − γ, (14)
cX,p = c(γ)p , p ≥ 2, (15)
LX(h) = L(γ)(h − γ). (16)
Given that hm needs to be estimated, a rule of thumb for comparison or classification ofseveral images is to choose γ as the smallest semi-integer value ensuring γ + hm > 0 for allimages under analysis.
3. Original versus Replica: the Princeton Experiment
Appealing though it may be, applying multifractal analysis immediately and blindly to mas-terpieces, such as Van Gogh’s paintings, with the aim of, e.g., performing forgery detection orclassification according to given artistic periods is difficult since the correct answers are often stillunder debate among conservators and art historians. Furthermore, the questions raised by conser-vators and art historians must first find a relevant formulation in an Image Processing language.Therefore, we instead begin with testing multifractal analysis on the Princeton experiment data.
7
3.1. The Princeton Experiment
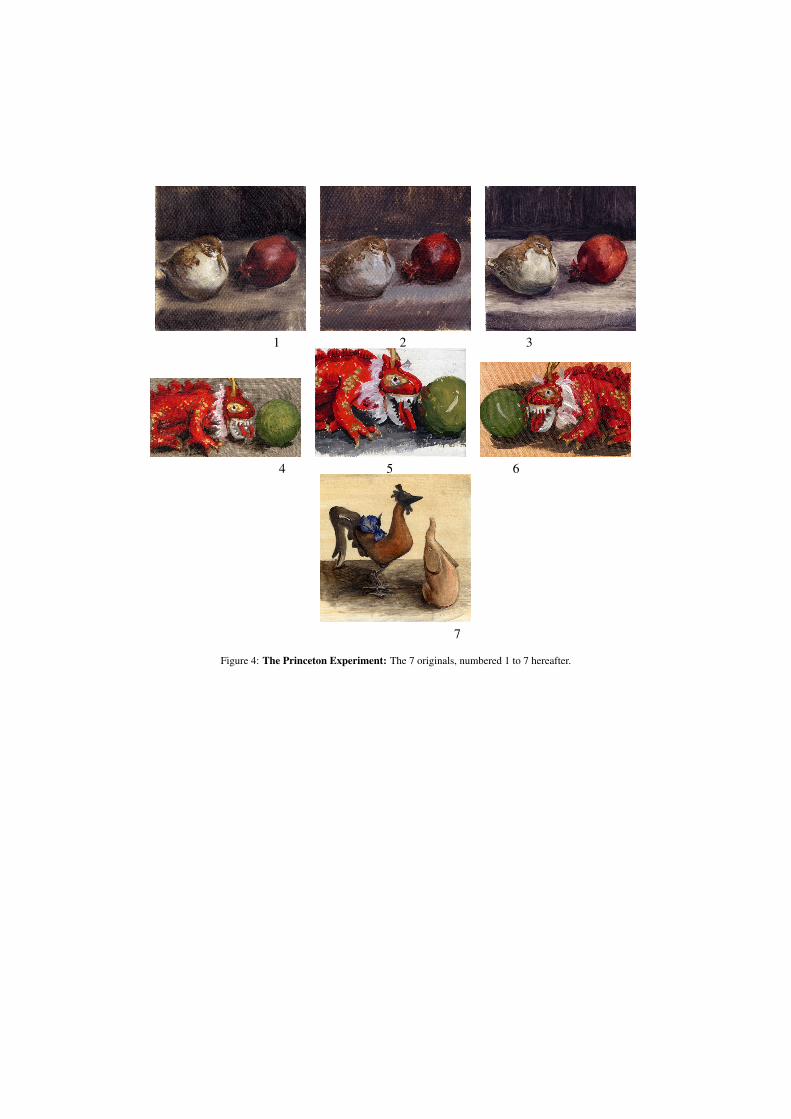
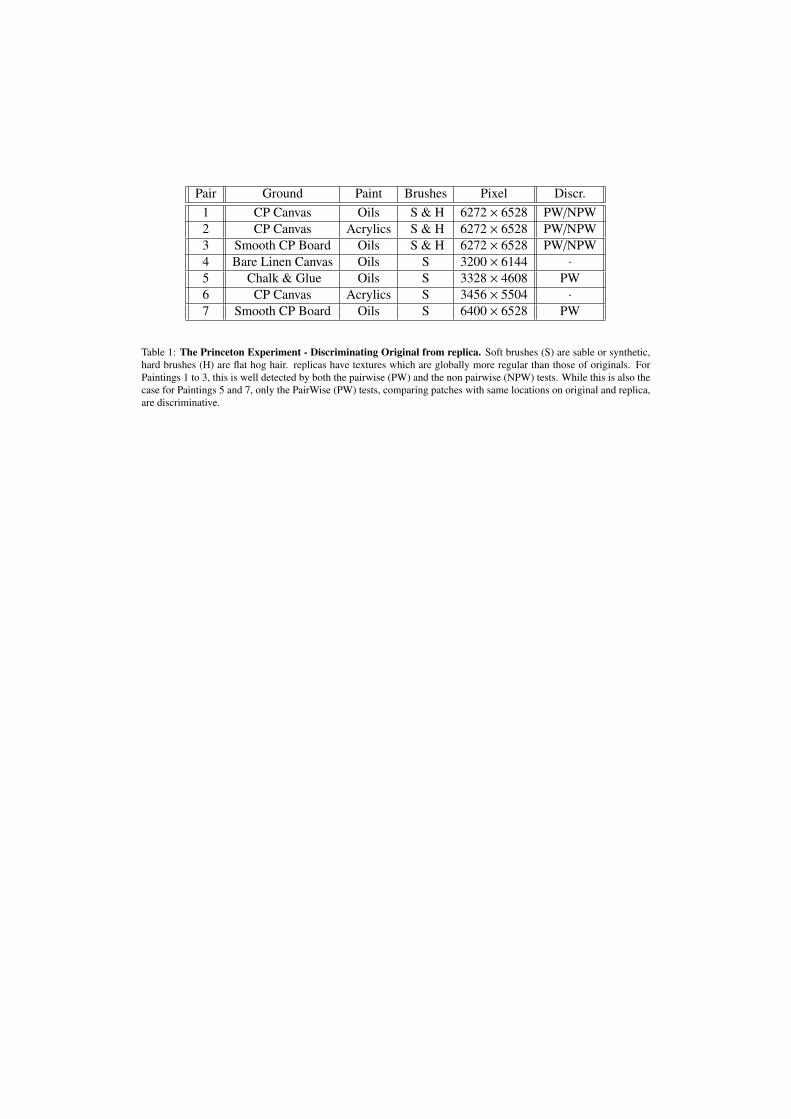
The Machine Learning and Image Processing for Art Investigation Research Group at Prince-ton University (cf. www.math.princeton.edu/ipai/index.html) had the brilliant idea ofsetting up a scientific art investigation experiment. It is described in detail at www.math.princeton.edu/ipai/datasets.htmland in [9, 15]: Charlotte Caspers, then an art conservation student from Stichting Restauratie Ate-lier Limburg specializing in art reconstruction, was proposed to perform a series of seven paint-ings using different materials (various brushes, canvas, paints). All of them are small (' 15 × 15cm2) and represent indoor environment still life subjects. After a delay of two weeks, she wasasked to produce, under the same conditions and using the same materials, replicas that were asclose as possible to her originals. Originals and replicas were scanned at very high resolution(800 dpi) enabling to analyze the very fine scales of the texture (as a pixel essentially represents32 × 32 µm2). The paintings are described in Table 1 and plotted in Fig. 4. The Princeton groupis gratefully acknowledged for making the material of this experiment available to other researchteams.
3.2. Multifractal Properties
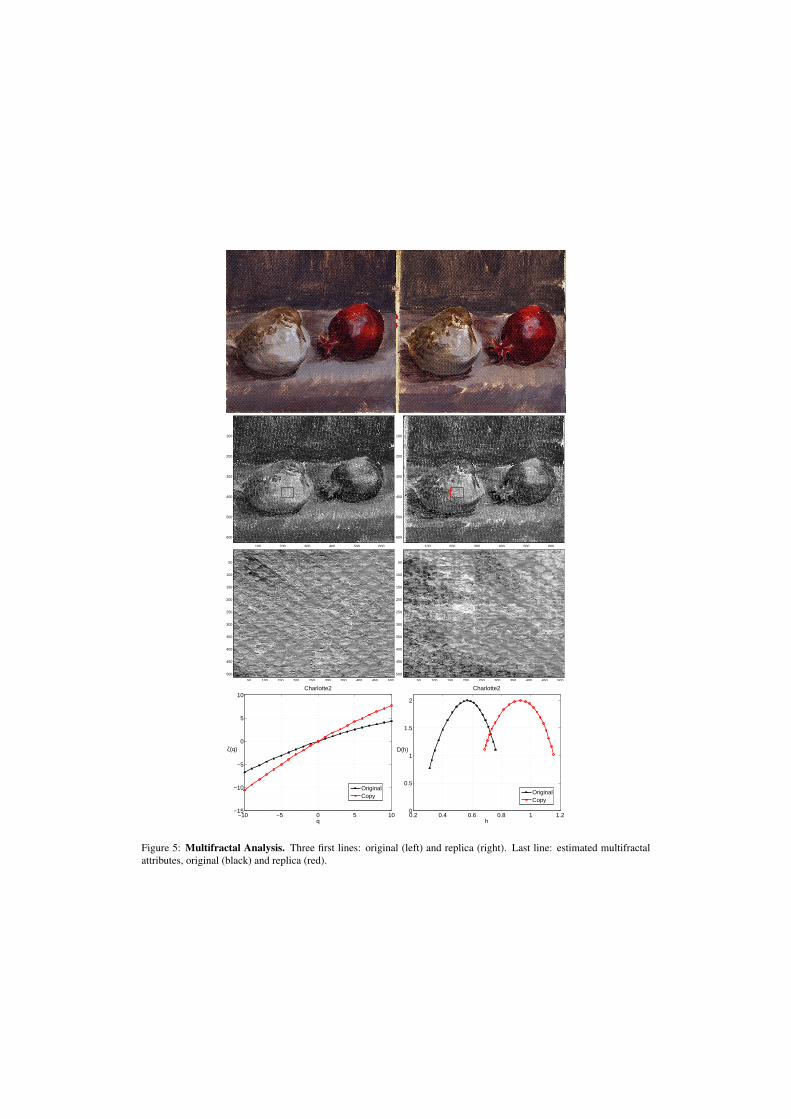
To analyze and assess fractal properties in paintings, small patches of homogeneous texturesof N×N pixels are manually selected. Then, the wavelet leader multifractal formalism describedin Section 2 is applied to each of them. Structure functions S ( j, q, γ) are depicted in Figs. 2and 3 and display the power law behavior postulated in Eq. (9) satisfactorily well for a range ofvalues of q around 0 (here, q ∈ [−5; 5] and N = 1024). These power laws hold for all sevenpaintings, for both originals and replicas, for many different patches at various positions in thepainting (bird, bag, upper background, lower background, . . . ). Their existence confirms that thefractal (or scaling) properties in these paintings can be regarded as relevant features to describetheir textures. Other figures, in the spirit of Fig. 5, are not reported here for sake of space and areavailable upon request.
An important aspect of (wavelet leader) multifractal analysis lies in the fact that the range ofscales a ∈ [amin, amax] within which scaling behavior as in Eq. (9) holds, is selected a posteriorifrom visual inspection of the log-log diagrams, such as those in Fig. 2, by the expert performingthe analysis (assisted by statistical procedures, cf. [25]). Therefore, the selection of the relevantrange of scales is not an a priori and arbitrary choice but constitutes per se an important output ofthe analysis: It provides information on the scales in actual units within which fractal propertieshold. For the Charlotte Casper paintings, it can be estimated that scaling holds over a decade,within scales ranging from [0.5 × 0.5] to [5 × 5] mm2. This shows that the observed scalingproperties are related to fine details of the various textures in the paintings and not to the (largerscale) shapes of the represented subjects.
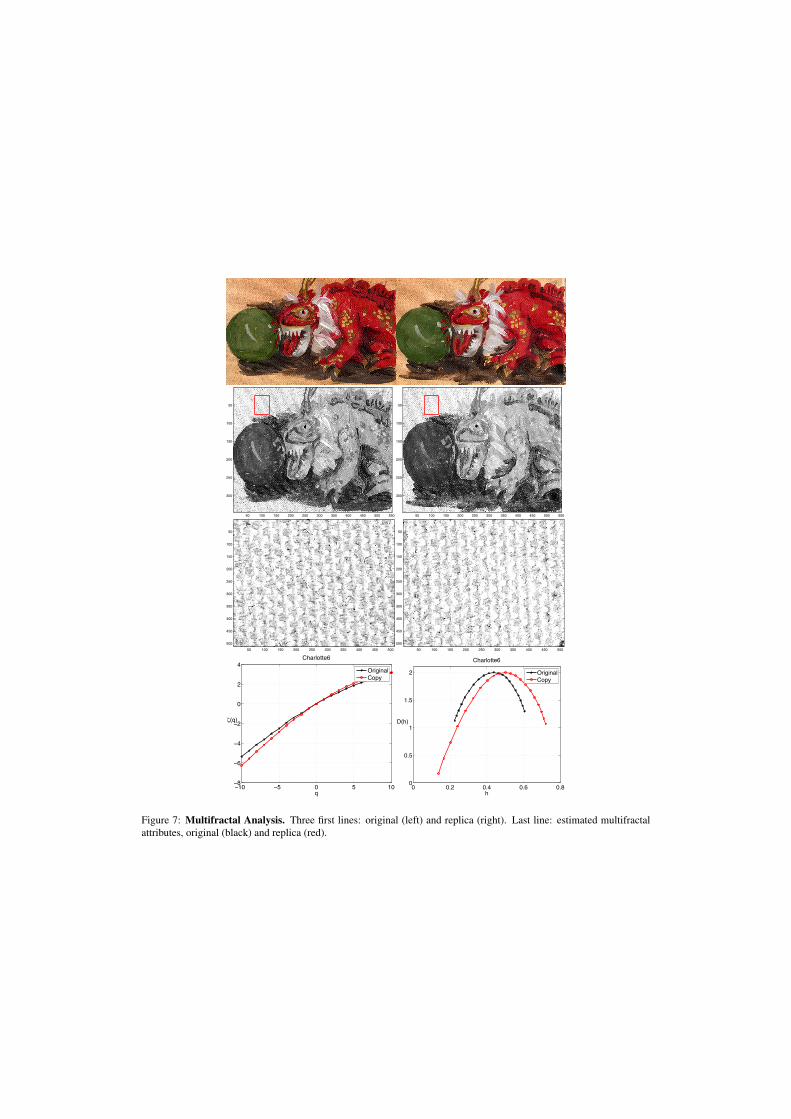
Furthermore, patches of the same location on both original and replica do not share the samescaling properties. This is illustrated in Fig. 5, where the scaling functions and the multifractalspectra significantly differ. Interestingly, it is found that the multifractal spectra estimated fromreplicas tend to be systematically shifted to the right on the Holder exponent axis, as comparedto those measured on originals. Technically, this is effectively measured on c1, which estimates
the position of the maximum of the multifractal spectrum: It is often observed that c(replica)1 >
c(origin.)1 . Consistently, it is observed that h(replica)
m > h(origin.)m . Both these observations clearly
indicate that systematically, the textures of the replicas are globally more regular and smootherthan those of the original paintings.
8
3.3. Results
3.3.1. Test procedure set-upThis section aims at deciding, by means of statistical procedures, whether the differences be-
tween the multifractal parameters estimated on replicas and originals we observed and discussedin the previous section are statistically significant or not.
A key point in the analysis underlying the above observations (cf. Section 3.2) resides inthe fact that multifractal parameters were estimated for well-chosen patches of homogeneoustextures (the bird, as in the example illustrated in Fig. 2, the bag, the backgrounds, etc.). Thismanual selection of patches requires a human/expert decision and cannot be easily automated.Here, we chose instead to split each painting blindly into adjacent non-overlapping patches ofN × N pixels. Then, the wavelet leader based multifractal formalism is applied to each patchindependently. Following the preliminary analysis described above, the scaling range is fixedto scales ranging from [0.5 × 0.5] to [5 × 5] mm2. In the results reported below, patch sizesN = 29, 210, 211 have been used and yield consistent conclusions. Tables are given for N = 210.
Along another line, the digitized paintings are provided in the form of three 8 bits matrices,which correspond to the RGB channel outputs supplied by the scanner, respectively. System-atically, these 3 channels have been transformed into a single Intensity gray-level image I, andinto 3 channels corresponding to the classical HSL (Hue, Saturation, Lightness) representationsystem for colors (cf. e.g., en.wikipedia.org/wiki/HSLandHSV for the exact definitions ofthe transformation RGB → I and RGB ↔ HSL). For each patch of each original and replica,these 7 instances (RGB, I, HSL) were analyzed independently.
Three characteristic multifractal parameters have been systematically retained for the testprocedures: hm, c1 and c2. The results shown here are obtained using the minimal compactsupport orthonormal Daubechies wavelet ψ with Nψ = 2 vanishing moments [5]. It has beenchecked that results are consistent when Nψ is increased. A value γ = 1 is found to be sufficientlylarge to ensure positive global regularity for all paintings and patches.
To test whether changes between multifractal parameter estimates for original and replica aresignificant, a set of classical non parametric hypothesis tests is applied and p-values are computedfor the null hypothesis that no change is observed between original and replica. Two categories oftests were used. PairWise tests (SignTest and SignRank) compare estimates obtained for patchesof the same locations on original and replica. Non PairWise tests (Wilcoxon RankSum) compareglobally the vectors containing multifractal attribute estimates for all patches of the original andreplica, respectively, without taking the locations of the patches into account. They are hencefar more demanding, since they could be used to compare two sets of paintings which are notoriginals and copies or replicas thereof. This setting is much more likely to be of interest inpractice. It corresponds, for instance, to the situation where a reference set of paintings that areindisputably attributed to a master (or a period of creation) is used to test a set of paintings thatare questionably attributed to this master (or a period of creation).
The level of significance of the tests is, as is classically done, set to 0.05 (i.e., differences areregarded as statistically significant whenever p ≤ 0.05, and the test has a 5% level of chances ofincorrectly deciding so). Tests are applied to both the multifractal parameters estimated from all7 channels, and to those of the L channel only (hence to those of a single gray-level image).
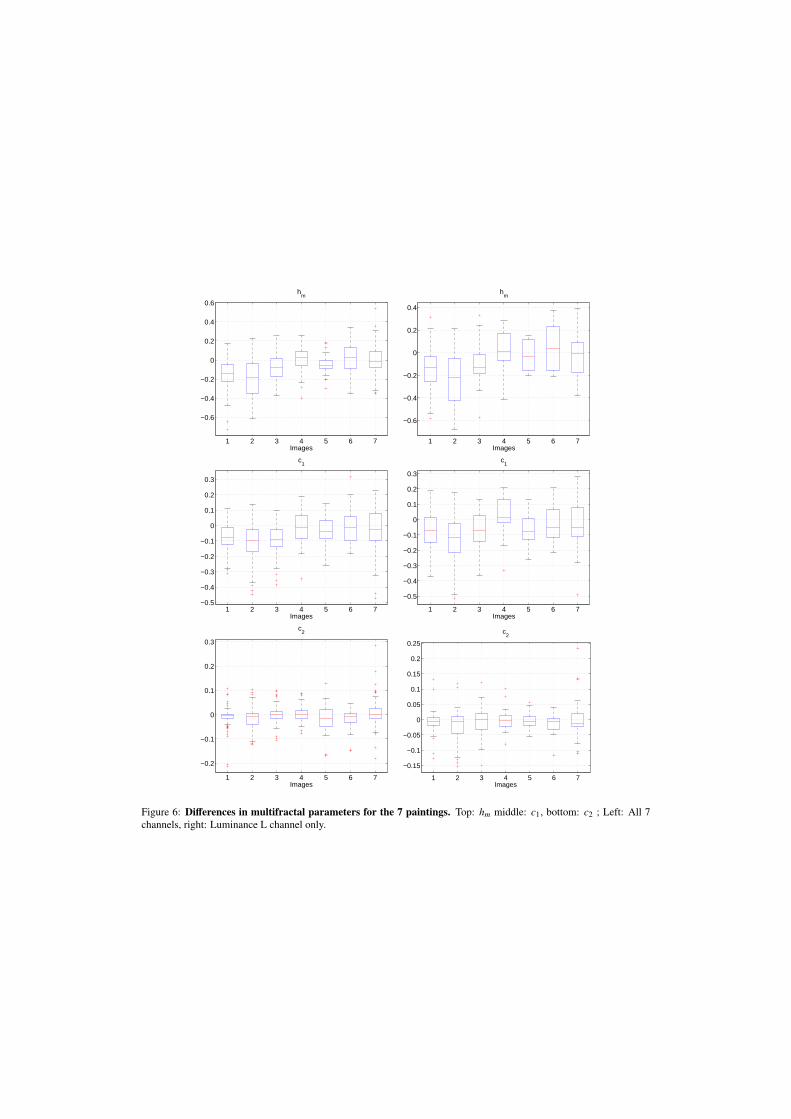
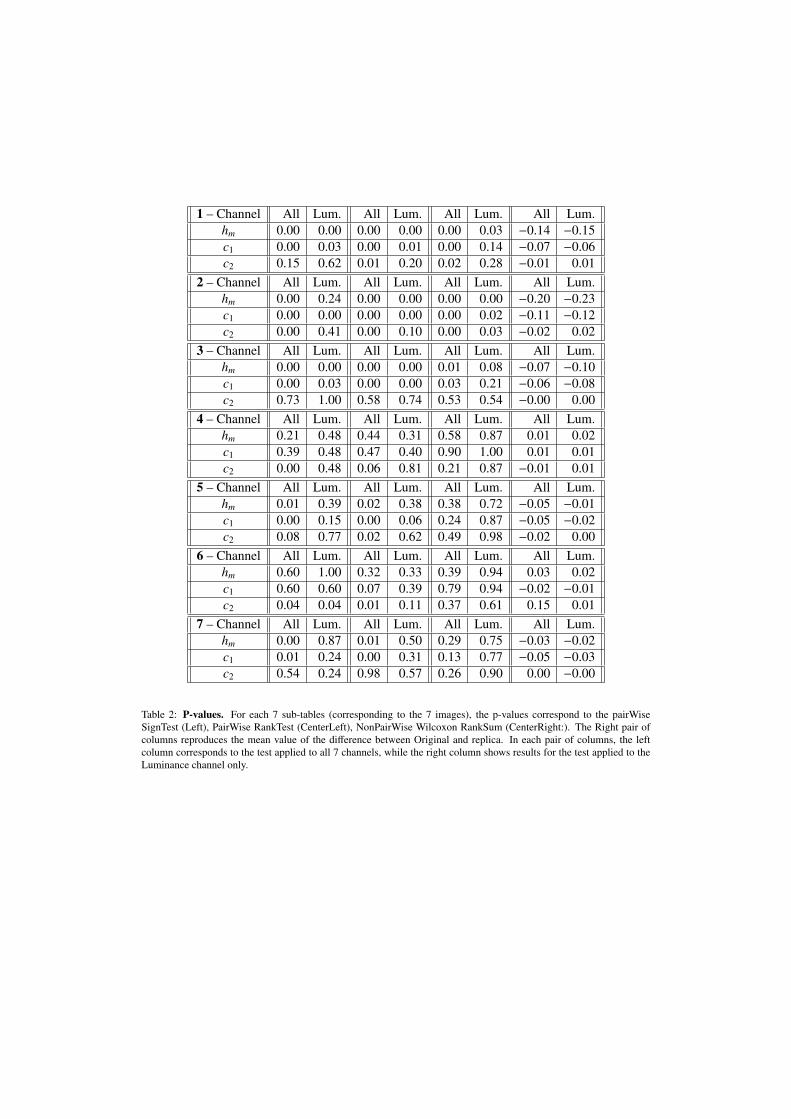
3.3.2. ResultsIn Fig. 6, multifractal parameter estimates of originals and replicas are compared by means
of box-plots. The p-values resulting from the different tests are reported in Table 2. Careful
9
reading of this table and figure enables to make the following observations:
- When significant, changes in c1 and hm are observed to systematically occur jointly andwith larger values for replicas as compared to originals.
- Parameter c2 is rarely found discriminant and when it is, changes in c2 are not systemati-cally in the same direction.
- For Paintings 1–3, both PairWise and Non PairWise tests detect significant changes, bethey applied to All-Channels or to Luminance only.
- For Paintings 5 and 7, discrimination is only achieved for PairWise tests applied to All-Channels.
- For Paintings 4 and 6, no change between original and replica is detected.
Such observations induce the following conclusions, which are summarized in Table 1:
- Multifractal Properties. When significant changes are found, the multifractal spectra com-puted from the textures of the replicas appear globally shifted to the right, with quasi nodeformation: The change in hm (the leftmost point of the spectrum) is comparable to thechange in c1 (the location of its maximum) and c2 (related to its width) is not changed.Therefore, the textures in replicas systematically are globally more regular than those ofthe originals, but they show neither a larger nor a smaller variability around this global reg-ularity. Let us also recall the important fact that fractal properties are observed for scalesranging from [0.5 × 0.5] to [5 × 5] mm2. Hence, the fractal properties observed in thisdata set may be tentatively related to brushstrokes, though there is no objective consensuson which scales relate to which characteristics of paintings (cf. [7, 23] for discussions onthese issues).
- Painting Properties. While discriminations between replicas and originals are clear andobvious for the three first paintings whose common feature is the use of Soft & Hardbrushes, discrimination is not or barely achieved for paintings for which only Soft brusheswere used. Consequently, a natural conclusion is to attribute this difference to the brushesactually used. The fact that the PairWise tests yield detection for paintings 5 and 7 remainto be interpreted. Furthermore, the reasons why no discrimination is achieved for Paintings4 and 6 remain to be understood. For these paintings, scaling and fractal properties areobserved which are qualitatively similar to those of the other paintings (as illustrated inFig. 7) yet are not discriminant. Note that for Paintings 4 and 6 a strong canvas structureis present and may constitute the dominant feature of the texture (cf. Fig. 7). Because itexists for both the original and the replica, it may prevent discrimination1.
1During the revision process, experts of the field kindly pointed to us that for Paintings 1 to 3, the artist had firstpainted the whole canvas, while this turns out not to be the case for Paintings 4 to 7. Moreover, colors used in Paintings4 to 7 are much lighter and clearer than those in paintings 1 to 3. These suggest that for Paintings 1 to 3 the analyzedtextures are correspond to the hand of the artist, while for Paintings 4 to 7, they rather result from a mixture on canvastextures and artist hand style, hence explaining less satisfactory results. Analysis that removing the canvas effect arecurrently under investigations. These spontaneous experts reader are gratefully acknowledged.
10
4. Van Gogh’s Paintings Multifractal Properties
4.1. The Image Processing for Art Investigation research project
Let us now turn to the analysis of Van Gogh’s paintings. In the framework of the ImageProcessing for Art Investigation research project initiated by R. Johnson (Cornell University)and I. Daubechies (Princeton University; cf. digitalpaintinganalysis.org) the Van GoghMuseum and the Kroller-Muller Museum (The Netherlands) made available a set of digitizedversions of Van Gogh’s paintings and of his contemporaries. These copies were obtained usinga scanning resolution of 200dpi and are checkerboarded on their right-half side, so that only theleft-half is actually available for analysis. In order to investigate the potential of image processingtools for art investigation, a series of stylometry challenges was set up under the supervision of R.Johnson, J. Coddington (MoMA, New York) and L. van Tilborgh (Van Gogh Museum, Amster-dam). These challenges are described in detail at www.digitalpaintinganalysis.org/Challenges.htm.In the present contribution, we chose to illustrate the results obtained on the dating and authen-ticity challenges, which are summarized below.
4.2. Methodology
Because paintings naturally consist of different textures, they are not analyzed globally. In-stead, fractal property analysis is based on the manual selection of small patches of N × N =
512 × 512 pixels for each painting (roughly 5 × 5 cm2). The wavelet leader multifractal formal-ism, described in Section 2, is applied to each of the seven channels of the patches (RGB, HSL,Intensity, cf. Section 3.3.1) and the corresponding multifractal attributes ζ(q),D(h), hm, c1, c2 arecomputed. Results shown here are obtained using the Daubechies wavelet with Nψ = 2 and areconsistent with those obtained when Nψ is increased. From preliminary analysis, we concludethat γ = 0.5 is sufficient to guarantee positive global regularity for each painting (cf. Sections2.1.2 and 2.5).
The choice of a patch for each single painting is based on the following criteria:
- Homogeneity of texture. Patches are manually located on pieces of texture that appearhomogeneous for all seven channels in order to limit the presence of large-scale coherentstructures and heterogeneity (such as the arms of the windmill in f503, or a combination ofbackground and subject) which could potentially obstruct the analysis. Note that differentchannels of the same patch may reveal very different textures and structures (cf. e.g., theRed Channel of painting f452 in Fig. 9, and its Saturation Channel in Fig. 10). Moreover,care has been taken to locate the patches on regions of the painting which may be assumedto have been subject to similar techniques, combinations of brushes, etc. (e.g. the heads offlowers in a bouquet, or a part of the background).
- Scaling and multifractal properties. The choice of patch locations is guided by the qualityof the observed scaling properties, involving careful inspection of the wavelet coefficientanalog of Eq. (7) prior to fractional integration and monitoring theoretical constraints onparameter estimates (for instance, c2 ≤ 0). Furthermore, estimates are required to be stablewith respect to small changes in the patch location.
The lower scanning resolution (as compared to that in the Princeton Experiment) makes itmore difficult to decide accurately on the range of scales to be involved in estimation. Neverthe-less, scaling properties are overall found to systematically hold for scales ranging from [0.5×0.5]
11

mm2 to [5 × 5] mm2, for all paintings in both challenges, and may hence again be tentatively re-lated to brushstrokes.
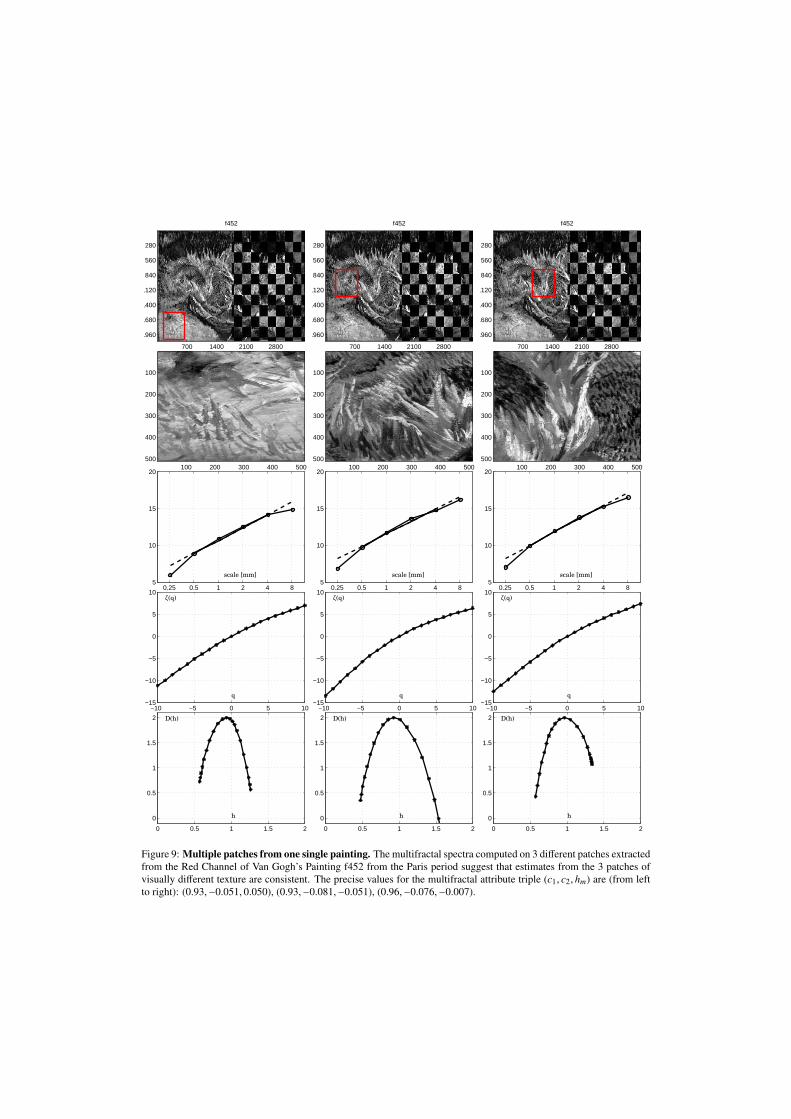
While some of the paintings do not leave much freedom for locating a patch because oftheir limited size (e.g. f441 and s448, cf. Figs. 8 and 12, respectively), others do (e.g. f297,f392 or f411). For these, different patches could be selected for analysis. A careful inspectionsuggests that the multifractal attributes obtained on different patches from a single painting areconsistent and remain within the natural statistical fluctuation of the estimation procedures. Thisis illustrated in Fig. 9, where analysis results for three patches of painting f452 are compared.
4.3. Dating Challenge
4.3.1. DescriptionVan Gogh, while in France, had two major periods of creation: One in Paris (ending early
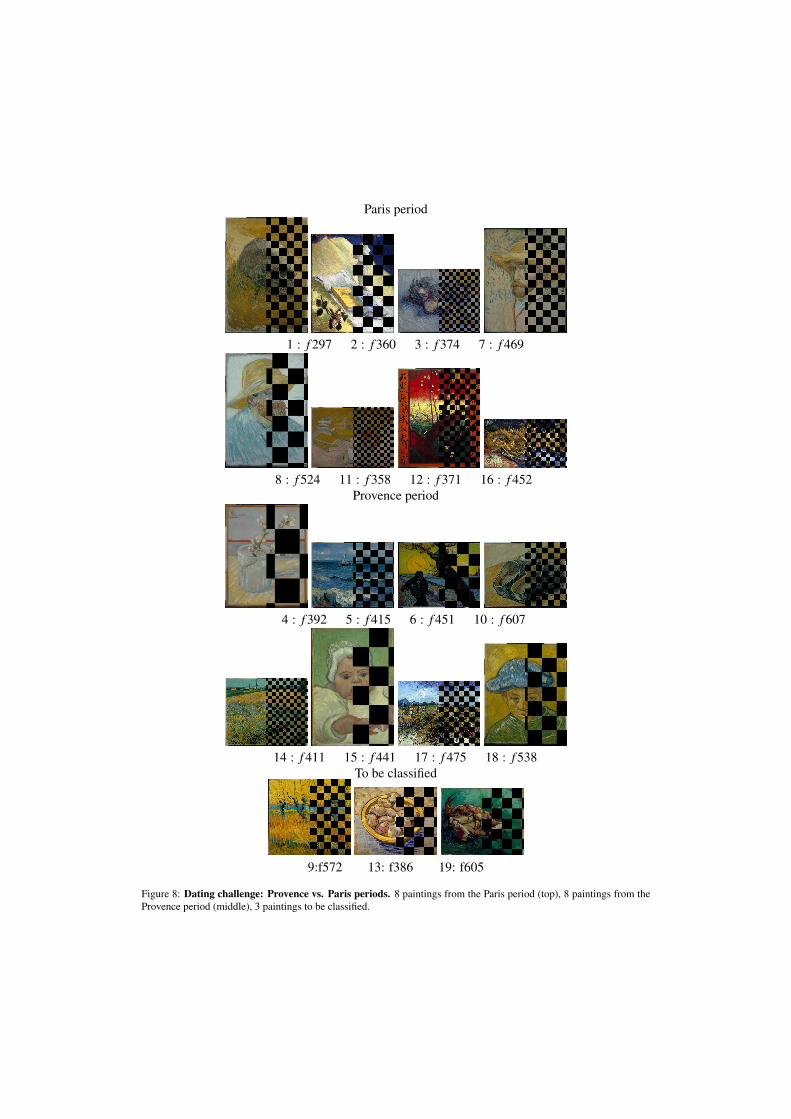
1888) and one later on in the Provence. While a number of his paintings are unambiguouslyattributed to the Paris or to the Provence periods, the decision for other paintings of the masteris still under debate amongst experts and art historians. Investigations by art experts often relyon a number of material and stylometric features (density of brush strokes, size or scale of thebrush strokes, thickness of contour lines, layers, colors, etc). In an attempt to investigate thepotential benefits of computer-based image processing procedures for assisting art experts inpainting analysis, two sets of height paintings each from the Paris and Provence period are givenas benchmark references, together with three paintings whose dates of creation are unknown.The low resolution digitized copies of Van Gogh’s masterpieces in these three sets are shown inFig. 8 (nomenclature corresponds to the Van Gogh Museum catalog).
4.3.2. ResultsIn Fig. 10, logscale diagrams, scaling functions and multifractal spectra are illustrated for
the Saturation Channel of one (arbitrarily selected) painting per class (Paris, Provence and Un-known). They indicate that the painting from the Provence period may show globally less regu-larity than the Paris period.
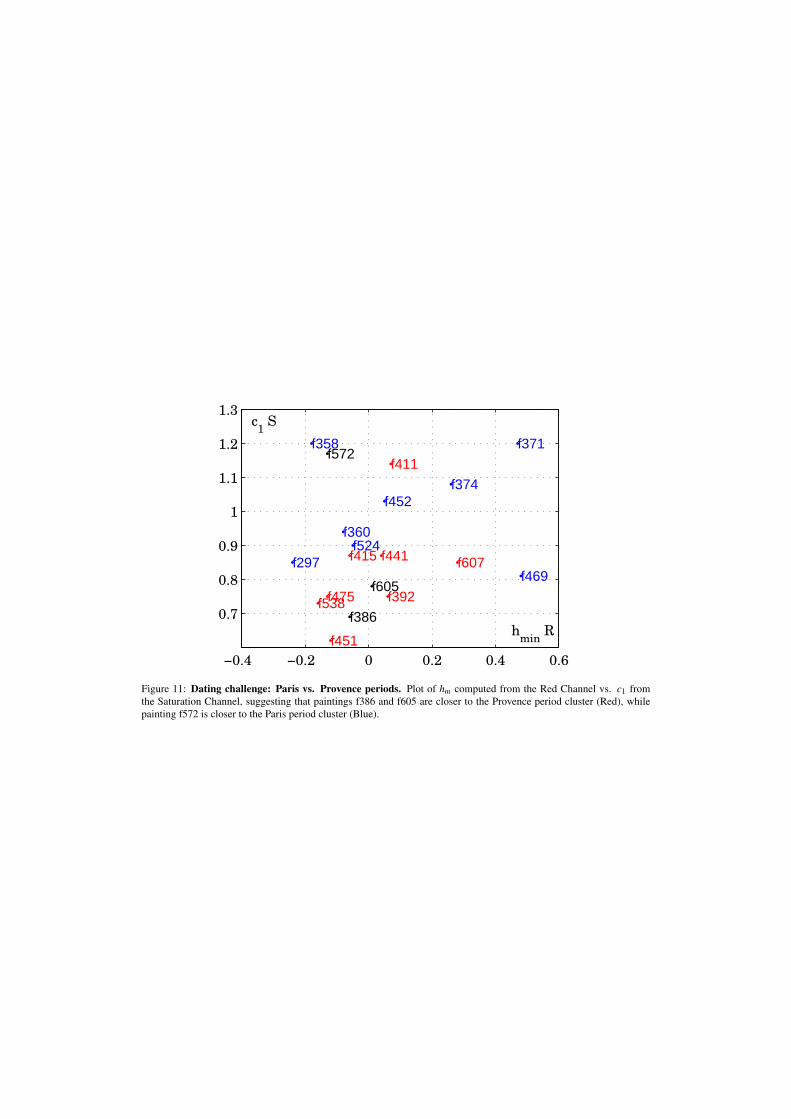
In an attempt to further quantify this preliminary observation, we chose to analyze the re-duced set c1, c2, hm of wavelet leader based multifractal attribute estimates in more detail. Be-cause recourse to machine learning techniques (such as Support Vector Machines) does not makeany sense for the 19(= 8 + 8 + 3) subjects living in a 42(= 7*3*2) dimensional space, we insteadmanually inspect a large collection of 2D projections of this space. The most convincing dis-crimination is obtained with parameter hm computed from the Red-Channel and c1 from theSaturation-Channel, the latter being particularly discriminant (cf. Fig. 11). Interestingly, arthistorians use saturation in colors one of the features to discriminate the Paris and Provenceperiods (cf. www.digitalpaintinganalysis.org/Challenges.htm). Note, however, thatmultifractal analysis does not discriminate levels of saturation but instead the regularity of thetexture in the Saturation-Channel. This projection supports the above observation: Textures inVan Gogh’s during the Paris period appear to be more regular, which may indicate more regular-ity in the brushstrokes themselves. These results are consistent with findings in [12], where largerwavelet coefficients at fine scales (hence more irregularity) are observed for non Van Gogh’s thanfor Van Gogh’s paintings. Also, the results obtained here suggest that paintings f 386 and f 605are closer to the Provence period cluster (red), while f 572 is closer to the Paris period cluster(blue). However, it must be noted that when relying on fractal properties, painting f 411 from theProvence period would be incorrectly attributed to the Paris period.
12
4.4. Authenticity Challenge
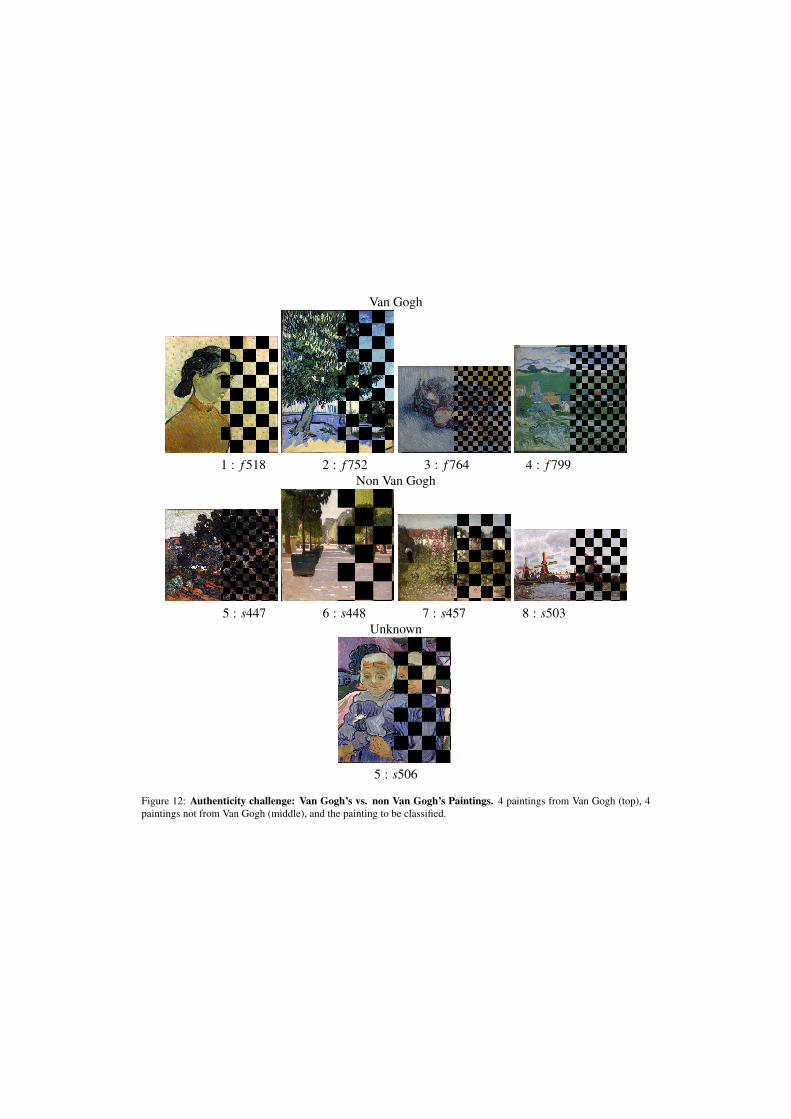
4.4.1. DescriptionIn this challenge, digitized copies of 4 paintings by Van Gogh and 4 paintings by his contem-
poraries are provided, along with one painting that is labelled unknown and proposed for clas-sification. The latter painting is a known contemporary copy of an original Van Gogh painting.However, the original Van Gogh is not in the available data set, hence preventing us from per-forming comparisons similar to those conducted on the Princeton experiment data. Experts statethat the colors of the copy have remained closer to the original colors than those of the painting bythe master. Essentially, their distinction between true Van Gogh’s and non Van Gogh’s is based ona careful analysis of Van Gogh’s brushstroke referred to as vigourous, with non overlapping andneatly defined strokes, as opposed to those of his contemporaries which are found to be either tooacademic and regular, or too messy and irregular (cf. www.digitalpaintinganalysis.org/Challenges.htm;see also [13] and [24], where brushwork texture and numerical brushstroke features are employedfor authentificating Van Gogh’s paintings).
The challenge consists in devising numerical features which distinguish the two test sets andwhich enable to associate the test painting with one or the other group. The nine paintings areshown in Fig. 12.
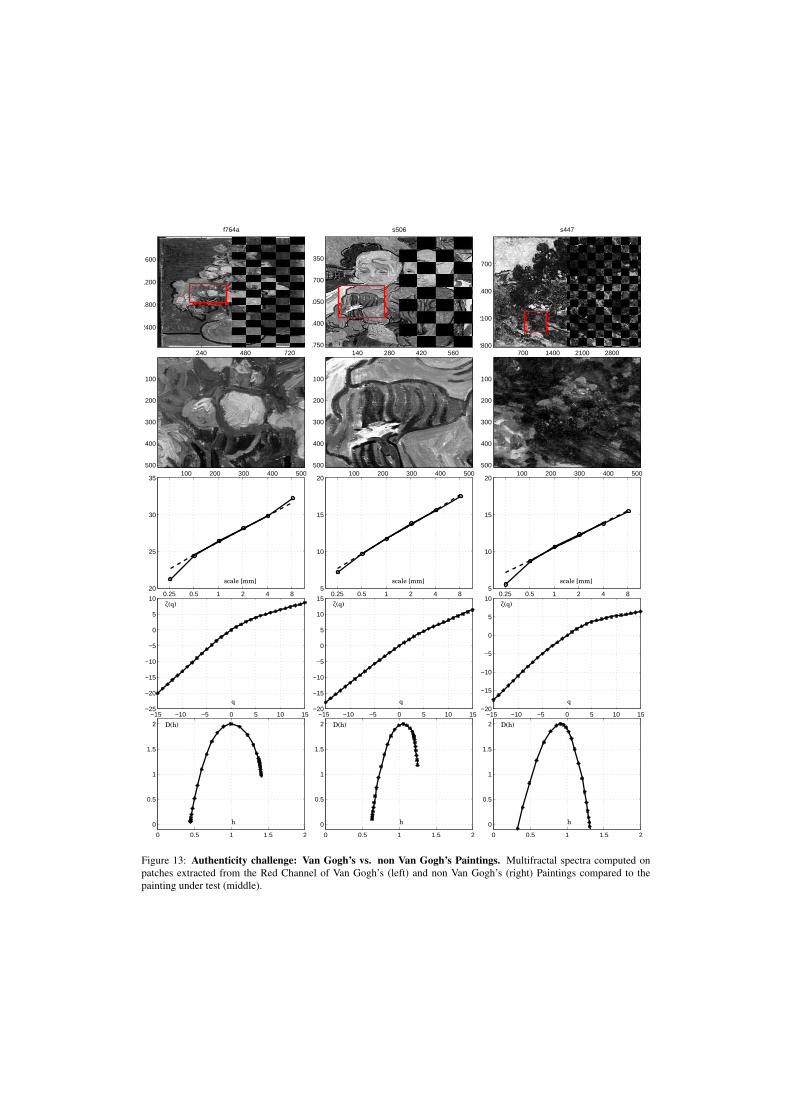
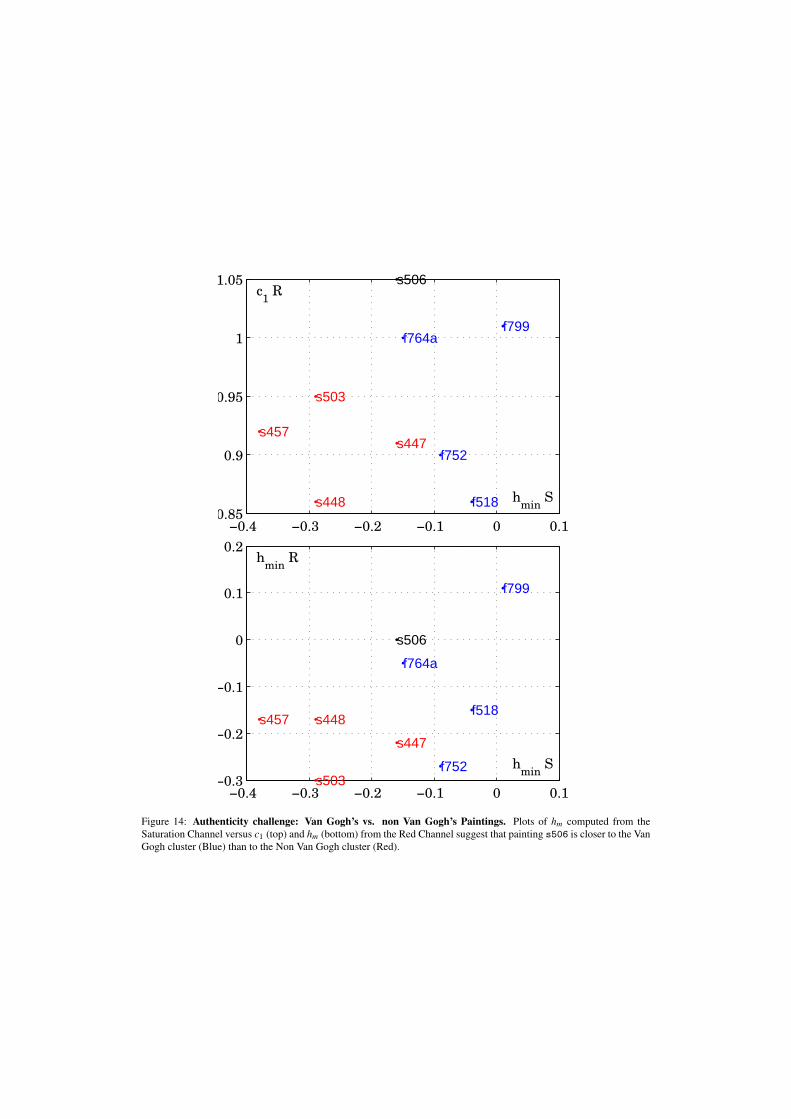
4.4.2. ResultsFig. 13 plots logscale diagrams, scaling functions and multifractal spectra obtained on the
Red Channel of one arbitrarily selected painting for each of the reference classes, and of thepainting whose label is to be determined.
A careful inspection of the multifractal spectra leads us to suggest that Van Gogh’s paintingstend to be globally more regular. Systematic estimation of the hm, c1, c2 parameters on the 7channels of the 9 paintings and manual analysis and 2D projections, as described for the datingchallenge, reveal that the Saturation and Red Channels are most discriminant between the twosets. This analysis indicates that the non Van Gogh paintings have smaller values for hm and c1and hence appear to be overall more irregular (cf. Fig. 14). These 2D projections also suggest,however, that the painting s506 under investigation is closer to the authentic Van Gogh paintingscluster than to the Non Van Gogh cluster. This incorrectly contradicts the experts’ decision,but may indicate that the copyist was successful here in reproducing Van Gogh’s brushstrokeregularity.
5. Conclusions and Perspectives
This contribution illustrates the potential and possibilities of wavelet leader based multifractalanalysis of digitized paintings for assisting art investigation.
At the technical level, this work shows that for well assessing the relevance of fractal prop-erties, as well as the range of scales where they can be regarded as relevant, classical waveletcoefficients must be used to complement the wavelet leader multifractal formalism. Also, mul-tifractal analysis cannot be applied blindly to arbitrary pieces of images or paintings since theyusually consist of collections of different textures and/or of different objects and subjects. In-stead, a meaningful analysis requires the careful selection of patches consisting of homogeneoustextures. This is where interventions of art experts could prove useful: They may be able toidentify specific patches which are of particular interest with respect to the techniques used, thestatus of the colors, the specificity of a particular part of a painting, etc.
13

At the painting level, it is worth mentioning that the range of scales where fractal propertieswere found to hold (from [0.5 × 0.5] mm2 to [5 × 5] mm2) are identical for the Princeton exper-iment and for Van Gogh’s paintings (despite being scanned at different resolutions). This resulthas been obtained independently for the two data sets by different authors of this work. Again,interpretation of why this range of scales carries fractal properties in painting would benefit sig-nificantly from close interaction with art experts. Also, given a specific interest or question, artexperts could contribute considerably to the type of analysis proposed here by suggesting whichpatch of a painting should be analyzed in priority.
The results obtained in this contribution encouragingly demonstrating that multifractal anal-ysis enables the measurement of features which fruitfully characterize painting texture. Thesefirst results could be further complemented and improved, by incorporating a larger number anddifferent types of attribute estimates in the analysis. In this perspective, measures of anisotropyare currently being investigated.
Again, the analysis tools put forward here in no way intend to replace the art historian ofexpert in an attribution decision or else. Instead, it aims at providing them with a set of attributescomputed in an automated, controlled and reproducible manner that will contribute as one of thepieces in the puzzle leading to an attribution decision. Hopefully, results such as those obtainedhere will help to promote existing close interactions between image processing researchers andart experts and encourage new ones. Such exchanges could enable the creation of further datasets for which both art expertise and technical issues (such as scanning resolution and techniques)are well documented, as well as the constitution of real interdisciplinary teams within which artexperts would propose questions for which image processing could help to formulate answers.
6. Acknowledgements
The authors gratefully acknowledge the leaders of the Image Processing for Art Investigationproject for having warmly welcome them in this research program. R. Johnson, D. Rockmoreand I. Daubechies are specifically acknowledged. The Van Gogh and Kroller-Muller Museums(The Netherlands) have made this work possible by making numerous paintings available withinthe framework of the Image Processing for Art Investigation project. The Princeton researchteam (notably S. Hughes and I. Daubechies) is acknowledged for providing us access to thePrinceton experiment data and for providing us with crucial information related to the conditionsunder which the experiment was conducted. S. Hughes and E. Postma are gratefully acknowl-edged for their kind help in Data handling. S. Hughes and and M. Martens are also gratefullyacknowledged for their valuable comments on the results obtained in this work and further po-tential developments. J. Coddington (Chief Conservator at the MoMA) and E. Hendriks (ChiefConservator at the Van Gogh museum) significantly helped improve this work with valuablediscussions, notably on space scales. They are gratefully acknowledged.
This work has been partially supported by the Del Duca Foundation, Institut de France,Young Research Team Award 2007.
References
[1] P. Abry, S. Jaffard, and H. Wendt. Irregularities and scaling in signal and image processing: Multifractal analysis.In M. Frame, editor, Benoit Mandelbrot: A Life in Many Dimensions. To Appear, Yale University, USA, 2012.
[2] A. Arneodo, N. Decoster, and S.G. Roux. A wavelet-based method for multifractal image analysis. I. Methodologyand test applications on isotropic and anisotropic random rough surfaces. Eur. Phys. J. B, 15(3):567–600, 2000.
14
[3] B. Castaing, Y. Gagne, and M. Marchand. Log-similarity for turbulent flows. Physica D, 68(3-4):387–400, 1993.[4] P. Chainais. Infinitely divisible cascades to model the statistics of natural images. IEEE Trans. on Pattern Analysis
and Machine Intelligence, 29(12), 2007.[5] I. Daubechies. Ten Lectures on Wavelets. SIAM, New York, 1992.[6] J. Delour, J.F. Muzy, and A. Arneodo. Intermittency of 1d velocity spatial profiles in turbulence: A magnitude
cumulant analysis. Eur. Phys. J. B, 23(2):243–248, 2001.[7] E. Hendriks and S. Hughes. Van Gogh’s brushstrokes: Marks of authenticity? Proceedings of Art, Conservation,
and Authenticities: Material, Concept, Context, 2009.[8] Th. Hurtut, Y. Gousseau, Ch. Farida, and F. Schmitt. Pictorial analysis of line-drawings. In M. Frame, editor,
Computational Aesthetics in Graphics (CAe’08), Eurographics, pages 123–130, 2008.[9] S. Jafarpour, G. Polatkan, E. Brevdo, S. Hughes, A. Brasoveanu, and I. Daubechies. Stylistic analysis of paintings
using wavelets and machine learning. In Proc. European Signal Processing Conference (EUSIPCO), 2009.[10] S. Jaffard. Wavelet techniques in multifractal analysis. In Fractal Geometry and Applications: A Jubilee of Benoıt
Mandelbrot, M. Lapidus et M. van Frankenhuijsen Eds., Proceedings of Symposia in Pure Mathematics, volume72(2), pages 91–152. AMS, 2004.
[11] S. Jaffard, B. Lashermes, and P. Abry. Wavelet leaders in multifractal analysis. In T. Qian, M.I. Vai, and X. Yuesh-eng, editors, Wavelet Analysis and Applications, pages 219–264, Basel, Switzerland, 2006. Birkhauser Verlag.
[12] C. R. Johnson Jr., E. Hendriks, I. J. Berezhnoy, E. Brevdo, S. M. Hughes, I. Daubechies, J. Li, E. Postma, and J. Z.Wang. Processing for artist identification: Computerized analysis of Vincent van Gogh’s painting brush- strokes.IEEE Signal Processing Magazine (Special Section - Signal Processing in Visual Cultural Heritage), 25:37–48,2008.
[13] J. Li, L. Yao, E. Hendriks, and J.Z. Wang. Rhythmic brushstrokes distinguish van Gogh from his contemporaries:Findings via automated brushstroke extraction. IEEE T Pattern Analysis and Machine Intelligence, 99(preprints),2011.
[14] S. Mallat. A Wavelet Tour of Signal Processing: The Sparse Way. Academic Press, Burlington, MA, 2009.[15] G. Polatkan, S. Jafarpour, E. Brevdo, S. Hughes, A. Brasoveanu, and I. Daubechies. Detection of forgery in
paintings using supervised learning. In Proc. IEEE Int. Conf. Image Processing (ICIP), 2005.[16] R.H. Riedi. Multifractal processes. In P. Doukhan, G. Oppenheim, and M.S. Taqqu, editors, Theory and applica-
tions of long range dependence, pages 625–717. Birkhauser, 2003.[17] S. Robinson. Can mathematical tools illuminate artistic style? SIAM News, www.siam.org/news/news.php?id=34,
2005.[18] D. Rockmore, J. Coddington, J. Elton, and Y. Wang. Multifractal analysis for Jackson Pollock. SPIE, pages
6810–13, 2008.[19] D. Rockmore, S. Lyu, and H. Farid. A digital technique for art authentication. PNAS, pages 17006–17010, 2004.[20] M. Sipics. The Van Gogh project: Art meets mathematics in ongoing international study. SIAM News,
www.siam.org/news/news.php?id=1568, 2009.[21] D.G. Stork and J. Coddington, editors. Computer Image Analysis in the Study of Art, volume 6810, Proceedings of
SPIE, 2008.[22] D.G. Stork, J. Coddington, and A. Bentkowska-Kafel, editors. Computer Vision and Image Analysis of Art II,
volume 7869, Proceedings of SPIE, 2011.[23] M.M. Van Dantzig. Vincent? A New Method of Identifying the Artist and his Work and of Unmasking the Forger
and his Products. Keesing, Amsterdam, 1953.[24] L.J.P. van der Maaten and E.O. Postma. Texton-based analysis of paintings. In Proceedings of SPIE, volume 7798,
2010.[25] D. Veitch, P. Abry, and M. S. Taqqu. On the automatic selection of the onset of scaling. Fractals, 4(11):377–390,
2003.[26] D. Veitch, M. S. Taqqu, and P. Abry. Meaningful mra initialization for discrete time series. Signal Processing,
80:1971–1983, 2000.[27] H. Wendt. Contributions of Wavelet Leaders and Bootstrap to Multifractal Analysis: Images, Estimation Perfor-
mance, Dependence Structure and Vanishing Moments. Confidence Intervals and Hypothesis Tests. PhD thesis,ENS Lyon, 2008.
[28] H. Wendt, P. Abry, and S. Jaffard. Bootstrap for empirical multifractal analysis. IEEE Signal Processing Mag.,24(4):38–48, 2007.
[29] H. Wendt, P. Abry, S. Jaffard, H. Ji, and Z. Shen. Wavelet leader multifractal analysis for texture classification. InProc. IEEE Int. Conf. Image Proc. (ICIP), Cairo, Egypt, 2009.
[30] H. Wendt, S.G. Roux, P. Abry, and S. Jaffard. Wavelet leaders and bootstrap for multifractal analysis of images.Signal Processing, 89:1100–1114, 2009.
15
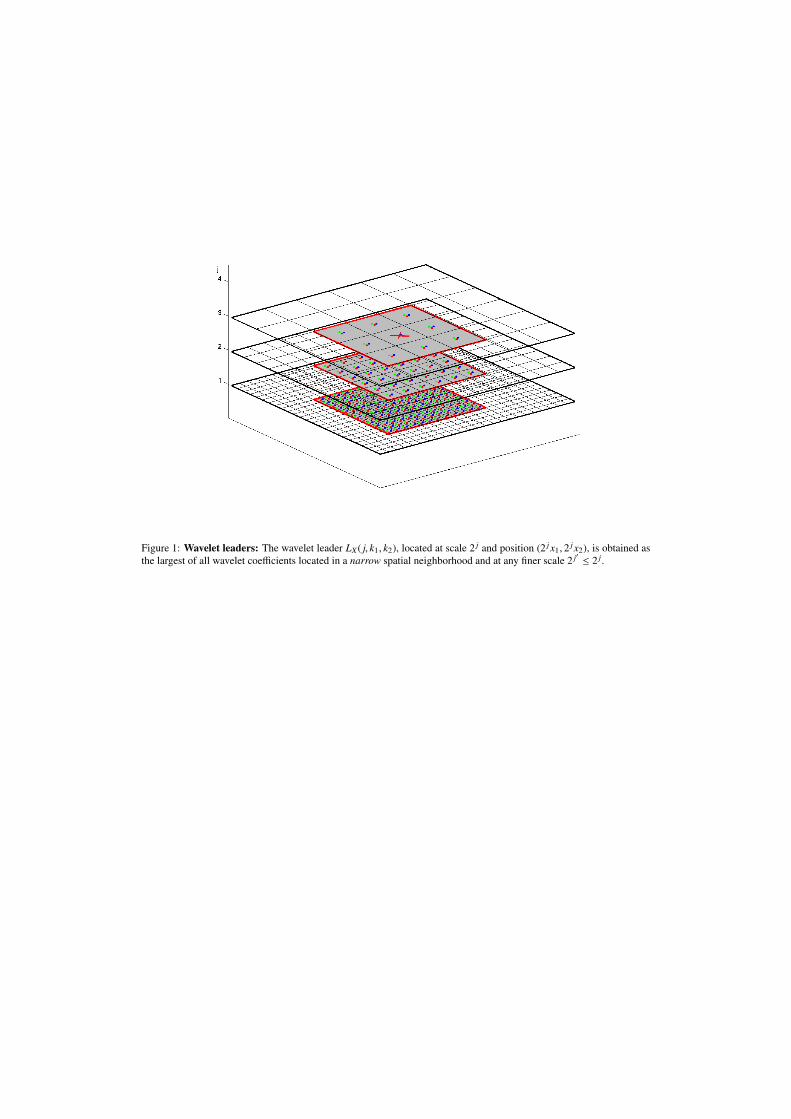
Figure 1: Wavelet leaders: The wavelet leader LX( j, k1, k2), located at scale 2 j and position (2 j x1, 2 j x2), is obtained asthe largest of all wavelet coefficients located in a narrow spatial neighborhood and at any finer scale 2 j′ ≤ 2 j.
100 200 300 400 500 600
100
200
300
400
500
600
50 100 150 200 250 300 350 400 450 500
50
100
150
200
250
300
350
400
450
500
2 4 8 16 32 643
4
5
6
7
8
9
scale (s)
log
S(j,q
)/q
2 4 8 16 32 64 128 2566
8
10
12
14
16
18
20
22
scale (s)
−10 −5 0 5 10−8
−6
−4
−2
0
2
4
6
q
!(q)
Charlotte7
0.4 0.5 0.6 0.7 0.80
0.5
1
1.5
2
h
D(h)
Charlotte7
Figure 2: Multifractal Analysis - Painting 7 of the Princeton Experiment. From top to bottom: Painting, SelectedPatch, Logscale Diagrams log2 S ( j, q, γ)/q vs. log2 2 j = j for numerous qs, Linear Regression for q = 2, ScalingFunction ζ(q), Multifractal Spectrum D(h).
200 400 600 800 1000 1200 1400 1600
200
400
600
800
1000
1200
1400
1600
1800
2000
50 100 150 200 250 300 350 400 450 500
50
100
150
200
250
300
350
400
450
500
2 4 8 16 32−8
−6
−4
−2
0
2
4
scale (s)
log
S(j,q
)/q
2 4 8 16 32 64−10
−5
0
5
10
scale (s)
−10 −5 0 5 10−20
−15
−10
−5
0
5
10
15
q
!(q)
f752
0 0.5 1 1.5 20
0.5
1
1.5
2
h
D(h)
f752
Figure 3: Multifractal Analysis - Van Gogh’s Painting f752. From top to bottom: Painting, Selected Patch, LogscaleDiagrams log2 S ( j, q, γ)/q vs. log2 2 j = j for numerous qs, Linear Regression for q = 2, Scaling Function ζ(q), Multi-fractal Spectrum D(h).
1 2 3
4 5 6
7
Figure 4: The Princeton Experiment: The 7 originals, numbered 1 to 7 hereafter.
Pair Ground Paint Brushes Pixel Discr.1 CP Canvas Oils S & H 6272 × 6528 PW/NPW2 CP Canvas Acrylics S & H 6272 × 6528 PW/NPW3 Smooth CP Board Oils S & H 6272 × 6528 PW/NPW4 Bare Linen Canvas Oils S 3200 × 6144 ·
5 Chalk & Glue Oils S 3328 × 4608 PW6 CP Canvas Acrylics S 3456 × 5504 ·
7 Smooth CP Board Oils S 6400 × 6528 PW
Table 1: The Princeton Experiment - Discriminating Original from replica. Soft brushes (S) are sable or synthetic,hard brushes (H) are flat hog hair. replicas have textures which are globally more regular than those of originals. ForPaintings 1 to 3, this is well detected by both the pairwise (PW) and the non pairwise (NPW) tests. While this is also thecase for Paintings 5 and 7, only the PairWise (PW) tests, comparing patches with same locations on original and replica,are discriminative.
100 200 300 400 500 600
100
200
300
400
500
600
100 200 300 400 500 600
100
200
300
400
500
600
50 100 150 200 250 300 350 400 450 500
50
100
150
200
250
300
350
400
450
500
50 100 150 200 250 300 350 400 450 500
50
100
150
200
250
300
350
400
450
500
−10 −5 0 5 10−15
−10
−5
0
5
10
q
ζ(q)
Charlotte2
OriginalCopy
0.2 0.4 0.6 0.8 1 1.20
0.5
1
1.5
2
h
D(h)
Charlotte2
OriginalCopy
Figure 5: Multifractal Analysis. Three first lines: original (left) and replica (right). Last line: estimated multifractalattributes, original (black) and replica (red).
1 2 3 4 5 6 7
−0.6
−0.4
−0.2
0
0.2
0.4
0.6
Images
hm
1 2 3 4 5 6 7
−0.6
−0.4
−0.2
0
0.2
0.4
Images
hm
1 2 3 4 5 6 7−0.5
−0.4
−0.3
−0.2
−0.1
0
0.1
0.2
0.3
Images
c1
1 2 3 4 5 6 7
−0.5
−0.4
−0.3
−0.2
−0.1
0
0.1
0.2
0.3
Images
c1
1 2 3 4 5 6 7
−0.2
−0.1
0
0.1
0.2
0.3
Images
c2
1 2 3 4 5 6 7
−0.15
−0.1
−0.05
0
0.05
0.1
0.15
0.2
0.25
Images
c2
Figure 6: Differences in multifractal parameters for the 7 paintings. Top: hm middle: c1, bottom: c2 ; Left: All 7channels, right: Luminance L channel only.
1 – Channel All Lum. All Lum. All Lum. All Lum.hm 0.00 0.00 0.00 0.00 0.00 0.03 −0.14 −0.15c1 0.00 0.03 0.00 0.01 0.00 0.14 −0.07 −0.06c2 0.15 0.62 0.01 0.20 0.02 0.28 −0.01 0.01
2 – Channel All Lum. All Lum. All Lum. All Lum.hm 0.00 0.24 0.00 0.00 0.00 0.00 −0.20 −0.23c1 0.00 0.00 0.00 0.00 0.00 0.02 −0.11 −0.12c2 0.00 0.41 0.00 0.10 0.00 0.03 −0.02 0.02
3 – Channel All Lum. All Lum. All Lum. All Lum.hm 0.00 0.00 0.00 0.00 0.01 0.08 −0.07 −0.10c1 0.00 0.03 0.00 0.00 0.03 0.21 −0.06 −0.08c2 0.73 1.00 0.58 0.74 0.53 0.54 −0.00 0.00
4 – Channel All Lum. All Lum. All Lum. All Lum.hm 0.21 0.48 0.44 0.31 0.58 0.87 0.01 0.02c1 0.39 0.48 0.47 0.40 0.90 1.00 0.01 0.01c2 0.00 0.48 0.06 0.81 0.21 0.87 −0.01 0.01
5 – Channel All Lum. All Lum. All Lum. All Lum.hm 0.01 0.39 0.02 0.38 0.38 0.72 −0.05 −0.01c1 0.00 0.15 0.00 0.06 0.24 0.87 −0.05 −0.02c2 0.08 0.77 0.02 0.62 0.49 0.98 −0.02 0.00
6 – Channel All Lum. All Lum. All Lum. All Lum.hm 0.60 1.00 0.32 0.33 0.39 0.94 0.03 0.02c1 0.60 0.60 0.07 0.39 0.79 0.94 −0.02 −0.01c2 0.04 0.04 0.01 0.11 0.37 0.61 0.15 0.01
7 – Channel All Lum. All Lum. All Lum. All Lum.hm 0.00 0.87 0.01 0.50 0.29 0.75 −0.03 −0.02c1 0.01 0.24 0.00 0.31 0.13 0.77 −0.05 −0.03c2 0.54 0.24 0.98 0.57 0.26 0.90 0.00 −0.00
Table 2: P-values. For each 7 sub-tables (corresponding to the 7 images), the p-values correspond to the pairWiseSignTest (Left), PairWise RankTest (CenterLeft), NonPairWise Wilcoxon RankSum (CenterRight:). The Right pair ofcolumns reproduces the mean value of the difference between Original and replica. In each pair of columns, the leftcolumn corresponds to the test applied to all 7 channels, while the right column shows results for the test applied to theLuminance channel only.
50 100 150 200 250 300 350 400 450 500 550
50
100
150
200
250
300
50 100 150 200 250 300 350 400 450 500 550
50
100
150
200
250
300
50 100 150 200 250 300 350 400 450 500
50
100
150
200
250
300
350
400
450
50050 100 150 200 250 300 350 400 450 500
50
100
150
200
250
300
350
400
450
500
−10 −5 0 5 10−8
−6
−4
−2
0
2
4
q
!(q)
Charlotte6
OriginalCopy
0 0.2 0.4 0.6 0.80
0.5
1
1.5
2
h
D(h)
Charlotte6
OriginalCopy
Figure 7: Multifractal Analysis. Three first lines: original (left) and replica (right). Last line: estimated multifractalattributes, original (black) and replica (red).
Paris period
1 : f 297 2 : f 360 3 : f 374 7 : f 469
8 : f 524 11 : f 358 12 : f 371 16 : f 452Provence period
4 : f 392 5 : f 415 6 : f 451 10 : f 607
14 : f 411 15 : f 441 17 : f 475 18 : f 538To be classified
9:f572 13: f386 19: f605
Figure 8: Dating challenge: Provence vs. Paris periods. 8 paintings from the Paris period (top), 8 paintings from theProvence period (middle), 3 paintings to be classified.
f452
700 1400 2100 2800
280
560
840
1120
1400
1680
1960
100 200 300 400 500
100
200
300
400
500
0.25 0.5 1 2 4 85
10
15
20
scale [mm]
−10 −5 0 5 10−15
−10
−5
0
5
10
q
ζ(q)
0 0.5 1 1.5 2
0
0.5
1
1.5
2
h
D(h)
f452
700 1400 2100 2800
280
560
840
1120
1400
1680
1960
100 200 300 400 500
100
200
300
400
500
0.25 0.5 1 2 4 85
10
15
20
scale [mm]
−10 −5 0 5 10−15
−10
−5
0
5
10
q
ζ(q)
0 0.5 1 1.5 2
0
0.5
1
1.5
2
h
D(h)
f452
700 1400 2100 2800
280
560
840
1120
1400
1680
1960
100 200 300 400 500
100
200
300
400
500
0.25 0.5 1 2 4 85
10
15
20
scale [mm]
−10 −5 0 5 10−15
−10
−5
0
5
10
q
ζ(q)
0 0.5 1 1.5 2
0
0.5
1
1.5
2
h
D(h)
Figure 9: Multiple patches from one single painting. The multifractal spectra computed on 3 different patches extractedfrom the Red Channel of Van Gogh’s Painting f452 from the Paris period suggest that estimates from the 3 patches ofvisually different texture are consistent. The precise values for the multifractal attribute triple (c1, c2, hm) are (from leftto right): (0.93,−0.051, 0.050), (0.93,−0.081,−0.051), (0.96,−0.076,−0.007).

f452
700 1400 2100 2800
280
560
840
1120
1400
1680
1960
100 200 300 400 500
100
200
300
400
500
0.25 0.5 1 2 4 8−10
−5
0
5
scale [mm]
−15 −10 −5 0 5 10 15−20
−15
−10
−5
0
5
10
15
q
ζ(q)
0 0.5 1 1.5 2
0
0.5
1
1.5
2
h
D(h)
f605
140 280 420 560
350
700
1050
350
700
1050
350
700
1050
100 200 300 400 500
100
200
300
400
500
0.25 0.5 1 2 4 8−10
−5
0
5
scale [mm]
−15 −10 −5 0 5 10 15−20
−15
−10
−5
0
5
10
q
ζ(q)
0 0.5 1 1.5 2
0
0.5
1
1.5
2
h
D(h)
f475
650 1300 1950 2600
650
1300
1950
650
1300
1950
650
1300
1950
100 200 300 400 500
100
200
300
400
500
0.25 0.5 1 2 4 8−10
−5
0
5
scale [mm]
−15 −10 −5 0 5 10 15−20
−15
−10
−5
0
5
10
q
ζ(q)
0 0.5 1 1.5 2
0
0.5
1
1.5
2
h
D(h)
Figure 10: Dating challenge: Paris vs. Provence periods. Multifractal spectra computed on patches extracted fromthe Saturation Channel of Van Gogh’s Paintings: Paris period (f452, left), Provence period (f475, right), to be classified(f605, middle).
−0.4 −0.2 0 0.2 0.4 0.6
0.7
0.8
0.9
1
1.1
1.2
1.3
f297
f360
f374
f469
f524
f358 f371
f452
f392
f415
f451
f607
f411
f441
f475f538
f572
f386
f605
hmin
R
c1 S
Figure 11: Dating challenge: Paris vs. Provence periods. Plot of hm computed from the Red Channel vs. c1 fromthe Saturation Channel, suggesting that paintings f386 and f605 are closer to the Provence period cluster (Red), whilepainting f572 is closer to the Paris period cluster (Blue).
Van Gogh
1 : f 518 2 : f 752 3 : f 764 4 : f 799Non Van Gogh
5 : s447 6 : s448 7 : s457 8 : s503Unknown
5 : s506
Figure 12: Authenticity challenge: Van Gogh’s vs. non Van Gogh’s Paintings. 4 paintings from Van Gogh (top), 4paintings not from Van Gogh (middle), and the painting to be classified.
f764a
240 480 720
600
1200
1800
2400
100 200 300 400 500
100
200
300
400
500
0.25 0.5 1 2 4 820
25
30
35
scale [mm]
−15 −10 −5 0 5 10 15−25
−20
−15
−10
−5
0
5
10
q
ζ(q)
0 0.5 1 1.5 2
0
0.5
1
1.5
2
h
D(h)
s506
140 280 420 560
350
700
1050
1400
1750
100 200 300 400 500
100
200
300
400
500
0.25 0.5 1 2 4 85
10
15
20
scale [mm]
−15 −10 −5 0 5 10 15−20
−15
−10
−5
0
5
10
15
q
ζ(q)
0 0.5 1 1.5 2
0
0.5
1
1.5
2
h
D(h)
s447
700 1400 2100 2800
700
1400
2100
2800
100 200 300 400 500
100
200
300
400
500
0.25 0.5 1 2 4 85
10
15
20
scale [mm]
−15 −10 −5 0 5 10 15−20
−15
−10
−5
0
5
10
q
ζ(q)
0 0.5 1 1.5 2
0
0.5
1
1.5
2
h
D(h)
Figure 13: Authenticity challenge: Van Gogh’s vs. non Van Gogh’s Paintings. Multifractal spectra computed onpatches extracted from the Red Channel of Van Gogh’s (left) and non Van Gogh’s (right) Paintings compared to thepainting under test (middle).
−0.4 −0.3 −0.2 −0.1 0 0.10.85
0.9
0.95
1
1.05
f518
f752
f764af799
s447
s448
s457
s503
s506
hmin
S
c1 R
−0.4 −0.3 −0.2 −0.1 0 0.1−0.3
−0.2
−0.1
0
0.1
0.2
f518
f752
f764a
f799
s447
s448s457
s503
s506
hmin
S
hmin
R
Figure 14: Authenticity challenge: Van Gogh’s vs. non Van Gogh’s Paintings. Plots of hm computed from theSaturation Channel versus c1 (top) and hm (bottom) from the Red Channel suggest that painting s506 is closer to the VanGogh cluster (Blue) than to the Non Van Gogh cluster (Red).