Embed Size (px)
Citation preview
DI
SC
US
SI
ON
P
AP
ER
S
ER
IE
S
Forschungsinstitut zur Zukunft der ArbeitInstitute for the Study of Labor
Which Institutions Encourage Entrepreneurs to Create Larger Firms?
IZA DP No. 5481
February 2011
Saul EstrinJulia KorostelevaTomasz Mickiewicz
Which Institutions Encourage
Entrepreneurs to Create Larger Firms?
Saul Estrin London School of Economics
and IZA
Julia Korosteleva University College London
Tomasz Mickiewicz
University College London
Discussion Paper No. 5481 February 2011
IZA
P.O. Box 7240 53072 Bonn
Germany
Phone: +49-228-3894-0 Fax: +49-228-3894-180
E-mail: [email protected]
Any opinions expressed here are those of the author(s) and not those of IZA. Research published in this series may include views on policy, but the institute itself takes no institutional policy positions. The Institute for the Study of Labor (IZA) in Bonn is a local and virtual international research center and a place of communication between science, politics and business. IZA is an independent nonprofit organization supported by Deutsche Post Foundation. The center is associated with the University of Bonn and offers a stimulating research environment through its international network, workshops and conferences, data service, project support, research visits and doctoral program. IZA engages in (i) original and internationally competitive research in all fields of labor economics, (ii) development of policy concepts, and (iii) dissemination of research results and concepts to the interested public. IZA Discussion Papers often represent preliminary work and are circulated to encourage discussion. Citation of such a paper should account for its provisional character. A revised version may be available directly from the author.
IZA Discussion Paper No. 5481 February 2011
ABSTRACT
Which Institutions Encourage Entrepreneurs to Create Larger Firms?*
We develop entrepreneurship and institutional theory to explain variation in different types of entrepreneurship across individuals and institutional contexts. Our framework generates hypotheses about the negative impact of higher levels of corruption, weaker property rights and especially intellectual property rights, and a larger state on entrepreneurs who plan to grow faster. We test these hypotheses using the Global Entrepreneurship Monitor surveys in 55 countries for 2001-2006, applying a multilevel estimation framework. We confirm our main hypotheses but we find no significant impact from intellectual property rights. JEL Classification: L26, D23, D84, J24, P11 Keywords: entrepreneurship, institutions, corruption, property rights, government,
Global Entrepreneurship Monitor Corresponding author: Saul Estrin Department of Management London School of Economics Houghton Street London WC2A 2AE United Kingdom E-mail: [email protected]
* The authors thank Paul Reynolds for advice on the consolidated Global Entrepreneurship Monitor (GEM) Adult Population Survey Data Set: 2001-2006. Global Entrepreneurship Monitor is an international project started in 1998 jointly by Babson College, USA and London Business School, UK, and extended to involve other national teams. We are also grateful to Zoltan Acs, Gian Fazio, Oleh Havrylyshyn, Philipp Koellinger, Wim Naudé, Paul Reynolds, Gerald Roland, David Smallbone, László Szerb, Friederike Welter, the participants of the London UCL and of Imperial College workshops on entrepreneurship, of the annual ASSA/ACES conferences in San Francisco and Denver, of the Annual Academy of Management conference in Chicago, and University of Staffordshire for comments and criticism.
3
1. INTRODUCTION
Entrepreneurship is a multi-faceted activity, with a variety of definitions and
interpretations (Parker 2009). For some researchers, the key characteristic of entrepreneurs is
their ability to innovate and create new and large scale business ventures (Acs and Audretsch
1990). Others contrast entrepreneurship with paid employment, and analyse the former as a
labour market choice to become self-employed (Evans and Leighton 1989). In practice, the
evidence suggest that entrepreneurship covers a multitude of activities from large scale new
firm creation via developing new business models within existing firms to more flexible
employment relationships for a single individual through self-employment. While an
enormous amount of theoretical and empirical work analyses the determinants of
entrepreneurship, there has been inadequate recognition that these determining characteristics
may vary according to what type of entrepreneur is being considered. Thus, some of the
factors conducive to the formation of micro-enterprises might be fundamentally different to
those underpinning innovative new venture creation which plan to grow to a significant scale.
This may also have important implications for business policy to support entrepreneurship.
This argument is likely to have particular force when we refer to the institutional context
supporting entrepreneurial activity across countries. Since Baumol (1990, 1993), a literature
has emerged suggesting that entrepreneurial activity will vary by country according to the
quality of supporting institutions. Institutional theory has argued that company behaviour,
including entrepreneurial choices, will be context specific (Meyer and Peng 2005), and a
literature has emerged to show that entrepreneurial activity is sensitive to the quality of
institutions (Batjargal 2003; Sobel 2008) as well as to the level of development. Within this
context, entrepreneurship, and especially entrepreneurial aspirations, are both seen as elements
4
in the process of autonomous experimentation leading to innovations and fuelling economic
progress (Ricketts, 2006). Important theoretical developments of these notions include
Busenitz, Gomez and Spencer (2000) while Aidis et al.(2010) establish empirically the central
role of corruption, the quality of property rights and the size of the state sector in explaining
the variation in rates of entrepreneurial entry across countries. Our approach in this paper is to
explore whether the plans of entrepreneurs to create jobs are influenced by the institutional
characteristics of the countries where they live. Our framework generates hypotheses on the
institutional factors influencing the expected size of new entrepreneurial firms at time of the
start-up, in terms of the aspirations to generate employment five years hence. We test these
hypotheses using a large scale cross-country cross-individual dataset containing 13,336
observations on entrepreneurs’ growth aspirations comprising 55 countries1
We go on to establish empirically that the proposed aspects of the institutional context
do affect the employment growth plans of entrepreneurs. Controlling for the level of
development and numerous individual characteristics, we show that less corruption and better
protection of property rights enhance the growth plans of entrepreneurs. In turn, governance
and allocative disincentives indicated by the size of the government are shown to have a
(Global
Entrepreneurship Monitor (GEM) 2001-2006) combined with a number of institutional
datasets. Taking into account the hierarchical structure of the data, we employ multilevel
modelling with individuals representing level one and countries or country-years representing
level two. We also address the problem of potential selection bias which might arise from the
interdependence between individual’s choice of whether to become an entrepreneur and
his/her growth aspirations, by utilizinga Heckman selection framework.
1 The 2001-2006 GEM dataset includes the following countries: Argentina, Australia, Austria, Belgium, Brazil, Canada, Chile, China, Colombia, Croatia, Czech Republic, Denmark, Ecuador, Finland, France, Germany, Greece, Hong Kong, Hungary, Iceland, India, Indonesia, Ireland, Israel, Italy, Jamaica, Japan, Jordan, South Korea, Latvia, Malaysia, Mexico, Netherlands, New Zealand, Norway, Peru, Philippines, Poland, Portugal, Russia, Singapore, Slovenia, South Africa, Spain, Sweden, Switzerland, Taiwan, Thailand, Turkey, Uganda, UK, United Arab Emirates, United States, Uruguay, Venezuela.
5
negative and significant effect on entrepreneurial employment aspirations. However, though
the literature has suggested that intellectual property rights may also be important for
entrepreneurship, we find no evidence that they count for employment growth.
These findings have important implications for entrepreneurs and policy-makers. We
place the aspirations by entrepreneurs to create more jobs in the spotlight, because raising
employment is important for its own sake and dynamic new ventures are strongly correlated
with innovation, technological change and investment. Entrepreneurs planning to build
relatively large scale businesses are advised to look closely at both levels of corruption and the
property rights environment. If possible, they should choose to locate where the quality of the
property rights system is higher and corruption less widespread. Policy-makers seeking to
encourage high-aspiration entrepreneurship in order to stimulate innovation, employment and
growth in the economy as a whole should focus above all else on containing the levels of
corruption and improving the quality of the basic property rights systems and on contract
enforcement, rather than a narrower focus on intellectual property rights.
The existing literature is largely silent on the question of how entrepreneur’s job growth
aspirations might be determined and almost none of existing papers address the question
across institutional contexts. Autio (2005, 2007) provides insights about regional patterns of
high-growth aspiration entrepreneurial activity, its associations with the national
entrepreneurial environment, and individual characteristics of high-growth aspiration
entrepreneurs, but does not offer testable implications regarding their determinants. There are
however two relevant recent contributions in the literature: Bowen and De Clercq (2008), who
analyse the impact of the institutional environment on the allocation of entrepreneurial effort
toward high-growth activities using aggregate data, and Autio and Acs (2010), who similarly
to us apply a multilevel framework, but focus on a single institutional dimension, namely
intellectual property rights. We provide a more general theoretical and empirical framework
and focus on planned employment growth rates rather than the number of jobs which
6
entrepreneurs aspire to create. This difference is important because expected employment does
not accurately measure employment growth aspirations. This is because even in a business
classified on the basis of the expected level of future employment as a high-growth aspiration
venture, the employment growth rate may become zero or even negative when we take
account of the current level of employment. The errors introduced by failing to control for the
initial level of employment are not trivial; out of all new entrepreneurs who expect to employ
other people in five years time, 28.5% have their expected employment equal to their current
level of employment.
We make original contribution in three main areas. Our conceptual work based on
institutional theory by North (1990), Baumol (1990) and Williamson (2000) develops a
framework to analyse the role of the national institutional context on types of
entrepreneurship, differentiated according to employment growth aspirations. We propose
three specific hypotheses concerning the impact of corruption, strength of property rights and
the size of the state on planned employment growth. Further, we address the statistical issues
arising from the joint determination of entrepreneurship and of growth aspirations and
resulting from the fact that the dataset has a hierarchical structure. We address the first by
using Heckman’s methodology to verify whether selection models are appropriate to take
account of potential interdependences, and the second by the use of multilevel modelling.
Finally, based on theory, our empirical results indicate which institutions influence
entrepreneurial employment growth aspirations. The negative impact of corruption is
highlighted, as is the general benefit of sound property, but not intellectual property rights.
Larger state sectors have a generally demotivating effect on job creation by entrepreneurs.
The paper proceeds as follows. The next section develops institutional theory to identify
the institutional factors likely to influence entrepreneurs’ employment growth aspirations. It
concludes with the three hypotheses to be tested. Section 3 describes the data and the
methodology, including the individual and macro level control variables such as the level of
7
development (GDP per capita) to be used in the empirical analysis. Empirical results and
discussion follow in Section 4, and Section 5 presents conclusions and policy implications.
2. EMPLOYMENT GROWTH ASPIRATIONS OF ENTREPRENEURS; THEORY
AND HYPOTHESES
This paper analyses the ways in which a number of key institutional dimensions might
influence entrepreneurial aspirations. Since Douglass North’s definitive analysis (1990), it has
been understood that many of the incentives underlying rational behaviour which economists
regard as too obvious to discuss with reference to developed market economies in fact rely on
the quality of institutions in the country under analysis. Entrepreneurial organisations, like all
others, will adapt their strategies to fit the opportunities and limitations defined by the
institutional framework in which they operate. Baumol argues that the quality of institutions
affects the allocation of entrepreneurial effort between alternative activities, e.g. productive or
non-productive (Baumol 1993, 2005). More generally, the literature has established that a
well-functioning business environment provides positive incentives for entrepreneurs while a
weak institutional environment is likely to be deleterious (North 1990, 1994: Baumol 1993;
Davidsson and Henrekson 2002; Harper 2003; Aidis et al. 2010). For example, strong property
rights are a crucial ingredient in the development of efficient capital markets, and therefore the
flow of funds to entrepreneurs. Similarly, it has been understood that the establishment and
enforcement of intellectual property rights for inventors of new products and processes will
stimulate the flow of innovation.As a third example, one can cite the argument that corruption
will impact disproportionately on entrepreneurs relative to existing organisations because it is
more difficult for them to evaluate the likely future scale and frequency of demands on their
income stream (Aidis and Mickiewicz, 2006). From the sociological perspective, Busenitz,
Gomez and Spencer (2000) highlight that variation in formal institutions also has deep social
8
and cultural roots, which influence the social desirability of entrepreneurial activity. Bowen
and de Clerq (2008) develop a framework building on Whitley (1991) who proposes that the
institutional context influences national business systems, and goes on to suggest particular
institutions likely to affect the behaviour of entrepreneurs. However, their list of critical
institutions is ad hoc, largely derived from their predicted effects on entrepreneurs rather than
from institutional theory and in particular does not take account of key distinctions, for
example concerning the exogeneity of institutions and differences in their speed of change,
which are particularly important when using data which have a time dimension.
Addressing these concerns, in our work, we build on the frameworks of North (1990),
Williamson (2000) and Aidis et al. (2010). North introduces a critical distinction: between
formalinstitutions, namely the “rules of the game” comprising the laws and formal institutional
structures that define the economic incentives guiding individual and organisational choices
and strategies, and informal institutions that comprise the social arrangements, networks and
loosely knit structures that explain how many of these incentives are either enhanced or muted
by the actual operations of institutions. Estrin and Prevezer (2011) analyse how formal and
informal institutions interact either to encourage or to disincentivise entrepreneurial activity.
Formal institutions are clearly of great relevance to entrepreneurship, and of these perhaps the
most important is the property rights system which underlies the operation of a market
economy. However, the literature also places great emphasis on informal institutions, for
example on the role of social networks in supporting early entrepreneurial activity and in
substituting for weak or deficient formal institutions.
Williamson (2000) places further structure on the analysis with the proposition that
institutions can be considered in terms of a hierarchy comprising four levels, each placing
constraints on the levels below. He places informal institution, denoted social embeddedness,
at the top of the hierarchy because these are the deepest rooted and the slowest changing.
When considering the variation of entrepreneurship across countries, Baumol (1990) might
9
argue that the most important example of such an institution is represented by the levels of
individual, legal and administrative probity. Corruption is an important indicator of this norm
and can therefore be viewed in Williamson’s sense as embedded (McMillan and Woodruff
2002; Aidis et al. 2010). At the second level are the constitutional foundations of the formal
institutional environment. As Williamson notes (p. 598), here “the definition and the
enforcement of property rights and the enforcement of contract law are important features”,
and this is especially so for entrepreneurs who need to rely on the enforceability of their
claims as residual claimant to the returns from the organisations that they have created
(Acemoglu and Johnson 2005; Johnson et al 1999, 2000; Hodler 2009). The third level is
governance, and is concerned with shaping the way in which the individuals interact with each
other in practice. The key areas in the depth and quality of governance that are of relevance to
entrepreneurship include regulation of incumbent firms to prevent anti-competitive behaviour
that might restrict the activities of entrepreneurs and the barriers to entry (Djankov et al.
2002). Generally, the dimensions of governance relate to the scale and effectiveness of the
state apparatus. Finally, at the fourth level, Williamson (2000) considers resource allocation
and employment, and the traditional economist’s analysis of prices, quantities and incentives.
From the entrepreneurship perspective, the main way that this will influence individual
choices is via opportunity costs and rewards from entrepreneurship as against alternative
forms of employment (Parker 2009).
In their study of institutions and entrepreneurship, Aidis et al. (2010) develop hypotheses
concerning all four levels in the hierarchy, namely informal institutions (corruption), formal
institutions (property rights), governance and resource allocation; with the latter two
combined into a single indicator as the size of the government. They also highlight the critical
role of the level of development, indicated by for example by GDP per capita, in moderating
some of these effects. It is well known that levels of entrepreneurial activity decline with level
of development up to a point, and then rise, as innovative activity plays an increasingly
10
important role in the growth process (Wennekers et al 2005). However, this relationship
depends on various aspects of institutions. For example, individuals in poor countries choose
entrepreneurship or self-employment rather than taking paid work because the opportunities
for work are relatively few and so the opportunity cost of entrepreneurship is low. However,
the returns to entrepreneurship will be reduced when corruption is high, property rights are
weak or entry regulations are burdensome. Similarly, formal property rights may tend to be
stronger in more developed economies but considerable variation remains presentthat could
lead to differences in entrepreneurship rates(e.g.France is characterised by weaker protection
of property rights than Germany(Heritage Foundation)).
The work cited above addressed the question of how the institutional context affects the
decision by individuals as to whether to become an entrepreneur rather than to choose paid
employment or not to be involved in the labour force. Our analysis in this paper will instead
focus on differences between entrepreneurs. It will apply the Williamson’s (2000) framework
and build on previous findings to explain the impact of different institutions on employment
growth aspirations. This is the element of entrepreneurship of particular relevance for
business policy and company strategy because entrepreneurs that intend to grow rapidly are
also likely to be the ones that are bringing new products to markets or developing new
business models or production processes. In the discussion that follows we therefore propose
ways that the key institutions identified in the literature as influencing the entrepreneurial
entry decision might also influence the employment growth aspirations of those entrepreneurs,
addressing each of the levels of Williamson’s (2000) hierarchy in turn.
We focus on the institutional dimensions that the literature has regarded as crucial in
determining entrepreneurship, namely, corruption, the protection and enforcement of property
rights and the size of the state sector. Both freedom from corruption and property rights
provide the basis for voluntary exchange and the market economy and have been identified
empirically as a critical determinant of entrepreneurial activity (Djankov et al 2002; McMillan
11
and Woodruff 2002; Aidis et al. 2010). The size of the state sector impacts on
entrepreneurship via the returns to entrepreneurial activity and the opportunity cost of
alternative employment choices (Parker 2004, 2009; Henrekson, 2005; Aidis et al. 2010). We
discuss these aspects in turn below.
2.1Corruption
It has been argued that corruption is damaging to new firm entry, by raising the costs and
therefore reducing the returns to entrepreneurial activity (Anokhin and Schulze 2009). It
makes the economic environment highly uncertain (Choi and Thum 2005), in a manner that
impacts relatively more on potential new firms than incumbents, who have developed
experience of operating in a corrupt environment and operate via an established set of social
networks to limit the scale and impact of corrupt practices in their businesses (Aidis et al.
2008a; 2010). New firms need to develop experience and contacts, and in the interim therefore
operate at a disadvantage to existing enterprises, which further reduces the returns to
entrepreneurship. Baumol (1990) argued that entrepreneurship is an activity that could take
productive, non-productive or destructive forms according to the institutional environment in
which entrepreneurs operated. Desai and Acs (2007) suggest that destructive entrepreneurship
is probably best understood through the concept of rent seeking; “any redistributive activity
that takes up resources” (p.5). They cite Murphy et al. (1993) who explore the trade-off
between entrepreneurship (and innovation) and rent seeking (redistributing existing wealth,
often through corrupt practises); they find that the latter is rewarded more highly than the
former in many institutional contexts. The corresponding hypothesis related to the link
between environments that have higher levels of corruption and the lower likelihood of
entrepreneurial entry is tested using the GEM dataset by Aidis et al (2010). They confirm the
hypothesis and note implicit supporting evidence for the view that corruption is a higher order
(embeddedness level) institution because the phenomenon is very slow to change.
12
The effects of a corrupt institutional environment seem likely to be particularly pernicious
when we consider higher growth aspiration entrepreneurship. As noted above, corruption will
reduce the returns to all types of entrepreneurship. However, it seems likely that very small
scale enterprises and self-employed workers can largely fly below the radar screens of corrupt
officials, in a manner that would not be possible for new firms which have a larger economic
footprint. Moreover, as noted by Desai and Acs (2007), a corrupt environment may have
negative supply side effects on entrepreneurs, and especially on those with higher aspirations,
leading them to satisfy their ambitions through rent seeking rather than the formation of new
firms. In the light of this we hypothesise that:
Hypothesis 1: A higher level of corruption will reduce the employment growth aspirations of
entrepreneurs.
2.2 Protection of property rights
Recent theories of entrepreneurship emphasise that “the institution of private property ...
has an important psychological dimension that enhances our feelings of ... internal control and
personal agency, and it thereby promotes entrepreneurial alertness” (Harper 2003, p. 74). It is
important that property rights not only guarantee the status quo, but also have the ‘find and
keep’ component, which is essential for entrepreneurial activities, related to discovery,
innovation and the creation of new resources (Harper 2003). Acemoglu and Johnson (2005)
show that property rights have pronounced effects on investment, financial development and
long-run economic growth. In their empirical account, Aidis et al. (2010) find the property
rights system to play the pivotal role in determining entrepreneurial entry, in particular in low
and middle income countries. Johnson et al. (2002) also provide evidence that weak property
rights discourage entrepreneurs from reinvesting profits.
13
However the literature has not investigated whether property rights will have a differential
effect with respect to entrepreneurs’ plans for employment growth. The significance of
property rights is related to the opportunity for the entrepreneur to utilise the resources of
others via secure contracts. For example high-growth aspiration projects are likely to be more
dependent on external finance. Moreover, because the assets that entrepreneurs rely upon are
often liquid, they may be easier to expropriate. In contrast, less sophisticated and less contract-
intensive forms of entrepreneurship such as simple one-person businesses will be less sensitive
to the quality of protection of property rights. Lower aspiration forms of entrepreneurship may
instead rely on localised trust that can partially substitute for a deficient formal institutional
environment (Aidis et al 2008a). Arrangements of this kind are commonplace in many
developing countries (De Soto, 1989; 2000). Therefore high-growth aspiration
entrepreneurship may be more sensitive to institutional quality.
Hence, the first part of our second hypothesis is formulated in general terms as:
Hypothesis 2a: Stronger property rights with respect to contract enforcement will encourage
higher employment growth aspiration entrepreneurship.
Bowen and de Clerq (2008) among others have argued that intellectual property rights
form the most important component of property rights, relevant for higher employment growth
aspiration entrepreneurs. This is because they are likely to be basing their decision to enter a
market upon an innovation of product or process, and they are therefore especially exposed to
imitation or theft of their ideas. The intellectual property rights framework is therefore the
element of Williamson’s (2000) second level of institutional hierarchy that they chose to stress
in analysing the impact of property rights on higher employment growth aspiration
entrepreneurship. This provides an alternative to hypothesis 2a namely,
14
Hypothesis 2b: Stronger property rights with respect to intellectual property will encourage
higher employment growth aspiration entrepreneurship.
2.3Size of the government
Aidis et al. (2010) showed that the third level of Williamson’s hierarchy as applied to
entrepreneurship could be combined as a single variable, indicating the size of the government
sector. A large state sector is usually synonymous with generous levels of welfare provision,
for example unemployment benefits, pensions and child welfare for women in work. These
benefits must be paid for, and this is usually done by high levels of personal taxation, often
within a progressive tax regime in which high earners, such as successful entrepreneurs, pay
higher marginal rates. This will reduce the expected returns to entrepreneurial activity.
Moreover, when the welfare system for those in employment is generous, the opportunity cost
of entrepreneurship as against other forms of employment or non-participation in the labor
force is raised. Taken together, these factors would suggest that a larger state sector will
reduce entrepreneurial activity; a hypothesis confirmed by Aidis et al. (2010).
In this context, we may also consider the impact on higher employment growth aspiration
entrepreneurship. If a larger state sector is financed by higher levels of average and marginal
taxation, this is likely to deter high growth entrepreneurship more by reducing the net returns
to entrepreneurship (Carroll et al. 2000).
Accordingly we hypothesise:
Hypothesis 3: A greater scale of government economic activity will reduce the employment
growth aspirations of entrepreneurs.
15
3. DATA AND METHODOLOGY
3.1 Individual Data
To test our hypotheses we merge GEM data with a country-level institutional indicators
and macroeconomic controls. We utilize data collected through the GEM adult population
surveys in 2001-2006 that cover 55 countries worldwide. With very few exceptions, the data
consist of representative samples of at least 2,000 individuals in each country. The samples are
drawn from the working age population which avoids the potential selectivity bias that could
affect studies which focus on existing entrepreneurs. GEM surveys were completed through
phone calls and through face-to-face interviews in countries, where low density of the
telephone network could create a bias. National datasets are harmonised across all countries
included in the survey2
The GEM data capture a wide range of business creation activities. We can distinguish
between (a) individuals who intend to create a new venture, (b) who are in the process of
establishing a new firm (start-ups, or nascent entrepreneurs)
.
3
2 For more details of the sampling procedure see Reynolds et al. (2005, 2008). 3 Start-ups or nascent entrepreneurs are defined in GEM as individuals between 18-64 years old, showing some action towards setting up a new business whether fully or partly owned. They also must not yet have paid any wages or salaries for more than three months.
, (c) currently operating young
firms (under 3.5 years), and (d) other owners-managers of established businesses. We
concentrate on young firms as our proxy for entrepreneurial entry. This category serves well
the purpose of our study as, unlike the nascent entrepreneurship category, it provides good
coverage of the current level of employment, used for defining our dependent variable (see
subsection 3.3). It is hard for start-ups to respond to questions concerning the current level of
employment given the early stage of their venture, for example, writing a business plan. Thus
in our dataset, only 8% of the sample start-ups report the level of employment as against 83%
for young firms.
16
3.2 Dependent variable
Our dependent variable, the employment growth aspirations (EGA as listed in the equation
1, presented in section 3.5 below) of owners-managers of new firms (entrepreneurs), is
calculated as the expected percentage change in the level of employment in five years from the
current level. Following the existing practice (Parker 2009), we add the owner-manager to the
expected and current employees to calculate both the expected and the current employment
correspondingly. The rate of employment growth reflecting entrepreneurial aspirations is
measured by the difference between the natural logarithms of expected and current
employment. Previous studies utilizing GEM data (Bowen andDeClercq 2008; Autio and Acs
2010) focus on expected employment alone4, which we do not consider as an accurate
measure of growth expectations. This is because, when we take account of the current level of
employment, we find that the employment growth rate may become zero or even negative,
even in a business classified on the basis of the expected level of future employment as a high-
growth aspiration venture. In our sample, out of all new entrepreneurs who expect to employ
other people in five years time, 28.5% have their expected employment equal to their current
level of employment, which indicates a true expectation of zero growth5
Figure 1 show country-level differences in new businesses’ employment growth
aspirations with 95% confidence intervals. These were calculated from a random-intercept
model that included only country effects. The average employment growth aspirations of new
owners-managers vary from as low as 11% in Greece to as high as 75% in Colombia (with
. Accordingly, in this
study we utilize the expected rate of employment growth by new firms to capture
entrepreneurial aspirations.
4 The question is worded, ‘How many people will be working for this business, not counting the owners but including all exclusive subcontractors, when it is five years old?’ which does not capture net employment creation. 5 There are also cases when new entrepreneurs expect to employ people five years hence, but the expected rate of employment growth is actually negative (4.5%).
17
Chile and Peru scoring close behind)6
For the strength of property rights (Hypothesis 2a), no universally accepted set of
measures yet exists
. Countries with predicted residuals above the horizontal
line at zero have mean employment growth expectations higher than all countries’ average
(44%).
{Figure 1}
3.3 Cross Country Data; variables related to our main hypotheses
To test Hypothesis 1, we use the Heritage Foundation Index of ‘Freedom from
Corruption’ to measure the level of corruption, inversely (l.FreeCorr: the operator l,is added
to denote that a variable is lagged one year). This indicator shows the perception of corruption
in the business environment, including levels of governmental administrative, judicial and
legal corruption (Beach and Kane 2008). It ranges from 0 to 100, with 100 denoting the lowest
levels of corruption.
7
6 These mean scores for countries are calculated on the basis of random intercepts, while confidence intervals are based on empirical Bayesian predictions.
, though many scholars have relied on the Heritage Foundation–Wall
Street Journal index of quality of property rights (e.g. Acemoglu and Johnson, 2005; Aidis et
al 2010; Autio and Acs 2010). However, the Heritage Foundation variable integrates two
dimensions of property rights, namely protection from arbitrary government and protection of
private contracts and given our theoretical framework we follow Acemoglu and Johnson
(2005) in believing the former to be more important, especially for entrepreneurship. We
therefore use as our main measure of strength of property rights the Polity IV measure of
7These include indicators provided by the International Country Risk Guide (especially law and order and investment profile measures; see: http://www.prsgroup.com/), the World Bank measures of governance effectiveness (especially, the rule of law indicator; see: Kaufmann et al, 2009); the World Bank’s Doing Business indicators (especially, those related to enforcing contracts; see: World Bank, 2009); the Frazer Institute indices (especially: legal structure and security of property rights indicator; see: Gwartneyet al, 2008) and the Heritage Foundation / Wall Street Journal indices (especially: property rights; see: Beach and Kane, 2008). In addition, given that the protection of property rights is conditional on the more fundamental feature of lack of arbitrariness in government actions, one may rely directly on measures of constraints on executive branch of the government (Marshall and Jaggers, 2007; for application, see: Acemoglu and Johnson, 2005). All these indicators are highly correlated, especially as underlying source information comes from the limited number of sources (see: Kaufmann and Kraay, 2008).
18
efficient constraints on the arbitrary power of the executive branch of the government, dubbed
as “constraints on executive” (l.ExecConstr).
Our measure of the strength of intellectual property rights (Hypothesis 2b) is based on the
executive survey conducted by World Economic Forum. It is scored as a continuous variable
from 1, denoting weak protection, to 7, representing the world’s most stringent level of
protection (l.IntelPro). Finally to measure the size of the state (Hypothesis 3), we use the
Heritage Foundation measure, which is based on the quadratic transformation of the ratio of
government expense to GDP, with lower scores signifying a larger government (l.GovSize).
3.4 Control Variables
We follow Aidis et al. (2010) in controlling for the level of development by using per
capita GDP at purchasing power parity (l.GDPpc) as well as the GDP annual growth rate
(obtained from the World Bank World Development Indicators) for cyclical effects
(l.GDPgrowth).
Commencing with macro-level variables, we follow Bowen and De Clercq (2008) in
controlling for FDI (foreign direct investment) (l.FDI). Prior research identifies various
indirect transmission mechanisms including technological externalities, backward and forward
linkages and competition (Damijan et al 2003; Navaretti and Venables 2004; Javorcik 2004).
Entrepreneurship, especially of the high-growth aspiration type, may serve as a mechanism
through which a new idea or technologies from foreign subsidiaries may spill over to domestic
companies (Audretsch and Thurik 2004, Cohen and Levinthal 1989). FDI may increase
competition, affecting both the market position of domestic incumbent firms and discouraging
the entry of new start-ups (De Backer and Sleuwaegen 2003; Bowen andDeClercq 2008). We
use UNCTAD datafor the share of FDI in GDP.
Given the multilevel nature of our data it is also important to control for the individual
characteristics of entrepreneurs (Parker 2009). In particular, business networks have been
19
found to play an important role via social learning using role models (Minniti et al. 2005b) in
assisting entrepreneurs to find the resources required for business creation (Aldrich et al 1987;
Djankov 2006; Nanda and Sorensen 2007; Aidis et al 2008a; 2008b). Network capital also
facilitates entrepreneurs’ access to finance (Aldrich et al 1987, Johannisson 2000) and is often
regarded as an intangible asset that can be used to overcome difficulties arising from failure of
formal institutions (Estrin and Mickiewicz 2011). We control for this by using the response to
a GEM question about whether the individual knows an entrepreneur personally
(KnowsEntrep) and also introduce a dummy variable denoting individual experience of being
a business angel (BusAngel) which is expected to be positively associated with entrepreneurs’
expectations of employment growth.
Previous entrepreneurial experience is argued to make subsequent entry more likely by
enhancing self-efficacy, both through “direct mastery experience (learning by doing) and
vicarious experience (learning by seeing)” (Harper 2003, p. 46). However, owning another
existing business (EstabBus) may raise the opportunity cost of a new involvement,
discouraging serial entrepreneurship.
A number of scholars have articulated the influence of risk aversion on the individual
decision to become an entrepreneur (Kihlstrom and Laffont 1979; Cramer et al. 2002). The
conventional wisdom is that individuals with lower risk aversion are more likely to become
engaged in entrepreneurial activity. Both Arenius and Minniti (2005) and Ardagna and Lusardi
(2008) find that an increased fear of failure, associated with higher risk aversion, discourages
nascent entrepreneurial activity. We control for this by using a GEM question about whether
the fear of failure would prevent the individual from starting a business (FearFail).
Previous GEM-based research shows that individuals with higher educational attainment
are more likely to start a business (Minniti et al 2005b) and to direct their efforts towards high-
growth activities (Autio 2005). We use two variables to control for education, concerning
secondary (EducSecpost) and tertiary education (EducPost) respectively. In addition, middle-
20
aged persons are more likely to start a business (Reynolds et al 1999; Minniti et al 2005b) and
we control for a quadratic in the age of the individual (Age, AgeSq). Entrepreneurial activity is
found to vary significantly with gender: being a male is more likely to drive up the rates of
entrepreneurship (Minnitiet al 2005a; Grilo and Thurik, 2005) so we include a dummy
variable for gender (Male). Individuals who are currently employed also found to be more
likely to become entrepreneurs (Minnitiet al 2005a), so we include a dummy variable for
employment status (CurrEmp).
Finally, we control for the current level of employment of young ventures in our sample,
expecting the higher initial level of employment to be negatively related to employment
growth plans of entrepreneurs (lnEmployment).
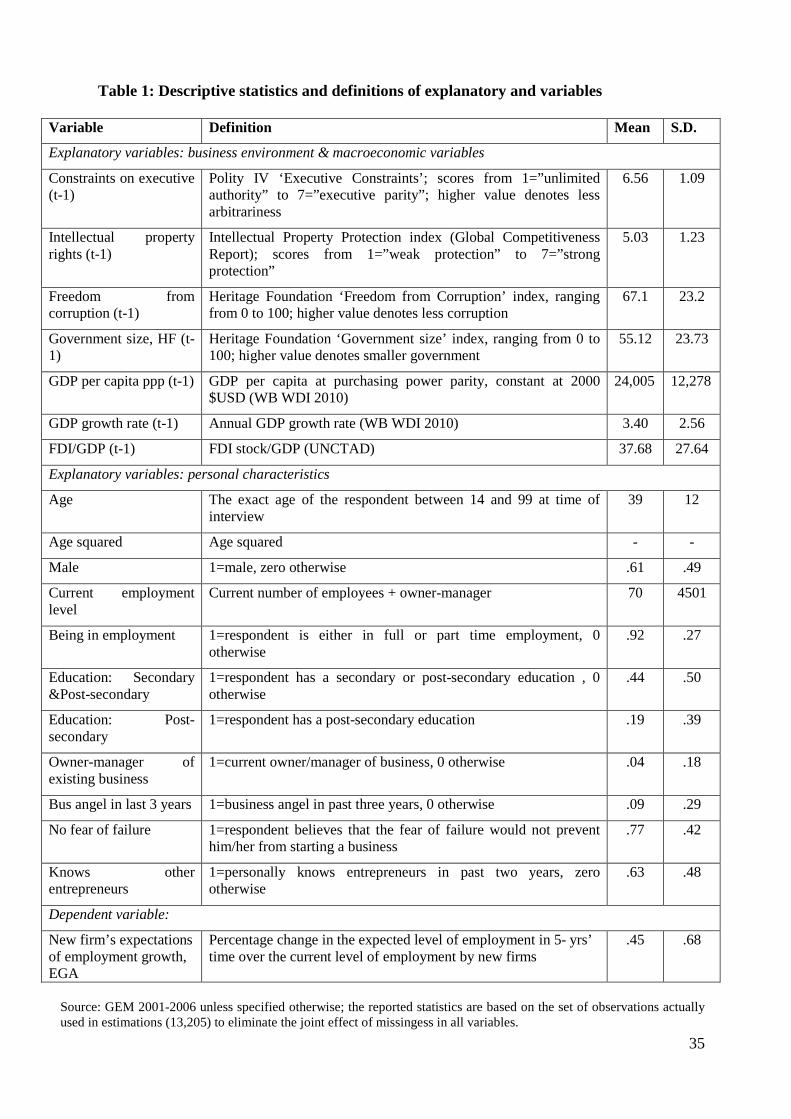
Definitions of variables discussed above are reported in Table 1 below.
{Table 1}
3.5 Methodology
We follow Autio and Acs (2010) in using multilevel modelling to address the issues of
unobserved heterogeneity within the context of a cross-country, cross-time, cross-individual
dataset. Multilevel modelling takes account of the fact that our dataset has a hierarchical
structure in which individuals represent level one and country-years samples represent level
two. This allows us to control for clustering of the data within a country or country-year.
Failure to do this would lead to biased results. Specifically, clustering may give rise to the
problem of unit dependencies, where, for example, two entrepreneurs from the same country
in the same year are more likely to exhibit similar patterns in their behaviour whether this
concerns growth aspirations or any other strategic choice. In this case, the independence
assumption does not hold, and a multi-level, random effects model should be employed to
obtain the correct standard errors (Rabe-Heskethet al. 2005). We utilise more sample
information by choosing country-years rather than countries for our level two groupings to
take account of differences in samples collected in different years, where applicable.
21
We examined if the choice of multilevel modelling with country-year effects is justified on
this dataset: we tested the significance of country-year group effects (random intercepts) by
performing a likelihood ratio test which compares the multilevel model with a single-level
model8
ijntInEmployme
. We found that country-group effects are significant for models of entrepreneurial
employment growth aspirations, thus confirming the choice of methodology. We further
tested the appropriateness of utilizing a random intercept versus a random slope model where
in the first instance we allow only for intercept to vary randomly across country-year groups
while in the second we allow for both the intercept and the slope to vary randomly across
country-year groups. In testing for random slopes, we used a likelihood ratio (LR) test
comparing a pair of a random-intercept model with a random-slope model for each individual-
level variable. The results of LR tests (available upon request from the authors) suggest that a
random intercept model is preferred.
In addition to individual effects (subscript ij below) we also introduced country-year
averages (subscript j below), distinguishing between individual level and group level variation,
so that for instance coefficient β5 for represents an individual effect of being in
employment, and coefficient β16 for jntInEmployme represents a peer effect of employment
prevalence rate in a given country-year group that may affect the individual entrepreneurial
decision. By using the LP test we verified that the inclusion of peer effects was needed.
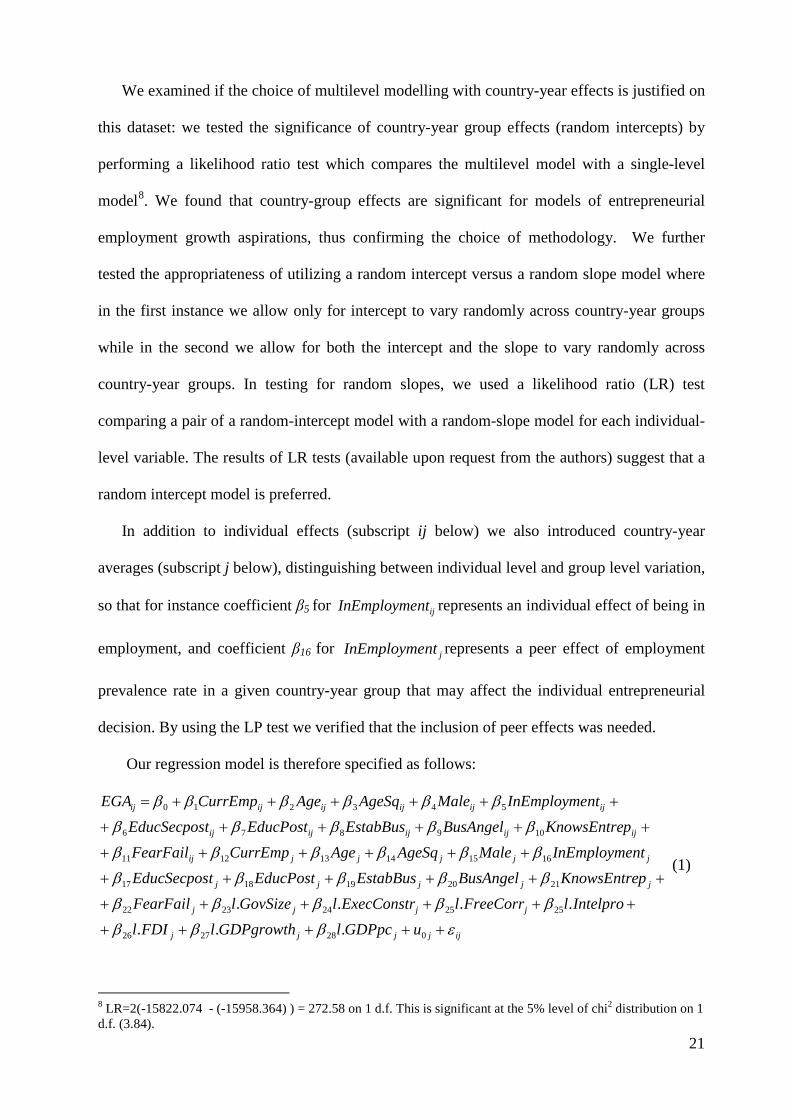
Our regression model is therefore specified as follows:
ijjjjj
jjjj
jjjjj
jjjjjij
ijijijijij
ijijijijijij
uGDPpclGDPgrowthlFDIlIntelprolFreeCorrlExecConstrlGovSizelFearFail
pKnowsEntreBusAngelEstabBusEducPosttEducSecposntInEmploymeMaleAgeSqAgeCurrEmpFearFail
pKnowsEntreBusAngelEstabBusEducPosttEducSecposntInEmploymeMaleAgeSqAgeCurrEmpEGA
εβββ
βββββ
βββββ
ββββββ
βββββ
ββββββ
+++++
++++++
++++++
++++++
++++++
++++++=
0282726
2525242322
2120191817
161514131211
109876
543210
.......
(1)
8 LR=2(-15822.074 - (-15958.364) ) = 272.58 on 1 d.f. This is significant at the 5% level of chi2 distribution on 1 d.f. (3.84).
22
whereEGAij is our measure of entrepreneurial growth aspirations,
{}ijijij
ijijijijijijijij
FearFailpKnowsEntreBusAngelEstabBusEducPosttEducSecposntInEmploymeMaleAgeSqAgeCurrEmp
,,
,,,,,,,,
represent individual-level direct effects,
{}j
jjjjjjjjjj
FearFailpKnowsEntreBusAngelEstabBusEducPosttEducSecposntInEmploymeMaleAgeSqAgeCurrEmp ,,,,,,,,,,
represent individual-level country-year mean effects to control for the effect of individual-
level indicators at a country-year level, and
jjjjjjj GDPpclGDPgrowthlFDIlFreeCorrlIntelprolExecConstrlGovSizel .,.,.,.,.,.,.
represent the lagged values of the institutional variables and macroeconomic controls9
ijju ε+0
. Our
study may be subject to potential endogeneity which may arise because the mean country-year
individual entry outcome is likely to affect some of the macro variables, for instance GDP
growth rate. We address this issue by lagging our macroeconomics and institutional variables
by one year.
The combination of represents the random part of the equation, where ju0 are
the country-year level residuals and ijε are individual-level residuals.
We note in Table 2potential problems of multicollinearity; intellectual property
protection and freedom from corruption are correlated with each other and with GDP per
9We also encountered the same problem with outliers in the employment growth expectations variable as Autio and Acs (2010) and resolved it in the similar way. We eliminated 171 individual-level observations based on the definition of severe outliers as being outside the outer fence (defined by inter-quartile range multiplied by three). We checked the sensitivity of our results to eliminating outliers and found that some of our results do not hold in the presence of outliers but our approach is justified by the fact that expectations become very imprecise for largest numbers and are beyond a plausible range.
23
capita. Therefore, after running the baseline model as specified by equation 1 above (and
reported as (1) in Table 4 below), we run two additional models, without intellectual property
rights and freedom from corruption respectively (models (2) and (3) in Table 4). To assess the
impact of collinearity with GDP pc, we run two further models (models (4) and (5) in Table
4), using alternative controls for the level of development; a set of GDP pc dummies denoting
the five quintiles of its distribution10
We must also consider the bias related to potential interdependence between the choice
of whether to become an entrepreneur and growth aspirations. In order to tackle this, we need
to test for selection bias by introducing into the employment growth aspirations (second
stage) equation the inverse Mill’s ratio calculated the equation i the choice to become an
entrepreneurship (first stage or selection equation). To identify the first stage of the Heckman
selection model(Wooldridge 2002), we must find a variable that is correlated with the first
stage dependent variable (entrepreneurial entry)and uncorrelated with the second.(growth
aspirations). For robustness, we utilised two alternative identification strategies.In the first,we
use a series on start-up entry regulation procedures from the World Bank’s Doing Business
indicators. Theory suggests thatentrepreneurial entrywill be closely related to start-up entry
regulation procedures (see e.gDjankovet al 2002) but because they constitute sunk costs, they
should not be relevant for employment growth expectations.of new firms. Our alternative
identification strategy focuses on informal finance. This is a major influence on
entrepreneurial entry (Bygrave 2003) but is likely to play a less important role in large scale
projectswhere formal sources of funds will be needed. We therefore introduce the prevalence
.
{Tables 2 and 3}
10Similarly, as can be seen in Table 3, two of our mean country-year individual variables, namely ‘knows other entrepreneurs’ and ‘owner-manager of established business’ are highly correlated with ‘business angel in past three years’ variable. We checked sensitivity of our results by dropping the ‘business angel in past three years’ variable aggregated by country-year mean. As a result of this robustness check the significance of social capital proxied by ‘knows other entrepreneurs’ aggregated by country-year mean was marginally driven down to 10% level of significance in specifications 2-4 (Table 4) whereas it turned out to be insignificant in specification (1).
24
rate of informal investors into the selection equation11
Our empirical results are reported in Table 4. The regressions are highly significant, as
are all the reported test statistics. Moreover, the regressions conform to our expectations in the
sense that the control variables are frequently significant and have the predicted sign. We also
confirm most of our hypotheses. Commencing with hypothesis 1, we find the coefficient on
freedom from corruption to be highly significant and with the expected sign in all three
specifications where it is included. Thus as predicted we find that entrepreneurs in institutional
environments which are more corrupt have lower employment aspirations. We also find very
strong evidence in support of hypothesis 2a. Our variable, constraints on executive, that we
use to measure the strength of property rights is entered into all five specifications and is
always highly significant. The strength of property rights is therefore found to enhance
employment aspirations of entrepreneurs. The results concerning hypothesis 2b are however
not consistent with our predictions. We fail to identify a significant impact of the strength of
intellectual property rights on the employment growth aspirations of entrepreneurs in any of
the three specifications. Finally, we find strong support for hypothesis 3 in all five
. We calculated two inverse Mill’s
ratios, based on each of the above selection equations respectively and included them as a
control in the second stage equation. However neither werestatistically significant. We
conclude that there is no selection bias arising from the possibility that the factors determining
the decision to become an entrepreneur might differ from those determining a new firm’s
employment growth expectations. Accordingly, we focus attention henceforth solely on the
employment growth aspirations models.
4. EMPIRICAL RESULTS
11These are derived from GEM data by taking the average percentage of respondents who invested in another start-up in the past three years in each country-year sub-sample.
25
specifications; the coefficient on the (inverse) size of the government is positive and
significant in all the equations.
{Table 4}
Turning to the control variables, the patterns largely conform to findings elsewhere in
the literature. As in Bowen and De Clercq (2008), foreign entry has some fragmentary positive
effects on entrepreneurs’ employment growth expectations though these results are sensitive to
controlling for corruption. Lower levels of corruption are probably associated with better
protection of foreign investors and a more competitive business environment in which the
power of incumbents is weakened to the benefit of entrepreneurs.
The relationship between age and new firms’ employment growth plans are negative;
older individuals have lower aspirations. However, the country-year means of age reveal a
non-linear relationship with employment growth aspirations falling until entrepreneurs reach
middle age, and rising thereafter. Higher education and being a male are positively associated
with growth aspirations, as is previous experience as a business angel. However, being in
employment has no impact on employment growth aspirations and education has no effect at
country-year aggregate level, suggesting that while individual effect of education is strong, the
broader environmental effects are less clear cut. Being the owner of an existing business has a
negative and highly significant impact on expectations of entrepreneurs to increase
employment which may be associated with higher risk of reallocating entrepreneurial effort
away from existing venture. The impact of network capital is significant and positive across all
specifications. However, its country-year mean effect is sensitive to multicollinearity. We
also find that greater risk aversion is likely to discourage planned employment growth. The
current level of employment, although with the expected negative sign, is insignificant,
though the subsample average has a significant negative effect, suggesting again the impact of
competition. Per capita GDP is negatively related to high growth projects, though this finding
is not consistent across all specifications. When GDP per capita is replaced with a set of
26
quintile dummies, countries which fall within the lowest 20th percentile of GDP per capita are
found to be more employment growth-oriented, which is consistent with the view that there is
a wider set of opportunities in developing economies.
5. DISCUSSION AND CONCLUSIONS
Our theoretical contribution in this paper has been to explore how the key institutions
argued by the literature to influence the prevalence of entrepreneurship across countries may
also affect their employment growth aspirations. We base our work on the ideas of Baumol
(1990, 1993) and Williamson (2000) as well as the developments by Aidis et al. (2010). We
hypothesised that employment growth aspirations will be reduced in institutional environment
in which corruption is more pervasive; property rights, including intellectual property rights,
are less clearly defined and enforced; and in which the state plays a greater role in economic
activity.
We tested our hypotheses on a large cross-country grouped individual dataset. This
allowed us to advance the empirical definition of employment growth aspirations by using
expected increases from current levels of employment over a five year horizon. The dataset
was structured hierarchically with individuals representing level 1 and country-year samples
level 2, so we chose to employ multilevel modelling methods in our empirical work. We also
verified that the employment growth aspirations of entrepreneurs can be estimated separately
from the choice to become an entrepreneur by using the Heckman model.
We tested a variety of specifications to address issues of multicollinearity, and our results
were found to be largely robust to these alternatives. We confirmed the first hypothesis and the
more general version of the second hypothesis (2a), concerning the effects of corruption and of
property rights correspondingly. We interpret our results as follows. For low-growth aspiration
ventures or plans to become self-employed, new entrepreneurs can rely on informal
27
institutions and localised trust to build self-efficacy necessary for successful entry. However,
higher growth aspiration projects require more reliance on formal, impersonal institutions and
the stability they may offer. Hence, weak property rights become a binding constraint for
entrepreneurial development to higher aspiration prospects. Weak protection of property rights
affect negatively the motivation of entrepreneurs to expand their businesses: they start new
ventures, but restrict themselves to small, subsistence scale projects. However, it is perhaps
surprising that we are unable to confirm the impact of strong intellectual property rights on
employment growth aspirations. One possible explanation is that even for highly innovative
entrepreneurs who plan to create large scale organisations on the basis of their inventions, the
overall strength of the property rights system is the key, rather than any single aspect such as
intellectual property rights. In addition, intellectual property protection perhaps relates more to
security against private expropriation, which may be counterbalanced to some extent by
private governance arrangements. In contrast, the risk from arbitrary government is more
difficult to limit.
We also confirm the third hypothesis about the role of the state. Our empirical work
confirms that the scale of the state’s activities affects entrepreneurial growth aspirations
negatively. The state may play many important roles in society, but there is a cost in terms of
entrepreneurial job creation. Interestingly, we find (Table 2) that property rights protection is
not closely correlated with the size of the government. This implies that the connection
between the size of the state and weak rule of law as postulated by Hayek (2006 [1960])
isproblematic. However, the most important part of Hayek’s legacy relates to the link between
the constitutional order, political institutional order and economic outcomes. What we have
demonstrated is that the rule of law is especially important for high-growth aspiration
entrepreneurs. However, property rights need to be disentangled from the issues related to the
size of the state and the impact of the two needs to be considered separately. In this respect,
our results are consistent with other research. In particular Acemoglu and Johnson (2005)
28
argue strongly that political institutions imposing effective constraints on arbitrary action by
the government are at the core of property rights protection.
There are some important limitations to our study which one might wish to address in
subsequent research. While GEM provides the largest cross-country dataset available on
entrepreneurial activity, the number of countries and especially less developed countries is
restricted. Moreover, the time horizon of the dataset is still quite short, probably not long
enough for testing significant institutional development within any one country over time.
Hence, our hypotheses relate primarily to the impact of variation in institutions, and this
variation is primarily cross-sectional. To some extent this problem will be addressed by
undertaking a similar analysis to that presented in this paper when the number of countries and
years has expanded, especially once GEM includes more low and middle income countries. A
further limitation is that we have not fully exploited the cross-country individual characteristic
of the dataset. This is because we sought to focus on how institutions impact differentially on
entrepreneurial aspirations. Future work should also consider the interaction between
institutions and individual characteristics, for example the fear of failure or the human capital
of entrepreneurs.
Our paper has important implications for would-be entrepreneurs. We have confirmed
the importance of education, personal networks and youth for entrepreneurs who plan fast
employment growth. We have also highlighted the problems caused for these aspirations by
corruption. Individuals aspiring to create larger firms in institutional context where corruption
is rife need to place developing strategies to address corruption at the top of their agendas. If
they have the option to move their businesses to environments where corruption is less
endemic, those options should be exercised. Similarly the critical role of property rights and
the rule of law in setting the contexts for successful entrepreneurship must be emphasized. It
may be that if entrepreneurs are forced to operate in contexts where property rights are weak
they should lower their aspirations in terms of the growth of the enterprise. It is in such
29
institutional context that we find that those entrepreneurs who failed in their entry are
particularly less like to try again (Aidis et al, 2008a), therefore a choice of right entry strategy
becomes essential.
Our findings also have important implications for policy makers. Considerable evidence
has been amassed which link innovation, employment, growth and economic development to
high-aspiration entrepreneurship (Davidsson and Henrekson 2002). Our paper provides
evidence that entrepreneurship in general can flourish in many contexts, perhaps in part
because formal institutions such as property rights can be replaced to a greater or lesser extent
by informal ones like social networks. However, this sanguine view does not apply for high-
growth aspiration entrepreneurship. This is significantly reduced in an environment where
corruption is high or property rights are poor. We have stressed that formal institutions can be
improved much more rapidly than informal ones, but significant and sustainable progress in
the former almost certainly requires as a pre-requisite progress in the latter, consistent with the
theory framework we adopted. Hence policy-makers in environments where corruption is
widespread or property rights are weak need to think deeply about education and other factors
affecting culture and informal institutions as well, to strengthen them if they wish to encourage
high employment growth entrepreneurship.
30
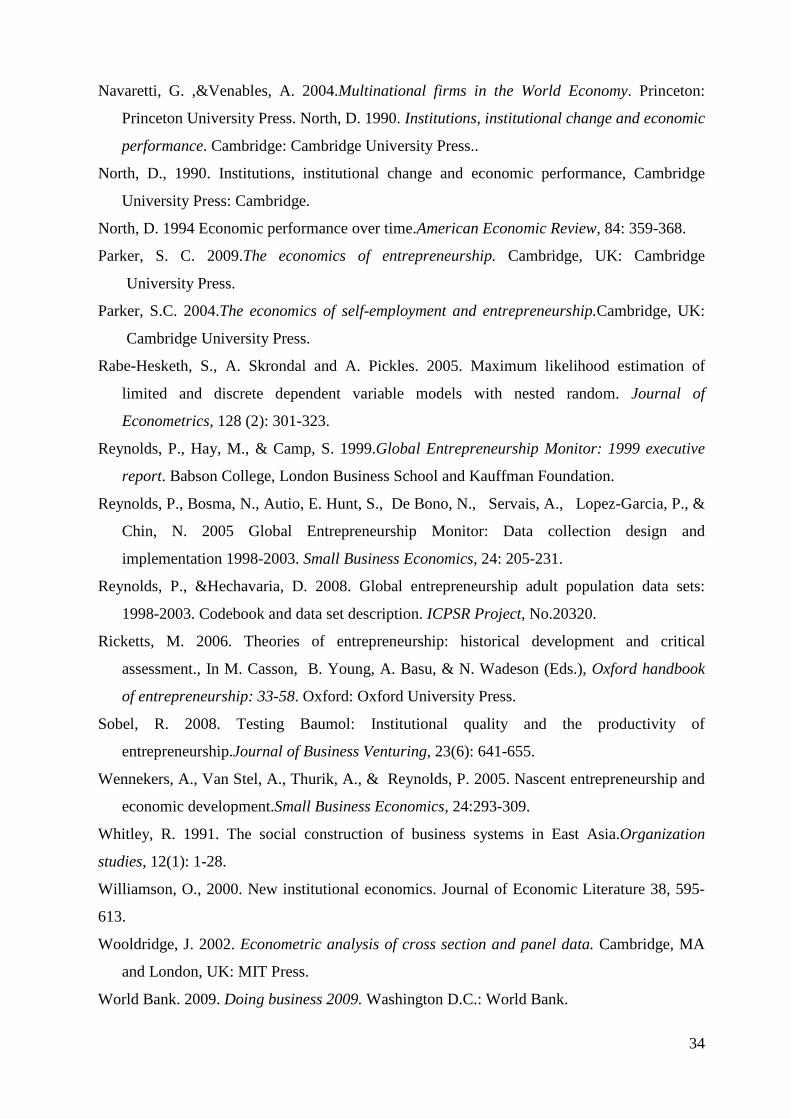
REFERENCES
Acemoglu, D.,& Johnson, S. 2005. Unbundling institutions.Journal of Political Economy,
113: 943-995.
Acs, Z. and D. Audretsch. 1990. Innovation and small firms. Cambridge. MA: MIT Press.
Aidis, R., & Mickiewicz, T. 2006. Entrepreneurs, expectations and business expansion:
lessons from Lithuania. Europe-Asia Studies, 58(6): 855-880.
Aidis, R., Estrin, S., & Mickiewicz, T. 2008a. Institutions and entrepreneurship development
in Russia: a comparative perspective. Journal of Business Venturing, 23: 656-672.
Aidis, R., Korosteleva, J., & Mickiewicz, T. 2008b. Entrepreneurship in Russia.In L. Dana,
Welpe, I., Ratten, V., & Han, M. (Eds.), Entrepreneurship and internationalisation of
SMEs in Asia: 265-274.Cheltenham: Edward Elgar.
Aidis, R., S. Estrin and T. Mickiewicz. 2010. Size matters: entrepreneurial entry and
government, Small Business Economics, DOI: 10.1007/s11187-010-9299-y.
Aldrich, H., Rosen, B., & Woodward, W. 1987.The impact of social networks on business
funding and profit. Frontiers of entrepreneurship research .Wellesley, MA: Babson
College.
Anokhin, S. & Schulze, W. 2009.Entrepreneurship, innovation and corruption.Journal of
Business Venturing, 24(5): 465-476.
Ardagna, S., &Lusardi, A. 2008. Explaining international differences in entrepreneurship: the
role of individual characteristics and regulatory constraints .NBER Working Paper, No.
14012.
Arenius, P., &Minniti, M. 2005. Perceptual variables and nascent entrepreneurship. Small
Business Economics 24: 233–247.
Audretsch, D., &Thurik, R. 2004. A model of the entrepreneurial economy.International
Journal of Entrepreneurship Education, 2(2): 143-66.
Autio, E. and Acs, Z. (2010) “Intellectual property protection and the formation of
entrepreneurial growth aspirations”, Strategic Entrepreneurship Journal, 4(3): 234–251.
Autio, E. 2007.Global Entrepreneurship Monitor: 2007 Global report on high-growth
entrepreneurship. London Business School, Babson College: London, U.K., and Babson
Park, MA.
Autio, E. 2005.Global Entrepreneurship Monitor: 2005 Report on high-expectation
entrepreneurship. London Business School and Babson College: London, U.K., and
Babson Park, MA.
31
Batjargal, B. 2003. Social capital and entrepreneurial performance in Russia: a longitudinal
study. Organisation Studies, 24: 535-556.
Baumol, W. 1990. Entrepreneurship: productive, unproductive, and destructive. Journal of
Political Economy, 98 (5, Part I), October: 893-921.
Baumol, W J. 1993. Formal entrepreneurship theory in economics: existence and bounds.
Journal of Business Venturing8 (3): 197-210.
Baumol, W J. 2005. Education for innovation; entrepreneurial breakthroughs versus corporate
incremental improvements. In Adam B. Jaffe, Josh Lerner, Scott Stern (Eds.), Innovation
policy and the economy: 33-56.Cambridge MA: NBER and MIT Press.
Beach, W., & Kane, T. 2008. Methodology: measuring the 10 economic freedoms. In K.
Holmes, Feulner, E., & O’Grady, M. (Eds.), 2008 Index of Economic Freedom: 39-55.
The Heritage Foundation: Washington.
Bowen, H.P., & De Clercq, D. 2008. Institutional context and allocation of entrepreneurial
effort.Journal of International Business Studies, 39 (4): 747-767.
Busenitz, L.W. Gomez, C., and Spencer, J.W. 2000. Country institutional profiles: Unlocking
entrepreneurial phenomena. Academy of Management Journal, 43: 994-1003.
Bygrave, W. 2003.Financing entrepreneurs and their ventures.In Reynolds, P., Bygrave, W.,
&Autio, E (Eds.), Global Entrepreneurship Monitor 2003 Global report. Kansas City:
Kauffman Center for Entrepreneurial Leadership at the Ewing Mario Kauffman
Foundation.
Carroll, R., Holtz-Eakin, D., Rider, M., Rosen, H. 2000.Income Taxes and Entrepreneurs’ Use
of Labour.Journal of Labor Economics, 18: 324-351.
Choi, J.P., &Thum, M. 2005. Corruption and the shadow economy.International Economic
Review, 46(3):817-36.
Cohen, W., &Levinthal, D. 1989. Innovation and learning: the two faces of R&D. Economic
Journal, 99: 569-96.
Cramer, J.S., Hartog, J., Jonker, N., & Van Praag, C.M. (2002.Low risk aversion encourages
the choice for entrepreneurship: an empirical test of a truism. Journal of Economic
Behavior and Organization, 48 (1): 29-36.
Damijan, J.P, Knell, M., Majcen, B., &Rojec, M. 2003. The role of FDI, R&D accumulation
and trade in transferring technology to transition countries: evidence from firm panel data
for eight transition countries. Economic Systems, 27: 189-204.
32
Davidsson, P., &Henrekson, M. 2002. Determinants of the prevalence of start-ups and high-
growth firms.Small Business Economics,19(2): 81-104.
De Backer, K.., &Sleuwaegen, L. 2003. Does foreign direct investment crowd out domestic
entrepreneurship.Review of Industrial Organization, 22(1): 67-84.
Desai, S and Acs, Z. 2007. A theory of destructive entrepreneurship.Jena Economic Research
Papers 85.
De Soto, H. 1989. The other path: the invisible revolution in the third world. London: Harper
Collins.
De Soto, H. 2000. The mystery of capital: why capitalism triumphs in the West and fails
everywhere else. New York: Basic Books.
Djankov, S., LaPorta, R., Lopez-De-Silanes, F., &Shleifer, A. 2002. The regulation of entry,
Quarterly Journal of Economics, CXVII (1): 1-36.
Djankov, S., Qian, Y., Ronald, G., &Zhuravskaya, E. 2006. Entrepreneurship in China and
Russia compared, Journal of the European Economic Association, 4(2-3): 353-365.
Estrin, S., & Mickiewicz, T. 2011. Entrepreneurship in transition economies; the role of
institutions and generational change. In M.Minniti (Ed.), The Dynamics of
Entrepreneurship. Oxford: Oxford University Press, Chapter 8: 293-338.
Estrin, S and Prevezer, M, 2011, “The role of informal institutions on corporate governance”,
forthcoming Asia Pacific Management Journal
Evans D. And Leighton, L, 1989, “Some empirical aspects of entrepreneurship”, American
Economic Review 79,519-35
Grilo, I., &Thurik, R. 2005.Latent and actual entrepreneurship in Europe and the US: some
recent developments. International Entrepreneurship and Management Journal, 1(4): 441-
459.
Gwartney, J., Lawson, R., & Norton, S. 2008. Economic freedom of the World.2008 annual
report.Economic Freedom Network.
Harper, D. 2003.Foundations of entrepreneurship and economic development. Abingdon:
Routledge.
Hayek, F. 2006 [1960].The constitution of liberty. London: Routledge.
Henrekson, M. 2005. Entrepreneurship: a weak link in the welfare state. Industrial and
Corporate Change, (14) 3: 437-467.
Hodler, R. 2009. Industrial Policy in an imperfect world.Journal of Development Economics,
90: 85-93.
33
Javorcik, B., S. 2004. Does foreign direct investment increases the productivity of domestic
firms? In search of spillovers through backward linkages.American Economic Review,
94(3):605-627.
Johannisson, B. 2000.Networking and entrepreneurial growth. In D. Sexton & H. Lawrence
(Eds), The Blackwell handbook of entrepreneurship: 368-386. Blackwell: Oxford.
Johnson, P., McMillan, J., &Woodruff, C. 1999. Contract enforcement in transition, EBRD
Working Paper, No. 45.
Johnson, P, McMillan, J., & Woodruff, C. 2000. Entrepreneurs and the ordering of
institutional reform.Economics of Transition, 8(1): 1-36.
Johnson, S., McMillan, J., & Woodruff, C. 2002. Property rights and finance. American
Economic Review, 92(5): 1335-1356.
Kaufmann, D., &Kraay, A. 2008. Governance indicators: where are we and where should we
go? World Bank Research Observer, 23(1):1-30.
Kaufmann, D., Kraay, A., &Mastruzzi, M. 2009. Governance matters VIII. Aggregate and
individual governance indicators 1996-2008.Policy Research Working Paper, No. 4978.
Washington, DC: World Bank.
Kihlstrom, R. ,&Laffont, J-J. 1979. A General equilibrium entrepreneurial theory of firm
formation based on risk aversion. Journal of Political Economy, 87 (4): 719-748.
Marshall, M., &Jaggers, K. 2007.Polity IV Project. Centre for Systemic Peace.
McMillan, J., &Woodruff, C. 2002. The central role of entrepreneurs in transition
economies.Journal of Economic Perspectives, 16(3):153-170.
Meyer, K., &Peng, M., L. 2005. Probing theoretically into Central and Eastern Europe:
transactions, resources and institutions. Journal of International Business, 36: 600-621.
Minniti, M., Arenius, P., &Langowitz, N. 2005a.Global Entrepreneurship Monitor: 2004
Report on women and entrepreneurship. Centre for women’s leadership at Babson
College: London Business School.
Minniti, M., Bygrave, W., &Autio, E. 2005b. Global Entrepreneurship Monitor: 2005
executive report. Wellesley, MA: Babson College.
Murphy K.M. A. Shleifer, and R. W. Vishny,1993. Why is rent seeking so costly to growth?
American Economic Review, 83(2): 409-14.
Nanda, R., & Sorensen, J. 2007. Peer effects and entrepreneurship. Harvard Business School
Working Paper, No. 08-051.
34
Navaretti, G. ,&Venables, A. 2004.Multinational firms in the World Economy. Princeton:
Princeton University Press. North, D. 1990. Institutions, institutional change and economic
performance. Cambridge: Cambridge University Press..
North, D., 1990. Institutions, institutional change and economic performance, Cambridge
University Press: Cambridge.
North, D. 1994 Economic performance over time.American Economic Review, 84: 359-368.
Parker, S. C. 2009.The economics of entrepreneurship. Cambridge, UK: Cambridge
University Press.
Parker, S.C. 2004.The economics of self-employment and entrepreneurship.Cambridge, UK:
Cambridge University Press.
Rabe-Hesketh, S., A. Skrondal and A. Pickles. 2005. Maximum likelihood estimation of
limited and discrete dependent variable models with nested random. Journal of
Econometrics, 128 (2): 301-323.
Reynolds, P., Hay, M., & Camp, S. 1999.Global Entrepreneurship Monitor: 1999 executive
report. Babson College, London Business School and Kauffman Foundation.
Reynolds, P., Bosma, N., Autio, E. Hunt, S., De Bono, N., Servais, A., Lopez-Garcia, P., &
Chin, N. 2005 Global Entrepreneurship Monitor: Data collection design and
implementation 1998-2003. Small Business Economics, 24: 205-231.
Reynolds, P., &Hechavaria, D. 2008. Global entrepreneurship adult population data sets:
1998-2003. Codebook and data set description. ICPSR Project, No.20320.
Ricketts, M. 2006. Theories of entrepreneurship: historical development and critical
assessment., In M. Casson, B. Young, A. Basu, & N. Wadeson (Eds.), Oxford handbook
of entrepreneurship: 33-58. Oxford: Oxford University Press.
Sobel, R. 2008. Testing Baumol: Institutional quality and the productivity of
entrepreneurship.Journal of Business Venturing, 23(6): 641-655.
Wennekers, A., Van Stel, A., Thurik, A., & Reynolds, P. 2005. Nascent entrepreneurship and
economic development.Small Business Economics, 24:293-309.
Whitley, R. 1991. The social construction of business systems in East Asia.Organization
studies, 12(1): 1-28.
Williamson, O., 2000. New institutional economics. Journal of Economic Literature 38, 595-
613.
Wooldridge, J. 2002. Econometric analysis of cross section and panel data. Cambridge, MA
and London, UK: MIT Press.
World Bank. 2009. Doing business 2009. Washington D.C.: World Bank.
35
Table 1: Descriptive statistics and definitions of explanatory and variables
Variable Definition Mean S.D. Explanatory variables: business environment & macroeconomic variables Constraints on executive (t-1)
Polity IV ‘Executive Constraints’; scores from 1=”unlimited authority” to 7=”executive parity”; higher value denotes less arbitrariness
6.56 1.09
Intellectual property rights (t-1)
Intellectual Property Protection index (Global Competitiveness Report); scores from 1=”weak protection” to 7=”strong protection”
5.03 1.23
Freedom from corruption (t-1)
Heritage Foundation ‘Freedom from Corruption’ index, ranging from 0 to 100; higher value denotes less corruption
67.1 23.2
Government size, HF (t-1)
Heritage Foundation ‘Government size’ index, ranging from 0 to 100; higher value denotes smaller government
55.12 23.73
GDP per capita ppp (t-1) GDP per capita at purchasing power parity, constant at 2000 $USD (WB WDI 2010)
24,005 12,278
GDP growth rate (t-1) Annual GDP growth rate (WB WDI 2010) 3.40 2.56 FDI/GDP (t-1) FDI stock/GDP (UNCTAD) 37.68 27.64 Explanatory variables: personal characteristics Age The exact age of the respondent between 14 and 99 at time of
interview 39 12
Age squared Age squared - - Male 1=male, zero otherwise .61 .49 Current employment level
Current number of employees + owner-manager 70 4501
Being in employment 1=respondent is either in full or part time employment, 0 otherwise
.92 .27
Education: Secondary &Post-secondary
1=respondent has a secondary or post-secondary education , 0 otherwise
.44 .50
Education: Post-secondary
1=respondent has a post-secondary education .19 .39
Owner-manager of existing business
1=current owner/manager of business, 0 otherwise .04 .18
Bus angel in last 3 years 1=business angel in past three years, 0 otherwise .09 .29 No fear of failure 1=respondent believes that the fear of failure would not prevent
him/her from starting a business .77 .42
Knows other entrepreneurs
1=personally knows entrepreneurs in past two years, zero otherwise
.63 .48
Dependent variable: New firm’s expectations of employment growth, EGA
Percentage change in the expected level of employment in 5- yrs’ time over the current level of employment by new firms
.45 .68
Source: GEM 2001-2006 unless specified otherwise; the reported statistics are based on the set of observations actually used in estimations (13,205) to eliminate the joint effect of missingess in all variables.
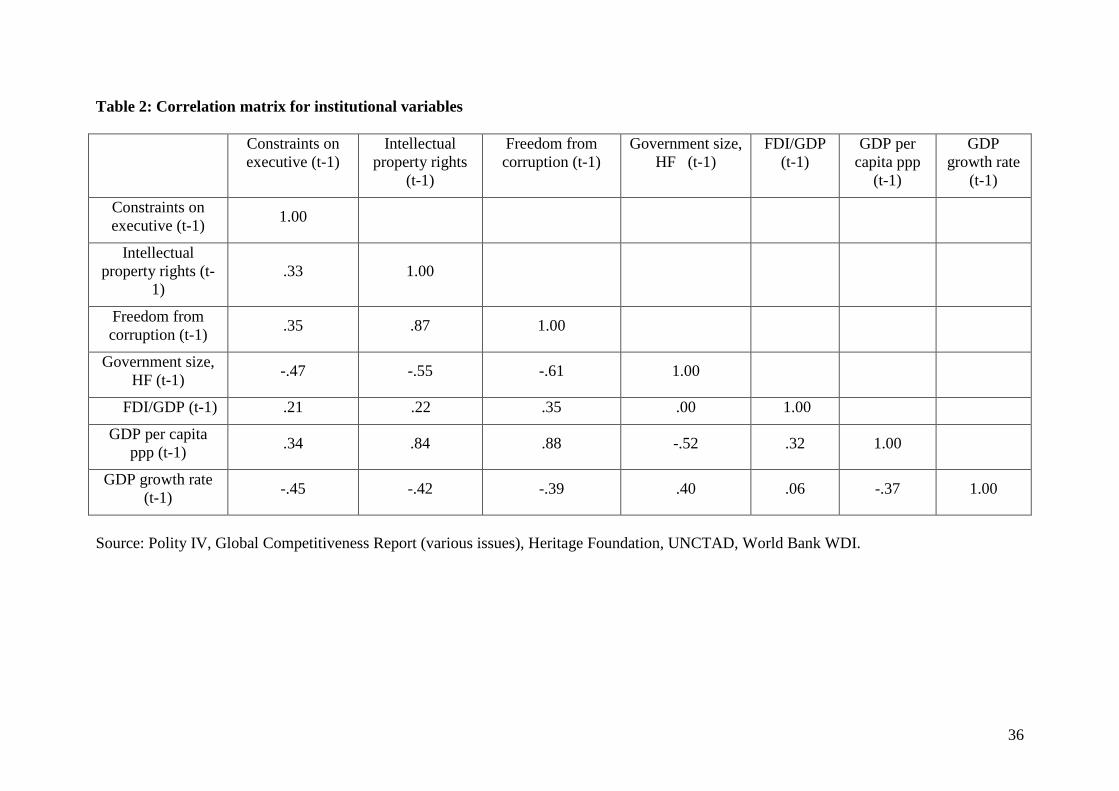
36
Table 2: Correlation matrix for institutional variables
Constraints on executive (t-1)
Intellectual property rights
(t-1)
Freedom from corruption (t-1)
Government size, HF (t-1)
FDI/GDP (t-1)
GDP per capita ppp
(t-1)
GDP growth rate
(t-1)
Constraints on executive (t-1) 1.00
Intellectual property rights (t-
1) .33 1.00
Freedom from corruption (t-1) .35 .87 1.00
Government size, HF (t-1) -.47 -.55 -.61 1.00
FDI/GDP (t-1) .21 .22 .35 .00 1.00
GDP per capita ppp (t-1) .34 .84 .88 -.52 .32 1.00
GDP growth rate (t-1) -.45 -.42 -.39 .40 .06 -.37 1.00
Source: Polity IV, Global Competitiveness Report (various issues), Heritage Foundation, UNCTAD, World Bank WDI.
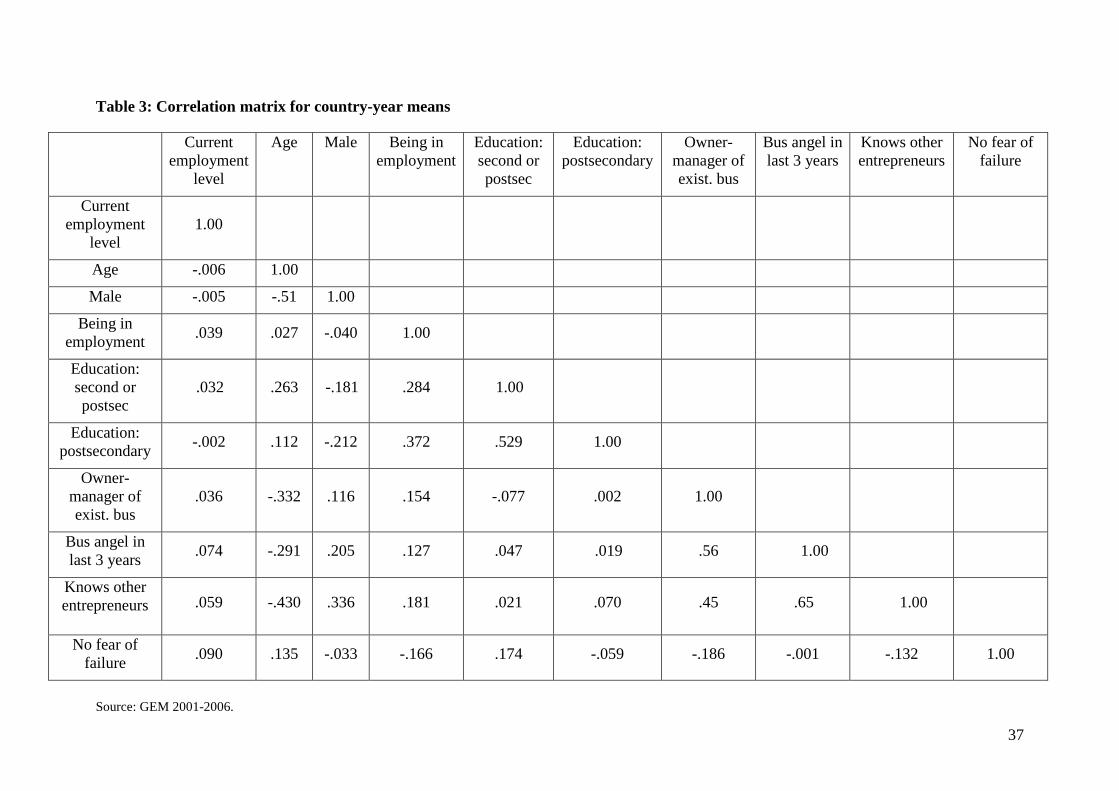
37
Table 3: Correlation matrix for country-year means
Current employment
level
Age Male Being in employment
Education: second or postsec
Education: postsecondary
Owner-manager of exist. bus
Bus angel in last 3 years
Knows other entrepreneurs
No fear of failure
Current employment
level 1.00
Age -.006 1.00
Male -.005 -.51 1.00
Being in employment .039 .027 -.040 1.00
Education: second or postsec
.032 .263 -.181 .284 1.00
Education: postsecondary -.002 .112 -.212 .372 .529 1.00
Owner-manager of exist. bus
.036 -.332 .116 .154 -.077 .002 1.00
Bus angel in last 3 years .074 -.291 .205 .127 .047 .019 .56 1.00
Knows other entrepreneurs .059 -.430 .336 .181 .021 .070 .45 .65 1.00
No fear of failure .090 .135 -.033 -.166 .174 -.059 -.186 -.001 -.132 1.00
Source: GEM 2001-2006.
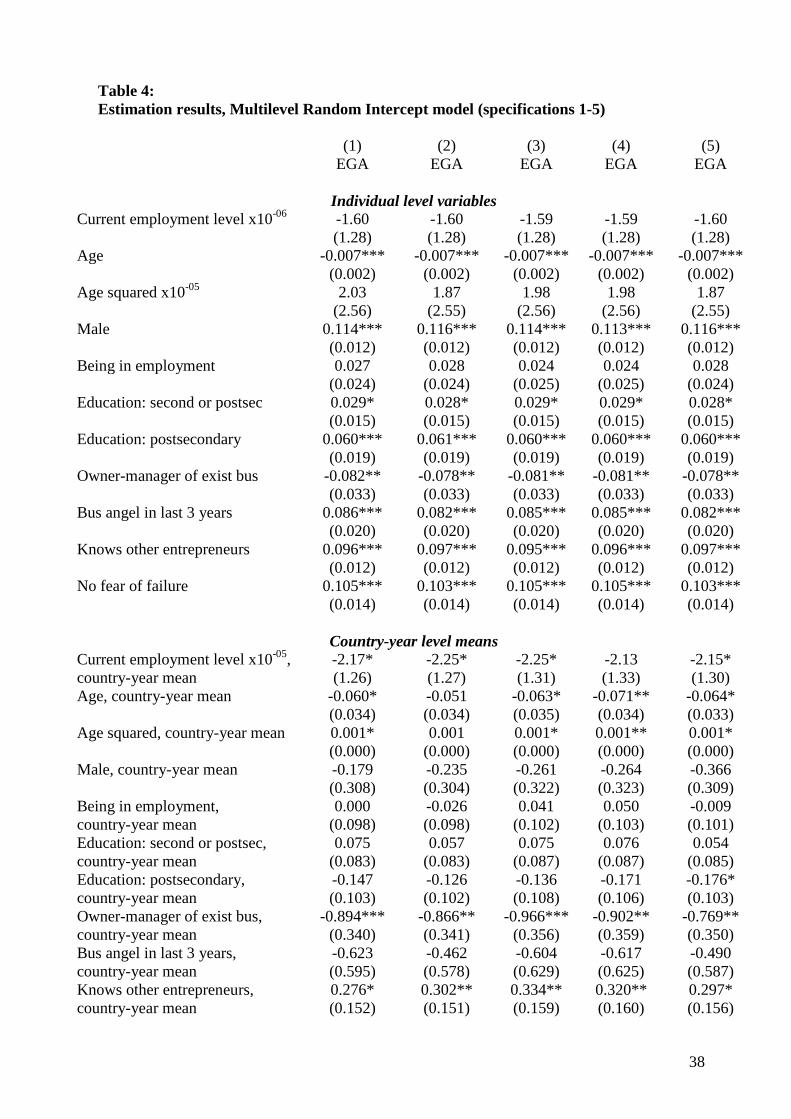
38
Table 4: Estimation results, Multilevel Random Intercept model (specifications 1-5)
(1) (2) (3) (4) (5) EGA EGA EGA EGA EGA
Individual level variables Current employment level x10-06 -1.60 -1.60 -1.59 -1.59 -1.60 (1.28) (1.28) (1.28) (1.28) (1.28) Age -0.007*** -0.007*** -0.007*** -0.007*** -0.007*** (0.002) (0.002) (0.002) (0.002) (0.002) Age squared x10-05 2.03 1.87 1.98 1.98 1.87 (2.56) (2.55) (2.56) (2.56) (2.55) Male 0.114*** 0.116*** 0.114*** 0.113*** 0.116*** (0.012) (0.012) (0.012) (0.012) (0.012) Being in employment 0.027 0.028 0.024 0.024 0.028 (0.024) (0.024) (0.025) (0.025) (0.024) Education: second or postsec 0.029* 0.028* 0.029* 0.029* 0.028* (0.015) (0.015) (0.015) (0.015) (0.015) Education: postsecondary 0.060*** 0.061*** 0.060*** 0.060*** 0.060*** (0.019) (0.019) (0.019) (0.019) (0.019) Owner-manager of exist bus -0.082** -0.078** -0.081** -0.081** -0.078** (0.033) (0.033) (0.033) (0.033) (0.033) Bus angel in last 3 years 0.086*** 0.082*** 0.085*** 0.085*** 0.082*** (0.020) (0.020) (0.020) (0.020) (0.020) Knows other entrepreneurs 0.096*** 0.097*** 0.095*** 0.096*** 0.097*** (0.012) (0.012) (0.012) (0.012) (0.012) No fear of failure 0.105*** 0.103*** 0.105*** 0.105*** 0.103*** (0.014) (0.014) (0.014) (0.014) (0.014)
Country-year level means Current employment level x10-05, -2.17* -2.25* -2.25* -2.13 -2.15* country-year mean (1.26) (1.27) (1.31) (1.33) (1.30) Age, country-year mean -0.060* -0.051 -0.063* -0.071** -0.064* (0.034) (0.034) (0.035) (0.034) (0.033) Age squared, country-year mean 0.001* 0.001 0.001* 0.001** 0.001* (0.000) (0.000) (0.000) (0.000) (0.000) Male, country-year mean -0.179 -0.235 -0.261 -0.264 -0.366 (0.308) (0.304) (0.322) (0.323) (0.309) Being in employment, 0.000 -0.026 0.041 0.050 -0.009 country-year mean (0.098) (0.098) (0.102) (0.103) (0.101) Education: second or postsec, 0.075 0.057 0.075 0.076 0.054 country-year mean (0.083) (0.083) (0.087) (0.087) (0.085) Education: postsecondary, -0.147 -0.126 -0.136 -0.171 -0.176* country-year mean (0.103) (0.102) (0.108) (0.106) (0.103) Owner-manager of exist bus, -0.894*** -0.866** -0.966*** -0.902** -0.769** country-year mean (0.340) (0.341) (0.356) (0.359) (0.350) Bus angel in last 3 years, -0.623 -0.462 -0.604 -0.617 -0.490 country-year mean (0.595) (0.578) (0.629) (0.625) (0.587) Knows other entrepreneurs, 0.276* 0.302** 0.334** 0.320** 0.297* country-year mean (0.152) (0.151) (0.159) (0.160) (0.156)
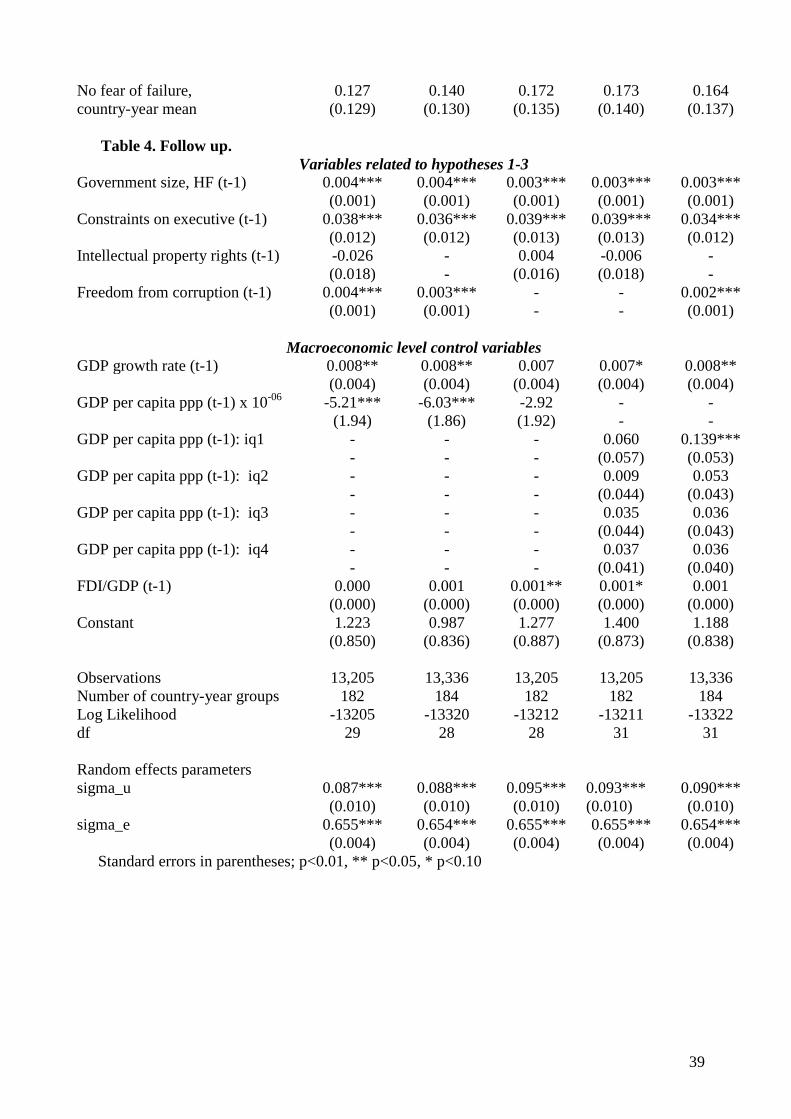
39
No fear of failure, 0.127 0.140 0.172 0.173 0.164 country-year mean (0.129) (0.130) (0.135) (0.140) (0.137)
Table 4. Follow up.
Variables related to hypotheses 1-3 Government size, HF (t-1) 0.004*** 0.004*** 0.003*** 0.003*** 0.003*** (0.001) (0.001) (0.001) (0.001) (0.001) Constraints on executive (t-1) 0.038*** 0.036*** 0.039*** 0.039*** 0.034*** (0.012) (0.012) (0.013) (0.013) (0.012) Intellectual property rights (t-1) -0.026 - 0.004 -0.006 - (0.018) - (0.016) (0.018) - Freedom from corruption (t-1) 0.004*** 0.003*** - - 0.002*** (0.001) (0.001) - - (0.001)
Macroeconomic level control variables GDP growth rate (t-1) 0.008** 0.008** 0.007 0.007* 0.008** (0.004) (0.004) (0.004) (0.004) (0.004) GDP per capita ppp (t-1) x 10-06 -5.21*** -6.03*** -2.92 - - (1.94) (1.86) (1.92) - - GDP per capita ppp (t-1): iq1 - - - 0.060 0.139*** - - - (0.057) (0.053) GDP per capita ppp (t-1): iq2 - - - 0.009 0.053 - - - (0.044) (0.043) GDP per capita ppp (t-1): iq3 - - - 0.035 0.036 - - - (0.044) (0.043) GDP per capita ppp (t-1): iq4 - - - 0.037 0.036 - - - (0.041) (0.040) FDI/GDP (t-1) 0.000 0.001 0.001** 0.001* 0.001 (0.000) (0.000) (0.000) (0.000) (0.000) Constant 1.223 0.987 1.277 1.400 1.188 (0.850) (0.836) (0.887) (0.873) (0.838) Observations 13,205 13,336 13,205 13,205 13,336 Number of country-year groups 182 184 182 182 184 Log Likelihood -13205 -13320 -13212 -13211 -13322 df 29 28 28 31 31 Random effects parameters sigma_u 0.087*** 0.088*** 0.095*** 0.093*** 0.090*** (0.010) (0.010) (0.010) (0.010) (0.010) sigma_e 0.655*** 0.654*** 0.655*** 0.655*** 0.654*** (0.004) (0.004) (0.004) (0.004) (0.004)
Standard errors in parentheses; p<0.01, ** p<0.05, * p<0.10
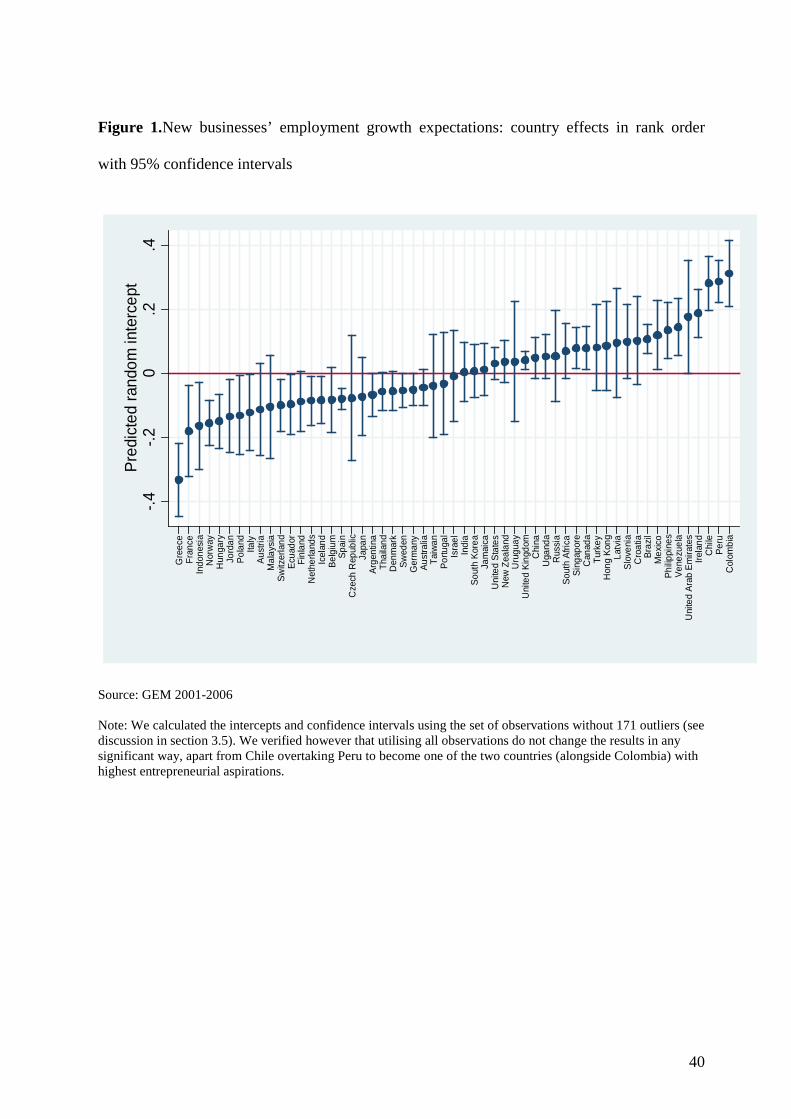
40
Figure 1.New businesses’ employment growth expectations: country effects in rank order
with 95% confidence intervals
Source: GEM 2001-2006 Note: We calculated the intercepts and confidence intervals using the set of observations without 171 outliers (see discussion in section 3.5). We verified however that utilising all observations do not change the results in any significant way, apart from Chile overtaking Peru to become one of the two countries (alongside Colombia) with highest entrepreneurial aspirations.
-.4-.2
0.2
.4Pr
edic
ted
rand
om in
terc
ept
Gre
ece
Fran
ceIn
done
sia
Nor
way
Hun
gary
Jord
anPo
land
Italy
Aust
riaM
alay
sia
Switz
erla
ndEc
uado
rFi
nlan
dN
ethe
rland
sIc
elan
dBe
lgiu
mSp
ain
Cze
ch R
epub
licJa
pan
Arge
ntin
aTh
aila
ndD
enm
ark
Swed
enG
erm
any
Aust
ralia
Taiw
anPo
rtuga
lIs
rael
Indi
aSo
uth
Kore
aJa
mai
caU
nite
d St
ates
New
Zea
land
Uru
guay
Uni
ted
King
dom
Chi
naU
gand
aR
ussi
aSo
uth
Afric
aSi
ngap
ore
Can
ada
Turk
eyH
ong
Kong
Latv
iaSl
oven
iaC
roat
iaBr
azil
Mex
ico
Philip
pine
sVe
nezu
ela
Uni
ted
Arab
Em
irate
sIre
land
Chi
lePe
ruC
olom
bia