Embed Size (px)
Citation preview

Last year, we called for a new set of financial performance measures—to reflect more accurately how financial services companieslike ours create value for customers and stockholders.We believe this new set of measures is more suited to the faster growing,dynamic, diversified, knowledge-based financial services industry than to the stagnant, old banking segment.The more preciselythat service companies can measure the value they create, the more accurately the marketplace can measure the value of their stock. Our proposal prompted such significant interest and discussion that we’ve expanded on it in our report to you this year.
Which measures really matter?Wells Fargo & Company Annual Report 2004
1 To Our OwnersOur total compound annual stock-holder return the past 20 years: 23%.CEO Dick Kovacevich explains how we did it.
6 Our 10 Strategic InitiativesA progress report on the initiativesthat help us achieve double-digitrevenue and earnings growth.
11 Which Measures Really Matter?We measure success differently thanour competitors. We believe thesemeasures matter most.
25 Helping Our Communities Prosperand GrowAre we making measurable progress?
31 Board of Directors, Senior Management
33 Financial Review
60 Controls and Procedures
62 Financial Statements
112 Report of Independent Registered Public Accounting Firm
116 Stockholder Information
Wells Fargo & Company (NYSE: WFC)
is a diversified financial services company
providing banking, insurance, investments,
mortgage loans and consumer finance. Our
corporate headquarters is in San Francisco,
but we’re decentralized so all Wells Fargo
“convenience points”—including stores,
regional commercial banking centers,
ATMs, Wells Fargo Phone BankSM centers,
internet—are headquarters for satisfying
all our customers’ financial needs and
helping them succeed financially.
“Aaa” Wells Fargo Bank, N.A. is the only
U.S. bank to receive the highest possible
credit rating from Moody’s Investors Service.
Assets: $428 billion
Rank in size among U.S. peers: 5th
Market value of stock: $105 billion
Rank by market cap among U.S. peers: 4th
Team members: 150,000 (one of U.S.’s
40 largest private employers)
Customers: 23 million
Stores: 6,046
Fortune 500 rank (profit): 17
FORWARD-LOOKING STATEMENTS In this report we make forward-looking statements about our company’s financial condition, results of operations, plans, objectives and future performance and business. When we use the words “believe,” “expect,” “anticipate,” “estimate,” “may,” “can”, “will” or similar expressions, we are making forward-looking statements.These forward-looking statements involve inherent risks and uncertainties. A number of factors — many beyond our control — could cause actual results to differ from those in our forward-looking statements. These factors include • changes in political, business and economic conditions, including changes in interest rates • competition, including competition from insurance companies and securities firms • fiscal and monetary policies • customers choosing not to use banks for transactions • legislation and regulation • future mergers and acquisitions • the integration of merged and acquired companies • critical accounting policies. We discuss in more detail on pages 55–59 these factors and other factors that could cause actual results to differ from those in our forward-looking statements. Other factors are described under “Regulation and Supervision” in our 2004 Annual Report on Form 10-K.© 2005 Wells Fargo & Company. All rights reserved.
#1, #2 or #3 in deposit market share in 17 of our 23 banking states; #2 nationally (6/30/04)
#1 retail mortgage originator,#2 mortgage servicer*,
#1 in mortgages to low-to-moderate income home buyers
#1 home equity lender,
#1 (and first) internet bank,
#1 small business lender,
#1 insurance broker owned by bank-holding company (world’s 5th largest insurance brokerage)
*Inside Mortgage Finance
#1 agricultural lender (banks)
#1 financial services provider to middle-market businesses in our territory,
#2 debit card issuer,
#3 bank auto lender,
#4 ATM network,
One of USA’s leading commercial real estate lenders among banks,
One of North America’s premier consumer finance companies.
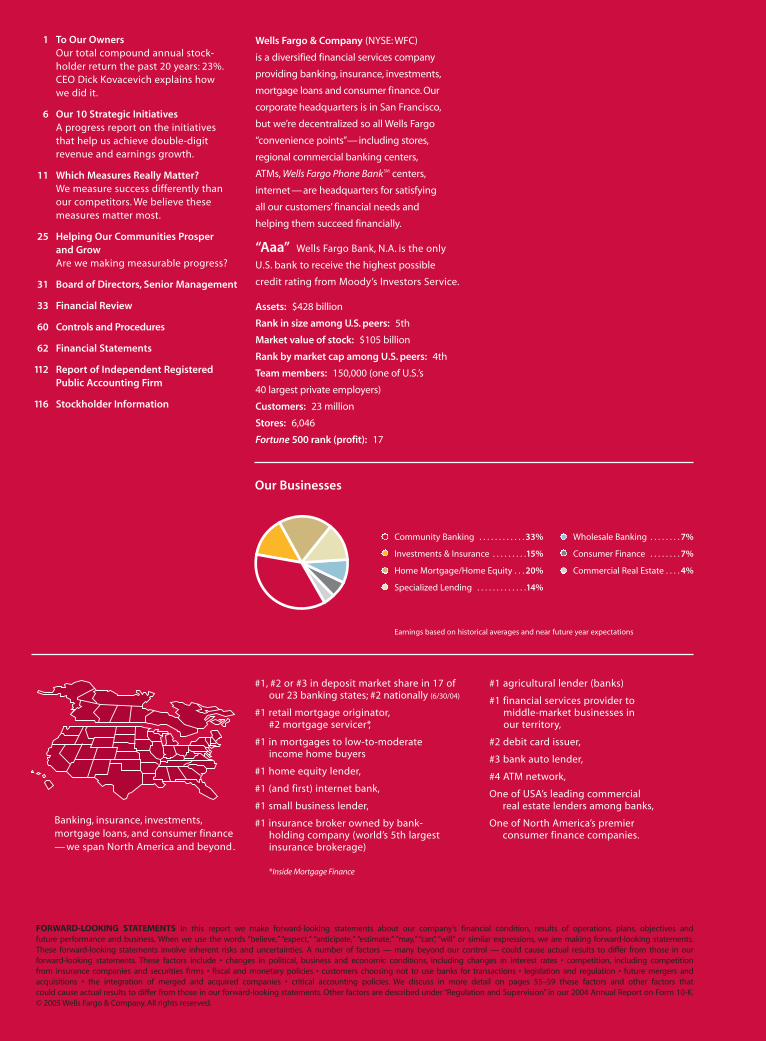
Our Businesses
Earnings based on historical averages and near future year expectations
Banking, insurance, investments,mortgage loans, and consumer finance— we span North America and beyond.
Community Banking . . . . . . . . . . . . 33%
Investments & Insurance . . . . . . . . .15%
Home Mortgage/Home Equity . . . 20%
Specialized Lending . . . . . . . . . . . . .14%
Wholesale Banking . . . . . . . . 7%
Consumer Finance . . . . . . . . 7%
Commercial Real Estate . . . . 4%

To Our Owners,Another exceptional year by a trulyexceptional team!
Once again, our team’s performancecontinues to be among the very best,not just in financial services but in any industry:
- Solid market share growth across our more than 80 businesses,
- Double-digit earnings per share growth,
- Double-digit loan growth,
- Double-digit growth in retail core deposits,
- Record sales of more than one million core banking products every month,
- Improved productivity,
- Strong credit quality.
All in all, significant progress towardachieving our vision of satisfying all ourcustomers’ financial needs and helpingthem succeed financially.
Dick KovacevichChairman and CEO San Francisco, CaliforniaTeam member since: 1986
22
mong our 2004achievements:
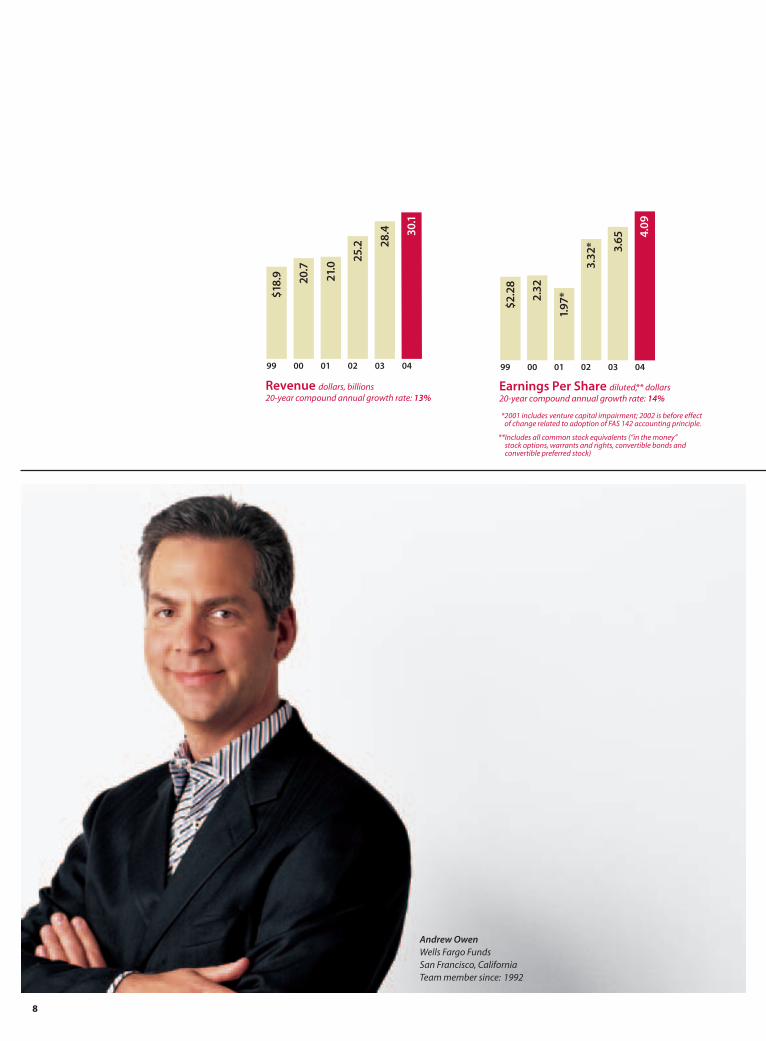
• Diluted earnings per share — a record$4.09, up 12 percent.
• Net income — a record $7.0 billion, up 13 percent.
• Return on equity — 19.6 percent; returnon assets 1.71 percent.
• Revenue growth of six percent — thesingle-most important measure of successin our industry — up 11 percent excluding Wells Fargo Home Mortgage (which hadexceptional revenue in 2003 due to therefinance boom).
• Every month, through needs-based selling,we sold more than one million retailbanking products, a company record.
• Cross-sell reached a record high of4.6 products per consumer household (up from about three at the time of theNorwest-Wells Fargo merger six yearsago) and 5.3 products per WholesaleBanking customer.
• Consumer households with eight productsor more — our long-term goal — reached 14 percent of our total banking house-holds; 38 percent of our consumers havefive products or more.
• Retention improved by six percent for high-value checking account customers.
• Customer service levels and teller-line wait times improved but still are not at the levels we want them to be.
• One of every three of our new checkingaccount customers now has a Wells FargoPacksSM — a checking account and at leastthree other products such as a debit card,credit card, savings account, home equityloan, or online banking.
• Nonperforming assets and net charge-offs, as a percent of loans, declined from.66 percent and .81 percent in 2003 to .55 percent and .62 percent in 2004.
• Record net income for Wholesale Bankingfor the sixth consecutive year— #1 inmarket share for middle marketcommercial customers in the western U.S.1
• Wells Fargo Financial, our consumerfinance company, continued its rapidgrowth, increasing average receivables 45 percent with profit of more than a half billion dollars for the first time in its 106-year history.
• We originated $298 billion in mortgagesand continued to be the nation’s #1 retailmortgage originator. Our owned mortgageservicing portfolio, which helps provide a “natural hedge” when interest rates rise and mortgage originations decline, rose 13 percent to $805 billion.
• #1 nationally in home equity loan marketshare for the fourth consecutive year, our portfolio rose 42 percent from lastyear to $52 billion. Home equity lines and loans remain the consumer credit“product of choice.” Credit qualitycontinued to be very solid.
• More than half our households and almosttwo-thirds of our corporate customersnow bank with us actively online — morethan a third of those households using Bill Pay and presentment; Global Financeranks us the world’s best consumerinternet bank and Watchfire GomezProranks us the best U.S. internet bank.
• Through joint ventures with Grupo Banorte, HSBC Mexico and BBVABancomer, we now have the largest network of banking stores and ATMs
for remitting funds to Mexico of any U.S.financial services company.
• Being the first financial services companyin the nation to seize the opportunity, wesurpassed the half million mark in thenumber of accounts opened for Mexicannationals using the Matricula Consularcard as a form of identification. This helpsMexican nationals move from the riskycash economy into secure, reliable financialservices so they can succeed financially. At year-end 2004, we were opening anaverage of 22,000 new accounts a monththrough this process, a seven-fold increaseover the past three years.
• Our stock reached a record high close of$63.25 on December 13, 2004.
• Our dividend payout over the past year of more than $3 billion ranked as thefourth highest in the U.S. among all public companies.2
• Our total market capitalization at year-end was $105 billion (versus less than $1 billion 20 years ago).
• Our bank remains the only “Aaa” ratedbank in the United States with the highestpossible credit rating from Moody’sInvestors Service.
• In recognition of our team’s outstandingperformance and their key role in achievingthese great results, we committed to aspecial, one-time contribution in shares ofWells Fargo common stock of one percentof their pay to the 401(k) account for everyeligible team member (up to maximum of$750), for a total of $44 million.
1 Independent research firm, cumulative market share of lead banking relationships across Wells Fargo's 23 banking states
2 Cato Institute
A
3
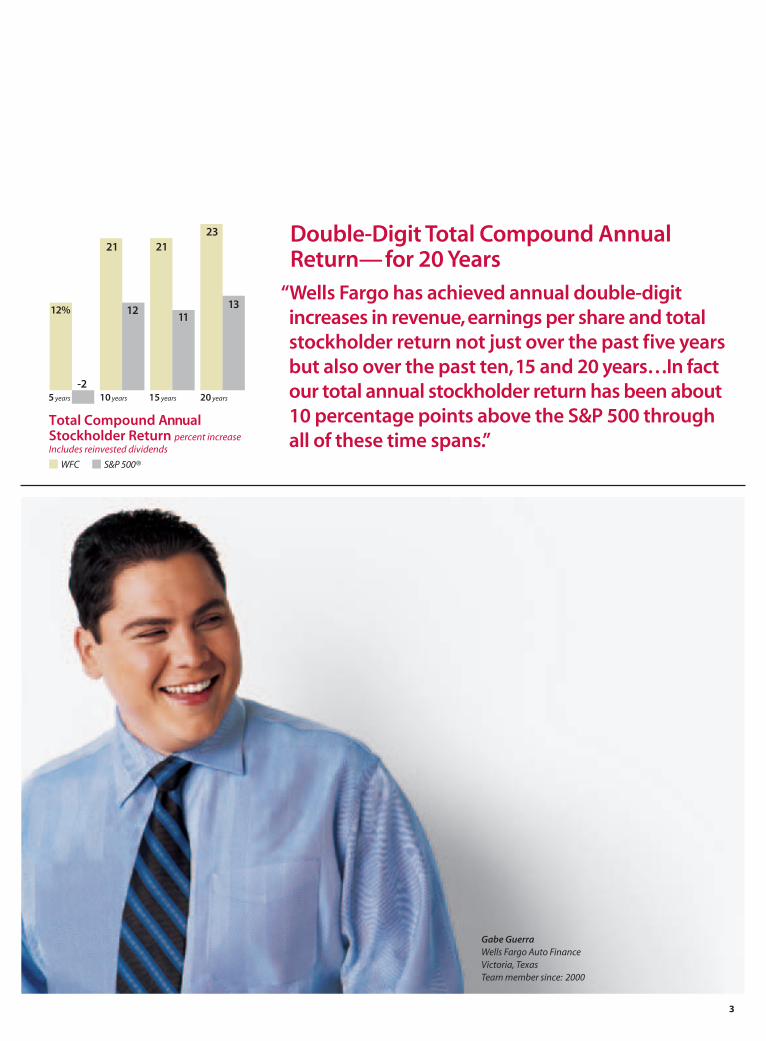
Gabe GuerraWells Fargo Auto FinanceVictoria, TexasTeam member since: 2000
Double-Digit Total Compound AnnualReturn—for 20 Years
“Wells Fargo has achieved annual double-digitincreases in revenue,earnings per share and totalstockholder return not just over the past five yearsbut also over the past ten,15 and 20 years…In fact our total annual stockholder return has been about 10 percentage points above the S&P 500 through all of these time spans.”
-5
0
5
10
15
20
25
21
12
21
11
23
13
10 years 15 years 20 years
Total Compound Annual Stockholder Return percent increaseIncludes reinvested dividends
5 years
WFC S&P 500®
12%
-2
4
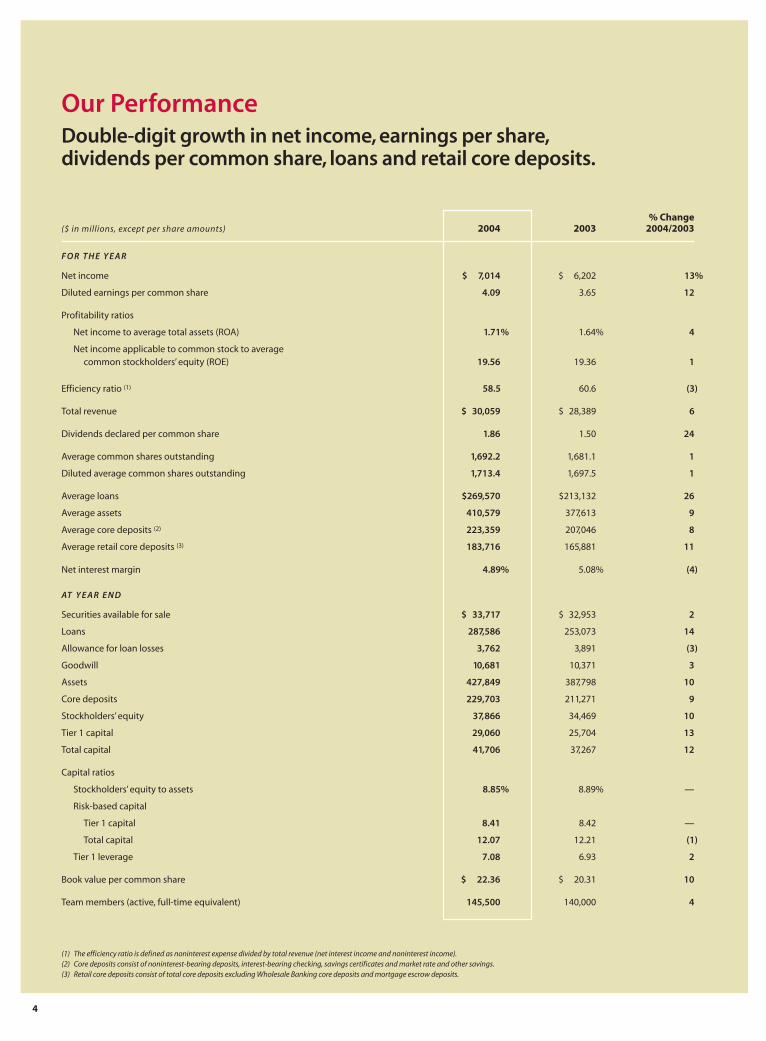
Our PerformanceDouble-digit growth in net income, earnings per share,dividends per common share, loans and retail core deposits.
F O R T H E Y E A R
Net income $ 7,014 $ 6,202 13%
Diluted earnings per common share 4.09 3.65 12
Profitability ratios
Net income to average total assets (ROA) 1.71% 1.64% 4
Net income applicable to common stock to average common stockholders’ equity (ROE) 19.56 19.36 1
Efficiency ratio (1) 58.5 60.6 (3)
Total revenue $ 30,059 $ 28,389 6
Dividends declared per common share 1.86 1.50 24
Average common shares outstanding 1,692.2 1,681.1 1
Diluted average common shares outstanding 1,713.4 1,697.5 1
Average loans $269,570 $213,132 26
Average assets 410,579 377,613 9
Average core deposits (2) 223,359 207,046 8
Average retail core deposits (3) 183,716 165,881 11
Net interest margin 4.89% 5.08% (4)
AT Y E A R E N D
Securities available for sale $ 33,717 $ 32,953 2
Loans 287,586 253,073 14
Allowance for loan losses 3,762 3,891 (3)
Goodwill 10,681 10,371 3
Assets 427,849 387,798 10
Core deposits 229,703 211,271 9
Stockholders’ equity 37,866 34,469 10
Tier 1 capital 29,060 25,704 13
Total capital 41,706 37,267 12
Capital ratios
Stockholders’ equity to assets 8.85% 8.89% —
Risk-based capital
Tier 1 capital 8.41 8.42 —
Total capital 12.07 12.21 (1)
Tier 1 leverage 7.08 6.93 2
Book value per common share $ 22.36 $ 20.31 10
Team members (active, full-time equivalent) 145,500 140,000 4
% Change($ in millions, except per share amounts) 2004 2003 2004/2003
(1) The efficiency ratio is defined as noninterest expense divided by total revenue (net interest income and noninterest income).(2) Core deposits consist of noninterest-bearing deposits, interest-bearing checking, savings certificates and market rate and other savings.(3) Retail core deposits consist of total core deposits excluding Wholesale Banking core deposits and mortgage escrow deposits.
5
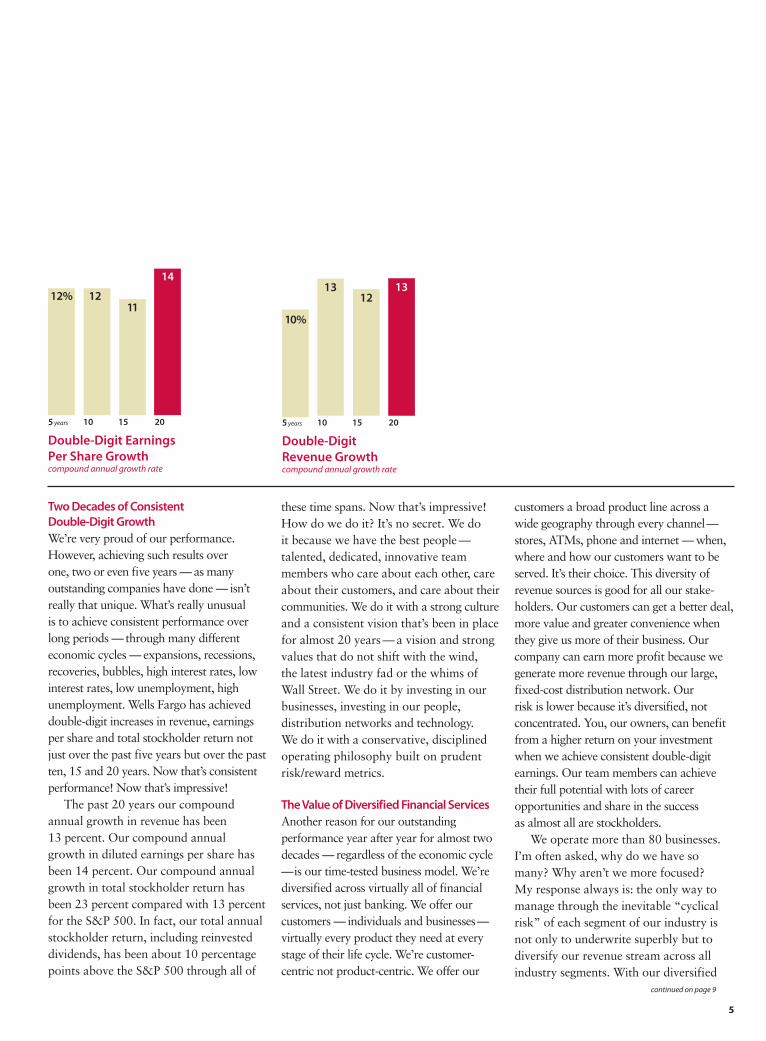
Two Decades of Consistent Double-Digit Growth We’re very proud of our performance.However, achieving such results over one, two or even five years — as manyoutstanding companies have done — isn’treally that unique. What’s really unusual is to achieve consistent performance overlong periods — through many differenteconomic cycles — expansions, recessions,recoveries, bubbles, high interest rates, lowinterest rates, low unemployment, highunemployment. Wells Fargo has achieveddouble-digit increases in revenue, earningsper share and total stockholder return notjust over the past five years but over the pastten, 15 and 20 years. Now that’s consistentperformance! Now that’s impressive!
The past 20 years our compoundannual growth in revenue has been13 percent. Our compound annualgrowth in diluted earnings per share hasbeen 14 percent. Our compound annualgrowth in total stockholder return hasbeen 23 percent compared with 13 percentfor the S&P 500. In fact, our total annualstockholder return, including reinvesteddividends, has been about 10 percentagepoints above the S&P 500 through all of
these time spans. Now that’s impressive!How do we do it? It’s no secret. We do it because we have the best people —talented, dedicated, innovative teammembers who care about each other, careabout their customers, and care about theircommunities. We do it with a strong cultureand a consistent vision that’s been in placefor almost 20 years — a vision and strongvalues that do not shift with the wind, the latest industry fad or the whims ofWall Street. We do it by investing in ourbusinesses, investing in our people,distribution networks and technology. We do it with a conservative, disciplinedoperating philosophy built on prudentrisk/reward metrics.
The Value of Diversified Financial ServicesAnother reason for our outstandingperformance year after year for almost twodecades — regardless of the economic cycle—is our time-tested business model. We’rediversified across virtually all of financialservices, not just banking. We offer ourcustomers — individuals and businesses—virtually every product they need at everystage of their life cycle. We’re customer-centric not product-centric. We offer our
customers a broad product line across awide geography through every channel—stores, ATMs, phone and internet — when,where and how our customers want to beserved. It’s their choice. This diversity ofrevenue sources is good for all our stake-holders. Our customers can get a better deal,more value and greater convenience whenthey give us more of their business. Ourcompany can earn more profit because wegenerate more revenue through our large,fixed-cost distribution network. Our risk is lower because it’s diversified, notconcentrated. You, our owners, can benefitfrom a higher return on your investmentwhen we achieve consistent double-digitearnings. Our team members can achievetheir full potential with lots of careeropportunities and share in the success as almost all are stockholders.
We operate more than 80 businesses.I’m often asked, why do we have somany? Why aren’t we more focused? My response always is: the only way tomanage through the inevitable “cyclicalrisk” of each segment of our industry isnot only to underwrite superbly but todiversify our revenue stream across allindustry segments. With our diversified
continued on page 9
5 years 10 15 20
Double-Digit Revenue Growthcompound annual growth rate
0
3
6
9
12
15
1312
13
10%
5 years 10 15 20
Double-Digit Earnings Per Share Growthcompound annual growth rate
0
3
6
9
12
15
1211
14
12%
6
1. Investments, Brokerage,Trust,Private Banking, Insurance
Fifteen percent of our banking earnings
came from investments, brokerage, trust,
private banking and insurance — it’s still
not good enough. We want to increase
that percentage to at least 25 percent. Less
than five percent of our 10 million banking
households have relationships with our
brokerage business. Less than two percent
buy insurance through us.
Progress:
• Acquired $29 billion in assets under
management from Strong Financial,
making us one of the nation’s top 20
mutual fund companies. Our combined
team now can offer our 11 million banking
households a broader, deeper array of
funds through new distribution channels.
• 1,000+ bankers (up 120 percent in 2004)
licensed to sell investment products such
as mutual funds.
• The number of our private bankers has
grown to more than 600 the last five years
(up 400 percent).
• New assets attracted through WellsTrade,®
our online brokerage channel, have grown
at a compound rate of 21 percent the past
two years.
2.“Going for Gr-Eight”Our average banking household has 4.6
products with us (about double the industry
average). Our average commercial/corporate
customer has 5.3. But both purchase about
16 financial products from someone. We
want our consumer and business customers
to have at least eight products with us.
Progress:
• Added 10,000 sales people in banking,
mortgage and consumer finance
businesses past three years.
• Increased training, partnering among team
members to better identify opportunities to
satisfy more of customers’financial needs.
3.Doing It Right for the Customer Our product is service and our value-added
is financial advice. We want to be advocates
for our customers, put them at the center of
everything we do and give them such
outstanding service and advice that they will
give us all their business, honor us with
repeat purchases and rave about us to their
family, friends and business associates.
Progress:
• With just one request through any of our
stores or Wells Fargo Phone Bank, our
customers now can change their address
for 23 products — including savings,
checking, debit cards, credit cards, Bill
Pay, mortgage, home equity, brokerage
and insurance.
• Wells Fargo Phone Bank now services
customer accounts from a single source
using web-based technology, reducing
human error, speeding service.
4. Banking with a Mortgage and a Home Equity Loan
We want all our mortgage customers in our
23 banking states to bank with us. We also
want all our banking customers—who need
a mortgage or a home equity loan—to get
it through Wells Fargo. Only 20.5 percent of
our banking customers who own a home
have their mortgage with Wells Fargo (five
years ago: 10.8 percent). Only 21.3 percent
have a home equity loan with us (five years
ago: 11 percent). Forty-three percent of our
mortgage customers who bank with us also
have a home equity loan with us.
Progress:
• Announced a long-term goal: double
number of commission-based home
mortgage consultants, currently 10,000.
• In response to rising interest rate
environment, launched SmartFit Home
Equity Account,SM giving homeowners
certainty of fixed rate, benefit of lower
payments and flexible line of credit.
5.Wells Fargo Cards in EveryWells Fargo Wallet
We want every one of our creditworthy
customers to have a Wells Fargo credit
card and debit card. These cards—and,
increasingly, stored-value cards—have
surpassed checks and cash for in-store
purchases. They’re the payment tool of
choice for a majority of Americans.
Progress:
• Banking customers with a Wells Fargo
credit card: 31 percent (1999: 21 percent).
• Checking account customers with a
Wells Fargo debit card: 88 percent (1999:
72 percent).
6.When,Where and How We integrate our distribution channels to
offer our products and services anytime,
anywhere our customers want to be served.
We believe we offer customers more choices
than virtually any other financial services
provider—traditional stores, supermarket
stores, ATMs, Wells Fargo Phone Bank,
internet and mail—when, where and how
they want to use them. Very few, if any,
customers are single-channel users. We want
to further expand our distribution channels
for more customer convenience and be
recognized as the world’s best internet bank
Our 10 Strategic Initiatives guide us towardour vision and help us achieve double-digitrevenue and earnings growth. Here’s a briefprogress report on each:
7
across all four major customer segments:
consumer, investor, small business, middle
market and large companies.
Progress:
• Opened 104 new banking stores, average
of two per week; remodeled 396.
• Opened 80 consumer finance stores.
• Global Finance ranks Wells Fargo best U.S.
consumer internet bank, best for online bill
payment and presentment, online credit,
and corporate/institutional website design
in North America; Watchfire GomezPro
ranks us the best internet bank in the U.S.
• Active users of Commercial Electronic
Office® (CEO®) internet portal — giving
corporate and commercial customers
integrated financial services in one place,
real time — have grown to over 60 percent
of our customers in three years since
launch; CEO log-ins surpassed one million
a month. Revenue flowing through our
CEO portal in 2004 was almost twice what
it was in 2002.
• Consumer households banking actively
with us online rose 27 percent versus last
year; small business active online users
rose 30 percent; middle market and large
corporate rose 14 percent.
• All 6,200 ATMs are now web-enabled for
faster transactions, customized messaging,
serving customers in six languages;
also customized for audio guidance for
visually impaired.
7.“Information-Based”Marketing
Take full advantage of what we know about
our customers’needs so we can offer them
the choice, convenience and price benefits
of giving us all their business. We use
technology not to de-personalize service but
to personalize it. Thanks to technology, we
know how many products each customer
has with us. We can anticipate the products
they’ll most likely need—based on account
balances, life events, transaction history, and
how they access Wells Fargo. With that
knowledge, and respecting the confidentiality
of information of our customers, we can
tailor sales messages through our Wells Fargo
Phone Bank, ATMs,wellsfargo.com and
statement mailings to help satisfy our
customers’ financial needs.
Progress:
• First to provide online customers, for free,
automatic, all-in-one personal finance
picture showing debit card and credit card
spending, checking and Bill Pay, organizing
transactions by categories such as gas/auto,
groceries and ATM withdrawals.
8. Be Our Customers’Payment Processor
Banking is necessary. Banks are not. Banks
traditionally have been the intermediary in
the billions of transactions among consumers,
businesses and the government. That role,
however, is not a birthright. We need to
make sure Wells Fargo adds real value so we
can be our customers’ first choice, electronic
or paper, whenever and wherever they buy
services and be the payments link for all their
Wells Fargo accounts. We generate about
30 percent of our revenue through payment
services such as checks, credit cards, debit
cards, cash and securities, direct deposit,
wire transfer and automated clearinghouse
(ACH). Last year for the first time, electronic
payments surpassed cash and checks. The
new Federal law, known as “Check 21,”
makes it possible for banks to process digital
images of checks, not just paper ones,
reducing risk and the inefficiency of
transporting paper checks from hand to
hand and institution to institution.
Progress:
• Processed more than $35 trillion in
payments electronically in 2004.*
• Nation’s third largest processor of
ACH transactions.
9. Premier CustomersWe must attract more — and keep all our
current—premier and excellent customers.
We also need to aggressively cross-sell
households that have the potential to
become premier customers. We must focus
even more on closing the “back door”—
reducing, by half, the number of customers
who leave us or give us less of their business.
Progress:
• Six percent improvement in retaining
high-value checking account customers.
(see page 16)
10. People as a CompetitiveAdvantage
Most importantly, we must do even better in
training, rewarding and recognizing all our
team members. We must build an inclusive
workplace and a diverse organization. All
members of our team should know they’re
valued, that they can go as far as their ability
and desire to work will take them. We must
be a company that encourages a healthy
balance in work and home life. Our success
depends on how much our team members
care for their customers, for each other, their
communities and our stockholders. People
commit themselves to other people, not
organizations. Processes are important but
they don’t do the work, people do. Because
we believe in people as our competitive
advantage, we’ll continue to invest in our
“human capital.” It’s the most important,
valuable investment we can make.
Progress:
• Special one-time contribution of
Wells Fargo common stock to 401(k)
account of each eligible team member
(up to maximum of $750).
• To be more responsive to our increasingly
diverse communities, our team members
have formed 72 Team Member Networks
and 44 Diversity Councils nationwide.
*Credit card point of sale, debit card, credit card purchases, onlineBill Pay, ACH, merchant card, online merchant payments and wire transfer
8
Andrew OwenWells Fargo FundsSan Francisco, CaliforniaTeam member since: 1992
3.65
3.32
*
1.97
*2.32
$2.2
8
01 02 03 0499 00
Earnings Per Share diluted,* * dollars20-year compound annual growth rate: 14%
4.09
0
1
2
3
4
5
$18.
9 20.7
21.0
25.2 28
.4 30.1
99 00 01 02 03 04
Revenue dollars, billions20-year compound annual growth rate: 13%
0
5
10
15
20
25
30
35
*2001 includes venture capital impairment; 2002 is before effect of change related to adoption of FAS 142 accounting principle.
**Includes all common stock equivalents (“in the money”stock options, warrants and rights, convertible bonds andconvertible preferred stock)
9
set of financial services businesses, eachresponding differently to a given economic situation, we’ve found that we can growat double-digit rates and actually reducerisk. For narrowly-focused companies,faster linear growth often results in anexponential increase in concentrated risk.In our diversified business model, our riskactually decreases as we grow becausewe’re diversifying that risk among many businesses.
How Do We Measure the Value We Create? Our diversified business model — executedsuccessfully for two decades — drives theway we measure success. Last year, wecalled for a new set of measures—to reflectmore accurately how financial servicescompanies, like ours, create value forcustomers and stockholders. We believe this new set of measures is more suited to
the faster growing, dynamic, diversifiedfinancial services industry than thosemeasures that “big banks” have tradition-ally used. We measure what we treasure…revenue, profit, market share growth andstockholder returns. Now it’s a year later.Our proposal prompted such significantinterest and discussion that we’ve expandedon it in our report to you this year. Whyshould all this matter to you? The moreprecisely that service companies, the heart of the U.S. economy, can measure the valuethey create, the more accurately the market-place can measure the value of their stock.
This subject of measuring value created—fueled by the explosive growth of
information technology and the internet—isnot new. Experts around the world — evena Nobel Prize winner — have been discussingand studying it for at least two decades.Some companies even have created complexsoftware programs to try to measure thecorrelation between a company’s intellectualcapital and its market value. Sweden has agovernment agency that tries to measure thecountry’s intellectual capital, which oneexpert has called “the invisible balancesheet.” Most recently, the AmericanEnterprise Institute called for “a morerelevant and transparent system of financialand non-financial disclosure.” It says this“will help investors better assess the value ofcompanies in the knowledge economy, and … help companies create more value fortheir shareholders.”
We don’t pretend to be as smart as theexperts on this subject. We don’t propose
any fancy new theories. We are simplysuggesting a new set of value-creationmeasures for financial services companiesso there is an apples-to-apples way tocompare companies’ performance acrossthe industry in the measures that reallymatter. That’s why we say financialservices companies measure the wrongthings, often based on the traditionalmeasures of the banking industry.For example:• Asset size and return on assets —
important to banks in the “old days”—do not reflect contributions from suchfee-based businesses as mortgage,insurance and money management.
• Deposits can be a valuable measure ofmarket share but today they represent only about one-fifth of total householdfinancial assets. Our share of deposits insome states is 25 to 30 percent but guesswhat our average share of total householdfinancial assets is in those states? About five percent!
• Total customers can be a meaninglessmeasure — it gives you little or no insightinto breadth and depth of relationships.Think of the profit difference between ten customers who entrust you with 100 percent of their business versus 100 who give you just ten percent of it.
• The standard efficiency ratio — how many cents it costs to generate a dollar of revenue — differs widely by type ofbusiness in financial services. For example,a well-run commercial lending businesshas an efficiency ratio of about 25 percentwhile a well-run insurance broker has anefficiency ratio of 75 percent. Guess whichone has the higher risk-based return onequity? We prefer a different way tomeasure efficiency: the rate at whichrevenue growth exceeds expense growth.Our goal is to grow revenue twice as fastas expenses. If you do that, your efficiencyratio will improve year after year after year.
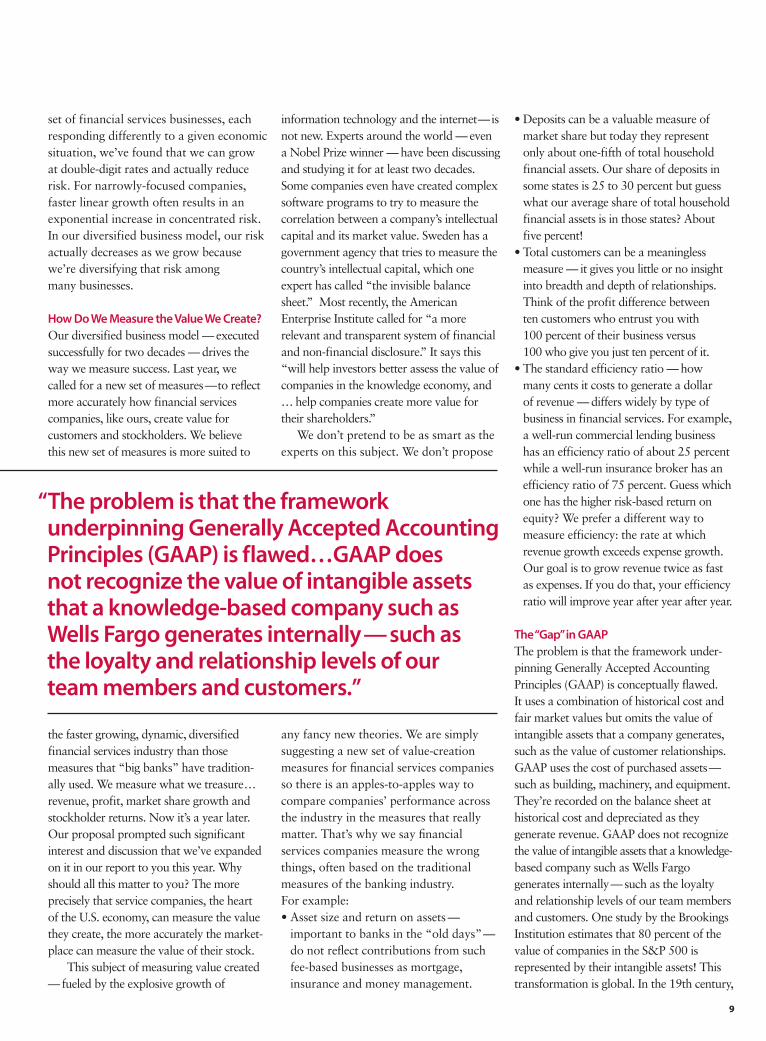
The “Gap”in GAAP The problem is that the framework under-pinning Generally Accepted AccountingPrinciples (GAAP) is conceptually flawed. It uses a combination of historical cost andfair market values but omits the value ofintangible assets that a company generates,such as the value of customer relationships.GAAP uses the cost of purchased assets—such as building, machinery, and equipment.They’re recorded on the balance sheet athistorical cost and depreciated as theygenerate revenue. GAAP does not recognizethe value of intangible assets that a knowledge-based company such as Wells Fargogenerates internally—such as the loyaltyand relationship levels of our team membersand customers. One study by the BrookingsInstitution estimates that 80 percent of thevalue of companies in the S&P 500 isrepresented by their intangible assets! Thistransformation is global. In the 19th century,
“The problem is that the frameworkunderpinning Generally Accepted AccountingPrinciples (GAAP) is flawed…GAAP does not recognize the value of intangible assetsthat a knowledge-based company such as Wells Fargo generates internally—such as the loyalty and relationship levels of our team members and customers.”

1 01 0
trade between nations was in goods. In the21st century, the movement of goods is farsurpassed by the movement of capital—monetary and intellectual—on fiber linesaround the world at the speed of light. Asthe late Walt Wriston, my friend, mentor,and former CEO of Citicorp, wrote sowisely more than a decade ago, “capital will go where it’s welcome and stay whereit’s well treated.” And that goes not just forfinancial capital but intellectual capital. In aknowledge-based economy, it’s your peoplewho are most important, not physical assets.People who can choose where they want towork. People who have a choice of beingtruly engaged (or not) and excited aboutwhat they’re doing and what they achieve.
Among the new measures we’ve added this year are ones that track thevalue of our most important competitiveadvantage — our team members. Howlong do they stay with us so we canbenefit from their knowledge, experience,caring, and customer relationships? Howengaged are they? Recruiting and trainingnew team members costs tens of millionsof dollars a year. So, reducing the loss oftalented team members increases earnings.Keeping customers also is critical toconsistent growth. Our customers—howlong do they stay with us so we can betterunderstand their financial goals, helpthem succeed financially and earn more oftheir business? Lowering the rate of lostcustomers is even more profitable thanattracting new ones. And, of course, youoften lose customers when the peopleserving them leave you. A company oursize, for example, can easily lose a millionbanking households a year. On average,each of these households delivered over$200 in annual profit — that’s $200 mil-lion in reduced profit; on a present valuebasis, billions in lost profits. GAAPseldom captures the full effect of lost customers.
2005: The Economy Last year at this time we said a solid casecould be made for economic optimism. That proved correct. Now a year later,interest rates, inflation and inventories arestill low. The U.S. Gross Domestic Product isgrowing nicely. The economy has generatedmore than two million jobs in the past year.Capital spending is strong. Productivity isgood. The dollar has fallen over 20 percent,helping exports. The S&P 500 is up 51 percent from its 2003 low. The NASDAQis up 71 percent. Retail sales are good.Economic growth in India, China and the rest of Asia is strong. Unfortunately,European economies are not keeping pace,partly due to the drag of their welfareentitlement states. Core inflation is likely to remain low, allowing the Federal Reserveto increase interest rates slowly until theyreach an economic neutral rate of aboutthree to four percent.
The “Next Stage”Once again, we thank our 150,000 talentedteam members for their outstandingaccomplishments and record results. Wethank them for believing, living and sharingour customer-focused vision and values. Wethank them for knowing how they connectindividually with our business strategy andour time-tested business model. We thankthem for their unrelenting focus onsatisfying all our customers’ financial needsand for partnering to do what’s best for ourcustomers. We thank them for listening toour customers, asking them the rightquestions, and offering products andservices of real value — so that ourcustomers, in turn, can succeed financiallyand then vote with their pocketbooks andbuy even more of our products and services—thus increasing our revenue. We thankthem for their commitment to ourcommunities and for the time — hundreds ofthousands of hours—and the talent they
contribute to non-profits and communityactivities. We thank them for striving for thehighest standards of corporate governance,their commitment to tough and thoroughinternal audit and compliance, for believingin principles not just rules. We thank themfor building a corporate culture in which weall should know instinctively what’s right andwhat’s wrong—without needing to be told.
We thank our customers for entrustingus with more of their business and for paying us the ultimate compliment:returning to us for their next financialservices product. We thank ourcommunities — thousands of them acrossNorth America — for the privilege ofhelping make them better places in whichto live and work. And we thank you, ourowners, for your confidence in Wells Fargoas we begin our 153rd year.
The “Next Stage” of success is justdown the road — for our team members,our customers, our communities and our stockholders.
It’s going to be a great ride!
Richard M. Kovacevich, Chairman and CEO

1 1
Which MeasuresReally Matter?We measure success differentlythan our competitors.We believethese measures matter most.They’re the most important long-term indicators of success inthe financial services industry.
- Revenue Growth
- Earnings Per Share
- Return On Equity
- Revenue vs. Expense Growth
- Assets Managed, Administered
- Managing Risk
- Retaining Team Members
- Team Member Engagement
- Retaining Customers
- Customer Service
- Customer Access Options
- Cross-Selling
- Product Solutions (Sales)Per Banker Per Day
- Market Share
- Total Stockholder Return
Letty CanteroWells Fargo BankCorona, CaliforniaTeam member since: 1994
1 2
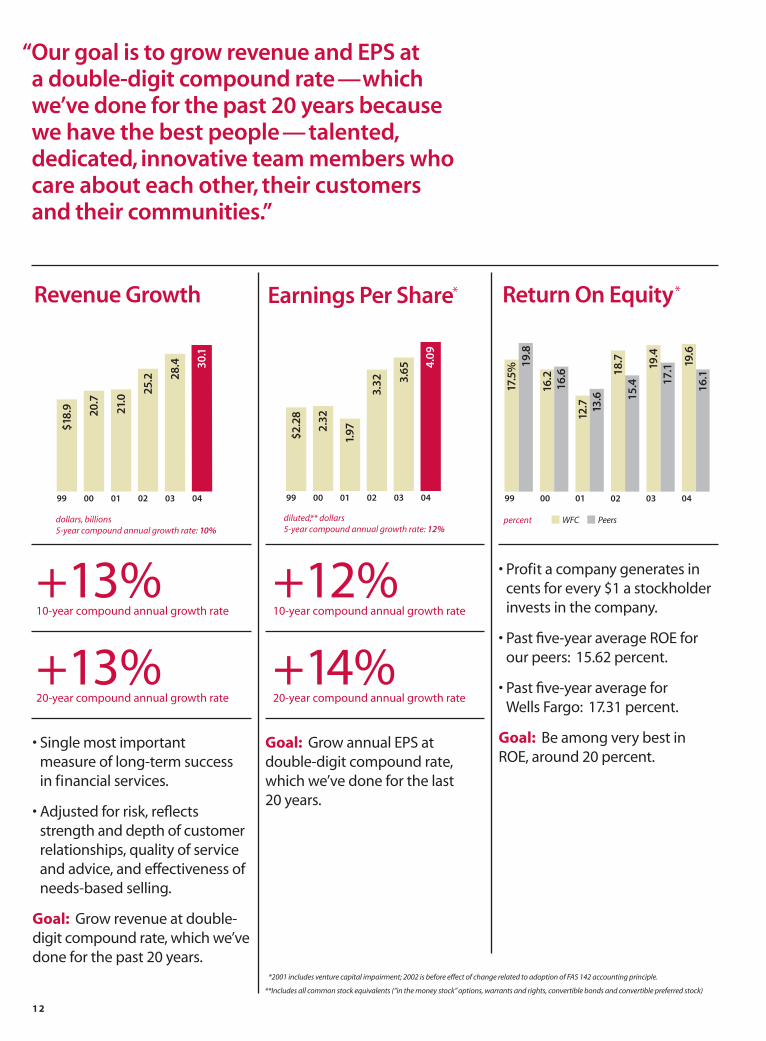
• Single most important measure of long-term success in financial services.
• Adjusted for risk, reflectsstrength and depth of customerrelationships, quality of serviceand advice, and effectiveness ofneeds-based selling.
Goal: Grow revenue at double-digit compound rate, which we’vedone for the past 20 years.
Goal: Grow annual EPS atdouble-digit compound rate,which we’ve done for the last 20 years.
• Profit a company generates incents for every $1 a stockholderinvests in the company.
• Past five-year average ROE forour peers: 15.62 percent.
• Past five-year average for Wells Fargo: 17.31 percent.
Goal: Be among very best inROE, around 20 percent.
$18.
9 20.7
21.0
25.2 28
.4 30.1
99 00 01 02 03 04
dollars, billions5-year compound annual growth rate: 10%
0
5
10
15
20
25
30
35
3.65
3.32
1.972.
32
$2.2
8
01 02 03 0499 00
diluted,* * dollars5-year compound annual growth rate: 12%
4.09
0
1
2
3
4
5
17.5
% 19.8
16.2
16.6
12.7 13
.6
18.7
15.4
19.4
17.1 19
.616
.1
99 00 01 02 03 04
percent WFC Peers
0
5
10
15
20
“Our goal is to grow revenue and EPS at a double-digit compound rate—whichwe’ve done for the past 20 years becausewe have the best people—talented,dedicated, innovative team members whocare about each other, their customers and their communities.”
Revenue Growth Earnings Per Share* Return On Equity*
+13%10-year compound annual growth rate
+13%20-year compound annual growth rate
+12%10-year compound annual growth rate
+14%20-year compound annual growth rate
*2001 includes venture capital impairment; 2002 is before effect of change related to adoption of FAS 142 accounting principle.
**Includes all common stock equivalents (“in the money stock” options, warrants and rights, convertible bonds and convertible preferred stock)
1 3
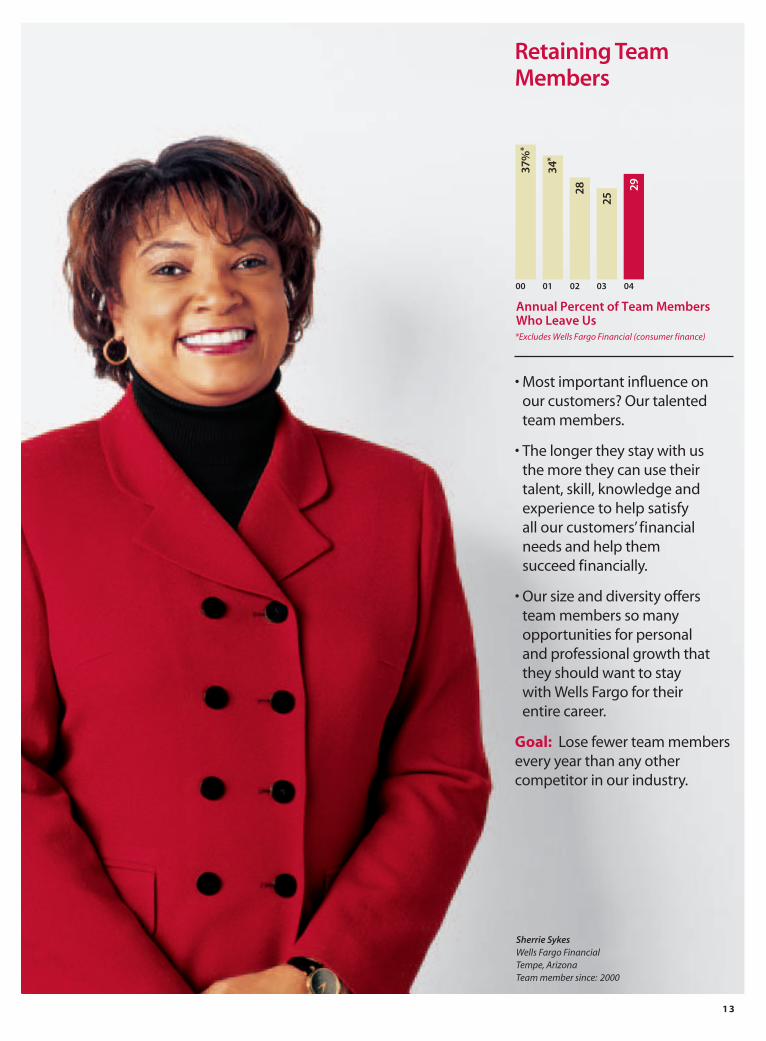
• Most important influence onour customers? Our talentedteam members.
• The longer they stay with us the more they can use theirtalent, skill, knowledge andexperience to help satisfy all our customers’ financialneeds and help them succeed financially.
• Our size and diversity offersteam members so manyopportunities for personal and professional growth thatthey should want to stay with Wells Fargo for their entire career.
Goal: Lose fewer team membersevery year than any othercompetitor in our industry.
37%
*
34*
28
25
29
00 01 02 03 04
Annual Percent of Team Members Who Leave Us*Excludes Wells Fargo Financial (consumer finance)
Retaining TeamMembers
Sherrie SykesWells Fargo FinancialTempe, ArizonaTeam member since: 2000

1 4
• Vast majority of our surveyedteam members like their workand know how it helps ourcompany achieve its goals.
• Our team member satisfactionscores: significantly higher than national average.
0
20
40
60
80
100
84% 88
91
00 02 04
Wells Fargo Team MembersWho Say They Know HowTheir Work Helps Wells Fargo percent
84% 89 88
00 02 04
Wells Fargo Team Members Who Say They Like Their Workpercent
0
20
40
60
80
100
91%Wells Fargo team members who know how their work helps Wells Fargo
Team Member Engagement
88%Wells Fargo team members who say they like their work
Mohan ChellaswamiWells Fargo Home MortgageSt. Louis, MissouriTeam member since: 1991
• Our ratio of engaged to activelydisengaged team members in Regional Banking is 4 to 1 (1.7 to 1 for average U.S. workers).Source: The Gallup Organization
Goal: Maintain our engaged to disengaged ratio well over the national average.
1 5
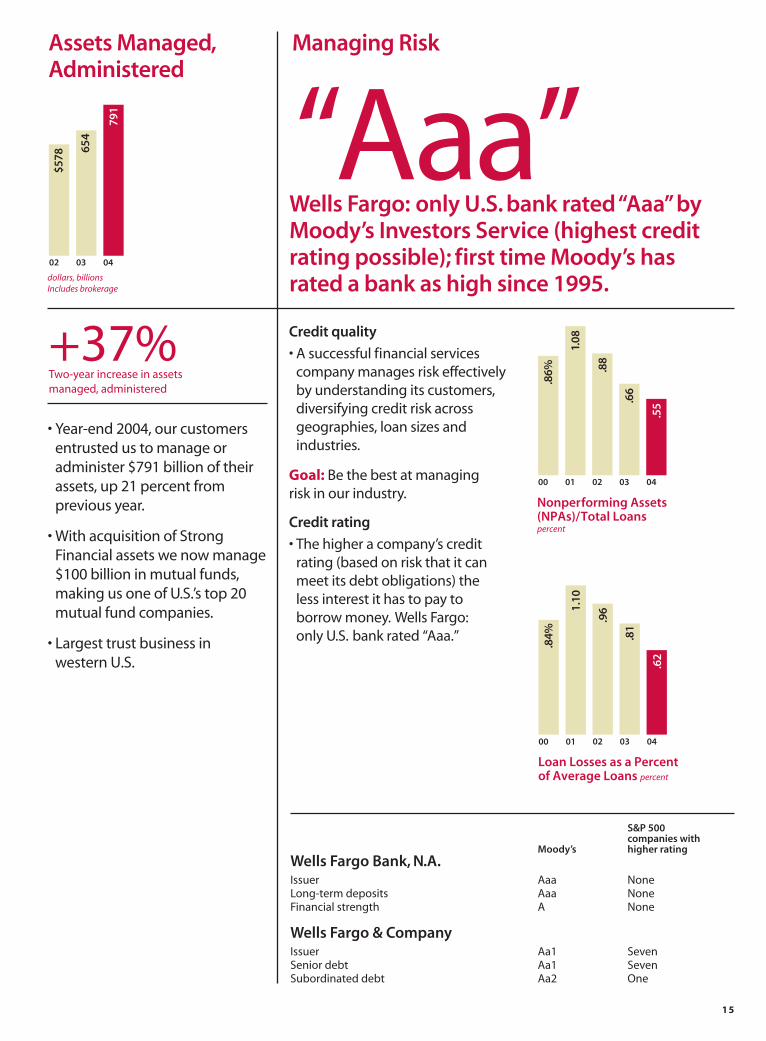
• Year-end 2004, our customersentrusted us to manage oradminister $791 billion of theirassets, up 21 percent fromprevious year.
• With acquisition of StrongFinancial assets we now manage$100 billion in mutual funds,making us one of U.S.’s top 20mutual fund companies.
• Largest trust business in western U.S.
$578
654
791
02 03 04
dollars, billionsIncludes brokerage
0
100
200
300
400
500
600
700
800
Credit quality
• A successful financial servicescompany manages risk effectivelyby understanding its customers,diversifying credit risk acrossgeographies, loan sizes andindustries.
Goal: Be the best at managing risk in our industry.
Credit rating
• The higher a company’s creditrating (based on risk that it canmeet its debt obligations) the less interest it has to pay to borrow money. Wells Fargo:only U.S. bank rated “Aaa.”
.86%
1.08
.88
.66
.55
00 01 02 03 04
Nonperforming Assets(NPAs)/Total Loanspercent
0.0
0.2
0.4
0.6
0.8
1.0
1.2
.84%
1.10
.96
.81
.62
00 01 02 03 04
Loan Losses as a Percent of Average Loans percent
0.0
0.2
0.4
0.6
0.8
1.0
1.2
Assets Managed,Administered
+37%Two-year increase in assets managed, administered
“Aaa”Wells Fargo: only U.S. bank rated “Aaa”byMoody’s Investors Service (highest creditrating possible); first time Moody’s has rated a bank as high since 1995.
Managing Risk
S&P 500 companies with
Moody’s higher rating Wells Fargo Bank, N.A.Issuer Aaa NoneLong-term deposits Aaa NoneFinancial strength A None
Wells Fargo & CompanyIssuer Aa1 SevenSenior debt Aa1 SevenSubordinated debt Aa2 One
1 6
10.4
% (e
st.)
8.9
8.0
7.5
01 02 03 04
High-Value* Checking Account Customers Who Leave Us percent
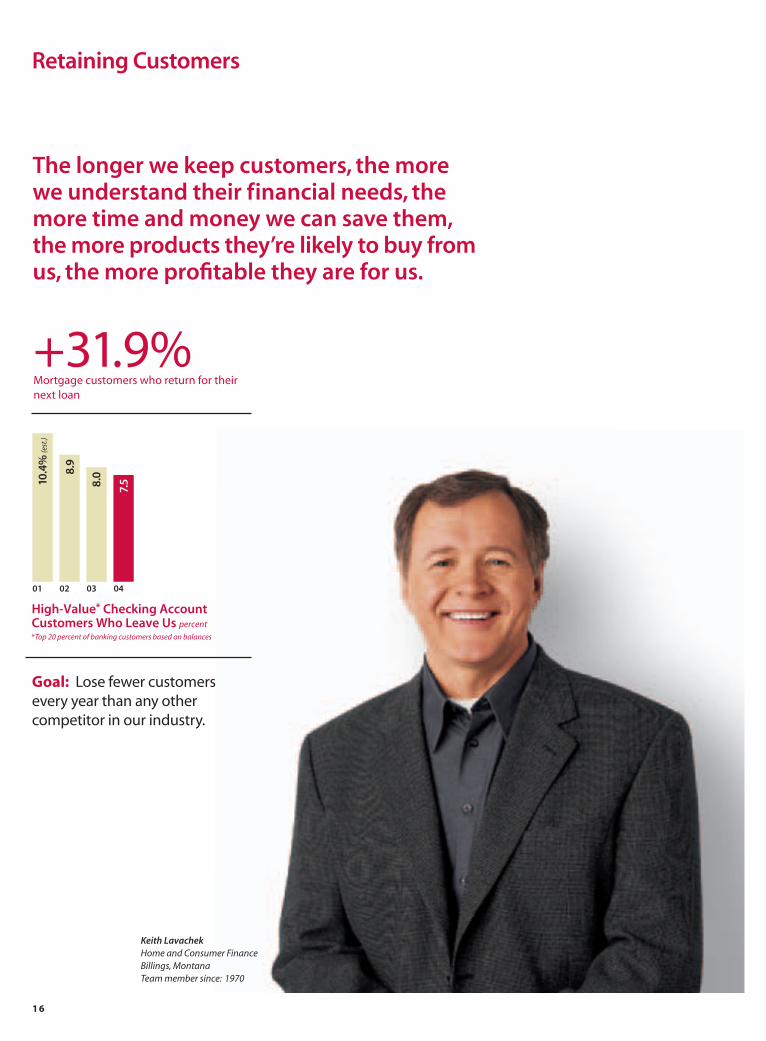
Goal: Lose fewer customersevery year than any othercompetitor in our industry.
+31.9%Mortgage customers who return for their next loan
Retaining Customers
Keith LavachekHome and Consumer FinanceBillings, MontanaTeam member since: 1970
The longer we keep customers, the more we understand their financial needs, the more time and money we can save them,the more products they’re likely to buy from us, the more profitable they are for us.
*Top 20 percent of banking customers based on balances

1 7
Revenue vs. Expense Growth7.
0
1.4%
20.3
6.7
12.4
16.9
5.9
2.2
percent increase
01 02 03 04
Revenue Growth Expense Growth
• The standard efficiency ratio — cents it costs to earn a dollar of revenue — differswidely by type of business infinancial services.
• We prefer a different measure:the rate at which revenue growthexceeds expense growth.
Goal: Grow revenue twice as fast as expenses. If we do, ourefficiency ratio will improve year after year.
Meriem ElmandjraSpecialized Financial Services, Wholesale Banking San Francisco, CaliforniaTeam member since: 1999
1.2xAverage revenue growth exceeded
average expense growth last four years
1 8
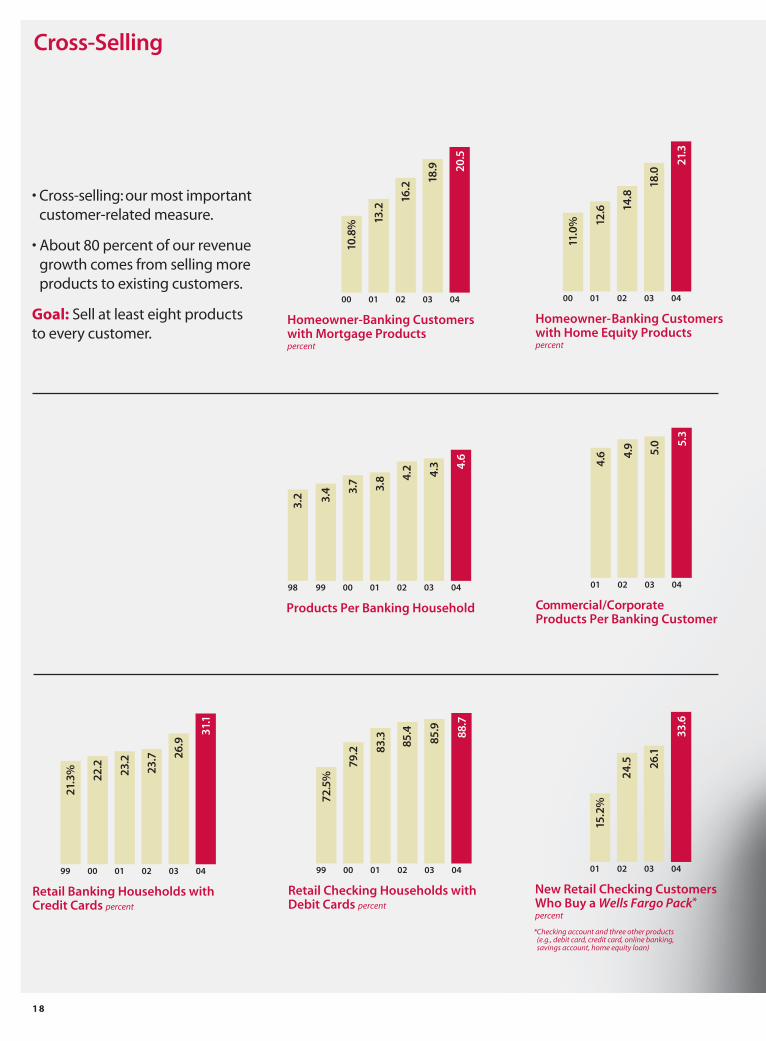
• Cross-selling: our most importantcustomer-related measure.
• About 80 percent of our revenuegrowth comes from selling moreproducts to existing customers.
Goal: Sell at least eight productsto every customer.
Cross-Selling
3.7 3.8 4.
2 4.3 4.
6
9998
3.2 3.
4
00 01 02 03 04
Products Per Banking Household
0
1
2
3
4
5
6
10.8
% 13.2
16.2
18.9
20.5
00 01 02 03 04
Homeowner-Banking Customerswith Mortgage Products percent
0
5
10
15
20
25
4.6 4.
9 5.0 5.
3
01 02 03 04
Commercial/CorporateProducts Per Banking Customer
0
1
2
3
4
5
6
11.0
% 12.6 14
.8
18.0
21.3
00 01 02 03 04
Homeowner-Banking Customerswith Home Equity Productspercent
0
5
10
15
20
25
15.2
%
24.5 26
.1
33.6
01 02 03 04
New Retail Checking Customers Who Buy a Wells Fargo Pack*percent
*Checking account and three other products (e.g., debit card, credit card, online banking, savings account, home equity loan)
22.2
23.2
23.7 26
.9
31.1
99
21.3
%
00 01 02 03 04
Retail Banking Households with Credit Cards percent
0
5
10
15
20
25
30
35
79.2 83
.3
85.4
85.9 88
.7
99
72.5
%
00 01 02 03 04
Retail Checking Households with Debit Cards percent
0
20
40
60
80
100

1 9
• Very important measure of howeffectively and efficiently wetake advantage of sales andservice opportunities brought to us each day by our 10 millionretail banking households.
• Our vision: providing ourcustomers solutions—notpitching products.
• We ask: How can we helpcustomers be financiallysuccessful? What are theirfinancial goals? What productsand services do they need toachieve those goals?
Goal: Earn all our customers’financial services business.
3.6 4.
0 4.3 4.
7 4.8
00 01 02 03 04
8+Product Solutions(Sales) Per Banker*
Per Day
+33%Since 2000
*Platform full-time equivalent (FTE) team member
Beth OppermanPrivate Client ServicesMinneapolis, MinnesotaTeam member since: 1994
Our average banking household has 4.6 products with us (about double the industry average). Our averagecommercial/corporate customer has 5.3.But both purchase about 16 financialproducts from someone. We want ourconsumer and business customers to have at least eight products with us.
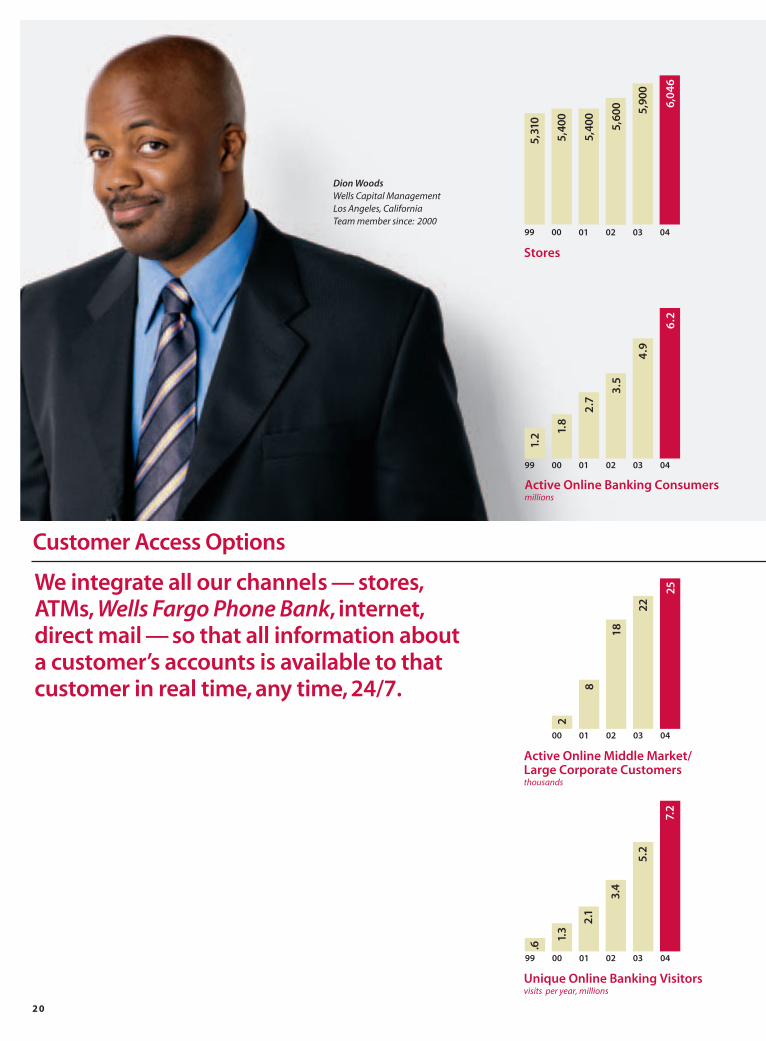
Dion WoodsWells Capital ManagementLos Angeles, CaliforniaTeam member since: 2000
2 0
5,40
0
5,40
0
5,60
0 5,90
0
6,04
6
99
5,31
0
00 01 02 03 04
Stores
0
1
2
3
4
5
6
7
8
99 00 01 02 03 04
Unique Online Banking Visitorsvisits per year, millions
.6
1.3
2.1
3.4
5.2
7.2
We integrate all our channels — stores,ATMs, Wells Fargo Phone Bank, internet,direct mail — so that all information about a customer’s accounts is available to thatcustomer in real time, any time, 24/7.
Customer Access Options
0
1
2
3
4
5
6
7
8
1.8
2.7
3.5
4.9
6.2
99
1.2
00 01 02 03 04
Active Online Banking Consumersmillions
0
5
10
15
20
25
2
8
18
22
25
00 01 02 03 04
Active Online Middle Market/Large Corporate Customersthousands
2 1
0
100
200
300
400
500
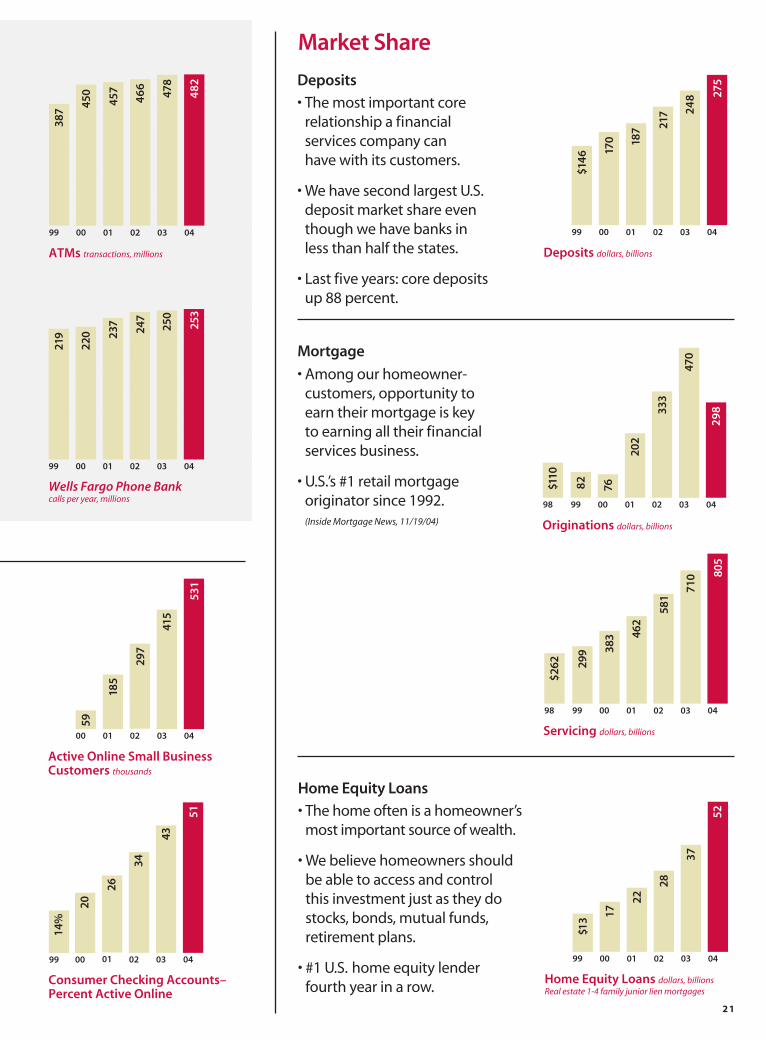
450
457
46
6
478
482
99
387
00 01 02 03 04
ATMs transactions, millions
Deposits
• The most important corerelationship a financial services company can have with its customers.
• We have second largest U.S.deposit market share eventhough we have banks in less than half the states.
• Last five years: core deposits up 88 percent.
170 18
7 217 24
8 275
99
$146
00 01 02 03 04
Deposits dollars, billions
0
50
100
150
200
250
300
76
202
333
470
298
9998
$110
82
00 01 02 03 04
Originations dollars, billions
0
100
200
300
400
500
383 46
2
581
710 80
59998
$262 29
9
00 01 02 03 04
Servicing dollars, billions
0
200
400
600
800
1000
Market Share
Mortgage
• Among our homeowner-customers, opportunity to earn their mortgage is key to earning all their financialservices business.
• U.S.’s #1 retail mortgageoriginator since 1992.(Inside Mortgage News, 11/19/04)
0
100
200
300
400
500
600
59
185
297
415
531
00 01 02 03 04
Active Online Small Business Customers thousands
0
10
20
30
40
50
60
43
34
51
02 03 04
Consumer Checking Accounts–Percent Active Online
26
01
20
00
14%
99
0
50
100
150
200
250
300
220 23
7
247
250
253
99
219
00 01 02 03 04
Wells Fargo Phone Bankcalls per year, millions
17
22
28
37
52
99
$13
00 01 02 03 04
Home Equity Loans dollars, billionsReal estate 1-4 family junior lien mortgages
Home Equity Loans
• The home often is a homeowner’smost important source of wealth.
• We believe homeowners shouldbe able to access and control this investment just as they dostocks, bonds, mutual funds,retirement plans.
• #1 U.S. home equity lender fourth year in a row.
2 2
0
20
40
60
80
100
120
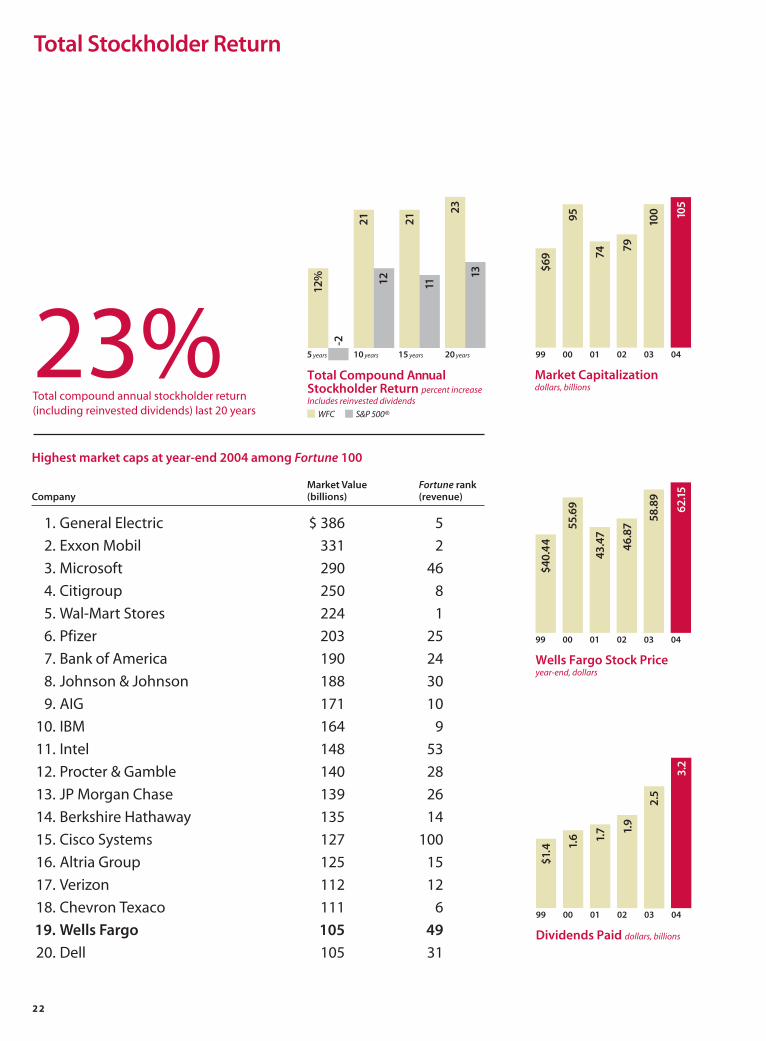
95
74
79
100 10
5
99
$69
00 01 02 03 04
Market Capitalizationdollars, billions
0
10
20
30
40
50
60
70
80
55.6
9
43.4
7
46.8
7
58.8
9
62.1
5
99
$40.
44
00 01 02 03 04
Wells Fargo Stock Priceyear-end, dollars
0.0
0.5
1.0
1.5
2.0
2.5
3.0
3.5
1.6 1.
7 1.9
2.5
3.2
99
$1.4
00 01 02 03 04
Dividends Paid dollars, billions
Total Stockholder Return
23%Total compound annual stockholder return (including reinvested dividends) last 20 years
Highest market caps at year-end 2004 among Fortune 100
Market Value Fortune rankCompany (billions) (revenue)
1. General Electric $ 386 5
2. Exxon Mobil 331 2
3. Microsoft 290 46
4. Citigroup 250 8
5. Wal-Mart Stores 224 1
6. Pfizer 203 25
7. Bank of America 190 24
8. Johnson & Johnson 188 30
9. AIG 171 10
10. IBM 164 9
11. Intel 148 53
12. Procter & Gamble 140 28
13. JP Morgan Chase 139 26
14. Berkshire Hathaway 135 14
15. Cisco Systems 127 100
16. Altria Group 125 15
17. Verizon 112 12
18. Chevron Texaco 111 6
19. Wells Fargo 105 49
20. Dell 105 31
-5
0
5
10
15
20
25
12%
-2
21
12
21
11
23
13
10 years 15 years 20 years
Total Compound Annual Stockholder Return percent increaseIncludes reinvested dividends
5 years
WFC S&P 500®

2 3
• We expect that the first teammember a customer approacheswith a problem will take personalresponsibility for fixing it.
• More sales do not always resultin better service but betterservice almost always results in more sales.
Goal: Surprise and delightcustomers with such great service that they’ll recommend us to family, friends and business associates.
Evelyn LaneBusiness Banking, Wells Fargo Bank Everett, WashingtonTeam member since: 1986
0
20
40
60
80
100
80% 82
12/03 12/04
Retail Banking Customers (Served by Tellers) “Extremely Satisfied”* with Wells Fargo percent
Responses from 30,000 retail customers a month*4 or 5 rating (5: extremely satisfied)
0
20
40
60
80
100
77
84 87
02 03 04
Commercial Banking Customers Who Rate Our Service Very Good or Excellent percent
Responses from 1,900 middle-market customers, 2004
70%
01
Customer Service
Our product is service! Our value added isfinancial advice.The quality of our servicekeeps customers coming back for more.
0
20
40
60
80
100
78 76
80
02 03 04
Mortgage CustomerSatisfaction with Wells Fargo
81% 80
00 01
Percent who say they are satisfied “very much”with service when surveyed

2 4
Lonnie DafneyWells Fargo FinancialDes Moines, IowaTeam member since: 1992
2 5
Successful companies don’t improve theircommunities simply by writing checks — ittakes human capital and social capital, notjust financial capital, to make a meaningfuldifference. By combining the three, we’remaking a difference one by one — one teammember at a time, one customer at a time,one community at a time. Thousands of ourteam members are making that difference by giving their time, talent and resources tohelp our communities prosper and grow.We’re proud of their commitment—and we thank them for their generosity.
+24 Years of Involvement Wells Fargo team member Lonnie Dafney ofDes Moines, Iowa lives our company’s “Visionand Values”every single day. She’s beeninvolved with the Isiserettes Drill and DrumTeam since its founding in 1980. The team—performers of high-energy dance routines tothe beat of percussion instruments—giveslow-to-moderate income inner-city youththe opportunity to travel and experience life outside the inner city, helping build self-esteem and character.
A passionate dancer, Dafney joined theIsiserettes at age 11. Her mother was one of the team’s founders and is still involved.Dafney became an Isiserettes dance andmusic instructor 15 years ago, and today, inaddition to her job in human resources, shededicates up to 50 hours every month, andmany of her weekends to traveling with theteam, which performs in parades, communityevents, and half-time shows at sporting events.
Thanks to Dafney’s involvement, 60young people every year travel all over thecountry as ambassadors for the African-American community and Iowa, learningvaluable life lessons in diversity, moneymanagement and social skill building.
This year, Dafney and the Isiserettes won the $50,000 Wells Fargo Volunteer ServiceAward. She was one of 162 team membersawarded over $300,000 in grants for theirdesignated non-profits. “I encourage youngpeople to reach for places they would havenever dreamed of going,”says Dafney.“If I can do it, so can they.”
Dafney is just one of the thousands of Wells Fargo team members who are
supporting causes important to them.A few examples:• The past eleven years, 92,000 team
member-volunteers have given 3.2 millionhours to build or renovate 1,700 homeswith Habitat for Humanity.
• 3,000 team members have been trained to teach Wells Fargo’s financial literacycurriculum, Hands On Banking®, in schoolsand community groups.
• The past ten years, 250 team members have been awarded a fully paid VolunteerLeave. The total leave time granted was 800 months of volunteer service, or 139,360 hours.
• In 2004, 3,000 team members across the country participated in the annual “Week of Caring”by lending a hand at local community service agencies—tutoring school children, spending timewith home-bound elderly, serving meals at homeless shelters, or makingneighborhood improvements.
2 5
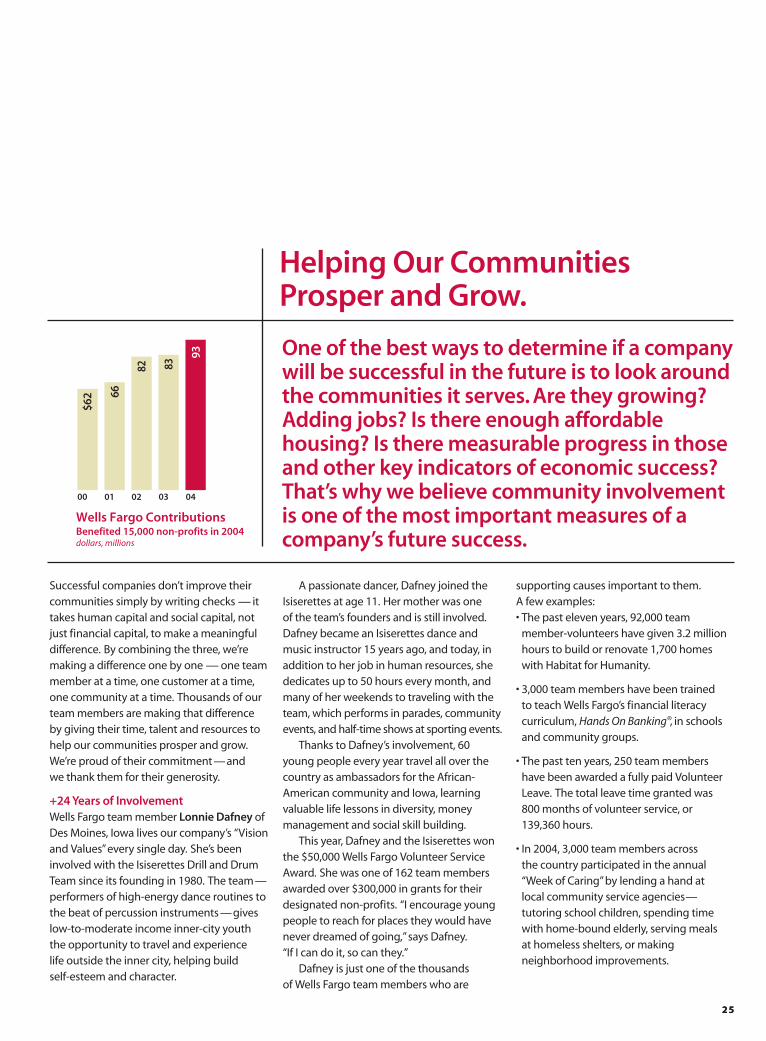
One of the best ways to determine if a company will be successful in the future is to look around the communities it serves. Are they growing?Adding jobs? Is there enough affordablehousing? Is there measurable progress in thoseand other key indicators of economic success?That’s why we believe community involvementis one of the most important measures of acompany’s future success.
0
20
40
60
80
100
$62 66
82 83
93
00 01 02 03 04
Wells Fargo ContributionsBenefited 15,000 non-profits in 2004dollars, millions
Helping Our Communities Prosper and Grow.

2 6
+ 900 Hispanic Adults at Five Financial Literacy Seminars Alfonso Castro was apprehensive when hedecided to attend a Wells Fargo financialliteracy seminar. In search of a job to supporthis family, he had to leave his wife and 13-year-old daughter behind in San PedroXalostoc Etepac, Mexico to come to theUnited States, where he found a restaurantjob in San Diego, California. At first he wasintimidated by banks, but he soon realizedhe needed to open an account to save for his daughter’s quinceanera (15th birthday celebration).
Castro attended a Spanish-languageworkshop on money management, one of a number of free, financial literacy seminarshosted by Wells Fargo in a variety oflanguages nationwide to help low-incomefamilies and immigrants manage theirmoney so they can save for college tuition,buy a home or start a business.
During the seminar, Castro met bilingualteam member Mariher Valenzuela. “Shereally took the time to understand my
financial goals,”said Castro, “and explain the process to me.”
The next week he opened checking,savings, and credit card accounts. SinceCastro works up to 80 hours each week, he often uses ATMs, and is now bankingthrough wellsfargo.com. His cousin andseveral friends also have opened accountswith Wells Fargo through Valenzuela.
Castro is not alone. He’s one of about 900Spanish-speaking customers who attendedfive financial literacy seminars in San Diegoin 2004.
+ 1,700 Children Served in 3 YearsEighth grader Steven Cantu (opposite page)faced the prospect of an uneventful summer— then he got the opportunity of his younglife. Cantu, who attends KingsboroughMiddle School in San Antonio, Texas, waschosen to participate in a summer basketballcamp sponsored by local non-profit SlamDunk for Life.
He might not have had this opportunity if it weren’t for Wells Fargo team memberRandy Fields. He’s a regional trust manager
for Private Client Services in San Antonio anda founding director and board member ofthe organization. Fields became involvedwith Slam Dunk in 2002 when asked by hispastor to lend a hand.
Some 31 inner-city middle schoolsparticipate in the program and kids whomake an effort to be good students can be nominated by their school. Campinstructors include some of the city’s premier high school basketball coaches and sports celebrities.
Fields spends several hours every weekmanaging the program, building relation-ships with schools and he helps coach andmentor children every summer.
Instructors at the week-long camp havetrained over 1,700 at-risk middle schoolchildren not just in basketball fundamentals,but important life skills such as goal setting,perseverance, teamwork and discipline.“I learned how to work together with others,"said Cantu. “I also learned how important it is to stay in school.”
Alfonso CastroCustomer Since: 2004San Diego, California

2 7
Randy FieldsWells Fargo Private Client ServicesSan Antonio, TexasTeam member since: 2002

2 82 8
Bruce H. Carpenter IIITeam member since: 2002
Stacy DiCianniTeam member since: 2003
Wayne WareTeam member since: 2002
Wells Fargo Home MortgagePensacola, Florida
2 92 9
$200,000 Contribution to the AmericanRed Cross Disaster Relief Fund In the summer of 2004, four devastatinghurricanes—Charley, Frances, Ivan andJeanne—pounded Florida. In the storms’path were more than 80 Wells Fargo HomeMortgage and Wells Fargo Financial stores,with more than 1,900 team membersacross the state.
The Wells Fargo Housing Foundationcontributed $200,000 to the American RedCross for disaster relief efforts. The financialsupport was very important but it was thecaring and commitment of our own teammembers on the ground that really made the difference.
When Ivan swept the coast in mid-September, team members BruceCarpenter, Stacy DiCianni and WayneWare were among 25 Home Mortgageteam members evacuated from theiroffices in Pensacola, Florida. For threeweeks, these hometown heroes helpedclear debris, repair roofs and deliverlunches to police officers working around the clock.
Carpenter borrowed generators from a friend in Atlanta to provide power andwater for his neighbors. Another teammember, Tracy Morgan-Frick, welcomedsix Marines to stay in her home for threedays, distributing supplies on behalf of the American Red Cross.
Back in their hurricane-damagedoffices, the team provided recovery aid to thousands of Wells Fargo customersaffected by the storms. One hundred HomeMortgage team members from across theU.S. volunteered to go to Florida to helpcustomers keep their mortgage loans ingood standing and help clean up debris.
“Everyone in the community cametogether,”said Carpenter. “In times like this, you don’t think twice about it—you just do it.”
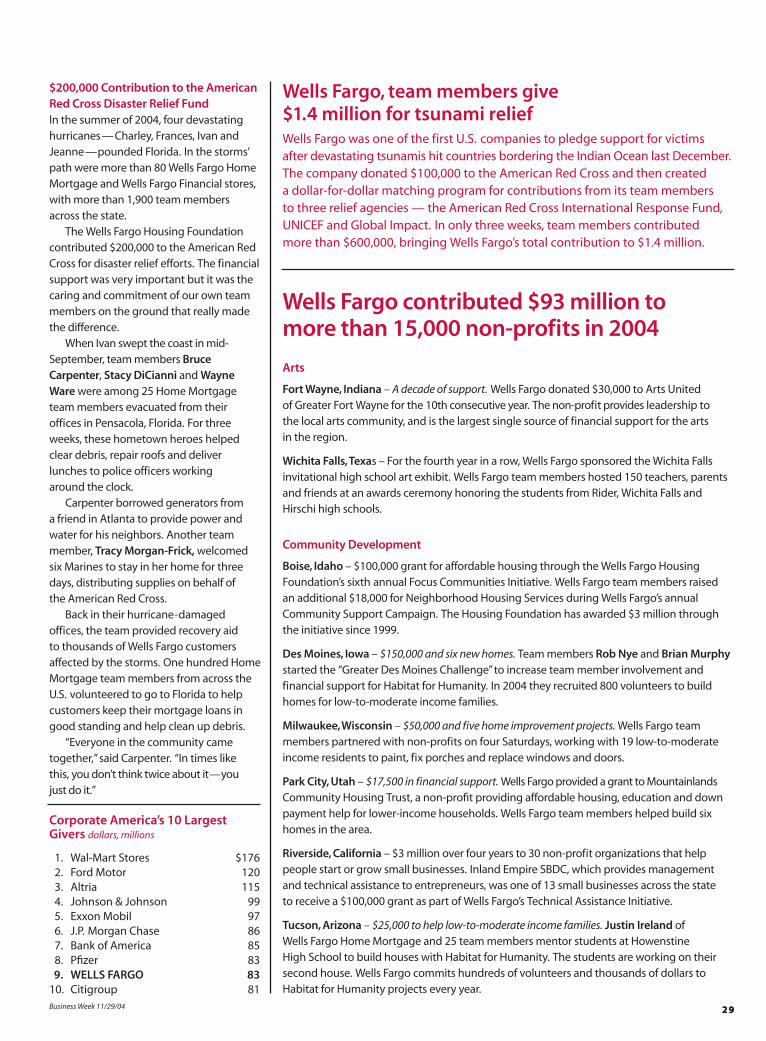
Wells Fargo contributed $93 million to more than 15,000 non-profits in 2004
Arts
Fort Wayne, Indiana – A decade of support. Wells Fargo donated $30,000 to Arts United of Greater Fort Wayne for the 10th consecutive year. The non-profit provides leadership to the local arts community, and is the largest single source of financial support for the arts in the region.
Wichita Falls,Texas – For the fourth year in a row, Wells Fargo sponsored the Wichita Fallsinvitational high school art exhibit. Wells Fargo team members hosted 150 teachers, parentsand friends at an awards ceremony honoring the students from Rider, Wichita Falls andHirschi high schools.
Community Development
Boise, Idaho – $100,000 grant for affordable housing through the Wells Fargo HousingFoundation’s sixth annual Focus Communities Initiative. Wells Fargo team members raised an additional $18,000 for Neighborhood Housing Services during Wells Fargo’s annualCommunity Support Campaign. The Housing Foundation has awarded $3 million throughthe initiative since 1999.
Des Moines, Iowa – $150,000 and six new homes. Team members Rob Nye and Brian Murphystarted the “Greater Des Moines Challenge”to increase team member involvement andfinancial support for Habitat for Humanity. In 2004 they recruited 800 volunteers to buildhomes for low-to-moderate income families.
Milwaukee,Wisconsin – $50,000 and five home improvement projects. Wells Fargo teammembers partnered with non-profits on four Saturdays, working with 19 low-to-moderateincome residents to paint, fix porches and replace windows and doors.
Park City, Utah – $17,500 in financial support. Wells Fargo provided a grant to MountainlandsCommunity Housing Trust, a non-profit providing affordable housing, education and downpayment help for lower-income households. Wells Fargo team members helped build sixhomes in the area.
Riverside, California – $3 million over four years to 30 non-profit organizations that helppeople start or grow small businesses. Inland Empire SBDC, which provides managementand technical assistance to entrepreneurs, was one of 13 small businesses across the state to receive a $100,000 grant as part of Wells Fargo’s Technical Assistance Initiative.
Tucson, Arizona – $25,000 to help low-to-moderate income families. Justin Ireland of Wells Fargo Home Mortgage and 25 team members mentor students at Howenstine High School to build houses with Habitat for Humanity. The students are working on theirsecond house. Wells Fargo commits hundreds of volunteers and thousands of dollars toHabitat for Humanity projects every year.
Wells Fargo, team members give $1.4 million for tsunami reliefWells Fargo was one of the first U.S. companies to pledge support for victims after devastating tsunamis hit countries bordering the Indian Ocean last December.The company donated $100,000 to the American Red Cross and then created a dollar-for-dollar matching program for contributions from its team members to three relief agencies — the American Red Cross International Response Fund,UNICEF and Global Impact. In only three weeks, team members contributed more than $600,000, bringing Wells Fargo’s total contribution to $1.4 million.
Corporate America’s 10 Largest Givers dollars, millions
1. Wal-Mart Stores $1762. Ford Motor 1203. Altria 1154. Johnson & Johnson 995. Exxon Mobil 976. J.P. Morgan Chase 867. Bank of America 858. Pfizer 839. WELLS FARGO 83
10. Citigroup 81Business Week 11/29/04
3 0
Education
Anchorage, Alaska – Seven years, 240students. Students at East High School workat their on-campus Wells Fargo banking storein exchange for class credit, gaining valuablecareer readiness and financial literacy skills.Twenty students participate every semester,managed by their teacher and Wells Fargostore manager, Bill Kaltschnee.
Los Angeles, California – $500,000 overthree years to help students at Manual ArtsHigh School prepare for college and career.Wells Fargo partnered with the University of Southern California and The FulfillmentFund, a non-profit helping underservedstudents attain higher education, to developthe “College Pathways Program,”providingcritical educational resources for studentswith average academic performance. Teammember Tom Booker serves on the board of directors.
Phoenix, Arizona – $150,000 to teachers in300 schools. Wells Fargo’s Teacher PartnerProgram awards up to $500 each to teachersfor special needs such as school supplies,musical instruments, field trips, andcomputer lab equipment. A panel of teammembers, school officials and communityleaders selects the winning teachers. Theprogram has awarded $1.2 million to Arizona schools since 1997.
Reno, Nevada – $1 million to build Wells Fargo Auditorium at University ofNevada, Reno. The auditorium will be part of the University’s Knowledge Center, a newcenter for community outreach programsand cultural presentations.
Sacramento, California – $500,000 as lead sponsor to support Sacramento HighSchool’s new School of Business, whichintroduces students to finance, economicdevelopment and community revitalization.Students receive financial literacy trainingand participate in business programs andWells Fargo team members mentor students.
San Francisco, California – $100,000 grant to44 schools. Mayor Gavin Newsom recognizedWells Fargo’s contribution by declaring“Wells Fargo’s Support for Schools Day”at acelebratory event. Fifty Wells Fargo teammembers attended.
Human Services
Albuquerque, New Mexico – 17 teammembers raised $4,400. Team members fromthe Wells Fargo Loan Servicing Center heldseveral fundraisers for the American CancerSociety’s Relay for Life. 13 team membersand their families, with sleeping bags in tow,walked in the 16-hour event.
Big Sandy, Montana – One community, 14 years involvement. Team member Dianna Webster is on the board of Big SandyRotary Club, the only civic organization inthe small rural community. Dianna and other Wells Fargo team members helped raise$20,000 for community programs, includinga summer camp for disadvantaged kids.
Denver, Colorado – $1 million grant to buildnew children’s hospital. Wells Fargo’scontribution to The Children’s Hospital fund-raising campaign was one of the hospital’slargest ever one-time contributions from apublic company. Team member David Kasperof Wells Fargo Private Client Services serveson the hospital’s board of directors.
Los Angeles, California – $500,000 to theUnited Way of Greater Los Angeles Bridgingthe Gap Fund, helping children and adultsbreak out of the cycle of poverty by
empowering them with basic skills andcritical resources — food, shelter andhealthcare. Regional President Laura Schulteis a board member; team membersvolunteer for a variety of United Way“Commitment to Caring”projects.
Omaha, Nebraska – $5,000 and 300 turkeydinners. Just two days before Thanksgiving,Wells Fargo came to the local Food Bank’s aid and provided turkey dinners and all thefixings to 300 families in need. Thirty teammembers packed and delivered 300 meals.Team members donated canned food during the Food Bank’s annual CorporateFood Drive.
Seattle,Washington – Five years of boardparticipation and $20,000 grant. Mike Foodyof Wells Fargo Private Client Services is onthe board of Treehouse, providing servicesto disadvantaged foster children. The grantsupported educational programs promotingself-esteem and confidence. Team membersraised an additional $14,000 to buy clothingand school supplies.
Sioux Falls, South Dakota – $6,500 raised for Make-A-Wish Foundation. Wells Fargoteam members held fundraisers to helpgrant the wish of a 2 1/2 year-old boy with a life-threatening illness. They sold holidayornaments, held a book fair, a silent auction,and a pancake breakfast.
Twin Cities, Minnesota – 35,000 homelessMinnesotans helped over 10 years. Wells Fargopartnered with Twin Cities Community VoiceMail to provide the phoneless, many lookingfor housing or jobs, with free voice mail. Teammembers Shari McGuire and Dave Kapalkaof Wells Fargo Services serve as boardmembers, and Wells Fargo has contributedover $33,500 since the partnership began in 1998.
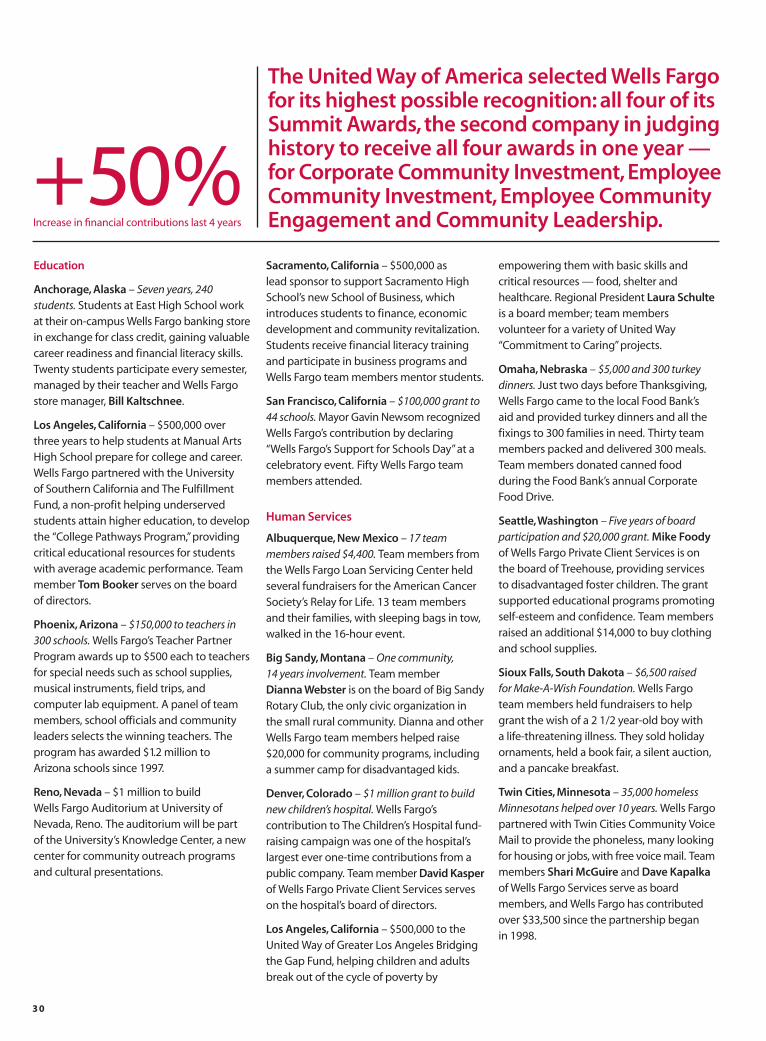
+50%Increase in financial contributions last 4 years
The United Way of America selected Wells Fargofor its highest possible recognition: all four of itsSummit Awards, the second company in judginghistory to receive all four awards in one year —for Corporate Community Investment, EmployeeCommunity Investment, Employee CommunityEngagement and Community Leadership.

3 1
Committees 1 Audit and Examination2 Credit 3 Finance 4 Governance and Nominating 5 Human Resources
Board of Directors Executive Officers and Corporate Staff
Paul R. Ackerman, SVP, Treasurer
Howard I. Atkins, EVP, Chief Financial Officer *
Patricia R. Callahan, EVP, Human Resources *
C. Webb Edwards, EVP, Technology and Operations *
John E. Ganoe, EVP, Corporate Development
Lawrence P. Haeg, EVP, Corporate Communications
Laurel A. Holschuh, SVP, Corporate Secretary
David A. Hoyt, Group EVP, Wholesale Banking *
Richard M. Kovacevich, Chairman, President, CEO *
Richard D. Levy, SVP, Controller *
Kevin McCabe, EVP, Chief Auditor
David J. Munio, EVP, Chief Credit Officer *
Mark C. Oman, Group EVP, Home and Consumer Finance Group *
Eric D. Shand, Chief Loan Examiner
Robert S. Strickland, SVP, Investor Relations
James M. Strother, EVP, General Counsel, Government Relations *
John G. Stumpf, Group EVP, Community Banking *
Carrie L. Tolstedt, Group EVP, Regional Banking *
* “Executive officers” according to Securities and Exchange Commission rules
J.A. Blanchard III 1, 2, 4
Chairman, ADC Telecommunications
Eden Prairie, Minnesota
(Communications equipment, services)
Susan E. Engel 2, 3, 5
Chairwoman, CEO
Department 56, Inc.
Eden Prairie, Minnesota
(Specialty retailer)
Enrique Hernandez, Jr. 1, 3
Chairman, CEO
Inter-Con Security Systems, Inc.
Pasadena, California
(Security services)
Robert L. Joss 2, 3
Philip H. Knight Professor and Dean
Stanford U. Graduate School of Business
Palo Alto, California
(Higher education)
Reatha Clark King 1, 3
Retired President, Board Chair
General Mills Foundation
Minneapolis, Minnesota
(Corporate foundation)
Richard M. Kovacevich
Chairman, President, CEO
Wells Fargo & Company
San Francisco, California
Richard D. McCormick 3, 5
Chairman Emeritus,
US WEST, Inc.
Denver, Colorado
(Communications)
Cynthia H. Milligan 1, 4
Dean, College of Business Administration
University of Nebraska – Lincoln
(Higher education)
Philip J. Quigley 1, 2, 4
Retired Chairman, President, CEO
Pacific Telesis Group
San Francisco, California
(Telecommunications)
Donald B. Rice 4, 5
Chairman, President, CEO
Agensys, Inc.
Santa Monica, California
(Biotechnology)
Judith M. Runstad 1, 3
Of Counsel
Foster Pepper & Shefelman PLLC
Seattle, Washington
(Law firm)
Stephen W. Sanger 3, 5
Chairman, CEO
General Mills, Inc.
Minneapolis, Minnesota
(Packaged foods)
Susan G. Swenson 1, 2, 4
Chief Operating Officer
T-Mobile USA, Inc.
Bellevue, Washington
(Wireless communications)
Michael W. Wright 2, 4, 5
Retired Chairman, CEO
SUPERVALU INC.
Eden Prairie, Minnesota
(Food distribution, retailing)

COMMUNITY BANKING
Group Head
John G. Stumpf
Regional Banking
Group Head
Carrie L. Tolstedt
Regional Presidents
Jon R. Campbell, Minnesota, North Dakota,South Dakota, Illinois, Indiana, Michigan,Wisconsin, Ohio
Debra J. Paterson, Metro Minnesota
Norbert J. Harrington, Greater Minnesota
J. Lanier Little, Illinois, Michigan, Wisconsin
Carl A. Miller, Jr., Indiana, Ohio
Daniel P. Murphy, South Dakota, North Dakota
Peter J. Fullerton, North Dakota
Paul W. “Chip” Carlisle, Texas
George W. Cone, Heart of Texas
John T. Gavin, Dallas-Fort Worth
Glenn V. Godkin, Houston
Don C. Kendrick Jr., Central Texas
Kenneth A. Telg, West Texas
Thomas W. Honig, Colorado, Montana, Utah,Wyoming
Joy N. Ott, Montana
Robert A. Hatch, Utah
Donald R. Sall, Greater Colorado
H. Lynn Horak, Iowa, Nebraska
J. Scott Johnson, Iowa
Kirk L. Kellner, Nebraska
James O. Prunty, Northwest
Alan V. Johnson, Oregon
J. Pat McMurray, Idaho
Richard Strutz, Alaska
Laura A. Schulte, California, Nevada, Border Banking
Michael F. Billeci, Greater San Francisco Bay Area
Nathan E. Christian, Southern California, Border Banking
Kirk V. Clausen, Nevada
William J. Dewhurst, Central California
Felix S. Fernandez, Northern California
Shelley Freeman, Los Angeles Metro
Lisa J. Stevens, San Francisco Metro
Robert D. Worth, California Business Banking
Kim M. Young, Orange County
Gerrit van Huisstede, Arizona, New Mexico
Gregory A. Winegardner, New Mexico
Business Banking Support Group
Timothy J. Coughlon
Marketing
Sylvia L. Reynolds
Retail Insurance Group
Peter J. Wissinger
Michael E. Connealy, Rural Community Insurance Services
Steven Veno, Wells Fargo Insurance
Consumer, Business, Investment Internet Services
Avid Modjtabai
Private Client Services
Group Head
Clyde W. Ostler
Lance P. Fox, Credit Administration
Jay S. Welker, Regional Management
Regional Managing Directors
Anne D. Copeland, Northern California,Central California, Nevada
Richard D. Byrd, Los Angeles County
James Cimino, Southern California, Orange County, Arizona
Joe W. Defur, Washington, Oregon, Idaho,Alaska
David J. Kasper, Colorado, Utah, Montana,Wyoming
Russell A. LaBrasca, Texas, New Mexico
David J. Pittman, Illinois, Iowa, Nebraska
Timothy N. Traudt, Minnesota, North Dakota,South Dakota, Wisconsin, Illinois, Indiana,Ohio, Michigan
Tracey B. Warson, Bay Area
Diversified Products Group
Group Head
Michael R. James
Marc L. Bernstein, Business Direct Lending
Louis M. Cosso, Auto Finance
Jerry E. Gray, SBA Lending
Michael T. Borchert, Payroll Services
Rebecca L. Macieira-Kaufmann, Small Business Segment
Kevin A. Rhein, Wells Fargo Card Services
Debra B. Rossi, Online Merchant Services
Jon A. Veenis, Education Finance Services
Donald W. Weber, Merchant Services
Wells Fargo Services
Group Head
C. Webb Edwards
Kevin B. Dabney, Payment Strategies Group
Kerri P. Grosslight, Enterprise SharedServices
Victor K. Nichols, Technology Infrastructure
Michael D. Noble, Operations
Anthony M. Padinha, Group Technology
Diana L. Starcher, Customer Service and Sales
HOME AND CONSUMER FINANCE
Group Head
Mark C. Oman
Wells Fargo Home Mortgage
Michael J. Heid, Division President, CapitalMarkets, Finance and Administration
Cara K. Heiden, Division President, National Consumer Lending andInstitutional Lending
Susan A. Davis, Centralized Retail/Retail Administration
Michael Lepore, Institutional Lending
Consumer Credit Group
Doreen Woo Ho, Division President
Brian J. Bartlett, Corporate Trust
John W. Barton, Regional Banking
Scott Gable, Personal Credit Management
Meheriar M. Hasan, Direct to Consumer
Kathleen L. Vaughan, Equity Direct andInstitutional Lending
Wells Fargo Financial, Inc.
Thomas P. Shippee, CEO, President
Greg M. Janasko, Commercial Business
David R. Kvamme, Consumer Business
Gary D. Lorenz, Auto Business
Oriol Segarra, Caribbean Consumer
Jaime Marti, Caribbean Auto
WHOLESALE BANKING
Group Head
David A. Hoyt
Credit Adminsitration
Thomas J. Davis, Real Estate
Michael J. Loughlin, Commercial/Corporate
Commercial Banking
Iris S. Chan
John C. Adams, Northern California
JoAnn N. Bertges, Central California
Robert A. Chereck, Texas
Albert F. (Rick) Ehrke, Southern California
Mark D. Howell, Intermountain/Southwest
Paul D. Kalsbeek, Southeast
Edmund O. Lelo, Greater Los Angeles
Perry G. Pelos, Midwest
John V. Rindlaub, Pacific Northwest
Specialized Financial Services
Timothy J. Sloan
J. Edward Blakey, Commercial MortgageGroup
Richard P. Ferris, Corporate Banking,Shareowner Services
John P. Hullar, Wells Fargo Securities
Jay Kornmayer, Gaming
Mark L. Myers, Real Estate MerchantBanking, Homebuilder Finance
J. Michael Johnson, Financial Sponsors,Leveraged, Media and Mezzanine Finance,Distribution
James R. Renner, Wells Fargo EquipmentFinance
David J. Weber, Securities Investment Group
Real Estate
A. Larry Chapman
Charles H. Fedalen, Jr., SouthernCalifornia/Southwest
Shirley O. Griffin, Real Estate PortfolioServices
Christopher J. Jordan, Mid-Atlantic/New England
Robin W. Michel, NorthernCalifornia/Northwest
James H. Muir, Eastern/Midwest
Stephen P. Prinz, Central/Texas
International and Insurance Services
David J. Zuercher
Ronald A. Caton, Global CorrespondentBanking
Kevin W. Conboy, Acordia
Peter P. Connolly, Foreign Exchange/International Financial Services
Sanjiv S. Sanghvi, Wells Fargo HSBC Trade Bank
Asset-Based Lending
John F. Nickoll
Peter E. Schwab, Wells Fargo Foothill
Henry K. Jordan, Wells Fargo Foothill
Thomas Pizzo, Wells Fargo Century
Martin J. McKinley, Wells Fargo BusinessCredit
Jeffrey T. Nikora, Alternative InvestmentManagement
Eastdil Realty Company, LLC
Benjamin V. Lambert, Chairman, CEO
Roy H. March, President
Institutional Investment Services
Michael J. Niedermeyer
Robert W. Bissell, Wells Capital Management
James W. Paulsen, Wells Capital Management
John S. McCune, Institutional Brokerage
Laurie B. Nordquist, Institutional Trust Group
Karla M. Rabusch, Wells Fargo Funds
Wholesale Services
Stephen M. Ellis
Norwest Equity Partners
John E. Lindahl, Managing Partner
Norwest Venture Partners
Promod Haque, Managing Partner
Senior Business Officers
3 2

Financial Review
34 Overview
38 Critical Accounting Policies
41 Earnings Performance41 Net Interest Income44 Noninterest Income45 Noninterest Expense45 Operating Segment Results
46 Balance Sheet Analysis46 Securities Available for Sale
(table on page 72)46 Loan Portfolio (table on page 74)46 Deposits
47 Off-Balance Sheet Arrangements andAggregate Contractual Obligations
47 Off-Balance Sheet Arrangements,Variable Interest Entities, Guarantees and Other Commitments
48 Contractual Obligations48 Transactions with Related Parties
48 Risk Management48 Credit Risk Management Process49 Nonaccrual Loans and Other Assets50 Loans 90 Days or More Past Due
and Still Accruing50 Allowance for Credit Losses
(table on page 75)50 Asset/Liability and
Market Risk Management51 Interest Rate Risk
51 Mortgage Banking Interest Rate Risk52 Market Risk – Trading Activities52 Market Risk – Equity Markets53 Liquidity and Funding
54 Capital Management
54 Comparison of 2003 with 2002
55 Factors That May Affect Future Results
59 Additional Information
60 Controls and Procedures
60 Disclosure Controls and Procedures
60 Internal Control over Financial Reporting
60 Management’s Report on Internal Controlover Financial Reporting
61 Report of Independent Registered PublicAccounting Firm
Financial Statements
62 Consolidated Statement of Income
63 Consolidated Balance Sheet
64 Consolidated Statement of Changes in Stockholders’ Equity and Comprehensive Income
65 Consolidated Statement of Cash Flows
66 Notes to Financial Statements
112 Report of Independent RegisteredPublic Accounting Firm
113 Quarterly Financial Data
115 Glossary
33
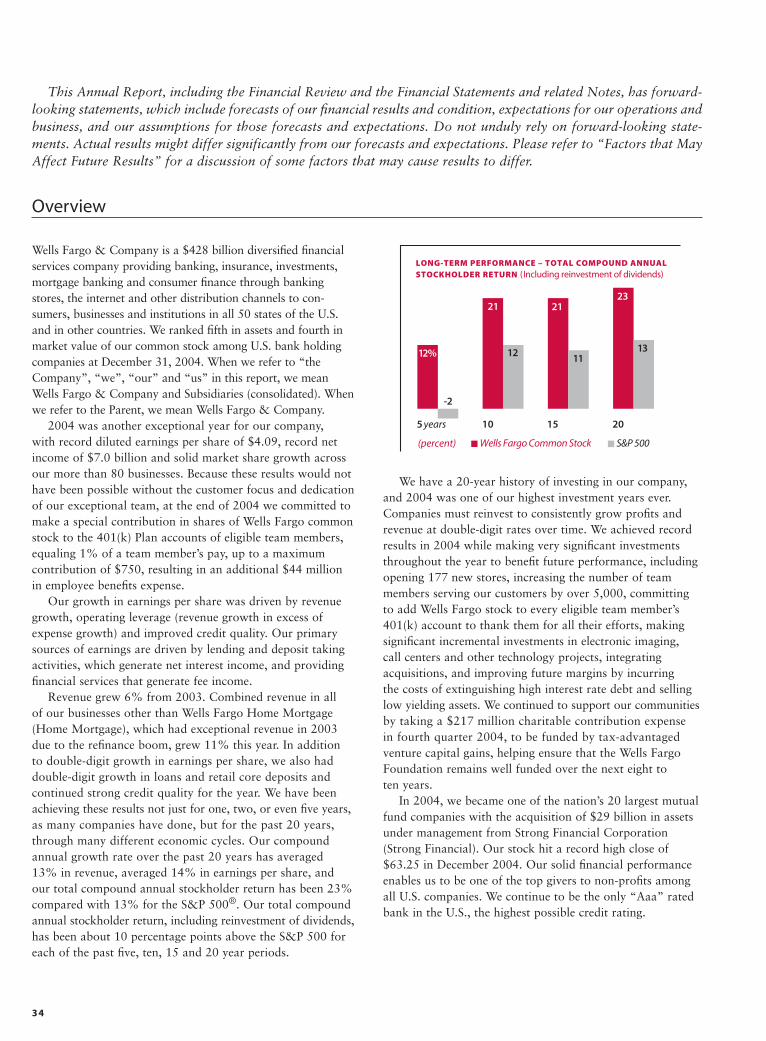
34
Wells Fargo & Company is a $428 billion diversified financialservices company providing banking, insurance, investments,mortgage banking and consumer finance through bankingstores, the internet and other distribution channels to con-sumers, businesses and institutions in all 50 states of the U.S.and in other countries. We ranked fifth in assets and fourth inmarket value of our common stock among U.S. bank holdingcompanies at December 31, 2004. When we refer to “theCompany”, “we”, “our” and “us” in this report, we meanWells Fargo & Company and Subsidiaries (consolidated). Whenwe refer to the Parent, we mean Wells Fargo & Company.
2004 was another exceptional year for our company, with record diluted earnings per share of $4.09, record netincome of $7.0 billion and solid market share growth acrossour more than 80 businesses. Because these results would nothave been possible without the customer focus and dedicationof our exceptional team, at the end of 2004 we committed tomake a special contribution in shares of Wells Fargo commonstock to the 401(k) Plan accounts of eligible team members,equaling 1% of a team member’s pay, up to a maximum contribution of $750, resulting in an additional $44 million in employee benefits expense.
Our growth in earnings per share was driven by revenuegrowth, operating leverage (revenue growth in excess ofexpense growth) and improved credit quality. Our primarysources of earnings are driven by lending and deposit takingactivities, which generate net interest income, and providingfinancial services that generate fee income.
Revenue grew 6% from 2003. Combined revenue in all of our businesses other than Wells Fargo Home Mortgage(Home Mortgage), which had exceptional revenue in 2003due to the refinance boom, grew 11% this year. In addition to double-digit growth in earnings per share, we also haddouble-digit growth in loans and retail core deposits and continued strong credit quality for the year. We have beenachieving these results not just for one, two, or even five years,as many companies have done, but for the past 20 years,through many different economic cycles. Our compoundannual growth rate over the past 20 years has averaged 13% in revenue, averaged 14% in earnings per share, and our total compound annual stockholder return has been 23%compared with 13% for the S&P 500®. Our total compoundannual stockholder return, including reinvestment of dividends,has been about 10 percentage points above the S&P 500 foreach of the past five, ten, 15 and 20 year periods.
We have a 20-year history of investing in our company,and 2004 was one of our highest investment years ever.Companies must reinvest to consistently grow profits andrevenue at double-digit rates over time. We achieved recordresults in 2004 while making very significant investmentsthroughout the year to benefit future performance, includingopening 177 new stores, increasing the number of teammembers serving our customers by over 5,000, committingto add Wells Fargo stock to every eligible team member’s401(k) account to thank them for all their efforts, makingsignificant incremental investments in electronic imaging, call centers and other technology projects, integrating acquisitions, and improving future margins by incurring the costs of extinguishing high interest rate debt and sellinglow yielding assets. We continued to support our communitiesby taking a $217 million charitable contribution expense in fourth quarter 2004, to be funded by tax-advantaged venture capital gains, helping ensure that the Wells FargoFoundation remains well funded over the next eight to ten years.
In 2004, we became one of the nation’s 20 largest mutualfund companies with the acquisition of $29 billion in assetsunder management from Strong Financial Corporation(Strong Financial). Our stock hit a record high close of$63.25 in December 2004. Our solid financial performanceenables us to be one of the top givers to non-profits amongall U.S. companies. We continue to be the only “Aaa” ratedbank in the U.S., the highest possible credit rating.
Overview
This Annual Report, including the Financial Review and the Financial Statements and related Notes, has forward-looking statements, which include forecasts of our financial results and condition, expectations for our operations andbusiness, and our assumptions for those forecasts and expectations. Do not unduly rely on forward-looking state-ments. Actual results might differ significantly from our forecasts and expectations. Please refer to “Factors that MayAffect Future Results” for a discussion of some factors that may cause results to differ.
-5
0
5
10
15
20
25
12%
-2
21
12
21
11
23
13
10 15 205 years
(percent) Wells Fargo Common Stock S&P 500
LONG-TERM PERFORMANCE – TOTAL COMPOUND ANNUAL STOCKHOLDER RETURN (Including reinvestment of dividends)
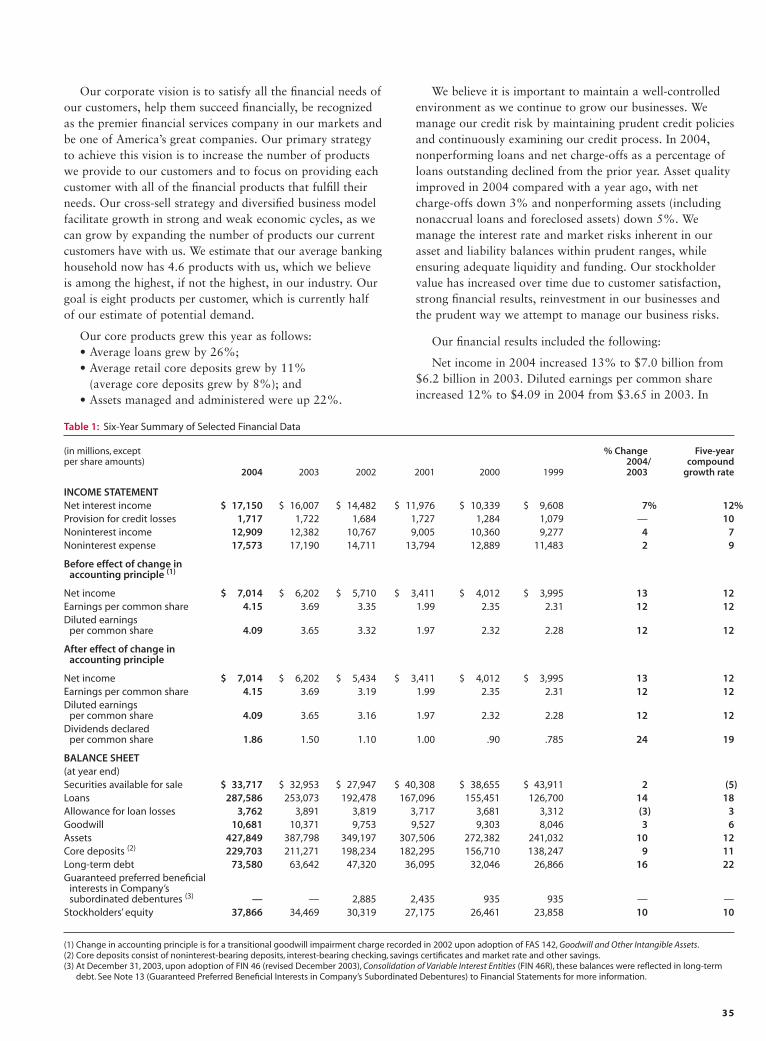
35
Our corporate vision is to satisfy all the financial needs ofour customers, help them succeed financially, be recognizedas the premier financial services company in our markets andbe one of America’s great companies. Our primary strategyto achieve this vision is to increase the number of productswe provide to our customers and to focus on providing eachcustomer with all of the financial products that fulfill theirneeds. Our cross-sell strategy and diversified business modelfacilitate growth in strong and weak economic cycles, as wecan grow by expanding the number of products our currentcustomers have with us. We estimate that our average bankinghousehold now has 4.6 products with us, which we believe is among the highest, if not the highest, in our industry. Ourgoal is eight products per customer, which is currently half of our estimate of potential demand.
Our core products grew this year as follows: • Average loans grew by 26%;• Average retail core deposits grew by 11%
(average core deposits grew by 8%); and• Assets managed and administered were up 22%.
We believe it is important to maintain a well-controlledenvironment as we continue to grow our businesses. Wemanage our credit risk by maintaining prudent credit policiesand continuously examining our credit process. In 2004,nonperforming loans and net charge-offs as a percentage ofloans outstanding declined from the prior year. Asset qualityimproved in 2004 compared with a year ago, with netcharge-offs down 3% and nonperforming assets (includingnonaccrual loans and foreclosed assets) down 5%. We manage the interest rate and market risks inherent in ourasset and liability balances within prudent ranges, whileensuring adequate liquidity and funding. Our stockholdervalue has increased over time due to customer satisfaction,strong financial results, reinvestment in our businesses andthe prudent way we attempt to manage our business risks.
Our financial results included the following:
Net income in 2004 increased 13% to $7.0 billion from$6.2 billion in 2003. Diluted earnings per common shareincreased 12% to $4.09 in 2004 from $3.65 in 2003. In
Table 1: Six-Year Summary of Selected Financial Data
(in millions, except % Change Five-yearper share amounts) 2004/ compound
2004 2003 2002 2001 2000 1999 2003 growth rate
INCOME STATEMENTNet interest income $ 17,150 $ 16,007 $ 14,482 $ 11,976 $ 10,339 $ 9,608 7% 12%Provision for credit losses 1,717 1,722 1,684 1,727 1,284 1,079 — 10Noninterest income 12,909 12,382 10,767 9,005 10,360 9,277 4 7Noninterest expense 17,573 17,190 14,711 13,794 12,889 11,483 2 9
Before effect of change in accounting principle (1)
Net income $ 7,014 $ 6,202 $ 5,710 $ 3,411 $ 4,012 $ 3,995 13 12Earnings per common share 4.15 3.69 3.35 1.99 2.35 2.31 12 12Diluted earnings
per common share 4.09 3.65 3.32 1.97 2.32 2.28 12 12
After effect of change in accounting principle
Net income $ 7,014 $ 6,202 $ 5,434 $ 3,411 $ 4,012 $ 3,995 13 12Earnings per common share 4.15 3.69 3.19 1.99 2.35 2.31 12 12Diluted earnings
per common share 4.09 3.65 3.16 1.97 2.32 2.28 12 12Dividends declared
per common share 1.86 1.50 1.10 1.00 .90 .785 24 19
BALANCE SHEET(at year end)Securities available for sale $ 33,717 $ 32,953 $ 27,947 $ 40,308 $ 38,655 $ 43,911 2 (5)Loans 287,586 253,073 192,478 167,096 155,451 126,700 14 18Allowance for loan losses 3,762 3,891 3,819 3,717 3,681 3,312 (3) 3Goodwill 10,681 10,371 9,753 9,527 9,303 8,046 3 6Assets 427,849 387,798 349,197 307,506 272,382 241,032 10 12Core deposits (2) 229,703 211,271 198,234 182,295 156,710 138,247 9 11Long-term debt 73,580 63,642 47,320 36,095 32,046 26,866 16 22Guaranteed preferred beneficial
interests in Company’ssubordinated debentures (3) — — 2,885 2,435 935 935 — —
Stockholders’ equity 37,866 34,469 30,319 27,175 26,461 23,858 10 10
(1) Change in accounting principle is for a transitional goodwill impairment charge recorded in 2002 upon adoption of FAS 142, Goodwill and Other Intangible Assets.(2) Core deposits consist of noninterest-bearing deposits, interest-bearing checking, savings certificates and market rate and other savings.(3) At December 31, 2003, upon adoption of FIN 46 (revised December 2003), Consolidation of Variable Interest Entities (FIN 46R), these balances were reflected in long-term
debt. See Note 13 (Guaranteed Preferred Beneficial Interests in Company’s Subordinated Debentures) to Financial Statements for more information.
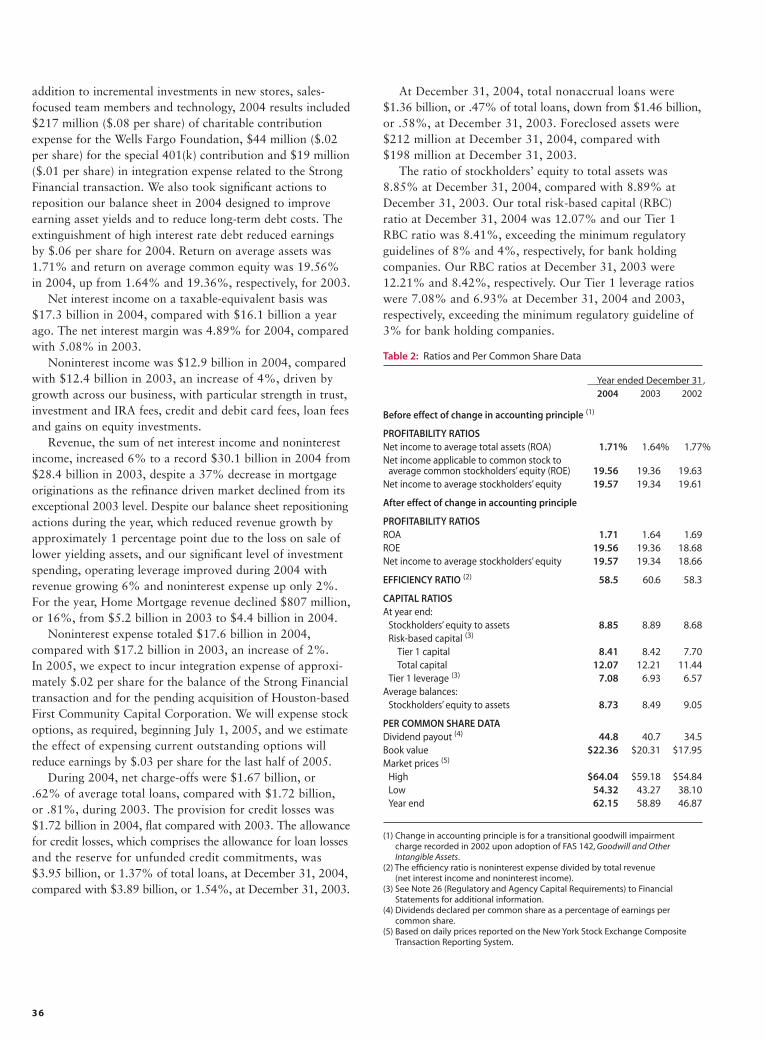
36
addition to incremental investments in new stores, sales-focused team members and technology, 2004 results included$217 million ($.08 per share) of charitable contributionexpense for the Wells Fargo Foundation, $44 million ($.02per share) for the special 401(k) contribution and $19 million($.01 per share) in integration expense related to the StrongFinancial transaction. We also took significant actions toreposition our balance sheet in 2004 designed to improveearning asset yields and to reduce long-term debt costs. Theextinguishment of high interest rate debt reduced earnings by $.06 per share for 2004. Return on average assets was1.71% and return on average common equity was 19.56%in 2004, up from 1.64% and 19.36%, respectively, for 2003.
Net interest income on a taxable-equivalent basis was$17.3 billion in 2004, compared with $16.1 billion a yearago. The net interest margin was 4.89% for 2004, comparedwith 5.08% in 2003.
Noninterest income was $12.9 billion in 2004, comparedwith $12.4 billion in 2003, an increase of 4%, driven bygrowth across our business, with particular strength in trust,investment and IRA fees, credit and debit card fees, loan feesand gains on equity investments.
Revenue, the sum of net interest income and noninterestincome, increased 6% to a record $30.1 billion in 2004 from$28.4 billion in 2003, despite a 37% decrease in mortgageoriginations as the refinance driven market declined from itsexceptional 2003 level. Despite our balance sheet repositioningactions during the year, which reduced revenue growth byapproximately 1 percentage point due to the loss on sale oflower yielding assets, and our significant level of investmentspending, operating leverage improved during 2004 with revenue growing 6% and noninterest expense up only 2%.For the year, Home Mortgage revenue declined $807 million,or 16%, from $5.2 billion in 2003 to $4.4 billion in 2004.
Noninterest expense totaled $17.6 billion in 2004, compared with $17.2 billion in 2003, an increase of 2%. In 2005, we expect to incur integration expense of approxi-mately $.02 per share for the balance of the Strong Financialtransaction and for the pending acquisition of Houston-basedFirst Community Capital Corporation. We will expense stockoptions, as required, beginning July 1, 2005, and we estimatethe effect of expensing current outstanding options willreduce earnings by $.03 per share for the last half of 2005.
During 2004, net charge-offs were $1.67 billion, or .62% of average total loans, compared with $1.72 billion, or .81%, during 2003. The provision for credit losses was$1.72 billion in 2004, flat compared with 2003. The allowancefor credit losses, which comprises the allowance for loan lossesand the reserve for unfunded credit commitments, was$3.95 billion, or 1.37% of total loans, at December 31, 2004,compared with $3.89 billion, or 1.54%, at December 31, 2003.
At December 31, 2004, total nonaccrual loans were $1.36 billion, or .47% of total loans, down from $1.46 billion,or .58%, at December 31, 2003. Foreclosed assets were$212 million at December 31, 2004, compared with $198 million at December 31, 2003.
The ratio of stockholders’ equity to total assets was8.85% at December 31, 2004, compared with 8.89% atDecember 31, 2003. Our total risk-based capital (RBC) ratio at December 31, 2004 was 12.07% and our Tier 1RBC ratio was 8.41%, exceeding the minimum regulatoryguidelines of 8% and 4%, respectively, for bank holdingcompanies. Our RBC ratios at December 31, 2003 were12.21% and 8.42%, respectively. Our Tier 1 leverage ratioswere 7.08% and 6.93% at December 31, 2004 and 2003,respectively, exceeding the minimum regulatory guideline of3% for bank holding companies.
Table 2: Ratios and Per Common Share Data
Year ended December 31,2004 2003 2002
Before effect of change in accounting principle (1)
PROFITABILITY RATIOSNet income to average total assets (ROA) 1.71% 1.64% 1.77%Net income applicable to common stock to
average common stockholders’ equity (ROE) 19.56 19.36 19.63Net income to average stockholders’ equity 19.57 19.34 19.61
After effect of change in accounting principle
PROFITABILITY RATIOSROA 1.71 1.64 1.69ROE 19.56 19.36 18.68Net income to average stockholders’ equity 19.57 19.34 18.66
EFFICIENCY RATIO (2) 58.5 60.6 58.3
CAPITAL RATIOSAt year end:
Stockholders’ equity to assets 8.85 8.89 8.68Risk-based capital (3)
Tier 1 capital 8.41 8.42 7.70Total capital 12.07 12.21 11.44
Tier 1 leverage (3) 7.08 6.93 6.57Average balances:
Stockholders’ equity to assets 8.73 8.49 9.05
PER COMMON SHARE DATADividend payout (4) 44.8 40.7 34.5Book value $22.36 $20.31 $17.95Market prices (5)
High $64.04 $59.18 $54.84Low 54.32 43.27 38.10Year end 62.15 58.89 46.87
(1) Change in accounting principle is for a transitional goodwill impairmentcharge recorded in 2002 upon adoption of FAS 142, Goodwill and OtherIntangible Assets.
(2) The efficiency ratio is noninterest expense divided by total revenue (net interest income and noninterest income).
(3) See Note 26 (Regulatory and Agency Capital Requirements) to FinancialStatements for additional information.
(4) Dividends declared per common share as a percentage of earnings per common share.
(5) Based on daily prices reported on the New York Stock Exchange CompositeTransaction Reporting System.
37
Recent Accounting StandardsOn December 8, 2003, President Bush signed the MedicarePrescription Drug, Improvement and Modernization Act of 2003 (the Act). The Act introduces a prescription drug benefit under Medicare as well as a federal subsidy to plansponsors that provide a benefit that is at least equivalent toMedicare. Specific authoritative guidance on the accountingfor the federal subsidy has been issued through the FinancialAccounting Standards Board (FASB) Staff Position 106-2(FSP 106-2), Accounting and Disclosure RequirementsRelated to the Medicare Prescription Drug, Improvementand Modernization Act of 2003, which was issued inMay 2004. We adopted FSP 106-2 prospectively effectiveJuly 1, 2004, and the adoption did not have a materialimpact on either our accumulated postretirement benefitobligation or our net periodic postretirement benefit costduring 2004.
On December 12, 2003, the Accounting StandardsExecutive Committee of the American Institute of CertifiedPublic Accountants issued Statement of Position 03-3 (SOP 03-3), Accounting for Certain Loans or Debt SecuritiesAcquired in a Transfer, which addresses the accounting forcertain loans acquired in a transfer when it is probable, atacquisition, that the investor will be unable to collect all contractually required payments receivable. SOP 03-3 isapplied prospectively, effective for loans acquired beginningJanuary 1, 2005. SOP 03-3 requires acquired loans with evidence of credit deterioration to be recorded at fair valueand prohibits recording any valuation allowance related tosuch loans at the time of purchase. This SOP limits the yieldthat may be accreted on such loans to the excess of theinvestor’s estimated cash flows over its initial investment inthe loan. Subsequent increases in cash flows expected to becollected are recognized prospectively through adjustment of the loan’s yield over its remaining life. Decreases in cashflows expected to be collected are recognized as impairment.Mortgage loans held for sale and loans to borrowers in goodstanding under revolving credit agreements are excludedfrom the scope of SOP 03-3.
On July 16, 2004, the FASB ratified the decisions reached by the Emerging Issues Task Force (EITF) withrespect to Issue No. 02-14 (EITF 02-14), Whether the EquityMethod of Accounting Applies When an Investor Does Not Have an Investment in Voting Stock of an Investee but Exercises Significant Influence through Other Means.The EITF reached a consensus that an investor should applythe equity method of accounting when it has investments ineither common stock or “in-substance common stock” of a corporation, provided that the investor has the ability toexercise significant influence over the operating and financialpolicies of the investee. In-substance common stock, as definedin the consensus, is an investment that has risk and reward
characteristics, among other factors, that are substantiallythe same as common stock. We adopted the consensusreached in EITF 02-14 during 2004 and the adoption didnot have a material effect on our financial statements.
On October 13, 2004, the FASB ratified the consensusreached by the EITF at its September 29–30 and June 30–July 1meetings with respect to Issue No. 04-8 (EITF 04-8), TheEffect of Contingently Convertible Instruments on DilutedEarnings Per Share. This consensus requires instruments withcontingent conversion features that are based on the marketprice of an entity’s own stock, even though the market pricetrigger has not been met, to be included in the computationof diluted earnings per share. EITF 04-8 became effective for periods ending after December 15, 2004. However, thedetermination of the dilutive effect upon adoption of EITF04-8, if any, is based on the form of the instrument thatexisted at December 31, 2004.
In November 2004, we amended the indenture underwhich the Company’s Floating Rate Convertible SeniorDebentures due 2033 (the Debentures) were issued to elimi-nate a provision in the indenture that prohibited us frompaying cash upon conversion of the Debentures if an eventof default, as defined in the indenture, exists at the time ofconversion. We then made an irrevocable election under theindenture that obligates us to deliver, upon conversion of theDebentures, cash in an amount equal to at least the originalprincipal amount of the converted Debentures and cash orcommon stock or a combination of cash and common stockfor any amount in excess of such original principal amount.As a result of these actions, none of the shares of commonstock underlying the Debentures currently would be consideredoutstanding for the purposes of calculating diluted earningsper share under EITF 04-8.
On December 16, 2004, the FASB issued Statement ofFinancial Accounting Standards No. 123 (revised 2004),Share-Based Payment (FAS 123R), which replaces FAS 123,Accounting for Stock-Based Compensation, and supersedesAccounting Principles Board Opinion No. 25, Accounting forStock Issued to Employees. The scope of FAS 123R includesa wide range of stock-based compensation arrangementsincluding stock options, restricted stock plans, performance-based awards, stock appreciation rights, and employee stockpurchase plans. FAS 123R requires us to measure the costof employee services received in exchange for an award ofequity instruments based on the fair value of the award onthe grant date. That cost must be recognized in the incomestatement over the vesting period of the award. Because market prices are generally not available for most employeestock options, the grant-date fair value must be estimatedusing an option-pricing model. FAS 123R applies to allawards granted after July 1, 2005 and to awards modified,repurchased, or cancelled after July 1, 2005. We will adopt
38
Critical Accounting Policies
Our significant accounting policies (described in Note 1(Summary of Significant Accounting Policies) to FinancialStatements) are fundamental to understanding our results ofoperations and financial condition, because some accountingpolicies require that we use estimates and assumptions thatmay affect the value of our assets or liabilities and financialresults. Three of these policies are critical because they requiremanagement to make difficult, subjective and complex judgments about matters that are inherently uncertain andbecause it is likely that materially different amounts wouldbe reported under different conditions or using differentassumptions. These policies govern the allowance for creditlosses, the valuation of mortgage servicing rights and pensionaccounting. Management has reviewed and approved thesecritical accounting policies and has discussed these policieswith the Audit and Examination Committee.
Allowance for Credit LossesThe allowance for credit losses, which comprises theallowance for loan losses and the reserve for unfunded credit commitments, is management’s estimate of credit lossesinherent in the loan portfolio at the balance sheet date. Wehave an established process, using several analytical toolsand benchmarks, to calculate a range of possible outcomesand determine the adequacy of the allowance. No single statistic or measurement determines the adequacy of theallowance. Loan recoveries and the provision for credit losses increase the allowance, while loan charge-offs decrease the allowance.
PROCESS TO DETERMINE THE ADEQUACY OF THE ALLOWANCE
FOR CREDIT LOSSES
For analytical purposes only, we allocate a portion of theallowance to specific loan categories (the allocated allowance).The entire allowance (both allocated and unallocated), however,is used to absorb credit losses inherent in the total loan portfolio.
Approximately two-thirds of the allocated allowance is determined at a pooled level for retail loan portfolios (consumer loans and leases, home mortgage loans and some segments of small business loans). We use forecasting models to measure the losses inherent in these portfolios. We frequently validate and update these models to capturethe recent behavioral characteristics of the portfolios, as wellas any changes in our loss mitigation or marketing strategies.
We use a standardized loan grading process for wholesaleloan portfolios (commercial loans, commercial real estateand construction loans and leases). Based on this process, we assign a loss factor to each pool of graded loans and aloan equivalent amount of unfunded loan commitments andletters of credit. For graded loans with evidence of creditweakness at the balance sheet date, the loss factors arederived from migration models that track loss content associated with actual portfolio movements between loangrades over a specified period of time. For graded loanswithout evidence of credit weakness at the balance sheetdate, we use a combination of our long-term average lossexperience and external loss data. In addition, we individuallyreview nonperforming loans over $3 million for impairmentbased on cash flows or collateral. We include the impairmenton nonperforming loans in the allocated allowance unless ithas already been recognized as a loss.
The allocated allowance is supplemented by the unallocatedallowance to adjust for imprecision and to incorporate therange of probable outcomes inherent in estimates used forthe allocated allowance. The unallocated allowance is theresult of our judgment of risks inherent in the portfolio, economic uncertainties, historical loss experience and othersubjective factors, including industry trends, not reflected inthe allocated allowance.
The ratios of the allocated allowance and the unallocatedallowance to the total allowance may change from period toperiod. The total allowance reflects management’s estimateof credit losses inherent in the loan portfolio at the balancesheet date.
The allowance for credit losses, and the resulting provi-sion, is based on judgments and assumptions, including(1) general economic conditions, (2) loan portfolio composition,(3) loan loss experience, (4) management’s evaluation of the credit risk relating to pools of loans and individual borrowers, (5) sensitivity analysis and expected loss modelsand (6) observations from our internal auditors, internalloan review staff or our banking regulators.
To estimate the possible range of allowance required atDecember 31, 2004, and the related change in provisionexpense, we assumed the following scenarios of a reasonablypossible deterioration or improvement in loan credit quality.
FAS 123R effective July 1, 2005, as required, and will usethe “modified prospective” transition method. Under thismethod, awards that are granted, modified, or settled afterJuly 1, 2005, will be measured and accounted for in accor-dance with FAS 123R. In addition, beginning July 1, 2005,expense must be recognized in the income statement for
unvested awards that were granted prior to July 1, 2005.The expense will be based on the fair value determined atgrant date under FAS 123. We estimate that our earnings per share in the second half of 2005 will be reduced by $.03 as a result of implementing FAS 123R.
39
Assumptions for deterioration in loan credit quality were:• For retail loans, a 15 basis point increase in estimated
loss rates from actual 2004 loss levels; and• For wholesale loans, a 20 basis point increase in estimated
loss rates, moving closer to historical averages.
Assumptions for improvement in loan credit quality were:• For retail loans, a 5 basis point decrease in estimated
loss rates from actual 2004 loss levels; and• For wholesale loans, no improvement in actual
2004 loss levels.
Under the assumptions for deterioration in loan creditquality, another $470 million in expected losses could occurand under the assumptions for improvement, a $70 millionreduction in expected losses could occur.
Changes in the estimate of the allowance for credit losses can materially affect net income. The example above is only one of a number of reasonably possible scenarios.Determining the allowance for credit losses requires us tomake forecasts that are highly uncertain and require a highdegree of judgment.
Valuation of Mortgage Servicing RightsWe recognize the rights to service mortgage loans for others,or mortgage servicing rights (MSRs), as assets, whether wepurchase the servicing rights, or keep them after the sale orsecuritization of loans we originated. Purchased MSRs arecapitalized at cost. Originated MSRs are recorded based onthe relative fair value of the retained servicing right and themortgage loan on the date the mortgage loan is sold. Bothpurchased and originated MSRs are carried at the lower of(1) the capitalized amount, net of accumulated amortizationand hedge accounting adjustments, or (2) fair value. If MSRsare designated as a hedged item in a fair value hedge, theMSRs’ carrying value is adjusted for changes in fair valueresulting from the application of hedge accounting. Theadjustment becomes part of the carrying value. The carryingvalue of these MSRs is subject to a fair value test under FAS140, Accounting for Transfers and Servicing of Financial Assetsand Extinguishments of Liabilities.
MSRs are amortized in proportion to and over the periodof estimated net servicing income. We analyze the amortiza-tion of MSRs monthly and adjust amortization to reflectchanges in prepayment speeds and discount rates.
We determine the fair value of MSRs using a valuationmodel that calculates the present value of estimated futurenet servicing income. The model incorporates assumptionsthat market participants use in estimating future net servicingincome, including estimates of prepayment speeds, discountrate, cost to service, escrow account earnings, contractualservicing fee income, ancillary income and late fees. The valuation of MSRs is discussed further in this section and in Notes 1 (Summary of Significant Accounting Policies), 21 (Securitizations and Variable Interest Entities) and 22(Mortgage Banking Activities) to Financial Statements.
Each quarter, we evaluate MSRs for possible impairmentbased on the difference between the carrying amount andcurrent estimated fair value under FAS 140. To evaluate and measure impairment we stratify the portfolio based oncertain risk characteristics, including loan type and note rate.If temporary impairment exists, we establish a valuationallowance through a charge to net income for any excess of amortized cost over the current fair value, by risk stratifi-cation. If we later determine that all or part of the temporaryimpairment no longer exists for a particular risk stratifica-tion, we may reduce the valuation allowance through anincrease to net income.
Under our policy, we also evaluate other-than-temporaryimpairment of MSRs by considering both historical and pro-jected trends in interest rates, pay-off activity and whetherthe impairment could be recovered through interest rateincreases. We recognize a direct write-down if we determinethat the recoverability of a recorded valuation allowance is remote. A direct write-down permanently reduces the carrying value of the MSRs, while a valuation allowance(temporary impairment) can be reversed.
To reduce the sensitivity of earnings to interest rate andmarket value fluctuations, we hedge the change in value ofMSRs primarily with derivative contracts. Reductions orincreases in the value of the MSRs are generally offset bygains or losses in the value of the derivative. If the reductionor increase in the value of the MSRs is not offset, we immediately recognize a gain or loss for the portion of theamount that is not offset (hedge ineffectiveness). We do notfully hedge MSRs because origination volume is a “naturalhedge,” (i.e., as interest rates decline, servicing values decreaseand fees from origination volume increase). Conversely, asinterest rates increase, the value of the MSRs increases, while fees from origination volume tend to decline.
Servicing fees—net of amortization, provision for impairment and gain or loss on the ineffective portion and the portion of the derivatives excluded from the assessmentof hedge effectiveness—are recorded in mortgage bankingnoninterest income.
We use a dynamic and sophisticated model to estimate the value of our MSRs. Mortgage loan prepayment speed—a key assumption in the model—is the annual rate at whichborrowers are forecasted to repay their mortgage loan principal. The discount rate—another key assumption in the model—is equal to what we believe the required rate ofreturn would be for an asset with similar risk. To determinethe discount rate, we consider the risk premium for uncer-tainties from servicing operations (e.g., possible changes in future servicing costs, ancillary income and earnings on escrow accounts). Both assumptions can and generallywill change in quarterly and annual valuations as marketconditions and interest rates change. Senior managementreviews all assumptions quarterly.

40
Our key economic assumptions and the sensitivity of thecurrent fair value of MSRs to an immediate adverse changein those assumptions are shown in Note 21 (Securitizationsand Variable Interest Entities) to Financial Statements.
There have been significant market-driven fluctuations inloan prepayment speeds and the discount rate in recent years.These fluctuations could be rapid and significant in the future.Therefore, estimating prepayment speeds within a range thatmarket participants would use in determining the fair value of MSRs requires significant management judgment.
Pension AccountingWe use four key variables to calculate our annual pensioncost; (1) size and characteristics of the employee population,(2) actuarial assumptions, (3) expected long-term rate of returnon plan assets, and (4) discount rate. We describe below theeffect of each of these variables on our pension expense.
SIZE AND CHARACTERISTICS OF THE EMPLOYEE POPULATION
Pension expense is directly related to the number of employeescovered by the plans, and other factors including salary, ageand years of employment. The number of our employees eligible for pension benefits has steadily increased over the lastfew years, causing a proportional growth in pension expense.
ACTUARIAL ASSUMPTIONS
To estimate the projected benefit obligation, actuarialassumptions are required about factors such as mortalityrate, turnover rate, retirement rate, disability rate and therate of compensation increases. These factors don’t tend tochange significantly over time, so the range of assumptions,and their impact on pension expense, is generally narrow.
EXPECTED LONG-TERM RATE OF RETURN ON PLAN ASSETS
We calculate the expected return on plan assets each yearbased on the composition of assets at the beginning of theplan year and the expected long-term rate of return on thatportfolio. The expected long-term rate of return is designedto approximate the actual long-term rate of return on the planassets over time and is not expected to change significantly.Therefore the pattern of income/expense recognition closelymatches the stable pattern of services provided by ouremployees over the life of the pension obligation.
To determine if the expected rate of return is reasonable,we consider such factors as (1) the actual return earned onplan assets, (2) historical rates of return on the various assetclasses in the plan portfolio, (3) projections of returns onvarious asset classes, and (4) current/prospective capital market conditions and economic forecasts. We have used an expected rate of return of 9% on plan assets for the pasteight years. Over the last two decades, the plan assets haveactually earned an average annualized rate of return higherthan 9%. Differences in each year, if any, between expectedand actual returns are included in our unrecognized net actuarial gain or loss amount. We generally amortize anyunrecognized net actuarial gain or loss in excess of a 5%corridor (as defined in FAS 87, Employers’ Accounting forPensions) in net periodic pension calculations over the nextfive years. Our average remaining service period is approxi-mately 11 years. See Note 16 (Employee Benefits and OtherExpenses) to Financial Statements for details on changes inthe pension benefit obligation and the fair value of plan assets.
We use November 30 as a measurement date for our pension asset and projected benefit obligation balances. If we were to assume a 1% increase/decrease in the expectedlong-term rate of return, holding the discount rate and otheractuarial assumptions constant, pension expense woulddecrease/increase by approximately $44 million.
DISCOUNT RATE
We use the discount rate to determine the present value ofour future benefit obligations. It reflects the rates availableon long-term high-quality fixed-income debt instruments,reset annually on the measurement date. We lowered our discount rate to 6% in 2004 from 6.5% in 2003 and 7% in 2002, reflecting the decline in market interest rates during these periods.
If we were to assume a 1% increase in the discount rate,and keep the expected long-term rate of return and otheractuarial assumptions constant, pension expense woulddecrease by approximately $62 million; if we were to assume a 1% decrease in the discount rate, and keep otherassumptions constant, pension expense would increase byapproximately $90 million. The decrease to pension expensebased on a 1% increase in discount rate differs from theincrease to pension expense based on a 1% decrease in discount rate due to the 5% corridor.
41
Earnings Performance
Net Interest IncomeNet interest income is the interest earned on debt securities,loans (including yield-related loan fees) and other interest-earning assets minus the interest paid for deposits and long-term and short-term debt. The net interest margin is theaverage yield on earning assets minus the average interestrate paid for deposits and our other sources of funding. Netinterest income and the net interest margin are presented ona taxable-equivalent basis to consistently reflect income fromtaxable and tax-exempt loans and securities based on a 35%marginal tax rate.
Net interest income on a taxable-equivalent basis was$17.3 billion in 2004, compared with $16.1 billion in 2003,an increase of 7%. The increase was primarily due to strongconsumer loan growth, particularly in mortgage products. Thebenefit of this growth was partially offset by lower loan yieldsas new volumes were added below the portfolio average.
The net interest margin for 2004 decreased to 4.89% from5.08% in 2003. The decrease was primarily due to lowerinvestment portfolio yields following maturities and prepay-ments of higher yielding mortgage-backed securities, and theaddition of new consumer and commercial loans with yieldsbelow the existing portfolio average. These factors were partially offset by the benefits of balance sheet repositioningactions taken in 2004.
Average earning assets increased $36.2 billion in 2004from 2003 due to increases in average loans and debt securities available for sale, offset by a decline in averagemortgages held for sale. Loans averaged $269.6 billion in
2004, compared with $213.1 billion in 2003. The increasewas largely due to growth in mortgage and home equityproducts. Average mortgages held for sale decreased to$32.3 billion in 2004 from $58.7 billion in 2003, due to a 37% decrease in mortgage originations as the refinancedriven market declined from its exceptional 2003 level. Debt securities available for sale averaged $33.1 billion in 2004, compared with $27.3 billion in 2003.
Average core deposits are an important contributor togrowth in net interest income and the net interest margin.This low-cost source of funding rose 8% from 2003. Totalaverage retail core deposits, which exclude WholesaleBanking core deposits and mortgage escrow deposits, for2004 grew $17.8 billion, or 11%, from a year ago. Averagemortgage escrow deposits declined to $14.1 billion in 2004from $18.9 billion in 2003. Average core deposits were$223.4 billion and $207.0 billion and funded 54.4% and54.8% of average total assets in 2004 and 2003, respectively.While savings certificates of deposits declined on averagefrom $20.9 billion to $18.9 billion, noninterest-bearingchecking accounts and other core deposit categories increasedon average from $186.1 billion in 2003 to $204.5 billion in2004 reflecting growth in consumer and business primaryaccount relationships. Total average interest-bearing depositsincreased to $182.6 billion in 2004 from $161.7 billion ayear ago. Total average noninterest-bearing deposits increasedto $79.3 billion in 2004 from $76.8 billion a year ago.
Table 3 presents the individual components of net interestincome and the net interest margin.
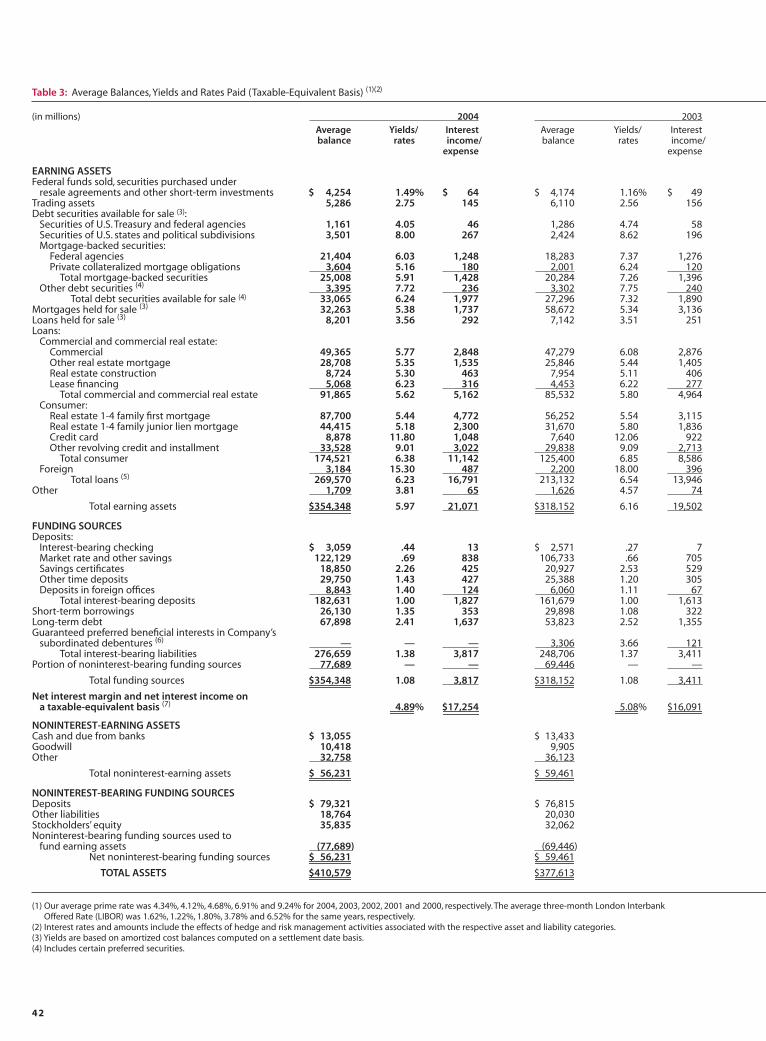
42
Table 3: Average Balances, Yields and Rates Paid (Taxable-Equivalent Basis) (1)(2)
(in millions) 2004 2003Average Yields/ Interest Average Yields/ Interestbalance rates income/ balance rates income/
expense expense
EARNING ASSETSFederal funds sold, securities purchased under
resale agreements and other short-term investments $ 4,254 1.49% $ 64 $ 4,174 1.16% $ 49Trading assets 5,286 2.75 145 6,110 2.56 156Debt securities available for sale (3):
Securities of U.S. Treasury and federal agencies 1,161 4.05 46 1,286 4.74 58Securities of U.S. states and political subdivisions 3,501 8.00 267 2,424 8.62 196Mortgage-backed securities:
Federal agencies 21,404 6.03 1,248 18,283 7.37 1,276Private collateralized mortgage obligations 3,604 5.16 180 2,001 6.24 120
Total mortgage-backed securities 25,008 5.91 1,428 20,284 7.26 1,396Other debt securities (4) 3,395 7.72 236 3,302 7.75 240
Total debt securities available for sale (4) 33,065 6.24 1,977 27,296 7.32 1,890Mortgages held for sale (3) 32,263 5.38 1,737 58,672 5.34 3,136Loans held for sale (3) 8,201 3.56 292 7,142 3.51 251Loans:
Commercial and commercial real estate:Commercial 49,365 5.77 2,848 47,279 6.08 2,876Other real estate mortgage 28,708 5.35 1,535 25,846 5.44 1,405Real estate construction 8,724 5.30 463 7,954 5.11 406Lease financing 5,068 6.23 316 4,453 6.22 277
Total commercial and commercial real estate 91,865 5.62 5,162 85,532 5.80 4,964Consumer:
Real estate 1-4 family first mortgage 87,700 5.44 4,772 56,252 5.54 3,115Real estate 1-4 family junior lien mortgage 44,415 5.18 2,300 31,670 5.80 1,836Credit card 8,878 11.80 1,048 7,640 12.06 922Other revolving credit and installment 33,528 9.01 3,022 29,838 9.09 2,713
Total consumer 174,521 6.38 11,142 125,400 6.85 8,586Foreign 3,184 15.30 487 2,200 18.00 396
Total loans (5) 269,570 6.23 16,791 213,132 6.54 13,946Other 1,709 3.81 65 1,626 4.57 74
Total earning assets $354,348 5.97 21,071 $318,152 6.16 19,502
FUNDING SOURCESDeposits:
Interest-bearing checking $ 3,059 .44 13 $ 2,571 .27 7Market rate and other savings 122,129 .69 838 106,733 .66 705Savings certificates 18,850 2.26 425 20,927 2.53 529Other time deposits 29,750 1.43 427 25,388 1.20 305Deposits in foreign offices 8,843 1.40 124 6,060 1.11 67
Total interest-bearing deposits 182,631 1.00 1,827 161,679 1.00 1,613Short-term borrowings 26,130 1.35 353 29,898 1.08 322Long-term debt 67,898 2.41 1,637 53,823 2.52 1,355Guaranteed preferred beneficial interests in Company’s
subordinated debentures (6) — — — 3,306 3.66 121Total interest-bearing liabilities 276,659 1.38 3,817 248,706 1.37 3,411
Portion of noninterest-bearing funding sources 77,689 — — 69,446 — —
Total funding sources $354,348 1.08 3,817 $318,152 1.08 3,411
Net interest margin and net interest income ona taxable-equivalent basis (7) 4.89% $17,254 5.08% $16,091
NONINTEREST-EARNING ASSETSCash and due from banks $ 13,055 $ 13,433Goodwill 10,418 9,905Other 32,758 36,123
Total noninterest-earning assets $ 56,231 $ 59,461
NONINTEREST-BEARING FUNDING SOURCESDeposits $ 79,321 $ 76,815Other liabilities 18,764 20,030Stockholders’ equity 35,835 32,062Noninterest-bearing funding sources used to
fund earning assets (77,689) (69,446)Net noninterest-bearing funding sources $ 56,231 $ 59,461
TOTAL ASSETS $410,579 $377,613
(1) Our average prime rate was 4.34%, 4.12%, 4.68%, 6.91% and 9.24% for 2004, 2003, 2002, 2001 and 2000, respectively. The average three-month London InterbankOffered Rate (LIBOR) was 1.62%, 1.22%, 1.80%, 3.78% and 6.52% for the same years, respectively.
(2) Interest rates and amounts include the effects of hedge and risk management activities associated with the respective asset and liability categories.(3) Yields are based on amortized cost balances computed on a settlement date basis.(4) Includes certain preferred securities.
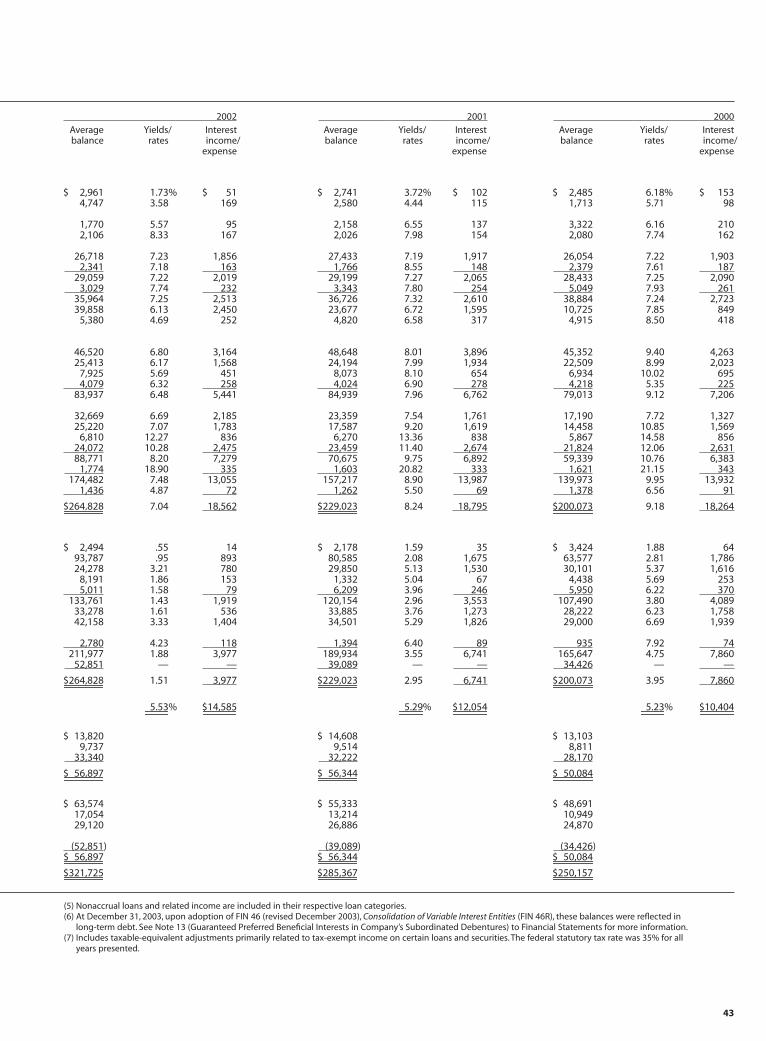
43
2002 2001 2000Average Yields/ Interest Average Yields/ Interest Average Yields/ Interestbalance rates income/ balance rates income/ balance rates income/
expense expense expense
$ 2,961 1.73% $ 51 $ 2,741 3.72% $ 102 $ 2,485 6.18% $ 1534,747 3.58 169 2,580 4.44 115 1,713 5.71 98
1,770 5.57 95 2,158 6.55 137 3,322 6.16 2102,106 8.33 167 2,026 7.98 154 2,080 7.74 162
26,718 7.23 1,856 27,433 7.19 1,917 26,054 7.22 1,903 2,341 7.18 163 1,766 8.55 148 2,379 7.61 18729,059 7.22 2,019 29,199 7.27 2,065 28,433 7.25 2,090
3,029 7.74 232 3,343 7.80 254 5,049 7.93 26135,964 7.25 2,513 36,726 7.32 2,610 38,884 7.24 2,72339,858 6.13 2,450 23,677 6.72 1,595 10,725 7.85 849
5,380 4.69 252 4,820 6.58 317 4,915 8.50 418
46,520 6.80 3,164 48,648 8.01 3,896 45,352 9.40 4,26325,413 6.17 1,568 24,194 7.99 1,934 22,509 8.99 2,023
7,925 5.69 451 8,073 8.10 654 6,934 10.02 695 4,079 6.32 258 4,024 6.90 278 4,218 5.35 225
83,937 6.48 5,441 84,939 7.96 6,762 79,013 9.12 7,206
32,669 6.69 2,185 23,359 7.54 1,761 17,190 7.72 1,32725,220 7.07 1,783 17,587 9.20 1,619 14,458 10.85 1,569
6,810 12.27 836 6,270 13.36 838 5,867 14.58 856 24,072 10.28 2,475 23,459 11.40 2,674 21,824 12.06 2,63188,771 8.20 7,279 70,675 9.75 6,892 59,339 10.76 6,383 1,774 18.90 335 1,603 20.82 333 1,621 21.15 343
174,482 7.48 13,055 157,217 8.90 13,987 139,973 9.95 13,932 1,436 4.87 72 1,262 5.50 69 1,378 6.56 91
$264,828 7.04 18,562 $229,023 8.24 18,795 $200,073 9.18 18,264
$ 2,494 .55 14 $ 2,178 1.59 35 $ 3,424 1.88 6493,787 .95 893 80,585 2.08 1,675 63,577 2.81 1,78624,278 3.21 780 29,850 5.13 1,530 30,101 5.37 1,616
8,191 1.86 153 1,332 5.04 67 4,438 5.69 253 5,011 1.58 79 6,209 3.96 246 5,950 6.22 370
133,761 1.43 1,919 120,154 2.96 3,553 107,490 3.80 4,08933,278 1.61 536 33,885 3.76 1,273 28,222 6.23 1,75842,158 3.33 1,404 34,501 5.29 1,826 29,000 6.69 1,939
2,780 4.23 118 1,394 6.40 89 935 7.92 74211,977 1.88 3,977 189,934 3.55 6,741 165,647 4.75 7,860 52,851 — — 39,089 — — 34,426 — —
$264,828 1.51 3,977 $229,023 2.95 6,741 $200,073 3.95 7,860
5.53% $14,585 5.29% $12,054 5.23% $10,404
$ 13,820 $ 14,608 $ 13,1039,737 9,514 8,811
33,340 32,222 28,170
$ 56,897 $ 56,344 $ 50,084
$ 63,574 $ 55,333 $ 48,69117,054 13,214 10,94929,120 26,886 24,870
(52,851) (39,089) (34,426)$ 56,897 $ 56,344 $ 50,084
$321,725 $285,367 $250,157
(5) Nonaccrual loans and related income are included in their respective loan categories.(6) At December 31, 2003, upon adoption of FIN 46 (revised December 2003), Consolidation of Variable Interest Entities (FIN 46R), these balances were reflected in
long-term debt. See Note 13 (Guaranteed Preferred Beneficial Interests in Company’s Subordinated Debentures) to Financial Statements for more information.(7) Includes taxable-equivalent adjustments primarily related to tax-exempt income on certain loans and securities. The federal statutory tax rate was 35% for all
years presented.
44
Service charges on deposit accounts increased 5% to $2,417 million in 2004 from $2,297 million in 2003 due to growth in core deposits and increased activity.
We earn trust, investment and IRA fees from managingand administering assets, which include mutual funds, corpo-rate trust, personal trust, employee benefit trust and agencyassets. Generally, these fees are based on the market value of the assets that are managed, administered, or both. AtDecember 31, 2004, our managed and administered assetstotaled approximately $705 billion, up from $576 billion at December 31, 2003. This increase included $24 billion in mutual fund assets and $5 billion in institutional invest-ment accounts acquired from Strong Financial Corporation(Strong Financial) at December 31, 2004. When the mergerof the Wells Fargo Funds® and certain Strong Financialfunds is completed in second quarter 2005, we will renameour mutual fund family the Wells Fargo Advantage FundsSM.The increase in trust, investment and IRA fees was primarilydue to growth in assets, successful efforts to grow businesses,and modest fill-in acquisitions (excluding the year-end StrongFinancial transaction).
Additionally, we receive commission and other fees forproviding services for retail and discount brokerage customers.
At December 31, 2004 and 2003, brokerage balances wereapproximately $86 billion and $78 billion, respectively.Generally, these fees are based on the number of transactionsexecuted at the customer’s direction.
Card fees increased 14% to $1,230 million in 2004 from$1,079 million in 2003 predominantly due to increases in creditcard accounts and credit and debit card transaction volume.
Other fees increased 14% to $1,779 million in 2004 from$1,560 million in 2003 due to the increase in loan fees as aresult of growth in the portfolio.
Mortgage banking noninterest income was $1,860 millionin 2004, compared with $2,512 million in 2003. Net servicingfees reflected income of $1,037 million in 2004 comparedwith losses of $954 million in 2003. Servicing fees are presented net of amortization and impairment of mortgageservicing rights (MSRs) and gains and losses from hedgeineffectiveness, which are all influenced by both the level and direction of mortgage interest rates. The increase in net servicing fees in 2004, compared with the prior year,reflected a reduction of $934 million in amortization due to an increase in average interest rates and higher gross servicing fees resulting from growth in the servicing portfolio.In addition, to reflect the higher value of our MSRs, wereversed $208 million of the valuation allowance in 2004,compared with an impairment provision of $1,092 million in 2003. Net derivative gains on fair value hedges of our MSRswere $554 million and $1,111 million in 2004 and 2003,respectively. (For further discussion of hedge accounting forMSRs see Note 27 (Derivatives – Fair Value Hedges) toFinancial Statements.)
Net gains on mortgage loan origination/sales activitieswere $539 million in 2004, compared with $3,019 millionfor 2003. The lower level of gains in 2004 compared with2003 reflected lower origination volume and a decrease inmargins due primarily to the increase in average interestrates and lower consumer demand. Originations during 2004 declined to $298 billion from $470 billion in 2003.
Net losses on debt securities were $15 million for 2004,compared with net gains of $4 million for 2003. Net gainsfrom equity investments were $394 million in 2004, com-pared with gains of $55 million in 2003 due to improvedmarket conditions.
We routinely review our investment portfolios and recognizeimpairment write-downs based primarily on issuer-specificfactors and results, and our intent to hold such securities. We also consider general economic and market conditions,including industries in which venture capital investments aremade, and adverse changes affecting the availability of ven-ture capital. We determine impairment based on all of theinformation available at the time of the assessment, but newinformation or economic developments in the future couldresult in recognition of additional impairment.
“All other” noninterest income for 2003 was offset by$163 million of losses on the early retirement of $2.6 billionof term debt that was previously issued at higher costs.
Noninterest Income
Table 4: Noninterest Income
(in millions) Year ended December 31, ___% Change2004 2003 2002 2004/ 2003/
2003 2002
Service charges on deposit accounts $ 2,417 $ 2,297 $ 2,134 5% 8%
Trust and investment fees:Trust, investment and IRA fees 1,509 1,345 1,343 12 —Commissions and all other fees 607 592 532 3 11
Total trust and investment fees 2,116 1,937 1,875 9 3
Card fees 1,230 1,079 977 14 10
Other fees:Cash network fees 180 179 183 1 (2)Charges and fees on loans 921 756 616 22 23All other 678 625 573 8 9
Total other fees 1,779 1,560 1,372 14 14
Mortgage banking:Servicing fees,net of amortization
and provision for impairment 1,037 (954) (737) — 29Net gains on mortgage loan
origination/sales activities 539 3,019 2,086 (82) 45All other 284 447 364 (36) 23
Total mortgage banking 1,860 2,512 1,713 (26) 47
Operating leases 836 937 1,115 (11) (16)Insurance 1,193 1,071 997 11 7Trading assets 523 502 321 4 56Net gains (losses) on debt
securities available for sale (15) 4 293 — (99)Net gains (losses) from
equity investments 394 55 (327) 616 —Net gains on sales of loans 11 28 19 (61) 47Net gains (losses) on dispositions
of operations (15) 29 10 — 190All other 580 371 268 56 38
Total $12,909 $12,382 $10,767 4% 15%
45
Noninterest expense in 2004 increased only 2%, includ-ing the net losses on extinguishment of debt and additionalinvestments made in new stores, technology and additionalsales and service team members, offset by a reduction inHome Mortgage production costs. Employee benefitsexpense included the $44 million special 401(k) contribu-tion. Noninterest expense for 2004 included a $217 millionexpense for a charitable contribution to our Foundation, tobe funded by tax-advantaged venture capital gains, and 2003included donations of appreciated public equity securities toour Foundation.
We expect to incur approximately $65 million of integra-tion expense related to the Strong Financial transaction, ofwhich $19 million (or approximately $.01 per share) wasincurred in fourth quarter 2004. In 2005, we expect to incurtotal integration expense of approximately $.02 per share forthe balance of the expenses for the Strong Financial transac-tion and for the pending acquisition of First CommunityCapital Corporation.
We will expense stock options, as required, beginning July 1, 2005, and estimate the effect of expensing currentoutstanding options will reduce earnings per share by $.03for the last half of 2005.
Operating Segment ResultsOur lines of business for management reporting consist of Community Banking, Wholesale Banking and Wells Fargo Financial.
Noninterest Expense COMMUNITY BANKING’S net income increased 14% to $5.0 billion in 2004 from $4.4 billion in 2003. Net interestincome increased to $12.2 billion in 2004 from $11.5 billionin 2003, or 6%, primarily due to growth in consumer loansand deposits, partially offset by a decrease in average mortgages held for sale. Average loans were $187.0 billion in 2004, up 31% from $143.2 billion in 2003. Retail coredeposits, which exclude Wholesale Banking core depositsand mortgage escrow deposits, averaged $183.7 billion in2004, up 11% over the prior year. Revenue in businessesother than Home Mortgage rose 10% on higher fee revenue,including deposit service charges, trust and investments,debit and credit cards and insurance. Home Mortgage revenue decreased from 2003, a year of record originationsfrom strong refinancing activity. While total CommunityBanking noninterest expense included additional investmentsmade in technology, store growth and additional team members, total noninterest expense decreased $137 million, or 1%, due to overall expense management, including areduction in Home Mortgage production costs.
WHOLESALE BANKING’S net income increased 11% to $1.6 billionin 2004 from $1.4 billion in 2003. Average loans increased7% and average core deposits grew 14% from 2003. Thequality of Wholesale Banking’s loan portfolio improved as reflected in a lower level of nonperforming loans and a decrease in net credit losses from the prior year. The provision for credit losses decreased to $62 million in 2004from $177 million in 2003, due to lower net charge-offs.Noninterest income increased $304 million to $3.1 billion in2004 compared with 2003, primarily due to higher incomein insurance brokerage, trust and investment fees, commis-sions and capital markets activity. Noninterest expenseincreased to $2.7 billion in 2004 from $2.6 billion in 2003primarily due to higher personnel expense, along with integration costs related to the Strong Financial transaction.
WELLS FARGO FINANCIAL’S net income increased 12% to $507 million in 2004 from $451 million in 2003. The 2004results reflected a strong increase in real estate secured loansand auto lending, as average loans reached $29.5 billion, anincrease of 45% over the prior year. Total revenue rose 18%in 2004, reaching $3.2 billion, compared with $2.7 billion in2003, due to higher net interest income. Net interest incomeincreased $482 million, or 21%, to $2.8 billion in 2004from $2.3 billion in 2003 due to growth in average loans.The provision for credit losses increased by $174 millionfrom 2003 to 2004 due to the growth in average loans and expected seasoning in the loan portfolio. Noninterestexpense increased $247 million, or 18%, in 2004 from2003, reflecting investments in new consumer finance stores and additional team members.
For a more complete description of our operating seg-ments, including additional financial information and theunderlying management accounting process, see Note 20(Operating Segments) to Financial Statements.
Table 5: Noninterest Expense
(in millions) Year ended December 31, _ _ % Change2004 2003 2002 2004/ 2003/
2003 2002
Salaries $ 5,393 $ 4,832 $ 4,383 12% 10%Incentive compensation 1,807 2,054 1,706 (12) 20Employee benefits 1,724 1,560 1,283 11 22Equipment 1,236 1,246 1,014 (1) 23Net occupancy 1,208 1,177 1,102 3 7Operating leases 633 702 802 (10) (12)Outside professional services 669 509 445 31 14Contract services 626 866 546 (28) 59Advertising and promotion 459 392 327 17 20Travel and entertainment 442 389 337 14 15Outside data processing 418 404 350 3 15Telecommunications 296 343 347 (14) (1)Postage 269 336 256 (20) 31Charitable donations 248 237 39 5 508Insurance 247 197 169 25 17Stationery and supplies 240 241 226 — 7Operating losses 192 193 163 (1) 18Net losses from debt
extinguishment 174 — — — —Security 161 163 159 (1) 3Core deposit intangibles 134 142 155 (6) (8)All other 997 1,207 902 (17) 34
Total $17,573 $17,190 $14,711 2% 17%
46
Balance Sheet Analysis
Table 6: Mortgage-Backed Securities
(in billions) Fair Net unrealized Remainingvalue gain (loss) maturity
At December 31, 2004 $25.1 $ .9 3.7 yrs.
At December 31, 2004,assuming a 200 basis point:Increase in interest rates 23.2 (1.0) 6.3 yrs.Decrease in interest rates 25.9 1.7 1.6 yrs.
Table 7: Deposits
(in millions) December 31, %2004 2003 Change
Noninterest-bearing $ 81,082 $ 74,387 9%Interest-bearing checking 3,122 2,735 14Market rate and
other savings 126,648 114,362 11Savings certificates 18,851 19,787 (5)
Core deposits 229,703 211,271 9Other time deposits 36,622 27,488 33Deposits in foreign offices 8,533 8,768 (3)
Total deposits $274,858 $247,527 11%
Loan PortfolioA comparative schedule of average loan balances is includedin Table 3; year-end balances are in Note 6 (Loans andAllowance for Credit Losses) to Financial Statements.
Loans averaged $269.6 billion in 2004, compared with$213.1 billion in 2003, an increase of 26%. Total loans at December 31, 2004, were $287.6 billion, compared with $253.1 billion at year-end 2003, an increase of 14%.Average 1–4 family first mortgages and junior liens increased$31.4 billion, or 56%, and $12.7 billion, or 40%, respectively,in 2004 compared with a year ago. Average commercial andcommercial real estate loans increased $6.3 billion in 2004compared with a year ago. Average mortgages held for saledecreased $26.4 billion, or 45%, to $32.3 billion in 2004from $58.7 billion in 2003 due to lower origination volume.With lower refinancing demand in 2004, residential mortgageoriginations of $298 billion were down 37% from theindustry record of $470 billion we established in 2003.
DepositsYear-end deposit balances are in Table 7. Comparative detail of average deposit balances is included in Table 3.Average core deposits funded 54.4% and 54.8% of averagetotal assets in 2004 and 2003, respectively. Total averageinterest-bearing deposits rose from $161.7 billion in 2003 to $182.6 billion in 2004. Total average noninterest-bearingdeposits rose from $76.8 billion in 2003 to $79.3 billion in 2004. Savings certificates declined on average from $20.9 billion in 2003 to $18.9 billion in 2004.
A comparison between the year-end 2004 and 2003 balancesheets is presented below.
Securities Available for SaleOur securities available for sale portfolio includes both debtand marketable equity securities. We hold debt securitiesavailable for sale primarily for liquidity, interest rate riskmanagement and yield enhancement purposes. Accordingly,this portfolio primarily includes very liquid, high-quality federal agency debt securities. At December 31, 2004, weheld $33.0 billion of debt securities available for sale, compared with $32.4 billion at December 31, 2003, with anet unrealized gain of $1.2 billion and $1.3 billion for thesame periods. In addition, we held $696 million of marketableequity securities available for sale at December 31, 2004,and $582 million at December 31, 2003, with a net unrealizedgain of $189 million and $188 million for the same periods.
The weighted-average expected maturity of debt securitiesavailable for sale was 4.3 years at December 31, 2004. Since76% of this portfolio is mortgage-backed securities, theexpected remaining maturity may differ from contractualmaturity because borrowers may have the right to prepayobligations before the underlying mortgages mature.
The estimated effect of a 200 basis point increase ordecrease in interest rates on the fair value and the expectedremaining maturity of the mortgage-backed securities available for sale portfolio is in Table 6.
See Note 5 (Securities Available for Sale) to FinancialStatements for securities available for sale by security type.
47
Off-Balance Sheet Arrangements and Aggregate Contractual Obligations
Off-Balance Sheet Arrangements, Variable InterestEntities, Guarantees and Other CommitmentsWe consolidate our majority-owned subsidiaries and sub-sidiaries in which we are the primary beneficiary. Generally,we use the equity method of accounting if we own at least20% of an affiliate and we carry the investment at cost if weown less than 20% of an affiliate. See Note 1 (Summary ofSignificant Accounting Policies) to Financial Statements forour consolidation policy.
In the ordinary course of business, we engage in financialtransactions that are not recorded on the balance sheet, ormay be recorded on the balance sheet in amounts that aredifferent than the full contract or notional amount of thetransaction. These transactions are designed to (1) meet thefinancial needs of customers, (2) manage our credit, marketor liquidity risks, (3) diversify our funding sources or(4) optimize capital, and are accounted for in accordancewith generally accepted accounting principles (GAAP).
Almost all of our off-balance sheet arrangements resultfrom securitizations. We routinely securitize home mortgageloans and, from time to time, other financial assets, includingstudent loans, commercial mortgages and automobile receivables. We normally structure loan securitizations assales, in accordance with FAS 140. This involves the transferof financial assets to certain qualifying special-purpose entitiesthat we are not required to consolidate. In a securitization,we can convert the assets into cash earlier than if we held the assets to maturity. Special-purpose entities used in thesetypes of securitizations obtain cash to acquire assets by issu-ing securities to investors. In a securitization, we usually provide representations and warranties for receivables transferred. Also, we generally retain the right to service thetransferred receivables and to repurchase those receivablesfrom the special-purpose entity if the outstanding balance of the receivable falls to a level where the cost exceeds thebenefits of servicing such receivables.
At December 31, 2004, securitization arrangements sponsored by the Company consisted of approximately$77 billion in securitized loan receivables, including $45 billion of home mortgage loans. We retained servicingrights and other beneficial interests related to these securiti-zations of $575 million, consisting of $138 million in securi-ties, $353 million in servicing assets and $84 million in otherretained interests. Related to securitizations, we provided$16 million in liquidity commitments in demand notes andreserve fund balances, and committed to provide up to $32 million in credit enhancements.
Also, we hold variable interests greater than 20% but less than 50% in certain special-purpose entities formed to provide affordable housing and to securitize high-yieldcorporate debt that had approximately $3 billion in totalassets at December 31, 2004. We are not required to consolidate these entities. Our maximum exposure to loss as a result of our involvement with these unconsolidated
variable interest entities was approximately $950 million atDecember 31, 2004, primarily representing investments inentities formed to invest in affordable housing. We, however,expect to recover our investment over time through realizationof federal low-income housing tax credits.
For more information on securitizations including sales proceeds and cash flows from securitizations, seeNote 21 (Securitizations and Variable Interest Entities) toFinancial Statements.
Home Mortgage, in the ordinary course of business, origi-nates a portion of its mortgage loans through unconsolidatedjoint ventures in which we own an interest of 50% or less.Loans made by these joint ventures are funded by Wells FargoBank, N.A., or an affiliated entity, through an establishedline of credit and are subject to specified underwriting criteria. At December 31, 2004, the total assets of thesemortgage origination joint ventures were approximately $80 million. We provide liquidity to these joint ventures inthe form of outstanding lines of credit and, at December 31,2004, these liquidity commitments totaled $350 million.
We also hold interests in other unconsolidated joint ventures formed with unrelated third parties to provide efficiencies from economies of scale. A third party managesour real estate lending services joint ventures and providescustomers title, escrow, appraisal and other real estate relatedservices. Our merchant services joint venture includes creditcard processing and related activities. At December 31, 2004,total assets of our real estate lending and merchant servicesjoint ventures were approximately $520 million.
When we acquire brokerage, asset management andinsurance agencies, the terms of the acquisitions may providefor deferred payments or additional consideration, based on certain performance targets. At December 31, 2004, theamount of contingent consideration we expected to pay wasnot significant to our financial statements.
As a financial services provider, we routinely commit toextend credit, including loan commitments, standby letters ofcredit and financial guarantees. A significant portion of com-mitments to extend credit may expire without being drawnupon. These commitments are subject to the same creditpolicies and approval process used for our loans. For moreinformation, see Note 6 (Loans and Allowance for CreditLosses) and Note 25 (Guarantees) to Financial Statements.
In our venture capital and capital markets businesses, wecommit to fund equity investments directly to investmentfunds and to specific private companies. The timing of futurecash requirements to fund these commitments generallydepends on the venture capital investment cycle, the periodover which privately-held companies are funded by venturecapital investors and ultimately taken public through an ini-tial offering. This cycle can vary based on market conditionsand the industry in which the companies operate. We expectthat many of these investments will become public, or other-wise become liquid, before the balance of unfunded equity
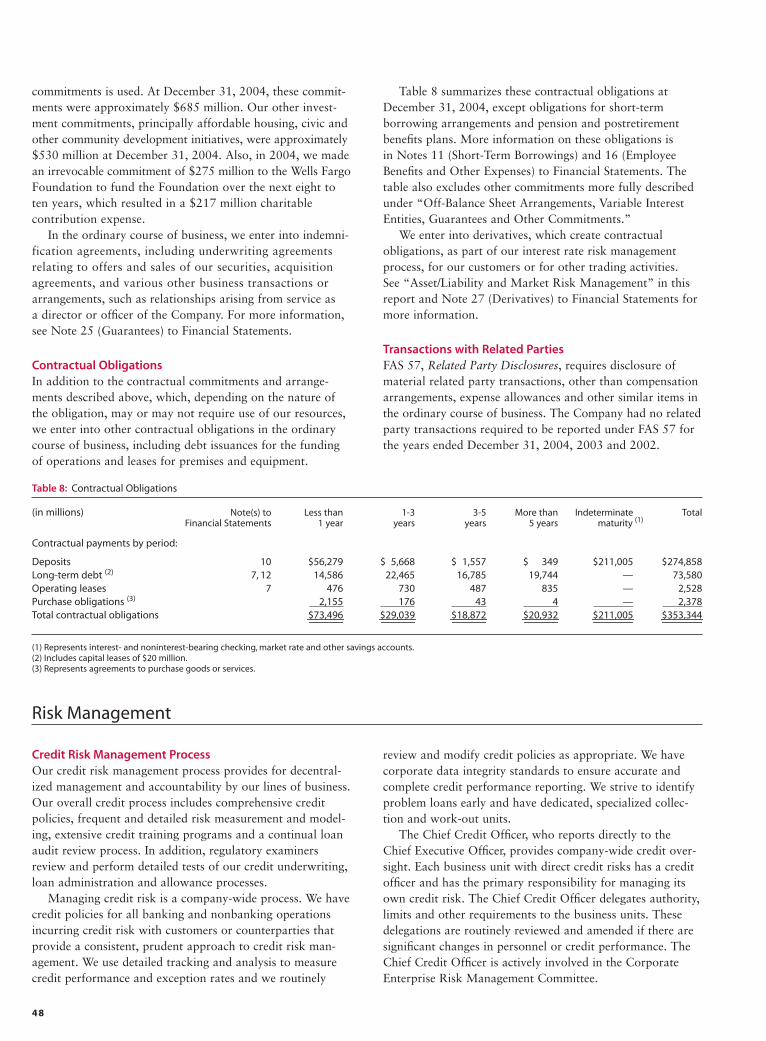
48
Risk Management
Credit Risk Management ProcessOur credit risk management process provides for decentral-ized management and accountability by our lines of business.Our overall credit process includes comprehensive creditpolicies, frequent and detailed risk measurement and model-ing, extensive credit training programs and a continual loanaudit review process. In addition, regulatory examinersreview and perform detailed tests of our credit underwriting,loan administration and allowance processes.
Managing credit risk is a company-wide process. We havecredit policies for all banking and nonbanking operationsincurring credit risk with customers or counterparties thatprovide a consistent, prudent approach to credit risk man-agement. We use detailed tracking and analysis to measurecredit performance and exception rates and we routinely
review and modify credit policies as appropriate. We havecorporate data integrity standards to ensure accurate andcomplete credit performance reporting. We strive to identifyproblem loans early and have dedicated, specialized collec-tion and work-out units.
The Chief Credit Officer, who reports directly to theChief Executive Officer, provides company-wide credit over-sight. Each business unit with direct credit risks has a creditofficer and has the primary responsibility for managing itsown credit risk. The Chief Credit Officer delegates authority,limits and other requirements to the business units. Thesedelegations are routinely reviewed and amended if there aresignificant changes in personnel or credit performance. TheChief Credit Officer is actively involved in the CorporateEnterprise Risk Management Committee.
Table 8: Contractual Obligations
(in millions) Note(s) to Less than 1-3 3-5 More than Indeterminate TotalFinancial Statements 1 year years years 5 years maturity (1)
Contractual payments by period:
Deposits 10 $56,279 $ 5,668 $ 1,557 $ 349 $211,005 $274,858Long-term debt (2) 7, 12 14,586 22,465 16,785 19,744 — 73,580Operating leases 7 476 730 487 835 — 2,528Purchase obligations (3) 2,155 176 43 4 — 2,378Total contractual obligations $73,496 $29,039 $18,872 $20,932 $211,005 $353,344
(1) Represents interest- and noninterest-bearing checking, market rate and other savings accounts.(2) Includes capital leases of $20 million.(3) Represents agreements to purchase goods or services.
commitments is used. At December 31, 2004, these commit-ments were approximately $685 million. Our other invest-ment commitments, principally affordable housing, civic andother community development initiatives, were approximately$530 million at December 31, 2004. Also, in 2004, we madean irrevocable commitment of $275 million to the Wells FargoFoundation to fund the Foundation over the next eight toten years, which resulted in a $217 million charitable contribution expense.
In the ordinary course of business, we enter into indemni-fication agreements, including underwriting agreements relating to offers and sales of our securities, acquisitionagreements, and various other business transactions orarrangements, such as relationships arising from service as a director or officer of the Company. For more information,see Note 25 (Guarantees) to Financial Statements.
Contractual Obligations In addition to the contractual commitments and arrange-ments described above, which, depending on the nature ofthe obligation, may or may not require use of our resources,we enter into other contractual obligations in the ordinarycourse of business, including debt issuances for the funding of operations and leases for premises and equipment.
Table 8 summarizes these contractual obligations atDecember 31, 2004, except obligations for short-term borrowing arrangements and pension and postretirementbenefits plans. More information on these obligations is in Notes 11 (Short-Term Borrowings) and 16 (EmployeeBenefits and Other Expenses) to Financial Statements. Thetable also excludes other commitments more fully describedunder “Off-Balance Sheet Arrangements, Variable InterestEntities, Guarantees and Other Commitments.”
We enter into derivatives, which create contractual obligations, as part of our interest rate risk managementprocess, for our customers or for other trading activities. See “Asset/Liability and Market Risk Management” in thisreport and Note 27 (Derivatives) to Financial Statements formore information.
Transactions with Related PartiesFAS 57, Related Party Disclosures, requires disclosure ofmaterial related party transactions, other than compensationarrangements, expense allowances and other similar items inthe ordinary course of business. The Company had no relatedparty transactions required to be reported under FAS 57 forthe years ended December 31, 2004, 2003 and 2002.
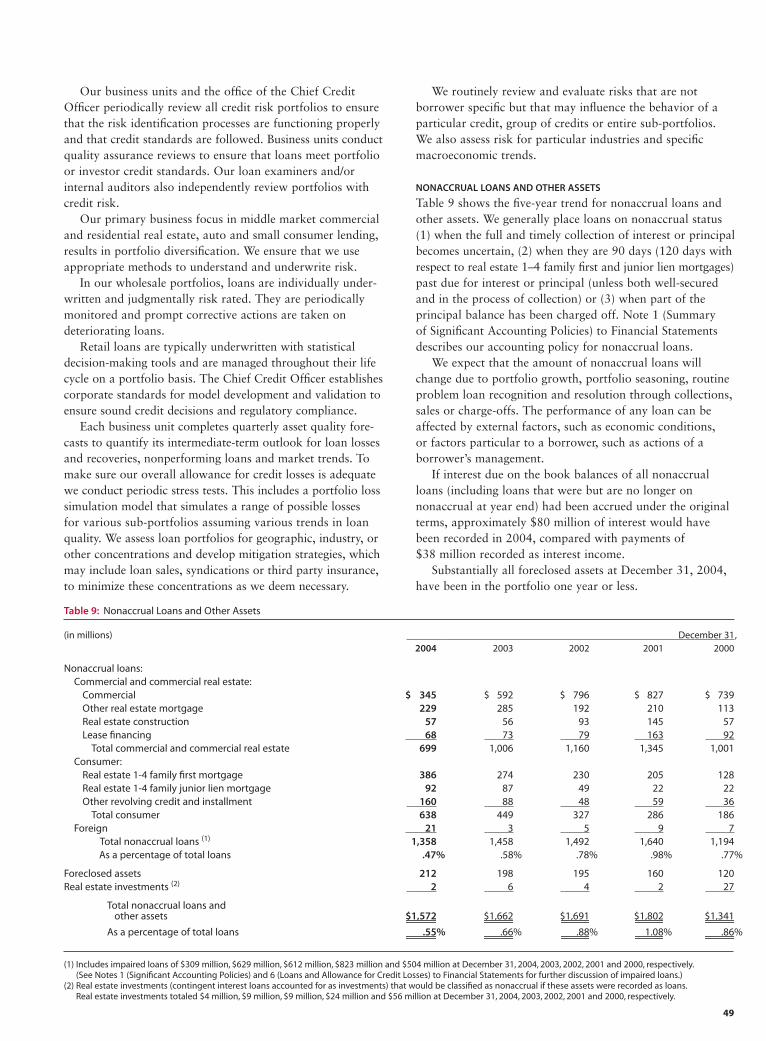
49
Our business units and the office of the Chief CreditOfficer periodically review all credit risk portfolios to ensurethat the risk identification processes are functioning properlyand that credit standards are followed. Business units conductquality assurance reviews to ensure that loans meet portfolioor investor credit standards. Our loan examiners and/orinternal auditors also independently review portfolios withcredit risk.
Our primary business focus in middle market commercialand residential real estate, auto and small consumer lending,results in portfolio diversification. We ensure that we useappropriate methods to understand and underwrite risk.
In our wholesale portfolios, loans are individually under-written and judgmentally risk rated. They are periodicallymonitored and prompt corrective actions are taken on deteriorating loans.
Retail loans are typically underwritten with statistical decision-making tools and are managed throughout their lifecycle on a portfolio basis. The Chief Credit Officer establishescorporate standards for model development and validation toensure sound credit decisions and regulatory compliance.
Each business unit completes quarterly asset quality fore-casts to quantify its intermediate-term outlook for loan lossesand recoveries, nonperforming loans and market trends. Tomake sure our overall allowance for credit losses is adequatewe conduct periodic stress tests. This includes a portfolio losssimulation model that simulates a range of possible losses for various sub-portfolios assuming various trends in loanquality. We assess loan portfolios for geographic, industry, orother concentrations and develop mitigation strategies, whichmay include loan sales, syndications or third party insurance,to minimize these concentrations as we deem necessary.
We routinely review and evaluate risks that are not borrower specific but that may influence the behavior of aparticular credit, group of credits or entire sub-portfolios.We also assess risk for particular industries and specificmacroeconomic trends.
NONACCRUAL LOANS AND OTHER ASSETS
Table 9 shows the five-year trend for nonaccrual loans andother assets. We generally place loans on nonaccrual status(1) when the full and timely collection of interest or principalbecomes uncertain, (2) when they are 90 days (120 days withrespect to real estate 1–4 family first and junior lien mortgages)past due for interest or principal (unless both well-securedand in the process of collection) or (3) when part of the principal balance has been charged off. Note 1 (Summary of Significant Accounting Policies) to Financial Statementsdescribes our accounting policy for nonaccrual loans.
We expect that the amount of nonaccrual loans willchange due to portfolio growth, portfolio seasoning, routineproblem loan recognition and resolution through collections,sales or charge-offs. The performance of any loan can beaffected by external factors, such as economic conditions, or factors particular to a borrower, such as actions of a borrower’s management.
If interest due on the book balances of all nonaccrualloans (including loans that were but are no longer on nonaccrual at year end) had been accrued under the originalterms, approximately $80 million of interest would havebeen recorded in 2004, compared with payments of $38 million recorded as interest income.
Substantially all foreclosed assets at December 31, 2004,have been in the portfolio one year or less.
Table 9: Nonaccrual Loans and Other Assets
(in millions) December 31,2004 2003 2002 2001 2000
Nonaccrual loans:Commercial and commercial real estate:
Commercial $ 345 $ 592 $ 796 $ 827 $ 739Other real estate mortgage 229 285 192 210 113Real estate construction 57 56 93 145 57Lease financing 68 73 79 163 92
Total commercial and commercial real estate 699 1,006 1,160 1,345 1,001Consumer:
Real estate 1-4 family first mortgage 386 274 230 205 128Real estate 1-4 family junior lien mortgage 92 87 49 22 22Other revolving credit and installment 160 88 48 59 36
Total consumer 638 449 327 286 186Foreign 21 3 5 9 7
Total nonaccrual loans (1) 1,358 1,458 1,492 1,640 1,194As a percentage of total loans .47% .58% .78% .98% .77%
Foreclosed assets 212 198 195 160 120Real estate investments (2) 2 6 4 2 27
Total nonaccrual loans andother assets $1,572 $1,662 $1,691 $1,802 $1,341
As a percentage of total loans .55% .66% .88% 1.08% .86%
(1) Includes impaired loans of $309 million, $629 million, $612 million, $823 million and $504 million at December 31, 2004, 2003, 2002, 2001 and 2000, respectively.(See Notes 1 (Significant Accounting Policies) and 6 (Loans and Allowance for Credit Losses) to Financial Statements for further discussion of impaired loans.)
(2) Real estate investments (contingent interest loans accounted for as investments) that would be classified as nonaccrual if these assets were recorded as loans.Real estate investments totaled $4 million, $9 million, $9 million, $24 million and $56 million at December 31, 2004, 2003, 2002, 2001 and 2000, respectively.
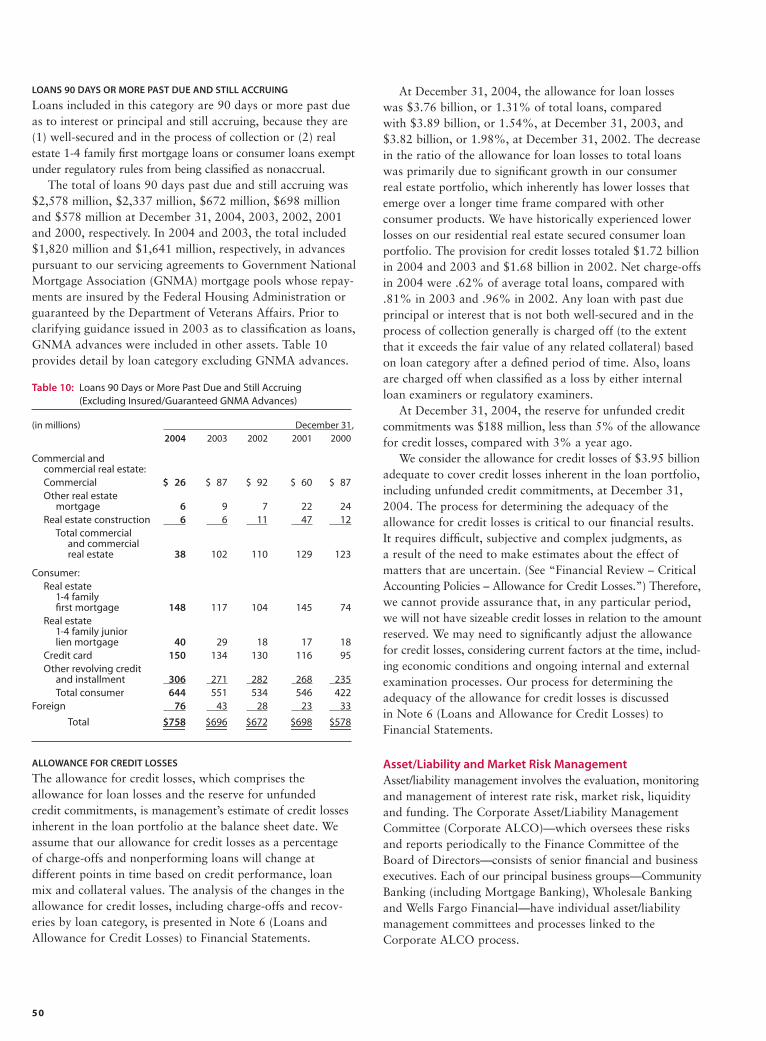
50
At December 31, 2004, the allowance for loan losses was $3.76 billion, or 1.31% of total loans, compared with $3.89 billion, or 1.54%, at December 31, 2003, and$3.82 billion, or 1.98%, at December 31, 2002. The decreasein the ratio of the allowance for loan losses to total loanswas primarily due to significant growth in our consumer real estate portfolio, which inherently has lower losses thatemerge over a longer time frame compared with other consumer products. We have historically experienced lowerlosses on our residential real estate secured consumer loanportfolio. The provision for credit losses totaled $1.72 billionin 2004 and 2003 and $1.68 billion in 2002. Net charge-offsin 2004 were .62% of average total loans, compared with.81% in 2003 and .96% in 2002. Any loan with past dueprincipal or interest that is not both well-secured and in theprocess of collection generally is charged off (to the extentthat it exceeds the fair value of any related collateral) basedon loan category after a defined period of time. Also, loansare charged off when classified as a loss by either internalloan examiners or regulatory examiners.
At December 31, 2004, the reserve for unfunded creditcommitments was $188 million, less than 5% of the allowancefor credit losses, compared with 3% a year ago.
We consider the allowance for credit losses of $3.95 billionadequate to cover credit losses inherent in the loan portfolio,including unfunded credit commitments, at December 31,2004. The process for determining the adequacy of theallowance for credit losses is critical to our financial results.It requires difficult, subjective and complex judgments, as a result of the need to make estimates about the effect ofmatters that are uncertain. (See “Financial Review – CriticalAccounting Policies – Allowance for Credit Losses.”) Therefore,we cannot provide assurance that, in any particular period,we will not have sizeable credit losses in relation to the amountreserved. We may need to significantly adjust the allowancefor credit losses, considering current factors at the time, includ-ing economic conditions and ongoing internal and externalexamination processes. Our process for determining the adequacy of the allowance for credit losses is discussed in Note 6 (Loans and Allowance for Credit Losses) to Financial Statements.
Asset/Liability and Market Risk ManagementAsset/liability management involves the evaluation, monitoringand management of interest rate risk, market risk, liquidityand funding. The Corporate Asset/Liability ManagementCommittee (Corporate ALCO)—which oversees these risksand reports periodically to the Finance Committee of theBoard of Directors—consists of senior financial and businessexecutives. Each of our principal business groups—CommunityBanking (including Mortgage Banking), Wholesale Bankingand Wells Fargo Financial—have individual asset/liabilitymanagement committees and processes linked to theCorporate ALCO process.
ALLOWANCE FOR CREDIT LOSSES
The allowance for credit losses, which comprises theallowance for loan losses and the reserve for unfunded credit commitments, is management’s estimate of credit lossesinherent in the loan portfolio at the balance sheet date. Weassume that our allowance for credit losses as a percentageof charge-offs and nonperforming loans will change at different points in time based on credit performance, loanmix and collateral values. The analysis of the changes in theallowance for credit losses, including charge-offs and recov-eries by loan category, is presented in Note 6 (Loans andAllowance for Credit Losses) to Financial Statements.
Table 10: Loans 90 Days or More Past Due and Still Accruing(Excluding Insured/Guaranteed GNMA Advances)
(in millions) December 31,2004 2003 2002 2001 2000
Commercial and commercial real estate:Commercial $ 26 $ 87 $ 92 $ 60 $ 87Other real estate
mortgage 6 9 7 22 24Real estate construction 6 6 11 47 12
Total commercialand commercial real estate 38 102 110 129 123
Consumer:Real estate
1-4 family first mortgage 148 117 104 145 74
Real estate 1-4 family junior lien mortgage 40 29 18 17 18
Credit card 150 134 130 116 95Other revolving credit
and installment 306 271 282 268 235Total consumer 644 551 534 546 422
Foreign 76 43 28 23 33
Total $758 $696 $672 $698 $578
LOANS 90 DAYS OR MORE PAST DUE AND STILL ACCRUING
Loans included in this category are 90 days or more past dueas to interest or principal and still accruing, because they are(1) well-secured and in the process of collection or (2) realestate 1-4 family first mortgage loans or consumer loans exemptunder regulatory rules from being classified as nonaccrual.
The total of loans 90 days past due and still accruing was$2,578 million, $2,337 million, $672 million, $698 millionand $578 million at December 31, 2004, 2003, 2002, 2001and 2000, respectively. In 2004 and 2003, the total included$1,820 million and $1,641 million, respectively, in advancespursuant to our servicing agreements to Government NationalMortgage Association (GNMA) mortgage pools whose repay-ments are insured by the Federal Housing Administration orguaranteed by the Department of Veterans Affairs. Prior toclarifying guidance issued in 2003 as to classification as loans,GNMA advances were included in other assets. Table 10 provides detail by loan category excluding GNMA advances.
51
INTEREST RATE RISK
Interest rate risk, which potentially can have a significantearnings impact, is an integral part of being a financial intermediary. We are subject to interest rate risk because:
• assets and liabilities may mature or reprice at differenttimes (for example, if assets reprice faster than liabilitiesand interest rates are generally falling, earnings will initially decline);
• assets and liabilities may reprice at the same time but bydifferent amounts (for example, when the general levelof interest rates is falling, we may reduce rates paid onchecking and savings deposit accounts by an amount thatis less than the general decline in market interest rates);
• short-term and long-term market interest rates maychange by different amounts (i.e., the shape of the yieldcurve may affect new loan yields and funding costs differently); or
• the remaining maturity of various assets or liabilitiesmay shorten or lengthen as interest rates change (forexample, if long-term mortgage interest rates declinesharply, mortgage-backed securities held in the securitiesavailable for sale portfolio may prepay significantly earlier than anticipated – which could reduce portfolioincome). In addition, interest rates may have an indirectimpact on loan demand, credit losses, mortgage originationvolume, the value of mortgage servicing rights, the value of the pension liability and other sources of earnings.
We assess interest rate risk by comparing our most likelyearnings plan with various earnings models using manyinterest rate scenarios that differ in the direction of interestrate changes, the degree of change over time, the speed ofchange and the projected shape of the yield curve. For example,if we assume an increase of 325 basis points in the federalfunds rate and an increase of 250 basis points in the 10 yearConstant Maturity Treasury Bond yield during the sameperiod, estimated earnings at risk would be approximately3.0% of our most likely earnings plan for 2005. Simulationestimates depend on, and will change with, the size and mixof our actual and projected balance sheet at the time of each simulation.
We use exchange-traded and over-the-counter interest ratederivatives to hedge our interest rate exposures. The creditrisk amount and estimated net fair values of these derivativesas of December 31, 2004 and 2003 are presented in Note 27(Derivatives) to Financial Statements. We use derivatives forasset/liability management in three ways:
• to convert most of the long-term fixed-rate debt to floating-rate payments by entering into receive-fixedswaps at issuance;
• to convert the cash flows from selected asset and/or liability instruments/portfolios from fixed to floatingpayments or vice versa; and
• to hedge the mortgage origination pipeline, fundedmortgage loans and mortgage servicing rights usingswaptions, futures, forwards and options.
MORTGAGE BANKING INTEREST RATE RISK
We originate, fund and service mortgage loans, which sub-jects us to a number of risks, including credit, liquidity andinterest rate risks. We manage credit and liquidity risk byselling or securitizing most of the mortgage loans we origi-nate. Changes in interest rates, however, may have a signifi-cant effect on mortgage banking income in any quarter andover time. Interest rates impact both the value of the mort-gage servicing rights (MSRs), which is adjusted to the lowerof cost or fair value, and the future earnings of the mortgagebusiness, which are driven by origination volume and theduration of our servicing. We manage both risks by hedgingthe impact of interest rates on the value of the MSRs usingderivatives, combined with the “natural hedge” provided bythe origination and servicing components of the mortgagebusiness; however, we do not hedge 100% of these two risks.
We hedge a significant portion of the value of our MSRsagainst a change in interest rates with derivatives. The prin-cipal source of risk in this hedging process is the risk thatchanges in the value of the hedging contracts may not matchchanges in the value of the hedged portion of our MSRs forany given change in long-term interest rates.
The value of our MSRs is influenced primarily by prepay-ment speed assumptions affecting the duration of the mort-gage loans to which our MSRs relate. Changes in long-terminterest rates affect these prepayment speed assumptions. For example, a decrease in long-term rates would accelerateprepayment speed assumptions as borrowers refinance theirexisting mortgage loans and decrease the value of the MSRs.In contrast, prepayment speed assumptions would tend toslow in a rising interest rate environment and increase thevalue of the MSRs.
For a given decline in interest rates, a portion of thepotential reduction in the value of our MSRs is offset by estimated increases in origination and servicing fees overtime from new mortgage activity or refinancing associatedwith that decline in interest rates. With much lower long-term interest rates, the decline in the value of our MSRs andthe effect on net income would be immediate whereas theadditional origination and servicing fee income accrues overtime. Under GAAP, impairment of our MSRs, due to adecrease in long-term rates or other reasons, is charged toearnings through an increase to the valuation allowance.
In scenarios of sustained increases in long-term interestrates, origination fees may decline as refinancing activity slows.In such higher interest rate scenarios, the duration of the ser-vicing portfolio may lengthen. In such circumstances, we mayreduce periodic amortization of MSRs, and may recover someor all of the previously established valuation allowance.
Our MSRs totaled $7.9 billion, net of a valuation allowanceof $1.6 billion at December 31, 2004, and $6.9 billion, net ofa valuation allowance of $1.9 billion, at December 31, 2003.The weighted-average note rate on the owned servicingportfolio was 5.75% at December 31, 2004, and 5.90% atDecember 31, 2003. Our MSRs were 1.15% of mortgageloans serviced for others at December 31, 2004 and 2003.
52
As part of our mortgage banking activities, we enter intocommitments to fund residential mortgage loans at specifiedtimes in the future. A mortgage loan commitment is an interestrate lock that binds us to lend funds to a potential borrowerat a specified interest rate and within a specified period oftime, generally up to 60 days after inception of the rate lock.These loan commitments are derivative loan commitments ifthe loans that will result from the exercise of the commitmentswill be held for sale. Under FAS 133, Accounting for DerivativeInstruments and Hedging Activities (as amended), thesederivative loan commitments are recognized at fair value on the consolidated balance sheet with changes in their fairvalues recorded as part of income from mortgage bankingoperations. Consistent with EITF 02-3, Issues Involved inAccounting for Derivative Contracts Held for TradingPurposes and Contracts Involved in Energy Trading and RiskManagement Activities, and SEC Staff Accounting BulletinNo. 105, Application of Accounting Principles to LoanCommitments, we record no value for the loan commitmentat inception. Subsequent to inception, we recognize fair value of the derivative loan commitment based on estimatedchanges in the fair value of the underlying loan that wouldresult from the exercise of that commitment and on changesin the probability that the loan will fund within the terms ofthe commitment. The value of that loan is affected primarilyby changes in interest rates and the passage of time. We alsoapply a fall-out factor to the valuation of the derivative loancommitment for the probability that the loan will not fundwithin the terms of the commitments. The value of the MSRs is recognized only after the servicing asset has beencontractually separated from the underlying loan by sale or securitization.
Outstanding derivative loan commitments expose us to the risk that the price of the loans underlying the commit-ments might decline due to increases in mortgage interestrates from inception of the rate lock to the funding of theloan. To minimize this risk, we utilize options, futures andforwards to economically hedge the potential decreases inthe values of the loans that could result from the exercise of the loan commitments. We expect that these derivativefinancial instruments will experience changes in fair valuethat will offset the changes in fair value of the derivativeloan commitments.
MARKET RISK – TRADING ACTIVITIES
From a market risk perspective, our net income is exposed tochanges in interest rates, credit spreads, foreign exchange rates,equity and commodity prices and their implied volatilities. Theprimary purpose of our trading businesses is to accommodatecustomers in the management of their market price risks. Also,we take positions based on market expectations or to benefitfrom price differences between financial instruments andmarkets, subject to risk limits established and monitored by Corporate ALCO. All securities, loans, foreign exchangetransactions, commodity transactions and derivatives—transacted with customers or used to hedge capital markettransactions with customers—are carried at fair value.
The Institutional Risk Committee establishes and monitors counterparty risk limits. The notional or contractual amount,credit risk amount and estimated net fair value of all customeraccommodation derivatives at December 31, 2004 and 2003are included in Note 27 (Derivatives) to Financial Statements.Open, “at risk” positions for all trading business are moni-tored by Corporate ALCO.
The standardized approach for monitoring and reportingmarket risk for the trading activities is the value-at-risk (VAR)metrics complemented with factor analysis and stress testing.Value-at-risk measures the worst expected loss over a giventime interval and within a given confidence interval. Wemeasure and report daily VAR at 99% confidence intervalbased on actual changes in rates and prices over the past 250 days. The analysis captures all financial instruments thatare considered trading positions. The average one-day VARthroughout 2004 was $19 million, with a lower bound of$12 million and an upper bound of $57 million.
MARKET RISK – EQUITY MARKETS
We are directly and indirectly affected by changes in the equitymarkets. We make and manage direct equity investments instart-up businesses, emerging growth companies, managementbuy-outs, acquisitions and corporate recapitalizations. We alsoinvest in non-affiliated funds that make similar private equityinvestments. These private equity investments are made withincapital allocations approved by management and the Boardof Directors. The Board reviews business developments, keyrisks and historical returns for the private equity investmentsat least annually. Management reviews these investments at leastquarterly and assesses them for possible other-than-temporaryimpairment. For nonmarketable investments, the analysis isbased on facts and circumstances of each individual investmentand the expectations for that investment’s cash flows andcapital needs, the viability of its business model and our exitstrategy. At December 31, 2004, private equity investmentstotaled $1,449 million, compared with $1,714 million atDecember 31, 2003.
We also have marketable equity securities in the availablefor sale investment portfolio, including securities distributedfrom our venture capital activities. We manage these investmentswithin capital risk limits approved by management and theBoard and monitored by Corporate ALCO. Gains and losseson these securities are recognized in net income when realizedand, in addition, other-than-temporary impairment may beperiodically recorded. The initial indicator of impairment formarketable equity securities is a sustained decline in marketprice below the amount recorded for that investment. Weconsider a variety of factors, such as the length of time andthe extent to which the market value has been less than cost;the issuer’s financial condition, capital strength, and near-term prospects; any recent events specific to that issuer andeconomic conditions of its industry; and, to a lesser degree,our investment horizon in relationship to an anticipated near-term recovery in the stock price, if any. At December 31, 2004,the fair value of marketable equity securities was $696 millionand cost was $507 million, compared with $582 million and$394 million, respectively, at December 31, 2003.
53
Changes in equity market prices may also indirectly affectour net income (1) by affecting the value of third party assetsunder management and, hence, fee income, (2) by affectingparticular borrowers, whose ability to repay principal and/or interest may be affected by the stock market, or (3) byaffecting brokerage activity, related commission income andother business activities. Each business line monitors andmanages these indirect risks.
LIQUIDITY AND FUNDING
The objective of effective liquidity management is to ensurethat we can meet customer loan requests, customer depositmaturities/withdrawals and other cash commitments effi-ciently under both normal operating conditions and underunpredictable circumstances of industry or market stress. To achieve this objective, Corporate ALCO establishes andmonitors liquidity guidelines that require sufficient asset-based liquidity to cover potential funding requirements andto avoid over-dependence on volatile, less reliable fundingmarkets. We set liquidity management guidelines for boththe consolidated balance sheet as well as for the Parentspecifically to ensure that the Parent is a source of strengthfor its regulated, deposit-taking banking subsidiaries.
Debt securities in the securities available for sale portfolioprovide asset liquidity, in addition to the immediately liquidresources of cash and due from banks and federal funds sold and securities purchased under resale agreements. Theweighted-average expected remaining maturity of the debtsecurities within this portfolio was 4.3 years at December 31,2004. Of the $31.8 billion (cost basis) of debt securities inthis portfolio at December 31, 2004, $5.1 billion, or 16%,is expected to mature or be prepaid in 2005 and an additional$4.5 billion, or 14%, in 2006. Asset liquidity is furtherenhanced by our ability to sell or securitize loans in secondarymarkets through whole-loan sales and securitizations. In2004, we sold mortgage loans of approximately $230 billion,including securitized home mortgage loans and commercialmortgage loans of approximately $195 billion. The amountof mortgage loans, as well as home equity loans and otherconsumer loans, available to be sold or securitized totaledapproximately $125 billion at December 31, 2004.
Core customer deposits have historically provided a size-able source of relatively stable and low-cost funds. Averagecore deposits and stockholders’ equity funded 63.1% and63.3% of average total assets in 2004 and 2003, respectively.
The remaining assets were funded by long-term debt,deposits in foreign offices, short-term borrowings (federalfunds purchased, securities sold under repurchase agreements,commercial paper and other short-term borrowings) and trust preferred securities. Short-term borrowings averaged$26.1 billion and $29.9 billion in 2004 and 2003, respectively.Long-term debt, including issuances of trust preferred securi-ties, averaged $67.9 billion and $57.1 billion in 2004 and2003, respectively.
We anticipate making capital expenditures of approximately$1.2 billion in 2005 for stores, relocation and remodeling of
Company facilities, and routine replacement of furniture, equip-ment and servers. We will fund these expenditures from various sources, including retained earnings and borrowings.
Liquidity is also available through our ability to raisefunds in a variety of domestic and international money andcapital markets. We access capital markets for long-termfunding by issuing registered debt, private placements andasset-backed secured funding. Approximately $80 billion of our debt is rated by Moody’s Investors Service as “Aa1”and Fitch, Inc. as “AA,” among the highest ratings given to a financial services company. In September 2003, Moody’sInvestors Service raised Wells Fargo Bank, N.A.’s rating to“Aaa,” its highest investment grade, from “Aa1” and raisedthe Company’s senior debt rating to “Aa1” from “Aa2.” InOctober 2003, Standard & Poor’s Ratings Service raised thecounterparty ratings on the Company to “AA-minus/A-1-plus”from “A-plus/A-1” and the revised outlook for the Companyto stable from positive. Rating agencies base their ratings onmany quantitative and qualitative factors, including capitaladequacy, liquidity, asset quality, business mix and level andquality of earnings. Material changes in these factors couldresult in a different debt rating; however, a change in debtrating would not cause us to violate any of our debt covenants.
PARENT. In March 2003, the Parent registered with theSecurities and Exchange Commission (SEC) for issuance of$15.3 billion in senior and subordinated notes and preferredand common securities. In April 2004, the Parent filed a reg-istration statement with the SEC for issuance of an additional$20 billion in senior and subordinated notes, preferred stockand other securities. During 2004, the Parent issued a totalof $17.1 billion of senior and subordinated notes and trustpreferred securities. At December 31, 2004, the Parent’sremaining issuance capacity under effective registration state-ments was $11.9 billion. We used the proceeds from securi-ties issued in 2004 for general corporate purposes and expectthat the proceeds in the future will also be used for generalcorporate purposes. The Parent also issues commercial paperand has a $1 billion back-up credit facility. In February 2005,the Parent issued $750 million in senior notes.
WELLS FARGO BANK, N.A. In March 2003, Wells Fargo Bank, N.A.established a $50 billion bank note program under which itmay issue up to $20 billion in short-term senior notes out-standing at any time and up to a total of $30 billion in long-term senior and subordinated notes. Securities are issued underthis program as private placements in accordance with Officeof the Comptroller of the Currency (OCC) regulations. During2004, Wells Fargo Bank, N.A. issued $5.9 billion in seniorlong-term notes. At December 31, 2004, the remaining issuanceauthority under the long-term portion was $9.0 billion. InJanuary 2005, Wells Fargo Bank, N.A. issued $225 millionin senior long-term notes. In addition, not under the banknote program, in February 2005, Wells Fargo Bank, N.A.issued $1.5 billion in subordinated debt.
54
Comparison of 2003 with 2002
Net income in 2003 was $6.2 billion, or $3.65 per share,compared with $5.7 billion, or $3.32 per share, before theeffect of the accounting change related to FAS 142, for 2002.On the same basis, return on average assets (ROA) was1.64% and return on average common equity (ROE) was
19.36% in 2003, compared with 1.77% and 19.63%,respectively, for 2002.
Net income in 2003 was $6.2 billion, compared with$5.4 billion in 2002. Diluted earnings per common sharewere $3.65 in 2003, compared with $3.16 in 2002. ROA
Capital Management
We have an active program for managing stockholder capital.We use capital to fund organic growth, acquire banks andother financial services companies, pay dividends and repur-chase our shares. Our objective is to produce above marketlong-term returns by opportunistically using capital whenreturns are perceived to be high and issuing/accumulatingcapital when such costs are perceived to be low.
From time to time our Board of Directors authorizes the Company to repurchase shares of its common stock.Although we announce when our Board authorizes sharerepurchases, we typically do not give any public noticebefore we repurchase our shares. Various factors determinethe amount and timing of our share repurchases, includingour capital requirements, the number of shares we expect to issue for acquisitions and employee benefit plans, marketconditions (including the trading price of our stock), andlegal considerations. These factors can change at any time,and there can be no assurance as to the number of shares we will repurchase or when we will repurchase them.
Historically, our policy has been to repurchase sharesunder the “safe harbor” conditions of Rule 10b-18 of theExchange Act including a limitation on the daily volume ofrepurchases. In November 2003, the SEC amended Rule10b-18 to impose an additional daily volume limitation onshare repurchases during a pending merger or acquisition inwhich shares of our stock will constitute some or all of theconsideration. Our management may determine that duringa pending stock merger or acquisition when the safe harborwould otherwise be available, it is in the Company’s bestinterest to repurchase shares in excess of this additional dailyvolume limitation. In such cases, we intend to repurchaseshares in compliance with the other conditions of the safeharbor, including the standing daily volume limitation thatapplies whether or not there is a pending stock merger or acquisition.
During 2002, the Board of Directors authorized therepurchase of up to 50 million additional shares of our out-standing common stock. In April 2004, the Board authorizedthe repurchase of up to 25 million shares of common stock.During 2004, we repurchased approximately 38 millionshares of our common stock. At December 31, 2004, thetotal remaining common stock repurchase authority underthe 2004 authorization was approximately 13 million shares.In January 2005, the Board authorized the repurchase of upto an additional 25 million shares of common stock. EffectiveFebruary 22, 2005, the Board amended the PartnerShares®
Stock Option Plan to reduce the number of shares available forawards under the plan by 20,000,000 shares. At December 31,2004, there were 21,194,286 shares available for awards underthe plan. (See Note 15 (Common Stock and Stock Plans) foradditional information on our broad-based employee stockoption plans.)
Our potential sources of capital include retained earnings,and issuances of common and preferred stock and subordi-nated debt. In 2004, retained earnings increased $3.6 billion,predominantly as a result of net income of $7.0 billion lessdividends of $3.2 billion. In 2004, we issued $1.7 billion ofcommon stock under various employee benefit and directorplans and under our dividend reinvestment program. TheParent issued $1.9 billion in subordinated debt and trust preferred securities in 2004.
The Company and each of our subsidiary banks are subject to various regulatory capital adequacy requirementsadministered by the Federal Reserve Board and the OCC.Risk-based capital guidelines establish a risk-adjusted ratiorelating capital to different categories of assets and off-balancesheet exposures. At December 31, 2004, the Company andeach of our covered subsidiary banks were “well capitalized”under regulatory standards. See Note 26 (Regulatory andAgency Capital Requirements) to Financial Statements foradditional information.
WELLS FARGO FINANCIAL. In November 2003, Wells FargoFinancial Canada Corporation (WFFCC), a wholly ownedCanadian subsidiary of Wells Fargo Financial, Inc. (WFFI),qualified for distribution with the provincial securitiesexchanges in Canada $1.5 billion (Canadian) of issuanceauthority. In December 2004, WFFCC amended its existingshelf registration by adding $2.5 billion (Canadian) ofissuance authority. During 2004, WFFCC issued $1.1 billion
(Canadian) in senior notes. At December 31, 2004, theremaining issuance capacity for WFFCC was $2.9 billion(Canadian). During 2004, WFFI issued $400 million(Canadian) and $207 million (U.S.) in senior notes as private placements. In 2004, WFFI also entered into asecured borrowing arrangement for $500 million (U.S.).Under the terms of the arrangement, WFFI pledged autoloans as security for the borrowing.
55
We make forward-looking statements in this report and in other reports and proxy statements we file with the SEC. In addition, our senior management might make forward-looking statements orally to analysts, investors, the media and others.
Forward-looking statements include:• projections of our revenues, income, earnings per share,
capital expenditures, dividends, capital structure orother financial items;
• descriptions of plans or objectives of our managementfor future operations, products or services, includingpending acquisitions;
• forecasts of our future economic performance; and• descriptions of assumptions underlying or relating to
any of the foregoing.
In this report, for example, we make forward-lookingstatements about:• the projected funding requirements of the Wells Fargo
Foundation over the next eight to ten years and the
expected funding sources for the 2004 commitment tothe Foundation;
• the amount of integration expense expected to beincurred in 2005 for the Strong Financial transactionand the pending acquisition of First Community Capital Corporation;
• the estimated impact of expensing stock options on2005 earnings per share;
• the anticipated amount of capital expenditures in 2005for stores, relocation and remodeling of facilities, andother items;
• the expected impact of recent accounting standards;• future credit losses and nonperforming assets; and • future short-term and long-term interest rate levels
and their impact on our net interest margin, net income, liquidity and capital.
Forward-looking statements discuss matters that are nothistorical facts. Because they discuss future events or condi-tions, forward-looking statements often include words such
Factors That May Affect Future Results
was 1.64% and ROE was 19.36% in 2003, compared with1.69% and 18.68%, respectively, in 2002.
Net interest income on a taxable-equivalent basis was$16.1 billion in 2003, compared with $14.6 billion in 2002.The 10% increase in net interest income was primarily dueto robust loan growth and significantly lower funding costsresulting from strong core deposit growth and lower whole-sale funding rates. These factors were partially offset byreduced income from a smaller investment portfolio follow-ing the sale, prepayment and maturity of higher yieldingmortgage-backed securities. The net interest margin was5.08% for 2003, compared with 5.53% in 2002. Thedecrease was primarily due to declining loan yields as newvolumes were added to the portfolio at yields below existingloans due to a lower interest rate environment. This was partially offset by significantly reduced funding costs andgrowth in noninterest-bearing funds.
Noninterest income was $12.4 billion in 2003, comparedwith $10.8 billion in 2002. The 15% increase was largelydue to higher mortgage banking noninterest income and feeincome, including service charges on deposit accounts, creditcard fees and charges and fees on loans. Also, the increasereflects net gains from equity investments in 2003, comparedwith losses in 2002. The increase in noninterest income waspartially offset by lower net gains on debt securities in 2003compared with 2002.
Mortgage banking noninterest income was $2.5 billion in 2003, compared with $1.7 billion in 2002. Net servicingfees reflected losses of $1.0 billion in 2003, compared with$.7 billion in 2002. The increase in net losses from servicingfees was primarily due to lower average interest rates, whichresulted in higher MSRs amortization and an increase to the
valuation allowance. The increase in net losses was partiallyoffset by an increase in gross servicing fees due to an 18%growth in the servicing portfolio. Net gains on mortgageloan origination/sales activities increased to $3.0 billion in 2003 from $2.1 billion in 2002, primarily due to highermortgage origination volume and gains on loan sales.Originations during 2003 grew to $470 billion from $333 billion in 2002.
Revenue, the sum of net interest income and noninterestincome, increased from $25.2 billion in 2002 to $28.4 billionin 2003, or 12%.
Noninterest expense totaled $17.2 billion in 2003, compared with $14.7 billion in 2002, an increase of 17%.The increase in noninterest expense, including increases insalaries, employee benefits, incentive compensation, contractservices, advertising and promotion and postage, was largelydue to the growth in the mortgage banking business, whichaccounted for approximately 48% of the increase from 2002.The increase was also due to charitable donations, predomi-nantly donations of appreciated public equity securities tothe Wells Fargo Foundation.
The provision for credit losses was $1.72 billion in 2003,compared with $1.68 billion in 2002. During 2003, netcharge-offs were .81% of average total loans, compared with .96% during 2002. The allowance for credit losses was$3.89 billion, or 1.54% of total loans, at December 31, 2003,compared with $3.82 billion, or 1.98%, at December 31, 2002.
At December 31, 2003, total nonaccrual loans were$1.46 billion, or .58% of total loans, compared with$1.49 billion, or .78%, at December 31, 2002. Foreclosedassets were $198 million at December 31, 2003, and$195 million at December 31, 2002.
56
as “anticipate,” “believe,” “estimate,” “expect,” “intend,”“plan,” “project,” “target,” “can,” “could,” “may,” “should,”“will,” “would” or similar expressions. Do not unduly relyon forward-looking statements. They give our expectationsabout the future and are not guarantees. Forward-lookingstatements speak only as of the date they are made, and wemight not update them to reflect changes that occur after thedate they are made.
There are a number of factors—many beyond our control—that could cause results to differ significantly from our expec-tations. Some of these factors are described below. Other fac-tors, such as credit, market, operational, liquidity, interestrate and other risks, are described elsewhere in this report(see, for example, “Balance Sheet Analysis”). Factors relatingto the regulation and supervision are described in our AnnualReport on Form 10-K for the year ended December 31, 2004.Any factor described in this report or in our 2004 Form 10-Kcould by itself, or together with one or more other factors,adversely affect our business, results of operations or finan-cial condition. There are also other factors that we have notdescribed in this report or in our 2004 Form 10-K that couldcause results to differ from our expectations.
Industry FactorsAS A FINANCIAL SERVICES COMPANY, OUR EARNINGS ARE SIGNIFICANTLY
AFFECTED BY GENERAL BUSINESS AND ECONOMIC CONDITIONS.
Our business and earnings are affected by general businessand economic conditions in the United States and abroad.These conditions include short-term and long-term interestrates, inflation, monetary supply, fluctuations in both debtand equity capital markets, and the strength of the U.S.economy and the local economies in which we operate. Forexample, an economic downturn, an increase in unemploy-ment, or other events that affect household and/or corporateincomes could decrease the demand for loan and non-loanproducts and services and increase the number of customerswho fail to pay interest or principal on their loans.
Geopolitical conditions can also affect our earnings. Actsor threats of terrorism, actions taken by the U.S. or othergovernments in response to acts or threats of terrorism and/ormilitary conflicts, could affect business and economic conditionsin the U.S. and abroad. The terrorist attacks in 2001, forexample, caused an immediate decrease in air travel, whichaffected the airline industry, lodging, gaming and tourism.
We discuss other business and economic conditions inmore detail elsewhere in this report.
THE FISCAL AND MONETARY POLICIES OF THE FEDERAL GOVERNMENT
AND ITS AGENCIES SIGNIFICANTLY AFFECT OUR EARNINGS.
The Board of Governors of the Federal Reserve System reg-ulates the supply of money and credit in the United States.Its policies determine in large part our cost of funds forlending and investing and the return we earn on those loansand investments, both of which affect our net interest mar-gin. They also can materially affect the value of financialinstruments we hold, such as debt securities and mortgageservicing rights. Its policies also can affect our borrowers,
potentially increasing the risk that they may fail to repaytheir loans. Changes in Federal Reserve Board policies arebeyond our control and hard to predict.
THE FINANCIAL SERVICES INDUSTRY IS HIGHLY COMPETITIVE.
We operate in a highly competitive industry that could becomeeven more competitive as a result of legislative, regulatoryand technological changes and continued consolidation.Banks, securities firms and insurance companies now canmerge by creating a “financial holding company,” which canoffer virtually any type of financial service, including banking,securities underwriting, insurance (both agency and under-writing) and merchant banking. Recently, a number of for-eign banks have acquired financial services companies in the United States, further increasing competition in the U.S.market. Also, technology has lowered barriers to entry andmade it possible for nonbanks to offer products and servicestraditionally provided by banks, such as automatic transferand automatic payment systems. Many of our competitorshave fewer regulatory constraints and some have lower cost structures.
WE ARE HEAVILY REGULATED BY FEDERAL AND STATE AGENCIES.
The Parent, our subsidiary banks and many of our nonbanksubsidiaries are heavily regulated at the federal and state levels. This regulation is to protect depositors, federal depositinsurance funds and the banking system as a whole, notsecurity holders. Congress and state legislatures and federaland state regulatory agencies continually review bankinglaws, regulations and policies for possible changes. Changesto statutes, regulations or regulatory policies, including interpretation or implementation of statutes, regulations or policies, could affect us in substantial and unpredictableways including limiting the types of financial services andproducts we may offer and/or increasing the ability of nonbanksto offer competing financial services and products. Also, ifwe do not comply with laws, regulations or policies, we couldreceive regulatory sanctions and damage to our reputation.For more information, refer to the “Regulation and Supervision”section of our 2004 Form 10-K and to Notes 3 (Cash, Loanand Dividend Restrictions) and 26 (Regulatory and AgencyCapital Requirements) to Financial Statements.
FUTURE LEGISLATION COULD CHANGE OUR COMPETITIVE POSITION.
Legislation is from time to time introduced in the Congress,including proposals to substantially change the financialinstitution regulatory system and to expand or contract thepowers of banking institutions and bank holding companies.This legislation may change banking statutes and our operatingenvironment in substantial and unpredictable ways. If enacted,such legislation could increase or decrease the cost of doingbusiness, limit or expand permissible activities or affect thecompetitive balance among banks, savings associations, creditunions and other financial institutions. We cannot predictwhether any of this potential legislation will be enacted, andif enacted, the effect that it, or any regulations, would haveon our financial condition or results of operations.
57
WE DEPEND ON THE ACCURACY AND COMPLETENESS OF INFORMATION
ABOUT CUSTOMERS AND COUNTERPARTIES.
In deciding whether to extend credit or enter into othertransactions with customers and counterparties, we may relyon information furnished to us by or on behalf of customersand counterparties, including financial statements and otherfinancial information. We also may rely on representations of customers and counterparties as to the accuracy and completeness of that information and, with respect to financial statements, on reports of independent auditors. For example, in deciding whether to extend credit, we mayassume that a customer’s audited financial statements con-form with GAAP and present fairly, in all material respects,the financial condition, results of operations and cash flowsof the customer. We also may rely on the audit report covering those financial statements. Our financial conditionand results of operations could be negatively affected byrelying on financial statements that do not comply withGAAP or that are materially misleading.
CONSUMERS MAY DECIDE NOT TO USE BANKS TO COMPLETE THEIR
FINANCIAL TRANSACTIONS.
Technology and other changes now allow parties to completefinancial transactions without banks. For example, consumerscan pay bills and transfer funds directly without banks. Theprocess of eliminating banks as intermediaries, known as“disintermediation,” could result in the loss of fee income, as well as the loss of customer deposits and income generatedfrom those deposits.
Company FactorsMAINTAINING OR INCREASING OUR MARKET SHARE DEPENDS
ON MARKET ACCEPTANCE AND REGULATORY APPROVAL OF
NEW PRODUCTS AND SERVICES.
Our success depends, in part, on our ability to adapt ourproducts and services to evolving industry standards. There isincreasing pressure to provide products and services at lowerprices. This can reduce our net interest margin and revenuesfrom our fee-based products and services. In addition, thewidespread adoption of new technologies, including internetservices, could require us to make substantial expenditures tomodify or adapt our existing products and services. We mightnot be successful in introducing new products and services,achieving market acceptance of our products and services, ordeveloping and maintaining loyal customers.
NEGATIVE PUBLIC OPINION COULD DAMAGE OUR REPUTATION AND
ADVERSELY IMPACT OUR EARNINGS.
Reputation risk, or the risk to our earnings and capital fromnegative public opinion, is inherent in our business. Negativepublic opinion can result from our actual or alleged conductin any number of activities, including lending practices, cor-porate governance and acquisitions, and from actions takenby government regulators and community organizations inresponse to those activities. Negative public opinion canadversely affect our ability to keep and attract customers and can expose us to litigation and regulatory action. Becausevirtually all our businesses operate under the “Wells Fargo”
brand, actual or alleged conduct by one business can result innegative public opinion about other Wells Fargo businesses.Although we take steps to minimize reputation risk in dealingwith our customers and communities, as a large diversifiedfinancial services company with a relatively high industryprofile, the risk will always be present in our organization.
THE PARENT RELIES ON DIVIDENDS FROM ITS SUBSIDIARIES FOR
MOST OF ITS REVENUE.
The Parent is a separate and distinct legal entity from itssubsidiaries. It receives substantially all of its revenue fromdividends from its subsidiaries. These dividends are the principal source of funds to pay dividends on the Parent’scommon and preferred stock and interest and principal onits debt. Various federal and/or state laws and regulationslimit the amount of dividends that our bank and certain ofour nonbank subsidiaries may pay to the Parent. Also, theParent’s right to participate in a distribution of assets upon a subsidiary’s liquidation or reorganization is subject to theprior claims of the subsidiary’s creditors. For more information,refer to “Regulation and Supervision – Dividend Restrictions”and “ – Holding Company Structure” in our 2004 Form 10-K.
OUR ACCOUNTING POLICIES AND METHODS ARE KEY TO HOW WE
REPORT OUR FINANCIAL CONDITION AND RESULTS OF OPERATIONS.
THEY MAY REQUIRE MANAGEMENT TO MAKE ESTIMATES ABOUT
MATTERS THAT ARE UNCERTAIN.
Our accounting policies and methods are fundamental tohow we record and report our financial condition and resultsof operations. Our management must exercise judgment inselecting and applying many of these accounting policies andmethods so they comply with GAAP and reflect management’sjudgment of the most appropriate manner to report ourfinancial condition and results. In some cases, managementmust select the accounting policy or method to apply fromtwo or more alternatives, any of which might be reasonableunder the circumstances yet might result in our reportingmaterially different amounts than would have been reportedunder a different alternative. Note 1 (Summary of SignificantAccounting Policies) to Financial Statements describes oursignificant accounting policies.
Three accounting policies are critical to presenting ourfinancial condition and results. They require management to make difficult, subjective or complex judgments aboutmatters that are uncertain. Materially different amountscould be reported under different conditions or using differentassumptions. These critical accounting policies relate to: (1) the allowance for credit losses, (2) the valuation of mortgage servicing rights, and (3) pension accounting.Because of the uncertainty of estimates about these matters,we cannot provide any assurance that we will not:
• significantly increase our allowance for credit lossesand/or sustain credit losses that are significantly higherthan the reserve provided;
• recognize significant provision for impairment of ourmortgage servicing rights; or
• significantly increase our pension liability.
58
For more information, refer in this report to “CriticalAccounting Policies,” “Balance Sheet Analysis” and “Risk Management.”
CHANGES IN ACCOUNTING STANDARDS COULD MATERIALLY IMPACT
OUR FINANCIAL STATEMENTS.
From time to time the Financial Accounting Standards Board (FASB) changes the financial accounting and reportingstandards that govern the preparation of our financial statements. These changes can be hard to predict and canmaterially impact how we record and report our financialcondition and results of operations. In some cases, we couldbe required to apply a new or revised standard retroactively,resulting in our restating prior period financial statements.
WE HAVE BUSINESSES OTHER THAN BANKING.
We are a diversified financial services company. In additionto banking, we provide insurance, investments, mortgagesand consumer finance. Although we believe our diversityhelps lessen the effect when downturns affect any one segment of our industry, it also means our earnings could be subject to different risks and uncertainties. We discusssome examples below.
MERCHANT BANKING. Our merchant banking business, whichincludes venture capital investments, has a much greater riskof capital losses than our traditional banking business. Also,it is difficult to predict the timing of any gains from thisbusiness. Realization of gains from our venture capitalinvestments depends on a number of factors—many beyondour control—including general economic conditions, theprospects of the companies in which we invest, when thesecompanies go public, the size of our position relative to thepublic float, and whether we are subject to any resale restric-tions. Factors, such as a slowdown in consumer demand or a decline in capital spending, could result in declines in thevalues of our publicly-traded and private equity securities. If we determine that the declines are other-than-temporary,additional impairment charges would be recognized. Also,we will realize losses to the extent we sell securities at lessthan book value. For more information, see in this report“Balance Sheet Analysis – Securities Available for Sale.”
MORTGAGE BANKING. The effect of interest rates on our mort-gage business can be large and complex. Changes in interestrates can affect loan origination fees and loan servicing fees,which account for a significant portion of mortgage-relatedrevenues. A decline in mortgage rates generally increases the demand for mortgage loans as borrowers refinance, but also generally leads to accelerated payoffs in our mortgageservicing portfolio. Conversely, in a constant or increasingrate environment, we would expect fewer loans to be refi-nanced and a decline in payoffs in our servicing portfolio.We use dynamic, sophisticated models to assess the effect of interest rates on mortgage fees, amortization of mortgageservicing rights, and the value of mortgage servicing rights.
The estimates of net income and fair value produced by these models, however, depend on assumptions of futureloan demand, prepayment speeds and other factors that mayoverstate or understate actual experience. We use derivativesto hedge the value of our servicing portfolio but they do notcover the full value of the portfolio. We cannot assure thatthe hedges will offset significant decreases in the value of theportfolio. For more information, see in this report “CriticalAccounting Policies – Valuation of Mortgage Servicing Rights”and “Asset /Liability and Market Risk Management.”
WE RELY ON OTHER COMPANIES TO PROVIDE KEY COMPONENTS
OF OUR BUSINESS INFRASTRUCTURE.
Third parties provide key components of our business infrastructure such as internet connections and networkaccess. Any disruption in internet, network access or othervoice or data communication services provided by these thirdparties or any failure of these third parties to handle currentor higher volumes of use could adversely affect our ability todeliver products and services to our customers and otherwiseto conduct our business. Technological or financial difficultiesof a third party service provider could adversely affect ourbusiness to the extent those difficulties result in the interrup-tion or discontinuation of services provided by that party.
WE HAVE AN ACTIVE ACQUISITION PROGRAM.
We regularly explore opportunities to acquire financial institutions and other financial services providers. We cannotpredict the number, size or timing of acquisitions. We typicallydo not comment publicly on a possible acquisition or businesscombination until we have signed a definitive agreement.
We must generally receive federal regulatory approvalbefore we can acquire a bank or bank holding company. Indetermining whether to approve a proposed bank acquisition,federal bank regulators will consider, among other factors,the effect of the acquisition on competition, financial condi-tion, and future prospects including current and projectedcapital ratios and levels, the competence, experience, andintegrity of management and record of compliance with lawsand regulations, the convenience and needs of the communi-ties to be served, including the acquiring institution’s recordof compliance under the Community Reinvestment Act, and the effectiveness of the acquiring institution in combat-ing money laundering activities. In addition, we cannot be certain when or if, or on what terms and conditions, anyrequired regulatory approvals will be granted. We might berequired to sell banks or branches as a condition to receivingregulatory approval.
Difficulty in integrating an acquired company may causeus not to realize expected revenue increases, cost savings,increases in geographic or product presence, and/or otherprojected benefits from the acquisition. The integration couldresult in higher than expected deposit attrition (run-off), lossof key employees, disruption of our business or the businessof the acquired company, or otherwise adversely affect ourability to maintain relationships with customers and employeesor achieve the anticipated benefits of the acquisition. Also,
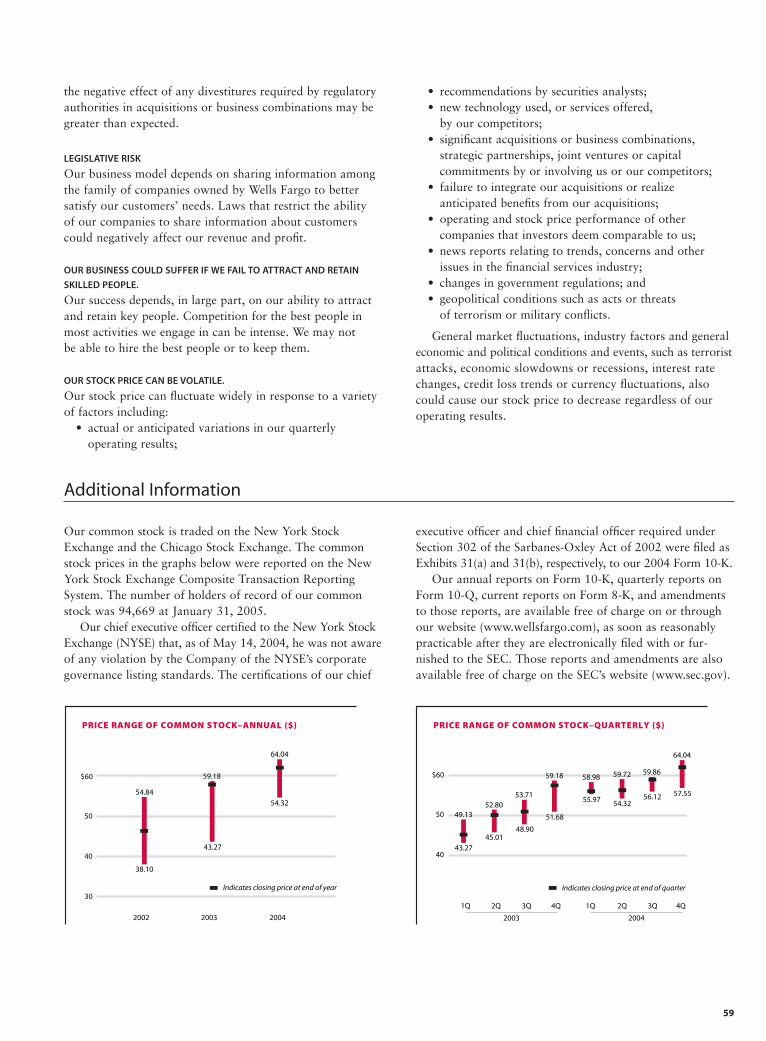
59
Additional Information
Our common stock is traded on the New York StockExchange and the Chicago Stock Exchange. The commonstock prices in the graphs below were reported on the NewYork Stock Exchange Composite Transaction ReportingSystem. The number of holders of record of our commonstock was 94,669 at January 31, 2005.
Our chief executive officer certified to the New York StockExchange (NYSE) that, as of May 14, 2004, he was not awareof any violation by the Company of the NYSE’s corporategovernance listing standards. The certifications of our chief
2004 20032002
$60
50
40
30
PRICE RANGE OF COMMON STOCK–ANNUAL ($)
Indicates closing price at end of year
54.84
38.10
59.18
43.27
64.04
54.32
$60
50
40
PRICE RANGE OF COMMON STOCK–QUARTERLY ($)
4Q3Q2Q1Q
2003
4Q3Q2Q1Q
2004
Indicates closing price at end of quarter
43.27
49.13
45.01
52.80
48.90
53.71
59.18
51.68
55.97
58.98
54.32
59.72
56.12
59.86
64.04
57.55
executive officer and chief financial officer required underSection 302 of the Sarbanes-Oxley Act of 2002 were filed asExhibits 31(a) and 31(b), respectively, to our 2004 Form 10-K.
Our annual reports on Form 10-K, quarterly reports onForm 10-Q, current reports on Form 8-K, and amendmentsto those reports, are available free of charge on or throughour website (www.wellsfargo.com), as soon as reasonablypracticable after they are electronically filed with or fur-nished to the SEC. Those reports and amendments are alsoavailable free of charge on the SEC’s website (www.sec.gov).
the negative effect of any divestitures required by regulatoryauthorities in acquisitions or business combinations may begreater than expected.
LEGISLATIVE RISK
Our business model depends on sharing information amongthe family of companies owned by Wells Fargo to better satisfy our customers’ needs. Laws that restrict the ability of our companies to share information about customerscould negatively affect our revenue and profit.
OUR BUSINESS COULD SUFFER IF WE FAIL TO ATTRACT AND RETAIN
SKILLED PEOPLE.
Our success depends, in large part, on our ability to attractand retain key people. Competition for the best people inmost activities we engage in can be intense. We may not be able to hire the best people or to keep them.
OUR STOCK PRICE CAN BE VOLATILE.
Our stock price can fluctuate widely in response to a varietyof factors including:
• actual or anticipated variations in our quarterly operating results;
• recommendations by securities analysts;• new technology used, or services offered,
by our competitors;• significant acquisitions or business combinations,
strategic partnerships, joint ventures or capital commitments by or involving us or our competitors;
• failure to integrate our acquisitions or realize anticipated benefits from our acquisitions;
• operating and stock price performance of other companies that investors deem comparable to us;
• news reports relating to trends, concerns and otherissues in the financial services industry;
• changes in government regulations; and • geopolitical conditions such as acts or threats
of terrorism or military conflicts.
General market fluctuations, industry factors and generaleconomic and political conditions and events, such as terroristattacks, economic slowdowns or recessions, interest ratechanges, credit loss trends or currency fluctuations, alsocould cause our stock price to decrease regardless of ouroperating results.
60
Internal control over financial reporting is defined in Rule 13a-15(f) promulgated under the Securities Exchange Act of 1934 as a process designed by, or under the supervision of, the company’s principal executive and principal financialofficers and effected by the company’s board of directors, management and other personnel, to provide reasonableassurance regarding the reliability of financial reporting and the preparation of financial statements for external purposes in accordance with generally accepted accounting principles and includes those policies and procedures that:
• Pertain to the maintenance of records that in reasonable detail accurately and fairly reflect the transactions and dispositions of assets of the company;
• Provide reasonable assurance that transactions are recorded as necessary to permit preparation of financial statements in accordance with generally accepted accounting principles, and that receipts and expenditures of the company are being made only in accordance with authorizations of management and directors of the company; and
• Provide reasonable assurance regarding prevention or timely detection of unauthorized acquisition, use or disposition of the company’s assets that could have a material effect on the financial statements.
Because of its inherent limitations, internal control over financial reporting may not prevent or detect misstatements.Projections of any evaluation of effectiveness to future periods are subject to the risk that controls may becomeinadequate because of changes in conditions, or that the degree of compliance with the policies or procedures maydeteriorate. No change occurred during fourth quarter 2004 that has materially affected, or is reasonably likely tomaterially affect, the Company’s internal control over financial reporting. Management’s report on internal controlover financial reporting is set forth below, and should be read with these limitations in mind.
Management’s Report on Internal Control over Financial ReportingThe Company’s management is responsible for establishing and maintaining adequate internal control over financialreporting for the Company. Management assessed the effectiveness of the Company’s internal control over financialreporting as of December 31, 2004, using the criteria set forth by the Committee of Sponsoring Organizations of theTreadway Commission (COSO) in Internal Control – Integrated Framework. Based on this assessment, managementconcluded that as of December 31, 2004, the Company’s internal control over financial reporting was effective.
KPMG LLP, the independent registered public accounting firm that audited the Company’s financial statementsincluded in this Annual Report, issued an audit report on management’s assessment of the Company’s internal control over financial reporting. KPMG’s audit report appears on the following page.
Internal Control over Financial Reporting
Controls and Procedures
Disclosure Controls and Procedures
As required by SEC rules, the Company’s management evaluated the effectiveness, as of December 31, 2004, of theCompany’s disclosure controls and procedures. The Company’s chief executive officer and chief financial officer participated in the evaluation. Based on this evaluation, the Company’s chief executive officer and the chief financialofficer concluded that the Company’s disclosure controls and procedures were effective as of December 31, 2004.
61
Report of Independent Registered Public Accounting Firm
The Board of Directors and Stockholders Wells Fargo & Company:
We have audited management’s assessment, included in the accompanying Management’s Report on InternalControl over Financial Reporting, that Wells Fargo & Company and Subsidiaries (“the Company”) maintained effective internal control over financial reporting as of December 31, 2004, based on criteria established in InternalControl – Integrated Framework issued by the Committee of Sponsoring Organizations of the Treadway Commission(COSO). The Company’s management is responsible for maintaining effective internal control over financial reportingand for its assessment of the effectiveness of internal control over financial reporting. Our responsibility is to expressan opinion on management’s assessment and an opinion on the effectiveness of the Company’s internal control overfinancial reporting based on our audit.
We conducted our audit in accordance with the standards of the Public Company Accounting Oversight Board(United States). Those standards require that we plan and perform the audit to obtain reasonable assurance aboutwhether effective internal control over financial reporting was maintained in all material respects. Our audit includedobtaining an understanding of internal control over financial reporting, evaluating management’s assessment, testingand evaluating the design and operating effectiveness of internal control, and performing such other procedures as weconsidered necessary in the circumstances. We believe that our audit provides a reasonable basis for our opinion.
A company’s internal control over financial reporting is a process designed to provide reasonable assuranceregarding the reliability of financial reporting and the preparation of financial statements for external purposes inaccordance with generally accepted accounting principles. A company’s internal control over financial reportingincludes those policies and procedures that (1) pertain to the maintenance of records that, in reasonable detail, accurately and fairly reflect the transactions and dispositions of the assets of the company; (2) provide reasonableassurance that transactions are recorded as necessary to permit preparation of financial statements in accordancewith generally accepted accounting principles, and that receipts and expenditures of the company are being madeonly in accordance with authorizations of management and directors of the company; and (3) provide reasonableassurance regarding prevention or timely detection of unauthorized acquisition, use, or disposition of the company’sassets that could have a material effect on the financial statements.
Because of its inherent limitations, internal control over financial reporting may not prevent or detect misstate-ments. Also, projections of any evaluation of effectiveness to future periods are subject to the risk that controls maybecome inadequate because of changes in conditions, or that the degree of compliance with the policies or proceduresmay deteriorate.
In our opinion, management’s assessment that Wells Fargo & Company and Subsidiaries maintained effectiveinternal control over financial reporting as of December 31, 2004, is fairly stated, in all material respects, based oncriteria established in Internal Control – Integrated Framework issued by the Committee of Sponsoring Organizationsof the Treadway Commission (COSO). Also in our opinion, Wells Fargo & Company and Subsidiaries maintained, in all material respects, effective internal control over financial reporting as of December 31, 2004, based on criteriaestablished in Internal Control – Integrated Framework issued by the Committee of Sponsoring Organizations of theTreadway Commission (COSO).
We also have audited, in accordance with the standards of the Public Company Accounting Oversight Board(United States), the consolidated balance sheet of Wells Fargo & Company and Subsidiaries as of December 31, 2004and 2003, and the related consolidated statements of income, changes in stockholders’ equity and comprehensiveincome, and cash flows for each of the years in the three-year period ended December 31, 2004, and our report dated February 23, 2005 expressed an unqualified opinion on those consolidated financial statements.
San Francisco, CaliforniaFebruary 23, 2005
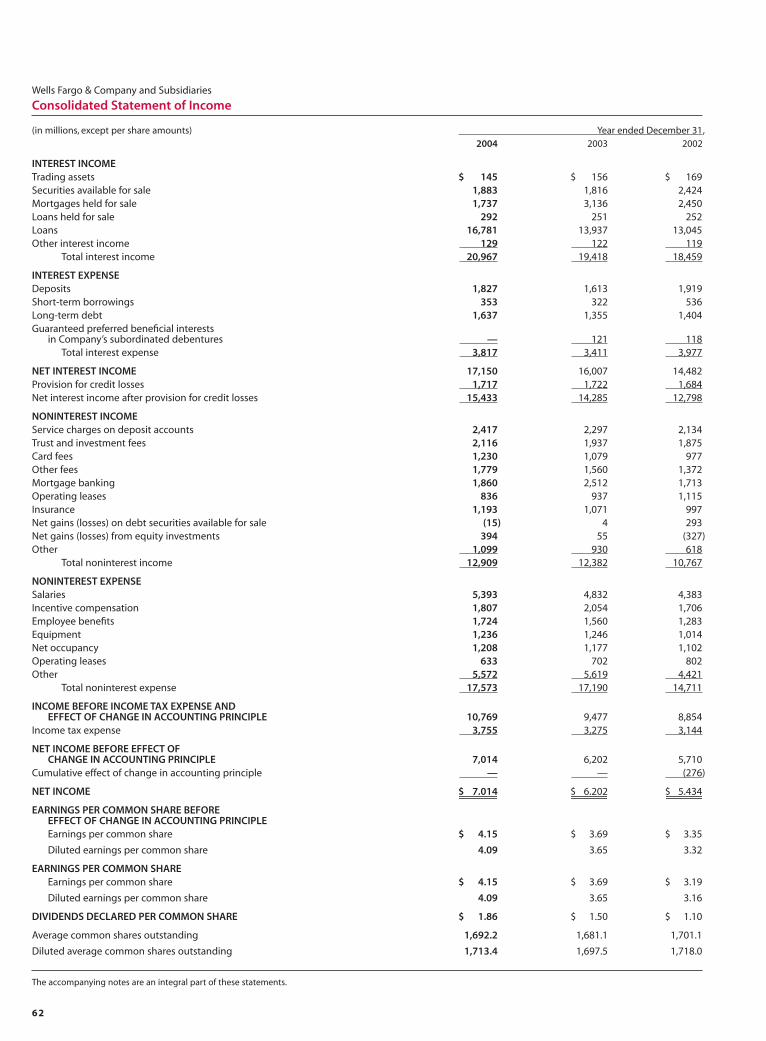
62
Wells Fargo & Company and Subsidiaries
Consolidated Statement of Income
(in millions, except per share amounts) Year ended December 31,2004 2003 2002
INTEREST INCOMETrading assets $ 145 $ 156 $ 169Securities available for sale 1,883 1,816 2,424Mortgages held for sale 1,737 3,136 2,450Loans held for sale 292 251 252Loans 16,781 13,937 13,045Other interest income 129 122 119
Total interest income 20,967 19,418 18,459
INTEREST EXPENSEDeposits 1,827 1,613 1,919Short-term borrowings 353 322 536Long-term debt 1,637 1,355 1,404Guaranteed preferred beneficial interests
in Company’s subordinated debentures — 121 118Total interest expense 3,817 3,411 3,977
NET INTEREST INCOME 17,150 16,007 14,482Provision for credit losses 1,717 1,722 1,684Net interest income after provision for credit losses 15,433 14,285 12,798
NONINTEREST INCOMEService charges on deposit accounts 2,417 2,297 2,134Trust and investment fees 2,116 1,937 1,875Card fees 1,230 1,079 977Other fees 1,779 1,560 1,372Mortgage banking 1,860 2,512 1,713Operating leases 836 937 1,115Insurance 1,193 1,071 997Net gains (losses) on debt securities available for sale (15) 4 293Net gains (losses) from equity investments 394 55 (327)Other 1,099 930 618
Total noninterest income 12,909 12,382 10,767
NONINTEREST EXPENSESalaries 5,393 4,832 4,383Incentive compensation 1,807 2,054 1,706Employee benefits 1,724 1,560 1,283Equipment 1,236 1,246 1,014Net occupancy 1,208 1,177 1,102Operating leases 633 702 802Other 5,572 5,619 4,421
Total noninterest expense 17,573 17,190 14,711
INCOME BEFORE INCOME TAX EXPENSE AND EFFECT OF CHANGE IN ACCOUNTING PRINCIPLE 10,769 9,477 8,854
Income tax expense 3,755 3,275 3,144
NET INCOME BEFORE EFFECT OF CHANGE IN ACCOUNTING PRINCIPLE 7,014 6,202 5,710
Cumulative effect of change in accounting principle — — (276)
NET INCOME $ 7,014 $ 6,202 $ 5,434
EARNINGS PER COMMON SHARE BEFORE EFFECT OF CHANGE IN ACCOUNTING PRINCIPLEEarnings per common share $ 4.15 $ 3.69 $ 3.35
Diluted earnings per common share 4.09 3.65 3.32
EARNINGS PER COMMON SHAREEarnings per common share $ 4.15 $ 3.69 $ 3.19
Diluted earnings per common share 4.09 3.65 3.16
DIVIDENDS DECLARED PER COMMON SHARE $ 1.86 $ 1.50 $ 1.10
Average common shares outstanding 1,692.2 1,681.1 1,701.1
Diluted average common shares outstanding 1,713.4 1,697.5 1,718.0
The accompanying notes are an integral part of these statements.
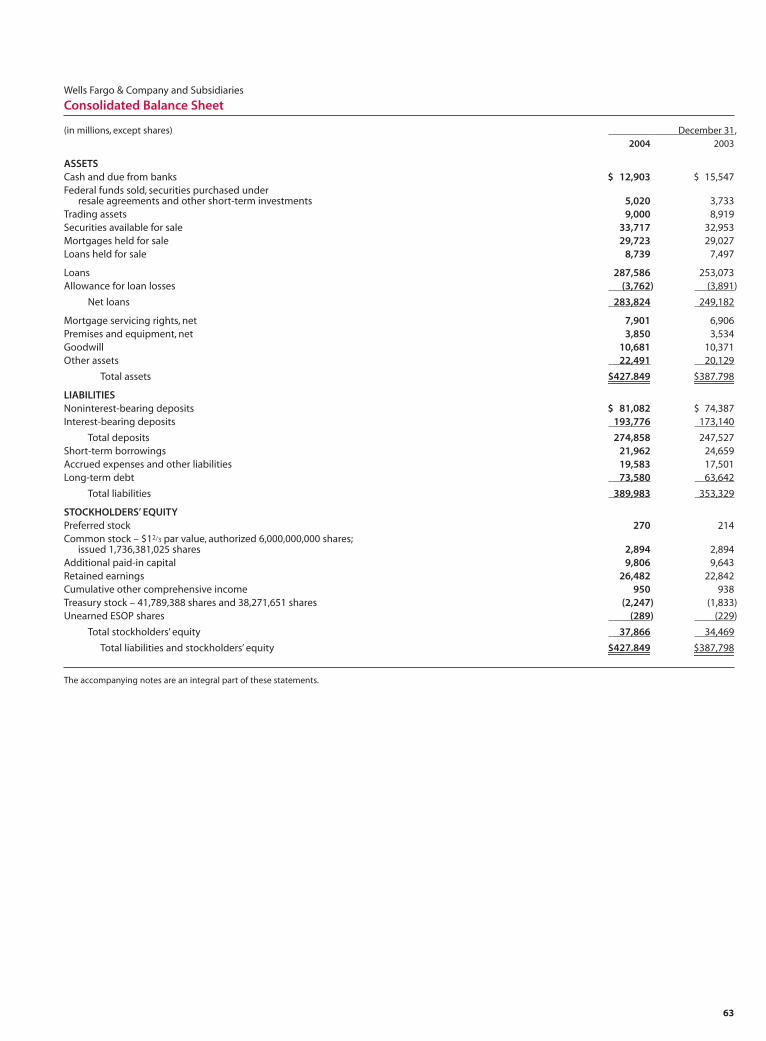
63
Wells Fargo & Company and Subsidiaries
Consolidated Balance Sheet
(in millions, except shares) December 31,2004 2003
ASSETSCash and due from banks $ 12,903 $ 15,547Federal funds sold, securities purchased under
resale agreements and other short-term investments 5,020 3,733Trading assets 9,000 8,919Securities available for sale 33,717 32,953Mortgages held for sale 29,723 29,027Loans held for sale 8,739 7,497
Loans 287,586 253,073Allowance for loan losses (3,762) (3,891)
Net loans 283,824 249,182
Mortgage servicing rights, net 7,901 6,906Premises and equipment, net 3,850 3,534Goodwill 10,681 10,371Other assets 22,491 20,129
Total assets $427,849 $387,798
LIABILITIESNoninterest-bearing deposits $ 81,082 $ 74,387Interest-bearing deposits 193,776 173,140
Total deposits 274,858 247,527Short-term borrowings 21,962 24,659Accrued expenses and other liabilities 19,583 17,501Long-term debt 73,580 63,642
Total liabilities 389,983 353,329
STOCKHOLDERS’ EQUITYPreferred stock 270 214Common stock – $12/3 par value, authorized 6,000,000,000 shares;
issued 1,736,381,025 shares 2,894 2,894Additional paid-in capital 9,806 9,643Retained earnings 26,482 22,842Cumulative other comprehensive income 950 938Treasury stock – 41,789,388 shares and 38,271,651 shares (2,247) (1,833)Unearned ESOP shares (289) (229)
Total stockholders’ equity 37,866 34,469
Total liabilities and stockholders’ equity $427,849 $387,798
The accompanying notes are an integral part of these statements.
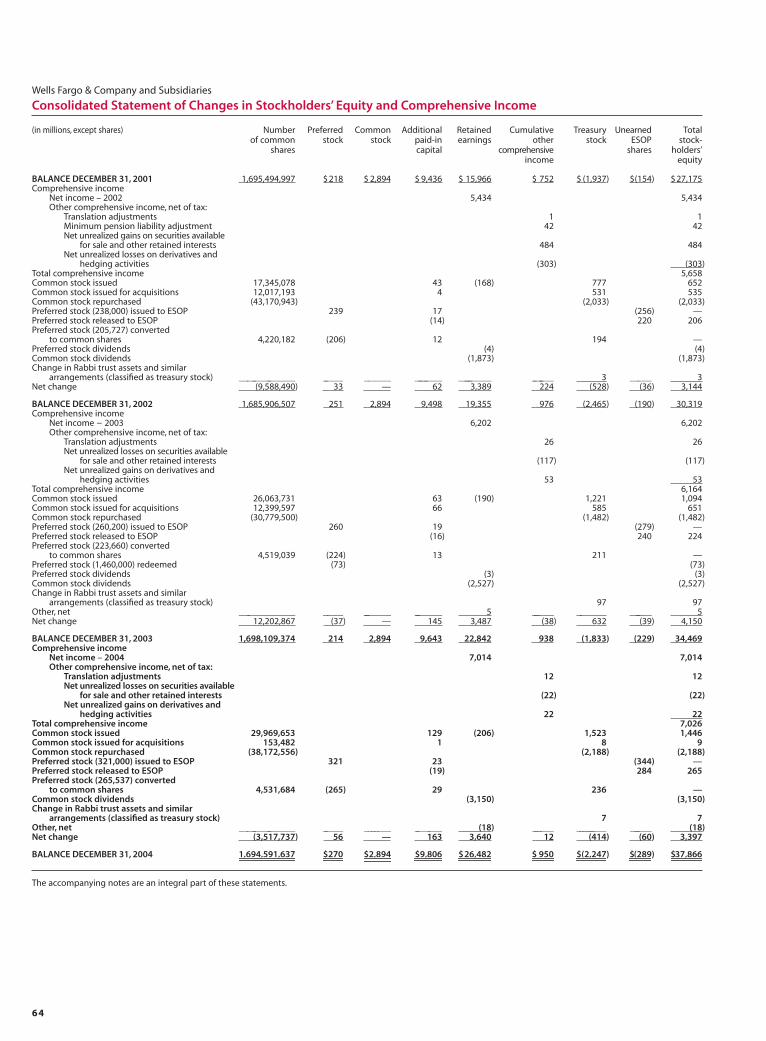
64
Wells Fargo & Company and Subsidiaries
Consolidated Statement of Changes in Stockholders’ Equity and Comprehensive Income
(in millions, except shares) Number Preferred Common Additional Retained Cumulative Treasury Unearned Totalof common stock stock paid-in earnings other stock ESOP stock-
shares capital comprehensive shares holders’income equity
BALANCE DECEMBER 31, 2001 1,695,494,997 $218 $ 2,894 $ 9,436 $ 15,966 $ 752 $ (1,937) $(154) $27,175Comprehensive income
Net income – 2002 5,434 5,434Other comprehensive income, net of tax:
Translation adjustments 1 1Minimum pension liability adjustment 42 42Net unrealized gains on securities available
for sale and other retained interests 484 484Net unrealized losses on derivatives and
hedging activities (303) (303)Total comprehensive income 5,658Common stock issued 17,345,078 43 (168) 777 652Common stock issued for acquisitions 12,017,193 4 531 535Common stock repurchased (43,170,943) (2,033) (2,033)Preferred stock (238,000) issued to ESOP 239 17 (256) —Preferred stock released to ESOP (14) 220 206Preferred stock (205,727) converted
to common shares 4,220,182 (206) 12 194 —Preferred stock dividends (4) (4)Common stock dividends (1,873) (1,873)Change in Rabbi trust assets and similar
arrangements (classified as treasury stock) ______________ _____ ______ ________ _________ _______ 3 _____ 3Net change (9,588,490) 33 — 62 3,389 224 (528) (36) 3,144
BALANCE DECEMBER 31, 2002 1,685,906,507 251 2,894 9,498 19,355 976 (2,465) (190) 30,319Comprehensive income
Net income – 2003 6,202 6,202Other comprehensive income, net of tax:
Translation adjustments 26 26Net unrealized losses on securities available
for sale and other retained interests (117) (117)Net unrealized gains on derivatives and
hedging activities 53 53Total comprehensive income 6,164Common stock issued 26,063,731 63 (190) 1,221 1,094Common stock issued for acquisitions 12,399,597 66 585 651Common stock repurchased (30,779,500) (1,482) (1,482)Preferred stock (260,200) issued to ESOP 260 19 (279) —Preferred stock released to ESOP (16) 240 224Preferred stock (223,660) converted
to common shares 4,519,039 (224) 13 211 —Preferred stock (1,460,000) redeemed (73) (73)Preferred stock dividends (3) (3)Common stock dividends (2,527) (2,527)Change in Rabbi trust assets and similar
arrangements (classified as treasury stock) 97 97Other, net ___________ ____ ______ ______ 5 _____ ______ _____ 5Net change 12,202,867 (37) — 145 3,487 (38) 632 (39) 4,150
BALANCE DECEMBER 31, 2003 1,698,109,374 214 2,894 9,643 22,842 938 (1,833) (229) 34,469Comprehensive income
Net income – 2004 7,014 7,014Other comprehensive income, net of tax:
Translation adjustments 12 12Net unrealized losses on securities available
for sale and other retained interests (22) (22)Net unrealized gains on derivatives and
hedging activities 22 22Total comprehensive income 7,026Common stock issued 29,969,653 129 (206) 1,523 1,446Common stock issued for acquisitions 153,482 1 8 9Common stock repurchased (38,172,556) (2,188) (2,188)Preferred stock (321,000) issued to ESOP 321 23 (344) —Preferred stock released to ESOP (19) 284 265Preferred stock (265,537) converted
to common shares 4,531,684 (265) 29 236 —Common stock dividends (3,150) (3,150)Change in Rabbi trust assets and similar
arrangements (classified as treasury stock) 7 7Other, net ______________ _____ _______ _______ (18) ______ _________ ______ (18)Net change (3,517,737) 56 — 163 3,640 12 (414) (60) 3,397
BALANCE DECEMBER 31, 2004 1,694,591,637 $270 $2,894 $9,806 $26,482 $ 950 $(2,247) $(289) $37,866
The accompanying notes are an integral part of these statements.
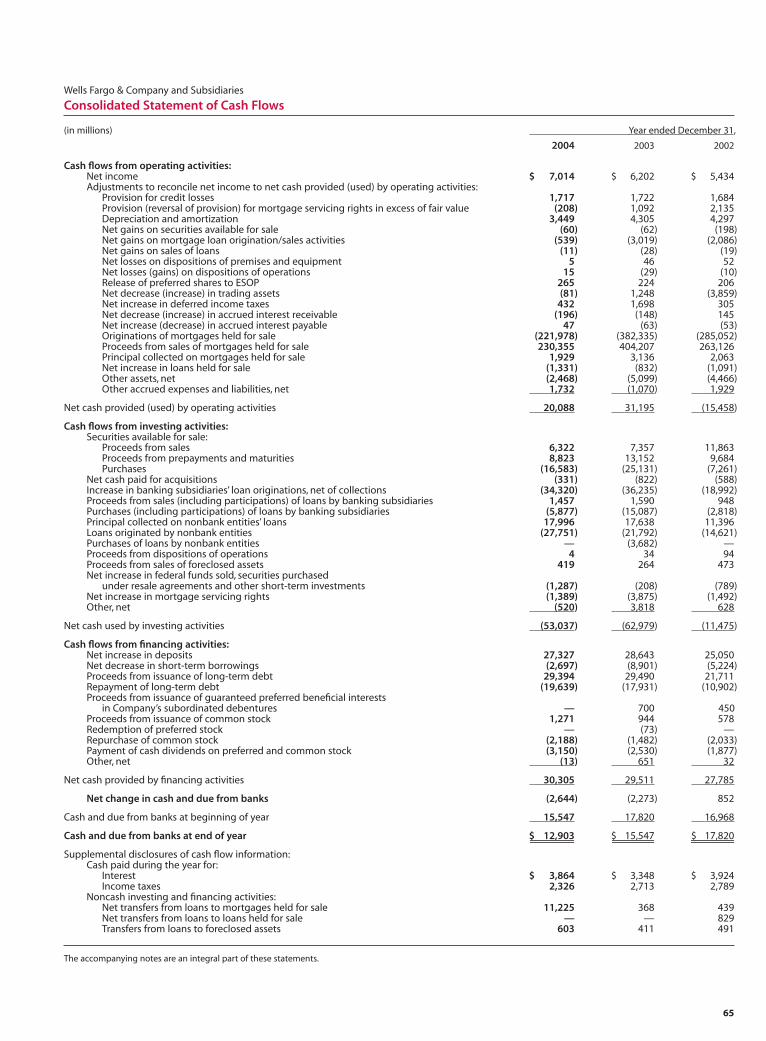
65
Wells Fargo & Company and Subsidiaries
Consolidated Statement of Cash Flows
(in millions) Year ended December 31,
2004 2003 2002
Cash flows from operating activities:Net income $ 7,014 $ 6,202 $ 5,434Adjustments to reconcile net income to net cash provided (used) by operating activities:
Provision for credit losses 1,717 1,722 1,684Provision (reversal of provision) for mortgage servicing rights in excess of fair value (208) 1,092 2,135Depreciation and amortization 3,449 4,305 4,297Net gains on securities available for sale (60) (62) (198)Net gains on mortgage loan origination/sales activities (539) (3,019) (2,086)Net gains on sales of loans (11) (28) (19)Net losses on dispositions of premises and equipment 5 46 52Net losses (gains) on dispositions of operations 15 (29) (10)Release of preferred shares to ESOP 265 224 206Net decrease (increase) in trading assets (81) 1,248 (3,859)Net increase in deferred income taxes 432 1,698 305Net decrease (increase) in accrued interest receivable (196) (148) 145Net increase (decrease) in accrued interest payable 47 (63) (53)Originations of mortgages held for sale (221,978) (382,335) (285,052)Proceeds from sales of mortgages held for sale 230,355 404,207 263,126Principal collected on mortgages held for sale 1,929 3,136 2,063Net increase in loans held for sale (1,331) (832) (1,091)Other assets, net (2,468) (5,099) (4,466)Other accrued expenses and liabilities, net 1,732 (1,070) 1,929
Net cash provided (used) by operating activities 20,088 31,195 (15,458)
Cash flows from investing activities:Securities available for sale:
Proceeds from sales 6,322 7,357 11,863Proceeds from prepayments and maturities 8,823 13,152 9,684Purchases (16,583) (25,131) (7,261)
Net cash paid for acquisitions (331) (822) (588)Increase in banking subsidiaries’ loan originations, net of collections (34,320) (36,235) (18,992)Proceeds from sales (including participations) of loans by banking subsidiaries 1,457 1,590 948Purchases (including participations) of loans by banking subsidiaries (5,877) (15,087) (2,818)Principal collected on nonbank entities’ loans 17,996 17,638 11,396Loans originated by nonbank entities (27,751) (21,792) (14,621)Purchases of loans by nonbank entities — (3,682) —Proceeds from dispositions of operations 4 34 94Proceeds from sales of foreclosed assets 419 264 473Net increase in federal funds sold, securities purchased
under resale agreements and other short-term investments (1,287) (208) (789)Net increase in mortgage servicing rights (1,389) (3,875) (1,492)Other, net (520) 3,818 628
Net cash used by investing activities (53,037) (62,979) (11,475)
Cash flows from financing activities:Net increase in deposits 27,327 28,643 25,050Net decrease in short-term borrowings (2,697) (8,901) (5,224)Proceeds from issuance of long-term debt 29,394 29,490 21,711Repayment of long-term debt (19,639) (17,931) (10,902)Proceeds from issuance of guaranteed preferred beneficial interests
in Company’s subordinated debentures — 700 450Proceeds from issuance of common stock 1,271 944 578Redemption of preferred stock — (73) —Repurchase of common stock (2,188) (1,482) (2,033)Payment of cash dividends on preferred and common stock (3,150) (2,530) (1,877)Other, net (13) 651 32
Net cash provided by financing activities 30,305 29,511 27,785
Net change in cash and due from banks (2,644) (2,273) 852
Cash and due from banks at beginning of year 15,547 17,820 16,968
Cash and due from banks at end of year $ 12,903 $ 15,547 $ 17,820
Supplemental disclosures of cash flow information:Cash paid during the year for:
Interest $ 3,864 $ 3,348 $ 3,924Income taxes 2,326 2,713 2,789
Noncash investing and financing activities:Net transfers from loans to mortgages held for sale 11,225 368 439Net transfers from loans to loans held for sale — — 829Transfers from loans to foreclosed assets 603 411 491
The accompanying notes are an integral part of these statements.
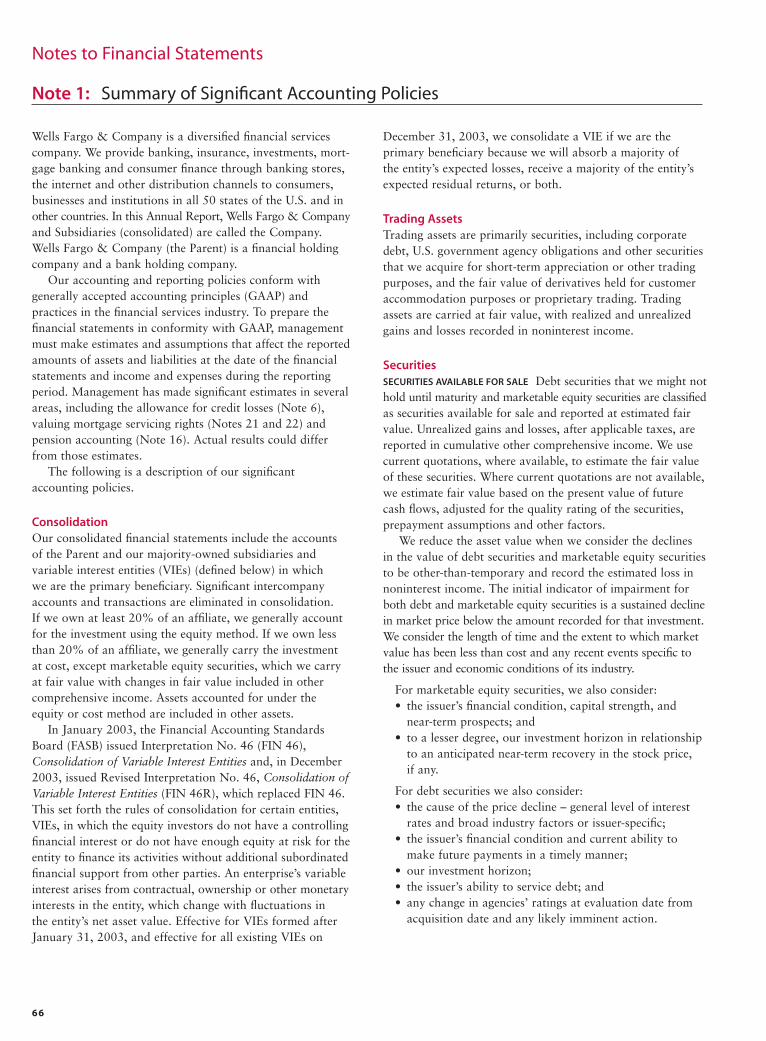
66
Notes to Financial Statements
Wells Fargo & Company is a diversified financial servicescompany. We provide banking, insurance, investments, mort-gage banking and consumer finance through banking stores,the internet and other distribution channels to consumers,businesses and institutions in all 50 states of the U.S. and inother countries. In this Annual Report, Wells Fargo & Companyand Subsidiaries (consolidated) are called the Company.Wells Fargo & Company (the Parent) is a financial holdingcompany and a bank holding company.
Our accounting and reporting policies conform with generally accepted accounting principles (GAAP) and practices in the financial services industry. To prepare thefinancial statements in conformity with GAAP, managementmust make estimates and assumptions that affect the reportedamounts of assets and liabilities at the date of the financialstatements and income and expenses during the reportingperiod. Management has made significant estimates in severalareas, including the allowance for credit losses (Note 6),valuing mortgage servicing rights (Notes 21 and 22) andpension accounting (Note 16). Actual results could differfrom those estimates.
The following is a description of our significant accounting policies.
ConsolidationOur consolidated financial statements include the accountsof the Parent and our majority-owned subsidiaries and variable interest entities (VIEs) (defined below) in which we are the primary beneficiary. Significant intercompanyaccounts and transactions are eliminated in consolidation. If we own at least 20% of an affiliate, we generally accountfor the investment using the equity method. If we own lessthan 20% of an affiliate, we generally carry the investmentat cost, except marketable equity securities, which we carryat fair value with changes in fair value included in othercomprehensive income. Assets accounted for under the equity or cost method are included in other assets.
In January 2003, the Financial Accounting StandardsBoard (FASB) issued Interpretation No. 46 (FIN 46),Consolidation of Variable Interest Entities and, in December2003, issued Revised Interpretation No. 46, Consolidation ofVariable Interest Entities (FIN 46R), which replaced FIN 46.This set forth the rules of consolidation for certain entities,VIEs, in which the equity investors do not have a controllingfinancial interest or do not have enough equity at risk for theentity to finance its activities without additional subordinatedfinancial support from other parties. An enterprise’s variableinterest arises from contractual, ownership or other monetaryinterests in the entity, which change with fluctuations in the entity’s net asset value. Effective for VIEs formed afterJanuary 31, 2003, and effective for all existing VIEs on
December 31, 2003, we consolidate a VIE if we are the primary beneficiary because we will absorb a majority of the entity’s expected losses, receive a majority of the entity’sexpected residual returns, or both.
Trading AssetsTrading assets are primarily securities, including corporatedebt, U.S. government agency obligations and other securitiesthat we acquire for short-term appreciation or other tradingpurposes, and the fair value of derivatives held for customeraccommodation purposes or proprietary trading. Tradingassets are carried at fair value, with realized and unrealizedgains and losses recorded in noninterest income.
SecuritiesSECURITIES AVAILABLE FOR SALE Debt securities that we might nothold until maturity and marketable equity securities are classifiedas securities available for sale and reported at estimated fairvalue. Unrealized gains and losses, after applicable taxes, arereported in cumulative other comprehensive income. We usecurrent quotations, where available, to estimate the fair valueof these securities. Where current quotations are not available,we estimate fair value based on the present value of futurecash flows, adjusted for the quality rating of the securities, prepayment assumptions and other factors.
We reduce the asset value when we consider the declines in the value of debt securities and marketable equity securitiesto be other-than-temporary and record the estimated loss innoninterest income. The initial indicator of impairment forboth debt and marketable equity securities is a sustained declinein market price below the amount recorded for that investment.We consider the length of time and the extent to which marketvalue has been less than cost and any recent events specific tothe issuer and economic conditions of its industry.
For marketable equity securities, we also consider:• the issuer’s financial condition, capital strength, and
near-term prospects; and• to a lesser degree, our investment horizon in relationship
to an anticipated near-term recovery in the stock price, if any.
For debt securities we also consider:• the cause of the price decline – general level of interest
rates and broad industry factors or issuer-specific;• the issuer’s financial condition and current ability to
make future payments in a timely manner;• our investment horizon;• the issuer’s ability to service debt; and• any change in agencies’ ratings at evaluation date from
acquisition date and any likely imminent action.
Note 1: Summary of Significant Accounting Policies
67
We manage these investments within capital risk limitsapproved by management and the Board and monitored by the Corporate Asset/Liability Management Committee.We recognize realized gains and losses on the sale of thesesecurities in noninterest income using the specific identifica-tion method.
Unamortized premiums and discounts are recognized ininterest income over the contractual life of the security usingthe interest method. As principal repayments are received on securities (i.e. primarily mortgage-backed securities) apro-rata portion of the unamortized premium or discount is recognized in interest income.
NONMARKETABLE EQUITY SECURITIES Nonmarketable equitysecurities include venture capital equity securities that arenot publicly traded and securities acquired for various pur-poses, such as to meet regulatory requirements (for example,Federal Reserve Bank and Federal Home Loan Bank stock).We review these assets at least quarterly for possible other-than-temporary impairment. Our review typically includesan analysis of the facts and circumstances of each investment,the expectations for the investment’s cash flows and capitalneeds, the viability of its business model and our exit strategy.These securities are accounted for under the cost or equitymethod and are included in other assets. We reduce the assetvalue when we consider declines in value to be other-than-temporary. We recognize the estimated loss as a loss fromequity investments in noninterest income.
Mortgages Held for SaleMortgages held for sale are stated at the lower of total cost or market value. Gains and losses on loan sales (salesproceeds minus carrying value) are recorded in noninterestincome. Direct loan origination costs and fees are deferred at origination of the loan. These deferred costs and fees arerecognized in mortgage banking noninterest income uponsale of the loan.
Loans Held for SaleLoans held for sale are carried at the lower of cost or market value. Direct loan origination costs and fees aredeferred at origination of the loan. Gains and losses on loansales (sales proceeds minus carrying value) are recorded innoninterest income.
LoansLoans are reported at the principal amount outstanding, netof unearned income, except for purchased loans, which arerecorded at fair value on the purchase date. Unearned incomeincludes deferred fees net of deferred direct incremental loanorigination costs. We amortize unearned income to interestincome, over periods not exceeding the contractual life of theloan, using the interest method.
From time to time, we pledge loans, primarily 1-4 familymortgage loans, to secure borrowings from the FederalHome Loan Bank.
NONACCRUAL LOANS We generally place loans on nonaccrualstatus (1) when the full and timely collection of interest orprincipal becomes uncertain, (2) when they are 90 days (120 days with respect to real estate 1-4 family first andjunior lien mortgages) past due for interest or principal(unless both well-secured and in the process of collection) or (3) when part of the principal balance has been chargedoff. Generally, consumer loans not secured by real estate areplaced on nonaccrual status only when part of the principalhas been charged off. These loans are entirely charged offwhen deemed uncollectible or when they reach a definednumber of days past due based on loan product, industrypractice, country, terms and other factors.
When we place a loan on nonaccrual status, we reversethe accrued and unpaid interest receivable against interestincome and account for the loan on the cash or cost recoverymethod, until it qualifies for return to accrual status. Generally,we return a loan to accrual status (a) when all delinquentinterest and principal becomes current under the terms of the loan agreement or (b) when the loan is both well-securedand in the process of collection and collectibility is no longerdoubtful, after a period of demonstrated performance.
IMPAIRED LOANS We assess, account for and disclose asimpaired certain nonaccrual commercial loans and commer-cial real estate mortgage and construction loans that are over$3 million. We consider a loan to be impaired when, basedon current information and events, we will probably not beable to collect all amounts due according to the loan con-tract, including scheduled interest payments.
When we identify a loan as impaired, we measure theimpairment using discounted cash flows, except when thesole (remaining) source of repayment for the loan is theoperation or liquidation of the collateral. In these cases weuse the current fair value of the collateral, less selling costs,instead of discounted cash flows.
If we determine that the value of the impaired loan is lessthan the recorded investment in the loan (net of previouscharge-offs, deferred loan fees or costs and unamortized premium or discount), we recognize impairment through an allocated reserve or a charge-off to the allowance.
ALLOWANCE FOR CREDIT LOSSES The allowance for credit losses,which comprises the allowance for loan losses and thereserve for unfunded credit commitments, is management’sestimate of credit losses inherent in the loan portfolio at the balance sheet date. Our determination of the allowance,and the resulting provision, is based on judgments andassumptions, including (1) general economic conditions,(2) loan portfolio composition, (3) loan loss experience,(4) management’s evaluation of credit risk relating to pools of loans and individual borrowers, (5) sensitivity analysis andexpected loss models and (6) observations from our internalauditors, internal loan review staff or our banking regulators.
68
Transfers and Servicing of Financial AssetsWe account for a transfer of financial assets as a sale whenwe surrender control of the transferred assets. Servicingrights and other retained interests in the sold assets arerecorded by allocating the previously recorded investmentbetween the assets sold and the interest retained based ontheir relative fair values at the date of transfer. We determinethe fair values of servicing rights and other retained interestsat the date of transfer using the present value of estimatedfuture cash flows, using assumptions that market partici-pants use in their estimates of values. We use quoted marketprices when available to determine the value of otherretained interests.
We recognize the rights to service mortgage loans for others,or mortgage servicing rights (MSRs), as assets whether wepurchase the servicing rights or sell or securitize loans weoriginate and retain servicing rights. MSRs are amortized inproportion to, and over the period of, estimated net servicingincome. The amortization of MSRs is analyzed monthly andis adjusted to reflect changes in prepayment speeds.
To determine the fair value of MSRs, we use a valuationmodel that calculates the present value of estimated futurenet servicing income. We use assumptions in the valuationmodel that market participants use in estimating future netservicing income, including estimates of prepayment speeds,discount rate, cost to service, escrow account earnings, con-tractual servicing fee income, ancillary income and late fees.
Each quarter, we evaluate MSRs for possible impairmentbased on the difference between the carrying amount andcurrent fair value, in accordance with Statement of FinancialAccounting Standards No. 140 (FAS 140), Accounting forTransfers and Servicing of Financial Assets and Extinguishmentsof Liabilities. To evaluate and measure impairment we stratifythe portfolio based on certain risk characteristics, includingloan type and note rate. If temporary impairment exists, we establish a valuation allowance through a charge to netincome for any excess of amortized cost over the current fairvalue, by risk stratification. If we later determine that all or a portion of the temporary impairment no longer exists for a particular risk stratification, we will reduce the valuationallowance through an increase to net income.
Under our policy, we also evaluate other-than-temporaryimpairment of MSRs by considering both historical and projected trends in interest rates, pay off activity andwhether the impairment could be recovered through interestrate increases. We recognize a direct write-down when wedetermine that the recoverability of a recorded valuationallowance is remote. A direct write-down permanentlyreduces the carrying value of the MSRs, while a valuationallowance (temporary impairment) can be reversed.
Mortgages held for sale include residential mortgages thatwere originated in accordance with secondary market pricingand underwriting standards and certain mortgages originatedinitially for investment and not underwritten to secondarymarket standards. Net gains and losses on mortgage loanorigination/sales activities reflect the periodic evaluation ofour portfolios, which are carried at the lower of cost or market value.
Premises and EquipmentPremises and equipment are carried at cost less accumulateddepreciation and amortization. Capital leases are included in premises and equipment at the capitalized amount lessaccumulated amortization.
Primarily we use the straight-line method of depreciationand amortization. Estimated useful lives range up to 40 yearsfor buildings, up to 10 years for furniture and equipment,and the shorter of the estimated useful life or lease term forleasehold improvements. We amortize capitalized leased assetson a straight-line basis over the lives of the respective leases.
Goodwill and Identifiable Intangible AssetsGoodwill is recorded when the purchase price is higher thanthe fair value of net assets acquired in business combinationsunder the purchase method of accounting.
Effective January 1, 2002, we assess goodwill for impair-ment annually, and more frequently in certain circumstances.We assess goodwill for impairment on a reporting unit levelby applying a fair-value-based test using discounted estimatedfuture net cash flows. Impairment exists when the carryingamount of the goodwill exceeds its implied fair value. We recognize impairment losses as a charge to noninterestexpense (unless related to discontinued operations) and an adjustment to the carrying value of the goodwill asset.Subsequent reversals of goodwill impairment are prohibited.In 2002, our initial goodwill impairment testing resulted in a $276 million (after tax), $404 million (before tax), transitional impairment charge reported as a cumulativeeffect of a change in accounting principle.
We amortize core deposit intangibles on an acceleratedbasis based on useful lives of 10 to 15 years. We review core deposit intangibles for impairment whenever events or changes in circumstances indicate that their carryingamounts may not be recoverable. Impairment is indicated if the sum of undiscounted estimated future net cash flows is less than the carrying value of the asset. Impairment is permanently recognized by writing down the asset to theextent that the carrying value exceeds the estimated fair value.
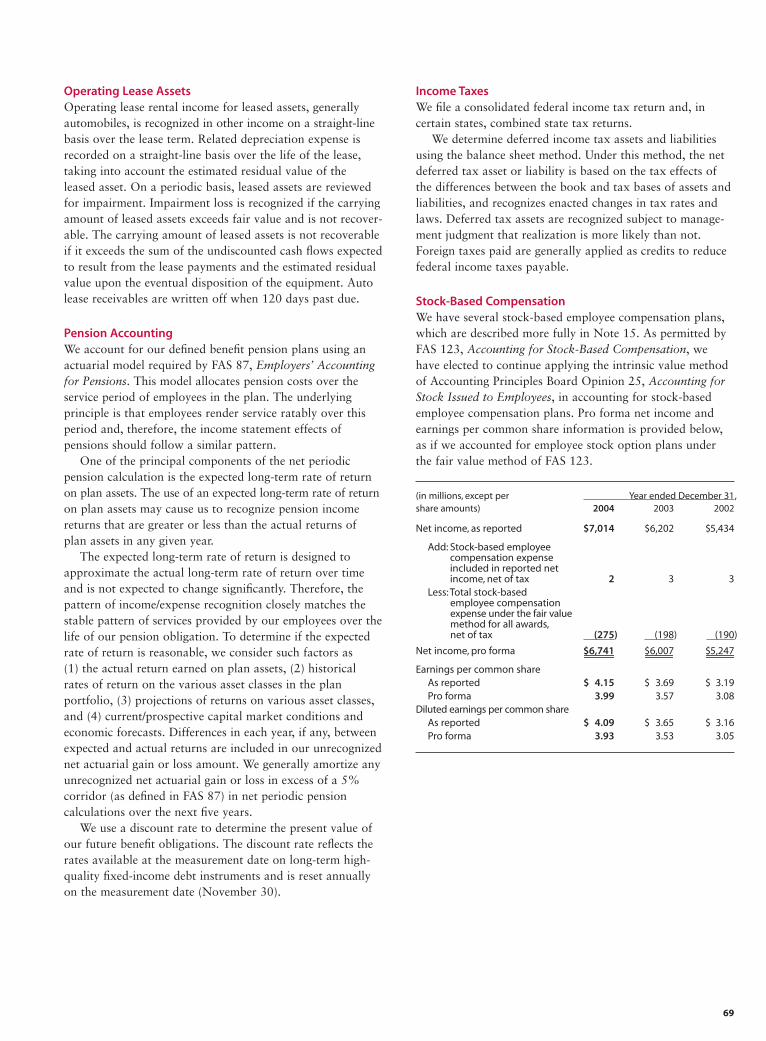
69
Operating Lease AssetsOperating lease rental income for leased assets, generallyautomobiles, is recognized in other income on a straight-linebasis over the lease term. Related depreciation expense isrecorded on a straight-line basis over the life of the lease,taking into account the estimated residual value of the leased asset. On a periodic basis, leased assets are reviewedfor impairment. Impairment loss is recognized if the carryingamount of leased assets exceeds fair value and is not recover-able. The carrying amount of leased assets is not recoverableif it exceeds the sum of the undiscounted cash flows expectedto result from the lease payments and the estimated residualvalue upon the eventual disposition of the equipment. Autolease receivables are written off when 120 days past due.
Pension AccountingWe account for our defined benefit pension plans using anactuarial model required by FAS 87, Employers’ Accountingfor Pensions. This model allocates pension costs over the service period of employees in the plan. The underlying principle is that employees render service ratably over thisperiod and, therefore, the income statement effects of pensions should follow a similar pattern.
One of the principal components of the net periodic pension calculation is the expected long-term rate of returnon plan assets. The use of an expected long-term rate of returnon plan assets may cause us to recognize pension incomereturns that are greater or less than the actual returns of plan assets in any given year.
The expected long-term rate of return is designed toapproximate the actual long-term rate of return over timeand is not expected to change significantly. Therefore, thepattern of income/expense recognition closely matches thestable pattern of services provided by our employees over thelife of our pension obligation. To determine if the expectedrate of return is reasonable, we consider such factors as (1) the actual return earned on plan assets, (2) historicalrates of return on the various asset classes in the plan portfolio, (3) projections of returns on various asset classes,and (4) current/prospective capital market conditions andeconomic forecasts. Differences in each year, if any, betweenexpected and actual returns are included in our unrecognizednet actuarial gain or loss amount. We generally amortize anyunrecognized net actuarial gain or loss in excess of a 5%corridor (as defined in FAS 87) in net periodic pension calculations over the next five years.
We use a discount rate to determine the present value ofour future benefit obligations. The discount rate reflects therates available at the measurement date on long-term high-quality fixed-income debt instruments and is reset annuallyon the measurement date (November 30).
Income TaxesWe file a consolidated federal income tax return and, in certain states, combined state tax returns.
We determine deferred income tax assets and liabilitiesusing the balance sheet method. Under this method, the netdeferred tax asset or liability is based on the tax effects ofthe differences between the book and tax bases of assets andliabilities, and recognizes enacted changes in tax rates andlaws. Deferred tax assets are recognized subject to manage-ment judgment that realization is more likely than not.Foreign taxes paid are generally applied as credits to reducefederal income taxes payable.
Stock-Based CompensationWe have several stock-based employee compensation plans,which are described more fully in Note 15. As permitted byFAS 123, Accounting for Stock-Based Compensation, wehave elected to continue applying the intrinsic value methodof Accounting Principles Board Opinion 25, Accounting forStock Issued to Employees, in accounting for stock-basedemployee compensation plans. Pro forma net income andearnings per common share information is provided below,as if we accounted for employee stock option plans underthe fair value method of FAS 123.
(in millions, except per Year ended December 31,share amounts) 2004 2003 2002
Net income, as reported $7,014 $6,202 $5,434
Add: Stock-based employee compensation expense included in reported net income, net of tax 2 3 3
Less: Total stock-based employee compensation expense under the fair value method for all awards,net of tax (275) (198) (190)
Net income, pro forma $6,741 $6,007 $5,247
Earnings per common share As reported $ 4.15 $ 3.69 $ 3.19Pro forma 3.99 3.57 3.08
Diluted earnings per common shareAs reported $ 4.09 $ 3.65 $ 3.16Pro forma 3.93 3.53 3.05
70
Total stock-based employee compensation was higherunder the fair value method in 2004 compared with 2003.Stock options granted in our February 2004 grant, under our Long-Term Incentive Compensation Plan (the Plan), fully vested upon grant, resulting in full recognition of stock-based compensation expense for the 2004 annual grant under the fair value method in the table on the previ-ous page. Stock options granted in our 2003, 2002 and 2001 annual grants under the Plan vest over a three-yearperiod, and expense reflected in the table for these grants is recognized over the vesting period.
Earnings Per Common ShareWe present earnings per common share and diluted earningsper common share. We compute earnings per common shareby dividing net income (after deducting dividends on preferredstock) by the average number of common shares outstandingduring the year. We compute diluted earnings per commonshare by dividing net income (after deducting dividends onpreferred stock) by the average number of common sharesoutstanding during the year, plus the effect of common stockequivalents (for example, stock options, restricted sharerights and convertible debentures) that are dilutive.
Derivatives and Hedging ActivitiesWe recognize all derivatives on the balance sheet at fairvalue. On the date we enter into a derivative contract, wedesignate the derivative as (1) a hedge of the fair value of arecognized asset or liability (“fair value” hedge), (2) a hedgeof a forecasted transaction or of the variability of cash flowsto be received or paid related to a recognized asset or liability(“cash flow” hedge) or (3) held for trading, customer accom-modation or a contract not qualifying for hedge accounting(“free-standing derivative”). For a fair value hedge, we recordchanges in the fair value of the derivative and, to the extentthat it is effective, changes in the fair value of the hedgedasset or liability, attributable to the hedged risk, in currentperiod net income in the same financial statement categoryas the hedged item. For a cash flow hedge, we record changesin the fair value of the derivative to the extent that it is effective in other comprehensive income. We subsequentlyreclassify these changes in fair value to net income in thesame period(s) that the hedged transaction affects net incomein the same financial statement category as the hedged item.For free-standing derivatives, we report changes in the fairvalues in current period noninterest income.
We formally document the relationship between hedginginstruments and hedged items, as well as our risk manage-ment objective and strategy for various hedge transactions.This includes linking all derivatives designated as fair valueor cash flow hedges to specific assets and liabilities on thebalance sheet or to specific forecasted transactions. We also
formally assess, both at the inception of the hedge and on an ongoing basis, if the derivatives we use are highly effectivein offsetting changes in fair values or cash flows of hedgeditems. If we determine that a derivative is not highly effectiveas a hedge, we discontinue hedge accounting.
We discontinue hedge accounting prospectively when (1) a derivative is no longer highly effective in offsettingchanges in the fair value or cash flows of a hedged item, (2) a derivative expires or is sold, terminated, or exercised,(3) a derivative is dedesignated as a hedge, because it isunlikely that a forecasted transaction will occur, or (4) wedetermine that designation of a derivative as a hedge is nolonger appropriate.
When we discontinue hedge accounting because a deriva-tive no longer qualifies as an effective fair value hedge, wecontinue to carry the derivative on the balance sheet at itsfair value with changes in fair value included in earnings,and no longer adjust the previously hedged asset or liabilityfor changes in fair value. Previous adjustments to the hedgeditem are accounted for in the same manner as other compo-nents of the carrying amount of the asset or liability.
When we discontinue hedge accounting because it isprobable that a forecasted transaction will not occur, wecontinue to carry the derivative on the balance sheet at itsfair value with changes in fair value included in earnings,and immediately recognize gains and losses that were accu-mulated in other comprehensive income in earnings.
When we discontinue hedge accounting because the hedg-ing instrument is sold, terminated, or no longer designated(dedesignated), the amount reported in other comprehensiveincome up to the date of sale, termination or dedesignationcontinues to be reported in other comprehensive incomeuntil the forecasted transaction affects earnings.
In all other situations in which we discontinue hedgeaccounting, the derivative will be carried at its fair value onthe balance sheet, with changes in its fair value recognized incurrent period earnings.
We occasionally purchase or originate financial instruments that contain an embedded derivative. At inception of the financial instrument, we assess (1) if theeconomic characteristics of the embedded derivative areclearly and closely related to the economic characteristics of the financial instrument (host contract), (2) if the financial instrument that embodies both the embeddedderivative and the host contract is measured at fair valuewith changes in fair value reported in earnings, or (3) if aseparate instrument with the same terms as the embeddedinstrument would meet the definition of a derivative. If theembedded derivative does not meet any of these conditions,we separate it from the host contract and carry it at fairvalue with changes recorded in current period earnings.
71
We regularly explore opportunities to acquire financial services companies and businesses. Generally, we do notmake a public announcement about an acquisition opportunity until a definitive agreement has been signed.
Effective December 31, 2004, we completed the acquisition of $29 billion in assets under management, comprising $24 billion in mutual fund assets and $5 billionin institutional investment accounts, from Strong FinancialCorporation. Other business combinations completed in2004, 2003 and 2002 were:
Note 2: Business Combinations
At December 31, 2004, we had two pending businesscombinations with total assets of approximately $720 mil-lion. We expect to complete these transactions by second quarter 2005.
For information on contingent consideration related toacquisitions, which are considered guarantees, see Note 25.
Federal Reserve Board regulations require that each of oursubsidiary banks maintain reserve balances on deposits withthe Federal Reserve Banks. The average required reserve balance was $1.2 billion and $1.0 billion in 2004 and 2003, respectively.
Federal law restricts the amount and the terms of bothcredit and non-credit transactions between a bank and itsnonbank affiliates. They may not exceed 10% of the bank’scapital and surplus (which for this purpose represents Tier 1and Tier 2 capital, as calculated under the risk-based capitalguidelines, plus the balance of the allowance for credit lossesexcluded from Tier 2 capital) with any single nonbank affili-ate and 20% of the bank’s capital and surplus with all itsnonbank affiliates. Transactions that are extensions of creditmay require collateral to be held to provide added security tothe bank. (For further discussion of risk-based capital, seeNote 26.)
Note 3: Cash, Loan and Dividend Restrictions
Dividends paid by our subsidiary banks are subject tovarious federal and state regulatory limitations. Dividendsthat may be paid by a national bank without the expressapproval of the Office of the Comptroller of the Currency(OCC) are limited to that bank’s retained net profits for thepreceding two calendar years plus retained net profits up tothe date of any dividend declaration in the current calendaryear. Retained net profits, as defined by the OCC, consist ofnet income less dividends declared during the period. We alsohave state-chartered subsidiary banks that are subject tostate regulations that limit dividends. Under those provisions,our national and state-chartered subsidiary banks could have declared additional dividends of $1,154 million and$844 million at December 31, 2004 and 2003, respectively,without obtaining prior regulatory approval. In addition, our nonbank subsidiaries could have declared additional dividends of $1,638 million and $1,682 million at December 31, 2004 and 2003, respectively.
(in millions) Date Assets
2004Other (1) Various $ 74
2003Certain assets of Telmark, LLC, Syracuse, New York February 28 $ 660Pacific Northwest Bancorp, Seattle, Washington October 31 3,245Two Rivers Corporation, Grand Junction, Colorado October 31 74Other (2) Various 136
$ 4,115
2002Texas Financial Bancorporation, Inc., Minneapolis, Minnesota February 1 $2,957Five affiliated banks and related entities of Marquette Bancshares, Inc.
located in Minnesota, Wisconsin, Illinois, Iowa and South Dakota February 1 3,086Rediscount business of Washington Mutual Bank, FA, Philadelphia, Pennsylvania March 28 281Tejas Bancshares, Inc., Amarillo, Texas April 26 374Other (3) Various 94
$ 6,792
(1) Consists of 13 acquisitions of insurance brokerage and payroll services businesses.(2) Consists of 14 acquisitions of asset management, commercial real estate brokerage, bankruptcy and insurance brokerage businesses.(3) Consists of 6 acquisitions of asset management, securities brokerage and insurance brokerage businesses.
72
The following table shows the unrealized gross losses and fairvalue of securities in the securities available for sale portfolio at
The following table provides the cost and fair value for themajor categories of securities available for sale carried at fair
Note 5: Securities Available for Sale
value. There were no securities classified as held to maturityat the end of 2004 or 2003.
December 31, 2004, by length of time that individual securitiesin each category have been in a continuous loss position.
(in millions) December 31, 2004 2003
Cost Unrealized Unrealized Fair Cost Unrealized Unrealized Fairgross gross value gross gross valuegains losses gains losses
Securities of U.S. Treasury and federal agencies $ 1,128 $ 16 $ (4) $ 1,140 $ 1,252 $ 35 $ (1) $ 1,286Securities of U.S. states and political subdivisions 3,429 196 (4) 3,621 3,175 176 (5) 3,346Mortgage-backed securities:
Federal agencies 20,198 750 (4) 20,944 20,353 799 (22) 21,130Private collateralized
mortgage obligations (1) 4,082 121 (4) 4,199 3,056 106 (8) 3,154Total mortgage-backed securities 24,280 871 (8) 25,143 23,409 905 (30) 24,284
Other 2,974 157 (14) 3,117 3,285 198 (28) 3,455Total debt securities 31,811 1,240 (30) 33,021 31,121 1,314 (64) 32,371
Marketable equity securities 507 198 (9) 696 394 188 — 582
Total (2) $32,318 $1,438 $(39) $33,717 $31,515 $1,502 $(64) $32,953
(1) A majority of private collateralized mortgage obligations are AAA-rated bonds collateralized by 1–4 family residential first mortgages.(2) At December 31, 2004, we held no securities of any single issuer (excluding the U.S.Treasury and federal agencies) with a book value that exceeded 10% of stockholders’ equity.
(in millions) December 31, 2004 Less than 12 months 12 months or more Total
Unrealized Fair Unrealized Fair Unrealized Fairgross value gross value gross value
losses losses losses
Securities of U.S. Treasury and federal agencies $ (4) $ 304 $— $ — $ (4) $ 304Securities of U.S. states and political subdivisions (1) 65 (3) 62 (4) 127Mortgage-backed securities:
Federal agencies (4) 450 — — (4) 450Private collateralized
mortgage obligations (4) 981 — — (4) 981Total mortgage-backed securities (8) 1,431 — — (8) 1,431
Other (11) 584 (3) 56 (14) 640Total debt securities (24) 2,384 (6) 118 (30) 2,502
Marketable equity securities (9) 44 — — (9) 44Total $(33) $2,428 $ (6) $118 $(39) $2,546
Note 4: Federal Funds Sold, Securities Purchased Under Resale Agreements and Other Short-Term Investments
The table to the right provides the detail of federal fundssold, securities purchased under resale agreements and othershort-term investments.
(in millions) December 31,2004 2003
Federal funds sold and securities purchased under resale agreements $3,009 $2,081
Interest-earning deposits 1,397 988
Other short-term investments 614 664
Total $5,020 $3,733
73
(in millions) Year ended December 31,2004 2003 2002
Realized gross gains $ 168 $ 178 $ 617
Realized gross losses (1) (108) (116) (419)
Realized net gains $ 60 $ 62 $ 198
(1) Includes other-than-temporary impairment of $9 million, $50 million and $180 million for 2004, 2003 and 2002, respectively.
We had a limited number of debt securities in a continuousloss position for 12 months or more at December 31, 2004,which consisted of asset-backed securities, bonds and notes.Because the declines in fair value were due to changes inmarket interest rates, not in estimated cash flows, and becausewe have the intent and ability to retain our investment in the issuer for a period of time to allow for any anticipatedrecovery in market value, no other-than-temporary impair-ment was recorded at December 31, 2004.
Securities pledged where the secured party has the right to sell or repledge totaled $2.3 billion at December 31, 2004,and $3.2 billion at December 31, 2003. Securities pledgedwhere the secured party does not have the right to sell orrepledge totaled $19.4 billion at December 31, 2004, and$18.6 billion at December 31, 2003, primarily to secure trustand public deposits and for other purposes as required orpermitted by law. We have accepted collateral in the form of securities that we have the right to sell or repledge of $2.5 billion at December 31, 2004, and $2.1 billion atDecember 31, 2003, of which we sold or repledged $1.7 billion and $1.8 billion, respectively.
The following table shows the realized net gains on thesales of securities from the securities available for sale portfolio, including marketable equity securities.
The following table shows the remaining contractual principal maturities and contractual yields of debt securitiesavailable for sale. The remaining contractual principal maturities for mortgage-backed securities were allocatedassuming no prepayments. Remaining expected maturitieswill differ from contractual maturities because borrowersmay have the right to prepay obligations before the underlying mortgages mature.
(in millions) December 31, 2004Total Weighted- Remaining contractual principal maturity
amount average After one year After five yearsyield Within one year through five years through ten years After ten years
Amount Yield Amount Yield Amount Yield Amount Yield
Securities of U.S. Treasury and federal agencies $ 1,140 3.51% $278 3.02% $ 774 3.47% $ 43 4.99% $ 45 5.73%
Securities of U.S. states andpolitical subdivisions 3,621 7.20 253 8.10 1,011 7.73 1,020 7.35 1,337 6.51
Mortgage-backed securities:Federal agencies 20,944 5.80 28 2.79 89 5.55 66 5.72 20,761 5.81Private collateralized
mortgage obligations 4,199 4.98 — — 3 6.80 4 3.79 4,192 4.98Total mortgage-backed securities 25,143 5.67 28 2.79 92 5.60 70 5.60 24,953 5.67
Other 3,117 8.42 207 4.63 1,037 8.46 1,115 8.79 758 8.84
ESTIMATED FAIR VALUEOF DEBT SECURITIES (1) $33,021 6.02% $766 5.12% $2,914 6.79% $2,248 7.97% $27,093 5.80%
TOTAL COST OF DEBT SECURITIES $31,811 $645 $2,504 $2,093 $26,569
(1) The weighted-average yield is computed using the contractual life amortization method.
74
(in millions) December 31,2004 2003
Commercial and commercial real estate:Commercial $ 59,603 $ 52,211Other real estate mortgage 2,788 1,961Real estate construction 7,164 5,644
Total commercial and commercial real estate 69,555 59,816
Consumer:Real estate 1-4 family first mortgage 9,009 6,428Real estate 1-4 family junior lien mortgage 31,396 23,436Credit card 38,200 24,831Other revolving credit and installment 15,427 11,219
Total consumer 94,032 65,914Foreign 407 238
Total loan commitments $163,994 $125,968
any of the following loan categories: commercial loans byindustry; commercial real estate loans by state or propertytype; real estate 1–4 family first and junior lien mortgages by state, except for California, which represented 18% oftotal loans at December 31, 2004, and 19% of total loans at December 31, 2003; or other revolving credit and installment loans by product type.
A summary of the major categories of loans outstanding isshown in the following table. Outstanding loan balances atDecember 31, 2004 and 2003, are net of unearned income,including net deferred loan fees, of $3,766 million and$3,430 million, respectively.
At December 31, 2004 and 2003, we did not have anyconcentrations greater than 10% of total loans included in
Note 6: Loans and Allowance for Credit Losses
(in millions) December 31,2004 2003 2002 2001 2000
Commercial and commercial real estate:Commercial $ 54,517 $ 48,729 $ 47,292 $ 47,547 $ 50,518Other real estate mortgage 29,804 27,592 25,312 24,808 23,972Real estate construction 9,025 8,209 7,804 7,806 7,715Lease financing 5,169 4,477 4,085 4,017 4,350
Total commercial and commercial real estate 98,515 89,007 84,493 84,178 86,555Consumer:
Real estate 1-4 family first mortgage 87,686 83,535 44,119 29,317 19,321Real estate 1-4 family junior lien mortgage 52,190 36,629 28,147 21,801 17,361Credit card 10,260 8,351 7,455 6,700 6,616Other revolving credit and installment 34,725 33,100 26,353 23,502 23,974
Total consumer 184,861 161,615 106,074 81,320 67,272Foreign 4,210 2,451 1,911 1,598 1,624
Total loans $287,586 $253,073 $192,478 $167,096 $155,451
In assessing adequate compensation for the credit riskpresented by a customer, we may require collateral. We holdvarious types of collateral, including accounts receivable,inventory, land, buildings, equipment, income-producingcommercial properties and residential real estate. Collateralrequirements for each customer may vary according to thespecific credit underwriting, terms and structure of loansfunded immediately or under a commitment to fund at alater date.
A commitment to extend credit is a legally binding agreement to lend funds to a customer, usually at a statedinterest rate and for a specified purpose. These commitmentshave fixed expiration dates and generally require a fee. Whenwe make such a commitment, we have credit risk. The liquidityrequirements or credit risk will be lower than the contractualamount of commitments to extend credit because a significantportion of these commitments are expected to expire withoutbeing used. Certain commitments are subject to loan agreementswith covenants regarding the financial performance of thecustomer that must be met before we are required to fundthe commitment. We use the same credit policies for commitments to extend credit that we use in making loans.For information on standby letters of credit, see Note 25.
In addition, we manage the potential risk in credit com-mitments by limiting the total amount of arrangements, bothby individual customer and in total, by monitoring the sizeand maturity structure of these portfolios and by applyingthe same credit standards for all of our credit activities.
The total of our unfunded loan commitments, net of allfunds lent and all standby and commercial letters of creditissued under the terms of these commitments, is summarizedby loan categories in the following table.
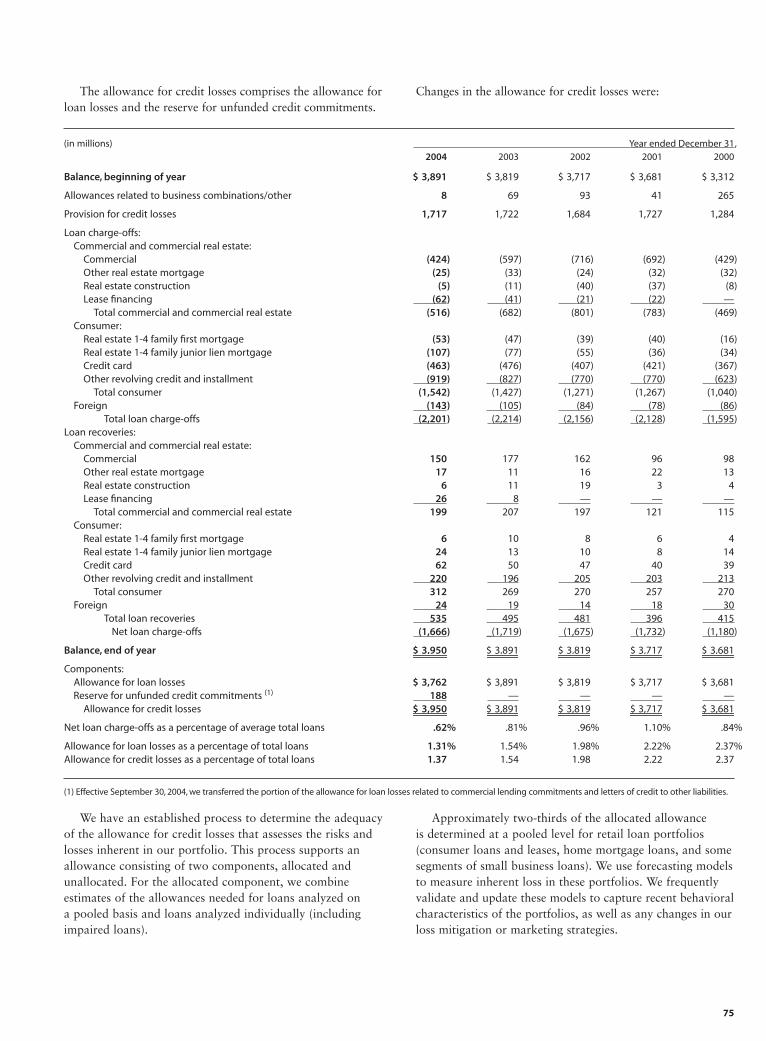
75
The allowance for credit losses comprises the allowance forloan losses and the reserve for unfunded credit commitments.
Changes in the allowance for credit losses were:
(in millions) Year ended December 31,2004 2003 2002 2001 2000
Balance, beginning of year $ 3,891 $ 3,819 $ 3,717 $ 3,681 $ 3,312
Allowances related to business combinations/other 8 69 93 41 265
Provision for credit losses 1,717 1,722 1,684 1,727 1,284
Loan charge-offs:Commercial and commercial real estate:
Commercial (424) (597) (716) (692) (429)Other real estate mortgage (25) (33) (24) (32) (32)Real estate construction (5) (11) (40) (37) (8)Lease financing (62) (41) (21) (22) —
Total commercial and commercial real estate (516) (682) (801) (783) (469)Consumer:
Real estate 1-4 family first mortgage (53) (47) (39) (40) (16)Real estate 1-4 family junior lien mortgage (107) (77) (55) (36) (34)Credit card (463) (476) (407) (421) (367)Other revolving credit and installment (919) (827) (770) (770) (623)
Total consumer (1,542) (1,427) (1,271) (1,267) (1,040)Foreign (143) (105) (84) (78) (86)
Total loan charge-offs (2,201) (2,214) (2,156) (2,128) (1,595)Loan recoveries:
Commercial and commercial real estate:Commercial 150 177 162 96 98Other real estate mortgage 17 11 16 22 13Real estate construction 6 11 19 3 4Lease financing 26 8 — — —
Total commercial and commercial real estate 199 207 197 121 115Consumer:
Real estate 1-4 family first mortgage 6 10 8 6 4Real estate 1-4 family junior lien mortgage 24 13 10 8 14Credit card 62 50 47 40 39Other revolving credit and installment 220 196 205 203 213
Total consumer 312 269 270 257 270Foreign 24 19 14 18 30
Total loan recoveries 535 495 481 396 415Net loan charge-offs (1,666) _(1,719) (1,675) (1,732) (1,180)
Balance, end of year $ 3,950 $ 3,891 $ 3,819 $ 3,717 $ 3,681
Components:Allowance for loan losses $ 3,762 $ 3,891 $ 3,819 $ 3,717 $ 3,681Reserve for unfunded credit commitments (1) 188 — — — —
Allowance for credit losses $ 3,950 $ 3,891 $ 3,819 $ 3,717 $ 3,681
Net loan charge-offs as a percentage of average total loans .62% .81% .96% 1.10% .84%
Allowance for loan losses as a percentage of total loans 1.31% 1.54% 1.98% 2.22% 2.37%Allowance for credit losses as a percentage of total loans 1.37 1.54 1.98 2.22 2.37
(1) Effective September 30, 2004, we transferred the portion of the allowance for loan losses related to commercial lending commitments and letters of credit to other liabilities.
We have an established process to determine the adequacyof the allowance for credit losses that assesses the risks andlosses inherent in our portfolio. This process supports anallowance consisting of two components, allocated and unallocated. For the allocated component, we combine estimates of the allowances needed for loans analyzed on a pooled basis and loans analyzed individually (includingimpaired loans).
Approximately two-thirds of the allocated allowance is determined at a pooled level for retail loan portfolios (consumer loans and leases, home mortgage loans, and somesegments of small business loans). We use forecasting modelsto measure inherent loss in these portfolios. We frequentlyvalidate and update these models to capture recent behavioralcharacteristics of the portfolios, as well as any changes in ourloss mitigation or marketing strategies.
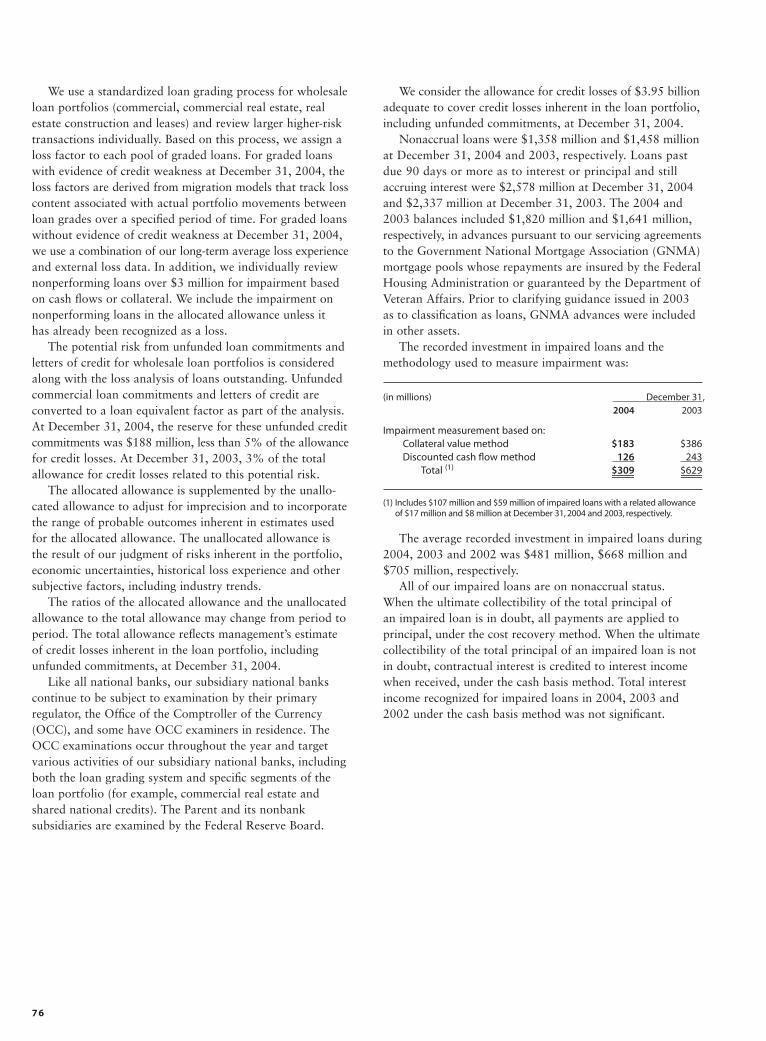
76
(in millions) December 31,2004 2003
Impairment measurement based on:Collateral value method $183 $386Discounted cash flow method 126 243
Total (1) $309 $629
(1) Includes $107 million and $59 million of impaired loans with a related allowanceof $17 million and $8 million at December 31, 2004 and 2003, respectively.
We consider the allowance for credit losses of $3.95 billionadequate to cover credit losses inherent in the loan portfolio,including unfunded commitments, at December 31, 2004.
Nonaccrual loans were $1,358 million and $1,458 millionat December 31, 2004 and 2003, respectively. Loans pastdue 90 days or more as to interest or principal and stillaccruing interest were $2,578 million at December 31, 2004and $2,337 million at December 31, 2003. The 2004 and2003 balances included $1,820 million and $1,641 million,respectively, in advances pursuant to our servicing agreementsto the Government National Mortgage Association (GNMA)mortgage pools whose repayments are insured by the FederalHousing Administration or guaranteed by the Department ofVeteran Affairs. Prior to clarifying guidance issued in 2003as to classification as loans, GNMA advances were includedin other assets.
The recorded investment in impaired loans and themethodology used to measure impairment was:
We use a standardized loan grading process for wholesaleloan portfolios (commercial, commercial real estate, realestate construction and leases) and review larger higher-risktransactions individually. Based on this process, we assign aloss factor to each pool of graded loans. For graded loanswith evidence of credit weakness at December 31, 2004, theloss factors are derived from migration models that track losscontent associated with actual portfolio movements betweenloan grades over a specified period of time. For graded loanswithout evidence of credit weakness at December 31, 2004,we use a combination of our long-term average loss experienceand external loss data. In addition, we individually reviewnonperforming loans over $3 million for impairment basedon cash flows or collateral. We include the impairment onnonperforming loans in the allocated allowance unless it has already been recognized as a loss.
The potential risk from unfunded loan commitments andletters of credit for wholesale loan portfolios is consideredalong with the loss analysis of loans outstanding. Unfundedcommercial loan commitments and letters of credit are converted to a loan equivalent factor as part of the analysis.At December 31, 2004, the reserve for these unfunded creditcommitments was $188 million, less than 5% of the allowancefor credit losses. At December 31, 2003, 3% of the totalallowance for credit losses related to this potential risk.
The allocated allowance is supplemented by the unallo-cated allowance to adjust for imprecision and to incorporatethe range of probable outcomes inherent in estimates usedfor the allocated allowance. The unallocated allowance is the result of our judgment of risks inherent in the portfolio,economic uncertainties, historical loss experience and othersubjective factors, including industry trends.
The ratios of the allocated allowance and the unallocatedallowance to the total allowance may change from period toperiod. The total allowance reflects management’s estimateof credit losses inherent in the loan portfolio, includingunfunded commitments, at December 31, 2004.
Like all national banks, our subsidiary national bankscontinue to be subject to examination by their primary regulator, the Office of the Comptroller of the Currency(OCC), and some have OCC examiners in residence. TheOCC examinations occur throughout the year and targetvarious activities of our subsidiary national banks, includingboth the loan grading system and specific segments of theloan portfolio (for example, commercial real estate andshared national credits). The Parent and its nonbank subsidiaries are examined by the Federal Reserve Board.
The average recorded investment in impaired loans during2004, 2003 and 2002 was $481 million, $668 million and$705 million, respectively.
All of our impaired loans are on nonaccrual status. When the ultimate collectibility of the total principal of an impaired loan is in doubt, all payments are applied toprincipal, under the cost recovery method. When the ultimatecollectibility of the total principal of an impaired loan is notin doubt, contractual interest is credited to interest incomewhen received, under the cash basis method. Total interestincome recognized for impaired loans in 2004, 2003 and2002 under the cash basis method was not significant.
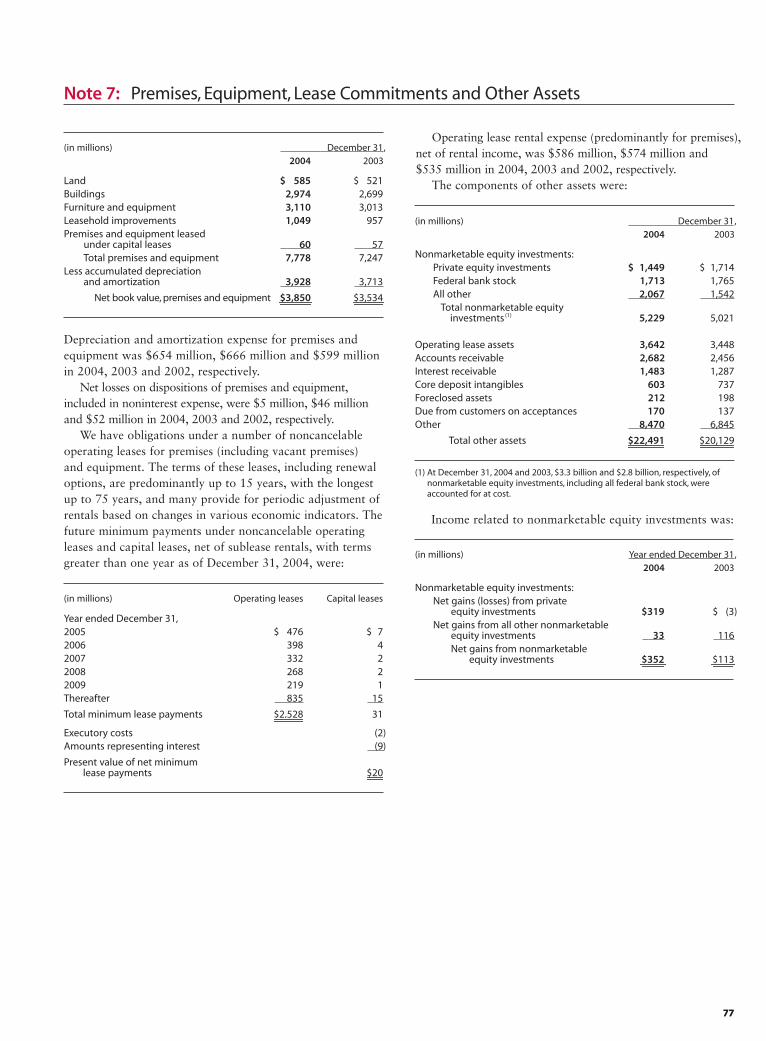
77
(in millions) Year ended December 31,2004 2003
Nonmarketable equity investments:Net gains (losses) from private
equity investments $319 $ (3)Net gains from all other nonmarketable
equity investments 33 116Net gains from nonmarketable
equity investments $352 $113
(1) At December 31, 2004 and 2003, $3.3 billion and $2.8 billion, respectively, ofnonmarketable equity investments, including all federal bank stock, wereaccounted for at cost.
Note 7: Premises, Equipment, Lease Commitments and Other Assets
Operating lease rental expense (predominantly for premises),net of rental income, was $586 million, $574 million and $535 million in 2004, 2003 and 2002, respectively.
The components of other assets were:
Depreciation and amortization expense for premises andequipment was $654 million, $666 million and $599 millionin 2004, 2003 and 2002, respectively.
Net losses on dispositions of premises and equipment, included in noninterest expense, were $5 million, $46 millionand $52 million in 2004, 2003 and 2002, respectively.
We have obligations under a number of noncancelableoperating leases for premises (including vacant premises) and equipment. The terms of these leases, including renewaloptions, are predominantly up to 15 years, with the longestup to 75 years, and many provide for periodic adjustment ofrentals based on changes in various economic indicators. Thefuture minimum payments under noncancelable operatingleases and capital leases, net of sublease rentals, with termsgreater than one year as of December 31, 2004, were:
Income related to nonmarketable equity investments was:
(in millions) December 31,2004 2003
Land $ 585 $ 521Buildings 2,974 2,699Furniture and equipment 3,110 3,013Leasehold improvements 1,049 957Premises and equipment leased
under capital leases 60 57Total premises and equipment 7,778 7,247
Less accumulated depreciation and amortization 3,928 3,713
Net book value, premises and equipment $3,850 $3,534
(in millions) Operating leases Capital leases
Year ended December 31,2005 $ 476 $ 72006 398 42007 332 22008 268 22009 219 1Thereafter 835 15
Total minimum lease payments $2,528 31
Executory costs (2)Amounts representing interest (9)
Present value of net minimum lease payments $20
(in millions) December 31,2004 2003
Nonmarketable equity investments:Private equity investments $ 1,449 $ 1,714Federal bank stock 1,713 1,765All other 2,067 1,542
Total nonmarketable equityinvestments (1) 5,229 5,021
Operating lease assets 3,642 3,448Accounts receivable 2,682 2,456Interest receivable 1,483 1,287Core deposit intangibles 603 737Foreclosed assets 212 198Due from customers on acceptances 170 137Other 8,470 6,845
Total other assets $22,491 $20,129
77
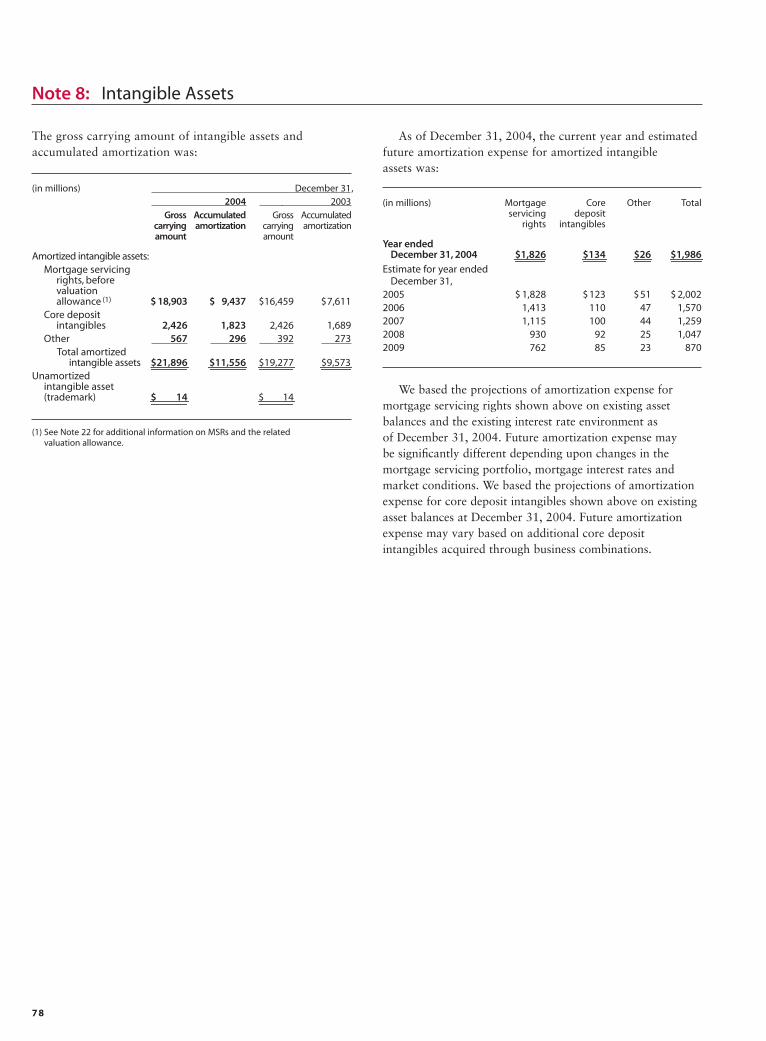
78
The gross carrying amount of intangible assets and accumulated amortization was:
Note 8: Intangible Assets
We based the projections of amortization expense formortgage servicing rights shown above on existing asset balances and the existing interest rate environment as of December 31, 2004. Future amortization expense may be significantly different depending upon changes in the mortgage servicing portfolio, mortgage interest rates andmarket conditions. We based the projections of amortizationexpense for core deposit intangibles shown above on existingasset balances at December 31, 2004. Future amortizationexpense may vary based on additional core deposit intangibles acquired through business combinations.
(in millions) December 31,2004 2003
Gross Accumulated Gross Accumulatedcarrying amortization carrying amortizationamount amount
Amortized intangible assets:Mortgage servicing
rights, beforevaluation allowance (1) $ 18,903 $ 9,437 $16,459 $7,611
Core deposit intangibles 2,426 1,823 2,426 1,689
Other 567 296 392 273Total amortized
intangible assets $21,896 $11,556 $19,277 $9,573Unamortized
intangible asset (trademark) $ 14 $ 14
(1) See Note 22 for additional information on MSRs and the related valuation allowance.
(in millions) Mortgage Core Other Totalservicing deposit
rights intangibles
Year ended December 31, 2004 $1,826 $134 $26 $1,986
Estimate for year ended December 31,
2005 $ 1,828 $123 $51 $ 2,0022006 1,413 110 47 1,5702007 1,115 100 44 1,2592008 930 92 25 1,0472009 762 85 23 870
As of December 31, 2004, the current year and estimatedfuture amortization expense for amortized intangible assets was:
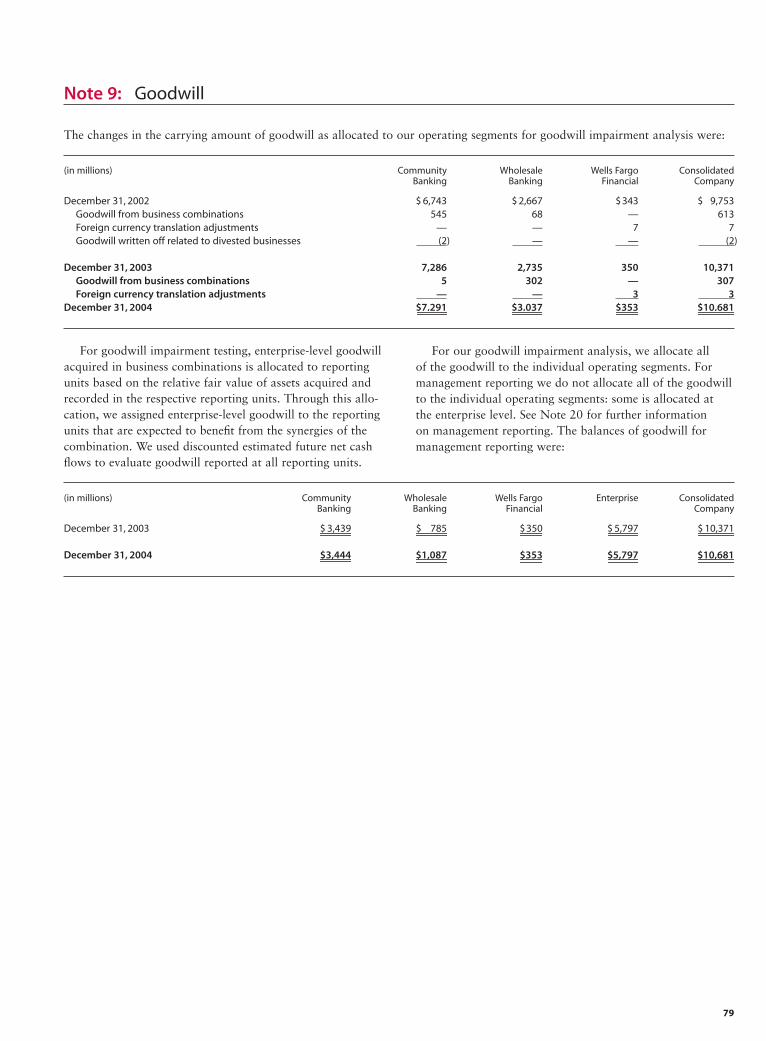
79
The changes in the carrying amount of goodwill as allocated to our operating segments for goodwill impairment analysis were:
Note 9: Goodwill
For goodwill impairment testing, enterprise-level goodwillacquired in business combinations is allocated to reportingunits based on the relative fair value of assets acquired andrecorded in the respective reporting units. Through this allo-cation, we assigned enterprise-level goodwill to the reportingunits that are expected to benefit from the synergies of thecombination. We used discounted estimated future net cashflows to evaluate goodwill reported at all reporting units.
For our goodwill impairment analysis, we allocate all of the goodwill to the individual operating segments. Formanagement reporting we do not allocate all of the goodwillto the individual operating segments: some is allocated at the enterprise level. See Note 20 for further information on management reporting. The balances of goodwill formanagement reporting were:
(in millions) Community Wholesale Wells Fargo Enterprise ConsolidatedBanking Banking Financial Company
December 31, 2003 $ 3,439 $ 785 $350 $ 5,797 $ 10,371
December 31, 2004 $3,444 $1,087 $353 $5,797 $10,681
(in millions) Community Wholesale Wells Fargo ConsolidatedBanking Banking Financial Company
December 31, 2002 $ 6,743 $ 2,667 $343 $ 9,753Goodwill from business combinations 545 68 — 613Foreign currency translation adjustments — — 7 7Goodwill written off related to divested businesses (2) — — (2)
December 31, 2003 7,286 2,735 350 10,371Goodwill from business combinations 5 302 — 307Foreign currency translation adjustments — — 3 3
December 31, 2004 $7,291 $3,037 $353 $10,681
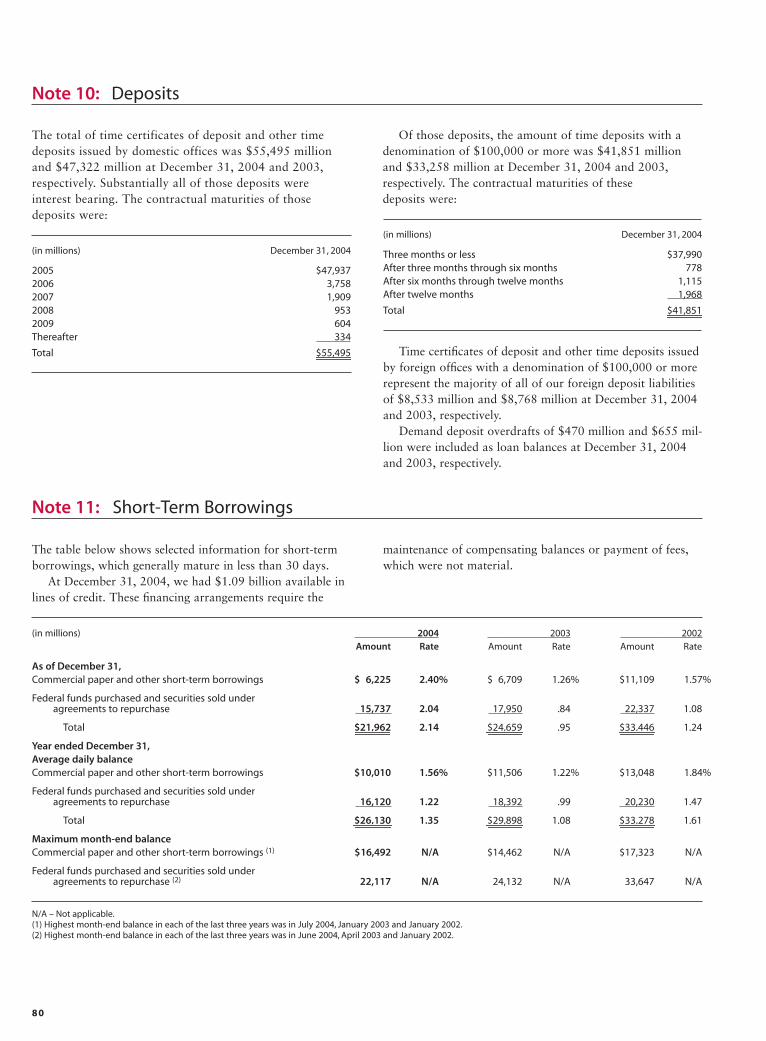
80
(in millions) December 31, 2004
Three months or less $37,990After three months through six months 778After six months through twelve months 1,115After twelve months 1,968
Total $41,851
The total of time certificates of deposit and other timedeposits issued by domestic offices was $55,495 millionand $47,322 million at December 31, 2004 and 2003,respectively. Substantially all of those deposits were interest bearing. The contractual maturities of thosedeposits were:
Note 10: Deposits
Of those deposits, the amount of time deposits with adenomination of $100,000 or more was $41,851 millionand $33,258 million at December 31, 2004 and 2003,respectively. The contractual maturities of these deposits were:
(in millions) December 31, 2004
2005 $47,9372006 3,7582007 1,9092008 9532009 604Thereafter 334
Total $55,495 Time certificates of deposit and other time deposits issued by foreign offices with a denomination of $100,000 or more represent the majority of all of our foreign deposit liabilities of $8,533 million and $8,768 million at December 31, 2004 and 2003, respectively.
Demand deposit overdrafts of $470 million and $655 mil-lion were included as loan balances at December 31, 2004 and 2003, respectively.
The table below shows selected information for short-termborrowings, which generally mature in less than 30 days.
At December 31, 2004, we had $1.09 billion available inlines of credit. These financing arrangements require the
Note 11: Short-Term Borrowings
(in millions) 2004 2003 2002Amount Rate Amount Rate Amount Rate
As of December 31,Commercial paper and other short-term borrowings $ 6,225 2.40% $ 6,709 1.26% $11,109 1.57%
Federal funds purchased and securities sold underagreements to repurchase 15,737 2.04 17,950 .84 22,337 1.08
Total $21,962 2.14 $24,659 .95 $33,446 1.24
Year ended December 31,Average daily balanceCommercial paper and other short-term borrowings $10,010 1.56% $11,506 1.22% $13,048 1.84%
Federal funds purchased and securities sold underagreements to repurchase 16,120 1.22 18,392 .99 20,230 1.47
Total $26,130 1.35 $29,898 1.08 $33,278 1.61
Maximum month-end balanceCommercial paper and other short-term borrowings (1) $16,492 N/A $14,462 N/A $17,323 N/A
Federal funds purchased and securities sold underagreements to repurchase (2) 22,117 N/A 24,132 N/A 33,647 N/A
N/A – Not applicable.(1) Highest month-end balance in each of the last three years was in July 2004, January 2003 and January 2002.(2) Highest month-end balance in each of the last three years was in June 2004, April 2003 and January 2002.
maintenance of compensating balances or payment of fees,which were not material.
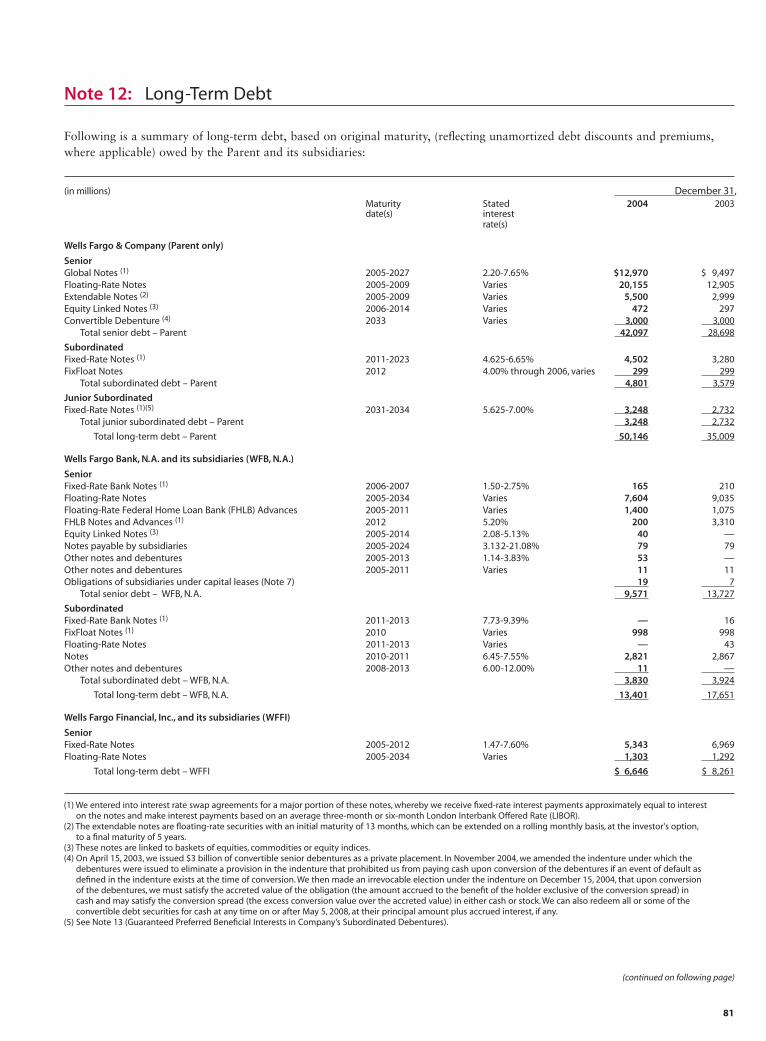
81
Following is a summary of long-term debt, based on original maturity, (reflecting unamortized debt discounts and premiums,where applicable) owed by the Parent and its subsidiaries:
Note 12: Long-Term Debt
(in millions) December 31,Maturity Stated 2004 2003date(s) interest
rate(s)
Wells Fargo & Company (Parent only)
SeniorGlobal Notes (1) 2005-2027 2.20-7.65% $12,970 $ 9,497Floating-Rate Notes 2005-2009 Varies 20,155 12,905Extendable Notes (2) 2005-2009 Varies 5,500 2,999Equity Linked Notes (3) 2006-2014 Varies 472 297Convertible Debenture (4) 2033 Varies 3,000 3,000
Total senior debt – Parent 42,097 28,698
SubordinatedFixed-Rate Notes (1) 2011-2023 4.625-6.65% 4,502 3,280FixFloat Notes 2012 4.00% through 2006, varies 299 299
Total subordinated debt – Parent 4,801 3,579
Junior SubordinatedFixed-Rate Notes (1)(5) 2031-2034 5.625-7.00% 3,248 2,732
Total junior subordinated debt – Parent 3,248 2,732
Total long-term debt – Parent 50,146 35,009
Wells Fargo Bank, N.A. and its subsidiaries (WFB, N.A.)
SeniorFixed-Rate Bank Notes (1) 2006-2007 1.50-2.75% 165 210Floating-Rate Notes 2005-2034 Varies 7,604 9,035Floating-Rate Federal Home Loan Bank (FHLB) Advances 2005-2011 Varies 1,400 1,075FHLB Notes and Advances (1) 2012 5.20% 200 3,310Equity Linked Notes (3) 2005-2014 2.08-5.13% 40 —Notes payable by subsidiaries 2005-2024 3.132-21.08% 79 79Other notes and debentures 2005-2013 1.14-3.83% 53 —Other notes and debentures 2005-2011 Varies 11 11Obligations of subsidiaries under capital leases (Note 7) 19 7
Total senior debt – WFB, N.A. 9,571 13,727
SubordinatedFixed-Rate Bank Notes (1) 2011-2013 7.73-9.39% — 16FixFloat Notes (1) 2010 Varies 998 998Floating-Rate Notes 2011-2013 Varies — 43Notes 2010-2011 6.45-7.55% 2,821 2,867Other notes and debentures 2008-2013 6.00-12.00% 11 —
Total subordinated debt – WFB, N.A. 3,830 3,924
Total long-term debt – WFB, N.A. 13,401 17,651
Wells Fargo Financial, Inc., and its subsidiaries (WFFI)
SeniorFixed-Rate Notes 2005-2012 1.47-7.60% 5,343 6,969Floating-Rate Notes 2005-2034 Varies 1,303 1,292
Total long-term debt – WFFI $ 6,646 $ 8,261
(1) We entered into interest rate swap agreements for a major portion of these notes, whereby we receive fixed-rate interest payments approximately equal to intereston the notes and make interest payments based on an average three-month or six-month London Interbank Offered Rate (LIBOR).
(2) The extendable notes are floating-rate securities with an initial maturity of 13 months, which can be extended on a rolling monthly basis, at the investor's option,to a final maturity of 5 years.
(3) These notes are linked to baskets of equities, commodities or equity indices.(4) On April 15, 2003, we issued $3 billion of convertible senior debentures as a private placement. In November 2004, we amended the indenture under which the
debentures were issued to eliminate a provision in the indenture that prohibited us from paying cash upon conversion of the debentures if an event of default asdefined in the indenture exists at the time of conversion. We then made an irrevocable election under the indenture on December 15, 2004, that upon conversion of the debentures, we must satisfy the accreted value of the obligation (the amount accrued to the benefit of the holder exclusive of the conversion spread) in cash and may satisfy the conversion spread (the excess conversion value over the accreted value) in either cash or stock. We can also redeem all or some of the convertible debt securities for cash at any time on or after May 5, 2008, at their principal amount plus accrued interest, if any.
(5) See Note 13 (Guaranteed Preferred Beneficial Interests in Company’s Subordinated Debentures).
(continued on following page)
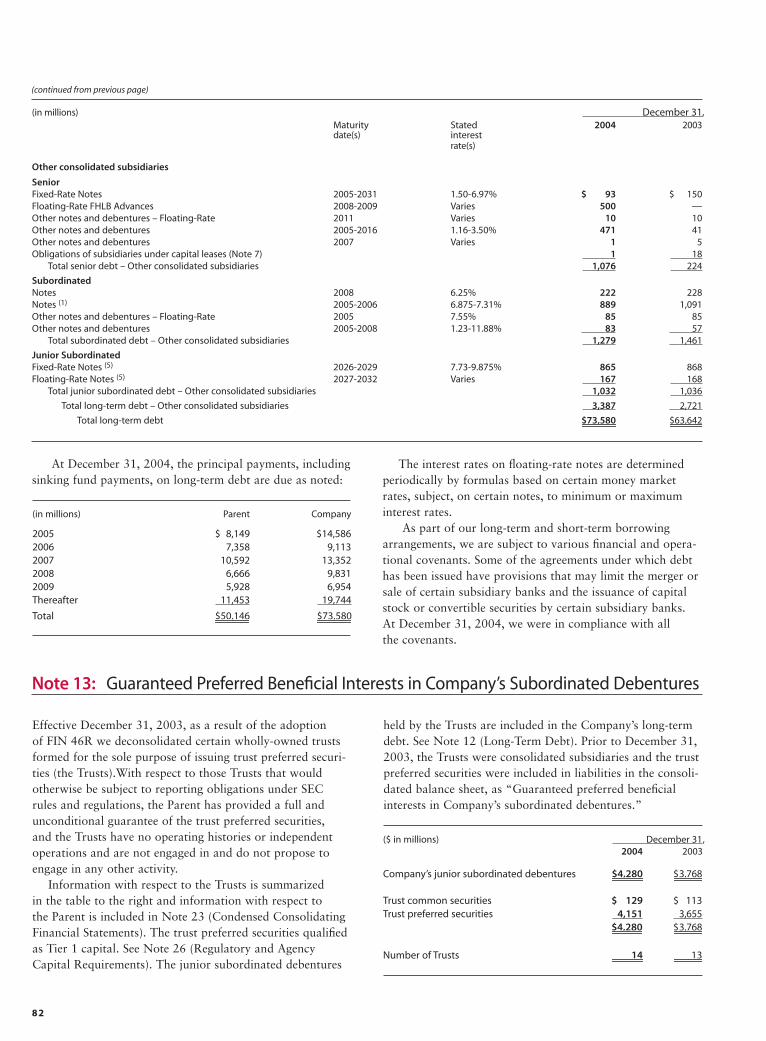
82
(in millions) December 31,Maturity Stated 2004 2003date(s) interest
rate(s)
Other consolidated subsidiaries
SeniorFixed-Rate Notes 2005-2031 1.50-6.97% $ 93 $ 150Floating-Rate FHLB Advances 2008-2009 Varies 500 —Other notes and debentures – Floating-Rate 2011 Varies 10 10Other notes and debentures 2005-2016 1.16-3.50% 471 41Other notes and debentures 2007 Varies 1 5Obligations of subsidiaries under capital leases (Note 7) 1 18
Total senior debt – Other consolidated subsidiaries 1,076 224
SubordinatedNotes 2008 6.25% 222 228Notes (1) 2005-2006 6.875-7.31% 889 1,091Other notes and debentures – Floating-Rate 2005 7.55% 85 85Other notes and debentures 2005-2008 1.23-11.88% 83 57
Total subordinated debt – Other consolidated subsidiaries 1,279 1,461
Junior SubordinatedFixed-Rate Notes (5) 2026-2029 7.73-9.875% 865 868Floating-Rate Notes (5) 2027-2032 Varies 167 168
Total junior subordinated debt – Other consolidated subsidiaries 1,032 1,036
Total long-term debt – Other consolidated subsidiaries 3,387 2,721
Total long-term debt $73,580 $63,642
($ in millions) December 31,2004 2003
Company’s junior subordinated debentures $4,280 $3,768
Trust common securities $ 129 $ 113Trust preferred securities 4,151 3,655
$4,280 $3,768
Number of Trusts 14 13
held by the Trusts are included in the Company’s long-termdebt. See Note 12 (Long-Term Debt). Prior to December 31,2003, the Trusts were consolidated subsidiaries and the trustpreferred securities were included in liabilities in the consoli-dated balance sheet, as “Guaranteed preferred beneficialinterests in Company’s subordinated debentures.”
Effective December 31, 2003, as a result of the adoption of FIN 46R we deconsolidated certain wholly-owned trustsformed for the sole purpose of issuing trust preferred securi-ties (the Trusts).With respect to those Trusts that would otherwise be subject to reporting obligations under SEC rules and regulations, the Parent has provided a full andunconditional guarantee of the trust preferred securities, and the Trusts have no operating histories or independentoperations and are not engaged in and do not propose toengage in any other activity.
Information with respect to the Trusts is summarized in the table to the right and information with respect to the Parent is included in Note 23 (Condensed ConsolidatingFinancial Statements). The trust preferred securities qualifiedas Tier 1 capital. See Note 26 (Regulatory and AgencyCapital Requirements). The junior subordinated debentures
Note 13: Guaranteed Preferred Beneficial Interests in Company’s Subordinated Debentures
At December 31, 2004, the principal payments, includingsinking fund payments, on long-term debt are due as noted:
(in millions) Parent Company
2005 $ 8,149 $14,5862006 7,358 9,1132007 10,592 13,3522008 6,666 9,8312009 5,928 6,954Thereafter 11,453 19,744
Total $50,146 $73,580
(continued from previous page)
The interest rates on floating-rate notes are determinedperiodically by formulas based on certain money marketrates, subject, on certain notes, to minimum or maximuminterest rates.
As part of our long-term and short-term borrowingarrangements, we are subject to various financial and opera-tional covenants. Some of the agreements under which debthas been issued have provisions that may limit the merger orsale of certain subsidiary banks and the issuance of capitalstock or convertible securities by certain subsidiary banks. At December 31, 2004, we were in compliance with all the covenants.
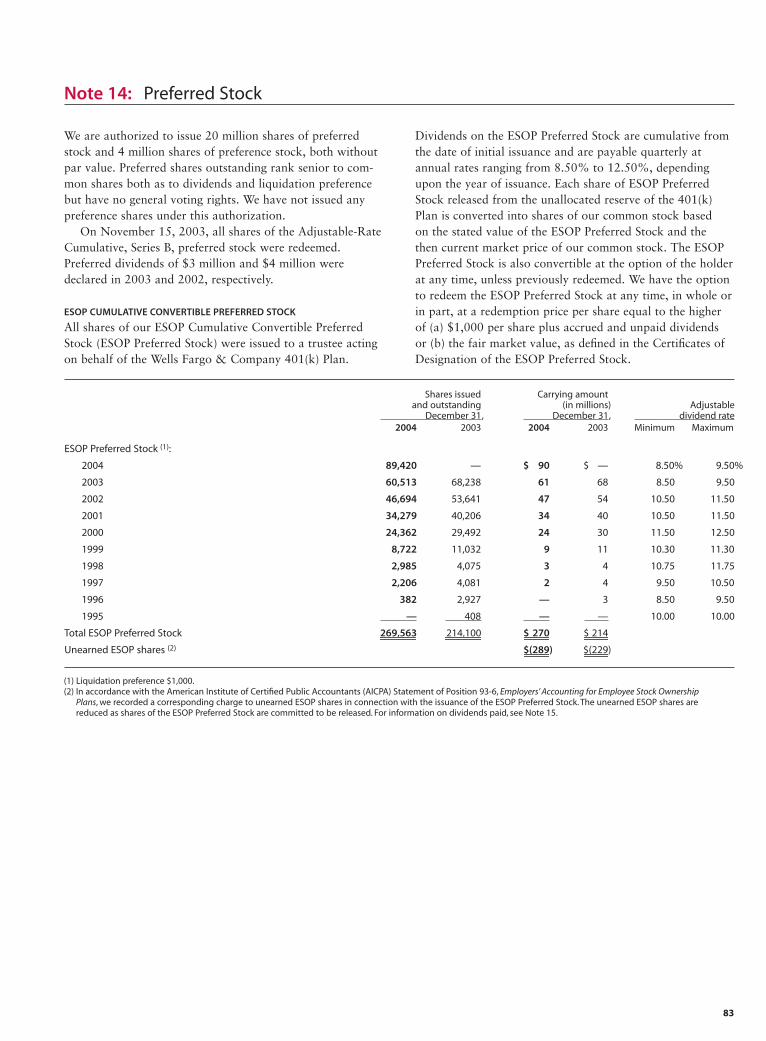
83
We are authorized to issue 20 million shares of preferredstock and 4 million shares of preference stock, both withoutpar value. Preferred shares outstanding rank senior to com-mon shares both as to dividends and liquidation preferencebut have no general voting rights. We have not issued anypreference shares under this authorization.
On November 15, 2003, all shares of the Adjustable-RateCumulative, Series B, preferred stock were redeemed.Preferred dividends of $3 million and $4 million weredeclared in 2003 and 2002, respectively.
ESOP CUMULATIVE CONVERTIBLE PREFERRED STOCK
All shares of our ESOP Cumulative Convertible PreferredStock (ESOP Preferred Stock) were issued to a trustee actingon behalf of the Wells Fargo & Company 401(k) Plan.
Note 14: Preferred Stock
Dividends on the ESOP Preferred Stock are cumulative fromthe date of initial issuance and are payable quarterly atannual rates ranging from 8.50% to 12.50%, dependingupon the year of issuance. Each share of ESOP PreferredStock released from the unallocated reserve of the 401(k)Plan is converted into shares of our common stock based on the stated value of the ESOP Preferred Stock and the then current market price of our common stock. The ESOPPreferred Stock is also convertible at the option of the holderat any time, unless previously redeemed. We have the optionto redeem the ESOP Preferred Stock at any time, in whole orin part, at a redemption price per share equal to the higherof (a) $1,000 per share plus accrued and unpaid dividends or (b) the fair market value, as defined in the Certificates ofDesignation of the ESOP Preferred Stock.
(1) Liquidation preference $1,000.(2) In accordance with the American Institute of Certified Public Accountants (AICPA) Statement of Position 93-6, Employers’ Accounting for Employee Stock Ownership
Plans, we recorded a corresponding charge to unearned ESOP shares in connection with the issuance of the ESOP Preferred Stock. The unearned ESOP shares arereduced as shares of the ESOP Preferred Stock are committed to be released. For information on dividends paid, see Note 15.
Shares issued Carrying amountand outstanding (in millions) Adjustable December 31, December 31, dividend rate
2004 2003 2004 2003 Minimum Maximum
ESOP Preferred Stock (1):
2004 89,420 — $ 90 $ — 8.50% 9.50%
2003 60,513 68,238 61 68 8.50 9.50
2002 46,694 53,641 47 54 10.50 11.50
2001 34,279 40,206 34 40 10.50 11.50
2000 24,362 29,492 24 30 11.50 12.50
1999 8,722 11,032 9 11 10.30 11.30
1998 2,985 4,075 3 4 10.75 11.75
1997 2,206 4,081 2 4 9.50 10.50
1996 382 2,927 — 3 8.50 9.50
1995 — 408 — — 10.00 10.00
Total ESOP Preferred Stock 269,563 214,100 $ 270 $ 214
Unearned ESOP shares (2) $(289) $(229)

84
Note 15: Common Stock and Stock Plans
Common StockOur reserved, issued and authorized shares of common stockat December 31, 2004, were:
Options also may include the right to acquire a “reload”stock option. If an option contains the reload feature and if a participant pays all or part of the exercise price of theoption with shares of stock purchased in the market or heldby the participant for at least six months, upon exercise ofthe option, the participant is granted a new option to pur-chase, at the fair market value of the stock as of the date ofthe reload, the number of shares of stock equal to the sum ofthe number of shares used in payment of the exercise priceand a number of shares with respect to related statutoryminimum withholding taxes. Options granted in 2004 didnot include a reload feature.
We did not record any compensation expense for theoptions granted under the plans during 2004, 2003 and2002, as the exercise price was equal to the quoted marketprice of the stock at the date of grant. The total number ofshares of common stock available for grant under the plansat December 31, 2004, was 38,417,959.
Holders of restricted shares and restricted share rights areentitled to the related shares of common stock at no costgenerally over three to five years after the restricted shares or restricted share rights were granted. Holders of restrictedshares generally are entitled to receive cash dividends paidon the shares. Holders of restricted share rights generally areentitled to receive cash payments equal to the cash dividendsthat would have been paid had the restricted share rightsbeen issued and outstanding shares of common stock. Exceptin limited circumstances, restricted shares and restrictedshare rights are canceled when employment ends.
In 2004, no restricted shares or restricted share rightswere granted. In 2003 and 2002, 61,740 and 81,380 restricted shares and restricted share rights were granted,respectively, with a weighted-average grant-date per share fair value of $56.05 and $45.47, respectively. AtDecember 31, 2004, 2003 and 2002, there were 448,150,577,722 and 656,124 restricted shares and restricted sharerights outstanding, respectively. The compensation expensefor the restricted shares and restricted share rights equals thequoted market price of the related stock at the date of grantand is accrued over the vesting period. We recognized total compensation expense for the restricted shares and restrictedshare rights of $3 million in 2004, $4 million in 2003 and$5 million in 2002.
For various acquisitions and mergers since 1992, we converted employee and director stock options of acquiredor merged companies into stock options to purchase ourcommon stock based on the terms of the original stockoption plan and the agreed-upon exchange ratio.
Dividend Reinvestment and Common Stock Purchase PlansParticipants in our dividend reinvestment and common stockdirect purchase plans may purchase shares of our commonstock at fair market value by reinvesting dividends and/ormaking optional cash payments, under the plan’s terms.
Director PlansWe provide a stock award to non-employee directors as part of their annual retainer under our director plans. Wealso provide annual grants of options to purchase commonstock to each non-employee director elected or re-elected at the annual meeting of stockholders. The options can beexercised after six months and through the tenth anniversary of the grant date.
Employee Stock PlansLONG-TERM INCENTIVE PLANS Our stock incentive plans providefor awards of incentive and nonqualified stock options, stockappreciation rights, restricted shares, restricted share rights,performance awards and stock awards without restrictions.We can grant employee stock options with exercise prices ator above the fair market value (as defined in the plan) of thestock at the date of grant and with terms of up to ten years.Options granted in 2003 and prior generally become fullyexercisable over three years from the date of grant. Optionsgranted in 2004 generally vest fully upon grant. Except asotherwise permitted under the plan, if employment is endedfor reasons other than retirement, permanent disability or death, the option period is reduced or the options are canceled.
Number of shares
Dividend reinvestment and common stock purchase plans 2,304,973
Director plans 734,684Stock plans (1) 212,321,072
Total shares reserved 215,360,729Shares issued 1,736,381,025Shares not reserved 4,048,258,246
Total shares authorized 6,000,000,000
(1) Includes employee option, restricted shares and restricted share rights, 401(k),profit sharing and compensation deferral plans.
85
market price of the stock reaches a predetermined price.These options generally expire ten years after the date ofgrant. Because the exercise price of each PartnerSharesgrant has been equal to or higher than the quoted marketprice of our common stock at the date of grant, we do not recognize any compensation expense.
The following table summarizes stock option activity and related information for the three years ended December 31, 2004.
Director Plans Long-Term Incentive Plans Broad-Based PlansNumber Weighted-average Number Weighted-average Number Weighted-average
exercise price exercise price exercise price
Options outstanding as of December 31, 2001 312,916 $ 34.69 81,929,268 $ 37.23 45,414,315 $ 39.23
2002:Granted 44,786 50.22 23,790,286 (1) 46.99 18,015,150 50.46Canceled — — (1,539,244) 45.36 (10,092,056) 42.15Exercised (8,594) 30.56 (10,873,465) 30.62 (3,249,213) 30.54Acquisitions — — 72,892 31.33 — —
Options outstanding as of December 31, 2002 349,108 36.78 93,379,737 40.35 50,088,196 43.25
2003:Granted 62,346 47.22 23,052,384 (1) 46.04 — —Canceled — — (1,529,868) 46.76 (4,293,930) 46.85Exercised (59,707) 26.90 (13,884,561) 31.96 (6,408,797) 34.09Acquisitions 4,769 31.42 889,842 25.89 — —
Options outstanding as of December 31, 2003 356,516 40.19 101,907,534 42.56 39,385,469 44.35
2004:Granted 50,960 56.39 21,983,690 (1) 57.41 — —Canceled — — (1,241,637) 48.06 (2,895,200) 48.26Exercised (21,427) 18.81 (18,574,660) 37.89 (3,792,605) 34.84
Options outstanding as of December 31, 2004 386,049 $43.51 104,074,927 $46.46 32,697,664 $45.10
Outstanding options exercisable as of:December 31, 2002 349,108 $ 36.78 54,429,329 $ 36.94 9,174,196 $ 31.35December 31, 2003 353,131 40.08 63,257,541 40.33 12,063,244 35.21December 31, 2004 386,049 43.51 84,702,073 46.64 8,590,539 35.99
(1) Includes 4,909,864, 2,311,824 and 2,860,926 reload grants at December 31, 2004, 2003 and 2002, respectively.
The following table presents the weighted-average pershare fair value of options granted estimated using a Black-Scholes option-pricing model and the weighted-averageassumptions used.
2004 2003 2002
Per share fair value of options granted:Director Plans $9.34 $9.59 $13.45Long-Term Incentive Plans 9.32 9.48 12.34Broad-Based Plans — — 15.62
Expected life (years) 4.4 4.3 5.0Expected volatility 23.8% 29.2% 31.6%Risk-free interest rate 2.9 2.5 4.6Expected annual dividend yield 3.4 2.9 2.4
BROAD-BASED PLANS In 1996, we adopted the PartnerShares®
Stock Option Plan, a broad-based employee stock optionplan. It covers full- and part-time employees who were not included in the long-term incentive plans described onthe preceding page. The total number of shares of commonstock authorized for issuance under the plan since inceptionthrough December 31, 2004, was 74,000,000, including21,194,286 shares available for grant. The exercise date ofoptions granted under the PartnerShares Plan is the earlier of (1) five years after the date of grant or (2) when the quoted
86
EMPLOYEE STOCK OWNERSHIP PLAN Under the Wells Fargo &Company 401(k) Plan (the 401(k) Plan), a defined contribu-tion employee stock ownership plan (ESOP), the 401(k) Planmay borrow money to purchase our common or preferredstock. Beginning in 1994, we have loaned money to the401(k) Plan to purchase shares of our ESOP Preferred Stock.As we release and convert ESOP Preferred Stock into com-mon shares, we record compensation expense equal to thecurrent market price of the common shares. Dividends on the common shares allocated as a result of the release and conversion of the ESOP Preferred Stock reduce retained
This table is a summary of our stock option plans described on the preceding page.
(in millions, except shares) Shares outstanding Dividends paid __________December 31, Year ended December 31,2004 2003 2002 2004 2003 2002
Allocated shares (common) 33,921,758 31,927,982 29,421,521 $61 $46 $31Unreleased shares (preferred) 269,563 214,100 177,560 32 26 24
Fair value of unearned ESOP shares $270 $214 $178
Deferred Compensation Plan for Independent Sales AgentsWF Deferred Compensation Holdings, Inc. is a wholly-owned subsidiary of the Parent formed solely to sponsor a deferred compensation plan for independent sales agentswho provide investment, financial and other qualifying services for or with respect to participating affiliates.
The balance of ESOP shares, the dividends on allocated shares of common stock and unreleased preferred shares paid to the401(k) Plan and the fair value of unearned ESOP shares were:
The plan, which became effective January 1, 2002, allowsparticipants to defer all or part of their eligible compensationpayable to them by a participating affiliate. The Parent has fully and unconditionally guaranteed the deferred compensation obligations of WF Deferred CompensationHoldings, Inc. under the plan.
December 31, 2004 Options outstanding Options exercisable
Range of exercise prices Number Weighted-average Weighted-average Number Weighted-averageexercise price remaining contractual exercise price
life (in yrs.)
Director Plans$7.84-$13.48 3,210 $10.80 1.01 3,210 $10.80$13.49-$16.00 12,530 15.49 .64 12,530 15.49$16.01-$25.04 40,796 22.08 .93 40,796 22.08$25.05-$38.29 44,620 32.92 2.86 44,620 32.92$38.30-$51.00 211,733 46.53 6.62 211,733 46.53$51.01-$69.01 73,160 59.43 7.75 73,160 59.43
Long-Term Incentive Plans$3.37-$5.06 51,412 $ 4.22 5.10 51,412 $ 4.22$5.07-$7.60 4,366 5.84 21.02 4,366 5.84$11.42-$17.13 424,485 15.72 1.09 334,485 15.48$17.14-$25.71 121,589 23.26 3.21 121,589 23.26$25.72-$38.58 21,690,735 34.18 3.94 21,476,235 34.17$38.59-$71.30 81,782,340 49.94 7.05 62,713,986 51.16
Broad-based Plans$16.56 429,482 $16.56 1.56 429,482 $16.56$24.85-$37.81 7,041,357 35.29 3.41 7,041,357 35.29$37.82-$46.50 13,584,200 46.46 5.85 738,150 46.48$46.51-$51.15 11,642,625 50.50 7.22 381,550 50.50
earnings and the shares are considered outstanding for computing earnings per share. Dividends on the unallocatedESOP Preferred Stock do not reduce retained earnings, andthe shares are not considered to be common stock equivalentsfor computing earnings per share. Loan principal and interestpayments are made from our contributions to the 401(k)Plan, along with dividends paid on the ESOP Preferred Stock.With each principal and interest payment, a portion of theESOP Preferred Stock is released and, after conversion of the ESOP Preferred Stock into common shares, allocated to the 401(k) Plan participants.
87
Note 16: Employee Benefits and Other Expenses
Employee BenefitsWe sponsor noncontributory qualified defined benefit retirement plans including the Cash Balance Plan. The Cash Balance Plan is an active plan that covers eligibleemployees (except employees of certain subsidiaries).
Under the Cash Balance Plan, eligible employees’ CashBalance Plan accounts are allocated a compensation creditbased on a percentage of their certified compensation. Thecompensation credit percentage is based on age and years of credited service. In addition, investment credits are allo-cated to participants quarterly based on their accumulatedbalances. Employees become vested in their Cash BalancePlan accounts after completing five years of vesting service or reaching age 65, if earlier. Pension benefits accrued beforethe conversion to the Cash Balance Plan are guaranteed. In addition, certain employees are eligible for a special transition benefit.
Although we were not required to make a minimum con-tribution in 2004 for our Cash Balance Plan, we funded themaximum amount deductible under the Internal RevenueCode, or $535 million. The total amount contributed for ourpension plans was $580 million. We expect that we will notbe required to make a minimum contribution in 2005 for theCash Balance Plan. The maximum contribution amount in2005 for the Cash Balance Plan depends on several factors,including the finalization of participant data. Our decisionon how much to contribute, if any, depends on other factors,including the actual investment performance of plan assets.Given these uncertainties, we cannot at this time reliablyestimate the maximum deductible contribution or theamount that we will contribute in 2005 to the Cash BalancePlan. For the unfunded nonqualified pension plans andpostretirement benefit plans, we will contribute the minimum
required amount in 2005, which equals the benefits paidunder the plans. In 2004, we paid $70 million in benefits for the postretirement plans, which included $26 million inretiree contributions, and $25 million for the unfunded pension plans.
We sponsor defined contribution retirement plans includ-ing the 401(k) Plan. Under the 401(k) Plan, after one monthof service, eligible employees may contribute up to 25% oftheir pretax certified compensation, although there may be a lower limit for certain highly compensated employees inorder to maintain the qualified status of the 401(k) Plan.Eligible employees who complete one year of service are eligible for matching company contributions, which are generally a 100% match up to 6% of an employee’s certifiedcompensation. The matching contributions generally vestover four years.
At the end of 2004, we committed to make a special contribution in shares of Wells Fargo common stock to the401(k) Plan for eligible team members, equaling 1% of ateam member’s pay, up to a maximum of $750, resulting inan additional $44 million in employee benefits expense.
Expenses for defined contribution retirement plans were$356 million, $257 million and $248 million in 2004, 2003and 2002, respectively.
We provide health care and life insurance benefits for certain retired employees and reserve the right to terminateor amend any of the benefits at any time.
The information set forth in the following tables is basedon current actuarial reports using the measurement date of November 30 for our pension and postretirement benefit plans.
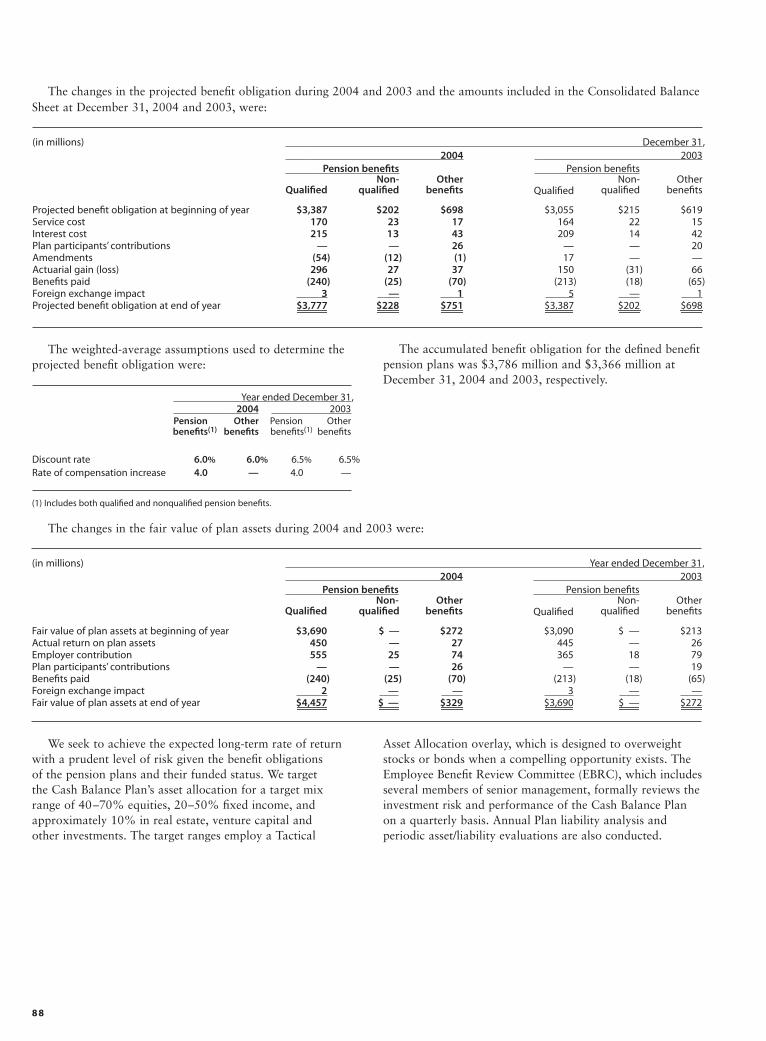
88
(in millions) Year ended December 31, 2004 2003
Pension benefits Pension benefitsNon- Other Non- Other
Qualified qualified benefits Qualified qualified benefits
Fair value of plan assets at beginning of year $3,690 $ — $272 $3,090 $ — $213Actual return on plan assets 450 — 27 445 — 26Employer contribution 555 25 74 365 18 79Plan participants’ contributions — — 26 — — 19Benefits paid (240) (25) (70) (213) (18) (65)Foreign exchange impact 2 — — 3 — —Fair value of plan assets at end of year $4,457 $ — $329 $3,690 $ — $272
We seek to achieve the expected long-term rate of returnwith a prudent level of risk given the benefit obligations of the pension plans and their funded status. We target the Cash Balance Plan’s asset allocation for a target mixrange of 40–70% equities, 20–50% fixed income, andapproximately 10% in real estate, venture capital and other investments. The target ranges employ a Tactical
Asset Allocation overlay, which is designed to overweightstocks or bonds when a compelling opportunity exists. TheEmployee Benefit Review Committee (EBRC), which includesseveral members of senior management, formally reviews theinvestment risk and performance of the Cash Balance Plan on a quarterly basis. Annual Plan liability analysis and periodic asset/liability evaluations are also conducted.
The weighted-average assumptions used to determine theprojected benefit obligation were:
Year ended December 31, 2004 2003
Pension Other Pension Otherbenefits(1) benefits benefits(1) benefits
Discount rate 6.0% 6.0% 6.5% 6.5%Rate of compensation increase 4.0 — 4.0 —
The accumulated benefit obligation for the defined benefitpension plans was $3,786 million and $3,366 million atDecember 31, 2004 and 2003, respectively.
(in millions) December 31, 2004 2003 Pension benefits Pension benefits
Non- Other Non- OtherQualified qualified benefits Qualified qualified benefits
Projected benefit obligation at beginning of year $3,387 $202 $698 $3,055 $215 $619Service cost 170 23 17 164 22 15Interest cost 215 13 43 209 14 42Plan participants’ contributions — — 26 — — 20Amendments (54) (12) (1) 17 — —Actuarial gain (loss) 296 27 37 150 (31) 66Benefits paid (240) (25) (70) (213) (18) (65)Foreign exchange impact 3 — 1 5 — 1Projected benefit obligation at end of year $3,777 $228 $751 $3,387 $202 $698
The changes in the projected benefit obligation during 2004 and 2003 and the amounts included in the Consolidated BalanceSheet at December 31, 2004 and 2003, were:
(1) Includes both qualified and nonqualified pension benefits.
The changes in the fair value of plan assets during 2004 and 2003 were:
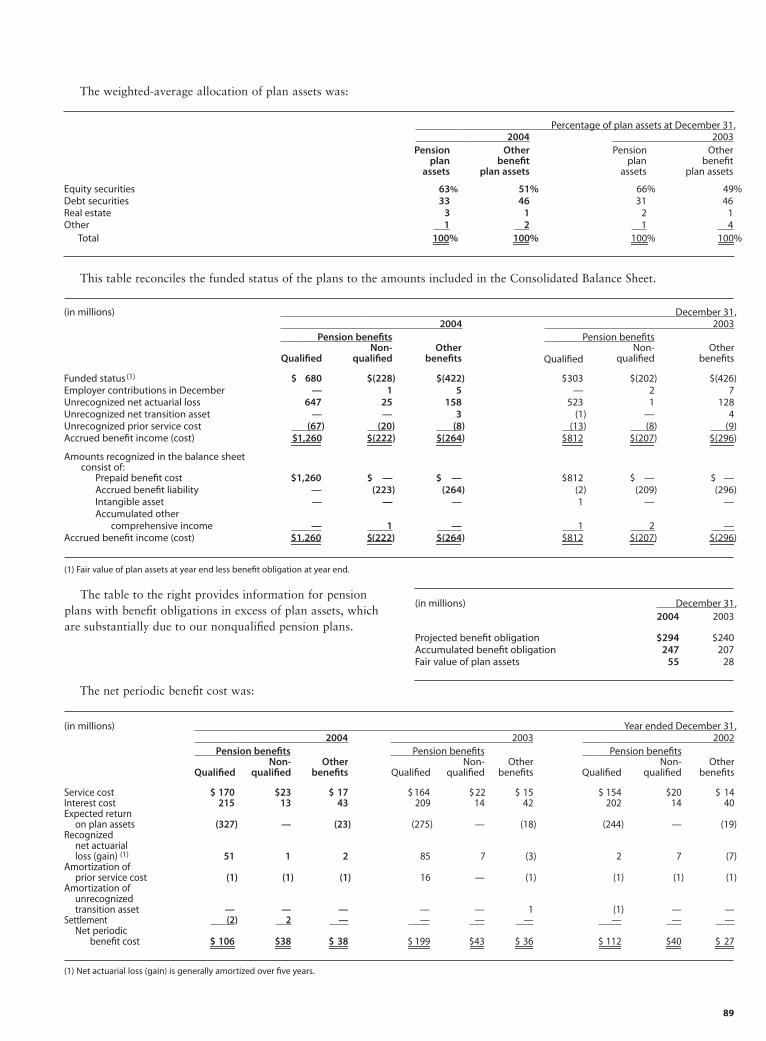
89
The table to the right provides information for pensionplans with benefit obligations in excess of plan assets, whichare substantially due to our nonqualified pension plans.
(in millions) December 31,2004 2003
Projected benefit obligation $294 $240Accumulated benefit obligation 247 207Fair value of plan assets 55 28
Percentage of plan assets at December 31, 2004 2003
Pension Other Pension Otherplan benefit plan benefit
assets plan assets assets plan assets
Equity securities 63% 51% 66% 49%Debt securities 33 46 31 46Real estate 3 1 2 1Other 1 2 1 4
Total 100% 100% 100% 100%
This table reconciles the funded status of the plans to the amounts included in the Consolidated Balance Sheet.
(in millions) December 31, 2004 2003
Pension benefits Pension benefitsNon- Other Non- Other
Qualified qualified benefits Qualified qualified benefits
Funded status (1) $ 680 $(228) $(422) $303 $(202) $(426)Employer contributions in December — 1 5 — 2 7Unrecognized net actuarial loss 647 25 158 523 1 128Unrecognized net transition asset — — 3 (1) — 4Unrecognized prior service cost (67) (20) (8) (13) (8) (9)Accrued benefit income (cost) $1,260 $(222) $(264) $812 $(207) $(296)
Amounts recognized in the balance sheetconsist of:
Prepaid benefit cost $1,260 $ — $ — $812 $ — $ —Accrued benefit liability — (223) (264) (2) (209) (296)Intangible asset — — — 1 — —Accumulated other
comprehensive income — 1 — 1 2 —Accrued benefit income (cost) $1,260 $(222) $(264) $812 $(207) $(296)
(1) Fair value of plan assets at year end less benefit obligation at year end.
The weighted-average allocation of plan assets was:
The net periodic benefit cost was:
(in millions) Year ended December 31, 2004 2003 2002
Pension benefits Pension benefits Pension benefitsNon- Other Non- Other Non- Other
Qualified qualified benefits Qualified qualified benefits Qualified qualified benefits
Service cost $ 170 $23 $ 17 $ 164 $22 $ 15 $ 154 $20 $ 14Interest cost 215 13 43 209 14 42 202 14 40Expected return
on plan assets (327) — (23) (275) — (18) (244) — (19)Recognized
net actuarial loss (gain) (1) 51 1 2 85 7 (3) 2 7 (7)
Amortization ofprior service cost (1) (1) (1) 16 — (1) (1) (1) (1)
Amortization ofunrecognized transition asset — — — — — 1 (1) — —
Settlement (2) 2 — — — — — — —Net periodic
benefit cost $ 106 $38 $ 38 $ 199 $43 $ 36 $ 112 $40 $ 27
(1) Net actuarial loss (gain) is generally amortized over five years.
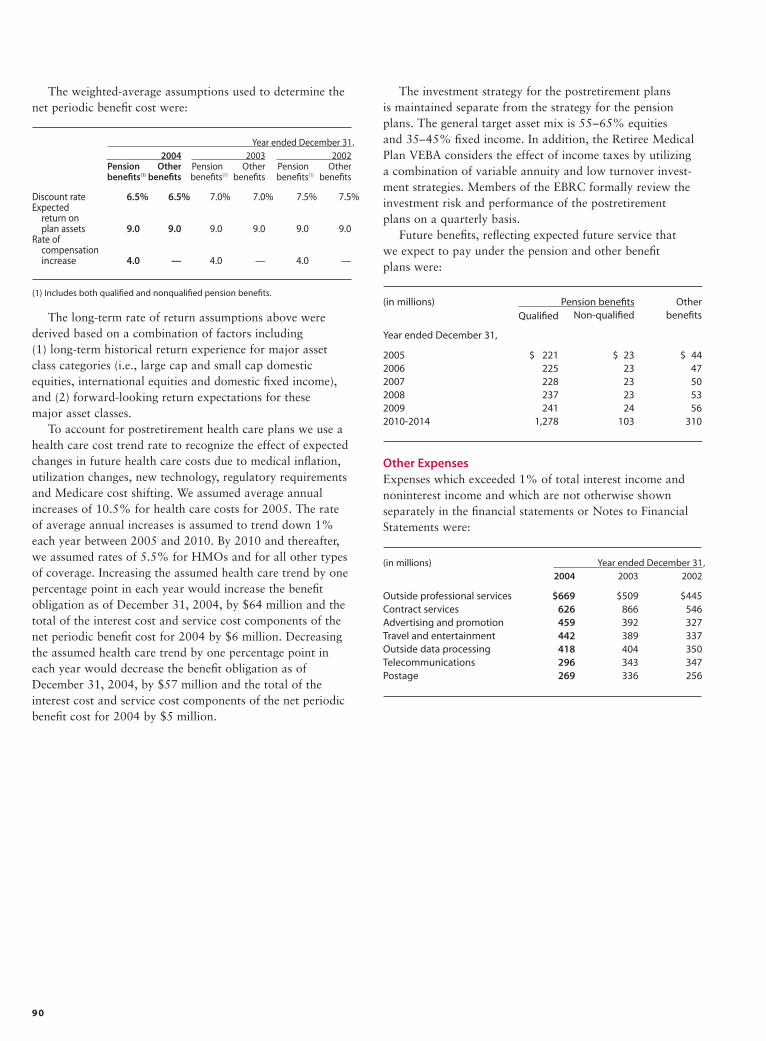
90
(in millions) Year ended December 31,2004 2003 2002
Outside professional services $669 $509 $445Contract services 626 866 546Advertising and promotion 459 392 327Travel and entertainment 442 389 337Outside data processing 418 404 350Telecommunications 296 343 347Postage 269 336 256
Year ended December 31, 2004 2003 2002
Pension Other Pension Other Pension Otherbenefits(1) benefits benefits(1) benefits benefits(1) benefits
Discount rate 6.5% 6.5% 7.0% 7.0% 7.5% 7.5%Expected
return on plan assets 9.0 9.0 9.0 9.0 9.0 9.0
Rate ofcompensationincrease 4.0 — 4.0 — 4.0 —
(1) Includes both qualified and nonqualified pension benefits.
The weighted-average assumptions used to determine thenet periodic benefit cost were:
The long-term rate of return assumptions above werederived based on a combination of factors including (1) long-term historical return experience for major assetclass categories (i.e., large cap and small cap domestic equities, international equities and domestic fixed income),and (2) forward-looking return expectations for these major asset classes.
To account for postretirement health care plans we use ahealth care cost trend rate to recognize the effect of expectedchanges in future health care costs due to medical inflation,utilization changes, new technology, regulatory requirementsand Medicare cost shifting. We assumed average annualincreases of 10.5% for health care costs for 2005. The rateof average annual increases is assumed to trend down 1%each year between 2005 and 2010. By 2010 and thereafter,we assumed rates of 5.5% for HMOs and for all other typesof coverage. Increasing the assumed health care trend by onepercentage point in each year would increase the benefitobligation as of December 31, 2004, by $64 million and thetotal of the interest cost and service cost components of thenet periodic benefit cost for 2004 by $6 million. Decreasingthe assumed health care trend by one percentage point ineach year would decrease the benefit obligation as ofDecember 31, 2004, by $57 million and the total of theinterest cost and service cost components of the net periodicbenefit cost for 2004 by $5 million.
Other ExpensesExpenses which exceeded 1% of total interest income andnoninterest income and which are not otherwise shown separately in the financial statements or Notes to FinancialStatements were:
(in millions) Pension benefits OtherQualified Non-qualified benefits
Year ended December 31,
2005 $ 221 $ 23 $ 442006 225 23 472007 228 23 502008 237 23 532009 241 24 562010-2014 1,278 103 310
The investment strategy for the postretirement plans is maintained separate from the strategy for the pension plans. The general target asset mix is 55–65% equities and 35–45% fixed income. In addition, the Retiree MedicalPlan VEBA considers the effect of income taxes by utilizing a combination of variable annuity and low turnover invest-ment strategies. Members of the EBRC formally review theinvestment risk and performance of the postretirement plans on a quarterly basis.
Future benefits, reflecting expected future service that we expect to pay under the pension and other benefit plans were:
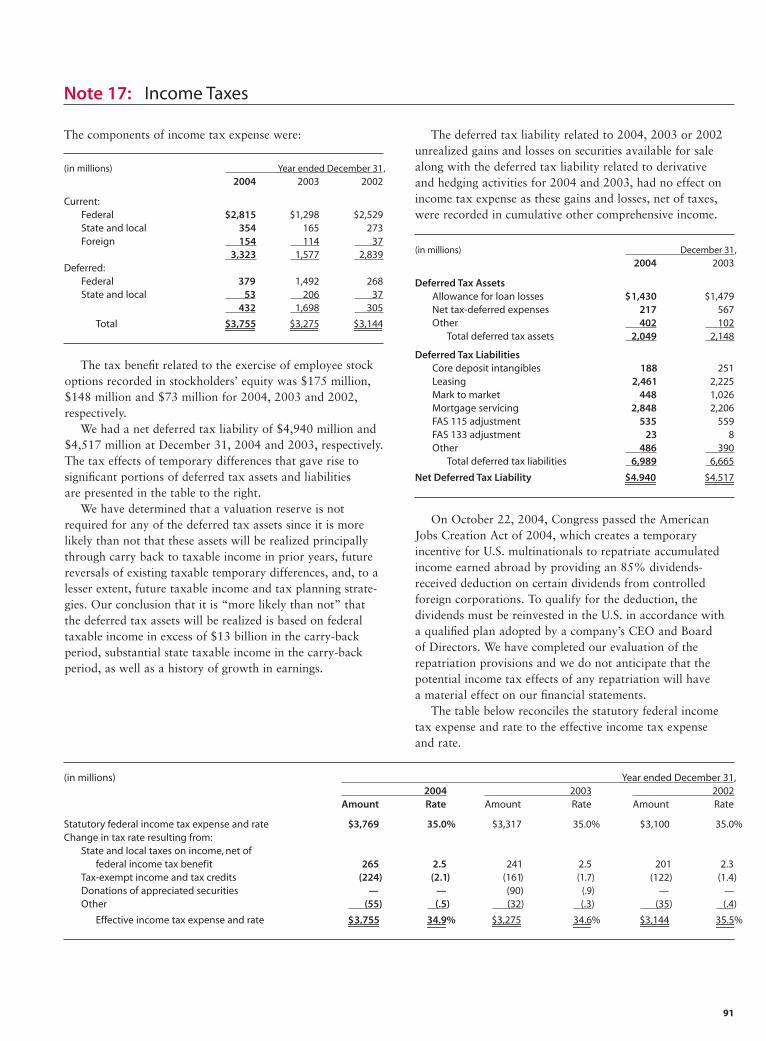
91
(in millions) December 31,2004 2003
Deferred Tax AssetsAllowance for loan losses $1,430 $1,479Net tax-deferred expenses 217 567Other 402 102
Total deferred tax assets 2,049 2,148
Deferred Tax LiabilitiesCore deposit intangibles 188 251Leasing 2,461 2,225Mark to market 448 1,026Mortgage servicing 2,848 2,206FAS 115 adjustment 535 559FAS 133 adjustment 23 8Other 486 390
Total deferred tax liabilities 6,989 6,665
Net Deferred Tax Liability $4,940 $4,517
The components of income tax expense were:
The tax benefit related to the exercise of employee stockoptions recorded in stockholders’ equity was $175 million,$148 million and $73 million for 2004, 2003 and 2002,respectively.
We had a net deferred tax liability of $4,940 million and$4,517 million at December 31, 2004 and 2003, respectively.The tax effects of temporary differences that gave rise to significant portions of deferred tax assets and liabilities are presented in the table to the right.
We have determined that a valuation reserve is notrequired for any of the deferred tax assets since it is morelikely than not that these assets will be realized principallythrough carry back to taxable income in prior years, futurereversals of existing taxable temporary differences, and, to alesser extent, future taxable income and tax planning strate-gies. Our conclusion that it is “more likely than not” thatthe deferred tax assets will be realized is based on federaltaxable income in excess of $13 billion in the carry-backperiod, substantial state taxable income in the carry-backperiod, as well as a history of growth in earnings.
Note 17: Income Taxes
(in millions) Year ended December 31,2004 2003 2002
Current:Federal $2,815 $1,298 $2,529State and local 354 165 273Foreign 154 114 37
3,323 1,577 2,839Deferred:
Federal 379 1,492 268State and local 53 206 37
432 1,698 305
Total $3,755 $3,275 $3,144
On October 22, 2004, Congress passed the AmericanJobs Creation Act of 2004, which creates a temporary incentive for U.S. multinationals to repatriate accumulatedincome earned abroad by providing an 85% dividends-received deduction on certain dividends from controlled foreign corporations. To qualify for the deduction, the dividends must be reinvested in the U.S. in accordance with a qualified plan adopted by a company’s CEO and Board of Directors. We have completed our evaluation of the repatriation provisions and we do not anticipate that thepotential income tax effects of any repatriation will have a material effect on our financial statements.
The table below reconciles the statutory federal incometax expense and rate to the effective income tax expense and rate.
The deferred tax liability related to 2004, 2003 or 2002unrealized gains and losses on securities available for salealong with the deferred tax liability related to derivative and hedging activities for 2004 and 2003, had no effect onincome tax expense as these gains and losses, net of taxes,were recorded in cumulative other comprehensive income.
(in millions) Year ended December 31, 2004 2003 2002
Amount Rate Amount Rate Amount Rate
Statutory federal income tax expense and rate $3,769 35.0% $3,317 35.0% $3,100 35.0%Change in tax rate resulting from:
State and local taxes on income, net offederal income tax benefit 265 2.5 241 2.5 201 2.3
Tax-exempt income and tax credits (224) (2.1) (161) (1.7) (122) (1.4)Donations of appreciated securities — — (90) (.9) — —Other (55) (.5) (32) (.3) (35) (.4)
Effective income tax expense and rate $3,755 34.9% $3,275 34.6% $3,144 35.5%
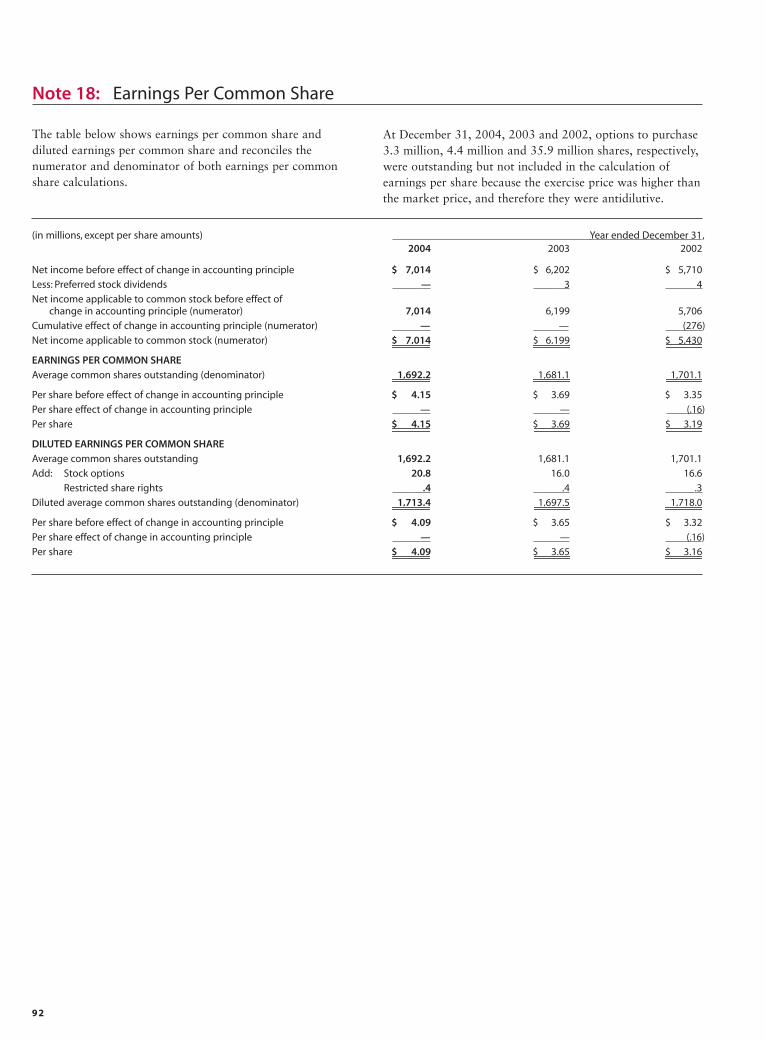
92
(in millions, except per share amounts) Year ended December 31,2004 2003 2002
Net income before effect of change in accounting principle $ 7,014 $ 6,202 $ 5,710
Less: Preferred stock dividends — 3 4
Net income applicable to common stock before effect ofchange in accounting principle (numerator) 7,014 6,199 5,706
Cumulative effect of change in accounting principle (numerator) — — (276)
Net income applicable to common stock (numerator) $ 7,014 $ 6,199 $ 5,430
EARNINGS PER COMMON SHARE
Average common shares outstanding (denominator) 1,692.2 1,681.1 1,701.1
Per share before effect of change in accounting principle $ 4.15 $ 3.69 $ 3.35
Per share effect of change in accounting principle — — (.16)
Per share $ 4.15 $ 3.69 $ 3.19
DILUTED EARNINGS PER COMMON SHARE
Average common shares outstanding 1,692.2 1,681.1 1,701.1
Add: Stock options 20.8 16.0 16.6
Restricted share rights .4 .4 .3
Diluted average common shares outstanding (denominator) 1,713.4 1,697.5 1,718.0
Per share before effect of change in accounting principle $ 4.09 $ 3.65 $ 3.32
Per share effect of change in accounting principle — — (.16)
Per share $ 4.09 $ 3.65 $ 3.16
The table below shows earnings per common share anddiluted earnings per common share and reconciles thenumerator and denominator of both earnings per commonshare calculations.
Note 18: Earnings Per Common Share
At December 31, 2004, 2003 and 2002, options to purchase3.3 million, 4.4 million and 35.9 million shares, respectively,were outstanding but not included in the calculation of earnings per share because the exercise price was higher thanthe market price, and therefore they were antidilutive.
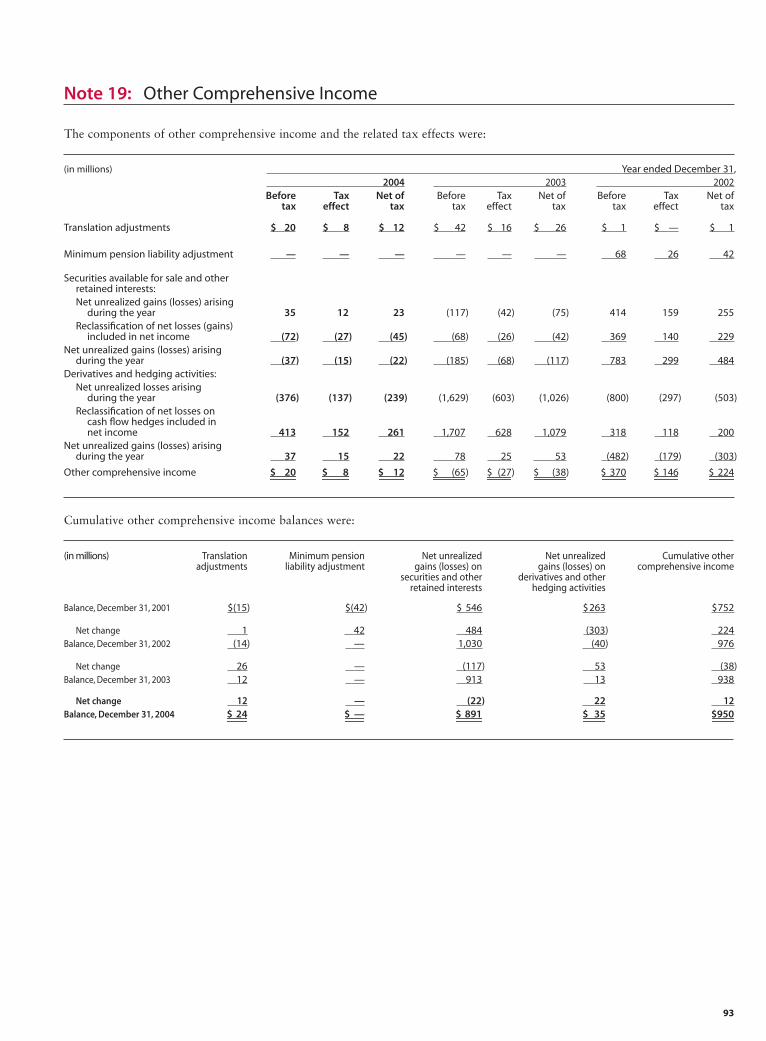
93
(in millions) Translation Minimum pension Net unrealized Net unrealized Cumulative other adjustments liability adjustment gains (losses) on gains (losses) on comprehensive income
securities and other derivatives and otherretained interests hedging activities
Balance, December 31, 2001 $(15) $(42) $ 546 $263 $752
Net change 1 42 484 (303) 224Balance, December 31, 2002 (14) — 1,030 (40) 976
Net change 26 — (117) 53 (38)Balance, December 31, 2003 12 — 913 13 938
Net change 12 — (22) 22 12Balance, December 31, 2004 $ 24 $ — $ 891 $ 35 $950
(in millions) Year ended December 31, 2004 2003 2002
Before Tax Net of Before Tax Net of Before Tax Net oftax effect tax tax effect tax tax effect tax
Translation adjustments $ 20 $ 8 $ 12 $ 42 $ 16 $ 26 $ 1 $ — $ 1
Minimum pension liability adjustment — — — — — — 68 26 42
Securities available for sale and other retained interests:Net unrealized gains (losses) arising
during the year 35 12 23 (117) (42) (75) 414 159 255Reclassification of net losses (gains)
included in net income (72) (27) (45) (68) (26) (42) 369 140 229Net unrealized gains (losses) arising
during the year (37) (15) (22) (185) (68) (117) 783 299 484Derivatives and hedging activities:
Net unrealized losses arisingduring the year (376) (137) (239) (1,629) (603) (1,026) (800) (297) (503)
Reclassification of net losses on cash flow hedges included innet income 413 152 261 1,707 628 1,079 318 118 200
Net unrealized gains (losses) arisingduring the year 37 15 22 78 25 53 (482) (179) (303)
Other comprehensive income $ 20 $ 8 $ 12 $ (65) $ (27) $ (38) $ 370 $ 146 $ 224
Note 19: Other Comprehensive Income
The components of other comprehensive income and the related tax effects were:
Cumulative other comprehensive income balances were:
94
Note 20: Operating Segments
We have three lines of business for management reporting:Community Banking, Wholesale Banking and Wells FargoFinancial. The results for these lines of business are based onour management accounting process, which assigns balancesheet and income statement items to each responsible operat-ing segment. This process is dynamic and, unlike financialaccounting, there is no comprehensive, authoritative guid-ance for management accounting equivalent to generallyaccepted accounting principles. The management accountingprocess measures the performance of the operating segmentsbased on our management structure and is not necessarilycomparable with similar information for other financial services companies. We define our operating segments byproduct type and customer segments. If the managementstructure and/or the allocation process changes, allocations,transfers and assignments may change. In that case, resultsfor prior periods would be restated for comparability.
The Community Banking Group offers a complete line of diversified financial products and services to consumersand small businesses with annual sales generally up to $10 million in which the owner generally is the financialdecision maker. Community Banking also offers investmentmanagement and other services to retail customers and highnet worth individuals, insurance, securities brokeragethrough affiliates and venture capital financing. These prod-ucts and services include the Wells Fargo Funds®, a family of mutual funds, as well as personal trust, employee benefittrust and agency assets. Loan products include lines of credit, equity lines and loans, equipment and transportation(auto, recreational vehicle and marine) loans, educationloans, origination and purchase of residential mortgage loans and servicing of mortgage loans and credit cards.Other credit products and financial services available tosmall businesses and their owners include receivables andinventory financing, equipment leases, real estate financing,Small Business Administration financing, venture capitalfinancing, cash management, payroll services, retirementplans, medical savings accounts and credit and debit cardprocessing. Consumer and business deposit products includechecking accounts, savings deposits, market rate accounts,Individual Retirement Accounts (IRAs), time deposits anddebit cards.
Community Banking serves customers through a widerange of channels, which include traditional banking stores,in-store banking centers, business centers and ATMs. Also,Phone BankSM centers and the National Business BankingCenter provide 24-hour telephone service. Online bankingservices include single sign-on to online banking, bill pay and brokerage, as well as online banking for small business.
The Wholesale Banking Group serves businesses acrossthe United States with annual sales generally in excess of$10 million. Wholesale Banking provides a complete line of commercial, corporate and real estate banking productsand services. These include traditional commercial loans and lines of credit, letters of credit, asset-based lending,equipment leasing, mezzanine financing, high-yield debt,international trade facilities, foreign exchange services, treasury management, investment management, institutionalfixed income and equity sales, online/electronic productssuch as the CEO® (Commercial Electronic Office®) portal,insurance brokerage services and investment banking services. Wholesale Banking manages and administers institutional investments and mutual funds, including the Wells Fargo Funds. Upon the second quarter 2005 merger of the Wells Fargo Funds and certain funds acquired in theStrong Financial transaction, we will rename our mutualfund family the Wells Fargo Advantage FundsSM. WholesaleBanking includes the majority ownership interest in theWells Fargo HSBC Trade Bank, which provides trade financ-ing, letters of credit and collection services and is sometimessupported by the Export-Import Bank of the United States (a public agency of the United States offering export financesupport for American-made products). Wholesale Bankingalso supports the commercial real estate market with products and services such as construction loans for com-mercial and residential development, land acquisition anddevelopment loans, secured and unsecured lines of credit,interim financing arrangements for completed structures,rehabilitation loans, affordable housing loans and letters of credit, permanent loans for securitization, commercial real estate loan servicing and real estate and mortgage brokerage services.
Wells Fargo Financial includes consumer finance and autofinance operations. Consumer finance operations make directconsumer and real estate loans to individuals and purchasesales finance contracts from retail merchants from officesthroughout the United States and in Canada, Latin America,the Caribbean, Guam and Saipan. Automobile finance oper-ations specialize in purchasing sales finance contracts directlyfrom automobile dealers and making loans secured by automobiles in the United States, Canada and Puerto Rico.Wells Fargo Financial also provides credit cards and leaseand other commercial financing.
The “Other” Column consists of Corporate level invest-ment activities and balances and unallocated goodwill heldat the enterprise level. This column also includes separatelyidentified transactions recorded at the enterprise level for management reporting.
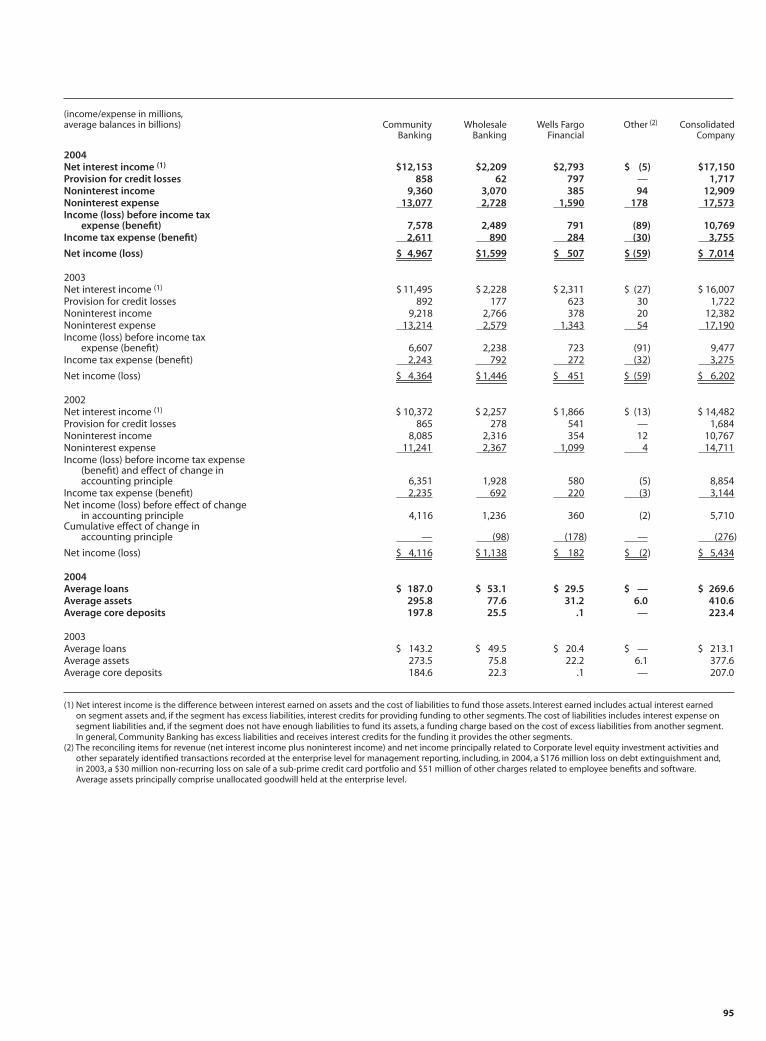
95
(income/expense in millions,average balances in billions) Community Wholesale Wells Fargo Other (2) Consolidated
Banking Banking Financial Company
2004Net interest income (1) $12,153 $2,209 $2,793 $ (5) $17,150Provision for credit losses 858 62 797 — 1,717Noninterest income 9,360 3,070 385 94 12,909Noninterest expense 13,077 2,728 1,590 178 17,573Income (loss) before income tax
expense (benefit) 7,578 2,489 791 (89) 10,769Income tax expense (benefit) 2,611 890 284 (30) 3,755
Net income (loss) $ 4,967 $1,599 $ 507 $ (59) $ 7,014
2003Net interest income (1) $ 11,495 $ 2,228 $ 2,311 $ (27) $ 16,007Provision for credit losses 892 177 623 30 1,722Noninterest income 9,218 2,766 378 20 12,382Noninterest expense 13,214 2,579 1,343 54 17,190Income (loss) before income tax
expense (benefit) 6,607 2,238 723 (91) 9,477Income tax expense (benefit) 2,243 792 272 (32) 3,275
Net income (loss) $ 4,364 $ 1,446 $ 451 $ (59) $ 6,202
2002Net interest income (1) $ 10,372 $ 2,257 $ 1,866 $ (13) $ 14,482Provision for credit losses 865 278 541 — 1,684Noninterest income 8,085 2,316 354 12 10,767Noninterest expense 11,241 2,367 1,099 4 14,711Income (loss) before income tax expense
(benefit) and effect of change in accounting principle 6,351 1,928 580 (5) 8,854
Income tax expense (benefit) 2,235 692 220 (3) 3,144Net income (loss) before effect of change
in accounting principle 4,116 1,236 360 (2) 5,710Cumulative effect of change in
accounting principle — (98) (178) — (276)
Net income (loss) $ 4,116 $ 1,138 $ 182 $ (2) $ 5,434
2004Average loans $ 187.0 $ 53.1 $ 29.5 $ — $ 269.6Average assets 295.8 77.6 31.2 6.0 410.6Average core deposits 197.8 25.5 .1 — 223.4
2003Average loans $ 143.2 $ 49.5 $ 20.4 $ — $ 213.1Average assets 273.5 75.8 22.2 6.1 377.6Average core deposits 184.6 22.3 .1 — 207.0
(1) Net interest income is the difference between interest earned on assets and the cost of liabilities to fund those assets. Interest earned includes actual interest earned on segment assets and, if the segment has excess liabilities, interest credits for providing funding to other segments. The cost of liabilities includes interest expense on segment liabilities and, if the segment does not have enough liabilities to fund its assets, a funding charge based on the cost of excess liabilities from another segment.In general, Community Banking has excess liabilities and receives interest credits for the funding it provides the other segments.
(2) The reconciling items for revenue (net interest income plus noninterest income) and net income principally related to Corporate level equity investment activities and other separately identified transactions recorded at the enterprise level for management reporting, including, in 2004, a $176 million loss on debt extinguishment and,in 2003, a $30 million non-recurring loss on sale of a sub-prime credit card portfolio and $51 million of other charges related to employee benefits and software.Average assets principally comprise unallocated goodwill held at the enterprise level.
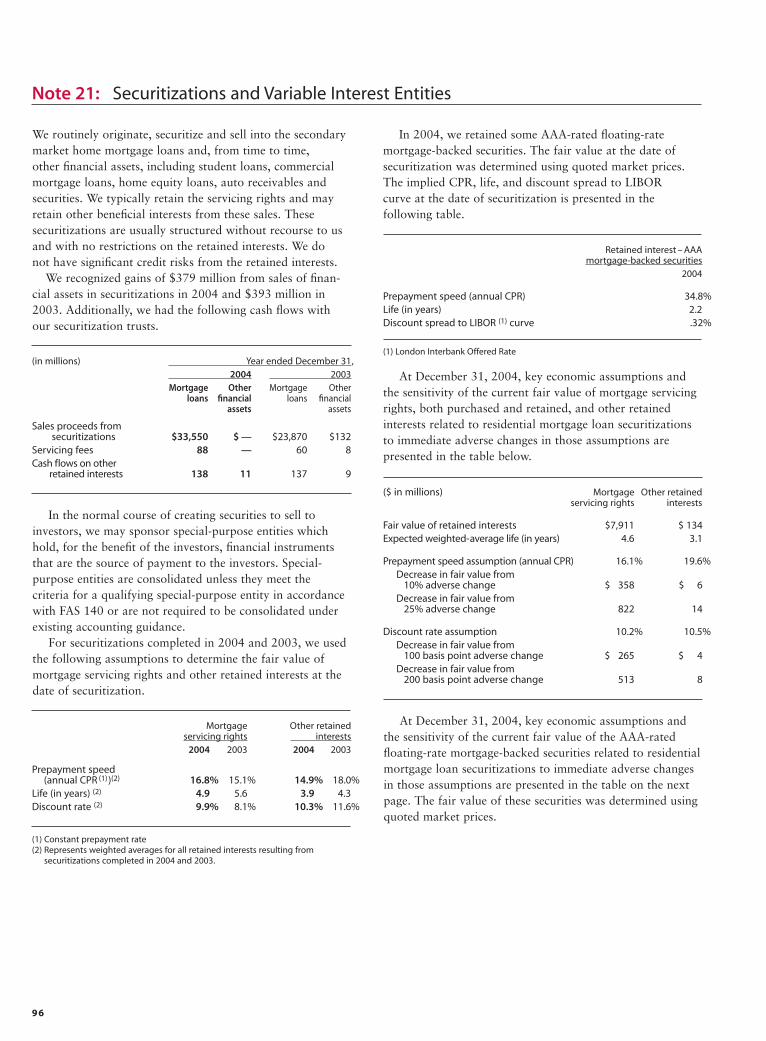
96
In the normal course of creating securities to sell toinvestors, we may sponsor special-purpose entities whichhold, for the benefit of the investors, financial instrumentsthat are the source of payment to the investors. Special-purpose entities are consolidated unless they meet the criteria for a qualifying special-purpose entity in accordancewith FAS 140 or are not required to be consolidated underexisting accounting guidance.
For securitizations completed in 2004 and 2003, we usedthe following assumptions to determine the fair value ofmortgage servicing rights and other retained interests at thedate of securitization.
At December 31, 2004, key economic assumptions andthe sensitivity of the current fair value of the AAA-ratedfloating-rate mortgage-backed securities related to residentialmortgage loan securitizations to immediate adverse changesin those assumptions are presented in the table on the nextpage. The fair value of these securities was determined usingquoted market prices.
(in millions) Year ended December 31, 2004 2003
Mortgage Other Mortgage Otherloans financial loans financial
assets assets
Sales proceeds from securitizations $33,550 $ — $23,870 $132
Servicing fees 88 — 60 8Cash flows on other
retained interests 138 11 137 9
Note 21: Securitizations and Variable Interest Entities
We routinely originate, securitize and sell into the secondarymarket home mortgage loans and, from time to time, other financial assets, including student loans, commercialmortgage loans, home equity loans, auto receivables andsecurities. We typically retain the servicing rights and mayretain other beneficial interests from these sales. These securitizations are usually structured without recourse to usand with no restrictions on the retained interests. We do not have significant credit risks from the retained interests.
We recognized gains of $379 million from sales of finan-cial assets in securitizations in 2004 and $393 million in2003. Additionally, we had the following cash flows with our securitization trusts.
At December 31, 2004, key economic assumptions andthe sensitivity of the current fair value of mortgage servicingrights, both purchased and retained, and other retainedinterests related to residential mortgage loan securitizationsto immediate adverse changes in those assumptions are presented in the table below.
($ in millions) Mortgage Other retainedservicing rights interests
Fair value of retained interests $7,911 $ 134Expected weighted-average life (in years) 4.6 3.1
Prepayment speed assumption (annual CPR) 16.1% 19.6%Decrease in fair value from
10% adverse change $ 358 $ 6 Decrease in fair value from
25% adverse change 822 14
Discount rate assumption 10.2% 10.5%Decrease in fair value from
100 basis point adverse change $ 265 $ 4 Decrease in fair value from
200 basis point adverse change 513 8
Mortgage Other retainedservicing rights interests
2004 2003 2004 2003
Prepayment speed (annual CPR (1))(2) 16.8% 15.1% 14.9% 18.0%
Life (in years) (2) 4.9 5.6 3.9 4.3Discount rate (2) 9.9% 8.1% 10.3% 11.6%
(1) Constant prepayment rate(2) Represents weighted averages for all retained interests resulting from
securitizations completed in 2004 and 2003.
Retained interest – AAAmortgage-backed securities
2004
Prepayment speed (annual CPR) 34.8%Life (in years) 2.2Discount spread to LIBOR (1) curve .32%
In 2004, we retained some AAA-rated floating-rate mortgage-backed securities. The fair value at the date ofsecuritization was determined using quoted market prices.The implied CPR, life, and discount spread to LIBOR curve at the date of securitization is presented in the following table.
(1) London Interbank Offered Rate
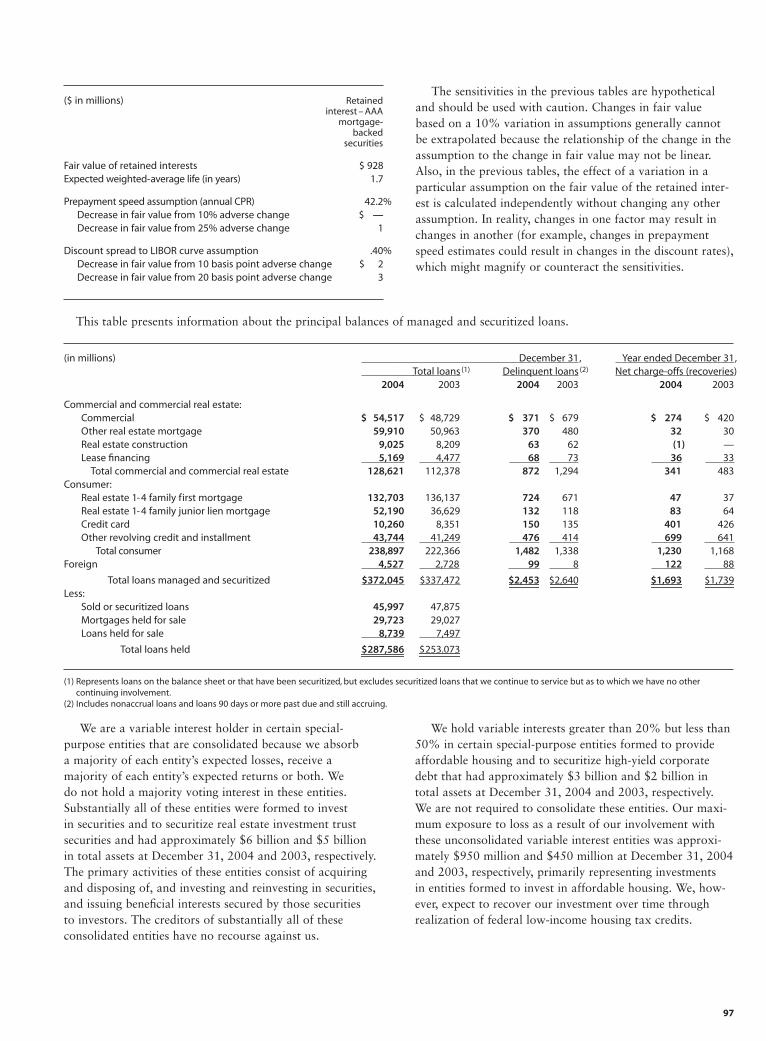
97
(in millions) December 31, Year ended December 31,Total loans (1) Delinquent loans (2) Net charge-offs (recoveries)
2004 2003 2004 2003 2004 2003
Commercial and commercial real estate:Commercial $ 54,517 $ 48,729 $ 371 $ 679 $ 274 $ 420Other real estate mortgage 59,910 50,963 370 480 32 30Real estate construction 9,025 8,209 63 62 (1) —Lease financing 5,169 4,477 68 73 36 33
Total commercial and commercial real estate 128,621 112,378 872 1,294 341 483Consumer:
Real estate 1-4 family first mortgage 132,703 136,137 724 671 47 37Real estate 1-4 family junior lien mortgage 52,190 36,629 132 118 83 64Credit card 10,260 8,351 150 135 401 426Other revolving credit and installment 43,744 41,249 476 414 699 641
Total consumer 238,897 222,366 1,482 1,338 1,230 1,168Foreign 4,527 2,728 99 8 122 88
Total loans managed and securitized $372,045 $337,472 $2,453 $2,640 $1,693 $1,739Less:
Sold or securitized loans 45,997 47,875Mortgages held for sale 29,723 29,027Loans held for sale 8,739 7,497
Total loans held $287,586 $253,073
(1) Represents loans on the balance sheet or that have been securitized, but excludes securitized loans that we continue to service but as to which we have no other continuing involvement.
(2) Includes nonaccrual loans and loans 90 days or more past due and still accruing.
This table presents information about the principal balances of managed and securitized loans.
We are a variable interest holder in certain special-purpose entities that are consolidated because we absorb a majority of each entity’s expected losses, receive a majority of each entity’s expected returns or both. We do not hold a majority voting interest in these entities.Substantially all of these entities were formed to invest in securities and to securitize real estate investment trustsecurities and had approximately $6 billion and $5 billion in total assets at December 31, 2004 and 2003, respectively.The primary activities of these entities consist of acquiringand disposing of, and investing and reinvesting in securities,and issuing beneficial interests secured by those securities to investors. The creditors of substantially all of these consolidated entities have no recourse against us.
We hold variable interests greater than 20% but less than50% in certain special-purpose entities formed to provideaffordable housing and to securitize high-yield corporatedebt that had approximately $3 billion and $2 billion intotal assets at December 31, 2004 and 2003, respectively. We are not required to consolidate these entities. Our maxi-mum exposure to loss as a result of our involvement withthese unconsolidated variable interest entities was approxi-mately $950 million and $450 million at December 31, 2004and 2003, respectively, primarily representing investments in entities formed to invest in affordable housing. We, how-ever, expect to recover our investment over time throughrealization of federal low-income housing tax credits.
($ in millions) Retained interest – AAA
mortgage- backed
securities
Fair value of retained interests $ 928Expected weighted-average life (in years) 1.7
Prepayment speed assumption (annual CPR) 42.2%Decrease in fair value from 10% adverse change $ —Decrease in fair value from 25% adverse change 1
Discount spread to LIBOR curve assumption .40%Decrease in fair value from 10 basis point adverse change $ 2Decrease in fair value from 20 basis point adverse change 3
The sensitivities in the previous tables are hypothetical and should be used with caution. Changes in fair valuebased on a 10% variation in assumptions generally cannotbe extrapolated because the relationship of the change in theassumption to the change in fair value may not be linear.Also, in the previous tables, the effect of a variation in a particular assumption on the fair value of the retained inter-est is calculated independently without changing any otherassumption. In reality, changes in one factor may result inchanges in another (for example, changes in prepaymentspeed estimates could result in changes in the discount rates),which might magnify or counteract the sensitivities.
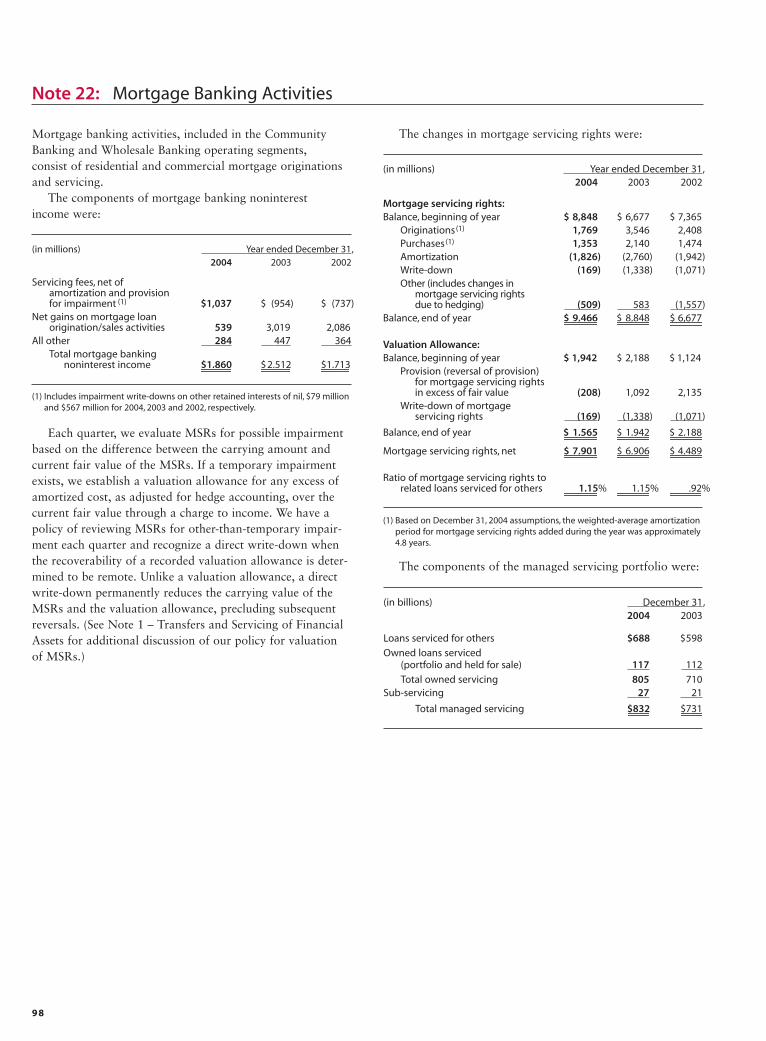
98
Mortgage banking activities, included in the CommunityBanking and Wholesale Banking operating segments, consist of residential and commercial mortgage originationsand servicing.
The components of mortgage banking noninterest income were:
Note 22: Mortgage Banking Activities
(in millions) Year ended December 31,2004 2003 2002
Servicing fees, net of amortization and provision for impairment (1) $1,037 $ (954) $ (737)
Net gains on mortgage loan origination/sales activities 539 3,019 2,086
All other 284 447 364Total mortgage banking
noninterest income $1,860 $2,512 $1,713
Each quarter, we evaluate MSRs for possible impairmentbased on the difference between the carrying amount andcurrent fair value of the MSRs. If a temporary impairmentexists, we establish a valuation allowance for any excess ofamortized cost, as adjusted for hedge accounting, over thecurrent fair value through a charge to income. We have apolicy of reviewing MSRs for other-than-temporary impair-ment each quarter and recognize a direct write-down whenthe recoverability of a recorded valuation allowance is deter-mined to be remote. Unlike a valuation allowance, a directwrite-down permanently reduces the carrying value of theMSRs and the valuation allowance, precluding subsequentreversals. (See Note 1 – Transfers and Servicing of FinancialAssets for additional discussion of our policy for valuationof MSRs.)
(in millions) Year ended December 31,2004 2003 2002
Mortgage servicing rights:Balance, beginning of year $ 8,848 $ 6,677 $ 7,365
Originations(1) 1,769 3,546 2,408Purchases(1) 1,353 2,140 1,474Amortization (1,826) (2,760) (1,942)Write-down (169) (1,338) (1,071)Other (includes changes in
mortgage servicing rights due to hedging) (509) 583 (1,557)
Balance, end of year $ 9,466 $ 8,848 $ 6,677
Valuation Allowance:Balance, beginning of year $ 1,942 $ 2,188 $ 1,124
Provision (reversal of provision) for mortgage servicing rights in excess of fair value (208) 1,092 2,135
Write-down of mortgageservicing rights (169) (1,338) (1,071)
Balance, end of year $ 1,565 $ 1,942 $ 2,188
Mortgage servicing rights, net $ 7,901 $ 6,906 $ 4,489
Ratio of mortgage servicing rights torelated loans serviced for others 1.15% 1.15% .92%
(in billions) December 31,2004 2003
Loans serviced for others $688 $598
Owned loans serviced (portfolio and held for sale) 117 112
Total owned servicing 805 710Sub-servicing 27 21
Total managed servicing $832 $731
(1) Based on December 31, 2004 assumptions, the weighted-average amortizationperiod for mortgage servicing rights added during the year was approximately 4.8 years.
(1) Includes impairment write-downs on other retained interests of nil, $79 million and $567 million for 2004, 2003 and 2002, respectively.
The changes in mortgage servicing rights were:
The components of the managed servicing portfolio were:
99
Note 23: Condensed Consolidating Financial Statements
Condensed Consolidating Statement of Income
(in millions) Parent WFFI Other Eliminations Consolidatedconsolidating Company
subsidiaries
Year ended December 31, 2004
Dividends from subsidiaries:Bank $3,652 $ — $ — $(3,652) $ —Nonbank 307 — — (307) —
Interest income from loans — 3,548 13,233 — 16,781Interest income from subsidiaries 1,117 — — (1,117) —Other interest income 91 84 4,011 — 4,186
Total interest income 5,167 3,632 17,244 (5,076) 20,967
Short-term borrowings 106 47 458 (258) 353Long-term debt 872 1,089 387 (711) 1,637Other interest expense — — 1,827 — 1,827
Total interest expense 978 1,136 2,672 (969) 3,817
NET INTEREST INCOME 4,189 2,496 14,572 (4,107) 17,150Provision for credit losses — 833 884 — 1,717Net interest income after provision for credit losses 4,189 1,663 13,688 (4,107) 15,433
NONINTEREST INCOMEFee income – nonaffiliates — 223 7,319 — 7,542Other 139 256 5,053 (81) 5,367
Total noninterest income 139 479 12,372 (81) 12,909
NONINTEREST EXPENSESalaries and benefits 64 944 7,916 — 8,924Other 313 746 7,820 (230) 8,649
Total noninterest expense 377 1,690 15,736 (230) 17,573
INCOME BEFORE INCOME TAX EXPENSE(BENEFIT) AND EQUITY IN UNDISTRIBUTEDINCOME OF SUBSIDIARIES 3,951 452 10,324 (3,958) 10,769
Income tax expense (benefit) (97) 159 3,693 — 3,755Equity in undistributed income of subsidiaries 2,966 — — (2,966) —
NET INCOME $7,014 $ 293 $ 6,631 $(6,924) $ 7,014
Following are the condensed consolidating financial statements of the Parent and Wells Fargo Financial, Inc. and its wholly-owned subsidiaries (WFFI). The Wells FargoFinancial business segment for management reporting
(see Note 20) consists of WFFI and other affiliated consumer finance entities managed by WFFI that are included within other consolidating subsidiaries in the following tables.
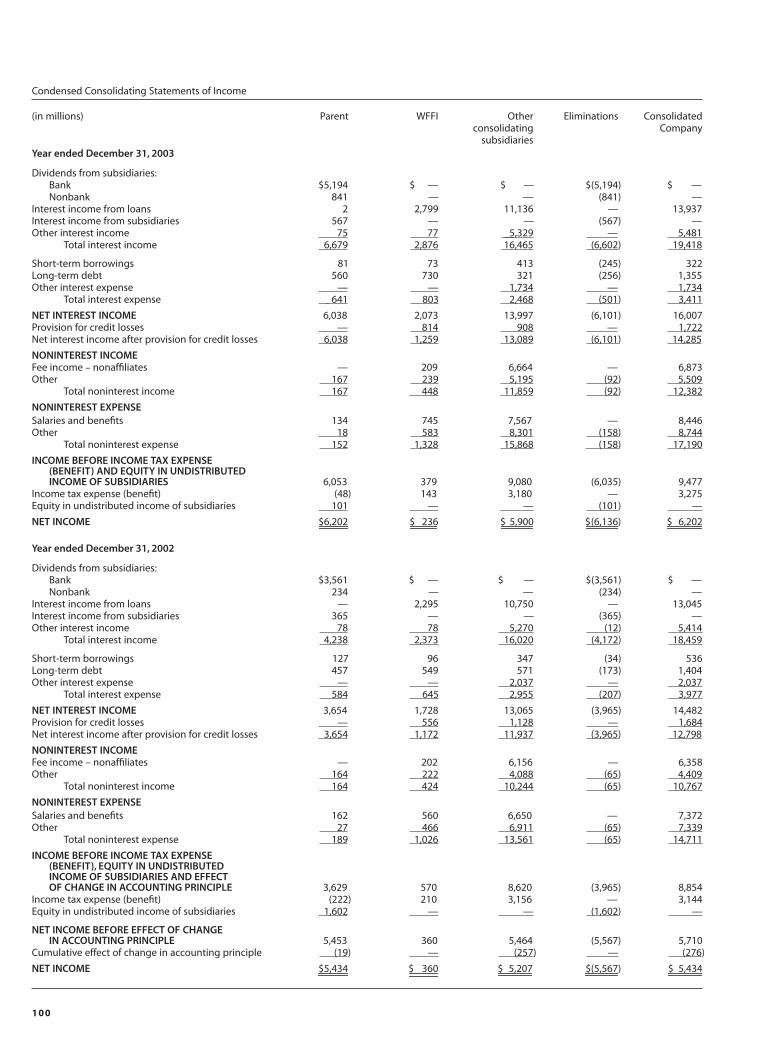
100
Condensed Consolidating Statements of Income
(in millions) Parent WFFI Other Eliminations Consolidatedconsolidating Company
subsidiariesYear ended December 31, 2003
Dividends from subsidiaries:Bank $5,194 $ — $ — $(5,194) $ — Nonbank 841 — — (841) —
Interest income from loans 2 2,799 11,136 — 13,937Interest income from subsidiaries 567 — — (567) —Other interest income 75 77 5,329 — 5,481
Total interest income 6,679 2,876 16,465 (6,602) 19,418
Short-term borrowings 81 73 413 (245) 322Long-term debt 560 730 321 (256) 1,355Other interest expense — — 1,734 — 1,734
Total interest expense 641 803 2,468 (501) 3,411
NET INTEREST INCOME 6,038 2,073 13,997 (6,101) 16,007Provision for credit losses — 814 908 — 1,722Net interest income after provision for credit losses 6,038 1,259 13,089 (6,101) 14,285
NONINTEREST INCOMEFee income – nonaffiliates — 209 6,664 — 6,873Other 167 239 5,195 (92) 5,509
Total noninterest income 167 448 11,859 (92) 12,382
NONINTEREST EXPENSESalaries and benefits 134 745 7,567 — 8,446Other 18 583 8,301 (158) 8,744
Total noninterest expense 152 1,328 15,868 (158) 17,190
INCOME BEFORE INCOME TAX EXPENSE(BENEFIT) AND EQUITY IN UNDISTRIBUTEDINCOME OF SUBSIDIARIES 6,053 379 9,080 (6,035) 9,477
Income tax expense (benefit) (48) 143 3,180 — 3,275Equity in undistributed income of subsidiaries 101 — — (101) —
NET INCOME $6,202 $ 236 $ 5,900 $(6,136) $ 6,202
Year ended December 31, 2002
Dividends from subsidiaries:Bank $3,561 $ — $ — $(3,561) $ —Nonbank 234 — — (234) —
Interest income from loans — 2,295 10,750 — 13,045Interest income from subsidiaries 365 — — (365) —Other interest income 78 78 5,270 (12) 5,414
Total interest income 4,238 2,373 16,020 (4,172) 18,459
Short-term borrowings 127 96 347 (34) 536Long-term debt 457 549 571 (173) 1,404Other interest expense — — 2,037 — 2,037
Total interest expense 584 645 2,955 (207) 3,977
NET INTEREST INCOME 3,654 1,728 13,065 (3,965) 14,482Provision for credit losses — 556 1,128 — 1,684Net interest income after provision for credit losses 3,654 1,172 11,937 (3,965) 12,798
NONINTEREST INCOMEFee income – nonaffiliates — 202 6,156 — 6,358Other 164 222 4,088 (65) 4,409
Total noninterest income 164 424 10,244 (65) 10,767
NONINTEREST EXPENSESalaries and benefits 162 560 6,650 — 7,372Other 27 466 6,911 (65) 7,339
Total noninterest expense 189 1,026 13,561 (65) 14,711
INCOME BEFORE INCOME TAX EXPENSE(BENEFIT), EQUITY IN UNDISTRIBUTEDINCOME OF SUBSIDIARIES AND EFFECT OF CHANGE IN ACCOUNTING PRINCIPLE 3,629 570 8,620 (3,965) 8,854
Income tax expense (benefit) (222) 210 3,156 — 3,144Equity in undistributed income of subsidiaries 1,602 — — (1,602) —
NET INCOME BEFORE EFFECT OF CHANGEIN ACCOUNTING PRINCIPLE 5,453 360 5,464 (5,567) 5,710
Cumulative effect of change in accounting principle (19) — (257) — (276)
NET INCOME $5,434 $ 360 $ 5,207 $(5,567) $ 5,434
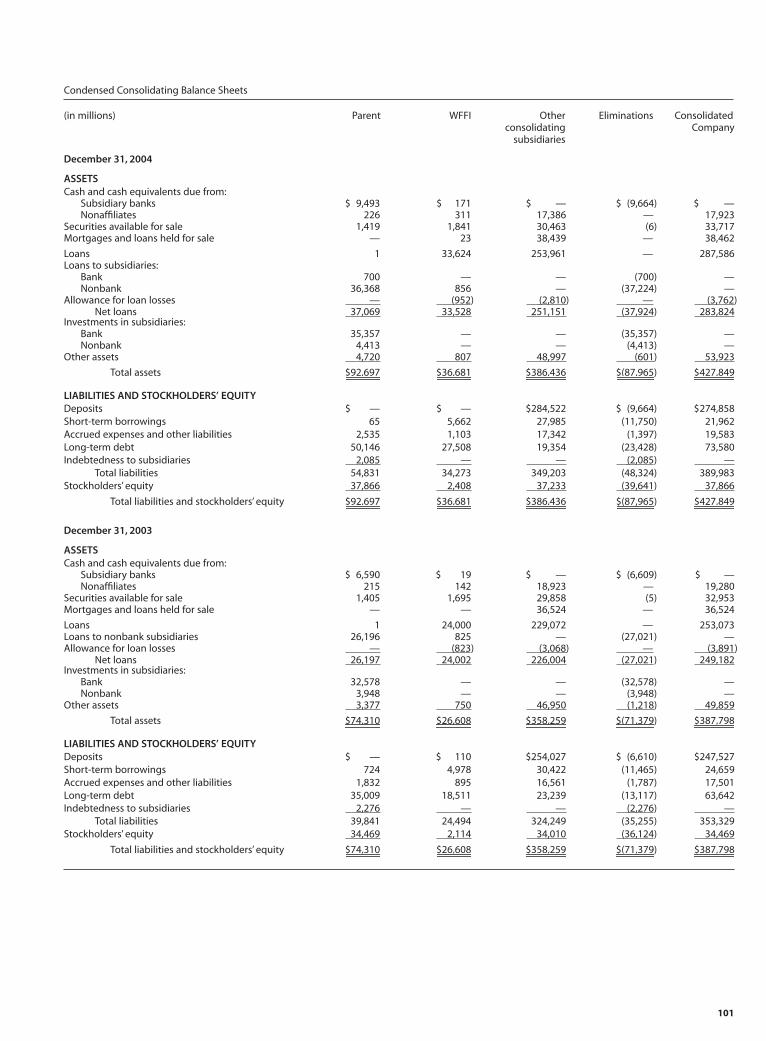
101
Condensed Consolidating Balance Sheets
(in millions) Parent WFFI Other Eliminations Consolidatedconsolidating Company
subsidiaries
December 31, 2004
ASSETSCash and cash equivalents due from:
Subsidiary banks $ 9,493 $ 171 $ — $ (9,664) $ —Nonaffiliates 226 311 17,386 — 17,923
Securities available for sale 1,419 1,841 30,463 (6) 33,717Mortgages and loans held for sale — 23 38,439 — 38,462
Loans 1 33,624 253,961 — 287,586Loans to subsidiaries:
Bank 700 — — (700) —Nonbank 36,368 856 — (37,224) —
Allowance for loan losses — (952) (2,810) — (3,762)Net loans 37,069 33,528 251,151 (37,924) 283,824
Investments in subsidiaries:Bank 35,357 — — (35,357) —Nonbank 4,413 — — (4,413) —
Other assets 4,720 807 48,997 (601) 53,923
Total assets $92,697 $36,681 $386,436 $(87,965) $427,849
LIABILITIES AND STOCKHOLDERS’ EQUITYDeposits $ — $ — $284,522 $ (9,664) $274,858Short-term borrowings 65 5,662 27,985 (11,750) 21,962Accrued expenses and other liabilities 2,535 1,103 17,342 (1,397) 19,583Long-term debt 50,146 27,508 19,354 (23,428) 73,580Indebtedness to subsidiaries 2,085 — — (2,085) —
Total liabilities 54,831 34,273 349,203 (48,324) 389,983Stockholders’ equity 37,866 2,408 37,233 (39,641) 37,866
Total liabilities and stockholders’ equity $92,697 $36,681 $386,436 $(87,965) $427,849
December 31, 2003
ASSETSCash and cash equivalents due from:
Subsidiary banks $ 6,590 $ 19 $ — $ (6,609) $ —Nonaffiliates 215 142 18,923 — 19,280
Securities available for sale 1,405 1,695 29,858 (5) 32,953Mortgages and loans held for sale — — 36,524 — 36,524
Loans 1 24,000 229,072 — 253,073Loans to nonbank subsidiaries 26,196 825 — (27,021) —Allowance for loan losses — (823) (3,068) — (3,891)
Net loans 26,197 24,002 226,004 (27,021) 249,182Investments in subsidiaries:
Bank 32,578 — — (32,578) —Nonbank 3,948 — — (3,948) —
Other assets 3,377 750 46,950 (1,218) 49,859
Total assets $74,310 $26,608 $358,259 $(71,379) $387,798
LIABILITIES AND STOCKHOLDERS’ EQUITYDeposits $ — $ 110 $254,027 $ (6,610) $247,527Short-term borrowings 724 4,978 30,422 (11,465) 24,659Accrued expenses and other liabilities 1,832 895 16,561 (1,787) 17,501Long-term debt 35,009 18,511 23,239 (13,117) 63,642Indebtedness to subsidiaries 2,276 — — (2,276) —
Total liabilities 39,841 24,494 324,249 (35,255) 353,329Stockholders’ equity 34,469 2,114 34,010 (36,124) 34,469
Total liabilities and stockholders’ equity $74,310 $26,608 $358,259 $(71,379) $387,798
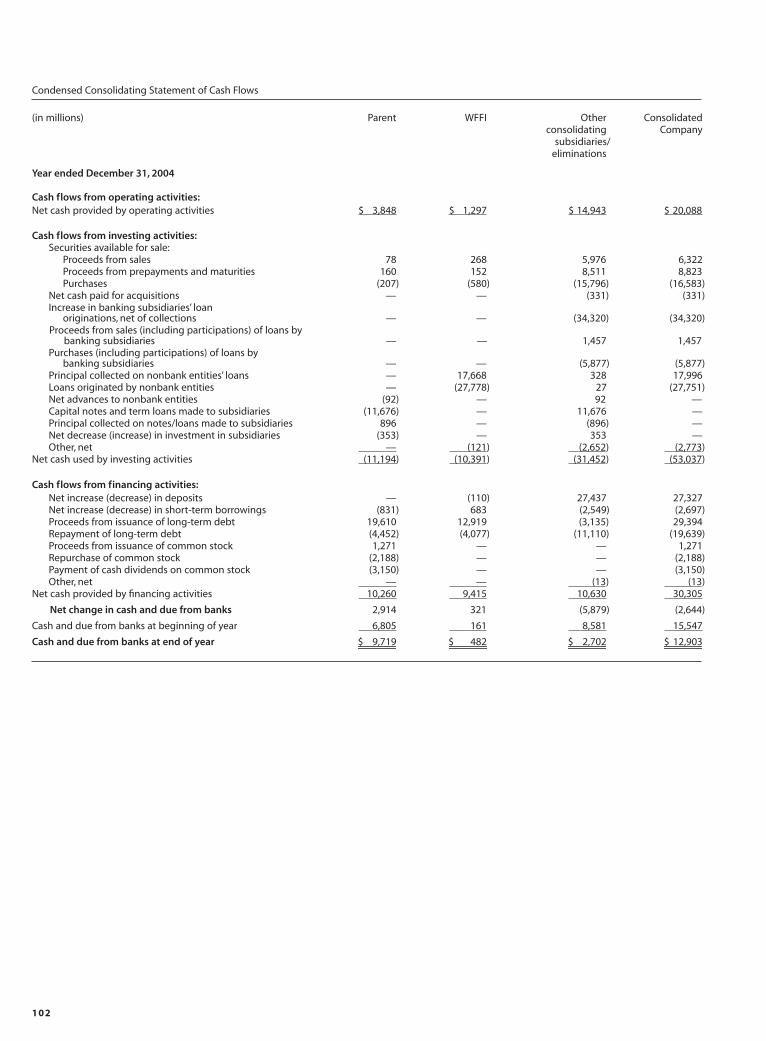
102
Condensed Consolidating Statement of Cash Flows
(in millions) Parent WFFI Other Consolidatedconsolidating Company
subsidiaries/eliminations
Year ended December 31, 2004
Cash flows from operating activities:Net cash provided by operating activities $ 3,848 $ 1,297 $ 14,943 $ 20,088
Cash flows from investing activities:Securities available for sale:
Proceeds from sales 78 268 5,976 6,322Proceeds from prepayments and maturities 160 152 8,511 8,823Purchases (207) (580) (15,796) (16,583)
Net cash paid for acquisitions — — (331) (331)Increase in banking subsidiaries’ loan
originations, net of collections — — (34,320) (34,320)Proceeds from sales (including participations) of loans by
banking subsidiaries — — 1,457 1,457Purchases (including participations) of loans by
banking subsidiaries — — (5,877) (5,877)Principal collected on nonbank entities’ loans — 17,668 328 17,996Loans originated by nonbank entities — (27,778) 27 (27,751)Net advances to nonbank entities (92) — 92 —Capital notes and term loans made to subsidiaries (11,676) — 11,676 —Principal collected on notes/loans made to subsidiaries 896 — (896) —Net decrease (increase) in investment in subsidiaries (353) — 353 —Other, net — (121) (2,652) (2,773)
Net cash used by investing activities (11,194) (10,391) (31,452) (53,037)
Cash flows from financing activities:Net increase (decrease) in deposits — (110) 27,437 27,327Net increase (decrease) in short-term borrowings (831) 683 (2,549) (2,697)Proceeds from issuance of long-term debt 19,610 12,919 (3,135) 29,394Repayment of long-term debt (4,452) (4,077) (11,110) (19,639)Proceeds from issuance of common stock 1,271 — — 1,271Repurchase of common stock (2,188) — — (2,188)Payment of cash dividends on common stock (3,150) — — (3,150)Other, net — — (13) (13)
Net cash provided by financing activities 10,260 9,415 10,630 30,305
Net change in cash and due from banks 2,914 321 (5,879) (2,644)
Cash and due from banks at beginning of year 6,805 161 8,581 15,547
Cash and due from banks at end of year $ 9,719 $ 482 $ 2,702 $ 12,903
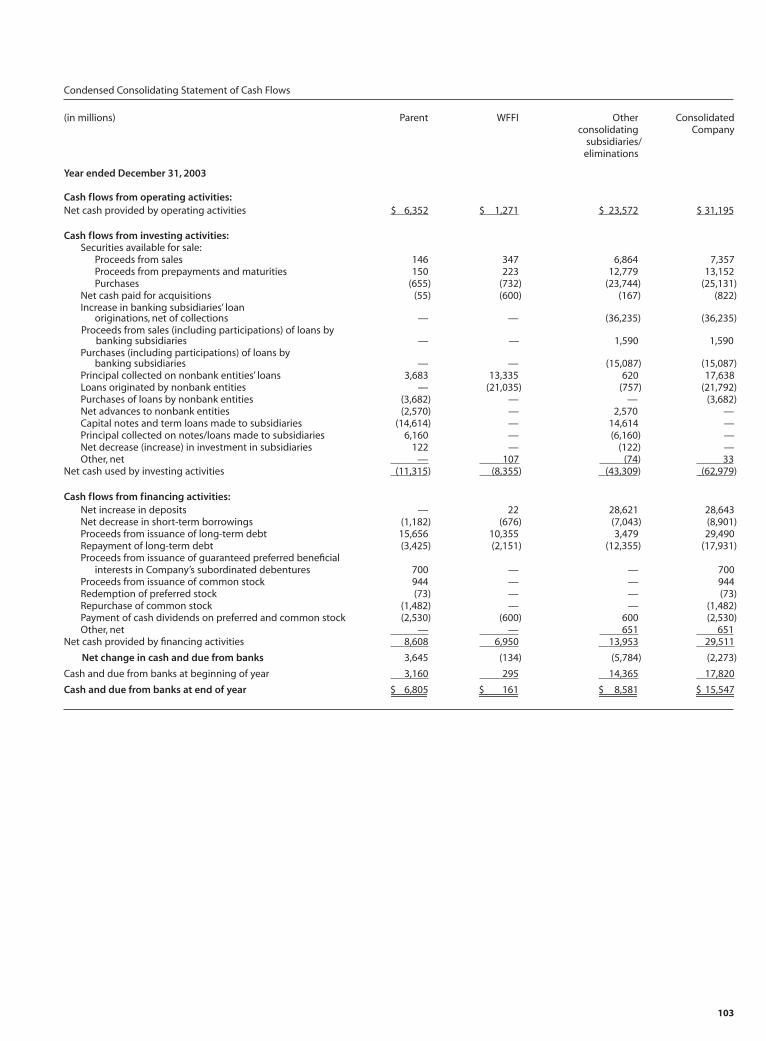
103
Condensed Consolidating Statement of Cash Flows
(in millions) Parent WFFI Other Consolidatedconsolidating Company
subsidiaries/eliminations
Year ended December 31, 2003
Cash flows from operating activities:Net cash provided by operating activities $ 6,352 $ 1,271 $ 23,572 $ 31,195
Cash flows from investing activities:Securities available for sale:
Proceeds from sales 146 347 6,864 7,357Proceeds from prepayments and maturities 150 223 12,779 13,152Purchases (655) (732) (23,744) (25,131)
Net cash paid for acquisitions (55) (600) (167) (822)Increase in banking subsidiaries’ loan
originations, net of collections — — (36,235) (36,235)Proceeds from sales (including participations) of loans by
banking subsidiaries — — 1,590 1,590Purchases (including participations) of loans by
banking subsidiaries — — (15,087) (15,087)Principal collected on nonbank entities’ loans 3,683 13,335 620 17,638Loans originated by nonbank entities — (21,035) (757) (21,792)Purchases of loans by nonbank entities (3,682) — — (3,682)Net advances to nonbank entities (2,570) — 2,570 —Capital notes and term loans made to subsidiaries (14,614) — 14,614 —Principal collected on notes/loans made to subsidiaries 6,160 — (6,160) —Net decrease (increase) in investment in subsidiaries 122 — (122) —Other, net — 107 (74) 33
Net cash used by investing activities (11,315) (8,355) (43,309) (62,979)
Cash flows from financing activities:Net increase in deposits — 22 28,621 28,643Net decrease in short-term borrowings (1,182) (676) (7,043) (8,901)Proceeds from issuance of long-term debt 15,656 10,355 3,479 29,490Repayment of long-term debt (3,425) (2,151) (12,355) (17,931)Proceeds from issuance of guaranteed preferred beneficial
interests in Company’s subordinated debentures 700 — — 700Proceeds from issuance of common stock 944 — — 944Redemption of preferred stock (73) — — (73)Repurchase of common stock (1,482) — — (1,482)Payment of cash dividends on preferred and common stock (2,530) (600) 600 (2,530)Other, net — — 651 651
Net cash provided by financing activities 8,608 6,950 13,953 29,511
Net change in cash and due from banks 3,645 (134) (5,784) (2,273)
Cash and due from banks at beginning of year 3,160 295 14,365 17,820
Cash and due from banks at end of year $ 6,805 $ 161 $ 8,581 $ 15,547
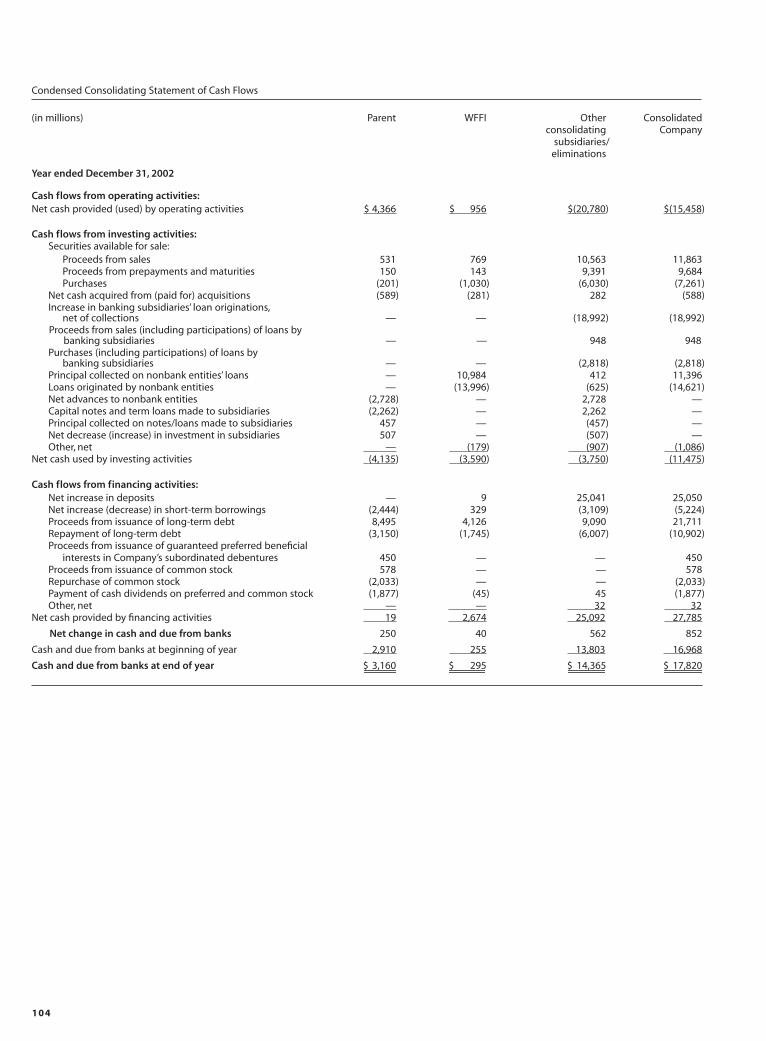
104
Condensed Consolidating Statement of Cash Flows
(in millions) Parent WFFI Other Consolidatedconsolidating Company
subsidiaries/eliminations
Year ended December 31, 2002
Cash flows from operating activities:Net cash provided (used) by operating activities $ 4,366 $ 956 $(20,780) $(15,458)
Cash flows from investing activities:Securities available for sale:
Proceeds from sales 531 769 10,563 11,863Proceeds from prepayments and maturities 150 143 9,391 9,684Purchases (201) (1,030) (6,030) (7,261)
Net cash acquired from (paid for) acquisitions (589) (281) 282 (588)Increase in banking subsidiaries’ loan originations,
net of collections — — (18,992) (18,992)Proceeds from sales (including participations) of loans by
banking subsidiaries — — 948 948Purchases (including participations) of loans by
banking subsidiaries — — (2,818) (2,818)Principal collected on nonbank entities’ loans — 10,984 412 11,396Loans originated by nonbank entities — (13,996) (625) (14,621)Net advances to nonbank entities (2,728) — 2,728 —Capital notes and term loans made to subsidiaries (2,262) — 2,262 —Principal collected on notes/loans made to subsidiaries 457 — (457) —Net decrease (increase) in investment in subsidiaries 507 — (507) —Other, net — (179) (907) (1,086)
Net cash used by investing activities (4,135) (3,590) (3,750) (11,475)
Cash flows from financing activities:Net increase in deposits — 9 25,041 25,050Net increase (decrease) in short-term borrowings (2,444) 329 (3,109) (5,224)Proceeds from issuance of long-term debt 8,495 4,126 9,090 21,711Repayment of long-term debt (3,150) (1,745) (6,007) (10,902)Proceeds from issuance of guaranteed preferred beneficial
interests in Company’s subordinated debentures 450 — — 450Proceeds from issuance of common stock 578 — — 578Repurchase of common stock (2,033) — — (2,033)Payment of cash dividends on preferred and common stock (1,877) (45) 45 (1,877)Other, net — — 32 32
Net cash provided by financing activities 19 2,674 25,092 27,785
Net change in cash and due from banks 250 40 562 852
Cash and due from banks at beginning of year 2,910 255 13,803 16,968
Cash and due from banks at end of year $ 3,160 $ 295 $ 14,365 $ 17,820
105
Note 25: Guarantees
Note 24: Legal Actions
In the normal course of business, we are subject to pendingand threatened legal actions, some for which the relief ordamages sought are substantial. After reviewing pending andthreatened actions with counsel, and any specific reservesestablished for such matters, management believes that theoutcome of such actions will not have a material adverse
effect on the results of operations or stockholders’ equity. We are not able to predict whether the outcome of suchactions may or may not have a material adverse effect onresults of operations in a particular future period as the timing and amount of any resolution of such actions and itsrelationship to the future results of operations are not known.
We provide significant guarantees to third parties includingstandby letters of credit, various indemnification agreements,guarantees accounted for as derivatives, contingent consider-ation related to business combinations and contingent performance guarantees.
We issue standby letters of credit, which include perfor-mance and financial guarantees, for customers in connectionwith contracts between the customers and third parties.Standby letters of credit assure that the third parties willreceive specified funds if customers fail to meet their contractual obligations. We are obliged to make payment if a customer defaults. Standby letters of credit were $9.4 billion and $8.3 billion at December 31, 2004 and2003, respectively, including financial guarantees of $5.3 billion and $4.7 billion, respectively, that we had issued or purchased participations in. Standby letters of credit are net of participations sold to other institutions andwere $1.7 billion and $1.5 billion at December 31, 2004 and 2003, respectively. We consider the credit risk in standby letters of credit in determining the allowance forcredit losses. Deferred fees for these standby letters of credit were not significant to our financial statements. We also had commitments for commercial and similar letters of credit of $731 million and $810 million atDecember 31, 2004 and 2003, respectively.
We enter into indemnification agreements in the ordinarycourse of business under which we agree to indemnify thirdparties against any damages, losses and expenses incurred inconnection with legal and other proceedings arising fromrelationships or transactions with us. These relationships ortransactions include those arising from service as a directoror officer of the Company, underwriting agreements relatingto our securities, securities lending, acquisition agreements,and various other business transactions or arrangements.Because the extent of our obligations under these agreementsdepends entirely upon the occurrence of future events, our potential future liability under these agreements is not determinable.
We write options, floors and caps. Options are exercisablebased on favorable market conditions. Periodic settlementsoccur on floors and caps based on market conditions. AtDecember 31, 2004 and 2003, the fair value of the writtenoptions liability in our balance sheet was $292 million and$382 million, respectively, and the written floors and caps
liability was $227 million and $213 million, respectively. Our ultimate obligation under written options, floors and caps is based on future market conditions and is only quantifiable at settlement. We offset substantially all options written to customers with purchased options.
We also enter into credit default swaps under which we buy loss protection from or sell loss protection to acounterparty in the event of default of a reference obliga-tion. The carrying amount of the contracts sold was a $2 million liability at December 31, 2004, and a $5 millionliability at December 31, 2003. The maximum amount wewould be required to pay under the swaps in which we sold protection, assuming all reference obligations default at a total loss, without recoveries, was $2.6 billion and $2.7 billion at December 31, 2004 and 2003, respectively. We purchased $2.8 billion notional of credit default swapsto mitigate the exposure of the written credit default swapsat December 31, 2004 and 2003. Almost all of these pur-chased credit default swaps had terms (i.e., use the same reference obligation and maturity) that would offset ourexposure from the written default swap contracts in whichwe are providing protection to a counterparty.
In connection with certain brokerage, asset managementand insurance agency acquisitions we have made, the termsof the acquisition agreements provide for deferred paymentsor additional consideration based on certain performancetargets. At December 31, 2004 and 2003, the amount ofcontingent consideration we expected to pay was not significant to our financial statements.
We have entered into various contingent performance guarantees through credit risk participation arrangementswith terms ranging from 1 to 30 years. We will be requiredto make payments under these guarantees if a customerdefaults on its obligation to perform under certain creditagreements with third parties. Because the extent of ourobligations under these guarantees depends entirely onfuture events, our potential future liability under these agreements is not fully determinable. However, our exposure under most of the agreements can be quantifiedand for those agreements our exposure was contractuallylimited to an aggregate liability of approximately $370 million at December 31, 2004 and $330 million at December 31, 2003.
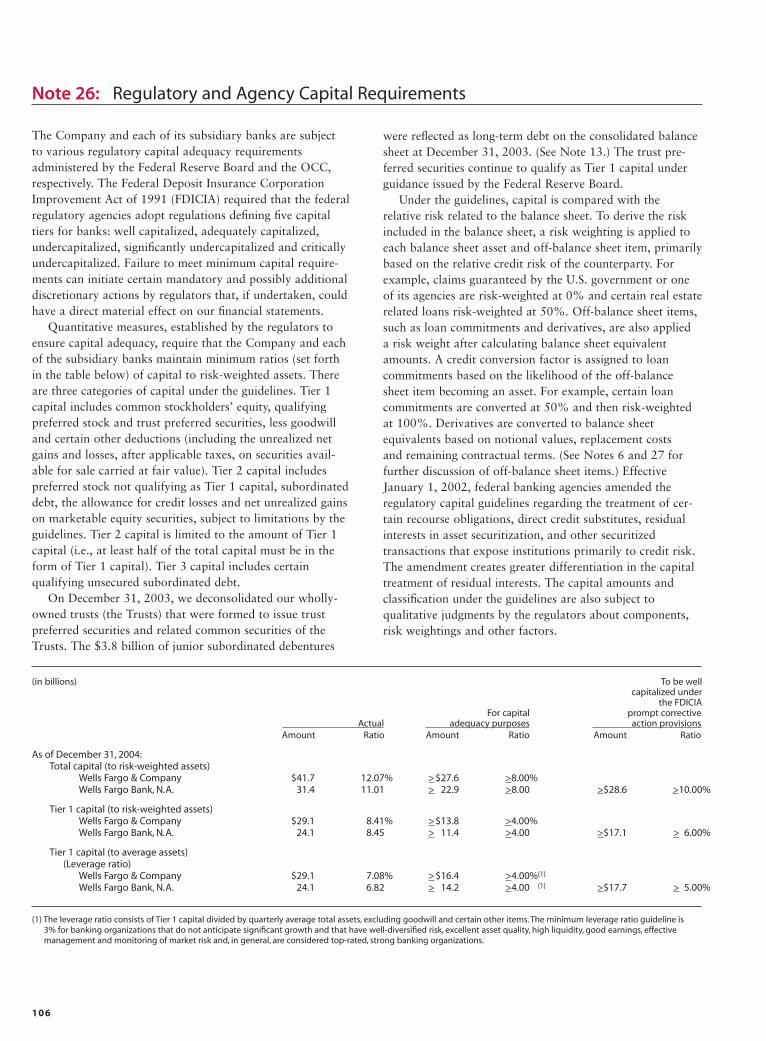
106
(in billions) To be wellcapitalized under
the FDICIAFor capital prompt corrective
Actual adequacy purposes action provisionsAmount Ratio Amount Ratio Amount Ratio
As of December 31, 2004:Total capital (to risk-weighted assets)
Wells Fargo & Company $41.7 12.07% >$27.6 >8.00%Wells Fargo Bank, N.A. 31.4 11.01 > 22.9 >8.00 >$28.6 >10.00%
Tier 1 capital (to risk-weighted assets)Wells Fargo & Company $29.1 8.41% >$13.8 >4.00%Wells Fargo Bank, N.A. 24.1 8.45 > 11.4 >4.00 >$17.1 > 6.00%
Tier 1 capital (to average assets)(Leverage ratio)
Wells Fargo & Company $29.1 7.08% >$16.4 >4.00%(1)
Wells Fargo Bank, N.A. 24.1 6.82 > 14.2 >4.00 (1) >$17.7 > 5.00%
(1) The leverage ratio consists of Tier 1 capital divided by quarterly average total assets, excluding goodwill and certain other items. The minimum leverage ratio guideline is3% for banking organizations that do not anticipate significant growth and that have well-diversified risk, excellent asset quality, high liquidity, good earnings, effectivemanagement and monitoring of market risk and, in general, are considered top-rated, strong banking organizations.
Note 26: Regulatory and Agency Capital Requirements
The Company and each of its subsidiary banks are subject to various regulatory capital adequacy requirements administered by the Federal Reserve Board and the OCC,respectively. The Federal Deposit Insurance CorporationImprovement Act of 1991 (FDICIA) required that the federalregulatory agencies adopt regulations defining five capitaltiers for banks: well capitalized, adequately capitalized,undercapitalized, significantly undercapitalized and criticallyundercapitalized. Failure to meet minimum capital require-ments can initiate certain mandatory and possibly additionaldiscretionary actions by regulators that, if undertaken, couldhave a direct material effect on our financial statements.
Quantitative measures, established by the regulators toensure capital adequacy, require that the Company and eachof the subsidiary banks maintain minimum ratios (set forthin the table below) of capital to risk-weighted assets. Thereare three categories of capital under the guidelines. Tier 1capital includes common stockholders’ equity, qualifying preferred stock and trust preferred securities, less goodwilland certain other deductions (including the unrealized netgains and losses, after applicable taxes, on securities avail-able for sale carried at fair value). Tier 2 capital includes preferred stock not qualifying as Tier 1 capital, subordinateddebt, the allowance for credit losses and net unrealized gainson marketable equity securities, subject to limitations by theguidelines. Tier 2 capital is limited to the amount of Tier 1capital (i.e., at least half of the total capital must be in theform of Tier 1 capital). Tier 3 capital includes certain qualifying unsecured subordinated debt.
On December 31, 2003, we deconsolidated our wholly-owned trusts (the Trusts) that were formed to issue trust preferred securities and related common securities of theTrusts. The $3.8 billion of junior subordinated debentures
were reflected as long-term debt on the consolidated balancesheet at December 31, 2003. (See Note 13.) The trust pre-ferred securities continue to qualify as Tier 1 capital underguidance issued by the Federal Reserve Board.
Under the guidelines, capital is compared with the relative risk related to the balance sheet. To derive the riskincluded in the balance sheet, a risk weighting is applied toeach balance sheet asset and off-balance sheet item, primarilybased on the relative credit risk of the counterparty. Forexample, claims guaranteed by the U.S. government or oneof its agencies are risk-weighted at 0% and certain real estaterelated loans risk-weighted at 50%. Off-balance sheet items,such as loan commitments and derivatives, are also applied a risk weight after calculating balance sheet equivalentamounts. A credit conversion factor is assigned to loan commitments based on the likelihood of the off-balancesheet item becoming an asset. For example, certain loancommitments are converted at 50% and then risk-weightedat 100%. Derivatives are converted to balance sheet equivalents based on notional values, replacement costs and remaining contractual terms. (See Notes 6 and 27 forfurther discussion of off-balance sheet items.) EffectiveJanuary 1, 2002, federal banking agencies amended the regulatory capital guidelines regarding the treatment of cer-tain recourse obligations, direct credit substitutes, residual interests in asset securitization, and other securitized transactions that expose institutions primarily to credit risk.The amendment creates greater differentiation in the capitaltreatment of residual interests. The capital amounts and classification under the guidelines are also subject to qualitative judgments by the regulators about components,risk weightings and other factors.
107
Our approach to managing interest rate risk includes the use of derivatives. This helps minimize significant unplannedfluctuations in earnings, fair values of assets and liabilities,and cash flows caused by interest rate volatility. Thisapproach involves modifying the repricing characteristics of certain assets and liabilities so that changes in interestrates do not have a significant adverse effect on the net interest margin and cash flows. As a result of interest ratefluctuations, hedged assets and liabilities will gain or losemarket value. In a fair value hedging strategy, the effect ofthis unrealized gain or loss will generally be offset by incomeor loss on the derivatives linked to the hedged assets and liabilities. In a cash flow hedging strategy, we manage thevariability of cash payments due to interest rate fluctuationsby the effective use of derivatives linked to hedged assets and liabilities.
We use derivatives as part of our interest rate risk management, including interest rate swaps, caps and floors,futures and forward contracts, and options. We also offervarious derivatives, including interest rate, commodity, equi-ty, credit and foreign exchange contracts, to our customersbut usually offset our exposure from such contracts by purchasing other financial contracts. The customer accom-modations and any offsetting financial contracts are treatedas free-standing derivatives. Free-standing derivatives alsoinclude derivatives we enter into for risk management thatdo not otherwise qualify for hedge accounting. To a lesserextent, we take positions based on market expectations or tobenefit from price differentials between financial instrumentsand markets.
By using derivatives, we are exposed to credit risk if counterparties to financial instruments do not perform asexpected. If a counterparty fails to perform, our credit risk is equal to the fair value gain in a derivative contract. Weminimize credit risk through credit approvals, limits andmonitoring procedures. Credit risk related to derivatives isconsidered and, if material, provided for separately. As we
generally enter into transactions only with counterpartiesthat carry high quality credit ratings, losses from counterpar-ty nonperformance on derivatives have not been significant.Further, we obtain collateral where appropriate to reducerisk. To the extent the master netting arrangements meet therequirements of FASB Interpretation No. 39, Offsetting ofAmounts Related to Certain Contracts, as amended by FASBInterpretation No. 41, Offsetting of Amounts Related toCertain Repurchase and Reverse Repurchase Agreements,amounts are shown net in the balance sheet.
Our derivative activities are monitored by the CorporateAsset/Liability Management Committee. Our Treasury function, which includes asset/liability management, isresponsible for various hedging strategies developed throughanalysis of data from financial models and other internal and industry sources. We incorporate the resulting hedgingstrategies into our overall interest rate risk management and trading strategies.
Fair Value HedgesWe use derivatives to manage the risk of changes in the fairvalue of mortgage servicing rights and other retained inter-ests. Derivative gains or losses caused by market conditions(volatility) and the spread between spot and forward ratespriced into the derivative contracts (the passage of time) areexcluded from the evaluation of hedge effectiveness, but are reflected in earnings. The change in value of derivativesexcluded from the assessment of hedge effectiveness was anet gain of $944 million, $908 million and $1,201 million in 2004, 2003 and 2002, respectively. The ineffective portionof the change in value of these derivatives was a net loss of $390 million in 2004 and a net gain of $203 million and $1,125 million in 2003 and 2002, respectively. The net derivative gain was $554 million, $1,111 million and $2,326 million in 2004, 2003 and 2002, respectively. Netderivative gains and losses are included in “Servicing fees,net of amortization and provision for impairment” in Note 22.
Management believes that, as of December 31, 2004, theCompany and each of the covered subsidiary banks met allcapital adequacy requirements to which they are subject.
The most recent notification from the OCC categorizedeach of the covered subsidiary banks as well capitalized,under the FDICIA prompt corrective action provisionsapplicable to banks. To be categorized as well capitalized,the institution must maintain a total risk-based capital ratioas set forth in table on the previous page and not be subjectto a capital directive order. There are no conditions or eventssince that notification that management believes have
changed the risk-based capital category of any of the covered subsidiary banks.
Wells Fargo Bank, N.A., through its mortgage bankingdivision, is an approved seller/servicer, and is required to maintain minimum levels of shareholders’ equity, as specified by various agencies, including the United StatesDepartment of Housing and Urban Development,Government National Mortgage Association, Federal HomeLoan Mortgage Corporation and Federal National MortgageAssociation. At December 31, 2004, Wells Fargo Bank, N.A.met these requirements.
Note 27: Derivatives
108
In 2002, we began using derivatives to hedge changes in fair value of our commercial real estate mortgages andfranchise loans due to changes in LIBOR interest rates. We originate a portion of these loans with the intent to sell them. The ineffective portion of these fair value hedgeswas a net loss of $21 million, $22 million and $3 million in 2004, 2003 and 2002, respectively, recorded as part of mortgage banking noninterest income in the statement ofincome. For the commercial real estate hedges, all parts ofeach derivative’s gain or loss are included in the assessmentof hedge effectiveness.
We also enter into interest rate swaps, designated as fairvalue hedges, to convert certain of our fixed-rate long-termdebt to floating-rate debt. The ineffective part of these fairvalue hedges was not significant in 2004, 2003 or 2002. For long-term debt, all parts of each derivative’s gain or loss are included in the assessment of hedge effectiveness.
At December 31, 2004, all designated fair value hedgescontinued to qualify as fair value hedges.
Cash Flow HedgesWe use derivatives to convert floating-rate loans to fixedrates and to hedge forecasted sales of mortgage loans. Wealso hedge floating-rate senior debt against future interestrate increases by using interest rates swaps to convert float-ing-rate senior debt to fixed rates and by using interest ratecaps. We recognized a net gain of $10 million in 2004,which represents the total ineffectiveness of cash flowhedges, compared with a net gain of $72 million in 2003and a net loss of $311 million in 2002. Gains and losses on derivatives that are reclassified from cumulative othercomprehensive income to current period earnings, are included in the line item in which the hedged item’s effect in earnings is recorded. All parts of gain or loss on thesederivatives are included in the assessment of hedge effective-ness. As of December 31, 2004, all designated cash flowhedges continued to qualify as cash flow hedges.
At December 31, 2004, we expected that $8 million ofdeferred net losses on derivatives in other comprehensiveincome will be reclassified as earnings during the next twelve months, compared with $9 million and $125 millionof deferred net losses at December 31, 2003 and 2002,respectively. We are hedging our exposure to the variabilityof future cash flows for all forecasted transactions for amaximum of one year for hedges converting floating-rateloans to fixed, seven years for hedges of floating-rate senior debt and one year for hedges of forecasted sales of mortgage loans.
Free-Standing Derivatives We enter into various derivatives primarily to provide derivative products to customers. To a lesser extent, we take positions based on market expectations or to benefitfrom price differentials between financial instruments and markets. These derivatives are not linked to specificassets and liabilities on the balance sheet or to forecastedtransactions in an accounting hedge relationship and, therefore, do not qualify for hedge accounting. They are carried at fair value with changes in fair value recorded aspart of other noninterest income in the statement of income.
Interest rate lock commitments for residential mortgageloans that we intend to resell are considered free-standingderivatives. Our interest rate exposure on these derivativeloan commitments is economically hedged with options,futures and forwards. The commitments and free-standingderivatives are carried at fair value with changes in fair value recorded as a part of mortgage banking noninterestincome in the statement of income. We record a zero fair value for a derivative loan commitment at inception consistent with EITF 02-3, Issues Involved in Accounting for Derivative Contracts Held for Trading Purposes andContracts Involved in Energy Trading and Risk ManagementActivities, and SEC Staff Accounting Bulletin No. 105,Application of Accounting Principles to Loan Commitments.Changes subsequent to inception are based on changes infair value of the underlying loan resulting from the exerciseof the commitment and changes in the probability that theloan will fund within the terms of the commitment, which is affected primarily by changes in interest rates and passageof time. The aggregate fair value of derivative loan commit-ments on the consolidated balance sheet at December 31,2004 and 2003, was a net liability of $38 million and $44 million, respectively; and is included in the caption“Interest rate contracts – Options written” under CustomerAccommodations and Trading in the following table.
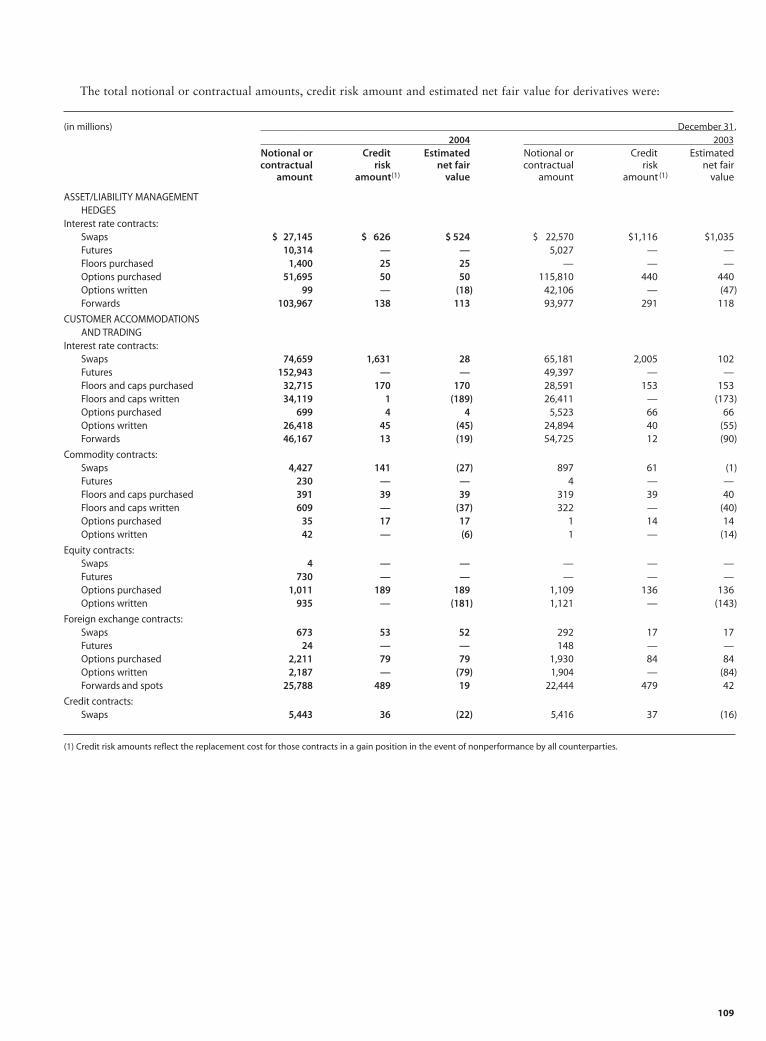
109
(in millions) December 31, 2004 2003
Notional or Credit Estimated Notional or Credit Estimatedcontractual risk net fair contractual risk net fair
amount amount(1) value amount amount (1) value
ASSET/LIABILITY MANAGEMENTHEDGES
Interest rate contracts:Swaps $ 27,145 $ 626 $ 524 $ 22,570 $1,116 $1,035Futures 10,314 — — 5,027 — —Floors purchased 1,400 25 25 — — —Options purchased 51,695 50 50 115,810 440 440Options written 99 — (18) 42,106 — (47)Forwards 103,967 138 113 93,977 291 118
CUSTOMER ACCOMMODATIONSAND TRADING
Interest rate contracts:Swaps 74,659 1,631 28 65,181 2,005 102Futures 152,943 — — 49,397 — —Floors and caps purchased 32,715 170 170 28,591 153 153Floors and caps written 34,119 1 (189) 26,411 — (173)Options purchased 699 4 4 5,523 66 66Options written 26,418 45 (45) 24,894 40 (55)Forwards 46,167 13 (19) 54,725 12 (90)
Commodity contracts:Swaps 4,427 141 (27) 897 61 (1)Futures 230 — — 4 — —Floors and caps purchased 391 39 39 319 39 40Floors and caps written 609 — (37) 322 — (40)Options purchased 35 17 17 1 14 14Options written 42 — (6) 1 — (14)
Equity contracts:Swaps 4 — — — — —Futures 730 — — — — —Options purchased 1,011 189 189 1,109 136 136Options written 935 — (181) 1,121 — (143)
Foreign exchange contracts:Swaps 673 53 52 292 17 17Futures 24 — — 148 — —Options purchased 2,211 79 79 1,930 84 84Options written 2,187 — (79) 1,904 — (84)Forwards and spots 25,788 489 19 22,444 479 42
Credit contracts:Swaps 5,443 36 (22) 5,416 37 (16)
The total notional or contractual amounts, credit risk amount and estimated net fair value for derivatives were:
(1) Credit risk amounts reflect the replacement cost for those contracts in a gain position in the event of nonperformance by all counterparties.
110
Note 28: Fair Value of Financial Instruments
LOANS HELD FOR SALE
The fair value of loans held for sale is based on what secondary markets are currently offering for portfolios with similar characteristics.
LOANS
The fair valuation calculation differentiates loans based ontheir financial characteristics, such as product classification,loan category, pricing features and remaining maturity.Prepayment estimates are evaluated by product and loan rate.
The fair value of commercial loans, other real estatemortgage loans and real estate construction loans is calculated by discounting contractual cash flows using discount rates that reflect our current pricing for loans with similar characteristics and remaining maturity.
For real estate 1-4 family first and junior lien mortgages,fair value is calculated by discounting contractual cash flows,adjusted for prepayment estimates, using discount ratesbased on current industry pricing for loans of similar size,type, remaining maturity and repricing characteristics.
For consumer finance and credit card loans, the portfo-lio’s yield is equal to our current pricing and, therefore, thefair value is equal to book value.
For other consumer loans, the fair value is calculated bydiscounting the contractual cash flows, adjusted for prepay-ment estimates, based on the current rates we offer for loans with similar characteristics.
Loan commitments, standby letters of credit and commer-cial and similar letters of credit not included in the followingtable had contractual values of $164.0 billion, $9.4 billionand $731 million, respectively, at December 31, 2004, and$126.0 billion, $8.3 billion and $810 million, respectively, atDecember 31, 2003. These instruments generate ongoing fees at our current pricing levels. Of the commitments atDecember 31, 2004, 40% mature within one year. Deferredfees on commitments and standby letters of credit totaled $46 million and $38 million at December 31, 2004 and2003, respectively. Carrying cost estimates fair value forthese fees.
NONMARKETABLE EQUITY INVESTMENTS
There are generally restrictions on the sale and/or liquidationof our nonmarketable equity investments, including federalbank stock. Federal bank stock carrying value approximatesfair value. We use all facts and circumstances available toestimate the fair value of our cost method investments. We typically consider our access to and need for capital(including recent or projected financing activity), qualitativeassessments of the viability of the investee, and prospects for its future.
FAS 107, Disclosures about Fair Value of FinancialInstruments, requires that we disclose estimated fair valuesfor our financial instruments. This disclosure should be read with the financial statements and Notes to FinancialStatements in this Annual Report. The carrying amounts in the following table are recorded in the ConsolidatedBalance Sheet under the indicated captions.
We base fair values on estimates or calculations using present value techniques when quoted market prices are notavailable. Because broadly-traded markets do not exist formost of our financial instruments, we try to incorporate theeffect of current market conditions in the fair value calcula-tions. These valuations are our estimates, and are often calculated based on current pricing policy, the economic andcompetitive environment, the characteristics of the financialinstruments and other such factors. These calculations aresubjective, involve uncertainties and significant judgment and do not include tax ramifications. Therefore, the resultscannot be determined with precision, substantiated by comparison to independent markets and may not be realizedin an actual sale or immediate settlement of the instruments.There may be inherent weaknesses in any calculation tech-nique, and changes in the underlying assumptions used,including discount rates and estimates of future cash flows, that could significantly affect the results.
We have not included certain material items in our disclosure, such as the value of the long-term relationshipswith our deposit, credit card and trust customers, since these intangibles are not financial instruments. For all of these reasons, the total of the fair value calculations presented do not represent, and should not be construed to represent, the underlying value of the Company.
Financial AssetsSHORT-TERM FINANCIAL ASSETS
Short-term financial assets include cash and due from banks,federal funds sold and securities purchased under resaleagreements and due from customers on acceptances. The carrying amount is a reasonable estimate of fair valuebecause of the relatively short time between the originationof the instrument and its expected realization.
TRADING ASSETS
Trading assets are carried at fair value.
SECURITIES AVAILABLE FOR SALE
Securities available for sale are carried at fair value. For further information, see Note 5.
MORTGAGES HELD FOR SALE
The fair value of mortgages held for sale is based on quotedmarket prices or on what secondary markets are currentlyoffering for portfolios with similar characteristics.
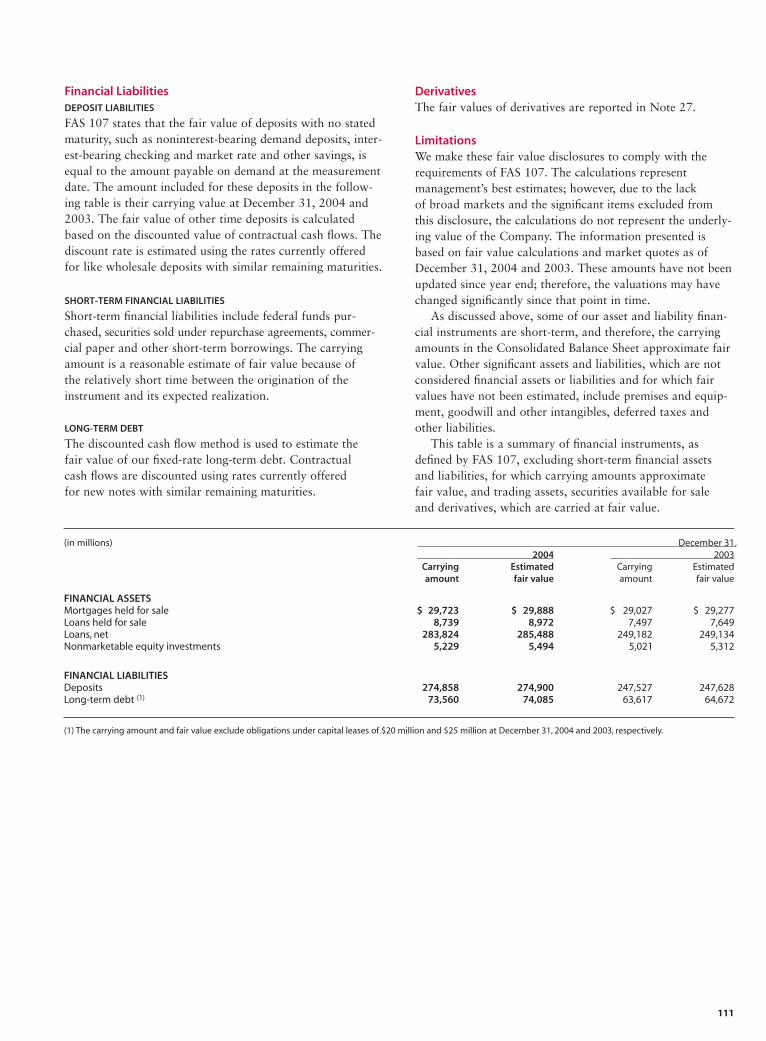
111
(in millions) December 31, 2004 2003
Carrying Estimated Carrying Estimatedamount fair value amount fair value
FINANCIAL ASSETSMortgages held for sale $ 29,723 $ 29,888 $ 29,027 $ 29,277Loans held for sale 8,739 8,972 7,497 7,649Loans, net 283,824 285,488 249,182 249,134Nonmarketable equity investments 5,229 5,494 5,021 5,312
FINANCIAL LIABILITIESDeposits 274,858 274,900 247,527 247,628Long-term debt (1) 73,560 74,085 63,617 64,672
(1) The carrying amount and fair value exclude obligations under capital leases of $20 million and $25 million at December 31, 2004 and 2003, respectively.
Financial LiabilitiesDEPOSIT LIABILITIES
FAS 107 states that the fair value of deposits with no statedmaturity, such as noninterest-bearing demand deposits, inter-est-bearing checking and market rate and other savings, isequal to the amount payable on demand at the measurementdate. The amount included for these deposits in the follow-ing table is their carrying value at December 31, 2004 and2003. The fair value of other time deposits is calculatedbased on the discounted value of contractual cash flows. Thediscount rate is estimated using the rates currently offeredfor like wholesale deposits with similar remaining maturities.
SHORT-TERM FINANCIAL LIABILITIES
Short-term financial liabilities include federal funds pur-chased, securities sold under repurchase agreements, commer-cial paper and other short-term borrowings. The carryingamount is a reasonable estimate of fair value because of the relatively short time between the origination of theinstrument and its expected realization.
LONG-TERM DEBT
The discounted cash flow method is used to estimate the fair value of our fixed-rate long-term debt. Contractual cash flows are discounted using rates currently offered for new notes with similar remaining maturities.
Derivatives The fair values of derivatives are reported in Note 27.
LimitationsWe make these fair value disclosures to comply with therequirements of FAS 107. The calculations represent management’s best estimates; however, due to the lack of broad markets and the significant items excluded fromthis disclosure, the calculations do not represent the underly-ing value of the Company. The information presented isbased on fair value calculations and market quotes as ofDecember 31, 2004 and 2003. These amounts have not beenupdated since year end; therefore, the valuations may havechanged significantly since that point in time.
As discussed above, some of our asset and liability finan-cial instruments are short-term, and therefore, the carryingamounts in the Consolidated Balance Sheet approximate fairvalue. Other significant assets and liabilities, which are notconsidered financial assets or liabilities and for which fairvalues have not been estimated, include premises and equip-ment, goodwill and other intangibles, deferred taxes andother liabilities.
This table is a summary of financial instruments, asdefined by FAS 107, excluding short-term financial assets and liabilities, for which carrying amounts approximate fair value, and trading assets, securities available for sale and derivatives, which are carried at fair value.
112
The Board of Directors and Stockholders Wells Fargo & Company:
We have audited the accompanying consolidated balance sheet of Wells Fargo & Company and Subsidiaries as of December 31, 2004 and 2003, and the related consolidated statements of income, changes in stockholders’ equity and comprehensive income, and cash flows for each of the years in the three-year period ended December 31, 2004. These consolidated financial statements are the responsibility of the Company’s management. Our responsibility is to express an opinion on these consolidated financial statements based on our audits.
We conducted our audits in accordance with the standards of the Public Company Accounting Oversight Board (United States). Those standards require that we plan and perform the audit to obtain reasonable assurance about whether the financial statements are free of material misstatement. An audit includes examining, on a test basis, evidence supporting the amounts and disclosures in the financial statements. An audit also includes assessing the accounting principles used and significant estimates made by management, as well as evaluating the overall financial statement presentation. We believe that our audits provide a reasonable basis for our opinion.
In our opinion, the consolidated financial statements referred to above present fairly, in all material respects, the financialposition of Wells Fargo & Company and Subsidiaries as of December 31, 2004 and 2003, and the results of their operationsand their cash flows for each of the years in the three-year period ended December 31, 2004, in conformity with U.S. generallyaccepted accounting principles.
As discussed in Note 1 to the consolidated financial statements, the Company changed its method of accounting for goodwill in 2002.
We also have audited, in accordance with the standards of the Public Company Accounting Oversight Board (United States),the effectiveness of Wells Fargo & Company and Subsidiaries’ internal control over financial reporting as of December 31,2004, based on criteria established in Internal Control – Integrated Framework issued by the Committee of SponsoringOrganizations of the Treadway Commission (COSO), and our report dated February 23, 2005 expressed an unqualified opinion on management’s assessment of, and the effective operation of, internal control over financial reporting.
San Francisco, CaliforniaFebruary 23, 2005
Report of Independent Registered Public Accounting Firm
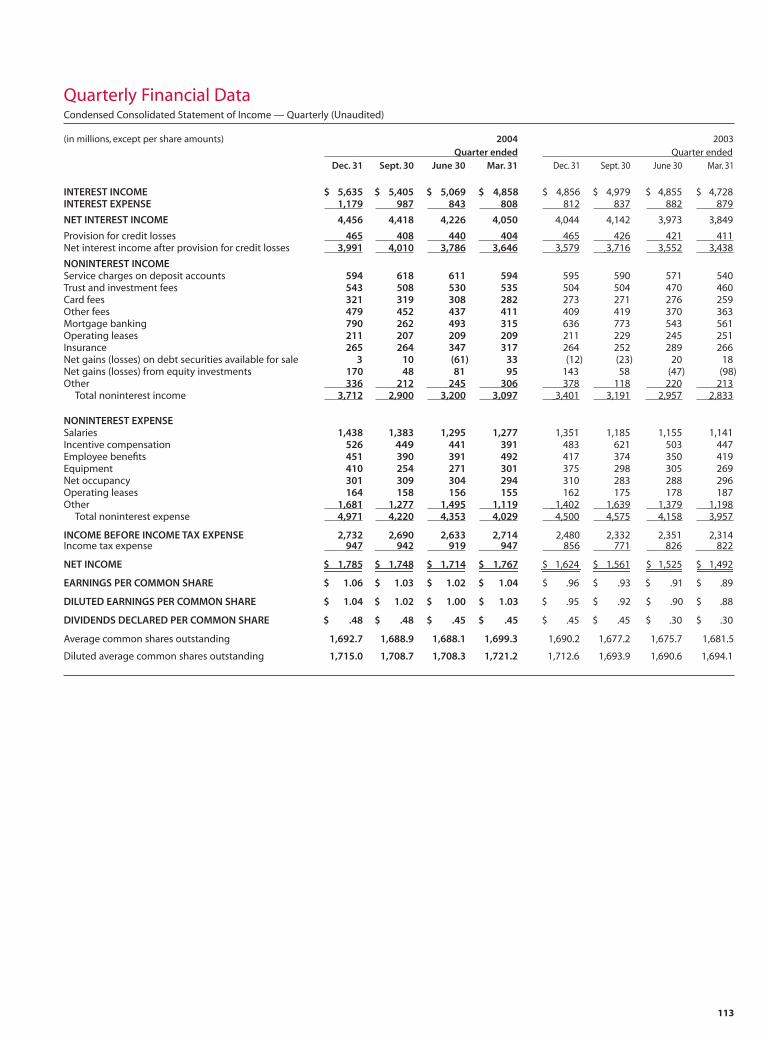
113
Quarterly Financial DataCondensed Consolidated Statement of Income — Quarterly (Unaudited)
(in millions, except per share amounts) 2004 2003 Quarter ended Quarter ended
Dec. 31 Sept. 30 June 30 Mar. 31 Dec. 31 Sept. 30 June 30 Mar. 31
INTEREST INCOME $ 5,635 $ 5,405 $ 5,069 $ 4,858 $ 4,856 $ 4,979 $ 4,855 $ 4,728INTEREST EXPENSE 1,179 987 843 808 812 837 882 879
NET INTEREST INCOME 4,456 4,418 4,226 4,050 4,044 4,142 3,973 3,849
Provision for credit losses 465 408 440 404 465 426 421 411Net interest income after provision for credit losses 3,991 4,010 3,786 3,646 3,579 3,716 3,552 3,438
NONINTEREST INCOMEService charges on deposit accounts 594 618 611 594 595 590 571 540Trust and investment fees 543 508 530 535 504 504 470 460Card fees 321 319 308 282 273 271 276 259Other fees 479 452 437 411 409 419 370 363Mortgage banking 790 262 493 315 636 773 543 561Operating leases 211 207 209 209 211 229 245 251Insurance 265 264 347 317 264 252 289 266Net gains (losses) on debt securities available for sale 3 10 (61) 33 (12) (23) 20 18Net gains (losses) from equity investments 170 48 81 95 143 58 (47) (98)Other 336 212 245 306 378 118 220 213
Total noninterest income 3,712 2,900 3,200 3,097 3,401 3,191 2,957 2,833
NONINTEREST EXPENSESalaries 1,438 1,383 1,295 1,277 1,351 1,185 1,155 1,141Incentive compensation 526 449 441 391 483 621 503 447Employee benefits 451 390 391 492 417 374 350 419Equipment 410 254 271 301 375 298 305 269Net occupancy 301 309 304 294 310 283 288 296Operating leases 164 158 156 155 162 175 178 187Other 1,681 1,277 1,495 1,119 1,402 1,639 1,379 1,198
Total noninterest expense 4,971 4,220 4,353 4,029 4,500 4,575 4,158 3,957
INCOME BEFORE INCOME TAX EXPENSE 2,732 2,690 2,633 2,714 2,480 2,332 2,351 2,314Income tax expense 947 942 919 947 856 771 826 822
NET INCOME $ 1,785 $ 1,748 $ 1,714 $ 1,767 $ 1,624 $ 1,561 $ 1,525 $ 1,492
EARNINGS PER COMMON SHARE $ 1.06 $ 1.03 $ 1.02 $ 1.04 $ .96 $ .93 $ .91 $ .89
DILUTED EARNINGS PER COMMON SHARE $ 1.04 $ 1.02 $ 1.00 $ 1.03 $ .95 $ .92 $ .90 $ .88
DIVIDENDS DECLARED PER COMMON SHARE $ .48 $ .48 $ .45 $ .45 $ .45 $ .45 $ .30 $ .30
Average common shares outstanding 1,692.7 1,688.9 1,688.1 1,699.3 1,690.2 1,677.2 1,675.7 1,681.5
Diluted average common shares outstanding 1,715.0 1,708.7 1,708.3 1,721.2 1,712.6 1,693.9 1,690.6 1,694.1
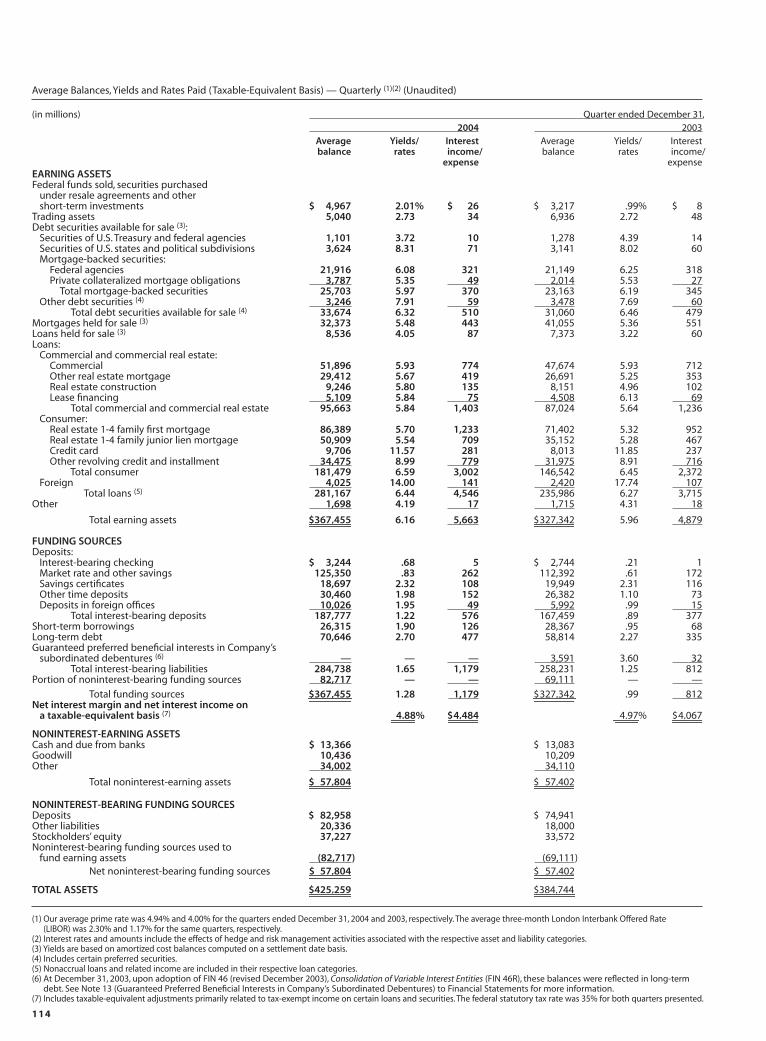
114
Average Balances, Yields and Rates Paid (Taxable-Equivalent Basis) — Quarterly (1)(2) (Unaudited)
(in millions) Quarter ended December 31, 2004 2003
Average Yields/ Interest Average Yields/ Interestbalance rates income/ balance rates income/
expense expenseEARNING ASSETSFederal funds sold, securities purchased
under resale agreements and other short-term investments $ 4,967 2.01% $ 26 $ 3,217 .99% $ 8
Trading assets 5,040 2.73 34 6,936 2.72 48Debt securities available for sale (3):
Securities of U.S. Treasury and federal agencies 1,101 3.72 10 1,278 4.39 14Securities of U.S. states and political subdivisions 3,624 8.31 71 3,141 8.02 60Mortgage-backed securities:
Federal agencies 21,916 6.08 321 21,149 6.25 318Private collateralized mortgage obligations 3,787 5.35 49 2,014 5.53 27
Total mortgage-backed securities 25,703 5.97 370 23,163 6.19 345 Other debt securities (4) 3,246 7.91 59 3,478 7.69 60
Total debt securities available for sale (4) 33,674 6.32 510 31,060 6.46 479Mortgages held for sale (3) 32,373 5.48 443 41,055 5.36 551Loans held for sale (3) 8,536 4.05 87 7,373 3.22 60Loans:
Commercial and commercial real estate:Commercial 51,896 5.93 774 47,674 5.93 712Other real estate mortgage 29,412 5.67 419 26,691 5.25 353Real estate construction 9,246 5.80 135 8,151 4.96 102Lease financing 5,109 5.84 75 4,508 6.13 69
Total commercial and commercial real estate 95,663 5.84 1,403 87,024 5.64 1,236Consumer:
Real estate 1-4 family first mortgage 86,389 5.70 1,233 71,402 5.32 952Real estate 1-4 family junior lien mortgage 50,909 5.54 709 35,152 5.28 467Credit card 9,706 11.57 281 8,013 11.85 237Other revolving credit and installment 34,475 8.99 779 31,975 8.91 716
Total consumer 181,479 6.59 3,002 146,542 6.45 2,372Foreign 4,025 14.00 141 2,420 17.74 107
Total loans (5) 281,167 6.44 4,546 235,986 6.27 3,715Other 1,698 4.19 17 1,715 4.31 18
Total earning assets $367,455 6.16 5,663 $327,342 5.96 4,879
FUNDING SOURCESDeposits:
Interest-bearing checking $ 3,244 .68 5 $ 2,744 .21 1Market rate and other savings 125,350 .83 262 112,392 .61 172Savings certificates 18,697 2.32 108 19,949 2.31 116Other time deposits 30,460 1.98 152 26,382 1.10 73Deposits in foreign offices 10,026 1.95 49 5,992 .99 15
Total interest-bearing deposits 187,777 1.22 576 167,459 .89 377Short-term borrowings 26,315 1.90 126 28,367 .95 68Long-term debt 70,646 2.70 477 58,814 2.27 335Guaranteed preferred beneficial interests in Company’s
subordinated debentures (6) — — — 3,591 3.60 32Total interest-bearing liabilities 284,738 1.65 1,179 258,231 1.25 812
Portion of noninterest-bearing funding sources 82,717 — — 69,111 — —
Total funding sources $367,455 1.28 1,179 $327,342 .99 812Net interest margin and net interest income on
a taxable-equivalent basis (7) 4.88% $4,484 4.97% $4,067
NONINTEREST-EARNING ASSETSCash and due from banks $ 13,366 $ 13,083Goodwill 10,436 10,209Other 34,002 34,110
Total noninterest-earning assets $ 57,804 $ 57,402
NONINTEREST-BEARING FUNDING SOURCESDeposits $ 82,958 $ 74,941Other liabilities 20,336 18,000Stockholders’ equity 37,227 33,572Noninterest-bearing funding sources used to
fund earning assets (82,717) (69,111)Net noninterest-bearing funding sources $ 57,804 $ 57,402
TOTAL ASSETS $425,259 $384,744
(1) Our average prime rate was 4.94% and 4.00% for the quarters ended December 31, 2004 and 2003, respectively. The average three-month London Interbank Offered Rate (LIBOR) was 2.30% and 1.17% for the same quarters, respectively.
(2) Interest rates and amounts include the effects of hedge and risk management activities associated with the respective asset and liability categories.(3) Yields are based on amortized cost balances computed on a settlement date basis.(4) Includes certain preferred securities.(5) Nonaccrual loans and related income are included in their respective loan categories.(6) At December 31, 2003, upon adoption of FIN 46 (revised December 2003), Consolidation of Variable Interest Entities (FIN 46R), these balances were reflected in long-term
debt. See Note 13 (Guaranteed Preferred Beneficial Interests in Company’s Subordinated Debentures) to Financial Statements for more information.(7) Includes taxable-equivalent adjustments primarily related to tax-exempt income on certain loans and securities. The federal statutory tax rate was 35% for both quarters presented.
114

115
Collateralized debt obligations: Securitized corporate debt.
Core deposits: Deposits acquired in a bank’s natural market area,counted as a stable source of funds for lending. These deposits generally have a predictable cost and customer loyalty.
Core deposit intangibles: The present value of the difference in cost offunding provided by core deposit balances compared with alternativefunding with similar terms assigned to acquired core deposit balancesby a buyer.
Cost method of accounting: Investment in the subsidiary is carried atcost, and the parent company accounts for the subsidiary’s operationsonly to the extent that the subsidiary declares dividends. Generallyused if investment ownership is less than 20%.
Derivatives: Financial contracts whose value is derived from publiclytraded securities, interest rates, currency exchange rates or marketindices. Derivatives cover a wide assortment of financial contracts,including forward contracts, futures, options and swaps.
Effectiveness/ineffectiveness (of derivatives): Effectiveness is the gain or loss on a hedging instrument that exactly offsets the loss orgain on the hedged item. Any difference would be the effect of hedge ineffectiveness, which is recognized currently in earnings.
Equity method of accounting: Investment in the subsidiary is originally recorded at cost, and the value of the investment is increased or decreased based on the investor’s proportional share of the change in the subsidiary’s net worth. Generally used if investment ownership is 20% or more but less than 50%.
Federal Reserve Board (FRB): The Board of Governors of the FederalReserve System, charged with supervising and regulating bank holding companies, including financial holding companies.
Futures and forward contracts: Contracts in which the buyer agrees topurchase and the seller agrees to deliver a specific financial instrumentat a predetermined price or yield. May be settled either in cash or bydelivery of the underlying financial instrument.
GAAP (Generally accepted accounting principles): Accounting rules and conventions defining acceptable practices in recording transactions and preparing financial statements. U.S. GAAP is primarilydetermined by the Financial Accounting Standards Board (FASB).
Hedge: Financial technique to offset the risk of loss from price fluctuations in the market by offsetting the risk in another transaction. The risk in one position counterbalances the risk in another transaction.
Interest rate floors and caps: Interest rate protection instrumentswhere the seller pays the buyer an interest differential, which represents the difference between a short-term rate (e. g., three-month LIBOR) and an agreed-upon rate (the strike rate) applied to a notional principal amount.
Interest rate swap contracts: Primarily an asset/liability managementstrategy to reduce interest rate risk. Interest rate swap contracts areexchanges of interest rate payments, such as fixed-rate payments forfloating-rate payments, based on notional principal amounts.
Mortgage servicing rights: The rights to service mortgage loans for others, which are acquired through purchases or kept after sales orsecuritizations of originated loans.
Glossary
Net interest margin: The average yield on earning assets minus theaverage interest rate paid for deposits and debt.
Notional amount: A number of currency units, shares, or other unitsspecified in a derivative contract.
Office of the Comptroller of the Currency (OCC): Part of the U.S.Treasury department and the primary regulator for banks with national charters.
Options: Contracts that grant the purchaser, for a premium payment,the right, but not the obligation, to either purchase or sell the associated financial instrument at a set price during a period or at a specified date in the future.
Other-than-temporary impairment: A write-down of certain assetsrecorded when a decline in the fair market value below the carryingvalue of the asset is considered not to be temporary. Applies to goodwill, mortgage servicing rights, other intangible assets, securitiesavailable for sale and nonmarketable equity securities. (See Note 1 –Summary of Significant Accounting Policies for impairment policies for specific categories of assets.)
Qualifying special-purpose entities (QSPE): A trust or other legal vehicle that meets certain conditions, including (1) that it is distinctfrom the transferor, (2) activities are limited, and (3) the types of assets it may hold and conditions under which it may dispose of noncashassets are limited. A QSPE is not consolidated on the balance sheet.
Securitize/securitization: The process and the result of pooling financial assets together and issuing liability and equity obligationsbacked by the resulting pool of assets to convert those assets into marketable securities.
Special-purpose entities (SPE): A legal entity, sometimes a trust or alimited partnership, created solely for the purpose of holding assets.
Taxable-equivalent basis: Basis of presentation of net interest incomeand the net interest margin adjusted to consistently reflect incomefrom taxable and tax-exempt loans and securities based on a 35% marginal tax rate. The yield that a tax-free investment would provide to an investor if the tax-free yield was “grossed up” by the amount oftaxes not paid.
Underlying: A specified interest rate, security price, commodity price,foreign exchange rate, index of prices or rates or other variable. Anunderlying may be the price or rate of an asset or liability, but is not the asset or liability itself.
Value at risk: The amount or percentage of value that is at risk of beinglost from a change in prevailing interest rates.
Variable interest entity (VIE): An entity in which the equity investors (1) do not have a controlling financial interest, or (2) do not have sufficient equity at risk for the entity to finance its activities withoutsubordinated financial support from other parties.
Yield curve (shape of the yield curve, flat yield curve): A graph showing the relationship between the yields on bonds of the samecredit quality with different maturities. For example, a “normal”, or “positive”, yield curve exists when long-term bonds have higher yieldsthan short-term bonds. A “flat” yield curve exists when yields are thesame for short-term and long-term bonds. A “steep” yield curve existswhen yields on long-term bonds are significantly higher than on short-term bonds.
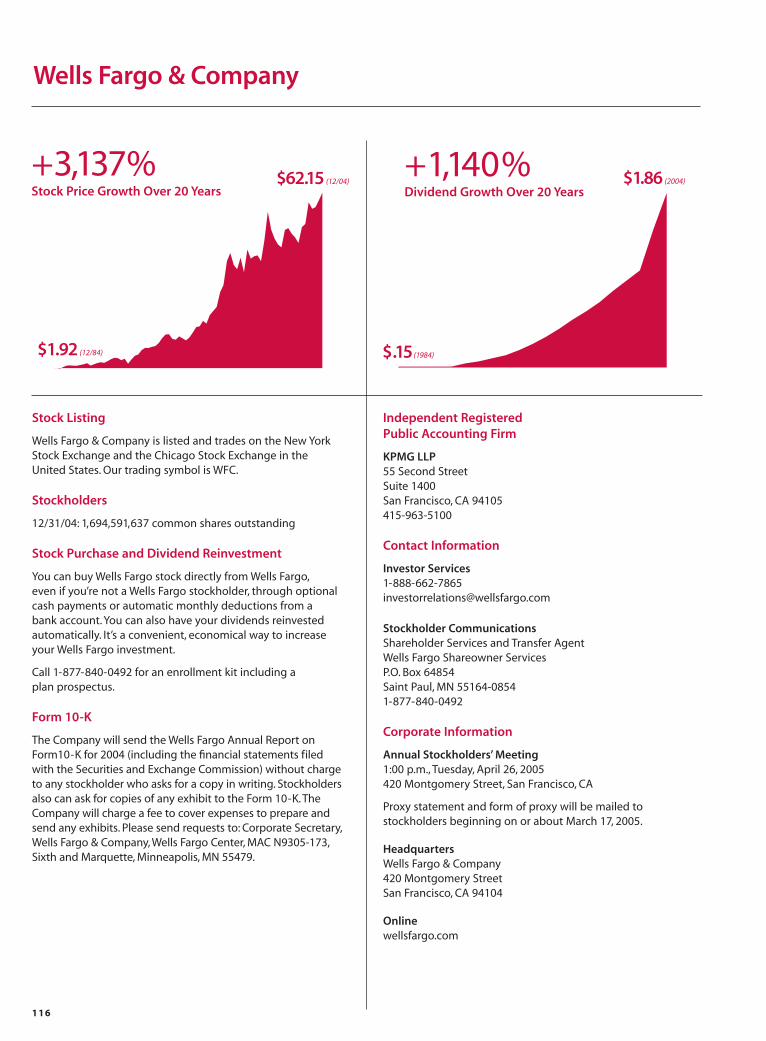
116
Wells Fargo & Company
Stock Listing
Wells Fargo & Company is listed and trades on the New YorkStock Exchange and the Chicago Stock Exchange in the United States. Our trading symbol is WFC.
Stockholders
12/31/04: 1,694,591,637 common shares outstanding
Stock Purchase and Dividend Reinvestment
You can buy Wells Fargo stock directly from Wells Fargo,even if you’re not a Wells Fargo stockholder, through optionalcash payments or automatic monthly deductions from a bank account. You can also have your dividends reinvestedautomatically. It’s a convenient, economical way to increaseyour Wells Fargo investment.
Call 1-877-840-0492 for an enrollment kit including a plan prospectus.
Form 10-K
The Company will send the Wells Fargo Annual Report onForm10-K for 2004 (including the financial statements filed with the Securities and Exchange Commission) without chargeto any stockholder who asks for a copy in writing. Stockholdersalso can ask for copies of any exhibit to the Form 10-K. TheCompany will charge a fee to cover expenses to prepare andsend any exhibits. Please send requests to: Corporate Secretary,Wells Fargo & Company, Wells Fargo Center, MAC N9305-173,Sixth and Marquette, Minneapolis, MN 55479.
Independent Registered Public Accounting Firm
KPMG LLP55 Second StreetSuite 1400San Francisco, CA 94105415-963-5100
Contact Information
Investor [email protected]
Stockholder CommunicationsShareholder Services and Transfer AgentWells Fargo Shareowner ServicesP.O. Box 64854Saint Paul, MN 55164-08541-877-840-0492
Corporate Information
Annual Stockholders’ Meeting 1:00 p.m., Tuesday, April 26, 2005 420 Montgomery Street, San Francisco, CA
Proxy statement and form of proxy will be mailed to stockholders beginning on or about March 17, 2005.
HeadquartersWells Fargo & Company420 Montgomery StreetSan Francisco, CA 94104
Online wellsfargo.com
$1.92 (12/84)
$62.15 (12/04)+3,137%Stock Price Growth Over 20 Years
+1,140%Dividend Growth Over 20 Years
$.15 (1984)
$1.86 (2004)

Reputation
ForbesAmong top 25 companies worldwide in compositeranking of sales, profit, assets and market cap.
Best managed company in banking.
FortuneAmong top 20 Fortune 500 companies in profitand market cap.
Global FinanceBest U.S. consumer internet bank, best for onlinebill payment and presentment, online credit,corporate/institutional website design in North America.
Moody’s Investors ServiceOnly U.S. bank rated “Aaa,” highest possible credit rating.
Smart Money#2 U.S. full service investment broker
Watchfire GomezPro#1 U.S. online internet bank
Anna HsiungWells Fargo Services San Francisco, CaliforniaTeam member since: 2001

OUR VISION:
Satisfy all our customers’ financial needsand help them succeed financially.
NUESTRA VISION:
Deseamos satisfacer todas las necesidadesfinancieras de nuestros clientes y ayudarlosa tener éxito en el área financiera.
Wells Fargo & Company420 Montgomery StreetSan Francisco, California 94163
1-800-411- 4932www.wellsfargo.com
Linda Adler, Private Client Services, Rapid City, South DakotaTeam member since: 1980
Are the days of company loyalty gone? There’s lots of opportunity for careergrowth with a successful, large, diverse, national company. Fifteen years ago, asa teller, Linda became the first team member in our history to be on the cover ofour Annual Report. She’s still growing with Wells Fargo today and helping satisfyall her customers’ financial needs.
Well done, Linda!