Embed Size (px)
Citation preview
Whittaker Elementary School (Team WildC.A.T.S.- Collaborating to Achieve Team Success)
(We
Annual Report to Parents
2015-2016
Dr. Casandra H. Jenkins ,
Principal
1 Annual Report to Parents 2015-2016
Mission Statement
Whittaker Elementary School exists to ensure academic success for all students.
Goal 1: Increase Student Learning OCSD5will meet performance standards yearly on local, state, and national tests while closing the achievement gap.
Goal 2: Improve Resource Management The district will base all financial decisions on all zero-based budget protocol to ensure that they are matched with district goals and the strategic plan.
Goal 3: Improve Human Capital The district will focus on retaining, training, and developing the best personnel at all levels by utilizing a yearly evaluation system, as well as recruiting highly qualified personnel according to national, state, and district guidelines. Goal 4: Increase Engagement The district will increase opportunities that promote stakeholder involvement and engagement each year. Goal 5: Safety Above All Else All stakeholders will be satisfied with the safety and security of the school climate in OCSD5 as measured by national, state, and local data in the areas of learning environment, home-school relations, social, and physical environment.
2 Annual Report to Parents 2015-2016
Accomplishments Whittaker Elementary School continues to achieve and remains in the forefront of education across Orangeburg County. The school has most recently achieved the following accomplishments:
Federal Report Card Rating of 100%---The highest possible rating.
Whittaker teachers have been recognized every year since the inception of the District 80% or Higher Teacher
Luncheon. Only teachers that had students to achieve high scores on the SC Palmetto Assessment of State
Standards (PASS) test have been recognized for this great accomplishment.
National Race to the Top Grant Recipients of $25 Million Dollars
Just Say No to Drugs Drill Team has been 1st Place Winners in all Parades and Competition Events since its
inception.
21st Century Afterschool students have been recognized as the Orangeburg County Relay for Life Kick-Off
Guests for their work and research on the different types of cancer. The students have raised a total of
$1,010.00. All funds were donated to the Mabry Cancer Center of Orangeburg.
The 21st Century Afterschool Program has been recognized as District Winners of the Afterschool Program
Competition every year since its inception.
The focus of the afterschool program is to ensure hands-on experiences with real-world activities in the areas
of (Science, Technology, Engineering, and Mathematics. The program is affectionately known as S.T.E.A.M.)
21st Century students honored senior citizens in a Senior’s Hour of Fun Game Day where they were featured in
the Times and Democrat. The students hosted guests in ages as high as 92 and 93 years old.
District Principal of the Year
District Teacher of the Year Finalist
Palmetto Silver Academic Reward Recipients
3 Annual Report to Parents 2015-2016
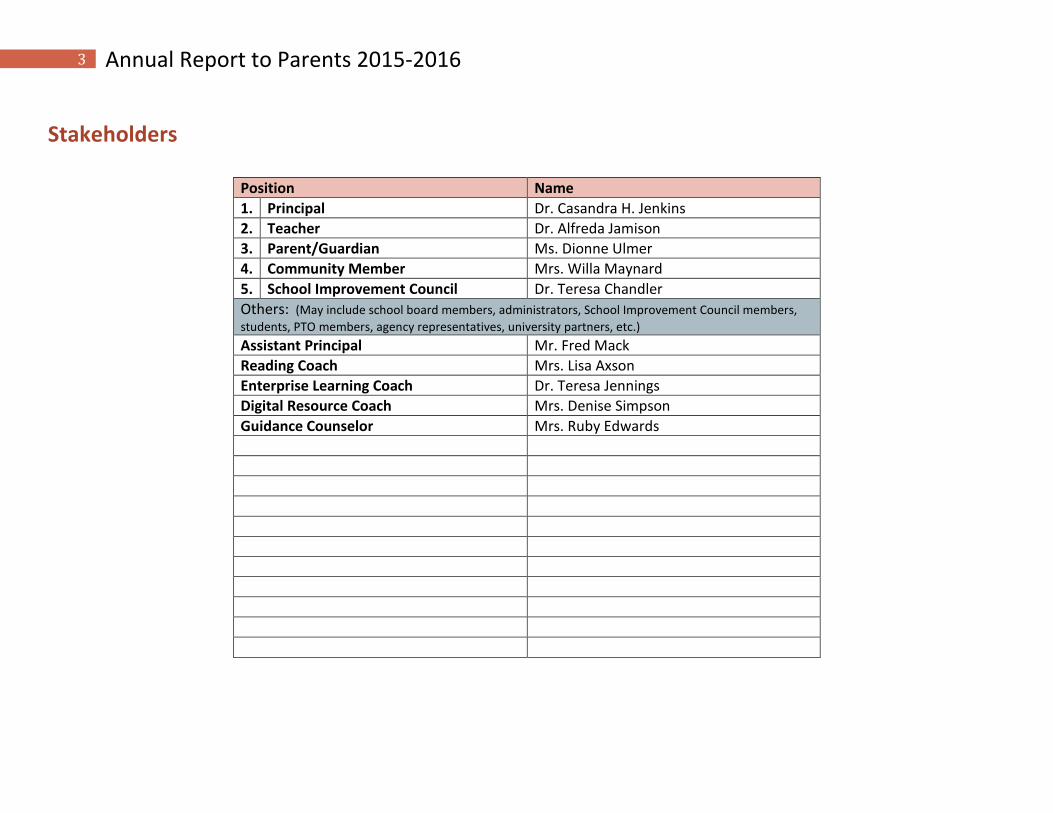
Stakeholders
Position Name
1. Principal Dr. Casandra H. Jenkins
2. Teacher Dr. Alfreda Jamison
3. Parent/Guardian Ms. Dionne Ulmer
4. Community Member Mrs. Willa Maynard
5. School Improvement Council Dr. Teresa Chandler
Others: (May include school board members, administrators, School Improvement Council members,
students, PTO members, agency representatives, university partners, etc.) Assistant Principal Mr. Fred Mack
Reading Coach Mrs. Lisa Axson
Enterprise Learning Coach Dr. Teresa Jennings
Digital Resource Coach Mrs. Denise Simpson
Guidance Counselor Mrs. Ruby Edwards
4 Annual Report to Parents 2015-2016
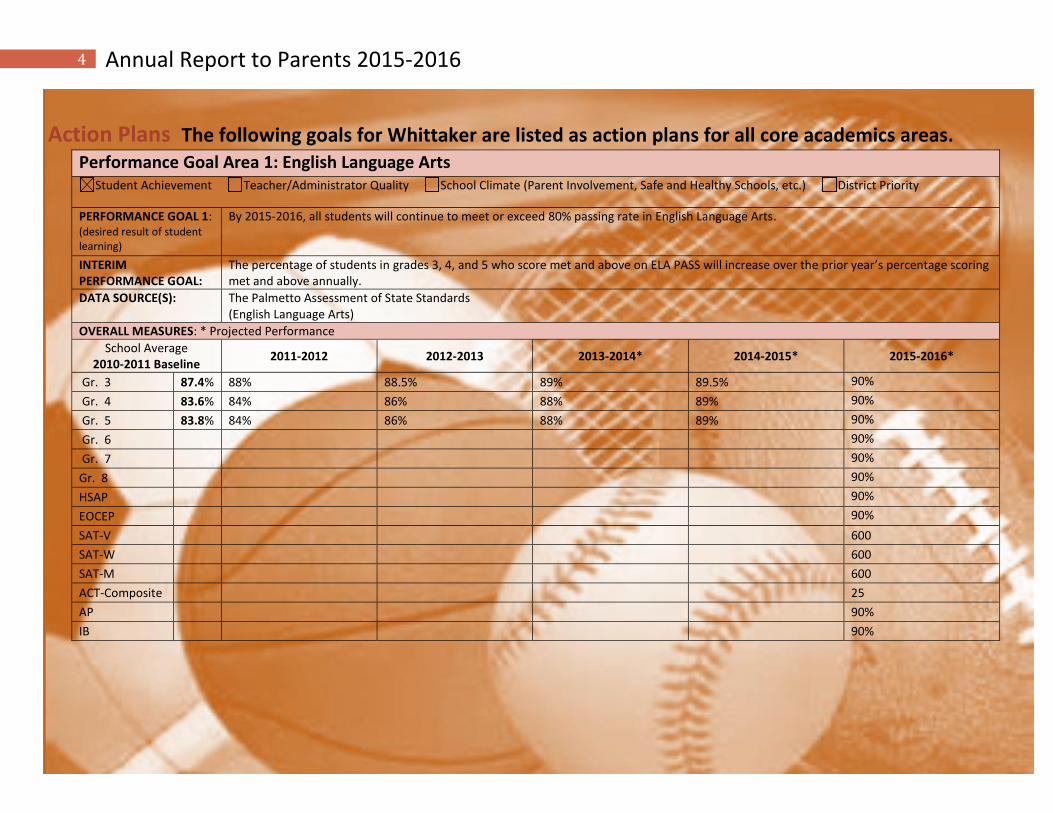
Action Plans The following goals for Whittaker are listed as action plans for all core academics areas.
Performance Goal Area 1: English Language Arts Student Achievement Teacher/Administrator Quality School Climate (Parent Involvement, Safe and Healthy Schools, etc.) District Priority
PERFORMANCE GOAL 1: (desired result of student learning)
By 2015-2016, all students will continue to meet or exceed 80% passing rate in English Language Arts.
INTERIM PERFORMANCE GOAL:
The percentage of students in grades 3, 4, and 5 who score met and above on ELA PASS will increase over the prior year’s percentage scoring met and above annually.
DATA SOURCE(S): The Palmetto Assessment of State Standards (English Language Arts)
OVERALL MEASURES: * Projected Performance
School Average 2010-2011 Baseline
2011-2012 2012-2013 2013-2014* 2014-2015* 2015-2016*
Gr. 3 87.4% 88% 88.5% 89% 89.5% 90%
Gr. 4 83.6% 84% 86% 88% 89% 90%
Gr. 5 83.8% 84% 86% 88% 89% 90%
Gr. 6 90%
Gr. 7 90%
Gr. 8 90%
HSAP 90%
EOCEP 90%
SAT-V 600
SAT-W 600
SAT-M 600
ACT-Composite 25
AP 90%
IB 90%
5 Annual Report to Parents 2015-2016
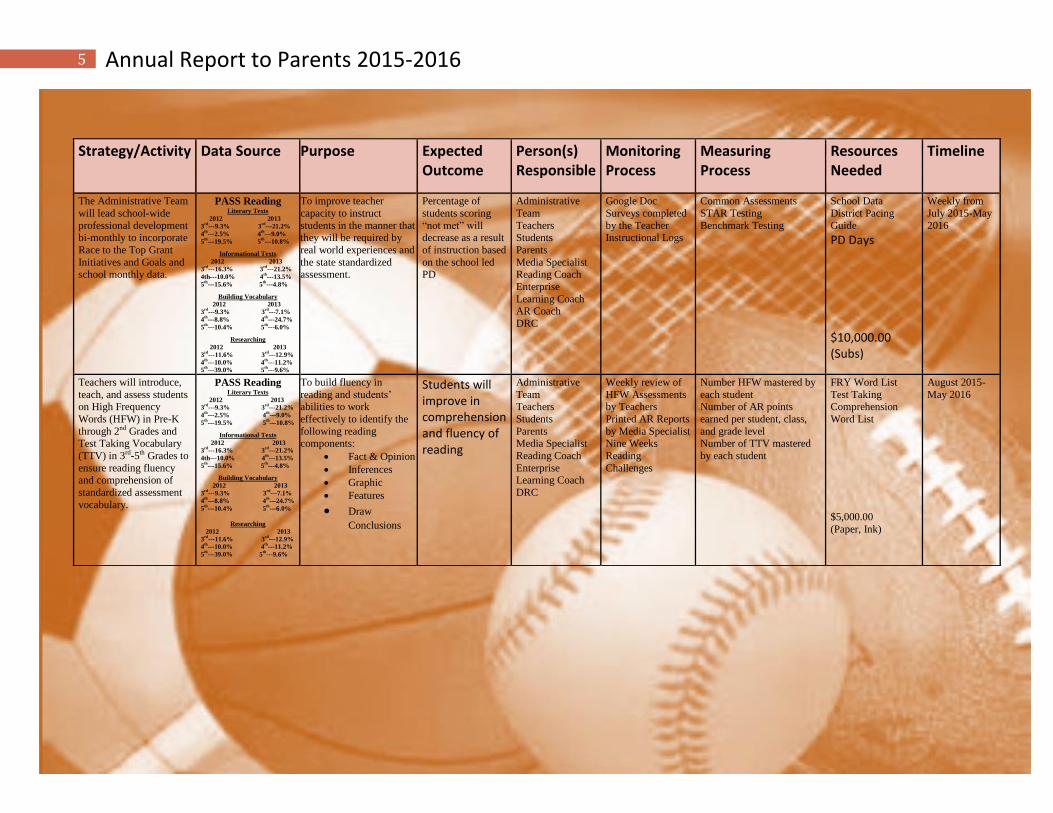
Strategy/Activity Data Source Purpose Expected Outcome
Person(s) Responsible
Monitoring Process
Measuring Process
Resources Needed
Timeline
The Administrative Team
will lead school-wide
professional development bi-monthly to incorporate
Race to the Top Grant
Initiatives and Goals and school monthly data.
PASS Reading Literary Texts
2012 2013
3rd
---9.3% 3rd
---21.2%
4th
---2.5% 4th
---9.0%
5th
---19.5% 5th
---10.8%
Informational Texts
2012 2013
3rd
---16.3% 3rd
---21.2%
4th---10.0% 4th
---13.5%
5th
---15.6% 5th
---4.8%
Building Vocabulary
2012 2013
3rd
---9.3% 3rd
---7.1%
4th
---8.8% 4th
---24.7%
5th
---10.4% 5th
---6.0%
Researching
2012 2013
3rd
---11.6% 3rd
---12.9%
4th
---10.0% 4th
---11.2%
5th
---39.0% 5th
---9.6%
To improve teacher
capacity to instruct
students in the manner that they will be required by
real world experiences and
the state standardized assessment.
Percentage of
students scoring
“not met” will decrease as a result
of instruction based
on the school led PD
Administrative
Team
Teachers Students
Parents
Media Specialist Reading Coach
Enterprise
Learning Coach AR Coach
DRC
Google Doc
Surveys completed
by the Teacher Instructional Logs
Common Assessments
STAR Testing
Benchmark Testing
School Data
District Pacing
Guide
PD Days $10,000.00 (Subs)
Weekly from
July 2015-May
2016
Teachers will introduce,
teach, and assess students on High Frequency
Words (HFW) in Pre-K
through 2nd Grades and
Test Taking Vocabulary
(TTV) in 3rd-5th Grades to
ensure reading fluency and comprehension of
standardized assessment
vocabulary.
PASS Reading Literary Texts
2012 2013
3rd
---9.3% 3rd
---21.2%
4th
---2.5% 4th
---9.0%
5th
---19.5% 5th
---10.8%
Informational Texts
2012 2013
3rd
---16.3% 3rd
---21.2%
4th---10.0% 4th
---13.5%
5th
---15.6% 5th
---4.8%
Building Vocabulary
2012 2013
3rd
---9.3% 3rd
---7.1%
4th
---8.8% 4th
---24.7%
5th
---10.4% 5th
---6.0%
Researching
2012 2013
3rd
---11.6% 3rd
---12.9%
4th
---10.0% 4th
---11.2%
5th
---39.0% 5th
---9.6%
To build fluency in
reading and students’ abilities to work
effectively to identify the
following reading
components:
Fact & Opinion
Inferences
Graphic
Features
Draw
Conclusions
Students will improve in comprehension and fluency of reading
Administrative
Team Teachers
Students
Parents
Media Specialist
Reading Coach
Enterprise Learning Coach
DRC
Weekly review of
HFW Assessments by Teachers
Printed AR Reports
by Media Specialist
Nine Weeks
Reading
Challenges
Number HFW mastered by
each student Number of AR points
earned per student, class,
and grade level
Number of TTV mastered
by each student
FRY Word List
Test Taking Comprehension
Word List
$5,000.00
(Paper, Ink)
August 2015-
May 2016
6 Annual Report to Parents 2015-2016
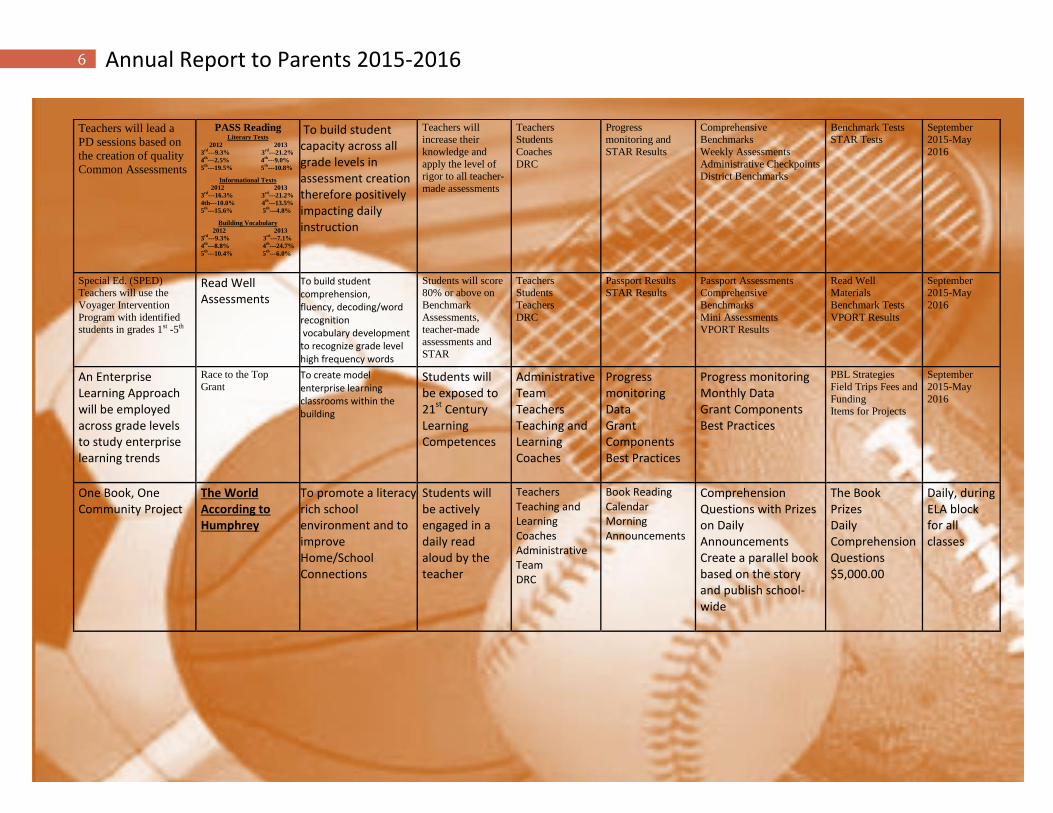
Teachers will lead a
PD sessions based on
the creation of quality
Common Assessments
PASS Reading Literary Texts
2012 2013
3rd
---9.3% 3rd
---21.2%
4th
---2.5% 4th
---9.0%
5th
---19.5% 5th
---10.8%
Informational Texts
2012 2013
3rd
---16.3% 3rd
---21.2%
4th---10.0% 4th
---13.5%
5th
---15.6% 5th
---4.8%
Building Vocabulary
2012 2013
3rd
---9.3% 3rd
---7.1%
4th
---8.8% 4th
---24.7%
5th
---10.4% 5th
---6.0%
To build student capacity across all grade levels in assessment creation therefore positively impacting daily instruction
Teachers will increase their
knowledge and
apply the level of rigor to all teacher-
made assessments
Teachers Students
Coaches
DRC
Progress monitoring and
STAR Results
Comprehensive Benchmarks
Weekly Assessments
Administrative Checkpoints District Benchmarks
Benchmark Tests STAR Tests
September 2015-May
2016
Special Ed. (SPED) Teachers will use the
Voyager Intervention
Program with identified students in grades 1st -5th
Read Well Assessments
To build student comprehension, fluency, decoding/word recognition vocabulary development to recognize grade level high frequency words
Students will score 80% or above on
Benchmark
Assessments, teacher-made
assessments and
STAR
Teachers Students
Teachers
DRC
Passport Results STAR Results
Passport Assessments Comprehensive
Benchmarks
Mini Assessments VPORT Results
Read Well Materials
Benchmark Tests
VPORT Results
September 2015-May
2016
An Enterprise Learning Approach will be employed across grade levels to study enterprise learning trends
Race to the Top
Grant To create model enterprise learning classrooms within the building
Students will be exposed to 21
st Century
Learning Competences
Administrative Team Teachers Teaching and Learning Coaches
Progress monitoring Data Grant Components Best Practices
Progress monitoring Monthly Data Grant Components Best Practices
PBL Strategies
Field Trips Fees and
Funding Items for Projects
September
2015-May
2016
One Book, One Community Project
The World According to Humphrey
To promote a literacy rich school environment and to improve Home/School Connections
Students will be actively engaged in a daily read aloud by the teacher
Teachers Teaching and Learning Coaches Administrative Team DRC
Book Reading Calendar Morning Announcements
Comprehension Questions with Prizes on Daily Announcements Create a parallel book based on the story and publish school-wide
The Book Prizes Daily Comprehension Questions $5,000.00
Daily, during ELA block for all classes
7 Annual Report to Parents 2015-2016
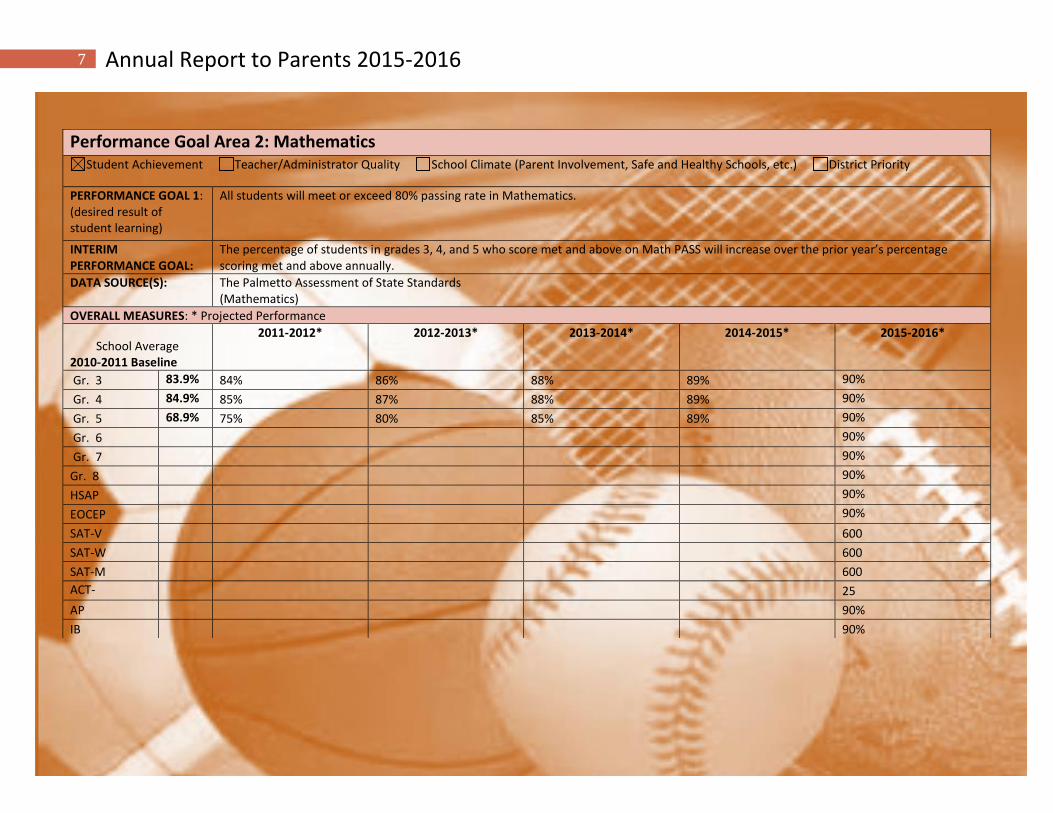
Performance Goal Area 2: Mathematics Student Achievement Teacher/Administrator Quality School Climate (Parent Involvement, Safe and Healthy Schools, etc.) District Priority
PERFORMANCE GOAL 1: (desired result of student learning)
All students will meet or exceed 80% passing rate in Mathematics.
INTERIM PERFORMANCE GOAL:
The percentage of students in grades 3, 4, and 5 who score met and above on Math PASS will increase over the prior year’s percentage scoring met and above annually.
DATA SOURCE(S): The Palmetto Assessment of State Standards (Mathematics)
OVERALL MEASURES: * Projected Performance
School Average 2010-2011 Baseline
2011-2012* 2012-2013* 2013-2014* 2014-2015* 2015-2016*
Gr. 3 83.9% 84% 86% 88% 89% 90%
Gr. 4 84.9% 85% 87% 88% 89% 90%
Gr. 5 68.9% 75% 80% 85% 89% 90%
Gr. 6 90%
Gr. 7 90%
Gr. 8 90%
HSAP 90%
EOCEP 90%
SAT-V 600
SAT-W 600
SAT-M 600
ACT-Composite
25
AP 90%
IB 90%
8 Annual Report to Parents 2015-2016
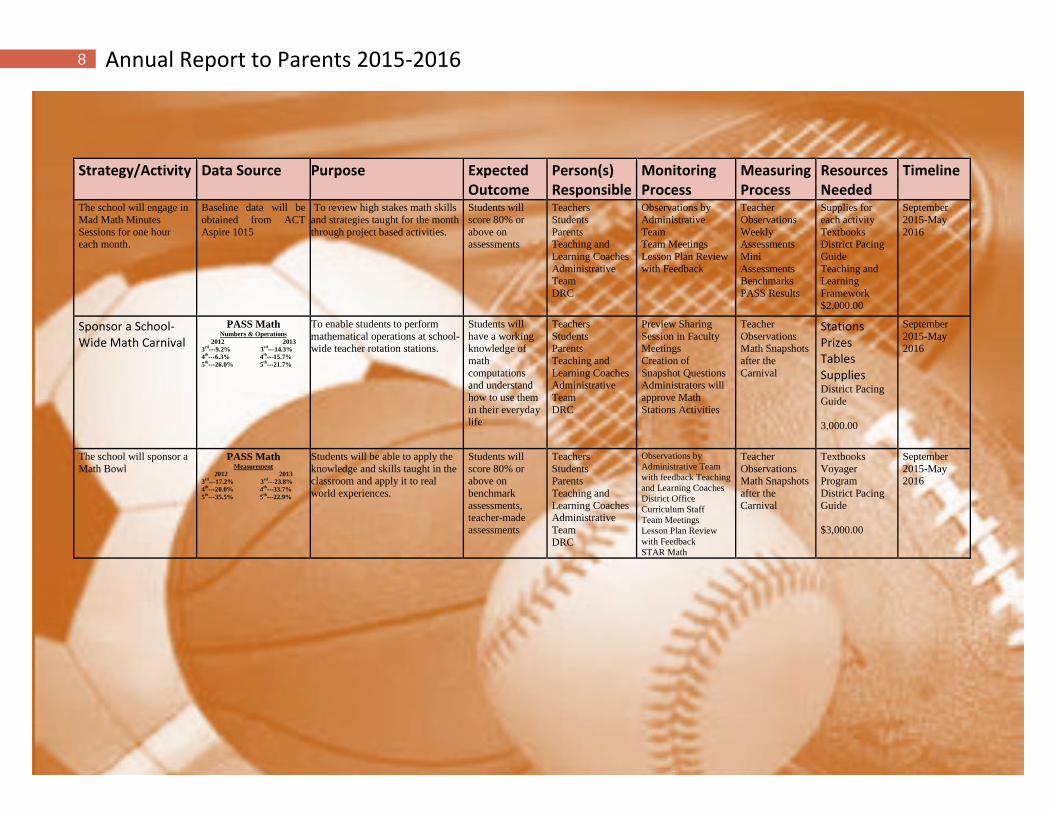
Strategy/Activity Data Source Purpose Expected Outcome
Person(s) Responsible
Monitoring Process
Measuring Process
Resources Needed
Timeline
The school will engage in
Mad Math Minutes
Sessions for one hour each month.
Baseline data will be
obtained from ACT
Aspire 1015
To review high stakes math skills
and strategies taught for the month
through project based activities.
Students will
score 80% or
above on assessments
Teachers
Students
Parents Teaching and
Learning Coaches
Administrative Team
DRC
Observations by
Administrative
Team Team Meetings
Lesson Plan Review
with Feedback
Teacher
Observations
Weekly Assessments
Mini
Assessments Benchmarks
PASS Results
Supplies for
each activity
Textbooks District Pacing
Guide
Teaching and Learning
Framework
$2,000.00
September
2015-May
2016
Sponsor a School-Wide Math Carnival
PASS Math Numbers & Operations
2012 2013
3rd
---9.2% 3rd
---14.3%
4th
---6.3% 4th
---15.7%
5th
---26.0% 5th
---21.7%
To enable students to perform
mathematical operations at school-wide teacher rotation stations.
Students will
have a working knowledge of
math
computations and understand
how to use them
in their everyday life
Teachers
Students Parents
Teaching and
Learning Coaches Administrative
Team
DRC
Preview Sharing
Session in Faculty Meetings
Creation of
Snapshot Questions Administrators will
approve Math
Stations Activities
Teacher
Observations Math Snapshots
after the
Carnival
Stations Prizes Tables Supplies
District Pacing
Guide
3,000.00
September
2015-May 2016
The school will sponsor a
Math Bowl PASS Math
Measurement
2012 2013
3rd
---17.2% 3rd
---23.8%
4th
---20.0% 4th
---33.7%
5th
---35.5% 5th
---22.9%
Students will be able to apply the
knowledge and skills taught in the classroom and apply it to real
world experiences.
Students will
score 80% or above on
benchmark
assessments, teacher-made
assessments
Teachers
Students Parents
Teaching and
Learning Coaches Administrative
Team
DRC
Observations by
Administrative Team
with feedback Teaching
and Learning Coaches
District Office
Curriculum Staff
Team Meetings
Lesson Plan Review
with Feedback
STAR Math
Teacher
Observations Math Snapshots
after the
Carnival
Textbooks
Voyager Program
District Pacing
Guide
$3,000.00
September
2015-May 2016
9 Annual Report to Parents 2015-2016
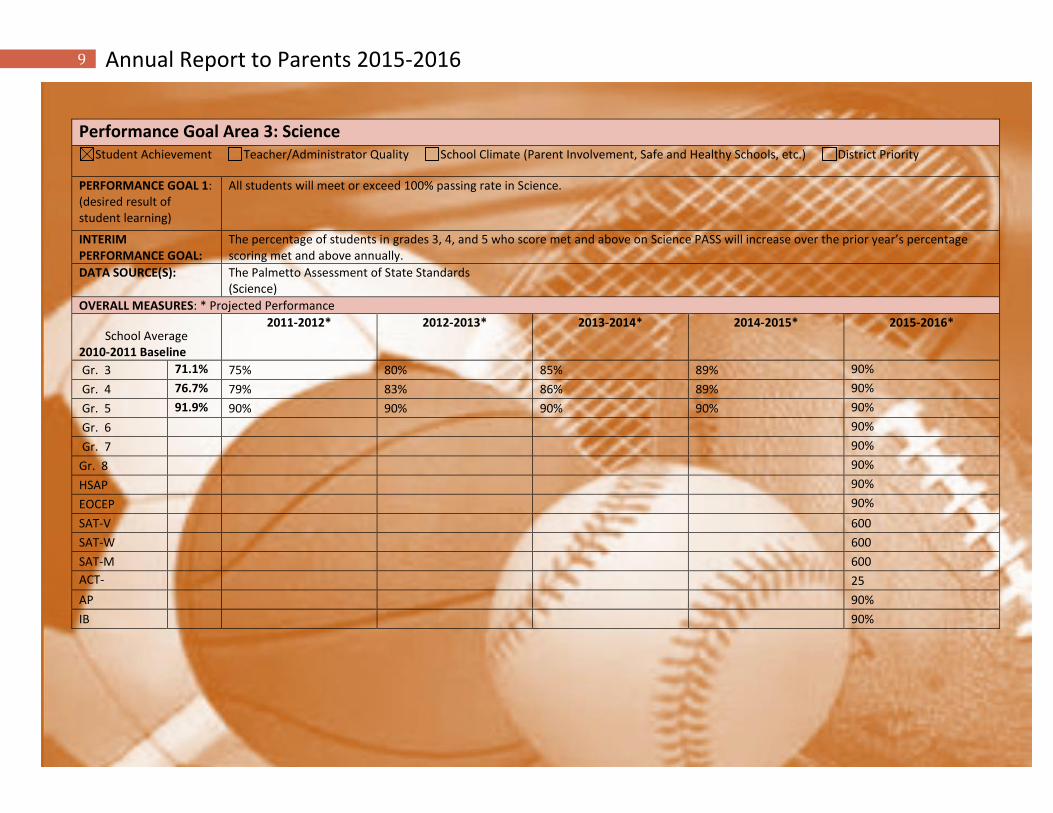
Performance Goal Area 3: Science Student Achievement Teacher/Administrator Quality School Climate (Parent Involvement, Safe and Healthy Schools, etc.) District Priority
PERFORMANCE GOAL 1: (desired result of student learning)
All students will meet or exceed 100% passing rate in Science.
INTERIM PERFORMANCE GOAL:
The percentage of students in grades 3, 4, and 5 who score met and above on Science PASS will increase over the prior year’s percentage scoring met and above annually.
DATA SOURCE(S): The Palmetto Assessment of State Standards (Science)
OVERALL MEASURES: * Projected Performance
School Average 2010-2011 Baseline
2011-2012* 2012-2013* 2013-2014* 2014-2015* 2015-2016*
Gr. 3 71.1% 75% 80% 85% 89% 90%
Gr. 4 76.7% 79% 83% 86% 89% 90%
Gr. 5 91.9% 90% 90% 90% 90% 90%
Gr. 6 90%
Gr. 7 90%
Gr. 8 90%
HSAP 90%
EOCEP 90%
SAT-V 600
SAT-W 600
SAT-M 600
ACT-Composite
25
AP 90%
IB 90%
10 Annual Report to Parents 2015-2016
Strategy/Activity Data Source Purpose Expected Outcome
Person(s) Responsible
Monitoring Process
Measuring Process
Resources Needed
Timeline
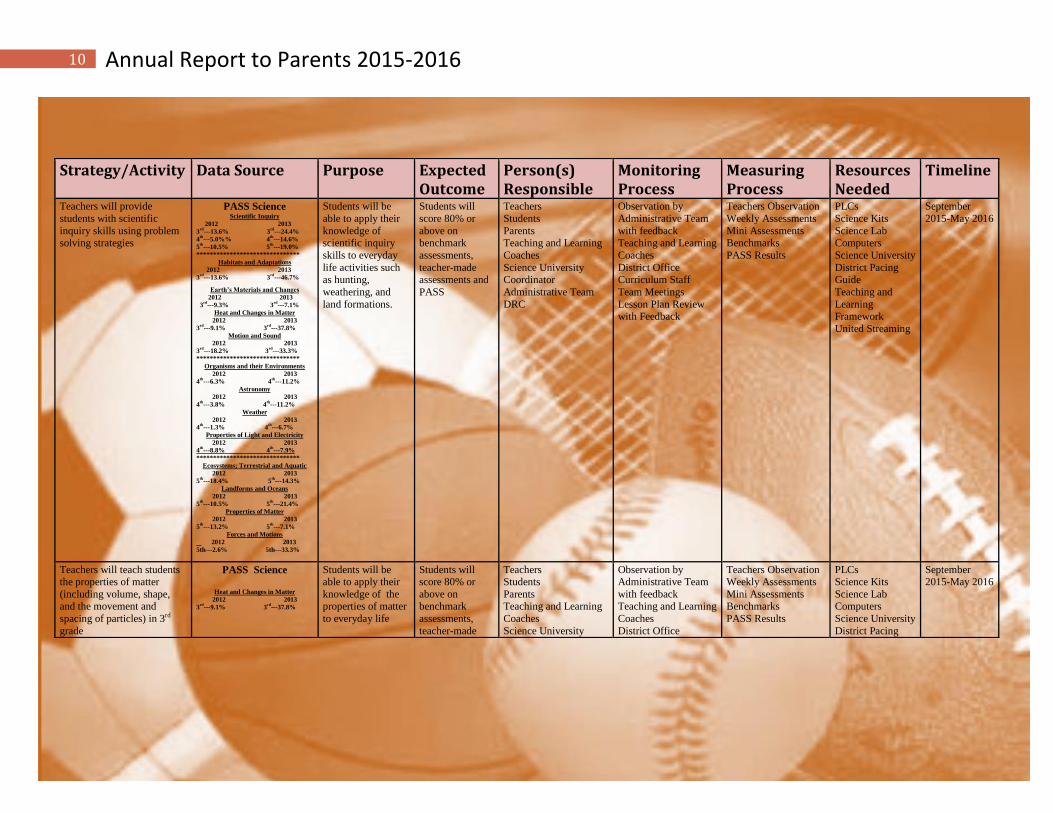
Teachers will provide
students with scientific
inquiry skills using problem solving strategies
PASS Science Scientific Inquiry
2012 2013
3rd
---13.6% 3rd
---24.4%
4th
---5.0%% 4th
---14.6%
5th
---10.5% 5th
---19.0%
*******************************
Habitats and Adaptations
2012 2013
3rd
---13.6% 3rd
---46.7%
Earth’s Materials and Changes
2012 2013
3rd
---9.3% 3rd
---7.1%
Heat and Changes in Matter
2012 2013
3rd
---9.1% 3rd
---37.8%
Motion and Sound
2012 2013
3rd
---18.2% 3rd
---33.3%
*******************************
Organisms and their Environments
2012 2013
4th
---6.3% 4th
---11.2%
Astronomy
2012 2013
4th
---3.8% 4th
---11.2%
Weather
2012 2013
4th
---1.3% 4th
---6.7%
Properties of Light and Electricity
2012 2013
4th
---8.8% 4th
---7.9%
*******************************
Ecosystems; Terrestrial and Aquatic
2012 2013
5th
---18.4% 5th
---14.3%
Landforms and Oceans
2012 2013
5th
---10.5% 5th
---21.4%
Properties of Matter
2012 2013
5th
---13.2% 5th
---7.1%
Forces and Motions
2012 2013
5th---2.6% 5th---33.3%
Students will be
able to apply their
knowledge of scientific inquiry
skills to everyday
life activities such as hunting,
weathering, and
land formations.
Students will
score 80% or
above on benchmark
assessments,
teacher-made assessments and
PASS
Teachers
Students
Parents Teaching and Learning
Coaches
Science University Coordinator
Administrative Team
DRC
Observation by
Administrative Team
with feedback Teaching and Learning
Coaches
District Office Curriculum Staff
Team Meetings
Lesson Plan Review with Feedback
Teachers Observation
Weekly Assessments
Mini Assessments Benchmarks
PASS Results
PLCs
Science Kits
Science Lab Computers
Science University
District Pacing Guide
Teaching and
Learning Framework
United Streaming
September
2015-May 2016
Teachers will teach students the properties of matter
(including volume, shape, and the movement and
spacing of particles) in 3rd
grade
PASS Science
Heat and Changes in Matter
2012 2013
3rd
---9.1% 3rd
---37.8%
Students will be able to apply their
knowledge of the properties of matter
to everyday life
Students will score 80% or
above on benchmark
assessments,
teacher-made
Teachers Students
Parents Teaching and Learning
Coaches
Science University
Observation by Administrative Team
with feedback Teaching and Learning
Coaches
District Office
Teachers Observation Weekly Assessments
Mini Assessments Benchmarks
PASS Results
PLCs Science Kits
Science Lab Computers
Science University
District Pacing
September 2015-May 2016
11 Annual Report to Parents 2015-2016
assessments and PASS
Coordinator Administrative Team
DRC
Curriculum Staff Team Meetings
Lesson Plan Review
with Feedback
Guide Teaching and
Learning
Framework United Streaming
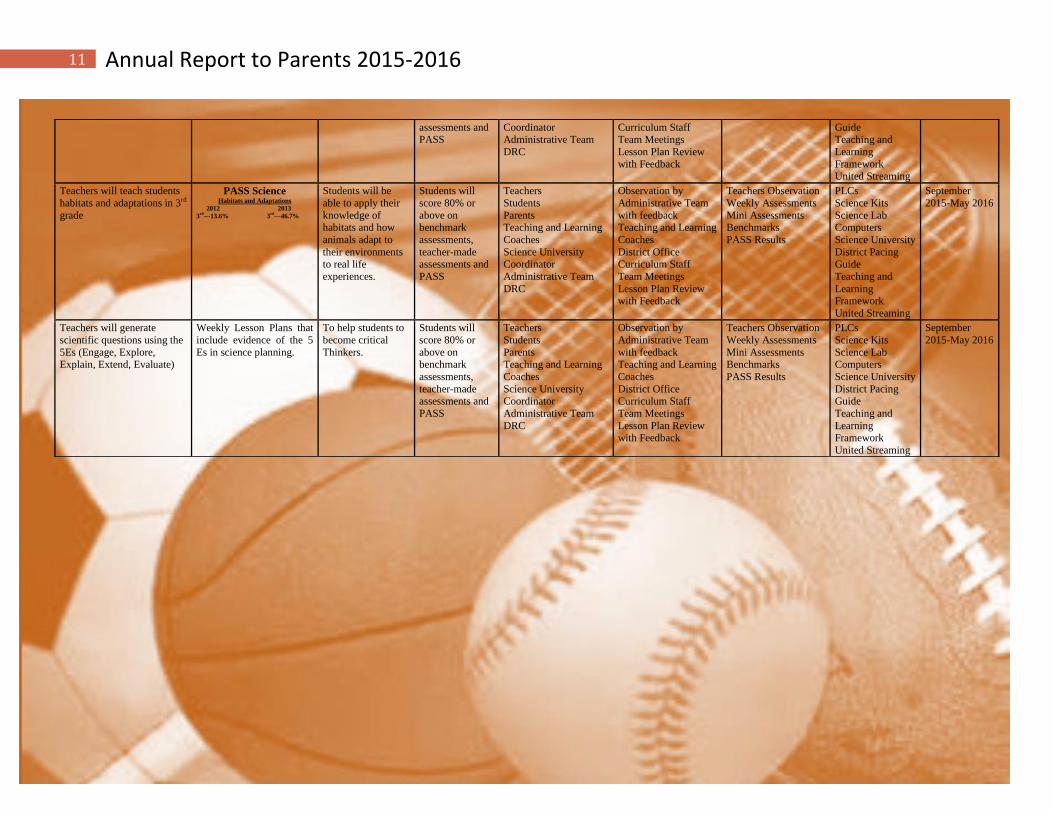
Teachers will teach students
habitats and adaptations in 3rd
grade
PASS Science Habitats and Adaptations
2012 2013
3rd
---13.6% 3rd
---46.7%
Students will be
able to apply their
knowledge of habitats and how
animals adapt to
their environments
to real life
experiences.
Students will
score 80% or
above on benchmark
assessments,
teacher-made
assessments and
PASS
Teachers
Students
Parents Teaching and Learning
Coaches
Science University
Coordinator
Administrative Team
DRC
Observation by
Administrative Team
with feedback Teaching and Learning
Coaches
District Office
Curriculum Staff
Team Meetings
Lesson Plan Review with Feedback
Teachers Observation
Weekly Assessments
Mini Assessments Benchmarks
PASS Results
PLCs
Science Kits
Science Lab Computers
Science University
District Pacing
Guide
Teaching and
Learning Framework
United Streaming
September
2015-May 2016
Teachers will generate
scientific questions using the
5Es (Engage, Explore, Explain, Extend, Evaluate)
Weekly Lesson Plans that
include evidence of the 5
Es in science planning.
To help students to
become critical
Thinkers.
Students will
score 80% or
above on benchmark
assessments,
teacher-made assessments and
PASS
Teachers
Students
Parents Teaching and Learning
Coaches
Science University Coordinator
Administrative Team
DRC
Observation by
Administrative Team
with feedback Teaching and Learning
Coaches
District Office Curriculum Staff
Team Meetings
Lesson Plan Review
with Feedback
Teachers Observation
Weekly Assessments
Mini Assessments Benchmarks
PASS Results
PLCs
Science Kits
Science Lab Computers
Science University
District Pacing Guide
Teaching and
Learning
Framework
United Streaming
September
2015-May 2016
12 Annual Report to Parents 2015-2016
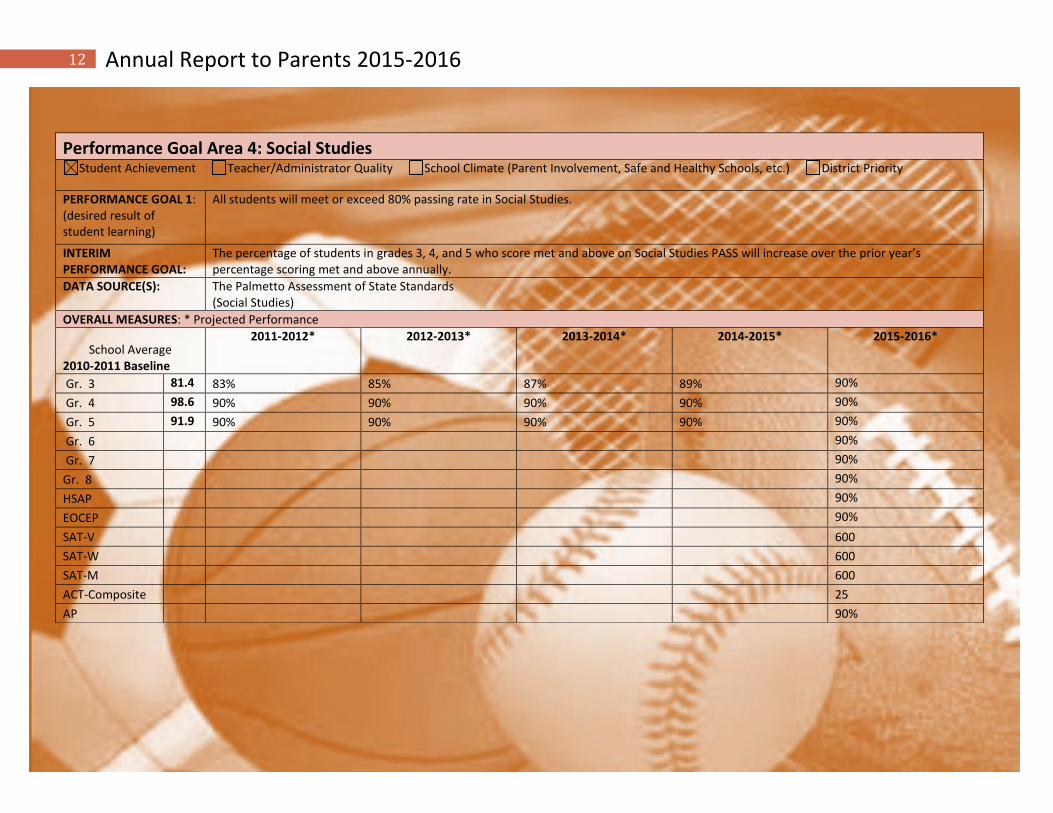
Performance Goal Area 4: Social Studies Student Achievement Teacher/Administrator Quality School Climate (Parent Involvement, Safe and Healthy Schools, etc.) District Priority
PERFORMANCE GOAL 1: (desired result of student learning)
All students will meet or exceed 80% passing rate in Social Studies.
INTERIM PERFORMANCE GOAL:
The percentage of students in grades 3, 4, and 5 who score met and above on Social Studies PASS will increase over the prior year’s percentage scoring met and above annually.
DATA SOURCE(S): The Palmetto Assessment of State Standards (Social Studies)
OVERALL MEASURES: * Projected Performance
School Average 2010-2011 Baseline
2011-2012* 2012-2013* 2013-2014* 2014-2015* 2015-2016*
Gr. 3 81.4 83% 85% 87% 89% 90%
Gr. 4 98.6 90% 90% 90% 90% 90%
Gr. 5 91.9 90% 90% 90% 90% 90%
Gr. 6 90%
Gr. 7 90%
Gr. 8 90%
HSAP 90%
EOCEP 90%
SAT-V 600
SAT-W 600
SAT-M 600
ACT-Composite 25
AP 90%
13 Annual Report to Parents 2015-2016
Strategy/Activity Data Source Purpose Expected Outcome
Person(s) Responsible
Monitoring Process
Measuring Process
Resources Needed
Timeline
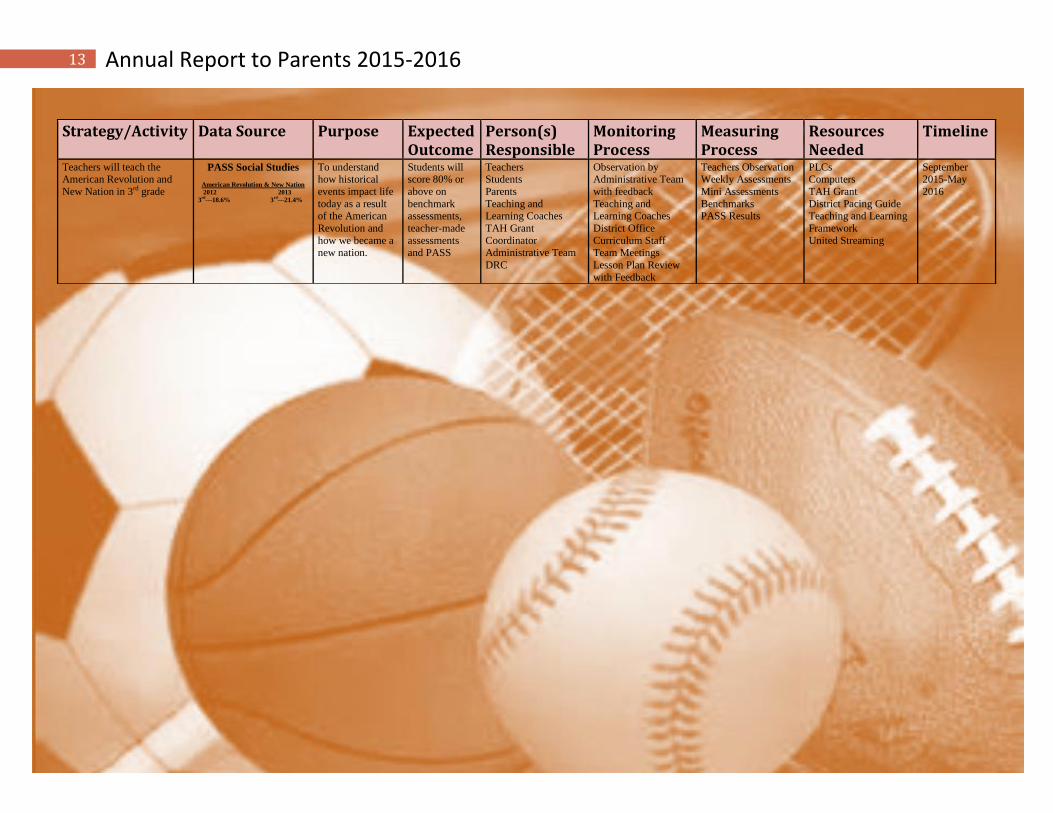
Teachers will teach the American Revolution and
New Nation in 3rd grade
PASS Social Studies
American Revolution & New Nation
2012 2013
3rd
---18.6% 3rd
---21.4%
To understand how historical
events impact life
today as a result of the American
Revolution and
how we became a new nation.
Students will score 80% or
above on
benchmark assessments,
teacher-made
assessments and PASS
Teachers Students
Parents
Teaching and Learning Coaches
TAH Grant
Coordinator Administrative Team
DRC
Observation by Administrative Team
with feedback
Teaching and Learning Coaches
District Office
Curriculum Staff Team Meetings
Lesson Plan Review
with Feedback
Teachers Observation Weekly Assessments
Mini Assessments
Benchmarks PASS Results
PLCs Computers
TAH Grant
District Pacing Guide Teaching and Learning
Framework
United Streaming
September 2015-May
2016
14 Annual Report to Parents 2015-2016
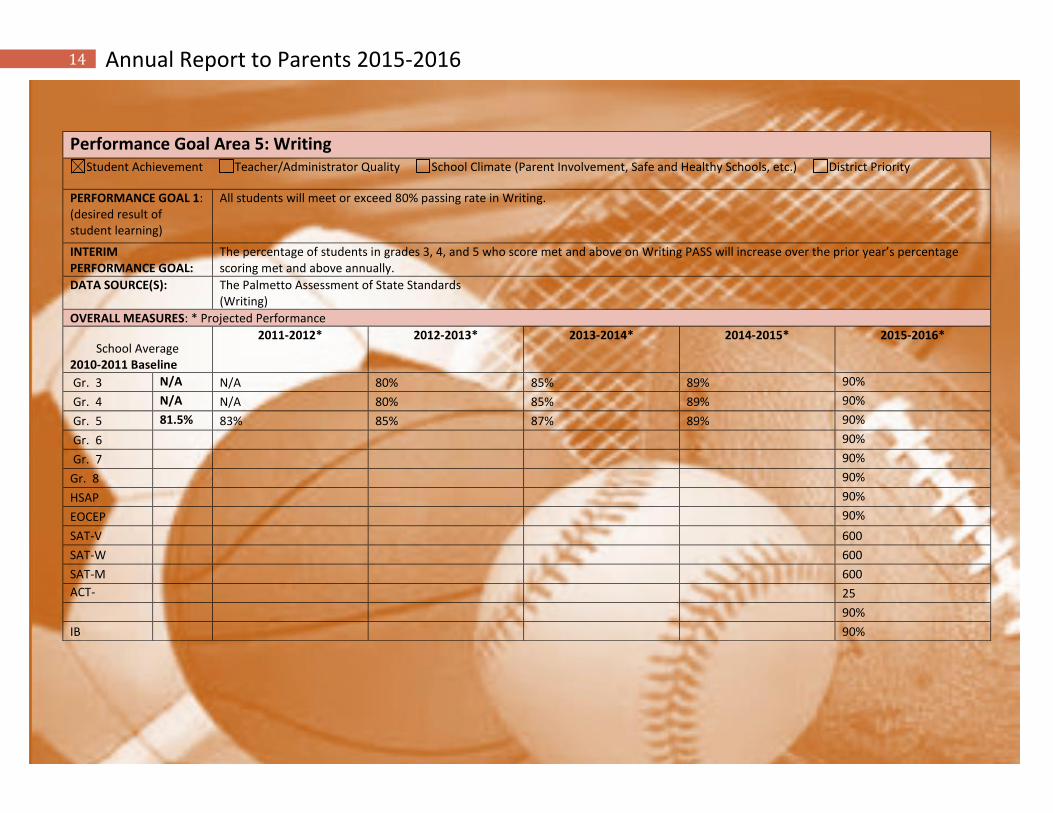
Performance Goal Area 5: Writing Student Achievement Teacher/Administrator Quality School Climate (Parent Involvement, Safe and Healthy Schools, etc.) District Priority
PERFORMANCE GOAL 1: (desired result of student learning)
All students will meet or exceed 80% passing rate in Writing.
INTERIM PERFORMANCE GOAL:
The percentage of students in grades 3, 4, and 5 who score met and above on Writing PASS will increase over the prior year’s percentage scoring met and above annually.
DATA SOURCE(S): The Palmetto Assessment of State Standards (Writing)
OVERALL MEASURES: * Projected Performance
School Average 2010-2011 Baseline
2011-2012* 2012-2013* 2013-2014* 2014-2015* 2015-2016*
Gr. 3 N/A N/A 80% 85% 89% 90%
Gr. 4 N/A N/A 80% 85% 89% 90%
Gr. 5 81.5% 83% 85% 87% 89% 90%
Gr. 6 90%
Gr. 7 90%
Gr. 8 90%
HSAP 90%
EOCEP 90%
SAT-V 600
SAT-W 600
SAT-M 600
ACT-Composite
25
90%
IB 90%
15 Annual Report to Parents 2015-2016
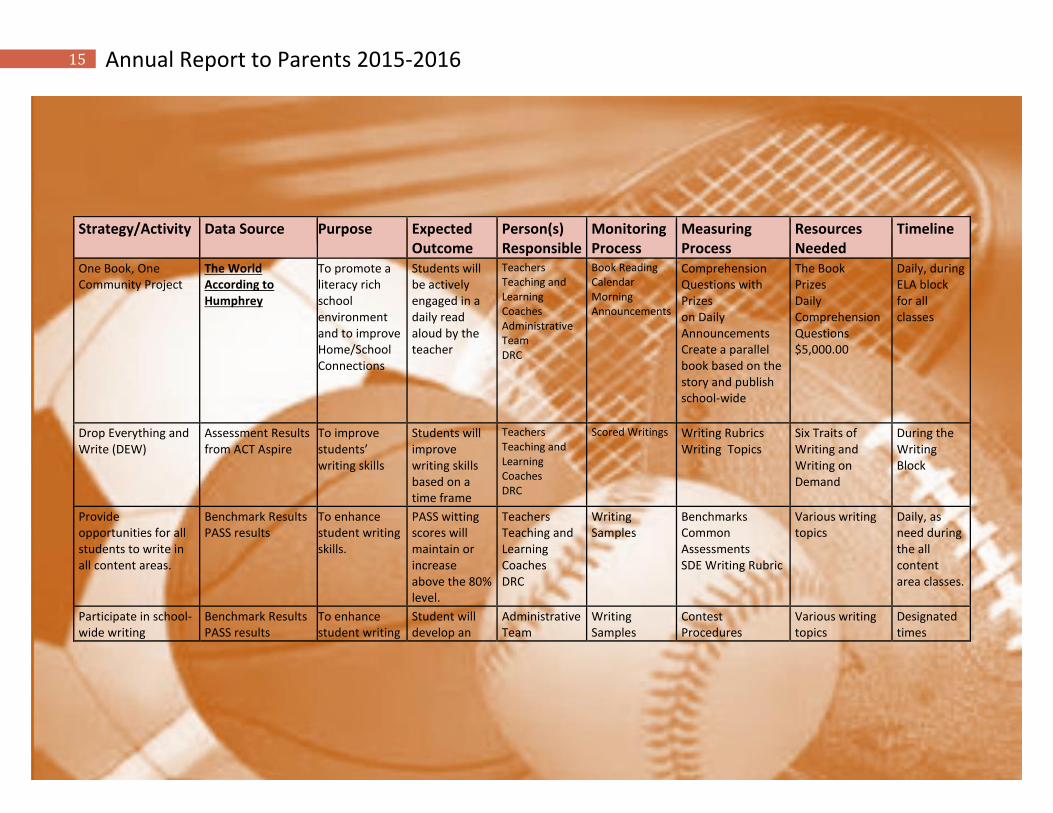
Strategy/Activity Data Source Purpose Expected Outcome
Person(s) Responsible
Monitoring Process
Measuring Process
Resources Needed
Timeline
One Book, One Community Project
The World According to Humphrey
To promote a literacy rich school environment and to improve Home/School Connections
Students will be actively engaged in a daily read aloud by the teacher
Teachers Teaching and Learning Coaches Administrative Team DRC
Book Reading Calendar Morning Announcements
Comprehension Questions with Prizes on Daily Announcements Create a parallel book based on the story and publish school-wide
The Book Prizes Daily Comprehension Questions $5,000.00
Daily, during ELA block for all classes
Drop Everything and Write (DEW)
Assessment Results from ACT Aspire
To improve students’ writing skills
Students will improve writing skills based on a time frame
Teachers Teaching and Learning Coaches DRC
Scored Writings Writing Rubrics Writing Topics
Six Traits of Writing and Writing on Demand
During the Writing Block
Provide opportunities for all students to write in all content areas.
Benchmark Results PASS results
To enhance student writing skills.
PASS witting scores will maintain or increase above the 80% level.
Teachers Teaching and Learning Coaches DRC
Writing Samples
Benchmarks Common Assessments SDE Writing Rubric
Various writing topics
Daily, as need during the all content area classes.
Participate in school-wide writing
Benchmark Results PASS results
To enhance student writing
Student will develop an
Administrative Team
Writing Samples
Contest Procedures
Various writing topics
Designated times
16 Annual Report to Parents 2015-2016
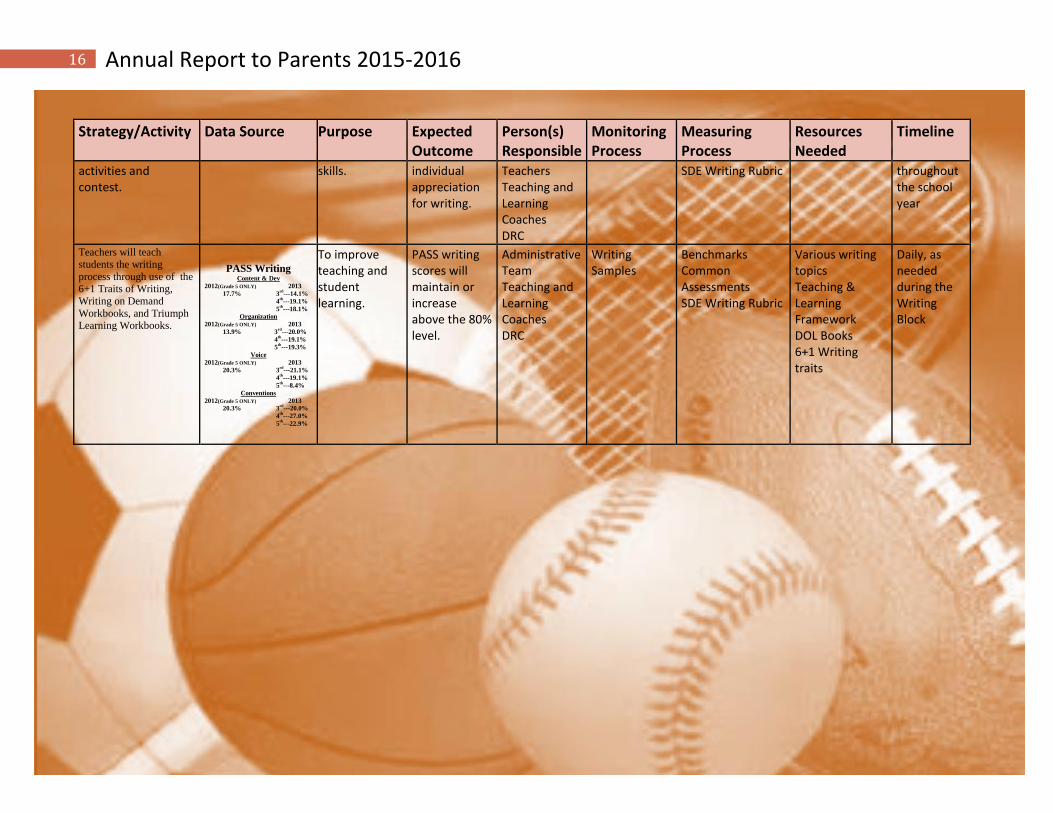
Strategy/Activity Data Source Purpose Expected Outcome
Person(s) Responsible
Monitoring Process
Measuring Process
Resources Needed
Timeline
activities and contest.
skills. individual appreciation for writing.
Teachers Teaching and Learning Coaches DRC
SDE Writing Rubric
throughout the school year
Teachers will teach
students the writing
process through use of the 6+1 Traits of Writing,
Writing on Demand
Workbooks, and Triumph Learning Workbooks.
PASS Writing
Content & Dev
2012(Grade 5 ONLY) 2013
17.7% 3rd
---14.1%
4th
---19.1%
5th
---18.1%
Organization
2012(Grade 5 ONLY) 2013
13.9% 3rd
---20.0%
4th
---19.1%
5th
---19.3%
Voice
2012(Grade 5 ONLY) 2013
20.3% 3rd
---21.1%
4th
---19.1%
5th
---8.4%
Conventions
2012(Grade 5 ONLY) 2013
20.3% 3rd
---20.0%
4th
---27.0%
5th
---22.9%
To improve teaching and student learning.
PASS writing scores will maintain or increase above the 80% level.
Administrative Team Teaching and Learning Coaches DRC
Writing Samples
Benchmarks Common Assessments SDE Writing Rubric
Various writing topics Teaching & Learning Framework DOL Books 6+1 Writing traits
Daily, as needed during the Writing Block
17 Annual Report to Parents 2015-2016
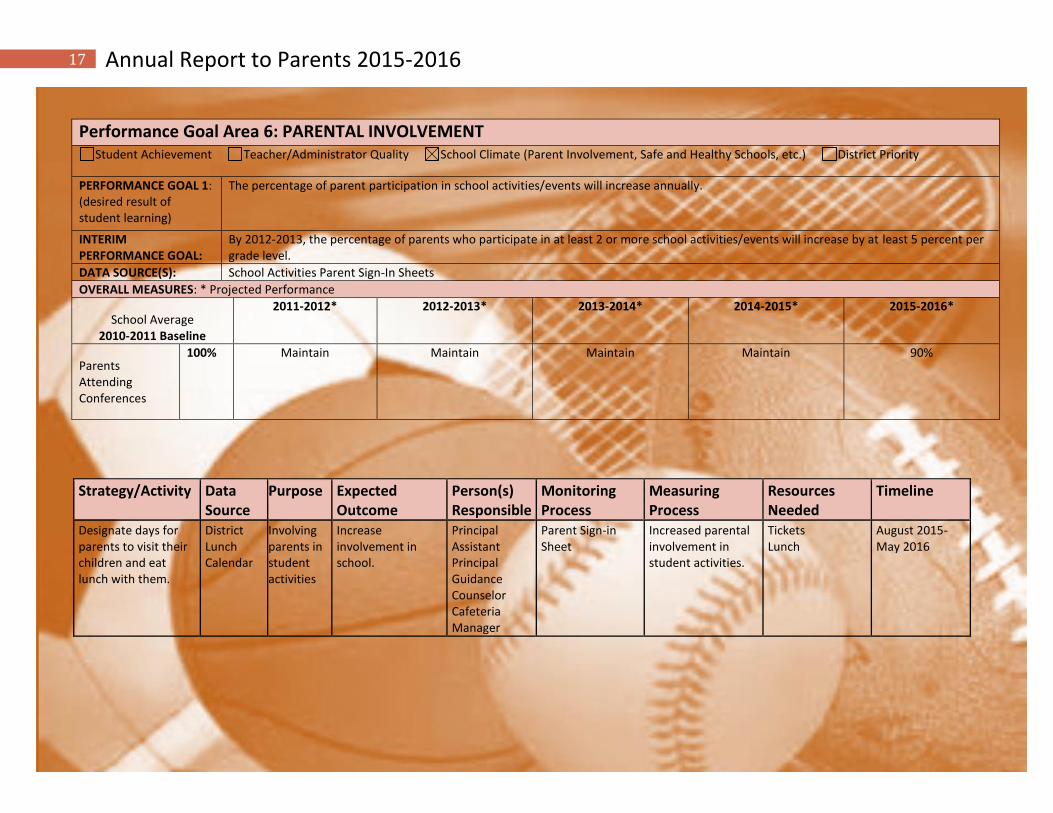
Performance Goal Area 6: PARENTAL INVOLVEMENT Student Achievement Teacher/Administrator Quality School Climate (Parent Involvement, Safe and Healthy Schools, etc.) District Priority
PERFORMANCE GOAL 1: (desired result of student learning)
The percentage of parent participation in school activities/events will increase annually.
INTERIM PERFORMANCE GOAL:
By 2012-2013, the percentage of parents who participate in at least 2 or more school activities/events will increase by at least 5 percent per grade level.
DATA SOURCE(S): School Activities Parent Sign-In Sheets
OVERALL MEASURES: * Projected Performance
School Average 2010-2011 Baseline
2011-2012* 2012-2013* 2013-2014* 2014-2015* 2015-2016*
Parents Attending Conferences
100% Maintain Maintain Maintain Maintain 90%
Strategy/Activity Data Source
Purpose Expected Outcome
Person(s) Responsible
Monitoring Process
Measuring Process
Resources Needed
Timeline
Designate days for parents to visit their children and eat lunch with them.
District Lunch Calendar
Involving parents in student activities
Increase involvement in school.
Principal Assistant Principal Guidance Counselor Cafeteria Manager
Parent Sign-in Sheet
Increased parental involvement in student activities.
Tickets Lunch
August 2015-May 2016
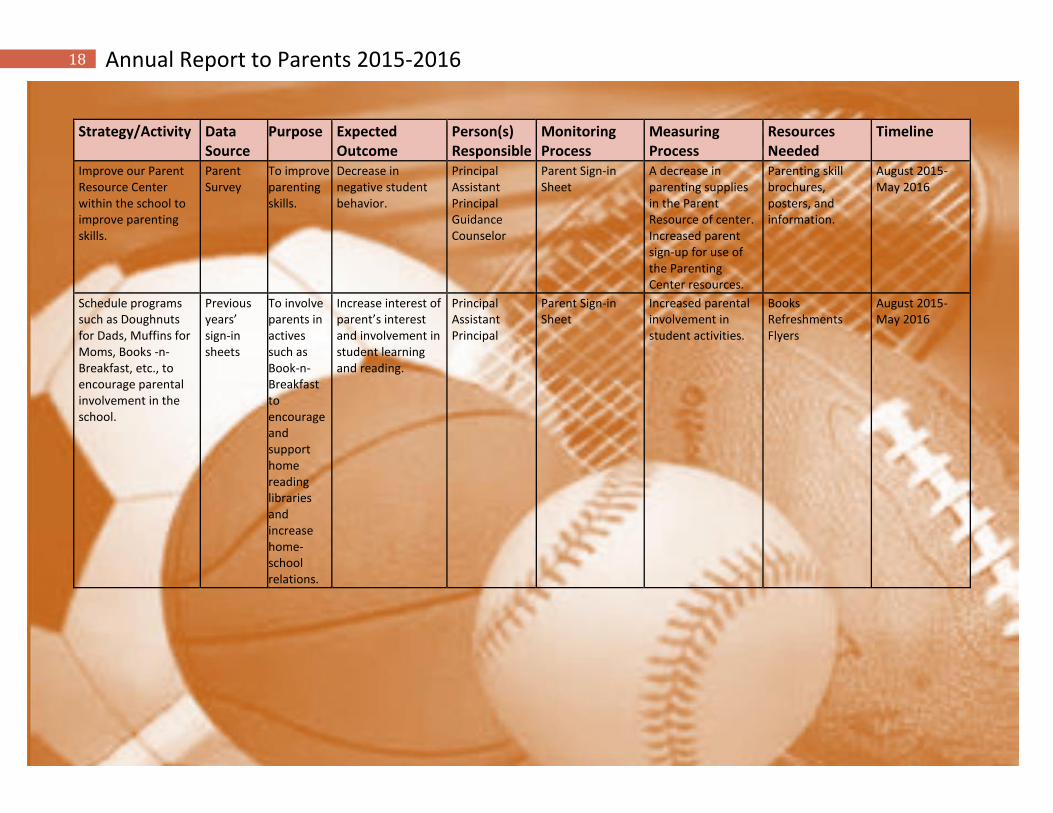
18 Annual Report to Parents 2015-2016
Strategy/Activity Data Source
Purpose Expected Outcome
Person(s) Responsible
Monitoring Process
Measuring Process
Resources Needed
Timeline
Improve our Parent Resource Center within the school to improve parenting skills.
Parent Survey
To improve parenting skills.
Decrease in negative student behavior.
Principal Assistant Principal Guidance Counselor
Parent Sign-in Sheet
A decrease in parenting supplies in the Parent Resource of center. Increased parent sign-up for use of the Parenting Center resources.
Parenting skill brochures, posters, and information.
August 2015-May 2016
Schedule programs such as Doughnuts for Dads, Muffins for Moms, Books -n-Breakfast, etc., to encourage parental involvement in the school.
Previous years’ sign-in sheets
To involve parents in actives such as Book-n-Breakfast to encourage and support home reading libraries and increase home-school relations.
Increase interest of parent’s interest and involvement in student learning and reading.
Principal Assistant Principal
Parent Sign-in Sheet
Increased parental involvement in student activities.
Books Refreshments Flyers
August 2015-May 2016
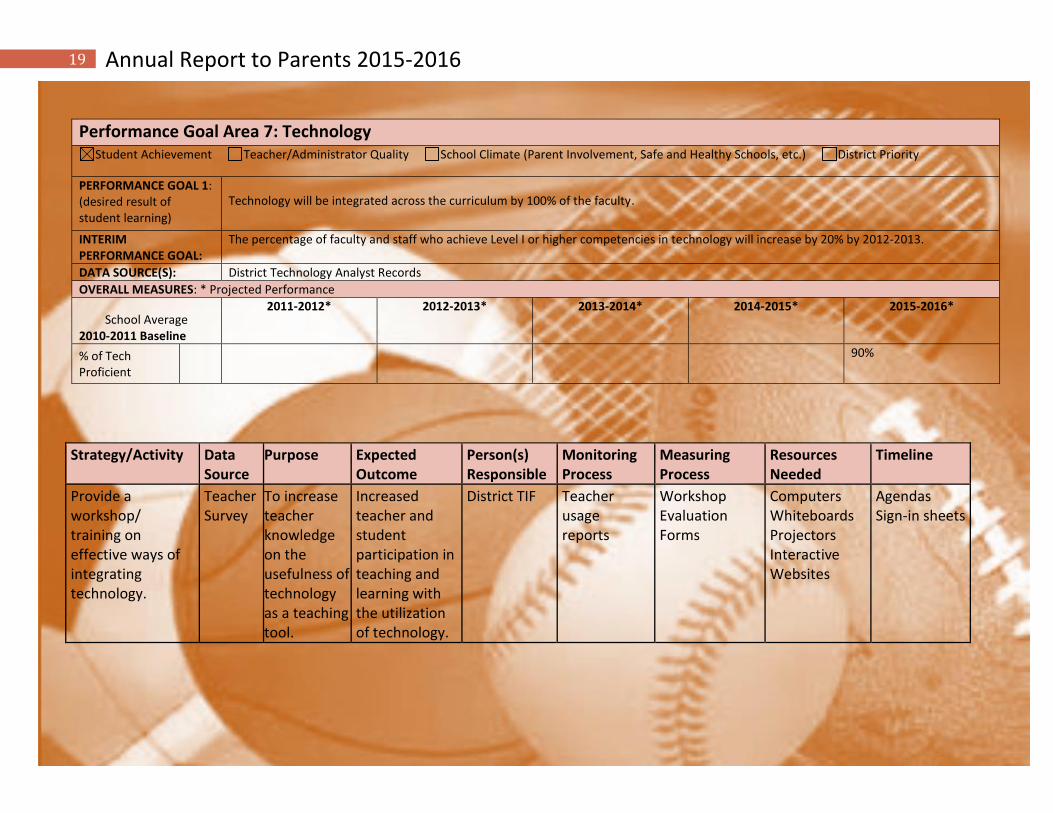
19 Annual Report to Parents 2015-2016
Performance Goal Area 7: Technology Student Achievement Teacher/Administrator Quality School Climate (Parent Involvement, Safe and Healthy Schools, etc.) District Priority
PERFORMANCE GOAL 1: (desired result of student learning)
Technology will be integrated across the curriculum by 100% of the faculty.
INTERIM PERFORMANCE GOAL:
The percentage of faculty and staff who achieve Level I or higher competencies in technology will increase by 20% by 2012-2013.
DATA SOURCE(S): District Technology Analyst Records
OVERALL MEASURES: * Projected Performance
School Average 2010-2011 Baseline
2011-2012* 2012-2013* 2013-2014* 2014-2015* 2015-2016*
% of Tech Proficient
90%
Strategy/Activity Data Source
Purpose Expected Outcome
Person(s) Responsible
Monitoring Process
Measuring Process
Resources Needed
Timeline
Provide a workshop/ training on effective ways of integrating technology.
Teacher Survey
To increase teacher knowledge on the usefulness of technology as a teaching tool.
Increased teacher and student participation in teaching and learning with the utilization of technology.
District TIF Teacher usage reports
Workshop Evaluation Forms
Computers Whiteboards Projectors Interactive Websites
Agendas Sign-in sheets
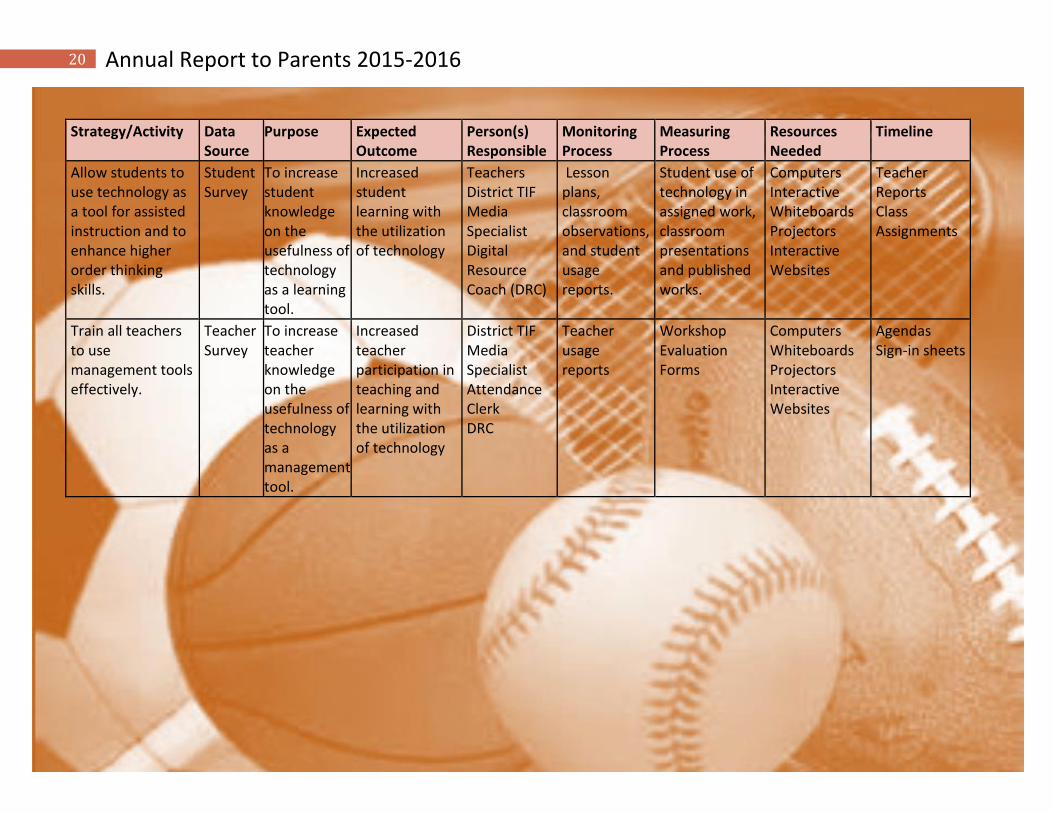
20 Annual Report to Parents 2015-2016
Strategy/Activity Data Source
Purpose Expected Outcome
Person(s) Responsible
Monitoring Process
Measuring Process
Resources Needed
Timeline
Allow students to use technology as a tool for assisted instruction and to enhance higher order thinking skills.
Student Survey
To increase student knowledge on the usefulness of technology as a learning tool.
Increased student learning with the utilization of technology
Teachers District TIF Media Specialist Digital Resource Coach (DRC)
Lesson plans, classroom observations, and student usage reports.
Student use of technology in assigned work, classroom presentations and published works.
Computers Interactive Whiteboards Projectors Interactive Websites
Teacher Reports Class Assignments
Train all teachers to use management tools effectively.
Teacher Survey
To increase teacher knowledge on the usefulness of technology as a management tool.
Increased teacher participation in teaching and learning with the utilization of technology
District TIF Media Specialist Attendance Clerk DRC
Teacher usage reports
Workshop Evaluation Forms
Computers Whiteboards Projectors Interactive Websites
Agendas Sign-in sheets
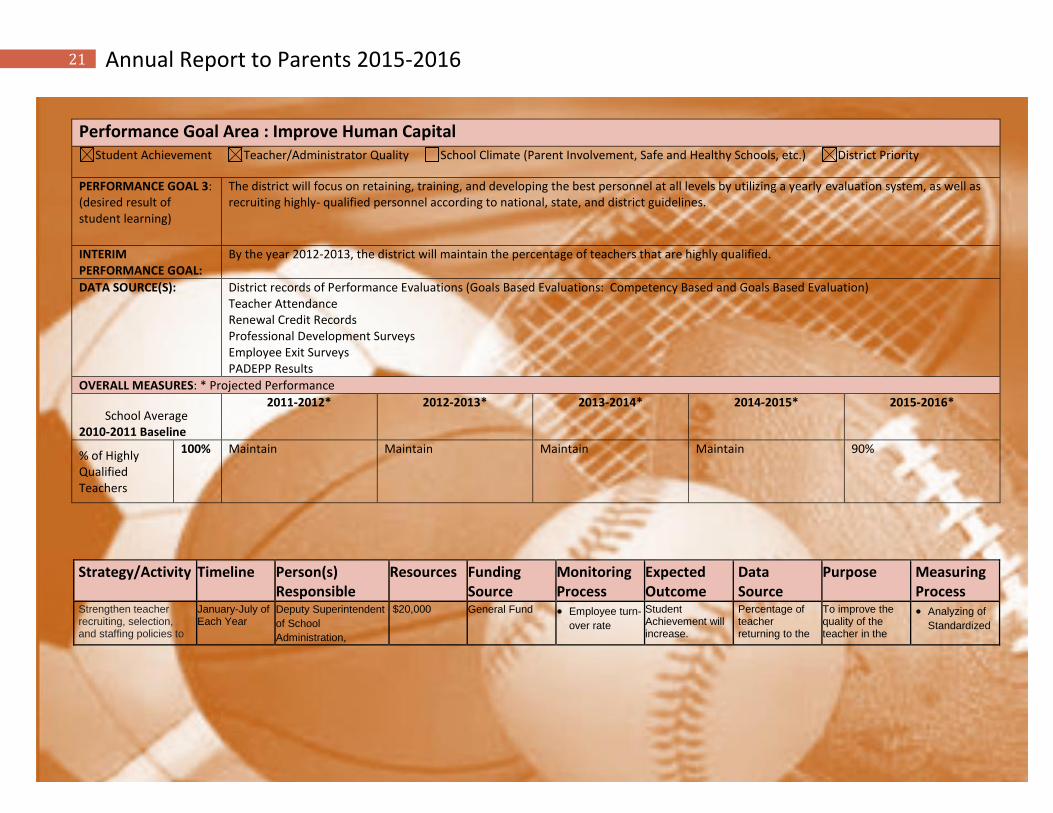
21 Annual Report to Parents 2015-2016
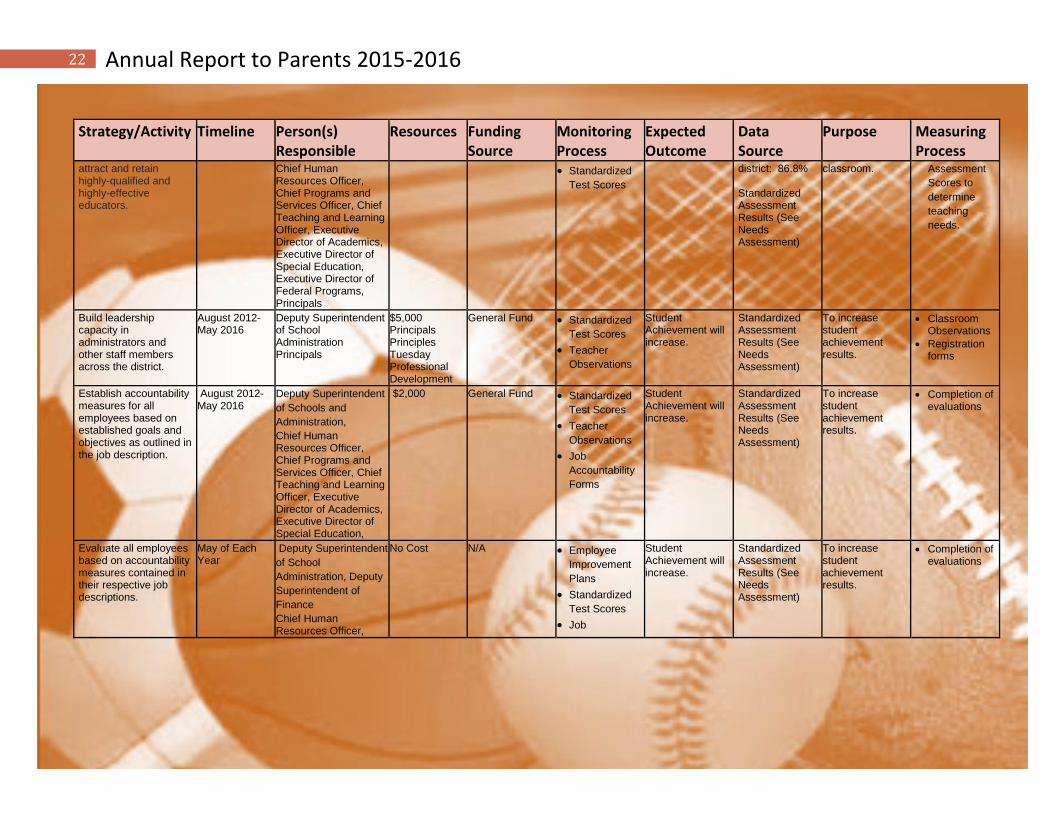
Performance Goal Area : Improve Human Capital Student Achievement Teacher/Administrator Quality School Climate (Parent Involvement, Safe and Healthy Schools, etc.) District Priority
PERFORMANCE GOAL 3: (desired result of student learning)
The district will focus on retaining, training, and developing the best personnel at all levels by utilizing a yearly evaluation system, as well as recruiting highly- qualified personnel according to national, state, and district guidelines.
INTERIM PERFORMANCE GOAL:
By the year 2012-2013, the district will maintain the percentage of teachers that are highly qualified.
DATA SOURCE(S): District records of Performance Evaluations (Goals Based Evaluations: Competency Based and Goals Based Evaluation) Teacher Attendance Renewal Credit Records Professional Development Surveys Employee Exit Surveys PADEPP Results
OVERALL MEASURES: * Projected Performance
School Average 2010-2011 Baseline
2011-2012* 2012-2013* 2013-2014* 2014-2015* 2015-2016*
% of Highly Qualified Teachers
100% Maintain Maintain Maintain Maintain 90%
Strategy/Activity Timeline Person(s) Responsible
Resources Funding Source
Monitoring Process
Expected Outcome
Data Source
Purpose Measuring Process
Strengthen teacher recruiting, selection, and staffing policies to
January-July of Each Year
Deputy Superintendent
of School
Administration,
$20,000 General Fund Employee turn-
over rate
Student Achievement will increase.
Percentage of teacher returning to the
To improve the quality of the teacher in the
Analyzing of
Standardized
22 Annual Report to Parents 2015-2016
Strategy/Activity Timeline Person(s) Responsible
Resources Funding Source
Monitoring Process
Expected Outcome
Data Source
Purpose Measuring Process
attract and retain highly-qualified and highly-effective educators.
Chief Human Resources Officer, Chief Programs and Services Officer, Chief Teaching and Learning Officer, Executive Director of Academics, Executive Director of Special Education, Executive Director of Federal Programs, Principals
Standardized
Test Scores
district: 86.8% Standardized Assessment Results (See Needs Assessment)
classroom. Assessment
Scores to
determine
teaching
needs.
Build leadership capacity in administrators and other staff members across the district.
August 2012-May 2016
Deputy Superintendent of School Administration Principals
$5,000 Principals Principles Tuesday Professional Development
General Fund Standardized
Test Scores
Teacher
Observations
Student Achievement will increase.
Standardized Assessment Results (See Needs Assessment)
To increase student achievement results.
Classroom Observations
Registration forms
Establish accountability measures for all employees based on established goals and objectives as outlined in the job description.
August 2012-May 2016
Deputy Superintendent
of Schools and
Administration,
Chief Human Resources Officer, Chief Programs and Services Officer, Chief Teaching and Learning Officer, Executive Director of Academics, Executive Director of Special Education,
$2,000 General Fund Standardized
Test Scores
Teacher
Observations
Job
Accountability
Forms
Student Achievement will increase.
Standardized Assessment Results (See Needs Assessment)
To increase student achievement results.
Completion of evaluations
Evaluate all employees based on accountability measures contained in their respective job descriptions.
May of Each Year
Deputy Superintendent
of School
Administration, Deputy
Superintendent of
Finance
Chief Human Resources Officer,
No Cost N/A Employee
Improvement
Plans
Standardized
Test Scores
Job
Student Achievement will increase.
Standardized Assessment Results (See Needs Assessment)
To increase student achievement results.
Completion of evaluations
23 Annual Report to Parents 2015-2016
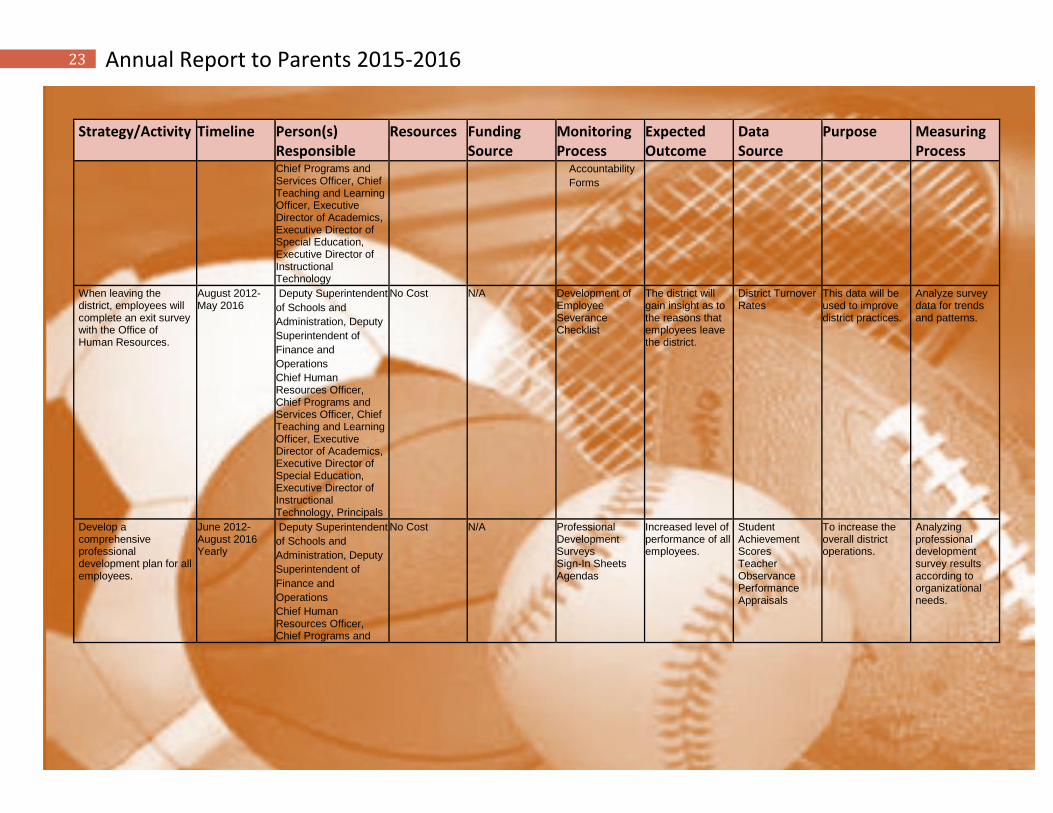
Strategy/Activity Timeline Person(s) Responsible
Resources Funding Source
Monitoring Process
Expected Outcome
Data Source
Purpose Measuring Process
Chief Programs and Services Officer, Chief Teaching and Learning Officer, Executive Director of Academics, Executive Director of Special Education, Executive Director of Instructional Technology
Accountability
Forms
When leaving the district, employees will complete an exit survey with the Office of Human Resources.
August 2012-May 2016
Deputy Superintendent
of Schools and
Administration, Deputy
Superintendent of
Finance and
Operations
Chief Human Resources Officer, Chief Programs and Services Officer, Chief Teaching and Learning Officer, Executive Director of Academics, Executive Director of Special Education, Executive Director of Instructional Technology, Principals
No Cost N/A Development of Employee Severance Checklist
The district will gain insight as to the reasons that employees leave the district.
District Turnover Rates
This data will be used to improve district practices.
Analyze survey data for trends and patterns.
Develop a comprehensive professional development plan for all employees.
June 2012-August 2016 Yearly
Deputy Superintendent
of Schools and
Administration, Deputy
Superintendent of
Finance and
Operations
Chief Human Resources Officer, Chief Programs and
No Cost N/A Professional Development Surveys Sign-In Sheets Agendas
Increased level of performance of all employees.
Student Achievement Scores Teacher Observance Performance Appraisals
To increase the overall district operations.
Analyzing professional development survey results according to organizational needs.
24 Annual Report to Parents 2015-2016
Strategy/Activity Timeline Person(s) Responsible
Resources Funding Source
Monitoring Process
Expected Outcome
Data Source
Purpose Measuring Process
Services Officer, Chief Teaching and Learning Officer, Executive Director of Academics, Executive Director of Special Education, Executive Director of Instructional Technology, Principals
25 Annual Report to Parents 2015-2016
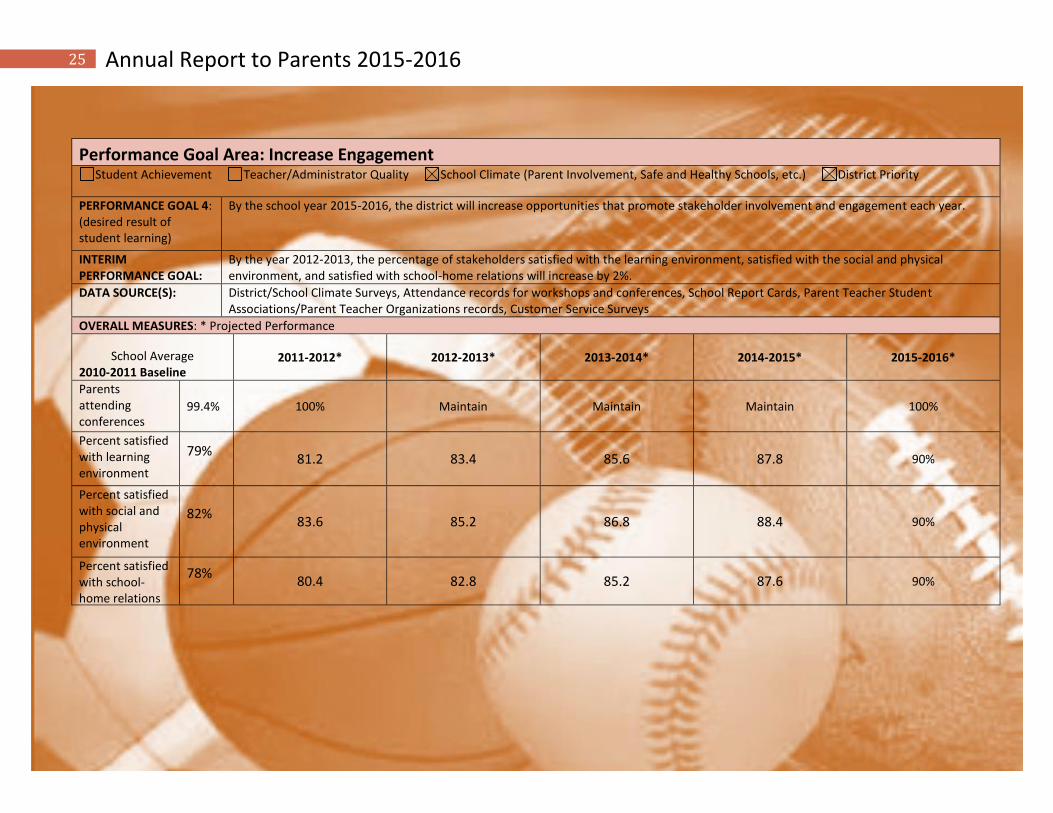
Performance Goal Area: Increase Engagement Student Achievement Teacher/Administrator Quality School Climate (Parent Involvement, Safe and Healthy Schools, etc.) District Priority
PERFORMANCE GOAL 4: (desired result of student learning)
By the school year 2015-2016, the district will increase opportunities that promote stakeholder involvement and engagement each year.
INTERIM PERFORMANCE GOAL:
By the year 2012-2013, the percentage of stakeholders satisfied with the learning environment, satisfied with the social and physical environment, and satisfied with school-home relations will increase by 2%.
DATA SOURCE(S): District/School Climate Surveys, Attendance records for workshops and conferences, School Report Cards, Parent Teacher Student Associations/Parent Teacher Organizations records, Customer Service Surveys
OVERALL MEASURES: * Projected Performance
School Average 2010-2011 Baseline
2011-2012* 2012-2013* 2013-2014* 2014-2015* 2015-2016*
Parents attending conferences
99.4% 100% Maintain Maintain Maintain 100%
Percent satisfied with learning environment
79%
81.2 83.4 85.6 87.8 90%
Percent satisfied with social and physical environment
82%
83.6 85.2 86.8 88.4 90%
Percent satisfied with school-home relations
78%
80.4 82.8 85.2 87.6 90%
26 Annual Report to Parents 2015-2016
Strategy/Activity Timeline Person(s) Responsible
Resources Funding Source
Monitoring Process
Expected Outcome
Data Source
Purpose Measuring Process
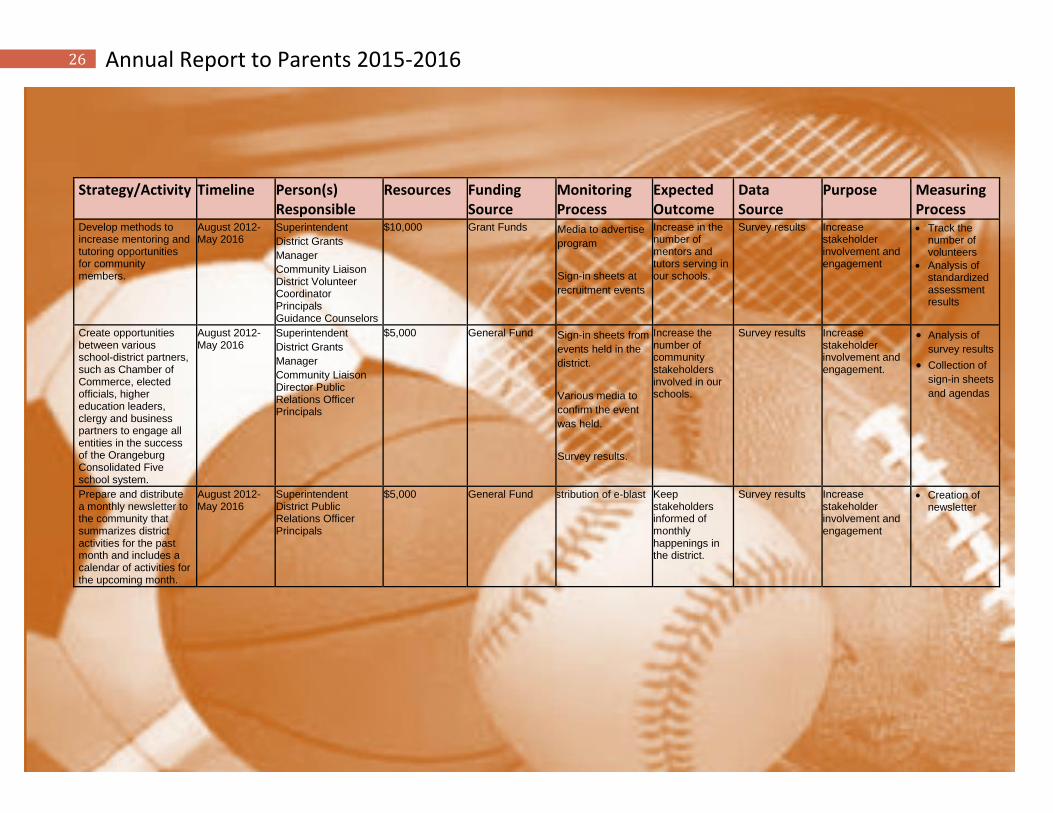
Develop methods to increase mentoring and tutoring opportunities for community members.
August 2012-May 2016
Superintendent District Grants
Manager Community Liaison District Volunteer Coordinator Principals Guidance Counselors
$10,000 Grant Funds Media to advertise
program
Sign-in sheets at
recruitment events
Increase in the number of mentors and tutors serving in our schools.
Survey results
Increase stakeholder involvement and engagement
Track the number of volunteers
Analysis of standardized assessment results
Create opportunities between various school-district partners, such as Chamber of Commerce, elected officials, higher education leaders, clergy and business partners to engage all entities in the success of the Orangeburg Consolidated Five school system.
August 2012-May 2016
Superintendent District Grants
Manager Community Liaison Director Public Relations Officer Principals
$5,000 General Fund Sign-in sheets from
events held in the
district.
Various media to
confirm the event
was held.
Survey results.
Increase the number of community stakeholders involved in our schools.
Survey results
Increase stakeholder involvement and engagement.
Analysis of
survey results Collection of
sign-in sheets
and agendas
Prepare and distribute a monthly newsletter to the community that summarizes district activities for the past month and includes a calendar of activities for the upcoming month.
August 2012-May 2016
Superintendent District Public Relations Officer Principals
$5,000 General Fund Distribution of e-blast Keep stakeholders informed of monthly happenings in the district.
Survey results
Increase stakeholder involvement and engagement
Creation of newsletter
27 Annual Report to Parents 2015-2016
Strategy/Activity Timeline Person(s) Responsible
Resources Funding Source
Monitoring Process
Expected Outcome
Data Source
Purpose Measuring Process
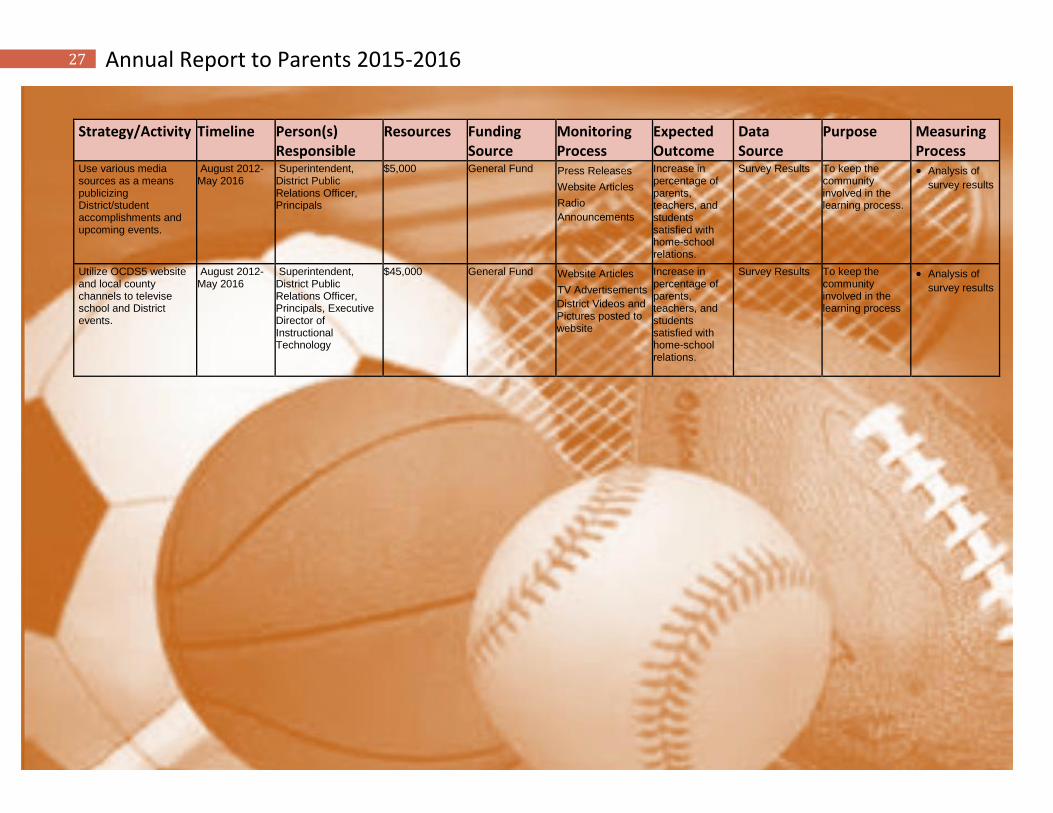
Use various media sources as a means publicizing District/student accomplishments and upcoming events.
August 2012-May 2016
Superintendent, District Public Relations Officer, Principals
$5,000 General Fund Press Releases
Website Articles
Radio
Announcements
Increase in percentage of parents, teachers, and students satisfied with home-school relations.
Survey Results To keep the community involved in the learning process.
Analysis of
survey results
Utilize OCDS5 website and local county channels to televise school and District events.
August 2012-May 2016
Superintendent, District Public Relations Officer, Principals, Executive Director of Instructional Technology
$45,000 General Fund Website Articles
TV Advertisements
District Videos and Pictures posted to website
Increase in percentage of parents, teachers, and students satisfied with home-school relations.
Survey Results To keep the community involved in the learning process
Analysis of
survey results
28 Annual Report to Parents 2015-2016
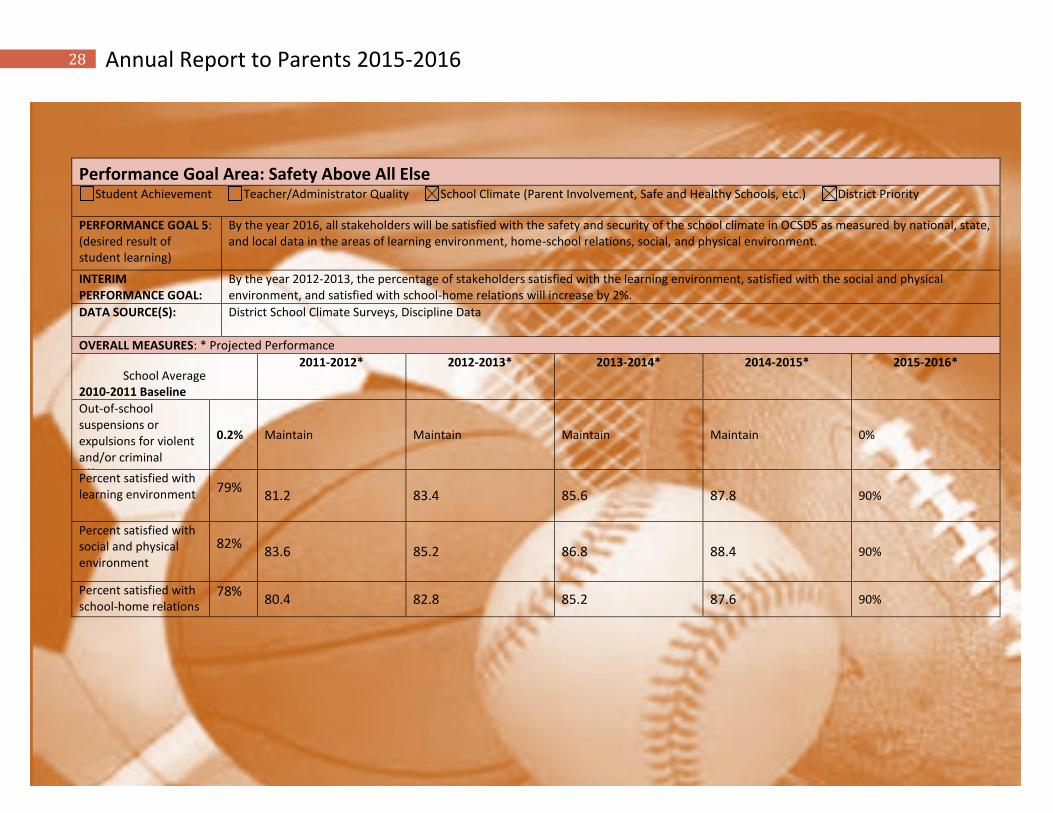
Performance Goal Area: Safety Above All Else Student Achievement Teacher/Administrator Quality School Climate (Parent Involvement, Safe and Healthy Schools, etc.) District Priority
PERFORMANCE GOAL 5: (desired result of student learning)
By the year 2016, all stakeholders will be satisfied with the safety and security of the school climate in OCSD5 as measured by national, state, and local data in the areas of learning environment, home-school relations, social, and physical environment.
INTERIM PERFORMANCE GOAL:
By the year 2012-2013, the percentage of stakeholders satisfied with the learning environment, satisfied with the social and physical environment, and satisfied with school-home relations will increase by 2%.
DATA SOURCE(S): District School Climate Surveys, Discipline Data
OVERALL MEASURES: * Projected Performance
School Average 2010-2011 Baseline
2011-2012* 2012-2013* 2013-2014* 2014-2015* 2015-2016*
Out-of-school suspensions or expulsions for violent and/or criminal offenses
0.2% Maintain Maintain Maintain Maintain 0%
Percent satisfied with learning environment 79%
81.2 83.4 85.6 87.8 90%
Percent satisfied with social and physical environment
82%
83.6 85.2 86.8 88.4 90%
Percent satisfied with school-home relations
78%
80.4 82.8 85.2 87.6 90%
29 Annual Report to Parents 2015-2016
Strategy/Activity Timeline Person(s) Responsible
Resources Funding Source
Monitoring Process
Expected Outcome
Data Source
Purpose Measuring Process
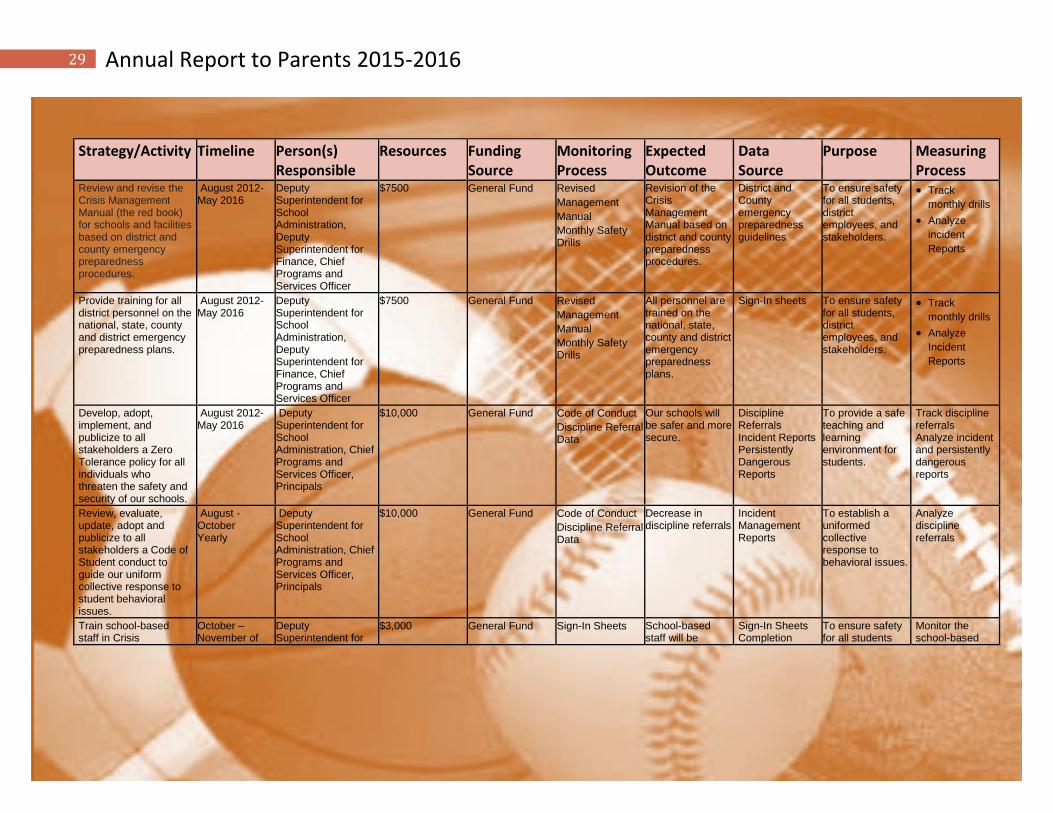
Review and revise the Crisis Management Manual (the red book) for schools and facilities based on district and county emergency preparedness procedures.
August 2012-May 2016
Deputy Superintendent for School Administration, Deputy Superintendent for Finance, Chief Programs and Services Officer
$7500 General Fund Revised
Management
Manual
Monthly Safety Drills
Revision of the Crisis Management Manual based on district and county preparedness procedures.
District and County emergency preparedness guidelines
To ensure safety for all students, district employees, and stakeholders.
Track
monthly drills
Analyze
incident
Reports
Provide training for all district personnel on the national, state, county and district emergency preparedness plans.
August 2012-May 2016
Deputy Superintendent for School Administration, Deputy Superintendent for Finance, Chief Programs and Services Officer
$7500 General Fund Revised
Management
Manual
Monthly Safety Drills
All personnel are trained on the national, state, county and district emergency preparedness plans.
Sign-In sheets To ensure safety for all students, district employees, and stakeholders.
Track
monthly drills
Analyze
Incident
Reports
Develop, adopt, implement, and publicize to all stakeholders a Zero Tolerance policy for all individuals who threaten the safety and security of our schools.
August 2012-May 2016
Deputy Superintendent for School Administration, Chief Programs and Services Officer, Principals
$10,000 General Fund Code of Conduct
Discipline Referral Data
Our schools will be safer and more secure.
Discipline Referrals Incident Reports Persistently Dangerous Reports
To provide a safe teaching and learning environment for students.
Track discipline referrals Analyze incident and persistently dangerous reports
Review, evaluate, update, adopt and publicize to all stakeholders a Code of Student conduct to guide our uniform collective response to student behavioral issues.
August -October Yearly
Deputy Superintendent for School Administration, Chief Programs and Services Officer, Principals
$10,000 General Fund Code of Conduct
Discipline Referral Data
Decrease in discipline referrals
Incident Management Reports
To establish a uniformed collective response to behavioral issues.
Analyze discipline referrals
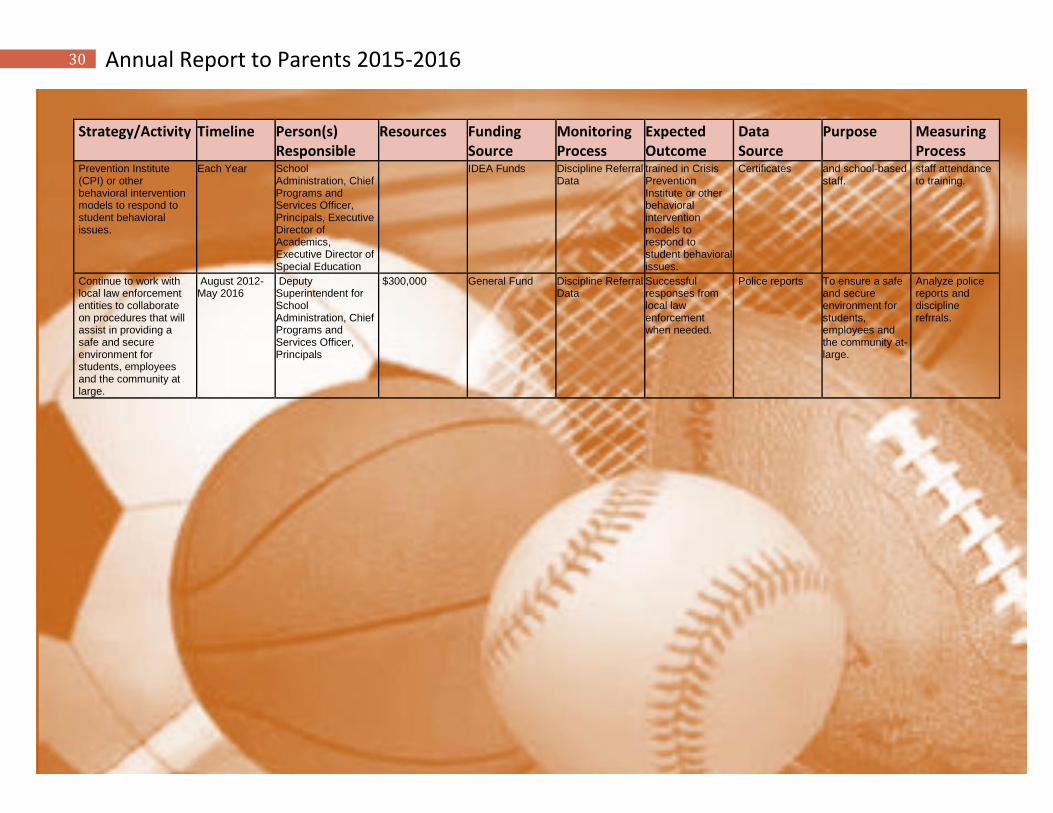
Train school-based staff in Crisis
October – November of
Deputy Superintendent for
$3,000 General Fund Sign-In Sheets School-based staff will be
Sign-In Sheets Completion
To ensure safety for all students
Monitor the school-based
30 Annual Report to Parents 2015-2016
Strategy/Activity Timeline Person(s) Responsible
Resources Funding Source
Monitoring Process
Expected Outcome
Data Source
Purpose Measuring Process
Prevention Institute (CPI) or other behavioral intervention models to respond to student behavioral issues.
Each Year School Administration, Chief Programs and Services Officer, Principals, Executive Director of Academics, Executive Director of Special Education
IDEA Funds Discipline Referral Data
trained in Crisis Prevention Institute or other behavioral intervention models to respond to student behavioral issues.
Certificates and school-based staff.
staff attendance to training.
Continue to work with local law enforcement entities to collaborate on procedures that will assist in providing a safe and secure environment for students, employees and the community at large.
August 2012-May 2016
Deputy Superintendent for School Administration, Chief Programs and Services Officer, Principals
$300,000 General Fund Discipline Referral Data
Successful responses from local law enforcement when needed.
Police reports To ensure a safe and secure environment for students, employees and the community at-large.
Analyze police reports and discipline refrrals.