Embed Size (px)
Citation preview
Who Did the Audit? Investor Perceptions and Disclosures of Other Audit Participants in
PCAOB Filings
Carol Callaway Dee*
University of Colorado Denver
Ayalew Lulseged
University of North Carolina Greensboro
Tianming Zhang
Florida State University
August 2012
We thank Jana Hranaiova, Linda Hughen, Andres Vinelli, and especially Brian Daugherty for
their suggestions and comments. The paper has also benefited from comments received at
presentations at the 2012 Deloitte Foundation/University of Kansas Auditing Symposium, and
the brown bag workshop series at the PCAOB’s headquarters in Washington DC.
* Corresponding author. University of Colorado Denver, 1475 Lawrence St., PO Box 173364, Campus Box 165,
Denver CO 80217-3364. Phone 303-315-8463. [email protected]
Who Did the Audit? Investor Perceptions and Disclosures of Other Audit Participants in
PCAOB Filings
Abstract
We empirically test whether investors value information about other firms participating
in the audits of SEC issuers—that is, firms other than the principal audit firm that issues the audit
report. A recent proposal by the PCAOB would require disclosure of such information. The
PCAOB argues this requirement would increase transparency and provide investors with
valuable information about overall audit quality.
We use a matched control sample research design in the study. We examine cumulative
abnormal returns (CARs) for issuers that had other auditors participating in their audits as
disclosed in registered audit firms’ Form 2 filings with the PCAOB, along with a sample of
matching control issuers that were not disclosed as having other participant auditors. Using the
filing date of Form 2 as the event date, we find that CARs are significantly negative for the
experimental sample, but not for the matched control sample. Results hold in a multivariate
model that includes firm-specific control variables.
In an analysis of earnings response coefficients (ERCs), we find that market valuation of
earnings surprises declines after revelation that others participated in the audit. Taken together,
these results suggest that data contained in PCAOB Form 2 filings related to other participants in
the external audit provide new information to the market, and investors behave as if they
perceive audits in which others participated as being of lower quality. Our empirical results
support the PCAOB’s position that the disclosure of other participants in audits enhances
transparency and is of information value to investors.
1
INTRODUCTION
We empirically test whether client market valuations are affected by news that other
firms participated in their audits—that is, firms other than the principal auditor issuing the audit
report. Our work is motivated in part by a rule proposed in 2011 by the Public Company
Accounting Oversight Board (PCAOB or Board). This rule would require registered accounting
firms to disclose in an SEC issuer’s audit report the names of other firms or individuals that
participated in the audit and the percentage of the audit’s total hours these participants provided,
subject to certain minimal thresholds.1
The PCAOB argues that this requirement would increase transparency and provide
investors with valuable information about the overall quality of audits, and surveys indicate that
large investor groups want to know about other audit participants (CFA 2010; IAG 2011).
However, because under current U.S. auditing standards the principal auditor assumes
responsibility for the entire audit (including any portions completed by other auditors) the
principal auditor bears the burden of reputation damage and litigation costs in the event of an
audit failure. This provides market-based incentives to ensure that the principal auditor delivers
a high quality audit (Palmrose 1988; Simunic and Stein 1987) and closely monitors the work of
any other firms involved. Thus public disclosure of other participants in the audit may have little
or no information value to investors.
We examine whether the disclosure of other audit participants provides new information
to the market and if it changes investors’ perceptions of the overall quality of the audit. Our
study is designed to address some of the questions posed by the Board in its proposed rule, in
particular whether disclosure of other participants in the audit would be useful information to
1 The proposed rule is in PCAOB Concept Release No. 2011-07 “Improving the transparency of audits: proposed
amendments to PCAOB auditing standards and Form 2”.
2
investors. More specifically, we empirically investigate whether the market reacts to the
disclosure of other participants in audits and if the market’s valuation of earnings surprises
changes after this disclosure.
Under current PCAOB interim standard AU §543 “Part of Audit Performed by Other
Independent Auditors”, principal auditors are prohibited from disclosing the identities of other
firms that participated in the audit unless it is a shared responsibility opinion.2 We thus follow
an indirect route to identify the other audit participants and the clients for which they assisted the
primary auditor. We obtain data from the annual reports (Form 2) registered audit firms began
filing with the PCAOB in 2010. These filings contain the first publicly available data about the
participation of other audit firms in SEC issuers’ audits. From the information reported in Part
4.2 of the Form 2 filings, we identify auditors that “played a substantial role in the preparation or
furnishing of an audit report” for SEC issuers (but did not act as the principal auditor) and the
issuers for which they did this work.3 The PCAOB defines auditors performing a “substantial
role” as those auditors whose work either comprises 20% of total hours or total fees for the issuer
audit, or who perform the majority of the audit work on a subsidiary constituting 20% of assets
or revenues of the issuer.4 Thus, these auditors provide a non-trivial amount of services to these
audits. We then match each of these issuers (experimental issuers) with a control issuer in the
same three-digit SIC code that is closest in size to the experimental issuer. We use the filing date
of Form 2 as the event date.
2 At this time, AU §543 applies to audits of both public and non-public companies. However, as part of its Clarity
Project, the American Institute of Certified Public Accountants (AICPA) issued AU-C §600 “Special
Considerations—Audits of Group Financial Statements (Including the Work of Component Auditors)” which
replaces AU §543 for audits of non-public companies. It is effective for periods ending on or after December 15,
2012. 3 If the audit firm issued any audit reports of its own during the Form 2 reporting period, the firm is not required to
complete part 4.2. Therefore, our sample excludes audit firms that both issued audit reports and participated in other
audits for which they were not the principal auditor. We discuss this limitation later in the paper. 4 PCAOB Rule 1001 (p) (ii).
3
In univariate market reaction analysis for the experimental issuers, we find that mean
two-day (0, +1), three-day (0, +2) and four-day (0, +3) event window cumulative abnormal
returns (CARs) are significantly negative; the one-day (0, 0) CARs are negative but not
significant. However, for the matching subsample, none of these CARs is significantly different
from zero. This provides support for the notion that the negative market reaction we document
for companies in the experimental sample is a result of the disclosure by other participating
auditors of their involvement in the audits of these issuers (the experimental subsample).
We also estimate a cross sectional CAR regression model on the full sample of
experimental and matching companies. This model relates CAR to firm specific control
variables, as well as to an indicator variable DISCLOSED which equals one for clients having
other participant audit firms as disclosed in those firms’ Form 2 filings and zero otherwise. We
find that CAR is significantly negatively related to DISCLOSED across all three models (two-,
three-, and four-day CAR models). Consistent with the univariate results we report, this finding
suggests that the disclosure of other audit participants provides new information that is of value
to investors’ assessment of the overall quality of the audit, consistent with the views of the
PCAOB and other stakeholders (CFA 2010; IAG 2011).
In our analysis of earnings response coefficients, we use a pre-post design, where each
issuer acts as its own control, to test if the market valuation of earnings surprises changes after
the disclosure of other participants in audits. We estimate four models with two alternative
proxies for the dependent variable: size- and risk-adjusted CAR, and two alternative proxies for
unexpected earnings: analyst forecast errors and earnings changes from quarter t-4 to t. We
estimate the four models separately by subsample (experimental and matching) as well on the
full sample (pooled experimental and matching). In all four model specifications, we find that the
4
variable of interest, , is significantly negative for the experimental subsample,
indicating that the market perceives earnings of these clients as being less informative after news
of the other audit participants is revealed. However, for the matching subsample of firms without
disclosure of other audit participants, is not significant in any of the four models.
This suggests that the results—declines in ERC in the post event period—are driven by the
disclosure by other audit participants of their involvement in the audits of the issuers in the
experimental subsample. The results from the ERC model we estimate on the full sample (pooled
experimental and matching) fully corroborate our findings in the subsamples. The variable of
interest is significantly negative in all four models, confirming that
there is a decline in ERC in the post period only for those issuers with other participating audit
firms as disclosed in those firms’ Form 2 filings.
Overall, these results suggest that PCAOB required disclosures by auditors of their
significant participation in the audits of issuers provides new information, and investors behave
as if they perceive such audits (those involving other audit participants) as being of lower
quality. Thus, our empirical results support the PCAOB’s position that the disclosure of other
participants in audits enhances transparency and is of information value to investors.
BACKGROUND
In the U.S., except for the relatively rare instances where the principal auditor decides to
make reference to the work of the other auditors (i.e., opts for a shared responsibility opinion)
the principal auditor signs and assumes full responsibility for the audit opinion.5 Thus, only the
signing audit firm is publicly identified as having conducted the audit. Yet for audits of large
global companies with international operations, other audit firms are usually involved to some
5 Lyubimov (2011) finds 109 shared responsibility opinions filed on EDGAR over the seven year period 2004
through 2010. For ease of exposition, audits we refer to hereafter exclude shared responsibility opinions unless
otherwise stated.
5
extent, even though only the principal auditor issues the audit report (Doty 2011). These other
audit participants are oftentimes foreign affiliates of the principal auditor.
The PCAOB is concerned that investors may be unaware that Big 4 audit firms as well as
other large audit firms with international operations are organized as global networks of member
firms, each a separate legal entity in its home country.6 This structure provides each affiliated
member with legal protection from liability for the acts of its affiliates in other countries. For
example, Deloitte firms are each members of Deloitte Touche Tohmatsu Limited (DTTL). This
relationship is described on Deloitte’s website as follows:
DTTL does not itself provide services to clients. DTTL and each DTTL member firm are
separate and distinct legal entities, which cannot obligate each other. DTTL and each
DTTL member firm are liable only for their own acts or omissions and not those of each
other. http://www.deloitte.com/view/en_GX/global/about/index.htm.
This legal structure is designed to help protect the governing organization (such as
DTTL) from liability for audit failures, as well as member firms from liability for audit failures
of other member firms. Nevertheless, in the U.S., the audit firm issuing the report bears
responsibility for the entire audit, including audit work done by foreign affiliates and other audit
participants. Thus the legal structure of global audit firms likely will not protect a U.S. audit
firm issuing an audit report from liability for work done on the audit by its foreign affiliates.
Under current U.S. auditing standards, the principal auditor is prohibited from disclosing
in the audit report the involvement of other auditors for fear that it may mislead the reader about
6 PCAOB Chairman Doty (2011) states: “I am concerned about investor awareness. I have been surprised to
encounter many savvy business people and senior policy makers who are unaware of the fact that an audit report that
is signed by a large U.S. firm may be based, in large part, on the work of affiliated firms. Such firms are generally
completely separate legal entities in other countries.” In his book No One Would Listen, Bernie Madoff
whistleblower Harry Markopolos (2010) writes “What many people don’t realize is that PricewaterhouseCoopers is
actually a different corporation in different countries. The corporations have the same brand name, but basically
they’re franchises.”
6
the extent of responsibility taken by the principal auditor.7 The principal auditor assumes
responsibility for the entire audit—including any portions completed by other auditors such as
the firm’s foreign affiliates. As a result, the principal auditor fully bears the burden of reputation
damage and litigation costs in the event of an audit failure. This provides the principal audit firm
market based incentives (Palmrose 1988; Simunic and Stein 1987) to ensure the work of all other
audit participants is of uniformly high quality. In the presence of these market based incentives,
investors may expect the principal auditor to provide high quality audits regardless of the
involvement of other firms, suggesting that disclosure of other audit participants should not
affect investors’ perceptions of audit quality.
Nevertheless, actions taken by the Board indicate it believes this information is important
for the public to know, and surveys conducted by the PCAOB’s Investor Advisory Group (IAG)
and the Chartered Financial Analysts’ Institute conclude that large investor groups want to know
about other audit participants. In 2011, the PCAOB issued Concept Release No. 2011-007
“Improving the Transparency of Audits: Proposed Amendments to PCAOB Auditing Standards
and Form 2” that would require registered accounting firms to disclose the names of other
participants in audits and the portion of the audit these other participants performed.8 The
PCAOB argues that the proposed rule would increase transparency and provide investors with
valuable information about the overall quality of the audit for a number of reasons.
7 AU §543, par. 4: “If the principal auditor is able to satisfy himself as to the independence and professional
reputation of the other auditor and takes steps he considered appropriate to satisfy himself as to the audit performed
by the other auditor, he may be able to express an opinion on the financial statements taken as a whole without
making reference in his reports to the audit of the other auditor. If the principal auditor decides to take this position,
he should not state in his report that part of the audit was made by another auditor because to do so may cause a
reader to misinterpret the degrees of responsibility being assumed.” [Emphasis added]. 8 The proposal also requires disclosure of the name of the engagement partner responsible for the audit. The
proposed rule does not require disclosure of the use of specialists or client personnel such as internal auditors who
assist the principal auditor. The use of specialists is covered under AU §336 while using internal auditors to assist
the independent auditor is discussed in AU §322.
7
First, the PCAOB standard will let investors know whether a potentially significant
portion of the audit was performed by the audit firm’s foreign affiliates. PCAOB Chairman
James Doty describes this as follows:
For many large, multi-national companies, a significant portion of the audit may be
conducted abroad—even half or more of the total audit hours. In theory, when a
networked firm signs the opinion, the audit is supposed to be seamless and of consistently
high quality. In practice, that may or may not be the case. (Doty 2011).
In other words, the PCAOB believes the only way for investors to properly assess audit quality is
to have knowledge of the extent that other audit firms and affiliates were involved. Second,
because the PCAOB has been unable to conduct inspections in a number of foreign countries, it
is quite possible that other registered firms participating in the audit have not been inspected by
the Board. Identification of the other audit participants will allow investors to determine whether
the firm has been inspected and, if inspected, to evaluate the Board’s findings. Finally,
identification of other parties that participated in the audit will allow investors to consider other
relevant information about the participant, such as firm size, experience and expertise. Overall,
this suggests that knowing the identity and involvement of other audit participants will help
financial statement users to evaluate the relative quality of the audit and thus the extent to which
they will rely on the financial statements.
In an experimental study, Lyubimov et al. (2011) find that their subjects (potential jurors)
perceived audit work that was both offshored and outsourced to be of the lowest quality and the
highest risk. If outsourced audit work is perceived to be of lower quality and higher risk relative
to work that is not outsourced, investors are likely to revise downward the perceived quality of
the overall audit upon learning that some audit work was outsourced. The disclosure of other
participants in audits may result in a negative market reaction and lower ERC in the post
8
disclosure period. This is consistent with the PCAOB’s arguments regarding the information
value of increased transparency about other participants in audits. However, Lyubimov et al.
(2011) also find that compensatory damages increase with outsourcing and punitive damages
increase with the interaction of outsourcing and offshoring. The potential of facing increased
compensatory and/or punitive damages for failed audits that involve other participating auditors
(i.e., audit work that is outsourced) may give the principal auditor an added incentive to deliver a
higher quality audit when it engages other audit participants. This suggests that increased
transparency through public disclosure of other audit participants could help improve audit
quality.
In sum, because the principal auditor bears the risk of reputation damage and litigation
expense in the event of an audit failure, the principal audit firm has the incentive to ensure the
audit is of uniformly high quality. Cognizant of the strong economic incentives of the principal
auditor, investors may not change their perceptions of audit quality (and thus earnings quality)
upon learning of the presence of other audit participants. If this scenario holds, we will observe
no market reaction to the disclosure and no change in ERCs in the post disclosure period.9
However, the PCAOB believes this disclosure is necessary for investors to properly evaluate the
quality of the audit work performed. If investors find (or at least perceive) the disclosure
provides new information about the quality of the audit and thus the quality of the information
contained in the financial statements, we will observe a significant market reaction to the
disclosure and a significant change in ERCs in the post disclosure period. Given these competing
views, we empirically investigate whether investors value the disclosure of information about
9 The converse is not true of course. That is, finding no result does not necessarily mean that investors did not
change their perceptions of audit quality.
9
other participants in the external audit under the null hypothesis that there will be no market
reaction to the disclosure and there will be no change in ERC in the post disclosure period.
RESEARCH DESIGN
We use a matched control sample design in this study. From 2010 Form 2 filings by
registered firms participating in audits but not signing audit opinions, we identify issuer clients
for which parts of the audit were conducted by firms other than the signing audit firm. For each
identified company (“experimental company”), we find the company closest to it in total assets
as of the beginning of 2010 that is in the same three-digit SIC code but was not disclosed as
having other auditors participate in its audits (“control company”). Each control company may
be matched with only one experimental company. We use the Form 2 filing date for registered
audit firms that substantially participated in issuer audits as the event date, because this is the
first opportunity investors have to learn that auditors other than signing audit firms participated
in issuer audits. For our samples of experimental and control companies, we examine client stock
market reactions to the Form 2 filings, and the relation between unexpected earnings and
abnormal returns before and after the filing dates. While it is possible that companies in the
control group have other participants in their audits, investors have no way of knowing whether
that is the case because the information is not publicly disclosed. Thus what we capture in our
analysis is the difference in investors’ perceptions of audit quality (and thus earnings quality)
between companies that have been identified as having other participants in audits and those that
have not—not necessarily the actual quality of the audits and earnings.
Market Reaction Analysis
Using the date audit firms that substantially participate in audits but do not issue audit
opinions file their 2010 annual reports as event dates, we examine stock price reactions of the
10
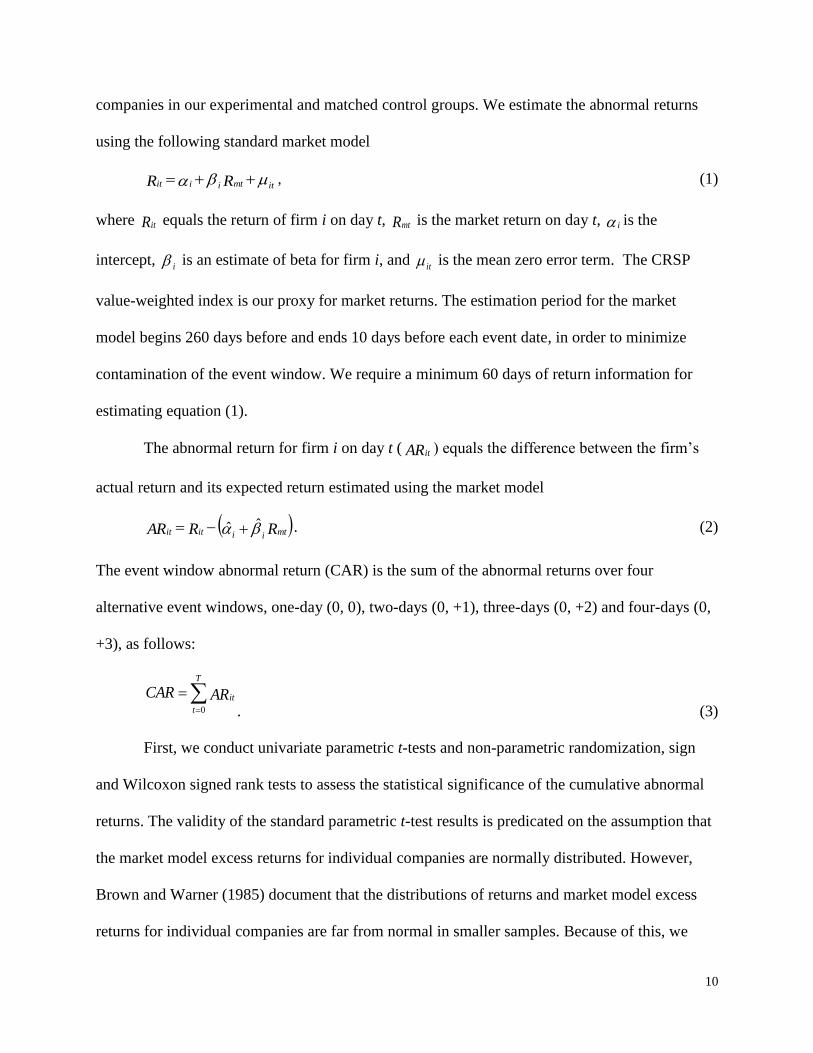
companies in our experimental and matched control groups. We estimate the abnormal returns
using the following standard market model
itmtiiit RR , (1)
where Rit equals the return of firm i on day t, Rmt is the market return on day t, i is the
intercept, i is an estimate of beta for firm i, and it
is the mean zero error term. The CRSP
value-weighted index is our proxy for market returns. The estimation period for the market
model begins 260 days before and ends 10 days before each event date, in order to minimize
contamination of the event window. We require a minimum 60 days of return information for
estimating equation (1).
The abnormal return for firm i on day t ( ARit ) equals the difference between the firm’s
actual return and its expected return estimated using the market model
RRAR mti iitit ˆˆ . (2)
The event window abnormal return (CAR) is the sum of the abnormal returns over four
alternative event windows, one-day (0, 0), two-days (0, +1), three-days (0, +2) and four-days (0,
+3), as follows:
T
t
itARCAR0 . (3)
First, we conduct univariate parametric t-tests and non-parametric randomization, sign
and Wilcoxon signed rank tests to assess the statistical significance of the cumulative abnormal
returns. The validity of the standard parametric t-test results is predicated on the assumption that
the market model excess returns for individual companies are normally distributed. However,
Brown and Warner (1985) document that the distributions of returns and market model excess
returns for individual companies are far from normal in smaller samples. Because of this, we
11
check the robustness of the t-test results using non-parametric tests that do not require the
normality assumption. In addition to the median based nonparametric sign and Wilcoxon signed
rank tests, we report p-values from a non-parametric randomization test as in Blacconiere (1991)
and Blacconiere and Patten (1994).10
The p-values in the randomization test are derived by comparing the actual one-, two-,
three- or four-day event window CARs to the 999 “pseudo-event” CARs from corresponding
event windows randomly selected from all event and non-event days one year before and one
year after the actual event dates. The randomization test p-value is the proportion of times the
actual event window CAR is greater than the 999 pseudo-event CARs.11
According to Noreen
(1989), the randomization test (unlike most parametric procedures) does not have strict normality
assumption requirements and 1,000 iterations (one for the actual event date and 999 for the
pseudo-event dates) are sufficient to ensure that the null is correctly rejected when it is false.
Next we estimate a multivariate cross sectional regression model on the pooled sample of
companies in both the experimental and matched control groups, to see if the abnormal returns
are associated with investors’ knowledge of the presence of other participants in audits after
controlling for certain client-specific characteristics that prior research identifies as being
associated with abnormal returns (firm subscripts excluded).
(4)
Where
10
Bowen, Johnson and Shevlin (1989) and Blacconiere and Defond (1997) are two other examples of studies using a
randomization test. 11
The p-value is computed as number the of times the actual event window CAR is greater than the pseudo-event
CARs, plus one, divided by the total number of iterations.
[( ) ] ( )⁄

12
CAR = issuer i’s cumulative abnormal return over a two-, three-, or four-day
window, beginning with the day the other participating auditor filed
its Form 2;
DISCLOSED = one for issuers that are disclosed in the participating auditor’s Form 2
(experimental firms) and zero otherwise (matching firms);
PRBANKRUPT = Zmijewski’s [1984] financial distress measure for issuer;
LAGRET = issuer’s one year cumulative raw returns prior to the participating
auditor’s Form 2 filing;
LNASSET = natural log of issuer’s total assets (in millions of dollars);
BM = issuer’s book value of equity scaled by market value of equity;
LEV = issuer’s total debt scaled by total assets;
GROWTH = issuer’s growth rate in sales;
ROA = issuer’s 2-digit SIC code median adjusted return on assets;
FEERATIO = ratio of non-audit fees to total fees paid by issuer;
NEWAUD = one if issuer switched audit firms during the year prior to the
participating auditor’s Form 2 filing and zero otherwise; and
INSTHOLD = percentage of issuer shares owned by institutional shareholders.
The variable of interest is DISCLOSED, an indicator variable set to one when a company
is identified as having other participants in its audits and zero otherwise. Consistent with Baber
et al. (1995), the control variables in the model include client financial distress (PRBANKRUPT),
prior return (LAGRET), client size (LNASSET), and new engagement or not (NEWAUD). As in
Krishnamurthy et al. (2006), we include FEERATIO as a proxy for the economic bonding
between the client and auditor and institutional holding (INSTHOLD) as a proxy for
effectiveness of corporate governance. We add proxies for client opportunities and incentives to
manage earnings such as book to market (BM), leverage (LEV), prior sales growth (GROWTH),
and ROA (Krishnamurthy et al. 2006).
Market Valuation of Earnings (ERC) Analysis
To assess whether the disclosure of other participants in audits affects investors’
perceptions of the quality of the audits and hence the valuation of earnings, we estimate the
following pooled cross-sectional regression earnings response coefficient (ERC) model similar to
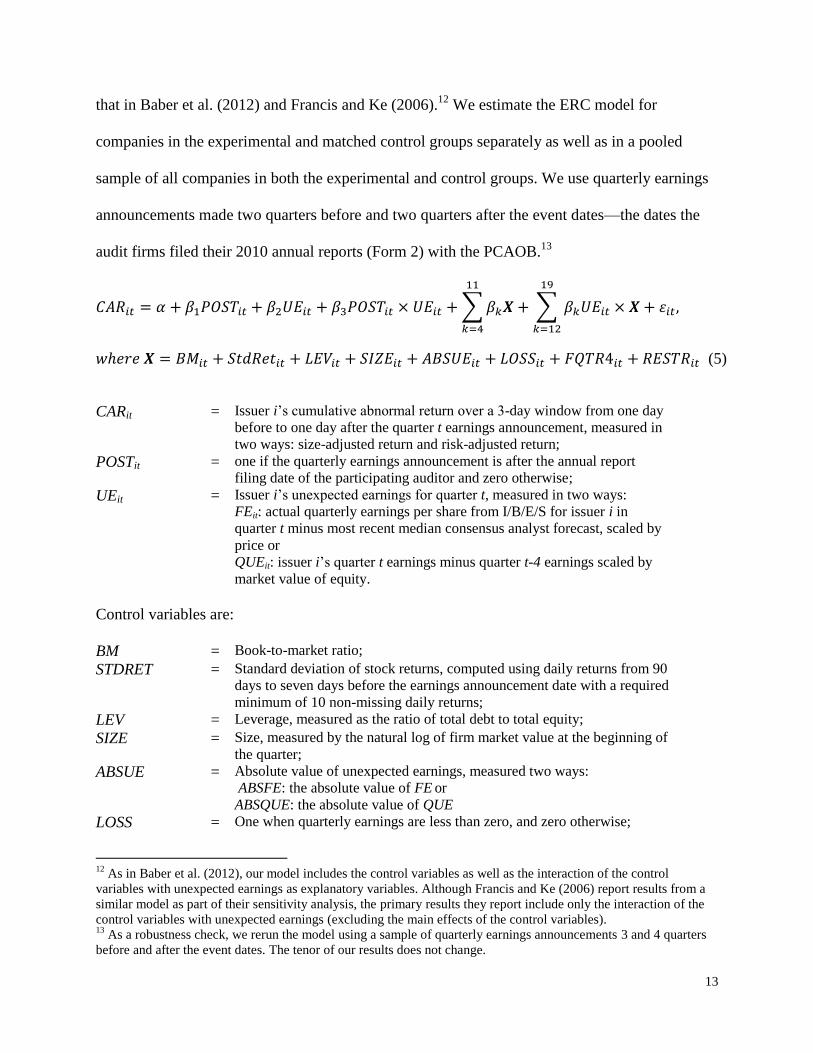
13
that in Baber et al. (2012) and Francis and Ke (2006).12
We estimate the ERC model for
companies in the experimental and matched control groups separately as well as in a pooled
sample of all companies in both the experimental and control groups. We use quarterly earnings
announcements made two quarters before and two quarters after the event dates—the dates the
audit firms filed their 2010 annual reports (Form 2) with the PCAOB.13
∑
∑
(5)
CARit = Issuer i’s cumulative abnormal return over a 3-day window from one day
before to one day after the quarter t earnings announcement, measured in
two ways: size-adjusted return and risk-adjusted return;
POSTit = one if the quarterly earnings announcement is after the annual report
filing date of the participating auditor and zero otherwise;
UEit = Issuer i’s unexpected earnings for quarter t, measured in two ways:
FEit: actual quarterly earnings per share from I/B/E/S for issuer i in
quarter t minus most recent median consensus analyst forecast, scaled by
price or
QUEit: issuer i’s quarter t earnings minus quarter t-4 earnings scaled by
market value of equity.
Control variables are:
BM = Book-to-market ratio;
STDRET = Standard deviation of stock returns, computed using daily returns from 90
days to seven days before the earnings announcement date with a required
minimum of 10 non-missing daily returns;
LEV = Leverage, measured as the ratio of total debt to total equity;
SIZE = Size, measured by the natural log of firm market value at the beginning of
the quarter;
ABSUE = Absolute value of unexpected earnings, measured two ways:
ABSFE: the absolute value of FE or
ABSQUE: the absolute value of QUE
LOSS = One when quarterly earnings are less than zero, and zero otherwise;
12
As in Baber et al. (2012), our model includes the control variables as well as the interaction of the control
variables with unexpected earnings as explanatory variables. Although Francis and Ke (2006) report results from a
similar model as part of their sensitivity analysis, the primary results they report include only the interaction of the
control variables with unexpected earnings (excluding the main effects of the control variables). 13
As a robustness check, we rerun the model using a sample of quarterly earnings announcements 3 and 4 quarters
before and after the event dates. The tenor of our results does not change.
14
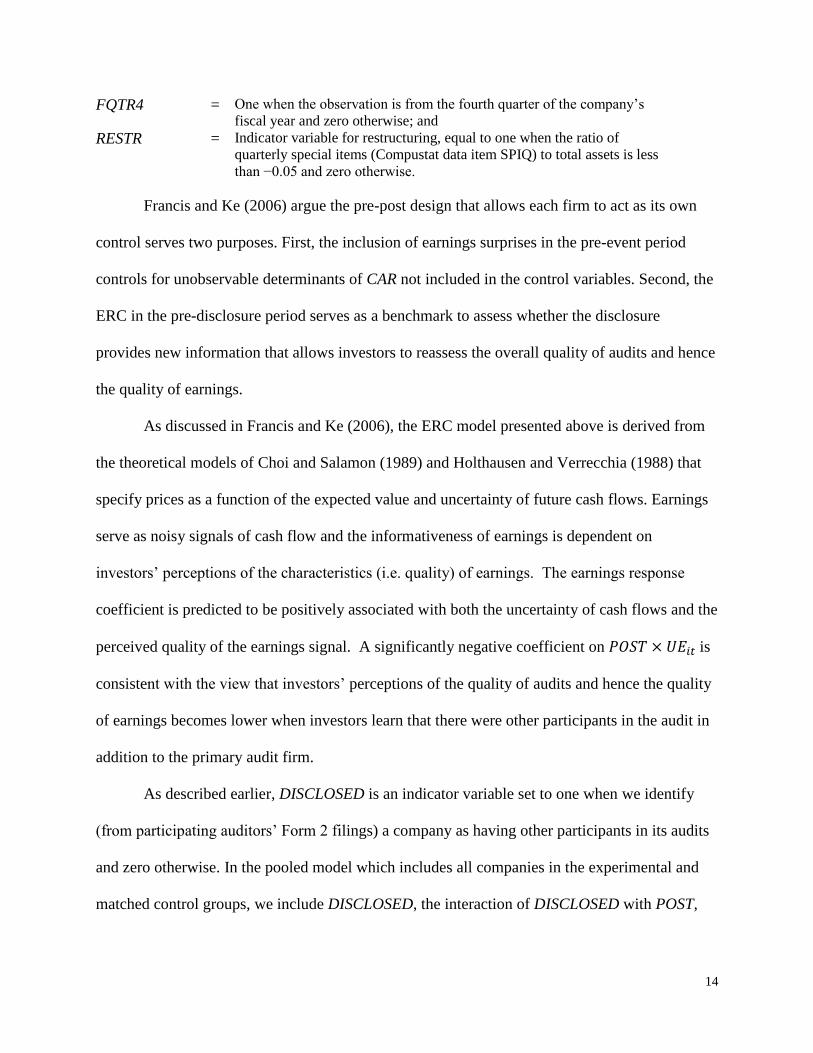
FQTR4 = One when the observation is from the fourth quarter of the company’s
fiscal year and zero otherwise; and
RESTR = Indicator variable for restructuring, equal to one when the ratio of
quarterly special items (Compustat data item SPIQ) to total assets is less
than −0.05 and zero otherwise.
Francis and Ke (2006) argue the pre-post design that allows each firm to act as its own
control serves two purposes. First, the inclusion of earnings surprises in the pre-event period
controls for unobservable determinants of CAR not included in the control variables. Second, the
ERC in the pre-disclosure period serves as a benchmark to assess whether the disclosure
provides new information that allows investors to reassess the overall quality of audits and hence
the quality of earnings.
As discussed in Francis and Ke (2006), the ERC model presented above is derived from
the theoretical models of Choi and Salamon (1989) and Holthausen and Verrecchia (1988) that
specify prices as a function of the expected value and uncertainty of future cash flows. Earnings
serve as noisy signals of cash flow and the informativeness of earnings is dependent on
investors’ perceptions of the characteristics (i.e. quality) of earnings. The earnings response
coefficient is predicted to be positively associated with both the uncertainty of cash flows and the
perceived quality of the earnings signal. A significantly negative coefficient on is
consistent with the view that investors’ perceptions of the quality of audits and hence the quality
of earnings becomes lower when investors learn that there were other participants in the audit in
addition to the primary audit firm.
As described earlier, DISCLOSED is an indicator variable set to one when we identify
(from participating auditors’ Form 2 filings) a company as having other participants in its audits
and zero otherwise. In the pooled model which includes all companies in the experimental and
matched control groups, we include DISCLOSED, the interaction of DISCLOSED with POST,

15
the interaction of DISCLOSED with UE, and a three way interaction variable
as additional explanatory variables.
∑
∑
(6)
The variable of interest in the pooled model is the three way interaction variable
. A significantly negative coefficient on the three way interaction
variable will indicate that ERCs are lower for issuers identified in the POST period as having
other participants in their audits—that is, in the quarters after the public disclosure of other
participants in the audits of these companies.
As in most prior research, we compute CAR over a three-day event window (-1, +1) to
account for information leakage prior to the event date and earnings announcements made after
normal trading hours. We do not have industry control variables in our model due to the
relatively small sample size. However, we use standard errors that are robust to
heteroskedasticity and two-digit SIC code clustering in our tests.
SAMPLE
In this section, we discuss the data collection procedure and characteristics of the sample
firms. We then present the sample selection procedure for the market reaction and the market
valuation of earnings surprises (ERC) analysis.
Data Collection and Characteristics of the Other Audit Participants
We gather data for the study from the first Annual Reports (Form 2) that registered
auditors filed with the PCAOB in 2010. These annual reports are available on the PCAOB
16
website at https://rasr.pcaobus.org/search/search.aspx. Under current PCAOB reporting rules,
only auditors that did not issue audit opinions are required to disclose the audits in which they
significantly participated. Thus, we limit our search to the annual reports of audit firms that “Did
not issue audit reports on issuers, but played a substantial role in the preparation or furnishings of
audit reports with respect to an issuer”. We find 111 annual report filings by such audit firms for
2010.14
According to PCAOB Rule 1001 (p) (ii), auditors performing a “substantial role” are
those that either (1) perform “material services” for the principal audit firm, defined as 20% of
total hours or 20% of total fees for the issuer audit, or (2) perform the majority of the audit work
on a subsidiary that constitutes 20% of assets or revenues of the issuer. Thus these auditors
provide a significant amount of services to these audits.
We note that not all auditors that substantially participate in audits of SEC issuers are
required to disclose their participation in the Form 2. Specifically, auditors that issue opinions for
any SEC issuers do not disclose their significant participation in the audits of other SEC issues
for which they do not issue opinions. For example, assume that PCAOB registered audit firms A
and B substantially participate in the audits of issuers P and Q, respectively. In addition, Firm A
has one issuer client X for which it serves as the principal auditor, while Firm B does not act as
principal auditor for any issuers. Under current PCAOB standards, because Firm B does not act
as principal auditor for any issuers, Firm B will list issuer Q on its Form 2. However, because
Firm A does serve as principal auditor for at least one issuer, it will not list issuer P on its Form 2
even though it substantially participated in the audit of issuer P.15
Thus, issuer Q will be included
14
Eight of the 111 firms filed amendments (Form 2/A) shortly after filing their Form 2. A close examination of the
amendments reveals that the amended information does not affect this study. Therefore, when examining market
reaction, we use the date of original Form 2 filing and ignore the date of amendment filing. 15
Firms must list in another section of Form 2 the issuer clients for which they act as principal auditor. Thus Firm A
will disclose issuer X on its Form 2, but not issuer P.
17
in our sample of companies having other participant auditors while issuer P will not. This will
pose some generalizability problems to our findings that we discuss later in the paper.
After obtaining the report filing date from the PCAOB website, we read the annual
reports and collect the following information about each of the participating auditors: the name
of the firm; the country in which it is located; the total number of its personnel, accountants, and
CPAs; and the names of issuers for which it substantially participated in audits. For each issuer
identified in the report, we obtain its name and CIK, the name of its principal auditor and the
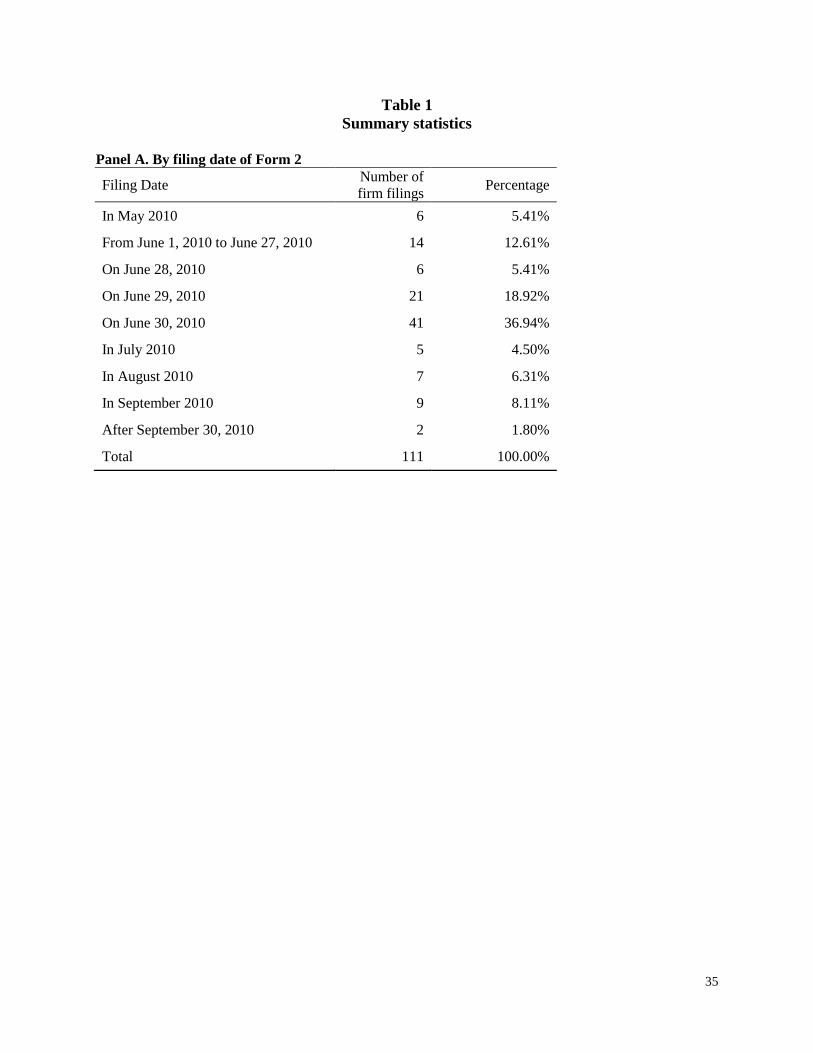
nature of the substantial role played by the participating auditor(s). Table 1 presents summary
statistics about the 111 audit firms we identified. As our sample is taken from the first public
filings by registered audit firms of Form 2, we provide a detailed description of the sample.
Panel A presents the number and percentage of firms by filing date. Annual reports must
be filed by June 30 each year, and cover the period from April 1 of the previous year through
March 31 of the reporting year. Despite this deadline, we find that about 21% of auditors filed
late. The filings are concentrated on the last three days of June (about 61%). To address the
statistical problems that may arise due to this event day clustering, we use standard errors robust
to event day clustering in our tests.
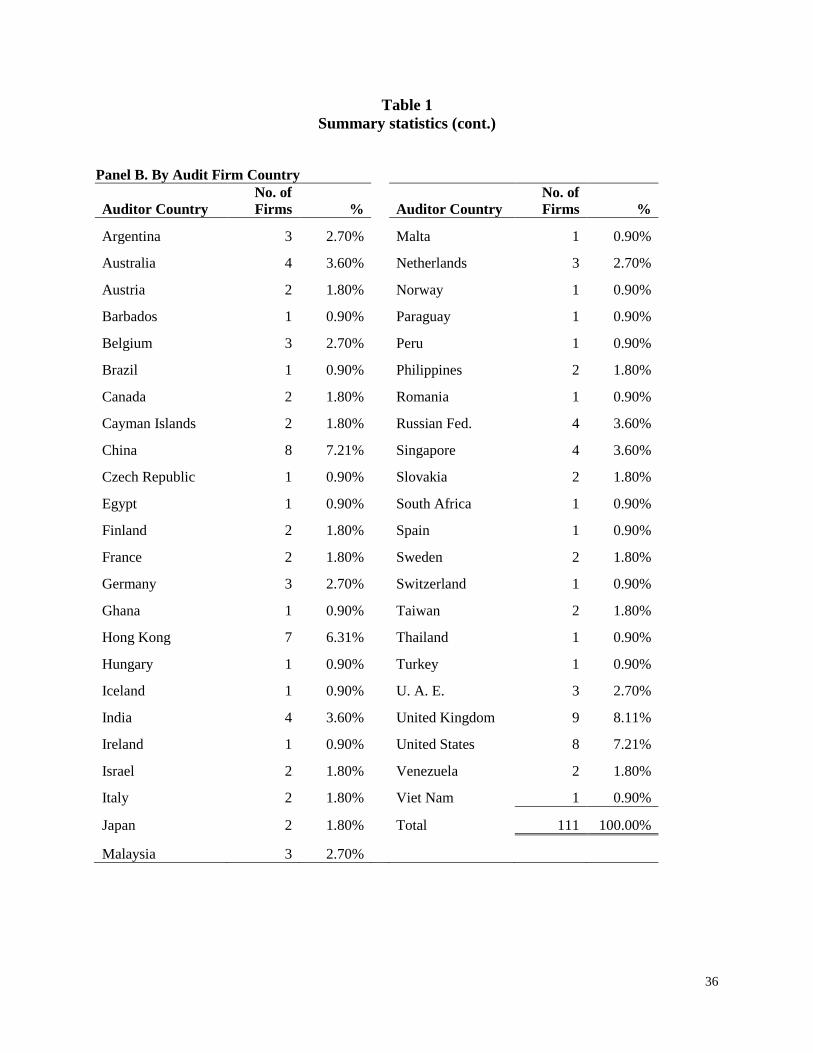
Panel B reports the country breakdown (number and percentage) of the 111 audit firms.
Only eight (7.21%) of the other participant auditors in our sample are U.S. domiciled. The
foreign domiciled other participant auditors are widely dispersed across 45 countries. The three
countries with the largest concentration of the participating auditors in the sample are United
Kingdom (9 auditors or 8.11%), China (8 auditors or 7.21%) and Hong Kong (7 auditors or
6.31%). Interestingly, these three countries are among those countries that prevented the PCAOB
18
from conducting inspections at that time (June 2010).16
Panel C tabulates the number and
percentage of the 111 auditors by the number of SEC issuer audits in which they have
“substantially participated”. The vast majority of these auditors (102, or 91.9%) are involved in
the audits of four or fewer SEC issuers. In fact, 76 (68.5%) of the auditors are involved in the
audit of a single SEC issuer.
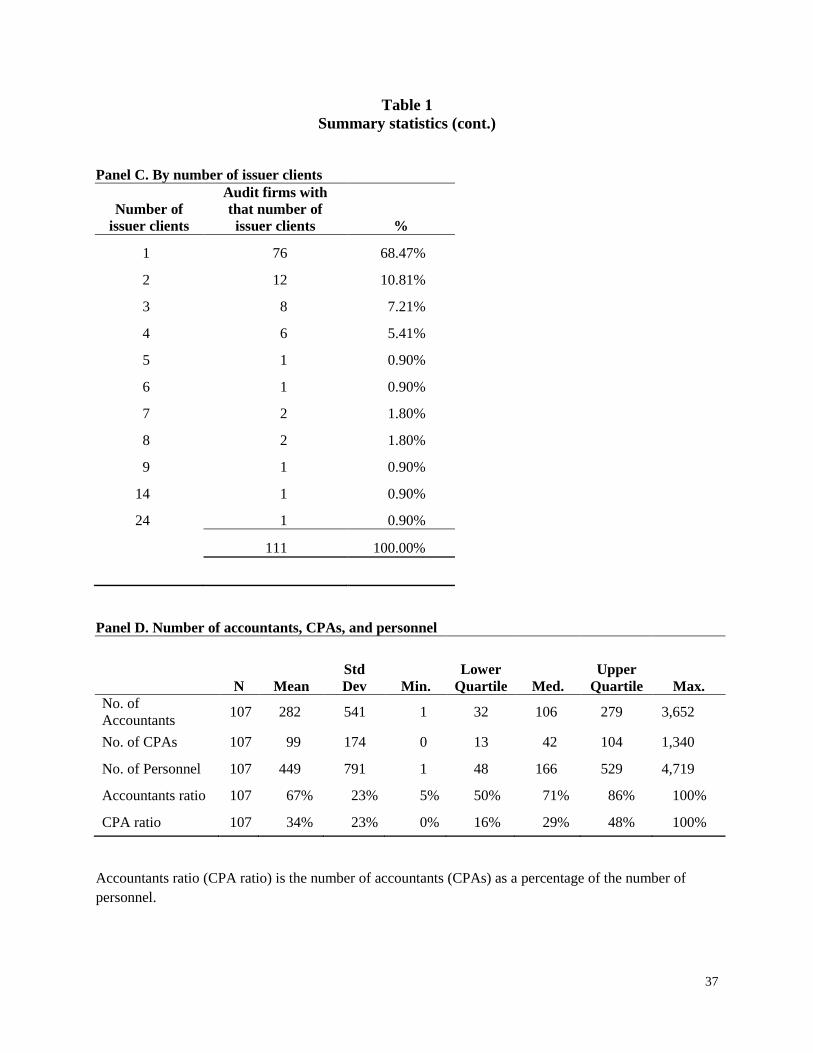
Panel D presents descriptive statistics on the number of accountants, CPAs, and
personnel as well as the percentage of accountants and CPAs hired by these auditors. 107 of the
111 audit firms report this information in their annual reports and are used in the analysis. The
CPA category includes accountants licensed in the US or those holding equivalent certifications
from other countries (such as Chartered Accountants of England and Wales or Chartered
Accountants of India). The average (median) audit firm in our sample hires 449 (166) total
personnel. The average (median) percentage of accountants is 67% (71%) and the average
(median) percentage of CPAs is 34% (29%).
Sample Selection: Market Reaction Analysis
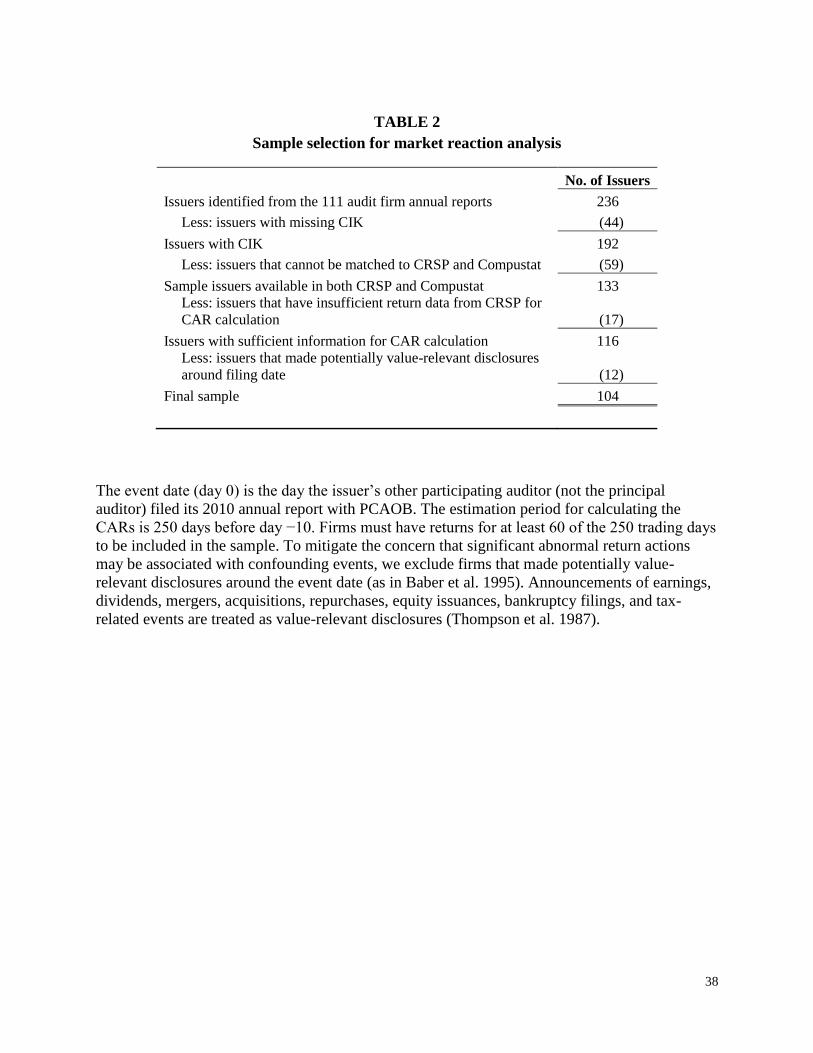
Table 2 presents the sample selection procedures to identify the SEC issuers used in the
market reaction analysis. We begin with 236 SEC issuers we identify from the 111 annual
reports filed by firms that substantially participate in the audits of SEC issuers but do not serve
as principal auditor for any issuer. We eliminate 44 issuers with missing CIKs and 59 issuers we
cannot match to CRSP and Compustat. An additional 17 issuers are eliminated because they fail
to meet the CRSP data requirements for the calculation of CAR. Issuers must have stock return
data for at least 60 of the 250 days in the estimation period (−260, −10) to be included in the
sample. Finally, as in Baber et al. (1995), we drop 12 issuers that made potentially value relevant
16
In January 2011, the Board announced a cooperative agreement with its U.K. counterpart that will allow the
PCAOB to conduct inspections of U.K. domiciled audit firms registered with the PCAOB.
19
disclosures around the event date (the date the auditors in our sample filed their annual reports
with the PCAOB). Announcements of earnings, dividends, mergers, acquisitions, repurchases,
equity issuances, bankruptcy filings, and tax related events are considered value-relevant
disclosures (Thompson et al. 1987).
The above procedures result in a final sample for the univariate market analysis of 104
SEC issuers audited by 46 unique principal auditors (auditors that issue audit opinions) along
with 57 unique other participating auditors. 75 of the 104 issuers have a U.S. domiciled principal
auditor (33 Big 4 and 42 non-Big 4) and the remaining 29 have a non-U.S. (including Canada)
domiciled principal auditor (24 Big 4 affiliated and five other). The other participating auditors
for 60 of the issuers are domiciled in countries such as China, Sweden and U.K. that at the time
denied the Board access to inspection. For 62 of the issuers, the other participating auditors
identify their role in the audit as “Audit Issuer Subsidiary”, while 29 of the issuers had other
participating auditors describe their role as “Subcontractor Assist Principal Auditor”. For the
remaining 13 issuers, the other participating auditors assumed different roles which we classify
as “other”.
As discussed earlier, we use a matched control sample design in our analysis. Thus for
each of the above 104 companies identified as having other participants in their audits
(experimental companies), we find a matching company that (1) has not been identified as
having other participants in its audit, (2) is in the same three digit SIC code as the experimental
company, and (3) is closest in total assets to the experimental company.
In the multivariate analysis that examines whether CAR is lower for issuers identified as
having other participants in their audits, we drop 18 pairs of issuers—i.e., experimental and
matched control, or 36 total issuers—because information needed to compute one or more of the
20
independent variables in the regression is not available. Thus we use 172 issuers (86
experimental and 86 matching control issuers) in the cross-sectional regression relating CAR to a
dummy variable that indicates whether the issuer is identified as having other participants in its
audits (along with control variables to proxy for firm-specific characteristics).
Sample Selection: Market Valuation of Earnings Surprises (ERC) Analysis
As discussed in the research design section, the principal purpose of the ERC analysis is
to test if the market perceives the disclosure of other audit participants informative and reflects
this in its valuation of unexpected earnings in the post disclosure period. We define unexpected
earnings (UE) in two ways: analyst forecast error (FE) and quarterly earnings changes (QUE).
FE is arguably a better proxy for unexpected earnings than QUE, because FE reflects changes in
earnings expectations after last quarter’s earnings announcement up to the release of the latest
analyst forecast. However, data limitations in I/B/E/S significantly reduce the number of issuer
firms for which we can compute FE and may result in a low power test. Thus we report results
from both ERC models: one using FE as a proxy for unexpected earnings and another using
QUE.
For the ERC model using QUE, all 104 pairs of experimental and matched control issuers
(i.e., 208 issuers) have complete information in Compustat needed to compute QUE. We use
quarterly earnings announced two quarters before and after the event dates—the dates the other
participating audit firms filed Form 2. Thus, we have 416 issuer-quarters for both the
experimental and matching control subsamples when using QUE, or a total of 832 issuer-quarters
in the pooled models.
For the analysis using FE, 48 pairs of experimental and control issuers (96 issuers) have
complete data in I/B/E/S for the two quarters immediately before and after the event date. As a
21
result, when using FE to proxy for unexpected earnings we have 192 issuer-quarters for each of
the experimental and matched control subsamples, and 384 issuer-quarters in the pooled ERC
analyses.
RESULTS
In this section we report the results from our market reaction and ERC analyses. First we
present the univariate results from the market reaction analysis for the experimental and matched
control subsamples. Next we show results from a pooled cross-sectional regression model of
experimental and control issuers. The model estimates CAR as a function of an indicator variable
DISCLOSED, set to one when a company is identified by a participant audit firm as having other
participants in its audits and zero otherwise, and certain client-specific characteristics identified
in prior research as being associated with abnormal returns. We then discuss results from the
market valuation of earnings (ERC) analysis by subsamples (experimental and matched control)
and full sample (pooled experimental and matched).
Results: Market Reaction Analysis
Univariate
Table 3 presents results from the univariate market reaction analysis. In panel A, we
report the results for the companies that are identified as having other participants in their audits
(experimental companies) and in Panel B the results for the matched control firms. CAR is
computed for four alternative event windows: one day (0, 0), two days, (0, +1), three days, (0,
+2) and four days (0, +3). The event day (day 0) is the day the other participating auditors filed
their annual reports with the PCAOB. The p-values we report are from the parametric t-test, the
non-parametric randomization test and the two median based non-parametric tests—the sign and
the Wilcoxon signed rank tests.
22
In the experimental subsample (Panel A), neither the parametric t-test nor the non-
parametric tests (randomized, sign, and signed rank tests) reject the null hypothesis that the one
day CAR is not significantly different from zero. However, the mean (median) CAR for the two
day, three day, and four day event windows are −0.88 (−0.69), −0.91 (−0.71), and −1.36 (−1.03)
percent, respectively and all but one are statistically significant at two-tail p-values of 0.10 or
less.17
Investors appear to be revising down the market prices of issuers upon learning about the
presence of other participants in the audits.
In contrast, for the matched control subsample (Panel B), the mean and median CARs are
smaller in magnitude, have mixed signs (some positive and some negative) and neither the
parametric t-test nor the non-parametric randomized, sign and signed rank tests reject the null
hypothesis that CAR is not significantly different from zero, across all windows. While we find a
significant negative market reaction for the companies that have been identified as having other
participants in their audits, we do not find any significant market reactions for the companies in
the matched control group. This implies that the significant negative market reaction we
document for the companies identified as having other participants in audits is a result of the
disclosure of other participants in audits.
In additional subsample analysis (not tabulated), we examine if the negative market
reaction to the disclosure of the other participants in audits we document in the experimental
sample differs across major classes of issuers. First, we put the 104 issuers into two groups on
the basis of whether they have a U.S. (75) or non-U.S. domiciled (29) principal auditor. The
mean CARs are negative for both groups across all four event windows and the difference of
means t-tests do not reject the equality of the mean market reactions for the two groups. Next, we
compare the mean market reactions between issuers with participating auditors domiciled in
17
The only exception is the sign test p-value for the two day event window, which is 0.112.
23
countries that prevent the PCAOB from conducting inspections (60) and those domiciled in
countries that allow PCAOB inspections, including the U.S. (44). We find a significant
difference in mean market reaction on the event day (0, 0). The market reaction is significantly
more negative for issuers with participating auditors from countries that prevent PCAOB
inspections, with two-tail p-value of 0.08. However, we do not find a statistically significant
difference between the negative market reactions of the two groups in the other three windows.
In our final subsample analysis, we group issuers in the experimental sample by the role
the participating auditors played as reported in Form 2 (“audit issuer subsidiary”, “assist the
principal auditor” and “other”). In an analysis that classifies “other” as a part of the “assist
principal auditor” group, we find that the market reaction is more negative for the “assist
principal auditor” group (n=42) than the “audit issuer subsidiary” group (n=62), with difference
of mean two-tailed p-values of 0.006 and 0.08 in the one-day and two-day event windows,
respectively. We find similar results, albeit stronger, when we put the issuers in the other group
as part of the audit issuer subsidiary group or completely exclude them from the analysis.
Multivariate
In order to ensure that the results we find in the univariate analysis are robust to
controlling for firm specific characteristic variables that previous research finds to be associated
with CAR, we estimate a multivariate cross sectional regression model on the pooled sample of
companies in both the experimental and matched control groups. This allows us to see if the
abnormal returns are associated with investors’ knowledge of the presence of other participants
in audits after controlling for certain client-specific characteristics.
Table 4, Panels A and B present the descriptive statistics by subsample (experimental and
matching) for the control variables in the cross sectional market reaction model. The descriptive
24
statistics show that the experimental and matching firms are similar across most dimensions. In
difference of means tests for each control variable, we cannot reject the null hypothesis that the
experimental and matched samples were taken from the same population.
Results for the cross sectional regression analysis are in Table 4, Panel C. The model is
estimated on the full sample (pooled experimental and matching companies). The dependent
variables are the CARs for the two-day, three-day, and four-day event windows. The models
include an indicator variable DISCLOSED, which equals one for clients with other participant
audit firms disclosed in PCAOB Form 2 filings, and zero otherwise. All continuous independent
variables are demeaned. Heteroskedasticity and event-day clustering robust standard errors are
used in the statistical tests.
All three models in Table 4 Panel C are well specified with adjusted R-squares of
19.68%, 12.87% and 15.51%, respectively. Many of the control variables are significant in at
least one of the models at 10% or less (two-tail) level. LAGRET and INSTHOLD are statistically
significant in all models, PRBANKRUPT in the two-day and four-day models, ROA in the two-
day and three-day models, and LNASSET and FEERATIO in the four-day model. CAR is
increasing (i.e., is less negative) with the size of the issuer and the percentage of institutional
holding; and decreasing (i.e., is more negative) for firms with higher financial distress, higher
previous returns, higher ROA and higher fee ratio. More importantly, the variable of interest,
DISCLOSED, is negative and significant in all three models. These results indicate that the
negative market reaction to the disclosure of other audit participants is robust to controlling for
firm specific variables that previous research finds to be associated with CAR.
In additional analyses not tabulated, we estimate the multivariate model (equation 4) on
the experimental companies subsample and include variables that proxy for the workforce size
25
and expertise of the substantially participating auditors.18
We estimate 2 models: one that
includes in equation 4 the number of personnel, number of CPAs, and number of accountants for
the other audit participants, and one that includes number of personnel, percentage of CPAs and
percentage of accountants for the other audit participants. In these models, we find that number
(percentage) of CPAs is positively related to CAR, with two-tailed p-value of 0.088 (0.075).
Number of personnel, and number and percentage of accountants are not significantly related to
CAR. This indicates that the negative market reaction to the announcement of other audit
participants is decreasing (i.e., is less negative) with the ratio or number of CPAs hired by the
other audit participant of the issuer.
Results: Market Valuation of Earnings Surprises (ERC)
Tables 5 and 6 report the results from the estimation of the ERC regression model
(Equation 5) we specified in the research design section by subsample (experimental and
matching companies). In Table 5, we report the results from the regression model that uses
analyst forecast error (FE) as the proxy for unexpected earnings. In Table 6, we report the results
from the model that proxies unexpected earnings with change in actual earnings from quarter t-4
to quarter t (QUE). In both Tables 5 and 6, descriptive statistics on the dependent and
independent variables are presented in Panel A for the experimental subsample and Panel B for
the matching subsample. The regression results for both subsamples are in Panel C of Tables 5
and 6.
For each subsample (experimental and matching) in Table 5, the regression results (Panel
C) from the model that defines CAR as the size-adjusted return (risk-adjusted return) are
reported on the left (right). Both models are well specified with adjusted R-squares of 9.88% and
18
We exclude the control sample issuers because we cannot obtain information about whether their audits are
conducted using auditors other than the principal auditor.
26
10.15%, respectively for the experimental companies subsample and 14.58% and 15.54%,
respectively for the matching subsample. In the experimental companies subsample, the variable
of interest, , is negative and significant (two-tail p-value < 0.01) in both models. This
finding is consistent with the notion that (1) the PCAOB’s required disclosure by auditors of
their significant participation in the audits of issuers provides new information to investors, and
(2) investors behave as if they perceive the participation of other auditors as reducing the quality
of the audit. However, in the matching companies subsample, is not significant at
traditional levels suggesting that the decline in ERC for the experimental companies is likely
driven by the disclosure by other participant auditors of their involvements in the audits of these
companies.
In the experimental subsample, FE is positive and significant in both models (two-tail p-
value < 0.05); the market values unexpected earnings positively. Moreover, all the control
variables in the model have signs consistent with those documented in prior research, although
not all are significant. In the size-adjusted CAR model, LEV, LOSS, and
are significant, and LEV, LOSS, , and are significant in the risk-
adjusted CAR model. is weakly significant in the size-adjusted CAR model (with
two-tail p-value of 0.13), while is weakly significant in the risk-adjusted CAR model
(with two-tail p-value of 0.12). In sum, ERC is lower for loss firms and for the fourth quarter
compared to the other three quarters in the size adjusted model. ERC is lower for risky firms
(LEV) and the fourth quarter compared to the other three quarters in the risk adjusted model. In
the matching companies subsample, FE and all the other control variables generally have the
same signs as those in the experimental subsample. However, only FE, LOSS and
are statistically significant at traditional levels.

27
Panel C in Table 6 presents the results from the regression model that uses QUE as a
proxy for unexpected earnings. The general tenor of the results in Table 6 is similar to those we
report in Table 5, with few exceptions. Both the size (left column) and risk-adjusted (right
column) CAR models are well specified, with adjusted R-squares of 11.79% and 9.83%,
respectively in the experimental subsample and 8.57% and 8.30%, respectively in the matching
subsample. The variable of interest for the experimental sample is negative and
significant, albeit weaker in significance than in the model using FE, with two tail p-value <
0.08. The variable of interest is insignificant in the matching sample. QUE is
positive and significant (p-value < 0.01) in both the experimental and matching subsamples. All
the control variables in the experimental subsample have the expected signs although not all are
significant. In the experimental subsample, the control variables LEV, SIZE, LOSS, and
are significant in both models. is significant in only the size-adjusted
model, while is significant in only the risk-adjusted CAR model. Likewise, all the
control variables in the matching subsample have the expected signs but not all are significant.
The control variables STDRET, SIZE, , and are significant in both
models for the matching subsample, while BM and LOSS are significant only in the risk-adjusted
CAR model.
Tables 7 and 8 report the results from estimation of Equation 6—the full sample (pooled
experimental and matching) ERC model. In Table 7, we report the results from the regression
model that uses analyst forecast error (FE) as the proxy for unexpected earnings. In Table 8, we
report the results from the model that proxies unexpected earnings by change in actual earnings
from quarter t-4 to quarter t (QUE). In both Tables 7 and 8, descriptive statistics are in panel A

28
and regression results in Panel B. The regression results on the left (right) of Panel B are for the
size-adjusted (the risk-adjusted) CAR models.
Both the size-adjusted and risk-adjusted CAR models in Table 7 are well specified, with
adjusted R-squares of 11.15% and 11.47%, respectively. All the control variables that are
significant have their expected signs. FE is positive and significant in both models (at 5% level).
In both models, CAR is significantly negatively related to standard deviation of returns
(STDRET), leverage (LEV), LOSS, , and . CAR is significantly related
to BM only in the risk-adjusted CAR model.
More importantly, in Panel B of Table 7 the variable of interest
is significantly negative at traditional levels (p < 0.10) in both the size-adjusted and risk-
adjusted models. This suggests that ERC is lower in the post period (i.e., the period after other
participating auditors disclosed their participation in the audit of issuers) only for those issuers
identified in these disclosures (experimental companies).
Both the size-adjusted and risk-adjusted CAR models in Table 8 are well specified, with
adjusted R-squares of 6.74% and 6.22%, respectively. All the control variables that are
significant have their expected signs. QUE, like FE, is positive and significant in both models (at
5% level). In both models, CAR is significantly negatively related to standard deviation of
returns (STDRET), LOSS, , , , and .
However, more importantly, as in the model using FE to proxy for unexpected earnings, the
variable of interest is significantly negative at traditional levels.
Again, this suggests that ERC is lower in the post period only for those issuers identified as
having other participant auditors (the experimental sample).
29
As robustness check, we repeat the ERC analysis using earnings announcements (1) three
quarters immediately before and three quarters immediately after, and (2) four quarters
immediately before and four quarters immediately after the event date. Lastly, we re-estimate 1
and 2 after excluding the quarter immediately before and the quarter immediately after the event
date. The results (not tabulated) remain essentially the same.
CONCLUSION
We empirically test whether investors’ perceptions of audit quality are affected by news
that firms other than the principal auditor participated in the audit. Our work is motivated in part
by a proposed PCAOB rule that would require registered accounting firms to disclose in the
audit report the names of other firms or individuals that participated in the audit and the
percentage of the audit’s total hours these participants provided. The PCAOB argues that this
requirement would increase transparency and provide investors with valuable information about
the overall quality of the audit. Our study is designed to address some of the questions raised by
the Board in its proposed rule, in particular whether disclosure of other participants in the audit
would be useful information to investors.
Under current PCAOB standards, principal auditors are prohibited from disclosing the
identities of other firms that participated in the audit unless it is a shared responsibility opinion.
Therefore, we obtain data from the annual reports (Form 2) registered audit firms began filing
with the PCAOB in 2010. From the information reported in Part 4.2 of the Form 2 filings, we
identify non-principal auditors that played a “substantial role” in the audits of SEC issuers and
the issuers for which they did this work. Auditors performing a “substantial role” are defined by
the PCAOB as those (1) whose work either comprises 20% of total hours or total fees for the
issuer audit, or (2) who perform the majority of the audit work on a subsidiary constituting 20%
30
of assets or revenues of the issuer. Thus, these auditors provide a significant amount of services
to these audits.
We use a matched control sample research design in the study. Each experimental
company is matched with a control company that is closest in size to the experimental company
within the same three-digit SIC code. Using the filing date of Form 2 as the event date, we find
that cumulative abnormal returns (CARs) are significantly negative in the two-day, three-day,
and four-day event windows for the experimental sample—that is, our sample of issuers that
were listed in an audit firm’s Form 2 as a client for which the firm participated in the audit but
was not the principal auditor. For companies in the matching control sample, none of the CARs
is significantly different from zero. This suggests that the negative market reaction we document
for companies in the experimental sample is a result of the disclosure by other participating
auditors of their involvement in the audits of these issuers.
In order to ensure that the results we find in the univariate analysis are robust to
controlling for firm specific characteristics that previous research finds to be associated with
CAR, we estimate a multivariate cross sectional regression model using the pooled sample of
companies in both the experimental and matched control groups. This allows us to see if the
abnormal returns are associated with investors’ knowledge of the presence of other participants
in audits after controlling for certain client-specific characteristics. The models include an
indicator variable DISCLOSED, which equals one for issuers with audits that used other
participant audit firms (as disclosed by the participant audit firm in its Form 2 filings) and zero
otherwise. We find that CAR is significantly negatively related to DISCLOSED across all three
event windows, suggesting that the disclosure of other audit participants provides new
31
information that is of value to investors’ assessment of the overall quality of the audit, consistent
with the views of the Board and major investor groups.
In our analysis of earnings response coefficients, we use a pre-post design, where each
issuer acts as its own control, to test if the market valuation of earnings surprises changes after
the disclosure of other participants in audits. We estimate four models with two alternative
proxies for the dependent variable: size and risk-adjusted CAR and two alternative proxies for
unexpected earnings: analyst forecast errors and earnings changes from quarter t-4 to t. We
estimate the four models by subsample (experimental and matching) as well as on the full sample
(pooled experimental and matching). In all four model specifications, we find that the variable of
interest, , is significantly negative for the experimental subsample. This indicates
that the market valuation of earnings surprises declines after news of other audit participants is
revealed in the participating audit firms’ Form 2 filings.
However, for the matching subsample, is not significant in any of the four
models. The significance of in only the experimental subsample suggests that the
declines in ERC in the post event period are related to the disclosures made by other audit
participants of their involvement in the audits of the issuers in the experimental subsample. The
results from the ERC model estimated on the full sample (pooled experimental and matching)
corroborate our findings in the subsamples. The variable of interest
is significantly negative in all four models confirming that there is a decline in ERC in the post
period only for those issuers with other participating auditors as disclosed in those firms’ Form 2
filings.
Overall, these results suggest that PCAOB required disclosures by auditors of their
significant participation in the audits of issuers provide new information, and investors behave as
32
if they perceive audits in which other auditors participate negatively after the information is
disclosed. Thus, our empirical results support the PCAOB’s position that the disclosure of other
participants in audits enhances transparency and is of information value to investors.
As indicated earlier, only the auditors that do not issue audit opinions during the
reporting period are required to report their participation in other audits. Thus if an issuer’s audit
received substantial services from other audit participants, but those other audit participants
issued audit opinions to at least one SEC issuer during the reporting period, it will not be
included in our sample. To the extent that the issuers that receive substantial audit services from
auditors required to disclose such services could be systematically different from those that
receive similar services from auditors not required to disclose, our findings may not generalize to
the issuers excluded from the sample due to data availability limitations. With this limitation in
mind, we believe our study provides important empirical evidence that news of other participants
in audits is value-relevant to investors.

33
REFERENCES
American Institute of Certified Public Accountants. 1972. AU Section 543: Part of audit
performed by other independent auditors. http://www.aicpa.org/Research/
Standards/AuditAttest/DownloadableDocuments/AU-00543.pdf. Accessed August 30,
2012.
Baber, W., K. Kumar, and T. Verghese. 1995. Client security price reactions to the Laventhol
and Horwath bankruptcy. Journal of Accounting Research 33: 385-395.
Baber,W., J. Krishnan, and Y. Zhang. 2012. Investor Perceptions of the Earnings Quality
Consequences of Hiring an Affiliated Auditor. Working paper, Georgetown University,
Temple University, and American University.
Blacconiere, W. 1991. Market reactions to accounting regulations in the Savings and Loan
industry. Journal of Accounting and Economics 14: 91-113.
Blacconiere, W., and M. DeFond. 1997. An investigation of independent audit opinions and
subsequent independent auditor litigation of publicly-traded failed savings and loans.
Journal of Accounting and Public Policy 16: 415–454.
Blacconiere, W., and D. Patten. 1994. Environmental disclosures, regulatory costs, and changes
in firm value. Journal of Accounting and Economics 18: 357-377.
Bowen. R., M. Johnson, and T. Shevlin. 1989. A joint test of market efficiency and the
information content of earnings during the stock market crash of October 1987. Journal
of Accounting and Economics 11: 225-254.
Brown, S., and J. Warner. 1985. Using daily returns: The case of event studies. Journal of
Financial Economics 14: 3-31.
CFA Institute. 2010. Independent auditor’s report survey results.
http://www.cfainstitute.org/Survey/independent_auditors_report_survey_results.pdf.
Accessed August 30, 2012.
Choi, S. K., and G. Salamon. 1989. External reporting and capital asset prices. In C.f. Lee (Ed.),
Advances in Quantitative Analysis of Finance and Accounting 3 (Part A): 85-110.
Doty, J. 2011. “Statement on Proposed Amendments to Improve Transparency through
Disclosure of Engagement Partner and Certain Other Participants in Audits.” Speech,
PCAOB Open Board Meeting, October 11. Washington DC.
Francis, J.R., and B. Ke. 2006. Disclosure of fees paid to auditors and the market valuation of
earnings surprises. Review of Accounting Studies 11: 495-523.

34
Hothausen, R., and R. Verrecchia. 1988. The effect of sequential information releases on the
variance of price changes in an intertemporal multi-asset market. Journal of Accounting
Research 26: 82-106.
Investor Advisory Group (IAG). 2011. Presentation of the working group on auditor’s report and
the role of the auditor.
http://pcaobus.org/News/Events/Pages/03162011_IAGMeeting.aspx . Accessed August
13, 2012.
Krishnamurthy, S., J. Zhou, and N. Zhou. 2006.Auditor reputation, auditor independence, and
the stock-market impact of Andersen’s indictment on its client firms. Contemporary
Accounting Research 23 (2): 465–90.
Levin, C. 2012. Comment letter on PCAOB Rulemaking Docket No. 29. January 3.
http://pcaobus.org/Rules/Rulemaking/Docket029/017b_Levin.pdf
Lyubimov, A. 2011. Accepting full responsibility in the audit opinion: Implications for audit
quality. Working paper, University of Central Florida.
Lyubimov, A., V. Arnold, and S. G. Sutton. 2011. Perceptions of quality, risk, and legal liability
associated with outsourcing and offshoring audit procedures. Working paper, University
of Central Florida.
Markopolos, H. 2010. No One Would Listen: A True Financial Thriller. John Wiley & Sons,
Inc.: Hoboken, NJ.
Noreen, E. 1989. An introduction to testing hypothesis using computer-intensive statistics.
Wiley: New York, NY.
Palmrose, Z.V., 1988. An analysis of auditor litigation and audit service quality. The Accounting
Review 63 (January): 55-73
Simunic, D.A., and M. T. Stein. 1987. The impact of litigation risk on audit pricing: A review of
the economics and evidence. Auditing: A Journal of Practice and Theory 15: 120–134.
Thompson, R., C. Olsen, and R. J. Dietrich. 1987. Attributes of news about firms: An analysis
of firm-specific news reported in the wall street journal index. Journal of Accounting
Research 25 (2): 245 – 274.
Zmijewski, M. 1984. Methodological Issues Related to the Estimation of Financial Distress
Prediction Models. Journal of Accounting Research 24 (Supplement): 59-82.
35
Table 1
Summary statistics
Panel A. By filing date of Form 2
Filing Date Number of
firm filings Percentage
In May 2010 6 5.41%
From June 1, 2010 to June 27, 2010 14 12.61%
On June 28, 2010 6 5.41%
On June 29, 2010 21 18.92%
On June 30, 2010 41 36.94%
In July 2010 5 4.50%
In August 2010 7 6.31%
In September 2010 9 8.11%
After September 30, 2010 2 1.80%
Total 111 100.00%
36
Table 1
Summary statistics (cont.)
Panel B. By Audit Firm Country
Auditor Country
No. of
Firms %
Auditor Country
No. of
Firms %
Argentina 3 2.70%
Malta 1 0.90%
Australia 4 3.60%
Netherlands 3 2.70%
Austria 2 1.80%
Norway 1 0.90%
Barbados 1 0.90%
Paraguay 1 0.90%
Belgium 3 2.70%
Peru 1 0.90%
Brazil 1 0.90%
Philippines 2 1.80%
Canada 2 1.80%
Romania 1 0.90%
Cayman Islands 2 1.80%
Russian Fed. 4 3.60%
China 8 7.21%
Singapore 4 3.60%
Czech Republic 1 0.90%
Slovakia 2 1.80%
Egypt 1 0.90%
South Africa 1 0.90%
Finland 2 1.80%
Spain 1 0.90%
France 2 1.80%
Sweden 2 1.80%
Germany 3 2.70%
Switzerland 1 0.90%
Ghana 1 0.90%
Taiwan 2 1.80%
Hong Kong 7 6.31%
Thailand 1 0.90%
Hungary 1 0.90%
Turkey 1 0.90%
Iceland 1 0.90%
U. A. E. 3 2.70%
India 4 3.60%
United Kingdom 9 8.11%
Ireland 1 0.90%
United States 8 7.21%
Israel 2 1.80%
Venezuela 2 1.80%
Italy 2 1.80%
Viet Nam 1 0.90%
Japan 2 1.80%
Total 111 100.00%
Malaysia 3 2.70%
37
Table 1
Summary statistics (cont.)
Panel C. By number of issuer clients
Number of
issuer clients
Audit firms with
that number of
issuer clients %
1 76 68.47%
2 12 10.81%
3 8 7.21%
4 6 5.41%
5 1 0.90%
6 1 0.90%
7 2 1.80%
8 2 1.80%
9 1 0.90%
14 1 0.90%
24 1 0.90%
111 100.00%
Panel D. Number of accountants, CPAs, and personnel
N Mean
Std
Dev Min.
Lower
Quartile Med.
Upper
Quartile Max.
No. of
Accountants 107 282 541 1 32 106 279 3,652
No. of CPAs 107 99 174 0 13 42 104 1,340
No. of Personnel 107 449 791 1 48 166 529 4,719
Accountants ratio 107 67% 23% 5% 50% 71% 86% 100%
CPA ratio 107 34% 23% 0% 16% 29% 48% 100%
Accountants ratio (CPA ratio) is the number of accountants (CPAs) as a percentage of the number of
personnel.
38
TABLE 2
Sample selection for market reaction analysis
No. of Issuers
Issuers identified from the 111 audit firm annual reports 236
Less: issuers with missing CIK (44)
Issuers with CIK 192
Less: issuers that cannot be matched to CRSP and Compustat (59)
Sample issuers available in both CRSP and Compustat 133
Less: issuers that have insufficient return data from CRSP for
CAR calculation (17)
Issuers with sufficient information for CAR calculation 116
Less: issuers that made potentially value-relevant disclosures
around filing date (12)
Final sample 104
The event date (day 0) is the day the issuer’s other participating auditor (not the principal
auditor) filed its 2010 annual report with PCAOB. The estimation period for calculating the
CARs is 250 days before day −10. Firms must have returns for at least 60 of the 250 trading days
to be included in the sample. To mitigate the concern that significant abnormal return actions
may be associated with confounding events, we exclude firms that made potentially value-
relevant disclosures around the event date (as in Baber et al. 1995). Announcements of earnings,
dividends, mergers, acquisitions, repurchases, equity issuances, bankruptcy filings, and tax-
related events are treated as value-relevant disclosures (Thompson et al. 1987).
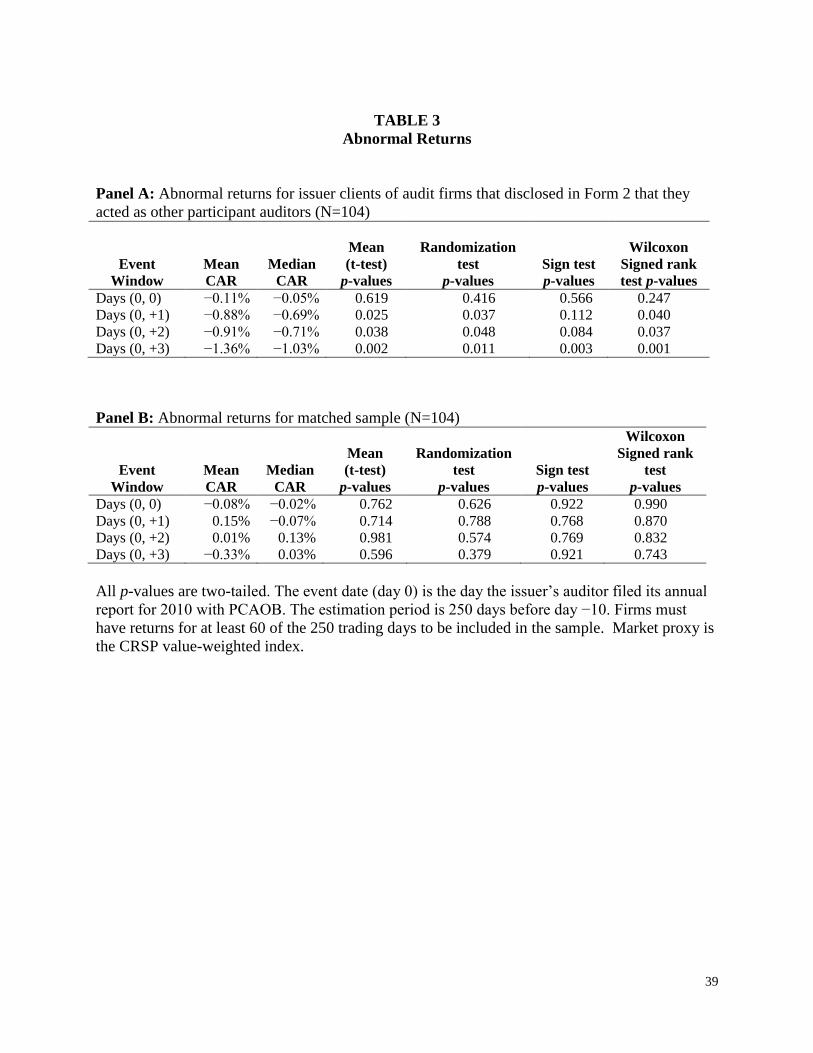
39
TABLE 3
Abnormal Returns
Panel A: Abnormal returns for issuer clients of audit firms that disclosed in Form 2 that they
acted as other participant auditors (N=104)
Event
Window
Mean
CAR
Median
CAR
Mean
(t-test)
p-values
Randomization
test
p-values
Sign test
p-values
Wilcoxon
Signed rank
test p-values
Days (0, 0) −0.11% −0.05% 0.619 0.416 0.566 0.247
Days (0, +1) −0.88% −0.69% 0.025 0.037 0.112 0.040
Days (0, +2) −0.91% −0.71% 0.038 0.048 0.084 0.037
Days (0, +3) −1.36% −1.03% 0.002 0.011 0.003 0.001
Panel B: Abnormal returns for matched sample (N=104)
Event
Window
Mean
CAR
Median
CAR
Mean
(t-test)
p-values
Randomization
test
p-values
Sign test
p-values
Wilcoxon
Signed rank
test
p-values
Days (0, 0) −0.08% −0.02% 0.762 0.626 0.922 0.990
Days (0, +1) 0.15% −0.07% 0.714 0.788 0.768 0.870
Days (0, +2) 0.01% 0.13% 0.981 0.574 0.769 0.832
Days (0, +3) −0.33% 0.03% 0.596 0.379 0.921 0.743
All p-values are two-tailed. The event date (day 0) is the day the issuer’s auditor filed its annual
report for 2010 with PCAOB. The estimation period is 250 days before day −10. Firms must
have returns for at least 60 of the 250 trading days to be included in the sample. Market proxy is
the CRSP value-weighted index.
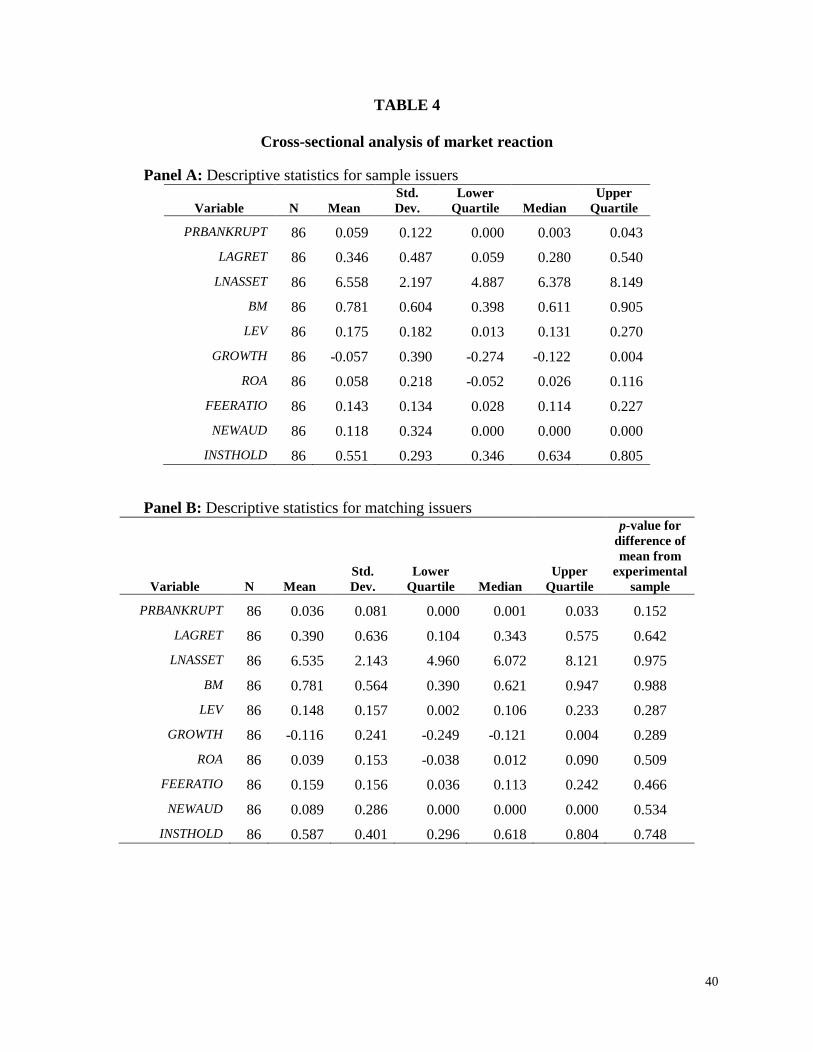
40
TABLE 4
Cross-sectional analysis of market reaction
Panel A: Descriptive statistics for sample issuers
Variable N Mean
Std.
Dev.
Lower
Quartile Median
Upper
Quartile
PRBANKRUPT 86 0.059 0.122 0.000 0.003 0.043
LAGRET 86 0.346 0.487 0.059 0.280 0.540
LNASSET 86 6.558 2.197 4.887 6.378 8.149
BM 86 0.781 0.604 0.398 0.611 0.905
LEV 86 0.175 0.182 0.013 0.131 0.270
GROWTH 86 -0.057 0.390 -0.274 -0.122 0.004
ROA 86 0.058 0.218 -0.052 0.026 0.116
FEERATIO 86 0.143 0.134 0.028 0.114 0.227
NEWAUD 86 0.118 0.324 0.000 0.000 0.000
INSTHOLD 86 0.551 0.293 0.346 0.634 0.805
Panel B: Descriptive statistics for matching issuers
Variable N Mean
Std.
Dev.
Lower
Quartile Median
Upper
Quartile
p-value for
difference of
mean from
experimental
sample
PRBANKRUPT 86 0.036 0.081 0.000 0.001 0.033 0.152
LAGRET 86 0.390 0.636 0.104 0.343 0.575 0.642
LNASSET 86 6.535 2.143 4.960 6.072 8.121 0.975
BM 86 0.781 0.564 0.390 0.621 0.947 0.988
LEV 86 0.148 0.157 0.002 0.106 0.233 0.287
GROWTH 86 -0.116 0.241 -0.249 -0.121 0.004 0.289
ROA 86 0.039 0.153 -0.038 0.012 0.090 0.509
FEERATIO 86 0.159 0.156 0.036 0.113 0.242 0.466
NEWAUD 86 0.089 0.286 0.000 0.000 0.000 0.534
INSTHOLD 86 0.587 0.401 0.296 0.618 0.804 0.748
41
TABLE 4
Cross-sectional analysis of market reaction (cont.)
Panel C: Regression. N=172. T statistics in parentheses.
Dependent Variable
Two-day
CAR (0, 1)
Three-day
CAR (0, 2)
Four-day
CAR (0, 3)
Intercept 0.000 0.000 −0.006
(0.09) (0.12) (−0.93)
DISCLOSED −0.008 −0.010 −0.012
(−2.76) ** (−2.16)* (−2.52) **
PRBANKRUPT −0.075 −0.043 −0.093
(−1.89) * (−0.92) (−2.27) **
LAGRET −0.025 −0.027 −0.038
(−2.42) ** (−4.15) *** (−2.72) **
LNASSET 0.001 0.002 0.004
(0.61) (1.01) (4.59) ***
BM 0.006 −0.001 −0.001
(1.01) (−0.09) (−0.11)
LEV 0.011 −0.004 −0.002
(1.20) (−0.20) (−0.09)
GROWTH −0.013 −0.014 −0.013
(−1.20) (−0.82) (−0.68)
ROA −0.060 −0.056 −0.055
(−6.38) *** (−2.06) * (−1.38)
FEERATIO −0.017 −0.025 −0.029
(−1.51) (−1.63) (−2.66) **
NEWAUD 0.007 0.017 0.007
(0.73) (1.22) (0.41)
INSTHOLD 0.020 0.027 0.018
(2.84) ** (2.68) ** (1.80) *
Adj. R2 0.1968 0.1287 0.1551
***, **, and * indicate significance at the 1%, 5%, and 10% level, respectively, two-tailed. 86 pairs of sample and
matching firms have the information required to compute all independent variables. DISCLOSED equals one for
issuers that are disclosed in the participating auditor’s FORM 2 (sample firms) and zero otherwise (matching firms).
PRBANKRUPT equals Zmijewski’s [1984] financial distress measure for issuer. LAGRET equals issuer’s one year
cumulative raw returns prior to the participating auditor’s Form 2 filing. LNASSET equals natural log of issuer’s
total assets (in million dollars). BM equals issuer’s book value of equity scaled by market value of equity. LEV
equals issuer’s total debt to total assets. GROWTH equals issuer’s growth rate in sales. ROA equals Issuer’s 2-digit
SIC code median adjusted ROA. FEERATIO equals ratio of non-audit fees to total fees paid by issuer. NEWAUD
equals one if issuer switched auditor during the year prior to the participating auditor’s Form 2 filing and zero
otherwise. INSTHOLD equals percentage of issuer shares owned by institutional shareholders. In Panel C, all
continuous independent variables are demeaned.
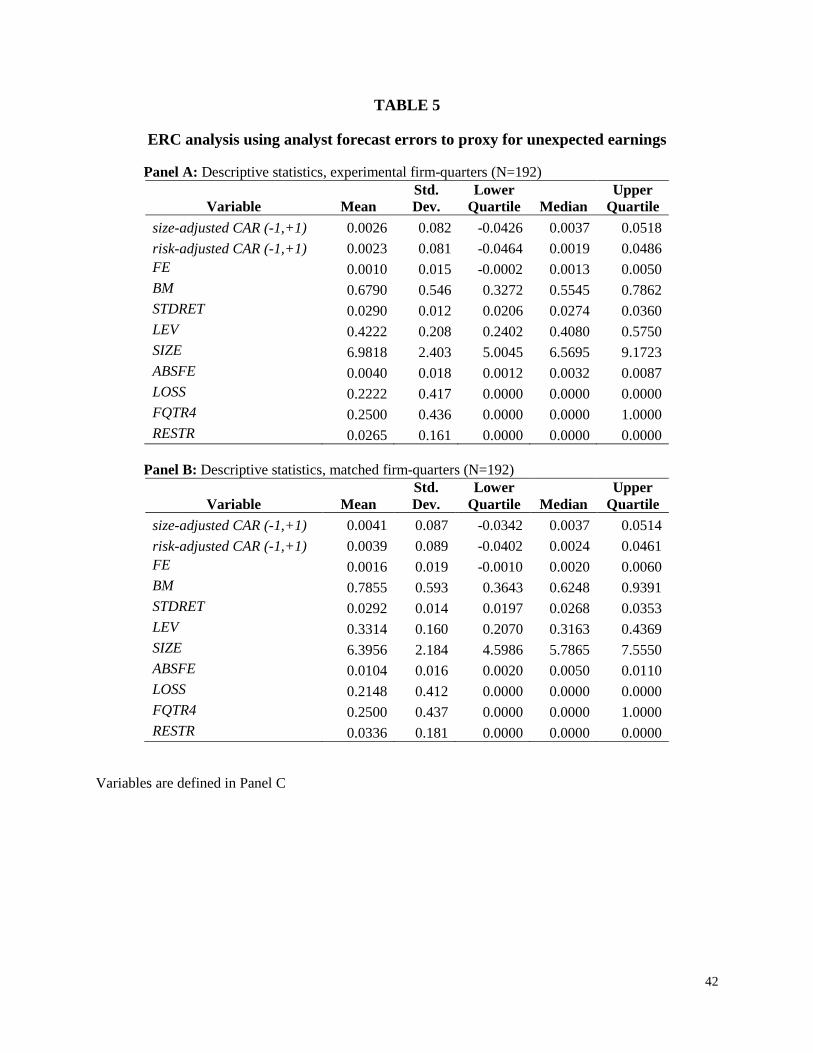
42
TABLE 5
ERC analysis using analyst forecast errors to proxy for unexpected earnings
Panel A: Descriptive statistics, experimental firm-quarters (N=192)
Variable Mean
Std.
Dev.
Lower
Quartile Median
Upper
Quartile
size-adjusted CAR (-1,+1) 0.0026 0.082 -0.0426 0.0037 0.0518
risk-adjusted CAR (-1,+1) 0.0023 0.081 -0.0464 0.0019 0.0486
FE 0.0010 0.015 -0.0002 0.0013 0.0050
BM 0.6790 0.546 0.3272 0.5545 0.7862
STDRET 0.0290 0.012 0.0206 0.0274 0.0360
LEV 0.4222 0.208 0.2402 0.4080 0.5750
SIZE 6.9818 2.403 5.0045 6.5695 9.1723
ABSFE 0.0040 0.018 0.0012 0.0032 0.0087
LOSS 0.2222 0.417 0.0000 0.0000 0.0000
FQTR4 0.2500 0.436 0.0000 0.0000 1.0000
RESTR 0.0265 0.161 0.0000 0.0000 0.0000
Panel B: Descriptive statistics, matched firm-quarters (N=192)
Variable Mean
Std.
Dev.
Lower
Quartile Median
Upper
Quartile
size-adjusted CAR (-1,+1) 0.0041 0.087 -0.0342 0.0037 0.0514
risk-adjusted CAR (-1,+1) 0.0039 0.089 -0.0402 0.0024 0.0461
FE 0.0016 0.019 -0.0010 0.0020 0.0060
BM 0.7855 0.593 0.3643 0.6248 0.9391
STDRET 0.0292 0.014 0.0197 0.0268 0.0353
LEV 0.3314 0.160 0.2070 0.3163 0.4369
SIZE 6.3956 2.184 4.5986 5.7865 7.5550
ABSFE 0.0104 0.016 0.0020 0.0050 0.0110
LOSS 0.2148 0.412 0.0000 0.0000 0.0000
FQTR4 0.2500 0.437 0.0000 0.0000 1.0000
RESTR 0.0336 0.181 0.0000 0.0000 0.0000
Variables are defined in Panel C
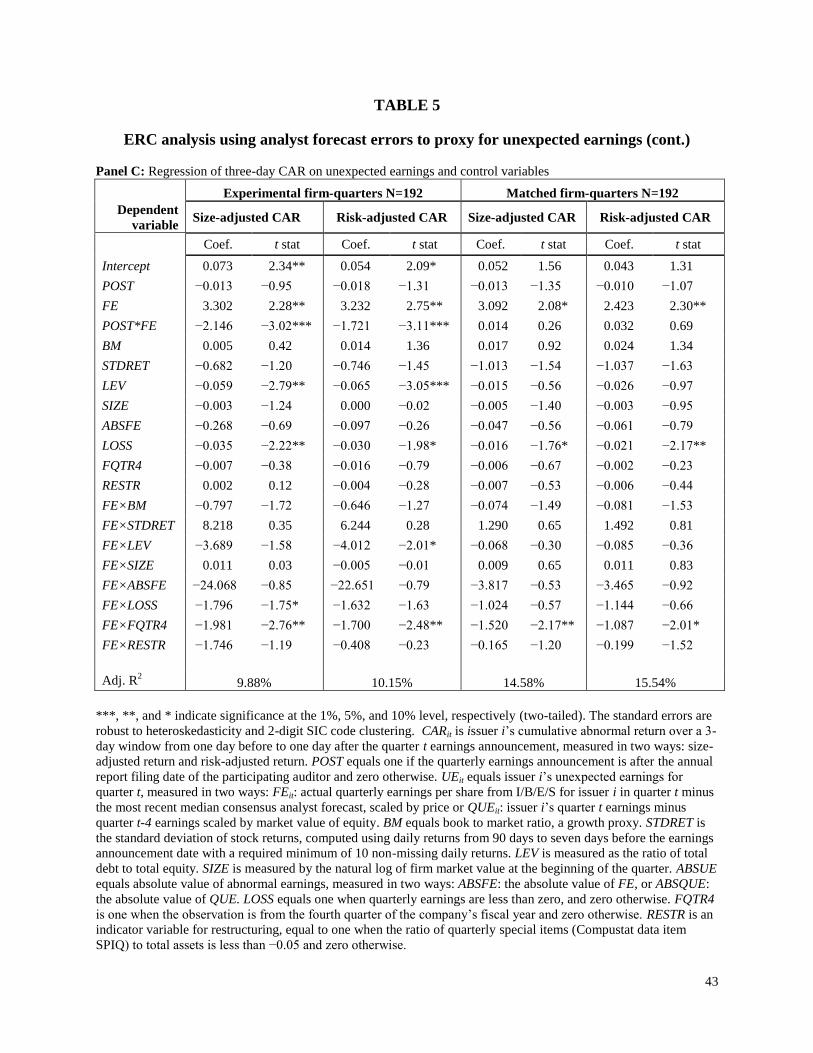
43
TABLE 5
ERC analysis using analyst forecast errors to proxy for unexpected earnings (cont.)
Panel C: Regression of three-day CAR on unexpected earnings and control variables
Experimental firm-quarters N=192 Matched firm-quarters N=192
Dependent
variable Size-adjusted CAR Risk-adjusted CAR Size-adjusted CAR Risk-adjusted CAR
Coef. t stat Coef. t stat Coef. t stat Coef. t stat
Intercept 0.073 2.34** 0.054 2.09* 0.052 1.56 0.043 1.31
POST −0.013 −0.95 −0.018 −1.31 −0.013 −1.35 −0.010 −1.07
FE 3.302 2.28** 3.232 2.75** 3.092 2.08* 2.423 2.30**
POST*FE −2.146 −3.02*** −1.721 −3.11*** 0.014 0.26 0.032 0.69
BM 0.005 0.42 0.014 1.36 0.017 0.92 0.024 1.34
STDRET −0.682 −1.20 −0.746 −1.45 −1.013 −1.54 −1.037 −1.63
LEV −0.059 −2.79** −0.065 −3.05*** −0.015 −0.56 −0.026 −0.97
SIZE −0.003 −1.24 0.000 −0.02 −0.005 −1.40 −0.003 −0.95
ABSFE −0.268 −0.69 −0.097 −0.26 −0.047 −0.56 −0.061 −0.79
LOSS −0.035 −2.22** −0.030 −1.98* −0.016 −1.76* −0.021 −2.17**
FQTR4 −0.007 −0.38 −0.016 −0.79 −0.006 −0.67 −0.002 −0.23
RESTR 0.002 0.12 −0.004 −0.28 −0.007 −0.53 −0.006 −0.44
FE×BM −0.797 −1.72 −0.646 −1.27 −0.074 −1.49 −0.081 −1.53
FE×STDRET 8.218 0.35 6.244 0.28 1.290 0.65 1.492 0.81
FE×LEV −3.689 −1.58 −4.012 −2.01* −0.068 −0.30 −0.085 −0.36
FE×SIZE 0.011 0.03 −0.005 −0.01 0.009 0.65 0.011 0.83
FE×ABSFE −24.068 −0.85 −22.651 −0.79 −3.817 −0.53 −3.465 −0.92
FE×LOSS −1.796 −1.75* −1.632 −1.63 −1.024 −0.57 −1.144 −0.66
FE×FQTR4 −1.981 −2.76** −1.700 −2.48** −1.520 −2.17** −1.087 −2.01*
FE×RESTR −1.746 −1.19 −0.408 −0.23 −0.165 −1.20 −0.199 −1.52
Adj. R2 9.88% 10.15% 14.58% 15.54%
***, **, and * indicate significance at the 1%, 5%, and 10% level, respectively (two-tailed). The standard errors are
robust to heteroskedasticity and 2-digit SIC code clustering. CARit is issuer i’s cumulative abnormal return over a 3-
day window from one day before to one day after the quarter t earnings announcement, measured in two ways: size-
adjusted return and risk-adjusted return. POST equals one if the quarterly earnings announcement is after the annual
report filing date of the participating auditor and zero otherwise. UEit equals issuer i’s unexpected earnings for
quarter t, measured in two ways: FEit: actual quarterly earnings per share from I/B/E/S for issuer i in quarter t minus
the most recent median consensus analyst forecast, scaled by price or QUEit: issuer i’s quarter t earnings minus
quarter t-4 earnings scaled by market value of equity. BM equals book to market ratio, a growth proxy. STDRET is
the standard deviation of stock returns, computed using daily returns from 90 days to seven days before the earnings
announcement date with a required minimum of 10 non-missing daily returns. LEV is measured as the ratio of total
debt to total equity. SIZE is measured by the natural log of firm market value at the beginning of the quarter. ABSUE
equals absolute value of abnormal earnings, measured in two ways: ABSFE: the absolute value of FE, or ABSQUE:
the absolute value of QUE. LOSS equals one when quarterly earnings are less than zero, and zero otherwise. FQTR4
is one when the observation is from the fourth quarter of the company’s fiscal year and zero otherwise. RESTR is an
indicator variable for restructuring, equal to one when the ratio of quarterly special items (Compustat data item
SPIQ) to total assets is less than −0.05 and zero otherwise.
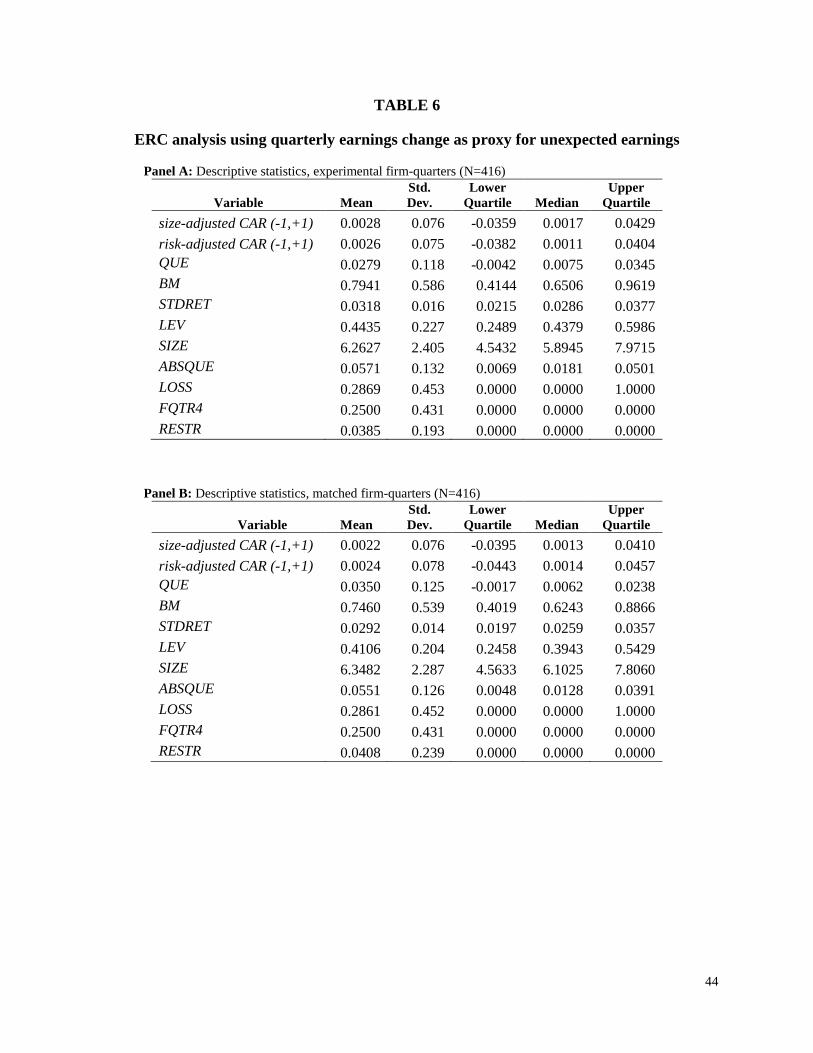
44
TABLE 6
ERC analysis using quarterly earnings change as proxy for unexpected earnings
Panel A: Descriptive statistics, experimental firm-quarters (N=416)
Variable Mean
Std.
Dev.
Lower
Quartile Median
Upper
Quartile
size-adjusted CAR (-1,+1) 0.0028 0.076 -0.0359 0.0017 0.0429
risk-adjusted CAR (-1,+1) 0.0026 0.075 -0.0382 0.0011 0.0404
QUE 0.0279 0.118 -0.0042 0.0075 0.0345
BM 0.7941 0.586 0.4144 0.6506 0.9619
STDRET 0.0318 0.016 0.0215 0.0286 0.0377
LEV 0.4435 0.227 0.2489 0.4379 0.5986
SIZE 6.2627 2.405 4.5432 5.8945 7.9715
ABSQUE 0.0571 0.132 0.0069 0.0181 0.0501
LOSS 0.2869 0.453 0.0000 0.0000 1.0000
FQTR4 0.2500 0.431 0.0000 0.0000 0.0000
RESTR 0.0385 0.193 0.0000 0.0000 0.0000
Panel B: Descriptive statistics, matched firm-quarters (N=416)
Variable Mean
Std.
Dev.
Lower
Quartile Median
Upper
Quartile
size-adjusted CAR (-1,+1) 0.0022 0.076 -0.0395 0.0013 0.0410
risk-adjusted CAR (-1,+1) 0.0024 0.078 -0.0443 0.0014 0.0457
QUE 0.0350 0.125 -0.0017 0.0062 0.0238
BM 0.7460 0.539 0.4019 0.6243 0.8866
STDRET 0.0292 0.014 0.0197 0.0259 0.0357
LEV 0.4106 0.204 0.2458 0.3943 0.5429
SIZE 6.3482 2.287 4.5633 6.1025 7.8060
ABSQUE 0.0551 0.126 0.0048 0.0128 0.0391
LOSS 0.2861 0.452 0.0000 0.0000 1.0000
FQTR4 0.2500 0.431 0.0000 0.0000 0.0000
RESTR 0.0408 0.239 0.0000 0.0000 0.0000
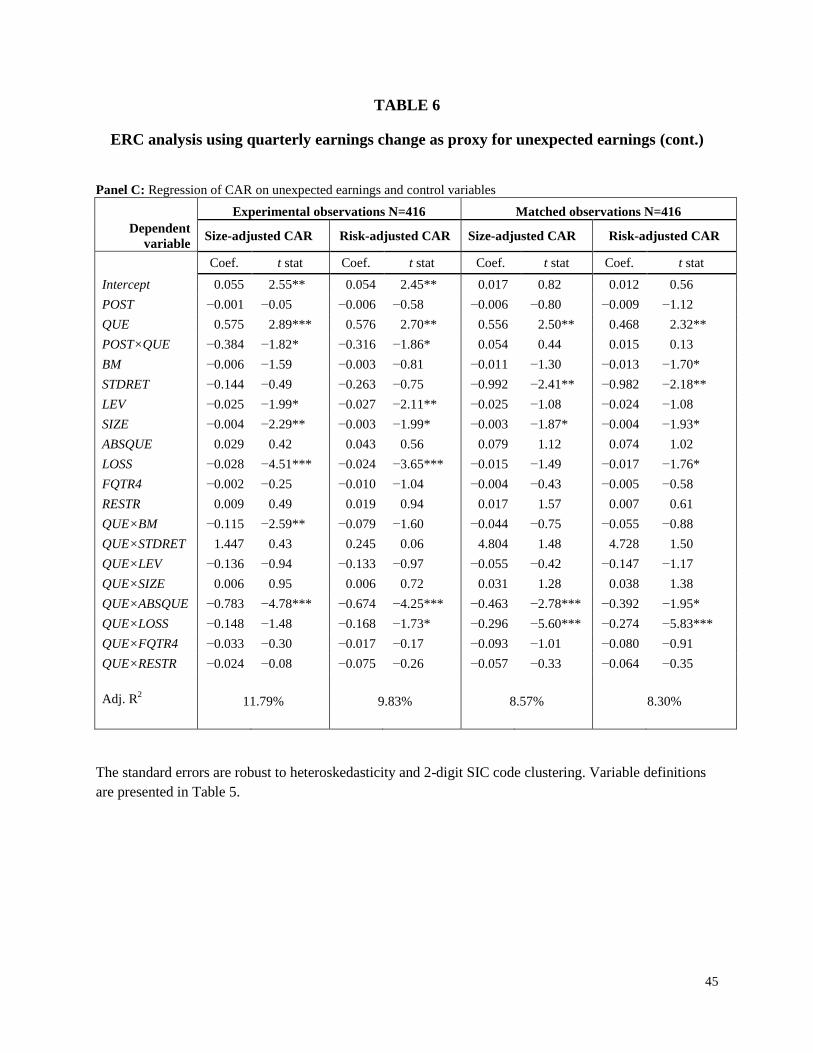
45
TABLE 6
ERC analysis using quarterly earnings change as proxy for unexpected earnings (cont.)
Panel C: Regression of CAR on unexpected earnings and control variables
Experimental observations N=416 Matched observations N=416
Dependent
variable Size-adjusted CAR Risk-adjusted CAR Size-adjusted CAR Risk-adjusted CAR
Coef. t stat Coef. t stat Coef. t stat Coef. t stat
Intercept 0.055 2.55** 0.054 2.45** 0.017 0.82 0.012 0.56
POST −0.001 −0.05 −0.006 −0.58 −0.006 −0.80 −0.009 −1.12
QUE 0.575 2.89*** 0.576 2.70** 0.556 2.50** 0.468 2.32**
POST×QUE −0.384 −1.82* −0.316 −1.86* 0.054 0.44 0.015 0.13
BM −0.006 −1.59 −0.003 −0.81 −0.011 −1.30 −0.013 −1.70*
STDRET −0.144 −0.49 −0.263 −0.75 −0.992 −2.41** −0.982 −2.18**
LEV −0.025 −1.99* −0.027 −2.11** −0.025 −1.08 −0.024 −1.08
SIZE −0.004 −2.29** −0.003 −1.99* −0.003 −1.87* −0.004 −1.93*
ABSQUE 0.029 0.42 0.043 0.56 0.079 1.12 0.074 1.02
LOSS −0.028 −4.51*** −0.024 −3.65*** −0.015 −1.49 −0.017 −1.76*
FQTR4 −0.002 −0.25 −0.010 −1.04 −0.004 −0.43 −0.005 −0.58
RESTR 0.009 0.49 0.019 0.94 0.017 1.57 0.007 0.61
QUE×BM −0.115 −2.59** −0.079 −1.60 −0.044 −0.75 −0.055 −0.88
QUE×STDRET 1.447 0.43 0.245 0.06 4.804 1.48 4.728 1.50
QUE×LEV −0.136 −0.94 −0.133 −0.97 −0.055 −0.42 −0.147 −1.17
QUE×SIZE 0.006 0.95 0.006 0.72 0.031 1.28 0.038 1.38
QUE×ABSQUE −0.783 −4.78*** −0.674 −4.25*** −0.463 −2.78*** −0.392 −1.95*
QUE×LOSS −0.148 −1.48 −0.168 −1.73* −0.296 −5.60*** −0.274 −5.83***
QUE×FQTR4 −0.033 −0.30 −0.017 −0.17 −0.093 −1.01 −0.080 −0.91
QUE×RESTR −0.024 −0.08 −0.075 −0.26 −0.057 −0.33 −0.064 −0.35
Adj. R2 11.79% 9.83% 8.57% 8.30%
The standard errors are robust to heteroskedasticity and 2-digit SIC code clustering. Variable definitions
are presented in Table 5.
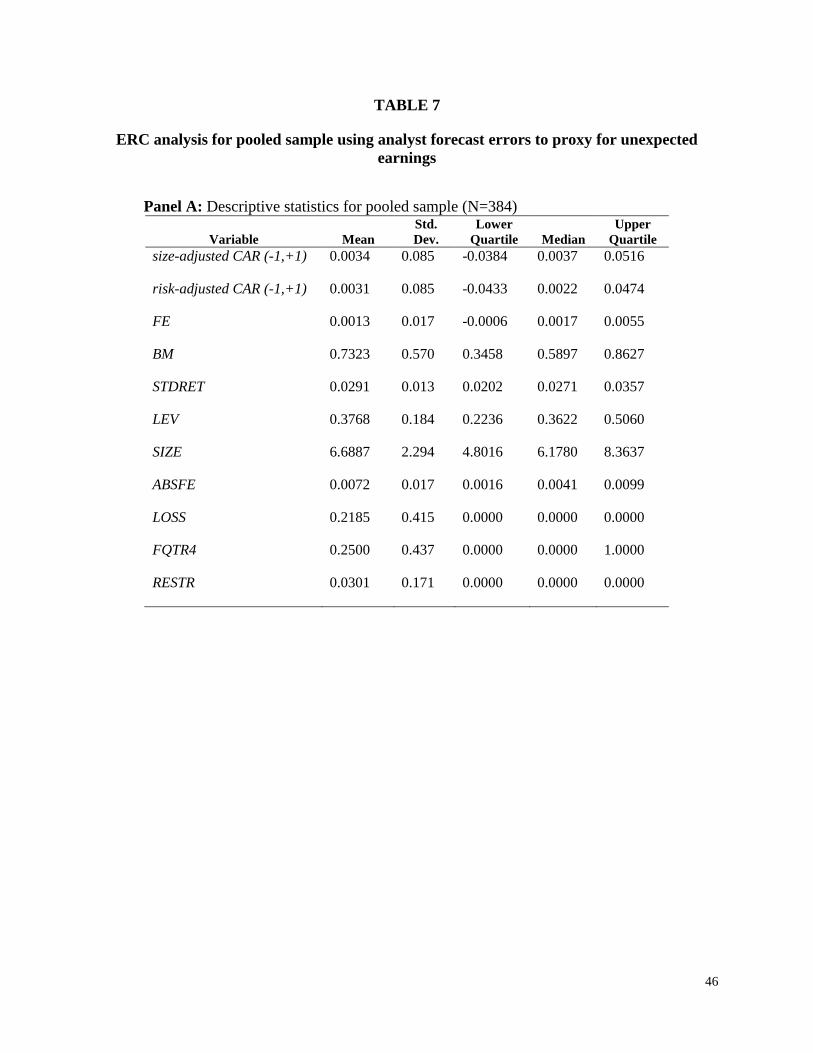
46
TABLE 7
ERC analysis for pooled sample using analyst forecast errors to proxy for unexpected
earnings
Panel A: Descriptive statistics for pooled sample (N=384)
Variable Mean
Std.
Dev.
Lower
Quartile Median
Upper
Quartile
size-adjusted CAR (-1,+1) 0.0034 0.085 -0.0384 0.0037 0.0516
risk-adjusted CAR (-1,+1) 0.0031 0.085 -0.0433 0.0022 0.0474
FE 0.0013 0.017 -0.0006 0.0017 0.0055
BM 0.7323 0.570 0.3458 0.5897 0.8627
STDRET 0.0291 0.013 0.0202 0.0271 0.0357
LEV 0.3768 0.184 0.2236 0.3622 0.5060
SIZE 6.6887 2.294 4.8016 6.1780 8.3637
ABSFE 0.0072 0.017 0.0016 0.0041 0.0099
LOSS 0.2185 0.415 0.0000 0.0000 0.0000
FQTR4 0.2500 0.437 0.0000 0.0000 1.0000
RESTR 0.0301 0.171 0.0000 0.0000 0.0000
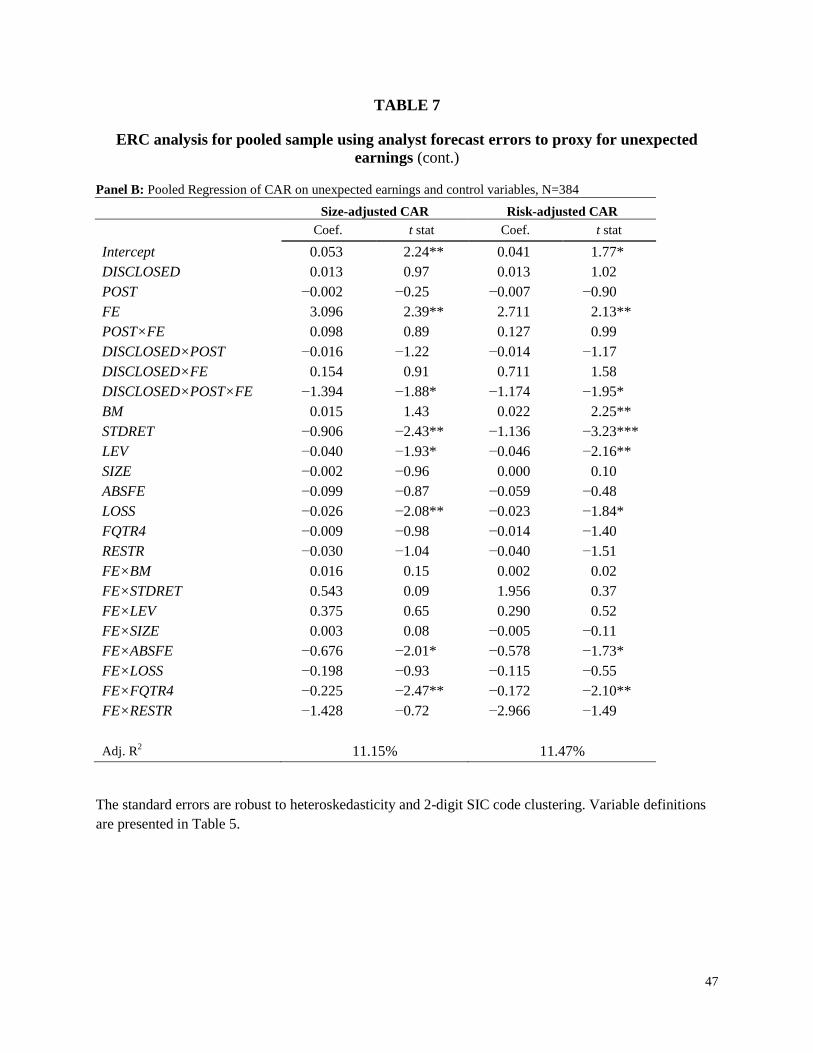
47
TABLE 7
ERC analysis for pooled sample using analyst forecast errors to proxy for unexpected
earnings (cont.)
Panel B: Pooled Regression of CAR on unexpected earnings and control variables, N=384
Size-adjusted CAR Risk-adjusted CAR
Coef. t stat Coef. t stat
Intercept 0.053 2.24** 0.041 1.77*
DISCLOSED 0.013 0.97 0.013 1.02
POST −0.002 −0.25 −0.007 −0.90
FE 3.096 2.39** 2.711 2.13**
POST×FE 0.098 0.89 0.127 0.99
DISCLOSED×POST −0.016 −1.22 −0.014 −1.17
DISCLOSED×FE 0.154 0.91 0.711 1.58
DISCLOSED×POST×FE −1.394 −1.88* −1.174 −1.95*
BM 0.015 1.43 0.022 2.25**
STDRET −0.906 −2.43** −1.136 −3.23***
LEV −0.040 −1.93* −0.046 −2.16**
SIZE −0.002 −0.96 0.000 0.10
ABSFE −0.099 −0.87 −0.059 −0.48
LOSS −0.026 −2.08** −0.023 −1.84*
FQTR4 −0.009 −0.98 −0.014 −1.40
RESTR −0.030 −1.04 −0.040 −1.51
FE×BM 0.016 0.15 0.002 0.02
FE×STDRET 0.543 0.09 1.956 0.37
FE×LEV 0.375 0.65 0.290 0.52
FE×SIZE 0.003 0.08 −0.005 −0.11
FE×ABSFE −0.676 −2.01* −0.578 −1.73*
FE×LOSS −0.198 −0.93 −0.115 −0.55
FE×FQTR4 −0.225 −2.47** −0.172 −2.10**
FE×RESTR −1.428 −0.72 −2.966 −1.49
Adj. R
2 11.15% 11.47%
The standard errors are robust to heteroskedasticity and 2-digit SIC code clustering. Variable definitions
are presented in Table 5.
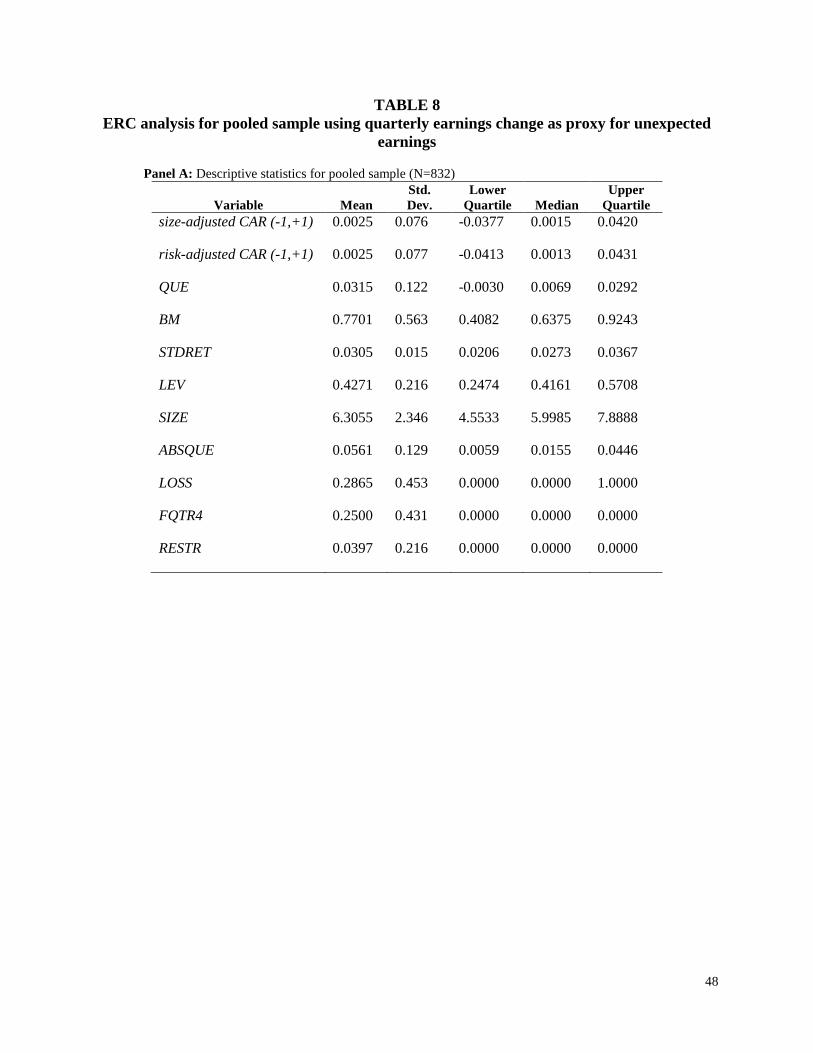
48
TABLE 8
ERC analysis for pooled sample using quarterly earnings change as proxy for unexpected
earnings
Panel A: Descriptive statistics for pooled sample (N=832)
Variable Mean
Std.
Dev.
Lower
Quartile Median
Upper
Quartile
size-adjusted CAR (-1,+1) 0.0025 0.076 -0.0377 0.0015 0.0420
risk-adjusted CAR (-1,+1) 0.0025 0.077 -0.0413 0.0013 0.0431
QUE 0.0315 0.122 -0.0030 0.0069 0.0292
BM 0.7701 0.563 0.4082 0.6375 0.9243
STDRET 0.0305 0.015 0.0206 0.0273 0.0367
LEV 0.4271 0.216 0.2474 0.4161 0.5708
SIZE 6.3055 2.346 4.5533 5.9985 7.8888
ABSQUE 0.0561 0.129 0.0059 0.0155 0.0446
LOSS 0.2865 0.453 0.0000 0.0000 1.0000
FQTR4 0.2500 0.431 0.0000 0.0000 0.0000
RESTR 0.0397 0.216 0.0000 0.0000 0.0000
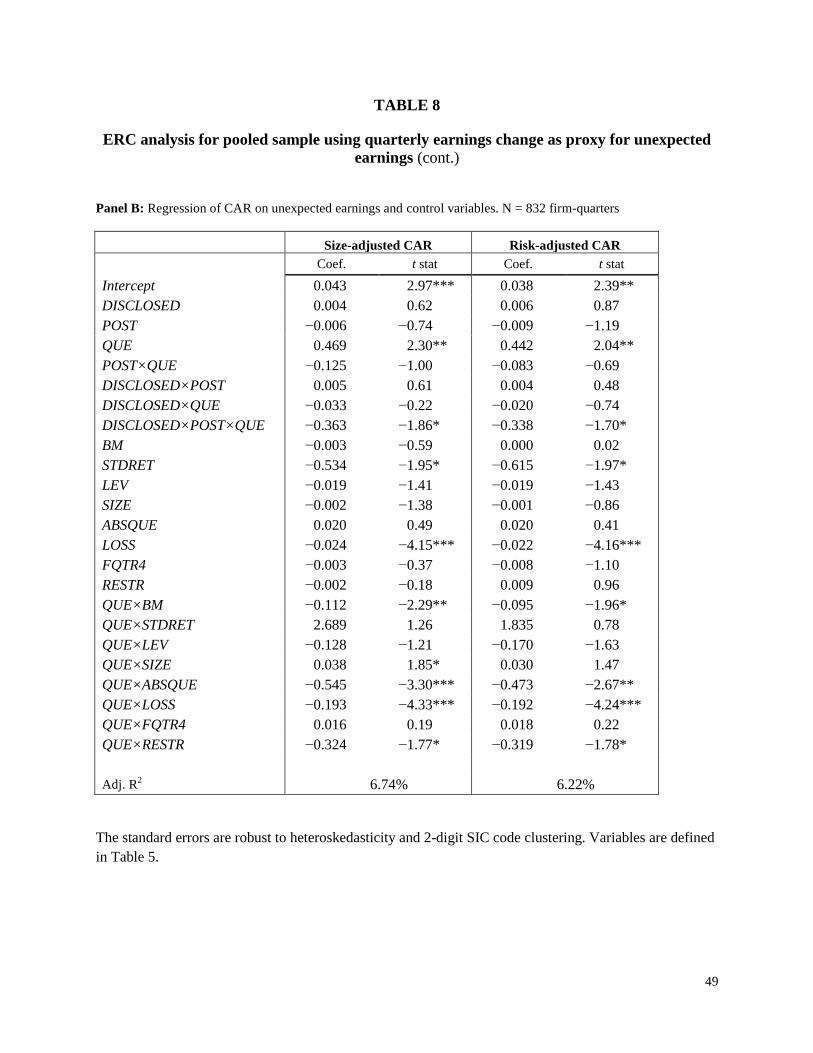
49
TABLE 8
ERC analysis for pooled sample using quarterly earnings change as proxy for unexpected
earnings (cont.)
Panel B: Regression of CAR on unexpected earnings and control variables. N = 832 firm-quarters
Size-adjusted CAR Risk-adjusted CAR
Coef. t stat Coef. t stat
Intercept 0.043 2.97*** 0.038 2.39**
DISCLOSED 0.004 0.62 0.006 0.87
POST −0.006 −0.74 −0.009 −1.19
QUE 0.469 2.30** 0.442 2.04**
POST×QUE −0.125 −1.00 −0.083 −0.69
DISCLOSED×POST 0.005 0.61 0.004 0.48
DISCLOSED×QUE −0.033 −0.22 −0.020 −0.74
DISCLOSED×POST×QUE −0.363 −1.86* −0.338 −1.70*
BM −0.003 −0.59 0.000 0.02
STDRET −0.534 −1.95* −0.615 −1.97*
LEV −0.019 −1.41 −0.019 −1.43
SIZE −0.002 −1.38 −0.001 −0.86
ABSQUE 0.020 0.49 0.020 0.41
LOSS −0.024 −4.15*** −0.022 −4.16***
FQTR4 −0.003 −0.37 −0.008 −1.10
RESTR −0.002 −0.18 0.009 0.96
QUE×BM −0.112 −2.29** −0.095 −1.96*
QUE×STDRET 2.689 1.26 1.835 0.78
QUE×LEV −0.128 −1.21 −0.170 −1.63
QUE×SIZE 0.038 1.85* 0.030 1.47
QUE×ABSQUE −0.545 −3.30*** −0.473 −2.67**
QUE×LOSS −0.193 −4.33*** −0.192 −4.24***
QUE×FQTR4 0.016 0.19 0.018 0.22
QUE×RESTR −0.324 −1.77* −0.319 −1.78*
Adj. R2 6.74% 6.22%
The standard errors are robust to heteroskedasticity and 2-digit SIC code clustering. Variables are defined
in Table 5.