Embed Size (px)
Citation preview
CONFERENCE ON HOUSEHOLD FINANCE AND CONSUMPTION
WORK ING PAPER SER I E SNO 1299 / F EBRUARY 2011
by Tabea Bucher-Koenenand Michael Ziegelmeyer
WHO LOST THE MOST? FINANCIAL LITERACY, COGNITIVE ABILITIES, AND THE FINANCIAL CRISIS
CONFERENCE ON HOUSEHOLD
FINANCE AND CONSUMPTION
1 We are grateful to participants at the DIW Conference on Aging, Saving and Retirement, the SAVE Conference 2010, the Household Heterogeneity
and Household Finance Conference by Deutsche Bundesbank and Federal Reserve Bank of Cleveland, and the joint BCL ECB Conference on
Moreover, we would like to thank Axel Börsch-Supan, Dimitris Christelis, Michael Ehrmann, Elsa Fornero, Martin Gasche, Michael
Haliassos, Lena Janys, Johannes Koenen, Lisa Kramer, Annamaria Lusardi, Thomas Mathae, Chiara Monticone, Markus Nöth, Ulrich Schlieper,
Konrad Stahl, Matthias Weiss, and Joachim Winter for helpful comments. MEA is a research institute which is funded by two thirds
through public third-party means for which we are very grateful. Furthermore, we would like to thank the state
of Baden-Württemberg and the German Insurance Association for the basic funding of MEA. We are particularly
grateful to the German Research Foundation (Deutsche Forschungsgemeinschaft) for financing the SAVE survey.
2 MEA and University of Mannheim, 68131 Mannheim, Germany; e-mail: [email protected]
This paper can be downloaded without charge from http://www.ecb.europa.eu or from the Social Science Research Network electronic library at http://ssrn.com/abstract_id=1738368.
NOTE: This Working Paper should not be reported as representing the views of the European Central Bank (ECB). The views expressed are those of the authors
and do not necessarily reflect those of the ECB.
WORKING PAPER SER IESNO 1299 / FEBRUARY 2011
WHO LOST THE MOST?
FINANCIAL LITERACY,
COGNITIVE ABILITIES,
AND THE FINANCIAL CRISIS 1
by Tabea Bucher-Koenen 2 and Michael Ziegelmeyer 3
In 2011 all ECBpublications
feature a motiftaken from
the €100 banknote.
Household Finance and Consumption in Luxembourg as well as seminar participants at MEA, CDSE and CERP, and in Paris for many fruitful
discussions.
3 Economics and Research Department, and MEA, Banque centrale du Luxembourg
ZUniversity of Mannheim, Germany; e-mail: Michael.Z [email protected]
CONFERENCE ON “HOUSEHOLD FINANCE AND CONSUMPTION”
This paper was presented at the conference on “Household Finance and Consumption”, which was co-organised by the Banque centrale du Luxembourg and the ECB, and was held on 25-26 October 2010 in Luxembourg. The organising committee consisted of Michael Ehrmann (ECB), Michalis Haliassos (CFS and Goethe University), Thomas Mathä (Banque centrale du Luxembourg), Peter Tufano (Harvard Business School), and Caroline Willeke (ECB). The conference programme, including papers, can be found at http://www.ecb.europa.eu/events/conferences/html/joint_ecb_lux.en.html. The views expressed in this paper are those of the authors and do not necessarily reflect those of the Banque centrale du Luxembourg, the ECB or the Eurosystem.
© European Central Bank, 2011
AddressKaiserstrasse 2960311 Frankfurt am Main, Germany
Postal addressPostfach 16 03 1960066 Frankfurt am Main, Germany
Telephone+49 69 1344 0
Internethttp://www.ecb.europa.eu
Fax+49 69 1344 6000
All rights reserved.
Any reproduction, publication and reprint in the form of a different publication, whether printed or produced electronically, in whole or in part, is permitted only with the explicit written authorisation of the ECB or the authors.
Information on all of the papers published in the ECB Working Paper Series can be found on the ECB’s website, http://www.ecb.europa.eu/pub/scientific/wps/date/html/index.en.html
ISSN 1725-2806 (online)
3ECB
Working Paper Series No 1299Febuary 2011
Abstract 4
Non-technical summary 5
1 Introduction 6
2 Related literature and hypotheses 7
2.1 Stock market participation 7
2.2 Under-diversifi cation and other investment mistakes 9
2.3 Portfolio adjustments 11
3 Data 12
3.1 SAVE 12
3.2 Measuring fi nancial losses 13
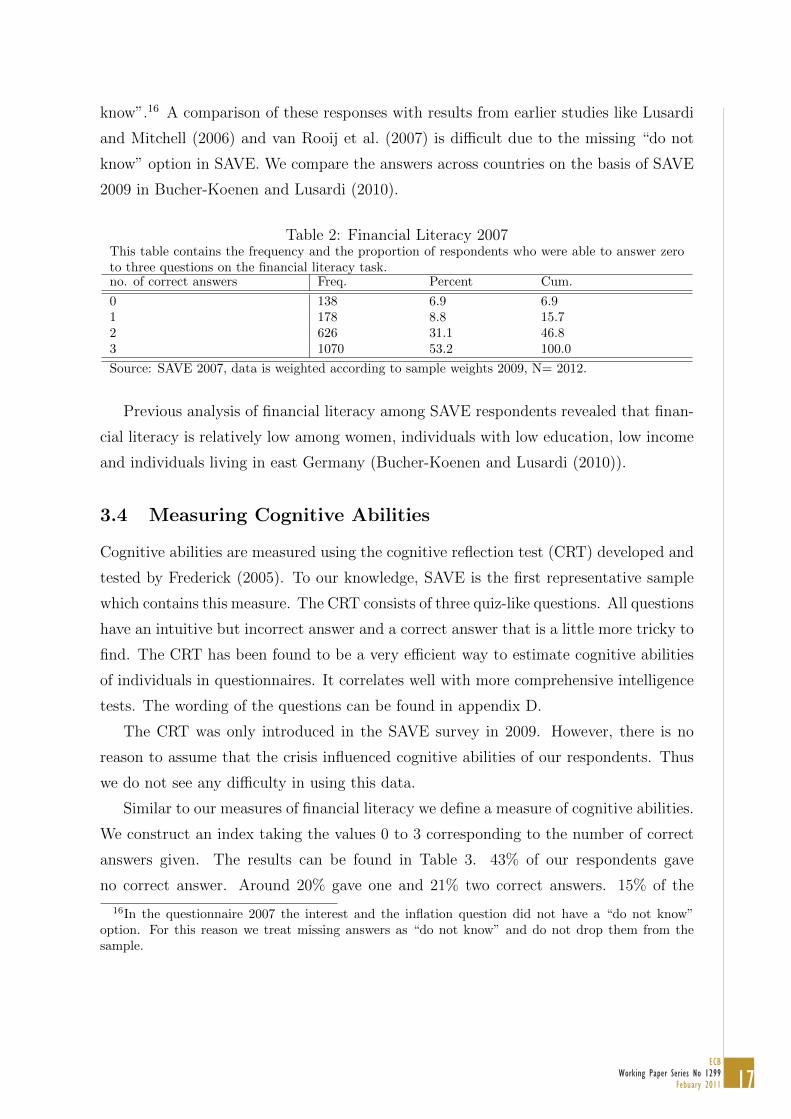
3.3 Measuring fi nancial literacy 16
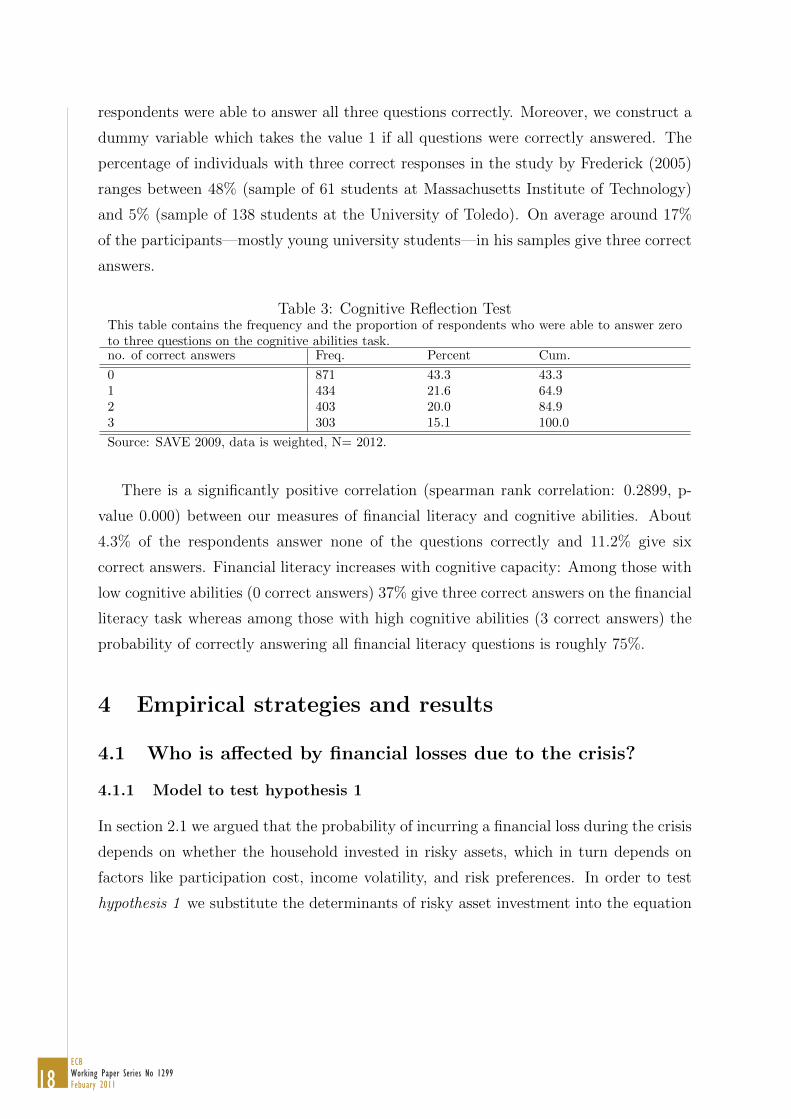
3.4 Measuring cognitive abilities 17
4 Empirical strategies and results 18
4.1 Who is affected by fi nancial losses due to the crisis? 18
4.2 Who lost the most? 22
4.3 Who realizes their loss? 26
5 Conclusions 30
References 32
Appendices 37
CONTENTS
4ECBWorking Paper Series No 1299Febuary 2011
Abstract
We study how and to what extent private households are affected by the recent
financial crisis and how their financial decisions are influenced by this shock. Our
analysis reveals that individuals with low levels of financial literacy are less likely to
have invested in the stock market and thus are less likely to report losses in wealth.
Yet, individuals with low financial literacy are more likely to sell their assets which
lost in value (realize losses). This reaction to short-term losses has potential long-
term consequences if individuals do not participate in markets’ recovery and face
lower returns in the long run.
Keywords: financial literacy, cognitive ability, financial crisis, life-cycle savings, sav-
ing behavior, portfolio choice
JEL Classification: D91, D14, G11
5ECB
Working Paper Series No 1299Febuary 2011
Non-technical Summary
We study how and to what extent private households are affected by the recent
financial crisis and how their financial decisions are influenced by this shock. We aim
at answering the following questions: Are individuals with lower financial literacy and
lower cognitive abilities more frequently affected by financial losses due to the crisis? Are
individuals with lower financial literacy and cognitive abilities affected more severely if
loss is measured as a percentage of wealth? And are individuals with lower financial
literacy and cognitive abilities more likely to realize their losses?
Our analysis is based on SAVE, a representative panel of German households that
contains very detailed information on their financial and socio-economic situation as well
as financial literacy and cognitive abilities. We use information from the surveys con-
ducted in the early summers of 2007, 2008, and 2009 and make extensive use of a special
module of questions regarding the financial crisis that was added to the questionnaire
in 2009.
Using self-reports, little more than 20% of households in Germany were affected
by financial losses due to the financial crisis. On average households lost about 2,561
Euros or 3.6% of their financial assets. Simulated losses based on households portfolio
composition at the end of 2007 and average returns of these assets during 2008 are
relatively close to the self-reported measure.
Ex ante, the relation between financial literacy and losses is not clear. On the
one hand individuals with lower literacy and cognitive ability are more prone to make
mistakes; on the other hand they are more likely to stay out of risky assets. Our analysis
based on SAVE reveals that individuals with low levels of financial knowledge are less
likely to have invested in the stock market and are therefore in general less likely to report
losses in wealth due to the financial crisis. The effect of financial literacy is significant
even if we control for socio-demographic differences, risk preferences and income risk.
In contrast to our expectations we find that individuals with low financial literacy did
not suffer larger losses measured as a fraction of their wealth. However, individuals with
lower levels of financial literacy were more likely to sell their assets which lost in value
and thus realize their losses for sure. This reaction of individuals with low financial
literacy to short-term losses can have substantial long-term consequences for wealth
distribution if these individuals do not participate in markets’ recovery and face lower
returns in the long run.
6ECBWorking Paper Series No 1299Febuary 2011
1 Introduction
The recent financial downturn and economic crisis provided a major challenge for finan-
cial institutions, politicians, companies and private households around the world. We use
the financial crisis as a natural experiment to study to what extent private households
are affected and how they react to such a shock? Are financially literate and individuals
with higher IQ better prepared to shield themselves from shocks like the financial and
economic crisis? This question is difficult to assess because individuals with higher levels
of expertise are more likely to invest in risky assets, which were particularly affected by
declines in value during the financial crisis. Therefore we do not only focus on the losses
in wealth individuals incurred during the crisis but additionally analyze if households
realized their losses for sure by selling assets.
Our analysis is based on SAVE, a representative panel of German households that
contains very detailed information on their financial and socio-economic situation as well
as financial literacy and cognitive abilities. We use information from the surveys con-
ducted in the early summers of 2007, 2008, and 2009 and make extensive use of a special
module of questions regarding the financial crisis that was added to the questionnaire
in 2009. Germany is particularly suited for our analysis because there was no housing
or mortgage crisis in 2007/2008. Thus, the losses (or gains) in wealth of households
are purely related to the composition of financial portfolios and their adjustments in
the course of the crisis. While households with a large share of equity in their portfolio
are likely to have suffered from the economic downturn, households could gain higher
returns on time deposits, saving accounts and government bonds at the same time.1
Our analysis reveals that individuals with low levels of financial knowledge are less
likely to have invested in the stock market and are therefore less likely to report losses
in wealth due to the financial crisis. Thus, we confirm the finding by Calvet et al.
(2007) and van Rooij et al. (2007) that individuals with low levels of financial knowledge
stay out of risky assets. We find no effect of financial literacy and IQ on the size
of the loss conditional on participation in risky asset markets. However, individuals
with lower levels of financial expertise sold the assets which have lost in value with a
1The German DAX, which measures the development of the 30 largest and best-performing com-panies on the German equity market and represents around 80% of the market capital authorized inGermany (http://deutsche-boerse.com) dropped by about 40% during 2008. In contrast to this thereturns on private deposits with a duration of less than 2 years increased from an average of 3.6% in2007 to an average 4.25% in 2008 (http://www.bundesbank.de/statistik).
7ECB
Working Paper Series No 1299Febuary 2011
higher likelihood. This means that they did not only incur paper losses but realized
their losses for sure. This reaction to a shock like the financial crisis potentially has
substantial consequences for wealth distribution. Households with less financial expertise
and cognitive abilities did not participate in markets’ recovery. Moreover, if individuals
shy away from risky investments or feel confirmed in their scepticism towards financial
markets, they will face lower long-term returns.
The paper is organized as follows: In section 2 we give a brief overview of the
literature on household investment behavior and develop our hypotheses. Section 3
describes the SAVE data and the variables used for our analysis. In section 4 we report
our empirical results. We conclude in section 5 with a brief discussion.
2 Related Literature and Hypotheses
2.1 Stock Market Participation
One of the central findings of capital market theory is that every household should invest
part of their wealth in risky assets in order to profit from the risk premium.2 Over the
life-cycle the absolute amount of assets held in stocks should increase until retirement
and decrease thereafter. Without fixed cost of stock market participation the relative
amount of stocks in the portfolio should decrease with age; young investors should hold
100% of their assets in stocks.3 These results persist even when controlling for in-
come risk and other background risks.4 Empirical examinations of households’ portfolio
choice reveal that many households do not hold equity.5 This phenomenon is known as
the stock market participation puzzle. One of the arguments put forward to explain the
2This result is based on Markowitz (1952), Merton (1969, 1971), and Samuelson (1969). For acomprehensive overview of the literature on strategic asset allocation see Campbell and Viceira (2003)as well as Curcuru et al. (2004).
3See Campbell and Viceira (2003) based on Campbell et al. (2001).4See e.g. Cocco et al. (2005), Curcuru et al. (2004).5See e.g. Mankiw and Zeldes (1991), Haliassos and Bertaut (1995), Guiso et al. (2003), and Christelis,
Jappelli and Padula (2010) for international evidence. Borsch-Supan and Essig (2003) find that onlyaround 17% of German households directly participate in the stock market. The amount would increasewhen including indirect stock holdings, however, the authors argue that there is a large overlap betweendirect and indirect stock holders. Christelis, Geogarakos and Haliassos (2010) find that around 25% ofthe households older than 50 in Germany own stocks directly or indirectly. Based on aggregate data,Ramb and Scharnagl (2010) report that the share of direct equity holdings in German households’portfolios moved around 5% since the burst of the “dot com bubble” in 2000. The fraction of mutualfunds in portfolios was around 14% in recent years.
8ECBWorking Paper Series No 1299Febuary 2011
reluctance of households to invest in risky assets is the existence of fixed participation
cost (e.g., Mankiw and Zeldes (1991), Haliassos and Bertaut (1995), Vissing-Jorgensen
(2002, 2003), and Calvet et al. (2007)). Mankiw and Zeldes (1991) find that stock mar-
ket participation increases with income and education. They argue that this is in line
with the existence of participation cost because, firstly, high income households have
larger portfolios and can afford to pay the fixed participation cost, and secondly, the
cost of information acquisition is lower for highly educated households. However, they
also find that even among households with more than $100,000 of liquid assets partici-
pation in equity is below 50% and conclude that information cost must be substantial or
non-economic reasons influence households’ behavior. The introduction of a fixed cost
of stock market participation in the model of Campbell and Viceira (2003) merely shifts
stock market entry to later ages but does not fundamentally change the predictions of
the model. Vissing-Jorgensen (2002) and (2003) estimates that a fixed participation
cost of around 50 dollars in 2003 can explain non-participation of half the households in
her sample. Andersen and Nielsen (2010) find that fixed entry and participation costs
in monetary terms can account for roughly one third of non-participation in the stock
market. They conclude that participation seems to be influenced by other factors like
for example behavioral biases and cognitive abilities. The authors show that the proba-
bility of participation in the stock market after a windfall gain is significantly higher for
educated and financially literate individuals. This is in line with other studies which find
evidence that in particular individuals with lower financial knowledge and lower cognitive
abilities are less likely to participate in the stock market.6 In particular, Grinblatt et al.
(2010) find evidence that even among the most affluent individuals higher IQ increases
stock market participation. This implies that individuals with high financial literacy
and high cognitive abilities face lower cost of acquiring information and thus lower par-
ticipation cost than individuals who know little about financial markets and have low
cognitive abilities. In addition to this, Calvet et al. (2007) suggest that individuals with
low financial literacy might be aware of their weakness and stay out of risky markets
to avoid investment mistakes like for example under-diversification. Furthermore, in-
dividuals who invest in the stock market have an incentive to acquire knowledge and
thus participants have higher levels of financial literacy than non-participants. More-
6See e.g. Guiso and Jappelli (2005), Calvet et al. (2007), van Rooij et al. (2007), Christiansen et al.(2008), Christelis, Jappelli and Padula (2010), McArdle et al. (2009), Cole and Shastry (2009), andGrinblatt et al. (2010).
9ECB
Working Paper Series No 1299Febuary 2011
over, McArdle et al. (2009) and Cole and Shastry (2009) propose several alternative
mechanisms through which cognitive abilities and financial education could be related
to financial market participation. For example, time preferences simultaneously influ-
ence the investment in education and saving behavior. Thus, it is hard to determine
causality. However, for our analysis the mechanism that drives stock market participa-
tion of households is only of secondary importance. Assuming that the financial crisis
was an unanticipated exogenous shock, financial losses of individuals should be closely
related to stock market participation and thus, our first hypothesis on the effect of the
crisis is:
Hypothesis 1: Households with higher financial literacy/cognitive abilities are more
likely to hold risky assets in their portfolio (select portfolios with a higher expected return
at higher risk). Thus, they are more likely to incur losses due to the financial crisis.
2.2 Under-Diversification and other Investment Mistakes
There is a growing literature which investigates the relationship between financial in-
vestment mistakes, cognitive abilities and financial literacy. The central finding is that
individuals with lower cognitive abilities and lower financial knowledge are more likely
to suffer from biases and make investment mistakes.7 Kimball and Shumway (2010) sug-
gest that the most plausible reason is that more financially literate investors are better
informed and therefore are better at managing their portfolios.
One of the most investigated deviations of investors from optimal behavior is lack of
diversification.8 In their comprehensive study of 60,000 US brokerage accounts Goetz-
mann and Kumar (2008) for example find that on average investors hold under-diversified
portfolios. The degree of diversification increases with age, income, education, and so-
phistication.9 Specifically, they find that under-diversified investors overestimate specific
industries, and local stocks, and are sensitive to past returns. Their annual returns were
on average 2.4% lower than those of diversified investors. Kimball and Shumway (2010)
discover that financially literate investors are less likely to apply naive diversification
7See, e.g., Benjamin et al. (2006), Agarwal et al. (2009), Kimball and Shumway (2010).8See, e.g., Blume and Friend (1975), Moskowitz and Vissing-Jorgensen (2002), Vissing-Jorgensen
(2003), Campbell (2006), Calvet et al. (2007), Goetzmann and Kumar (2008).9They define sophisticated investors as those who “trade options, engage in short-selling, and have
greater investment experience”(p.435).
10ECBWorking Paper Series No 1299Febuary 2011
heuristics, like the 1/n rule. Moreover, they invest fewer amounts of their assets in
stocks of the company they work for; and they are less frequently suffering from a home
bias. Guiso and Jappelli (2008) also find that a lack of diversification is related to a
lack of financial literacy. They argue that financially illiterate investors are likely to
undervalue the benefits from diversification—or even ignore them altogether—and ad-
ditionally have difficulties to assess the correlation between their assets’ returns. Thus,
individuals with high financial knowledge hold a larger number of different assets in their
portfolio. Similarly Grinblatt et al. (2010) find that individuals with higher IQ invest
in a larger number of different stocks and are more likely to hold mutual funds in their
portfolio.
Apart from this Goetzmann and Kumar (2008) find that investors with better diver-
sification are also better at selecting stocks with higher returns, probably also because
they are better informed. The authors identify a small group of active investors who
are under-diversified and perform very well—most likely a group of very well informed
investors. Grinblatt et al. (2009) observe that high IQ investors on average earn 11%
higher returns than low IQ investors.
If financially literate investors are better at managing their portfolios in “normal
times” they most probably were also better prepared during the financial crisis. Thus,
we hypothesize:
Hypothesis 2a: Conditional on stock market participation, households with higher
financial literacy/cognitive abilities are better at managing their portfolios. Thus, they
suffer smaller losses as a percentage of their wealth.
On the other hand, Odean (1998) argues that overconfidence leads investors to over-
estimate the precision of their own evaluation of signals which leads them to hold port-
folios that are more risky than the portfolios of non-overconfident investors with the
same degree of risk aversion. Barber and Odean (2001) find that overconfident investors
trade too much and thereby lower their returns. Furthermore, they find that men tend
to be more overconfident than women with similar sophistication. If men on average
hold riskier portfolios due to overconfidence compared to women, they should have in-
curred larger losses as a fraction of their wealth compared to their female counterparts.
Therefore, we propose the following hypothesis:
Hypothesis 2b: Conditional on stock market participation, households with a male

11ECB
Working Paper Series No 1299Febuary 2011
decision maker are more likely to suffer from overconfidence compared to households
with female decision makers with a similar degree of financial literacy and cognitive
ability. Thus, men compared to women hold riskier portfolios and incur larger losses as
a percentage of their wealth.
2.3 Portfolio Adjustments
The German stock market lost about 40% of its value in the course of 2008. On the
aggregate level a strong tendency to shift from risky to less risky assets has been observed.
Many investors sold their equity in particular at the trough of the crisis in October 2008
(Bundesverband Investment und Asset Management e.V. (2009)) and thus did not only
incur paper losses but realized their losses. The re-balancing behavior of households has
been subject to many examinations. A variety of different rational as well as irrational
reasons for active re-balancing have been examined for example by Odean (1998), Coval
and Shumway (2005), Locke and Mann (2005), Massa and Simonov (2005), and Calvet
et al. (2009).
In order to understand the mechanisms that were driving individuals’ reactions to
the financial crisis, we have to examine their motives. It is unclear if the realization of
losses can be seen as a financial investment mistake from an ex ante perspective. Ex
post it seems that it would have been better not to sell assets which have lost in value
but rather buy assets when prices were low and profit from markets’ recovery.
We differentiate between selling assets due to constraints and portfolio re-balancing
caused by a change in expectations. If individuals need their funds to buffer unexpected
shocks to income due to the crisis, they might have to sell assets that lost their value.
Besides smoothing consumption, households might have adjusted portfolios due to
a change in expectations. Some households might have realized their losses in order to
reduce their (future) tax burden. Moreover, if households had an ex ante rule to sell
their stock as soon as the value dropped below a certain threshold in order to avoid
suffering from a disposition effect (holding losers too long and selling winners too soon),
the selling of loser stocks might have been plausible. We expect that individuals with
higher financial literacy and cognitive abilities are more likely to apply these strategies.
On the other hand, if households sold their risky assets because they expected the
future returns to be lower permanently, they were not well informed. Households with
12ECBWorking Paper Series No 1299Febuary 2011
higher financial knowledge should have been better informed about the long-term de-
velopment of future returns and thus were more likely not to sell their risky assets.
Moreover, investors might have suffered from “myopic loss aversion” (investors give high
weight to losses compared to gains and evaluate their portfolios too often) as argued
by Benartzi and Thaler (2007) or were influenced by an atmosphere of panic. Benartzi
and Thaler (2007) as well as Duflo and Saez (2003) find that particularly unsophisti-
cated investors are strongly influenced by peer effects. Calvet et al. (2009) examine
re-balancing behavior of Swedish households and observe that in particular financially
sophisticated households were less likely to exit financial markets between 1999 and 2002
when the stock market declined. Assuming that financial sophistication is related to fi-
nancial literacy and cognitive abilities one would expect individuals with low financial
literacy/cognitive abilities to sell loser stocks more frequently.
Thus, we end up with two competing hypotheses:
Hypothesis 3a: Households with higher financial literacy/cognitive abilities are more
likely to realize their losses.
and
Hypothesis 3b: Households with lower financial literacy/cognitive abilities are more
likely to realize their losses.
The empirical analysis can contribute to clarify which of the two effects prevails.
3 Data
3.1 SAVE
We use SAVE, a panel of German households that contains detailed information on
households’ financial situation and socio-economic as well as psychological characteris-
tics.10 The analysis is based on the surveys conducted in the early summer of 2007,
2008, and 2009, and we make extensive use of a special module of questions regarding
the financial crisis which was added to the questionnaire in 2009. In 2009 there are 2,222
households in the panel.
10SAVE was first conducted in 2001 by the Mannheim Research Institute for the Economics of Aging(MEA). Consecutive waves were in the field in 2003/2004, and every year since 2005. A detaileddescription of the scientific background, design and results of the survey can be found in Borsch-Supanet al. (2009).
13ECB
Working Paper Series No 1299Febuary 2011
Due to item non-response, the SAVE data set is imputed using an iterative multiple
imputation procedure based on a Markov-Chain Monte-Carlo method (Schunk (2008)).
The goal of this procedure is to increase the efficiency of our estimates due to a larger
number of observations and to reduce the item non-response bias that occurs if obser-
vations with and without missing values differ systematically. For our analysis, all five
multiply imputed data sets are used and the results are derived using Rubin’s method
(Rubin (1987, 1996)). In the case of our explained variables (absolute and relative
loss) and key explanatory variables (financial literacy and cognitive abilities), we do not
use imputed values. Thus, our basic sample consists of 2,012 households. The socio-
demographic characteristics of the sample are provided in Table C1 in the appendix.
All descriptive statistics are weighted and results are representative for the German
population.11 For the regression analyses no weights are used.12
3.2 Measuring Financial Losses
3.2.1 Reported Losses
Absolute Financial Losses. We measure losses due to the financial crisis by directly
asking households. The question in SAVE 2009 was phrased in the following way: Have
you and /or your partner personally suffered losses in wealth due to the financial crisis?
If yes, how high was your total loss in 2008 in Euros? 13 At this point it is unclear if
households reported paper or realized losses. However, we will elaborate on this in the
course of our analysis.
About 79.5% of the households responded that they did not incur financial losses due
to the crisis. 20.5% reported a loss. The average loss reported by households conditional
on reporting a loss is 13,153 Euros. The median loss is 5,000 Euros. The distribution
of losses is skewed to the right and is plotted in figure A1 in the appendix. The un-
conditional average loss of all households in Germany is 2,562 Euros. In comparison,
the average loss of German households calculated on the basis of aggregate financial
11The reference statistic to calibrate weights according to income and age classes is the GermanMikrozensus. For a detailed description see Borsch-Supan et al. (2009), pp. 48-52.
12Deaton (1997) mentions that “when the sectors [sub populations] are homogeneous, OLS is moreefficient, and when they are not, both estimators are inconsistent. In neither case is there an argumentfor weighting.” (p. 70).
13We do not compare households’ balance sheets at the end of 2007 and 2008 as the net wealthposition of households can also be influenced by consumption-saving decisions and bequests, etc.
14ECBWorking Paper Series No 1299Febuary 2011
account statistics of the Deutsche Bundesbank is 3,105 Euros.14 The difference may
at least partly be explained by the fact that some households have not reported paper
losses.
In order to evaluate how well households estimate their losses we simulate financial
losses on the basis of their portfolios at the end of 2007. We apply the approach taken
by Borsch-Supan et al. (2010), i.e., we use households’ portfolio composition at the end
of 2007 and apply average realized returns of these assets during 2008. We deduct the
simulated wealth level at the end of 2008 from the wealth level at the end of 2007 to
obtain paper losses and gains during 2008. To construct our simulated loss variable we
exclude gains as our direct question only covered losses. According to the simulation
about 29.6% of households in Germany were affected by losses in financial wealth. The
difference compared to reported losses can be due to two reasons: First, some of the
households did not report their paper losses when asked directly and some households
might be unaware of the fact that they were affected by the financial crisis. We will
comment on this aspect after we introduce measures of financial literacy and cognitive
abilities. Second, in SAVE we have information on rather broad classes of assets. We
calculated the returns on asset classes using average returns of these assets as we do not
have information of the precise composition of households’ portfolios. Thus, for some
households the simulated loss might not reflect their true situation very well.
The average simulated loss of households is 2,658 Euro. This is quite close to the
reported average loss of 2,562 Euros.15 Conditional on reporting a loss the average
simulated loss is 10,692 Euros, i.e. the value is below the average reported loss of 13,153
Euros. We also analyze the difference between simulated and reported losses on the
individual level and find that about 13% report losses below the simulated loss and
about 22% report losses above the simulated loss. For 64% of the respondent reported
and simulated losses both are zero. Again the deviations can be due to misreporting of
the households as well as due to the imprecise estimation of simulated returns to wealth
during 2008. Overall, we come to the conclusion that households on average seem to
have a plausible notion of their losses during the financial crisis. We will comment on
the deviation in more details below.
14Estimated on the basis of Deutsche Bundesbank (2009): Geldvermogen undVerbindlichkeiten der privaten Haushalte. Tabelle aus der Finanzierungsrechnung;http://www.bundesbank.de/statistik/statistik wirtschaftsdaten tabellen.php
15The correlation of simulated and reported losses is 0.52 (p-value 0.000).
15ECB
Working Paper Series No 1299Febuary 2011
Relative Financial Losses. We divide financial losses by households’ total financial
wealth at the end of 2007. Total financial wealth is constructed using deposits held in
savings accounts, building savings contracts, fixed income securities, stocks, stock mutual
and real estate funds, life insurance contracts, private and employer-based pension wealth
as well as other financial assets. On average households lost about 3.6% of their gross
financial wealth. Conditional on suffering a loss, households lost about 18.6% of their
gross financial wealth. The median loss is 9.5%. Overall, about 9.2% of the households
lost more than 10% and about 1.8% lost more than half of their financial assets. The
average simulated loss relative to financial wealth at the end of 2007 is 3.7% which is
again quite close to the reported one.
Additionally we relate losses to total wealth. Thus, we add housing and business
wealth as well as other real assets (e.g. jewelery, antiques etc.) to our financial wealth
variable. Related to their total gross wealth at the end of 2007, households on average
lost 1.7% of their wealth. Conditional on reporting a loss, the fraction of total wealth
lost is 8.9% with a median of 2.5%. 3.8% lost a fraction of wealth higher than 10% of
all assets. Less than 1% of all households lost more than half of their total wealth.
3.2.2 Realized Losses
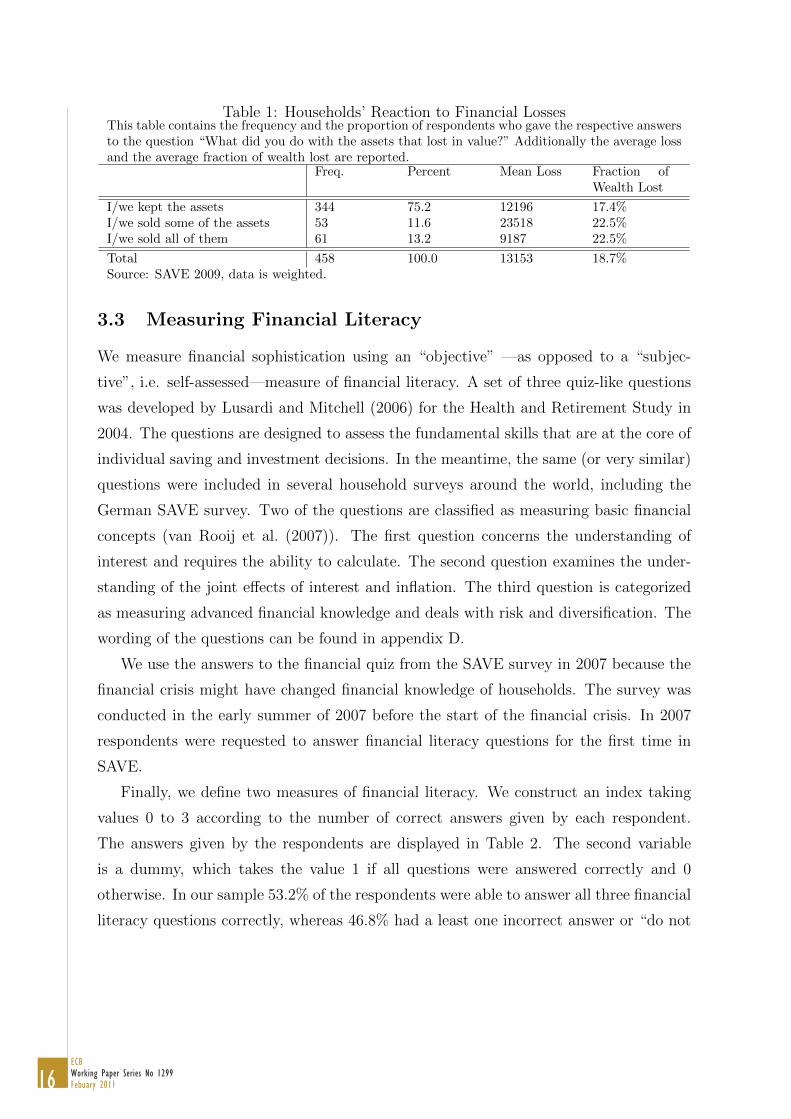
As a follow up question we asked respondents: What did you do with the assets that lost
in value? We kept the assets. / We sold some of the assets. / We sold all of them.
This question was only asked conditional on reporting a loss. Thus, 458 households
gave an answer to this question. 75.2% responded that they kept the loser assets in their
portfolio. Thus, these households reported paper losses. 13.2% report that they sold
all of the assets that lost in value and 11.6% sold at least some of them (see Table 1).
For the analysis conducted later on we construct a variable equal to 1 if households sold
some or all of their assets.
Table 1 also relates the absolute and relative losses of households to their reaction.
We find that the average loss of households who kept their assets is little over 12,000
Euros. The average loss of households who sold some of the assets is almost twice as
large (about 23,500 Euros). However, the loss of households who sold all their assets is
only around 9,000 Euros. Investors who kept their assets on average lost 17.4% of their
wealth which is about 23% less than the average relative losses of investors who sold
some or all of their assets and who suffered an average relative loss of 22.5%.
16ECBWorking Paper Series No 1299Febuary 2011
Table 1: Households’ Reaction to Financial LossesThis table contains the frequency and the proportion of respondents who gave the respective answersto the question “What did you do with the assets that lost in value?” Additionally the average lossand the average fraction of wealth lost are reported.
Freq. Percent Mean Loss Fraction ofWealth Lost
I/we kept the assets 344 75.2 12196 17.4%I/we sold some of the assets 53 11.6 23518 22.5%I/we sold all of them 61 13.2 9187 22.5%
Total 458 100.0 13153 18.7%Source: SAVE 2009, data is weighted.
3.3 Measuring Financial Literacy
We measure financial sophistication using an “objective” —as opposed to a “subjec-
tive”, i.e. self-assessed—measure of financial literacy. A set of three quiz-like questions
was developed by Lusardi and Mitchell (2006) for the Health and Retirement Study in
2004. The questions are designed to assess the fundamental skills that are at the core of
individual saving and investment decisions. In the meantime, the same (or very similar)
questions were included in several household surveys around the world, including the
German SAVE survey. Two of the questions are classified as measuring basic financial
concepts (van Rooij et al. (2007)). The first question concerns the understanding of
interest and requires the ability to calculate. The second question examines the under-
standing of the joint effects of interest and inflation. The third question is categorized
as measuring advanced financial knowledge and deals with risk and diversification. The
wording of the questions can be found in appendix D.
We use the answers to the financial quiz from the SAVE survey in 2007 because the
financial crisis might have changed financial knowledge of households. The survey was
conducted in the early summer of 2007 before the start of the financial crisis. In 2007
respondents were requested to answer financial literacy questions for the first time in
SAVE.
Finally, we define two measures of financial literacy. We construct an index taking
values 0 to 3 according to the number of correct answers given by each respondent.
The answers given by the respondents are displayed in Table 2. The second variable
is a dummy, which takes the value 1 if all questions were answered correctly and 0
otherwise. In our sample 53.2% of the respondents were able to answer all three financial
literacy questions correctly, whereas 46.8% had a least one incorrect answer or “do not
17ECB
Working Paper Series No 1299Febuary 2011
know”.16 A comparison of these responses with results from earlier studies like Lusardi
and Mitchell (2006) and van Rooij et al. (2007) is difficult due to the missing “do not
know” option in SAVE. We compare the answers across countries on the basis of SAVE
2009 in Bucher-Koenen and Lusardi (2010).
Table 2: Financial Literacy 2007This table contains the frequency and the proportion of respondents who were able to answer zeroto three questions on the financial literacy task.no. of correct answers Freq. Percent Cum.
0 138 6.9 6.91 178 8.8 15.72 626 31.1 46.83 1070 53.2 100.0
Source: SAVE 2007, data is weighted according to sample weights 2009, N= 2012.
Previous analysis of financial literacy among SAVE respondents revealed that finan-
cial literacy is relatively low among women, individuals with low education, low income
and individuals living in east Germany (Bucher-Koenen and Lusardi (2010)).
3.4 Measuring Cognitive Abilities
Cognitive abilities are measured using the cognitive reflection test (CRT) developed and
tested by Frederick (2005). To our knowledge, SAVE is the first representative sample
which contains this measure. The CRT consists of three quiz-like questions. All questions
have an intuitive but incorrect answer and a correct answer that is a little more tricky to
find. The CRT has been found to be a very efficient way to estimate cognitive abilities
of individuals in questionnaires. It correlates well with more comprehensive intelligence
tests. The wording of the questions can be found in appendix D.
The CRT was only introduced in the SAVE survey in 2009. However, there is no
reason to assume that the crisis influenced cognitive abilities of our respondents. Thus
we do not see any difficulty in using this data.
Similar to our measures of financial literacy we define a measure of cognitive abilities.
We construct an index taking the values 0 to 3 corresponding to the number of correct
answers given. The results can be found in Table 3. 43% of our respondents gave
no correct answer. Around 20% gave one and 21% two correct answers. 15% of the
16In the questionnaire 2007 the interest and the inflation question did not have a “do not know”option. For this reason we treat missing answers as “do not know” and do not drop them from thesample.
18ECBWorking Paper Series No 1299Febuary 2011
respondents were able to answer all three questions correctly. Moreover, we construct a
dummy variable which takes the value 1 if all questions were correctly answered. The
percentage of individuals with three correct responses in the study by Frederick (2005)
ranges between 48% (sample of 61 students at Massachusetts Institute of Technology)
and 5% (sample of 138 students at the University of Toledo). On average around 17%
of the participants—mostly young university students—in his samples give three correct
answers.
Table 3: Cognitive Reflection TestThis table contains the frequency and the proportion of respondents who were able to answer zeroto three questions on the cognitive abilities task.no. of correct answers Freq. Percent Cum.
0 871 43.3 43.31 434 21.6 64.92 403 20.0 84.93 303 15.1 100.0
Source: SAVE 2009, data is weighted, N= 2012.
There is a significantly positive correlation (spearman rank correlation: 0.2899, p-
value 0.000) between our measures of financial literacy and cognitive abilities. About
4.3% of the respondents answer none of the questions correctly and 11.2% give six
correct answers. Financial literacy increases with cognitive capacity: Among those with
low cognitive abilities (0 correct answers) 37% give three correct answers on the financial
literacy task whereas among those with high cognitive abilities (3 correct answers) the
probability of correctly answering all financial literacy questions is roughly 75%.
4 Empirical strategies and results
4.1 Who is affected by financial losses due to the crisis?
4.1.1 Model to test hypothesis 1
In section 2.1 we argued that the probability of incurring a financial loss during the crisis
depends on whether the household invested in risky assets, which in turn depends on
factors like participation cost, income volatility, and risk preferences. In order to test
hypothesis 1 we substitute the determinants of risky asset investment into the equation
19ECB
Working Paper Series No 1299Febuary 2011
to estimate the loss probability. Thus, we estimate the following reduced form probit:
L = β0 + β1z + β2w + β3k + β4c+ ε. (1)
Where L is an indicator equal to one if a household incurred a loss, z is a vector of
socio-demographic variables, w is the log of gross financial wealth, k is financial literacy,
and c is cognitive abilities. ε is a standard normal random error.
We proposed that households with high financial literacy/high cognitive abilities are
more likely to hold risky assets in their portfolio and thus are more likely to incur losses
due to the financial crisis.17 Therefore, we expect β3 and β4 to be positive. The awareness
of individuals of their exposure to risk during the crisis and the losses related to this might
depend on the knowledge of individuals about their own financial situation which might
again depend on their levels of financial literacy. However, it is unclear if individuals with
lower levels of financial literacy are more likely to over- or underestimate their losses. An
analysis of the deviations between reported and simulated financial losses with respect
to financial literacy and cognitive abilities reveals that there are no systematic over- or
under-estimations of the losses depending on abilities. Furthermore, there is no relation
between financial literacy and the squared difference between simulated and reported
losses, i.e. financially illiterate households are not deviating more strongly. Thus, we do
not think that our estimates are systematically biased.
4.1.2 Empirical results: model 1
We restrict our analysis to households with positive gross financial wealth at the end of
2007 because only households with positive assets had something to lose during 2008. We
have 1673 observations in the sample. As proposed in hypothesis one, households with
high financial literacy are more likely to incur losses due to the financial crisis. Bi-variate
analysis reveals that 13.6% of the households with a respondent who was unable to
answer all financial literacy questions report to be affected by a loss in wealth as a result
of the financial crisis. In contrast, 32.2% of the respondents who answered all questions
correctly report financial losses. Moreover, the fraction of households suffering from
17Figure B2 in the appendix shows relative stock market participation over percentiles of gross fi-nancial wealth for individuals with high and low financial literacy. It can be observed that the stockmarket participation of those with high financial literacy is higher compared to those with low financialliteracy in the top 70% of the wealth distribution. There are no differences at the bottom, most likelydue to budget limitations.
20ECBWorking Paper Series No 1299Febuary 2011
losses increases from 23.2% for low cognitive abilities (less than three correct answers)
to 31% for high cognitive abilities (three correct answers).
To understand the effect of financial literacy and cognitive abilities on being affected
by losses in wealth, we conduct the multivariate regression as specified in equation 1.
The results are reported in Table 4.
We measure financial literacy by using a dummy variable for three correct answers
to the financial literacy task and cognitive abilities by using a dummy variable for three
correct answers in the cognitive abilities task.18 Furthermore, we include financial wealth
at the end of 2007, income, education and whether individuals are non German as
controls. These variables are used as proxies for the ability and willingness of households
to incur fixed participation cost. Moreover, Campbell and Viceira (2003) argue that the
participation in risky asset markets can be influenced by income risk of households. We
include two variables to proxy income risk: one measure for subjective income volatility
of households in the past 5 years19 and one variable controlling for self-employment of
the person answering the questionnaire. We also include a measure for risk aversion in
the domain of financial matters.20 We proxy diversification by including the number of
asset categories that households own at the end of 2007 and we include a dummy equal
to one if households consulted a financial advisor. Additionally, controls for age, living
in East Germany21, living in a rural region, being retired and gender are included.
Our regression reveals that financially literate individuals have a more than 11%
higher chance to incur a loss during the crisis compared to financially illiterate respon-
dents (significant at 1%). Therefore, hypothesis 1 is confirmed with respect to the effect
of financial literacy. The effect of cognitive abilities is insignificant. Besides, the proba-
bility to report losses increases with age, financial wealth, the number of asset categories
and risk preferences and with consulting a financial advisor. It decreases if households
18All our results maintain for alternative definitions of cognitive abilities and financial literacy. Morespecifically, we ran regressions using variables taking values from 0 to 3 for cognitive abilities andfinancial literacy, respectively.
19The wording of the question is: “Over the past five years did your personal income fluctuateconsiderably, fluctuate somewhat, or not fluctuate at all?”
20The wording of the question is: “To what extent do the following statements apply to you? Pleaseanswer on a scale from 0 to 10, where 0 means “does not apply at all” and 10 means “applies verywell”. I do not mind taking risks with respect to financial matters.” Dohmen et al. (2010) establish thepredictive validity of this measure. We take the measure from SAVE 2008, i.e. it is measured in spring2008.
21There are still substantial differences in the economic situation between the former communist andnon-communist part of Germany, thus it seems appropriate to control for these structural differences.
21ECB
Working Paper Series No 1299Febuary 2011
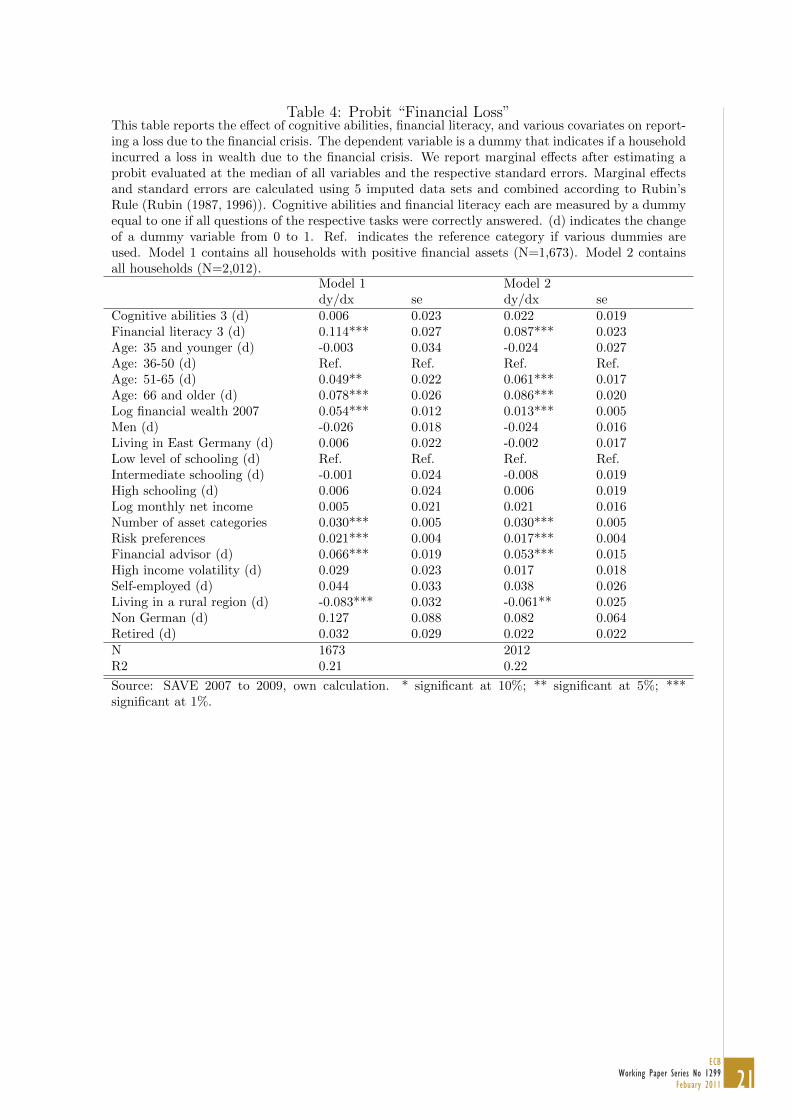
Table 4: Probit “Financial Loss”This table reports the effect of cognitive abilities, financial literacy, and various covariates on report-ing a loss due to the financial crisis. The dependent variable is a dummy that indicates if a householdincurred a loss in wealth due to the financial crisis. We report marginal effects after estimating aprobit evaluated at the median of all variables and the respective standard errors. Marginal effectsand standard errors are calculated using 5 imputed data sets and combined according to Rubin’sRule (Rubin (1987, 1996)). Cognitive abilities and financial literacy each are measured by a dummyequal to one if all questions of the respective tasks were correctly answered. (d) indicates the changeof a dummy variable from 0 to 1. Ref. indicates the reference category if various dummies areused. Model 1 contains all households with positive financial assets (N=1,673). Model 2 containsall households (N=2,012).
Model 1 Model 2dy/dx se dy/dx se
Cognitive abilities 3 (d) 0.006 0.023 0.022 0.019Financial literacy 3 (d) 0.114*** 0.027 0.087*** 0.023Age: 35 and younger (d) -0.003 0.034 -0.024 0.027Age: 36-50 (d) Ref. Ref. Ref. Ref.Age: 51-65 (d) 0.049** 0.022 0.061*** 0.017Age: 66 and older (d) 0.078*** 0.026 0.086*** 0.020Log financial wealth 2007 0.054*** 0.012 0.013*** 0.005Men (d) -0.026 0.018 -0.024 0.016Living in East Germany (d) 0.006 0.022 -0.002 0.017Low level of schooling (d) Ref. Ref. Ref. Ref.Intermediate schooling (d) -0.001 0.024 -0.008 0.019High schooling (d) 0.006 0.024 0.006 0.019Log monthly net income 0.005 0.021 0.021 0.016Number of asset categories 0.030*** 0.005 0.030*** 0.005Risk preferences 0.021*** 0.004 0.017*** 0.004Financial advisor (d) 0.066*** 0.019 0.053*** 0.015High income volatility (d) 0.029 0.023 0.017 0.018Self-employed (d) 0.044 0.033 0.038 0.026Living in a rural region (d) -0.083*** 0.032 -0.061** 0.025Non German (d) 0.127 0.088 0.082 0.064Retired (d) 0.032 0.029 0.022 0.022N 1673 2012R2 0.21 0.22
Source: SAVE 2007 to 2009, own calculation. * significant at 10%; ** significant at 5%; ***significant at 1%.
22ECBWorking Paper Series No 1299Febuary 2011
live in a rural region.
Our results are robust to including all households (Model 2). Again we find that
individuals with higher financial literacy are more likely to be affected by losses in
financial wealth.
4.2 Who lost the most?
4.2.1 Model to test hypothesis 2
In section 2.2 we proposed that households better at managing their portfolios should
incur smaller losses relative to their financial wealth. The ability to manage ones portfolio
in turn depends on financial knowledge and cognitive capacity. In order to test hypothesis
2 we estimate a model of the form:
l = β0 + β1z + β2r + β3k + β4c+ β5m+ λ+ ε. (2)
Where l = loss/w07 is the loss relative to financial wealth at the end of 2007, z is
a vector of socio-demographic variables, r is a proxy for the share of risky assets in the
portfolio and k and c are financial literacy and cognitive abilities, respectively. m is an
indicator if the household has a male decision maker. ε is a standard normal random
error.
We estimate model 2 in two different ways. First, we estimate a simple linear re-
gression using OLS and condition on households reporting a loss. Second, we use a
Heckman two-step estimation (Heckman (1976, 1979)) to correct for selection of report-
ing a loss, and include the inverse mills ratio λ in the estimated equation. The first step
is estimated using the model developed in the previous section (equation 1). We use
income volatility, living in a rural region, and being retired as exclusion restrictions. We
assume that these variables only influence whether households participate in risky asset
markets, i.e. report a loss, but have no effect on the size of the loss. This is confirmed
by Chi2-test of the joint significance of these variables in the first and the second stage
of the equation.22
22In the first stage the three variables are jointly highly significant in all five of our imputed datasets. Wald-statistics range between 8.71 and 11.42; p-values are below 5% in all cases. Whereas in thesecond stage equation their joint significance is rejected in all five cases (Wald statistics between 1.15and 3.16, p-values not significant).
23ECB
Working Paper Series No 1299Febuary 2011
We hypothesize that households with higher financial literacy/cognitive abilities are
better diversified and therefore suffer smaller losses as a percentage of their wealth, i.e.,
we expect β3 and β4 to be negative. Moreover, we expect households with male decision
makers to incur higher losses, i.e., β5 should be positive.
Potential problem of truncation. Respondents in SAVE 2009 were only asked
for their losses in financial wealth and not for their gains. Therefore, our dependent
variable is potentially truncated. In SAVE 2010 we modified this question and instead
asked respondents for their gains and losses over the last two years. A glance at data
from SAVE 2010 gives us the opportunity to estimate an upper limit of the fraction of
respondents which might have reported gains when asked in 2009.23 The comparison
of losses reported in 2009 compared to losses and gains reported in 2010 reveals a very
high correlation of 0.6751 (p-value 0.000). About 1.4% of all respondents report no loss
during 2008 and a gain over a two year period between 2008 and 2010. This is the
maximum fraction of respondents that are subject to truncation because it also contains
those households who incurred no loss during 2008 but a gain during 2009. Thus, we do
not think that we have a substantial problem of truncation in our data.
4.2.2 Empirical results: model 2
The analysis of this model is restricted to households with positive financial wealth in
2007. The descriptive analysis reveals that the fraction of wealth lost is around 10.3%
for individuals low financial literacy and decreases slightly for highly literate households
(9.1%). The difference between the two groups is insignificant. The analysis of relative
losses over levels of cognitive abilities shows that individuals with lower cognitive abilities
on average lost a higher fraction of their wealth (9.8%) than individuals with higher
cognitive abilities (8.1%). Again, the difference between the two groups is insignificant.
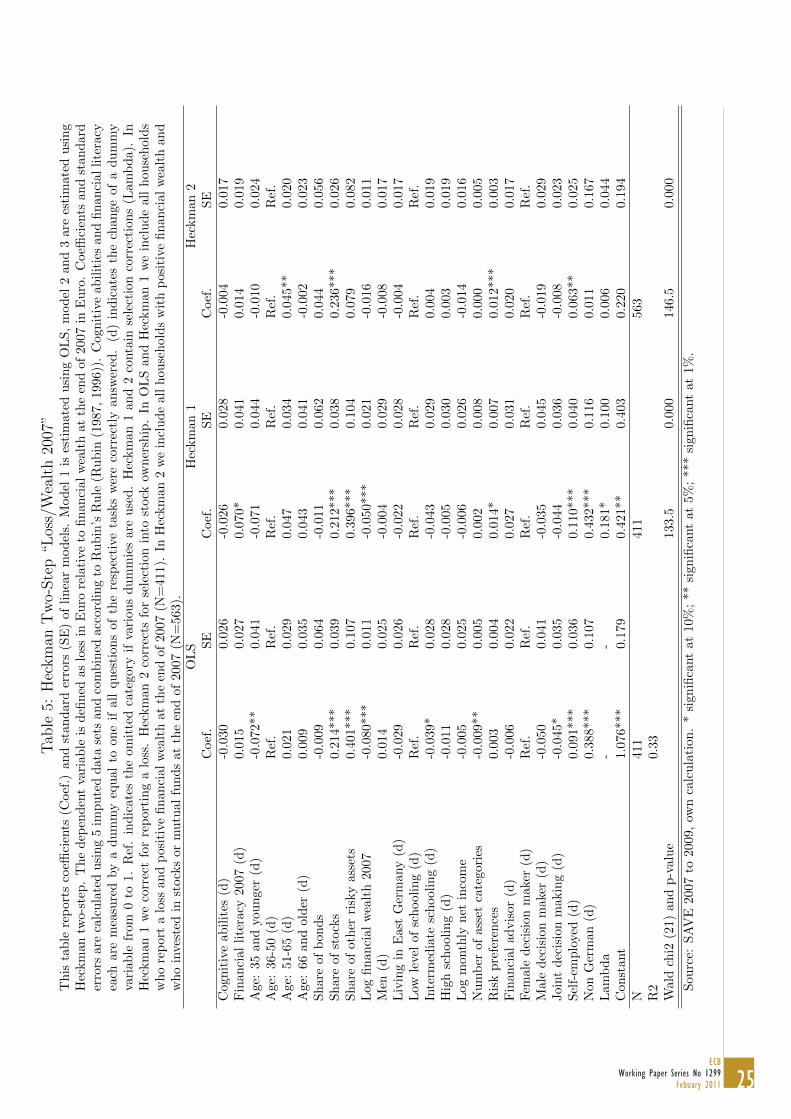
We conduct multivatiate regression as specified in equation 2 to test hypothesis 2a
and 2b. The results of an OLS regression and of Heckman two-step estimations can be
found in Table 5. Our dependent variable in these regressions is the loss (measured in
Euros) divided by financial wealth at the end of 2007.
We find that the fraction of wealth lost is higher, the higher the share of financial
23We can assume that this is an upper limit because of very high returns of the stock markets during2009. We think that there is a negligible fraction of households which report a loss over the two yearperiod from 2007 to 2009, but would have reported a gain between 2007 and 2008.
24ECBWorking Paper Series No 1299Febuary 2011
wealth invested in stocks or other risky assets.24 The number of asset categories as well as
being younger than 36 and having a low schooling degree have weakly significant negative
effects on the faction of wealth lost in the OLS but the effects become insignificant when
correcting for selection (Heckman 1 and 2 in Table 5). Self-employment and being of
non German origin are significantly positively related to the size of the loss.
Contrary to our expectation financial literacy and cognitive abilities are not nega-
tively related to the fraction of wealth lost—both effects are insignificant in the OLS
regression. When correcting for reporting a loss (Heckman 1) the effect of financial
literacy becomes positively significant at 10%. Thus, we do not find support for hypoth-
esis 2a, that individuals with higher levels of financial literacy are better at shielding
themselves from losses due to the financial crisis..
To test hypothesis 2b we include two dummy variables to control for decision making
within the household. The reference group are single female decision makers. We find
no significant differences in the size of the loss between single female or male decision
makers, as proposed in hypothesis 2b. In the OLS regression we find week evidence
that joint decision makers incurred smaller losses compared to female decision makers.
However, the effect is not significant in the selection models.
As a robustness check we changed the dependent variable of the selection equation
(Heckman 2). Here the selection is not whether households report a loss, but whether
households own stocks or stock mutual funds at the end of 2007. The results regarding
the effect of financial literacy and cognitive abilities do not change in this specification.
However the significance of some of the control variables changes. Mainly due to the
different sample size because of the different selection modeled.
To check if our results are influenced by the performance of households with very
risky portfolios and accordingly very large losses, we conducted a sensitivity check and
restricted our estimation to households with a fraction invested in stocks that is smaller
than 80%, i.e. we exclude the top 9 to 10% of households with the highest share of
risky investments in their portfolio (depending on the sample). Financial literacy is still
positively related to the fraction of wealth lost, but the effect is smaller and insignificant
in all three specifications.
24These variable are not included in the selection equation because for all individuals without riskyassets the fractions are 0. There is no variation in these variables for the households not selected.
25ECB
Working Paper Series No 1299Febuary 2011
Tab
le5:
Hec
km
anT
wo-
Ste
p“L
oss/
Wea
lth
2007
”T
his
tab
lere
por
tsco
effici
ents
(Coef
.)an
dst
and
ard
erro
rs(S
E)
ofli
nea
rm
od
els.
Mod
el1
ises
tim
ate
du
sing
OL
S,
mod
el2
an
d3
are
esti
mate
du
sin
gH
eckm
antw
o-st
ep.
Th
ed
epen
den
tva
riab
leis
defi
ned
aslo
ssin
Eu
rore
lati
veto
fin
anci
alw
ealt
hat
the
end
of
2007
inE
uro
.C
oeffi
cien
tsan
dst
an
dard
erro
rsar
eca
lcu
late
du
sin
g5
imp
ute
dd
ata
sets
and
com
bin
edac
cord
ing
toR
ub
in’s
Ru
le(R
ub
in(1
987,
1996))
.C
ogn
itiv
eab
ilit
ies
an
dfi
nan
cial
lite
racy
each
are
mea
sure
dby
ad
um
my
equ
alto
one
ifal
lqu
esti
ons
ofth
ere
spec
tive
task
sw
ere
corr
ectl
yan
swer
ed.
(d)
ind
icate
sth
ech
an
ge
of
ad
um
my
vari
able
from
0to
1.R
ef.
ind
icat
esth
eom
itte
dca
tego
ryif
vari
ous
du
mm
ies
are
use
d.
Hec
km
an
1an
d2
conta
inse
lect
ion
corr
ecti
on
s(L
am
bd
a).
InH
eckm
an1
we
corr
ect
for
rep
orti
ng
alo
ss.
Hec
km
an2
corr
ects
for
sele
ctio
nin
tost
ock
own
ersh
ip.
InO
LS
an
dH
eckm
an
1w
ein
clu
de
all
hou
seh
old
sw
ho
rep
ort
alo
ssan
dp
osit
ive
fin
anci
alw
ealt
hat
the
end
of20
07(N
=41
1).
InH
eckm
an2
we
incl
ud
eall
hou
seh
old
sw
ith
posi
tive
fin
an
cial
wea
lth
an
dw
ho
inves
ted
inst
ock
sor
mu
tual
fund
sat
the
end
of20
07(N
=56
3).
OL
SH
eckm
an
1H
eckm
an
2C
oef
.S
EC
oef
.S
EC
oef
.S
EC
ogn
itiv
eab
ilit
es(d
)-0
.030
0.02
6-0
.026
0.0
28
-0.0
04
0.0
17
Fin
anci
alli
tera
cy20
07(d
)0.
015
0.02
70.
070*
0.0
41
0.0
14
0.0
19
Age
:35
and
you
nge
r(d
)-0
.072
**0.
041
-0.0
710.0
44
-0.0
10
0.0
24
Age
:36
-50
(d)
Ref
.R
ef.
Ref
.R
ef.
Ref
.R
ef.
Age
:51
-65
(d)
0.02
10.
029
0.04
70.0
34
0.0
45**
0.0
20
Age
:66
and
old
er(d
)0.
009
0.03
50.
043
0.0
41
-0.0
02
0.0
23
Sh
are
ofb
ond
s-0
.009
0.06
4-0
.011
0.0
62
0.0
44
0.0
56
Sh
are
ofst
ock
s0.
214*
**0.
039
0.21
2***
0.0
38
0.2
36***
0.0
26
Sh
are
ofot
her
risk
yas
sets
0.40
1***
0.10
70.
396*
**0.1
04
0.0
79
0.0
82
Log
fin
anci
alw
ealt
h20
07-0
.080
***
0.01
1-0
.050
***
0.0
21
-0.0
16
0.0
11
Men
(d)
0.01
40.
025
-0.0
040.0
29
-0.0
08
0.0
17
Liv
ing
inE
ast
Ger
man
y(d
)-0
.029
0.02
6-0
.022
0.0
28
-0.0
04
0.0
17
Low
leve
lof
sch
oolin
g(d
)R
ef.
Ref
.R
ef.
Ref
.R
ef.
Ref
.In
term
edia
tesc
hool
ing
(d)
-0.0
39*
0.02
8-0
.043
0.0
29
0.0
04
0.0
19
Hig
hsc
hool
ing
(d)
-0.0
110.
028
-0.0
050.0
30
0.0
03
0.0
19
Log
mon
thly
net
inco
me
-0.0
050.
025
-0.0
060.0
26
-0.0
14
0.0
16
Nu
mb
erof
asse
tca
tego
ries
-0.0
09**
0.00
50.
002
0.0
08
0.0
00
0.0
05
Ris
kp
refe
ren
ces
0.00
30.
004
0.01
4*0.0
07
0.0
12***
0.0
03
Fin
anci
alad
vis
or(d
)-0
.006
0.02
20.
027
0.0
31
0.0
20
0.0
17
Fem
ale
dec
isio
nm
aker
(d)
Ref
.R
ef.
Ref
.R
ef.
Ref
.R
ef.
Mal
ed
ecis
ion
mak
er(d
)-0
.050
0.04
1-0
.035
0.0
45
-0.0
19
0.0
29
Joi
nt
dec
isio
nm
akin
g(d
)-0
.045
*0.
035
-0.0
440.0
36
-0.0
08
0.0
23
Sel
f-em
plo
yed
(d)
0.09
1***
0.03
60.
110*
**0.0
40
0.0
63**
0.0
25
Non
Ger
man
(d)
0.38
8***
0.10
70.
432*
**0.1
16
0.0
11
0.1
67
Lam
bd
a-
-0.
181*
0.1
00
0.0
06
0.0
44
Con
stan
t1.
076*
**0.
179
0.42
1**
0.4
03
0.2
20
0.1
94
N41
141
1563
R2
0.33
Wal
dch
i2(2
1)an
dp
-val
ue
133.
50.0
00
146.5
0.0
00
Sou
rce:
SA
VE
2007
to20
09,
own
calc
ula
tion
.*
sign
ifica
nt
at10
%;
**si
gnifi
cant
at5%
;**
*si
gnifi
cant
at
1%
.
26ECBWorking Paper Series No 1299Febuary 2011
4.3 Who realizes their loss?
4.3.1 Model to test hypothesis 3
In section 2.3 we argued that different reasons might have existed to sell ones assets
during the crisis and realize a loss. To investigate our competing hypotheses 3a and 3b
we estimate a model of the following form:
s = β0 + β1z + β2k + β3c+ β4y + λ+ ε, (3)
where s indicates whether the household has sold assets that lost in value, and y
indicates a shock to income. All other variables are defined as before. Again we estimate
two specifications: a linear model conditional on reporting a loss and a Heckman two-
step. The Heckman two-step might be necessary because only households reporting a
loss were asked how they reacted to the crisis.
We use income volatility, living in a rural region, self-employment, being non German
and being retired as exclusion restrictions. We assume that these variables only influence
whether households participate in risky asset markets, i.e. report a loss, but have no
effect on their reaction to the loss. This is confirmed by Chi2-Test of the joint significance
of these variables in the first and the second stage of the equation.25
As argued in section 2.3, individuals with higher financial literacy and cognitive
abilities might be more or less likely to sell their assets, thus β2 as well as β3 can be
positive or negative.
4.3.2 Empirical results: model 3
The question about the realization of losses was asked conditional on reporting a loss.
As before we condition on positive gross financial wealth at the end of 2007, i.e. 442
households are included in our regression.26 Descriptive analysis reveals that the fraction
of households who sold their assets that lost value is 21% for highly financially literate
respondents compared to 36% on average for respondents answering less than 3 questions
correctly. Similarly, the percentage of households who sold at least some of their loser
stocks deceases from 26% for low cognitive abilities to 21% for high cognitive abilities.
25In the first stage the variables are jointly highly significant in all five of our imputed data sets (Waldstatistics between 12.2 and 16.4, p-values below 5%). Whereas in the second stage equation their jointsignificance is rejected in all five cases (Wald statistics between 6.1 and 7.2, p-values not significant).
26The different sample size compared to model 2 is due to differences in the number of missing values.

27ECB
Working Paper Series No 1299Febuary 2011
The results of linear regressions modeled as suggested in equation 3 are shown in
Table 6.27 In specification 1 and 3 the dependent variable is a dummy equal to one if the
respondent households sold some or all of the asset which lost in value. In specification
2 and 4 we use a stricter definition: The dependent variable is a dummy equal to one
only if a households sold all the assets which lost in value.
27We report OLS regressions for ease of interpretation. Our results do not change when estimatingprobit regressions.
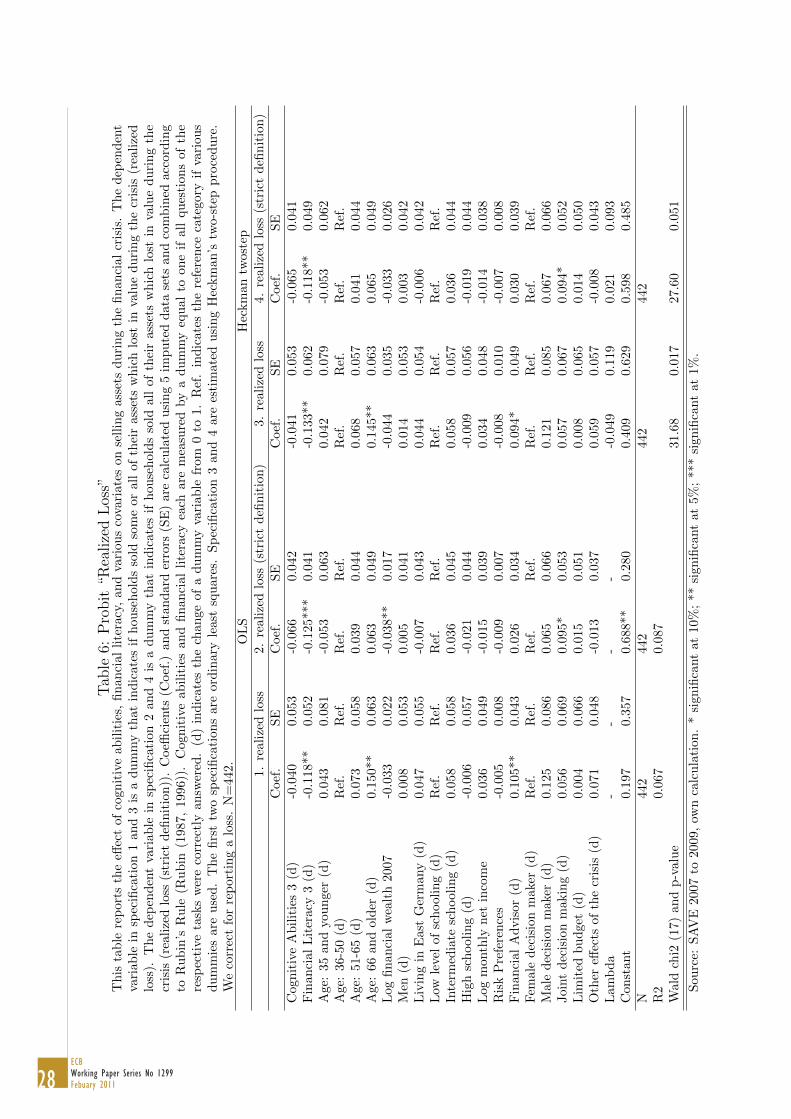
28ECBWorking Paper Series No 1299Febuary 2011
Tab
le6:
Pro
bit
“Rea
lize
dL
oss”
Th
ista
ble
rep
orts
the
effec
tof
cogn
itiv
eab
ilit
ies,
fin
anci
allite
racy
,an
dva
riou
sco
vari
ates
onse
llin
gass
ets
du
rin
gth
efi
nan
cial
cris
is.
Th
edep
end
ent
vari
able
insp
ecifi
cati
on1
and
3is
ad
um
my
that
ind
icat
esif
hou
seh
old
sso
ldso
me
oral
lof
thei
rass
ets
wh
ich
lost
inva
lue
du
rin
gth
ecr
isis
(rea
lize
dlo
ss).
Th
ed
epen
den
tva
riab
lein
spec
ifica
tion
2an
d4
isa
dum
my
that
ind
icat
esif
hou
seh
old
sso
ldall
of
thei
rass
ets
wh
ich
lost
inva
lue
duri
ng
the
cris
is(r
eali
zed
loss
(str
ict
defi
nit
ion
)).
Coeffi
cien
ts(C
oef
.)an
dst
and
ard
erro
rs(S
E)
are
calc
ula
ted
usi
ng
5im
pu
ted
data
sets
an
dco
mbin
edacc
ord
ing
toR
ub
in’s
Ru
le(R
ub
in(1
987,
1996
)).
Cog
nit
ive
abil
itie
san
dfi
nan
cial
lite
racy
each
are
mea
sure
dby
ad
um
my
equ
al
toon
eif
all
ques
tion
sof
the
resp
ecti
veta
sks
wer
eco
rrec
tly
answ
ered
.(d
)in
dic
ates
the
chan
geof
ad
um
my
vari
able
from
0to
1.
Ref
.in
dic
ate
sth
ere
fere
nce
cate
gory
ifva
riou
sd
um
mie
sar
euse
d.
Th
efi
rst
two
spec
ifica
tion
sar
eor
din
ary
leas
tsq
uar
es.
Sp
ecifi
cati
on3
and
4are
esti
mate
du
sin
gH
eckm
an
’stw
o-s
tep
pro
ced
ure
.W
eco
rrec
tfo
rre
por
tin
ga
loss
.N
=44
2.O
LS
Hec
km
an
twost
ep1.
real
ized
loss
2.re
aliz
edlo
ss(s
tric
td
efin
itio
n)
3.
reali
zed
loss
4.
reali
zed
loss
(str
ict
defi
nit
ion
)C
oef
.S
EC
oef
.S
EC
oef
.S
EC
oef
.S
EC
ogn
itiv
eA
bil
itie
s3
(d)
-0.0
400.
053
-0.0
660.
042
-0.0
41
0.0
53
-0.0
65
0.0
41
Fin
anci
alL
iter
acy
3(d
)-0
.118
**0.
052
-0.1
25**
*0.
041
-0.1
33**
0.0
62
-0.1
18**
0.0
49
Age
:35
and
you
nge
r(d
)0.
043
0.08
1-0
.053
0.06
30.
042
0.0
79
-0.0
53
0.0
62
Age
:36
-50
(d)
Ref
.R
ef.
Ref
.R
ef.
Ref
.R
ef.
Ref
.R
ef.
Age
:51
-65
(d)
0.07
30.
058
0.03
90.
044
0.06
80.0
57
0.0
41
0.0
44
Age
:66
and
old
er(d
)0.
150*
*0.
063
0.06
30.
049
0.14
5**
0.0
63
0.0
65
0.0
49
Log
fin
anci
alw
ealt
h20
07-0
.033
0.02
2-0
.038
**0.0
17-0
.044
0.0
35
-0.0
33
0.0
26
Men
(d)
0.00
80.
053
0.00
50.
041
0.01
40.0
53
0.0
03
0.0
42
Liv
ing
inE
ast
Ger
man
y(d
)0.
047
0.05
5-0
.007
0.04
30.
044
0.0
54
-0.0
06
0.0
42
Low
leve
lof
sch
oolin
g(d
)R
ef.
Ref
.R
ef.
Ref
.R
ef.
Ref
.R
ef.
Ref
.In
term
edia
tesc
hool
ing
(d)
0.05
80.
058
0.03
60.
045
0.05
80.0
57
0.0
36
0.0
44
Hig
hsc
hool
ing
(d)
-0.0
060.
057
-0.0
210.
044
-0.0
09
0.0
56
-0.0
19
0.0
44
Log
mon
thly
net
inco
me
0.03
60.
049
-0.0
150.
039
0.03
40.0
48
-0.0
14
0.0
38
Ris
kP
refe
ren
ces
-0.0
050.
008
-0.0
090.
007
-0.0
08
0.0
10
-0.0
07
0.0
08
Fin
anci
alA
dvis
or(d
)0.
105*
*0.
043
0.02
60.
034
0.09
4*
0.0
49
0.0
30
0.0
39
Fem
ale
dec
isio
nm
aker
(d)
Ref
.R
ef.
Ref
.R
ef.
Ref
.R
ef.
Ref
.R
ef.
Mal
ed
ecis
ion
mak
er(d
)0.
125
0.08
60.
065
0.06
60.
121
0.0
85
0.0
67
0.0
66
Joi
nt
dec
isio
nm
akin
g(d
)0.
056
0.06
90.
095*
0.05
30.
057
0.0
67
0.0
94*
0.0
52
Lim
ited
bu
dge
t(d
)0.
004
0.06
60.
015
0.05
10.
008
0.0
65
0.0
14
0.0
50
Oth
ereff
ects
ofth
ecr
isis
(d)
0.07
10.
048
-0.0
130.
037
0.05
90.0
57
-0.0
08
0.0
43
Lam
bd
a-
--
--0
.049
0.1
19
0.0
21
0.0
93
Con
stan
t0.
197
0.35
70.
688*
*0.
280
0.40
90.6
29
0.5
98
0.4
85
N44
244
244
2442
R2
0.06
70.
087
Wal
dch
i2(1
7)an
dp
-val
ue
31.6
80.0
17
27.6
00.0
51
Sou
rce:
SA
VE
2007
to20
09,
own
calc
ula
tion
.*
sign
ifica
nt
at10
%;
**si
gnifi
cant
at5%
;**
*si
gnifi
cant
at
1%
.
29ECB
Working Paper Series No 1299Febuary 2011
Cognitive abilities as well as financial literacy have a negative effect on selling the loser
stocks which is in line with the descriptive results. However, only the effect of financial
literacy is significant. The ability to answer all financial literacy questions correctly
decreases the probability to sell assets after a loss by between 11 and 13% depending on
the specification. Correcting for selection into reporting a loss only slightly changes our
results compared to the OLS. And using a stricter definition of realizing losses hardly
changes the results.
The second interesting point to notice is that individuals older than 66 are signifi-
cantly more likely to sell their assets, compared to individuals between 36 and 50. The
reason is probably that they were pessimistic about medium term future stock returns
and have shorter future time horizons compared to younger investors. The effect disap-
pears when using the strict definition of realizing the losses. Apart from the variables
we already introduced, a variable is included to take account of shocks to income and
whether individuals had to sell the assets to smooth consumption. We have information
if households were affected by the crisis via the labor market. Specifically we asked
respondents if they lost their job, whether their income declined and if they worked
shorter hours due to the crisis. We do not find any significant impact of these other
effects of the crisis on realizing losses.
For households who sold at least some of the assets, there was a follow up question
asking for the destination of the money:
What did you do with the money from selling the assets? We used most of it for
consumption. / We transferred most of it to our checking account or other forms of
assets.
This analysis confirms that most of the households who sold the assets did not aim
at smoothing consumption. Only about 17% of the respondents consumed most of the
money from the assets they sold. The majority (83%) transferred the money to other
assets.
Summing up, we are able to reject hypothesis 3a according to which households with
higher financial literacy are more likely to realize their losses. We find robust evidence
that higher financial literacy is positively related to keeping the loser assets. Thus,
individuals with lower financial literacy were more likely to realize their losses and leave
the equity market during the crisis.
30ECBWorking Paper Series No 1299Febuary 2011
5 Conclusions
Our analysis of the effects of the financial crisis on households’ portfolios and their
reactions reveals the following results:
• On average, households in Germany do not seem to have suffered substantially
from the financial crisis. Little more than 20% of households in Germany report
financial losses. Mean losses are about 2,560 Euros or 3.6% of gross financial assets.
• Comparing reported and simulated losses reveals that households have a plausible
notion of their losses during the financial crisis.
• Households with lower financial literacy and cognitive abilities are less likely to
participate in risky asset markets and thus less frequently report financial losses
due to the crisis. The effect of financial literacy is significant even if we control for
socio-demographic differences, risk preferences and income risk. Thus, our results
are consistent with previous results in the literature, e.g. Calvet et al. (2007), van
Rooij et al. (2007). The main explanation is that financially illiterate households
are skeptical about financial markets and thus stay out of risky assets to avoid
investment mistakes.
• Contrary to the predictions derived from existing theory, households with lower
financial literacy and cognitive abilities did not lose larger fractions of their wealth
if they participated in the stock market. Moreover, our indicator of overconfidence
does not reveal any significant effects on the size of the loss.
• Financially illiterate households were more likely to sell the assets which lost in
value during the crisis. Calvet et al. (2009) observe that financially unsophisticated
households in Sweden are more likely to exit risky asset markets when incurring a
loss. We confirm these findings using German household data.
However, one should not jump to conclusions too fast. Even though the effects of
the financial crisis on private households in Germany appear to be limited in the short
run they can have substantial consequences in the long run. In Germany, participation
in risky assets has been traditionally low but has increased slightly in recent years. If
the shock to financial market returns has a negative impact on financial market par-
ticipation, the rising trend in stock market participation might slow down or even be
31ECB
Working Paper Series No 1299Febuary 2011
reversed (we observe households leaving the stock market due to the crisis). Malmendier
and Nagel (2010) find evidence that past returns matter for households’ participation
in stock and bond markets. Consequentially, there might be substantial losses in future
welfare for households who leave or stay out. This might impact households’ financial
well-being particularly in the light of demographic transition and declining pension ben-
efits. Mankiw and Zeldes (1991) estimate that consumption patterns of stockholders
and nonstockholders differ substantially: stock holding households have overall larger
volatility of consumption, but at the same time they have higher average levels of con-
sumption. Cocco et al. (2005) estimate a welfare loss of 1.5 to 2% of annual consumption
due to lack of stock market participation.
Thus, due to different investment strategies of financially literate and illiterate in-
vestors income inequality might increase. The main reasons for this are: first, financially
illiterate will miss the higher long-term returns of the stock market; second, there is a
high probability that households who realized returns during an economic downturn
do not reinvest in risky assets very soon, which means that they do not participate in
potential recovery processes directly after economic crises. Borsch-Supan et al. (2010)
show that financial losses due to the 2007/2008 financial crisis are around 0.2 percentage
points in the long-run. The loss of not participating in the stock market would be larger
if one looks at the historical outperformance of equity in stocks vs. government bonds
over the past century for Germany, the US and other countries. The equity premium
from 1900-2005 was at least 5 percentage points per annum on average (Mehra (2006)).
The foregone future losses are even higher if households sell their stock when the market
value is very low. Overall, we find that despite the moderate impact of the financial
crisis on households in Germany the long-term effects on wealth distribution can be
substantial. The reason is that households with higher levels of financial literacy are
better at reacting to a shock like the financial crisis compared to households with low
financial literacy.
32ECBWorking Paper Series No 1299Febuary 2011
References
Agarwal, S., Driscoll, J. C., Gabaix, X., Laibson, D., Dell’Ariccia, G. and Pence, K. M.:
2009, The Age of Reason: Financial Decisions over the Life Cycle and Implications
for Regulation, Brookings Papers on Economic Activity Fall(2), 51–118.
Andersen, S. and Nielsen, K. M.: 2010, Participation Constraints in the Stock Mar-
ket: Evidence from Unexpected Inheritance due to Sudden Death, Working Paper
University of Hong Kong .
Barber, B. M. and Odean, T.: 2001, Boys will be Boys: Gender, Overconfidence, and
Common Stock Investment, Quarterly Journal of Economics February, 261–292.
Benartzi, S. and Thaler, R. H.: 2007, Heuristics and Biases in Retirement Savings
Behavior, Journal of Economic Perspectives 21(3), 81–104.
Benjamin, D. J., Brown, S. A. and Shapiro, J. M.: 2006, Who is ”Behavioral”? Cognitive
Ability and Anomalous Preferences, Levine’s Working Paper Archive .
Blume, M. E. and Friend, I.: 1975, The Asset Structure of Individual Portfolios and
Some Implications for Utility Functions, The Journal of Finance XXX, 585–603.
Borsch-Supan, A., Coppola, M., Essig, L., Eymann, A. and Schunk, D.: 2009, The
German SAVE Study - Design and Results, second edn, Mannheim Institute for the
Economics of Aging (MEA).
Borsch-Supan, A. and Essig, L.: 2003, Stockholding in Germany, in L. Guiso, M. Halias-
sos and T. Jappelli (eds), Stockholding in Europe, MacMillan, pp. 110–140.
Borsch-Supan, A., Gasche, M. and Ziegelmeyer, M.: 2010, Auswirkungen der Finanzkrise
auf die private Altersvorsorge, Perpektiven der Wirtschaftspolitik 11(4), 383–406.
Bucher-Koenen, T. and Lusardi, A.: 2010, Financial Literacy and Retirement Planning
in Germany, mimeo .
Bundesverband Investment und Asset Management e.V.: 2009, Investment 2009 - Daten,
Fakten, Entwicklung, Bundesverband Investment und Asset Management e.V.
33ECB
Working Paper Series No 1299Febuary 2011
Calvet, L. E., Campbell, J. Y. and Sodini, P.: 2007, Down or Out: Assessing the Welfare
Costs of Household Investment Mistakes, Journal of Political Economy 115(5), 707–
747.
Calvet, L. E., Campbell, J. Y. and Sodini, P.: 2009, Fight or Flight? Portfolio Rebal-
ancing by Individual Investors, Quarterly Journal of Economics 124(1), 301–348.
Campbell, J., Cocco, J., Gomes, F. and Maenhout, P. J.: 2001, Risk Aspects of
Investment-Based Social Security Reform, University of Chicago Press, chapter In-
vesting Retirement Wealth: A Life-Cycle Model.
Campbell, J. Y.: 2006, Household Finance, The Journal of Finance LXI(4), 1553–1604.
Campbell, J. Y. and Viceira, L. M.: 2003, Strategic Asset Allocation - Portfolio Choice
for Long-Term Investors, Oxford University Press.
Christelis, D., Geogarakos, D. and Haliassos, M.: 2010, Differences in Portfolios Across
Countries: Economic Environment Versus Household Characteristics, MEA Discus-
sion Paper 204-2010.
Christelis, D., Jappelli, T. and Padula, M.: 2010, Cognitive Abilities and Portfolio
Choice, European Economic Review 54, 18–38.
Christiansen, C., Schroter Joensen, J. and Rangvid, J.: 2008, Are Economists More
Likely to Hold Stocks?, Review of Finance 12, 465–496.
Cocco, J. F., Gomes, F. J. and Maenhout, P. J.: 2005, Consumption and Portfolio
Choice over the Life Cycle, Review of Financial Studies 18, 491–533.
Cole, S. and Shastry, G. K.: 2009, Smart Money: The Effect of Education, Cognitive
Ability, and Financial Literacy on Financial Market Participation, Working Paper
Harvard Business School 09-071.
Coval, J. D. and Shumway, T.: 2005, Do Behavioral Biases Affect Prices?, The Journal
of Finance LX, 1–34.
Curcuru, S., Heaton, J., Lucas, D. and Moore, D.: 2004, Heterogeneity and Portfolio
Choice: Theory and Evidence, Handbook of Financial Econometrics, North-Holland.
34ECBWorking Paper Series No 1299Febuary 2011
Deaton, A.: 1997, The Analysis of Household Surveys: A Microeconometric Approach
to Development Policy, 3rd edn, Baltimore, MD: Published for the World Bank by
Johns Hopkins University Press.
Dohmen, T., Falk, A., Huffman, D., Sunde, U., Schupp, J. and Wagner, G. G.: 2010,
Individual Risk Attitudes: Measurement, Determinants and Behavioral Consequences,
Journal of the European Economic Association forthcoming.
Duflo, E. and Saez, E.: 2003, The Role of Information and Social Interactions in Retire-
ment Plan Decisions: Evidence from a Randomized Experiment, Quarterly Journal
of Economics 118(3), 815–842.
Frederick, S.: 2005, Cognitive Reflection and Decision Making, Journal of Economic
Perspectives 19, 25–42.
Goetzmann, W. N. and Kumar, A.: 2008, Equity Portfolio Investment, Review of Fi-
nance 12, 433–463.
Grinblatt, M., Keloharju, M. and Linnainma, J.: 2009, Do Smart Investors Outperform
Dumb Investors?, Chicago Booth Research Paper 09-33.
Grinblatt, M., Keloharju, M. and Linnainmaa, J.: 2010, IQ and Stock Market Partici-
pation, CRSP Working Paper 09-27.
Guiso, L., Haliassos, M. and Jappelli, T.: 2003, Household Stockholding in Europe:
Where Do We Stand and Where Do We Go?, Economic Policy 18(36), 123–170.
Guiso, L. and Jappelli, T.: 2005, Awareness and Stock Market Participation, Review of
Finance 9, 537–567.
Guiso, L. and Jappelli, T.: 2008, Financial Literacy and Portfolio Diversification, EUI
Working Paper 31.
Haliassos, M. and Bertaut, C. C.: 1995, Why Do so few Hold Stocks?, The Economic
Journal 105(432), 1110–1129.
Heckman, J. J.: 1976, The common structure of statistical models of truncation, samlple
selection adn limited dependent variables and a simple estimator of such models.,
Annals of the Economic and Social Measurement 5, 475–492.
35ECB
Working Paper Series No 1299Febuary 2011
Heckman, J. J.: 1979, Sample Selection Bias as a Specification Error, Econometrica
47, 153–161.
Kimball, M. S. and Shumway, T.: 2010, Investor Sophistication and the Home Bias,
Diversification, and Employer Stock Puzzles, University of Michigan Working Paper
.
Locke, P. R. and Mann, S. C.: 2005, Professional Trader Discipline and Trade Disposi-
tion, Journal of Financial Economics 76, 401–444.
Lusardi, A. and Mitchell, O.: 2006, Financial Literacy and Planning: Implications for
Retirement Wellbeing, Pension Research Council Working Paper 1.
Malmendier, U. and Nagel, S.: 2010, Depression Babies: Do Macroeconomic Experiences
Affect Risk-Taking?, Quarterly Journal of Economics conditionally accepted.
Mankiw, N. G. and Zeldes, S. P.: 1991, The Consumption of Stockholders and Non-
stockholders, Journal of Financial Economics 29, 97–112.
Markowitz, H.: 1952, Portfolio Selection, The Journal of Finance 7, 77–91.
Massa, M. and Simonov, A.: 2005, Behavioral Biases and Investment, Review of Finance
9, 483–507.
McArdle, J. J., Smith, J. P. and Willis, R.: 2009, Cognition and Economic Outcomes in
the Health and Retirement Survey, IZA Discussion Paper IZA DP 4269.
Mehra, R.: 2006, The Equity Premium Puzzle - A Review, Foundations and Trends in
Finance 2, 1–81.
Merton, R. C.: 1969, Lifetime Portfolio Selection Under Uncertainty: The Continuous-
Time Case, The Review of Economics and Statistics 51, 247–257.
Merton, R. C.: 1971, Optimum Consumption and Portfolio Rules in a Continuous-Time
Model, Journal of Economic Theory 3, 373–413.
Moskowitz, T. and Vissing-Jorgensen, A.: 2002, The Returns to Entrepreneurial Invest-
ment: A Private Equity Premium Puzzle, American Economic Review 92(4), 745–778.
36ECBWorking Paper Series No 1299Febuary 2011
Odean, T.: 1998, Are Investors Reluctant to Realize Their Losses?, The Journal of
Finance LIII(5), 1775–1798.
Ramb, F. and Scharnagl, M.: 2010, Households’ Portfolio Structure in Germany - Anal-
ysis of Financial Accounts Data 1959-2009, unpublished working papers .
Rubin, D. B.: 1987, Multiple Imputation for Nonresponse in Surveys, New York: Wiley.
Rubin, D. B.: 1996, Multiple Imputation After 18+ Years, Journal of the American
Statistical Association 91(434), 473–489.
Samuelson, P. A.: 1969, Lifetime Portfolio Selection by Dynamic Stochastic Program-
ming, The Review of Economics and Statistics 51, 239–246.
Schunk, D.: 2008, A Markov Chain Monte Carlo Algorithm for Multiple Imputation in
Large Surveys, Advances in Statistical Analysis 92, 101–114.
van Rooij, M., Lusardi, A. and Alessie, R.: 2007, Financial Literacy and Stock Market
Participation, NBER Working Paper 13565.
Vissing-Jorgensen, A.: 2002, Towards an Explanation of Household Portfolio Choice:
Nonfinancial Income and Participation Cost Structures, Working Paper University of
Chicago .
Vissing-Jorgensen, A.: 2003, Perspectives on Behavioral Finance: Does “Irrationality”
Disappear with Wealth? Evidence from Expectations and Actions, NBER Macroeco-
nomics Annual 18, 139–194.
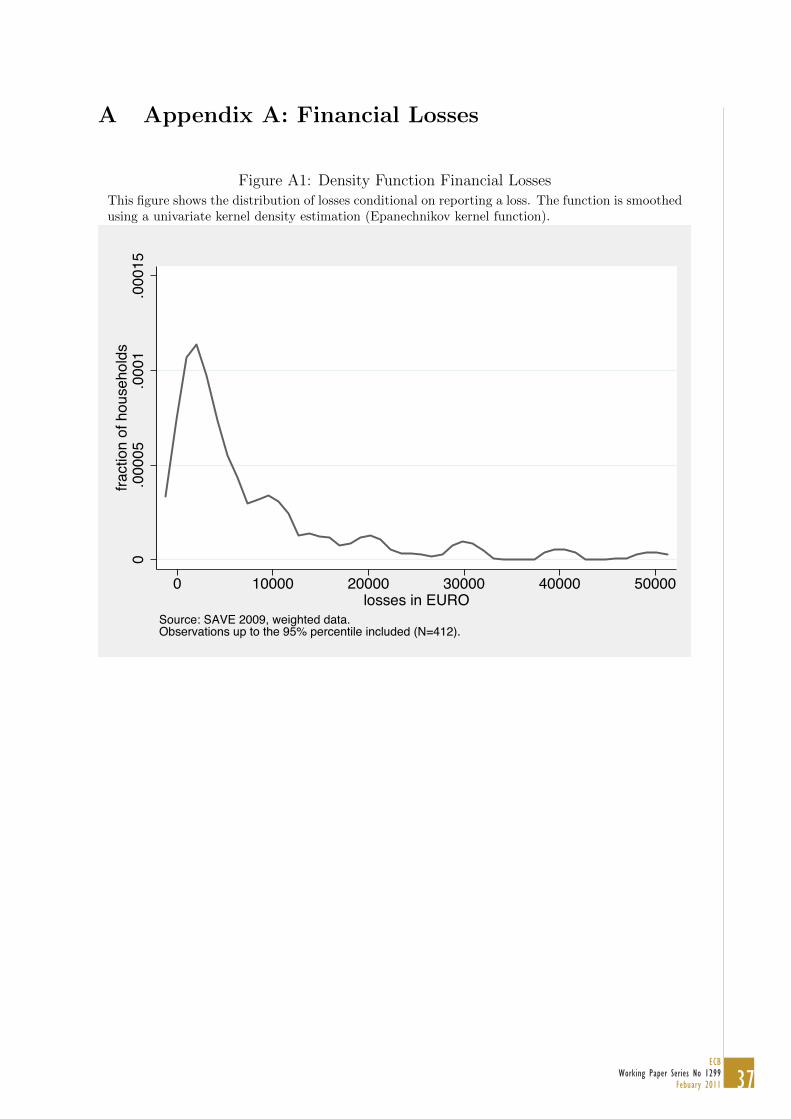
37ECB
Working Paper Series No 1299Febuary 2011
A Appendix A: Financial Losses
Figure A1: Density Function Financial LossesThis figure shows the distribution of losses conditional on reporting a loss. The function is smoothedusing a univariate kernel density estimation (Epanechnikov kernel function).
0.0
0005
.000
1.0
0015
fract
ion
of h
ouse
hold
s
0 10000 20000 30000 40000 50000losses in EURO
Source: SAVE 2009, weighted data.Observations up to the 95% percentile included (N=412).
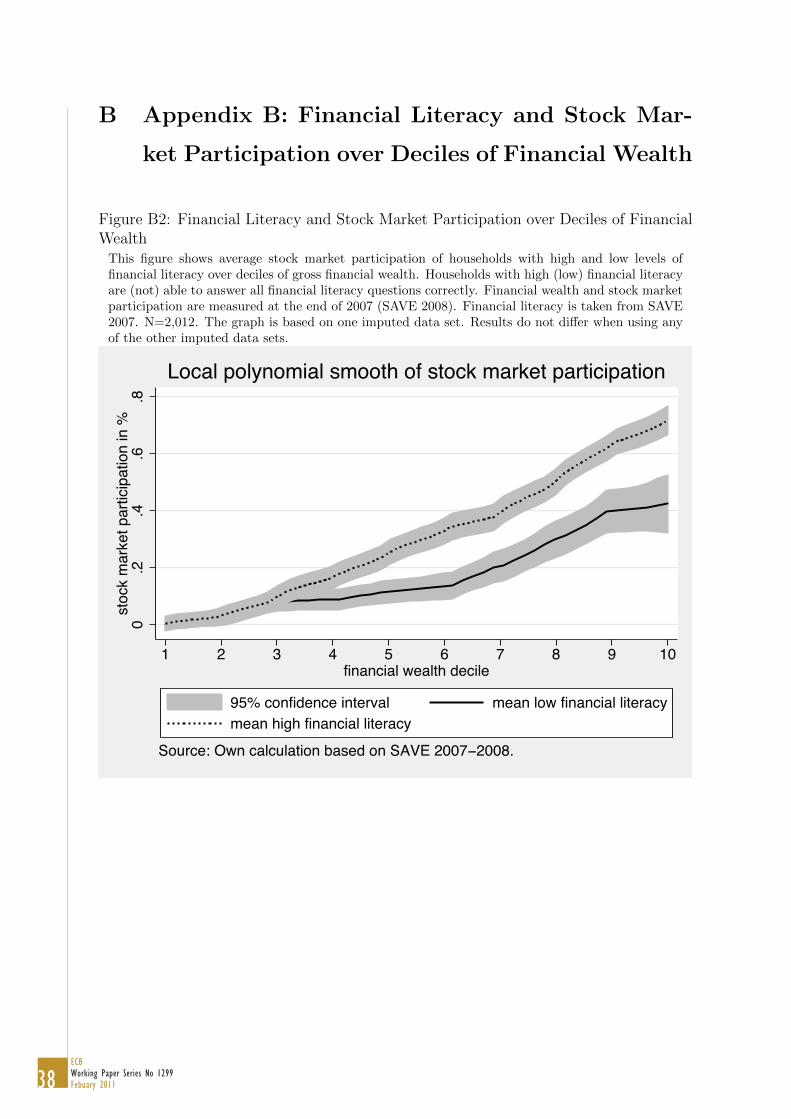
38ECBWorking Paper Series No 1299Febuary 2011
B Appendix B: Financial Literacy and Stock Mar-
ket Participation over Deciles of Financial Wealth
Figure B2: Financial Literacy and Stock Market Participation over Deciles of FinancialWealth
This figure shows average stock market participation of households with high and low levels offinancial literacy over deciles of gross financial wealth. Households with high (low) financial literacyare (not) able to answer all financial literacy questions correctly. Financial wealth and stock marketparticipation are measured at the end of 2007 (SAVE 2008). Financial literacy is taken from SAVE2007. N=2,012. The graph is based on one imputed data set. Results do not differ when using anyof the other imputed data sets.
0.2
.4.6
.8st
ock
mar
ket p
artic
ipat
ion
in %
1 2 3 4 5 6 7 8 9 10financial wealth decile
95% confidence interval mean low financial literacymean high financial literacy
Source: Own calculation based on SAVE 2007−2008.
Local polynomial smooth of stock market participation
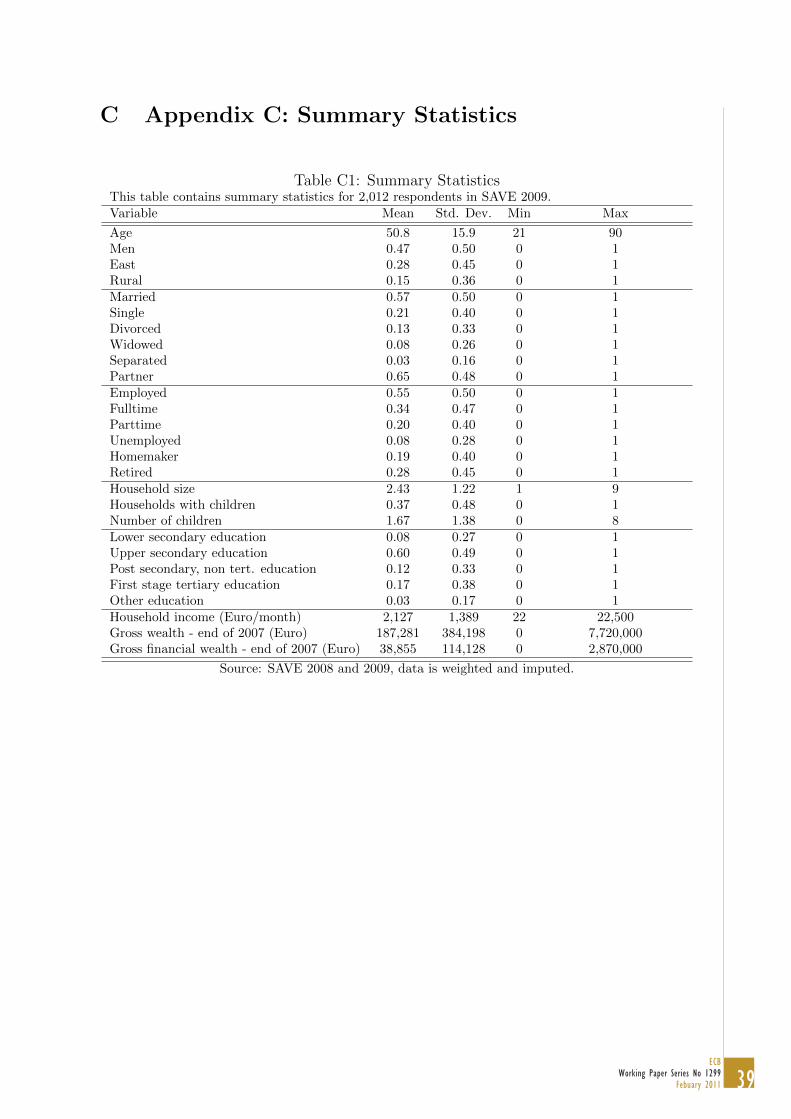
39ECB
Working Paper Series No 1299Febuary 2011
C Appendix C: Summary Statistics
Table C1: Summary StatisticsThis table contains summary statistics for 2,012 respondents in SAVE 2009.Variable Mean Std. Dev. Min Max
Age 50.8 15.9 21 90Men 0.47 0.50 0 1East 0.28 0.45 0 1Rural 0.15 0.36 0 1Married 0.57 0.50 0 1Single 0.21 0.40 0 1Divorced 0.13 0.33 0 1Widowed 0.08 0.26 0 1Separated 0.03 0.16 0 1Partner 0.65 0.48 0 1Employed 0.55 0.50 0 1Fulltime 0.34 0.47 0 1Parttime 0.20 0.40 0 1Unemployed 0.08 0.28 0 1Homemaker 0.19 0.40 0 1Retired 0.28 0.45 0 1Household size 2.43 1.22 1 9Households with children 0.37 0.48 0 1Number of children 1.67 1.38 0 8Lower secondary education 0.08 0.27 0 1Upper secondary education 0.60 0.49 0 1Post secondary, non tert. education 0.12 0.33 0 1First stage tertiary education 0.17 0.38 0 1Other education 0.03 0.17 0 1Household income (Euro/month) 2,127 1,389 22 22,500Gross wealth - end of 2007 (Euro) 187,281 384,198 0 7,720,000Gross financial wealth - end of 2007 (Euro) 38,855 114,128 0 2,870,000
Source: SAVE 2008 and 2009, data is weighted and imputed.

40ECBWorking Paper Series No 1299Febuary 2011
D Appendix D: Measures of Financial Literacy and
Cognitive Abilities
Financial Literacy
1. Understanding of Interest Rate (Numeracy)
“Suppose you had e100 in a savings account and the interest rate was 2% per
year. After 5 years, how much do you think you would have in the account if you
left the money to grow: more than e102, exactly e102, less than e102?”
2. Understanding of Inflation
“Imagine that the interest rate on your savings account was 1% per year and
inflation was 2% per year. After 1 year, would you be able to buy more than,
exactly the same as, or less than today with the money in this account?”
3. Understanding of Risk and Diversification
“Do you think that the following statement is true or false? Buying a single
company stock usually provides a safer return than a stock mutual fund.” do not
know
Cognitive Reflection Test
1. “A bat and a ball cost 110 cents in total. The bat costs 100 cents more than the
ball. How much does the ball cost?”
2. “If it takes 5 machines 5 minutes to make 5 widgets, how long would it take 100
machines to make 100 widgets?”
3. “In a lake, there is a patch of lily pads. Every day, the patch doubles in size. If it
takes 48 days for the patch to cover the entire lake, how long would it take for the
patch to cover half of the lake?”

Work ing PaPer Ser i e Sno 1118 / november 2009
DiScretionary FiScal PolicieS over the cycle
neW eviDence baSeD on the eScb DiSaggregateD aPProach
by Luca Agnello and Jacopo Cimadomo