Embed Size (px)
Citation preview

March 13, 2016
Morgan Stanley does and seeks to do business with companies covered in Morgan Stanley Research. As a result, investors should be aware that the firm may have a conflict of interest that could affect the objectivity of Morgan Stanley Research. Investors should consider Morgan Stanley Research as only a single factor in making their investment decision. For analyst certification and other important disclosures, refer to the Disclosure Section, located at the end of this report.
* = This Research Report has been partially prepared by analysts employed by non-U.S. affiliates of the member.+= Analysts employed by non-U.S. affiliates are not registered with FINRA, may not be associated persons of the member and may not be subject to NASD/NYSE restrictions on communications with a subject company, public appearances and trading securities held by a research analyst account.
B L U E P A P E R
Wholesale Banks & Asset Managers
Learning to Live with Less Liquidity Asset managers: systemic risk over-estimated; conduct risk underestimated.
Contrary to widely held perception, mutual funds have not been a source of systemic risk: in 2015, redemptions were just 2-6% in the worst three months. But stress-tests, new liquidity rules, a focus on value for money and more intrusive regulation will require further adaptation – including a further ~3% cost pressure, and new focus on scale and capital.
Liquidity challenges, exacerbated by negative rates, could help, not hinder, index
and ETF players, and those with longer lock-ups. We think core fixed income ETFs will increasingly be used to help manage fund liquidity. At the other end of our barbell, players with favourable lock-up periods may seize advantage.
Wholesale banks: more strategic pruning to come. Our base case is that many banks will fail to meet their cost of capital in the next two years, especially in Europe. Re-pricing is helping but won’t be enough as ultra-low rates and shifting liquidity dynamics weigh on revenue pools. The benefits of scale are becoming more extreme too. We estimate ~5% of market share could be up for grabs as banks make sharper client and regional choices.
The bigger prize lies in re-thinking the operating model. We estimate that longer-term investment to reshape operating models, structurally removing cost and capital, especially in fixed income and currencies, could lead to a 2-3% RoE uplift, but may take 3+ years. Winners will be those with scale, but specialist banks and non-banks could also prosper.
M O R G A N S T A N L E Y R E S E A R C H
G l o b a l
Huw van Steenis1
+44 (0)20 7425 9747
Betsy Graseck2
+1 212 761 8473
Bruce Hamilton1
+44 (0)20 7425 7597
Michael Cyprys2
+1 212 761 7619
Anil Sharma1
+44 (0)20 7425 8828
Vishwanath Tirupattur 2
+1 212 761 1043
Christian Edelmann +1 212 345 3589
James Davis +44 (0)20 7852 7631
Mariya Rosberg +1 646 364 8448
Patrick Hunt +44 (0)20 7852 7608
Jaime Lizarraga +34 667 314 197
Dawn Kelly +44 (0)20 7852 7843
Oliver Wyman is a global leader in management consulting. For more information, visit www.oliverwyman.com.
Oliver Wyman is not authorized or regulated by the PRA or the FCA and is not providing investment advice. Oliver Wyman authors are not research analysts and are neither FCA nor FINRA registered. Oliver Wyman authors have only contributed their expertise on business strategy within the report. Oliver Wyman’s views are clearly delineated. The securities and valuation sections of report are the work of Morgan Stanley only and not Oliver Wyman.
For disclosures specifically pertaining to Oliver Wyman, please see the Disclosure Section located at the end of this report.
1Morgan Stanley & Co. International plc+2Morgan Stanley & Co. Incorporated
Morgan Stanley Blue Papers focus on critical investment themes that require coordinated
perspectives across industry sectors, regions, or asset classes.

March 13, 2016
Wholesale Banks & Asset Managers
Table of Contents
Joint Executive Summary: How Business Models Will Adapt to Less Liquidity ....................................................................... 3
1. Learning to Live with Less in Asset Management ............................................................................................................... 9
2. Learning to Live with Less in Banks .................................................................................................................................... 16
3. Learning to Live with Less in Market Infrastructure ............................................................................................................. 31
2
March 13, 2016
Wholesale Banks & Asset Managers
M O R G A N S T A N L E Y B L U E P A P E R Joint Executive Summary: How Business Models Will Adapt to Less Liquidity
QE, financial regulation and changes in market structure lie at the heart of a profound shift in liquidity risk from banks to investors. This journey is far from over. Where it goes is the focus of this report.
There will be an enduring impact on business models, we
believe, as well as on who wins and loses. Asset managers will have to adjust processes and product strategies as they learn to live with far less plentiful and more expensive liquidity, and far more intrusive conduct regulation. Regulation and technology – plus the buy-side response – are accelerating the push towards electronic and agency trading in many fixed income markets. For the sell-side, changing the operating model of securities trading will be crucial to success, in our view, and some will need to resort to tough strategic pruning.
Liquidity conundrum troubling more investors
Liquidity conditions have worsened since we wrote last
year, and we are concerned that a couple of factors will
weigh further on the market.
Banks are still looking to trim capacity. As regulatory costs and challenging markets continue to drag on returns, and many banks are not achieving their hurdle rates, we expect another ~10% shrinkage in balance sheets in the next two years.
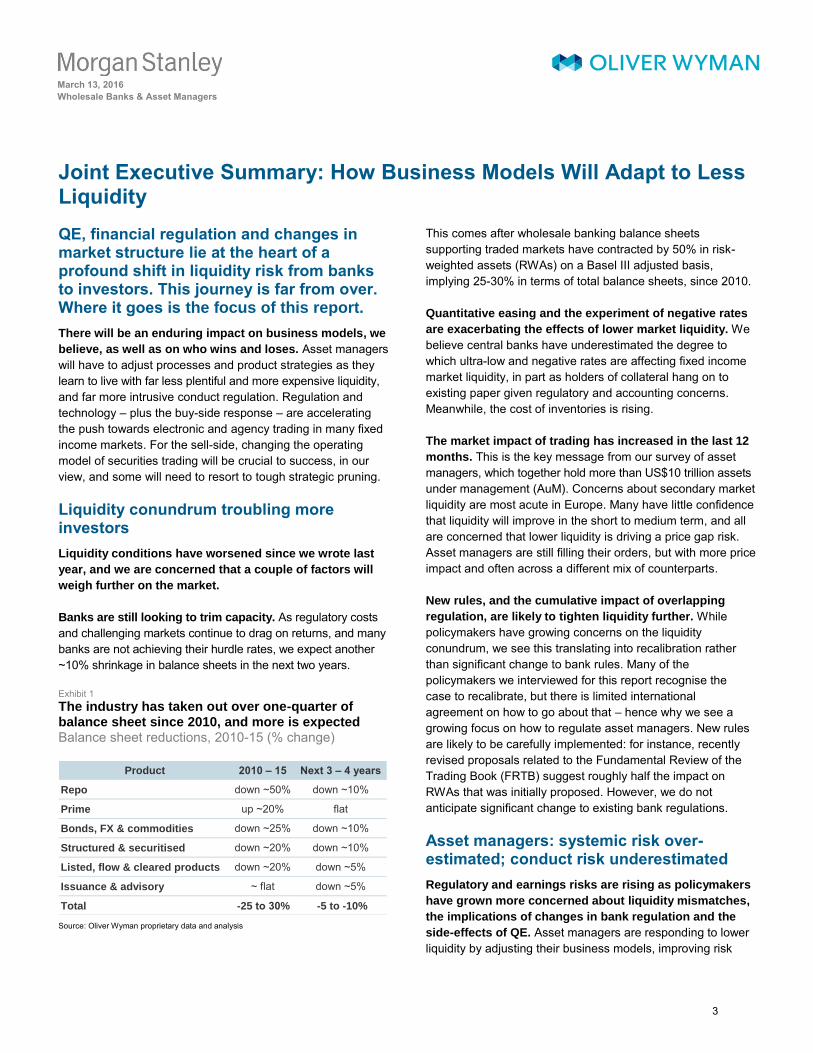
Exhibit 1 The industry has taken out over one-quarter of balance sheet since 2010, and more is expected Balance sheet reductions, 2010-15 (% change)
Source: Oliver Wyman proprietary data and analysis
This comes after wholesale banking balance sheets supporting traded markets have contracted by 50% in risk-weighted assets (RWAs) on a Basel III adjusted basis, implying 25-30% in terms of total balance sheets, since 2010.
Quantitative easing and the experiment of negative rates
are exacerbating the effects of lower market liquidity. We believe central banks have underestimated the degree to which ultra-low and negative rates are affecting fixed income market liquidity, in part as holders of collateral hang on to existing paper given regulatory and accounting concerns. Meanwhile, the cost of inventories is rising.
The market impact of trading has increased in the last 12
months. This is the key message from our survey of asset managers, which together hold more than US$10 trillion assets under management (AuM). Concerns about secondary market liquidity are most acute in Europe. Many have little confidence that liquidity will improve in the short to medium term, and all are concerned that lower liquidity is driving a price gap risk. Asset managers are still filling their orders, but with more price impact and often across a different mix of counterparts.
New rules, and the cumulative impact of overlapping
regulation, are likely to tighten liquidity further. While policymakers have growing concerns on the liquidity conundrum, we see this translating into recalibration rather than significant change to bank rules. Many of the policymakers we interviewed for this report recognise the case to recalibrate, but there is limited international agreement on how to go about that – hence why we see a growing focus on how to regulate asset managers. New rules are likely to be carefully implemented: for instance, recently revised proposals related to the Fundamental Review of the Trading Book (FRTB) suggest roughly half the impact on RWAs that was initially proposed. However, we do not anticipate significant change to existing bank regulations.
Asset managers: systemic risk over-estimated; conduct risk underestimated
Regulatory and earnings risks are rising as policymakers
have grown more concerned about liquidity mismatches,
the implications of changes in bank regulation and the
side-effects of QE. Asset managers are responding to lower liquidity by adjusting their business models, improving risk
Product 2010 – 15 Next 3 – 4 years
Repo down ~50% down ~10%
Prime up ~20% flat
Bonds, FX & commodities down ~25% down ~10%
Structured & securitised down ~20% down ~10%
Listed, flow & cleared products down ~20% down ~5%
Issuance & advisory ~ flat down ~5%
Total -25 to 30% -5 to -10%
3
March 13, 2016
Wholesale Banks & Asset Managers
M O R G A N S T A N L E Y B L U E P A P E R management and husbanding cash – but there is more to be done. Changes to risk management and product construction, as well as a shift in competitive structure, are needed.
Systemic risk of mutual funds overestimated
Mutual funds have again proven not to be a source of
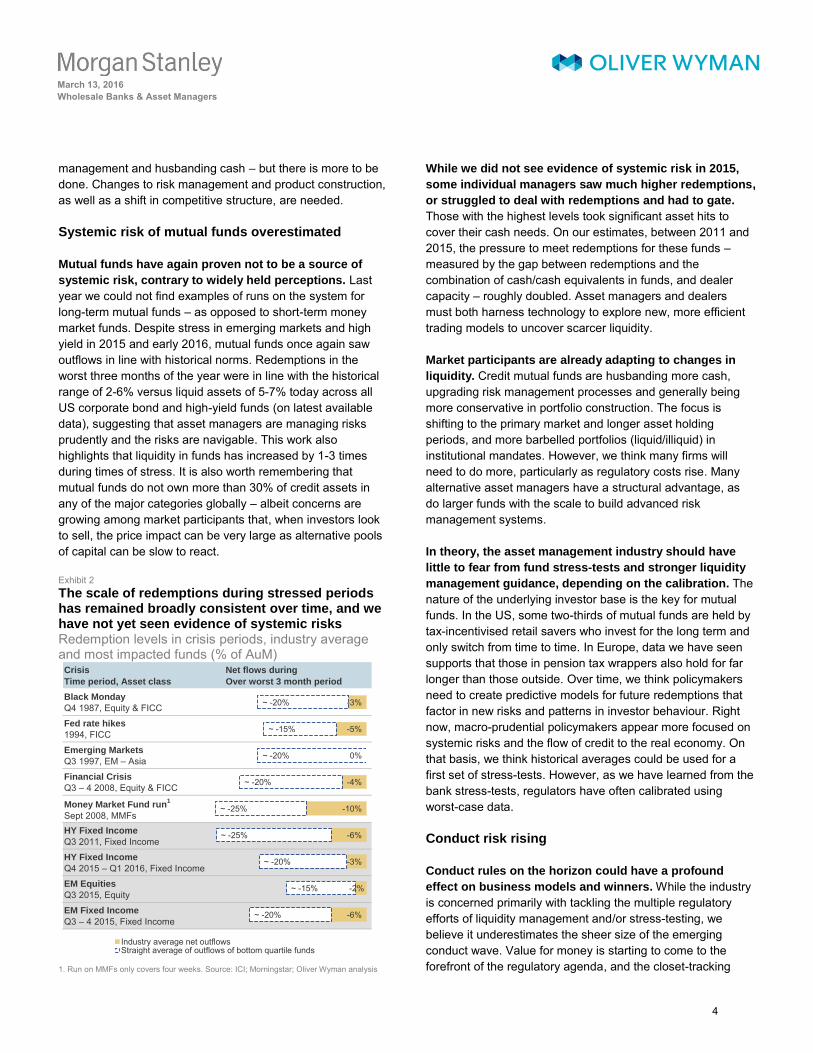
systemic risk, contrary to widely held perceptions. Last year we could not find examples of runs on the system for long-term mutual funds – as opposed to short-term money market funds. Despite stress in emerging markets and high yield in 2015 and early 2016, mutual funds once again saw outflows in line with historical norms. Redemptions in the worst three months of the year were in line with the historical range of 2-6% versus liquid assets of 5-7% today across all US corporate bond and high-yield funds (on latest available data), suggesting that asset managers are managing risks prudently and the risks are navigable. This work also highlights that liquidity in funds has increased by 1-3 times during times of stress. It is also worth remembering that mutual funds do not own more than 30% of credit assets in any of the major categories globally – albeit concerns are growing among market participants that, when investors look to sell, the price impact can be very large as alternative pools of capital can be slow to react.
Exhibit 2 The scale of redemptions during stressed periods has remained broadly consistent over time, and we have not yet seen evidence of systemic risks Redemption levels in crisis periods, industry average and most impacted funds (% of AuM)
1. Run on MMFs only covers four weeks. Source: ICI; Morningstar; Oliver Wyman analysis
While we did not see evidence of systemic risk in 2015,
some individual managers saw much higher redemptions,
or struggled to deal with redemptions and had to gate.
Those with the highest levels took significant asset hits to cover their cash needs. On our estimates, between 2011 and 2015, the pressure to meet redemptions for these funds – measured by the gap between redemptions and the combination of cash/cash equivalents in funds, and dealer capacity – roughly doubled. Asset managers and dealers must both harness technology to explore new, more efficient trading models to uncover scarcer liquidity.
Market participants are already adapting to changes in
liquidity. Credit mutual funds are husbanding more cash, upgrading risk management processes and generally being more conservative in portfolio construction. The focus is shifting to the primary market and longer asset holding periods, and more barbelled portfolios (liquid/illiquid) in institutional mandates. However, we think many firms will need to do more, particularly as regulatory costs rise. Many alternative asset managers have a structural advantage, as do larger funds with the scale to build advanced risk management systems.
In theory, the asset management industry should have
little to fear from fund stress-tests and stronger liquidity
management guidance, depending on the calibration. The nature of the underlying investor base is the key for mutual funds. In the US, some two-thirds of mutual funds are held by tax-incentivised retail savers who invest for the long term and only switch from time to time. In Europe, data we have seen supports that those in pension tax wrappers also hold for far longer than those outside. Over time, we think policymakers need to create predictive models for future redemptions that factor in new risks and patterns in investor behaviour. Right now, macro-prudential policymakers appear more focused on systemic risks and the flow of credit to the real economy. On that basis, we think historical averages could be used for a first set of stress-tests. However, as we have learned from the bank stress-tests, regulators have often calibrated using worst-case data.
Conduct risk rising
Conduct rules on the horizon could have a profound
effect on business models and winners. While the industry is concerned primarily with tackling the multiple regulatory efforts of liquidity management and/or stress-testing, we believe it underestimates the sheer size of the emerging conduct wave. Value for money is starting to come to the forefront of the regulatory agenda, and the closet-tracking
Crisis
Time period, Asset class
Net flows during
Over worst 3 month period
Black Monday
Q4 1987, Equity & FICC
Fed rate hikes
1994, FICC
Emerging Markets
Q3 1997, EM – Asia
Financial Crisis
Q3 – 4 2008, Equity & FICC
Money Market Fund run1
Sept 2008, MMFsHY Fixed Income
Q3 2011, Fixed Income
HY Fixed Income
Q4 2015 – Q1 2016, Fixed Income
EM Equities
Q3 2015, Equity
EM Fixed Income
Q3 – 4 2015, Fixed Income
-3%
-5%
0%
-4%
-10%
-6%
-3%
-2%
-6%
~ -20%
~ -15%
~ -20%
~ -20%
~ -25%
~ -25%
~ -20%
~ -15%
~ -20%
Industry average net outflowsStraight average of outflows of bottom quartile funds
4
March 13, 2016
Wholesale Banks & Asset Managers
M O R G A N S T A N L E Y B L U E P A P E R debate entails a liability risk for the industry. We see the biggest concern in terms of a conduct spill-over from prudential regulation, such as rising litigation.
Our base case assumes that higher costs are necessary
for asset managers to respond to more stringent conduct
rules. We expect incremental conduct/compliance-related costs to put further pressure on margins in 2017-18. Combined with increased costs for upgrading trading and liquidity management, this could push up costs by around 3% across the industry. We believe the mid-sized players – many of which are captive within large financial institutions – underestimate the need for change and have not touched the core of the operating model. Our bear case is for a pick-up in litigation on the back of this conduct risk. All of this implies that it will be critical for shareholders and investors alike to carefully monitor capital – a largely unmanaged resource in asset management.
Liquidity challenges could help, not hinder, index
and ETF players
Contrary to concerns on liquidity, fixed income exchange
traded funds (ETFs) may actually benefit. Negative rates and asset manager liquidity guidelines and stress-tests should boost fixed income ETFs, on our analysis. One example of support for fixed income ETFs, like in equities, has been a ‘sweep’ for cash coming in or set to leave. Our meetings showed that a growing number of managers are open to this, including leaving ETFs as a longer-term buffer. That said, they also revealed a schism between managers who value ETFs and those who do not wish to be seen to be using ETFs in their active funds. The largest firms, hedge funds and insurance companies sounded far less reluctant to have competitor CUSIPs/ISINs in their portfolios than some of their mid-sized peers.
However, we expect ETF growth to focus increasingly on
larger, more liquid asset classes. We see incremental assets under management coming from core asset classes as scale and tracking error challenges put pressure on lower liquidity areas. These may constrain some smart beta players in less liquid strategies. The bear case for ETFs, though, is that regulators take action (for example, more onerous liquidity buffers for ETFs themselves) to stem their rise.
Players with longer lock-up periods may be able to take
advantage. Open-ended strategies that depend on liquidity for alpha will be more constrained, which could lead to some convergence of returns. This should benefit alternative managers with longer liquidity locks, although strategies that
depend on leverage may find it increasingly difficult to obtain financing from the street. We estimate that US$1-3 trillion of open-ended mutual fund exposure is to emerging markets and high-yield assets where liquidity challenges are most intense. More closed-end or segregated mandate ownership of these assets could help, or new technology to dramatically reduce mandate sizes.
Leaders in the ‘solutions’ space should also emerge as
winners, but we expect the field to narrow sharply. We see attractive growth opportunities for multi-asset solutions. However, the field looks set to narrow as (i) ultra-low rates and liquidity challenge the model, and (ii) some providers struggle to make the transition from product provider to a broader advisory role.
Banks: heavy pruning necessary to boost returns
Our base case is that many investment banks, especially
in Europe, will fail to achieve their cost of capital over the
next two years. Only further restructuring, capacity shrinkage and changing the business model can drive a recovery, in our view. Re-pricing is starting to help, but will not be enough on its own. Scale benefits are becoming ever more extreme, posing tough questions for managements outside the top five franchises in any area.
Ultra-low rates, new regulation and thin liquidity have
structurally changed the client opportunity for banks, and
the industry is still grappling with this. Since 2010, client sales have fallen by 1-2% per year as clients have become more selective over when and how to trade. Critically, banks are now much less able to monetise this flow. Despite removing US$4-5 trillion of balance sheet, a similar amount of RWA and US$20 billion of cost since 2010, there is still too much capacity, in our view, relative to the forward-looking client revenue opportunity.
With around one- third of banks performing below hurdle
rates, we expect tough decisions about withdrawing
capital from parts of the business. Banks have trimmed hard, but most still hold onto a range of sub-hurdle businesses to preserve optionality and for fear of a negative impact on the wider franchise. Yet our analysis suggests that, while scale benefits are strong within a product or region, they are much less marked at the wholesale banking level. We expect more restructuring as banks whittle down to the activities and client groups where they can build an edge. This could put up to 5% of market share up for grabs – similar in size to the wave of restructuring in 2012.
5
March 13, 2016
Wholesale Banks & Asset Managers
M O R G A N S T A N L E Y B L U E P A P E R We model a 1-2% drag on returns from tighter regulation.
Equity allocated to wholesale businesses has increased by around 10% over the past five years, even though banks have reduced balance sheets by 25%. We estimate that the adoption of the FRTB will lead to ~25% RWA inflation for wholesale units pre-mitigation, though much lower post. In a group context, this implies modest low-single-digit RWA pressure – albeit the impact will vary from bank to bank and looks greatest for less liquid products. Further headwinds are likely from the Operational Risk Review, Total Loss-Absorbing Capacity (TLAC) and the beginning of Comprehensive Capital Analysis and Review (CCAR) stress-testing for foreign banks in the US in 2016. We believe that the size and shape of the impact will be significantly larger than is generally anticipated, and that some intermediate holding companies may need to downsize their operations further.
Re-pricing is starting to help, but is limited. Capacity withdrawal has started to feed through to re-pricing, most notably in repo and to a lesser degree in flow fixed income. But these businesses only represent 15-20% of industry revenues and, in other areas, fierce competition and increased transparency are weighing on margins.
Exhibit 3
Industry returns can still achieve hurdle rates, but with limited growth banks will need to deliver both operating model reform and strategic pruning
RoE outlook to reach ~12% RoE, 3-5 year outlook from 2015
Source: Company filings and annual reports; Oliver Wyman analysis
Longer-term competitive advantage lies in re-thinking the operating model
The bigger prize now lies in reshaping the operating
model. Banks will need to streamline infrastructure, transform sales models and push towards electronic and alternative execution. We think this could lead to a net 2-3% RoE uplift
for the industry, but over several years and requiring considerable investment. Those under earnings pressure may struggle to capture these benefits unless they make tough choices to free up cost, capital and management bandwidth.
We see most scope to reform operating models in fixed
income. We think economic pressures will push more banks to create capital-light models, supporting new execution styles. Our interviews with asset managers suggest that there is widespread support for this transition, with some pushing volumes to alternative platforms to improve liquidity. However, there is still a lot of inertia, and most investors still view deep relationships with a core set of banks as vital to weather volatile markets and scarce liquidity.
Non-banks will grow in importance and could capture
US$3-5 billion in revenues as sub-scale players pull back.
Shifting liquidity dynamics and persistently low rates are making it ever harder to monetise client activity in flow fixed income. In liquid markets such as foreign exchange, government bonds and swaps, non-bank market makers are already becoming a strong force. Sub-scale banks are increasingly likely, we believe, to opt for partnerships with third-party liquidity providers, and offer ‘white-label’ solutions – accepting revenue loss for cost and capital release. Incredit, there is a battle for control of data networks as banks shift towards a quasi-agency role, and we anticipate growing use of non-bank balance sheets.
Yet a range of viable FICC models looks likely to stay.
Institutional flow trading is the area under most pressure – but it represents only 20% of FICC revenues, on our analysis. Other areas, such as debt capital markets, corporate hedging and foreign exchange, solutions and illiquid credit trading, remain more attractive. The larger players will be committed across the board, we believe, leveraging their scale advantage in terms of technology and depth of internal liquidity. Smaller players will have to carve out profitable niches, we believe, and exit or outsource other activities.
Changes to client behaviour are both a challenge and
opportunity for the sell-side. Clients are becoming ever more sophisticated in managing their order flow and dealer relationships. This implies a shifting role for sales to leverage data better and further skew towards electronic distribution as banks look to take out cost. Harnessing data will be vital to enable banks to better tier and ration service levels across clients.
Target RoEStrategicpruning
Reform ofoperatingmodels
Revenuegrowth
Pre-mgmt.action RoE
Regulatorydrag
2015RoE
9% 1 – 2%
~7%2 – 3%
~12%
+2%
6
March 13, 2016
Wholesale Banks & Asset Managers
M O R G A N S T A N L E Y B L U E P A P E R Tackling infrastructure costs is critical; up to 20% could
be released, or US$15 billion in costs. Relatively few firms have managed to rationalise their technology platforms, governance and controls, but the stakes are high as there is less low-hanging fruit in the front office now. Banks have already cut costs by 8-10% over the past five years, but infra-structure costs have stayed resolute as complex regulatory initiatives have offset any benefits. Success over the next two to three years will hinge on banks being able to overhaul their infrastructure cost base and respond to new technologies.
Revenues on the wane; scale models benefiting for now
Our base case sees revenues down ~10% in 2016, putting
ever greater pressure on management teams to act. The combination of turning credit and equity markets with ultra-low interest rates is creating particularly tough cyclical headwinds, in addition to structural client changes and capacity withdrawal. This would imply FICC to be down by c.30% since 2013. More broadly, wholesale banking fee pools would be lower as a proportion of GDP than at any time since 1995, save the crisis. Our bear case is calibrated to equity market corrections over the past 30 years – which have typically wiped out four to six quarters of earnings.
Cyclical headwinds highlight structural over-capacity in
equities and investment banking. Banks have skewed towards these areas in pursuit of ‘capital-light’ growth, yet many are offering a waterfront service without the scale to cover the heavy fixed cost base. In equities, only the largest global players and truly specialist firms are set to return a profit over the cycle. In banking we are effectively seeing a fragmentation into attractive and unattractive segments. The collapse in leveraged finance, concentration at the top, growing role for boutiques, and fight for deal economics are particularly squeezing the middle.
Deteriorating conditions in emerging markets are turning
up the heat on sub-scale international networks. Many banks have retained considerable optionality in markets where they have long suffered from weak economics, with returns on average only half those of local players. Asia is a particular pain point. We think more banks will trim further.
While the benefits of scale are stark, we do see viable
options for specialist models built around clients and
regions. On average, the top five banks in any given asset class generate 50% more pretax profit per US dollar capital
deployed than the next five. Yet many banks excel in one region or product and not in another, and the economic benefits of size at the overall wholesale level are more muted. In the near term, integrated scale players stand to benefit as they pivot to invest in operating model reform and consolidate share. Yet all those we spoke to saw a very strong role for specialist providers, reinforcing our view that narrow, focused models can also produce advantaged economics. The challenge for these banks is to build portfolios of businesses that are mutually reinforcing and attractive through the cycle. We think this will make choices across regions, and across client groups, more important than ever in driving strategy.
MI players: ultra-low/negative rates to trump structural opportunities
We see opportunities for market infrastructure (MI)
players to step into modular supply-and-demand chains and offer services to the buy- and sell-side, for an estimated prize of >US$5 billion in new revenue. However, they will have to do this in the face of pressured economics, growing liquidity and operational risks, and regulatory challenges. Upgrades to risk management could add 2-3% to industry costs, or US$2-3 billion, we estimate.
Low rates and regulations are challenging the economics
of custodians and clearers, with more costs likely pushed
on to clients. Ultra-low interest rates are placing downward pressure on net interest income, and causing questions for custodians and clearers around collateral types and management. Meanwhile, some of the risk siphoned off the sell-side has come to reside with these players who facilitate intraday trading across markets and timing conventions. We think more costs will be pushed on to clients. Operational deposits are a particular concern as liquidity ratio rules make them costly for custodians to maintain, at a time when many clients are being pushed to hold more cash.
Winners, we believe, will restructure the business model
to take advantage of emerging opportunities. Traditional industry-backed utilities and screen-based data businesses are being challenged by emerging exchange giants and new fin-tech disruptors. Over the past five years, the proportion of industry revenues made outside core businesses has grown from less than 5% to around 15% (primarily data provision and IT systems), and we expect this trend to continue as lines blur between providers, with success defined by brand and the ability to deliver.
7

March 13, 2016
Wholesale Banks & Asset Managers
M O R G A N S T A N L E Y B L U E P A P E RMessages from our proprietary survey
Key takeaways from our meetings with senior executives of asset managers with over US$10 trillion of combined assets under management.
Investors are increasingly concerned about credit market liquidity.
Although the last 12 months have not seen a material deterioration, there
is little confidence in improvement in the near to medium term.
The greatest challenges are seen in emerging markets and high yield,
although concern extends to broader corporate credit, non-agency
mortgages, rates and emerging market FX.
Trades are still being done; what has changed is how and at what price
point.
Many are concerned that bank regulation has impaired market making
and hence liquidity, while the shift in sell-side structure from principal to
agency is hampering liquidity and increasing the risk of price a gap.
All are concerned that lower liquidity is exaggerating market moves in
less liquid securities.
Near-term impacts – greater liquidity premium + cost of borrowing for
corporates; longer-term solution – innovation of structures and product.
Investors are building in larger liquidity premiums, given concerns on
market liquidity and their ability to exit positions if the investment thesis
changes.
Institutional-focused firms can use customised mandates to take greater
liquidity risks and generate client alpha.
The buy-side is trying to limit the number of counterparties to improve
access to the balance sheet from the sell-side. Some still use many
dealers but expect a reduction from here.
Some see daily NAV funds migrating to higher capital structures in order
to keep funds more liquid and nimble; however, this could lead to
homogenisation of holdings.
Many see innovation as critical in terms of mutual fund structures, as
well as significant development in fixed income markets (e.g., reduced
issues by corporates).
Alternative asset managers with longer-dated capital see opportunities
in liquidity-constrained environment with significant price volatility.
Alts increasingly see value in certain credits that trade below intrinsic
value, largely because of the lack of liquidity. But they are taking a buy-
and-hold-to-maturity view because their ability to exit may be limited.
There is overall agreement on the need for better liquidity risk
management across the industry, but most think their practices and
systems are robust enough.
All have policies to monitor liquidity, and consistent portfolio reviews and
mechanisms to handle redemptions.
Many establish liquidity thresholds in daily NAV vehicles by assessing
historical worst redemption experience over various time horizons.
There are mixed views on ETF usage to help manage liquidity: some
consider ETFs as liquid securities within credit funds and are
comfortable using up to a few hundred basis points of the portfolio,
whereas others prefer futures.
Many mutual funds have inter-fund lending arrangements and credit
facilities to help manage redemptions, but for emergency use only.
SEC proposal welcome, though seen as too prescriptive in certain areas.
Investors are supportive of the direction of the SEC proposals, though
some feel they are prescriptive, mainly in regard to liquidity classification
buckets and fund sizing.
Some fear the liquidity bucket proposals could impair liquidity and
returns as everyone rushes to own the same liquid assets and
dispersion among holdings decreases.
Many want to see more global regulatory consistency and coordination,
for example in the use of gates in extremes.
Most view the 15% illiquidity limit as reasonable; some also recommend
a self-report system if getting close to that level.
Swing pricing is viewed as a good thing (currently not allowed in the US,
but SEC proposals could enable funds to enact swing pricing).
Europeans await new rules with interest; those familiar with AIFMD feel it
is a good basis and are at ease with new rules.
Electronic platforms may be successful, but it will be tough unless
dealer community is involved.
Some believe that electronic market makers are far ahead of brokers,
but the latter have all the relationships. A solution could be a partnership
between the two.
Many want to be at the forefront of electronic trading, but are agnostic on
platforms. Despite the number of proposals, many are sceptical that they
hold the solution, and see dealer community involvement as critical.
We would like to thank the firms and individuals who took the time to meet with us.
8
March 13, 2016
Wholesale Banks & Asset Managers
M O R G A N S T A N L E Y B L U E P A P E R 1. Learning to Live with Less in Asset Management
The industry has started to live with less liquidity but, as this journey is
far from over, tougher choices on operating models and product
structures will be required. In combination with a much higher
regulatory focus on conduct risk, this will likely bring capital – a largely
unmanaged resource – to the forefront of shareholder and investor
attention. Many of the growth opportunities, we believe, will favour
scale players or managers that can bridge the liquidity mismatch.
1.1 Tailwinds abating
For the first time since the global financial crisis, we are
beginning to see sustained pressure on asset managers
as multiple headwinds confront the industry. Regulatory pressures continue to mount, as concerns around potential systemic risks may spill over into conduct risks. The industry has started to adjust, but there is more to be done, we believe, to upgrade the operating model as the sell-side continues to ration service levels and liquidity provision.
These structural challenges must be absorbed in the
context of a much more difficult revenue environment.
After 45%+ revenue growth since 2008, on the back of ~55% growth in assets under management from US$50 trillion to US$80 trillion, we expect 2016 revenues to be down and see skewed growth prospects out to 2018. Industry AuM were flat in 2015 as QE tapered off in the US, questions around the state of emerging market economies became more prominent, and the collapse in oil prices led to significant outflows from impacted investors such as sovereign wealth funds.
We expect meaningful shifts in strategy in response to
these pressures, driving greater divergence between the
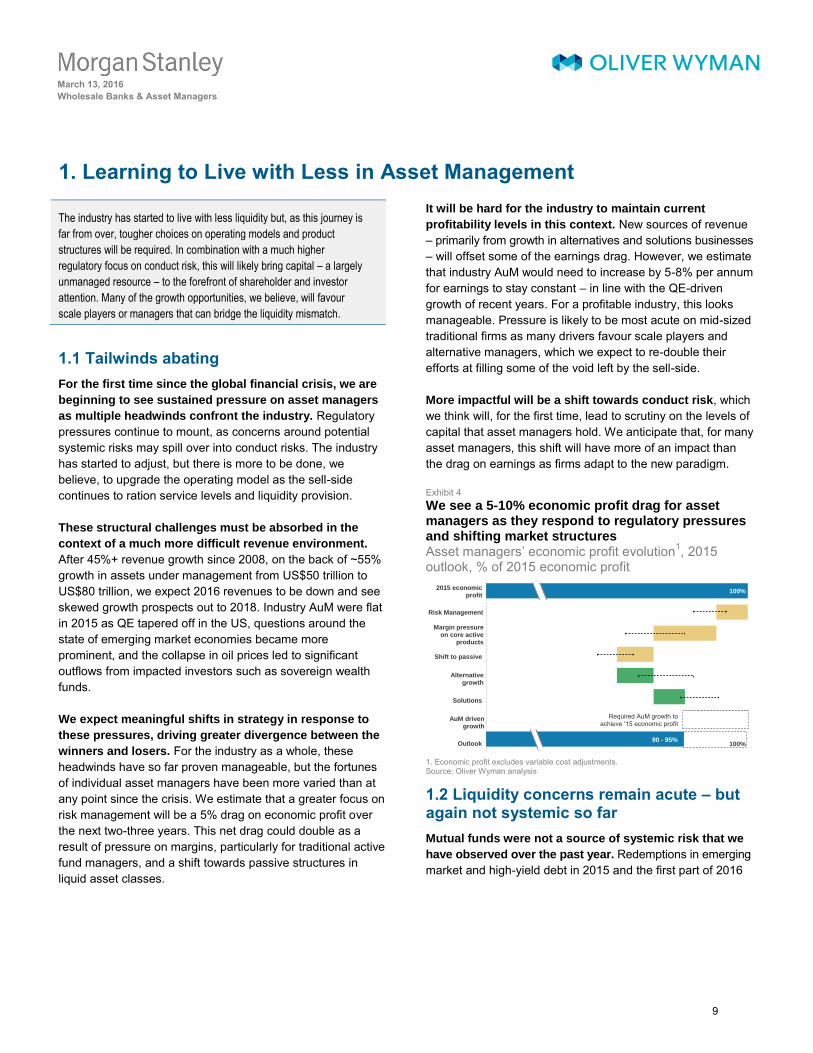
winners and losers. For the industry as a whole, these headwinds have so far proven manageable, but the fortunes of individual asset managers have been more varied than at any point since the crisis. We estimate that a greater focus on risk management will be a 5% drag on economic profit over the next two-three years. This net drag could double as a result of pressure on margins, particularly for traditional active fund managers, and a shift towards passive structures in liquid asset classes.
It will be hard for the industry to maintain current
profitability levels in this context. New sources of revenue – primarily from growth in alternatives and solutions businesses– will offset some of the earnings drag. However, we estimatethat industry AuM would need to increase by 5-8% per annum for earnings to stay constant – in line with the QE-driven growth of recent years. For a profitable industry, this looks manageable. Pressure is likely to be most acute on mid-sized traditional firms as many drivers favour scale players and alternative managers, which we expect to re-double their efforts at filling some of the void left by the sell-side.
More impactful will be a shift towards conduct risk, which we think will, for the first time, lead to scrutiny on the levels of capital that asset managers hold. We anticipate that, for many asset managers, this shift will have more of an impact than the drag on earnings as firms adapt to the new paradigm.
Exhibit 4 We see a 5-10% economic profit drag for asset managers as they respond to regulatory pressures and shifting market structures Asset managers’ economic profit evolution
1, 2015 outlook, % of 2015 economic profit
1. Economic profit excludes variable cost adjustments.Source: Oliver Wyman analysis
1.2 Liquidity concerns remain acute – but again not systemic so far
Mutual funds were not a source of systemic risk that we
have observed over the past year. Redemptions in emerging market and high-yield debt in 2015 and the first part of 2016
100%
90 – 95%
100%
100%
90 - 95%
2015 economic profit
Risk Management
Margin pressure on core active
products
Shift to passive
Alternative growth
Solutions
AuM driven growth
Outlook
Required AuM growth to achieve '15 economic profit
9
March 13, 2016
Wholesale Banks & Asset Managers
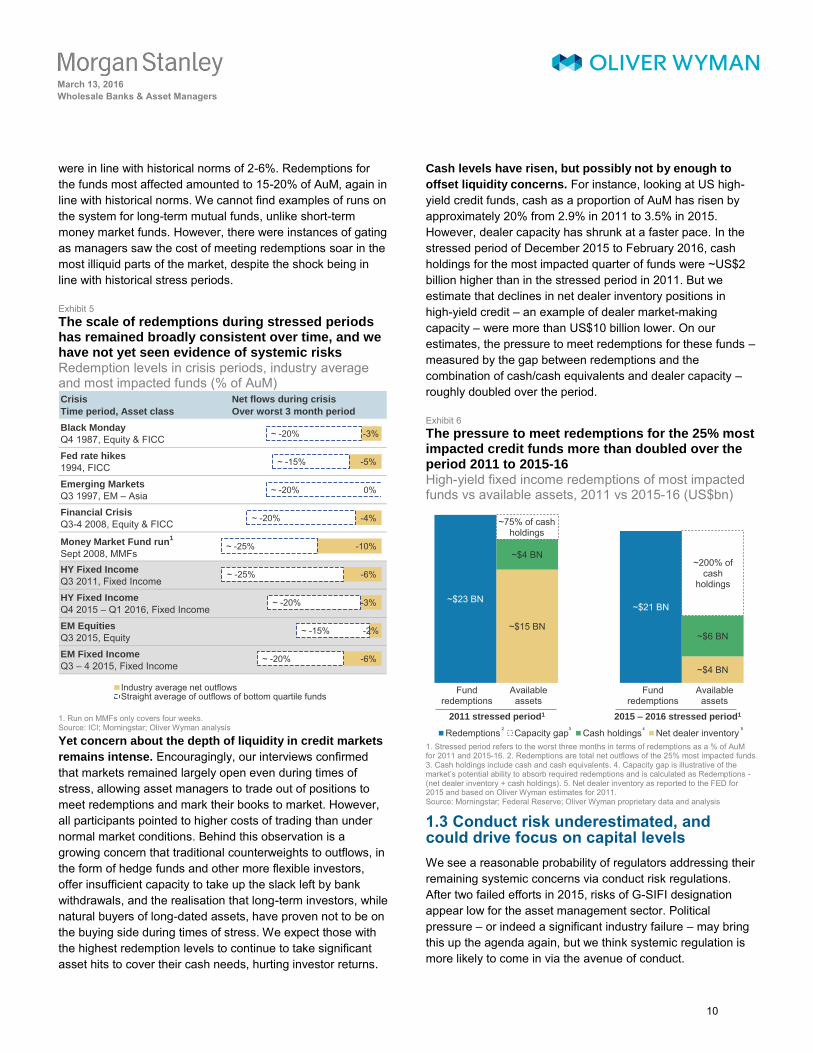
M O R G A N S T A N L E Y B L U E P A P E R were in line with historical norms of 2-6%. Redemptions for the funds most affected amounted to 15-20% of AuM, again in line with historical norms. We cannot find examples of runs on the system for long-term mutual funds, unlike short-term money market funds. However, there were instances of gating as managers saw the cost of meeting redemptions soar in the most illiquid parts of the market, despite the shock being in line with historical stress periods.
Exhibit 5 The scale of redemptions during stressed periods has remained broadly consistent over time, and we have not yet seen evidence of systemic risks Redemption levels in crisis periods, industry average and most impacted funds (% of AuM)
1. Run on MMFs only covers four weeks.Source: ICI; Morningstar; Oliver Wyman analysis
Yet concern about the depth of liquidity in credit markets
remains intense. Encouragingly, our interviews confirmed that markets remained largely open even during times of stress, allowing asset managers to trade out of positions to meet redemptions and mark their books to market. However, all participants pointed to higher costs of trading than under normal market conditions. Behind this observation is a growing concern that traditional counterweights to outflows, in the form of hedge funds and other more flexible investors, offer insufficient capacity to take up the slack left by bank withdrawals, and the realisation that long-term investors, while natural buyers of long-dated assets, have proven not to be on the buying side during times of stress. We expect those with the highest redemption levels to continue to take significant asset hits to cover their cash needs, hurting investor returns.
Cash levels have risen, but possibly not by enough to
offset liquidity concerns. For instance, looking at US high-yield credit funds, cash as a proportion of AuM has risen by approximately 20% from 2.9% in 2011 to 3.5% in 2015. However, dealer capacity has shrunk at a faster pace. In the stressed period of December 2015 to February 2016, cash holdings for the most impacted quarter of funds were ~US$2 billion higher than in the stressed period in 2011. But we estimate that declines in net dealer inventory positions in high-yield credit – an example of dealer market-making capacity – were more than US$10 billion lower. On our estimates, the pressure to meet redemptions for these funds – measured by the gap between redemptions and the combination of cash/cash equivalents and dealer capacity – roughly doubled over the period.
Exhibit 6 The pressure to meet redemptions for the 25% most impacted credit funds more than doubled over the period 2011 to 2015-16 High-yield fixed income redemptions of most impacted funds vs available assets, 2011 vs 2015-16 (US$bn)
1. Stressed period refers to the worst three months in terms of redemptions as a % of AuM for 2011 and 2015-16. 2. Redemptions are total net outflows of the 25% most impacted funds. 3. Cash holdings include cash and cash equivalents. 4. Capacity gap is illustrative of themarket’s potential ability to absorb required redemptions and is calculated as Redemptions - (net dealer inventory + cash holdings). 5. Net dealer inventory as reported to the FED for 2015 and based on Oliver Wyman estimates for 2011. Source: Morningstar; Federal Reserve; Oliver Wyman proprietary data and analysis
1.3 Conduct risk underestimated, and could drive focus on capital levels
We see a reasonable probability of regulators addressing their remaining systemic concerns via conduct risk regulations. After two failed efforts in 2015, risks of G-SIFI designation appear low for the asset management sector. Political pressure – or indeed a significant industry failure – may bring this up the agenda again, but we think systemic regulation is more likely to come in via the avenue of conduct.
Crisis
Time period, Asset class
Net flows during crisis
Over worst 3 month period
Black Monday
Q4 1987, Equity & FICC
Fed rate hikes
1994, FICC
Emerging Markets
Q3 1997, EM – Asia
Financial Crisis
Q3-4 2008, Equity & FICC
Money Market Fund run1
Sept 2008, MMFsHY Fixed Income
Q3 2011, Fixed Income
HY Fixed Income
Q4 2015 – Q1 2016, Fixed Income
EM Equities
Q3 2015, Equity
EM Fixed Income
Q3 – 4 2015, Fixed Income
-3%
-5%
0%
-4%
-10%
-6%
-3%
-2%
-6%
~ -20%
~ -15%
~ -20%
~ -20%
~ -25%
~ -25%
~ -20%
~ -15%
~ -20%
Industry average net outflowsStraight average of outflows of bottom quartile funds
~$15 BN
~$4 BN
~$4 BN
~$6 BN
~$23 BN~$21 BN
Redemptions Capacity gap Cash holdings Net dealer inventory
2011 stressed period1
2 43 5
2015 – 2016 stressed period1
~75% of cash holdings
~200% ofcash
holdings
Fundredemptions
Available assets
Fundredemptions
Available assets
10
March 13, 2016
Wholesale Banks & Asset Managers
M O R G A N S T A N L E Y B L U E P A P E R The historical ‘conduct’ view focused on process and system
failures. While fines in this space have been increasing, to date, the overall amounts have been fairly limited. What concerns us is the potential conduct spill-over from prudential regulation. Asset managers are already moving towards explicit categorisation of assets according to their liquidity, prompted in part by regulatory pressures. The problem is that challenging liquidity conditions could lead to compounded investor losses as funds are withdrawn. This, in turn, could raise questions over whether the liquidity categorisation of assets was appropriate and, more broadly, whether investors were fully aware of the liquidity or implied valuation risks of the products.
Regulators may also look more closely at how asset
managers behave in capital markets, as we have seen for
the banks. For example, this could include a view on how significant flows are handled, or how they interact with major counterparties.
At the same time, we see the conduct debate now shifting
towards ‘value for money’ and particularly rising scrutiny
of closet trackers. Evidence from the ESMA’s recent
publication shows that, in response to subdued returns and reflecting the fiduciary responsibility of the industry, regulators are increasingly focused on this issue. Yet there remain significant challenges in properly defining what closet tracking means (most definitions tend to look at a fund’s tracking error – that is, the difference between the return an investorreceives and that of the benchmark normally defined as a standard deviation, among other metrics). Indeed, mimicking the index for a certain period may well be the best outcome for investors, depending on the market environment.
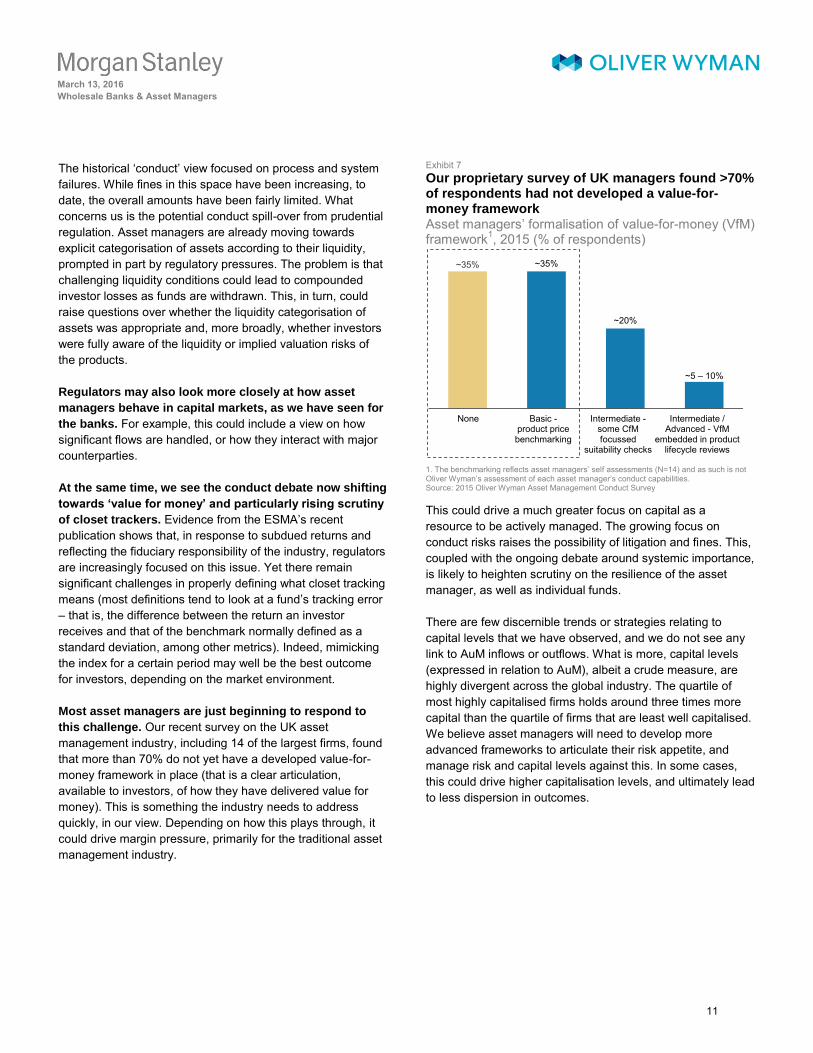
Most asset managers are just beginning to respond to
this challenge. Our recent survey on the UK asset management industry, including 14 of the largest firms, found that more than 70% do not yet have a developed value-for-money framework in place (that is a clear articulation, available to investors, of how they have delivered value for money). This is something the industry needs to address quickly, in our view. Depending on how this plays through, it could drive margin pressure, primarily for the traditional asset management industry.
Exhibit 7 Our proprietary survey of UK managers found >70% of respondents had not developed a value-for-money framework Asset managers’ formalisation of value-for-money (VfM) framework1, 2015 (% of respondents)
1. The benchmarking reflects asset managers’ self assessments (N=14) and as such is not Oliver Wyman’s assessment of each asset manager’s conduct capabilities. Source: 2015 Oliver Wyman Asset Management Conduct Survey
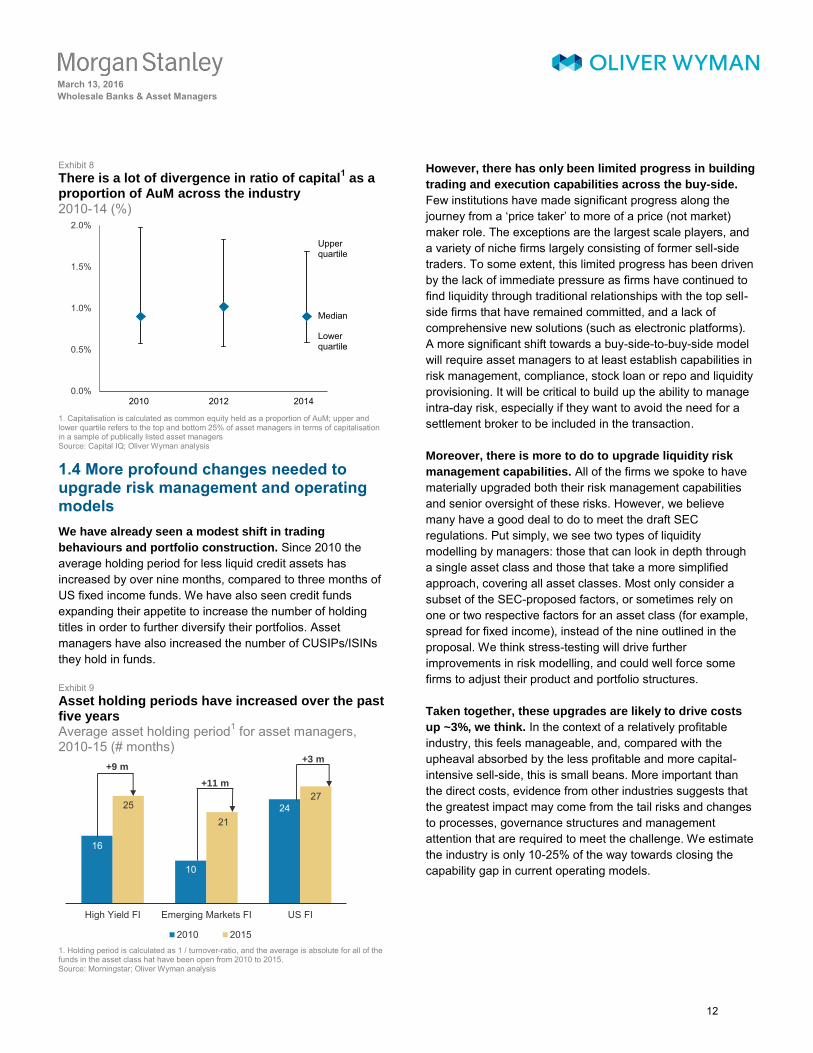
This could drive a much greater focus on capital as a resource to be actively managed. The growing focus on conduct risks raises the possibility of litigation and fines. This, coupled with the ongoing debate around systemic importance, is likely to heighten scrutiny on the resilience of the asset manager, as well as individual funds.
There are few discernible trends or strategies relating to capital levels that we have observed, and we do not see any link to AuM inflows or outflows. What is more, capital levels (expressed in relation to AuM), albeit a crude measure, are highly divergent across the global industry. The quartile of most highly capitalised firms holds around three times more capital than the quartile of firms that are least well capitalised. We believe asset managers will need to develop more advanced frameworks to articulate their risk appetite, and manage risk and capital levels against this. In some cases, this could drive higher capitalisation levels, and ultimately lead to less dispersion in outcomes.
~35% ~35%
~20%
~5 – 10%
Intermediate / Advanced - VfM
embedded in product lifecycle reviews
Intermediate -some CfM focussed
suitability checks
Basic -product price benchmarking
None
11
March 13, 2016
Wholesale Banks & Asset Managers
M O R G A N S T A N L E Y B L U E P A P E R Exhibit 8 There is a lot of divergence in ratio of capital
1 as a
proportion of AuM across the industry 2010-14 (%)
1. Capitalisation is calculated as common equity held as a proportion of AuM; upper andlower quartile refers to the top and bottom 25% of asset managers in terms of capitalisation in a sample of publically listed asset managers Source: Capital IQ; Oliver Wyman analysis
1.4 More profound changes needed to upgrade risk management and operating models
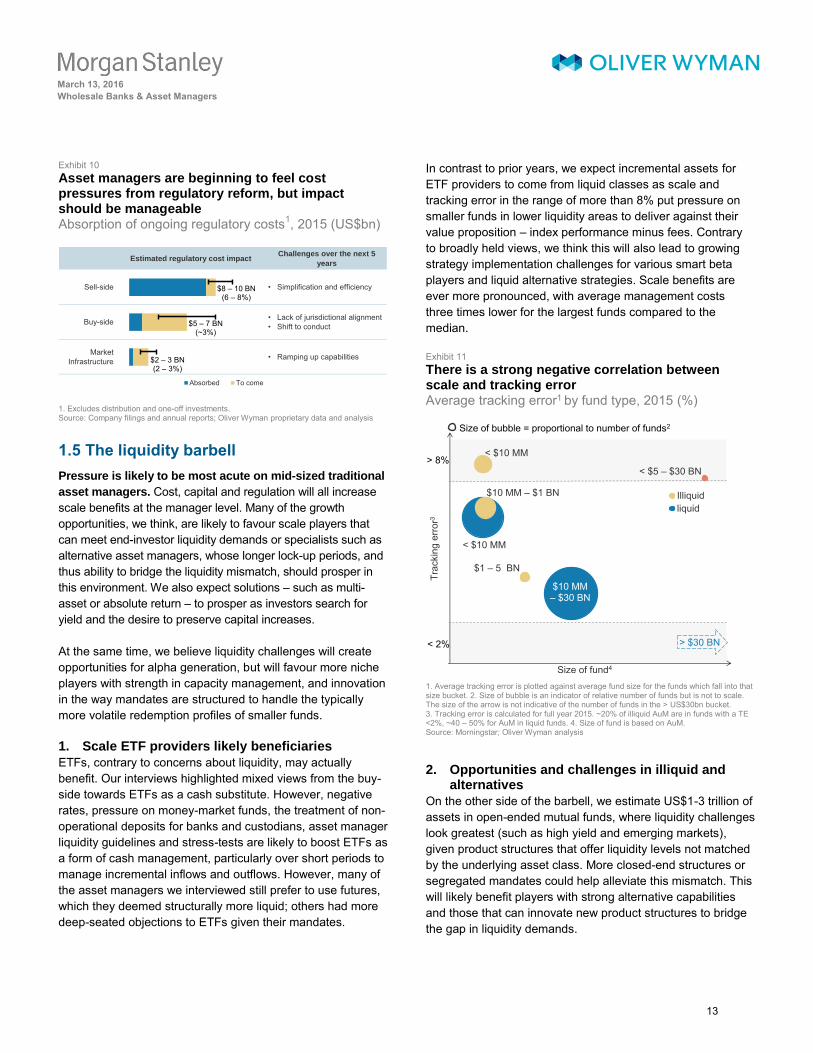
We have already seen a modest shift in trading
behaviours and portfolio construction. Since 2010 the average holding period for less liquid credit assets has increased by over nine months, compared to three months of US fixed income funds. We have also seen credit funds expanding their appetite to increase the number of holding titles in order to further diversify their portfolios. Asset managers have also increased the number of CUSIPs/ISINs they hold in funds.
Exhibit 9 Asset holding periods have increased over the past five yearsAverage asset holding period1 for asset managers, 2010-15 (# months)
1. Holding period is calculated as 1 / turnover-ratio, and the average is absolute for all of the funds in the asset class hat have been open from 2010 to 2015. Source: Morningstar; Oliver Wyman analysis
However, there has only been limited progress in building
trading and execution capabilities across the buy-side.
Few institutions have made significant progress along the journey from a ‘price taker’ to more of a price (not market)
maker role. The exceptions are the largest scale players, and a variety of niche firms largely consisting of former sell-side traders. To some extent, this limited progress has been driven by the lack of immediate pressure as firms have continued to find liquidity through traditional relationships with the top sell-side firms that have remained committed, and a lack of comprehensive new solutions (such as electronic platforms). A more significant shift towards a buy-side-to-buy-side model will require asset managers to at least establish capabilities in risk management, compliance, stock loan or repo and liquidity provisioning. It will be critical to build up the ability to manage intra-day risk, especially if they want to avoid the need for a settlement broker to be included in the transaction.
Moreover, there is more to do to upgrade liquidity risk
management capabilities. All of the firms we spoke to have materially upgraded both their risk management capabilities and senior oversight of these risks. However, we believe many have a good deal to do to meet the draft SEC regulations. Put simply, we see two types of liquidity modelling by managers: those that can look in depth through a single asset class and those that take a more simplified approach, covering all asset classes. Most only consider a subset of the SEC-proposed factors, or sometimes rely on one or two respective factors for an asset class (for example, spread for fixed income), instead of the nine outlined in the proposal. We think stress-testing will drive further improvements in risk modelling, and could well force some firms to adjust their product and portfolio structures.
Taken together, these upgrades are likely to drive costs
up ~3%, we think. In the context of a relatively profitable industry, this feels manageable, and, compared with the upheaval absorbed by the less profitable and more capital-intensive sell-side, this is small beans. More important than the direct costs, evidence from other industries suggests that the greatest impact may come from the tail risks and changes to processes, governance structures and management attention that are required to meet the challenge. We estimate the industry is only 10-25% of the way towards closing the capability gap in current operating models.
0.0%
0.5%
1.0%
1.5%
2.0%
2010 2012 2014
Upperquartile
Median
Lowerquartile
16
10
2425
21
27
High Yield FI Emerging Markets FI US FI
2010 2015
+9 m
+11 m
+3 m
12
March 13, 2016
Wholesale Banks & Asset Managers
M O R G A N S T A N L E Y B L U E P A P E R Exhibit 10 Asset managers are beginning to feel cost pressures from regulatory reform, but impact should be manageable Absorption of ongoing regulatory costs1, 2015 (US$bn)
1. Excludes distribution and one-off investments.Source: Company filings and annual reports; Oliver Wyman proprietary data and analysis
1.5 The liquidity barbell
Pressure is likely to be most acute on mid-sized traditional
asset managers. Cost, capital and regulation will all increase scale benefits at the manager level. Many of the growth opportunities, we think, are likely to favour scale players that can meet end-investor liquidity demands or specialists such as alternative asset managers, whose longer lock-up periods, and thus ability to bridge the liquidity mismatch, should prosper in this environment. We also expect solutions – such as multi-asset or absolute return – to prosper as investors search for yield and the desire to preserve capital increases.
At the same time, we believe liquidity challenges will create opportunities for alpha generation, but will favour more niche players with strength in capacity management, and innovation in the way mandates are structured to handle the typically more volatile redemption profiles of smaller funds.
1. Scale ETF providers likely beneficiaries
ETFs, contrary to concerns about liquidity, may actually benefit. Our interviews highlighted mixed views from the buy-side towards ETFs as a cash substitute. However, negative rates, pressure on money-market funds, the treatment of non-operational deposits for banks and custodians, asset manager liquidity guidelines and stress-tests are likely to boost ETFs as a form of cash management, particularly over short periods to manage incremental inflows and outflows. However, many of the asset managers we interviewed still prefer to use futures, which they deemed structurally more liquid; others had more deep-seated objections to ETFs given their mandates.
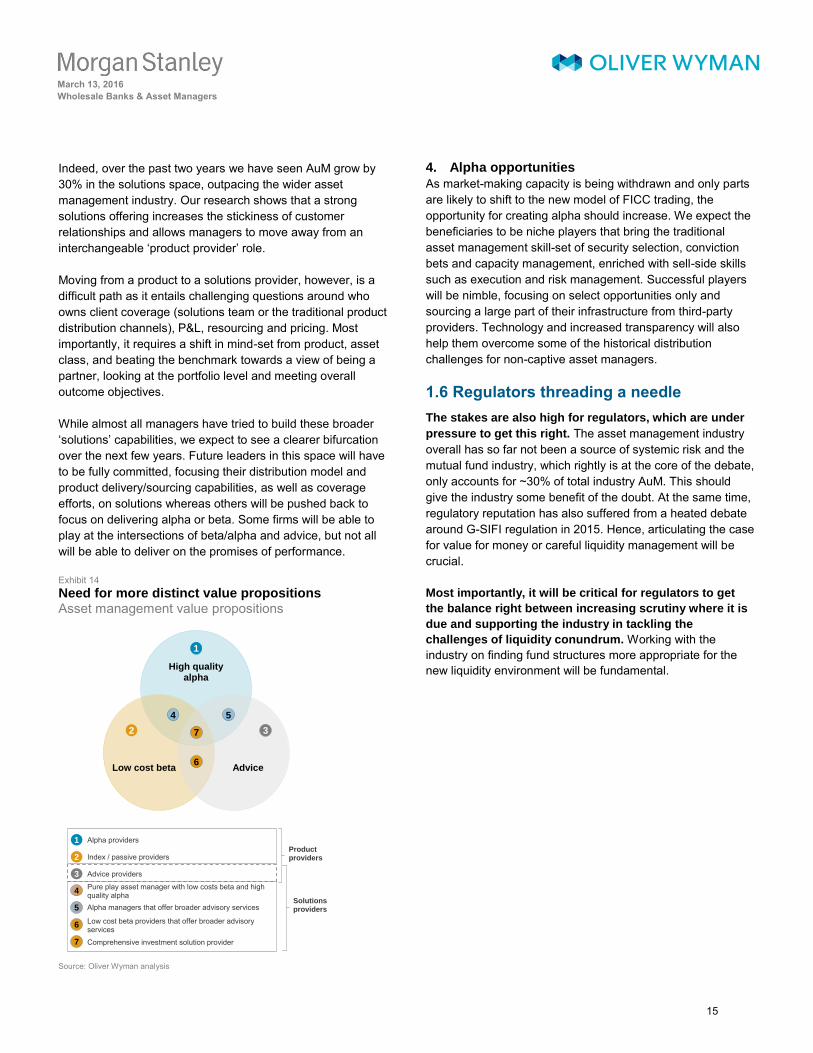
In contrast to prior years, we expect incremental assets for ETF providers to come from liquid classes as scale and tracking error in the range of more than 8% put pressure on smaller funds in lower liquidity areas to deliver against their value proposition – index performance minus fees. Contrary to broadly held views, we think this will also lead to growing strategy implementation challenges for various smart beta players and liquid alternative strategies. Scale benefits are ever more pronounced, with average management costs three times lower for the largest funds compared to the median.
Exhibit 11 There is a strong negative correlation between scale and tracking error Average tracking error1 by fund type, 2015 (%)
1. Average tracking error is plotted against average fund size for the funds which fall into that size bucket. 2. Size of bubble is an indicator of relative number of funds but is not to scale. The size of the arrow is not indicative of the number of funds in the > US$30bn bucket. 3. Tracking error is calculated for full year 2015. ~20% of illiquid AuM are in funds with a TE <2%, ~40 – 50% for AuM in liquid funds. 4. Size of fund is based on AuM. Source: Morningstar; Oliver Wyman analysis
2. Opportunities and challenges in illiquid andalternatives
On the other side of the barbell, we estimate US$1-3 trillion of assets in open-ended mutual funds, where liquidity challenges look greatest (such as high yield and emerging markets), given product structures that offer liquidity levels not matched by the underlying asset class. More closed-end structures or segregated mandates could help alleviate this mismatch. This will likely benefit players with strong alternative capabilities and those that can innovate new product structures to bridge the gap in liquidity demands.
Estimated regulatory cost impactChallenges over the next 5
years
Sell-side • Simplification and efficiency
Buy-side • Lack of jurisdictional alignment
• Shift to conduct
Market Infrastructure • Ramping up capabilities
Absorbed To come
$2 – 3 BN(2 – 3%)
$5 – 7 BN(~3%)
$8 – 10 BN(6 – 8%)
Illiquidliquid
> $30 BN
Size of bubble = proportional to number of funds2
< $5 – $30 BN
< $10 MM
$10 MM – $1 BN
< $10 MM
$1 – 5 BN
$10 MM – $30 BN
< 2%
> 8%
Trac
king
erro
r3
Size of fund4
13
March 13, 2016
Wholesale Banks & Asset Managers
M O R G A N S T A N L E Y B L U E P A P E R Exhibit 12 A relatively small portion of industry assets are housed in product structures that may not be matched by underlying assets Mismatch between redemption liquidity profile of AuM, 2015 (US$trn)
Source: Morningstar, Oliver Wyman proprietary data and analysis
We also see a growing set of opportunities to fill the void left by the sell-side. These include loan funds, derivative origination vehicles and flow market-making ventures. Tackling these opportunities will require specialist capabilities, typically with strong scale economies driven by fixed costs of origination platforms and/or technology platforms.
A case in point is loan vehicles: there are a number of gaps in the value chain that need to be filled before asset managers can truly gain traction. Banks retain an inherent advantage when it comes to risk modelling, client capture and cross-selling that will be hard for asset managers to replicate on a standalone basis. This structure suggests benefits are likely to accrue to the largest firms that can build out in house capabilities, and those funds that can go into partnerships with banks.
Exhibit 13 Asset managers are suited to step into parts of the value chain for less liquid assets, but there remain a number of capability gaps Difference between fund management and loan generation value chains
Source: Oliver Wyman analysis
3. Decision time for solutions
A heated battle is developing across the industry to establish solutions businesses. In a zero-yield environment with ever more challenging liquidity risk and growing regulatory scrutiny, asset managers will increasingly have to prove that they are delivering ‘value’. In light of this, multi-asset products have thrived and we expect them to continue doing so. At the same time, many managers have looked to build more comprehensive solutions capabilities with a focus on holistic advisory and not solely on product provision.
Less liquid More liquid
Daily ~$1 – 3 TN ~$35 TN
Non-daily
Asset liquidity profile
Inv
es
tor
red
em
pti
on
pro
file
~$40 – 45 TN
Medium proximity to existing AM capabilitiesKey: High proximity to existing AM capabilities
Low proximity to existing AM capabilities
Approval
Client Capture
Balance sheetprovision
Management
Recovery
Execution
Investmentmanagement
Collateral mgmt.
Clearing
Post-trade
Custody
Fundmanagement value chain
Loan generationvalue chain
Fund admin
14
March 13, 2016
Wholesale Banks & Asset Managers
M O R G A N S T A N L E Y B L U E P A P E R Indeed, over the past two years we have seen AuM grow by 30% in the solutions space, outpacing the wider asset management industry. Our research shows that a strong solutions offering increases the stickiness of customer relationships and allows managers to move away from an interchangeable ‘product provider’ role.
Moving from a product to a solutions provider, however, is a difficult path as it entails challenging questions around who owns client coverage (solutions team or the traditional product distribution channels), P&L, resourcing and pricing. Most importantly, it requires a shift in mind-set from product, asset class, and beating the benchmark towards a view of being a partner, looking at the portfolio level and meeting overall outcome objectives.
While almost all managers have tried to build these broader ‘solutions’ capabilities, we expect to see a clearer bifurcation
over the next few years. Future leaders in this space will have to be fully committed, focusing their distribution model and product delivery/sourcing capabilities, as well as coverage efforts, on solutions whereas others will be pushed back to focus on delivering alpha or beta. Some firms will be able to play at the intersections of beta/alpha and advice, but not all will be able to deliver on the promises of performance.
Exhibit 14 Need for more distinct value propositions Asset management value propositions
Source: Oliver Wyman analysis
4. Alpha opportunities
As market-making capacity is being withdrawn and only parts are likely to shift to the new model of FICC trading, the opportunity for creating alpha should increase. We expect the beneficiaries to be niche players that bring the traditional asset management skill-set of security selection, conviction bets and capacity management, enriched with sell-side skills such as execution and risk management. Successful players will be nimble, focusing on select opportunities only and sourcing a large part of their infrastructure from third-party providers. Technology and increased transparency will also help them overcome some of the historical distribution challenges for non-captive asset managers.
1.6 Regulators threading a needle
The stakes are also high for regulators, which are under
pressure to get this right. The asset management industry overall has so far not been a source of systemic risk and the mutual fund industry, which rightly is at the core of the debate, only accounts for ~30% of total industry AuM. This should give the industry some benefit of the doubt. At the same time, regulatory reputation has also suffered from a heated debate around G-SIFI regulation in 2015. Hence, articulating the case for value for money or careful liquidity management will be crucial.
Most importantly, it will be critical for regulators to get
the balance right between increasing scrutiny where it is
due and supporting the industry in tackling the
challenges of liquidity conundrum. Working with the industry on finding fund structures more appropriate for the new liquidity environment will be fundamental.High quality
alpha
Low cost beta
1
2 3
4 5
6
7
Advice
Index / passive providers
1 Alpha providers
2
Advice providers3
Alpha managers that offer broader advisory services
Low cost beta providers that offer broader advisory services 6
4
5
Pure play asset manager with low costs beta and high quality alpha
7 Comprehensive investment solution provider
Product providers
Solutions providers
15
March 13, 2016
Wholesale Banks & Asset Managers
M O R G A N S T A N L E Y B L U E P A P E R 2. Learning to Live with Less in Banks
Changing buy-side behaviour, along with waning revenues and the tail
end of regulatory drag, set a challenging threshold for banks. We do
not see the industry achieving its cost of capital through the cycle
without another round of heavy pruning equivalent in size to what has
been accomplished over the last five years – and an overhaul of the
operating model. Business models will continue to diverge as banks
are pushed to make sharper choices on where they look to drive scale.
2.1 Heavy pruning necessary to improve returns
Ultra-low rates, new regulation and thin liquidity have
structurally reduced the client revenue opportunity for
wholesale banks, and the industry is still grappling with
this adjustment.
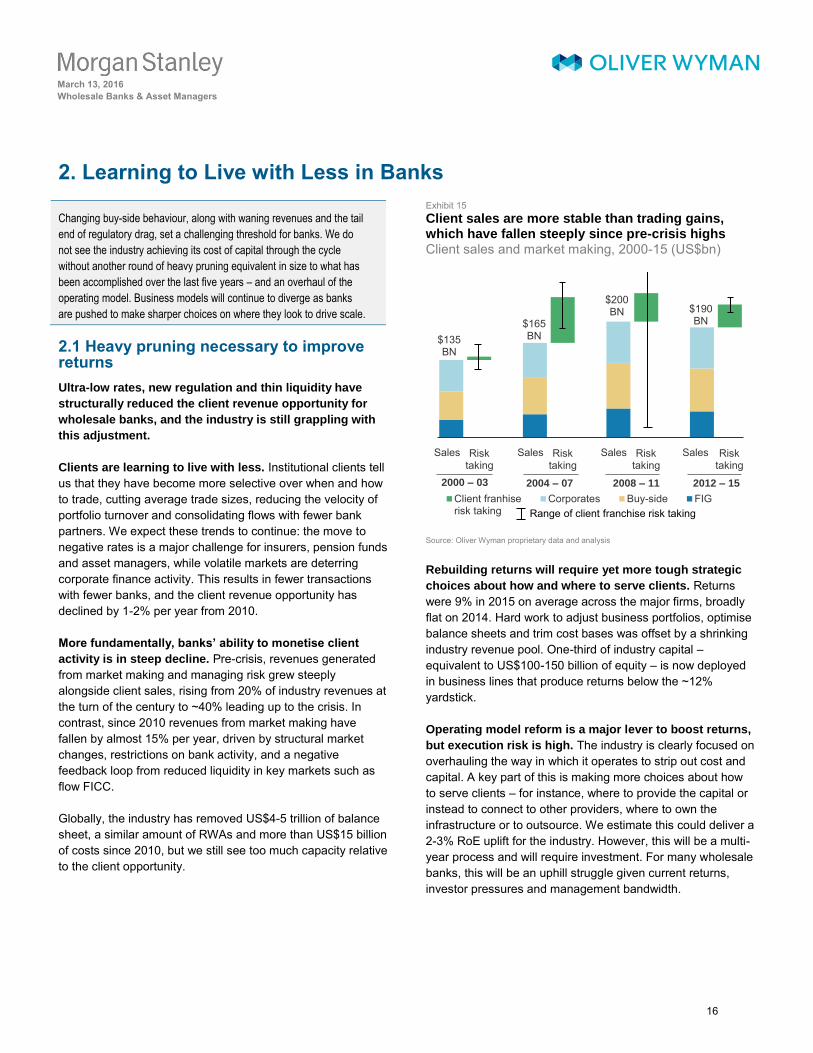
Clients are learning to live with less. Institutional clients tell us that they have become more selective over when and how to trade, cutting average trade sizes, reducing the velocity of portfolio turnover and consolidating flows with fewer bank partners. We expect these trends to continue: the move to negative rates is a major challenge for insurers, pension funds and asset managers, while volatile markets are deterring corporate finance activity. This results in fewer transactions with fewer banks, and the client revenue opportunity has declined by 1-2% per year from 2010.
More fundamentally, banks’ ability to monetise client
activity is in steep decline. Pre-crisis, revenues generated from market making and managing risk grew steeply alongside client sales, rising from 20% of industry revenues at the turn of the century to ~40% leading up to the crisis. In contrast, since 2010 revenues from market making have fallen by almost 15% per year, driven by structural market changes, restrictions on bank activity, and a negative feedback loop from reduced liquidity in key markets such as flow FICC.
Globally, the industry has removed US$4-5 trillion of balance sheet, a similar amount of RWAs and more than US$15 billion of costs since 2010, but we still see too much capacity relative to the client opportunity.
Exhibit 15 Client sales are more stable than trading gains, which have fallen steeply since pre-crisis highs Client sales and market making, 2000-15 (US$bn)
Source: Oliver Wyman proprietary data and analysis
Rebuilding returns will require yet more tough strategic
choices about how and where to serve clients. Returns were 9% in 2015 on average across the major firms, broadly flat on 2014. Hard work to adjust business portfolios, optimise balance sheets and trim cost bases was offset by a shrinking industry revenue pool. One-third of industry capital – equivalent to US$100-150 billion of equity – is now deployed in business lines that produce returns below the ~12% yardstick.
Operating model reform is a major lever to boost returns,
but execution risk is high. The industry is clearly focused on overhauling the way in which it operates to strip out cost and capital. A key part of this is making more choices about how to serve clients – for instance, where to provide the capital or instead to connect to other providers, where to own the infrastructure or to outsource. We estimate this could deliver a 2-3% RoE uplift for the industry. However, this will be a multi-year process and will require investment. For many wholesale banks, this will be an uphill struggle given current returns, investor pressures and management bandwidth.
Client franhiserisk taking
Corporates Buy-side FIG2000 – 03 2004 – 07 2008 – 11 2012 – 15
$135BN
$165BN
$200BN $190
BN
Range of client franchise risk taking
Risktaking
Sales Risk taking
Sales Risk taking
Sales Risk taking
Sales
16
March 13, 2016
Wholesale Banks & Asset Managers
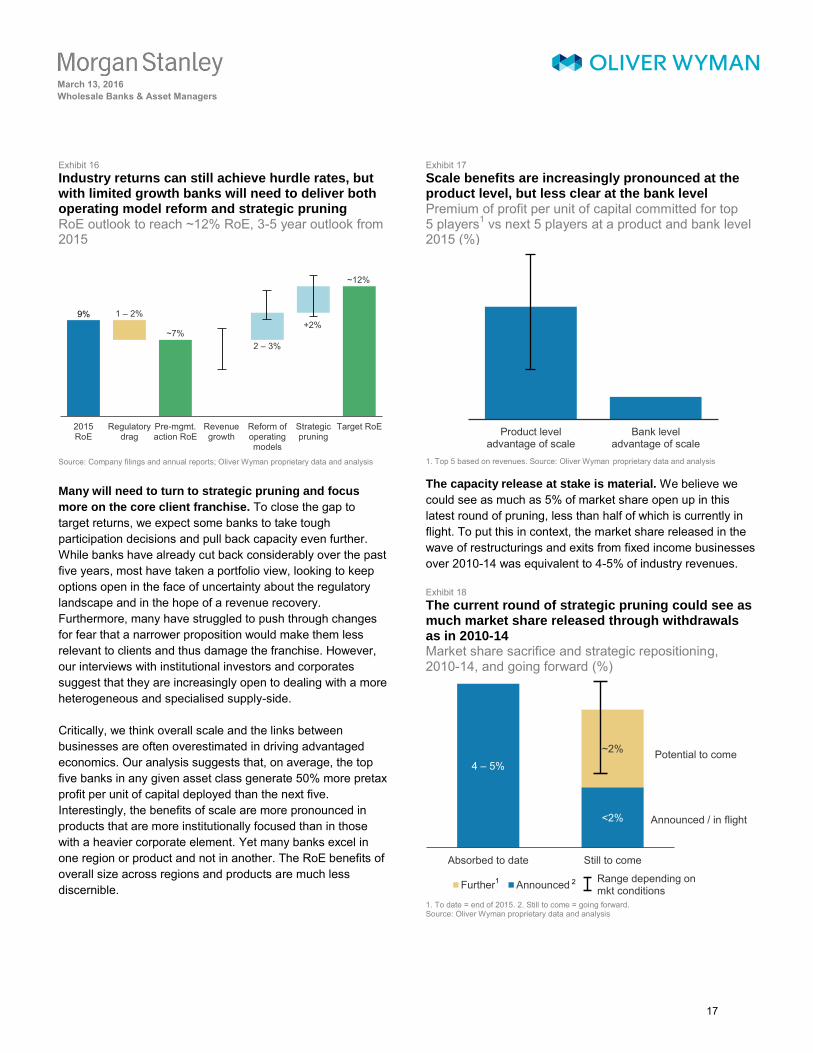
M O R G A N S T A N L E Y B L U E P A P E R Exhibit 16 Industry returns can still achieve hurdle rates, but with limited growth banks will need to deliver both operating model reform and strategic pruning RoE outlook to reach ~12% RoE, 3-5 year outlook from 2015
Source: Company filings and annual reports; Oliver Wyman proprietary data and analysis
Many will need to turn to strategic pruning and focus
more on the core client franchise. To close the gap to target returns, we expect some banks to take tough participation decisions and pull back capacity even further. While banks have already cut back considerably over the past five years, most have taken a portfolio view, looking to keep options open in the face of uncertainty about the regulatory landscape and in the hope of a revenue recovery. Furthermore, many have struggled to push through changes for fear that a narrower proposition would make them less relevant to clients and thus damage the franchise. However, our interviews with institutional investors and corporates suggest that they are increasingly open to dealing with a more heterogeneous and specialised supply-side.
Critically, we think overall scale and the links between businesses are often overestimated in driving advantaged economics. Our analysis suggests that, on average, the top five banks in any given asset class generate 50% more pretax profit per unit of capital deployed than the next five. Interestingly, the benefits of scale are more pronounced in products that are more institutionally focused than in those with a heavier corporate element. Yet many banks excel in one region or product and not in another. The RoE benefits of overall size across regions and products are much less discernible.
Exhibit 17 Scale benefits are increasingly pronounced at the product level, but less clear at the bank level Premium of profit per unit of capital committed for top 5 players1 vs next 5 players at a product and bank level 2015 (%)
1. Top 5 based on revenues. Source: Oliver Wyman proprietary data and analysis
The capacity release at stake is material. We believe we could see as much as 5% of market share open up in this latest round of pruning, less than half of which is currently in flight. To put this in context, the market share released in the wave of restructurings and exits from fixed income businesses over 2010-14 was equivalent to 4-5% of industry revenues.
Exhibit 18 The current round of strategic pruning could see as much market share released through withdrawals as in 2010-14 Market share sacrifice and strategic repositioning, 2010-14, and going forward (%)
1. To date = end of 2015. 2. Still to come = going forward. Source: Oliver Wyman proprietary data and analysis
Target RoEStrategicpruning
Reform ofoperatingmodels
Revenuegrowth
Pre-mgmt.action RoE
Regulatorydrag
2015RoE
9% 1 – 2%
~7%2 – 3%
~12%
+2%
Product leveladvantage of scale
Bank leveladvantage of scale
4 – 5%
<2%
~2%
Absorbed to date Still to come
Further Announced Range depending on mkt conditions
Potential to come
Announced / in flight
1 2
17
March 13, 2016
Wholesale Banks & Asset Managers
M O R G A N S T A N L E Y B L U E P A P E R 2.2 Regulatory headwinds are abating – but final stages will pose further challenges
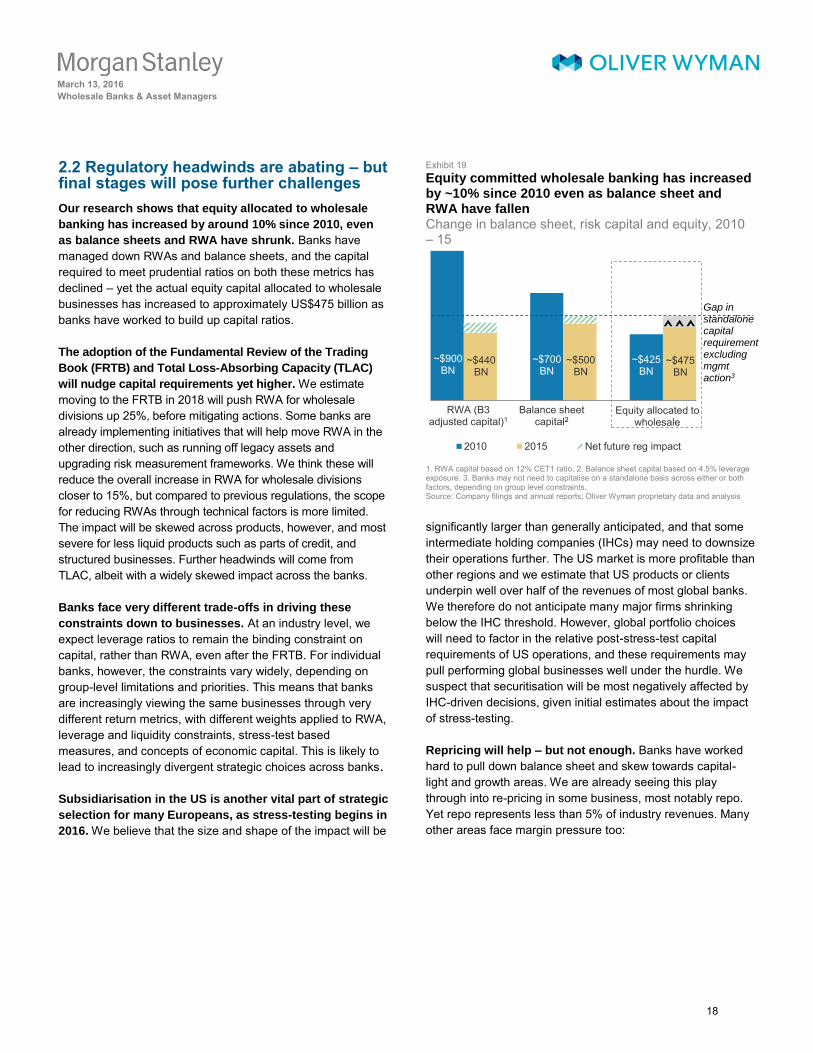
Our research shows that equity allocated to wholesale
banking has increased by around 10% since 2010, even
as balance sheets and RWA have shrunk. Banks have managed down RWAs and balance sheets, and the capital required to meet prudential ratios on both these metrics has declined – yet the actual equity capital allocated to wholesale businesses has increased to approximately US$475 billion as banks have worked to build up capital ratios.
The adoption of the Fundamental Review of the Trading
Book (FRTB) and Total Loss-Absorbing Capacity (TLAC)
will nudge capital requirements yet higher. We estimate moving to the FRTB in 2018 will push RWA for wholesale divisions up 25%, before mitigating actions. Some banks are already implementing initiatives that will help move RWA in the other direction, such as running off legacy assets and upgrading risk measurement frameworks. We think these will reduce the overall increase in RWA for wholesale divisions closer to 15%, but compared to previous regulations, the scope for reducing RWAs through technical factors is more limited. The impact will be skewed across products, however, and most severe for less liquid products such as parts of credit, and structured businesses. Further headwinds will come from TLAC, albeit with a widely skewed impact across the banks.
Banks face very different trade-offs in driving these
constraints down to businesses. At an industry level, we expect leverage ratios to remain the binding constraint on capital, rather than RWA, even after the FRTB. For individual banks, however, the constraints vary widely, depending on group-level limitations and priorities. This means that banks are increasingly viewing the same businesses through very different return metrics, with different weights applied to RWA, leverage and liquidity constraints, stress-test based measures, and concepts of economic capital. This is likely to lead to increasingly divergent strategic choices across banks.
Subsidiarisation in the US is another vital part of strategic
selection for many Europeans, as stress-testing begins in
2016. We believe that the size and shape of the impact will be
Exhibit 19 Equity committed wholesale banking has increased by ~10% since 2010 even as balance sheet and RWA have fallen Change in balance sheet, risk capital and equity, 2010 – 15
1. RWA capital based on 12% CET1 ratio. 2. Balance sheet capital based on 4.5% leverageexposure. 3. Banks may not need to capitalise on a standalone basis across either or both factors, depending on group level constraints. Source: Company filings and annual reports; Oliver Wyman proprietary data and analysis
significantly larger than generally anticipated, and that some intermediate holding companies (IHCs) may need to downsize their operations further. The US market is more profitable than other regions and we estimate that US products or clients underpin well over half of the revenues of most global banks. We therefore do not anticipate many major firms shrinking below the IHC threshold. However, global portfolio choices will need to factor in the relative post-stress-test capital requirements of US operations, and these requirements may pull performing global businesses well under the hurdle. We suspect that securitisation will be most negatively affected by IHC-driven decisions, given initial estimates about the impact of stress-testing.
Repricing will help – but not enough. Banks have worked hard to pull down balance sheet and skew towards capital-light and growth areas. We are already seeing this play through into re-pricing in some business, most notably repo. Yet repo represents less than 5% of industry revenues. Many other areas face margin pressure too:
~$900BN
~$700BN
~$425BN
~$440BN
~$500BN
~$475BN
2010 2015 Net future reg impact
RWA (B3adjusted capital)1
Balance sheetcapital2
Equity allocated towholesale
Gap instandalonecapital requirement excludingmgmt action3
18
March 13, 2016
Wholesale Banks & Asset Managers
M O R G A N S T A N L E Y B L U E P A P E R In banking, fierce competition is putting pressure on fee
structures and mandates are being split ever more finely.
In prime services, while there has been much discussionof rationing sheet and re-pricing, we have seen a netincrease in balance sheet committed over the last fiveyears as banks have chased a growing revenueopportunity.
Listed and cleared products struggle with re-pricing fixedfee structures, or face downward margin pressure fromnew transparency requirements. Bid/offer spreads in flowfixed income are closely linked to volatility, and thecombination of macro uncertainty and reduced liquidityprovision is likely to drive spreads wider.
In structured products, we expect further re-pricing ofcapital as rising costs of capital are passed on, andwhere the supply-side has already thinned considerably.
Yet we remain concerned that banks will move together towards the more attractive areas and that, absent much more substantive strategic capacity withdrawal, the net impact of re-pricing and margin compression will be limited.
Exhibit 20 Repricing will only provide limited uplift for the industry Balance sheet reductions and repricing, 2010-15 (US$bn and % change)
Source: Oliver Wyman proprietary data and analysis
2.3 Rethinking the operating model is where longer-term competitive advantage will lie
Success will increasingly depend on the ability to drive
change through the operating model. As the industry emerges from eight years of crisis and regulatory upheaval, the challenge now is to overhaul the way in which business is
done. The proliferation of fin-tech firms and providers offering to take services out of the banks means that banks can become more selective about where they compete across the value chain and how they choose to serve their clients. But this fluidity of the competitive landscape also paves the way for fierce competition with non-banks, and a shift away from many of the traditional drivers of scale advantage.
We see change in the operating model across three layers:
Product provision – most notably in fixed income, wherebanks are looking to find ways to support a more capital-light model. However, the risks are also greatest here ofnon-banks capturing an ever larger slice of the market ascapital and data networks become unbundled.
Back office – where there is a huge opportunity to reducecosts in infrastructure layers, in part leveraging externalsupply chains.
Customer platforms – where banks are seeking to usedata and technology to drive efficiencies in sales andcoverage layers, but again face risks from new platformscoming between them and customers and from theemergence of buy-side-to-buy-side solutions.
Exhibit 21 Operating models will change across three levels Impact of modular financial services value chain
Source: Oliver Wyman analysis
These changes could undermine the traditional drivers of
scale advantage over time. As some data and processing activities traditionally managed in-house are increasingly taken on by external suppliers, the advantages of size in supporting a high fixed cost base will be reduced. Shifts in client buying behaviour to be more platform-based and atomised could reduce the value of large coverage/distribution teams. Moreover, innovations in product provision could open the door to participating more cheaply in some activities, undermining balance sheet and capital advantages.
ProductRevenues
($BN)
Change in balance sheet
2010 – 15 (%)
Expected future
evolution (%)
Repo $10 BN down ~50% down ~10%
Prime $15 BN up ~20% flat
Bonds, FX & commodities $40 BN down ~25% down ~10%
Structured & securitised $50 BN down ~20% down ~10%
Listed, flow & cleared products $55 BN down ~20% down ~5%
Issuance $40 BN
Advisory $20 BN
Total $225 BN -25% to -30% -5 to -10%
~ flat down ~5%
Repricing dynamics
Modest repricingSignificant repricing Margin pressure
Customers Product provision Back and middle office
Trends
• Increased adoption of multi-
dealer platforms• Raising importance of pricing
transparency• Historical "Relationship
driven" model threatened in flow
• Automation of pricing and risk
management• Shift to all to all and (quasi)
agency trading models• New uses of data and
networks to drive pricing and matching
• Increased BPO as well as ITO
• Green fielding of costly platforms
• "Robotisation" of manual
processes to cut costs
Incumbent
advantages
• Existing data sets that can be
mined to generate trade ideas• Regulation
• Importance of balance sheet,
but less so than before
• Capital and balance sheet
• Depth of books and liquidity
• Pricing / Structuring expertise
• End-to-end view of processing
chains• Operation of critical financial
infrastructure (payments, safekeeping)
• Scale (mixed) and often fully
amortised platforms
New entrants
• Data firms and aggregators
• Communication platforms
• Corporate services platforms
• Trading venues
• Data networks
• Alternative balance sheet
and capital providers
• IT specialists but also Banks'
building utilities• Robotisation / automation
specialists• Existing MI players
• Blockchain platforms
19
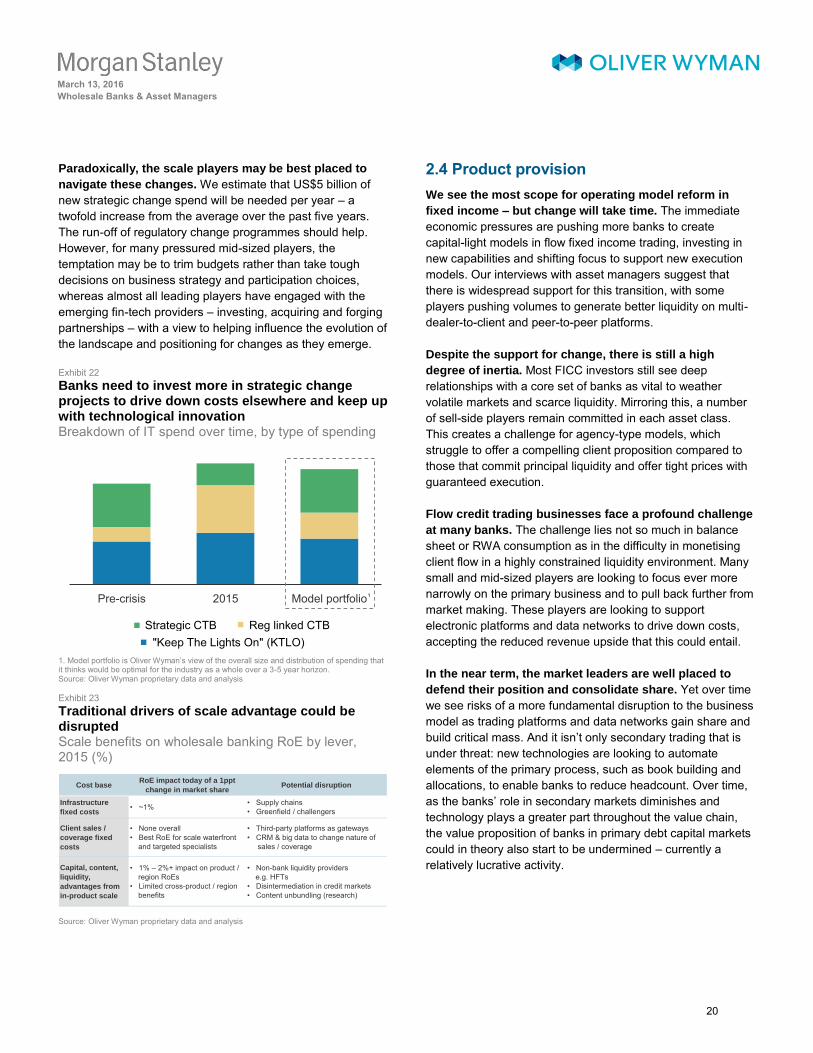
March 13, 2016
Wholesale Banks & Asset Managers
M O R G A N S T A N L E Y B L U E P A P E R Paradoxically, the scale players may be best placed to
navigate these changes. We estimate that US$5 billion of new strategic change spend will be needed per year – a twofold increase from the average over the past five years. The run-off of regulatory change programmes should help. However, for many pressured mid-sized players, the temptation may be to trim budgets rather than take tough decisions on business strategy and participation choices, whereas almost all leading players have engaged with the emerging fin-tech providers – investing, acquiring and forging partnerships – with a view to helping influence the evolution of the landscape and positioning for changes as they emerge.
Exhibit 22 Banks need to invest more in strategic change projects to drive down costs elsewhere and keep up with technological innovation Breakdown of IT spend over time, by type of spending
1. Model portfolio is Oliver Wyman’s view of the overall size and distribution of spending that it thinks would be optimal for the industry as a whole over a 3-5 year horizon. Source: Oliver Wyman proprietary data and analysis
Exhibit 23 Traditional drivers of scale advantage could be disrupted Scale benefits on wholesale banking RoE by lever, 2015 (%)
Source: Oliver Wyman proprietary data and analysis
2.4 Product provision
We see the most scope for operating model reform in
fixed income – but change will take time. The immediate economic pressures are pushing more banks to create capital-light models in flow fixed income trading, investing in new capabilities and shifting focus to support new execution models. Our interviews with asset managers suggest that there is widespread support for this transition, with some players pushing volumes to generate better liquidity on multi-dealer-to-client and peer-to-peer platforms.
Despite the support for change, there is still a high
degree of inertia. Most FICC investors still see deep relationships with a core set of banks as vital to weather volatile markets and scarce liquidity. Mirroring this, a number of sell-side players remain committed in each asset class. This creates a challenge for agency-type models, which struggle to offer a compelling client proposition compared to those that commit principal liquidity and offer tight prices with guaranteed execution.
Flow credit trading businesses face a profound challenge
at many banks. The challenge lies not so much in balance sheet or RWA consumption as in the difficulty in monetising client flow in a highly constrained liquidity environment. Many small and mid-sized players are looking to focus ever more narrowly on the primary business and to pull back further from market making. These players are looking to support electronic platforms and data networks to drive down costs, accepting the reduced revenue upside that this could entail.
In the near term, the market leaders are well placed to
defend their position and consolidate share. Yet over time we see risks of a more fundamental disruption to the business model as trading platforms and data networks gain share and build critical mass. And it isn’t only secondary trading that is
under threat: new technologies are looking to automate elements of the primary process, such as book building and allocations, to enable banks to reduce headcount. Over time, as the banks’ role in secondary markets diminishes and
technology plays a greater part throughout the value chain, the value proposition of banks in primary debt capital markets could in theory also start to be undermined – currently a relatively lucrative activity.
Pre-crisis 2015 Model portfolio1
Strategic CTB"Keep The Lights On" (KTLO)
Reg linked CTB
Cost baseRoE impact today of a 1ppt
change in market sharePotential disruption
Infrastructure
fixed costs• ~1% • Supply chains
• Greenfield / challengers
Client sales /
coverage fixed
costs
• None overall
• Best RoE for scale waterfront
and targeted specialists
• Third-party platforms as gateways• CRM & big data to change nature of
sales / coverage
Capital, content,
liquidity,
advantages from
in-product scale
• 1% – 2%+ impact on product / region RoEs
• Limited cross-product / regionbenefits
• Non-bank liquidity providers e.g. HFTs
• Disintermediation in credit markets
• Content unbundling (research)
20
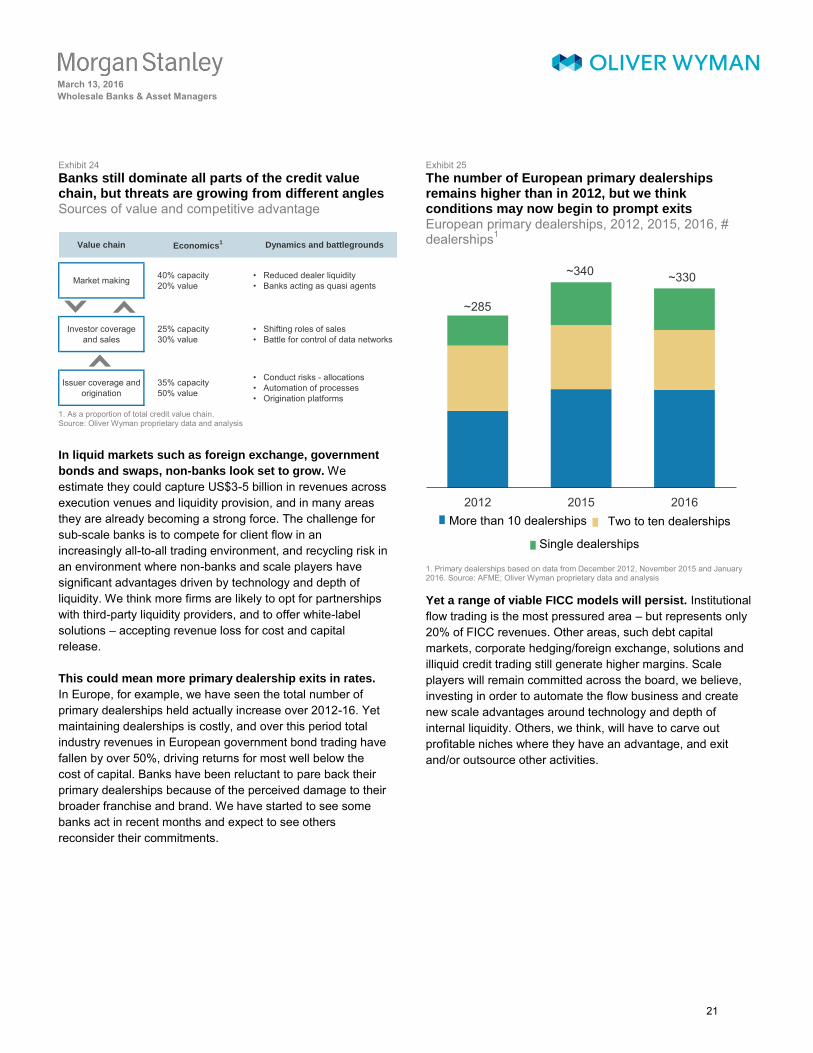
March 13, 2016
Wholesale Banks & Asset Managers
M O R G A N S T A N L E Y B L U E P A P E R Exhibit 24 Banks still dominate all parts of the credit value chain, but threats are growing from different angles Sources of value and competitive advantage
1. As a proportion of total credit value chain.Source: Oliver Wyman proprietary data and analysis
In liquid markets such as foreign exchange, government
bonds and swaps, non-banks look set to grow. We estimate they could capture US$3-5 billion in revenues across execution venues and liquidity provision, and in many areas they are already becoming a strong force. The challenge for sub-scale banks is to compete for client flow in an increasingly all-to-all trading environment, and recycling risk in an environment where non-banks and scale players have significant advantages driven by technology and depth of liquidity. We think more firms are likely to opt for partnerships with third-party liquidity providers, and to offer white-label solutions – accepting revenue loss for cost and capital release.
This could mean more primary dealership exits in rates.
In Europe, for example, we have seen the total number of primary dealerships held actually increase over 2012-16. Yet maintaining dealerships is costly, and over this period total industry revenues in European government bond trading have fallen by over 50%, driving returns for most well below the cost of capital. Banks have been reluctant to pare back their primary dealerships because of the perceived damage to their broader franchise and brand. We have started to see some banks act in recent months and expect to see others reconsider their commitments.
Exhibit 25 The number of European primary dealerships remains higher than in 2012, but we think conditions may now begin to prompt exits European primary dealerships, 2012, 2015, 2016, # dealerships1
1. Primary dealerships based on data from December 2012, November 2015 and January 2016. Source: AFME; Oliver Wyman proprietary data and analysis
Yet a range of viable FICC models will persist. Institutional flow trading is the most pressured area – but represents only 20% of FICC revenues. Other areas, such debt capital markets, corporate hedging/foreign exchange, solutions and illiquid credit trading still generate higher margins. Scale players will remain committed across the board, we believe, investing in order to automate the flow business and create new scale advantages around technology and depth of internal liquidity. Others, we think, will have to carve out profitable niches where they have an advantage, and exit and/or outsource other activities.
Value chain Economics1 Dynamics and battlegrounds
Market making 40% capacity 20% value
• Reduced dealer liquidity
• Banks acting as quasi agents
Investor coverage and sales
25% capacity 30% value
• Shifting roles of sales
• Battle for control of data networks
Issuer coverage and origination
35% capacity 50% value
• Conduct risks - allocations
• Automation of processes
• Origination platforms
2012 2015 2016
~285
~330~340
More than 10 dealerships Two to ten dealerships
Single dealerships
21
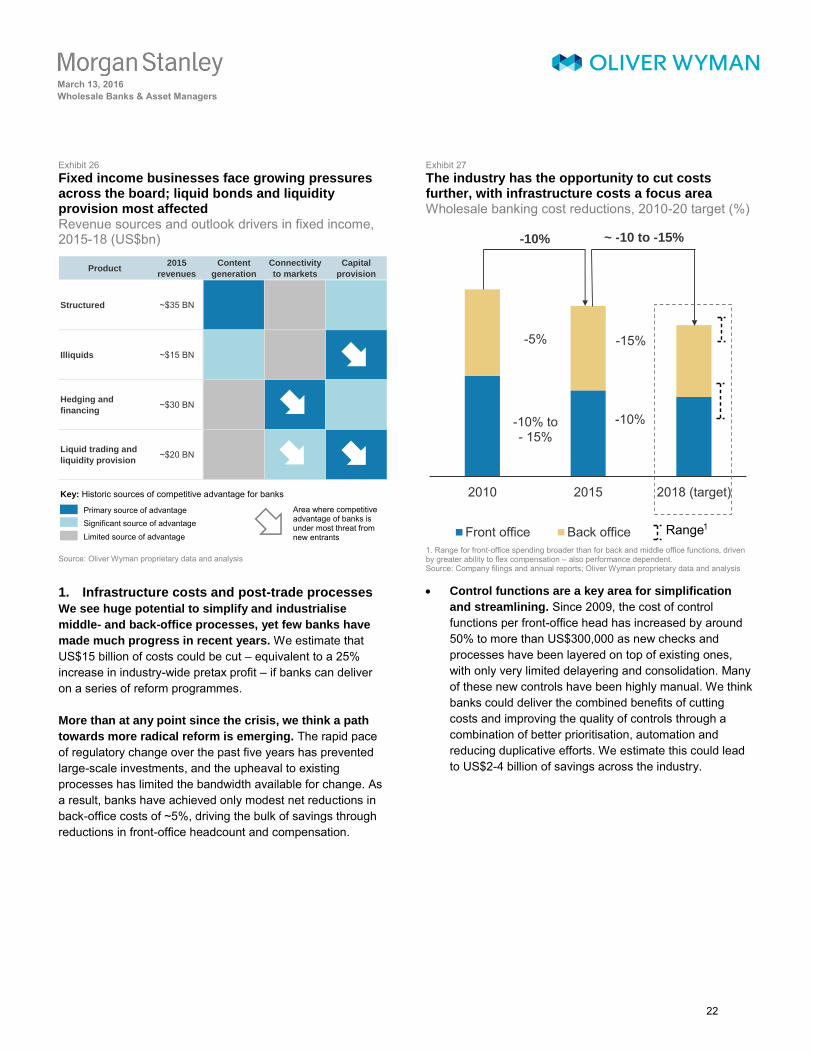
March 13, 2016
Wholesale Banks & Asset Managers
M O R G A N S T A N L E Y B L U E P A P E R Exhibit 26 Fixed income businesses face growing pressures across the board; liquid bonds and liquidity provision most affected Revenue sources and outlook drivers in fixed income, 2015-18 (US$bn)
Source: Oliver Wyman proprietary data and analysis
1. Infrastructure costs and post-trade processes
We see huge potential to simplify and industrialise
middle- and back-office processes, yet few banks have
made much progress in recent years. We estimate that US$15 billion of costs could be cut – equivalent to a 25% increase in industry-wide pretax profit – if banks can deliver on a series of reform programmes.
More than at any point since the crisis, we think a path
towards more radical reform is emerging. The rapid pace of regulatory change over the past five years has prevented large-scale investments, and the upheaval to existing processes has limited the bandwidth available for change. As a result, banks have achieved only modest net reductions in back-office costs of ~5%, driving the bulk of savings through reductions in front-office headcount and compensation.
Exhibit 27 The industry has the opportunity to cut costs further, with infrastructure costs a focus area Wholesale banking cost reductions, 2010-20 target (%)
1. Range for front-office spending broader than for back and middle office functions, driven by greater ability to flex compensation – also performance dependent. Source: Company filings and annual reports; Oliver Wyman proprietary data and analysis
Control functions are a key area for simplification
and streamlining. Since 2009, the cost of controlfunctions per front-office head has increased by around50% to more than US$300,000 as new checks andprocesses have been layered on top of existing ones,with only very limited delayering and consolidation. Manyof these new controls have been highly manual. We thinkbanks could deliver the combined benefits of cuttingcosts and improving the quality of controls through acombination of better prioritisation, automation andreducing duplicative efforts. We estimate this could leadto US$2-4 billion of savings across the industry.
Product2015
revenues
Content
generation
Connectivity
to markets
Capital
provision
Structured ~$35 BN
Illiquids ~$15 BN
Hedging and
financing~$30 BN
Liquid trading and
liquidity provision~$20 BN
Key: Historic sources of competitive advantage for banks
Primary source of advantageSignificant source of advantage
Limited source of advantage
Area where competitive advantage of banks is under most threat from new entrants
2010 2015 2018 (target)
Front office Back office
-10% ~ -10 to -15%
-5%
-10% to- 15%
-10%
-15%
Range1
22
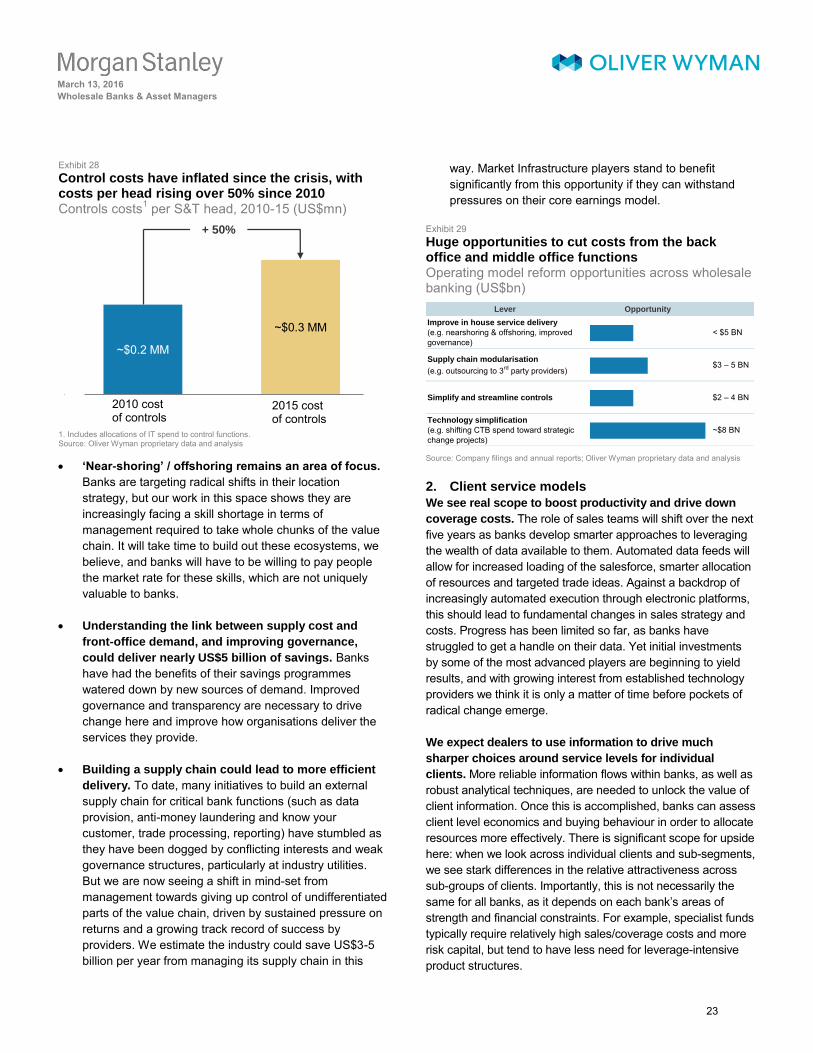
March 13, 2016
Wholesale Banks & Asset Managers
M O R G A N S T A N L E Y B L U E P A P E R Exhibit 28 Control costs have inflated since the crisis, with costs per head rising over 50% since 2010 Controls costs1 per S&T head, 2010-15 (US$mn)
1. Includes allocations of IT spend to control functions. Source: Oliver Wyman proprietary data and analysis
‘Near-shoring’ / offshoring remains an area of focus.
Banks are targeting radical shifts in their locationstrategy, but our work in this space shows they areincreasingly facing a skill shortage in terms ofmanagement required to take whole chunks of the valuechain. It will take time to build out these ecosystems, webelieve, and banks will have to be willing to pay peoplethe market rate for these skills, which are not uniquelyvaluable to banks.
Understanding the link between supply cost and
front-office demand, and improving governance,
could deliver nearly US$5 billion of savings. Bankshave had the benefits of their savings programmeswatered down by new sources of demand. Improvedgovernance and transparency are necessary to drivechange here and improve how organisations deliver theservices they provide.
Building a supply chain could lead to more efficient
delivery. To date, many initiatives to build an externalsupply chain for critical bank functions (such as dataprovision, anti-money laundering and know yourcustomer, trade processing, reporting) have stumbled asthey have been dogged by conflicting interests and weakgovernance structures, particularly at industry utilities.But we are now seeing a shift in mind-set frommanagement towards giving up control of undifferentiatedparts of the value chain, driven by sustained pressure onreturns and a growing track record of success byproviders. We estimate the industry could save US$3-5billion per year from managing its supply chain in this
way. Market Infrastructure players stand to benefit significantly from this opportunity if they can withstand pressures on their core earnings model.
Exhibit 29 Huge opportunities to cut costs from the back office and middle office functions Operating model reform opportunities across wholesale banking (US$bn)
Source: Company filings and annual reports; Oliver Wyman proprietary data and analysis
2. Client service models
We see real scope to boost productivity and drive down
coverage costs. The role of sales teams will shift over the next five years as banks develop smarter approaches to leveraging the wealth of data available to them. Automated data feeds will allow for increased loading of the salesforce, smarter allocation of resources and targeted trade ideas. Against a backdrop of increasingly automated execution through electronic platforms, this should lead to fundamental changes in sales strategy and costs. Progress has been limited so far, as banks have struggled to get a handle on their data. Yet initial investments by some of the most advanced players are beginning to yield results, and with growing interest from established technology providers we think it is only a matter of time before pockets of radical change emerge.
We expect dealers to use information to drive much
sharper choices around service levels for individual
clients. More reliable information flows within banks, as well as robust analytical techniques, are needed to unlock the value of client information. Once this is accomplished, banks can assess client level economics and buying behaviour in order to allocate resources more effectively. There is significant scope for upside here: when we look across individual clients and sub-segments, we see stark differences in the relative attractiveness across sub-groups of clients. Importantly, this is not necessarily the same for all banks, as it depends on each bank’s areas of
strength and financial constraints. For example, specialist funds typically require relatively high sales/coverage costs and more risk capital, but tend to have less need for leverage-intensive product structures.
~$0.2 MM
~$0.3 MM
+ 50%
2010 costof controls
2015 costof controls
Lever Opportunity
Improve in house service delivery
(e.g. nearshoring & offshoring, improved governance)
< $5 BN
Supply chain modularisation
(e.g. outsourcing to 3rd party providers)$3 – 5 BN
Simplify and streamline controls $2 – 4 BN
Technology simplification
(e.g. shifting CTB spend toward strategic change projects)
~$8 BN
23
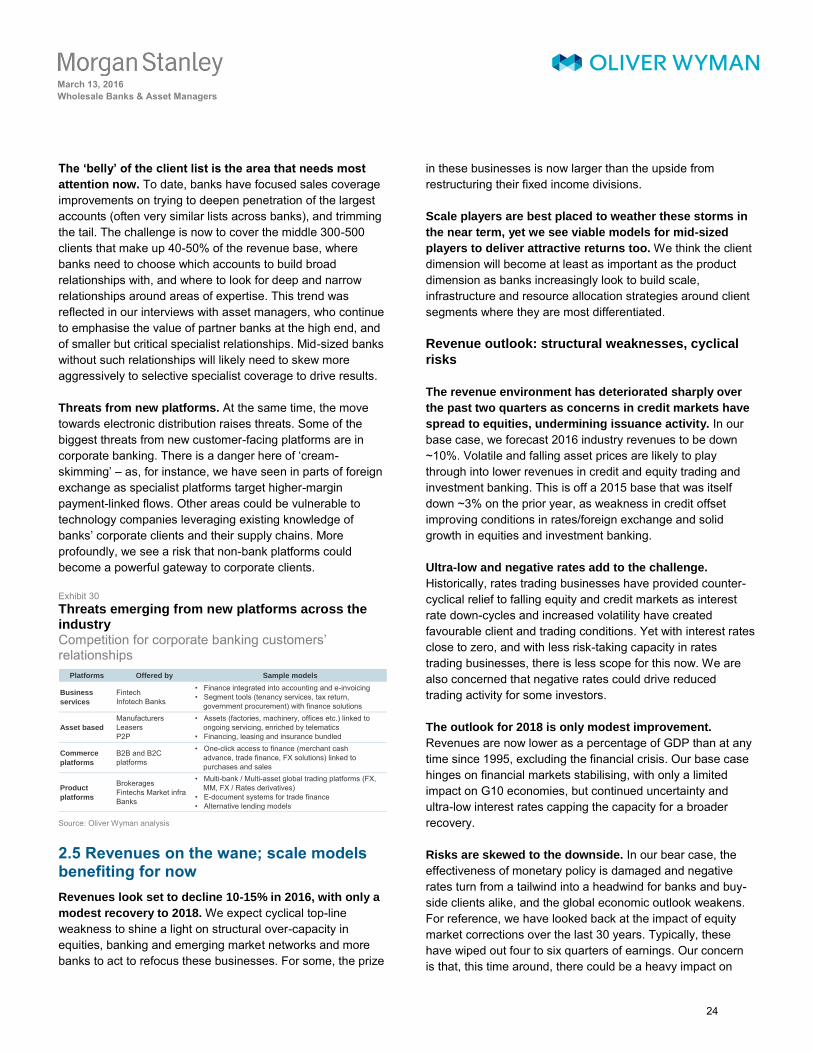
March 13, 2016
Wholesale Banks & Asset Managers
M O R G A N S T A N L E Y B L U E P A P E R The ‘belly’ of the client list is the area that needs most
attention now. To date, banks have focused sales coverage improvements on trying to deepen penetration of the largest accounts (often very similar lists across banks), and trimming the tail. The challenge is now to cover the middle 300-500 clients that make up 40-50% of the revenue base, where banks need to choose which accounts to build broad relationships with, and where to look for deep and narrow relationships around areas of expertise. This trend was reflected in our interviews with asset managers, who continue to emphasise the value of partner banks at the high end, and of smaller but critical specialist relationships. Mid-sized banks without such relationships will likely need to skew more aggressively to selective specialist coverage to drive results.
Threats from new platforms. At the same time, the move towards electronic distribution raises threats. Some of the biggest threats from new customer-facing platforms are in corporate banking. There is a danger here of ‘cream-skimming’ – as, for instance, we have seen in parts of foreign exchange as specialist platforms target higher-margin payment-linked flows. Other areas could be vulnerable to technology companies leveraging existing knowledge of banks’ corporate clients and their supply chains. More
profoundly, we see a risk that non-bank platforms could become a powerful gateway to corporate clients.
Exhibit 30 Threats emerging from new platforms across the industry Competition for corporate banking customers’ relationships
Source: Oliver Wyman analysis
2.5 Revenues on the wane; scale models benefiting for now
Revenues look set to decline 10-15% in 2016, with only a
modest recovery to 2018. We expect cyclical top-line weakness to shine a light on structural over-capacity in equities, banking and emerging market networks and more banks to act to refocus these businesses. For some, the prize
in these businesses is now larger than the upside from restructuring their fixed income divisions.
Scale players are best placed to weather these storms in
the near term, yet we see viable models for mid-sized
players to deliver attractive returns too. We think the client dimension will become at least as important as the product dimension as banks increasingly look to build scale, infrastructure and resource allocation strategies around client segments where they are most differentiated.
Revenue outlook: structural weaknesses, cyclical
risks
The revenue environment has deteriorated sharply over
the past two quarters as concerns in credit markets have
spread to equities, undermining issuance activity. In our base case, we forecast 2016 industry revenues to be down ~10%. Volatile and falling asset prices are likely to play through into lower revenues in credit and equity trading and investment banking. This is off a 2015 base that was itself down ~3% on the prior year, as weakness in credit offset improving conditions in rates/foreign exchange and solid growth in equities and investment banking.
Ultra-low and negative rates add to the challenge.
Historically, rates trading businesses have provided counter-cyclical relief to falling equity and credit markets as interest rate down-cycles and increased volatility have created favourable client and trading conditions. Yet with interest rates close to zero, and with less risk-taking capacity in rates trading businesses, there is less scope for this now. We are also concerned that negative rates could drive reduced trading activity for some investors.
The outlook for 2018 is only modest improvement.
Revenues are now lower as a percentage of GDP than at any time since 1995, excluding the financial crisis. Our base case hinges on financial markets stabilising, with only a limited impact on G10 economies, but continued uncertainty and ultra-low interest rates capping the capacity for a broader recovery.
Risks are skewed to the downside. In our bear case, the effectiveness of monetary policy is damaged and negative rates turn from a tailwind into a headwind for banks and buy-side clients alike, and the global economic outlook weakens. For reference, we have looked back at the impact of equity market corrections over the last 30 years. Typically, these have wiped out four to six quarters of earnings. Our concern is that, this time around, there could be a heavy impact on
Platforms Offered by Sample models
Business
services
FintechInfotech Banks
• Finance integrated into accounting and e-invoicing• Segment tools (tenancy services, tax return,
government procurement) with finance solutions
Asset based
ManufacturersLeasersP2P
• Assets (factories, machinery, offices etc.) linked toongoing servicing, enriched by telematics
• Financing, leasing and insurance bundled
Commerce
platforms
B2B and B2C platforms
• One-click access to finance (merchant cash advance, trade finance, FX solutions) linked topurchases and sales
Product
platforms
BrokeragesFintechs Market infraBanks
• Multi-bank / Multi-asset global trading platforms (FX, MM, FX / Rates derivatives)
• E-document systems for trade finance• Alternative lending models
24
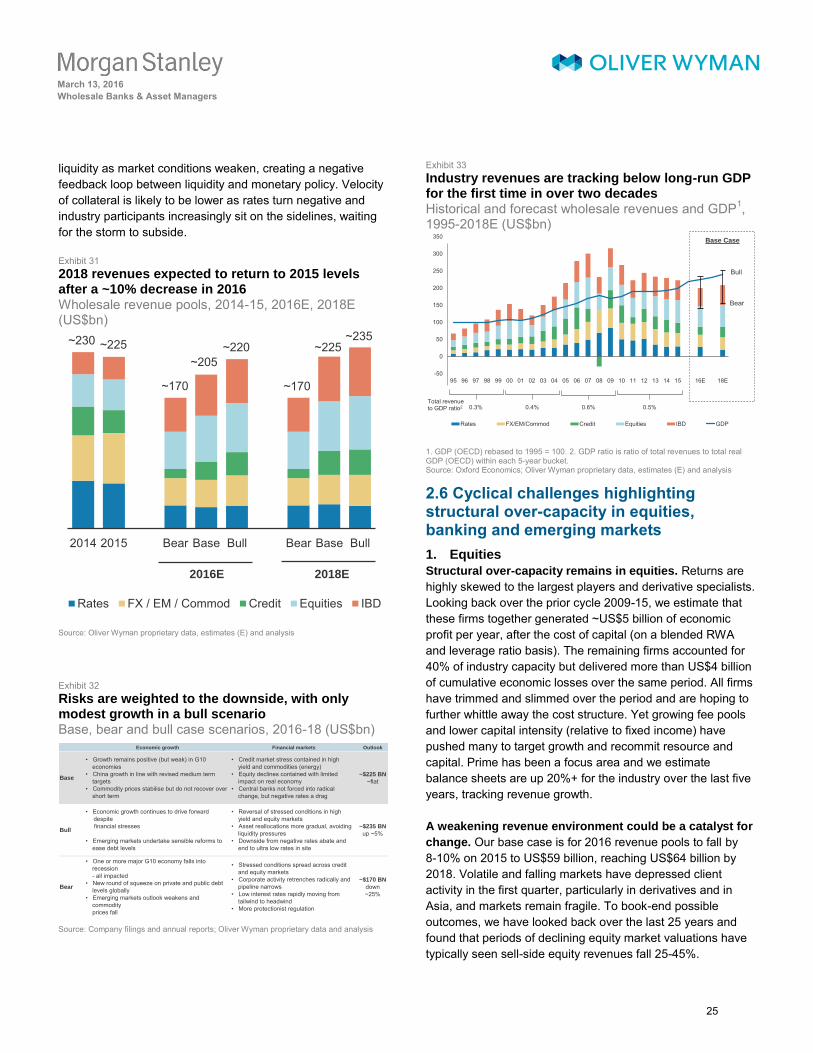
March 13, 2016
Wholesale Banks & Asset Managers
M O R G A N S T A N L E Y B L U E P A P E R liquidity as market conditions weaken, creating a negative feedback loop between liquidity and monetary policy. Velocity of collateral is likely to be lower as rates turn negative and industry participants increasingly sit on the sidelines, waiting for the storm to subside.
Exhibit 31 2018 revenues expected to return to 2015 levels after a ~10% decrease in 2016 Wholesale revenue pools, 2014-15, 2016E, 2018E (US$bn)
Source: Oliver Wyman proprietary data, estimates (E) and analysis
Exhibit 32 Risks are weighted to the downside, with only modest growth in a bull scenario Base, bear and bull case scenarios, 2016-18 (US$bn)
Source: Company filings and annual reports; Oliver Wyman proprietary data and analysis
Exhibit 33 Industry revenues are tracking below long-run GDP for the first time in over two decades Historical and forecast wholesale revenues and GDP1, 1995-2018E (US$bn)
1. GDP (OECD) rebased to 1995 = 100. 2. GDP ratio is ratio of total revenues to total realGDP (OECD) within each 5-year bucket. Source: Oxford Economics; Oliver Wyman proprietary data, estimates (E) and analysis
2.6 Cyclical challenges highlighting structural over-capacity in equities, banking and emerging markets
1. Equities
Structural over-capacity remains in equities. Returns are highly skewed to the largest players and derivative specialists. Looking back over the prior cycle 2009-15, we estimate that these firms together generated ~US$5 billion of economic profit per year, after the cost of capital (on a blended RWA and leverage ratio basis). The remaining firms accounted for 40% of industry capacity but delivered more than US$4 billion of cumulative economic losses over the same period. All firms have trimmed and slimmed over the period and are hoping to further whittle away the cost structure. Yet growing fee pools and lower capital intensity (relative to fixed income) have pushed many to target growth and recommit resource and capital. Prime has been a focus area and we estimate balance sheets are up 20%+ for the industry over the last five years, tracking revenue growth.
A weakening revenue environment could be a catalyst for
change. Our base case is for 2016 revenue pools to fall by 8-10% on 2015 to US$59 billion, reaching US$64 billion by 2018. Volatile and falling markets have depressed client activity in the first quarter, particularly in derivatives and in Asia, and markets remain fragile. To book-end possible outcomes, we have looked back over the last 25 years and found that periods of declining equity market valuations have typically seen sell-side equity revenues fall 25-45%.
BullBaseBearBullBaseBear20152014
Rates FX / EM / Commod Credit Equities IBD
~170
~205~220
~170
~225~235
2016E 2018E
~225~230
Economic growth Financial markets Outlook
Base
• Growth remains positive (but weak) in G10economies
• China growth in line with revised medium term
targets• Commodity prices stabilise but do not recover over
short term
• Credit market stress contained in high
yield and commodities (energy)• Equity declines contained with limited
impact on real economy• Central banks not forced into radical
change, but negative rates a drag
~$225 BN
~flat
Bull
• Economic growth continues to drive forward
despitefinancial stresses
• Emerging markets undertake sensible reforms to
ease debt levels
• Reversal of stressed conditions in high
yield and equity markets• Asset reallocations more gradual, avoiding
liquidity pressures• Downside from negative rates abate and
end to ultra low rates in site
~$235 BN
up ~5%
Bear
• One or more major G10 economy falls into recession- all impacted
• New round of squeeze on private and public debt
levels globally• Emerging markets outlook weakens and
commodityprices fall
• Stressed conditions spread across credit
and equity markets• Corporate activity retrenches radically and
pipeline narrows• Low interest rates rapidly moving from
tailwind to headwind• More protectionist regulation
~$170 BN
down ~25%
-50
0
50
100
150
200
250
300
350
95 96 97 98 99 00 01 02 03 04 05 06 07 08 09 10 11 12 13 14 15 16E 18E
Rates FX/EM/Commod Credit Equities IBD GDP
Bear
Base Case
Bull
Total revenueto GDP ratio2 0.3% 0.4% 0.6% 0.5%
25
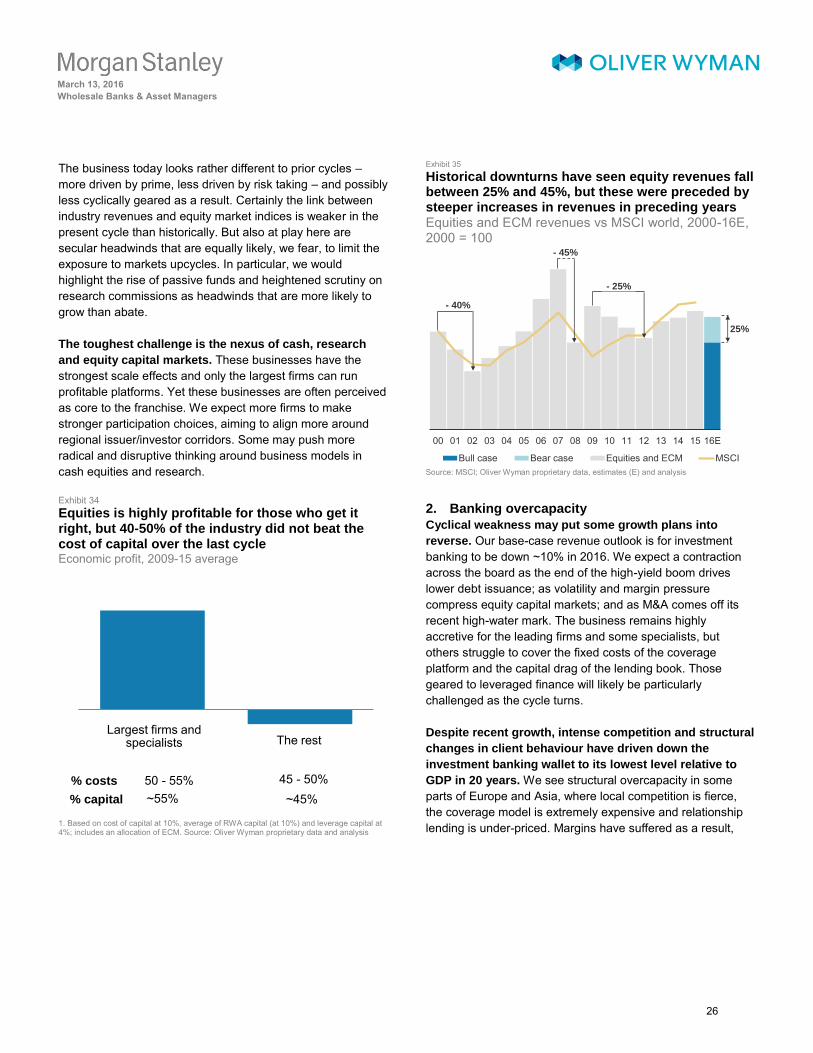
March 13, 2016
Wholesale Banks & Asset Managers
M O R G A N S T A N L E Y B L U E P A P E R The business today looks rather different to prior cycles – more driven by prime, less driven by risk taking – and possibly less cyclically geared as a result. Certainly the link between industry revenues and equity market indices is weaker in the present cycle than historically. But also at play here are secular headwinds that are equally likely, we fear, to limit the exposure to markets upcycles. In particular, we would highlight the rise of passive funds and heightened scrutiny on research commissions as headwinds that are more likely to grow than abate.
The toughest challenge is the nexus of cash, research
and equity capital markets. These businesses have the strongest scale effects and only the largest firms can run profitable platforms. Yet these businesses are often perceived as core to the franchise. We expect more firms to make stronger participation choices, aiming to align more around regional issuer/investor corridors. Some may push more radical and disruptive thinking around business models in cash equities and research.
Exhibit 34 Equities is highly profitable for those who get it right, but 40-50% of the industry did not beat the cost of capital over the last cycle Economic profit, 2009-15 average
1. Based on cost of capital at 10%, average of RWA capital (at 10%) and leverage capital at 4%; includes an allocation of ECM. Source: Oliver Wyman proprietary data and analysis
Exhibit 35
Historical downturns have seen equity revenues fall between 25% and 45%, but these were preceded by steeper increases in revenues in preceding years Equities and ECM revenues vs MSCI world, 2000-16E, 2000 = 100
Source: MSCI; Oliver Wyman proprietary data, estimates (E) and analysis
2. Banking overcapacity
Cyclical weakness may put some growth plans into
reverse. Our base-case revenue outlook is for investment banking to be down ~10% in 2016. We expect a contraction across the board as the end of the high-yield boom drives lower debt issuance; as volatility and margin pressure compress equity capital markets; and as M&A comes off its recent high-water mark. The business remains highly accretive for the leading firms and some specialists, but others struggle to cover the fixed costs of the coverage platform and the capital drag of the lending book. Those geared to leveraged finance will likely be particularly challenged as the cycle turns.
Despite recent growth, intense competition and structural
changes in client behaviour have driven down the
investment banking wallet to its lowest level relative to
GDP in 20 years. We see structural overcapacity in some parts of Europe and Asia, where local competition is fierce, the coverage model is extremely expensive and relationship lending is under-priced. Margins have suffered as a result,
% costs
% capital
50 - 55%~55%
45 - 50%~45%
Largest firms and specialists The rest
00 01 02 03 04 05 06 07 08 09 10 11 12 13 14 15 16E
Bull case Bear case Equities and ECM MSCI
- 40%
- 25%
- 45%
25%
26
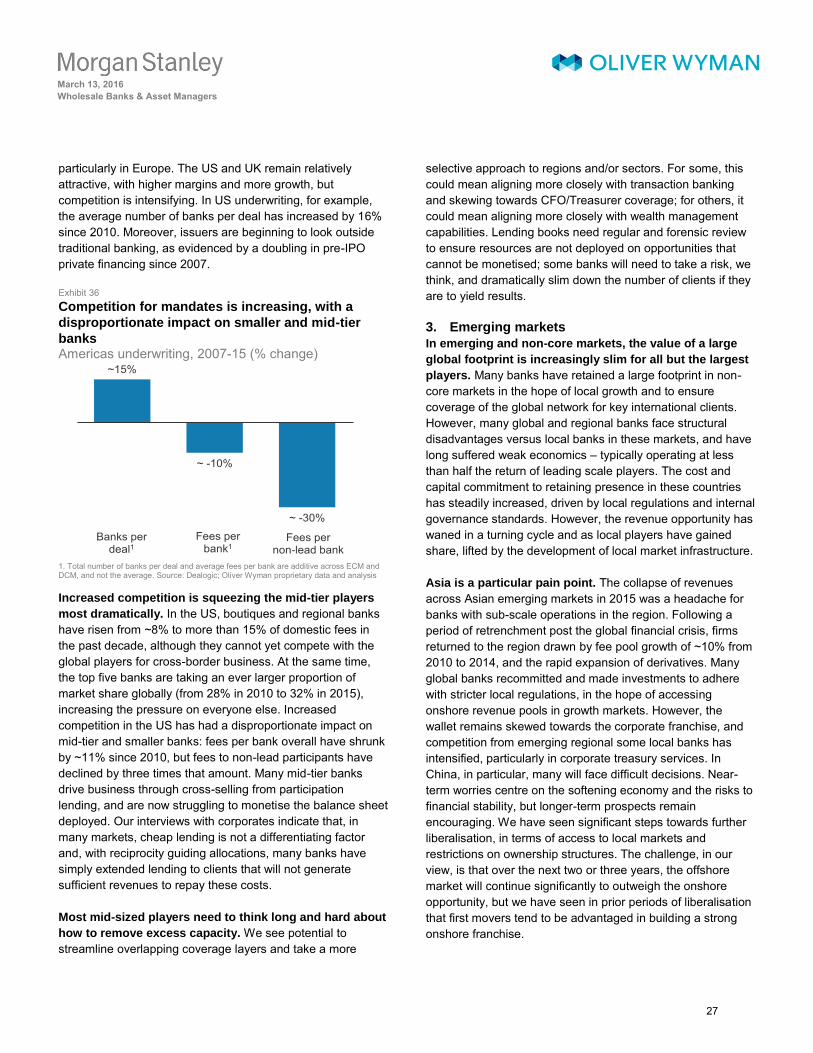
March 13, 2016
Wholesale Banks & Asset Managers
M O R G A N S T A N L E Y B L U E P A P E R particularly in Europe. The US and UK remain relatively attractive, with higher margins and more growth, but competition is intensifying. In US underwriting, for example, the average number of banks per deal has increased by 16% since 2010. Moreover, issuers are beginning to look outside traditional banking, as evidenced by a doubling in pre-IPO private financing since 2007.
Exhibit 36 Competition for mandates is increasing, with a
disproportionate impact on smaller and mid-tier
banks Americas underwriting, 2007-15 (% change)
1. Total number of banks per deal and average fees per bank are additive across ECM andDCM, and not the average. Source: Dealogic; Oliver Wyman proprietary data and analysis
Increased competition is squeezing the mid-tier players
most dramatically. In the US, boutiques and regional banks have risen from ~8% to more than 15% of domestic fees in the past decade, although they cannot yet compete with the global players for cross-border business. At the same time, the top five banks are taking an ever larger proportion of market share globally (from 28% in 2010 to 32% in 2015), increasing the pressure on everyone else. Increased competition in the US has had a disproportionate impact on mid-tier and smaller banks: fees per bank overall have shrunk by ~11% since 2010, but fees to non-lead participants have declined by three times that amount. Many mid-tier banks drive business through cross-selling from participation lending, and are now struggling to monetise the balance sheet deployed. Our interviews with corporates indicate that, in many markets, cheap lending is not a differentiating factor and, with reciprocity guiding allocations, many banks have simply extended lending to clients that will not generate sufficient revenues to repay these costs.
Most mid-sized players need to think long and hard about
how to remove excess capacity. We see potential to streamline overlapping coverage layers and take a more
selective approach to regions and/or sectors. For some, this could mean aligning more closely with transaction banking and skewing towards CFO/Treasurer coverage; for others, it could mean aligning more closely with wealth management capabilities. Lending books need regular and forensic review to ensure resources are not deployed on opportunities that cannot be monetised; some banks will need to take a risk, we think, and dramatically slim down the number of clients if they are to yield results.
3. Emerging markets
In emerging and non-core markets, the value of a large
global footprint is increasingly slim for all but the largest
players. Many banks have retained a large footprint in non-core markets in the hope of local growth and to ensure coverage of the global network for key international clients. However, many global and regional banks face structural disadvantages versus local banks in these markets, and have long suffered weak economics – typically operating at less than half the return of leading scale players. The cost and capital commitment to retaining presence in these countries has steadily increased, driven by local regulations and internal governance standards. However, the revenue opportunity has waned in a turning cycle and as local players have gained share, lifted by the development of local market infrastructure.
Asia is a particular pain point. The collapse of revenues across Asian emerging markets in 2015 was a headache for banks with sub-scale operations in the region. Following a period of retrenchment post the global financial crisis, firms returned to the region drawn by fee pool growth of ~10% from 2010 to 2014, and the rapid expansion of derivatives. Many global banks recommitted and made investments to adhere with stricter local regulations, in the hope of accessing onshore revenue pools in growth markets. However, the wallet remains skewed towards the corporate franchise, and competition from emerging regional some local banks has intensified, particularly in corporate treasury services. In China, in particular, many will face difficult decisions. Near-term worries centre on the softening economy and the risks to financial stability, but longer-term prospects remain encouraging. We have seen significant steps towards further liberalisation, in terms of access to local markets and restrictions on ownership structures. The challenge, in our view, is that over the next two or three years, the offshore market will continue significantly to outweigh the onshore opportunity, but we have seen in prior periods of liberalisation that first movers tend to be advantaged in building a strong onshore franchise.
~15%
~ -10%
~ -30%
Banks perdeal1
Fees perbank1
Fees pernon-lead bank
27
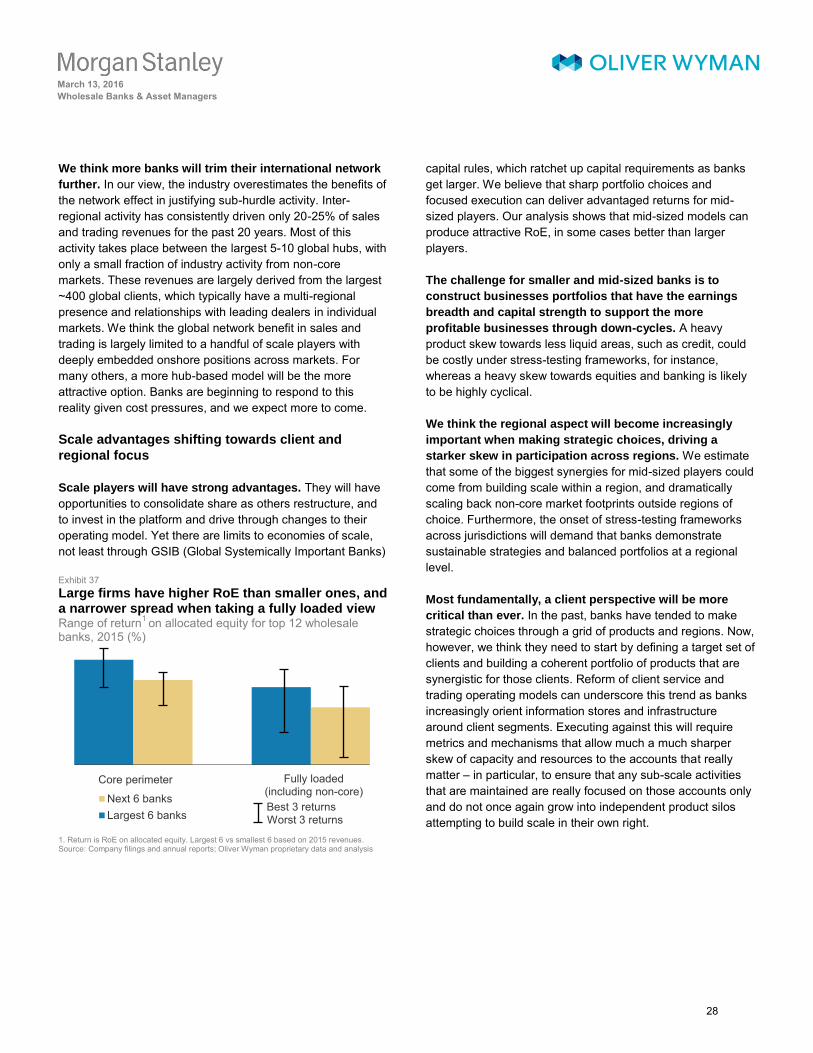
March 13, 2016
Wholesale Banks & Asset Managers
M O R G A N S T A N L E Y B L U E P A P E R We think more banks will trim their international network
further. In our view, the industry overestimates the benefits of the network effect in justifying sub-hurdle activity. Inter-regional activity has consistently driven only 20-25% of sales and trading revenues for the past 20 years. Most of this activity takes place between the largest 5-10 global hubs, with only a small fraction of industry activity from non-core markets. These revenues are largely derived from the largest ~400 global clients, which typically have a multi-regional presence and relationships with leading dealers in individual markets. We think the global network benefit in sales and trading is largely limited to a handful of scale players with deeply embedded onshore positions across markets. For many others, a more hub-based model will be the more attractive option. Banks are beginning to respond to this reality given cost pressures, and we expect more to come.
Scale advantages shifting towards client and
regional focus
Scale players will have strong advantages. They will have opportunities to consolidate share as others restructure, and to invest in the platform and drive through changes to their operating model. Yet there are limits to economies of scale, not least through GSIB (Global Systemically Important Banks)
Exhibit 37 Large firms have higher RoE than smaller ones, and a narrower spread when taking a fully loaded view Range of return1 on allocated equity for top 12 wholesale banks, 2015 (%)
1. Return is RoE on allocated equity. Largest 6 vs smallest 6 based on 2015 revenues.Source: Company filings and annual reports; Oliver Wyman proprietary data and analysis
capital rules, which ratchet up capital requirements as banks get larger. We believe that sharp portfolio choices and focused execution can deliver advantaged returns for mid-sized players. Our analysis shows that mid-sized models can produce attractive RoE, in some cases better than larger players.
The challenge for smaller and mid-sized banks is to
construct businesses portfolios that have the earnings
breadth and capital strength to support the more
profitable businesses through down-cycles. A heavy product skew towards less liquid areas, such as credit, could be costly under stress-testing frameworks, for instance, whereas a heavy skew towards equities and banking is likely to be highly cyclical.
We think the regional aspect will become increasingly
important when making strategic choices, driving a
starker skew in participation across regions. We estimate that some of the biggest synergies for mid-sized players could come from building scale within a region, and dramatically scaling back non-core market footprints outside regions of choice. Furthermore, the onset of stress-testing frameworks across jurisdictions will demand that banks demonstrate sustainable strategies and balanced portfolios at a regional level.
Most fundamentally, a client perspective will be more
critical than ever. In the past, banks have tended to make strategic choices through a grid of products and regions. Now, however, we think they need to start by defining a target set of clients and building a coherent portfolio of products that are synergistic for those clients. Reform of client service and trading operating models can underscore this trend as banks increasingly orient information stores and infrastructure around client segments. Executing against this will require metrics and mechanisms that allow much a much sharper skew of capacity and resources to the accounts that really matter – in particular, to ensure that any sub-scale activities that are maintained are really focused on those accounts only and do not once again grow into independent product silos attempting to build scale in their own right.
Next 6 banksLargest 6 banks
Core perimeter Fully loaded(including non-core)
Worst 3 returnsBest 3 returns
28
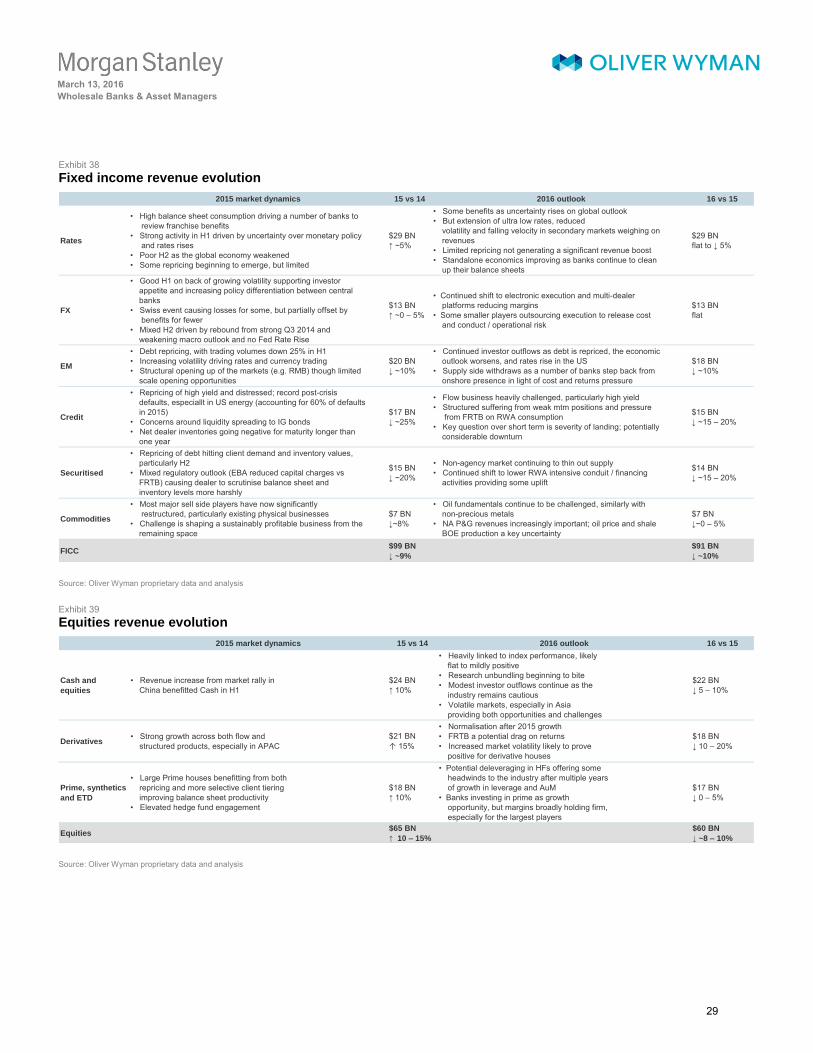
March 13, 2016
Wholesale Banks & Asset Managers
M O R G A N S T A N L E Y B L U E P A P E R
Exhibit 38 Fixed income revenue evolution
Source: Oliver Wyman proprietary data and analysis
Exhibit 39 Equities revenue evolution
Source: Oliver Wyman proprietary data and analysis
2015 market dynamics 15 vs 14 2016 outlook 16 vs 15
Rates
• High balance sheet consumption driving a number of banks to
review franchise benefits• Strong activity in H1 driven by uncertainty over monetary policy
and rates rises• Poor H2 as the global economy weakened• Some repricing beginning to emerge, but limited
$29 BN↑ ~5%
• Some benefits as uncertainty rises on global outlook
• But extension of ultra low rates, reducedvolatility and falling velocity in secondary markets weighing onrevenues
• Limited repricing not generating a significant revenue boost
• Standalone economics improving as banks continue to clean
up their balance sheets
$29 BNflat to ↓ 5%
FX
• Good H1 on back of growing volatility supporting investor appetite and increasing policy differentiation between central banks
• Swiss event causing losses for some, but partially offset by benefits for fewer
• Mixed H2 driven by rebound from strong Q3 2014 and weakening macro outlook and no Fed Rate Rise
$13 BN↑ ~0 – 5%
• Continued shift to electronic execution and multi-dealer platforms reducing margins
• Some smaller players outsourcing execution to release cost
and conduct / operational risk
$13 BNflat
EM
• Debt repricing, with trading volumes down 25% in H1• Increasing volatility driving rates and currency trading
• Structural opening up of the markets (e.g. RMB) though limitedscale opening opportunities
$20 BN↓ ~10%
• Continued investor outflows as debt is repriced, the economic outlook worsens, and rates rise in the US
• Supply side withdraws as a number of banks step back from
onshore presence in light of cost and returns pressure
$18 BN↓ ~10%
Credit
• Repricing of high yield and distressed; record post-crisis defaults, especiallt in US energy (accounting for 60% of defaults in 2015)
• Concerns around liquidity spreading to IG bonds
• Net dealer inventories going negative for maturity longer than
one year
$17 BN↓ ~25%
• Flow business heavily challenged, particularly high yield• Structured suffering from weak mtm positions and pressure
from FRTB on RWA consumption• Key question over short term is severity of landing; potentially
considerable downturn
$15 BN↓ ~15 – 20%
Securitised
• Repricing of debt hitting client demand and inventory values, particularly H2
• Mixed regulatory outlook (EBA reduced capital charges vs FRTB) causing dealer to scrutinise balance sheet andinventory levels more harshly
$15 BN↓ ~20%
• Non-agency market continuing to thin out supply• Continued shift to lower RWA intensive conduit / financing
activities providing some uplift
$14 BN↓ ~15 – 20%
Commodities
• Most major sell side players have now significantly
restructured, particularly existing physical businesses• Challenge is shaping a sustainably profitable business from the
remaining space
$7 BN↓~8%
• Oil fundamentals continue to be challenged, similarly withnon-precious metals
• NA P&G revenues increasingly important; oil price and shale BOE production a key uncertainty
$7 BN↓~0 – 5%
FICC$99 BN
↓ ~9%
$91 BN
↓ ~10%
2015 market dynamics 15 vs 14 2016 outlook 16 vs 15
Cash and
equities
• Revenue increase from market rally in
China benefitted Cash in H1$24 BN↑ 10%
• Heavily linked to index performance, likely flat to mildly positive
• Research unbundling beginning to bite
• Modest investor outflows continue as the
industry remains cautious• Volatile markets, especially in Asia
providing both opportunities and challenges
$22 BN↓ 5 – 10%
Derivatives• Strong growth across both flow and
structured products, especially in APAC$21 BN↑ 15%
• Normalisation after 2015 growth• FRTB a potential drag on returns
• Increased market volatility likely to prove
positive for derivative houses
$18 BN↓ 10 – 20%
Prime, synthetics
and ETD
• Large Prime houses benefitting from both
repricing and more selective client tiering improving balance sheet productivity
• Elevated hedge fund engagement
$18 BN↑ 10%
• Potential deleveraging in HFs offering some
headwinds to the industry after multiple years of growth in leverage and AuM
• Banks investing in prime as growth
opportunity, but margins broadly holding firm, especially for the largest players
$17 BN↓ 0 – 5%
Equities$65 BN
↑ 10 – 15%
$60 BN
↓ ~8 – 10%
29
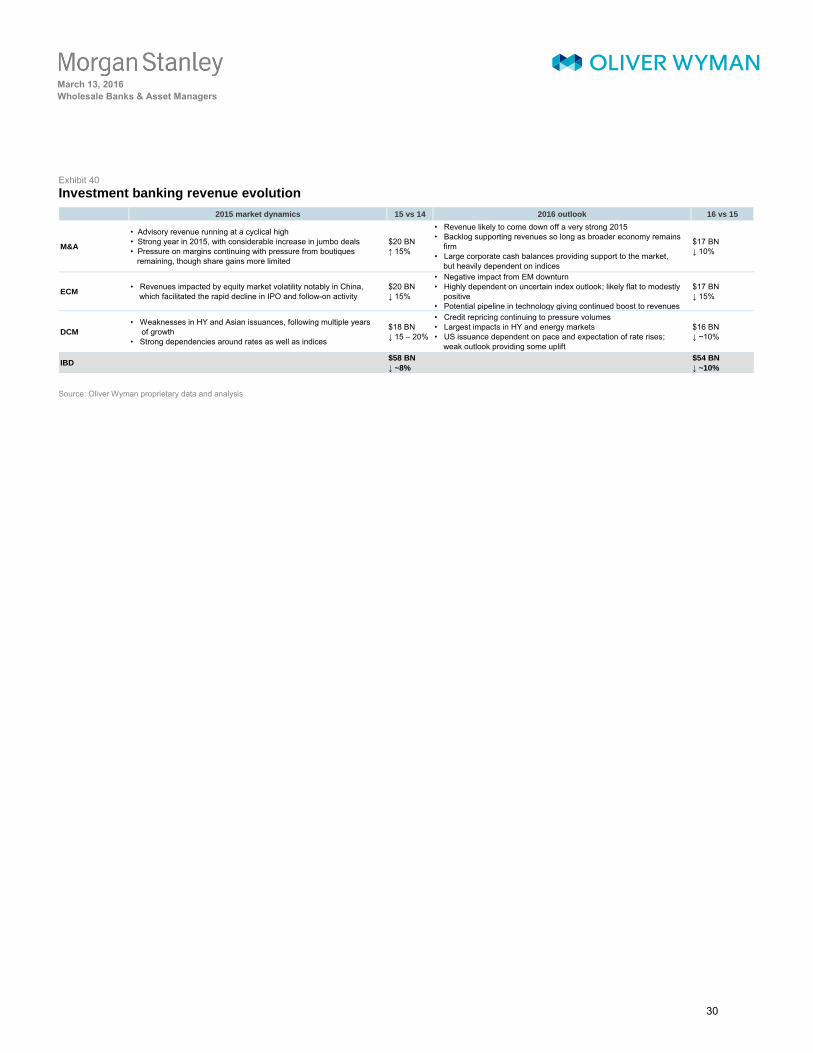
March 13, 2016
Wholesale Banks & Asset Managers
M O R G A N S T A N L E Y B L U E P A P E RExhibit 40 Investment banking revenue evolution
Source: Oliver Wyman proprietary data and analysis
2015 market dynamics 15 vs 14 2016 outlook 16 vs 15
M&A
• Advisory revenue running at a cyclical high
• Strong year in 2015, with considerable increase in jumbo deals• Pressure on margins continuing with pressure from boutiques
remaining, though share gains more limited
$20 BN↑ 15%
• Revenue likely to come down off a very strong 2015• Backlog supporting revenues so long as broader economy remains
firm• Large corporate cash balances providing support to the market,
but heavily dependent on indices
$17 BN↓ 10%
ECM• Revenues impacted by equity market volatility notably in China,
which facilitated the rapid decline in IPO and follow-on activity$20 BN↓ 15%
• Negative impact from EM downturn
• Highly dependent on uncertain index outlook; likely flat to modestly positive
• Potential pipeline in technology giving continued boost to revenues
$17 BN↓ 15%
DCM
• Weaknesses in HY and Asian issuances, following multiple years of growth
• Strong dependencies around rates as well as indices
$18 BN↓ 15 – 20%
• Credit repricing continuing to pressure volumes
• Largest impacts in HY and energy markets
• US issuance dependent on pace and expectation of rate rises; weak outlook providing some uplift
$16 BN↓ ~10%
IBD$58 BN
↓ ~8%
$54 BN
↓ ~10%
30
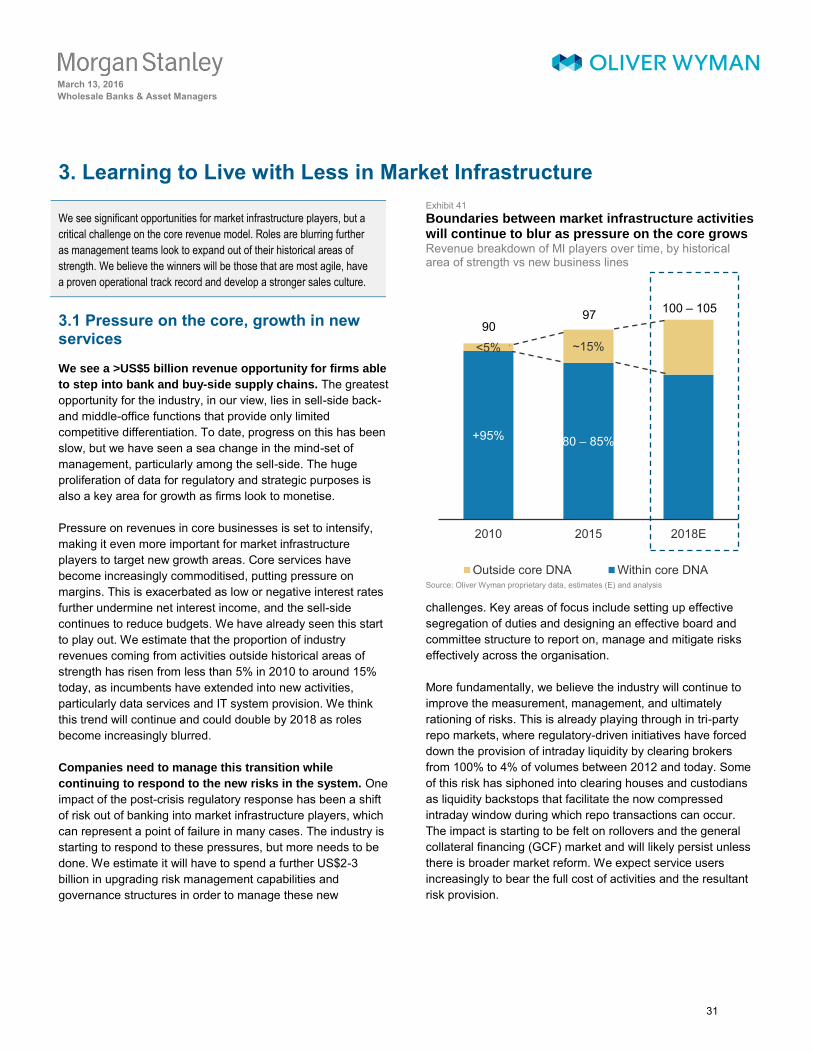
March 13, 2016
Wholesale Banks & Asset Managers
M O R G A N S T A N L E Y B L U E P A P E R 3. Learning to Live with Less in Market Infrastructure
We see significant opportunities for market infrastructure players, but a
critical challenge on the core revenue model. Roles are blurring further
as management teams look to expand out of their historical areas of
strength. We believe the winners will be those that are most agile, have
a proven operational track record and develop a stronger sales culture.
3.1 Pressure on the core, growth in new services
We see a >US$5 billion revenue opportunity for firms able
to step into bank and buy-side supply chains. The greatest opportunity for the industry, in our view, lies in sell-side back- and middle-office functions that provide only limited competitive differentiation. To date, progress on this has been slow, but we have seen a sea change in the mind-set of management, particularly among the sell-side. The huge proliferation of data for regulatory and strategic purposes is also a key area for growth as firms look to monetise.
Pressure on revenues in core businesses is set to intensify, making it even more important for market infrastructure players to target new growth areas. Core services have become increasingly commoditised, putting pressure on margins. This is exacerbated as low or negative interest rates further undermine net interest income, and the sell-side continues to reduce budgets. We have already seen this start to play out. We estimate that the proportion of industry revenues coming from activities outside historical areas of strength has risen from less than 5% in 2010 to around 15% today, as incumbents have extended into new activities, particularly data services and IT system provision. We think this trend will continue and could double by 2018 as roles become increasingly blurred.
Companies need to manage this transition while
continuing to respond to the new risks in the system. One impact of the post-crisis regulatory response has been a shift of risk out of banking into market infrastructure players, which can represent a point of failure in many cases. The industry is starting to respond to these pressures, but more needs to be done. We estimate it will have to spend a further US$2-3 billion in upgrading risk management capabilities and governance structures in order to manage these new
Exhibit 41 Boundaries between market infrastructure activities will continue to blur as pressure on the core grows Revenue breakdown of MI players over time, by historical area of strength vs new business lines
Source: Oliver Wyman proprietary data, estimates (E) and analysis
challenges. Key areas of focus include setting up effective segregation of duties and designing an effective board and committee structure to report on, manage and mitigate risks effectively across the organisation.
More fundamentally, we believe the industry will continue to improve the measurement, management, and ultimately rationing of risks. This is already playing through in tri-party repo markets, where regulatory-driven initiatives have forced down the provision of intraday liquidity by clearing brokers from 100% to 4% of volumes between 2012 and today. Some of this risk has siphoned into clearing houses and custodians as liquidity backstops that facilitate the now compressed intraday window during which repo transactions can occur. The impact is starting to be felt on rollovers and the general collateral financing (GCF) market and will likely persist unless there is broader market reform. We expect service users increasingly to bear the full cost of activities and the resultant risk provision.
+95% 80 – 85%
<5% ~15%
2010 2015 2018E
Outside core DNA Within core DNA
9097 100 – 105
31
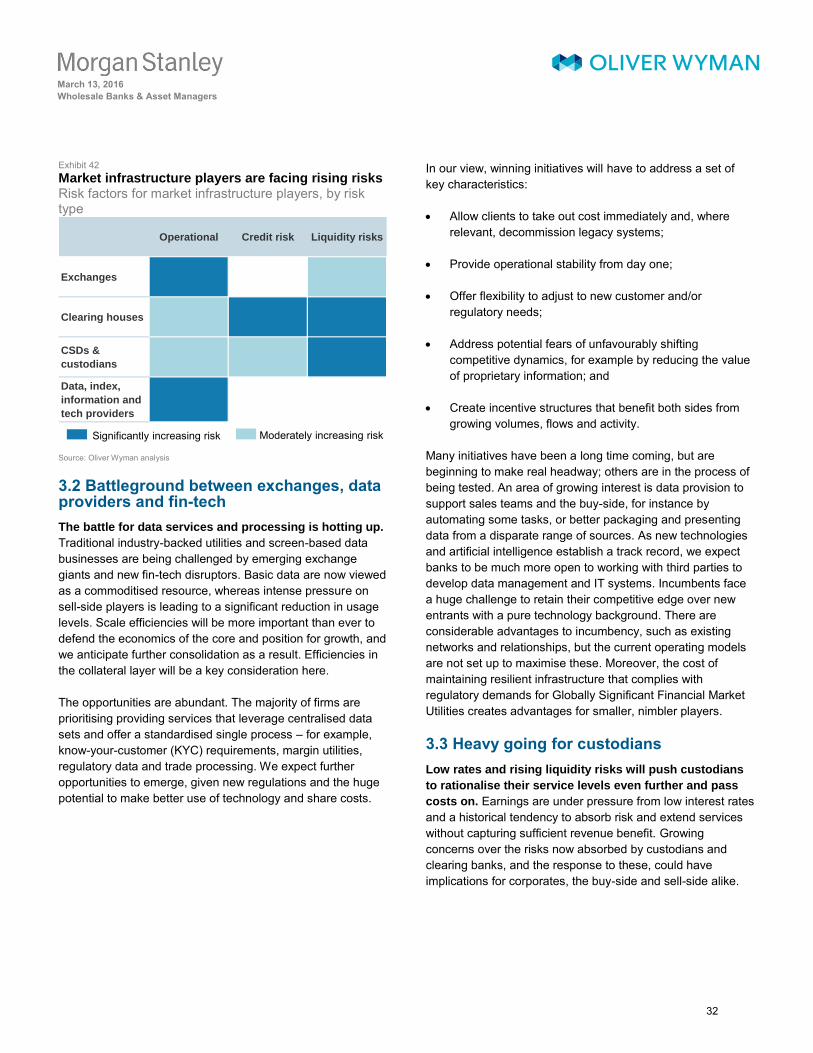
March 13, 2016
Wholesale Banks & Asset Managers
M O R G A N S T A N L E Y B L U E P A P E R Exhibit 42 Market infrastructure players are facing rising risks Risk factors for market infrastructure players, by risk type
Source: Oliver Wyman analysis
3.2 Battleground between exchanges, data providers and fin-tech
The battle for data services and processing is hotting up.
Traditional industry-backed utilities and screen-based data businesses are being challenged by emerging exchange giants and new fin-tech disruptors. Basic data are now viewed as a commoditised resource, whereas intense pressure on sell-side players is leading to a significant reduction in usage levels. Scale efficiencies will be more important than ever to defend the economics of the core and position for growth, and we anticipate further consolidation as a result. Efficiencies in the collateral layer will be a key consideration here.
The opportunities are abundant. The majority of firms are prioritising providing services that leverage centralised data sets and offer a standardised single process – for example, know-your-customer (KYC) requirements, margin utilities, regulatory data and trade processing. We expect further opportunities to emerge, given new regulations and the huge potential to make better use of technology and share costs.
In our view, winning initiatives will have to address a set of key characteristics:
Allow clients to take out cost immediately and, whererelevant, decommission legacy systems;
Provide operational stability from day one;
Offer flexibility to adjust to new customer and/orregulatory needs;
Address potential fears of unfavourably shiftingcompetitive dynamics, for example by reducing the valueof proprietary information; and
Create incentive structures that benefit both sides fromgrowing volumes, flows and activity.
Many initiatives have been a long time coming, but are beginning to make real headway; others are in the process of being tested. An area of growing interest is data provision to support sales teams and the buy-side, for instance by automating some tasks, or better packaging and presenting data from a disparate range of sources. As new technologies and artificial intelligence establish a track record, we expect banks to be much more open to working with third parties to develop data management and IT systems. Incumbents face a huge challenge to retain their competitive edge over new entrants with a pure technology background. There are considerable advantages to incumbency, such as existing networks and relationships, but the current operating models are not set up to maximise these. Moreover, the cost of maintaining resilient infrastructure that complies with regulatory demands for Globally Significant Financial Market Utilities creates advantages for smaller, nimbler players.
3.3 Heavy going for custodians
Low rates and rising liquidity risks will push custodians
to rationalise their service levels even further and pass
costs on. Earnings are under pressure from low interest rates and a historical tendency to absorb risk and extend services without capturing sufficient revenue benefit. Growing concerns over the risks now absorbed by custodians and clearing banks, and the response to these, could have implications for corporates, the buy-side and sell-side alike.
Operational Credit risk Liquidity risks
Exchanges
Clearing houses
CSDs &
custodians
Data, index,
information and
tech providers
Significantly increasing risk Moderately increasing risk
32

March 13, 2016
Wholesale Banks & Asset Managers
M O R G A N S T A N L E Y B L U E P A P E R An extended period of ultra-low interest rates squeezes
further, particularly in Europe. Revenues have been under pressure as net interest margins have fallen, and current macro-economic conditions suggest that a reprieve is unlikely in the near term and the pain may even increase. Hoped-for growth from new services – most notably collateral management – has not lived up to expectations.
We still see an opportunity for the custodians to enter the race for data services by better leveraging their unique and captive access to static data. However, they need to act fast as greater attention is being paid to the next generation of innovators and start-ups, and the core value proposition of custodians as ‘stable and trusted’ institutions is no longer
seen as essential.
More costs will have to be passed on to clients, but the
market does not appreciate how great an impact that
could have, in our view. There is still plenty of scope to rationalise service provision, tackle outdated infrastructure and get to grips with cottage industries such as reporting frameworks. Core to this is pushing clients towards more standardised services; injecting more discipline around pricing; and revenue capture for non-standard services and risks. However, this imposes costs on service users.
Operational deposits are a particular concern. Their impact on liquidity ratios is making them costly for custodians to maintain, and many are seeking to actively reduce them. At a time when many clients are being pushed to hold more cash to weather liquidity risks and volatile markets, this could be a material challenge for the buy-side as the full impact of the lower liquidity percolates through the system.
3.4 Winners and losers
The opportunities are fragmented and disparate, and many initiatives have struggled to gain traction to date. Moreover, the battle for business in areas such as data provision will be fierce. The challenge is to adjust the DNA of the organisation from what used to be a ‘steady flow’ business with recurrent
revenues to a more agile, entrepreneurial model.
We identify four core components to this DNA shift:
Agility and adaptability: Incumbents need to develop aculture that allows initiatives to fail quickly and evolve;they will also have to adopt more of a portfolio approachwith a broader waterfront of opportunities (accepting thatnot all will become standalone profitable). This isfundamentally different to running a ‘core’ annuity type of
business.
Operational track record and network: A track recordin getting initiatives off the ground will be critical togaining momentum. The strength of the network will be areal differentiator in terms of getting sufficient industrytraction and support. Incumbents have an advantage, butpure-play technology providers are rapidly closing thisgap.
Clarification of roles, particularly to foster
cooperation: In many cases, successful developmentand deployment may not be achievable by a single partyin isolation; it will need to find mutually beneficialengagement models that work across incumbent marketinfrastructure providers, dealers, investors and potentiallyfin-tech providers. In that context, it will be critical forplayers to clarify their engagement model with the sell-side early on.
Sales culture: Few market infrastructure players havedeveloped a strong sales culture as their core business isannuity-like in nature. This has led to a lack of acustomer-centric view and focus on customer experience.Many clients also struggle with multiple points of contact,with no clear ownership and a holistic view of clientrelationships. To build traction in a more ‘portfolio-based’
business model, market infrastructure firms will need tobuild stronger sales teams with real industry insights andthe ability to prioritise coverage efforts based on a deeperunderstanding of the respective client wallets and needs.
33
March 13, 2016
Wholesale Banks & Asset Managers
M O R G A N S T A N L E Y B L U E P A P E R Disclosure Section Morgan Stanley & Co. International plc, authorized by the Prudential Regulatory Authority and regulated by the Financial Conduct Authority and the Prudential Regulatory Authority, disseminates in the UK research that it has prepared, and approves solely for the purposes of section 21 of the Financial Services and Markets Act 2000, research which has been prepared by any of its affiliates. As used in this disclosure section, Morgan Stanley includes RMB Morgan Stanley (Proprietary) Limited, Morgan Stanley & Co International plc and its affiliates. For important disclosures, stock price charts and equity rating histories regarding companies that are the subject of this report, please see the Morgan Stanley Research Disclosure Website at www.morganstanley.com/researchdisclosures, or contact your investment representative or Morgan Stanley Research at 1585 Broadway, (Attention: Research Management), New York, NY, 10036 USA. For valuation methodology and risks associated with any price targets referenced in this research report, please contact the Client Support Team as follows: US/Canada +1 800 303-2495; Hong Kong +852 2848-5999; Latin America +1 718 754-5444 (U.S.); London +44 (0)20-7425-8169; Singapore +65 6834-6860; Sydney +61 (0)2-9770-1505; Tokyo +81 (0)3-6836-9000. Alternatively you may contact your investment representative or Morgan Stanley Research at 1585 Broadway, (Attention: Research Management), New York, NY 10036 USA. Analyst Certification The following analysts hereby certify that their views about the companies and their securities discussed in this report are accurately expressed and that they have not received and will not receive direct or indirect compensation in exchange for expressing specific recommendations or views in this report: Hideyasu Ban; Michael J. Cyprys, CFA, CPA; Betsy L. Graseck, CFA; Bruce Hamilton; Anil Sharma, CFA; Andrei Stadnik, FIAA; Vishwanath Tirupattur; Daniel P Toohey; Huw Van Steenis; Richard E Wiles. Unless otherwise stated, the individuals listed on the cover page of this report are research analysts. Global Research Conflict Management Policy Morgan Stanley Research has been published in accordance with our conflict management policy, which is available at www.morganstanley.com/institutional/research/conflictpolicies. Important US Regulatory Disclosures on Subject Companies Morgan Stanley and others associated with it may make markets or specialize in, have positions in and effect transactions in securities of ETFs mentioned and may also perform or seek to perform brokerage and other services for those ETFs and may enter into transactions with them. Morgan Stanley participates in the creation and redemption of the securities covered in this report and as an authorized participant or otherwise, acquires such securities from the issuers for the purpose of resale. MSCI, an affiliate of Morgan Stanley, receives licensing fees from Barclays Global Investors, Vanguard and State Street with respect to a number of ETFs based on MSCI indices. ETFs are redeemable only in Creation Unit size through an Authorized Participant. The equity research analysts or strategists principally responsible for the preparation of Morgan Stanley Research have received compensation based upon various factors, including quality of research, investor client feedback, stock picking, competitive factors, firm revenues and overall investment banking revenues. Morgan Stanley and its affiliates do business that relates to companies/instruments covered in Morgan Stanley Research, including market making, providing liquidity, fund management, commercial banking, extension of credit, investment services and investment banking. Morgan Stanley sells to and buys from customers the securities/instruments of companies covered in Morgan Stanley Research on a principal basis. Morgan Stanley may have a position in the debt of the Company or instruments discussed in this report. Certain disclosures listed above are also for compliance with applicable regulations in non-US jurisdictions. STOCK RATINGS Morgan Stanley uses a relative rating system using terms such as Overweight, Equal-weight, Not-Rated or Underweight (see definitions below). Morgan Stanley does not assign ratings of Buy, Hold or Sell to the stocks we cover. Overweight, Equal-weight, Not-Rated and Underweight are not the equivalent of buy, hold and sell. Investors should carefully read the definitions of all ratings used in Morgan Stanley Research. In addition, since Morgan Stanley Research contains more complete information concerning the analyst's views, investors should carefully read Morgan Stanley Research, in its entirety, and not infer the contents from the rating alone. In any case, ratings (or research) should not be used or relied upon as investment advice. An investor's decision to buy or sell a stock should depend on individual circumstances (such as the investor's existing holdings) and other considerations. Global Stock Ratings Distribution (as of February 29, 2016)
For disclosure purposes only (in accordance with NASD and NYSE requirements), we include the category headings of Buy, Hold, and Sell alongside our ratings of Overweight, Equal-weight, Not-Rated and Underweight. Morgan Stanley does not assign ratings of Buy, Hold or Sell to the stocks we cover. Overweight, Equal-weight, Not-Rated and Underweight are not the equivalent of buy, hold, and sell but represent recommended relative weightings (see definitions below). To satisfy regulatory requirements, we correspond
34
March 13, 2016
Wholesale Banks & Asset Managers
M O R G A N S T A N L E Y B L U E P A P E R Overweight, our most positive stock rating, with a buy recommendation; we correspond Equal-weight and Not-Rated to hold and Underweight to sell recommendations, respectively.
COVERAGE UNIVERSE INVESTMENT BANKING CLIENTS (IBC) STOCK RATING CATEGORY COUNT % OF TOTAL COUNT % OF TOTAL IBC % OF RATING CATEGORY
Overweight/Buy 1,216 36% 320 44% 26% Equal-weight/Hold 1,399 42% 320 44% 23% Not-Rated/Hold 69 2% 3 0% 4% Underweight/Sell 671 20% 89 12% 13% Total 3,355 732
Data include common stock and ADRs currently assigned ratings. Investment Banking Clients are companies from whom Morgan Stanley received investment banking compensation in the last 12 months. Analyst Stock Ratings Overweight (O). The stock's total return is expected to exceed the average total return of the analyst's industry (or industry team's) coverage universe, on a risk-adjusted basis, over the next 12-18 months. Equal-weight (E). The stock's total return is expected to be in line with the average total return of the analyst's industry (or industry team's) coverage universe, on a risk-adjusted basis, over the next 12-18 months. Not-Rated (NR). Currently the analyst does not have adequate conviction about the stock's total return relative to the average total return of the analyst's industry (or industry team's) coverage universe, on a risk-adjusted basis, over the next 12-18 months. Underweight (U). The stock's total return is expected to be below the average total return of the analyst's industry (or industry team's) coverage universe, on a risk-adjusted basis, over the next 12-18 months. Unless otherwise specified, the time frame for price targets included in Morgan Stanley Research is 12 to 18 months.. Analyst Industry Views Attractive (A): The analyst expects the performance of his or her industry coverage universe over the next 12-18 months to be attractive vs. the relevant broad market benchmark, as indicated below. In-Line (I): The analyst expects the performance of his or her industry coverage universe over the next 12-18 months to be in line with the relevant broad market benchmark, as indicated below. Cautious (C): The analyst views the performance of his or her industry coverage universe over the next 12-18 months with caution vs. the relevant broad market benchmark, as indicated below. Benchmarks for each region are as follows: North America - S&P 500; Latin America - relevant MSCI country index or MSCI Latin America Index; Europe - MSCI Europe; Japan - TOPIX; Asia - relevant MSCI country index or MSCI sub-regional index or MSCI AC Asia Pacific ex Japan Index. Important Disclosures for Morgan Stanley Smith Barney LLC Customers Important disclosures regarding the relationship between the companies that are the subject of Morgan Stanley Research and Morgan Stanley Smith Barney LLC or Morgan Stanley or any of their affiliates, are available on the Morgan Stanley Wealth Management disclosure website at www.morganstanley.com/online/researchdisclosures. For Morgan Stanley specific disclosures, you may refer to www.morganstanley.com/researchdisclosures. Each Morgan Stanley Equity Research report is reviewed and approved on behalf of Morgan Stanley Smith Barney LLC. This review and approval is conducted by the same person who reviews the Equity Research report on behalf of Morgan Stanley. This could create a conflict of interest. Other Important Disclosures Morgan Stanley is not acting as a municipal advisor and the opinions or views contained herein are not intended to be, and do not constitute, advice within the meaning of Section 975 of the Dodd-Frank Wall Street Reform and Consumer Protection Act. Morgan Stanley produces an equity research product called a "Tactical Idea." Views contained in a "Tactical Idea" on a particular stock may be contrary to the recommendations or views expressed in research on the same stock. This may be the result of differing time horizons, methodologies, market events, or other factors. For all research available on a particular stock, please contact your sales representative or go to Matrix at http://www.morganstanley.com/matrix. Morgan Stanley Research is provided to our clients through our proprietary research portal on Matrix and also distributed electronically by Morgan Stanley to clients. Certain, but not all, Morgan Stanley Research products are also made available to clients through third-party vendors or redistributed to clients through alternate electronic means as a convenience. For access to all available Morgan Stanley Research, please contact your sales representative or go to Matrix at http://www.morganstanley.com/matrix. Any access and/or use of Morgan Stanley Research is subject to Morgan Stanley's Terms of Use (http://www.morganstanley.com/terms.html). By accessing and/or using Morgan Stanley Research, you are indicating that you have read and agree to be bound by our Terms of Use (http://www.morganstanley.com/terms.html). In addition you consent to Morgan
35
March 13, 2016
Wholesale Banks & Asset Managers
M O R G A N S T A N L E Y B L U E P A P E R Stanley processing your personal data and using cookies in accordance with our Privacy Policy and our Global Cookies Policy (http://www.morganstanley.com/privacy_pledge.html), including for the purposes of setting your preferences and to collect readership data so that we can deliver better and more personalized service and products to you. To find out more information about how Morgan Stanley processes personal data, how we use cookies and how to reject cookies see our Privacy Policy and our Global Cookies Policy (http://www.morganstanley.com/privacy_pledge.html). If you do not agree to our Terms of Use and/or if you do not wish to provide your consent to Morgan Stanley processing your personal data or using cookies please do not access our research. Morgan Stanley Research does not provide individually tailored investment advice. Morgan Stanley Research has been prepared without regard to the circumstances and objectives of those who receive it. Morgan Stanley recommends that investors independently evaluate particular investments and strategies, and encourages investors to seek the advice of a financial adviser. The appropriateness of an investment or strategy will depend on an investor's circumstances and objectives. The securities, instruments, or strategies discussed in Morgan Stanley Research may not be suitable for all investors, and certain investors may not be eligible to purchase or participate in some or all of them. Morgan Stanley Research is not an offer to buy or sell or the solicitation of an offer to buy or sell any security/instrument or to participate in any particular trading strategy. The value of and income from your investments may vary because of changes in interest rates, foreign exchange rates, default rates, prepayment rates, securities/instruments prices, market indexes, operational or financial conditions of companies or other factors. There may be time limitations on the exercise of options or other rights in securities/instruments transactions. Past performance is not necessarily a guide to future performance. Estimates of future performance are based on assumptions that may not be realized. If provided, and unless otherwise stated, the closing price on the cover page is that of the primary exchange for the subject company's securities/instruments. The fixed income research analysts, strategists or economists principally responsible for the preparation of Morgan Stanley Research have received compensation based upon various factors, including quality, accuracy and value of research, firm profitability or revenues (which include fixed income trading and capital markets profitability or revenues), client feedback and competitive factors. Fixed Income Research analysts', strategists' or economists' compensation is not linked to investment banking or capital markets transactions performed by Morgan Stanley or the profitability or revenues of particular trading desks. The "Important US Regulatory Disclosures on Subject Companies" section in Morgan Stanley Research lists all companies mentioned where Morgan Stanley owns 1% or more of a class of common equity securities of the companies. For all other companies mentioned in Morgan Stanley Research, Morgan Stanley may have an investment of less than 1% in securities/instruments or derivatives of securities/instruments of companies and may trade them in ways different from those discussed in Morgan Stanley Research. Employees of Morgan Stanley not involved in the preparation of Morgan Stanley Research may have investments in securities/instruments or derivatives of securities/instruments of companies mentioned and may trade them in ways different from those discussed in Morgan Stanley Research. Derivatives may be issued by Morgan Stanley or associated persons. With the exception of information regarding Morgan Stanley, Morgan Stanley Research is based on public information. Morgan Stanley makes every effort to use reliable, comprehensive information, but we make no representation that it is accurate or complete. We have no obligation to tell you when opinions or information in Morgan Stanley Research change apart from when we intend to discontinue equity research coverage of a subject company. Facts and views presented in Morgan Stanley Research have not been reviewed by, and may not reflect information known to, professionals in other Morgan Stanley business areas, including investment banking personnel. Morgan Stanley Research personnel may participate in company events such as site visits and are generally prohibited from accepting payment by the company of associated expenses unless pre-approved by authorized members of Research management. Morgan Stanley may make investment decisions that are inconsistent with the recommendations or views in this report. To our readers in Taiwan: Information on securities/instruments that trade in Taiwan is distributed by Morgan Stanley Taiwan Limited ("MSTL"). Such information is for your reference only. The reader should independently evaluate the investment risks and is solely responsible for their investment decisions. Morgan Stanley Research may not be distributed to the public media or quoted or used by the public media without the express written consent of Morgan Stanley. Information on securities/instruments that do not trade in Taiwan is for informational purposes only and is not to be construed as a recommendation or a solicitation to trade in such securities/instruments. MSTL may not execute transactions for clients in these securities/instruments. To our readers in Hong Kong: Information is distributed in Hong Kong by and on behalf of, and is attributable to, Morgan Stanley Asia Limited as part of its regulated activities in Hong Kong. If you have any queries concerning Morgan Stanley Research, please contact our Hong Kong sales representatives. Morgan Stanley is not incorporated under PRC law and the research in relation to this report is conducted outside the PRC. Morgan Stanley Research does not constitute an offer to sell or the solicitation of an offer to buy any securities in the PRC. PRC investors shall have the relevant qualifications to invest in such securities and shall be responsible for obtaining all relevant approvals, licenses, verifications and/or registrations from the relevant governmental authorities themselves.
36
March 13, 2016
Wholesale Banks & Asset Managers
M O R G A N S T A N L E Y B L U E P A P E R Morgan Stanley Research is disseminated in Brazil by Morgan Stanley C.T.V.M. S.A.; in Mexico by Morgan Stanley México, Casa de Bolsa, S.A. de C.V which is regulated by Comision Nacional Bancaria y de Valores. Paseo de los Tamarindos 90, Torre 1, Col. Bosques de las Lomas Floor 29, 05120 Mexico City; in Japan by Morgan Stanley MUFG Securities Co., Ltd. and, for Commodities related research reports only, Morgan Stanley Capital Group Japan Co., Ltd; in Hong Kong by Morgan Stanley Asia Limited (which accepts responsibility for its contents) and by Bank Morgan Stanley AG, Hong Kong Branch; in Singapore by Morgan Stanley Asia (Singapore) Pte. (Registration number 199206298Z) and/or Morgan Stanley Asia (Singapore) Securities Pte Ltd (Registration number 200008434H), regulated by the Monetary Authority of Singapore (which accepts legal responsibility for its contents and should be contacted with respect to any matters arising from, or in connection with, Morgan Stanley Research) and by Bank Morgan Stanley AG, Singapore Branch (Registration number T11FC0207F); in Australia to "wholesale clients" within the meaning of the Australian Corporations Act by Morgan Stanley Australia Limited A.B.N. 67 003 734 576, holder of Australian financial services license No. 233742, which accepts responsibility for its contents; in Australia to "wholesale clients" and "retail clients" within the meaning of the Australian Corporations Act by Morgan Stanley Wealth Management Australia Pty Ltd (A.B.N. 19 009 145 555, holder of Australian financial services license No. 240813, which accepts responsibility for its contents; in Korea by Morgan Stanley & Co International plc, Seoul Branch; in India by Morgan Stanley India Company Private Limited; in Indonesia by PT Morgan Stanley Asia Indonesia; in Canada by Morgan Stanley Canada Limited, which has approved of and takes responsibility for its contents in Canada; in Germany by Morgan Stanley Bank AG, Frankfurt am Main and Morgan Stanley Private Wealth Management Limited, Niederlassung Deutschland, regulated by Bundesanstalt fuer Finanzdienstleistungsaufsicht (BaFin); in Spain by Morgan Stanley, S.V., S.A., a Morgan Stanley group company, which is supervised by the Spanish Securities Markets Commission (CNMV) and states that Morgan Stanley Research has been written and distributed in accordance with the rules of conduct applicable to financial research as established under Spanish regulations; in the US by Morgan Stanley & Co. LLC, which accepts responsibility for its contents. Morgan Stanley & Co. International plc, authorized by the Prudential Regulatory Authority and regulated by the Financial Conduct Authority and the Prudential Regulatory Authority, disseminates in the UK research that it has prepared, and approves solely for the purposes of section 21 of the Financial Services and Markets Act 2000, research which has been prepared by any of its affiliates. RMB Morgan Stanley (Proprietary) Limited is a member of the JSE Limited and regulated by the Financial Services Board in South Africa. RMB Morgan Stanley (Proprietary) Limited is a joint venture owned equally by Morgan Stanley International Holdings Inc. and RMB Investment Advisory (Proprietary) Limited, which is wholly owned by FirstRand Limited. The information in Morgan Stanley Research is being disseminated by Morgan Stanley Saudi Arabia, regulated by the Capital Market Authority in the Kingdom of Saudi Arabia, and is directed at Sophisticated investors only. The information in Morgan Stanley Research is being communicated by Morgan Stanley & Co. International plc (DIFC Branch), regulated by the Dubai Financial Services Authority (the DFSA), and is directed at Professional Clients only, as defined by the DFSA. The financial products or financial services to which this research relates will only be made available to a customer who we are satisfied meets the regulatory criteria to be a Professional Client. The information in Morgan Stanley Research is being communicated by Morgan Stanley & Co. International plc (QFC Branch), regulated by the Qatar Financial Centre Regulatory Authority (the QFCRA), and is directed at business customers and market counterparties only and is not intended for Retail Customers as defined by the QFCRA. As required by the Capital Markets Board of Turkey, investment information, comments and recommendations stated here, are not within the scope of investment advisory activity. Investment advisory service is provided exclusively to persons based on their risk and income preferences by the authorized firms. Comments and recommendations stated here are general in nature. These opinions may not fit to your financial status, risk and return preferences. For this reason, to make an investment decision by relying solely to this information stated here may not bring about outcomes that fit your expectations. The trademarks and service marks contained in Morgan Stanley Research are the property of their respective owners. Third-party data providers make no warranties or representations relating to the accuracy, completeness, or timeliness of the data they provide and shall not have liability for any damages relating to such data. The Global Industry Classification Standard (GICS) was developed by and is the exclusive property of MSCI and S&P. Morgan Stanley Research, or any portion thereof may not be reprinted, sold or redistributed without the written consent of Morgan Stanley.
Other Important Disclosures from Oliver Wyman Copyright © 2016 Oliver Wyman. All rights reserved. This report may not be reproduced or redistributed, in whole or in part, without the written permission of Oliver Wyman and Oliver Wyman accepts no liability whatsoever for the actions of third parties in this respect. This report is not a substitute for tailored professional advice on how a specific financial institution should execute its strategy. This report is not investment advice and should not be relied on for such advice or as a substitute for consultation with professional accountants, tax, legal or financial advisers. Oliver Wyman has made every effort to use reliable, up-to-date and comprehensive information and analysis, but all information is provided without warranty of any kind, express or implied. Oliver Wyman disclaims
37

March 13, 2016
Wholesale Banks & Asset Managers
M O R G A N S T A N L E Y B L U E P A P E R any responsibility to update the information or conclusions in this report. Oliver Wyman accepts no liability for any loss arising from any action taken or refrained from as a result of information contained in this report or any reports or sources of information referred to herein, or for any consequential, special or similar damages even if advised of the possibility of such damages. This report may not be sold without the written consent of Oliver Wyman. The Oliver Wyman employees that contributed to this report are neither FCA nor FINRA registered. Oliver Wyman is not authorised or regulated by the Financial Conduct Authority or the Prudential Regulatory Authority. As a consultancy firm it may have business relationships with companies mentioned in this report and as such may receive fees for executing this business. Please refer to www.oliverwyman.com for further details.
38
The Americas 1585 Broadway New York, NY 10036-8293 United States Tel: +1 (1)212 761 4000
Europe 20 Bank Street, Canary Wharf London E14 4AD United Kingdom Tel: +44 (0)20 7425 8000
Japan 1-9-7 Otemachi, Chiyoda-ku Tokyo 100-8104 Japan Tel: +81 (0) 3 6836 5000
Asia/Pacific 1 Austin Road West Kowloon Hong Kong Tel: +852 2848 5200
EMEA
55 Baker Street London W1U 8EW United Kingdom Tel: +44 20 7333 8333 [email protected]
Americas 1166 Avenue of the Americas 29th Floor New York, NY 10036 United States Tel: +1 212 541 8100 [email protected]
Asia Pacific
8 Cross Street, #24-01 048424 Singapore Tel: +65 6510 9700 [email protected]
© 2016 Morgan Stanley and Oliver Wyman
39