Embed Size (px)
Citation preview
Why are Women Underrepresented in Elite Collegesand Universities? A Non-Linear Decomposition Analysis
Rob Bielby • Julie Renee Posselt • Ozan Jaquette • Michael N. Bastedo
Received: 7 October 2012� Springer Science+Business Media New York 2014
Abstract The emerging female advantage in education has received considerable attention
in the popular media and recent research. We examine a persistent exception to this trend:
women’s underrepresentation in America’s most competitive colleges and universities.
Using nationally generalizable data spanning four decades, we evaluate evidence for three
possible explanations. First, we analyze whether men’s academic profiles more closely match
the admissions preferences of elite institutions. Next, we consider organizational preferences
for male applicants. Finally, we test whether women self-select out of elite institutions
through their application choices. Using Blinder–Oaxaca non-linear decomposition tech-
niques and multinomial logistic regression, we find that men’s advantage in standardized test
scores best explains the enrollment gap. Our analyses thus suggest that the gender enrollment
gap in elite colleges and universities is a matter of access, not student choice. We discuss the
implications of these results for educational equity and college admissions.
Keywords Enrollment � Gender � Non-linear decomposition � Longitudinal
data � Stratification � Elite institutions
Introduction
In most sectors of American education, the gender gap means something different now than it
did forty years ago. Girls now outscore boys on standardized tests in elementary school, earn
R. Bielby (&)Center for the Study of Higher and Postsecondary Education, University of Michigan, 610 E.University Ave. SEB Room 2117, Ann Arbor, MI 48109, USAe-mail: [email protected]
J. R. Posselt � M. N. BastedoUniversity of Michigan, Ann Arbor, MI, USA
O. JaquetteUniversity of Arizona, Tucson, AZ, USA
123
Res High EducDOI 10.1007/s11162-014-9334-y
higher grades in high school, and enroll in and complete postsecondary degrees at higher rates
than men (Buchmann and DiPrete 2006; Cho 2007; Duckworth and Seligman 2006; Goldin
et al. 2006; Mickelson and Smith 1998; Sax 2008). Female representation in postsecondary
education has been skyrocketing since 1972. Women reached parity in college completion as
early as 1982 and, in 2007, completed 58 % of the baccalaureate degrees awarded nationally
(Snyder and Dillow 2011). However, enrollment in America’s most competitive higher
education institutions has thus far eluded this wave of gender democratization, with men
maintaining an enrollment advantage through the high school class of 2004. In this paper, our
objective is to examine three possible explanations for this seemingly ‘‘durable inequality’’
(Tilly 1999), which is an important exception to the emerging female advantage in education.
Women’s underrepresentation in elite institutions has important post-baccalaureate
implications that help motivate our inquiry. A small proportion of society gains access to
elite institutions, but as the labor market is increasingly saturated with bachelor’s degree
holders, institutional prestige has strengthened as a predictor of post-baccalaureate
opportunities (Bowman and Bastedo 2009; Frank and Cook 1995). Earning one’s bache-
lor’s degree from a selective institution is one of the strongest predictors of graduate school
admission (Attiyeh and Attiyeh 1997). Students with degrees from prestigious institutions
also have higher earnings, deeper professional networks, and are disproportionately rep-
resented in the upper echelons of corporate management (Bills 2003; Brewer et al. 1999;
Kerckhoff et al. 2001; Monks 2000). Equitable access to the most competitive institutions
thus conditions access to the top strata of America’s educational and labor market
opportunity structures.
Through a review of the literature and a conceptual framework focused on student-insti-
tution matching, we developed three hypotheses to explain the gender enrollment gap in most-
competitive institutions: (a) gender disparities in measures of academic achievement valued by
admissions offices; (b) admissions preferences for men; and (c) ‘‘undermatching’’ by qualified
female applicants, particularly in STEM fields. Prior research has tested these hypotheses in
isolation, and analyses have been based on single cross-sections of data from specific campuses.
Drawing upon a conceptual framework that explains the growth in matching between
students and institutions, we find that gender disparities in standardized testing are a
stronger explanation for female underrepresentation at elite colleges than undermatching or
admissions preferences for men. We test our hypotheses using nationally representative
student-level data from the high school senior classes of 1972, 1982, 1992, and 2004. Our
goal is to engage two tasks of critical quantitative research (Stage 2007): (a) using large-
scale data to reveal educational inequalities and the processes by which institutions per-
petuate them and (b) challenging conventional models and analyses to improve under-
standing of underrepresented groups’ (in this analysis, women’s) educational opportunities
and experiences. After testing hypotheses about both application and admission to selective
institutions, we find that it is institutional admissions priorities that impede women’s equal
enrollment. As such, we reveal a blind spot in arguments that structural obstacles to
education for women are a problem of the past.
Literature Review
Achievement Disparities and College Admissions
Prior research suggests women’s underrepresentation in elite institutions may be caused by
gender disparities in pre-collegiate academic achievement, gender disparities in student
Res High Educ
123
application patterns, and/or gender disparities in institutional preferences. Pre-collegiate
academic achievement is positively associated with college enrollment, the selectivity of
institution attended, and college completion (e.g., Bastedo and Jaquette 2011; Buchmann and
DiPrete 2006; Cho 2007; Hearn 1991; Posselt et al. 2012). Interestingly, gender disparities in
pre-collegiate academic achievement may contribute to both women’s enrollment advantage
in some institutional types and their persistent disadvantage in the most competitive ones.
Goldin et al. (2006), for example, found that women catching up and surpassing men in high
school grades and courses taken explained the growing female advantage in college enroll-
ment and completion since 1970. However, men continue to have higher average SAT math
scores than women, and comprised 62.75 % of SAT math scores in the 700–800 range in 2012
(College Board 2012). Alon (2009) showed that the effect of SAT/ACT scores on admissions
decisions at selective colleges has increased over time. However, prior research has not
examined whether male advantage in the upper distribution of college entrance exams
explains the male enrollment advantage in selective institutions.
Only Persell et al. (1992) have examined whether the effect of pre-collegiate academic
achievement on a student’s college selectivity differs by gender. Using data from the high
school senior class of 1982, they found that the effects of high school grades, advanced
course taking, and homework time on postsecondary enrollment selectivity were each
stronger for men than women. However, because their study modeled only postsecondary
enrollment, not application decisions, it is unclear whether these findings were due to
qualified women not applying to selective colleges or selective colleges rejecting qualified
women. This limitation implies two alternative explanations for the male enrollment
advantage in most-competitive institutions: women may be applying to most-competitive
institutions at a lower rate than men; or most-competitive admissions offices may have
preferences for male applicants, even after controlling for pre-collegiate academic
preparation.
Gender Disparities in Who Applies to Selective Colleges
Other researchers have considered whether gender disparities in the application pool may
help explain women’s underrepresentation in the most competitive colleges. Even after
controlling for prior academic achievement, non-academic factors such as gender, parental
education and income, race, geographic proximity, and athletics participation, all shape
students’ likelihood of applying to selective institutions (e.g., Griffith and Rothstein 2009;
Klasik 2013). Using data from the high school senior class of 2004, An (2010) found that
parental education (i.e., BA or higher) and being Black, Latino, or Asian (as opposed to being
White) were positively associated with applying to a selective institution, controlling for prior
academic achievement. However, women had a significantly lower probability of application
than men (An 2010). This finding is consistent with research on access to historically male-
dominated fields, including STEM majors and careers, which has found that women pursue
these fields at lower rates than men (e.g., Espinosa 2011; Riegle-Crumb and King 2010).
Gender-Sensitive Admissions
An’s (2010) findings about a male advantage in selective college application differ from
popular media reports and two small-scale studies that indicate applicant pools in selective
colleges and universities are increasingly female-dominated. These studies suggest gender
imbalance in the pool lead admissions offices to practice gender-sensitive admissions
favoring males, or what some have described as ‘‘male affirmative action’’ (Baum and
Res High Educ
123
Goodstein 2005; Conger and Dickson 2011; Lewin 2006; Whitmire 2009). Baum and
Goodstein (2005) analyses of 13 liberal arts colleges found that male applicants have a
higher probability of enrollment than women when an applicant pool is more than 53 %
female, suggesting admissions offices soften their standards for male academic achieve-
ment to avoid a female-dominated student body. Conger and Dickson (2011) focused on
Texas colleges and universities, finding that when a higher proportion of women are
admitted under the state’s Top 10 % Plan, men who are not automatically admitted under
the policy have a higher probability of admission than women with similar academic
profiles. This finding could not be tested on a national scale because it is based on a specific
state policy. However, it corroborates Baum and Goodstein (2005) finding that gender-
sensitive admissions occurs in some institutional contexts, and that it relates directly to the
ratio of qualified men and women in the applicant pool.
To summarize, research to date implies that female underrepresentation in most-com-
petitive institutions may be caused by earlier gender disparities in (a) pre-college academic
achievement, (b) the applicant pool, and/or (c) through gender-sensitive admissions that
favors men. However, few of these studies employ a nationally-representative sample and/
or consider trends across time, producing some apparently contradictory findings. More-
over, prior research has not used a competing hypotheses framework to test the efficacy of
alternative explanations. Our comprehensive analysis may yield clarity by considering the
evidence for multiple explanations, and by considering enrollment patterns across multiple
cohorts of a nationally-generalizable sample. The conceptual framework we describe in the
following section motivates three plausible hypotheses.
Conceptual Framework and Hypotheses
Under a broad conceptualization of college enrollment as the result of a matching process
between the student and institution, this section develops propositions and hypotheses to
test plausible explanations for the gender gap in most-competitive institutions. Specifically,
we argue that high-achieving students are matched to elite institutions because high-
achieving students want to enroll in the most elite institutions and the most elite institutions
want to enroll the most high-achieving students.
Proposition 1: Elite Colleges and Universities Value Observable Admissions Criteria
That Privilege Men
Hoxby (2009) provides an historical analysis of the emergence of matching between student
and institutional characteristics. The American higher education system began as a collection
of local autarkies; college recruited locally and most students attended the ‘‘college down the
road.’’ A nationally-integrated higher education market developed with declines in trans-
portation and information costs. For students considering colleges, the emergence of college
guidebooks (e.g., Barron’s Profiles of American Colleges) allowed prospective students to
compare the quality of geographically distant colleges, and declining airfare prices decreased
the costs of attending schools far from home. Meanwhile, for colleges considering students,
growth of standardized college entrance exams (i.e., SAT, ACT) appeared to increase the
quality of information about students because colleges could compare geographically distant
applicants, whose high school curricula were incommensurable. Entrance exams also
decreased the cost of acquiring information about applicants because colleges could quickly
compare applicants on the basis of a single test score, instead of reading time-consuming
Res High Educ
123
application essays. The cumulative effect of declining transportation costs and increased
information about student quality and institution quality was that students with the highest
academic profile increasingly matched to institutions with the highest academic profile
regardless of geographic proximity (Hoxby 2009).
Winston’s (1999) conceptual model provides additional insights about the relationship
between selectivity and rankings systems in determining how students are matched to
institutions. Winston (1999) described higher education as an industry in which the reputation
of producers (i.e., universities) vis-a-vis potential customers (i.e., applicants) depends largely
on the characteristics of their current customers (i.e., enrolled students). Therefore, univer-
sities have an incentive to be selective about who is allowed to be a customer, becoming elite
by enrolling students with the highest pre-collegiate academic achievement.
In turn, ranking systems, especially US News and World Report (USNWR), influence
which pre-collegiate academic characteristics institutions use to appraise prospective
students and which characteristics prospective students use to appraise institutions. In
2010, ‘‘student selectivity’’ represented 15 % of the overall USNWR academic quality
score, and SAT/ACT scores represented 50 % of the student selectivity score (USNWR
2010). Moving up in USNWR rankings results in somewhat more applications, higher
yield rates, and an increase in mean freshman SAT/ACT scores (Alter and Reback 2014;
Bowman and Bastedo 2009). Even stronger than the small increases in these indicators is
the perception among administrators that rankings are crucial (Espeland and Sauder 2007).
Therefore, it should come as no surprise that the increasing influence of SAT/ACT scores
on admissions decisions at selective institutions would coincide with the growing influence
of USNWR rankings in the public imagination.
The preceding conceptual argument suggests that institutional efforts to match on pre-
collegiate academic achievement measures—in particular SAT/ACT scores—could
explain men’s consistent enrollment advantage in elite institutions, if men perform better
than women on these criteria. Data from the College Board indicates that men’s significant
advantage in SAT math scores explains their persistent advantage in combined SAT math
and reading test scores. Men’s mean scores have been higher by 30–35 points every single
year since 1972, and women earned only 37.25 % of the SAT math scores in the 700–800
point range (College Board 2012). Men outnumbered women in every ten-point increment
above a score of 570 on the math portion of the SAT and, at the top of the distribution,
there were two boys for every one girl with a perfect or near perfect score.
However, national evidence suggests that women outperform men in other measures of
pre-collegiate academic achievement. Cho (2007) found that women’s advantage in overall
college enrollment emerged over the last 30 years due to their larger increases in high school
performance. Girls were overrepresented in AP/Honors math, science and English courses
(54, 55, and 61 % respectively), and comprised 55 % of the students in the top 10 % of their
high school classes (College Board 2012). However, the criteria on which women have had an
advantage—high school GPA, most importantly—seemed to have a weaker influence on the
odds of selective college enrollment than did test scores, on which men have had an advantage
since the 1960s (Hedges and Nowell 1995). Persell et al. (1992) thus proposed, ‘‘the pathways
to selective colleges are not gender neutral’’ (p. 219). Given these performance statistics and
the importance of high SAT scores to elite college admission, we hypothesize:
H1a Men’s enrollment advantage in most-competitive institutions is explained by men’s
stronger performance in admissions criteria that such institutions value.
H1b In particular, men’s enrollment advantage in most-competitive institutions is
explained by men’s higher SAT/ACT scores.
Res High Educ
123
Proposition 2: Organizational Preferences for Men are Embedded in the Admissions
Process
Admissions offices may also have explicit preferences for male applicants. This idea draws
from two literatures. First, recent research on selective admissions portrays admissions
offices crafting their classes of incoming students on the basis of both institution-level and
individual-level characteristics (Stevens 2007). For example, in addition to valuing
applicants who strengthen the institution’s academic profile or who are likely to aca-
demically succeed, selective institutions also value applicants whose enrollment supports
such organizational goals as diversity and financial viability (Bastedo 2014; Grodsky 2007;
Karabel 2005). Colleges and universities thus weigh the demographic composition of their
incoming cohort.
As discussed in the literature review, Baum and Goodstein (2005) proposed that what
looks like preferences for men begins with assessments of the applicant pool. Once an
applicant pool was more than 53 % female, decision makers appeared to evaluate men and
women differently to prevent a female advantage in the enrolled cohort. As a result, in
applicant pools where women predominated, men with lower levels of academic performance
nonetheless had higher predicted probabilities of admission than women (Baum and Good-
stein 2005). Paradoxically, they concluded, efforts to maintain gender balance can perpetuate
a male advantage as enrollment managers overcompensate for imbalance in the pool.
Second, we should not overlook the possibility of overt discrimination against women
and/or traditionally female qualities in elite institutions, whose culture still reflects the
effects of being historically male. Although women have made important gains in edu-
cation, sexual discrimination still exists in the workforce and in evaluation for other elite
educational and professional opportunities (Gaucher et al. 2011; Madera et al. 2009;
Rudman et al. 2012); therefore, it is not unreasonable to suggest that sexual discrimination
may affect the admissions process at elite institutions.
An important scholarly literature has investigated the extent to which wage differences
between men and women and between underrepresented minorities and Whites are due to
discrimination or due to differences in human capital accumulation (e.g., education,
occupation choice, years of experience) (e.g., Blau and Kahn 2006; Blinder 1973; Oaxaca
1973). In particular, Blinder and Oaxaca’s individual and collective work argues that the
proportion of a gender gap that cannot be explained by observable factors are due to
discrimination. Applying this logic to the current research, if the male enrollment
advantage in most-competitive admissions cannot be explained by male performance in
academic admissions criteria or by males being more likely to apply to most-competitive
institutions, then the explanation that remains is that most-competitive institutions practice
gender-sensitive admissions practices that favor men.
H2 The gender gap in the most competitive institutions is not fully explained by
observable differences between men and women, suggesting institutions are employing
gender-sensitive admissions practices that favor men.
Proposition 3: Women Apply to the Most Competitive Institutions at Lower Rates Than
Men
Finally, another plausible explanation for the male enrollment advantage in most-com-
petitive institutions, which also builds on the idea of matching, stresses student preferences
for institutions rather than institutional preferences for students. According to this
Res High Educ
123
explanation, the male enrollment advantage in most-competitive institutions is not due to
fewer women meeting the academic achievement criteria required by most-competitive
institutions. Rather, women meet the academic achievement criteria required by most-
competitive institutions, but are less likely to apply to most-competitive institutions than
men meeting these criteria. This idea suggests that women are more likely than men to
‘‘under-match’’—that is, to apply to and enroll in less selective institutions than their
academic profiles merit (Bastedo and Flaster 2014).
One reason women may be deterred from most-competitive institutions is perceptions of
the climate and/or culture. Hall and Sandler (1984) introduced findings about a ‘‘chilly
climate’’ for women in postsecondary STEM courses, and extended their analyses to
consider other aspects of elite campus environments. Deterrence from historically male
educational and professional contexts is a process that begins before students enroll in
college, however. For example, while earning comparable scores in eighth and tenth grade,
many women lose confidence in their abilities and interest in math (Barnett 2004; Cat-
sambis 1994). Regardless of their ability, women also may perceive the sex ratio in college
majors and professions as indicative of the gender representation of the skills germane for
success (Correll 2001). Internalizing performance expectations that men are innately more
capable in fields with low female representation, women are less likely to form career
aspirations in them (Correll 2004).
Indeed, internationally, women have been most underrepresented in traditionally male
fields like engineering and agriculture since 1965, and most overrepresented in tradition-
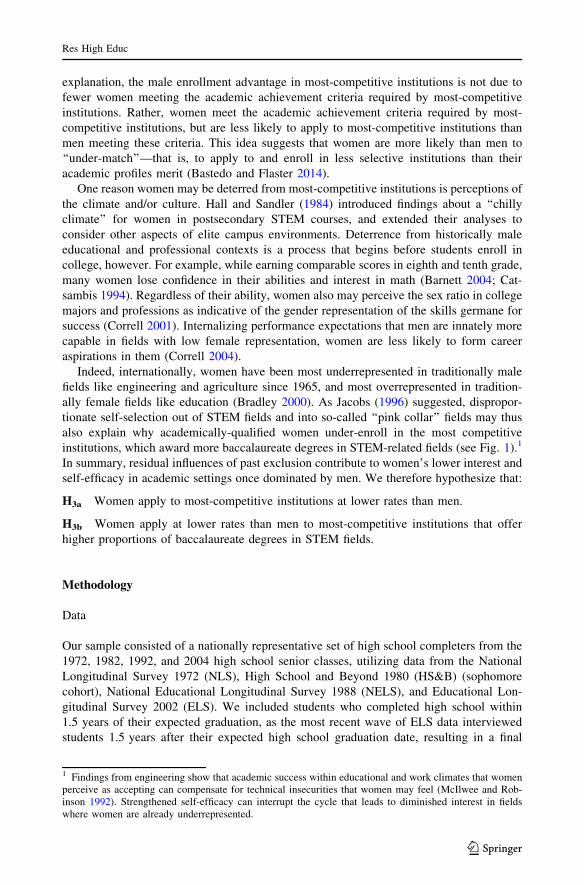
ally female fields like education (Bradley 2000). As Jacobs (1996) suggested, dispropor-
tionate self-selection out of STEM fields and into so-called ‘‘pink collar’’ fields may thus
also explain why academically-qualified women under-enroll in the most competitive
institutions, which award more baccalaureate degrees in STEM-related fields (see Fig. 1).1
In summary, residual influences of past exclusion contribute to women’s lower interest and
self-efficacy in academic settings once dominated by men. We therefore hypothesize that:
H3a Women apply to most-competitive institutions at lower rates than men.
H3b Women apply at lower rates than men to most-competitive institutions that offer
higher proportions of baccalaureate degrees in STEM fields.
Methodology
Data
Our sample consisted of a nationally representative set of high school completers from the
1972, 1982, 1992, and 2004 high school senior classes, utilizing data from the National
Longitudinal Survey 1972 (NLS), High School and Beyond 1980 (HS&B) (sophomore
cohort), National Educational Longitudinal Survey 1988 (NELS), and Educational Lon-
gitudinal Survey 2002 (ELS). We included students who completed high school within
1.5 years of their expected graduation, as the most recent wave of ELS data interviewed
students 1.5 years after their expected high school graduation date, resulting in a final
1 Findings from engineering show that academic success within educational and work climates that womenperceive as accepting can compensate for technical insecurities that women may feel (McIlwee and Rob-inson 1992). Strengthened self-efficacy can interrupt the cycle that leads to diminished interest in fieldswhere women are already underrepresented.
Res High Educ
123
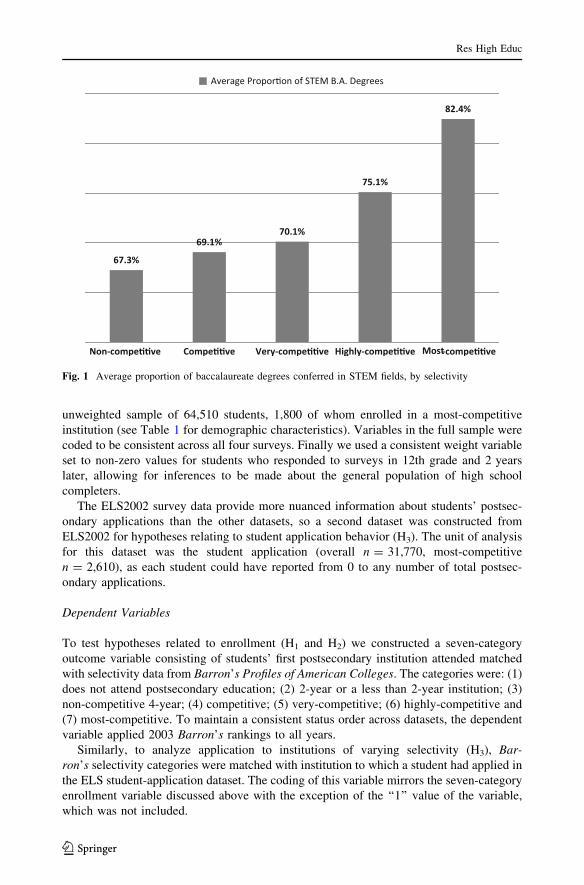
unweighted sample of 64,510 students, 1,800 of whom enrolled in a most-competitive
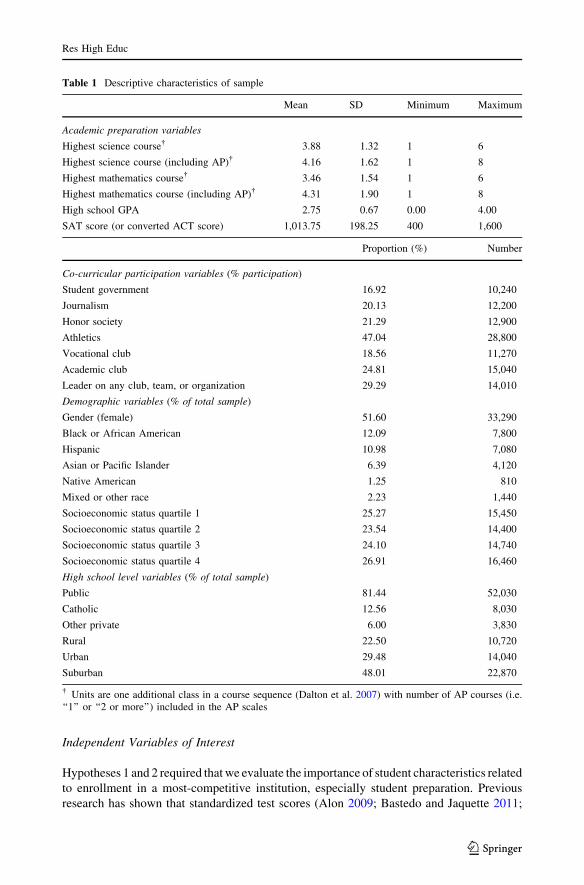
institution (see Table 1 for demographic characteristics). Variables in the full sample were
coded to be consistent across all four surveys. Finally we used a consistent weight variable
set to non-zero values for students who responded to surveys in 12th grade and 2 years
later, allowing for inferences to be made about the general population of high school
completers.
The ELS2002 survey data provide more nuanced information about students’ postsec-
ondary applications than the other datasets, so a second dataset was constructed from
ELS2002 for hypotheses relating to student application behavior (H3). The unit of analysis
for this dataset was the student application (overall n = 31,770, most-competitive
n = 2,610), as each student could have reported from 0 to any number of total postsec-
ondary applications.
Dependent Variables
To test hypotheses related to enrollment (H1 and H2) we constructed a seven-category
outcome variable consisting of students’ first postsecondary institution attended matched
with selectivity data from Barron’s Profiles of American Colleges. The categories were: (1)
does not attend postsecondary education; (2) 2-year or a less than 2-year institution; (3)
non-competitive 4-year; (4) competitive; (5) very-competitive; (6) highly-competitive and
(7) most-competitive. To maintain a consistent status order across datasets, the dependent
variable applied 2003 Barron’s rankings to all years.
Similarly, to analyze application to institutions of varying selectivity (H3), Bar-
ron’s selectivity categories were matched with institution to which a student had applied in
the ELS student-application dataset. The coding of this variable mirrors the seven-category
enrollment variable discussed above with the exception of the ‘‘1’’ value of the variable,
which was not included.
Fig. 1 Average proportion of baccalaureate degrees conferred in STEM fields, by selectivity
Res High Educ
123
Independent Variables of Interest
Hypotheses 1 and 2 required that we evaluate the importance of student characteristics related
to enrollment in a most-competitive institution, especially student preparation. Previous
research has shown that standardized test scores (Alon 2009; Bastedo and Jaquette 2011;
Table 1 Descriptive characteristics of sample
Mean SD Minimum Maximum
Academic preparation variables
Highest science course� 3.88 1.32 1 6
Highest science course (including AP)� 4.16 1.62 1 8
Highest mathematics course� 3.46 1.54 1 6
Highest mathematics course (including AP)� 4.31 1.90 1 8
High school GPA 2.75 0.67 0.00 4.00
SAT score (or converted ACT score) 1,013.75 198.25 400 1,600
Proportion (%) Number
Co-curricular participation variables (% participation)
Student government 16.92 10,240
Journalism 20.13 12,200
Honor society 21.29 12,900
Athletics 47.04 28,800
Vocational club 18.56 11,270
Academic club 24.81 15,040
Leader on any club, team, or organization 29.29 14,010
Demographic variables (% of total sample)
Gender (female) 51.60 33,290
Black or African American 12.09 7,800
Hispanic 10.98 7,080
Asian or Pacific Islander 6.39 4,120
Native American 1.25 810
Mixed or other race 2.23 1,440
Socioeconomic status quartile 1 25.27 15,450
Socioeconomic status quartile 2 23.54 14,400
Socioeconomic status quartile 3 24.10 14,740
Socioeconomic status quartile 4 26.91 16,460
High school level variables (% of total sample)
Public 81.44 52,030
Catholic 12.56 8,030
Other private 6.00 3,830
Rural 22.50 10,720
Urban 29.48 14,040
Suburban 48.01 22,870
� Units are one additional class in a course sequence (Dalton et al. 2007) with number of AP courses (i.e.‘‘1’’ or ‘‘2 or more’’) included in the AP scales
Res High Educ
123
Posselt et al. 2012), high school GPA, and high school course-taking (Hawkings and Lautz
2005) all play a role in determining postsecondary admissions and enrollment. Therefore, we
developed a set of pre-collegiate academic preparation variables that included SAT/ACT
score, high school GPA, highest math course passed, and highest science course passed.
We constructed the SAT/ACT score variable by (1) determining composite SAT and
ACT scores, (2) re-centering ACT test scores for HS&B and SAT scores for HS&B and
NELS to reflect modifications to the ACT in 1989 and the SAT in 1995, (3) converting
ACT scores to SAT scores with standardized concordance tables, and (4) selecting the
higher composite score if students took both the SAT and the ACT. Of the students who
indicated taking the SAT and/or ACT, test scores were missing for 3.3 % in NLS, 38.7 %
in HS&B, 23.9 % in NELS, and 10 % in ELS. We imputed missing SAT/ACT test scores
for students who indicate taking the SAT/ACT, using the average of the math and reading
components from the standardized senior year test taken by all NCES survey respondents
[See Posselt et al. (2012) for further detail on imputations].
The variables we created for high school GPA, highest math course passed, and highest
science course passed utilized raw, course-level high school transcript data not available
for NLS. Given the centrality of academic preparation to our research questions, we
therefore developed two sets of multivariate models, one including only those variables
available in the 1972 cohort and one including all variables of interest.
Math and science course-taking were defined using measures developed by Burkam
et al. (2003) and used by Dalton et al. (2007). Highest math course taken was defined as
follows: 1 = No math or ‘‘low’’ math; 2 = Algebra 1 or plane geometry; 3 = Algebra 2;
4 = Algebra 3, trigonometry, or analytic geometry; 5 = Pre-calculus; and 6 = Calculus.
Highest science course taken is defined as follows: 1 = No science or ‘‘low’’ science;
2 = Basic biology or secondary physical science; 3 = General biology; 4 = Chemistry 1
or Physics 1; 5 = Chemistry 1 and Physics 1; 6 = Chemistry 2, Physics 2, or advanced
biology. Additional course-taking variables were created including AP courses for the
1992 and 2004 cohorts, where data on AP course-taking was available. Highest math
course taken, including AP, was extended to include the code 7 = AP Calculus. Highest
science course taken, including AP, added the following codes: 7 = 1 AP science course,
8 = 2 AP science courses, 9 = 3 or more AP science courses.
To examine the role of extracurricular involvement and leadership (Gabler and Kauf-
man 2006), models also included self-reported measures of participation in key extra-
curricular activities (student government, honors society, athletics, vocational club,
academic club). For NLS, NELS, and ELS, a self-reported, dichotomous variable of
whether the student had been a leader in any extracurricular activities was also available
and included in the models.
For the analyses of ELS data pertaining to gendered selection into most-competitive
institutions by program offerings (H3b), we created variables using the Integrated Post-
secondary Education Data System. For this portion of the analysis, we focused specifically
on STEM concentration at most competitive institutions, as previous research has shown
that women are less likely to pursue STEM programs than men (Espinosa 2011; Riegle-
Crumb and King 2010). The institutional program offering variables assessed the pro-
portion of baccalaureate degrees conferred at most-competitive institutions in a STEM
field. First, STEM fields were defined according to the list maintained by the Department
of Homeland Security, last updated in 2012 (Department of Homeland Security 2013).
Then, the number of STEM baccalaureate degrees conferred by each institution in 2003
was divided by the total number of baccalaureate degrees conferred. Finally, most-com-
petitive institutions were separated into three equally-sized groups based on the proportion
Res High Educ
123
of STEM degrees conferred: Low STEM, Moderate STEM, and High STEM. If women
were enrolling in most-competitive institutions at lower rates than males due to the dis-
proportionate concentration of STEM programs at such institutions (H3b), then it would
also be expected that women would apply at lower rates to High STEM institutions than
Low STEM institutions when they did apply to most-competitive institutions.
Covariates
In order for the unexplained component of a decomposition analysis to relate to dis-
crimination (H2), the model must be well specified (i.e., composed of independent vari-
ables of importance and also an appropriate set of controls). Demographic, socioeconomic,
and academic preparation covariates were included in all multivariate analyses as controls,
as enrollment in most-competitive institutions was understood to vary across each of these
variables. Race was coded using dichotomous variables for Black or African American,
Hispanic, Asian or Pacific Islander, Native American, and Mixed or Other race, using
White as the excluded reference group. Socioeconomic status was divided into even
quartiles for each cohort and coded as dichotomous variables, using the lowest quartile for
each cohort as the excluded comparison group. Dummy variables for Catholic private high
school of origin and other private high school of origin were included, leaving public high
schools as the reference group. Finally, dummy variables for urban and rural high schools
were included, leaving suburban high schools as the comparison group. Table 1 shows a
complete list of covariates and descriptive statistics relating to those variables.
Methodology
Decomposition Analysis
We examined the enrollment gap between men and women across all four cohorts using
non-linear decomposition techniques based upon those developed by Blinder (1973) and
Oaxaca (1973). Like Blinder–Oaxaca decomposition, differences in the probability of
enrollment were decomposed into explained variation (i.e., differences due to covariate
values) and unexplained variation (i.e., differences in predicted enrollment when covariate
values are assumed equal across gender). Explained variation simply related differences in
student profiles (e.g. academic preparation, background characteristics, etc.) to the selec-
tivity of institution in which they enrolled (H1a). In well-specified models, Blinder (1973)
and Oaxaca (1973) argued unexplained variation is due to discrimination (H2), because in a
non-discriminating world, individuals with equal characteristics should have the same
outcome regardless of gender. To ensure that the model was well specified for access to
elite postsecondary institutions, we included in the decomposition models a full set of
covariates related to admission to selective institutions.
The traditional Blinder–Oaxaca approach decomposes the estimated ‘‘gap’’ in the
dependent variable between two groups (here A and B) into explained and unexplained
variation using the following OLS regression equation:
�YA � �YB ¼ �XA � �XBð ÞbA þ �XBðbA � bBÞ
where �Y represents the mean value of the dependent variable for a group (A or B), �X
represents the mean value of the set of independent variables for a group, and b represents
the set of estimated coefficients from the OLS regression of Y on the Xs. The left-hand side
Res High Educ
123
of the equation represents the gap, or difference between the means of groups A and B on the
dependent variable. This gap is decomposed into two parts on the right-hand side of the
equation. The first portion on the right hand side of the equation represents the explained
variation (i.e., the difference in the outcome due to differences in independent variable values,�XA and �XB). Variable values between groups in this portion of the equation are allowed to
differ, but coefficient values are held constant. The second portion represents the difference in
the outcome that is due to differences in the estimated coefficients, bA and bB. Here, variable
values are held constant, but coefficients are allowed to differ between the groups.
However, this linear model is inappropriate in cases where the dependent variable is
non-continuous (Sinning et al. 2008). In such cases, the conditional expectation of Y,
EðYijXiÞ, is likely to differ from �XGbG, which would be appropriate in an OLS model. In
the last twenty years, higher education researchers have shifted away from linear regres-
sion when predicting dichotomous and categorical outcomes such as college enrollment
and institutional selectivity (Dey and Astin 1993; Cabrera 1994; Peng et al. 2002).
Our dependent variable of interest, enrollment in a most-competitive institution, was
dichotomous; therefore, we estimated two non-linear models which (1) decomposed the
enrollment gap by gender and (2) estimated coefficients for each independent variable to
indicate their contribution to the explained portion of the gap. The first was Stata’s
nldecompose command (Sinning et al. 2008), which used the conditional expectations
mentioned above to account for the non-linearity in the model. The decomposition was
calculated as follows:
DNLA ¼ EbA
YiAjXiAð Þ � EbAYiBjXiBð Þ
n oþ fEbA
YiBjXiBð Þ � EbBYiBjXiBð Þg
Here, the leftmost bracketed portion on the right-hand side represents the explained var-
iation—in our analysis, the difference in enrollment due to differences in covariate values.
The rightmost bracketed portion represents unexplained variation, or enrollment differ-
ences due to differing coefficient values. And like the Blinder–Oaxaca approach, the left
bracketed portion holds coefficients constant while allowing variable values to differ, while
the right portion holds variable values constant and allows coefficients to differ. However,
now the differences are not taken between the mean values of the independent variables
and the estimated coefficients. Instead they are taken between the conditional expected
values of the dependent variables, YiG, calculated using the independent variable values,
XiG, and estimated coefficients of each group, bG. This model allowed us to address H2 by
providing a test for the significance of the explained and unexplained portions of the
difference in the dependent variable. We also used bootstrapping to produce robust stan-
dard errors. However, this model did not provide coefficients specific to each independent
variable to indicate their contribution to the explained portion of the gap.
In order to obtain such coefficients, which we required to test H1b, we relied on the use
of Stata’s fairlie command (Fairlie 2005), which provided a non-linear decomposition
framework particularly intended for binary outcome variables. The decomposition was
calculated as follows:
�YA � �YB ¼XNA
i¼1
F XiAbA
� �
NA
�XNB
i¼1
F XiBbA
� �
NB
24
35þ
XNB
i¼1
F XiBbA
� �
NB
�XNB
i¼1
F XiBbB
� �
NB
24
35
Here, NG represents the sample size for group G; therefore each sigma notated section
calculates an average value for all observations within that group. The difference between
Res High Educ
123
the average probabilities of the dependent variables in the groups (i.e., �YAand �YB)—in our
analysis, the difference in the average probability of enrollment between men and
women—was decomposed into variation based on measured covariate value differences,
enclosed in the left brackets, and variation based on coefficient differences, in the right
brackets. In this model, F represents the cumulative distribution function of the logistic
distribution:
1
1þ e�ðX�lÞ
r
Therefore, the model was not as generalizable as nldecompose, which was able to work
with a range of conditional expected values, but for our purposes the use of logistic
regression fit the data. The decomposition procedure for the fairlie program operates by
iteratively generating simulated samples of the data that pair observations from each group
and estimating predicted differences between those samples.2 The average contribution of
each variable to the estimated gap from all of the iterated samples is reported as the output.
Multinomial Logistic Regression
Finally, we evaluated gendered self-selection into most selective institutions (H3) by
employing multinomial logistic regression (MNL). The ordered nature of the institutional
selectivity categories used to code enrollment and application suggest the use of ordinal
logistic regression, but violation of the parallel regression assumption (Long and Freese
2005) compelled the use of MNL. By treating the outcome categories as fully categorical,
rather than ordered, MNL does not assume that coefficients for each independent variable
will be constant (i.e., slopes will be parallel) across the regression equations corresponding
to each outcome category.
Two MNL models were used to estimate each portion of H3, with application to non-
selective 4-year institutions used in both cases as the baseline comparison outcome cate-
gory. To test generally for gender differences in application to institutions based on
selectivity (H3a), the categorical application variable was regressed on academic prepa-
ration, co-curricular participation, demographic characteristics, and high school context.
Next, to test gender differences in application based on institutional STEM degree offer-
ings (H3b), we added a set of variables related to low, moderate, and high degree offerings
in STEM fields. The structure of the data resulted in multiple applications per student.
Anticipating that student applications (the unit of analysis) are therefore more highly
related within students than in the national population, the MNL models account for
clustering by estimating robust standard errors.
Limitations
The first limitations of our analysis stemmed from the complications of creating a single
analysis dataset from four surveys. Although we gave great attention to developing vari-
ables with consistent coding schemes across each of the cohorts, it is difficult to ensure that
a student’s response to an item concerning their academic profile in 1972 is equivalent to
the response of a student to a similar item in 2004.
2 In our analyses, 100 paired samples were used to produce each set of fairlie decomposition estimates.
Res High Educ
123
Another limitation was reliance on students’ enrollment behaviors as a proxy for both
students’ preferences for institutions and institutions’ preferences for students. Ideally, data
on application, admission, and enrollment could have been combined to analyze student
preferences, but no such data was available beyond the 2004 cohort, limiting the possibility
of longitudinal analyses. Nevertheless, the approach we employed had strong precedent in
the empirical literature (e.g., Grodsky 2007; Torche 2011).
Finally, some may consider the coding of institutional selectivity for our longitudinal
analyses a limitation. One advantage of the Barron’s criteria is that they are well defined
across levels of selectivity and have changed little since 1972 (Bastedo and Jaquette 2011).
This stability allowed us to apply Barron’s (2003) rankings to all years and thus make
cross-cohort comparisons, an approach used in previous longitudinal research on selective
college access (e.g., Astin and Oseguera 2004). However, fixing the 2003 rankings meant
that a small proportion of institutions were counted as more selective in 1972, 1982, or
1992 than they may have been.
Results
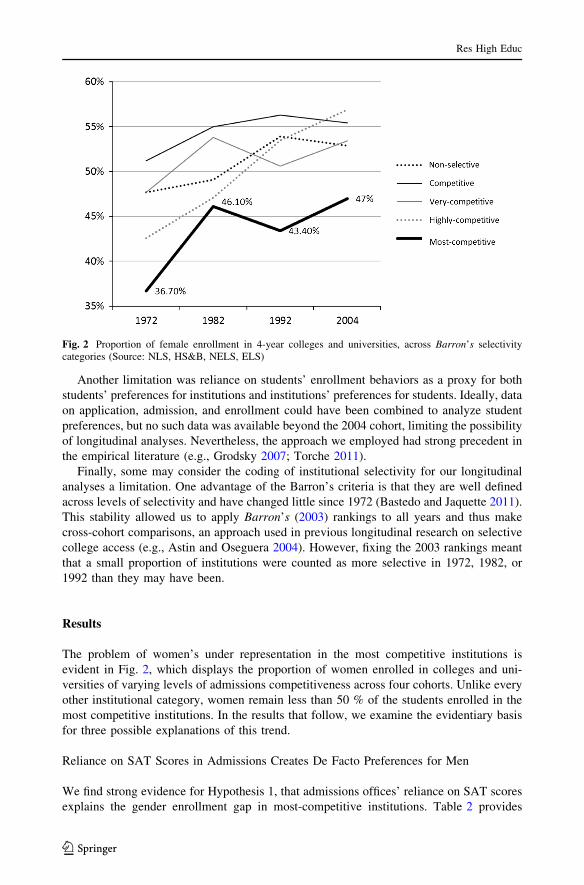
The problem of women’s under representation in the most competitive institutions is
evident in Fig. 2, which displays the proportion of women enrolled in colleges and uni-
versities of varying levels of admissions competitiveness across four cohorts. Unlike every
other institutional category, women remain less than 50 % of the students enrolled in the
most competitive institutions. In the results that follow, we examine the evidentiary basis
for three possible explanations of this trend.
Reliance on SAT Scores in Admissions Creates De Facto Preferences for Men
We find strong evidence for Hypothesis 1, that admissions offices’ reliance on SAT scores
explains the gender enrollment gap in most-competitive institutions. Table 2 provides
Fig. 2 Proportion of female enrollment in 4-year colleges and universities, across Barron’s selectivitycategories (Source: NLS, HS&B, NELS, ELS)
Res High Educ
123
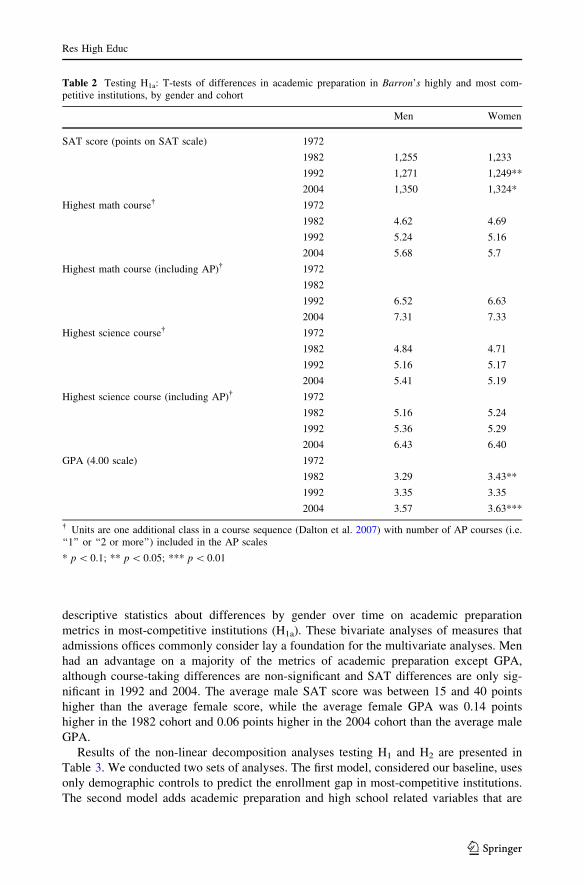
descriptive statistics about differences by gender over time on academic preparation
metrics in most-competitive institutions (H1a). These bivariate analyses of measures that
admissions offices commonly consider lay a foundation for the multivariate analyses. Men
had an advantage on a majority of the metrics of academic preparation except GPA,
although course-taking differences are non-significant and SAT differences are only sig-
nificant in 1992 and 2004. The average male SAT score was between 15 and 40 points
higher than the average female score, while the average female GPA was 0.14 points
higher in the 1982 cohort and 0.06 points higher in the 2004 cohort than the average male
GPA.
Results of the non-linear decomposition analyses testing H1 and H2 are presented in
Table 3. We conducted two sets of analyses. The first model, considered our baseline, uses
only demographic controls to predict the enrollment gap in most-competitive institutions.
The second model adds academic preparation and high school related variables that are
Table 2 Testing H1a: T-tests of differences in academic preparation in Barron’s highly and most com-petitive institutions, by gender and cohort
Men Women
SAT score (points on SAT scale) 1972
1982 1,255 1,233
1992 1,271 1,249**
2004 1,350 1,324*
Highest math course� 1972
1982 4.62 4.69
1992 5.24 5.16
2004 5.68 5.7
Highest math course (including AP)� 1972
1982
1992 6.52 6.63
2004 7.31 7.33
Highest science course� 1972
1982 4.84 4.71
1992 5.16 5.17
2004 5.41 5.19
Highest science course (including AP)� 1972
1982 5.16 5.24
1992 5.36 5.29
2004 6.43 6.40
GPA (4.00 scale) 1972
1982 3.29 3.43**
1992 3.35 3.35
2004 3.57 3.63***
� Units are one additional class in a course sequence (Dalton et al. 2007) with number of AP courses (i.e.‘‘1’’ or ‘‘2 or more’’) included in the AP scales
* p \ 0.1; ** p \ 0.05; *** p \ 0.01
Res High Educ
123
expected to contribute to the enrollment gap.3 The top three rows present results from the
significance test for the estimated gap in enrollment between men and women, as well as
bootstrapped estimates of the significance of the explained and unexplained portions of that
gap. The ‘‘Unexplained’’ row indicates the portion of the gap that is due to differences in
coefficient values between men and women; this is the portion of the gap that may be due
to gender discrimination.
As displayed in the top of Table 3, comparing the baseline and full models from the
non-linear decomposition reveals that accounting for academic preparation (a) reduces the
unexplained gender enrollment variance and (b) increases the explained gender enrollment
variance in each of the four cohorts. The specific admissions criteria that influence the gap
and to what degree they do so are then clarified in the lower portion of Table 3, where we
report individual contributions of each variable to the explained portion of the gender gap.
Here, we are most interested in the factors with negative coefficient estimates, which
provide evidence of men’s continued enrollment advantage in most-competitive
institutions.
The most consistent predictor of men’s enrollment advantage is SAT score, which
increases in importance over time as both a predictor of enrollment and as an explanation
of the gender gap. In fact, SAT score is the only variable that is statistically significant
across all four cohorts. In each model, the coefficient associated with each variable can be
interpreted as the expected shift in the enrollment gap as that variable varies, when holding
all other variables constant.4 For example, in 1972, the coefficient associated with SAT
suggests that the gender gap on average SAT scores (approx. 17 points, see Table 2)
accounts for a 4.2 percentage point enrollment advantage for males, or about 63 % of the
total 1972 enrollment gap. In 2004, there is a 4.6 percentage point enrollment gap, which
SAT scores fully explain (see Footnote 6). Coefficients associated with SAT scores remain
relatively consistent; however, because the size of the estimated enrollment gap varies, we
can conclude that the contribution of SAT score to the gender enrollment gap also changes
over time. In summary, differences in average SAT scores between males and females are
the largest contributor to each of the estimated gender gaps.
Other academic preparation variables that contribute to the male advantage include
highest science (1992) and mathematics (2004) course taken and involvement in a voca-
tional club (1972) or athletics (2004). The only academic preparation variable that sig-
nificantly benefits women is involvement in an honor society (1972), which reduces the
gender gap for females by about 16 percentage points.5 However, this marginal effect was
insufficient to offset men’s overall enrollment advantage that year. Taken together, these
findings provide strong support for H1b, that men’s enrollment advantage in most com-
petitive institutions is due to their higher performance on standardized test scores.
3 Because high school GPA and course enrollment data were not included in the NLS data, those variablesare not included in the full model for that cohort.4 All other variables are held constant for the estimation of each of these coefficients; therefore, theestimated contributions to the gap may be larger than the gap itself.5 Such ‘‘reductions’’ can however be deceiving, as the overall gender gap still advantages males in the end.Therefore, we can interpret these reductions as a constraint on the actual gender gap, which would be about6.8 % had women not participated in honors societies at a higher rate than males.
Res High Educ
123
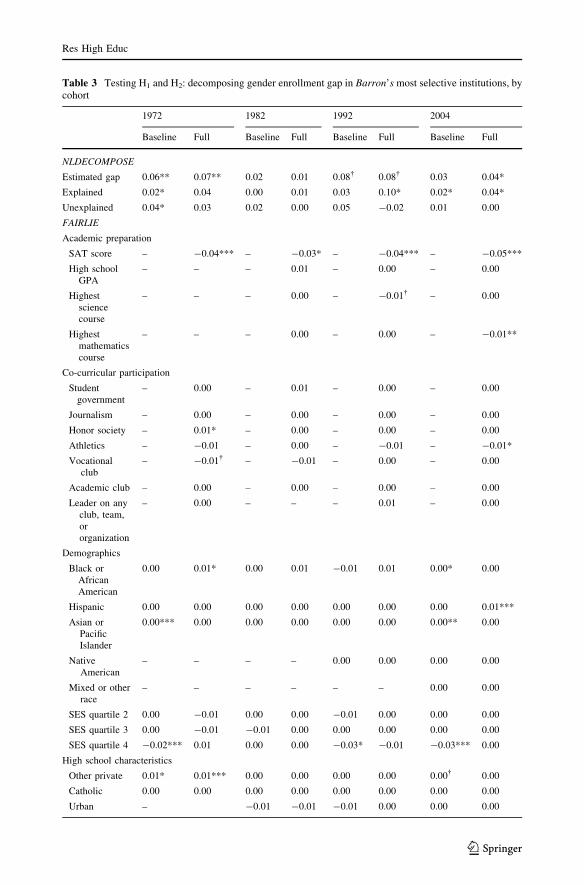
Table 3 Testing H1 and H2: decomposing gender enrollment gap in Barron’s most selective institutions, bycohort
1972 1982 1992 2004
Baseline Full Baseline Full Baseline Full Baseline Full
NLDECOMPOSE
Estimated gap 0.06** 0.07** 0.02 0.01 0.08� 0.08� 0.03 0.04*
Explained 0.02* 0.04 0.00 0.01 0.03 0.10* 0.02* 0.04*
Unexplained 0.04* 0.03 0.02 0.00 0.05 -0.02 0.01 0.00
FAIRLIE
Academic preparation
SAT score – -0.04*** – -0.03* – -0.04*** – -0.05***
High schoolGPA
– – – 0.01 – 0.00 – 0.00
Highestsciencecourse
– – – 0.00 – -0.01� – 0.00
Highestmathematicscourse
– – – 0.00 – 0.00 – -0.01**
Co-curricular participation
Studentgovernment
– 0.00 – 0.01 – 0.00 – 0.00
Journalism – 0.00 – 0.00 – 0.00 – 0.00
Honor society – 0.01* – 0.00 – 0.00 – 0.00
Athletics – -0.01 – 0.00 – -0.01 – -0.01*
Vocationalclub
– -0.01� – -0.01 – 0.00 – 0.00
Academic club – 0.00 – 0.00 – 0.00 – 0.00
Leader on anyclub, team,ororganization
– 0.00 – – – 0.01 – 0.00
Demographics
Black orAfricanAmerican
0.00 0.01* 0.00 0.01 -0.01 0.01 0.00* 0.00
Hispanic 0.00 0.00 0.00 0.00 0.00 0.00 0.00 0.01***
Asian orPacificIslander
0.00*** 0.00 0.00 0.00 0.00 0.00 0.00** 0.00
NativeAmerican
– – – – 0.00 0.00 0.00 0.00
Mixed or otherrace
– – – – – – 0.00 0.00
SES quartile 2 0.00 -0.01 0.00 0.00 -0.01 0.00 0.00 0.00
SES quartile 3 0.00 -0.01 -0.01 0.00 0.00 0.00 0.00 0.00
SES quartile 4 -0.02*** 0.01 0.00 0.00 -0.03* -0.01 -0.03*** 0.00
High school characteristics
Other private 0.01* 0.01*** 0.00 0.00 0.00 0.00 0.00� 0.00
Catholic 0.00 0.00 0.00 0.00 0.00 0.00 0.00 0.00
Urban – -0.01 -0.01 -0.01 0.00 0.00 0.00
Res High Educ
123
No Evidence for Overt Preferences for Men
The third row of Table 3 summarizes findings for H2. The only analysis in which we
identified significant unexplained variation—the first criterion for detecting discrimination
using this method—was the baseline model estimated for the 1972 cohort. However, any
potential discrimination suggested by this baseline model disappeared when we accounted
for academic preparation in the full model. In summary, the evidence does not support H2,
suggesting gender-sensitive admissions preferences is not producing the male enrollment
advantage in elite institutions.
No Evidence for Women Opting Out at the Application Stage
To discern whether the gender gap in enrollment in most-competitive institutions is simply
due to differences in where men and women apply, we analyzed the detailed data available
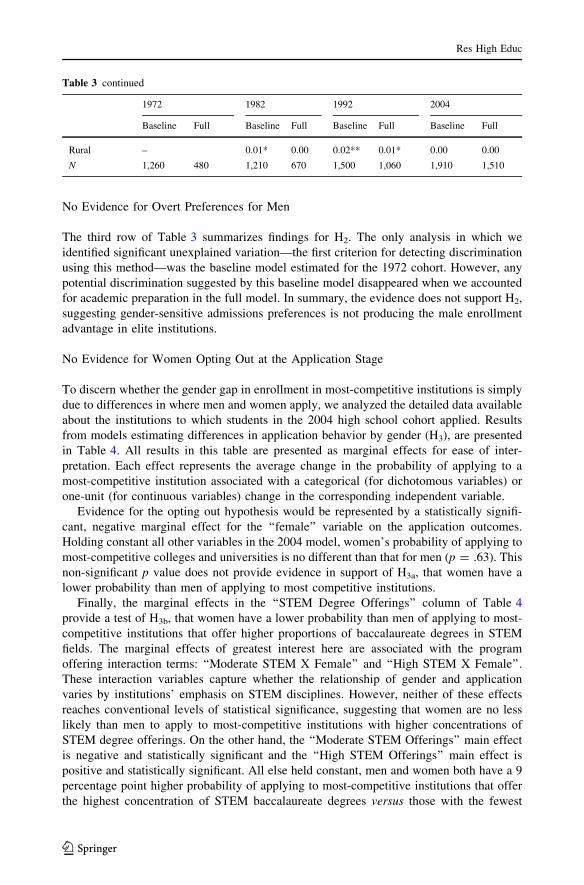
about the institutions to which students in the 2004 high school cohort applied. Results
from models estimating differences in application behavior by gender (H3), are presented
in Table 4. All results in this table are presented as marginal effects for ease of inter-
pretation. Each effect represents the average change in the probability of applying to a
most-competitive institution associated with a categorical (for dichotomous variables) or
one-unit (for continuous variables) change in the corresponding independent variable.
Evidence for the opting out hypothesis would be represented by a statistically signifi-
cant, negative marginal effect for the ‘‘female’’ variable on the application outcomes.
Holding constant all other variables in the 2004 model, women’s probability of applying to
most-competitive colleges and universities is no different than that for men (p = .63). This
non-significant p value does not provide evidence in support of H3a, that women have a
lower probability than men of applying to most competitive institutions.
Finally, the marginal effects in the ‘‘STEM Degree Offerings’’ column of Table 4
provide a test of H3b, that women have a lower probability than men of applying to most-
competitive institutions that offer higher proportions of baccalaureate degrees in STEM
fields. The marginal effects of greatest interest here are associated with the program
offering interaction terms: ‘‘Moderate STEM X Female’’ and ‘‘High STEM X Female’’.
These interaction variables capture whether the relationship of gender and application
varies by institutions’ emphasis on STEM disciplines. However, neither of these effects
reaches conventional levels of statistical significance, suggesting that women are no less
likely than men to apply to most-competitive institutions with higher concentrations of
STEM degree offerings. On the other hand, the ‘‘Moderate STEM Offerings’’ main effect
is negative and statistically significant and the ‘‘High STEM Offerings’’ main effect is
positive and statistically significant. All else held constant, men and women both have a 9
percentage point higher probability of applying to most-competitive institutions that offer
the highest concentration of STEM baccalaureate degrees versus those with the fewest
Table 3 continued
1972 1982 1992 2004
Baseline Full Baseline Full Baseline Full Baseline Full
Rural – 0.01* 0.00 0.02** 0.01* 0.00 0.00
N 1,260 480 1,210 670 1,500 1,060 1,910 1,510
Res High Educ
123

STEM degrees conferred. Similarly, men and women both have an approximately 6 per-
centage point lower probability of applying to institutions with a moderate concentration of
STEM offerings, versus those with the fewest STEM degrees conferred. This finding
Table 4 Testing H3a and H3b: MNL marginal effects of application to most-competitive institutions and bySTEM focus
Basic model STEM degree offerings
Marginal effect p Marginal effect p
Female 0.002 0.758 0.002 0.786
STEM orientation
Moderate stem offerings – -0.058 0.000***
High stem offerings – 0.094 0.000***
Moderate stem 9 female – -0.003 0.774
High stem 9 female – 0.001 0.927
Academic preparation
SAT score 0.0004 0.000*** 0.000 0.000***
High school GPA 0.0301 0.000*** 0.024 0.001***
Highest science course 0.0109 0.000*** 0.007 0.003***
Highest mathematics course 0.0108 0.000*** 0.008 0.002***
Co-curricular participation
Student government 0.0071 0.302 0.009 0.152
Journalism 0.0130 0.043** 0.009 0.140
Honor society 0.0199 0.003*** 0.024 0.000***
Athletics 0.0139 0.026** 0.016 0.005***
Vocational club -0.0127 0.220 -0.005 0.573
Academic club 0.0158 0.008*** 0.013 0.013**
Leader on any club, team, or organization 0.0133 0.040** 0.008 0.186
Demographics
Black or African American 0.0759 0.000*** 0.058 0.000***
Hispanic 0.0732 0.000*** 0.056 0.000***
Asian or Pacific Islander 0.0739 0.000*** 0.048 0.000***
Native American 0.0671 0.032** 0.051 0.098*
Mixed or other race 0.0505 0.000*** 0.040 0.000***
SES quartile 2 -0.0289 0.026** -0.022 0.053*
SES quartile 3 -0.0291 0.008*** -0.018 0.075*
SES quartile 4 -0.0133 0.190 -0.003 0.785
High school characteristics
Other private 0.0115 0.069* 0.009 0.120
Catholic -0.0177 0.142 -0.016 0.135
Urban 0.0300 0.001*** 0.028 0.000***
Rural 0.0050 0.531 0.008 0.281
N 16,800 16,770
Results reported as marginal effects should be interpreted as the estimated change in the probability ofapplying to a most-competitive institution due to a one unit change in the independent variable
* p \ 0.1; ** p \ 0.05; *** p \ 0.01
Res High Educ
123
provides further, albeit indirect, support for the conclusion that women are not uniquely
opting out of most-competitive institutions due a mismatch between their goals and most-
competitive institutions’ degree offerings.
Discussion
Our analyses suggest that the gender enrollment gap in access to the nation’s most com-
petitive institutions is not a matter of student choice, but instead an issue of admissions
reliance on a criterion that privileges male applicants. Just as previous research has found
that admissions is one process by which privileges of Whiteness and wealth are indirectly
embedded in elite institutions (Bastedo and Jaquette 2011; Karabel 2005; Posselt et al.
2012; Stevens 2007), present admissions norms also help embed male privilege in the
organizational climate for diversity (Milem et al. 2005). Men and women graduating from
high school in 2004 did not have significantly different probabilities of applying to the
most competitive colleges and universities, and this trend did not seem to be affected by
considering the proportion of STEM degrees such institutions offer.
Neither did we find evidence for gender sensitive admissions favoring men. In three of
four cohorts, unexplained variation did not account for a significant portion of the gender
enrollment gap, casting doubt on the presence of overt preferences for male applicants.
Apparent gender bias against women in 1972 disappears when we control for academic
preparation, standardized test scores, and extracurricular involvement. So-called male
affirmative action may therefore be occurring within select institutions and/or institutional
types such as liberal arts colleges, as found by Baum and Goodstein (2005) and Conger and
Dickson (2011), but does not seem to be a sufficiently widespread to be captured in the
nationally generalizable sample of high school graduates we analyze.
Rather, the evidence best supports a conclusion that women’s lower average stan-
dardized test scores, combined with the importance attributed to those scores in admissions
decisions, creates de facto preferences for men that drive women’s under-enrollment in
these institutions. SAT score is the single most important predictor of enrollment for men
and women across all four cohorts and the importance of this predictor has grown over
time; therefore, women’s failure to attain scores that are, on average, equivalent to men
means that their enrollment rates are also not equivalent.
Implications and Conclusion
This research has implications for future scholarship on women in education and college
access, as well as for college admissions practice. One implication of this work is the
evidence it provides that admissions offices are not weighting application criteria differ-
ently by gender. This supports DiPrete and Buchmann’s (2006) finding that we are con-
verging on a single equation for explaining male and female college enrollment. However,
broad-scale demographic analyses such as DiPrete and Buchmann’s (2006) and ours may
obscure details at the levels of individual institutions and majors. For example, it is
possible that STEM-focused institutions and colleges do evaluate men and women dif-
ferently for admissions. Qualitative analysis in such settings could therefore help uncover
detail about how gender stratification is both culturally embedded and actively challenged.
Future research should consider that the overt preference for men demonstrated by
institutions may not occur at the admission stage, but rather in the granting of financial aid
Res High Educ
123
packages. The use of aid leveraging to shape incoming classes to postsecondary institutions
has taken on a prominent role in U.S. higher education (Curs and Singell 2010; DesJardins
and McCall 2010; Duffy and Goldberg 1998). It may be the case that men and women are
treated equitably through the admissions process at most-competitive institutions, but are
offered differential packages based on gender that affect their enrollment decisions, and
thus the gender enrollment gap.
Research should also address how gender equity in selective institutional enrollment
intersects with other salient demographic and academic characteristics. There is some evi-
dence that gender differences in admission may be tied to the ways in which applicants ‘‘max
out’’ their high school curricula, as women are more likely to reach the highest courses in
English and science, but not mathematics (Bastedo and Howard 2014). In addition, previous
work has focused on the degree to which socioeconomic status (Astin and Oseguera 2004;
Bastedo and Jaquette 2011) and race (Grodsky 2007; Posselt et al. 2012) are similarly tied to
institutional selectivity in higher education. However, exploring the complex interactions
among gender, SES, and race with selectivity of postsecondary institutions is likely to unearth
further concerns for the equitability of the American higher education system.
We find that de facto institutional preferences for men can be traced to overreliance on
high SAT scores in admissions decision making. This practice is problematic not only from
the standpoint of equity and access, but also given what we know about SAT scores’
predictive validity. By the College Board’s (2008) own admission, SAT scores under-
predict the first year GPA of women college students. Analyzing SAT sections and high
school GPA separately and together, the College Board’s analysis supports previous work
of Ramist et al. (1994) and Bridgeman et al. (2000) to conclude that differential validity by
gender is smallest for GPA and highest for all sections of the SAT. Disproportionately
excluding women from institutions on the basis of a criterion that under-predicts their
performance is especially difficult to justify considering, on average, women outperform
men once they arrive on campus and have higher probabilities of graduating in a timely
manner (Bowen and Bok 1998; Snyder and Dillow 2007).
If institutions wish to admit the students who are most likely succeed academically, then
their decisions should place greater weight on high school grade point average than SAT
scores (Niu and Tienda 2010). Of course, were institutions to adopt the practice of placing
more weight on high school GPA, we might very well see an inversion of the gender
enrollment gap given women’s higher average GPA. As Persell et al. (1992) noted in their
analysis of HS&B data, women’s under-enrollment in selective institutions can be con-
ceptualized as ‘‘differential asset conversion’’ since women’s strength in high school
performance is not converting to selective college admissions as effectively as men’s
strength in SAT scores. Given the human capital signaling functions of degrees from most-
competitive institutions, they can be thought of as assets that convert to future labor market
opportunities (Bourdieu and Passeron 1990; Frank and Cook 1995). From this perspective,
a primary concern about men’s persisting enrollment advantage in these institutions is that
it may encourage longer-term disparities in workplace outcomes. For example, it may
perpetuate the gender gap in corporate leadership positions, whose candidates are often
drawn from such institutions (Bills 2003).
Overreliance on SAT scores can be traced both to elite institutions’ efforts to maintain
high average test scores to preserve their rankings, as well as to admissions file readers’
subconscious judgment processes (Bastedo 2014). Each of these implies different strategies
for reducing gender inequities in admissions. From an institutional stratification perspec-
tive, elite institutions’ status has much to do with their high selectivity, and they therefore
have a vested interest in maintaining a high level of competition for slots in their programs.
Res High Educ
123
The pursuit of prestige indirectly limits access for women and other underrepresented
groups by emphasizing an admissions criterion that ‘‘further privilege[s] the already
advantaged’’ (Karabel 2005, p. 386). Magazine rankings serve as the major catalyst driving
the focus on increasing standardized test scores, and the recent decision by U.S. News and
World Report to increase the weight of SAT scores in their formula (U.S. News 2013)
serves only to perpetuate negative impacts on gender equity. For colleges and universities
unwilling to challenge the system of prestige, one strategy aimed at building diversity
while maintaining high average SAT scores is micro-targeted recruitment—identifying and
investing in small lists of students who match very specific desired profiles.
A radical strategy to align institutional commitments to equity and prestige would be for
the colleges and universities at the very top of the rankings to use their influence to seek
change in the system—even at the potential expense of their own position in the rankings.
They could do so individually by joining the hundreds of colleges and universities that
have made SAT scores optional for admission (http://fairtest.org, 2013). They could also
act collectively to encourage USNWR to revise their rankings algorithms to place less
weight on standardized test scores and encourage metrics that simultaneously predict
student success and pressure institutions toward equitable opportunities for women, low-
income students, and African Americans, Latinos, and Native Americans. The top insti-
tutions have sufficient institutional legitimacy that advocating as a bloc and leaning on the
evidence could yield positive change in macro-level public perceptions about what qual-
ities mark America’s ‘‘best’’ colleges and universities.
However, SAT scores’ undue importance is also a micro-level problem. As academi-
cally qualified students apply to more and more schools to maximize their enrollment
choices (An 2010), enrollment competition is stiffening, and this leads those who read
admissions files to seek efficient means of distinguishing applicants. Test scores, unlike the
rest of the file, may seem quantified, decontextualized, and unambiguous, and thus have a
disproportionate influence on the final admission decision. Interventions in admissions
offices are needed to place test scores in their appropriate place in holistic admissions
processes. For example, admissions offices should develop practices that address common
psychological biases among admissions officers that produce preferences for students who
have higher standardized test scores, despite institutional policies to interpret academic
achievement in the context of family and school contexts (Bastedo 2014). And for
admissions offices to accept students with weaker standardized test scores than others who
have applied, there needs to be leadership from the top of the university that emphasizes
the importance of student diversity and other academic and personal characteristics of
students that SAT and ACT scores do not represent.
Our work demonstrates one of the many ways in which the ‘‘gender gap’’ has yet to be
fully addressed (Sax 2007) amid a national discussion that focuses primarily on ‘‘the war
against boys’’ (Sommers 2013). As revealed in a recent case study of efforts toward gender
equity in Harvard Business School, undergraduate representation is just one aspect of
cultivating gender equity and inclusion in elite postsecondary institutions (Kantor 2013).
However, structural diversity conditions students’ perceptions of belonging, inclusion, and
a positive campus climate (Locks et al. 2004). Erasure of a durable access barrier to
America’s most selective colleges thus represents a critical step in the broader agenda to
realize gender equity in American higher education.
Acknowledgments We acknowledge that this coding of race ignores heterogeneity within racial andethnic groups, but it was necessary to maintain this NCES coding scheme to ensure continuity across all fourcohorts in our data.
Res High Educ
123
References
Alon, S. (2009). The evolution of class inequality in higher education: Competition, exclusion, and adap-tation. American Sociological Review, 74, 731–755.
Alter, M., & Reback, R. (2014). True for your school? How changing reputations alter demand for selectiveU.S. colleges. Educational Evaluation and Policy Analysis, 36(1), 1–25.
An, B. P. (2010). The relations between race, family characteristics, and where students apply to college.Social Science Research, 39(2), 310–323.
Astin, A. W., & Oseguera, L. (2004). The declining ‘‘equity’’ of American higher education. The Review ofHigher Education, 27(3), 321–341.
Attiyeh, G., & Attiyeh, R. E. (1997). Testing for bias in graduate school admissions. Journal of HumanResources, 32(3), 524–548.
Barnett, R. C. (2004). Women and work: Where are we, where did we come from, and where are we going?Journal of Social Issues, 60(4), 667–674.
Barron, (2003). Barron’s profiles of American Colleges 2004. New York: Barron’s Educational Series Inc.,College Division.
Bastedo, M. N. (2014). Cognitive repairs in the admissions office. Unpublished paper, University ofMichigan.
Bastedo, M. N., & Flaster, A. (2014). Conceptual and methodological problems in research on collegeundermatch. Educational Researcher, 43, 93–99.
Bastedo, M. N., & Howard, J. E. (2014). Holistic admissions after affirmative action: Does ‘‘maximizing’’the high school curriculum matter? Unpublished paper, University of Michigan.
Bastedo, M. N., & Jaquette, O. (2011). Running in place: Low-income students and the dynamics of highereducation stratification. Educational Evaluation and Policy Analysis, 33(3), 318–339.
Baum, S., & Goodstein, E. (2005). Gender imbalance in college applications: Does it lead to a preference formen in the admissions process? Economics of Education Review, 24(6), 665–675.
Bills, D. (2003). Credentials, signals, and screens: Explaining the relationship between schooling and jobassignment. Review of Educational Research, 73(4), 441–469.
Blau, F. D., & Kahn, L. M. (2006). The U.S. gender pay gap in the 1990s: slowing convergence. Industrialand Labor Relations Review, 60(1), 45–66.
Blinder, A. (1973). Wage discrimination: Reduced form and structural estimates. Journal of HumanResources, 8, 436–455.
Bourdieu, P., & Passeron, J. C. (1990). Reproduction in education, society and culture (2nd ed.). London:Sage.
Bowen, W. G., & Bok, D. (1998). The shape of the river: Long-term consequences of considering race incollege and university admissions. Princeton: Princeton University Press.
Bowman, N. A., & Bastedo, M. N. (2009). Getting on the front page: Organizational reputation, statussignals, and the impact of U.S. News and World Report on student decisions. Research in HigherEducation, 50(5), 415–436.
Bradley, K. (2000). The incorporation of women into higher education: Paradoxical outcomes? Sociology ofEducation, 73(1), 1–18.
Brewer, D. J., Eide, E. R., & Ehrenberg, R. G. (1999). Does it pay to attend an elite private college? Cross-cohort evidence on the effects of college type on earnings. The Journal of Human Resources, 34(1),104–123.
Bridgeman, B., McCamley-Jenkins, L., & Ervin, N. (2000). Predictions of Freshman Grade-Point Averagefrom the Revised and Recentered SAT I: Reasoning Test. College Board Research Report 2000-1. ETSRR 2000-1. New York: College Entrance Examination Board.
Buchmann, C., & DiPrete, T. A. (2006). The growing female advantage in college completion: The role offamily background and academic achievement. American Sociological Review, 71(4), 515–541.
Burkam, D. T., Lee, V. E., & Owings, J. (2003). Mathematics, foreign language, science course taking andthe NELS:88 transcript data (NCES 2003-01). Washington, DC: US Department of Education,National Center for Education Statistics.
Cabrera, A. F. (1994). Logistic regression analysis in higher education: An applied perspective. In J.C. Smart (Ed.), Higher education: Handbook of theory and research (Vol. 10, pp. 225–256). NewYork, NY: Agathon.
Catsambis, S. (1994). The path to math: Gender and racial-ethnic differences in mathematics participationfrom middle school to high school. Sociology of Education, 67(3), 199–215.
Cho, D. (2007). The role of high school performance in explaining women’s rising college enrollment.Economics of Education Review, 26(4), 450–462.
Res High Educ
123
College Board. (2008). Differential validity and prediction of the SAT. Retrieved 12 September 2013 fromhttps://research.collegeboard.org/sites/default/files/publications/2012/7/researchreport-2008-4-differential-validity-prediction-sat.pdf.
College Board. (2012). Total Group Profile Report. Retrieved 6 September 2013 from http://media.collegeboard.com/digitalServices/pdf/research/TotalGroup-2012.pdf.
Conger, D., & Dickson, L. (2011, under review). Do public universities practice gender sensitive admis-sions? Unpublished manuscript.
Correll, S. J. (2001). Gender and the career choice process: The role of biased self-assessments. AmericanJournal of Sociology, 106(6), 1691–1730.
Correll, S. J. (2004). Constraints into preferences: Gender, status, and emerging career aspirations. AmericanSociological Review, 69(1), 93–113.
Curs, B. R., & Singell, L. D. (2010). Aim high or go low? Pricing strategies and enrollment effects when thenet price elasticity varies with need and ability. The Journal of Higher Education, 81(4), 515–543.
Dalton, B. W., Ingels, S. J., Downing, J., & Bozick, R. (2007). Advanced mathematics and sciencecoursetaking in the Spring high school senior classes of 1982, 1992, and 2004 (No. NCES 2007-312).Washington, DC: National Center for Education Statistics, Institute of Education Sciences, U.S.Department of Education.
Department of Homeland Security. (2013). STEM-designated degree program list. Retrieved 24 April 2013from http://www.ice.gov/sevis/stemlist.htm.
DesJardins, S. L., & McCall, B. P. (2010). Simulating the effects of financial aid packages on collegestudent stopout, reenrollment spells, and graduation chances. The Review of Higher Education, 33(4),513–541.
Dey, E. L., & Astin, A. W. (1993). Statistical alternatives for studying college student retention: A com-parative analysis of logit, probit, and linear regression. Research in Higher Education, 34(5), 569–581.
DiPrete, T. A., & Buchmann, C. (2006). Gender-specific trends in the value of education and the emerginggender gap in college completion. Demography, 43(1), 1–24.
Duckworth, A. L., & Seligman, M. E. P. (2006). Self-discipline gives girls the edge: Gender in self-discipline, grades, and achievement test scores. Journal of Educational Psychology, 98(1), 198–208.
Duffy, E. A., & Goldberg, I. (1998). Crafting a class: College admissions and financial aid, 1955–1994.Princeton: Princeton University Press.
Espeland, W. N., & Sauder, M. (2007). Rankings and reactivity: How public measures recreate socialworlds. American Journal of Sociology, 113(1), 1–40.
Espinosa, L. L. (2011). Pipelines and pathways: Women of color in undergraduate STEM majors and thecollege experiences that contribute to persistence. Harvard Educational Review, 81(2), 209–241.
Fairlie, R. W. (2005). An extension of the Blinder–Oaxaca decomposition technique to logit and probitmodels. Journal of Economic and Social Measurement, 30, 205–316.
FairTest. (2013). Schools that do not use SAT or ACT scores for admitting substantial numbers of studentsinto bachelor degree programs. Retrieved 20 October 2013 from http://fairtest.org/sites/default/files/OptionalPDFHardCopy.pdf.
Frank, R. H., & Cook, P. J. (1995). The winner-take-all society. New York: Free.Gabler, J., & Kaufman, J. (2006). Chess, cheerleading, Chopin: What gets you into college? Contexts, 5,
45–49.Gaucher, D., Friesen, J., & Kay, A. C. (2011). Evidence that gendered wording in job advertisements exists
and sustains gender inequality. Journal of Personality and Social Psychology, 101(1), 109–128.Goldin, C., Katz, L. F., & Kuziemko, I. (2006). The homecoming of American college women: The reversal
of the college gender gap. Journal of Economic Perspectives, 20(4), 133–156.Griffith, A. L., & Rothstein, D. S. (2009). Can’t get there from here: The decision to apply to a selective
college. Economics of Education Review, 28(5), 620–628.Grodsky, E. (2007). Compensatory scholarship in higher education. American Journal of Sociology, 112(6),
1662–1712.Hall, R. M., & Sandler, B. R. (1984). Out of the classroom: A chilly campus climate for women ? Project on
the status and education of women, Association of American Colleges Washington, DC. Retrieved 15September 2013, from http://aacu.secure.nisgroup.com/psew/publications/Out_of_Classroom_ChillyClimate_forWomen.pdf.
Hawkings, D. A., & Lautz, J. (2005). State of college admission. Alexandria, VA: National Association forCollege Admission Counseling.
Hearn, J. C. (1991). Academic and nonacademic influence on the college destinations of 1980 high schoolgraduates. Sociology of Education, 64(3), 158–171.
Hedges, L. V., & Nowell, A. (1995). Sex differences in mental test scores, variability, and numbers of high-scoring individuals. Science, 270, 41–45.
Res High Educ
123
Hoxby, C. M. (2009). The changing selectivity of American colleges. Journal of Economic Perspectives,23(4), 95–118.
Jacobs, J. A. (1996). Gender inequality and higher education. Annual Review of Sociology, 22, 153–185.Kantor, J. (2013, September 8). Harvard Business School case study: Gender equity. The New York Times,
A1.Karabel, J. (2005). The chosen: The hidden history of admission and exclusion at Harvard, Yale, and
Princeton. New York: Houghton Mifflin.Kerckhoff, A., Raudenbush, S., & Glennie, E. (2001). Education, cognitive skill, and labor force outcomes.
Sociology of Education, 74(1), 1–24.Klasik, D. (2013). The ACT of enrollment: The college enrollment effects of state-required college entrance
exam testing. Educational Researcher, 42(3), 151–160.Lewin, T. (2006, July 9). At colleges, women are leaving men in the dust. New York Times. Retrieved 6 July
2011 from http://www.nytimes.com/2006/07/09/education/09college.html.Locks, A. M., Hurtado, S., Bowman, N. A., & Oseguera, L. (2004). Extending notions of campus climate
and diversity to students’ transition to college. The Review of Higher Education, 31(3), 257–285.Long, J. S., & Freese, J. (2005). Regression models for categorical dependent variables using stata (2nd
ed.). College Station: Stata.Madera, J. M., Hebl, M. R., & Martin, R. C. (2009). Gender and letters of recommendation for academia:
Agentic and communal differences. Journal of Applied Psychology, 94(6), 1591.McIlwee, J. S., & Robinson, J. G. (1992). Women in engineering: gender, power, and workplace culture.
Albany: State University of New York Press.Mickelson, R. A., & Smith, S. S. (1998). Can education eliminate race, class, and gender inequality? In M.
L. Anderson & P. H. Collins (Eds.), Race, class, and gender: AN anthology (3rd ed., pp. 328–340).New York, NY: Wadsworth Publishing Company.
Milem, J. F., Chang, M. J., & Antonio, L. A. (2005). Making diversity work on campus: A research-basedperspective. Washington, DC: American Association of Colleges and Universities.
Monks, J. (2000). The returns to individual and college characteristics: Evidence from the National Lon-gitudinal Survey of Youth. Economics of Education Review, 19(3), 279–289.
Niu, S. X., & Tienda, M. (2010). Minority student academic performance under the uniform admission law:Evidence from the University of Texas at Austin. Educational Evaluation and Policy Analysis, 32(1),44–69.
Oaxaca, R. L. (1973). Male–female wage differentials in urban labor markets. International EconomicReview, 14(3), 693–709.
Peng, C. J., So, T. H., Stage, F. K., & St. John, E. P. (2002). The use and interpretation of logistic regressionin higher education journals: 1988–1999. Research in Higher Education, 43(3), 259–294.
Persell, C. H., Catsambis, S., & Cookson, P. W, Jr. (1992). Differential asset conversion: Class and genderedpathways to selective colleges. Sociology of Education, 65(3), 208–225.
Posselt, J. R., Jaquette, O., Bielby, R., & Bastedo, M. N. (2012). Access without equity: Race and ethnicstratification in higher education. American Educational Research Journal, 49(6), 1074–1111.
Ramist, L., Lewis, C., & McCamley-Jenkins, L. (1994). Student Group Differences in Predicting CollegeGrades: Sex, Language, and Ethnic Groups. College Board Report No. 93-1, ETS RR No. 94-27. NewYork: College Entrance Examination Board.
Riegle-Crumb, C., & King, B. (2010). Questioning a white male advantage in STEM: Examining disparitiesin college major by gender and race/ethnicity. Educational Researcher, 39(9), 656–664.
Rudman, L. A., Moss-Racusin, C. A., Phelan, J. E., & Nauts, S. (2012). Status incongruity and backlasheffects: Defending the gender hierarchy motivates prejudice against female leaders. Journal ofExperimental Social Psychology, 48(1), 165–179.
Sax, L. J. (2007). College women still face many obstacles in reaching their full potential. The Chronicle ofHigher Education, 54(5), B46.
Sax, L. J. (2008). The gender gap in college: Maximizing the developmental potential of women and men.San Francisco: Jossey-Bass.
Sinning, M., Hahn, M., & Bauer, T. K. (2008). The Blinder–Oaxaca decomposition for nonlinear regressionmodels. The Stata Journal, 8(4), 480–492.
Snyder, T. D., & Dillow, S. A. (2007). Digest of educational statistics 2006. Washington, DC: NationalCenter for Education Statistics.
Snyder, T. D., & Dillow, S. A. (2011). Digest of education statistics 2010. Washington, DC: National Centerfor Education Statistics.
Sommers, C. H. (2013). The war against boys: How misguided policies are harming our young men. NewYork: Simon and Schuster.
Res High Educ
123

Stage, F. K. (2007). Answering critical questions using quantitative data. New Directions for InstitutionalResearch, 133, 5–16.
Stevens, M. (2007). Creating a class: College admissions and the education of elites. Cambridge, MA:Harvard University Press.
Tilly, C. (1999). Durable inequality. Berkeley: University of California Press.Torche, F. (2011). Is college still the great equalizer? Intergenerational mobility across levels of schooling in
the United States. American Journal of Sociology, 177(3), 763–807.U.S. News and World Report. (2010). How U.S. news calculates the college rankings. Retrieved 29
November 2010, from http://www.usnews.com/articles/education/best-colleges/2010/08/17/how-us-news-calculates-the-college-rankings_print.html.
U.S. News and World Report. (2013). How U.S. news calculated the 2014 best colleges rankings. Retrieved25 October 2013 from http://www.usnews.com/education/best-colleges/articles/2013/09/09/how-us-news-calculated-the-2014-best-colleges-rankings.
Whitmire, R. (2009, November 5). The lost boys. Wall Street Journal, W.13.Winston, G. C. (1999). Subsidies, hierarchy, and peers: The awkward economics of higher education.
Journal of Economic Perspectives, 13(1), 13–36.
Res High Educ
123