Embed Size (px)
Citation preview
3
CHAPTER 1
Why Industry Matters for Africa
Economic growth in Africa has been on an accelerating trend for more than thirty years. The average annual growth rate of real
output increased from 1.8 percent in the period 1980–89 to 2.6 per-cent in 1990–99 and 5.3 percent in 2000–09. Since 2010 it has remained in the range of 4.5 to 5.5 percent per year. One of the enduring “stylized facts” of economic development is that struc-tural change— the movement of labor from low productivity sectors into higher productivity employment—is a key driver of growth, especially in lower income countries.1 Despite two de cades of solid economic growth, however, Africa has experienced relatively little structural change.2 The region’s growth turnaround beginning in 1995 was largely due to making fewer economic policy mistakes, rising commodity prices, and natural resource discoveries.3
1. See, for example, Lewis (1954), Kuznets (1955), and Chenery (1986).2. In general we use the terms Africa and sub- Saharan Africa inter-
changeably in this book, following the regional classifi cations of the World Bank and common usage. Where we wish to discuss only sub- Saharan Af-rica or North Africa we use those terms explicitly.
3. Arbache and Page (2008, 2009).
4 Made in Africa
In both theory and history, industry has been a key driver of structural change, but it has only played a minor role in recent struc-tural change in Africa. Since 2000, a growing share of African work-ers have been leaving agriculture and moving to higher productivity sectors. This positive structural change has contributed to overall growth, but the shift in employment has primarily been from agri-culture into ser vices for domestic consumers. Only about one in fi ve African workers leaving agriculture has moved into the industrial sector.4 To us, these trends raise the question: How important is industry to Africa?
As we attempt to answer this question, the defi nition of “indus-try” is critical. When the economic statistics used today were fi rst drawn up in the 1950s, there was little confusion over what industry meant. At the broadest level it encompassed mining, manufacturing, utilities, and construction. Of these, manufacturing— “smokestack industry”— was the subject of central interest. However, changes in transport costs and information and communications technology have shifted the boundaries of industry. A wide range of ser vices and agro- industrial products have become tradable and have many features in common with manufacturing.5 Like manufacturing, they benefi t from technological change and productivity growth. Some exhibit tendencies for scale and agglomeration economies.6 For that reason we take a broad view of what constitutes industry today. It is manufacturing and those tradable ser vices and agro- industrial value chains that share the fi rm- level characteristics that are the subject of this book. Put more straightforwardly, we are interested in industry both with and without smokestacks.
In an attempt to understand industry’s importance to Africa, we begin this chapter with a snapshot of the magnitude of Africa’s industrialization challenge. We compare the structure of Africa’s economies with a number of benchmarks and with the cross- country patterns relating the size of the industrial sector to the level of per
4. McMillan and Hartgen (2014).5. See, for example, Baumol (1985) and Bhagwati (1984).6. See Ebling and Janz (1999) and Ghani and Kharas (2010).
Why Industry Matters for Africa 5
capita income. The output and employment structure of a “typical” African economy is quite different from these comparators. The main gaps lie in the much smaller shares of output and employment in industry.
Although the numbers suggest that Africa has too little industry, it has managed to grow without industrialization for nearly two de cades. Perhaps it does not need to industrialize. In this chapter we make the case that industry matters for Africa. We show that the slow pace of industrialization is at least partly responsible for the region’s disappointing per for mance in translating growth into good jobs and poverty reduction. Lack of industrial development may also have closed off important opportunities to raise women’s welfare. We end by arguing that industrialization has some special characteristics that can sustain growth.
Africa’s “Manufacturing Defi cit”
Most African countries have national visions that call for achieving middle- income status over the next de cade. One mea sure of the ex-tent of structural change that might be needed for the transition to middle income can be found by comparing Africa’s current eco-nomic structure with that of a “benchmark” middle- income coun-try.7 The World Bank defi nes lower- middle- income status as falling in the range US$1,045–4,125 in 2012 purchasing power parity (PPP) prices.8 The lower bound of this range would seem to be a reason-able target for Africa’s national visions.
We constructed a benchmark economy by identifying a group of currently middle- income countries that have crossed the US$1,045 threshold.9 We selected the following benchmark countries and
7. This idea was proposed in a single- country context by Bevan and others (2003).
8. The World Bank Atlas method of currency conversion is used.9. Because the World Bank only provides GNI per capita in current terms,
the GNI per capita in 2012 was projected backward using the GDP per capita growth rate to the US$1,045 threshold, thus giving the benchmark year for
6 Made in Africa
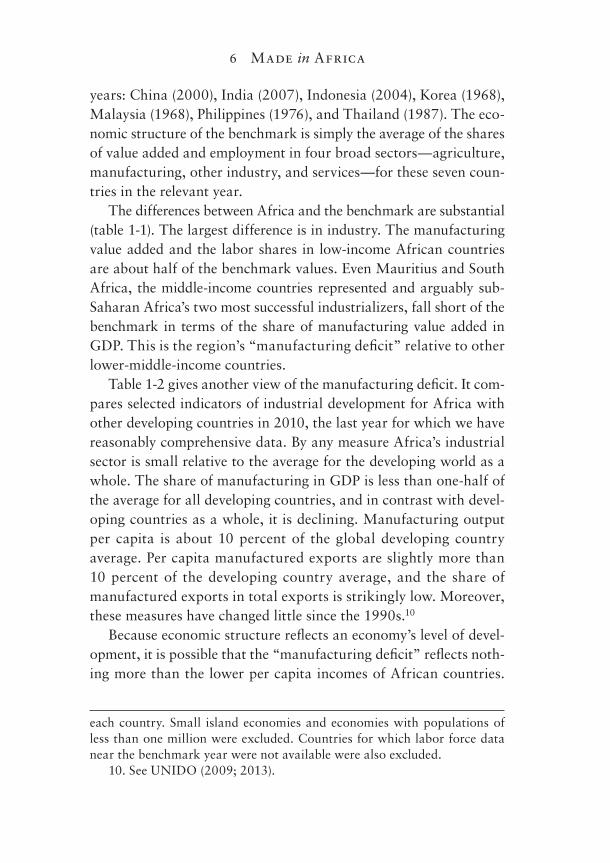
years: China (2000), India (2007), Indonesia (2004), Korea (1968), Malaysia (1968), Philippines (1976), and Thailand (1987). The eco-nomic structure of the benchmark is simply the average of the shares of value added and employment in four broad sectors— agriculture, manufacturing, other industry, and services— for these seven coun-tries in the relevant year.
The differences between Africa and the benchmark are substantial (table 1-1). The largest difference is in industry. The manufacturing value added and the labor shares in low- income African countries are about half of the benchmark values. Even Mauritius and South Africa, the middle- income countries represented and arguably sub- Saharan Africa’s two most successful industrializers, fall short of the benchmark in terms of the share of manufacturing value added in GDP. This is the region’s “manufacturing defi cit” relative to other lower- middle- income countries.
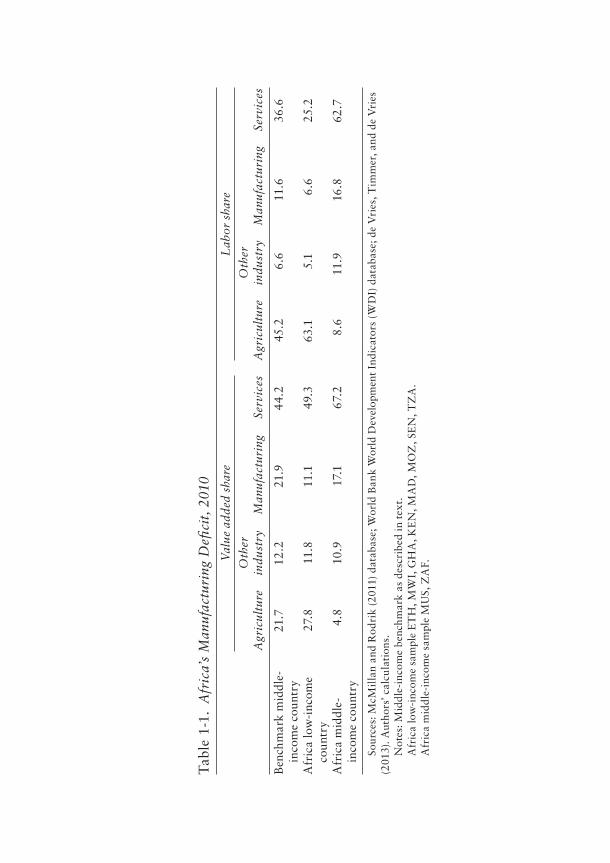
Table 1-2 gives another view of the manufacturing defi cit. It com-pares selected indicators of industrial development for Africa with other developing countries in 2010, the last year for which we have reasonably comprehensive data. By any mea sure Africa’s industrial sector is small relative to the average for the developing world as a whole. The share of manufacturing in GDP is less than one- half of the average for all developing countries, and in contrast with devel-oping countries as a whole, it is declining. Manufacturing output per capita is about 10 percent of the global developing country average. Per capita manufactured exports are slightly more than 10 percent of the developing country average, and the share of manufactured exports in total exports is strikingly low. Moreover, these mea sures have changed little since the 1990s.10
Because economic structure refl ects an economy’s level of devel-opment, it is possible that the “manufacturing defi cit” refl ects noth-ing more than the lower per capita incomes of African countries.
each country. Small island economies and economies with populations of less than one million were excluded. Countries for which labor force data near the benchmark year were not available were also excluded.
10. See UNIDO (2009; 2013).
Tab
le 1
-1.
Afr
ica’
s M
anuf
actu
ring
Defi
cit
, 201
0
Val
ue
add
ed s
hare
Lab
or s
hare
Agr
icul
ture
Oth
er
indu
stry
Man
ufac
turi
ngSe
rvic
esA
gric
ultu
reO
ther
in
dust
ryM
anuf
actu
ring
Serv
ices
Ben
chm
ark
mid
dle-
inco
me
coun
try
21.7
12.2
21.9
44.
245
.26.
611
.636
.6
Afr
ica
low
-inc
ome
coun
try
27.8
11.8
11.1
49.3
63.1
5.1
6.6
25.2
Afr
ica
mid
dle-
inco
me
coun
try
4.8
10.9
17.1
67.2
8.6
11.9
16.8
62.7
Sou
rces
: McM
illa
n an
d R
odri
k (2
011)
dat
abas
e; W
orld
Ban
k W
orld
Dev
elop
men
t In
dica
tors
(W
DI)
dat
abas
e; d
e V
ries
, Tim
mer
, and
de
Vri
es
(201
3). A
utho
rs’ c
alcu
lati
ons.
Not
es: M
iddl
e-in
com
e be
nch
mar
k as
des
crib
ed in
tex
t.A
fric
a lo
w-i
ncom
e sa
mpl
e E
TH
, MW
I, G
HA
, KE
N, M
AD
, MO
Z, S
EN
, TZ
A.
Afr
ica
mid
dle-
inco
me
sam
ple
MU
S, Z
AF.
Tab
le 1
-2.
Sele
cted
In
dica
tors
of
Indu
stri
al D
evel
opm
ent,
20
00
–10
Man
ufac
turi
ng v
alu
e ad
ded
Man
ufac
ture
d ex
port
s
Reg
ion
Shar
e of
GD
P
20
00
(per
cent
)
Shar
e of
G
DP
201
0 (p
erce
nt)
Per
cap
ita
201
0 (U
S$2
,00
0)
Per
cap
ita
grow
th
20
00
–10
(per
cent
)
Shar
e in
tot
al
expo
rts
201
0 (p
erce
nt)
Per
cap
ita
201
0 (U
S$2
,00
0)
Per
cap
ita
grow
th
20
00
–10
(per
cent
)
Sub-
Saha
ran
Afr
ica
aver
age
8.1
7.0
36.7
2.6
930
.061
.810
.3
Dev
elop
ing
coun
trie
s av
erag
e20
.521
.040
0.2
3.01
74.0
579.
67.
1
Sou
rces
: UN
IDO
(20
09);
UN
IDO
(20
13);
UN
IDO
Ind
ustr
ial D
evel
opm
ent
data
base
. Aut
hors
’ cal
cula
tion
s.N
otes
: Sub
-Sah
aran
Afr
ica
aver
age
excl
udes
Sou
th A
fric
a.
Why Industry Matters for Africa 9
This is where cross- country patterns make a useful reference point. The relationship between manufacturing and per capita income has an inverted U shape. In the early stages of development when most economies are concentrated in agriculture, growth in income is as-sociated with very rapid increases of the share of manufacturing in total output. As incomes and real wages rise and skills develop, the relative importance of manufacturing peaks and countries moving toward upper- middle- income levels diversify into more skill- intensive activities, including ser vices.
Globally, the share of manufacturing in total output rises with per capita income until countries reach upper-middle-income status and then declines. While African economies generally conform to this global pattern, the vast majority are below the global average in terms of the relationship between per capita income and the share of manufacturing in GDP. Only Madagascar, Mozambique, Lesotho, and the Ivory Coast have shares of manufacturing in total output that exceed the predicted values for their levels of income. Many of the region’s recent growth success stories— Ethiopia, Ghana, Kenya, Tanzania, and Uganda, for example— have shares of manufacturing in GDP that are well below their predicted val-ues. Controlling for the level of income, Africa faces a larger defi cit in terms of manufacturing than other countries at the same level of development.11
Structural Change, Industry, and Growth
Because developing economies are characterized by large differences in output per worker across sectors, there is a substantial growth payoff when factors of production move from lower productivity to higher productivity sectors. Africa is the developing region with the most to gain from structural change. It has the greatest differences across sectors in output per worker. The average ratio of highest to lowest productivity sectors in Africa is more than twice that for Latin
11. Dinh and others (2013).
10 Made in Africa
America and Asia.12 This shows the large potential for structural change to boost growth of income per person in Africa, although recent research fi nds that this potential has not been fully tapped.13
Economywide changes in output per worker over time can be decomposed into two components.14 The fi rst component refl ects productivity growth within individual sectors. It is the weighted sum of changes in labor productivity in each sector of the economy, where the weights are the employment shares of each sector in the beginning period. Not surprisingly, it has come to be labeled the “within sector component” of productivity change. The second com-ponent captures the change in economywide labor productivity of labor reallocations across different sectors. It is the product of indi-vidual sector productivity levels in the end period with the change in employment shares across sectors. This is the “structural change com-ponent.” Among developing countries and across regions, the contri-butions of these two components to overall productivity change are strikingly different.
Between 1990 and 2010 the movement of workers from lower to higher productivity sectors— mainly industry—in Asia added sub-stantially to economywide growth of output per worker. In this sense structural change was growth enhancing. Latin America was the polar opposite: there structural change was growth reducing. The share of workers in low productivity employment increased be-tween 1990 and 2010, offsetting productivity improvements within sectors and reducing overall productivity growth.15
Africa’s record of structural change is mixed. From 1990 through 1999 Africa looked more like Latin America. Output per worker increased within sectors while the share of workers employed in high productivity sectors declined. Up until the turn of the
12. Page (2012a).13. McMillan, Rodrik, and Verduzco- Gallo (2014); de Vries, Timmer,
and de Vries (2013).14. McMillan and Rodrik (2012) and de Vries, Timmer, and de Vries
(2013) present differing decompositions refl ecting different choices of weights. The exposition here follows McMillan and Rodrik.
15. McMillan, Rodrik, and Verduzco- Gallo (2014).
Why Industry Matters for Africa 11
twenty- fi rst century, structural change in Africa reduced growth of income per person.16
After 2000 labor in Africa began to move out of agriculture into more productive employment, but not into industry. Eight out of ten African workers who left agriculture ended up employed in the “market” ser vices sector, mainly in trade, restaurants, and personal ser vices.17 This amounted to movement from very low productivity employment to only slightly higher productivity jobs. Output per worker in ser vices in Africa is only about two times higher than out-put per worker in agriculture. Average labor productivity in manu-facturing is more than six times that in agriculture.18
Africa has a rapidly growing labor force, but employment in manufacturing and in other activities with high value added per worker is growing slowly. This pattern of structural change has some important implications for job creation and poverty reduction (as we explore in the next section). In addition, there is a risk that struc-tural change in Africa will run out of steam. Ser vices have been ab-sorbing workers faster than the ser vices sector has been increasing output. The relative productivity level of market ser vices fell from 3.0 times the total economy average in 1990 to 1.8 times in 2010, suggesting that the marginal productivity of new ser vices workers is low and possibly negative.19 This raises the risk that without a more robust growth of industry, the structural change component of growth in Africa may diminish or once again turn negative.
Jobs and Poverty Reduction
Africa has enjoyed twenty years of sustained economic growth. Yet there are many worrying signs that this has not resulted in robust
16. McMillan, Rodrik, and Verduzco- Gallo (2014).17. De Vries, Timmer, and de Vries (2013); McMillan and Hartgen
(2014).18. McMillan and Hartgen (2014).19. De Vries, Timmer, and de Vries (2013).
12 Made in Africa
growth of “good” jobs— those offering higher wages and better working conditions— and rapid reductions in poverty.20 Africa’s structural pattern of growth during the last two de cades is at least partly responsible. The sources of growth in the region’s most rap-idly growing economies have not been employment intensive. Lack of employment- intensive growth, together with the absence of progress in transforming traditional agriculture, are largely at the root of the region’s slow pace of poverty reduction. Industrial de-velopment offers a high employment, high productivity path for job creation, and evidence suggests that it can accelerate the pace of poverty reduction.
Industry and Africa’s “Employment Problem”
On the face of it, sub- Saharan Africa does not have a severe “employ-ment problem.” In 2013 the overall unemployment rate for the region was 7.6 percent, compared with a global average of about 6 percent, and youth unemployment rates in many sub- Saharan countries are relatively low compared to world averages.21 Unemployment is low in Africa’s lower income countries— falling in the range of 1 to 5 per-cent for countries such as Ethiopia, Ghana, Tanzania, and Uganda. But the averages are misleading. For the great majority of Africans the employment problem is more about the quality of the job than the absence of a job. Low unemployment frequently signals poor quality employment.
When an African worker fi nds a job it is likely to be of low qual-ity in terms of wages, benefi ts, and job security. Where unemploy-ment in Africa is low the informal sector is large, and many work-ers are forced into house hold, family, or self- employment because of
20. See World Bank (2013).21. ILO (2014). Unemployment rates in Africa are likely to be underesti-
mated because the ILO excludes people who were not working or were not actively looking for work, but say they would take a job if one were offered.
Why Industry Matters for Africa 13
the absence of a wage- paying job. The International Labor Or ga ni-za tion (ILO) estimates that three out of four jobs in sub- Saharan Africa can be labeled “vulnerable” due to workers working on their own account or as unpaid family workers. In 2011 nearly 82 per-cent of workers in Africa were classifi ed as working poor, compared to the world average of about 39 percent. The overwhelming major-ity of young workers in both rural and urban areas are engaged in informal self- employment. Fewer than one in fi ve of Africa’s young workers fi nd places in wage employment.22
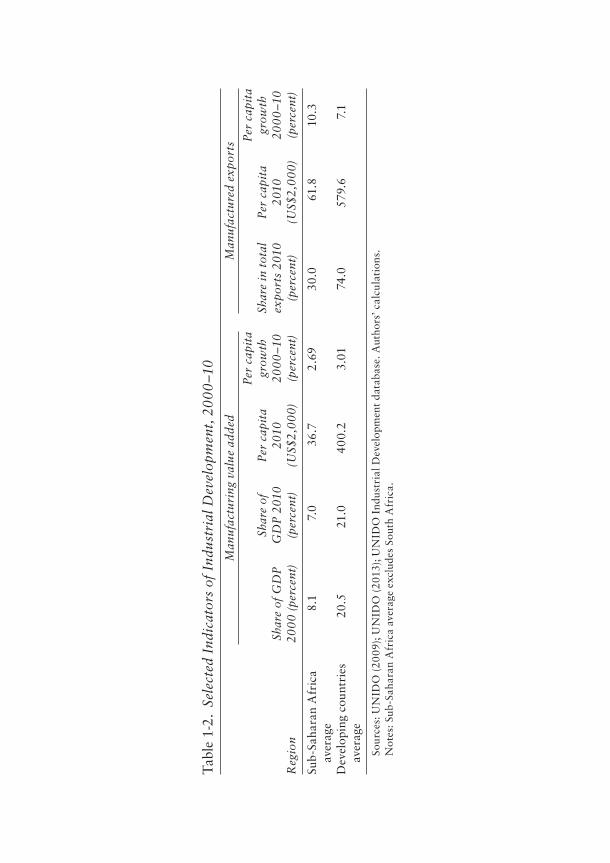
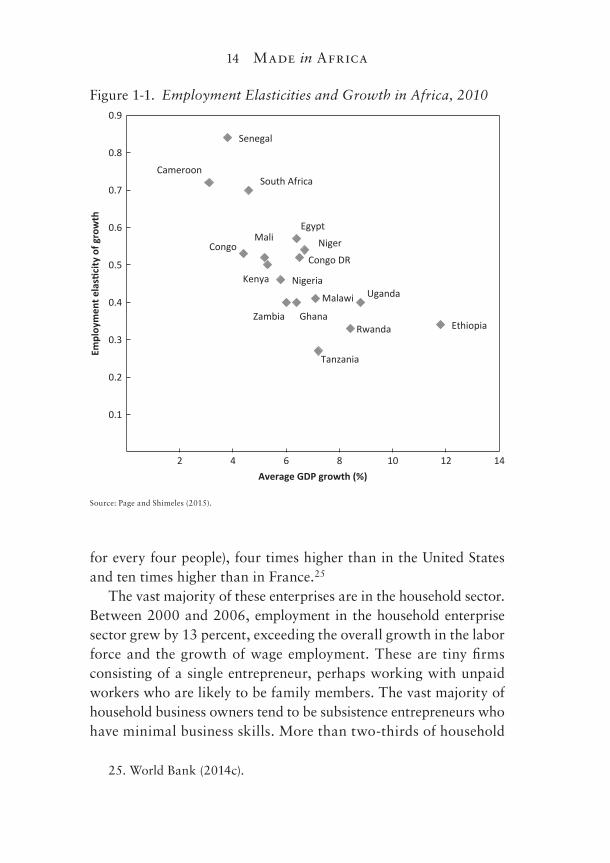
Africa’s poor employment outcomes largely refl ect the reality that the region’s fastest- growing economies— Ethiopia, Rwanda, Tanzania, and Uganda, among them— have the lowest responsive-ness of formal employment to growth (fi gure 1-1). In fact, there is no statistical relationship in Africa between economywide growth and the rate of growth of formal employment.23 This is a highly un-usual fi nding. Globally, there is a statistically signifi cant relation-ship between growth of GDP and employment growth. Between 1991 and 2003, for every 1 percentage point of additional GDP growth, total employment grew between 0.3 and 0.38 percentage points.24
The case of Tanzania, one of the countries we studied under our Learning to Compete (L2C) program, makes the point more con-cretely. Tanzania has a young and rapidly growing population. Ap-proximately 800,000 new workers enter the domestic labor mar-ket every year. The economy, however, is not creating that number of “good” jobs. In fact, Tanzania’s per for mance in job creation has been among the most disappointing of the region’s “growth mira-cle” economies. As the supply of workers seeking nonfarm employ-ment has outpaced demand in the wage sector, many labor force participants have been left with no choice but to create their own jobs. Today, 5 million nonfarm businesses operate in Tanzania. This is one of the highest rates of business formation in the world (one
22. ILO (2011).23. Page and Shimeles (2015).24. Kapos (2005).
14 Made in Africa
for every four people), four times higher than in the United States and ten times higher than in France.25
The vast majority of these enterprises are in the house hold sector. Between 2000 and 2006, employment in the house hold enterprise sector grew by 13 percent, exceeding the overall growth in the labor force and the growth of wage employment. These are tiny fi rms consisting of a single entrepreneur, perhaps working with unpaid workers who are likely to be family members. The vast majority of house hold business own ers tend to be subsistence entrepreneurs who have minimal business skills. More than two- thirds of house hold
25. World Bank (2014c).
Ethiopia
Uganda
Rwanda
Tanzania
Malawi
Niger
Congo DR
Ghana
Egypt
Zambia
NigeriaKenya
Mali
South Africa
Congo
Senegal
Cameroon
0.1
0.2
0.3
0.4
0.5
0.6
0.7
0.8
0.9
2 4 6 8 10 12 14
Empl
oym
ent e
las
city
of g
row
th
Average GDP growth (%)
Figure 1-1. Employment Elasticities and Growth in Africa, 2010
Source: Page and Shimeles (2015).
Why Industry Matters for Africa 15
enterprises in urban areas were formed because of lack of any other job opportunities.26
It is perhaps no surprise, then, that the po liti cal conversation in Africa often turns to the problem of “jobless growth.” Industry, including manufacturing, tradable ser vices, and agro- industry, is a high productivity, employment- intensive sector into which labor can potentially fl ow. As we shall see in chapter 2, it is a sector that has been growing more slowly than the economy as a whole for more than twenty years. The failure to industrialize is clearly a major part of Africa’s employment problem.
Industry, Structural Change, and Poverty
Poverty in Africa is something of a puzzle. We know that while in-dividual country experiences vary, growth is good for the poor; pov-erty declines as per capita incomes rise. And we know that the pace of poverty reduction for any rate of income growth is affected by the distribution of income. The puzzle is that Africa has both the lowest responsiveness of poverty to per capita income growth and the lowest responsiveness of poverty to changes in income distribu-tion of any of the world’s developing regions.27 The answer to the puzzle lies in part in the structural changes that have accompanied Africa’s recent growth. Both cross- country evidence and country- level simulations suggest that Africa’s per for mance in reducing pov-erty would have been better had the region started its structural transformation earlier and had it experienced more robust growth of industry.28
Our fi rst piece of evidence comes from cross- country economet-ric work. Standard cross- country analysis of poverty reduction as-sumes that the poverty headcount ratio— the share of poor in the population—is a function of per capita income growth and income
26. Kweka and Fox (2011).27. Page (2015a).28. Africa’s poverty challenges are also related to initial conditions re-
fl ected in basic economic structures. See Arndt and others (2012).
16 Made in Africa
distribution.29 To examine the infl uence of structural change on poverty we can modify this relationship to test whether the poverty headcount ratio is affected by variations in the share of employment in agriculture, ser vices, and industry, controlling for per capita GDP and the income distribution. We performed such a test for a sample of all developing countries, and the results support our intuition that industrialization can play an important role in accelerating the pace of poverty reduction.30 Controlling for income growth and income distribution, a 1 percent increase in industrial employment is associated with a 0.8 percent reduction in the poverty headcount ratio.31
While the cross- country evidence is suggestive that industrial development can accelerate poverty reduction, it is unlikely to convince skeptics. Another way to get at the same question is to under take some simulations. There are twelve African countries where sector- specifi c poverty headcounts at the level of three broad sectors— agriculture, industry (including manufacturing), and services— are available. We can use these data to estimate what the outcome in terms of poverty would have been, had these coun-tries gone through a pattern of structural change more in line with other countries moving from low to middle income.
Because economic structure is itself a function of per capita in-come, we need a “counterfactual” distribution of employment for each of the twelve African countries at their current levels of devel-opment. To arrive at such a counterfactual we again identifi ed a sample of non- African countries, mainly in Asia, that had achieved or were rapidly transitioning to middle- income status. We averaged the shares of employment in agriculture, industry, and ser vices of the benchmark countries at the time they were at the level of per
29. See, for example, Fosu (2011).30. For those interested in the econometrics, we also controlled for un-
observed time- invariant, country- specifi c effects To address possible endo-geneity of the sectoral shares of employment, per capita income, and the Gini coeffi cient, the model was estimated by the generalized method of moments (GMM) using internal instruments (two period lags).
31. Page and Shimeles (2015).
Why Industry Matters for Africa 17
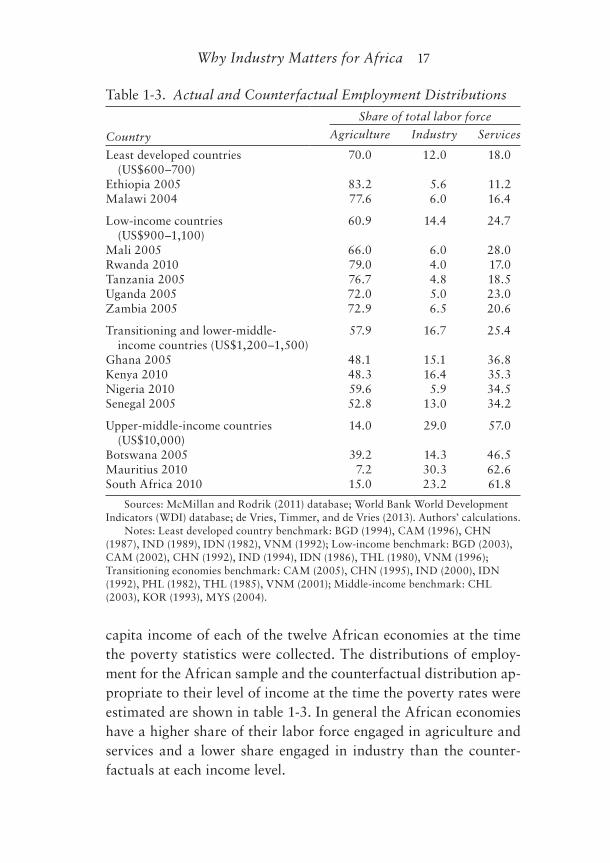
capita income of each of the twelve African economies at the time the poverty statistics were collected. The distributions of employ-ment for the African sample and the counterfactual distribution ap-propriate to their level of income at the time the poverty rates were estimated are shown in table 1-3. In general the African economies have a higher share of their labor force engaged in agriculture and ser vices and a lower share engaged in industry than the counter-factuals at each income level.
Table 1-3. Actual and Counterfactual Employment Distributions
Country
Share of total labor force
Agriculture Industry Services
Least developed countries (US$600–700)
70.0 12.0 18.0
Ethiopia 2005 83.2 5.6 11.2Malawi 2004 77.6 6.0 16.4
Low-income countries (US$900–1,100)
60.9 14.4 24.7
Mali 2005 66.0 6.0 28.0Rwanda 2010 79.0 4.0 17.0Tanzania 2005 76.7 4.8 18.5Uganda 2005 72.0 5.0 23.0Zambia 2005 72.9 6.5 20.6
Transitioning and lower-middle-income countries (US$1,200–1,500)
57.9 16.7 25.4
Ghana 2005 48.1 15.1 36.8Kenya 2010 48.3 16.4 35.3Nigeria 2010 59.6 5.9 34.5Senegal 2005 52.8 13.0 34.2
Upper-middle-income countries (US$10,000)
14.0 29.0 57.0
Botswana 2005 39.2 14.3 46.5Mauritius 2010 7.2 30.3 62.6South Africa 2010 15.0 23.2 61.8
Sources: McMillan and Rodrik (2011) database; World Bank World Development Indicators (WDI) database; de Vries, Timmer, and de Vries (2013). Authors’ calculations.
Notes: Least developed country benchmark: BGD (1994), CAM (1996), CHN (1987), IND (1989), IDN (1982), VNM (1992); Low-income benchmark: BGD (2003), CAM (2002), CHN (1992), IND (1994), IDN (1986), THL (1980), VNM (1996); Transitioning economies benchmark: CAM (2005), CHN (1995), IND (2000), IDN (1992), PHL (1982), THL (1985), VNM (2001); Middle-income benchmark: CHL (2003), KOR (1993), MYS (2004).
18 Made in Africa
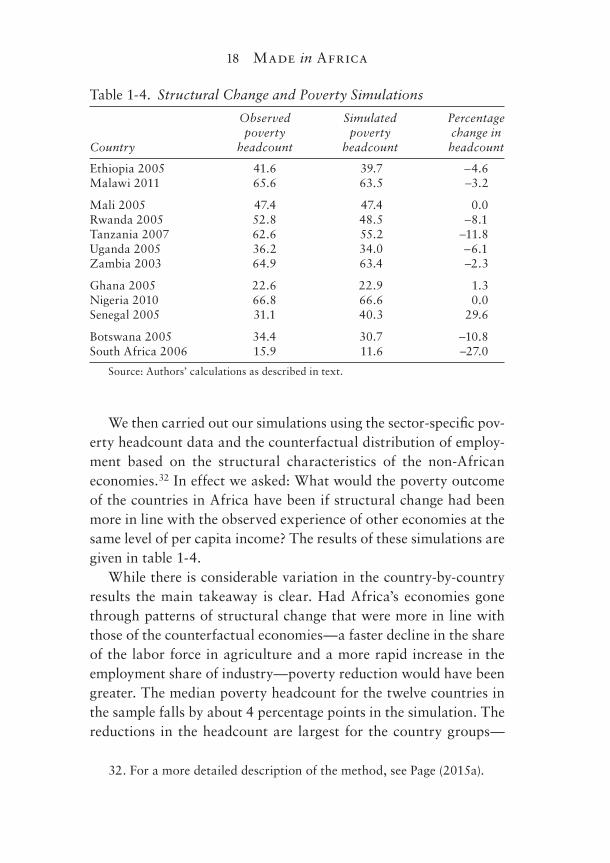
We then carried out our simulations using the sector- specifi c pov-erty headcount data and the counterfactual distribution of employ-ment based on the structural characteristics of the non- African economies.32 In effect we asked: What would the poverty outcome of the countries in Africa have been if structural change had been more in line with the observed experience of other economies at the same level of per capita income? The results of these simulations are given in table 1-4.
While there is considerable variation in the country- by- country results the main takeaway is clear. Had Africa’s economies gone through patterns of structural change that were more in line with those of the counterfactual economies— a faster decline in the share of the labor force in agriculture and a more rapid increase in the employment share of industry— poverty reduction would have been greater. The median poverty headcount for the twelve countries in the sample falls by about 4 percentage points in the simulation. The reductions in the headcount are largest for the country groups—
32. For a more detailed description of the method, see Page (2015a).
Table 1-4. Structural Change and Poverty Simulations
Country
Observed poverty
headcount
Simulated poverty
headcount
Percentage change in headcount
Ethiopia 2005 41.6 39.7 −4.6Malawi 2011 65.6 63.5 −3.2
Mali 2005 47.4 47.4 0.0Rwanda 2005 52.8 48.5 −8.1Tanzania 2007 62.6 55.2 −11.8Uganda 2005 36.2 34.0 −6.1Zambia 2003 64.9 63.4 −2.3
Ghana 2005 22.6 22.9 1.3Nigeria 2010 66.8 66.6 0.0Senegal 2005 31.1 40.3 29.6
Botswana 2005 34.4 30.7 −10.8South Africa 2006 15.9 11.6 −27.0
Source: Authors’ calculations as described in text.
Why Industry Matters for Africa 19
high- income economies and low- income economies— that most di-verge from the structural characteristics of their benchmark.
Creating Opportunities for Women
In addition to generating good jobs and accelerating poverty re-duction, industrialization has the power to transform women’s lives. Manufacturing growth has been known to be associated with in-creases in female labor force participation for a long time. This adds to house hold incomes and may increase women’s in de pen dence. More recently, evidence has begun to accumulate that manufactur-ing improves the welfare of women workers in other ways. There is some evidence that access to factory jobs increases the chances that girls will stay in school and postpone marriage by increasing the returns to education and by raising the opportunity cost of being married.
The garment industry in Bangladesh currently employs more than 3 million women, about 15 percent of women between the ages of sixteen and thirty. It was the fi rst industry to provide large- scale employment opportunities to women in a country where tradition-ally they have not worked outside the home. In addition to creating jobs, the arrival of the garment factories has affected women’s school enrollment, marriage, and childbearing decisions. Young women are entering school in greater numbers, staying in school longer, and postponing marriage and childbirth.33
Because garment manufacturing jobs reward basic literacy and numeracy, school enrollments in villages within commuting distance to garment factories have responded strongly to the arrival of tex-tile plants. Enrollment rates in villages near textile plants increased by nearly 40 percentage points compared with villages that did not have a garment factory nearby. Women appear to be seizing these
33. Rivoli (2005) points out that in the United States at the turn of the twentieth century, textile factories in the South played a similar role in women’s decisions to stay in school and postpone marriage.
20 Made in Africa
educational opportunities in higher numbers than men. Girls living in a “typical” (median) village near a textile plant stay in school for an extra 1.5 years relative to their brothers. In these villages there was a 50 percent increase in girls’ educational attainment compared to nonfactory villages. Access to manufacturing employment has also helped to reduce early marriage and childbirth. Girls in villages near factories are choosing to work when they are about seventeen to twenty- three years old instead of getting married.34
A similar transformation in the working lives of women has taken place in Lesotho. From the early 1980s to 2010, Lesotho’s manufacturing sector expanded from about 6 to 18 percent of GDP. This was driven mainly by strong growth of apparel exports, and it was accompanied by a signifi cant increase in female wage em-ployment. In recent years the garment industry has employed be-tween 35,000 and 43,000 workers, and women make up between 70 and 75 percent of the workforce. In some activities, such as cutting and sewing, women represent between 90 and 95 percent of workers.
Apparel exports have created a large number of new jobs for rel-atively unskilled women, more than 60 percent of whom come from rural areas. While wages are low, they exceed earnings in agricul-ture and self- employment. Core labor standards regarding working conditions are respected by the industry. Little is known yet about the impact of employment on women’s education, marriage, and fer-tility decisions, but employment in Lesotho’s garment industry has affected their welfare in another very important way. In a country where, by some estimates, as many as 40 percent of workers are HIV- positive, women working in the factories have access to inno-vative workplace health programs that provide free HIV care and treatment. The fact that workers can go to the clinics while they are on the factory premises is of great importance. It means that they do not miss a working day.35
34. Heath and Mobarak (2014).35. UNCTAD (2012).
Why Industry Matters for Africa 21
Manufacturing and Convergence
In an open world economy, poor countries should grow faster than rich ones. Conventional economic theory suggests that the return to investment will be higher in poor, capital- scarce economies, and global export and capital markets in principle break the constraints imposed by domestic markets and national savings. Thus, invest-ment rates in poorer economies should rise, and over the long run as capital per person grows, income per person in developing coun-tries should increase to the levels of the world’s richer economies. This is called convergence.
In reality, convergence has been the exception rather than the rule. Except in East Asia, sustained rapid growth in poor countries has been rare, and only a handful of low- income countries have reached high income levels. Economists have accommodated this re-ality in two ways. In theory, new growth models have evolved that do not impose diminishing returns to capital.36 In empirical work, convergence in developing economies has been shown to depend on a variety of country- specifi c factors that range from weak institu-tions to poor geography to inappropriate policies. The argument is that these hurdles must be overcome for investment to increase and become more productive. Only once the constraints are removed will developing nations begin to converge to rich- country income levels. This has come to be called “conditional convergence.”
Manufacturing is apparently the exception. In manufacturing, convergence is “unconditional.” Dani Rodrik has found that since 1960, output per worker in manufacturing has increased to ad-vanced economy levels, regardless of country- specifi c or regional factors. This turns out to be as true for Africa as for any other region. An equally important fi nding of Rodrik’s research is that uncondi-tional convergence is not characteristic of agriculture or ser vices.37
Unconditional convergence in manufacturing opens up two chan-nels for economywide growth. The fi rst is productivity growth within
36. For a survey of these “endogenous growth models,” see Romer (1994).37. See Rodrik (2013).
22 Made in Africa
manufacturing itself. Its importance to overall productivity growth depends on the size of the manufacturing sector, the economy’s dis-tance from best practice productivity levels, and the rate of conver-gence. The second channel is structural change into manufacturing.
Because the manufacturing sector has the potential to converge unconditionally to high levels of productivity, a shift in employment out of agriculture into manufacturing— the pattern of structural change seen in Asia— can be strongly growth enhancing.38 Econo-mywide growth depends crucially, however, on the size of the mod-ern manufacturing sector and its rate of growth—in short, on the pace of industrialization. This is not good news for Africa. Africa’s manufacturing sector is small and its pace of industrialization has been slow for more than forty years.
What You Make Matters
Two more stylized facts related to the structure of industry itself add to the case for industrialization. First, more diversifi ed production and export structures are associated with higher incomes per cap-ita. As income per person rises, the range of industrial activities be-comes more diverse until quite high levels of income are reached.39 Second, countries that produce and export more sophisticated products— those that are primarily manufactured by countries at higher income levels— tend to grow faster.40 We have found that differences in diversifi cation and sophistication are strongly related to differences in long- run growth in developing countries.
We divided a large sample of low- and middle- income countries into a four- way classifi cation based on growth per for mance and in-come level. Slow- growing countries were defi ned as those with aver-age growth below the median for all countries in the sample between
38. Rodrik (2014).39. See, for example, Imbs and Wacziarg (2003), Hummels and Klenow
(2005), and Cadot, Carrère, and Strauss- Kahn (2011).40. See Hausmann, Hwang, and Rodrik (2007) and UNIDO (2009).
Why Industry Matters for Africa 23
1975 and 2005. Fast- growing countries are those with average growth above the median. The countries were split between low- and middle- income status on the basis of their ranking in the World Bank classifi cation system in 1975. We then estimated the level of sophis-tication of production and exports in three groups of products for each country grouping between 1975 and 2005.
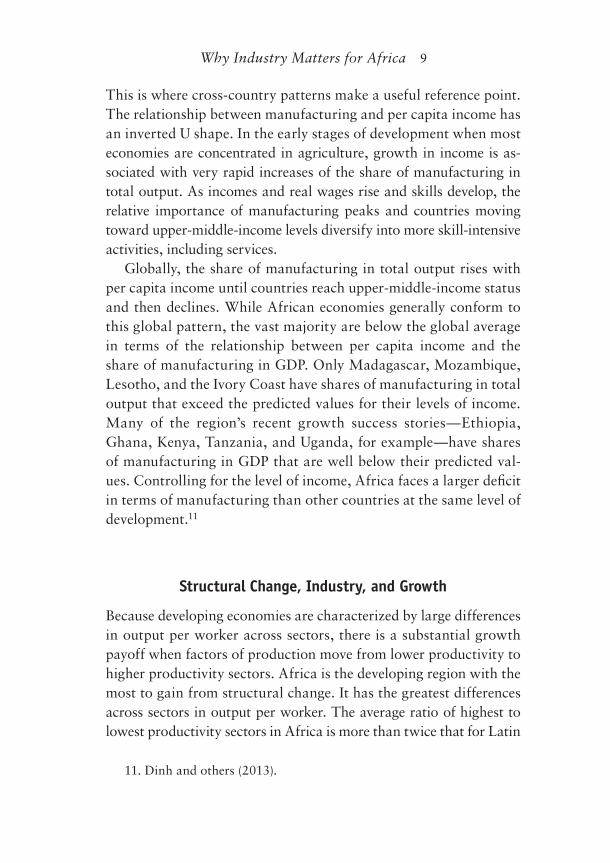
Next, we used the four- way classifi cation to explore the relation-ship between sophistication in production and exports and long- run growth. Figure 1-2 shows how the production structure of developing country manufacturing evolved in terms of sophistication between 1975 and 1985 and 1995 and 2005. Our focus is on two classes of industrial activity, low- and high- sophistication products.41 The verti-cal axis gives the average share of the country- product group in total production relative to the world as a whole. This is defi ned as “pro-duction intensity.” A value of one means that the average share of the product group in total output is equal to the global average; values less than one indicate that the product represents a smaller share of na-tional production than of global production, and vice versa.
Each vertical bar shows the average production intensity for the periods 1975–85 and 2000–05 for the country- product group. In-creases in intensity indicate that the share of the product group in na-tional output is increasing relative to its share in global output. Thus, changes in this ratio show whether an economy is entering or leaving a sector relative to the evolving structure of global production.
The results strongly support the assertion that “what you make matters.” Between 1975 and 1985 and 1995 and 2005, fast- growing low- income countries diversifi ed their production structures by increasing the production intensity of both low- sophistication and high- sophistication manufactured goods. Production among the slow growers— mainly countries in Africa—on the other hand became
41. Manufacturing activities are classifi ed as “sophisticated” if they have an index value of US$13,500 or above for the period after 1995 (re-gardless of their values in the earlier periods). Unsophisticated activities are classifi ed as those with values below US$10,000 in 1995. The omitted cat-egory of products lies between those two bounds.
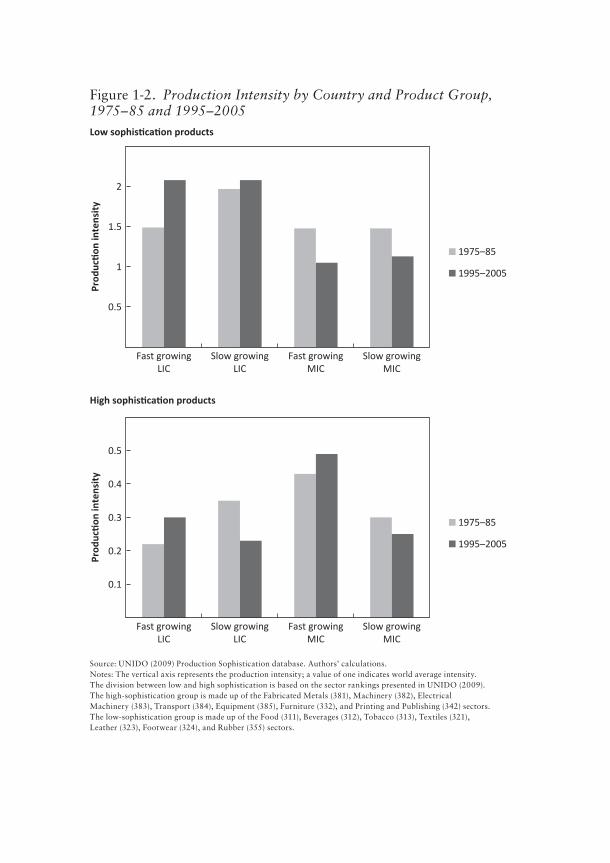
Figure 1-2. Production Intensity by Country and Product Group, 1975–85 and 1995–2005Low sophis ca on products
High sophis ca on products
0.5
1
1.5
Prod
ucon
inte
nsit
yPr
oduc
on in
tens
ity
2
Fast growingLIC
Slow growingLIC
Fast growingMIC
Slow growingMIC
1975–85
1995–2005
0.1
0.2
0.3
0.4
0.5
Fast growingLIC
Slow growingLIC
Fast growingMIC
Slow growingMIC
1975–85
1995–2005
Source: UNIDO (2009) Production Sophistication database. Authors’ calculations.Notes: The vertical axis represents the production intensity; a value of one indicates world average intensity. The division between low and high sophistication is based on the sector rankings presented in UNIDO (2009). The high- sophistication group is made up of the Fabricated Metals (381), Machinery (382), Electrical Machinery (383), Transport (384), Equipment (385), Furniture (332), and Printing and Publishing (342) sectors. The low- sophistication group is made up of the Food (311), Beverages (312), Tobacco (313), Textiles (321), Leather (323), Footwear (324), and Rubber (355) sectors.
Why Industry Matters for Africa 25
more concentrated in low- sophistication products. They also became less sophisticated. Production of high- sophistication manufacturers in slowly growing low- income countries declined dramatically in re-lation to the structure of world manufacturing output. Middle- income countries tell a similar tale. Fast and slow growers have quite distinct patterns of production intensity. Fast growers that were highly con-centrated in high- sophistication products in 1980 became more so-phisticated; slow growers did not.
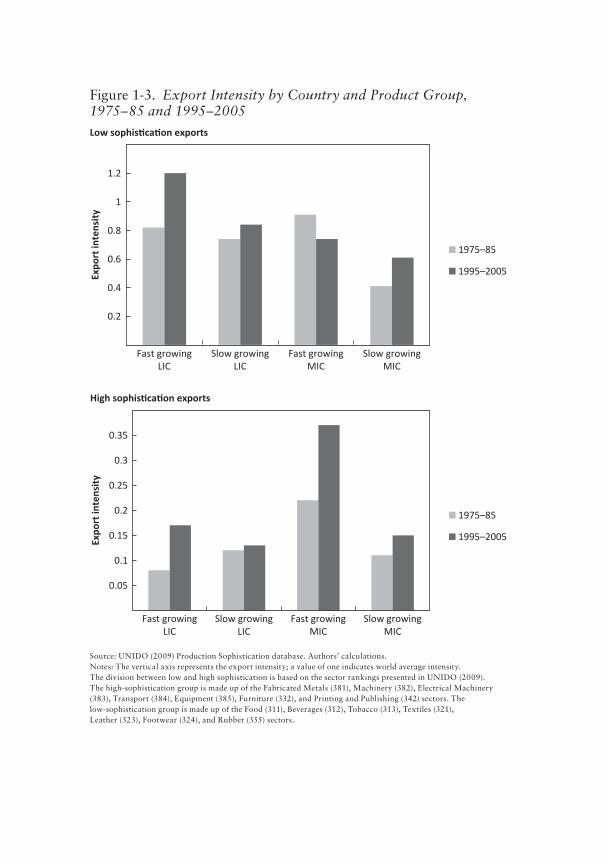
Figure 1-3 repeats the analysis for exports. The interpretation of export intensity is the same as for production intensity, except the base is the global structure of exports. This is analogous to calcu-lating revealed comparative advantage. The results for export inten-sity indicate that what you export matters as well. Fast- growing low- income countries showed a strong revealed comparative advan-tage in low- sophistication exports, as they moved decisively into the export space vacated by the rapidly growing middle- income coun-tries. The fast growers also nearly doubled the intensity of high- sophistication exports. Slowly growing low- income countries only modestly increased the intensity of low- sophistication exports, and export intensities of high- sophistication manufactures were vir-tually unchanged over two de cades. Fast- growing middle- income countries exited low- sophistication exports and rapidly increased the intensity of high- sophistication exports, in marked contrast to their slow- growing counterparts.
Our results suggest that economies that succeed in moving up in terms of the diversity and sophistication of their manufacturing sector have greater prospects for sustained long- term growth. One reason may be that more diverse economies are better able to take advan-tage of opportunities in global markets. Industrial diversifi cation ap-pears to take place at lower levels of per capita income than export diversifi cation.42 This is consistent with the idea that fi rms build competence in new activities locally and then enter global markets.
Diversifi cation into more sophisticated products provides an ad-ditional advantage. Because sophisticated products embody advanced
42. UNIDO (2009).
Low sophis ca on exports
High sophis ca on exports
0.2
0.4
0.6
0.8
1
1.2
Fast growingLIC
Expo
rt in
tens
ity
Expo
rt in
tens
ity
Slow growingLIC
Fast growingMIC
Slow growingMIC
1975–85
1995–2005
0.05
0.1
0.15
0.2
0.25
0.3
0.35
Fast growingLIC
Slow growingLIC
Fast growingMIC
Slow growingMIC
1975–85
1995–2005
Figure 1-3. Export Intensity by Country and Product Group, 1975–85 and 1995–2005
Source: UNIDO (2009) Production Sophistication database. Authors’ calculations.Notes: The vertical axis represents the export intensity; a value of one indicates world average intensity. The division between low and high sophistication is based on the sector rankings presented in UNIDO (2009). The high- sophistication group is made up of the Fabricated Metals (381), Machinery (382), Electrical Machinery (383), Transport (384), Equipment (385), Furniture (332), and Printing and Publishing (342) sectors. The low- sophistication group is made up of the Food (311), Beverages (312), Tobacco (313), Textiles (321), Leather (323), Footwear (324), and Rubber (355) sectors.
Why Industry Matters for Africa 27
country productivity levels, the ability of fi rms in lower income countries to produce and, especially, to export such goods indi-cates that they have mastered both the technology and the man-agement practices required to be globally competitive in price and quality. These are “high capability” fi rms in the sense that we shall discuss in chapter 5, and economies with large numbers of high ca-pability fi rms have a strong base for productivity change and long- run growth.43
Like many of the structural characteristics that we discuss in this book, the roles of convergence, diversity, and sophistication appear to change during the pro cess of economic development. At low levels of per capita income, unconditional convergence to best practice productivity levels, driven by better knowledge of production and technological catch-up, is likely to be the primary source of produc-tivity change in manufacturing. Because the impact of convergence depends on the size of the manufacturing sector and the rate of its growth, structural transformation driven by the expansion of indus-try, even in relatively unsophisticated activities, can be a signifi cant source of productivity growth in low- income countries. As incomes rise, productivity growth from sectoral reallocation is eventually ex-hausted, and fi rm- level sources of productivity growth become in-creasingly important.44 Diversity and sophistication are then likely to play a larger role in sustaining productivity growth in manufac-turing and overall economic growth by contributing to the accumu-lation of fi rm capabilities.
Summing Up
This chapter has presented our case for industrial development in Africa. We believe it is a strong one. Africa has seen a “growth
43. Sutton (2012).44. One strand of the literature on “middle- income traps” explores the
implications of this shift for economies trying to break into high- income status. See, for example, Eichengreen, Park, and Shin (2011) and Gill and Kharas (2007).
28 Made in Africa
miracle” over the last two de cades. However, until quite recently this remarkable growth took place without the kinds of changes in economic structure that were the hallmarks of the economic trans-formations of today’s high- income industrialized economies and, more recently, of the rapidly growing economies in East Asia. In fact, until the turn of this century structural change in Africa may have reduced its overall rate of growth of output per person. The missing player in Africa’s growth story has been industry. Even for its level of income, the relative size of Africa’s industrial sector and especially manufacturing is smaller than expected. Given the aspi-rations of Africa’s economies to place themselves solidly among the ranks of middle- income countries by 2025–30, this defi cit will need to close.
Industry matters for Africa in multiple ways. Africa has only re-cently begun to experience growth- enhancing structural change, but these changes have been unlike those experienced elsewhere. The shift in employment has been from agriculture to ser vices, where output per worker is less than a third of manufacturing. Africa’s inability to create enough higher output per worker jobs in the face of a rap-idly growing labor force has reduced the impact of growth on wage employment and poverty reduction. Industry can make a positive con-tribution to solving these problems. Industry is an engine of growth- enhancing structural change. Manufacturing, tradable ser vices, and agro- industry are all labor- intensive, high productivity sectors into which workers leaving agriculture can move. This movement is critical for the growth of wage employment and poverty reduction.
Manufacturing also has a special role to play in sustaining growth. Modern manufacturing industries converge to best practice productivity levels regardless of geo graph i cal disadvantages, poor institutions, or bad policies. This provides a powerful engine of pro-ductivity growth and increases the potential for growth- enhancing structural change. When productivity growth within the manufactur-ing sector and structural change work in tandem, the growth payoff can be large. Within the manufacturing sector what a country makes matters. At higher levels of income per capita, more diverse and so-

Why Industry Matters for Africa 29
phisticated production and export structures increase the chances for sustained growth.
While these characteristics of industry open up new possibilities for growth, job creation, and poverty reduction, success mainly depends on the pace of industrialization. That is not good news. Today, sub- Saharan Africa is more or less where it started in terms of industrial development half a century ago. The policy choices and external circumstances that helped to shape this trajectory are the subject of the next chapter.