Embed Size (px)
Citation preview
GSM, cdmaOne and 3G Systems
GSM, cdmaOne and 3G Systems. Raymond Steele, Chin-Chun Lee and Peter GouldCopyright © 2001 John Wiley & Sons Ltd
Print ISBN 0-471-49185-3 Electronic ISBN 0-470-84167-2
GSM, cdmaOne and 3G Systems
Raymond SteeleChairman,Multiple Access Communications Ltd,Southampton, UK
Chin-Chun LeeProfessor of Commmunications,Da-Yeh University, Chang-Hwa, Taiwan
Peter GouldDirector,Multiple Access Communications Ltd,Southampton, UK
JOHN WILEY & SONS, LTDChichester • Weinheim • New York • Brisbane • Singapore • Toronto

Copyright © 2001 by John Wiley & Sons Ltd Baffins Lane, Chichester, West Sussex, PO19 1UD, England
National 01243 779777 International (+44) 1243 779777
e-mail (for orders and customer service enquiries): [email protected]
Visit our Home Page on http://www.wiley.co.ukor
http://www.wiley.com
All Rights Reserved. No part of this publication may be reproduced, stored in a retrieval system, ortransmitted, in any form or by any means, electronic, mechanical, photocopying, recording, scanning orotherwise, except under the terms of the Copyright Designs and Patents Act 1988 or under the terms of alicence issued by the Copyright Licensing Agency, 90 Tottenham Court Road, London, W1P 9HE, UK,without the permission in writing of the Publisher, with the exception of any material supplied specificallyfor the purpose of being entered and executed on a computer system, for exclusive use by the purchaser ofthe publication. Neither the authors nor John Wiley & Sons Ltd accept any responsibility or liability for loss or damageoccasioned to any person or property through using the material, instructions, methods or ideas containedherein, or acting or refraining from acting as a result of such use. The authors and Publisher expresslydisclaim all implied warranties, including merchantability of fitness for any particular purpose. There willbe no duty on the authors of Publisher to correct any errors or defects in the software. Designations used by companies to distinguish their products are often claimed as trademarks. In allinstances where John Wiley & Sons is aware of a claim, the product names appear in initial capital orcapital letters. Readers, however, should contact the appropriate companies for more complete informationregarding trademarks and registration.
Other Wiley Editorial Offices
John Wiley & Sons, Inc., 605 Third Avenue,New York, NY 10158-0012, USA
Wiley-VCH Verlag GmbHPappelallee 3, D-69469 Weinheim, Germany
Jacaranda Wiley Ltd, 33 Park Road, Milton,Queensland 4064, Australia
John Wiley & Sons (Canada) Ltd, 22 Worcester RoadRexdale, Ontario, M9W 1L1, Canada
John Wiley & Sons (Asia) Pte Ltd, 2 Clementi Loop #02-01,Jin Xing Distripark, Singapore 129809
British Library Cataloguing in Publication Data
A catalogue record for this book is available from the British Library
ISBN 0 471 49185 3
Produced from PostScript files supplied by the authorsPrinted and bound in Great Britain by Bookcraft (Bath) LtdThis book is printed on acid-free paper responsibly manufactured from sustainable forestry,in which at least two trees are planted for each one used for paper production.
Contents
Preface ix
1 Introduction to Cellular Radio 11.1 A Single Cell . . . . . . . . . . . . . . . . . . . . . . . . . . . . . . . . . 21.2 Multiple Cells . . . . . . . . . . . . . . . . . . . . . . . . . . . . . . . . . 7
1.2.1 Hexagonal cells . . . . . . . . . . . . . . . . . . . . . . . . . . . . 91.2.2 Sectorisation . . . . . . . . . . . . . . . . . . . . . . . . . . . . . 13
1.3 The TDMA Radio Interface . . . . . . . . . . . . . . . . . . . . . . . . . . 151.3.1 Multiple access procedure for TDMA . . . . . . . . . . . . . . . . 151.3.2 The TDMA radio link . . . . . . . . . . . . . . . . . . . . . . . . 18
1.4 The CDMA Radio Interface . . . . . . . . . . . . . . . . . . . . . . . . . 261.4.1 Binary phase shift keying . . . . . . . . . . . . . . . . . . . . . . . 271.4.2 Spectrum spreading . . . . . . . . . . . . . . . . . . . . . . . . . . 30
1.4.3 The spread signal . . . . . . . . . . . . . . . . . . . . . . . . . . . 351.4.4 Multiple CDMA users . . . . . . . . . . . . . . . . . . . . . . . . 371.4.5 Simple capacity equation . . . . . . . . . . . . . . . . . . . . . . . 391.4.6 Cellular CDMA . . . . . . . . . . . . . . . . . . . . . . . . . . . . 41
1.5 Cellular Network Architecture . . . . . . . . . . . . . . . . . . . . . . . . 541.5.1 Physical and logical channels . . . . . . . . . . . . . . . . . . . . 541.5.2 Traffic and signalling channels . . . . . . . . . . . . . . . . . . . . 541.5.3 Network topology . . . . . . . . . . . . . . . . . . . . . . . . . . 561.5.4 Making a call to a mobile subscriber . . . . . . . . . . . . . . . . . 58
2 The GSM System 652.1 Introduction . . . . . . . . . . . . . . . . . . . . . . . . . . . . . . . . . . 652.2 An Overview of the GSM Network Architecture . . . . . . . . . . . . . . . 68
v
CONTENTS
2.2.1 The mobile station . . . . . . . . . . . . . . . . . . . . . . . . . . 69
2.2.2 The base station subsystem . . . . . . . . . . . . . . . . . . . . . . 722.2.3 The mobile services switching centre . . . . . . . . . . . . . . . . 73
2.2.4 The GSM network databases . . . . . . . . . . . . . . . . . . . . . 73
2.2.5 The management of GSM networks . . . . . . . . . . . . . . . . . 752.3 The GSM Radio Interface . . . . . . . . . . . . . . . . . . . . . . . . . . . 76
2.3.1 The GSM modulation scheme . . . . . . . . . . . . . . . . . . . . 772.3.2 The GSM radio carriers . . . . . . . . . . . . . . . . . . . . . . . 80
2.3.3 The GSM power classes . . . . . . . . . . . . . . . . . . . . . . . 842.3.4 The GSM bursts . . . . . . . . . . . . . . . . . . . . . . . . . . . 85
2.3.5 The GSM receiver . . . . . . . . . . . . . . . . . . . . . . . . . . 89
2.3.6 Physical and logical channels . . . . . . . . . . . . . . . . . . . . 1022.3.7 Mapping logical channels onto physical channels . . . . . . . . . . 107
2.3.8 The GSM frame structure . . . . . . . . . . . . . . . . . . . . . . 1082.3.9 Speech transmission . . . . . . . . . . . . . . . . . . . . . . . . . 114
2.3.10 User data transmission . . . . . . . . . . . . . . . . . . . . . . . . 1242.3.11 Control data transmission . . . . . . . . . . . . . . . . . . . . . . 126
2.3.12 Ciphering of control data . . . . . . . . . . . . . . . . . . . . . . . 129
2.4 Control of the radio resource . . . . . . . . . . . . . . . . . . . . . . . . . 1292.4.1 Cell selection . . . . . . . . . . . . . . . . . . . . . . . . . . . . . 130
2.4.2 Idle mode . . . . . . . . . . . . . . . . . . . . . . . . . . . . . . . 1322.4.3 Access mode . . . . . . . . . . . . . . . . . . . . . . . . . . . . . 133
2.4.4 Handover . . . . . . . . . . . . . . . . . . . . . . . . . . . . . . . 135
2.4.5 Power control . . . . . . . . . . . . . . . . . . . . . . . . . . . . . 1422.4.6 Frequency hopping . . . . . . . . . . . . . . . . . . . . . . . . . . 143
2.5 Security Issues . . . . . . . . . . . . . . . . . . . . . . . . . . . . . . . . 1452.5.1 Introduction . . . . . . . . . . . . . . . . . . . . . . . . . . . . . . 145
2.5.2 PIN code protection . . . . . . . . . . . . . . . . . . . . . . . . . 1452.5.3 Authentication . . . . . . . . . . . . . . . . . . . . . . . . . . . . 146
2.5.4 Encryption . . . . . . . . . . . . . . . . . . . . . . . . . . . . . . 147
2.5.5 The temporary mobile subscriber identity (TMSI) . . . . . . . . . . 147
3 Capacity of GSM Systems 1513.1 List of Mathematical Symbols . . . . . . . . . . . . . . . . . . . . . . . . 151
3.2 Introduction . . . . . . . . . . . . . . . . . . . . . . . . . . . . . . . . . . 1533.3 Macrocellular GSM Network: Up-link Transmissions . . . . . . . . . . . . 154
3.3.1 The SIR for omnidirectional macrocells . . . . . . . . . . . . . . . 1543.3.2 The SIR for sectorised macrocells . . . . . . . . . . . . . . . . . . 160
vi
CONTENTS
3.4 Macrocellular GSM Network: Down-link Transmissions . . . . . . . . . . 1673.4.1 The SIR for omnidirectional macrocells . . . . . . . . . . . . . . . 1673.4.2 The SIR for sectorised macrocells . . . . . . . . . . . . . . . . . . 170
3.5 Macrocellular GSM Network: Capacity . . . . . . . . . . . . . . . . . . . 1773.5.1 Effect of sectorisation on teletraffic . . . . . . . . . . . . . . . . . 1793.5.2 Summary of the performance of the macrocellular GSM network . . 180
3.6 Microcellular GSM Network . . . . . . . . . . . . . . . . . . . . . . . . . 1833.6.1 Path loss and shadow fading in city street microcells . . . . . . . . 1853.6.2 Up-link SIR values for a cross-shaped microcellular network . . . . 1863.6.3 Up-link SIR values for rectangular-shaped microcells . . . . . . . 1893.6.4 Microcellular GSM network capacity . . . . . . . . . . . . . . . . 1933.6.5 Irregular-shaped microcells . . . . . . . . . . . . . . . . . . . . . . 194
4 The cdmaOne System 2054.1 Introduction . . . . . . . . . . . . . . . . . . . . . . . . . . . . . . . . . . 2054.2 The cdmaOne Radio Interface . . . . . . . . . . . . . . . . . . . . . . . . 206
4.2.1 Operating frequencies . . . . . . . . . . . . . . . . . . . . . . . . 2064.2.2 The cdmaOne Forward link . . . . . . . . . . . . . . . . . . . . . 2094.2.3 The cdmaOne reverse link . . . . . . . . . . . . . . . . . . . . . . 248
4.3 Control of the Radio Resources . . . . . . . . . . . . . . . . . . . . . . . . 2714.3.1 Cell selection . . . . . . . . . . . . . . . . . . . . . . . . . . . . . 2714.3.2 The idle mode and paging . . . . . . . . . . . . . . . . . . . . . . 2734.3.3 The access procedure . . . . . . . . . . . . . . . . . . . . . . . . . 2744.3.4 Handover . . . . . . . . . . . . . . . . . . . . . . . . . . . . . . . 2754.3.5 Hard handover . . . . . . . . . . . . . . . . . . . . . . . . . . . . 2814.3.6 Power control . . . . . . . . . . . . . . . . . . . . . . . . . . . . . 281
5 Analysis of IS-95 2855.1 List of Mathematical Symbols . . . . . . . . . . . . . . . . . . . . . . . . 2855.2 Introduction . . . . . . . . . . . . . . . . . . . . . . . . . . . . . . . . . . 2895.3 CDMA in a Single Macrocell . . . . . . . . . . . . . . . . . . . . . . . . . 290
5.3.1 The up-link system . . . . . . . . . . . . . . . . . . . . . . . . . . 2905.3.2 The down-link system . . . . . . . . . . . . . . . . . . . . . . . . 303
5.4 CDMA Macrocellular Networks . . . . . . . . . . . . . . . . . . . . . . . 3085.4.1 The up-link system . . . . . . . . . . . . . . . . . . . . . . . . . . 3095.4.2 The down-link system . . . . . . . . . . . . . . . . . . . . . . . . 3225.4.3 Down-link with orthogonal codes . . . . . . . . . . . . . . . . . . 3325.4.4 Effect of sectorisation . . . . . . . . . . . . . . . . . . . . . . . . 3375.4.5 The capacity of the IS-95 CDMA in macrocells . . . . . . . . . . . 339
vii
CONTENTS
5.4.6 The effect of channel coding on CDMA systems . . . . . . . . . . 3405.4.7 Summary . . . . . . . . . . . . . . . . . . . . . . . . . . . . . . . 342
5.5 IS-95 Street Microcellular Networks . . . . . . . . . . . . . . . . . . . . . 3445.5.1 Up-link system and signal model . . . . . . . . . . . . . . . . . . . 3455.5.2 Performance of the up-link . . . . . . . . . . . . . . . . . . . . . . 3485.5.3 Down-link system and signal model . . . . . . . . . . . . . . . . . 3625.5.4 Performance of the down-link . . . . . . . . . . . . . . . . . . . . 3645.5.5 Capacity of IS-95 in street microcells . . . . . . . . . . . . . . . . 3675.5.6 Summary . . . . . . . . . . . . . . . . . . . . . . . . . . . . . . . 369
5.6 Power Control in CDMA Systems . . . . . . . . . . . . . . . . . . . . . . 3705.6.1 Channel model . . . . . . . . . . . . . . . . . . . . . . . . . . . . 3705.6.2 Estimation of the received signal power . . . . . . . . . . . . . . . 3715.6.3 Estimation of Eb=I0 . . . . . . . . . . . . . . . . . . . . . . . . . . 3755.6.4 Estimation of Eb=I0 for RAKE receivers . . . . . . . . . . . . . . . 3765.6.5 Power control scheme . . . . . . . . . . . . . . . . . . . . . . . . 3775.6.6 Simulations and results . . . . . . . . . . . . . . . . . . . . . . . . 3815.6.7 Summary . . . . . . . . . . . . . . . . . . . . . . . . . . . . . . . 393
6 Evolution of GSM and cdmaOne to 3G Systems 4046.1 Introduction . . . . . . . . . . . . . . . . . . . . . . . . . . . . . . . . . . 404
6.1.1 The generation game . . . . . . . . . . . . . . . . . . . . . . . . . 4046.1.2 IMT-2000 spectrum . . . . . . . . . . . . . . . . . . . . . . . . . . 407
6.2 Evolution of GSM . . . . . . . . . . . . . . . . . . . . . . . . . . . . . . . 4076.2.1 High speed circuit-switched data . . . . . . . . . . . . . . . . . . . 4106.2.2 The general packet radio service . . . . . . . . . . . . . . . . . . . 4116.2.3 The enhanced data rates for GSM evolution (EDGE) . . . . . . . . 420
6.3 The Universal Mobile Telecommunication System . . . . . . . . . . . . . . 4226.3.1 The UTRA FDD mode . . . . . . . . . . . . . . . . . . . . . . . . 4266.3.2 UTRA TDD system . . . . . . . . . . . . . . . . . . . . . . . . . 467
6.4 Evolution of IS-95 to cdma2000 . . . . . . . . . . . . . . . . . . . . . . . 4866.4.1 Forward link . . . . . . . . . . . . . . . . . . . . . . . . . . . . . 4886.4.2 Reverse link . . . . . . . . . . . . . . . . . . . . . . . . . . . . . . 4946.4.3 cdma2000 TDD . . . . . . . . . . . . . . . . . . . . . . . . . . . . 498
v iii
Preface
This book is concerned with the description and analysis of the global second generation(2G) mobile radio systems: the Global System of Mobile Communications (GSM) andcdmaOne. A subsidiary goal is to examine how these two systems will evolve into thirdgeneration (3G) ones with their requirement to support multimedia mobile radio commu-nications. The motivation for this book originated when we were asked to compare thecapacities of GSM and, as cdmaOne was known then, IS-95. The multiple access methodused by GSM is time division multiple access (TDMA), and this represented a significantchange from the first generation (1G) analogue systems that operated with frequency divi-sion multiple access (FDMA). IS-95 had a more complex radio interface than GSM, em-ploying code division multiple access (CDMA). Engineers at that time often held strongand somewhat uncompromising views regarding multiple access methods. We preferredCDMA from a spectral efficiency point of view, although that does not mean that CDMAshould be deployed in preference to TDMA as there are many complex performance andeconomic factors to be considered when deciding on the type of system to select.
GSM was deployed before cdmaOne and is the market leader, entrenched in many partsof the world. Its success is due to numerous factors: its advanced backbone network, the in-troduction of subscriber identity modules (SIMs) that decoupled handsets from subscribers,its good security system, the low cost equipment due to open (i.e. public) interfaces, therelentless programme of evolution that has yielded substantial gains in spectral efficiencycompared with the basic GSM system, and so on.
cdmaOne started as a radio interface. It was a bold step to use CDMA at a time when fewthought CDMA could work in a cellular environment. But it did so, acquiring the necessarybackbone network, and became a global standard offering tough competition to GSM. Itis also worthy of note that Europe, which had designed and promoted GSM, has opted forwideband CDMA for its third generation (3G) networks.
Our cardinal objectives in this book are to present to the reader detailed descriptions
i x
of the basic GSM and cdmaOne systems, mainly from the radio interface point of view;as well as accompanying analyses. Our first chapter is designed to provide backgroundmaterial on TDMA, CDMA and cellular radio networks. The reader knowledgeable inmobile radio should omit reading this chapter and proceed directly to Chapter 2 whichdescribes the basic GSM system. Chapter 3 provides an analysis of the performance ofGSM networks. The same method of system description followed by a chapter dedicatedto mathematical analysis is applied for cdmaOne in Chapters 4 and 5, respectively. Thefinal chapter endeavours to describe how GSM is evolving to provide higher bit rate circuit-switched channels and packet transmissions that will have an ability to provide a range ofmultimedia services. The Universal Mobile Telecommunications System (UMTS) is thendescribed, followed by a discussion of the evolution of cdmaOne to cdma2000. Both UMTSand cdma2000 are 3G systems.
The authors express their gratitude to those who have helped them in the gestation of thisbook. In particular they thank Dr Sheyam Lal Dhomeja for proof reading Chapters 2 and5, Denise Harvey for her typing and helping to get the book to fruition, our colleagues atMultiple Access Communications Ltd for providing snipits of knowledge when required,and last, but not least, our loved ones for providing the support all authors need.
x
Chapter 1Introduction to Cellular Radio
This book is concerned with two digital mobile radio systems: the global system for mo-bile communications (GSM); and a code division multiple access (CDMA) system thatwas originally known as the American interim standard 95, or IS-95 and is now called cd-maOne [1–7]. While GSM was conceived and developed through the concerted efforts ofregulators, operators and equipment manufacturers in Europe, cdmaOne owes its existenceto one dynamic Californian company, Qualcomm Inc. The authors have been involvedwith both the pan-European mobile radio system, which became GSM, and the QualcommCDMA system for a number of years. The GSM system predates cdmaOne.
The two systems are very different. The radio interface of GSM relies on time divisionmultiple access (TDMA), which means that its radio link is very different to that of cd-maOne. Also GSM is a complete network specification, from the subscriber unit throughto the network gateway. Indeed its fixed network component is perhaps its most advancedfeature [1,2]. cdmaOne, by contrast, has a more complex and advanced radio interface, andonly later were fixed network issues addressed [3,7].
In the chapters to follow, the GSM and cdmaOne systems will be described and analysedwhile the final chapter deals with their evolution to third generation systems. This chapter ismeant to provide background information on cellular radio [1–11]. The reader who is wellacquainted with the fundamentals of mobile radio communications should therefore bypassthis chapter.
For the reader who has elected to read this chapter we should state at the outset thatour goal is to provide a clear exposition of the concepts of the subject rather than detailedanalyses, which will follow in the later chapters. The first point to make is that a mobileradio network has a radio interface that enables a mobile station (MS) to communicatewith the fixed part of the mobile network. Both components, the radio interface that fa-cilitates user mobility, and the fixed network that enables the mobile to communicate with
1
eter GouldWiley & Sons Ltd
GSM, cdmaOne and 3G Systems. Raymond Steele, Chin-Chun Lee and Peter GouldCopyright © 2001 John Wiley & Sons Ltd
Print ISBN 0-471-49185-3 Electronic ISBN 0-470-84167-2
2 CHAPTER 1. INTRODUCTION TO CELLULAR RADIO
other users via the public switch telephone network (PSTN) or the integrated services dig-ital network (ISDN), are radically dissimilar and complex. This means that to have a goodappreciation of mobile radio requires a wide knowledge that includes speech coding, chan-nel coding, interleavers, radio modems, radio propagation, antennas, channel equalisation,RAKE receivers, diversity techniques, radio planning of cells, the significance of signal-to-interference ratios (SIRs), bit error rate (BER), teletraffic issues, protocol stacks, locationdatabases, signalling systems, encryption, authentication procedures, switching, packetisa-tion techniques, and so on. If some of these subjects are dealt with from a standing start inother chapters they will not be dealt with here. Neither will they be considered if they areoutside the confines of this text. What we will consider here are topics that are needed whenwe come to our discussions of GSM and cdmaOne.
There are many ways of describing cellular radio, and the two most obvious are a bottom-up approach, or a top-down one. The former starts with the basic principles of radio prop-agation, to the concept of a cell, then clusters of cells to the radio links and multiple accessmethods, to setting-up, maintaining, and clearing-down of calls. The top-down approachis essentially the reverse process, starting with the big picture and ending up with radiopropagation issues. We have opted for the bottom-up approach, building on concept afterconcept, until the overall concept of the network can be appreciated. Our starting point isthe notion of a single cell.
1.1 A Single Cell
Consider a base station (BS) having an antenna located on a tower radiating an electromag-netic signal to a mobile station (MS). The received signal depends on many factors. Theoutput port of the BS equipment delivers power at the appropriate radio frequency (RF) intothe cable connected to the antenna. There are losses in the cable, e.g. a 40 W RF signalat the BS equipment may yield only 16 W of radiated power. The BS antenna is usuallydirectional, which means that power is directed over a solid angle rather than over all an-gles. This means that compared with isotropic radiator there is a gain G(θ;φ) of power inthe θ and φ directions, where θ and φ are angles measured in the vertical and horizontaldirections, respectively.
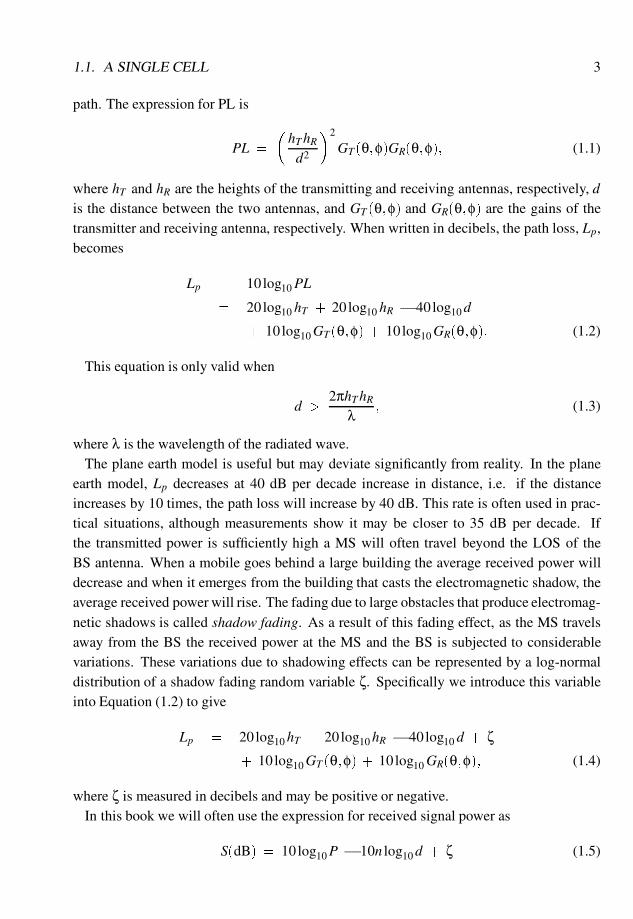
As the transmitted energy spreads out from the BS, the amount of power the MS antennacan receive diminishes [12, 13]. The mobile’s antenna is usually located only one to twometres above the ground whereas the BS antenna may be at a height from several metresto in excess of a hundred metres. The heights of the antenna affect the path loss, i.e. thedifference in the received signal power at the MS antenna compared with the BS transmittedpower. The path loss (PL) is usually measured in decibels (dB). As an example, for the planeearth model there are two paths, a direct line-of-sight (LOS) path and a ground-reflected
1.1. A SINGLE CELL 3
path. The expression for PL is
PL =
�hThRd2
�2
GT (θ;φ)GR(θ;φ); (1.1)
where hT and hR are the heights of the transmitting and receiving antennas, respectively, dis the distance between the two antennas, and GT (θ;φ) and GR(θ;φ) are the gains of thetransmitter and receiving antenna, respectively. When written in decibels, the path loss, Lp,becomes
Lp = 10log10PL
= 20log10 hT + 20log10 hR � 40log10d
+ 10log10GT (θ;φ) + 10log10GR(θ;φ): (1.2)
This equation is only valid when
d >2πhThR
λ; (1.3)
where λ is the wavelength of the radiated wave.The plane earth model is useful but may deviate significantly from reality. In the plane
earth model, Lp decreases at 40 dB per decade increase in distance, i.e. if the distanceincreases by 10 times, the path loss will increase by 40 dB. This rate is often used in prac-tical situations, although measurements show it may be closer to 35 dB per decade. Ifthe transmitted power is sufficiently high a MS will often travel beyond the LOS of theBS antenna. When a mobile goes behind a large building the average received power willdecrease and when it emerges from the building that casts the electromagnetic shadow, theaverage received power will rise. The fading due to large obstacles that produce electromag-netic shadows is called shadow fading. As a result of this fading effect, as the MS travelsaway from the BS the received power at the MS and the BS is subjected to considerablevariations. These variations due to shadowing effects can be represented by a log-normaldistribution of a shadow fading random variable ζ. Specifically we introduce this variableinto Equation (1.2) to give
Lp = 20log10hT + 20log10hR � 40log10 d + ζ+ 10log10GT (θ;φ) + 10log10GR(θ;φ); (1.4)
where ζ is measured in decibels and may be positive or negative.In this book we will often use the expression for received signal power as
S(dB) = 10log10P � 10n log10d + ζ (1.5)

4 CHAPTER 1. INTRODUCTION TO CELLULAR RADIO
or, when not in decibels, the expression becomes
S = Pd�n10ζ=10; (1.6)
where P is the transmitted power from the BS and n is called the exponent of the PL.Observe that when we employ Equations (1.5) or (1.6), the terms relating to antenna heightsand antenna gains are absent. This is because we often ignore the effects associated with theantennas on the path loss when we are concerned with signal-to-interference ratios (SIRs)since these parameters tend to cancel out on the signal and interference paths. Equation (1.6)is used extensively in Chapters 3 and 5.
The MS is not only subjected to shadow fading, but also to small scale fading, i.e. dueto the received signal changing in amplitude and phase as a consequence of a small changein the spatial separation (e.g. fraction of a wavelength) between the MS and its BS [4].This occurs because the MS is travelling through an electromagnetic field, receiving morethan one version of the same transmitted signal that travelled via different paths. Eachpath results in a component of the received signal that has a specific attenuation and phaseorientation. The received signal at the MS is therefore the vector sum of all these multipathsignals. The vector sum may be large at one instant and a small movement of the MSmay result in the multipath signal being very small. This variation often takes place over adistance of half a wavelength which is only (3�108)=(2�109) = 15 cm for a 1 GHz radiofrequency carrier.
If the received paths are close together in time, we may represent the channel impulsefunction by a single delta function whose amplitude is Rayleigh distributed while its phasehas a uniform distribution. The Fourier transform of a delta function is a flat spectrum.Since the weighting of the delta function varies due to the fading, the magnitude of the flatspectrum changes, and the condition is known as flat fading. This means all the frequenciesin the received signal fade together and by the same amount.
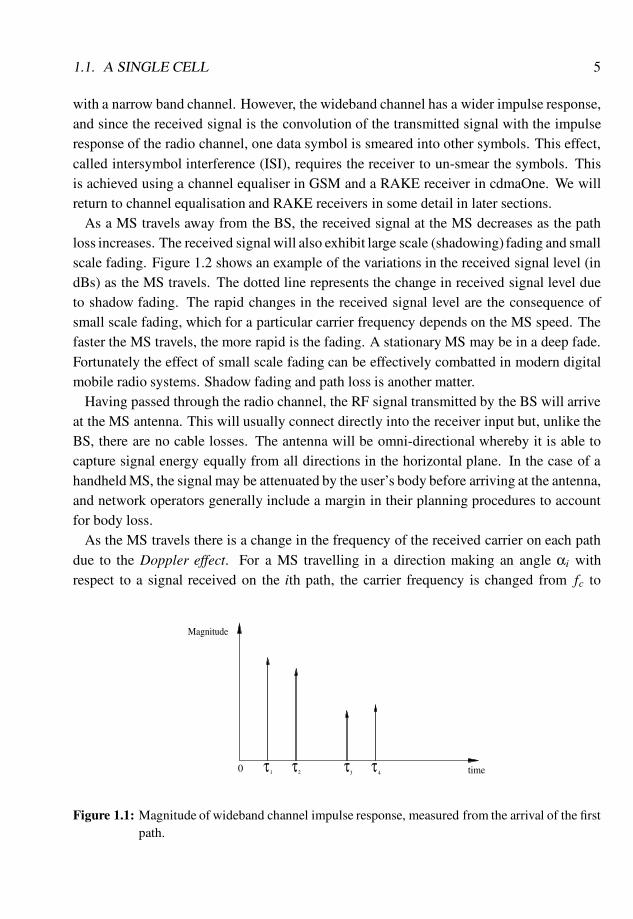
Often we have a path arriving in the vicinity of the MS and subjected to local scatteringproducing a single delta function that is Rayleigh distributed. Then another ray arrives yield-ing another delta function that is also Rayleigh distributed. This process of each receivedray causing a group of scattered rays that can be represented by a Rayleigh distributed deltafunction yields a channel impulse response that is itself made up of a number of impulsesor delta functions at epochs 0, τ1, τ2; : : :, as shown in Figure 1.1. Since each delta functionis fading independently the spectrum of the radio channel no longer fades uniformly for allfrequencies. This type of fading is called frequency selective fading, which means that inthe time domain the depths of the fades are, in general, much less than for flat fading. Inthe latter case the fading can be very deep, typically up to 40 dB, and this may cause burstsof symbol errors. As a consequence, having a wideband channel means that the signal isless likely to drop below the receiver sensitivity for a given transmitted power compared
1.1. A SINGLE CELL 5
with a narrow band channel. However, the wideband channel has a wider impulse response,and since the received signal is the convolution of the transmitted signal with the impulseresponse of the radio channel, one data symbol is smeared into other symbols. This effect,called intersymbol interference (ISI), requires the receiver to un-smear the symbols. Thisis achieved using a channel equaliser in GSM and a RAKE receiver in cdmaOne. We willreturn to channel equalisation and RAKE receivers in some detail in later sections.
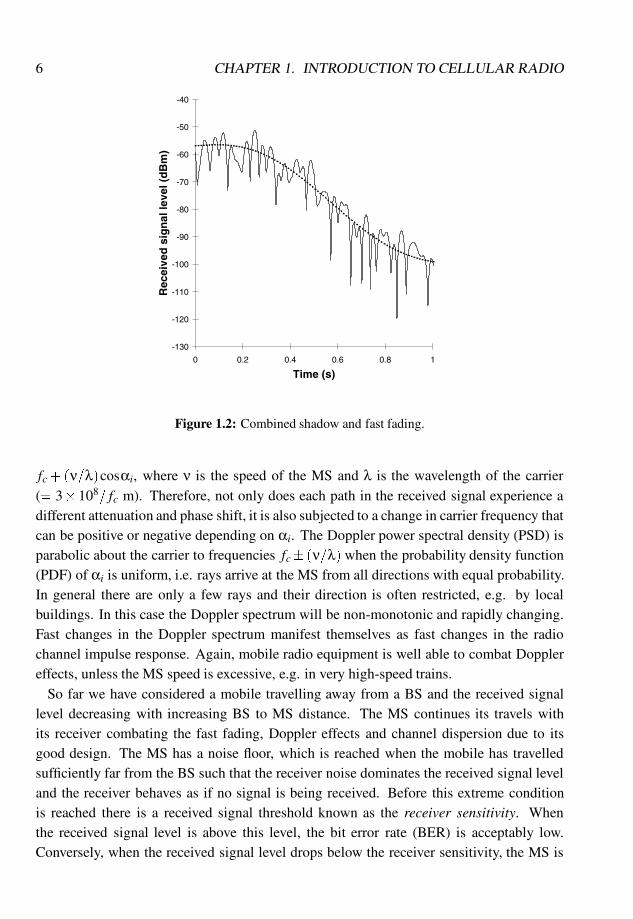
As a MS travels away from the BS, the received signal at the MS decreases as the pathloss increases. The received signal will also exhibit large scale (shadowing) fading and smallscale fading. Figure 1.2 shows an example of the variations in the received signal level (indBs) as the MS travels. The dotted line represents the change in received signal level dueto shadow fading. The rapid changes in the received signal level are the consequence ofsmall scale fading, which for a particular carrier frequency depends on the MS speed. Thefaster the MS travels, the more rapid is the fading. A stationary MS may be in a deep fade.Fortunately the effect of small scale fading can be effectively combatted in modern digitalmobile radio systems. Shadow fading and path loss is another matter.
Having passed through the radio channel, the RF signal transmitted by the BS will arriveat the MS antenna. This will usually connect directly into the receiver input but, unlike theBS, there are no cable losses. The antenna will be omni-directional whereby it is able tocapture signal energy equally from all directions in the horizontal plane. In the case of ahandheld MS, the signal may be attenuated by the user’s body before arriving at the antenna,and network operators generally include a margin in their planning procedures to accountfor body loss.
As the MS travels there is a change in the frequency of the received carrier on each pathdue to the Doppler effect. For a MS travelling in a direction making an angle αi withrespect to a signal received on the ith path, the carrier frequency is changed from fc to
τ0 τ τ21
Magnitude
τ3 4 time
Figure 1.1: Magnitude of wideband channel impulse response, measured from the arrival of the firstpath.
6 CHAPTER 1. INTRODUCTION TO CELLULAR RADIO
-130
-120
-110
-100
-90
-80
-70
-60
-50
-40
0 0.2 0.4 0.6 0.8 1
Time (s)
Rec
eive
d s
ign
al le
vel (
dB
m)
Figure 1.2: Combined shadow and fast fading.
fc+ (ν=λ)cosαi, where ν is the speed of the MS and λ is the wavelength of the carrier(= 3� 108= fc m). Therefore, not only does each path in the received signal experience adifferent attenuation and phase shift, it is also subjected to a change in carrier frequency thatcan be positive or negative depending on αi. The Doppler power spectral density (PSD) isparabolic about the carrier to frequencies fc� (ν=λ) when the probability density function(PDF) of αi is uniform, i.e. rays arrive at the MS from all directions with equal probability.In general there are only a few rays and their direction is often restricted, e.g. by localbuildings. In this case the Doppler spectrum will be non-monotonic and rapidly changing.Fast changes in the Doppler spectrum manifest themselves as fast changes in the radiochannel impulse response. Again, mobile radio equipment is well able to combat Dopplereffects, unless the MS speed is excessive, e.g. in very high-speed trains.
So far we have considered a mobile travelling away from a BS and the received signallevel decreasing with increasing BS to MS distance. The MS continues its travels withits receiver combating the fast fading, Doppler effects and channel dispersion due to itsgood design. The MS has a noise floor, which is reached when the mobile has travelledsufficiently far from the BS such that the receiver noise dominates the received signal leveland the receiver behaves as if no signal is being received. Before this extreme conditionis reached there is a received signal threshold known as the receiver sensitivity. Whenthe received signal level is above this level, the bit error rate (BER) is acceptably low.Conversely, when the received signal level drops below the receiver sensitivity, the MS is
1.2. MULTIPLE CELLS 7
no longer able to receive signals of an acceptable quality from the BS. The point in space atwhich this threshold occurs represents a boundary point for the down-link or forward link,i.e. the transmissions from the BS to the MS.
What about the up-link or reverse link, i.e. the transmission from the MS to the BS?The two links are never the same. They are similar in GSM and radically different incdmaOne. The MS transmitter operates at significantly lower power levels than the BS andso the maximum radiated power levels are lower than those at the BS. The BS is able tocompensate for the MS deficiencies by being able to operate at a lower receiver sensitivityand by employing techniques such as space diversity to enhance the received signal fromthe MS. It is important to note that the signal characteristics that we have already discussedin relation to the down-link (i.e. path loss, fast and slow fading, Doppler shift and ISI) willalso be present in the received up-link signal. To simplify our discussion, we will assumethat our boundary point is the same for either link, unless specifically stated.
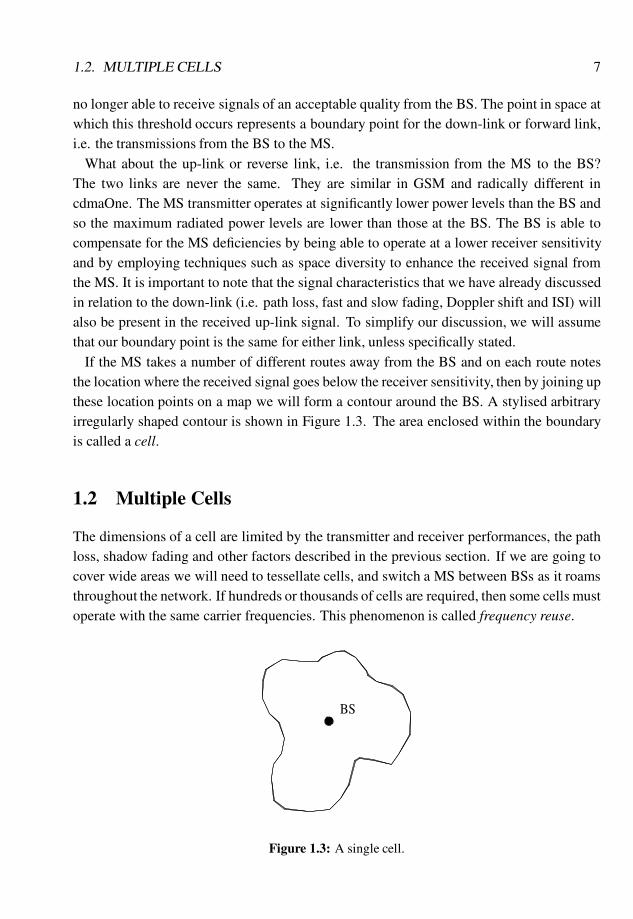
If the MS takes a number of different routes away from the BS and on each route notesthe location where the received signal goes below the receiver sensitivity, then by joining upthese location points on a map we will form a contour around the BS. A stylised arbitraryirregularly shaped contour is shown in Figure 1.3. The area enclosed within the boundaryis called a cell.
1.2 Multiple Cells
The dimensions of a cell are limited by the transmitter and receiver performances, the pathloss, shadow fading and other factors described in the previous section. If we are going tocover wide areas we will need to tessellate cells, and switch a MS between BSs as it roamsthroughout the network. If hundreds or thousands of cells are required, then some cells mustoperate with the same carrier frequencies. This phenomenon is called frequency reuse.
BS
Figure 1.3: A single cell.
8 CHAPTER 1. INTRODUCTION TO CELLULAR RADIO
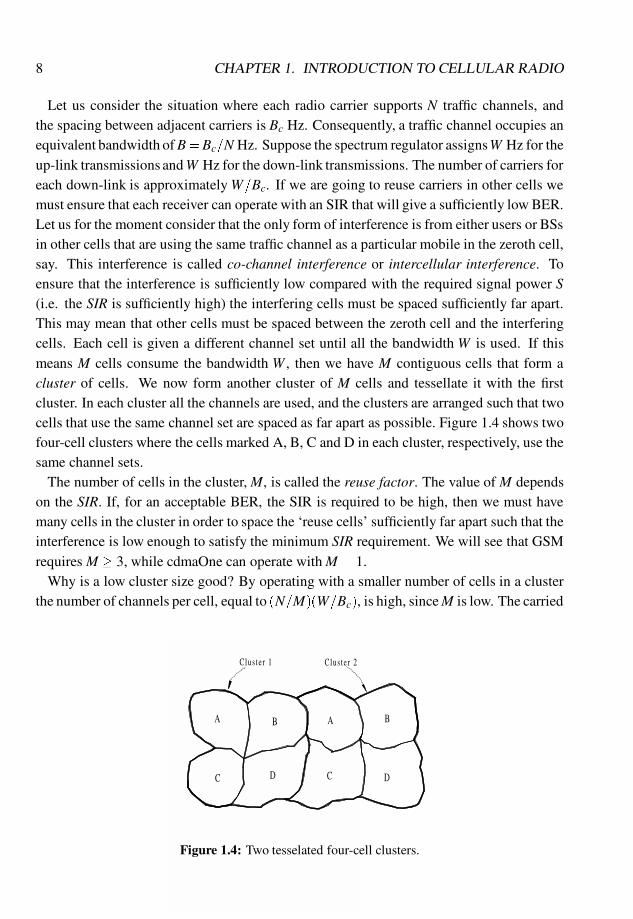
Let us consider the situation where each radio carrier supports N traffic channels, andthe spacing between adjacent carriers is Bc Hz. Consequently, a traffic channel occupies anequivalent bandwidth ofB=Bc=N Hz. Suppose the spectrum regulator assignsW Hz for theup-link transmissions andW Hz for the down-link transmissions. The number of carriers foreach down-link is approximately W=Bc. If we are going to reuse carriers in other cells wemust ensure that each receiver can operate with an SIR that will give a sufficiently low BER.Let us for the moment consider that the only form of interference is from either users or BSsin other cells that are using the same traffic channel as a particular mobile in the zeroth cell,say. This interference is called co-channel interference or intercellular interference. Toensure that the interference is sufficiently low compared with the required signal power S(i.e. the SIR is sufficiently high) the interfering cells must be spaced sufficiently far apart.This may mean that other cells must be spaced between the zeroth cell and the interferingcells. Each cell is given a different channel set until all the bandwidth W is used. If thismeans M cells consume the bandwidth W , then we have M contiguous cells that form acluster of cells. We now form another cluster of M cells and tessellate it with the firstcluster. In each cluster all the channels are used, and the clusters are arranged such that twocells that use the same channel set are spaced as far apart as possible. Figure 1.4 shows twofour-cell clusters where the cells marked A, B, C and D in each cluster, respectively, use thesame channel sets.
The number of cells in the cluster, M, is called the reuse factor. The value of M dependson the SIR. If, for an acceptable BER, the SIR is required to be high, then we must havemany cells in the cluster in order to space the ‘reuse cells’ sufficiently far apart such that theinterference is low enough to satisfy the minimum SIR requirement. We will see that GSMrequires M � 3, while cdmaOne can operate with M = 1.
Why is a low cluster size good? By operating with a smaller number of cells in a clusterthe number of channels per cell, equal to (N=M)(W=Bc), is high, sinceM is low. The carried
C D
A B
Clus ter 1
C D
A B
Clus ter 2
Figure 1.4: Two tesselated four-cell clusters.
1.2. MULTIPLE CELLS 9
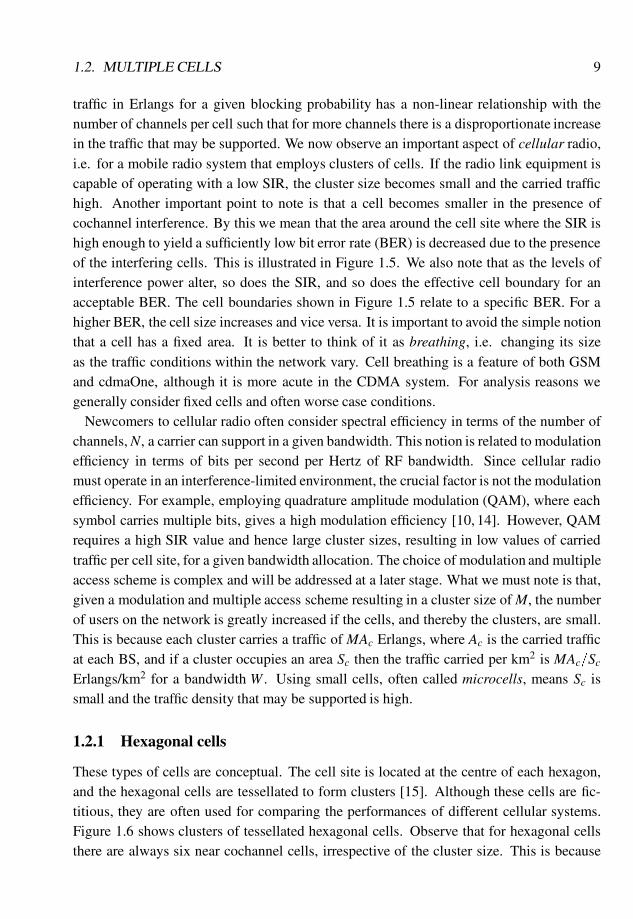
traffic in Erlangs for a given blocking probability has a non-linear relationship with thenumber of channels per cell such that for more channels there is a disproportionate increasein the traffic that may be supported. We now observe an important aspect of cellular radio,i.e. for a mobile radio system that employs clusters of cells. If the radio link equipment iscapable of operating with a low SIR, the cluster size becomes small and the carried traffichigh. Another important point to note is that a cell becomes smaller in the presence ofcochannel interference. By this we mean that the area around the cell site where the SIR ishigh enough to yield a sufficiently low bit error rate (BER) is decreased due to the presenceof the interfering cells. This is illustrated in Figure 1.5. We also note that as the levels ofinterference power alter, so does the SIR, and so does the effective cell boundary for anacceptable BER. The cell boundaries shown in Figure 1.5 relate to a specific BER. For ahigher BER, the cell size increases and vice versa. It is important to avoid the simple notionthat a cell has a fixed area. It is better to think of it as breathing, i.e. changing its sizeas the traffic conditions within the network vary. Cell breathing is a feature of both GSMand cdmaOne, although it is more acute in the CDMA system. For analysis reasons wegenerally consider fixed cells and often worse case conditions.
Newcomers to cellular radio often consider spectral efficiency in terms of the number ofchannels, N, a carrier can support in a given bandwidth. This notion is related to modulationefficiency in terms of bits per second per Hertz of RF bandwidth. Since cellular radiomust operate in an interference-limited environment, the crucial factor is not the modulationefficiency. For example, employing quadrature amplitude modulation (QAM), where eachsymbol carries multiple bits, gives a high modulation efficiency [10, 14]. However, QAMrequires a high SIR value and hence large cluster sizes, resulting in low values of carriedtraffic per cell site, for a given bandwidth allocation. The choice of modulation and multipleaccess scheme is complex and will be addressed at a later stage. What we must note is that,given a modulation and multiple access scheme resulting in a cluster size of M, the numberof users on the network is greatly increased if the cells, and thereby the clusters, are small.This is because each cluster carries a traffic of MAc Erlangs, where Ac is the carried trafficat each BS, and if a cluster occupies an area Sc then the traffic carried per km2 is MAc=ScErlangs/km2 for a bandwidth W . Using small cells, often called microcells, means Sc issmall and the traffic density that may be supported is high.
1.2.1 Hexagonal cells
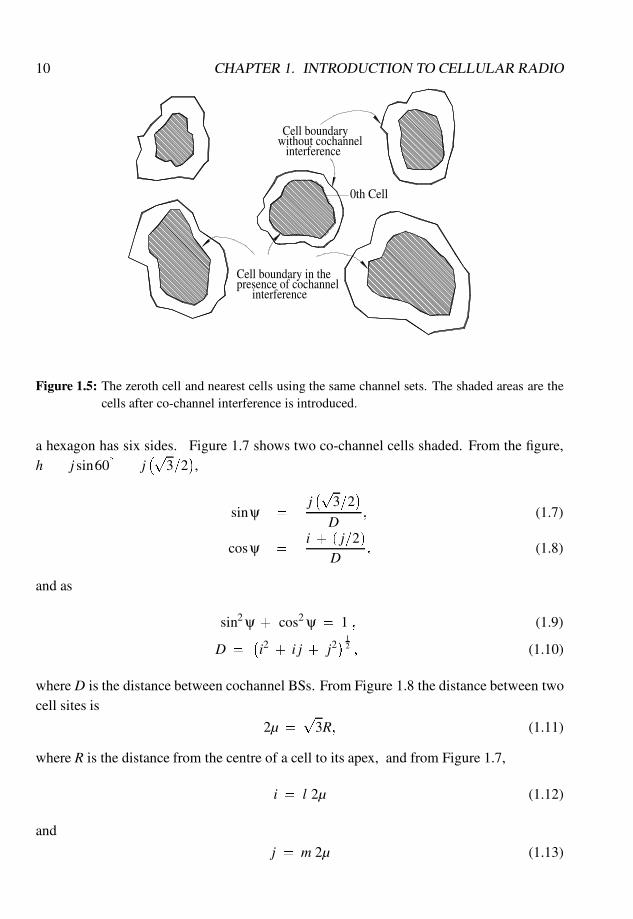
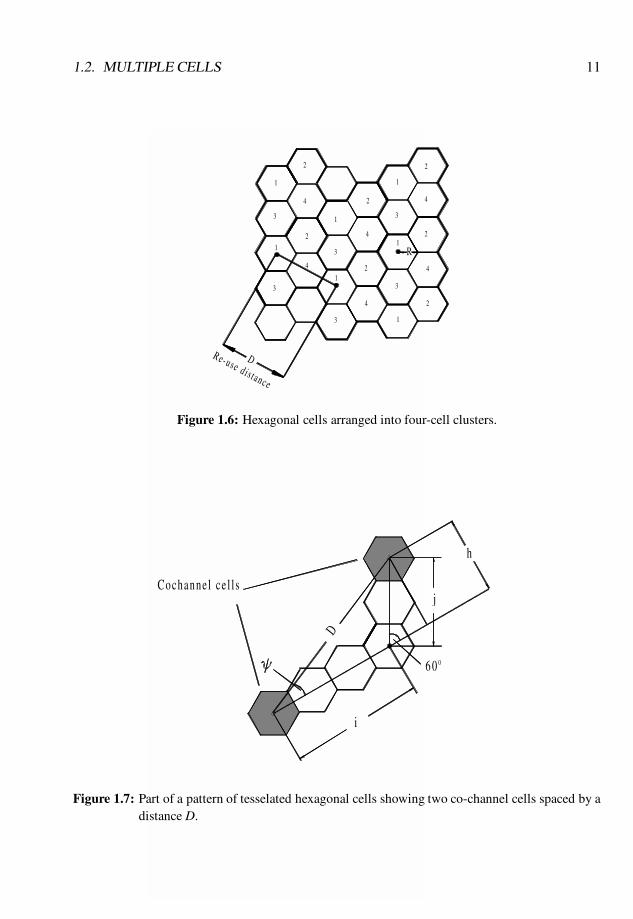
These types of cells are conceptual. The cell site is located at the centre of each hexagon,and the hexagonal cells are tessellated to form clusters [15]. Although these cells are fic-titious, they are often used for comparing the performances of different cellular systems.Figure 1.6 shows clusters of tessellated hexagonal cells. Observe that for hexagonal cellsthere are always six near cochannel cells, irrespective of the cluster size. This is because
10 CHAPTER 1. INTRODUCTION TO CELLULAR RADIO
without cochannelinterference
Cell boundary
Cell boundary in thepresence of cochannel
interference
0th Cell
Figure 1.5: The zeroth cell and nearest cells using the same channel sets. The shaded areas are thecells after co-channel interference is introduced.
a hexagon has six sides. Figure 1.7 shows two co-channel cells shaded. From the figure,h = j sin60
�
= j�p
3=2�,
sinψ =j�p
3=2�
D; (1.7)
cosψ =i + ( j=2)
D; (1.8)
and as
sin2 ψ + cos2 ψ = 1 ; (1.9)
D =�i2 + i j + j2
� 12 ; (1.10)
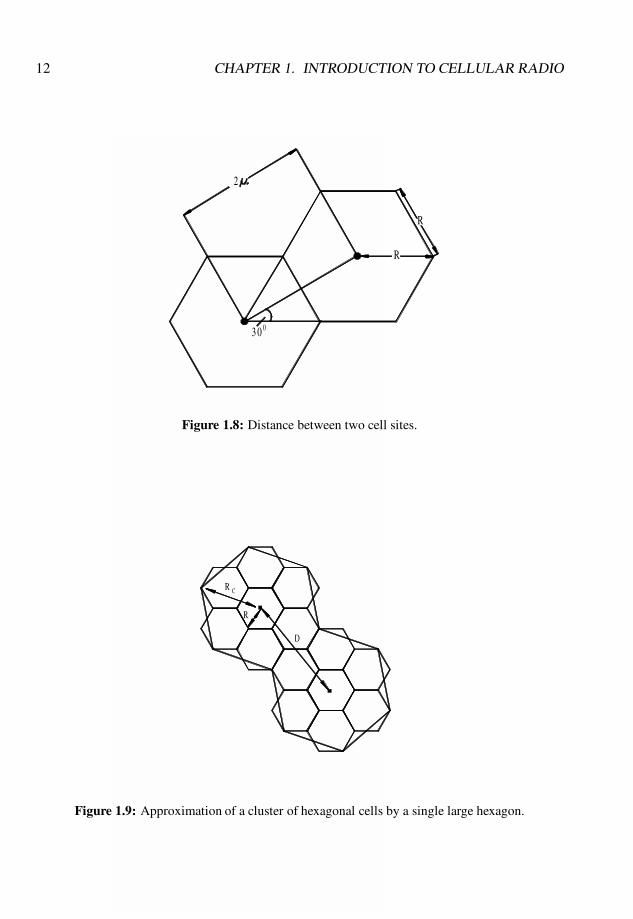
where D is the distance between cochannel BSs. From Figure 1.8 the distance between twocell sites is
2µ =p
3R; (1.11)
where R is the distance from the centre of a cell to its apex, and from Figure 1.7,
i = l 2µ (1.12)
and
j = m 2µ (1.13)
1.2. MULTIPLE CELLS 11
4
Re-use d i s tance
D
3
3
1
1
3
1
1
2
3
4
2
42
1
4
3
2
R
41
3
2
1
2
4
2
Figure 1.6: Hexagonal cells arranged into four-cell clusters.
D
i
Cochanne l ce l l s
6 0 0
j
h
Figure 1.7: Part of a pattern of tesselated hexagonal cells showing two co-channel cells spaced by adistance D.
12 CHAPTER 1. INTRODUCTION TO CELLULAR RADIO
3 0 0
2
R
R
Figure 1.8: Distance between two cell sites.
D
R
R
C
Figure 1.9: Approximation of a cluster of hexagonal cells by a single large hexagon.
1.2. MULTIPLE CELLS 13
where l and m are integers. Consequently, the distance between cochannel sites is
D = 2µ�l2 + lm + m2� 1
2 � (1.14)
A cluster of hexagonal cells can be approximated by a large hexagon of dimension Rc asshown in Figure 1.9. The number of cells, M, in this cluster is the ratio of the area of thecluster to the area of the cell, which is equal to the ratio of the distance squared betweenthe centres of the clusters to the distance squared between the centres of adjacent hexagonalcells, i.e.
M =D2
(2µ)2= l2 + lm + m2 (1.15)
or, with the aid of Equation (1.11), we get the useful ratio used in later chapters:
DR
=p
3M � (1.16)
1.2.2 Sectorisation
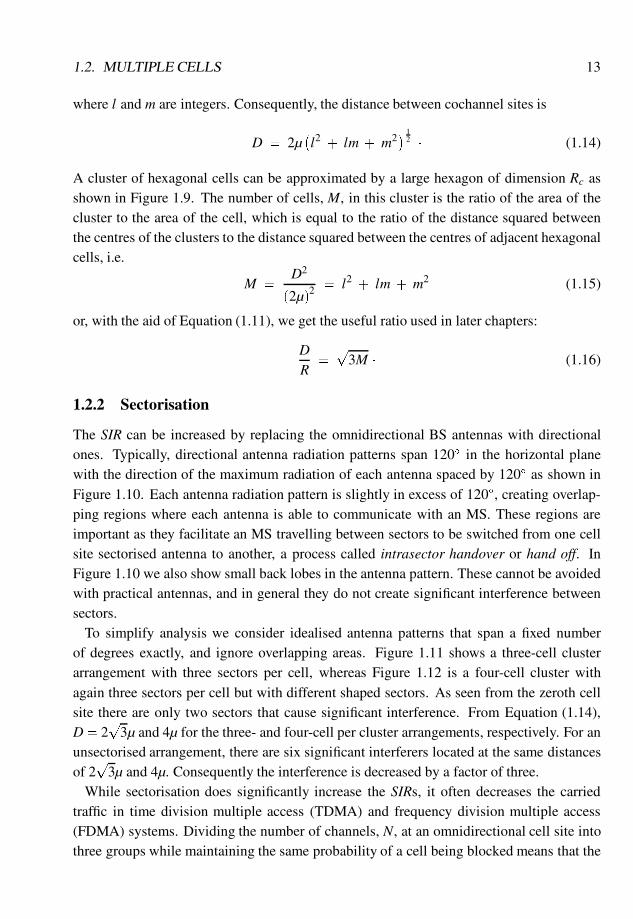
The SIR can be increased by replacing the omnidirectional BS antennas with directionalones. Typically, directional antenna radiation patterns span 120� in the horizontal planewith the direction of the maximum radiation of each antenna spaced by 120� as shown inFigure 1.10. Each antenna radiation pattern is slightly in excess of 120�, creating overlap-ping regions where each antenna is able to communicate with an MS. These regions areimportant as they facilitate an MS travelling between sectors to be switched from one cellsite sectorised antenna to another, a process called intrasector handover or hand off. InFigure 1.10 we also show small back lobes in the antenna pattern. These cannot be avoidedwith practical antennas, and in general they do not create significant interference betweensectors.
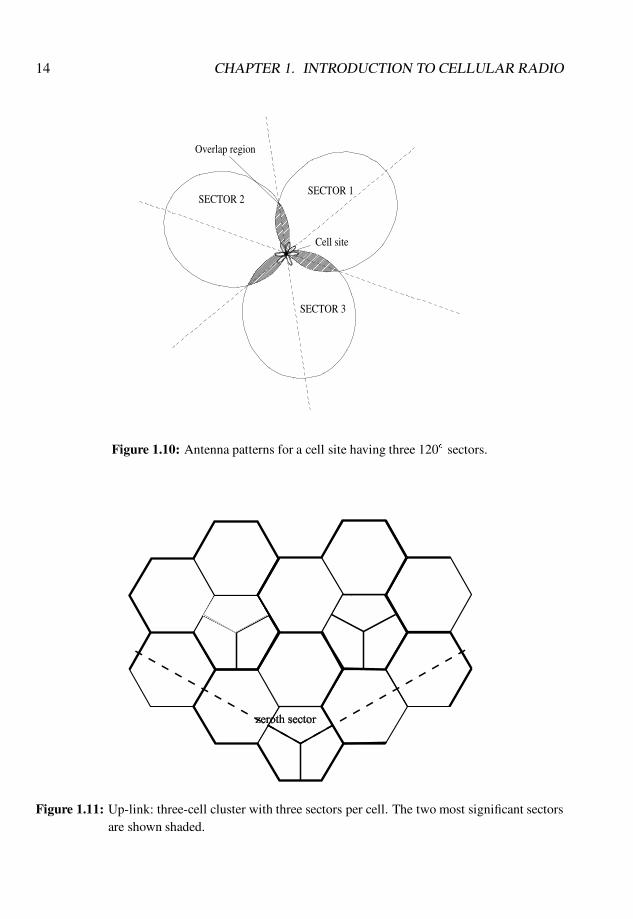
To simplify analysis we consider idealised antenna patterns that span a fixed numberof degrees exactly, and ignore overlapping areas. Figure 1.11 shows a three-cell clusterarrangement with three sectors per cell, whereas Figure 1.12 is a four-cell cluster withagain three sectors per cell but with different shaped sectors. As seen from the zeroth cellsite there are only two sectors that cause significant interference. From Equation (1.14),D= 2
p3µ and 4µ for the three- and four-cell per cluster arrangements, respectively. For an
unsectorised arrangement, there are six significant interferers located at the same distancesof 2
p3µ and 4µ. Consequently the interference is decreased by a factor of three.
While sectorisation does significantly increase the SIRs, it often decreases the carriedtraffic in time division multiple access (TDMA) and frequency division multiple access(FDMA) systems. Dividing the number of channels, N, at an omnidirectional cell site intothree groups while maintaining the same probability of a cell being blocked means that the
14 CHAPTER 1. INTRODUCTION TO CELLULAR RADIO
SECTOR 2
Overlap region
SECTOR 3
SECTOR 1
Cell site
Figure 1.10: Antenna patterns for a cell site having three 120� sectors.
Figure 1.11: Up-link: three-cell cluster with three sectors per cell. The two most significant sectorsare shown shaded.

1.3. THE TDMA RADIO INTERFACE 15
Figure 1.12: Up-link: four-cell clusters with three sectors per cell. The two most significant inter-fering sectors are shown shaded.
traffic is 3As, where As is the traffic carried by a sector and Aomni > 3As, where Aomni isthe traffic carried by the omnidirectional site. The reason is that the traffic in Erlangs isnon-linearly related to the number of channels, and as each sector only has N=3 channels,then each sector carries less than a third of Aomni. This effect is termed trunking efficiency.However, a high SIR means good link quality. In some cases the use of sectorisation allowsthe overall cluster size to be reduced without reducing the SIR beyond acceptable levels.This will mean that more channels will be available at each BS and this will go some wayto offsetting the capacity reduction resulting from the loss in trunking efficiency.
In CDMA systems the situation is very different. The same channels may be reused ineach sector and there will be no trunking efficiency loss. In a system with perfect sec-torisation the increase in capacity at a cell site will be equal to the number of sectors, i.e. athree-fold increase for three sectors. In practice, interference caused by overlapping antennapatterns and side and back lobes reduces this gain to around 80% of the ideal case.
1.3 The TDMA Radio Interface
1.3.1 Multiple access procedure for TDMA
In mobile radio communications, multiple users access the allotted radio spectrum in orderto communicate, via the fixed component of the mobile network, with another user in thePSTN/ISDN or in its own or other mobile networks. There are different multiple access
16 CHAPTER 1. INTRODUCTION TO CELLULAR RADIO
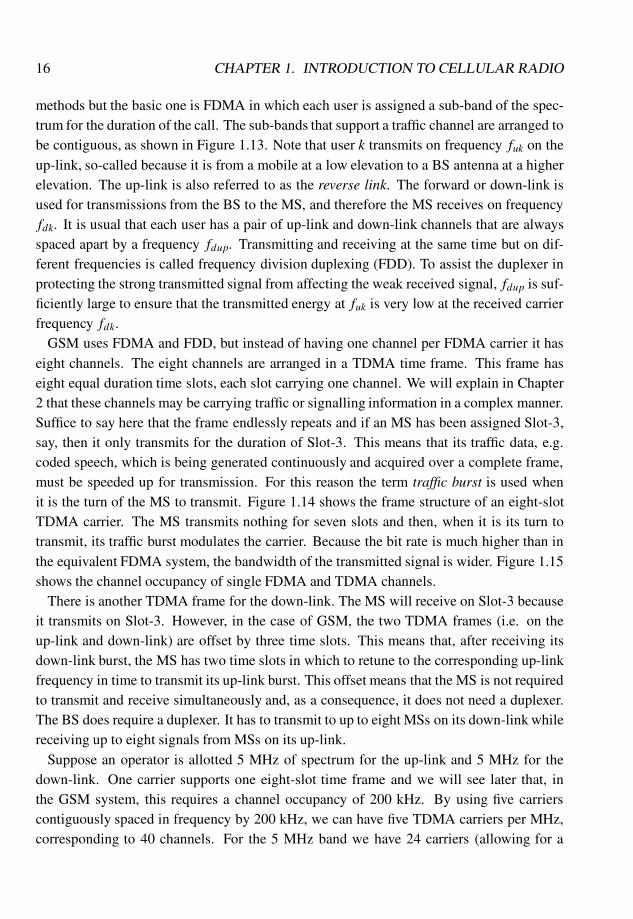
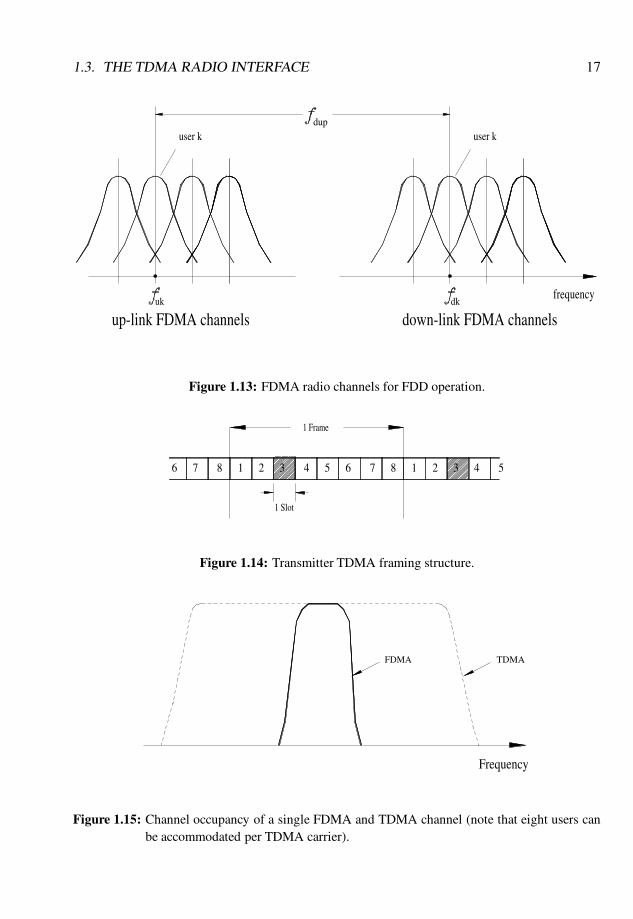
methods but the basic one is FDMA in which each user is assigned a sub-band of the spec-trum for the duration of the call. The sub-bands that support a traffic channel are arranged tobe contiguous, as shown in Figure 1.13. Note that user k transmits on frequency fuk on theup-link, so-called because it is from a mobile at a low elevation to a BS antenna at a higherelevation. The up-link is also referred to as the reverse link. The forward or down-link isused for transmissions from the BS to the MS, and therefore the MS receives on frequencyfdk. It is usual that each user has a pair of up-link and down-link channels that are alwaysspaced apart by a frequency fdup. Transmitting and receiving at the same time but on dif-ferent frequencies is called frequency division duplexing (FDD). To assist the duplexer inprotecting the strong transmitted signal from affecting the weak received signal, fdup is suf-ficiently large to ensure that the transmitted energy at fuk is very low at the received carrierfrequency fdk.
GSM uses FDMA and FDD, but instead of having one channel per FDMA carrier it haseight channels. The eight channels are arranged in a TDMA time frame. This frame haseight equal duration time slots, each slot carrying one channel. We will explain in Chapter2 that these channels may be carrying traffic or signalling information in a complex manner.Suffice to say here that the frame endlessly repeats and if an MS has been assigned Slot-3,say, then it only transmits for the duration of Slot-3. This means that its traffic data, e.g.coded speech, which is being generated continuously and acquired over a complete frame,must be speeded up for transmission. For this reason the term traffic burst is used whenit is the turn of the MS to transmit. Figure 1.14 shows the frame structure of an eight-slotTDMA carrier. The MS transmits nothing for seven slots and then, when it is its turn totransmit, its traffic burst modulates the carrier. Because the bit rate is much higher than inthe equivalent FDMA system, the bandwidth of the transmitted signal is wider. Figure 1.15shows the channel occupancy of single FDMA and TDMA channels.
There is another TDMA frame for the down-link. The MS will receive on Slot-3 becauseit transmits on Slot-3. However, in the case of GSM, the two TDMA frames (i.e. on theup-link and down-link) are offset by three time slots. This means that, after receiving itsdown-link burst, the MS has two time slots in which to retune to the corresponding up-linkfrequency in time to transmit its up-link burst. This offset means that the MS is not requiredto transmit and receive simultaneously and, as a consequence, it does not need a duplexer.The BS does require a duplexer. It has to transmit to up to eight MSs on its down-link whilereceiving up to eight signals from MSs on its up-link.
Suppose an operator is allotted 5 MHz of spectrum for the up-link and 5 MHz for thedown-link. One carrier supports one eight-slot time frame and we will see later that, inthe GSM system, this requires a channel occupancy of 200 kHz. By using five carrierscontiguously spaced in frequency by 200 kHz, we can have five TDMA carriers per MHz,corresponding to 40 channels. For the 5 MHz band we have 24 carriers (allowing for a
1.3. THE TDMA RADIO INTERFACE 17
up-link FDMA channelsuk
user kdup
down-link FDMA channelsdk
frequency
user k
Figure 1.13: FDMA radio channels for FDD operation.
1 Slot
6 7 8
1 Frame
31 2 4 5 26 7 8 1 3 4 5
Figure 1.14: Transmitter TDMA framing structure.
Frequency
FDMA TDMA
Figure 1.15: Channel occupancy of a single FDMA and TDMA channel (note that eight users canbe accommodated per TDMA carrier).
18 CHAPTER 1. INTRODUCTION TO CELLULAR RADIO
guard band), and it is these carriers that are deployed in our cellular structure. Thus, if thereare four cells per cluster and three sectors per cell, we may have two carriers or 16 channelsper sector. Adjacent carrier frequencies must not be used at the same site as they willinterfere with each other. This is known as adjacent channel interference. Planning whichcarriers to use in each sector is complex, and is known as frequency planning. Care mustbe exercised to maximise both the signal-to-cochannel interference ratios and the signal-to-adjacent channel interference ratios. Let us go one step farther. Given that we have 16channels per sector, and that one is used for signalling, then with 15 traffic channels anda blocking probability Pn for new calls of 2% the carried traffic will be approximately 9Erlangs (found from Erlang-B traffic capacity tables). Note that for a Pn of 2% the carriedtraffic is 98% of the offered traffic. If each user speaks on average for a total of 2 minutesin each hour, then the offered traffic is 2=60= 33 milliErlangs. As 9 Erlangs are available,the number of users that can be supported per sector is 270 users, or 3240 users per cluster.Thus we see that by using TDMA signals to modulate carriers in an FDMA mode, manyusers can be accommodated. This example can be easily modified to suit many differentscenarios.
1.3.2 The TDMA radio link
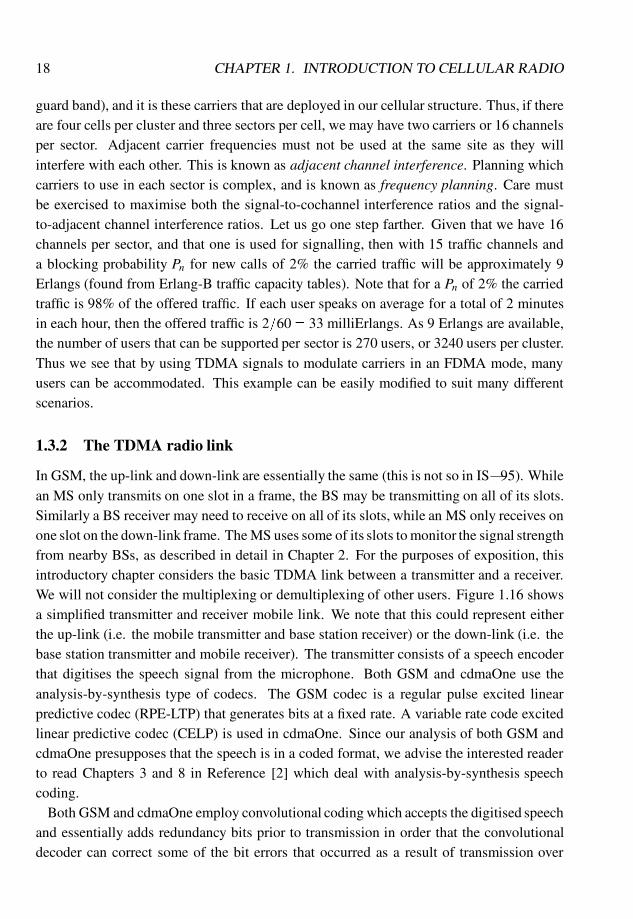
In GSM, the up-link and down-link are essentially the same (this is not so in IS�95). Whilean MS only transmits on one slot in a frame, the BS may be transmitting on all of its slots.Similarly a BS receiver may need to receive on all of its slots, while an MS only receives onone slot on the down-link frame. The MS uses some of its slots to monitor the signal strengthfrom nearby BSs, as described in detail in Chapter 2. For the purposes of exposition, thisintroductory chapter considers the basic TDMA link between a transmitter and a receiver.We will not consider the multiplexing or demultiplexing of other users. Figure 1.16 showsa simplified transmitter and receiver mobile link. We note that this could represent eitherthe up-link (i.e. the mobile transmitter and base station receiver) or the down-link (i.e. thebase station transmitter and mobile receiver). The transmitter consists of a speech encoderthat digitises the speech signal from the microphone. Both GSM and cdmaOne use theanalysis-by-synthesis type of codecs. The GSM codec is a regular pulse excited linearpredictive codec (RPE-LTP) that generates bits at a fixed rate. A variable rate code excitedlinear predictive codec (CELP) is used in cdmaOne. Since our analysis of both GSM andcdmaOne presupposes that the speech is in a coded format, we advise the interested readerto read Chapters 3 and 8 in Reference [2] which deal with analysis-by-synthesis speechcoding.
Both GSM and cdmaOne employ convolutional coding which accepts the digitised speechand essentially adds redundancy bits prior to transmission in order that the convolutionaldecoder can correct some of the bit errors that occurred as a result of transmission over
1.3. THE TDMA RADIO INTERFACE 19
Sequence Generation
and Baseband Modulator
speechinput
Speechcoder
coderFEC
Modulator
TDMA
bufferburst
Transmitter
interleaverbit
Packetiser
soundingsequence
channel
regeneratedbits
recoveredspeech
De-interleaver
PowerAmplifier
channelRadio
Speechdecoder
decoderFEC
ChannelEqualiser
DE-MUX
data
RFfront-end
Demodulator
Receiver
estimation
Localdata
Channelestimation
Figure 1.16: The basic TDMA mobile radio link.
the mobile radio channel. It is therefore appropriate that we say a few words concerningconvolutional coding, but for a more comprehensive discourse consult Reference [2].
Let us start by saying that mobile radio channels are not benign like optical channels oreven copper wire links in the PSTN. Mobile radio channels often cause high error ratesunless considerable counter measures are deployed. We have mentioned that as the mo-bile travels away from the BS there is an increasing path loss, there is shadow fading,fast fading, dispersion effects, receiver noise, co-channel interference and adjacent channelinterference. All of these factors may impair the received signal, and cause bits to be erro-neously regenerated at the receiver. A host of measures are therefore employed to decreasethe probability of bit errors, and if bit errors do occur, the role of forward error correction(FEC) codes is to correct as many of them as the power of the code will allow. In FECcoding the coder generally takes k input message bits at a time and maps them into n-bitcode words. The amount of redundancy introduced by the coder is measured by the ration=k, and the inverse of it, namely k=n, is defined as the coding rate. The redundancy bits,n�k, are used to increase the relative Hamming distance, which is the number of differentsymbols between two code words or coded symbol sequences. An FEC decoder is able toprovide error correction, although this is limited by the Hamming distance provided.
We are interested in convolutional codes as they are used by both cdmaOne and GSM. Aconvolutional coder accepts the latest k-bit and the previous (K�1)k-bit inputs to generatean n-bit code word, where K indicates the number of k-bit inputs required to produce a code
20 CHAPTER 1. INTRODUCTION TO CELLULAR RADIO
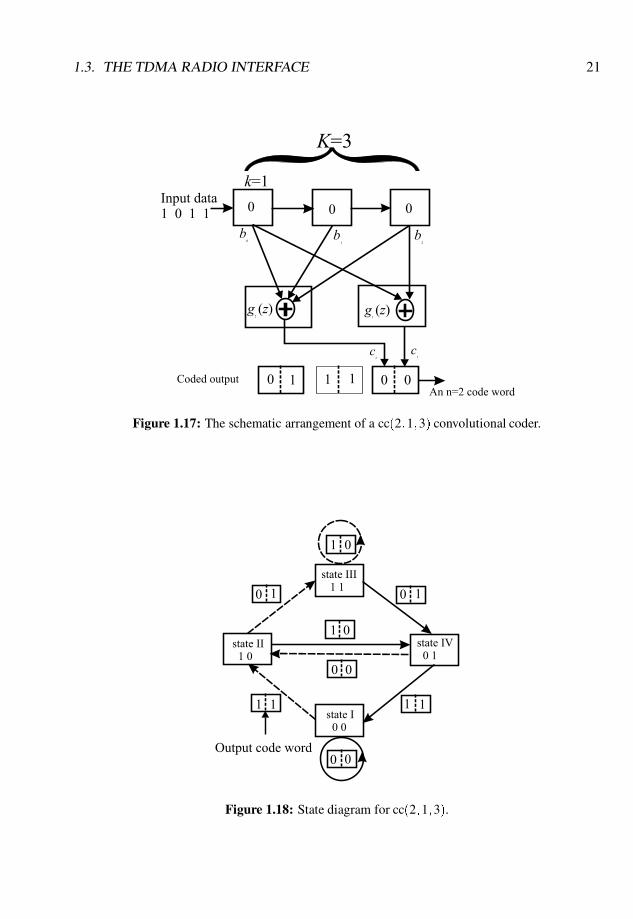
word, and is referred to as the constraint length [2]. A convolutional code can basically bedefined by the three parameters, n, k, and K, and is denoted by cc(n;k;K), where k=n iscalled the coding rate. An example of a convolutional coder is the cc(2;1;3) coder shownin Figure 1.17. In this coder, the code word generator can be described by two vectors
g1 = [101] and g2 = [111] (1.17)
and the corresponding code word [c2;c1], where
c1 =
264
b2
b1
b0
375g1 and c2 =
264
b2
b1
b0
375g2; (1.18)
and where b0, b1, and b2 are the three bits in the shift register. An equivalent form of thegenerator vectors is two generator polynomials
g1(z) = 1+ z2 and g2(z) = 1+ z+ z2 ; (1.19)
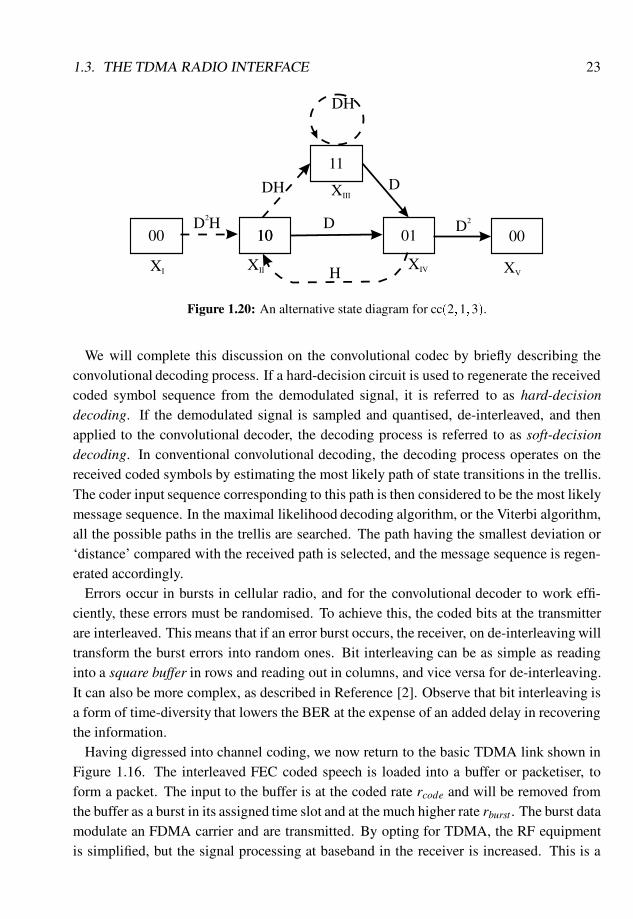
where 1 denotes the present input bit, and z and z2 represent the previous input bits havingone and two clock period delays, respectively, and + is modulo 2 addition. The convo-lutional coder is a finite-state machine which can be described by its state diagram. Fig-ure 1.18 shows the state diagram of the cc(2;1;3) convolutional code, where the states arethe content of the previous (K�1)k= 2 bits. The state transitions in response to an input bitof 1 or 0 are shown as dashed and solid lines, respectively, in the diagram. As the messagebits shift into the register k = 1 bit at a time, new coded symbols are formed in responseto these state transitions. On the basis of the state diagram, the trellis diagram is generatedto represent the coding process, and is formed by concatenating the consecutive instantsof the state transition diagram. The trellis diagram for cc(2;1;3) is shown in Figure 1.19,where the dashed and solid lines correspond to the latest input bit of 1 and 0, respectively.In the trellis diagram, each node, represented by a dot, corresponds to the state shown onthe left-hand side of the figure. Similar to the state diagram of Figure 1.18, the dashed andsolid lines indicate the state transitions due to an input bit of 1 or 0, respectively. For ainput data sequence of 01101, the corresponding paths in the trellis diagram are displayedby thick dashed and solid lines, and the coded symbol sequence is shown at the bottomof the figure. Since the error correction performance of convolutional codes is related totheir Hamming distance, we redraw the state diagram as shown in Figure 1.20 to examinethe Hamming distance of cc(2;1;3). Instead of labelling each branch with its correspond-ing output code word, we label it with D0 = 1, D1 = D or D2, where the exponent of Drepresents the Hamming distance corresponding to that branch compared with the all-zerobranch. We also label each branch with H or 1 to indicate a transition corresponding to an
1.3. THE TDMA RADIO INTERFACE 21
Figure 1.17: The schematic arrangement of a cc(2;1;3) convolutional coder.
Figure 1.18: State diagram for cc(2;1;3).

22 CHAPTER 1. INTRODUCTION TO CELLULAR RADIO
00
output codedsymbol
1010
11 000100
state IV11
00
01
00
01
01
10
01
10
01
01
11state II
10
state I00
state III01
11
Figure 1.19: The trellis diagram for cc(2;1;3).
input of 1 or 0, respectively. In the figure, XI is the input of the state, while the other fourstates in the diagram have outputs shown by the following state equations:
XII = D2HXI+HXIV ;
XIII = DHXII+DHXIII;
XIV = DXII+DXIII;
XV = D2XIV : (1.20)
For an infinite-length coded symbol sequence, the transfer function of the cc(2;1;3) code isdefined as
T (D;H) =XVXI
� (1.21)
From Equation (1.20) and after some manipulations, the transfer function can be shown tobe
T (D;H) =D5H
1�2HD
= D5H+2D6H2+4D7H3+ : : :+2kDk+5Hk+1+ : : :
=∞
∑d=5
2d�5Hd�4Dd
=∞
∑d=5
βdDd; (1.22)
whereβd = 2d�5Hd�4 (1.23)
is the coefficient of the transfer function which indicates the number of paths having aHamming distance of d. The minimal value of d = 5 is referred to as the minimal freedistance, d f , of the code.
1.3. THE TDMA RADIO INTERFACE 23
D
D
DH
D2H
DH
D2
XI H XVXIV
XIII
1010 0001
11
XII
00
Figure 1.20: An alternative state diagram for cc(2;1;3).
We will complete this discussion on the convolutional codec by briefly describing theconvolutional decoding process. If a hard-decision circuit is used to regenerate the receivedcoded symbol sequence from the demodulated signal, it is referred to as hard-decisiondecoding. If the demodulated signal is sampled and quantised, de-interleaved, and thenapplied to the convolutional decoder, the decoding process is referred to as soft-decisiondecoding. In conventional convolutional decoding, the decoding process operates on thereceived coded symbols by estimating the most likely path of state transitions in the trellis.The coder input sequence corresponding to this path is then considered to be the most likelymessage sequence. In the maximal likelihood decoding algorithm, or the Viterbi algorithm,all the possible paths in the trellis are searched. The path having the smallest deviation or‘distance’ compared with the received path is selected, and the message sequence is regen-erated accordingly.
Errors occur in bursts in cellular radio, and for the convolutional decoder to work effi-ciently, these errors must be randomised. To achieve this, the coded bits at the transmitterare interleaved. This means that if an error burst occurs, the receiver, on de-interleaving willtransform the burst errors into random ones. Bit interleaving can be as simple as readinginto a square buffer in rows and reading out in columns, and vice versa for de-interleaving.It can also be more complex, as described in Reference [2]. Observe that bit interleaving isa form of time-diversity that lowers the BER at the expense of an added delay in recoveringthe information.
Having digressed into channel coding, we now return to the basic TDMA link shown inFigure 1.16. The interleaved FEC coded speech is loaded into a buffer or packetiser, toform a packet. The input to the buffer is at the coded rate rcode and will be removed fromthe buffer as a burst in its assigned time slot and at the much higher rate rburst . The burst datamodulate an FDMA carrier and are transmitted. By opting for TDMA, the RF equipmentis simplified, but the signal processing at baseband in the receiver is increased. This is a
24 CHAPTER 1. INTRODUCTION TO CELLULAR RADIO
consequence of the TDMA structure transmitting and receiving data at a high rate due tothe method of bursty transmissions. As a crude approximation the burst rate rburst is rcodeincreased by the number of slots per frame. Transmitting at high bit rates introduces ISIwhere one bit is smeared over many. The radio channel is therefore dispersive, and in orderto regenerate the bits at the receiver we need to equalise the radio channel in order to removethese dispersive effects. This in turn requires us to estimate the complex impulse responseof the mobile radio channel, and to achieve this we need to sound the channel. Rather thanapply an impulse to the radio channel, or rather an approximation to one, we opt to senda pseudo-random sequence that has an autocorrelation function (ACF) that is impulse-like.By this means we can estimate the channel impulse response. However, sending a pseudo-random sequence in each TDMA packet represents a costly overhead in that, if it were notrequired, the bits could be assigned to the speech or FEC coding.
Referring to Figure 1.16, we have now described that speech is encoded, followed bychannel coding and bit interleaving to combat bit error bursts. We also see that the packetiseraccepts both the interleaved coded speech and a sounding bit sequence. This soundingsequence is placed in the centre of the packet with the coded data on either side. If thesounding sequence were placed at the front of the packet, then the estimation of the channelimpulse response at the receiver would be considerably inaccurate for the last data bits in thepacket. By placing the sounding sequence in the centre of the packet the channel impulseresponse will not significantly change over half a packet length.
The TDMA burst buffer is responsible for packetising the coded speech at a slow rateand applying it to the modulator at the TDMA rate. Modulators used for TDMA usuallyallow Class C amplifiers to be used. Forms of frequency shift keying or phase shift keyingare popular. GSM uses Gaussian minimum shift keying (GMSK) because its bandwidthoccupancy is relatively small, although it introduces ISI prior to transmission.
From Figure 1.16 we can see that once the signal leaves the power amplifier at the trans-mitter, it then passes through a radio channel, via the transmitting antenna, before arriving atthe receiver. As we have already seen in this chapter, the radio channel will cause a numberof deleterious effects to the transmitted signal. Its amplitude will vary with the path lossand fast and slow fading, and ISI may be introduced as a result of multiple, different lengthpaths between the transmitter and receiver. In the case of GSM, any ISI introduced by theradio channel will be in addition to the ISI already introduced by the modulation scheme.
The RF front-end of the receiver will consist of a receiving antenna followed by a lownoise amplifier to boost the received signal whilst adding very little thermal noise. Follow-ing this amplifier stage the signal will be passed through a band-pass filter that will passthe frequencies within the operating band of the TDMA system, but reject the signals fromsystems operating in adjacent bands. After the RF front-end, the signal is down-convertedto an intermediate frequency (IF), before being narrowly filtered at the bandwidth of the
1.3. THE TDMA RADIO INTERFACE 25
TDMA carrier. The signal is next converted into its in-phase (I) and quadrature (Q) base-band components by the quadrature demodulator. This is achieved by mixing the IF signalwith two quadrature carriers also at the IF. The resulting signals are then low-pass filteredto leave only the baseband components.
The I and Q signals will be sampled in an analogue-to-digital converter and the remainderof the receiver is implemented in digital form, i.e. by a digital signal processing (DSP) chip.The received digitised I and Q signals are demultiplexed into the traffic data and the sound-ing sequence. The latter is applied to a matched filter to provide an estimate of the channelimpulse response. We have previously mentioned that both the modulator and the mobileradio channel cause each received bit to have a duration that no longer spans the original bitperiod, but a number of bit periods. This means that each modulation symbol will interferewith both its preceding and successive bits, an effect known as intersymbol interference(ISI). We know the amount of ISI that was deliberately introduced by the modulator to re-strain the bandwidth occupancy of the modulated signal. We now have to decide how muchadditional bit spreading, or dispersion, caused by the channel, we wish to accommodate.There is a trade-off between the amount of channel dispersion that can be accommodatedand the receiver complexity, i.e. the larger the dispersion we wish to accommodate, thehigher the complexity of the channel equaliser at the receiver. Having decided how muchspreading will be accommodated, say three bits for the modulator and two for the radiochannel, then spreading in excess of five-bits may cause regenerated bits to be in error. Weknow that five bits can be arranged in 32 different ways, and we apply each five bit se-quence to a baseband digital modulator identical to the one used at the transmitter. Now wesee why we needed to sound the radio channel and get an estimate of its impulse response;because, armed with this response, we convolve each of the 32 local modulated signals toget 32 estimates of the received signal. These 32 estimates, or templates, apply to receivinga logical 1 or 0 with all the combinations that the two adjacent bits on either side of the bitbeing processed could have.
When the traffic data are processed, each traffic bit is compared with all 32 templates, andthe mean square error between the actual data bit and each of the 32 template waveformsyields 32 incremental metrics that are used in the Viterbi processor [16]. Note that if thechannel estimate were perfect, then one of these incremental metrics would be zero. A de-scription of the Viterbi processor is beyond the scope of this book and the reader is referredto Reference [2] for a comprehensive description. Suffice to say here that the Viterbi pro-cessor used for channel equalisation is similar to the workings of the convolutional decoder.The equalisation process requires these incremental metrics, and hence channel sounding isessential. The data in the burst are not regenerated until the last bit is finally processed.
This entire process has effectively equalised the effects of the radio channel (and theISI introduced in the modulation process) thereby allowing the transmitted data bits to be
26 CHAPTER 1. INTRODUCTION TO CELLULAR RADIO
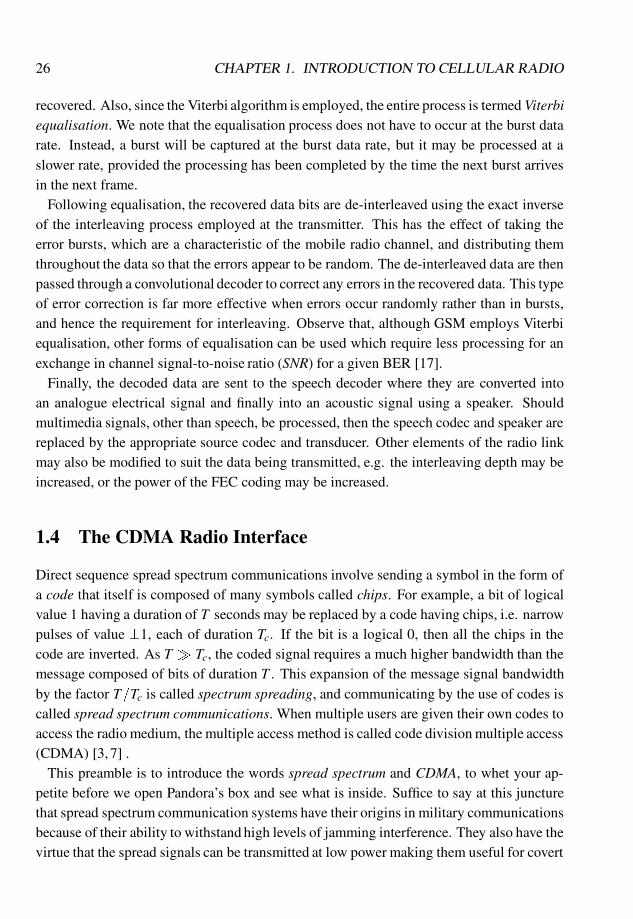
recovered. Also, since the Viterbi algorithm is employed, the entire process is termed Viterbiequalisation. We note that the equalisation process does not have to occur at the burst datarate. Instead, a burst will be captured at the burst data rate, but it may be processed at aslower rate, provided the processing has been completed by the time the next burst arrivesin the next frame.
Following equalisation, the recovered data bits are de-interleaved using the exact inverseof the interleaving process employed at the transmitter. This has the effect of taking theerror bursts, which are a characteristic of the mobile radio channel, and distributing themthroughout the data so that the errors appear to be random. The de-interleaved data are thenpassed through a convolutional decoder to correct any errors in the recovered data. This typeof error correction is far more effective when errors occur randomly rather than in bursts,and hence the requirement for interleaving. Observe that, although GSM employs Viterbiequalisation, other forms of equalisation can be used which require less processing for anexchange in channel signal-to-noise ratio (SNR) for a given BER [17].
Finally, the decoded data are sent to the speech decoder where they are converted intoan analogue electrical signal and finally into an acoustic signal using a speaker. Shouldmultimedia signals, other than speech, be processed, then the speech codec and speaker arereplaced by the appropriate source codec and transducer. Other elements of the radio linkmay also be modified to suit the data being transmitted, e.g. the interleaving depth may beincreased, or the power of the FEC coding may be increased.
1.4 The CDMA Radio Interface
Direct sequence spread spectrum communications involve sending a symbol in the form ofa code that itself is composed of many symbols called chips. For example, a bit of logicalvalue 1 having a duration of T seconds may be replaced by a code having chips, i.e. narrowpulses of value �1, each of duration Tc. If the bit is a logical 0, then all the chips in thecode are inverted. As T � Tc, the coded signal requires a much higher bandwidth than themessage composed of bits of duration T . This expansion of the message signal bandwidthby the factor T=Tc is called spectrum spreading, and communicating by the use of codes iscalled spread spectrum communications. When multiple users are given their own codes toaccess the radio medium, the multiple access method is called code division multiple access(CDMA) [3,7] .
This preamble is to introduce the words spread spectrum and CDMA, to whet your ap-petite before we open Pandora’s box and see what is inside. Suffice to say at this juncturethat spread spectrum communication systems have their origins in military communicationsbecause of their ability to withstand high levels of jamming interference. They also have thevirtue that the spread signals can be transmitted at low power making them useful for covert

1.4. THE CDMA RADIO INTERFACE 27
operations. We will describe CDMA using the bottom-up approach adopted in the previoussection. This means we will start by discussing a simple radio link before spreading is evenintroduced. Then we will examine the spreading and despreading processes, and then moveto the use of CDMA in cellular radio.
1.4.1 Binary phase shift keying
We will later describe a CDMA radio link employing binary phase shift keying (BPSK),and so it is appropriate initially to describe the basic BPSK radio link. In BPSK, when thebinary data is a logical 1, the phase of the transmitted radio carrier is 0�, and it changesto 180� when the data are a logical 0. The data signal b(t), which is composed of bits ofamplitude�1 and duration T , arrives at the BPSK modulator and switches the phase of theradio carrier between 0� and 180� for durations of T or multiples of T . The demodulator atthe receiver makes a decision as to the logical value of the bit transmitted by deciding if thevalue of the demodulated phasor is closer to 0� or 180�, and regenerating the appropriatebit.
The subject of BPSK is treated extensively in many textbooks and Reference [11] providesa good description. Within this discussion we highlight some of the key features of BPSKmodulation. The transmitted signal, s(t), may be represented by the expression
s(t) =
(gT (t)cosωct; b= logical 1;
�gT (t)cosωct; b= logical 0;
(1.24)
where gT (t) is the impulse response of the filter that shapes the bit b for transmission,defined over a period T , and ωc is the angular carrier frequency. We may also write thisequation as
s(t) = bgT (t)cosωct (1.25)
since
b=
(1; logical 1;
�1; logical 0:(1.26)
The energy of s(t) over a bit period is
Es =Z T
0s2(t)dt =
12
Z T
0g2T (t)dt = E=2; (1.27)
where E is the energy of a filtered baseband bit.The signal s(t) is transmitted over the channel, and for an additive white Gaussian noise
channel it can be shown that the probability of a bit error is
pe = Q�p
2E=N0
�=
1p2π
∞Zp
2E=N0
e�x2=2dx (1.28)
28 CHAPTER 1. INTRODUCTION TO CELLULAR RADIO
and the SNR is
SNR= γ= E=N0 � (1.29)
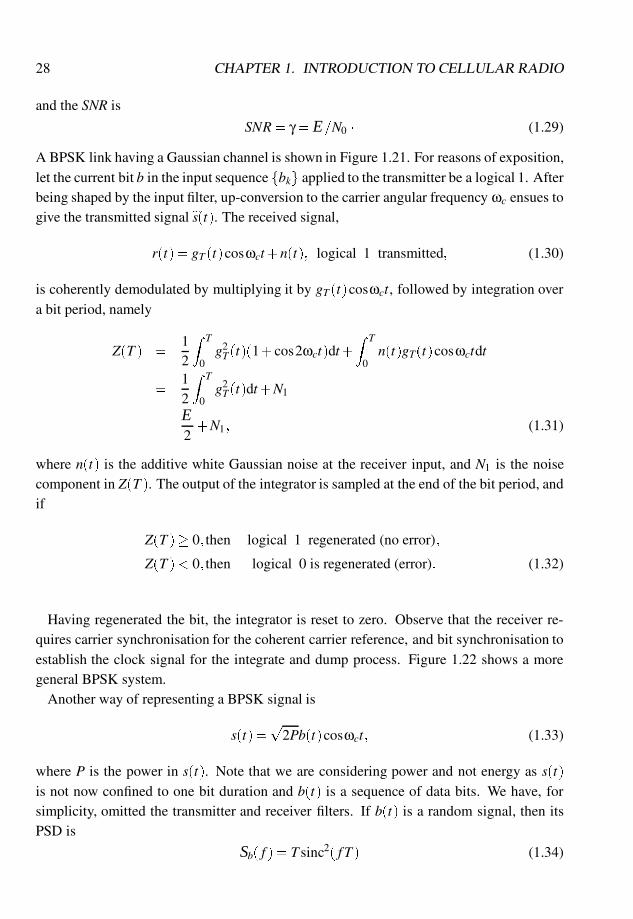
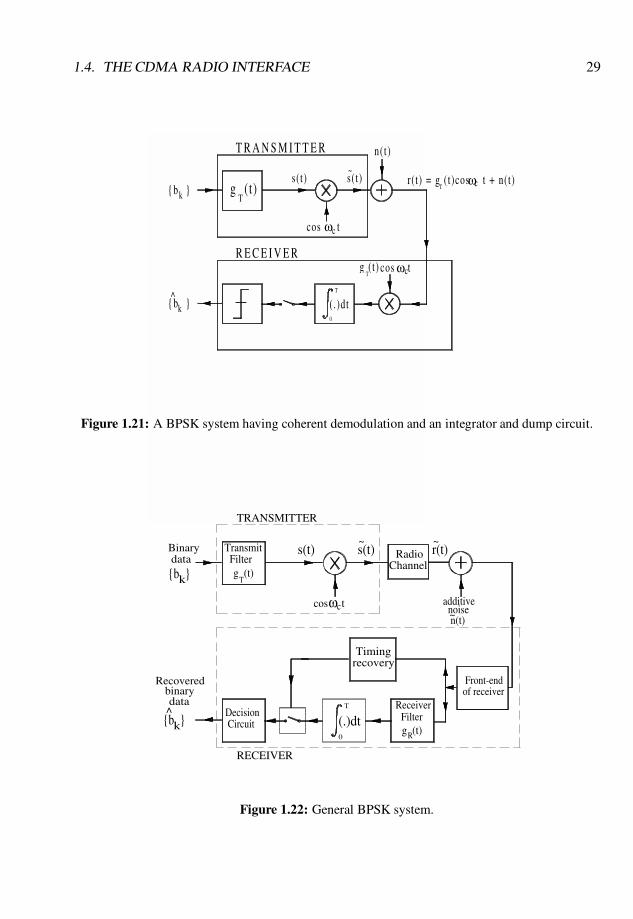
A BPSK link having a Gaussian channel is shown in Figure 1.21. For reasons of exposition,let the current bit b in the input sequence fbkg applied to the transmitter be a logical 1. Afterbeing shaped by the input filter, up-conversion to the carrier angular frequency ωc ensues togive the transmitted signal es(t). The received signal,
r(t) = gT (t)cosωct+n(t); logical 1 transmitted; (1.30)
is coherently demodulated by multiplying it by gT (t)cosωct, followed by integration overa bit period, namely
Z(T ) =12
Z T
0g2T (t)(1+cos2ωct)dt+
Z T
0n(t)gT(t)cosωctdt
=12
Z T
0g2T (t)dt+N1
=E2+N1; (1.31)
where n(t) is the additive white Gaussian noise at the receiver input, and N1 is the noisecomponent in Z(T ). The output of the integrator is sampled at the end of the bit period, andif
Z(T )� 0; then logical 1 regenerated (no error);
Z(T )< 0; then logical 0 is regenerated (error): (1.32)
Having regenerated the bit, the integrator is reset to zero. Observe that the receiver re-quires carrier synchronisation for the coherent carrier reference, and bit synchronisation toestablish the clock signal for the integrate and dump process. Figure 1.22 shows a moregeneral BPSK system.
Another way of representing a BPSK signal is
s(t) =p
2Pb(t)cosωct; (1.33)
where P is the power in s(t). Note that we are considering power and not energy as s(t)
is not now confined to one bit duration and b(t) is a sequence of data bits. We have, forsimplicity, omitted the transmitter and receiver filters. If b(t) is a random signal, then itsPSD is
Sb( f ) = T sinc2( f T) (1.34)
1.4. THE CDMA RADIO INTERFACE 29
(.)dtT
cos tc
{b }^k
0
g ( t)
R E C E I V E R
T R A N S M I T T E R
k{b }T
ω
s(t)
g ( t) ωccos tT
r( t) = g ( t)cos t + n(t)
n( t )
~s(t)
Tωc
Figure 1.21: A BPSK system having coherent demodulation and an integrator and dump circuit.
(.)dtT
CircuitDecision
RECEIVER
{b }k
Recovered binary data
^
0
g (t)
Transmit Filter
TRANSMITTER
{b }k
Binary data
T
cos tωc
s(t)
Filterg (t)R
Receiver
Timingrecovery
Front-endof receiver
additive noise n(t)~
Channel Radio
~s(t)
~r(t)
Figure 1.22: General BPSK system.
30 CHAPTER 1. INTRODUCTION TO CELLULAR RADIO
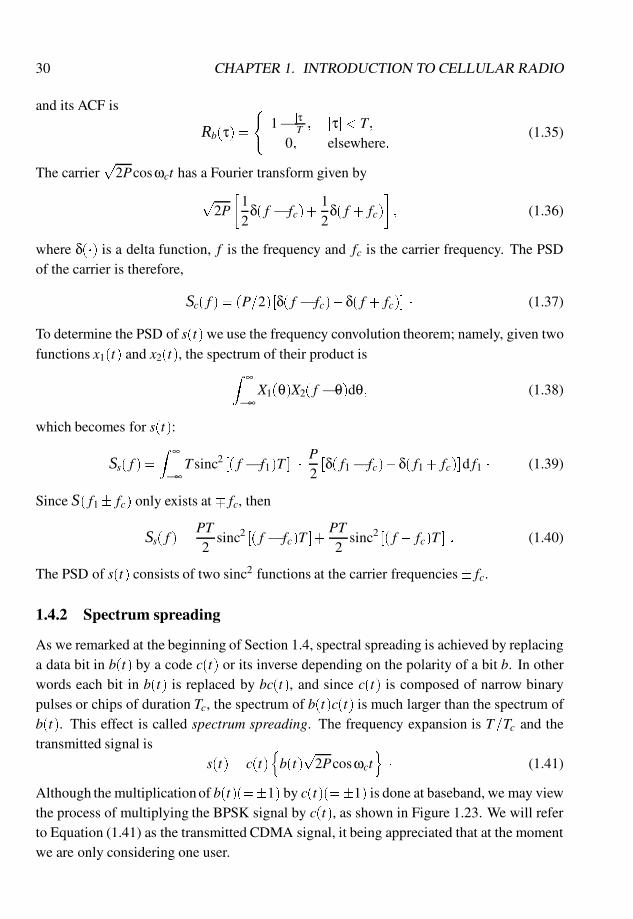
and its ACF is
Rb(τ) =
(1� jτj
T ; jτj< T;0; elsewhere:
(1.35)
The carrierp
2Pcosωct has a Fourier transform given by
p2P
�12
δ( f � fc)+12
δ( f + fc)
�; (1.36)
where δ(�) is a delta function, f is the frequency and fc is the carrier frequency. The PSDof the carrier is therefore,
Sc( f ) = (P=2) [δ( f � fc)+δ( f + fc)] � (1.37)
To determine the PSD of s(t) we use the frequency convolution theorem; namely, given twofunctions x1(t) and x2(t), the spectrum of their product is
Z ∞
�∞X1(θ)X2( f �θ)dθ; (1.38)
which becomes for s(t):
Ss( f ) =Z ∞
�∞T sinc2 [( f � f1)T ] � P2 [δ( f1� fc)+δ( f1 + fc)]d f1 � (1.39)
Since S( f1� fc) only exists at � fc, then
Ss( f ) =PT2
sinc2 [( f � fc)T ]+PT2
sinc2 [( f + fc)T ] : (1.40)
The PSD of s(t) consists of two sinc2 functions at the carrier frequencies � fc.
1.4.2 Spectrum spreading
As we remarked at the beginning of Section 1.4, spectral spreading is achieved by replacinga data bit in b(t) by a code c(t) or its inverse depending on the polarity of a bit b. In otherwords each bit in b(t) is replaced by bc(t), and since c(t) is composed of narrow binarypulses or chips of duration Tc, the spectrum of b(t)c(t) is much larger than the spectrum ofb(t). This effect is called spectrum spreading. The frequency expansion is T=Tc and thetransmitted signal is
s(t) = c(t)nb(t)
p2Pcosωct
o� (1.41)
Although the multiplication of b(t)(=�1) by c(t)(=�1) is done at baseband, we may viewthe process of multiplying the BPSK signal by c(t), as shown in Figure 1.23. We will referto Equation (1.41) as the transmitted CDMA signal, it being appreciated that at the momentwe are only considering one user.
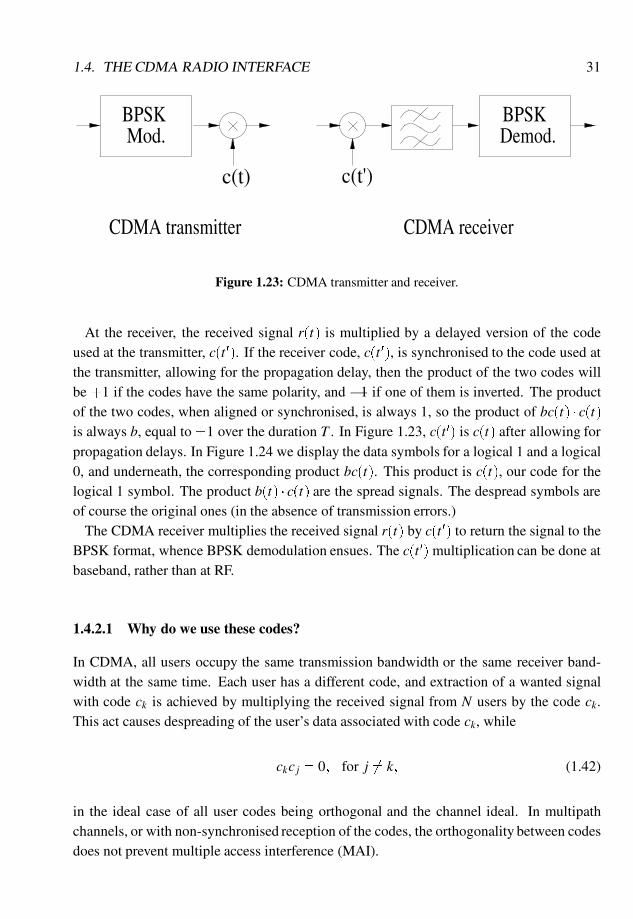
1.4. THE CDMA RADIO INTERFACE 31
CDMA transmitter
Mod. BPSK
c(t)
CDMA receiver
BPSKDemod.
c(t')
Figure 1.23: CDMA transmitter and receiver.
At the receiver, the received signal r(t) is multiplied by a delayed version of the codeused at the transmitter, c(t 0). If the receiver code, c(t 0), is synchronised to the code used atthe transmitter, allowing for the propagation delay, then the product of the two codes willbe +1 if the codes have the same polarity, and �1 if one of them is inverted. The productof the two codes, when aligned or synchronised, is always 1, so the product of bc(t) � c(t)is always b, equal to �1 over the duration T . In Figure 1.23, c(t 0) is c(t) after allowing forpropagation delays. In Figure 1.24 we display the data symbols for a logical 1 and a logical0, and underneath, the corresponding product bc(t). This product is c(t), our code for thelogical 1 symbol. The product b(t) � c(t) are the spread signals. The despread symbols areof course the original ones (in the absence of transmission errors.)
The CDMA receiver multiplies the received signal r(t) by c(t 0) to return the signal to theBPSK format, whence BPSK demodulation ensues. The c(t 0) multiplication can be done atbaseband, rather than at RF.
1.4.2.1 Why do we use these codes?
In CDMA, all users occupy the same transmission bandwidth or the same receiver band-width at the same time. Each user has a different code, and extraction of a wanted signalwith code ck is achieved by multiplying the received signal from N users by the code ck.This act causes despreading of the user’s data associated with code ck, while
ckc j = 0; for j 6= k; (1.42)
in the ideal case of all user codes being orthogonal and the channel ideal. In multipathchannels, or with non-synchronised reception of the codes, the orthogonality between codesdoes not prevent multiple access interference (MAI).
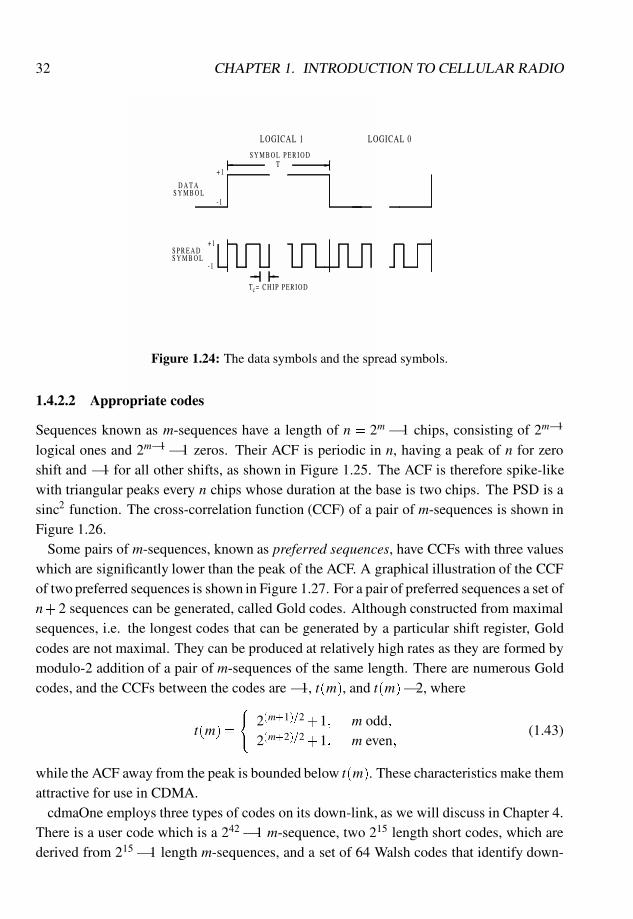
32 CHAPTER 1. INTRODUCTION TO CELLULAR RADIO
LOGICAL 1 LOGICAL 0
S Y M B O L P E R I O D
T = C H I P P E R I O D
S P R E A DS Y M B O L
+ 1
-1
c
-1
+ 1
S Y M B O LD A T A
T
Figure 1.24: The data symbols and the spread symbols.
1.4.2.2 Appropriate codes
Sequences known as m-sequences have a length of n = 2m� 1 chips, consisting of 2m�1
logical ones and 2m�1� 1 zeros. Their ACF is periodic in n, having a peak of n for zero
shift and �1 for all other shifts, as shown in Figure 1.25. The ACF is therefore spike-likewith triangular peaks every n chips whose duration at the base is two chips. The PSD is asinc2 function. The cross-correlation function (CCF) of a pair of m-sequences is shown inFigure 1.26.
Some pairs of m-sequences, known as preferred sequences, have CCFs with three valueswhich are significantly lower than the peak of the ACF. A graphical illustration of the CCFof two preferred sequences is shown in Figure 1.27. For a pair of preferred sequences a set ofn+ 2 sequences can be generated, called Gold codes. Although constructed from maximalsequences, i.e. the longest codes that can be generated by a particular shift register, Goldcodes are not maximal. They can be produced at relatively high rates as they are formed bymodulo-2 addition of a pair of m-sequences of the same length. There are numerous Goldcodes, and the CCFs between the codes are �1, t(m), and t(m)�2, where
t(m) =
(2(m+1)=2+1; m odd;
2(m+2)=2+1; m even;
(1.43)
while the ACF away from the peak is bounded below t(m). These characteristics make themattractive for use in CDMA.
cdmaOne employs three types of codes on its down-link, as we will discuss in Chapter 4.There is a user code which is a 242
� 1 m-sequence, two 215 length short codes, which arederived from 215
� 1 length m-sequences, and a set of 64 Walsh codes that identify down-
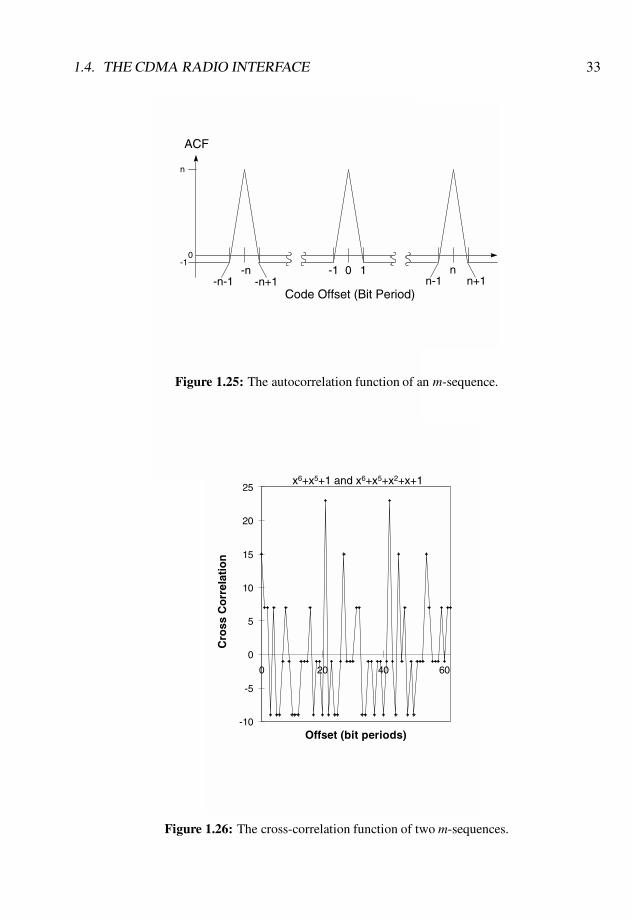
1.4. THE CDMA RADIO INTERFACE 33
0 1-1-1
-n-n+1-n-1
nn-1 n+1
0
n
Code Offset (Bit Period)
ACF
Figure 1.25: The autocorrelation function of an m-sequence.
-10
-5
0
5
10
15
20
25
0 20 40 60
Offset (bit periods)
Cro
ss C
orr
elat
ion
x6+x5+1 and x6+x5+x2+x+1
Figure 1.26: The cross-correlation function of two m-sequences.

34 CHAPTER 1. INTRODUCTION TO CELLULAR RADIO
-10
-8
-6
-4
-2
0
2
4
6
8
0 10 20 30
Offset (bit periods)
Cro
ss C
orr
elat
ion
x5+x2+1 and x5+x4+x2+x+1
Figure 1.27: The cross-correlation function of two preferred sequences.
link channel numbers. Since the Walsh codes have a high profile role in cdmaOne we willdescribe them here [18]. Walsh codes are binary orthogonal codes. When used on theirown they are not effective in CDMA. For example, in some textbooks on CDMA they arenot even mentioned. If a single code is to be used, unlike the situation in cdmaOne, then auser would do better not to use Walsh codes [19]. However, as used in cdmaOne they areeffective.
Walsh codes are easy to generate using a Hadamard matrix. The matrix of order twocontains the zero-order and first-order Walsh codes, namely
H2 =
"1 11 �1
#: (1.44)
The matrix is square and the zero-order Walsh code is found in the first row and in thefirst column. The first-order Walsh code is the second row and the second column. The
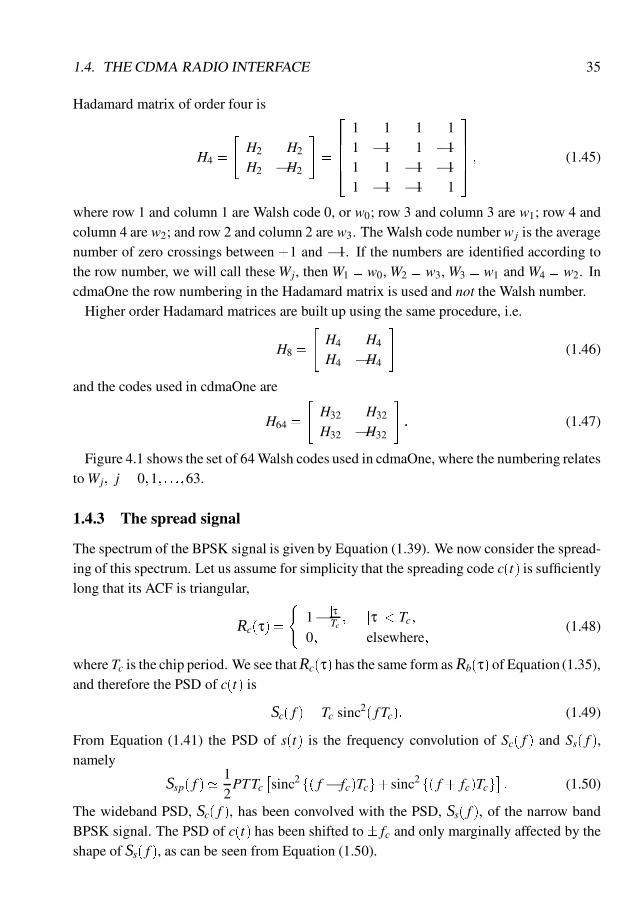
1.4. THE CDMA RADIO INTERFACE 35
Hadamard matrix of order four is
H4 =
"H2 H2
H2 �H2
#=
26664
1 1 1 11 �1 1 �11 1 �1 �11 �1 �1 1
37775 ; (1.45)
where row 1 and column 1 are Walsh code 0, or w0; row 3 and column 3 are w1; row 4 andcolumn 4 are w2; and row 2 and column 2 are w3. The Walsh code number wj is the averagenumber of zero crossings between +1 and �1. If the numbers are identified according tothe row number, we will call these Wj, then W1 = w0, W2 = w3, W3 = w1 and W4 = w2. IncdmaOne the row numbering in the Hadamard matrix is used and not the Walsh number.
Higher order Hadamard matrices are built up using the same procedure, i.e.
H8 =
"H4 H4
H4 �H4
#(1.46)
and the codes used in cdmaOne are
H64 =
"H32 H32
H32 �H32
#: (1.47)
Figure 4.1 shows the set of 64 Walsh codes used in cdmaOne, where the numbering relatesto Wj; j = 0;1; : : :;63.
1.4.3 The spread signal
The spectrum of the BPSK signal is given by Equation (1.39). We now consider the spread-ing of this spectrum. Let us assume for simplicity that the spreading code c(t) is sufficientlylong that its ACF is triangular,
Rc(τ) =
(1� jτj
Tc; jτj< Tc;
0; elsewhere;(1.48)
where Tc is the chip period. We see that Rc(τ) has the same form as Rb(τ) of Equation (1.35),and therefore the PSD of c(t) is
Sc( f ) = Tc sinc2( f Tc): (1.49)
From Equation (1.41) the PSD of s(t) is the frequency convolution of Sc( f ) and Ss( f ),namely
Ssp( f )'12PTTc
�sinc2 f( f � fc)Tcg+ sinc2 f( f + fc)Tcg
�: (1.50)
The wideband PSD, Sc( f ), has been convolved with the PSD, Ss( f ), of the narrow bandBPSK signal. The PSD of c(t) has been shifted to � fc and only marginally affected by theshape of Ss( f ), as can be seen from Equation (1.50).
36 CHAPTER 1. INTRODUCTION TO CELLULAR RADIO
1.4.3.1 Single user transmission over a Gaussian channel with a single frequencyjammer
The transmitted CDMA signal is given by Equation (1.41) and the jammer signal is
j(t) =p
2J cos(ωct+θ); (1.51)
where J is the jammer power and θ is an arbitrary phase angle. The additive noise is
n(t) = AR(t)cos(ωct+ψ); (1.52)
where AR(t) is Rayleigh distributed and ψ is uniformly distributed. The received signal is
r(t) = s(t�TP)+ j(t)+n(t); (1.53)
where Tp is the propagation delay between the transmitter and receiver. When the receivermultiplies r(t) by c(t), the wanted narrow band BPSK signal becomes
s(t) =p
2Pb(t�Tp) cos(ωc(t�Tp)): (1.54)
The jammer signal has been spread by the receiver code and is now wideband,
j(t) = c(t�Tp)p
2J cos(ωct+θ); (1.55)
having a PSD of
S j( f ) =12JTc
�sinc2 f( f � fc)Tcg+ sinc2 f( f + fc)Tcg
�: (1.56)
The noise also remains wideband since
n(t) = c(t�Tp)AR(t)cos(ωct+ψ) (1.57)
with a PSD of
Sn( f ) = σ2n
∞Z
�∞
Tc sinc2f( f � f1)Tcgd f1: (1.58)
The signal r(t)c(t�Tp) is filtered from fc� (1=2T) to fc+(1=2T). The wanted signal ispassed as is the jammer noise that is within the filter bandwidth yielding a noise power of
Jf = J(Tc=T ) (1.59)
since sinc2 f�g= 1 over the filter bandwidth. Similarly the Gaussian noise passed is
fc+1
2TZ
fc� 12T
Sn( f )d f = σ2n (Tc=T ) : (1.60)
1.4. THE CDMA RADIO INTERFACE 37
Observe that the act of despreading has decreased the unwanted interference power andnoise power by the same factor, Tc=T . We call this the processing gain:
G= T=Tc: (1.61)
The signal supplied to the BPSK demodulator is
rBPSK(t) =p
2P b(t�Tp)cos(ωc(t�Tp))+N(t); (1.62)
where N(t) is a Gaussian noise signal having power�J+σ2
n
�=G. The output of the BPSK
demodulator isTZ
0
rBPSK(t)2cos(ωc(t�Tp))dt =p
2Pb+ N; (1.63)
where N is the noise component after integration. An error occurs if
logical 1 transmitted;p
2P+ N < 0;
logical 0 transmitted;p
2P+ N � 0: (1.64)
1.4.3.2 Summary
We have discussed BPSK, and then introduced the notion of spreading a BPSK signal byreplacing each bit to be transmitted by a code c(t) or its inverse depending on the logicalvalue of the data bit. Then we considered the case of a single user spreading the binarysignal b(t) followed by BPSK modulation. The channel was a simple Gaussian one, exceptthat a narrow band jammer was present. We then found that the receiver could recover thewanted signal in the presence of receiver noise and a jamming signal by multiplying by thecode of the wanted signal. This had the effect of suppressing both the receiver noise and thejammer interference, relative to the wanted signal, by a factor equal to the processing gain,G.
1.4.4 Multiple CDMA users
Consider the case of N mobile users transmitting over wideband fading channels in thepresence of additive white Gaussian noise (AWGN) [19–21]. The transmitted CDMA signalfrom the kth user is
sk(t) =p
2Pck(t)bk(t)cos(ωct+θk); (1.65)
where θk is the phase of the kth carrier. The kth MS transmits over the kth radio channelwhose low pass complex impulse response is
hk(t) = akL
∑i=1
βiδ(t�τi)e jφi ; (1.66)
38 CHAPTER 1. INTRODUCTION TO CELLULAR RADIO
whereak = d�α
k 10ζ10 (1.67)
allows for path loss and shadow fading, as described in connection with Equation (1.6),where α is the path loss component and ζ is the shadow fading random variable. In Equa-tion (1.66), βi is the magnitude and φi is the phase of the ith received path at time τi, δ(t�τi)is a delta function at time τi and L is the number of paths. The received signal for N users is
r(t) =N
∑k=1
[sk(t)�hk(t)] + n(t); (1.68)
where n(t) is the AWGN having a two-side PSD of N0=2. On taking the convolution,
r(t) =p
2PN
∑k=1
akL
∑i=1
βiejφick(t�τi)bk(t�τi)
� cos(ωct�ωcτi+θk)+n(t); (1.69)
where τk is the random delay of the kth user and is uniformly distributed over [0;T ].Suppose the receiver recovers the phase in order to achieve coherent demodulation, and
is locked to, say, the jth path. On multiplying by the coherent carrier and code for the mthuser, followed by integration over a bit period T yields
Z[ j]m (T ) =
pP=2T
�amβ(m)
j b(m)0 +Zs+ZMAI
�+Zn(T); (1.70)
where the first term in this sum of terms is the wanted one, i.e. the scaled current bit ofthe mth user, b(m)
o . An error term arises because we are locked onto the jth path, whereasthere are received components from L paths, and these other (L� 1) versions of the signalthat occur at τi, i 6= j, cause the interference term Zs. Another form of interference ZMAI
is due to the MAI from other user signals, while Zn(T) is the Gaussian noise term. InReference [19], Zs and ZMAI are calculated in terms of partial cross-correlation functionsbetween the spreading codes. The bit error probability at the decision circuit is
Pe =12
erfc
"pP=2T (amβm
j +Zs +ZMAI)p2p
var[Zn(T )]
#� (1.71)
The variance of the AWGN component at the output of the matched filter can be shown tobe
var [Zn(T )] =N0T
4; (1.72)
where N0 is the double-sided PSD of the AGWN. Substitutingvar [Zn(T )] into Equation (1.71)gives
Pe =12
erfc
�rEb
N0(amβm
j +Zs+ZMAI)
�� (1.73)

1.4. THE CDMA RADIO INTERFACE 39
In the above equation, the bit error probability relies on the knowledge of the partial cross-correlation properties between the spreading codes. For conventional CDMA systems, eachbit is spread by a unique code having a code length of an integer number of spreading chipsper bit. The partial cross-correlation functions can be derived for a given spreading code.However, in cellular CDMA systems such as cdmaOne, the user code is a segment of a PNcode which has a length that is much greater than the number of spreading chips per bit.Consequently, the property of the partial cross-correlation functions varies from segment tosegment, and it becomes difficult to use the above approach to analyse the performance ofthese CDMA systems.
In cellular environments, the interference not only comes from the users in the MS’scell, but also from all the users in other cells. The total multiple access interference tendsto be Gaussian distributed due to the Central Limit Theorem. Therefore, an alternativeapproach to calculating Pe is to employ the Gaussian approximation method. This modelsthe summation of the total interference and AWGN at the receiver input as a Gaussiandistribution. For the Gaussian approximation model, Equation (1.70) can be rewritten as
Z[ j]m (T ) =
pP=2Tamβm
j bm0 +
rP2T [Zs+ZMAI ]+Zn(T ) ; (1.74)
where the first term is the wanted signal and the others are AWGN. The corresponding biterror probability is
Pe =12
erfc
2664
pP=2Tamβm
j
p2
�qvar[
pP=2T (Zs+ZMAI)]+ var[Zn(T )]
�3775 � (1.75)
Substituting var [Zn(T)] into Equation (1.71) with (1.72), we have
Pe =12
erfc
"amβm
jp2var[(Zs+ZMAI)]+N0=Eb
#� (1.76)
1.4.5 Simple capacity equation
This equation should be applied with caution because it is based on rather simplistic as-sumptions. Nevertheless it is often used to give an estimate of how many users a cell sitecan support. The number of users a system can support is highest for the cdmaOne typeof CDMA systems if each MS adjusts its transmitted power so that the received power atthe BS is S. The interference to any MS from the other (N� 1) MSs is (N� 1)S, and for areceiver noise power of N0W , the SIR for a single cell is
SIR=S
(N�1)S+N0W; (1.77)
40 CHAPTER 1. INTRODUCTION TO CELLULAR RADIO
where N0 is the PSD of the receiver noise and W is the bandwidth of the radio channel.Another representation of the SIR is
SIR=Eb (energy/bit) � Rb (bits/sec)I0 (PSD of the interference) � W
� (1.78)
Equating these two expressions for the SIR gives
Eb
I0=
G
(N�1)+ N0WS
(1.79)
with G, the processing gain, given by
G=TTc'
WRb
: (1.80)
Hence the number of users is
N = 1�N0WS
+G
Eb=I0(1.81)
and the signal-to-receiver noise ratio (S=N0W) is reasonably high so
N 'G
Eb=I0� (1.82)
Note that although the SNR � 1 because it is approximately 1=N, the noise power at theinput of the receiver, namely (N � 1)S+N0W , is decreased by the processing gain, G, togive a positive Eb=I0 at the output of the matched filter.
Of course, in practice a power control system that always ensures every MS delivers anexact power, S, at the cell site cannot be realised. A factor h can be introduced to accountfor imperfect power control. Then there is discontinuous transmission whereby an MSessentially ceases transmissions when the user is not speaking. We represent this by afactor µ. Users in neighbouring cells will also produce interference at the BS which wecall intercellular interference. An up-link reuse efficiency j is included to allow for thisinterference. If there are g sectors per cell site we end up with an approximate expressionfor the number of users per site as
N '
�G
Eb=I0
��h jgµ
�� (1.83)
Other multiplicative factors can be introduced to allow for the effects of handovers betweencells and between sectors.
In Chapter 5 we will deal in more detail with the calculation of N. The above discussionis meant to introduce the reader to a simple method of calculating how many users can beaccommodated at a cell site.
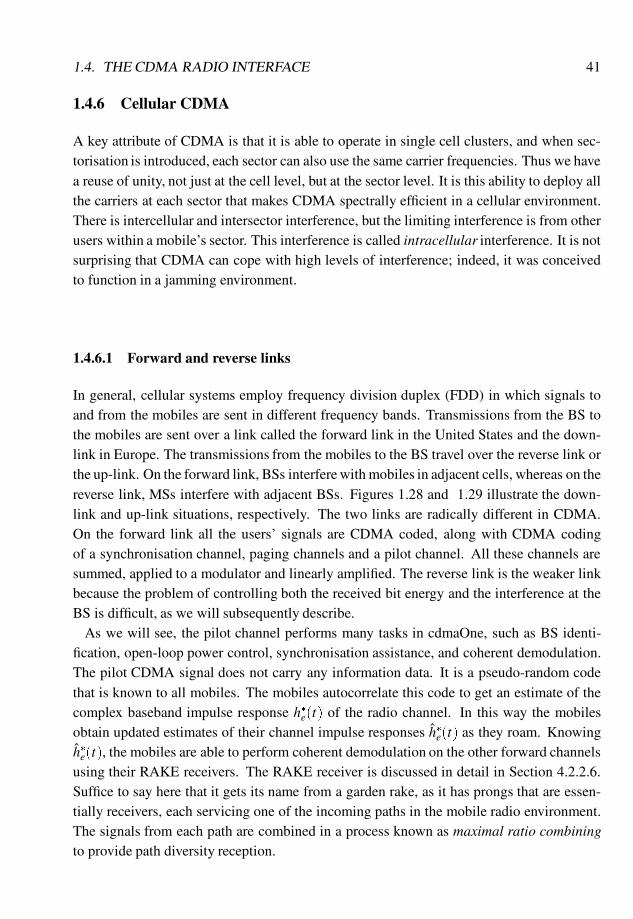
1.4. THE CDMA RADIO INTERFACE 41
1.4.6 Cellular CDMA
A key attribute of CDMA is that it is able to operate in single cell clusters, and when sec-torisation is introduced, each sector can also use the same carrier frequencies. Thus we havea reuse of unity, not just at the cell level, but at the sector level. It is this ability to deploy allthe carriers at each sector that makes CDMA spectrally efficient in a cellular environment.There is intercellular and intersector interference, but the limiting interference is from otherusers within a mobile’s sector. This interference is called intracellular interference. It is notsurprising that CDMA can cope with high levels of interference; indeed, it was conceivedto function in a jamming environment.
1.4.6.1 Forward and reverse links
In general, cellular systems employ frequency division duplex (FDD) in which signals toand from the mobiles are sent in different frequency bands. Transmissions from the BS tothe mobiles are sent over a link called the forward link in the United States and the down-link in Europe. The transmissions from the mobiles to the BS travel over the reverse link orthe up-link. On the forward link, BSs interfere with mobiles in adjacent cells, whereas on thereverse link, MSs interfere with adjacent BSs. Figures 1.28 and 1.29 illustrate the down-link and up-link situations, respectively. The two links are radically different in CDMA.On the forward link all the users’ signals are CDMA coded, along with CDMA codingof a synchronisation channel, paging channels and a pilot channel. All these channels aresummed, applied to a modulator and linearly amplified. The reverse link is the weaker linkbecause the problem of controlling both the received bit energy and the interference at theBS is difficult, as we will subsequently describe.
As we will see, the pilot channel performs many tasks in cdmaOne, such as BS identi-fication, open-loop power control, synchronisation assistance, and coherent demodulation.The pilot CDMA signal does not carry any information data. It is a pseudo-random codethat is known to all mobiles. The mobiles autocorrelate this code to get an estimate of thecomplex baseband impulse response h�e(t) of the radio channel. In this way the mobilesobtain updated estimates of their channel impulse responses h�e(t) as they roam. Knowingh�e(t), the mobiles are able to perform coherent demodulation on the other forward channelsusing their RAKE receivers. The RAKE receiver is discussed in detail in Section 4.2.2.6.Suffice to say here that it gets its name from a garden rake, as it has prongs that are essen-tially receivers, each servicing one of the incoming paths in the mobile radio environment.The signals from each path are combined in a process known as maximal ratio combiningto provide path diversity reception.
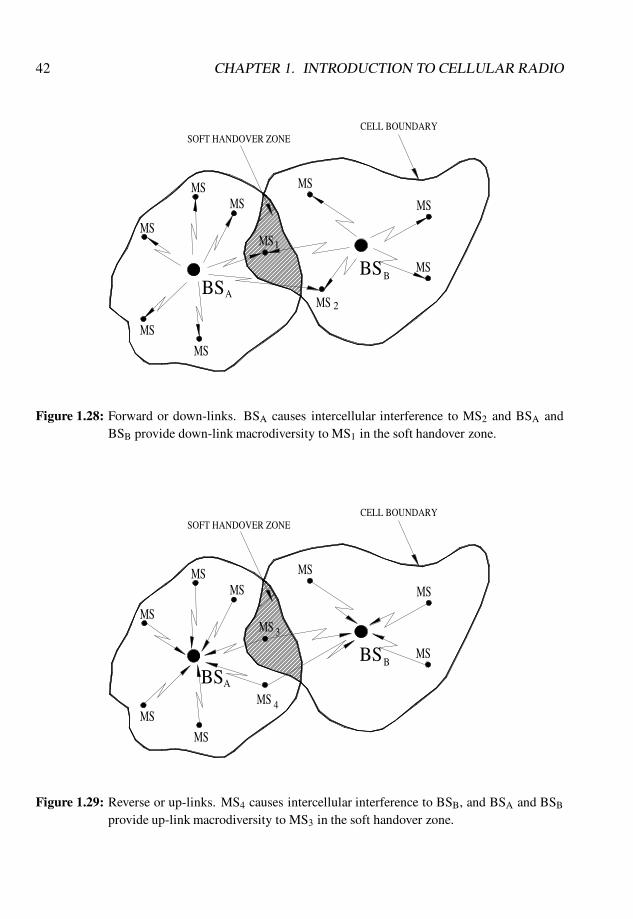
42 CHAPTER 1. INTRODUCTION TO CELLULAR RADIO
MS
A
MS
BS
MS
MS
MS1
MS
SOFT HANDOVER ZONE
BS MS
MS 2
B
CELL BOUNDARY
MS
MS
Figure 1.28: Forward or down-links. BSA causes intercellular interference to MS2 and BSA andBSB provide down-link macrodiversity to MS1 in the soft handover zone.
MS
A
MS
BSMS 4
MS
MS
MS 3
MS
SOFT HANDOVER ZONE
BS MSB
CELL BOUNDARY
MS
MS
Figure 1.29: Reverse or up-links. MS4 causes intercellular interference to BSB, and BSA and BSB
provide up-link macrodiversity to MS3 in the soft handover zone.
1.4. THE CDMA RADIO INTERFACE 43
1.4.6.2 Power control
The transmitted power of the mobile is controlled using both open-loop and closed-loopsystems. The combined control systems must provide rapid changes to the mobile trans-mitted power over a wide dynamic power range. All mobiles adjust their transmitted powerin an attempt to make their received power at the BS close to a target Eb=I0. Errors incontrolling the received power, and therefore errors in Eb=I0 for each user, can significantlydecrease the number of users that a BS can handle for a given BER.
The fast fading is different on each of the two FDD links and the closed-loop systemattempts to track this fading. This is only successfully accomplished at low mobile speeds.At fast vehicular speeds link quality is maintained by the FEC codec and its interleaver.The shadow fading is the same on both FDD links and therefore it can be combatted by theopen-loop system. The mobiles filter the output of the pilot correlator so that the variationsin the received pilot level can be tracked at the slow fading rates. Remember that the pilotsignal is transmitted at a constant power level.
Neighbouring cells also exercise up-link power control on their mobiles, but not on theinterference that these mobiles can cause to neighbouring BSs. This interference is calledintercellular interference.
On the forward link, a mobile receives the complete CDMA signal from its BS. Thesignals for the other mobiles in its cell constitute intracellular interference, but we mayview the power control as perfect since they are all transported on the same carrier from thesame place (the cell site) and with the same relative power. Because of neighbouring cellsthis idyllic situation is spoilt because some mobiles near a cell boundary are subjected tointercellular interference from adjacent BSs. In this case, the transmitted forward link powerfor these mobiles is increased slightly to overcome this additional interference. However,the dynamic range of the transmitted power variations on the forward link is small and theupdating of the power level is slow compared with the control exercised on the reverse link,i.e. on the transmitted power of each mobile.
1.4.6.3 Importance of Eb=I0
A key parameter is the expected value of the ratio of the energy per bit, Eb, to the PSDof the interference plus receiver noise, I0, referred to the input of the decision circuit. Wedeal with the expected values of this ratio, i.e. E fEb=I0g, as Eb, an energy, relates to thetransmitted power, the path loss, the shadow fading and the number of paths in the RAKEreceiver; while I0 is dependent on the intracellular and intercellular interferences, which inturn depend on the number of users making calls, the voice activity, mobile speed, errors inthe power control and so forth.
We consider I0 to be AWGN, like the receiver noise. This is because the MAI is the sum
44 CHAPTER 1. INTRODUCTION TO CELLULAR RADIO
of many user signals, which is Gaussian by the Central Limit Theorem. If the RAKE, FECcoding with interleaving and space diversity are able to remove the effects of fading, thendemodulation of the data is done in a Gaussian channel.
The capacity of a CDMA system is determined by the E fEb=I0g on the reverse link. TheBER depends on the Q-function of Eb=I0, and for a maximum acceptable BER there is an(Eb=I0)acc. This (Eb=I0)acc is not a constant, but varies with mobile speed. For a Gaussianchannel, (Eb=I0)acc is small. For poor channels we have a maximum (Eb=I0)acc, i.e. theinterference plus noise PSD, I0, becomes large. Controlling I0 is more difficult on the up-link. Power control errors have a significant effect on capacity.
1.4.6.4 Intercellular interference
This interference results from users in neighbouring cells and is therefore dependent on theloading of these cells, i.e. on the number of users making calls, the path loss exponent αand the shadow fading. The lower the α the greater the interference, and α is not homoge-neous, particularly in microcells. Typically, the number of users that a cell can support maydecrease due to intercellular interference by some 50% in terrestrial cellular systems, andby more in mobile satellite systems.
1.4.6.5 Processing gain
The processing gain G is defined as the symbol duration T to the chip duration Tc. UsuallyTc is fixed, but T is a function of the service. When a low bit rate service is being used,G is large, and the interference is suppressed giving a high E fEb=I0g and low BER. Thesituation is reversed for high symbol rate services.
1.4.6.6 Cell size
The dimensions of a cell are dependent on the number of users and the number of users inadjacent cells. If we consider an isolated cell with one user the dimension of the cell is verylarge, as I0 is merely the noise due to the receiver. Suppose the mobile is at the cell boundarywhere the mobile transmits its maximum power to overcome the path loss. If more usersbecome active in this single cell, the interference to our mobile on the boundary increasesand because the mobile is already transmitting at maximum power, Eb=I0 is unacceptablylow. Consequently the mobile on the boundary must move towards the BS, increasing thereceived Eb, until the acceptable Eb=I0 is reached. The distance from the BS where thisoccurs marks the new boundary. Thus the cell boundary is not fixed.
Suppose now a neighbouring cell site is activated. Intercellular interference occurs andour mobile on the boundary has a value of Eb=I0 at the receiver that is too low. To increaseEb at the receiver, it again has to move closer to its BS and now we have a new boundary

1.4. THE CDMA RADIO INTERFACE 45
surrounding a smaller size cell. Therefore, as the number of users increases in a set ofcontiguous cells, the cell sizes decrease and vice versa. It is therefore essential to providegenerously proportioned soft handover zones in which the cell sizes can fluctuate. Thebiggest factor affecting cell size is the intracellular interference.
1.4.6.7 Effect of demodulation on the reverse link capacity
Another reason for the reverse link having the poorer performance is that non-coherentdemodulation is used in narrow-band CDMA, because the BS cannot cope from an inter-ference point of view with receiving N pilots from the N mobiles, in addition to their trafficchannels. It is possible to employ coherent demodulation, but at the expense of capacity.This is done in the CODIT system [22]. Wideband DS-CDMA can transmit a pilot fromeach mobile, provided the pilot level is at a much lower power than its traffic channel.
1.4.6.8 FEC coding, interleaving and modulation
On both links it is customary to FEC code the data. The designer is not inhibited in hisuse of FEC coding from a bandwidth expansion point of view as the FEC coding gain morethan compensates for the loss of processing gain resulting from spectral spreading by theCDMA code. Indeed, if complexity were not a limitation the FEC code could expand thedata rate to the chip rate bandwidth. It would still be necessary to use a code for the purposeof multiple access.
Although wideband channels do not have the fading depths of narrow-band channels,errors will still occur in bursts. Accordingly the bits after FEC coding are interleaved inorder that the receiver on de-interleaving will disperse the errors to facilitate efficient FECdecoding.
Basic types of modulation tend to be used for CDMA. BPSK is appropriate. Quadraturephase shift keying (QPSK), where the same data are applied to each quadrature channel, butdifferent spreading codes are used, is better. Figure 1.30 shows a balanced QPSK CDMAmodem where the same BPSK signal is applied to two quadrature arms and spread by dif-ferent codes. M-ary modulation can also be employed, but the gains that are achieved canbe more easily realised by other methods, such as decreasing the FEC code rate.
1.4.6.9 Narrow-band versus wideband CDMA
Narrow-band direct sequence CDMA (DS-CDMA), typified by cdmaOne, has the advan-tage that is does not require a large spectrum allocation for its introduction. Furthermore,it is easier to introduce into existing analogue networks, like AMPS or TACS, as only alimited number of analogue channels need to be released for narrow-band DS-CDMA com-pared with wideband DS-CDMA.
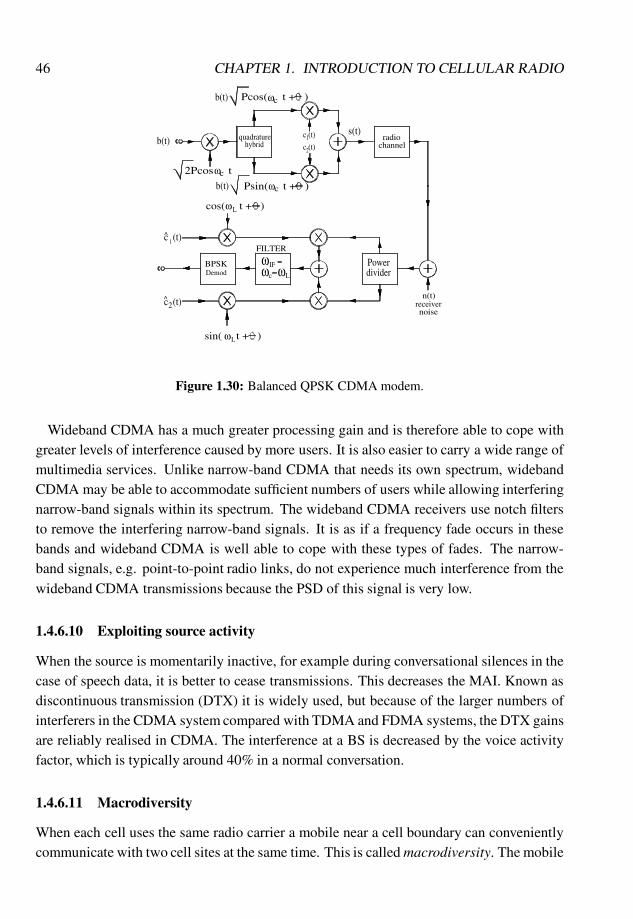
46 CHAPTER 1. INTRODUCTION TO CELLULAR RADIO
Psin( t + )
Pcos( t + )
c (t)^
2c (t)^
1
sin( t + )ωL
DemodBPSK
ω ωc L
ωIF
FILTER
2Pcos t
b(t)
cos( t + )ωL
b(t)
ωc
ωc
quadrature
b(t)
hybrid
ωc
dividerPower
receivernoise
n(t)
channelradio
2
c (t)
c (t)1
s(t)
Figure 1.30: Balanced QPSK CDMA modem.
Wideband CDMA has a much greater processing gain and is therefore able to cope withgreater levels of interference caused by more users. It is also easier to carry a wide range ofmultimedia services. Unlike narrow-band CDMA that needs its own spectrum, widebandCDMA may be able to accommodate sufficient numbers of users while allowing interferingnarrow-band signals within its spectrum. The wideband CDMA receivers use notch filtersto remove the interfering narrow-band signals. It is as if a frequency fade occurs in thesebands and wideband CDMA is well able to cope with these types of fades. The narrow-band signals, e.g. point-to-point radio links, do not experience much interference from thewideband CDMA transmissions because the PSD of this signal is very low.
1.4.6.10 Exploiting source activity
When the source is momentarily inactive, for example during conversational silences in thecase of speech data, it is better to cease transmissions. This decreases the MAI. Known asdiscontinuous transmission (DTX) it is widely used, but because of the larger numbers ofinterferers in the CDMA system compared with TDMA and FDMA systems, the DTX gainsare reliably realised in CDMA. The interference at a BS is decreased by the voice activityfactor, which is typically around 40% in a normal conversation.
1.4.6.11 Macrodiversity
When each cell uses the same radio carrier a mobile near a cell boundary can convenientlycommunicate with two cell sites at the same time. This is called macrodiversity. The mobile
1.4. THE CDMA RADIO INTERFACE 47
examines the pilots from each BS and chooses the K strongest paths, irrespective of whichBS they are associated with, where K is the maximum number of paths that may be trackedby the RAKE receiver. The mobile then exercises maximum ratio combining (MRC) on thetraffic channel data. Although MRC can be performed by combining the received signalsat each BS, it is more convenient to employ switch diversity reception at the base stationcontroller (BSC).
1.4.6.12 Handover
As the mobile approaches the boundary of its cell and its link performance deteriorates, itsBS is asked for assistance. The result is that the BS that services the cell on the other sideof the boundary is directed to also communicate with the mobile. Macrodiversity occursand the process of soft handover, also called soft hand off (SHO), is said to begin. Whenthe mobile travels sufficiently far into the new cell, the old BS ceases to communicate withthe mobile leaving the communications between the new BS and the mobile. When thisoccurs the SHO process is completed. SHO is, therefore a make-before-break handover.Softer handovers (SSHOs) are when soft handovers occur in the boundary zones of adjacentsectors of the same cell site.
When an operator has been allocated many carriers he may arrange for each cell site to useall of these carriers. When a mobile is near a boundary operating on carrier f1, the adjacentBS may have no capacity on its carrier f1 and so an SHO cannot be performed. The mobilewill then experience a hard handover (HHO) to a different CDMA carrier when the qualityof the link associated with carrier f1 becomes unacceptable. The HHO is characterisedby a break before make protocol. The HHO means that because macrodiversity cannot beaccommodated, the mobile must transmit and receive at higher power levels compared withwhen an SHO is implemented. The consequence is higher interference to other users anda decrease in system capacity. Consequently the network should avoid HHOs wheneverpossible.
Note that in an SHO the mobile transmits as if it were transmitting to its original BS,using the synchronisation codes, etc. that were assigned to it on call set-up. It receives,however, by observing the same data transmitted by both BSs. (SHO can involve more thantwo BSs.) The new BS would already be receiving interference from the mobile, but nowstarts to decode its signals as wanted ones. It does have to transmit to the mobile, but at lowpower levels because the mobile is using MRC. The network operator must have channelsavailable for SHO transmissions. The percentage of channels for this purpose may be high,e.g. 30%, since the soft handover decision zones near the boundary can be substantial. Thecontinuity of traffic flow during SHO is important for data services as it avoids delays dueto buffering in systems that employ HHO, like GSM.
48 CHAPTER 1. INTRODUCTION TO CELLULAR RADIO
1.4.6.13 Diversity techniques in DS-CDMA
1. Spaced diversity on the reverse link where the BS uses two or more antennas. RAKEreceivers utilise the best set of paths from the pool of paths received from one or moreantennas.
2. Deep fades associated with narrow-band TDMA and FDMA are avoided by the act offrequency spreading. Instead, fading may occur at some frequencies, but the fadingis not flat across the band. In the time domain the fading depth is therefore less thanin narrow-band systems.
3. By using RAKE reception we are able to demodulate versions of the transmittedsignal that are received over different paths. The effect of multipaths is partiallyremoved leading to a more Gaussian-like channel. The RAKE receiver is said toprovide path diversity.
4. The macrodiversity associated with SHO, where more than one BS communicateswith a mobile, can also be employed in indoor cells where the RAKE may be inef-fective if there are insufficient numbers of resolvable paths. It can also be appliedin mobile satellite communications where the mobile utilises signals from more thanone spot-beam to compensate for being in high path loss situations.
5. Time diversity is achieved by powerful channel coding followed by time interleaving.The time diversity achieved by the interleaving of symbols over a window randomisesthe error bursts and thereby assists channel decoding, but results in an interleavingdelay. This delay is made a function of the offered service, being relatively smallfor speech and long for computer file transfers. When long delays are permissible,concatenated coding is deployed to decrease the BER.
1.4.6.14 No frequency planning
CDMA networks can use all the allocated carriers at each cell site. By using single cellclusters frequency planning is avoided. This is an enormous advantage compared with net-works employing TDMA and FDMA, where frequency planning is time consuming and ex-pensive. The problem of frequency planning in three-dimensional microcells is formidable.The problem of frequency planning shifts in CDMA to one of coverage planning. Cells haveirregular shapes and fitting them together with suitable soft handover zones is non-trivial.Hence careful planning of transmitter power and BS siting is important.
1.4. THE CDMA RADIO INTERFACE 49
1.4.6.15 Capacity in DS-CDMA
This is high compared with TDMA and FDMA using fixed channel allocation (FCA) mainlybecause CDMA can operate in single cell clusters and get large gains from sectorisation.In accessing the network users are assigned codes which may be orthogonal at the mobiletransmitters, but have non-zero cross-correlation at the BS receiver due to multipath fad-ing. This manifests itself as intracellular interference from users within the same cell andintercellular interference from users in adjacent cells. The interference limits the number ofusers.
To combat interference we use good radio link design so that the link can function in highlevels of interference, e.g. by using FEC coding, and we employ techniques to decrease theinterference experienced by each user, e.g. sectorisation. Another approach is to remove theMAI due to the non-zero cross-correlation of the users’ codes at the receiver. This approachis known as interference cancellation [23,24,28–31] and is not used in the current cellularCDMA systems.
1.4.6.16 Frequency hopping CDMA
All our descriptions of CDMA are of DS-CDMA. There is another generic form of CDMAknown as frequency hopped CDMA (FH-CDMA). Before completing our discussion ofCDMA we will say a few words regarding the hopping variety. There are two types ofFH-CDMA, one is called slow frequency hopped CDMA (SFH-CDMA) and the other fastfrequency hopped CDMA (FFH-CDMA). As the names imply, FH-CDMA transmits itsinformation at any instant on a carrier drawn from a bank of carriers. The channel occupancyof each carrier must be sufficient to accommodate the modulated signal.
The length of time the transmitted carrier is unchanged is called the dwell time (TD). Afterthis time has elapsed the transmitted carrier may change, i.e. hop, to another carrier. Thereis a sequence of frequency hops that is given to a user. This sequence is a frequency hoppingcode, and in general this code sequence continuously repeats while a user is transmittingdata. Figure 1.31 shows a code sequence for the situation of eight carrier frequencies. Eachshaded block represents a data modulated signal positioned at a specific frequency. Supposethe modulated data are binary frequency shift keying (BFSK) where a logical l is representedby frequency fA and a logical 0 by a frequency fB. If the duration of a data bit is Tb, thenthe BFSK output is either fA or fB and lasts for Tb seconds. Should TD < Tb, then it followsthat for one bit there will be a number of frequency hops. This is the case of FFH-CDMA.On the other hand, if TD � Tb, each hop may last for a packet of data and this is referred toas SFH-CDMA. The military often use FFH-CDMA, where the hopping rate may be veryfast making it difficult to effectively jam the transmitted signal. However, the technology iscomplex and expensive for the commercial market where SFH-CDMA is preferred.

50 CHAPTER 1. INTRODUCTION TO CELLULAR RADIO
TD Time
Code sequenceduration Tcode
Fre
quen
cy
f1
2f
3f
4f
5f
6f
7f
8f
Figure 1.31: FH-CDMA hopping sequence.
Consider the case of SFH-CDMA using BFSK. The basic arrangements of the transmitterand receiver are shown in Figure 1.32. The input binary data are applied to the BFSKmodulator and a sequence of frequencies containing fA and fB that represents the logicalbits is formed. A log2 n-bit code generator selects fi, one of n possible carrier frequencies.The BFSK signal is translated in frequency to fi, and remains at this frequency while theBFSK frequency sequence corresponding to a packet of input data bits occurs. After timeTD, a new data packet occurs and is transmitted on a new value of fi according to thedictates of the code. At the receiver, the same carrier fi used in the transmitter is generated,but shifted by the IF. As a consequence the output of the mixer is always the BFSK signalat the IF. The BFSK signal is then demodulated by, say, a discriminator.
When other mobiles are present, the receiver will receive the wanted signal in the pres-ence of signals that are hopping according to different codes. We can make these codesorthogonal. For example, we may give users the same code, but with a time offset. If thecode is of length n, then n different codes may be used without any two users occupyingthe same hopping frequency at any one time. At the receiver, the unwanted signals will notbe down-converted to IF, but to other frequencies outside the bandwidth of the IF amplifier.In other words, the wanted signal is despread to the IF, while the unwanted signals remainwideband and are filtered out.
Owing to the need to reuse the set of hopping frequencies over a wide geographical area,it is inevitable that sometimes another user will use the same hopped frequency at the sametime. Demodulation of the data packet will now have to be done in the presence of an inter-ferer, and bit errors are inevitable, unless suitable error correcting procedures are employed.It is an appropriate juncture to observe that if SFH-CDMA were not used, and only BFSK
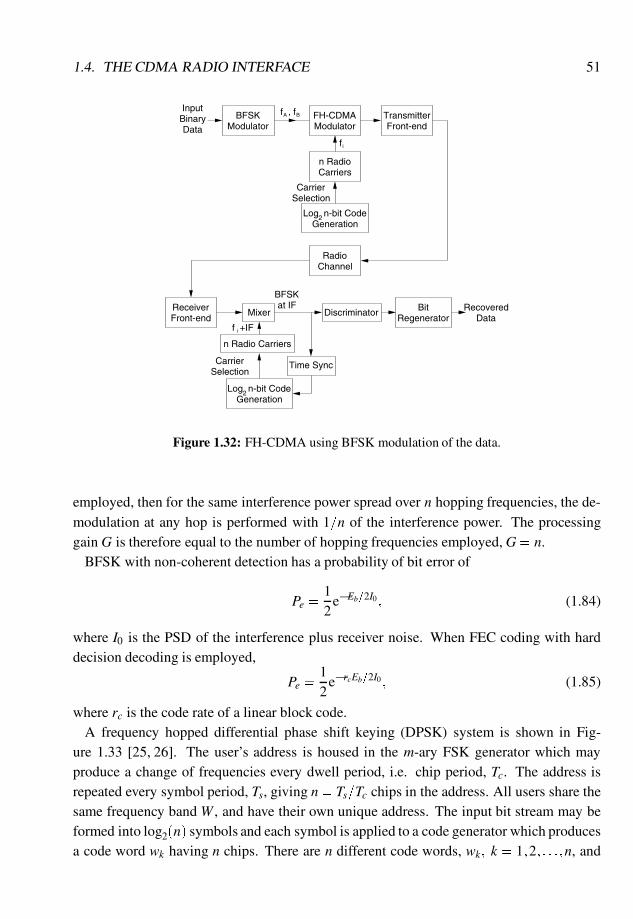
1.4. THE CDMA RADIO INTERFACE 51
BFSKModulator Modulator
FH-CDMAf , f A BInput
BinaryData Front-end
Transmitter
Carriersn Radio
Log n-bit CodeGeneration
fi
CarrierSelection
ChannelRadio
Front-endReceiver Mixer
n Radio Carriers
Log n-bit CodeGeneration
2
2
CarrierSelection
Time Sync
BFSKat IF
f +IFi
DiscriminatorRegenerator
Bit RecoveredData
Figure 1.32: FH-CDMA using BFSK modulation of the data.
employed, then for the same interference power spread over n hopping frequencies, the de-modulation at any hop is performed with 1=n of the interference power. The processinggain G is therefore equal to the number of hopping frequencies employed, G= n.
BFSK with non-coherent detection has a probability of bit error of
Pe =12
e�Eb=2I0; (1.84)
where I0 is the PSD of the interference plus receiver noise. When FEC coding with harddecision decoding is employed,
Pe =12
e�rcEb=2I0; (1.85)
where rc is the code rate of a linear block code.A frequency hopped differential phase shift keying (DPSK) system is shown in Fig-
ure 1.33 [25, 26]. The user’s address is housed in the m-ary FSK generator which mayproduce a change of frequencies every dwell period, i.e. chip period, Tc. The address isrepeated every symbol period, Ts, giving n= Ts=Tc chips in the address. All users share thesame frequency band W , and have their own unique address. The input bit stream may beformed into log2(n) symbols and each symbol is applied to a code generator which producesa code word wk having n chips. There are n different code words, wk; k = 1;2; : : :;n, and
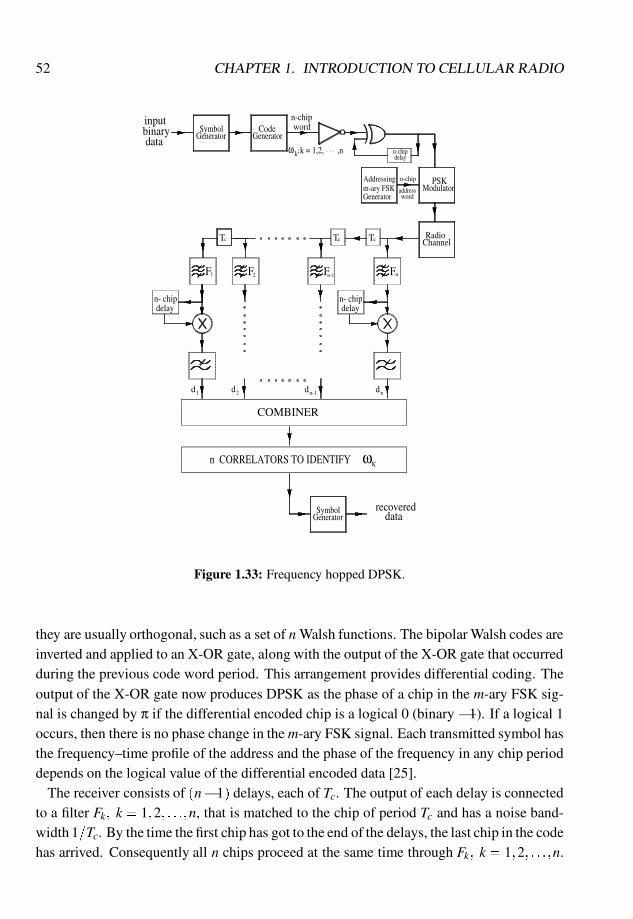
52 CHAPTER 1. INTRODUCTION TO CELLULAR RADIO
COMBINER
d
n CORRELATORS TO IDENTIFY
n-chip word
k = 1,2, ,n
1d 2d
GeneratorSymbol
n- chip delay
F1
binarydata
input
F2
cT
Generator Code
;ω k
recovereddata
ωκ
GeneratorSymbol
n-1 nd
n-chipdelay
address word
n-chip
m-ary FSKGenerator
n- chip delay
Fn-1
cT
nF
Tc
Addressing
Channel Radio
Modulator PSK
Figure 1.33: Frequency hopped DPSK.
they are usually orthogonal, such as a set of n Walsh functions. The bipolar Walsh codes areinverted and applied to an X-OR gate, along with the output of the X-OR gate that occurredduring the previous code word period. This arrangement provides differential coding. Theoutput of the X-OR gate now produces DPSK as the phase of a chip in the m-ary FSK sig-nal is changed by π if the differential encoded chip is a logical 0 (binary �1). If a logical 1occurs, then there is no phase change in the m-ary FSK signal. Each transmitted symbol hasthe frequency–time profile of the address and the phase of the frequency in any chip perioddepends on the logical value of the differential encoded data [25].
The receiver consists of (n�1) delays, each of Tc. The output of each delay is connectedto a filter Fk; k = 1;2; : : :;n, that is matched to the chip of period Tc and has a noise band-width 1=Tc. By the time the first chip has got to the end of the delays, the last chip in the codehas arrived. Consequently all n chips proceed at the same time through Fk; k = 1;2; : : :;n.
1.4. THE CDMA RADIO INTERFACE 53
Their phase relative to the previous word is detected with the aid of the n-chip delays and theproduct detectors. The low pass filters remove out-of-band frequencies to yield the detectedoutputs d j; j = 1;2; : : :;n.
The pass-bands of filters Fk are selected according to the user’s address, i.e. to the m-aryFSK code signal. Hence the output of the phase detectors gives the logical value of then-chip code word ωk representing the data symbol. The receiver must now identify ωk andhence the data symbol associated with ωk. This identification is achieved by correlating thesequence d j, with all possible words ωk,
Rk =
N
∑j=1
ωk jd j; k = 1;2; : : :;n; (1.86)
where ωk j is the jth bit of the kth word, and the value of k that gives the maximum Rk isdeemed to be the transmitted data code word from which the data symbol is immediatelyknown.
1.4.6.17 Some features of FH-CDMA
FH-CDMA and DS-CDMA both spread the spectrum of the data symbols using codes andthereby achieve frequency diversity on a user’s link, while the interference is averaged fromall users and decreased by the processing gain. The frequency hopping enables the effectsof fading to be mitigated, where the fading on each hop should be uncorrelated. FEC codingand interleaving may be employed. Users in interfering cells use different frequency hop-ping sequences. The timing of each mobile can be adjusted under BS control to ensure thatthe signals from all mobiles in a cell are time aligned at the BS. Because the mobiles use or-thogonal codes, they remain so at the BS. If quasi-orthogonal hopping sequences are used,then time alignment is not necessary due to the low cross-correlation properties betweenany two hopping sequences.
Dispersion due to multipaths is, in general, small in FH-CDMA. Guard times are alsoused with each burst. Consequently power control is not stringent and is similar to that usedin TDMA systems (like GSM) and for the same reasons, namely to decrease intercellularinterference. A dynamic range of 30 dB is sufficient with step sizes of �3 dB, comparedwith 85 dB with step sizes of�1 dB and an update rate of about a 1 kHz in DS-CDMA. FH-CDMA does not need a contiguous band of frequencies, like DS-CDMA, and, as each hoprepresents a narrow-band channel, it does not require the large guard bands associated withband edges of a contiguous set of FDMA DS-CDMA signals. Discontinuous transmission(DTX) is used.
54 CHAPTER 1. INTRODUCTION TO CELLULAR RADIO
1.5 Cellular Network Architecture
1.5.1 Physical and logical channels
In the previous sections we have discussed various methods that may be used to share acommon radio resource between a number of users, i.e. TDMA, FDMA and CDMA. Thesetechniques are used to divide the radio resources into a number of physical channels. TakingTDMA as an example, a single timeslot on a single carrier frequency is a physical channel.The user-generated and control information is mapped onto the physical channels usinglogical channels which carry information of a similar type. A single physical channel maybe used to carry a number of different logical channels. In the following section we willexamine the different types of logical channel.
1.5.2 Traffic and signalling channels
In any cellular radio system there are two main categories of logical channel that may existon the radio link between the mobile unit and the BS [1,2].
The traffic channels carry the user-generated information between the MS and the net-work. This information may take a number of different forms, including encoded speechdata or fax data. The maximum bit rate supported by the traffic channels defines the typesof service the system may support, e.g. speech, fax, video.
Both during and outside of a call, a degree of control information must flow between theMS and the network, and this is carried on signalling (or control) channels. This signallinginformation is used to control the MS during such processes as call set-up and handover.The signalling channels may be classified into a number of categories depending on themanner in which they are allocated and used.
The first category of signalling channels are those that are present whilst a MS is engagedin a connection with a BS. In GSM terminology, these channels are termed associatedcontrol channels, since they are always associated with a traffic channel. These channelsare used by the network to control the MS during a call and by the MS to report measurementinformation back to the network. GSM and cdmaOne both use different strategies to supportthese associated control channels and these will be discussed in the chapters dealing witheach system.
In cellular systems there are times when an MS must exchange signalling informationwith the network outside of a normal call. One example of this is location updating, wherebyan MS will autonomously, i.e. without any user interaction, register its location with the net-work as it moves between cells. In GSM terminology, these channels are termed dedicatedcontrol channels, since they are allocated to a particular MS in a similar way to traffic chan-nels. In general, dedicated control channels support a significantly lower data rate than
1.5. CELLULAR NETWORK ARCHITECTURE 55
traffic channels (in GSM it is eight times smaller).Cellular systems must provide an effective means by which an MS can access the network,
either in response to an incoming call or in response to the user making a call. MSs will bealerted to the presence of an incoming call, or mobile terminated call, by means of a pagingchannel. Every MS in a cell is required to continuously monitor this channel whilst it is notengaged in a call. When an MS needs to set up a connection with the network, either inresponse to a paging call or in response to the user making a call, i.e. a mobile originatedcall, it will do so using an access channel. The paging and access channels are generallytermed common control channels, since they may be used by any MS within a cell and theyare not allocated to individual MSs.
The final category of signalling channel used in cellular systems is the broadcast channels.As the name would suggest, these channels are used by the network to broadcast generalsynchronisation and system information to all the MSs within a cell. This information isused by the MS initially to find and synchronise with a BS at switch-on. The broadcastchannels will also carry general system parameters relating to the BS configuration.
Each BS must support channels from each of the different categories. The broadcast chan-nel configuration will generally be the same at each BS, since the amount of informationconveyed by these channels is unlikely to vary significantly across the entire network. Thenumber of paging channels required at a particular cell is determined by the rate at whichpaging calls must be transmitted. To examine the factors that affect the paging rate, we mustfirst introduce the important concept of the location area.
As an MS moves around a cellular network it must always ensure that the system is awareof its location so that it can be paged when an incoming call arrives. This is achieved bya process known as location updating, whereby an MS will access the network and supplysome brief details about the subscriber. Each MS will be registered within a location areawhich may consist of a single cell or a number of cells. In the event of an incoming call, theMS will be paged in every cell within the location area in which it is registered. This meansthat larger location areas will result in each BS having to transmit more paging messages,and the number of paging channels must be increased to support this additional load.
When an MS is paged, it will only reply to one BS, regardless of the size of the locationarea. This means that the number of access requests will be determined by the number ofusers located within an individual cell.
The number of dedicated control channels required at each cell is governed by a numberof factors. An MS must register its location with the network each time it moves betweendifferent location areas. This means that smaller location areas will lead to a larger numberof registrations, and since these will be supported using dedicated control channels, this willincrease the number of these channels required at a cell. The number of dedicated controlchannels will also be governed by the types of services supported within a cell, e.g. short
56 CHAPTER 1. INTRODUCTION TO CELLULAR RADIO
message service (SMS), which make use of these dedicated channels.Finally, the number of traffic channels required at each BS will be governed by the number
of users within each cell and the amount of time they spend engaged in calls. The numberof traffic channels required is usually determined using the Erlang-B formula [27].
1.5.3 Network topology
In this section we take a brief look at some of the main components of a mobile radiosystem. Chapter 2 contains a more detailed description of these components as they applyto GSM. cdmaOne is essentially an air-interface specification and we do not describe anyof the supporting network in Chapter 4, which deals with this system. The main componentthat the general public would associate with a cellular radio system is an MS that is only amobile phone. In many cases this is the only part of the cellular network that the subscriberever encounters. MSs may take a number of different forms, from the car phone, where theunit is installed in a vehicle and makes use of an exterior antenna and the vehicle’s powersupply, to the hand-held portable, which has its own battery power supply and is smallenough to be carried in a shirt pocket. As a minimum, an MS will contain a microphoneand loud speaker, and a keypad for entering telephone numbers and accessing the MS’sfeatures. In the case of a hand-held portable, the antenna may be entirely internal, or it maybe external with the facility to be extended to improve link quality.
The MS communicates with the cellular network, and any other networks, by means ofa radio link to its nearest BS. BSs are the other part of a cellular network that is clearlyvisible to the general public – on the tops of tall buildings or on tall masts by the sidesof major roads. Current BSs generally consist of a large weatherproof and vandal-proofcabinet which houses all the electronics and power supplies. A cable runs from the cabi-net to the antenna system, which may take a number of different forms depending on thecell configuration. Simple, non-sectorised cells may use two omnidirectional antennas ina ‘rugby goal post’, or ‘American football goal post’ arrangement. Although only one an-tenna is required for transmission, the second antenna is used to provide space diversity forthe reception of signals from the MS. Sectorised cells require one antenna, or two antennasfor diversity reception, in each sector, and these are positioned on and around a building ortower according to the sector plan.
As the demand for cellular services continues to expand at a phenomenal rate, the networkoperating companies are continually being forced to reduce the size of their cells to supportthe additional traffic. This means that much smaller BSs are required where antennae canbe mounted below the urban sky-line on the sides of buildings or on lamp posts. These BSsuse small, unobtrusive antennas, similar to those currently mounted on vehicles.
The BSs are connected to a switching and control centre via dedicated links, usually non-radio ones. We will refer to this centre as the mobile switching centre (MSC) (although we
1.5. CELLULAR NETWORK ARCHITECTURE 57
will see later how GSM interposes a base station controller (BSC) between its MSC and itsBSs). Generically, there are a number of MSCs that connect to each other and to the BSsthey are responsible for. Like the PSTN switches, the MSCs are concerned with routingtraffic. However, they must also support MS mobility. An MSC will allocate and supervisethe radio channels at each of its BSs. Generally, the BSs are relatively simple, with theintelligence in the MSC. Some MSCs have a gateway role, interfacing with other fixed andcellular networks.
In addition to the MS, BS and MSC, which are essentially all that is required to provide asimple connection between two users on the same, or different network, there are a numberof other components of a cellular system which are used to support the mobility of MSsand control the services that are provided. Home location registers (HLRs) are used to storeinformation particular to each individual subscriber on a cellular network. An HLR containsinformation relating to the types of services to be supported, e.g. international or premiumrate calls, and the subscriber’s current location within the network. Every subscriber toa cellular network has an entry in its HLR and this may be accessed by the subscriber’stelephone number or their electronic serial number (ESN).
A second database, known as the visitor location register (VLR), is used to hold informa-tion relating to those subscribers within a particular part of the network. Each VLR may beassociated with one, or a number of location areas. When an MS registers in a new locationarea, the subscriber’s details are copied from the HLR into the VLR for that area. If thesubscriber subsequently moves into a location area controlled by a different VLR, their de-tails will be deleted from the old VLR and added to the new VLR. Using the VLR to hold alocal copy of the subscriber’s details means that they can be accessed quickly and efficientlywhen required, e.g. during call set-up, rather than have the network access the HLR. This isparticularly important in systems that support international roaming. In this case the HLRand the MS may be located in different countries.
Although not essential to the operation of the network, a further database may be pro-vided to track stolen or malfunctioning MSs. In GSM, this is termed the equipment identityregister (EIR). Where a cellular network supports security functions, e.g. subscriber authen-tication or radio path encryption, a further database is required to hold any security relatedinformation. In GSM this database is termed the authentication centre (AUC).
A cellular network must also provide some means by which the operator may monitorand control its operation. This may take the form of monitoring the number of call attemptsthat are blocked at a particular BS, or changing the manner in which the radio resources areallocated to a particular cell. The interface between the network operator and the cellularnetwork is termed the operations andmaintenance centre (OMC). This may be concentratedwithin a central location or distributed throughout a number of different locations.
A cellular network must support features which assist the network operator in administer-
58 CHAPTER 1. INTRODUCTION TO CELLULAR RADIO
ing and billing subscribers. This is provided by the administration centre (ADC).In this section we have described some of the generic functional blocks which make up
a cellular system. Different systems may use different names for these blocks or dividetheir functionality in different ways; however, a cellular system must support all the basicfunctions described above in some form or another.
1.5.4 Making a call to a mobile subscriber
Armed with the discussions in the previous sections, we now examine the processes thatoccur when a person uses a telephone connected to a PSTN or ISDN, to make a call to amobile subscriber who, for argument’s sake, is travelling along the M3 motorway betweenSouthampton and London at 70 mph. One prerequisite for this entire process is that themobile subscriber actually has her mobile phone, or MS, switched on and that she is cur-rently within the coverage area of the cellular network. At switch-on the MS searches foran appropriate cellular network by scanning the relevant frequency band for some form ofrecognisable control channel transmitted by a nearby BS. The MS then informs the networkof its current location by performing a process known as location updating whereby it ac-cesses the network and provides it with its unique serial number. In some cases this locationup-dating process may not be necessary, for example where an MS is switched off and thenon again in the same area. When a location update is performed, the network enters thesubscriber’s details in the VLR associated with the location area in which the MS has regis-tered. Also, details of the MS’s location are stored within the subscriber’s entry in the HLR.Once an MS has successfully registered its location with the network it enters the idle modewhereby it listens to the paging channels from the selected BS.
Returning to our example of the mobile subscriber travelling along the M3 motorway, wewill assume that the MS was switched on at the start of the journey in Southampton’s CityCentre. In this case the MS will have identified a BS in this area, registered its locationwith the network and then commenced monitoring one of the BS’s paging channels. As thesubscriber drives out of the City Centre and towards the outskirts of the city to join the M3motorway, the MS will notice that the signal received from the City Centre BS begins tofall. If this was allowed to continue unchecked the subscriber would eventually drive out ofrange of the City Centre BS and the MS would no longer be in a position to make or receivecalls. However, in the case of a cellular system, as the signal begins to deteriorate from oneBS, the MS will start to look for a more appropriate BS to take over.
When the MS can identify a more appropriate BS it will examine its control channels todetermine the location area to which it belongs. If it belongs to the same location area asthe previous BS, the MS simply retunes to a paging channel on the new BS and continuesto monitor this new channel for incoming paging calls. Where the MS has moved betweenBSs in different locations areas, it must perform a location update and inform the network
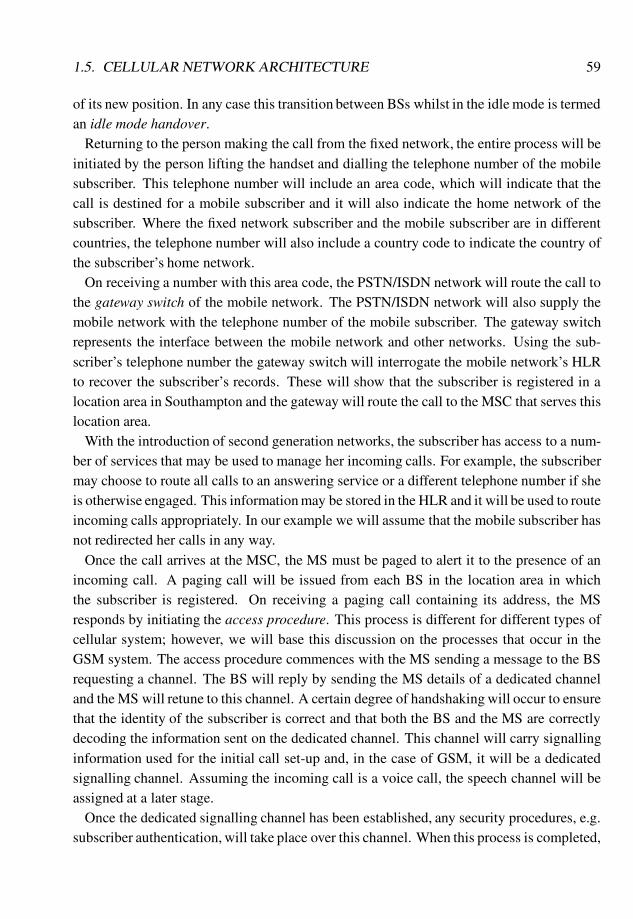
1.5. CELLULAR NETWORK ARCHITECTURE 59
of its new position. In any case this transition between BSs whilst in the idle mode is termedan idle mode handover.
Returning to the person making the call from the fixed network, the entire process will beinitiated by the person lifting the handset and dialling the telephone number of the mobilesubscriber. This telephone number will include an area code, which will indicate that thecall is destined for a mobile subscriber and it will also indicate the home network of thesubscriber. Where the fixed network subscriber and the mobile subscriber are in differentcountries, the telephone number will also include a country code to indicate the country ofthe subscriber’s home network.
On receiving a number with this area code, the PSTN/ISDN network will route the call tothe gateway switch of the mobile network. The PSTN/ISDN network will also supply themobile network with the telephone number of the mobile subscriber. The gateway switchrepresents the interface between the mobile network and other networks. Using the sub-scriber’s telephone number the gateway switch will interrogate the mobile network’s HLRto recover the subscriber’s records. These will show that the subscriber is registered in alocation area in Southampton and the gateway will route the call to the MSC that serves thislocation area.
With the introduction of second generation networks, the subscriber has access to a num-ber of services that may be used to manage her incoming calls. For example, the subscribermay choose to route all calls to an answering service or a different telephone number if sheis otherwise engaged. This information may be stored in the HLR and it will be used to routeincoming calls appropriately. In our example we will assume that the mobile subscriber hasnot redirected her calls in any way.
Once the call arrives at the MSC, the MS must be paged to alert it to the presence of anincoming call. A paging call will be issued from each BS in the location area in whichthe subscriber is registered. On receiving a paging call containing its address, the MSresponds by initiating the access procedure. This process is different for different types ofcellular system; however, we will base this discussion on the processes that occur in theGSM system. The access procedure commences with the MS sending a message to the BSrequesting a channel. The BS will reply by sending the MS details of a dedicated channeland the MS will retune to this channel. A certain degree of handshaking will occur to ensurethat the identity of the subscriber is correct and that both the BS and the MS are correctlydecoding the information sent on the dedicated channel. This channel will carry signallinginformation used for the initial call set-up and, in the case of GSM, it will be a dedicatedsignalling channel. Assuming the incoming call is a voice call, the speech channel will beassigned at a later stage.
Once the dedicated signalling channel has been established, any security procedures, e.g.subscriber authentication, will take place over this channel. When this process is completed,

60 CHAPTER 1. INTRODUCTION TO CELLULAR RADIO
a few more messages will pass between the MS and BS to ensure that the MS has the abilityto receive the call. Following this the network will allocate a dedicated speech channel andboth the BS and MS will retune to this channel and establish a connection. It is importantto note that all of these processes have been performed autonomously by the MS and nointeraction is required from the subscriber. In fact, to this point the mobile subscriber iscompletely unaware of the presence of an incoming call.
It is only once all these processes have been completed that the MS begins to ring and thesubscriber is made aware that someone is calling her. The subscriber will indicate that shewishes to receive the call by pressing the ‘off-hook’ button, or in some cases the MS mayautomatically answer the call. The affirmation is signalled back to the network by the MSand the incoming call is finally routed to the subscriber’s MS, and the two parties may startconversing.
We recall that our mobile subscriber is travelling along the M3 motorway and shortly afterthe call commences the subscriber moves out of the coverage area of the current BS and intothe coverage area of a new BS. It is important, if the call is to be maintained, that it is routedto the MS through the new BS. The process by which an MS moves between BSs while acall is in progress is called a handover. There are a number of different ways in which thecellular system can determine which new BS it should use as it moves out of the coveragearea of its current BS. In the case of both the GSM and cdmaOne systems, the handoverprocess is mobile assisted in that the MS continually measures the received signal strengthfrom its own BS and also from the neighbouring BSs. These measurements are reportedback to the network and they are used to determine the most appropriate cell for handoverpurposes. Once the network has decided that an MS is to be handed over between two BSs,it issues a handover command from the current BS on the dedicated speech channel andthis will contain details of the new dedicated speech channel on the new BS. The MS willthen retune to this new channel and a small amount of handshaking will occur to ensurethat the new connection has been established correctly. Once this has occurred the call isrouted to the MS via the new BS and the call continues normally. The handover processwill result in a short break in the speech path; however, this will normally be imperceptibleto the people involved in the conversation. We have essentially described a hard handover.cdmaOne employs soft handovers where the link to the new BS is established before the oldlink is relinquished. This means that there will be no break in the signal path, which is veryattractive from the point of view of data transmission where breaks can result in data loss.
Once the call has ended and one party has put down the telephone (or pressed the on-hookbutton in the case of the mobile subscriber) the call clear down process will be initiated.This consists of a small exchange of signalling information which ensures that both thenetwork and the MS know that the call has been ended by one of the parties. Once thisprocess is complete the MS will return to its idle mode and it will monitor the paging
1.5. CELLULAR NETWORK ARCHITECTURE 61
channel of its current cell.Calls initiated by the mobile subscriber follow a very similar process to that outlined
above; however, the process will commence with the subscriber dialling a number into theMS and pressing the ‘send’ button. Following this, the MS will access the network usingthe access procedure and the process will continue as described above.
� � �
We trust that this chapter has given you some insight into cellular radio. We now get intospecifics by describing the GSM system.
Bibliography
[1] Mouly M. and M.-B. Pautet, The GSM System for Mobile Communications, Publishedby the authors, 1992.
[2] Steele R. [Ed.], Mobile Radio Communications, John Wiley and IEEE Press, 1992.
[3] Viterbi A.J., Principles of Spread Spectrum Communications, Addison–Wesley, 1995.
[4] Rappaport T.S., Wireless Communications, Prentice-Hall, 1996.
[5] Macario R.C.V. [Ed.], Modern personal radio systems, IEE Telecommun. Ser. 33, 1996.
[6] Gibson J.D. [Ed.], The Mobile Communications Handbook, CRC Press and IEE Press,1966.
[7] Prasad R., CDMA for Wireless Personal Communications, Artech House, 1996.
[8] Jabbari B., P. Godlewski and X. Lagrange [Eds], Multiaccess, Mobility and Teletrafficfor Personal Communications, Kluwer Academic, 1966.
[9] Nanda S. and D.J. Goodman, Third GenerationWireless InformationNetworks, KluwerAcademic, 1992.
[10] Wong W.C., R. Steele and C.-E. Sundberg, Source-matched Mobile Communications,Pentech Press and IEEE Press, 1995.
[11] Proakis J.G. Digital Communications, McGraw-Hill, 1995.
[12] Parsons J.D. and J.G. Gardiner, Mobile Communications Systems, Blackie, 1989.
[13] Griffiths J., Radio Wave Propagation and Antennas – An Introduction, Prentice-HallInternational, 1987.
62
BIBLIOGRAPHY 63
[14] Webb W.T. and L. Hanzo, Quadrature Amplitude Modulation, John Wiley and IEEEPress, 1994.
[15] MacDonald V.H., The cellular concept, Bell Syst. Tech. J., 58, 1979, 15–41.
[16] Forney G.D. (Jr), The Viterbi algorithm, Proc. IEEE, 61, Mar 1973, 268–278.
[17] Cheung J.C.S. and R. Steele, Soft-decision feedback equaliser for continuousphase modulated signals in wideband mobile radio channels, IEEE Trans. Commun.,42(2/3/4), Feb/Mar/April 1994, 1628–1638.
[18] Harmuth H.F., Transmission of Information by Orthogonal Functions, Springer-Verlag, New York, 1969.
[19] Lam W.H. and R. Steele, Performance of direct-sequence, spread-spectrum multiple-access systems in mobile radio, IEE Proc.-I, 138(1), Feb 1991, 1–14.
[20] Pursley M.B. and D.V. Sarwate, Performance for evaluation of phase-coded spreadspectrum multiple access communication. Part I: System analysis, IEEE Trans. Com-mun. 25, 1977, 795–799.
[21] Pursley M.B. and D.V. Sarwate, Performance for evaluation of phase-coded spreadspectrum multiple access communication. Part II: Code sequence analysis, IEEE Trans.Commun. 25, 1977, 800–803.
[22] Baier A., U.-C. Fiebig, W. Granzow, W. Koch, P. Teder and J. Thielecke, Design studyfor a CDMA-based third generation mobile radio system, IEEE J. Sel. Area. Commun.,12(4), May 1994, 733–743.
[23] Li Y. and R. Steele, Serial interference cancellation method for CDMA, Electron. Lett.,30(19), 15 Sept 1994, 1581–83.
[24] Mowbray R.S., R.D. Pringle and P.M. Grant, Increased capacity CDMA system capac-ity through adaptive cochannel interference regeneration and cancellation, IEE Proc.-I,139(5), Oct 1992, 515–524.
[25] Henry P.S., Spectrum efficiency of a frequency-hopped-DSPK spread spectrum mobileradio system, IEEE Trans. Veh. Technol., VT-28(4), Nov 1979, 327–332.
[26] Cooper G.R. and R.W. Nettleton, A spread-spectrum technique for high capacity mo-bile communications, IEEE Trans. Veh. Technol., VT-27, Nov 1978, 264–275.
[27] Boucher J.R., Voice Teletraffic System Engineering, Artech House, 1988.
64 BIBLIOGRAPHY
[28] Oon T.-B., R. Steele and Y. Lee, Cancellation frame size for a quasi-single-bit detectorin asynchronous CDMA channel, Electron. Lett., 33, Feb 1997, 258–259.
[29] Oon T.-B., R. Steele and Y. Lee, Performance of an adaptive successive serial-parallelCDMA cancellation in flat Rayleigh fading channels, IEEE Veh. Tech. Conf., 1, 1997,193–197.
[30] Oon T.-B. and R. Steele, Maximum likelihood channel estimation of flat Rayleighmulti-user CDMA channels, IEE Colloq. (Digest), 129, May 1997, 5/1–5/7.
[31] Oon T.-B. and R. Steele, Successive serial parallel cancellation and joint detectionCDMA in flat fading asynchronous channels, Electron. Lett., 34, Jan 1998, 42–43.
Chapter 2The GSM System
2.1 Introduction
In 1982, the main governing body of the European telecommunication operators, knownas CEPT (Conference Europeene des Postes et Telecommunications), created the GroupeSpecial Mobile (GSM) committee and tasked it with specifying a pan-European cellularradio system to operate in the 900 MHz band. The system was conceived to overcomethe perceived capacity limitations of the successful analogue systems already deployed inseveral European countries (e.g. the Nordic Mobile Telephone system, NMT, in the Nordiccountries). The pan-European cellular standard would support international roaming andprovide a boost for the European telecommunications industry. The power centres behindthe proposed system were the 12 countries of the European Economic Community (EEC),the 26 countries involved in CEPT and the French and German PTTs. There was also strongsupport from the Nordic countries and the UK Government and industry. The French andGerman alliance, formed in 1983, was joined by Italy in 1985, and in 1986 the UK joinedto form the Quadripartite [1].
After initial discussions, three working parties (WPs) were created to deal with specificaspects of the system definition, and later on a fourth WP was added. In 1986, a permanentnucleus was set up in Paris to co-ordinate the efforts of the working parties and also managethe generation of the system recommendations. The WPs were required to define the systeminterfaces that would allow a mobile, in the form of either a hand-held or vehicular mountedunit, to roam throughout the countries where the new system had been deployed and haveaccess to the full range of services. Compared with the existing analogue systems, thenew system was required to have a higher capacity, comparable or lower operating costsand a comparable or better speech quality. The system was also required to co-exist withthe analogue systems. A common pan-European bandwidth allocation for the new system
65
GSM, cdmaOne and 3G Systems. Raymond Steele, Chin-Chun Lee and Peter GouldCopyright © 2001 John Wiley & Sons Ltd
Print ISBN 0-471-49185-3 Electronic ISBN 0-470-84167-2

66 CHAPTER 2. THE GSM SYSTEM
of 890–915 MHz and 935–960 MHz was agreed; however, by the time the system was tobe deployed, parts of this band would be occupied by analogue cellular systems in somecountries (e.g. the Total Access Communications System, TACS, in the United Kingdom).In these countries only a portion of the band would be used initially for GSM.
Although studies in various European countries had concluded that digital systems wereto be preferred over analogue systems, the choice of the multiple access scheme was notas clear-cut. It was decided that a number of different system proposals, put forward bycompanies and consortia from a number of different European countries, should be evalu-ated in prototype form. There were eight different system proposals. The MATS-D systemproposed by TEKADE incorporated three different multiple access schemes, namely codedivision multiple access (CDMA), frequency division multiple access (FDMA) and timedivision multiple access (TDMA). The CD900 system proposed by SEL was a widebandTDMA system in conjunction with spectral spreading [2, 3]. The remaining six proposalswere all based on narrow-band TDMA. The SFH900 system proposed by LCT used fre-quency hopping in combination with Gaussian minimum shift keying (GMSK) modulation,Viterbi equalisation and Reed–Solomon channel coding. Bosch proposed the S900-D sys-tem, which used four-level frequency shift keying (FSK) modulation, and Ericsson proposedthe DMS90 system which used frequency hopping, GMSK modulation and an adaptive de-cision feedback equaliser (DFE). The Mobira system and the MAX II system proposed byTeleverket were similar to the DMS90 system. Finally, the system proposed by ELAB ofNorway employed adaptive digital phase modulation (ADPM) and a Viterbi equaliser tocombat the effects of intersymbol interference (ISI). Some of the basic features of the eightdifferent systems are given in Table 2.1 [4].
The different systems were trialled in Paris at the end of 1986 and the most spectrally effi-cient (and ‘unofficial winner’) was the system proposed by ELAB. During 1987 the resultsof the trial were discussed and eventually agreement was reached on the main characteris-tics of the new system. The wideband solutions advocated by the French and Germans werenot adopted for a number of reasons, including the probability that the 1 µm VLSI technol-ogy, needed to support the complex baseband signal processing required by these systems,might not be available within the proposed time-scales. By June 1987 there was completeagreement that the system should employ narrow-band TDMA and that it would have manyof the features of the ELAB system. The system would initially support eight channels percarrier with eventual evolution to 16 channels per carrier.
The speech codec was chosen based on a subjective comparison of six different codecs at16 kb/s. The two codecs which performed significantly better than the others were a residualexcited linear prediction (RELP) codec and a multipulse excitation linear prediction codec(MPE-LPC). These two designs were merged to produce a regular pulse excitation LPC(RPE-LPC) with a net bit rate of 13 kb/s.
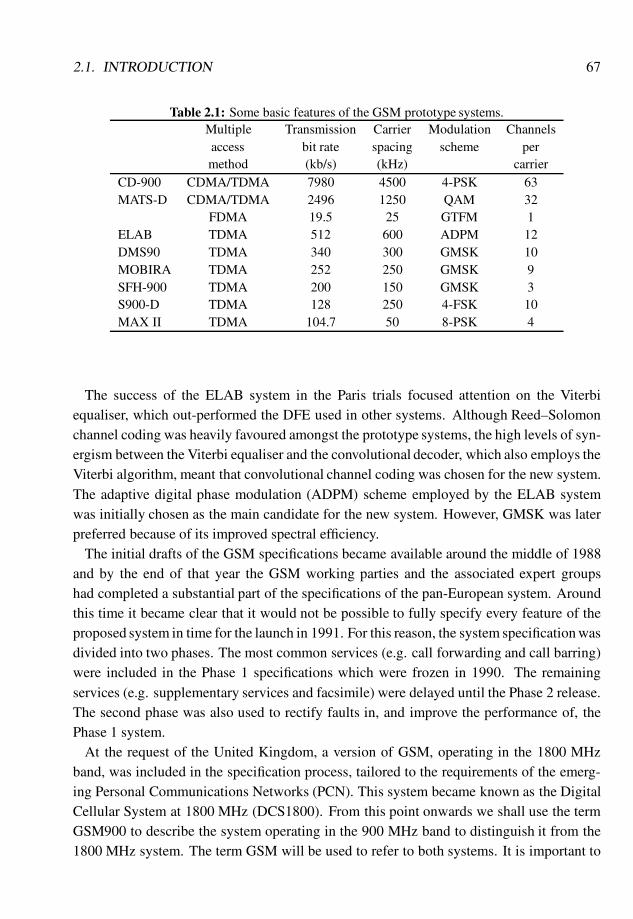
2.1. INTRODUCTION 67
Table 2.1: Some basic features of the GSM prototype systems.Multiple Transmission Carrier Modulation Channelsaccess bit rate spacing scheme permethod (kb/s) (kHz) carrier
CD-900 CDMA/TDMA 7980 4500 4-PSK 63MATS-D CDMA/TDMA 2496 1250 QAM 32
FDMA 19.5 25 GTFM 1ELAB TDMA 512 600 ADPM 12DMS90 TDMA 340 300 GMSK 10MOBIRA TDMA 252 250 GMSK 9SFH-900 TDMA 200 150 GMSK 3S900-D TDMA 128 250 4-FSK 10MAX II TDMA 104.7 50 8-PSK 4
The success of the ELAB system in the Paris trials focused attention on the Viterbiequaliser, which out-performed the DFE used in other systems. Although Reed–Solomonchannel coding was heavily favoured amongst the prototype systems, the high levels of syn-ergism between the Viterbi equaliser and the convolutional decoder, which also employs theViterbi algorithm, meant that convolutional channel coding was chosen for the new system.The adaptive digital phase modulation (ADPM) scheme employed by the ELAB systemwas initially chosen as the main candidate for the new system. However, GMSK was laterpreferred because of its improved spectral efficiency.
The initial drafts of the GSM specifications became available around the middle of 1988and by the end of that year the GSM working parties and the associated expert groupshad completed a substantial part of the specifications of the pan-European system. Aroundthis time it became clear that it would not be possible to fully specify every feature of theproposed system in time for the launch in 1991. For this reason, the system specification wasdivided into two phases. The most common services (e.g. call forwarding and call barring)were included in the Phase 1 specifications which were frozen in 1990. The remainingservices (e.g. supplementary services and facsimile) were delayed until the Phase 2 release.The second phase was also used to rectify faults in, and improve the performance of, thePhase 1 system.
At the request of the United Kingdom, a version of GSM, operating in the 1800 MHzband, was included in the specification process, tailored to the requirements of the emerg-ing Personal Communications Networks (PCN). This system became known as the DigitalCellular System at 1800 MHz (DCS1800). From this point onwards we shall use the termGSM900 to describe the system operating in the 900 MHz band to distinguish it from the1800 MHz system. The term GSM will be used to refer to both systems. It is important to
68 CHAPTER 2. THE GSM SYSTEM
note that the term GSM1800 is also commonly used to refer to the DCS1800 system. TheDCS1800 system adaptation began in 1990 and, in 1991, Phase 1 of the DCS1800 systemspecifications were frozen and were subsequently released as a set of amendments to theGSM900 Phase 1 specifications. The amendments were termed delta recommendations or∆-recs. In Phase 2 of the specifications, which were frozen in June 1993, the GSM900system and the DCS1800 system were combined into the same set of documents.
During the development of the Phase 2 specifications it became clear that the task ofrevising the specifications for a third time would be huge. For this reason it was decidedthat beyond Phase 2 the GSM system should gradually evolve as new features arrive and thiscontinual evolution has become known as Phase 2+. Some of the more significant featuresproposed for Phase 2+ included the half-rate speech coder, an increase in the maximummobile speed for reliable communications and a higher power 4 W mobile for the DCS1800system.
In 1988, GSM became a Technical Committee of the newly created European Telecom-munications Standards Institute (ETSI). Each of the four working parties became Sub-Technical Committees (STCs). At the end of 1991 the scope of the GSM Technical Com-mittee was widened to include the specification of a successor to GSM and, for this reason,the technical committee was renamed the Special Mobile Group (SMG) with the STCs be-coming SMG1 to 4. SMG5 was added with the task of specifying the Universal MobileTelecommunication System (UMTS), GSM’s successor [5]. Several other STCs have beenadded and their responsibilities are summarised in Table 2.2. The term GSM is still used todescribe the system, but it has been renamed ‘The Global System for Mobile Communica-tions’. SMG5 has since been discontinued and the task of developing the specifications forUMTS has been distributed among the other committees.
In this chapter we give an overview of GSM. We have concentrated our description on theGSM radio interface, since this has a direct impact on the capacity of a cellular system. Thereader wishing to learn more about GSM is either referred to books that are solely dedicatedto describing the system [6, 7], or the complete GSM specifications themselves which runto some 5000 pages and describe all the complexities of GSM.
2.2 An Overview of the GSM Network Architecture
In this section we briefly examine the different components that together make up a GSMnetwork. Many of these components are common to any cellular network; however, a feware peculiar to GSM. We also note that GSM sometimes uses its own terminology to de-scribe familiar components. A block diagram showing the simplified hierarchical structureof the GSM public land mobile network (PLMN) is given in Figure 2.1.
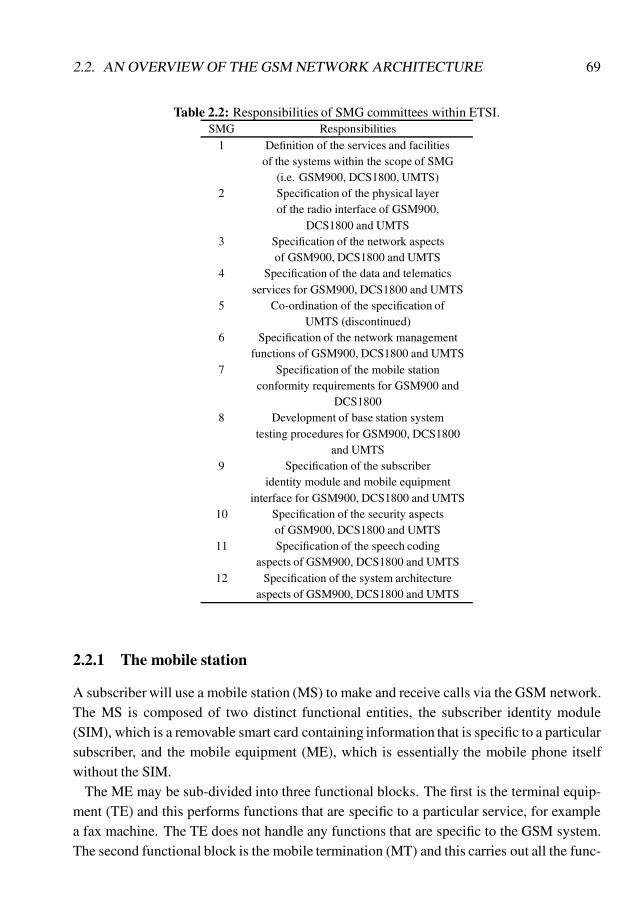
2.2. AN OVERVIEW OF THE GSM NETWORK ARCHITECTURE 69
Table 2.2: Responsibilities of SMG committees within ETSI.SMG Responsibilities
1 Definition of the services and facilitiesof the systems within the scope of SMG
(i.e. GSM900, DCS1800, UMTS)2 Specification of the physical layer
of the radio interface of GSM900,DCS1800 and UMTS
3 Specification of the network aspectsof GSM900, DCS1800 and UMTS
4 Specification of the data and telematicsservices for GSM900, DCS1800 and UMTS
5 Co-ordination of the specification ofUMTS (discontinued)
6 Specification of the network managementfunctions of GSM900, DCS1800 and UMTS
7 Specification of the mobile stationconformity requirements for GSM900 and
DCS18008 Development of base station system
testing procedures for GSM900, DCS1800and UMTS
9 Specification of the subscriberidentity module and mobile equipment
interface for GSM900, DCS1800 and UMTS10 Specification of the security aspects
of GSM900, DCS1800 and UMTS11 Specification of the speech coding
aspects of GSM900, DCS1800 and UMTS12 Specification of the system architecture
aspects of GSM900, DCS1800 and UMTS
2.2.1 The mobile station
A subscriber will use a mobile station (MS) to make and receive calls via the GSM network.The MS is composed of two distinct functional entities, the subscriber identity module(SIM), which is a removable smart card containing information that is specific to a particularsubscriber, and the mobile equipment (ME), which is essentially the mobile phone itselfwithout the SIM.
The ME may be sub-divided into three functional blocks. The first is the terminal equip-ment (TE) and this performs functions that are specific to a particular service, for examplea fax machine. The TE does not handle any functions that are specific to the GSM system.The second functional block is the mobile termination (MT) and this carries out all the func-
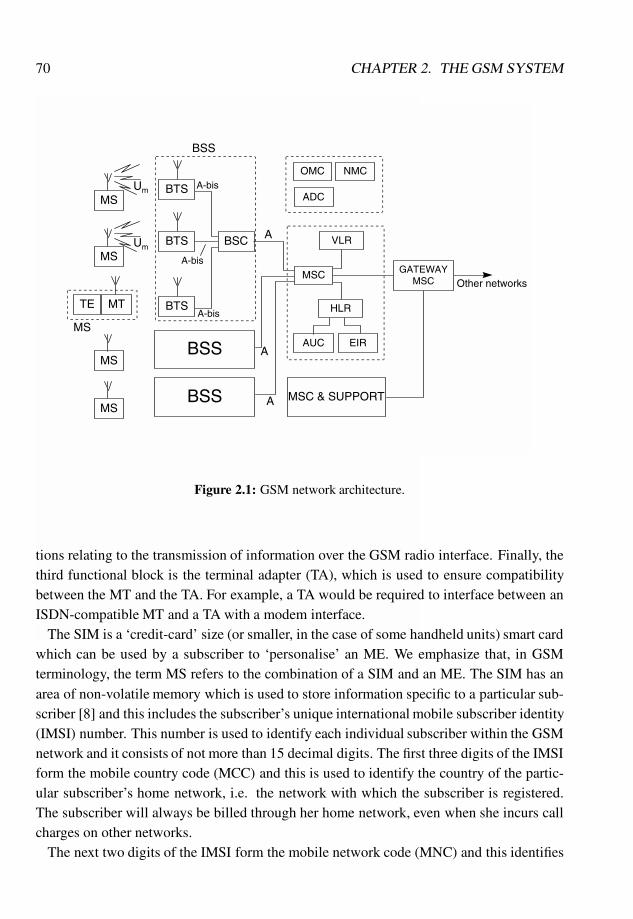
70 CHAPTER 2. THE GSM SYSTEM
GATEWAYMSC
OMC
ADC
NMC
AUC
VLR
HLR
MSC
EIR
MSC & SUPPORT
BSS
BSS
MS
MS
MS
MS
MS
MTTE
A
A
A
BTS A-bis
BSC
BTSA-bis
BTS
A-bis
BSS
Um
Um
Other networks
Figure 2.1: GSM network architecture.
tions relating to the transmission of information over the GSM radio interface. Finally, thethird functional block is the terminal adapter (TA), which is used to ensure compatibilitybetween the MT and the TA. For example, a TA would be required to interface between anISDN-compatible MT and a TA with a modem interface.
The SIM is a ‘credit-card’ size (or smaller, in the case of some handheld units) smart cardwhich can be used by a subscriber to ‘personalise’ an ME. We emphasize that, in GSMterminology, the term MS refers to the combination of a SIM and an ME. The SIM has anarea of non-volatile memory which is used to store information specific to a particular sub-scriber [8] and this includes the subscriber’s unique international mobile subscriber identity(IMSI) number. This number is used to identify each individual subscriber within the GSMnetwork and it consists of not more than 15 decimal digits. The first three digits of the IMSIform the mobile country code (MCC) and this is used to identify the country of the partic-ular subscriber’s home network, i.e. the network with which the subscriber is registered.The subscriber will always be billed through her home network, even when she incurs callcharges on other networks.
The next two digits of the IMSI form the mobile network code (MNC) and this identifies
2.2. AN OVERVIEW OF THE GSM NETWORK ARCHITECTURE 71
the subscriber’s home PLMN within the country indicated by the MCC. The MNCs areallocated by a relevant authority within each country. The remaining digits of the IMSIare the mobile subscriber identification number (MSIN) which is used to uniquely identifyeach subscriber within the context of their home PLMN. From this discussion it is clear thatthe IMSI is unique to each individual subscriber and it may also be used to determine thesubscriber’s home network.
The SIM will also contain the subscriber’s secret authentication key, Ki, the authenticationalgorithm, A3, and the cipher key generation algorithm, A8. The functions of each of theseitems will be examined in detail in Section 2.5, suffice to say at this point that they areused to implement the security features of GSM and they are stored in the SIM under heavyprotection. The language preference indicator is also located in the SIM and this is used toindicate the language to be used on the MS screen.
The items described above are mandatory and must be present in any SIM that conformsto the GSM specifications. The SIM may also contain a number of optional items whichwill include the subscriber’s abbreviated dialling numbers. This is a list of the subscriber’scommonly used telephone numbers that may be accessed using short numeric codes or usinga system of menus. The SIM may also contain a list of the last number(s) that the subscriberhas dialled and an area of storage for the subscriber’s short messages. GSM provides thefacility for a subscriber to send and receive short alpha-numeric text messages from theirMS and this facility has been termed the short message service (SMS).
Inserting an SIM card into an ME effectively personalises the equipment to the partic-ular subscriber. Any incoming calls for the subscriber will be routed to the ME and anycharges incurred using the ME will be billed to the subscriber’s account. This feature al-lows subscribers easily to switch between different MEs when, for example, their ME hasbeen returned for repair and a different ME must be used temporarily.
One of the major motives behind the development of the GSM system was to allow sub-scribers the freedom to roam throughout Europe whilst maintaining the ability to make andreceive calls using the same MS. This is only possible where compatible networks existin each country and it is not possible to roam between GSM900 and DCS1800 networksusing the same MS, unless the MS has a dual-mode capability allowing it to operate withthe 900 MHz and 1800 MHz systems. However, the SIM card has also introduced theconcept of ‘SIM roaming’ whereby a subscriber may roam between different, incompatiblenetworks by renting an appropriate ME and personalising it with her SIM card. This facilityhas become particularly attractive with the introduction in the United States of the PCS1900system (or GSM1900 as it is commonly called), which is a derivative of the GSM systemoperating in the US 1900 MHz PCS band. Although GSM900 and DCS1800 equipmentwill be incompatible with the PCS1900 system, a GSM900 subscriber from Europe couldrent a PCS1900 ME whilst visiting the United States and, by inserting her SIM card into the
72 CHAPTER 2. THE GSM SYSTEM
rented equipment, would be able to receive calls via her normal telephone number and havethe resulting charges billed to her home account. The ability to perform normal roaming orSIM card roaming will be subject to the existence of an appropriate roaming agreement be-tween the subscriber’s home network operator and a network operator in the country wherethe subscriber would like to roam.
In first generation analogue cellular systems, a user’s unique electronic serial number(ESN) is programmed directly into the subscriber unit (i.e. the mobile phone). In theevent that a subscriber decides to switch to a different network, the mobile phone mustbe exchanged or reprogrammed. The introduction of the SIM card allows the subscribercomplete freedom to switch between different networks without the need to exchange orreprogramme the ME itself. For example, if a GSM900 subscriber wishes to switch fromNetwork 1 to Network 2, the old SIM card can be replaced with a new one obtained fromthe operator of Network 2 and the same GSM900 mobile phone may be used on the newnetwork.
The situation is slightly more complicated in some countries (e.g. the United Kingdom)where the handsets are subsidised by the network operator and this subsidy must be re-turned if a subscriber decides to change networks. In this case a locking mechanism will beincluded such that a handset cannot be used with an SIM from a different network operatoruntil an unlocking code has been entered. The subscriber must make a payment to the ex-isting network operator to receive this unlocking code and this represents the repayment ofthe handset subsidy. The interface between the SIM and the ME is fully defined in the spec-ifications and is referred to as the SIM–ME interface. This ensures compatibility betweenthe SIMs and MEs of different manufacturers.
2.2.2 The base station subsystem
An MS communicates with a base transceiver station (BTS) via the radio interface, Um.A BTS performs all the transmission and reception functions relating to the GSM radiointerface along with a degree of signal processing. In some ways a BTS can be consideredto be a complex radio modem that takes the up-link radio signal from an MS and convertsit into data for transmission to other machines within the GSM network, and accepts datafrom the GSM network and converts it into a radio signal that can be transmitted to the MS.The BTSs are used to form the coverage cells in GSM and it is their position that determinesthe network’s coverage and capacity.
Although a BTS is concerned with transmission and reception over the radio interface, itplays only a minor role in the way the radio resources are allocated to the different MSs.Instead, the management of the radio interface is performed by a base station controller(BSC). The management functions include the allocation of radio channels to MSs on callset-up, determining when a handover is required and identifying a suitable target BTS and
2.2. AN OVERVIEW OF THE GSM NETWORK ARCHITECTURE 73
controlling the transmitted power of an MS to ensure that it is just sufficient to reach itsserving BTS. BSCs vary from manufacturer to manufacturer, but a BSC might typicallycontrol up to 40 BTSs. In addition to its processing capacity, a BSC will also have a limitedswitching capability, enabling it to route calls between the different BTSs under its control.The interface between a BSC and an associated BTS is known as the A-bis interface and itis fully defined by an open, or public, specification. In theory this allows a network operatorthe freedom to procure their BSCs and BTSs from different equipment manufacturers. TheBTS and BSC are collectively known as the base station subsystem (BSS).
2.2.3 The mobile services switching centre
Referring to Figure 2.1, we see that each BSS is connected to a mobile services switchingcentre (MSC). The MSC is concerned with the routing of calls to and from the mobileusers. It possesses a large switching capability that varies between manufacturers, but atypical MSC will control a few tens of BSCs and it will have a capacity of several tens ofthousands of subscribers. The MSC is similar to the switching exchange in a fixed network.However, it must include additional functions to cope with the mobility of the subscribers,e.g. functions to cope with location registration and handover. The GSM specifications usethe term MSC area to describe the part of a network that is covered by a particular MSCand its associated BSCs and BTSs. The interface between the MSC and BSS is knownas the A interface and it is fully defined in the specifications, giving the network operatorthe freedom to choose their MSCs and BSCs from different manufacturers. The interfacebetween different MSCs is called the E interface.
The network operator may also select one or a number of MSCs to act as gateway MSCs(GMSC). As its name would suggest, the GMSC provides the interface between the PLMNand external networks. In the event of an incoming call from another network, the GMSCcommunicates with the relevant network databases to ensure that the call is routed to theappropriate MS.
2.2.4 The GSM network databases
In the previous sections we have examined the various components within the GSM networkthat are used to form the communication path between an MS and another MS or a user onanother network, e.g. the public switched telephone network (PSTN). Equally important in acommercial network are the means of charging and billing subscribers, maintaining accuratesubscription records and preventing fraudulent network access. In a cellular network wheresubscribers are free to roam throughout the coverage area, the network must also possesssome way to track MSs so that it is able successfully to route incoming calls to them. Allof these functions are supported using a combination of databases or registers.
74 CHAPTER 2. THE GSM SYSTEM
The home location register (HLR) is used to store information that is specific to each sub-scriber. It will contain details of a particular user’s subscription, e.g. the services to whichthey have access, and some information relating to the location of each subscriber, e.g. thedetails of the MSC area within which the subscriber is currently registered. The informationcontained within the HLR may be accessed using either the subscriber’s IMSI or mobile sta-tion international ISDN (MSISDN) number, which is essentially the subscriber’s telephonenumber. Every GSM subscriber will have an entry in the HLR of their home network. Theinterface between an HLR and an MSC is called the C interface.
Another GSM database that is very closely associated with the HLR is the authenticationcentre (AuC). The AuC is solely used to store information that is concerned with GSM’ssecurity features, i.e. user authentication and radio path encryption. It will contain thesubscriber’s secret Ki key and the A3 and A8 security algorithms. The functions of the Ki
key and the security algorithms are described in detail in Section 2.5. The AuC will onlyever communicate with the HLR and it does this using the H interface.
Another important database used in the GSM system is the visitor location register (VLR).A VLR is associated with one or a number of MSCs and it contains information relatingto those subscribers that are currently registered within the MSC area(s) of its associatedMSC(s). The area that is served by a particular VLR is termed the VLR area. It is termed thevisitor location register because it holds information on those subscribers that are visitingits VLR area. The main function of the VLR is to provide a local copy of the subscriber’sinformation for the purposes of call handling and it removes the need to continually accessthe HLR to retrieve information about a particular subscriber. This becomes importantin a system such as GSM where subscribers may use networks in countries other than thecountry of their home network. The VLR also contains information that enables the networkto ‘find’ a particular subscriber in the event of an incoming call.
The process of locating a subscriber is facilitated by subdividing the network’s coveragearea into a number of location areas, each consisting of one or a number of cells or sectors.The VLR will contain the details of the location area in which each subscriber is registered.In the event of an incoming call, an MS will be paged in each of the cells within its loca-tion area and this means that the MS may move freely between the cells of a location areawithout having to inform the network. However, when an MS moves between cells belong-ing to different location areas, it must register in the new area using the location updatingprocedure. Where a subscriber moves between location areas controlled by different VLRs,its details are copied from the HLR to the new VLR. The HLR will also ensure that thesubscriber’s details are removed from the old VLR. The interface between the HLR and theVLR is called the D interface and the interface between an MSC and its associated VLR iscalled the B interface. An interface also exists between different VLRs and this is termedthe G interface.
2.2. AN OVERVIEW OF THE GSM NETWORK ARCHITECTURE 75
The introduction of the SIM card in GSM means that tracking a subscriber no longer im-plies the tracking of a piece of equipment, and vice versa. For this reason the equipmentidentity register (EIR) has been introduced to allow the network operator to track stolen andmalfunctioning MEs. Each ME is assigned a unique 15-digit international mobile equip-ment identity (IMEI) at the point of manufacture. Each model of ME must undergo aprocess known as type approval, wherein a number of its features are tested using a GSMsystem simulator. The type approval testing is carried out by accredited laboratories thatare independent of any manufacturing or operating companies and it is used to ensure thatall GSM ME models meet a minimum standard, regardless of the manufacturer. Once anME model has been type approved it will be assigned a six-digit type approval code (TAC)and this forms the first six digits of an ME’s IMEI. The next two digits of the IMEI rep-resent the final assembly code (FAC) and this is assigned by the manufacturer to identifythe place where the ME was finally assembled or manufactured. The next six digits of theIMEI represent the ME’s serial number (SNR) and this will be unique to every MS for agiven combination of TAC and FAC. The remaining digit of the 15-digit IMEI is defined as‘spare’.
The EIR is used to store three different lists of IMEIs. The white list contains the series ofIMEIs that have been allocated to MEs that may be used on the GSM network. The blacklist contains the IMEIs of all MEs that must be barred from using the GSM network. Thiswill contain the IMEIs of stolen and malfunctioning MEs. Finally, the network operatormay also use a grey list to hold the IMEIs of MEs that must be tracked by the network forevaluation purposes.
During an access attempt or during a call, the network has the ability to command an MSto supply its IMEI at any time. If the IMEI is on the black list or it is not on the white list, thenetwork will terminate the call or access attempt and the subscriber will be sent an ‘illegalME’ message. Once an MS has failed an IMEI check it will be prevented from making anyfurther access attempts, location updates or paging call responses. However, this MS maystill be used to make emergency calls. The IMEI check is performed within the EIR and theIMEI is passed to the EIR by the MSC that is currently serving the MS. The results of theIMEI check are then returned by the EIR to the relevant MSC. The interface between theEIR and the MSC is termed the F interface.
2.2.5 The management of GSM networks
From an operator’s viewpoint, an effective network management system is an important partof any telecommunications network. It is essential for the network operator to be able toidentify problems in the network at an early stage and correct them quickly and efficiently.It is also important for the network operator to be able to make changes to the networkconfiguration with a minimum of effort and without affecting the service provided to its
76 CHAPTER 2. THE GSM SYSTEM
subscribers. The functional blocks associated with the management of the GSM network,as shown in Figure 2.1, are the operations and maintenance centre (OMC), the networkmanagement centre (NMC) and the administration centre (ADC).
The OMC provides the means by which the operator controls the network. Each OMCwill typically be in charge of a subsystem, e.g. the BSS or the Network Switching Subsys-tem, NSS (i.e. the MSC, HLR, VLR, etc.) The NMC is concerned with the management ofthe entire network and it generally has a wider operational role than an OMC. The ADC isconcerned, as its name would suggest, with the administrative functions required within thenetwork.
2.3 The GSM Radio Interface
The radio interface provides the means by which an MS communicates with the BTSs of aGSM network whilst it moves within the coverage area. The performance of the radio inter-face, and particularly its ability to provide acceptable speech links in the face of co-channelinterference from other users within the system, acutely affects the overall capacity of a cel-lular system. In this section we examine the features of the GSM radio interface. Figure 2.2shows a simplified block diagram of the GSM radio link. In the following sections we willexamine the function and operation of each of these blocks in some detail. It is difficult tokeep to a strict top-down or bottom-up description of the GSM radio interface because, insome cases, in order to appreciate the reason for a particular feature of the radio interface,it is necessary to understand some features associated with a higher or lower layer protocol.For this reason we have adopted a somewhat unconventional approach to the descriptionof the radio interface. We will begin by examining the modulation scheme and the carrierfrequencies used in GSM. Then we will discuss the construction of the TDMA bursts, orpackets, and the way in which these may be demodulated in the presence of intersymbolinterference (ISI) caused by the radio channel and the modulation process itself. Follow-ing this we will discuss the different channels that are available in GSM and the manner inwhich the radio resources are allocated to each of the channels. At this point we will haveeffectively built up a picture of the radio interface as a ‘bit pipe’ where data are applied tothe transmitter and the same data, possibly with a number of errors, are recovered at thereceiver.
We will then turn our attention to the coding, interleaving and ciphering processes thatoccur on the GSM radio interface. These processes are different for speech information,user data (e.g. fax transmissions) and signalling information and, therefore, we will dealwith each of these different types of information separately. Finally, we will bring the twohalves of our radio interface description together by describing the manner in which thecoded, interleaved and ciphered, or encrypted, data are mapped onto the TDMA bursts.
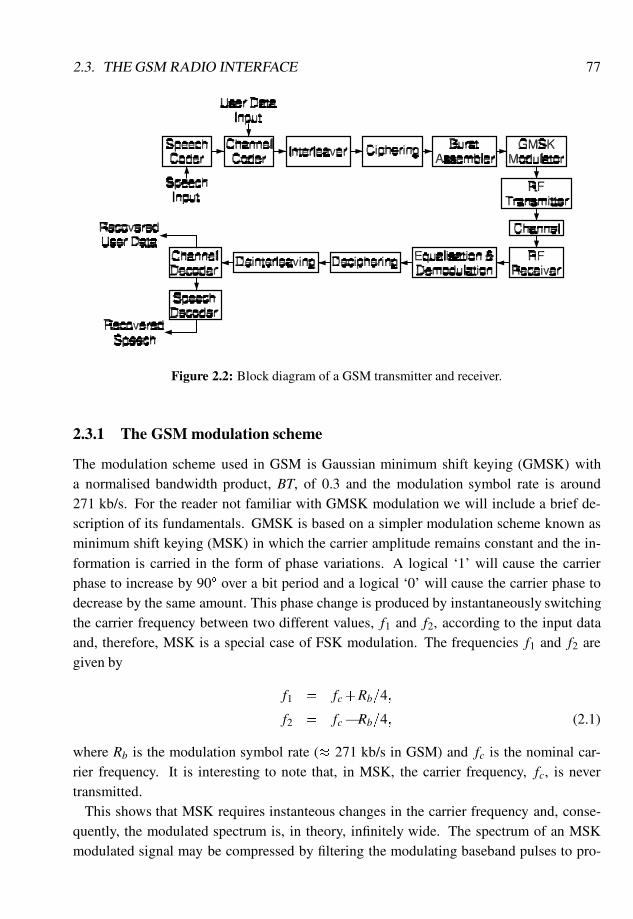
2.3. THE GSM RADIO INTERFACE 77
Figure 2.2: Block diagram of a GSM transmitter and receiver.
2.3.1 The GSM modulation scheme
The modulation scheme used in GSM is Gaussian minimum shift keying (GMSK) witha normalised bandwidth product, BT, of 0.3 and the modulation symbol rate is around271 kb/s. For the reader not familiar with GMSK modulation we will include a brief de-scription of its fundamentals. GMSK is based on a simpler modulation scheme known asminimum shift keying (MSK) in which the carrier amplitude remains constant and the in-formation is carried in the form of phase variations. A logical ‘1’ will cause the carrierphase to increase by 90� over a bit period and a logical ‘0’ will cause the carrier phase todecrease by the same amount. This phase change is produced by instantaneously switchingthe carrier frequency between two different values, f1 and f2, according to the input dataand, therefore, MSK is a special case of FSK modulation. The frequencies f1 and f2 aregiven by
f1 = fc+Rb=4;
f2 = fc�Rb=4; (2.1)
where Rb is the modulation symbol rate (� 271 kb/s in GSM) and fc is the nominal car-rier frequency. It is interesting to note that, in MSK, the carrier frequency, fc, is nevertransmitted.
This shows that MSK requires instanteous changes in the carrier frequency and, conse-quently, the modulated spectrum is, in theory, infinitely wide. The spectrum of an MSKmodulated signal may be compressed by filtering the modulating baseband pulses to pro-
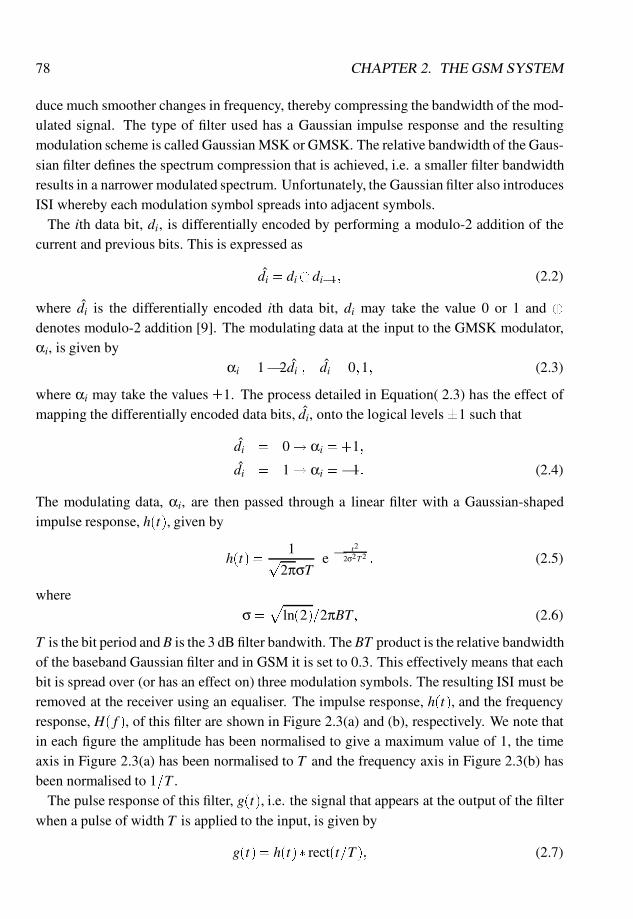
78 CHAPTER 2. THE GSM SYSTEM
duce much smoother changes in frequency, thereby compressing the bandwidth of the mod-ulated signal. The type of filter used has a Gaussian impulse response and the resultingmodulation scheme is called Gaussian MSK or GMSK. The relative bandwidth of the Gaus-sian filter defines the spectrum compression that is achieved, i.e. a smaller filter bandwidthresults in a narrower modulated spectrum. Unfortunately, the Gaussian filter also introducesISI whereby each modulation symbol spreads into adjacent symbols.
The ith data bit, di, is differentially encoded by performing a modulo-2 addition of thecurrent and previous bits. This is expressed as
di = di�di�1; (2.2)
where di is the differentially encoded ith data bit, di may take the value 0 or 1 and �denotes modulo-2 addition [9]. The modulating data at the input to the GMSK modulator,αi, is given by
αi = 1�2di ; di = 0;1; (2.3)
where αi may take the values �1. The process detailed in Equation( 2.3) has the effect ofmapping the differentially encoded data bits, di, onto the logical levels �1 such that
di = 0! αi =+1;
di = 1! αi =�1: (2.4)
The modulating data, αi, are then passed through a linear filter with a Gaussian-shapedimpulse response, h(t), given by
h(t) =1p
2πσTe �
t2
2σ2T2 : (2.5)
whereσ =p
ln(2)=2πBT; (2.6)
T is the bit period andB is the 3 dB filter bandwith. The BT product is the relative bandwidthof the baseband Gaussian filter and in GSM it is set to 0.3. This effectively means that eachbit is spread over (or has an effect on) three modulation symbols. The resulting ISI must beremoved at the receiver using an equaliser. The impulse response, h(t), and the frequencyresponse, H( f ), of this filter are shown in Figure 2.3(a) and (b), respectively. We note thatin each figure the amplitude has been normalised to give a maximum value of 1, the timeaxis in Figure 2.3(a) has been normalised to T and the frequency axis in Figure 2.3(b) hasbeen normalised to 1=T .
The pulse response of this filter, g(t), i.e. the signal that appears at the output of the filterwhen a pulse of width T is applied to the input, is given by
g(t) = h(t)� rect(t=T); (2.7)
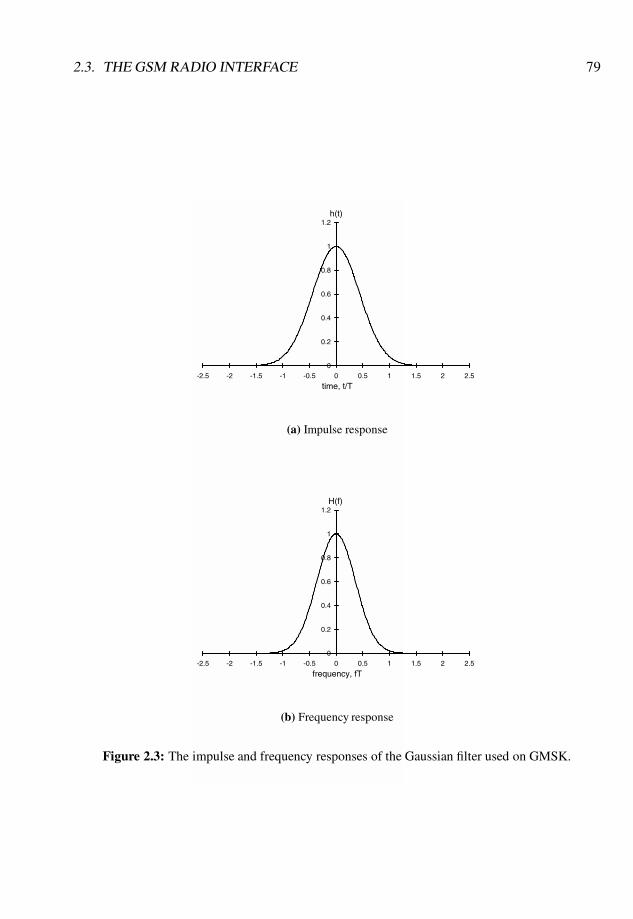
2.3. THE GSM RADIO INTERFACE 79
0
0.2
0.4
0.6
0.8
1
1.2
-2.5 -2 -1.5 -1 -0.5 0 0.5 1 1.5 2 2.5
time, t/T
h(t)
(a) Impulse response
0
0.2
0.4
0.6
0.8
1
1.2
-2.5 -2 -1.5 -1 -0.5 0 0.5 1 1.5 2 2.5
frequency, fT
H(f)
(b) Frequency response
Figure 2.3: The impulse and frequency responses of the Gaussian filter used on GMSK.
80 CHAPTER 2. THE GSM SYSTEM
where rect(t=T ) is defined as
rect(t=T) =
(1=T; j t j< T=2;0; otherwise;
(2.8)
and � denotes convolution. The pulse response, g(t), is shown in Figure 2.4 and we notethat it extends for approximately three bit periods, T . We have normalised the amplitude ofg(t) to a maximum value of 1 and we have normalised the time axis to T .
The signal at the output of the filter is the sum of the pulse responses for each input databit, as shown in Figure 2.5 for a data sequence of 0010. This signal is used to modulate thefrequency of the carrier. The phase of the modulated signal, ϕ(t), may be determined byintegrating the signal at the output of the filter, i.e.
ϕ(t) = ∑i
αiπmZ t�iT
�∞g(u)du; (2.9)
where the modulation index, m, is 1/2 (i.e. the maximum phase change over a data intervalis π=2 radians). Given Equation (2.9), the modulated RF carrier signal may be expressed as
x(t) =
r2Ec
Tcos(2π f0t+ϕ(t)+ϕ0); (2.10)
where Ec is the energy per modulating bit, f0 is the carrier frequency and ϕ0 is a randomphase offset that will remain constant for the duration of a single TDMA burst.
An example of the spectrum of a GSM carrier is shown in Figure 2.6. We observe that thepower has only decreased by some 35 dB at an offset of 200 kHz from the centre frequency,which represents the centre of the adjacent carrier. This results in a significant amount ofadjacent channel interference between GSM carriers and the specifications [10] define thata receiver will only perform satisfactorily if the wanted channel is no more than 9 dB lessthan the adjacent channel. Coupled with the effects of shadow fading and power control,this precludes the use of adjacent channels in the same cell. The specifications define anumber of transmitted spectrum masks to ensure that the radio transmitters do not generateunacceptable levels of adjacent channel interference. An example of one of these masksis given in Figure 2.7. The transmitted signal must remain below the mask (shown by adark line) at each frequency offset from the carrier. For example, at a 400 kHz offset fromthe centre frequency the transmitted power must be 60 dB less than the power at the centrefrequency.
2.3.2 The GSM radio carriers
GSM uses a combined time division multiple access (TDMA) and frequency division mul-tiple access (FDMA) scheme. The available spectrum is partitioned into a number of bands,
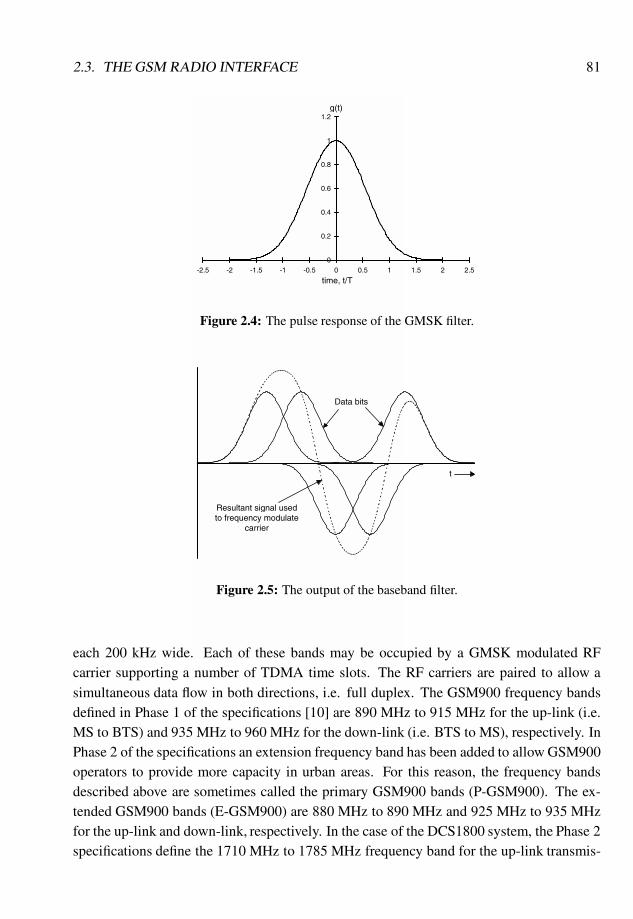
2.3. THE GSM RADIO INTERFACE 81
0
0.2
0.4
0.6
0.8
1
1.2
-2.5 -2 -1.5 -1 -0.5 0 0.5 1 1.5 2 2.5
time, t/T
g(t)
Figure 2.4: The pulse response of the GMSK filter.
Data bits
Resultant signal used to frequency modulate
carrier
t
Figure 2.5: The output of the baseband filter.
each 200 kHz wide. Each of these bands may be occupied by a GMSK modulated RFcarrier supporting a number of TDMA time slots. The RF carriers are paired to allow asimultaneous data flow in both directions, i.e. full duplex. The GSM900 frequency bandsdefined in Phase 1 of the specifications [10] are 890 MHz to 915 MHz for the up-link (i.e.MS to BTS) and 935 MHz to 960 MHz for the down-link (i.e. BTS to MS), respectively. InPhase 2 of the specifications an extension frequency band has been added to allow GSM900operators to provide more capacity in urban areas. For this reason, the frequency bandsdescribed above are sometimes called the primary GSM900 bands (P-GSM900). The ex-tended GSM900 bands (E-GSM900) are 880 MHz to 890 MHz and 925 MHz to 935 MHzfor the up-link and down-link, respectively. In the case of the DCS1800 system, the Phase 2specifications define the 1710 MHz to 1785 MHz frequency band for the up-link transmis-
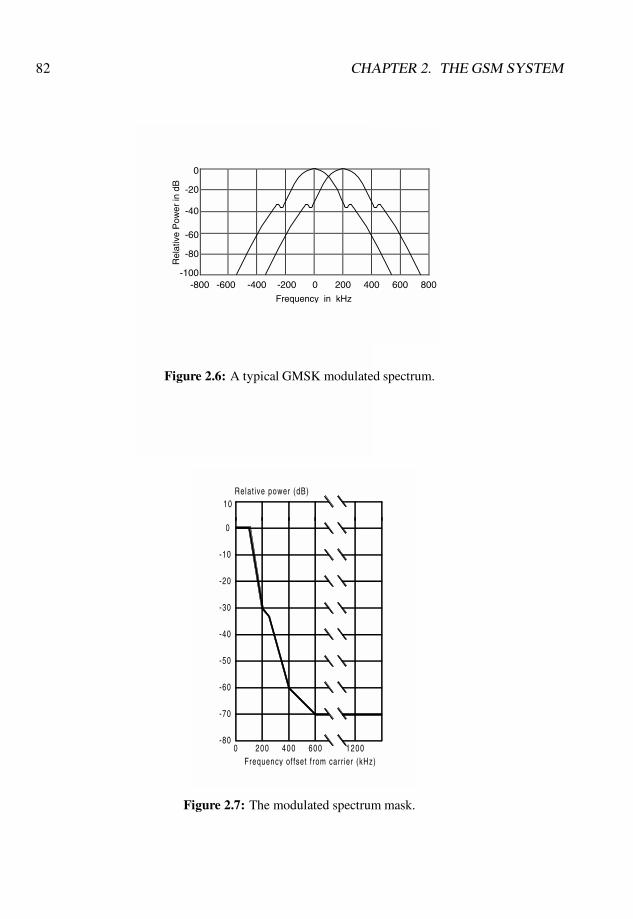
82 CHAPTER 2. THE GSM SYSTEM
Frequency in kHz
Rel
ativ
e P
ower
in d
B0
-20
-40
-60
-80
-100-800 -600 -400 -200 0 200 400 600 800
Figure 2.6: A typical GMSK modulated spectrum.
Frequency offset from carr ier (kHz)
Relat ive power (dB)
-80
-70
0
-50
-60
-40
200 400
-10
-30
-20
0
10
1200600
Figure 2.7: The modulated spectrum mask.
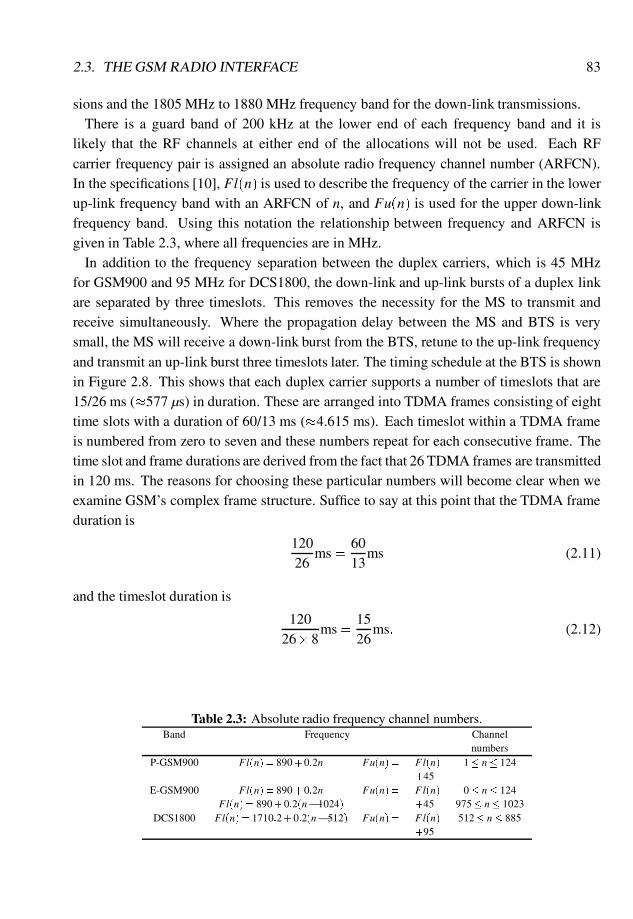
2.3. THE GSM RADIO INTERFACE 83
sions and the 1805 MHz to 1880 MHz frequency band for the down-link transmissions.There is a guard band of 200 kHz at the lower end of each frequency band and it is
likely that the RF channels at either end of the allocations will not be used. Each RFcarrier frequency pair is assigned an absolute radio frequency channel number (ARFCN).In the specifications [10], Fl(n) is used to describe the frequency of the carrier in the lowerup-link frequency band with an ARFCN of n, and Fu(n) is used for the upper down-linkfrequency band. Using this notation the relationship between frequency and ARFCN isgiven in Table 2.3, where all frequencies are in MHz.
In addition to the frequency separation between the duplex carriers, which is 45 MHzfor GSM900 and 95 MHz for DCS1800, the down-link and up-link bursts of a duplex linkare separated by three timeslots. This removes the necessity for the MS to transmit andreceive simultaneously. Where the propagation delay between the MS and BTS is verysmall, the MS will receive a down-link burst from the BTS, retune to the up-link frequencyand transmit an up-link burst three timeslots later. The timing schedule at the BTS is shownin Figure 2.8. This shows that each duplex carrier supports a number of timeslots that are15/26 ms (�577 µs) in duration. These are arranged into TDMA frames consisting of eighttime slots with a duration of 60/13 ms (�4.615 ms). Each timeslot within a TDMA frameis numbered from zero to seven and these numbers repeat for each consecutive frame. Thetime slot and frame durations are derived from the fact that 26 TDMA frames are transmittedin 120 ms. The reasons for choosing these particular numbers will become clear when weexamine GSM’s complex frame structure. Suffice to say at this point that the TDMA frameduration is
12026
ms =6013
ms (2.11)
and the timeslot duration is
12026�8
ms =1526
ms: (2.12)
Table 2.3: Absolute radio frequency channel numbers.Band Frequency Channel
numbersP-GSM900 Fl(n) = 890+0:2n Fu(n) = Fl(n) 1� n� 124
+45E-GSM900 Fl(n) = 890+0:2n Fu(n) = Fl(n) 0� n� 124
Fl(n) = 890+0:2(n�1024) +45 975� n� 1023DCS1800 Fl(n) = 1710:2+0:2(n�512) Fu(n) = Fl(n) 512� n� 885
+95
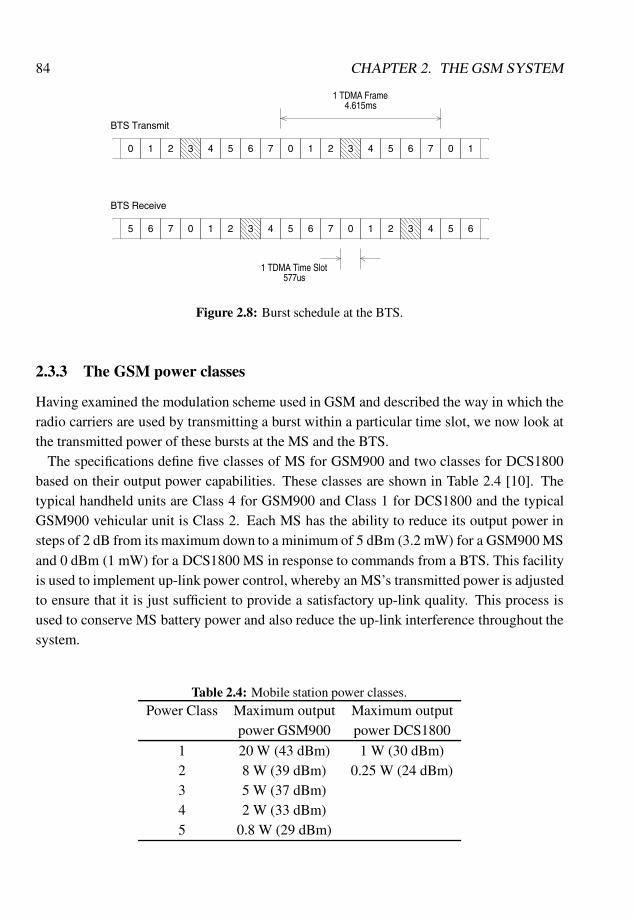
84 CHAPTER 2. THE GSM SYSTEM
577us1 TDMA Time Slot
5 76 0
BTS Receive
21 3 4 5
BTS Transmit
0 21 3 4 5 6 7 0
06 7 21 543 6
1 TDMA Frame4.615ms
321 4 5 076 1
Figure 2.8: Burst schedule at the BTS.
2.3.3 The GSM power classes
Having examined the modulation scheme used in GSM and described the way in which theradio carriers are used by transmitting a burst within a particular time slot, we now look atthe transmitted power of these bursts at the MS and the BTS.
The specifications define five classes of MS for GSM900 and two classes for DCS1800based on their output power capabilities. These classes are shown in Table 2.4 [10]. Thetypical handheld units are Class 4 for GSM900 and Class 1 for DCS1800 and the typicalGSM900 vehicular unit is Class 2. Each MS has the ability to reduce its output power insteps of 2 dB from its maximum down to a minimum of 5 dBm (3.2 mW) for a GSM900 MSand 0 dBm (1 mW) for a DCS1800 MS in response to commands from a BTS. This facilityis used to implement up-link power control, whereby an MS’s transmitted power is adjustedto ensure that it is just sufficient to provide a satisfactory up-link quality. This process isused to conserve MS battery power and also reduce the up-link interference throughout thesystem.
Table 2.4: Mobile station power classes.Power Class Maximum output Maximum output
power GSM900 power DCS1800
1 20 W (43 dBm) 1 W (30 dBm)2 8 W (39 dBm) 0.25 W (24 dBm)3 5 W (37 dBm)4 2 W (33 dBm)5 0.8 W (29 dBm)
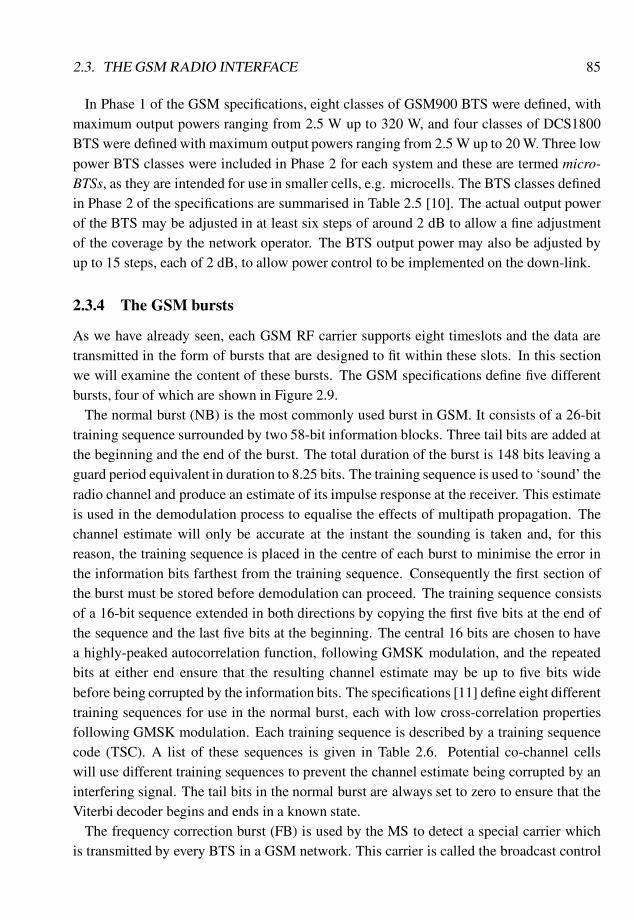
2.3. THE GSM RADIO INTERFACE 85
In Phase 1 of the GSM specifications, eight classes of GSM900 BTS were defined, withmaximum output powers ranging from 2.5 W up to 320 W, and four classes of DCS1800BTS were defined with maximum output powers ranging from 2.5 W up to 20 W. Three lowpower BTS classes were included in Phase 2 for each system and these are termed micro-BTSs, as they are intended for use in smaller cells, e.g. microcells. The BTS classes definedin Phase 2 of the specifications are summarised in Table 2.5 [10]. The actual output powerof the BTS may be adjusted in at least six steps of around 2 dB to allow a fine adjustmentof the coverage by the network operator. The BTS output power may also be adjusted byup to 15 steps, each of 2 dB, to allow power control to be implemented on the down-link.
2.3.4 The GSM bursts
As we have already seen, each GSM RF carrier supports eight timeslots and the data aretransmitted in the form of bursts that are designed to fit within these slots. In this sectionwe will examine the content of these bursts. The GSM specifications define five differentbursts, four of which are shown in Figure 2.9.
The normal burst (NB) is the most commonly used burst in GSM. It consists of a 26-bittraining sequence surrounded by two 58-bit information blocks. Three tail bits are added atthe beginning and the end of the burst. The total duration of the burst is 148 bits leaving aguard period equivalent in duration to 8.25 bits. The training sequence is used to ‘sound’ theradio channel and produce an estimate of its impulse response at the receiver. This estimateis used in the demodulation process to equalise the effects of multipath propagation. Thechannel estimate will only be accurate at the instant the sounding is taken and, for thisreason, the training sequence is placed in the centre of each burst to minimise the error inthe information bits farthest from the training sequence. Consequently the first section ofthe burst must be stored before demodulation can proceed. The training sequence consistsof a 16-bit sequence extended in both directions by copying the first five bits at the end ofthe sequence and the last five bits at the beginning. The central 16 bits are chosen to havea highly-peaked autocorrelation function, following GMSK modulation, and the repeatedbits at either end ensure that the resulting channel estimate may be up to five bits widebefore being corrupted by the information bits. The specifications [11] define eight differenttraining sequences for use in the normal burst, each with low cross-correlation propertiesfollowing GMSK modulation. Each training sequence is described by a training sequencecode (TSC). A list of these sequences is given in Table 2.6. Potential co-channel cellswill use different training sequences to prevent the channel estimate being corrupted by aninterfering signal. The tail bits in the normal burst are always set to zero to ensure that theViterbi decoder begins and ends in a known state.
The frequency correction burst (FB) is used by the MS to detect a special carrier whichis transmitted by every BTS in a GSM network. This carrier is called the broadcast control
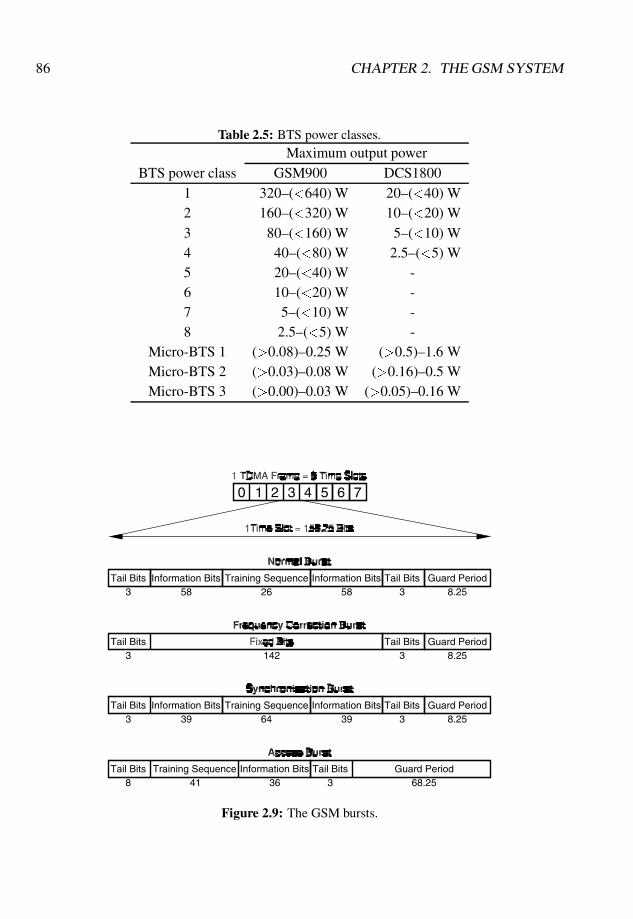
86 CHAPTER 2. THE GSM SYSTEM
Table 2.5: BTS power classes.Maximum output power
BTS power class GSM900 DCS18001 320–(<640) W 20–(<40) W2 160–(<320) W 10–(<20) W3 80–(<160) W 5–(<10) W4 40–(<80) W 2.5–(<5) W5 20–(<40) W -6 10–(<20) W -7 5–(<10) W -8 2.5–(<5) W -
Micro-BTS 1 (>0.08)–0.25 W (>0.5)–1.6 WMicro-BTS 2 (>0.03)–0.08 W (>0.16)–0.5 WMicro-BTS 3 (>0.00)–0.03 W (>0.05)–0.16 W
0 1 2 3 4 5 6 7
Tail Bits3
Information Bits58
Training Sequence26
Information Bits58
Tail Bits3
Guard Period8.25
Tail Bits3 142
Guard PeriodTail Bits3 8.25
Information Bits39
Information BitsTail Bits3 39
Training Sequence64
Guard PeriodTail Bits3 8.25
Information BitsTail Bits8 36
Training Sequence41
Guard PeriodTail Bits3 68.25
Figure 2.9: The GSM bursts.
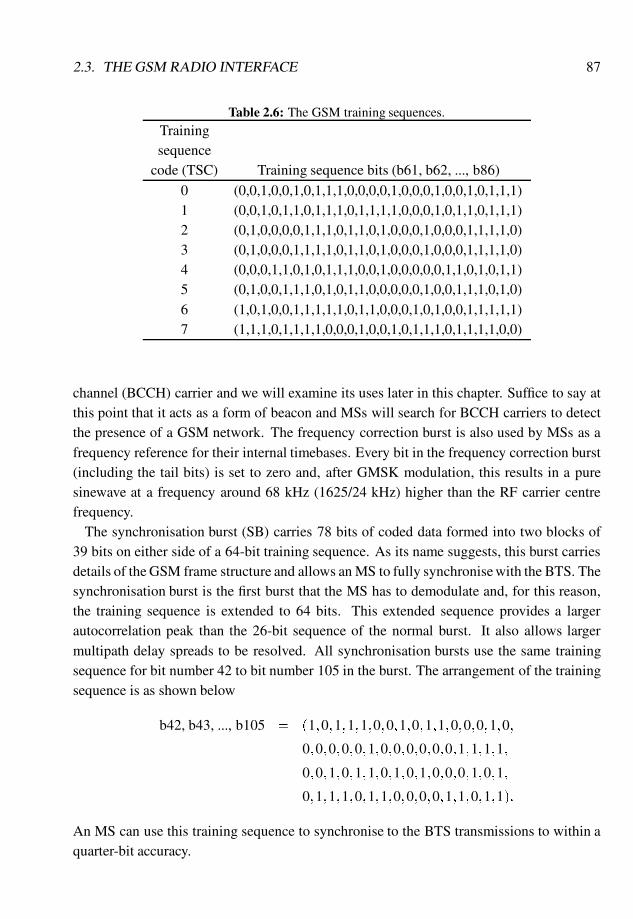
2.3. THE GSM RADIO INTERFACE 87
Table 2.6: The GSM training sequences.Trainingsequence
code (TSC) Training sequence bits (b61, b62, ..., b86)
0 (0,0,1,0,0,1,0,1,1,1,0,0,0,0,1,0,0,0,1,0,0,1,0,1,1,1)1 (0,0,1,0,1,1,0,1,1,1,0,1,1,1,1,0,0,0,1,0,1,1,0,1,1,1)2 (0,1,0,0,0,0,1,1,1,0,1,1,0,1,0,0,0,1,0,0,0,1,1,1,1,0)3 (0,1,0,0,0,1,1,1,1,0,1,1,0,1,0,0,0,1,0,0,0,1,1,1,1,0)4 (0,0,0,1,1,0,1,0,1,1,1,0,0,1,0,0,0,0,0,1,1,0,1,0,1,1)5 (0,1,0,0,1,1,1,0,1,0,1,1,0,0,0,0,0,1,0,0,1,1,1,0,1,0)6 (1,0,1,0,0,1,1,1,1,1,0,1,1,0,0,0,1,0,1,0,0,1,1,1,1,1)7 (1,1,1,0,1,1,1,1,0,0,0,1,0,0,1,0,1,1,1,0,1,1,1,1,0,0)
channel (BCCH) carrier and we will examine its uses later in this chapter. Suffice to say atthis point that it acts as a form of beacon and MSs will search for BCCH carriers to detectthe presence of a GSM network. The frequency correction burst is also used by MSs as afrequency reference for their internal timebases. Every bit in the frequency correction burst(including the tail bits) is set to zero and, after GMSK modulation, this results in a puresinewave at a frequency around 68 kHz (1625/24 kHz) higher than the RF carrier centrefrequency.
The synchronisation burst (SB) carries 78 bits of coded data formed into two blocks of39 bits on either side of a 64-bit training sequence. As its name suggests, this burst carriesdetails of the GSM frame structure and allows an MS to fully synchronise with the BTS. Thesynchronisation burst is the first burst that the MS has to demodulate and, for this reason,the training sequence is extended to 64 bits. This extended sequence provides a largerautocorrelation peak than the 26-bit sequence of the normal burst. It also allows largermultipath delay spreads to be resolved. All synchronisation bursts use the same trainingsequence for bit number 42 to bit number 105 in the burst. The arrangement of the trainingsequence is as shown below
b42, b43, ..., b105 = (1;0;1;1;1;0;0;1;0;1;1;0;0;0;1;0;
0;0;0;0;0;1;0;0;0;0;0;0;1;1;1;1;
0;0;1;0;1;1;0;1;0;1;0;0;0;1;0;1;
0;1;1;1;0;1;1;0;0;0;0;1;1;0;1;1):
An MS can use this training sequence to synchronise to the BTS transmissions to within aquarter-bit accuracy.
88 CHAPTER 2. THE GSM SYSTEM
The final GSM burst shown in Figure 2.9 is the access burst (AB). This consists of a41-bit training sequence followed by 36 information bits. The access burst is used by theMS to access the network initially and it is the first up-link burst that a BTS will have todemodulate from a particular MS. As with the synchronisation burst, the training sequenceis extended to ease the demodulation process. The number of tail bits at the beginning ofthe burst is increased to eight. The extended tail bits at the front of the burst are
b0, b1, b2, ..., b7 = (0;0;1;1;1;0;1;0):
This is followed by the training sequence,
b8, b9, ..., b48 = (0;1;0;0;1;0;1;1;0;1;
1;1;1;1;1;1;1;0;0;1;
1;0;0;1;1;0;1;0;1;0;
1;0;0;0;1;1;1;1;0;0;0):
The tail bits at the end of the burst are all set to zero. We note that the AB is much shorterthan the other bursts and this results in a large guard period of 68.25 bit periods. This guardperiod is included to compensate for the propagation delay between the MS and BTS. Oncea duplex link has been established, a closed loop timing advance mechanism is activated toensure that the MS up-link bursts arrive at the BTS within the correct time slots. However,this is not possible on the AB. Accordingly, a guard period of 68.25 bit periods, equivalentto 252 µs, allows the MS to be up to 38 km from the BTS before its up-link bursts will spillinto the next time slot.
We will later describe how the maximum timing advance of the MS decides the maximumrange of a BTS, although there are ways to increase the maximum range at the expense ofBTS capacity. As a result of its small size, the AB carries relatively little information andthis has an impact on the access procedure.
The fifth type of burst is not shown in Figure 2.9. It is the dummy burst (DB) and issimilar to the NB in that it has the same structure and uses the same training sequences. Themain difference between the DB and the NB is that the information bits on either side of thetraining sequence are set to a predefined sequence in the DB. The DB is used to fill inactivetime slots on the BCCH carrier, which must be transmitted continuously and at a constantpower.
The RF output spectrum of the transmitted signals in a TDMA system is not only deter-mined by the modulation process, but also by the switching transients that occur when thebursts of RF energy are transmitted. The switching transients tend to widen the spectrum ofthe transmitted signal, although this effect can be reduced by ramping the output power upand down when transmitting a burst, instead of just keying the transmitter on and off. The
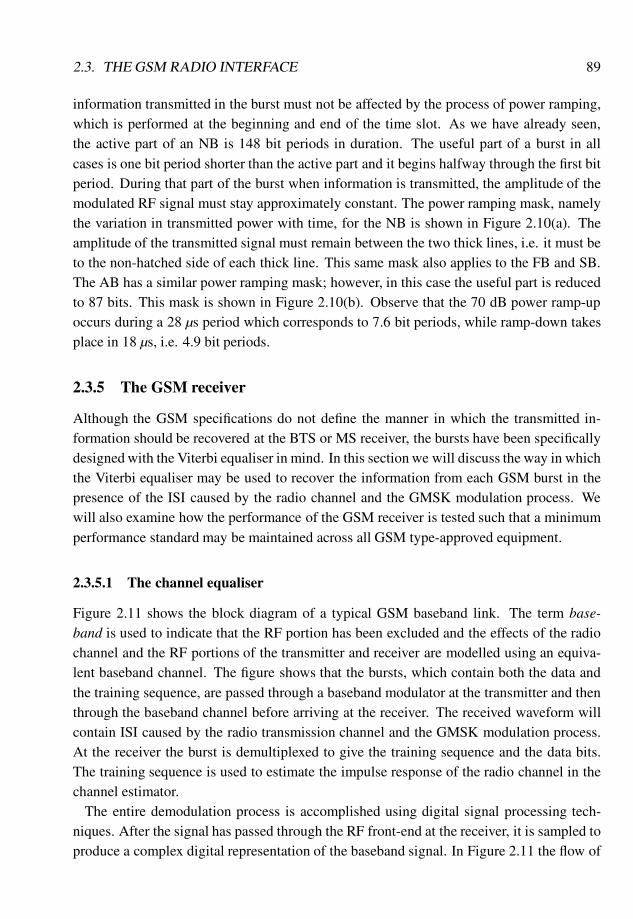
2.3. THE GSM RADIO INTERFACE 89
information transmitted in the burst must not be affected by the process of power ramping,which is performed at the beginning and end of the time slot. As we have already seen,the active part of an NB is 148 bit periods in duration. The useful part of a burst in allcases is one bit period shorter than the active part and it begins halfway through the first bitperiod. During that part of the burst when information is transmitted, the amplitude of themodulated RF signal must stay approximately constant. The power ramping mask, namelythe variation in transmitted power with time, for the NB is shown in Figure 2.10(a). Theamplitude of the transmitted signal must remain between the two thick lines, i.e. it must beto the non-hatched side of each thick line. This same mask also applies to the FB and SB.The AB has a similar power ramping mask; however, in this case the useful part is reducedto 87 bits. This mask is shown in Figure 2.10(b). Observe that the 70 dB power ramp-upoccurs during a 28 µs period which corresponds to 7.6 bit periods, while ramp-down takesplace in 18 µs, i.e. 4.9 bit periods.
2.3.5 The GSM receiver
Although the GSM specifications do not define the manner in which the transmitted in-formation should be recovered at the BTS or MS receiver, the bursts have been specificallydesigned with the Viterbi equaliser in mind. In this section we will discuss the way in whichthe Viterbi equaliser may be used to recover the information from each GSM burst in thepresence of the ISI caused by the radio channel and the GMSK modulation process. Wewill also examine how the performance of the GSM receiver is tested such that a minimumperformance standard may be maintained across all GSM type-approved equipment.
2.3.5.1 The channel equaliser
Figure 2.11 shows the block diagram of a typical GSM baseband link. The term base-band is used to indicate that the RF portion has been excluded and the effects of the radiochannel and the RF portions of the transmitter and receiver are modelled using an equiva-lent baseband channel. The figure shows that the bursts, which contain both the data andthe training sequence, are passed through a baseband modulator at the transmitter and thenthrough the baseband channel before arriving at the receiver. The received waveform willcontain ISI caused by the radio transmission channel and the GMSK modulation process.At the receiver the burst is demultiplexed to give the training sequence and the data bits.The training sequence is used to estimate the impulse response of the radio channel in thechannel estimator.
The entire demodulation process is accomplished using digital signal processing tech-niques. After the signal has passed through the RF front-end at the receiver, it is sampled toproduce a complex digital representation of the baseband signal. In Figure 2.11 the flow of
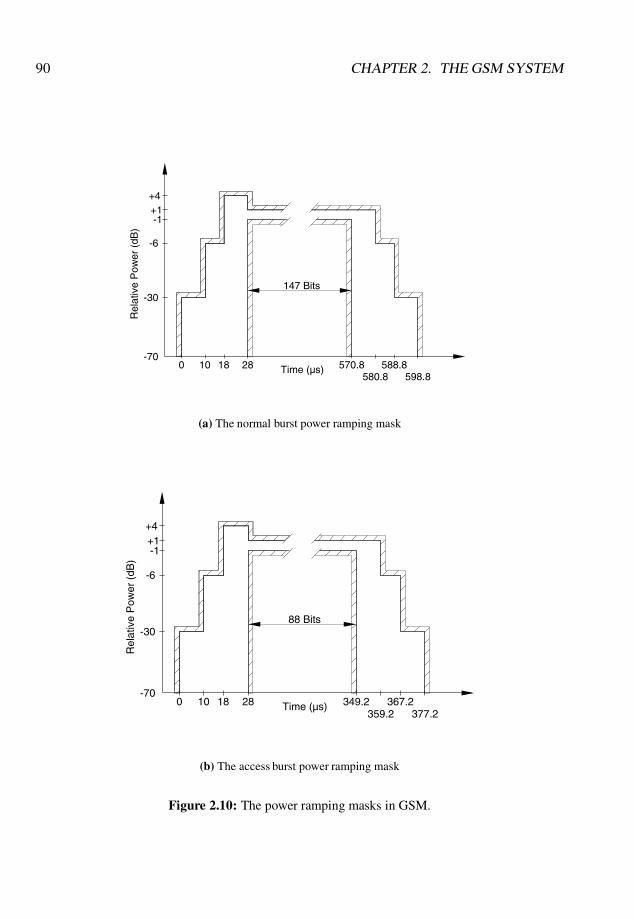
90 CHAPTER 2. THE GSM SYSTEM
-70
-30
0 10 18 28
-6
+4
Rel
ativ
e P
ower
(dB
)
570.8580.8
588.8598.8
Time (µs)
+1-1
147 Bits
(a) The normal burst power ramping mask
Time (µs)-70
0 10 18 28
Rel
ativ
e P
ower
(dB
)
-6
-30
+4+1-1
88 Bits
377.2359.2349.2 367.2
(b) The access burst power ramping mask
Figure 2.10: The power ramping masks in GSM.
2.3. THE GSM RADIO INTERFACE 91
complex baseband information is denoted by double arrows.In order to explain the channel estimation process, we represent the received training se-
quence, sr(t), as the convolution of the transmitted training sequence, s(t), and the impulseresponse of the baseband channel, hc(t), i.e.
sr(t) = s(t)�hc(t); (2.13)
where � denotes convolution. Passing sr(t) through a filter with an impulse response,hMF(t), that is matched to the training sequence yields a channel impulse response esti-mate, he(t), that is given by
he(t) = sr(t)�hMF(t)
= s(t)�hc(t)�hMF(t)
= Rs(t)�hc(t); (2.14)
where Rs(t) = s(t) � hMF(t) is the autocorrelation function (ACF) of the training sequence.It is important to note that Rs(t) is the autocorrelation of the modulated GMSK symbols thatare generated by the training sequence, and not the training sequence bits themselves. Thetraining sequences have been chosen using a computer search so that Rs(t) is an approxi-mation to a Dirac impulse-like function. The actual shape is pulse-like and its magnitude islimited to be less than the number of chips in the sounding sequence. Given that Rs(t) hasthis property, Equation (2.14) becomes
he(t) � δ(t)�hc(t)
� hc(t); (2.15)
where δ(t) is the Dirac impulse function.The time delay between the first and last recieved multipath components of the estimated
channel may be large and there is a correspondence between the size of this delay andthe complexity of the Viterbi channel equaliser. Every increase in delay corresponding toa bit duration results in a doubling of the number of states in the equaliser. There is astandardised artificial channel impulse response contrived to test the Viterbi equaliser. Thechannel impulse response is composed of six impulses of the same average power that areequally spaced over a time of 16 µs, i.e. the spacing between adjacent impulses is 3.2 µs.(This channel impulse response is shown later in Figure 2.13(d).) The GMSK modulatorspreads each bit over a bandwidth of three bits. The delay spread of 16 µs corresponds to16/3.69 or 4.34 bits periods. The total spreading for a 16µs excess delay spread would be7.34 bit periods.
Recall that the training sequence consists of a 16-bit sounding sequence with five bitsappended to either end. This means that channel estimates may be derived for total excess
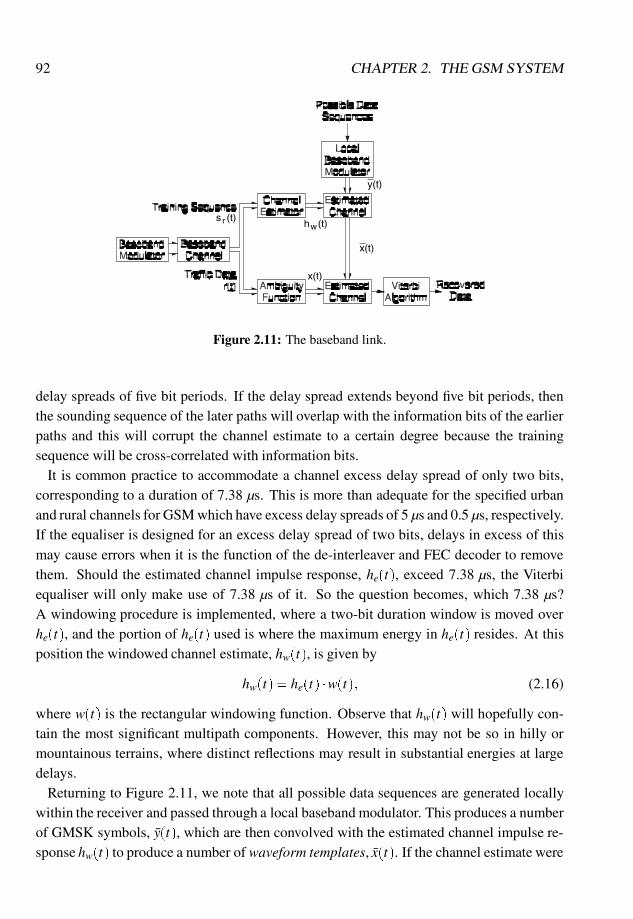
92 CHAPTER 2. THE GSM SYSTEM
s (t)r h (t)w
y(t)
x(t)
x(t)
Figure 2.11: The baseband link.
delay spreads of five bit periods. If the delay spread extends beyond five bit periods, thenthe sounding sequence of the later paths will overlap with the information bits of the earlierpaths and this will corrupt the channel estimate to a certain degree because the trainingsequence will be cross-correlated with information bits.
It is common practice to accommodate a channel excess delay spread of only two bits,corresponding to a duration of 7.38 µs. This is more than adequate for the specified urbanand rural channels for GSM which have excess delay spreads of 5 µs and 0.5 µs, respectively.If the equaliser is designed for an excess delay spread of two bits, delays in excess of thismay cause errors when it is the function of the de-interleaver and FEC decoder to removethem. Should the estimated channel impulse response, he(t), exceed 7.38 µs, the Viterbiequaliser will only make use of 7.38 µs of it. So the question becomes, which 7.38 µs?A windowing procedure is implemented, where a two-bit duration window is moved overhe(t), and the portion of he(t) used is where the maximum energy in he(t) resides. At thisposition the windowed channel estimate, hw(t), is given by
hw(t) = he(t) �w(t); (2.16)
where w(t) is the rectangular windowing function. Observe that hw(t) will hopefully con-tain the most significant multipath components. However, this may not be so in hilly ormountainous terrains, where distinct reflections may result in substantial energies at largedelays.
Returning to Figure 2.11, we note that all possible data sequences are generated locallywithin the receiver and passed through a local baseband modulator. This produces a numberof GMSK symbols, y(t), which are then convolved with the estimated channel impulse re-sponse hw(t) to produce a number of waveform templates, x(t). If the channel estimate were
2.3. THE GSM RADIO INTERFACE 93
perfect, then the waveform template that corresponds to the transmitted data sequence wouldexactly match the received waveform, r(t). However, there are a number of imperfections inthe channel estimation process. For example, the autocorrelation of the training sequence isnot a perfect Dirac function and there are problems associated with windowing the channelestimate. The effect of the imperfect channel sounding may be mitigated to some degree byintroducing the same distortions into the data path as in the channel estimation path. Ac-cordingly we introduce an ambiguity function, Rs(t), which is the autocorrelation functionof the training sequence.
To examine the role of the ambiguity function we first consider the received data signal,r(t), which is given by
r(t) = b(t)�hc(t); (2.17)
where b(t) is the transmitted data sequence and hc(t) is the actual channel impulse response.The received signal is convolved by w(t)Rs(t) to give
x(t) = b(t)�w(t)Rs(t)�hc(t): (2.18)
The locally generated waveform templates are produced by convolving each possible datasequence with the windowed channel estimate. This gives
x(t) = y(t)�hw(t)
= y(t)� (w(t)he(t))
= y(t)�w(t)Rs(t)�w(t)hc(t)
= y(t)�w(t)Rs(t)�hw(t): (2.19)
where y(t) is the output of the local baseband modulator, as shown in Figure 2.11. Notethat as y(t) is one of a number of possible b(t) waveforms, Equations (2.18) and (2.19)only differ in that x(t) includes hc(t), whereas x(t) is forced to have the windowed version,hw(t), and that hc(t) and hw(t) are the same when the impulse response used in forming y(t)is completely contained within the window.
Thus, by introducing the ambiguity function into the received data path, as shown in Fig-ure 2.11, the matching between the received waveform and the correct waveform templateis significantly improved.
Suppose the equaliser is to accommodate a five-bit overall spreading of the data, resultingfrom three-bit spreading in the GMSK modulator and two-bit spreading in the channel.So in any bit period we must consider the effect of five bits. Since five bits can yield 32different binary patterns, we must generate 32 different waveform templates, bx(t), of one-bit duration and use them as each bit of the information x(t) arrives. The same 32 valuesof x(t) will be used for each bit in x(t). The mean square error between each waveformtemplate, x(t), and the received waveform, x(t), is computed for each bit period. These
94 CHAPTER 2. THE GSM SYSTEM
mean square error values are called incremental metrics. The waveform template that mostclosely matches the received waveform will produce the lowest incremental metric and thiscould be used to regenerate the data bit, b(t). However, we refrain from regenerating adata bit. Instead this process of determining the smallest incremental metric is done for thefirst bit in the burst through to the last bit. Only at the end of the burst will all the bits beregenerated.
The Viterbi equaliser has 2v�1 states, where v in our example is five. So we have 16 states.Each state is associated with a different four-bit binary number. The states are formed intoa column having 16 circles, each representing a binary state, e.g. 1101. A trellis diagramis formed of the same columns of these 16 states. Each state, say 1101, will change at thenext bit interval to either 0101 or 1101 depending on whether the new bit is a logical 0 orlogical 1, respectively. There are two of the above described incremental metrics for eachstate, so at each bit period there are 32 incremental metrics. For the first data bit we selectthe lower metric at each state as the favoured metric. (In GSM there are introductory logical0 tail bits so we know how it starts and this eases the equalisation process.) The favouredmetric is associated with a logical 0 or logical 1 transmitted bit. We note the logical value ofthe bit associated with the metric as well as the value of the metric. At the next bit intervalwe get another set of 32 metrics. The two incremental metrics at any state are added to thepreviously retained incremental metric, and the summation is referred to as a path metric.The smaller of the two metrics retained, its value noted, as well as the logical value of thebit with which it is associated.
As the bits are processed, one at a time, incremental and path metrics for each state arecomputed as well as the value of the probable transmitted bit associated with the lowest pathmetric. At the end of the compete burst there will be 16 metrics, one for each state. Thestate with the lowest path metric will be selected, and a trace will be employed to identifythe bits associated with this path metric as it changed values from the beginning of the burstto when it won out as the lowest path metric. These bits are regenerated in one go as therecovered data burst, although bit de-interleaving and FEC decoding will still need to bedone.
This simple description relates to digital phase modulation. When we consider GMSK, afrequency modulation method, we require four phase states 0, π=2, π and 3π=2 in additionto the states previously described. Thus there are 16 states associated with 0 radians, 16states associated with π=2 radians, and so on. There are therefore 64 instant phase states.The reader is advised to consult Steele [4], Chapter 6, for a detailed description of Viterbiequalisation of GMSK signals. We note that with GMSK either double or multiple bit errorsoccur, although double errors are converted to single errors if differential encoding of thedata is done at the transmitter prior to GMSK modulation.
2.3. THE GSM RADIO INTERFACE 95
2.3.5.2 The GSM receiver performance
It is important in a system such as GSM that every piece of equipment complies with aminimum set of performance standards, regardless of its manufacturer or country of ori-gin. The performances of the MS and BTS receivers are specified by defining a maximumallowable bit error rate (BER) for each of the different GSM logical channels for a givenset of radio channel conditions. As the GSM system has been designed to operate in manydifferent environments, from rural to dense urban, it is important that the specifications re-flect this by specifying the performance of the MS and BTS receivers over a wide rangeof different operational environments. To this end, the GSM specifications [10] define fourdifferent channel models and these are used to specify the performances of the MS and BTSreceivers. Each channel model consists of a number of independently fading impulses, orpaths, at different time delays. In practice, the mobile radio channel cannot be separatedinto its different paths; however, the channel models have been defined in this manner sothat they may be easily implemented in wideband channel simulators for equipment testing.
Figure 2.12 shows a block diagram of a wideband channel simulator. The input signalis passed through a delay line which has a number of taps. Each tap represents a receivedsignal path and the signals at each tap are summed to produce the received signal. The delayblocks introduce time delays between the different paths, thereby modelling the effects ofpath length differences, and each tap may be weighted to model different path attenuations.The signals on the taps can also be set to fade independently with different characteristics.
The GSM channel models are defined in terms of the delays and relative amplitudes oftheir component paths. Each model is defined for a six-tap channel simulator; however,some channels also include a 12-tap setting for use with larger simulators. Table 2.7 givesthe characteristics of the rural area (RA) model. The left-hand column is the tap number.The column entitled ‘Relative time’ lists the time delays for the two sets of alternativetap settings. The next two columns give the relative amplitudes of each tap for the twoalternative settings and, finally, the right-hand column shows the fading characteristics foreach path in terms of its Doppler spectrum. CLASS is the classical Doppler spectrumdefined by
S( f ) = A=(1� ( f= fd)2)
12 (2.20)
and RICE is the sum of a classical Doppler spectrum and one direct path defined by
S( f ) = 0:41=2π fd(1� ( f= fd)2)
12 )+0:91δ( f �0:7 fd); (2.21)
where the maximum Doppler frequency is
fd = v=λ; (2.22)
v is the MS speed in m/s, λ is the wavelength of the carrier frequency in m, δ( � ) is the Diracfunction, f is the frequency which is constrained between � fd and A is a constant.
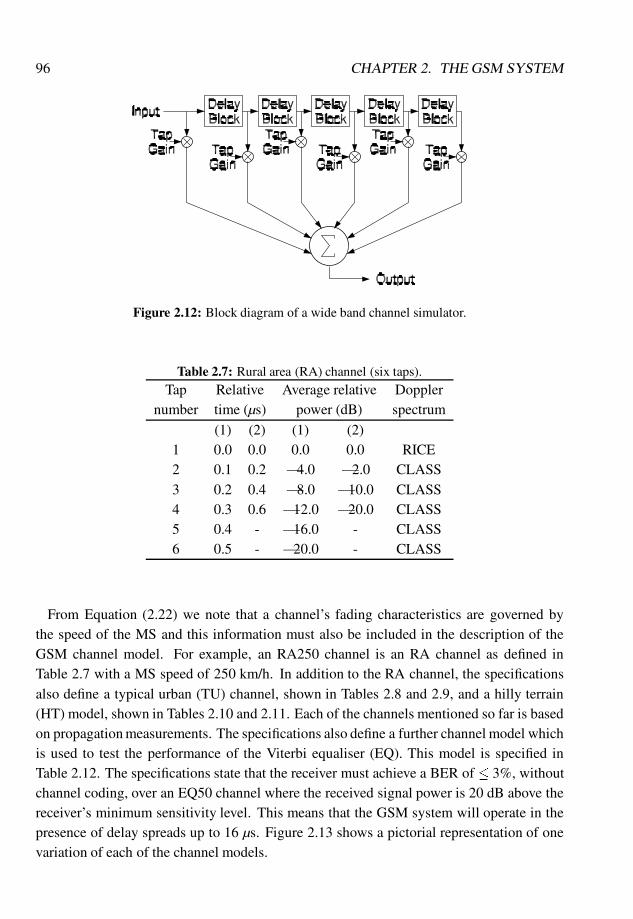
96 CHAPTER 2. THE GSM SYSTEM
Figure 2.12: Block diagram of a wide band channel simulator.
Table 2.7: Rural area (RA) channel (six taps).Tap Relative Average relative Doppler
number time (µs) power (dB) spectrum
(1) (2) (1) (2)1 0.0 0.0 0.0 0.0 RICE2 0.1 0.2 �4.0 �2.0 CLASS3 0.2 0.4 �8.0 �10.0 CLASS4 0.3 0.6 �12.0 �20.0 CLASS5 0.4 - �16.0 - CLASS6 0.5 - �20.0 - CLASS
From Equation (2.22) we note that a channel’s fading characteristics are governed bythe speed of the MS and this information must also be included in the description of theGSM channel model. For example, an RA250 channel is an RA channel as defined inTable 2.7 with a MS speed of 250 km/h. In addition to the RA channel, the specificationsalso define a typical urban (TU) channel, shown in Tables 2.8 and 2.9, and a hilly terrain(HT) model, shown in Tables 2.10 and 2.11. Each of the channels mentioned so far is basedon propagation measurements. The specifications also define a further channel model whichis used to test the performance of the Viterbi equaliser (EQ). This model is specified inTable 2.12. The specifications state that the receiver must achieve a BER of � 3%, withoutchannel coding, over an EQ50 channel where the received signal power is 20 dB above thereceiver’s minimum sensitivity level. This means that the GSM system will operate in thepresence of delay spreads up to 16 µs. Figure 2.13 shows a pictorial representation of onevariation of each of the channel models.
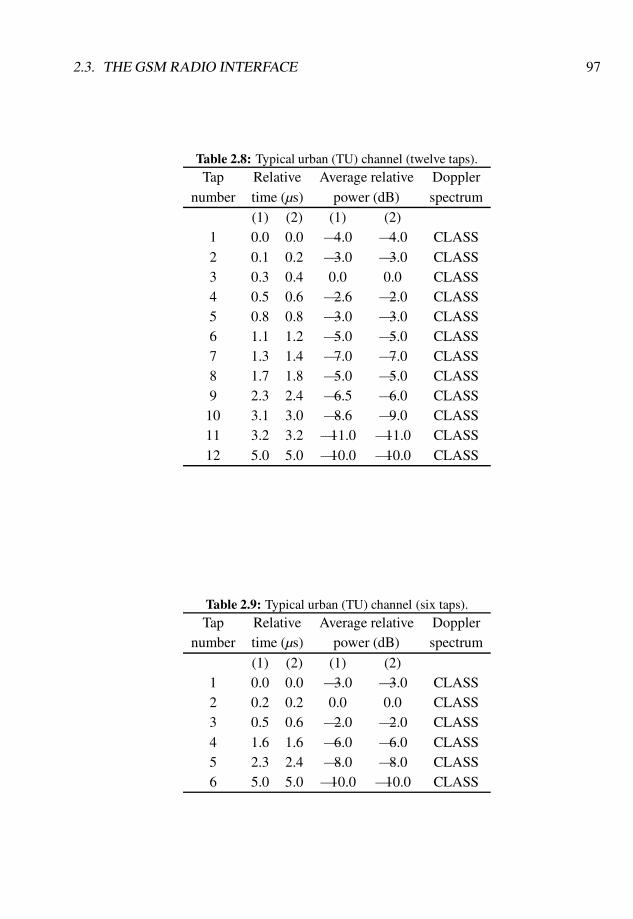
2.3. THE GSM RADIO INTERFACE 97
Table 2.8: Typical urban (TU) channel (twelve taps).Tap Relative Average relative Doppler
number time (µs) power (dB) spectrum(1) (2) (1) (2)
1 0.0 0.0 �4.0 �4.0 CLASS2 0.1 0.2 �3.0 �3.0 CLASS3 0.3 0.4 0.0 0.0 CLASS4 0.5 0.6 �2.6 �2.0 CLASS5 0.8 0.8 �3.0 �3.0 CLASS6 1.1 1.2 �5.0 �5.0 CLASS7 1.3 1.4 �7.0 �7.0 CLASS8 1.7 1.8 �5.0 �5.0 CLASS9 2.3 2.4 �6.5 �6.0 CLASS
10 3.1 3.0 �8.6 �9.0 CLASS11 3.2 3.2 �11.0 �11.0 CLASS12 5.0 5.0 �10.0 �10.0 CLASS
Table 2.9: Typical urban (TU) channel (six taps).Tap Relative Average relative Doppler
number time (µs) power (dB) spectrum
(1) (2) (1) (2)1 0.0 0.0 �3.0 �3.0 CLASS2 0.2 0.2 0.0 0.0 CLASS3 0.5 0.6 �2.0 �2.0 CLASS4 1.6 1.6 �6.0 �6.0 CLASS5 2.3 2.4 �8.0 �8.0 CLASS6 5.0 5.0 �10.0 �10.0 CLASS
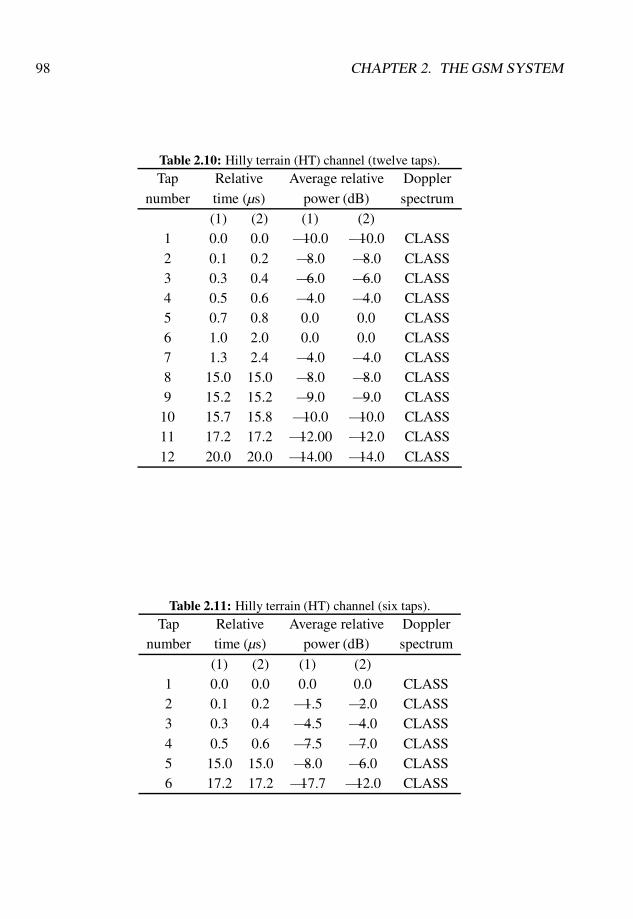
98 CHAPTER 2. THE GSM SYSTEM
Table 2.10: Hilly terrain (HT) channel (twelve taps).Tap Relative Average relative Doppler
number time (µs) power (dB) spectrum(1) (2) (1) (2)
1 0.0 0.0 �10.0 �10.0 CLASS2 0.1 0.2 �8.0 �8.0 CLASS3 0.3 0.4 �6.0 �6.0 CLASS4 0.5 0.6 �4.0 �4.0 CLASS5 0.7 0.8 0.0 0.0 CLASS6 1.0 2.0 0.0 0.0 CLASS7 1.3 2.4 �4.0 �4.0 CLASS8 15.0 15.0 �8.0 �8.0 CLASS9 15.2 15.2 �9.0 �9.0 CLASS
10 15.7 15.8 �10.0 �10.0 CLASS11 17.2 17.2 �12.00 �12.0 CLASS12 20.0 20.0 �14.00 �14.0 CLASS
Table 2.11: Hilly terrain (HT) channel (six taps).Tap Relative Average relative Doppler
number time (µs) power (dB) spectrum
(1) (2) (1) (2)1 0.0 0.0 0.0 0.0 CLASS2 0.1 0.2 �1.5 �2.0 CLASS3 0.3 0.4 �4.5 �4.0 CLASS4 0.5 0.6 �7.5 �7.0 CLASS5 15.0 15.0 �8.0 �6.0 CLASS6 17.2 17.2 �17.7 �12.0 CLASS

2.3. THE GSM RADIO INTERFACE 99
5 10 15 200Path Delay (µs)
-20
0
Ave
rage
Rel
ativ
e P
ower
(dB
)
0.5µs
(a) The RA channel model
Ave
rage
Rel
ativ
e P
ower
(dB
)
5µs
50
-20
Path Delay (µs)10 15
0
20
(b) The TU channel model
0.5µs
Ave
rage
Rel
ativ
e P
ower
(dB
)
50Path Delay (µs)
10 15
-20
0
20
(c) The HT channel model
15100 5Path Delay (µs)
Ave
rage
Rel
ativ
e P
ower
(dB
)
-20
0
20
(d) The EQ test profile
Figure 2.13: The GSM channel models.
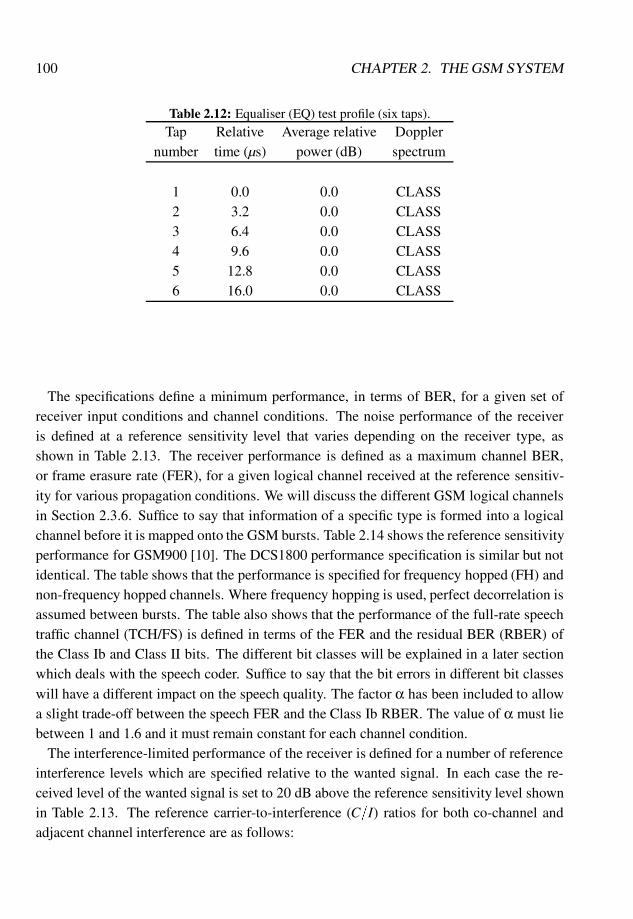
100 CHAPTER 2. THE GSM SYSTEM
Table 2.12: Equaliser (EQ) test profile (six taps).Tap Relative Average relative Doppler
number time (µs) power (dB) spectrum
1 0.0 0.0 CLASS2 3.2 0.0 CLASS3 6.4 0.0 CLASS4 9.6 0.0 CLASS5 12.8 0.0 CLASS6 16.0 0.0 CLASS
The specifications define a minimum performance, in terms of BER, for a given set ofreceiver input conditions and channel conditions. The noise performance of the receiveris defined at a reference sensitivity level that varies depending on the receiver type, asshown in Table 2.13. The receiver performance is defined as a maximum channel BER,or frame erasure rate (FER), for a given logical channel received at the reference sensitiv-ity for various propagation conditions. We will discuss the different GSM logical channelsin Section 2.3.6. Suffice to say that information of a specific type is formed into a logicalchannel before it is mapped onto the GSM bursts. Table 2.14 shows the reference sensitivityperformance for GSM900 [10]. The DCS1800 performance specification is similar but notidentical. The table shows that the performance is specified for frequency hopped (FH) andnon-frequency hopped channels. Where frequency hopping is used, perfect decorrelation isassumed between bursts. The table also shows that the performance of the full-rate speechtraffic channel (TCH/FS) is defined in terms of the FER and the residual BER (RBER) ofthe Class Ib and Class II bits. The different bit classes will be explained in a later sectionwhich deals with the speech coder. Suffice to say that the bit errors in different bit classeswill have a different impact on the speech quality. The factor α has been included to allowa slight trade-off between the speech FER and the Class Ib RBER. The value of α must liebetween 1 and 1.6 and it must remain constant for each channel condition.
The interference-limited performance of the receiver is defined for a number of referenceinterference levels which are specified relative to the wanted signal. In each case the re-ceived level of the wanted signal is set to 20 dB above the reference sensitivity level shownin Table 2.13. The reference carrier-to-interference (C=I) ratios for both co-channel andadjacent channel interference are as follows:
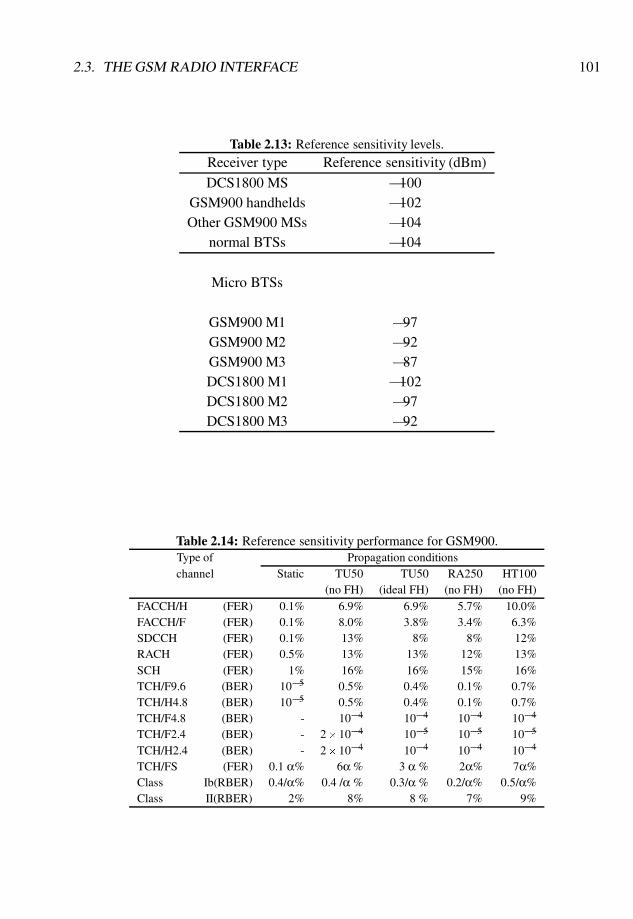
2.3. THE GSM RADIO INTERFACE 101
Table 2.13: Reference sensitivity levels.Receiver type Reference sensitivity (dBm)
DCS1800 MS �100GSM900 handhelds �102Other GSM900 MSs �104
normal BTSs �104
Micro BTSs
GSM900 M1 �97GSM900 M2 �92GSM900 M3 �87DCS1800 M1 �102DCS1800 M2 �97DCS1800 M3 �92
Table 2.14: Reference sensitivity performance for GSM900.Type of Propagation conditionschannel Static TU50 TU50 RA250 HT100
(no FH) (ideal FH) (no FH) (no FH)FACCH/H (FER) 0.1% 6.9% 6.9% 5.7% 10.0%FACCH/F (FER) 0.1% 8.0% 3.8% 3.4% 6.3%SDCCH (FER) 0.1% 13% 8% 8% 12%RACH (FER) 0.5% 13% 13% 12% 13%SCH (FER) 1% 16% 16% 15% 16%TCH/F9.6 (BER) 10�5 0.5% 0.4% 0.1% 0.7%TCH/H4.8 (BER) 10�5 0.5% 0.4% 0.1% 0.7%TCH/F4.8 (BER) - 10�4 10�4 10�4 10�4
TCH/F2.4 (BER) - 2�10�4 10�5 10�5 10�5
TCH/H2.4 (BER) - 2�10�4 10�4 10�4 10�4
TCH/FS (FER) 0.1 α% 6α % 3 α % 2α% 7α%Class Ib(RBER) 0.4/α% 0.4 /α % 0.3/α % 0.2/α% 0.5/α%Class II(RBER) 2% 8% 8 % 7% 9%
102 CHAPTER 2. THE GSM SYSTEM
co-channel interference C=I = 9 dBfirst adjacent channel interference (200 kHz) C=I = �9 dBsecond adjacent channel interference (400 kHz) C=I = �41 dBthird adjacent channel interference (600 kHz) C=I = �49 dB:
These values show that GSM is specified to operate in situations where the co-channelC=Iis� 9 dB and the first adjacent channel is� 9 dB greater than the wanted channel. Owing tothe effects of power control and shadow fading, this adjacent channel performance precludesthe use of adjacent channels within the same cell. Given the input conditions shown above,the receiver performance is defined in terms of maximum FERs and BERs for each logicalchannel and propagation condition similar to that shown for the sensitivity performanceitemised in Table 2.14. The interference performance of both GSM900 and DCS1800 isfully defined in the specifications [10] and full details have not been included here.
2.3.6 Physical and logical channels
In the previous sections we have discussed the way in which information is transmittedover the GSM radio interface in the form of bursts containing both information bits and apredefined training sequence. We have also looked at the way the information bits may berecovered in the presence of the ISI introduced by the modulation process and the radiochannel. In this section we consider the manner in which the user data, e.g. speech, and thesignalling data, e.g. handover commands, are mapped onto the TDMA bursts.
When an MS and a BTS communicate, they do so on a specific pair of radio frequency(RF) carriers, one for the up-link and the other for the down-link transmissions, and withina given time slot in each consecutive TDMA frame. This combination of time slot andcarrier frequency forms what is termed a physical channel. One RF channel will supporteight physical channels in time slots zero through to seven. The data, whether user trafficor signalling information, are mapped onto the physical channels by defining a number oflogical channels. A logical channel will carry information of a specific type and a numberof these channels may be combined before being mapped onto the same physical channel.Having introduced the concept of the physical and logical channels, we will now describethe function of each of the GSM logical channels.
2.3.6.1 Traffic channels
GSM defines two types of traffic channel (TCH). The full-rate TCH allows speech trans-mission at 13 kb/s and in the specifications it is termed a TCH/FS channel to show that it isa full-rate TCH carrying speech information. All forms of the GSM TCH follow a similarnaming convention as shown below. The full-rate TCH also allows user data transmissionat the primary user rates of 9.6, 4.8 and �2.4 kb/s, referred to as TCH/F9.6, TCH/F4.8 and
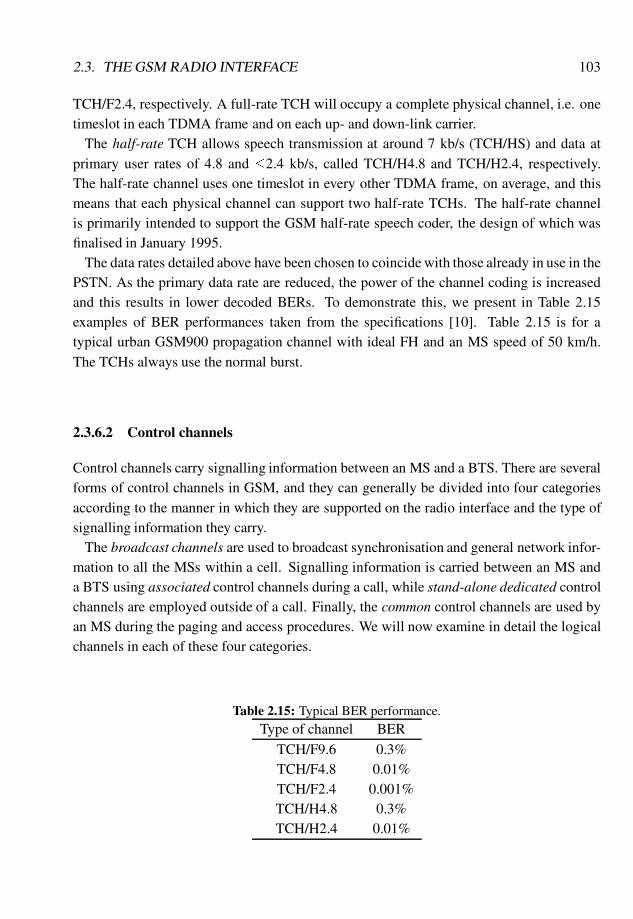
2.3. THE GSM RADIO INTERFACE 103
TCH/F2.4, respectively. A full-rate TCH will occupy a complete physical channel, i.e. onetimeslot in each TDMA frame and on each up- and down-link carrier.
The half-rate TCH allows speech transmission at around 7 kb/s (TCH/HS) and data atprimary user rates of 4.8 and �2.4 kb/s, called TCH/H4.8 and TCH/H2.4, respectively.The half-rate channel uses one timeslot in every other TDMA frame, on average, and thismeans that each physical channel can support two half-rate TCHs. The half-rate channelis primarily intended to support the GSM half-rate speech coder, the design of which wasfinalised in January 1995.
The data rates detailed above have been chosen to coincide with those already in use in thePSTN. As the primary data rate are reduced, the power of the channel coding is increasedand this results in lower decoded BERs. To demonstrate this, we present in Table 2.15examples of BER performances taken from the specifications [10]. Table 2.15 is for atypical urban GSM900 propagation channel with ideal FH and an MS speed of 50 km/h.The TCHs always use the normal burst.
2.3.6.2 Control channels
Control channels carry signalling information between an MS and a BTS. There are severalforms of control channels in GSM, and they can generally be divided into four categoriesaccording to the manner in which they are supported on the radio interface and the type ofsignalling information they carry.
The broadcast channels are used to broadcast synchronisation and general network infor-mation to all the MSs within a cell. Signalling information is carried between an MS anda BTS using associated control channels during a call, while stand-alone dedicated controlchannels are employed outside of a call. Finally, the common control channels are used byan MS during the paging and access procedures. We will now examine in detail the logicalchannels in each of these four categories.
Table 2.15: Typical BER performance.Type of channel BER
TCH/F9.6 0.3%TCH/F4.8 0.01%TCH/F2.4 0.001%TCH/H4.8 0.3%TCH/H2.4 0.01%
104 CHAPTER 2. THE GSM SYSTEM
Broadcast channels Broadcast channels are transmitted in the down-link direction only,i.e. they are only transmitted by the BTS.
The frequency correction channel (FCCH) is the simplest GSM logical channel becauseall its information bits are set to zero. The FCCH consists solely of frequency correctionbursts which, as we have already seen, consist of an all-zero bit pattern. After GMSK modu-lation, these bursts produce a pure sinewave at a frequency of around 68 kHz (1625/24 kHz)above the carrier frequency. The FCCH is used by the MS in the initial stages of BTS ac-quisition to correct its internal frequency sources and recover the carrier phase of the BTStransmissions.
The synchronisation channel (SCH) contains full details of its own position within theGSM framing structure. We will examine this framing structure in the next section. Usingthe information supplied on the SCH, an MS can fully synchronise its frame counters withthose of a BTS. The SCH information is transmitted using synchronisation bursts.
In addition to the frame synchronisation information, the SCH also contains a six-bit basestation identity code (BSIC). We will see in the Section 2.4.4, which deals with handoverin GSM, that an MS is required to measure the received signal strength of a special beaconcarrier, termed the BCCH carrier. This carrier is transmitted at a constant power by eachof the MS’s neighbouring BTSs. This information is reported to the network where it isused to determine whether the MS is connected to the most appropriate BTS or whetherit should be switched to a more suitable BTS. The MS will be provided with a list of theBCCH carrier frequencies used by its neighbouring BTSs and it will report a received signallevel measurement for each BCCH carrier frequency. It is important to ensure that the mea-surement information is always associated with the correct BTS. For example, an MS mayreport a received signal level measurement for frequency f1 which the network associateswith a particular BS, say, BSA. However, the MS may in fact be measuring the BCCH car-rier transmissions from a different BS, say, BSB. This confusion is resolved by requiring theMS periodically to decode the SCH of its neighbouring BTSs and extract the BSIC. Whenthe measurement information is sent to the network it is accompanied by the BSIC for eachBTS and this ensures that the network associates each measurement with the appropriateBTS. Therefore, it is important to ensure that two potential co-channel BTSs, e.g. BSA andBSB above, are assigned different BSICs.
The BSIC consists of a three-bit network colour code (NCC) and a three-bit BS colourcode (BCC). The term ‘colour’ is used because the assignment of these codes may beachieved by colouring the regions on a map according to the code that is in use within aparticular area. Where two networks, sharing the same frequency band, have overlappingcoverage they will each be assigned a different NCC. This ensures that the two networkscannot use the same BSIC. In general, two PLMNs within the same country will use dif-ferent frequency bands, and the use of the NCC only becomes important at international
2.3. THE GSM RADIO INTERFACE 105
boundaries where the coverage of two PLMNs using the same frequency bands may over-lap. The BCC is used by the individual operators to ensure that co-channel BTSs havedifferent BSICs. The BCC and the training sequence code (TSC) will be the same for eachBTS. This means that by decoding the BSIC for a particular BTS, the MS can determinewhich of the eight possible training sequences to expect in the normal bursts transmitted bya particular BTS (see Table 2.6).
The broadcast control channel (BCCH) is used to broadcast control information to everyMS within a cell. This information includes details of the control channel configurationused at the BTS (see Section 2.3.7), a list of the BCCH carrier frequencies used at theneighbouring BTSs and a number of parameters that are used by the MS when accessingthe BTS.
The cell broadcast channel (CBCH) is used to transmit short alpha numeric text messagesto all the MSs within a particular cell. These messages appear on the MS’s display and asubscriber may choose to receive different messages by selecting different pages, similar tothe way the teletext system works on broadcast television. The BCCH and the CBCH bothuse the normal burst.
Associated control channels When an MS is engaged in a call, a certain amount of sig-nalling information must flow across the radio interface in order to maintain the call. Forexample, an MS will continually report the received level of the BCCH carriers of its neigh-bouring BTSs. This type of signalling is supported using logical control channels whichoccupy the same physical channel as the traffic data. Non-urgent information, e.g. mea-surement data, is transmitted using the slow associated control channel (SACCH). Thischannel is always present when a dedicated link is active between the MS and BTS, and itoccupies one timeslot in every 26. SACCH messages may be sent once every 480 ms, i.e.approximately every 2 s. More urgent information, e.g. a handover command, is sent usingtime slots that are ‘stolen’ from the traffic channel. This channel is known as the fast asso-ciated control channel (FACCH) because of its ability to transfer information between theBTS and MS more quickly than the SACCH. A FACCH signalling block is used to exactlyreplace a single (20 ms) speech block and a complete FACCH message may be sent onceevery 20 ms. Both the SACCH and FACCH use the normal burst and they are both up-linkand down-link channels.
Stand-alone dedicated control channel In some situations, signalling information mustflow between a network and an MS when a call is not in progress, e.g. during a locationupdate. This could be accommodated by allocating either a full-rate or half-rate TCH andby using either the SACCH or FACCH to carry the information. This would, however, be awaste of the limited radio resources since the data transfer requirements of a process such

106 CHAPTER 2. THE GSM SYSTEM
as location updating are far less than those of speech transmissions. For this reason, a lowerdata rate channel has been defined which has around one-eighth of the capacity of a full-rate TCH. This channel is known as a stand-alone dedicated control channel (SDCCH).The channel is termed ‘stand-alone’ because it may exist independently of any TCH, and itis termed ‘dedicated’ because it is only used by one particular MS, i.e. it is dedicated to aparticular MS.
In some ways the SDCCH is similar to a TCH since they are both used to provide a dedi-cated connection between a BTS and an MS. The SDCCH also has an associated SACCH.Since the SDCCH always carries signalling traffic there is no frame stealing and conse-quently it does not need an FACCH. Alternatively, one could argue that the SDCCH isconstantly in the FACCH mode. The SDCCH operates on both the up-link and down-linkand the normal burst is always used.
Common control channels The common control channels may be used by any MS withina cell. The paging channel (PCH) is a down-link only channel that is used by the system topage individual MSs, e.g. in the event of an incoming call. There are two different PCHs, afull-rate PCH and a reduced rate PCH, for use in cells with a limited capacity. The normalburst is always used on the PCH.
The access grant channel (AGCH) shares the same physical resources as the PCH, i.e. aparticular time slot may be used by either channel, though not simultaneously. As its namewould suggest, the AGCH is used by the network to grant, or deny, an MS access to thenetwork by supplying it with details of a dedicated channel, i.e. TCH or SDCCH, to beused for subsequent communications. The AGCH is a down-link only channel and it usesthe normal burst.
The random access channel (RACH) is an up-link only channel that is used by an MS toinitially access the network, e.g. at call set-up or prior to a location update. It is termed‘random’ because there is no mechanism to ensure that no more than one MS transmitsin each RACH time slot and there is a finite probability that two mobiles could attempt toaccess the same RACH at the same time. This could result in neither access attempt beingsuccessful as the two signals collide at the BTS. If an MS receives no response from theBTS, it will attempt to access the BTS again after waiting a certain period of time. If thisperiod of time was the same for every MS, then once a collision occurs between two MSs,it will continue to occur for every subsequent access attempt. Therefore the delay betweenaccess attempts is randomised to reduce the likelihood of collisions at the BTS. The MSwill always transmit access bursts on the RACH.
2.3. THE GSM RADIO INTERFACE 107
2.3.7 Mapping logical channels onto physical channels
The various logical channels described above may be combined in one of six different ways,before being mapped onto a single physical channel. The simplest mapping is the full-ratetraffic channel (TCH/F) and its SACCH. When combined these channels fit exactly intoa single physical channel. We note that the mapping between the TCH and the physicalchannel is the same regardless of whether the TCH is used to carry speech or user data. Asingle physical channel will also support two half-rate traffic channels (TCH/H) and theirSACCHs or eight SDCCHs and their associated SACCHs. The remaining three logicalchannel combinations are a little more complicated and these are explained below.
The basic broadcast and common control channel combination consists of a single FCCH,SCH and BCCH on the down-link, along with a full-rate PCH and a full-rate AGCH. Theup-link is entirely dedicated to the RACH, and for this reason we shall term this a full-rateRACH. This type of channel configuration is generally used in medium capacity or largecapacity cells where the access capacity of a full-rate PCH, AGCH and RACH channel isjustified. This control channel combination may only occur on time slot zero of a carrier.The carrier that supports these channels at a BTS is called the BCCH carrier and it will beunique within each cell, or sector, i.e. each BTS will only have one BCCH carrier.
In smaller capacity cells, i.e. cells with a smaller number of RF carriers, the capacity ofthe full-rate PCH, AGCH and RACH may not be justified. For this reason, a second combi-nation of the access channels is employed. The down-link continues to support an FCCH,SCH and BCCH; however, the rate of the down-link PCH and AGCH is reduced to aroundone-third of their full rate. The extra slots that have been created as a result of this rate re-duction on the down-link are used to support four SDCCHs and their associated SACCHs.The SDCCHs will also occupy a number of up-link slots and the number of timeslots al-located to the RACH on the up-link is reduced accordingly. This will effectively halve thenumber of time slots allocated to the RACH. Again, this control channel combination mayonly occur on time slot zero of the BCCH carrier.
The final control channel combination is defined for use in large capacity cells wherethe access capacity of a single PCH, AGCH and RACH is insufficient. This combinationconsists of a BCCH and a full-rate PCH and AGCH on the down-link and a full-rate RACHon the up-link. This channel combination may only occur on slot two, or slots two andfour, or slots two, four and six of the BCCH carrier. The reasons for this restriction willbe explained later when we examine the timing advance mechanism. We note that eachBTS must only transmit a single FCCH and SCH and, consequently, these channels are notincluded in the extension channel set. Each extension set contains its own BCCH for tworeasons. Firstly, the BCCH contains information that applies only to the RACH occupyingthe same time slot within the TDMA frame, and secondly, it is easier for the MS to monitorbursts occurring on the same physical channel.
108 CHAPTER 2. THE GSM SYSTEM
The various channel combinations described above are summarised in Table 2.16. Wenote that the CBCH has been omitted. If this channel is required it may replace a singleSDCCH.
2.3.8 The GSM frame structure
We have already described the basic TDMA frame structure employed in GSM, wherebyeach carrier supports eight timeslots, and a physical channel occupies one timeslot in eachframe. The TDMA frame represents the lowest layer in a complex hierarchical frame struc-ture. The next level in the GSM frame structure, above the TDMA frame, is the multiframewhich consists of 26 TDMA frames in the case of the full-rate and half-rate traffic channels,or 51 frames for all of the other logical channels.
The frame structure for a full-rate traffic channel (TCH/F) occupying time slot one in eachTDMA frame is shown in Figure 2.14. The first 12 time slots in each TDMA frame of themultiframe, i.e. zero to 11, are used by the TCH/F itself. The next time slot is not used fortransmission, and for this reason it is termed an ‘idle’ time slot. The next 12 timeslots ineach TDMA frame of the multiframe are used by the TCH/F, and the remaining timeslot inTDMA frame 26 is used by the SACCH. Figure 2.14 may be applied to both the up-link anddown-link by noting that there is an offset of three burst periods between the frame timingon the up-link and down-link. The traffic multiframe is exactly 120 ms in duration and thisdefines many of the time periods that are used in GSM, e.g. 1 TDMA frame = 120 ms/26� 4.615 ms. We note that the multiframe structure shown in Figure 2.14 only applies toa TCH/F occupying the odd-numbered time slots. On even-numbered time slots, and timeslot zero, the position of the idle and SACCH time slots are exchanged. To understandthe reason for this we need to examine the way the information is carried on SACCH. Wewill see later that the SACCH messages are interleaved over four bursts, which representa time period of four multiframes or 480 ms. This means that the BTS must receive fourSACCH bursts before the information can be successfully de-interleaved and decoded, i.e.the SACCH information can only be decoded once every four frames. If the SACCH burstsoccurred at the same point in the multiframe for each physical channel, then the SACCHmessages from every MS would arrive within the same TDMA frame and this would puta large processing load on the BSC. In order to spread the SACCH processing load moreevenly in time, the position of the SACCH bursts are changed from timeslot to timeslot andthe interleaving periods are also arranged such that the BTS will have to decode a maximumof one SACCH message per TDMA frame. This also gives the BSC a period of around 12TDMA frames to process the information in the SACCH message before another messagearrives from another MS using the same carrier but in a different timeslot.
The organisation of the half-rate traffic channel (TCH/H) is a little more complicatedthan the TCH/F. Figure 2.15 shows an example of the organisation of two half-rate traffic
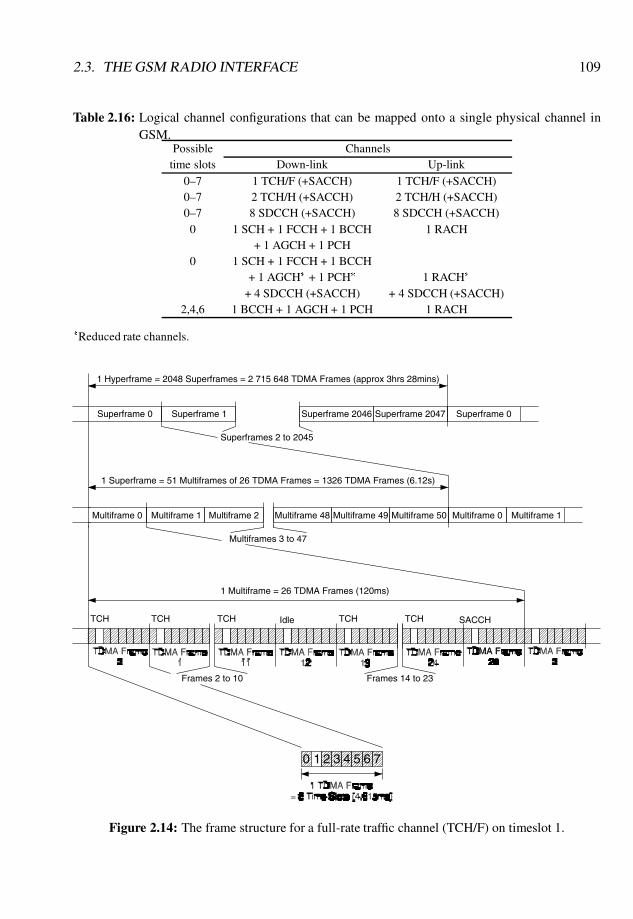
2.3. THE GSM RADIO INTERFACE 109
Table 2.16: Logical channel configurations that can be mapped onto a single physical channel inGSM.
Possible Channelstime slots Down-link Up-link
0–7 1 TCH/F (+SACCH) 1 TCH/F (+SACCH)0–7 2 TCH/H (+SACCH) 2 TCH/H (+SACCH)0–7 8 SDCCH (+SACCH) 8 SDCCH (+SACCH)
0 1 SCH + 1 FCCH + 1 BCCH 1 RACH+ 1 AGCH + 1 PCH
0 1 SCH + 1 FCCH + 1 BCCH+ 1 AGCH� + 1 PCH� 1 RACH�
+ 4 SDCCH (+SACCH) + 4 SDCCH (+SACCH)2,4,6 1 BCCH + 1 AGCH + 1 PCH 1 RACH
�Reduced rate channels.
0 1 2 3 4 5 6 7
Frames 2 to 10
Idle SACCH
Frames 14 to 23
1 Multiframe = 26 TDMA Frames (120ms)
TCH TCH TCH TCH TCH
Multiframe 0 Multiframe 1 Multiframe 2 Multiframe 50Multiframe 48 Multiframe 49 Multiframe 0 Multiframe 1
Multiframes 3 to 47
1 Superframe = 51 Multiframes of 26 TDMA Frames = 1326 TDMA Frames (6.12s)
1 Hyperframe = 2048 Superframes = 2 715 648 TDMA Frames (approx 3hrs 28mins)
Superframe 0
Superframes 2 to 2045
Superframe 1 Superframe 2047Superframe 2046 Superframe 0
Figure 2.14: The frame structure for a full-rate traffic channel (TCH/F) on timeslot 1.
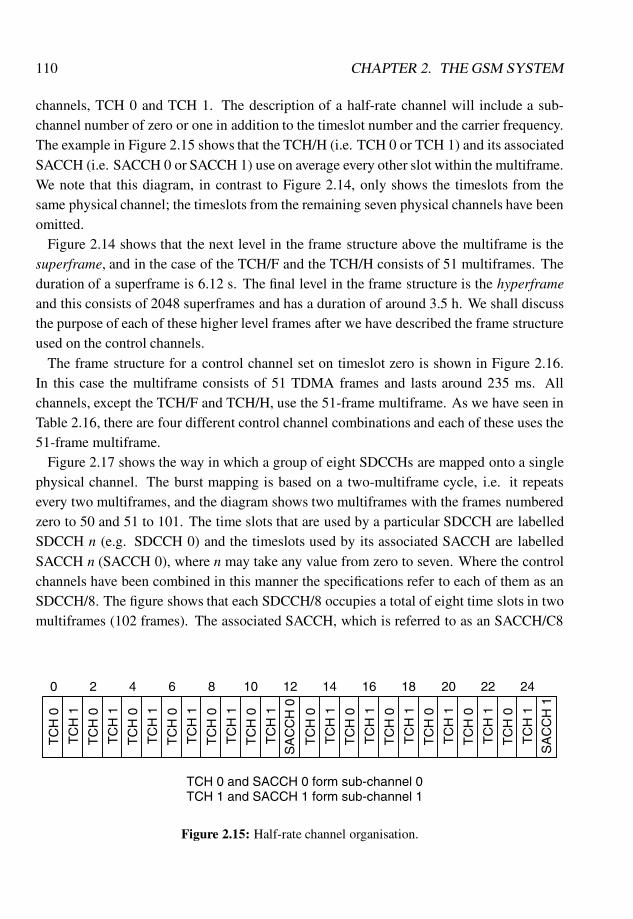
110 CHAPTER 2. THE GSM SYSTEM
channels, TCH 0 and TCH 1. The description of a half-rate channel will include a sub-channel number of zero or one in addition to the timeslot number and the carrier frequency.The example in Figure 2.15 shows that the TCH/H (i.e. TCH 0 or TCH 1) and its associatedSACCH (i.e. SACCH 0 or SACCH 1) use on average every other slot within the multiframe.We note that this diagram, in contrast to Figure 2.14, only shows the timeslots from thesame physical channel; the timeslots from the remaining seven physical channels have beenomitted.
Figure 2.14 shows that the next level in the frame structure above the multiframe is thesuperframe, and in the case of the TCH/F and the TCH/H consists of 51 multiframes. Theduration of a superframe is 6.12 s. The final level in the frame structure is the hyperframeand this consists of 2048 superframes and has a duration of around 3.5 h. We shall discussthe purpose of each of these higher level frames after we have described the frame structureused on the control channels.
The frame structure for a control channel set on timeslot zero is shown in Figure 2.16.In this case the multiframe consists of 51 TDMA frames and lasts around 235 ms. Allchannels, except the TCH/F and TCH/H, use the 51-frame multiframe. As we have seen inTable 2.16, there are four different control channel combinations and each of these uses the51-frame multiframe.
Figure 2.17 shows the way in which a group of eight SDCCHs are mapped onto a singlephysical channel. The burst mapping is based on a two-multiframe cycle, i.e. it repeatsevery two multiframes, and the diagram shows two multiframes with the frames numberedzero to 50 and 51 to 101. The time slots that are used by a particular SDCCH are labelledSDCCH n (e.g. SDCCH 0) and the timeslots used by its associated SACCH are labelledSACCH n (SACCH 0), where n may take any value from zero to seven. Where the controlchannels have been combined in this manner the specifications refer to each of them as anSDCCH/8. The figure shows that each SDCCH/8 occupies a total of eight time slots in twomultiframes (102 frames). The associated SACCH, which is referred to as an SACCH/C8
SA
CC
H 0
TC
H 0
TC
H 1
TCH 0 and SACCH 0 form sub-channel 0TCH 1 and SACCH 1 form sub-channel 1
0 2 4 6 8 1210 14 16 18 20 22 24
TC
H 0
TC
H 1
TC
H 0
TC
H 1
TC
H 0
TC
H 1
TC
H 0
TC
H 1
TC
H 0
TC
H 1
TC
H 0
TC
H 1
TC
H 0
TC
H 1
TC
H 0
TC
H 1
TC
H 0
TC
H 1
TC
H 0
TC
H 1
TC
H 0
TC
H 1
SA
CC
H 1
Figure 2.15: Half-rate channel organisation.

2.3. THE GSM RADIO INTERFACE 111
0 1 2 3 4 5 6 7
Frames 5 to 47
1 Multiframe = 51 TDMA Frames (approx 235ms)
Multiframe 0 Multiframe 1 Multiframe 2 Multiframe 25Multiframe 23 Multiframe 24 Multiframe 0 Multiframe 1
Multiframes 3 to 22
1 Superframe = 26 Multiframes of 51 TDMA Frames = 1326 TDMA Frames (6.12s)
1 Hyperframe = 2048 Superframes = 2 715 648 TDMA Frames (approx 3hrs 28mins)
Superframe 0
Superframes 2 to 2045
Superframe 1 Superframe 2047Superframe 2046 Superframe 0
Figure 2.16: The frame structure for a control channel group on timeslot 0.
in the specifications, occupies a further four timeslots in the same period. This means that8� 12 = 96 timeslots are occupied and the remaining six are left idle. Figure 2.17 showsthe situation for the down-link slots; the up-link configuration may be derived by shiftingeach slot 15 places to the right, i.e. SDCCH 0 will occupy slots 15 to 18 and slots 66 to 69and its associated SACCH will occupy slots 47 to 50 on the up-link. This control channelarrangement may be used on any time slot and any carrier, except timeslot zero of the BCCHcarrier.
Table 2.16 shows that there are three possible combinations of the broadcast and commonchannels. Figure 2.18 shows the manner in which each of these combinations is mappedonto the control channel multiframe. Figure 2.18(a) shows the basic control channel ar-rangement that would be present on time slot zero of the BCCH carrier. The down-linkmultiframe is subdivided into five groups of 10 time slots with a single idle slot at theend. The first timeslot of each of the groups is assigned to the FCCH and contains the
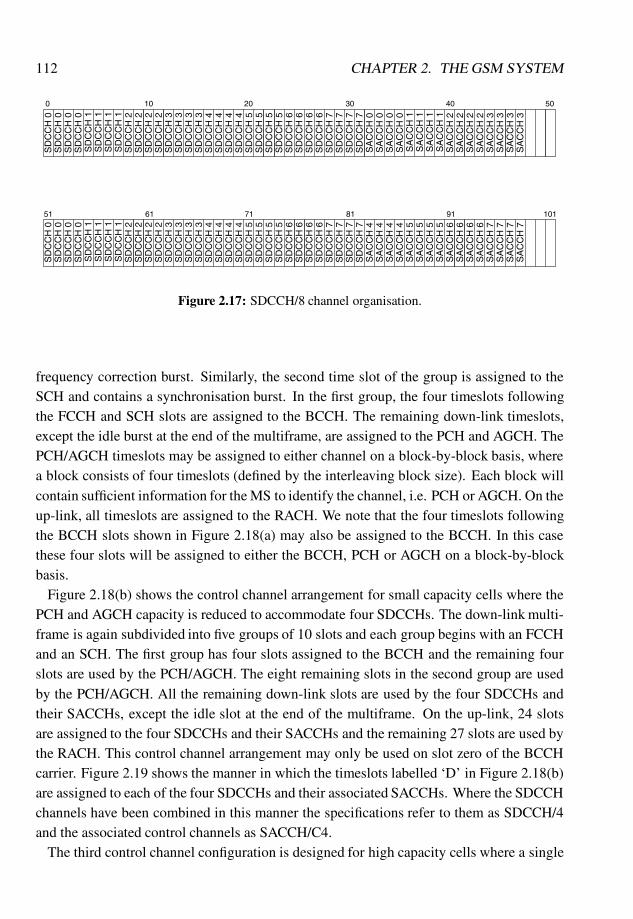
112 CHAPTER 2. THE GSM SYSTEM
SD
CC
H 0
3020100 40
SA
CC
H 0
50
51 61 71 81 91 101
SD
CC
H 0
SD
CC
H 0
SD
CC
H 0
SD
CC
H 1
SD
CC
H 1
SD
CC
H 1
SD
CC
H 1
SD
CC
H 2
SD
CC
H 2
SD
CC
H 2
SD
CC
H 2
SD
CC
H 3
SD
CC
H 3
SD
CC
H 3
SD
CC
H 3
SD
CC
H 4
SD
CC
H 4
SD
CC
H 4
SD
CC
H 4
SD
CC
H 5
SD
CC
H 5
SD
CC
H 5
SD
CC
H 5
SD
CC
H 6
SD
CC
H 6
SD
CC
H 6
SD
CC
H 6
SD
CC
H 7
SD
CC
H 7
SD
CC
H 7
SD
CC
H 7
SA
CC
H 0
SA
CC
H 0
SA
CC
H 0
SA
CC
H 1
SA
CC
H 1
SA
CC
H 1
SA
CC
H 1
SA
CC
H 2
SA
CC
H 2
SA
CC
H 2
SA
CC
H 2
SA
CC
H 3
SA
CC
H 3
SA
CC
H 3
SA
CC
H 3
SD
CC
H 6
SD
CC
H 2
SD
CC
H 2
SD
CC
H 1
SD
CC
H 1
SD
CC
H 1
SD
CC
H 1
SD
CC
H 0
SD
CC
H 0
SD
CC
H 0
SD
CC
H 0
SD
CC
H 6
SD
CC
H 5
SD
CC
H 5
SD
CC
H 5
SD
CC
H 5
SD
CC
H 4
SD
CC
H 4
SD
CC
H 4
SD
CC
H 4
SD
CC
H 3
SD
CC
H 3
SD
CC
H 3
SD
CC
H 3
SD
CC
H 2
SD
CC
H 2
SA
CC
H 6
SA
CC
H 5
SA
CC
H 4
SD
CC
H 7
SD
CC
H 7
SD
CC
H 7
SD
CC
H 7
SD
CC
H 6
SD
CC
H 6
SA
CC
H 7
SA
CC
H 4
SA
CC
H 4
SA
CC
H 4
SA
CC
H 5
SA
CC
H 5
SA
CC
H 5
SA
CC
H 6
SA
CC
H 6
SA
CC
H 6
SA
CC
H 7
SA
CC
H 7
SA
CC
H 7
Figure 2.17: SDCCH/8 channel organisation.
frequency correction burst. Similarly, the second time slot of the group is assigned to theSCH and contains a synchronisation burst. In the first group, the four timeslots followingthe FCCH and SCH slots are assigned to the BCCH. The remaining down-link timeslots,except the idle burst at the end of the multiframe, are assigned to the PCH and AGCH. ThePCH/AGCH timeslots may be assigned to either channel on a block-by-block basis, wherea block consists of four timeslots (defined by the interleaving block size). Each block willcontain sufficient information for the MS to identify the channel, i.e. PCH or AGCH. On theup-link, all timeslots are assigned to the RACH. We note that the four timeslots followingthe BCCH slots shown in Figure 2.18(a) may also be assigned to the BCCH. In this casethese four slots will be assigned to either the BCCH, PCH or AGCH on a block-by-blockbasis.
Figure 2.18(b) shows the control channel arrangement for small capacity cells where thePCH and AGCH capacity is reduced to accommodate four SDCCHs. The down-link multi-frame is again subdivided into five groups of 10 slots and each group begins with an FCCHand an SCH. The first group has four slots assigned to the BCCH and the remaining fourslots are used by the PCH/AGCH. The eight remaining slots in the second group are usedby the PCH/AGCH. All the remaining down-link slots are used by the four SDCCHs andtheir SACCHs, except the idle slot at the end of the multiframe. On the up-link, 24 slotsare assigned to the four SDCCHs and their SACCHs and the remaining 27 slots are used bythe RACH. This control channel arrangement may only be used on slot zero of the BCCHcarrier. Figure 2.19 shows the manner in which the timeslots labelled ‘D’ in Figure 2.18(b)are assigned to each of the four SDCCHs and their associated SACCHs. Where the SDCCHchannels have been combined in this manner the specifications refer to them as SDCCH/4and the associated control channels as SACCH/C4.
The third control channel configuration is designed for high capacity cells where a single
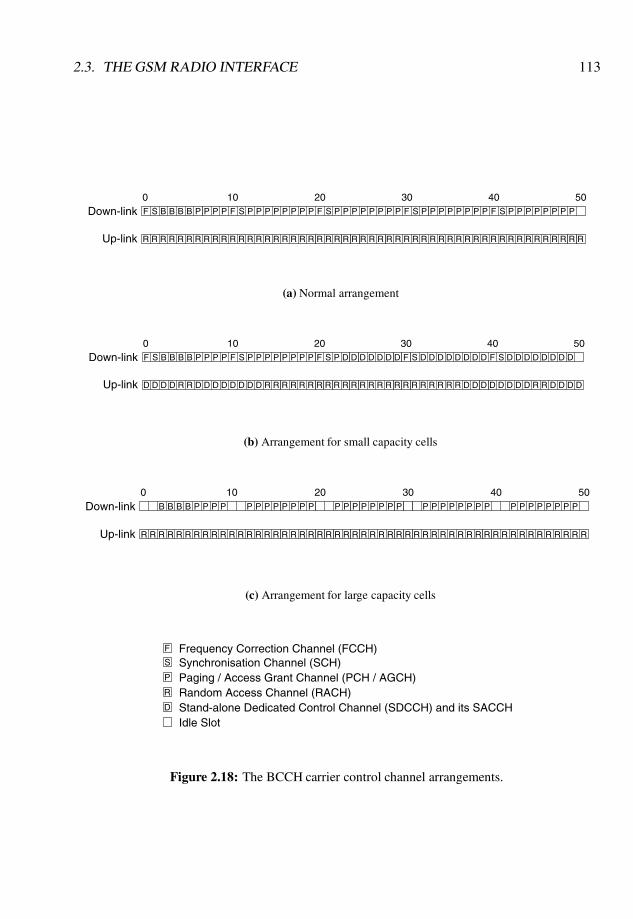
2.3. THE GSM RADIO INTERFACE 113
F S B B B B P P P P F S PP P PP P P P F PPS P P P P PP F PPS P P PP P P PF S P P PP P P P
0 10 20 30 40 50Down-link
Up-link RR RR RR R R RR R R RR R R RR R R RR R RR RRR RR RR RR RR RRR RR RRR RR R R RR R
(a) Normal arrangement
Up-link DD D D DRR DD DDD DD RRR RR
Down-link SF BB
0PBB PP SFP PP
10PPP PP
RRR RR RRR RR RR R RR RR R DD DD D D D RD R D D D D
SFP DP
20DDD DD SD F DD
30DD D DD SD F D D
40DDD D D D
50
(b) Arrangement for small capacity cells
Down-link
Up-link RR R R RRR R R
0BB PBB PP
RRR R R RRR R R
10P PP PPP PP
RRR R R RRR R R
20P PP PPP PP
RRR R R RRR R R
30P PP PP P PP
RRR R R RRR R R
40P P P PPP P P
RR
50P
(c) Arrangement for large capacity cells
F Frequency Correction Channel (FCCH)S Synchronisation Channel (SCH)P Paging / Access Grant Channel (PCH / AGCH)R Random Access Channel (RACH)D Stand-alone Dedicated Control Channel (SDCCH) and its SACCH
Idle Slot
Figure 2.18: The BCCH carrier control channel arrangements.
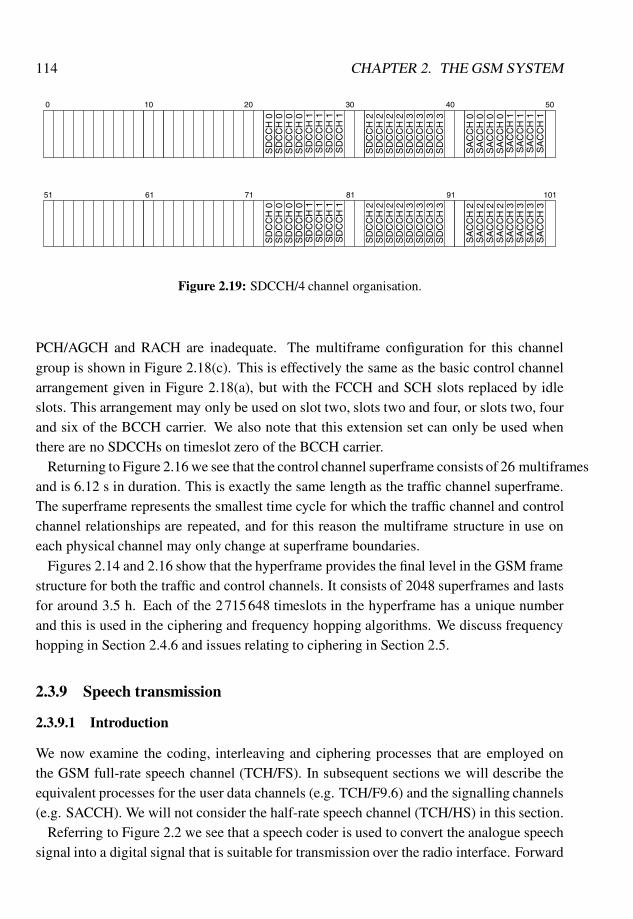
114 CHAPTER 2. THE GSM SYSTEM
SD
CC
H 0
3020100 40
SA
CC
H 0
50
51 7161 9181 101
SD
CC
H 0
SD
CC
H 0
SD
CC
H 0
SD
CC
H 1
SD
CC
H 1
SD
CC
H 1
SD
CC
H 1
SD
CC
H 2
SD
CC
H 2
SD
CC
H 2
SD
CC
H 2
SD
CC
H 3
SD
CC
H 3
SD
CC
H 3
SD
CC
H 3
SA
CC
H 0
SA
CC
H 0
SA
CC
H 0
SA
CC
H 1
SA
CC
H 1
SA
CC
H 1
SA
CC
H 1
SD
CC
H 0
SD
CC
H 0
SD
CC
H 0
SD
CC
H 0
SD
CC
H 3
SD
CC
H 3
SD
CC
H 3
SD
CC
H 3
SD
CC
H 2
SD
CC
H 2
SD
CC
H 2
SD
CC
H 2
SD
CC
H 1
SD
CC
H 1
SD
CC
H 1
SD
CC
H 1
SA
CC
H 3
SA
CC
H 3
SA
CC
H 3
SA
CC
H 3
SA
CC
H 2
SA
CC
H 2
SA
CC
H 2
SA
CC
H 2
Figure 2.19: SDCCH/4 channel organisation.
PCH/AGCH and RACH are inadequate. The multiframe configuration for this channelgroup is shown in Figure 2.18(c). This is effectively the same as the basic control channelarrangement given in Figure 2.18(a), but with the FCCH and SCH slots replaced by idleslots. This arrangement may only be used on slot two, slots two and four, or slots two, fourand six of the BCCH carrier. We also note that this extension set can only be used whenthere are no SDCCHs on timeslot zero of the BCCH carrier.
Returning to Figure 2.16 we see that the control channel superframe consists of 26 multiframesand is 6.12 s in duration. This is exactly the same length as the traffic channel superframe.The superframe represents the smallest time cycle for which the traffic channel and controlchannel relationships are repeated, and for this reason the multiframe structure in use oneach physical channel may only change at superframe boundaries.
Figures 2.14 and 2.16 show that the hyperframe provides the final level in the GSM framestructure for both the traffic and control channels. It consists of 2048 superframes and lastsfor around 3.5 h. Each of the 2715648 timeslots in the hyperframe has a unique numberand this is used in the ciphering and frequency hopping algorithms. We discuss frequencyhopping in Section 2.4.6 and issues relating to ciphering in Section 2.5.
2.3.9 Speech transmission
2.3.9.1 Introduction
We now examine the coding, interleaving and ciphering processes that are employed onthe GSM full-rate speech channel (TCH/FS). In subsequent sections we will describe theequivalent processes for the user data channels (e.g. TCH/F9.6) and the signalling channels(e.g. SACCH). We will not consider the half-rate speech channel (TCH/HS) in this section.
Referring to Figure 2.2 we see that a speech coder is used to convert the analogue speechsignal into a digital signal that is suitable for transmission over the radio interface. Forward
2.3. THE GSM RADIO INTERFACE 115
error correction (FEC) coding is then applied to the speech data to allow all or some of thetransmission errors to be corrected at the receiver. The FEC-coded data are interleaved andciphered before being assembled into bursts ready for transmission over the radio interface.Following the equalisation and demodulation process at the receiver, the recovered data isdeciphered, de-interleaved and channel decoded to remove as many transmission errors aspossible. The data are then passed to the speech decoder where it is converted back intoan analogue speech signal. It is important to note that the basic link shown in Figure 2.2may be applied to both the up-link (i.e. an MS transmitter and a BTS receiver) and thedown-link (i.e. a BTS transmitter and an MS receiver). We will now examine each of thecoding, interleaving and ciphering processes in more detail.
2.3.9.2 Speech coding
In any wide area cellular system, such as GSM, the radio spectrum is a scarce resource andit must be used in an efficient manner. In the case of speech transmission this imposes therequirement that the speech information must be transferred over the radio interface using aslow a data rate as possible whilst maintaining a satisfactory speech quality. This means thatwaveform encoders, such as the 32 kb/s adaptive differential pulse code modulation (AD-PCM) coder used in the digitally enhanced cordless telecommunication (DECT) system, areunsuitable for GSM because of their relatively high bit rate requirements. The transmissionof toll quality speech at data rates below 16 kb/s calls for highly complex speech coderswhich use digital filters to model the characteristics of the vocal production apparatus. Thespeech information is conveyed by transmitting the filter coefficients of the vocal tract andan excitation sequence which allows the speech to be reconstructed at the receiver. A fullexplanation of the GSM speech coder is beyond the scope of this book and the reader is re-ferred to Steele [4] for a detailed discussion of analysis-by-synthesis predictive coding anda comprehensive description of the full-rate GSM coder. In this section we will examine thebasic principles of the GSM full-rate coder and highlight its main features.
At an MS, the user’s acoustic pressure signal is converted into an analogue electricalsignal using a microphone. The electrical signal is sampled at 8 kHz and each sample isconverted into a 13-bit digital representation using a uniform analogue-to-digital conver-sion. Following this conversion process the signal is passed to the GSM speech coder. Onthe network side the situation is slightly more complicated because speech signals are usu-ally coded using an eight-bit A-law pulse code modulation (PCM) format in order to becompatible with the PSTN/ISDN. This means that, before the speech signal is passed to thespeech coder on the network side, it must first undergo an eight-bit A-law PCM to 13-bituniform PCM conversion.
The GSM coder belongs to the family of regular pulse excited (RPE) linear predictivecodecs (LPC). It also employs long-term prediction (LTP) in addition to the conventional
116 CHAPTER 2. THE GSM SYSTEM
short-term prediction (STP) and accordingly it is called an RPE-LTP speech coder. AnRPE-LTP encoder can be divided into four parts: pre-processing, STP analysis filtering,LTP analysis filtering and RPE computation. We will now briefly examine each of theseprocesses.
Pre-processing The sampled speech signal is initially passed through a notch filter toremove any dc offsets that may be present and passed through a first-order finite impulseresponse (FIR) pre-emphasis filter. The pre-emphasis filter is used to emphasise the lowpower, high frequency part of the speech spectrum and this provides better numerical preci-sion in the subsequent computations. The speech signal is then divided into non-overlappingframes consisting of 160 samples, each having a duration of 20 ms.
STP analysis filtering Speech data inherently contain a high level of redundancy and thismeans that it is possible to predict a future speech sample from previous speech samples.In mathematical terms we can say that a speech sample may be approximated as the linearcombination of a number of past speech samples (e.g. 8–16 samples) such that the predictedspeech sample at an instant n is given by
s(n) =p
∑k=1
aks(n�k); (2.23)
where ak are the predictor coefficients, s(n) is the speech sample at sampling instant n andp is the number of predictor coefficients or the predictor order. The prediction error, e(n),is defined as
e(n) = s(n)� s(n)
= s(n)�p
∑k=1
aks(n�k): (2.24)
Taking the z-transform of Equation (2.24) gives
E(z) = S(z)A(z); (2.25)
where
A(z) = 1�p
∑k=1
akz�k: (2.26)
The coefficients ak are computed by minimising the mean-squared error over a 20 ms seg-ment of the speech waveform. The inverse of A(z), i.e. H(z) = 1=A(z), is an all-pole digitalfilter which models the spectral envelope of the speech waveform.
In practice, the predictor coefficients, ak, are not calculated directly, but instead, a num-ber of reflection coefficients are derived from the autocorrelation coefficients of the speech
2.3. THE GSM RADIO INTERFACE 117
block. Uniform quantisation of the reflection coefficients is inefficient and, for this reason,they are transformed into another set of coefficients known as log area ratios (LARs). Thereare eight LARs per 20 ms speech block and they are quantised using six bits for LAR(1) andLAR(2), five bits for LAR(3) and LAR(4), four bits for LAR(5) and LAR(6) and three bitsfor LAR(7) and LAR(8), which results in 36 bits per speech block. These bit allocations aredetermined according to the dynamic range and the distribution of the LAR values.
LTP analysis filtering Filtering the speech signal using the inverse filter, A(z), tends toremove much of the redundancy by subtracting from each speech sample its predicted valueusing the past p samples. The resulting signal is known as the short-term prediction residualand it will generally exhibit a certain amount of periodicity related to the pitch period of theoriginal speech when it is voiced. This periodicity represents a further level of redundancywhich can be removed using a pitch predictor or a long-term predictor. The general form ofthe long-term predictor filter is given by
1P(z)
=1
1�Pl(z); (2.27)
where
Pl(z) =m2
∑k=�m1
Gkz�(α+k) (2.28)
is the long-term predictor, m1 and m2 determine the number of predictor taps, α is the LTPdelay and Gk is the LTP gain. In the case of the GSM full-rate speech coder, m1 = m2 = 0,resulting in a single-tap predictor. The parameters α and G0 are determined by minimisingthe mean-squared residual error after both short-term and long-term prediction over a periodof 40 samples, i.e. 5 ms. For the single-tap predictor, this residual error, e(n), at an instantn, is given by
e(n) = r(n)�Gr(n�α); (2.29)
where r(n) is the residual that is produced following the short-term prediction. The mean-squared residual, E, is given by
E =39
∑n=0
e2(n) =39
∑n=0
[r(n)�Gr(n�α)]2: (2.30)
The parameters G and α are quantised and coded using two and seven bits, respectively,resulting in nine bits per 5 ms sub-block and 36 bits per 20 ms block.
RPE computation Removing the redundancy from the speech signal produces a residualsignal. In the speech decoder this residual is used to excite the reconstructed LTP and STPfilters. The GSM system uses the regular pulse excited (RPE) approach to encode this
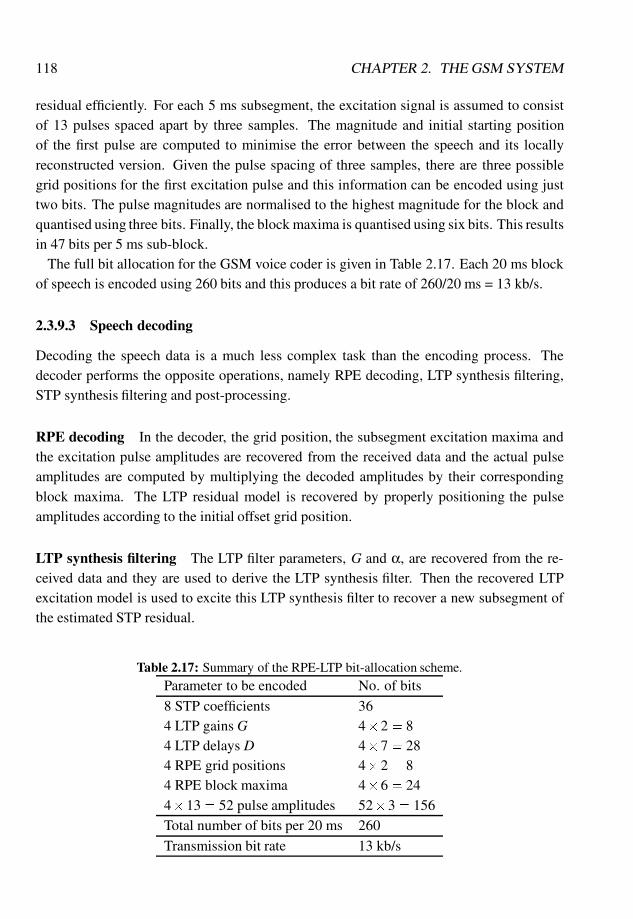
118 CHAPTER 2. THE GSM SYSTEM
residual efficiently. For each 5 ms subsegment, the excitation signal is assumed to consistof 13 pulses spaced apart by three samples. The magnitude and initial starting positionof the first pulse are computed to minimise the error between the speech and its locallyreconstructed version. Given the pulse spacing of three samples, there are three possiblegrid positions for the first excitation pulse and this information can be encoded using justtwo bits. The pulse magnitudes are normalised to the highest magnitude for the block andquantised using three bits. Finally, the block maxima is quantised using six bits. This resultsin 47 bits per 5 ms sub-block.
The full bit allocation for the GSM voice coder is given in Table 2.17. Each 20 ms blockof speech is encoded using 260 bits and this produces a bit rate of 260/20 ms = 13 kb/s.
2.3.9.3 Speech decoding
Decoding the speech data is a much less complex task than the encoding process. Thedecoder performs the opposite operations, namely RPE decoding, LTP synthesis filtering,STP synthesis filtering and post-processing.
RPE decoding In the decoder, the grid position, the subsegment excitation maxima andthe excitation pulse amplitudes are recovered from the received data and the actual pulseamplitudes are computed by multiplying the decoded amplitudes by their correspondingblock maxima. The LTP residual model is recovered by properly positioning the pulseamplitudes according to the initial offset grid position.
LTP synthesis filtering The LTP filter parameters, G and α, are recovered from the re-ceived data and they are used to derive the LTP synthesis filter. Then the recovered LTPexcitation model is used to excite this LTP synthesis filter to recover a new subsegment ofthe estimated STP residual.
Table 2.17: Summary of the RPE-LTP bit-allocation scheme.Parameter to be encoded No. of bits
8 STP coefficients 364 LTP gains G 4�2 = 84 LTP delays D 4�7 = 284 RPE grid positions 4�2 = 84 RPE block maxima 4�6 = 244�13= 52 pulse amplitudes 52�3 = 156Total number of bits per 20 ms 260
Transmission bit rate 13 kb/s
2.3. THE GSM RADIO INTERFACE 119
STP synthesis filtering The STP filter is reconstructed and excited by the reconstructedSTP residual signal to regenerate the speech.
Post-processing The speech signal is de-emphasised using the inverse of the pre-emphasisfilter employed in the encoding.
The data bits produced by the speech coder will each have a different impact on the speechsignal if they are received in error. For this reason, each bit is ranked in order of importanceand forward error correction is applied accordingly. In GSM the most important bits areprotected by a parity check and a powerful half-rate convolutional code, whereas the leastimportant bits are left unprotected. The specifications define three classes of bits, based onsubjective testing, and these are termed Class Ia, Class Ib and Class II. The Class Ia bitsare the most important and receive the most protection. In fact, if an error is detected in theClass Ia bits, then the entire speech frame is discarded and interpolation techniques are usedto reconstruct the speech from the frames on either side of the discarded block. The ClassIb bits are slightly less important and receive correspondingly less protection. The Class IIbits are the least important and they are transmitted unprotected.
2.3.9.4 Voice activity detection
During a typical telephone conversation, a person will generally speak for around 40% ofthe time and remain silent for the other 60%. The interference levels may be reduced andthe MS battery recharging cycle increased by turning the transmitter off during periodsof silence. This technique is known as discontinuous transmission (DTX) and relies onthe accurate detection of periods of silence in the user’s speech. This is achieved usingvoice activity detection (VAD) where the energy in the speech signal is computed for eachspeech block and a decision is made using an adaptive threshold as to whether the blockcontains speech or background noise. It is important that the system quickly recognises thebeginning of a talk spurt to prevent initial talk spurt clipping. In addition, a hangover delayis incorporated at the end of a talk spurt to prevent clipping occurring. The hangover delayof four speech frames (80 ms) also prevents the VAD system from reacting to very shortperiods of silence, e.g. between syllables or within a word.
Subjectively, the periods of complete silence introduced by the DTX process at the re-ceiver are annoying since they give the impression that the link has been lost. It was foundthat this situation could be improved by inserting ‘comfort noise’ to fill the periods of si-lence. The comfort noise is derived from the spectral envelope of the background noiseusing the LARs and it is conveyed in the form of a silence descriptor frame (SID). The SIDis the same size as a speech frame and is updated once every four multiframes, i.e. every480 ms.
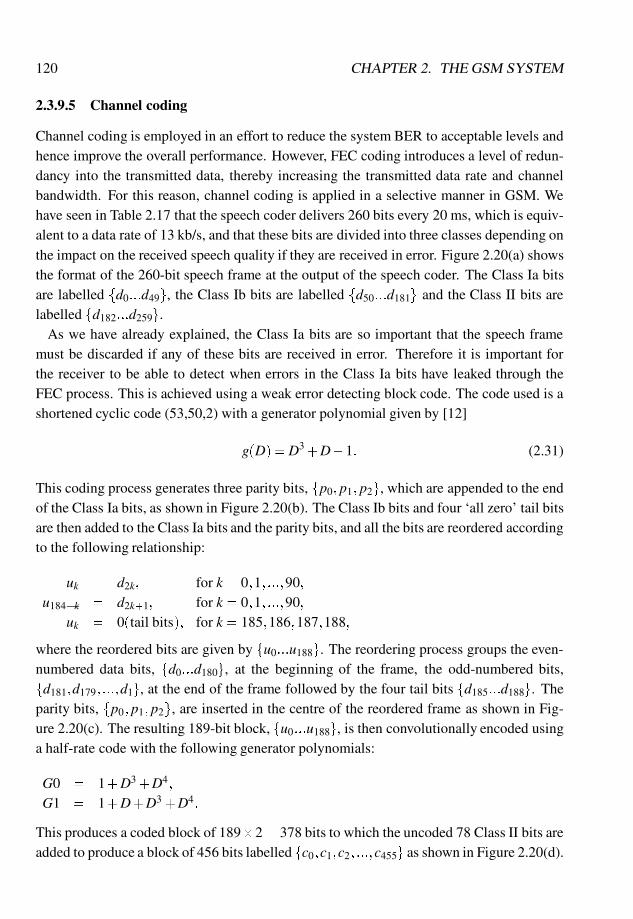
120 CHAPTER 2. THE GSM SYSTEM
2.3.9.5 Channel coding
Channel coding is employed in an effort to reduce the system BER to acceptable levels andhence improve the overall performance. However, FEC coding introduces a level of redun-dancy into the transmitted data, thereby increasing the transmitted data rate and channelbandwidth. For this reason, channel coding is applied in a selective manner in GSM. Wehave seen in Table 2.17 that the speech coder delivers 260 bits every 20 ms, which is equiv-alent to a data rate of 13 kb/s, and that these bits are divided into three classes depending onthe impact on the received speech quality if they are received in error. Figure 2.20(a) showsthe format of the 260-bit speech frame at the output of the speech coder. The Class Ia bitsare labelled fd0:::d49g, the Class Ib bits are labelled fd50:::d181g and the Class II bits arelabelled fd182:::d259g.
As we have already explained, the Class Ia bits are so important that the speech framemust be discarded if any of these bits are received in error. Therefore it is important forthe receiver to be able to detect when errors in the Class Ia bits have leaked through theFEC process. This is achieved using a weak error detecting block code. The code used is ashortened cyclic code (53,50,2) with a generator polynomial given by [12]
g(D) = D3+D+1: (2.31)
This coding process generates three parity bits, fp0; p1; p2g, which are appended to the endof the Class Ia bits, as shown in Figure 2.20(b). The Class Ib bits and four ‘all zero’ tail bitsare then added to the Class Ia bits and the parity bits, and all the bits are reordered accordingto the following relationship:
uk = d2k; for k = 0;1; :::;90;
u184�k = d2k+1; for k = 0;1; :::;90;
uk = 0(tail bits); for k = 185;186;187;188;
where the reordered bits are given by fu0:::u188g. The reordering process groups the even-numbered data bits, fd0:::d180g, at the beginning of the frame, the odd-numbered bits,fd181;d179; :::;d1g, at the end of the frame followed by the four tail bits fd185:::d188g. Theparity bits, fp0; p1; p2g, are inserted in the centre of the reordered frame as shown in Fig-ure 2.20(c). The resulting 189-bit block, fu0:::u188g, is then convolutionally encoded usinga half-rate code with the following generator polynomials:
G0 = 1+D3+D4;
G1 = 1+D+D3 +D4:
This produces a coded block of 189�2= 378 bits to which the uncoded 78 Class II bits areadded to produce a block of 456 bits labelled fc0;c1;c2; :::;c455g as shown in Figure 2.20(d).

2.3. THE GSM RADIO INTERFACE 121
1 Speech Frame = 260 bits = 20ms
d ---d 0 49 d ----------------------d 50 181 d --------d 259182
(a) The GSM speech frame
d 259182d
Class II bits
181
Class Ib bits
50d dd
Class Ia bits
0 d 49 0p 1p 2p
Parity bits
(b) The addition of the parity bits
d 0 0p 1p 2p2d 178d 180d 181d d 179 3d 1d 0 0 0 0 182 259dd
0u 1u 89u 90u 91u 92u 93u 94u 95u u 184 u 185 u 186 u 187 u 188u 183
(c) The bit reordering process
0c 377c 455c378c
(d) The FEC coded speech frame
Figure 2.20: The FEC coding process for the full-rate GSM speech frame.
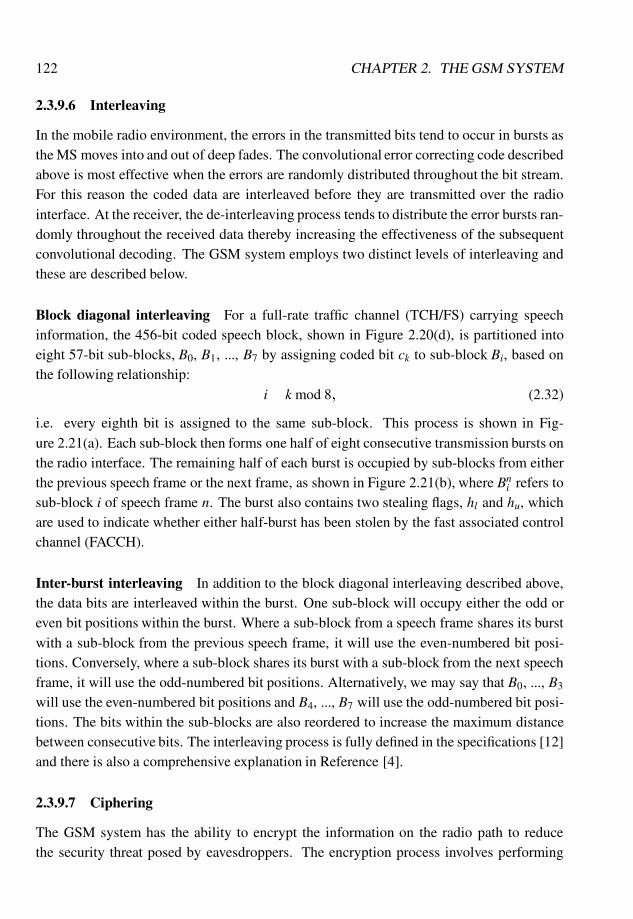
122 CHAPTER 2. THE GSM SYSTEM
2.3.9.6 Interleaving
In the mobile radio environment, the errors in the transmitted bits tend to occur in bursts asthe MS moves into and out of deep fades. The convolutional error correcting code describedabove is most effective when the errors are randomly distributed throughout the bit stream.For this reason the coded data are interleaved before they are transmitted over the radiointerface. At the receiver, the de-interleaving process tends to distribute the error bursts ran-domly throughout the received data thereby increasing the effectiveness of the subsequentconvolutional decoding. The GSM system employs two distinct levels of interleaving andthese are described below.
Block diagonal interleaving For a full-rate traffic channel (TCH/FS) carrying speechinformation, the 456-bit coded speech block, shown in Figure 2.20(d), is partitioned intoeight 57-bit sub-blocks, B0, B1, ..., B7 by assigning coded bit ck to sub-block Bi, based onthe following relationship:
i= k mod 8; (2.32)
i.e. every eighth bit is assigned to the same sub-block. This process is shown in Fig-ure 2.21(a). Each sub-block then forms one half of eight consecutive transmission bursts onthe radio interface. The remaining half of each burst is occupied by sub-blocks from eitherthe previous speech frame or the next frame, as shown in Figure 2.21(b), where Bn
i refers tosub-block i of speech frame n. The burst also contains two stealing flags, hl and hu, whichare used to indicate whether either half-burst has been stolen by the fast associated controlchannel (FACCH).
Inter-burst interleaving In addition to the block diagonal interleaving described above,the data bits are interleaved within the burst. One sub-block will occupy either the odd oreven bit positions within the burst. Where a sub-block from a speech frame shares its burstwith a sub-block from the previous speech frame, it will use the even-numbered bit posi-tions. Conversely, where a sub-block shares its burst with a sub-block from the next speechframe, it will use the odd-numbered bit positions. Alternatively, we may say that B0, ..., B3
will use the even-numbered bit positions and B4, ..., B7 will use the odd-numbered bit posi-tions. The bits within the sub-blocks are also reordered to increase the maximum distancebetween consecutive bits. The interleaving process is fully defined in the specifications [12]and there is also a comprehensive explanation in Reference [4].
2.3.9.7 Ciphering
The GSM system has the ability to encrypt the information on the radio path to reducethe security threat posed by eavesdroppers. The encryption process involves performing
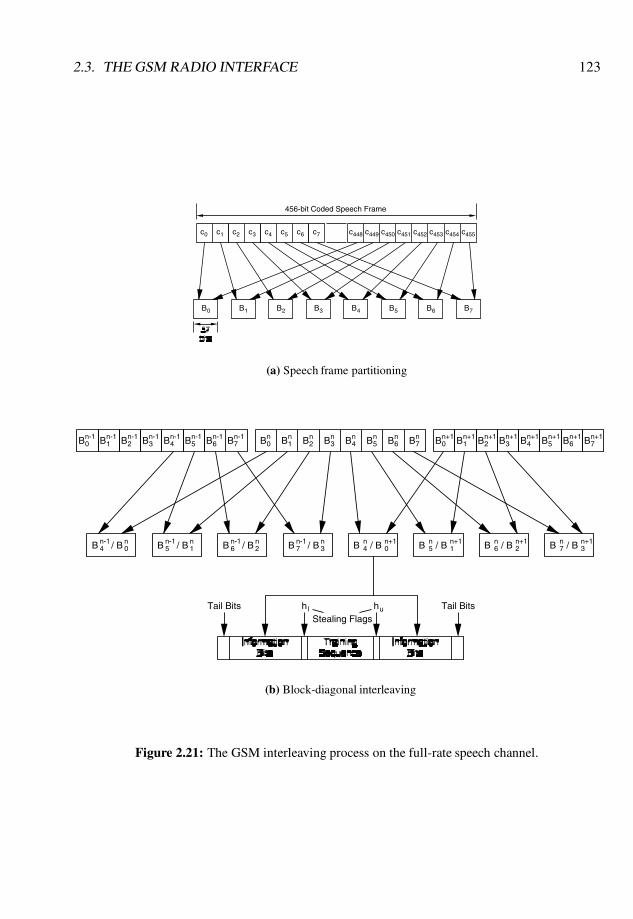
2.3. THE GSM RADIO INTERFACE 123
c0 c448
B0 1B 2B 4B3B 5B 7B6B
c1 c2 3c 6c4 5c c 7c 449c 450c 451c 452c 453c 454c 455c
456-bit Coded Speech Frame
(a) Speech frame partitioning
B0n+1
1Bn+12Bn+1
3Bn+14Bn+1
5Bn+16Bn+1 B7
n+17Bn
6Bn5Bn
4Bn3Bn
2Bn1Bn
0Bn7654321 BBBBBBn-1 n-1 n-1 n-1n-1n-1 n-1B0Bn-1
lh
B / B 7n-1
3n
26B / B n-1 n4 0B / B n+1n
15n-1B / B n
04n-1B / B n B / B 5
n1n+1 B / B 6
n2n+1 B / B 7
n3n+1
uhTail Bits Tail BitsStealing Flags
(b) Block-diagonal interleaving
Figure 2.21: The GSM interleaving process on the full-rate speech channel.
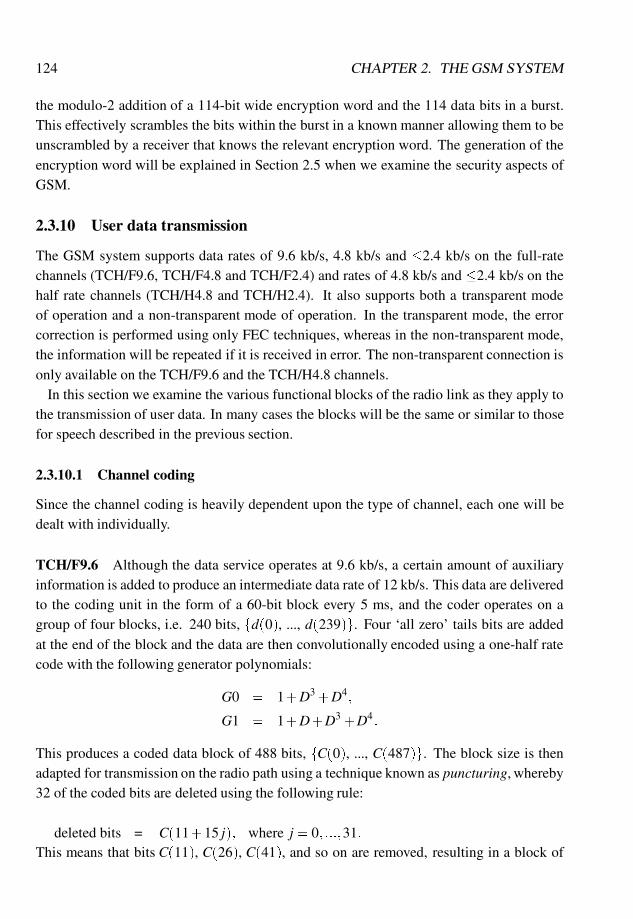
124 CHAPTER 2. THE GSM SYSTEM
the modulo-2 addition of a 114-bit wide encryption word and the 114 data bits in a burst.This effectively scrambles the bits within the burst in a known manner allowing them to beunscrambled by a receiver that knows the relevant encryption word. The generation of theencryption word will be explained in Section 2.5 when we examine the security aspects ofGSM.
2.3.10 User data transmission
The GSM system supports data rates of 9.6 kb/s, 4.8 kb/s and �2.4 kb/s on the full-ratechannels (TCH/F9.6, TCH/F4.8 and TCH/F2.4) and rates of 4.8 kb/s and �2.4 kb/s on thehalf rate channels (TCH/H4.8 and TCH/H2.4). It also supports both a transparent modeof operation and a non-transparent mode of operation. In the transparent mode, the errorcorrection is performed using only FEC techniques, whereas in the non-transparent mode,the information will be repeated if it is received in error. The non-transparent connection isonly available on the TCH/F9.6 and the TCH/H4.8 channels.
In this section we examine the various functional blocks of the radio link as they apply tothe transmission of user data. In many cases the blocks will be the same or similar to thosefor speech described in the previous section.
2.3.10.1 Channel coding
Since the channel coding is heavily dependent upon the type of channel, each one will bedealt with individually.
TCH/F9.6 Although the data service operates at 9.6 kb/s, a certain amount of auxiliaryinformation is added to produce an intermediate data rate of 12 kb/s. This data are deliveredto the coding unit in the form of a 60-bit block every 5 ms, and the coder operates on agroup of four blocks, i.e. 240 bits, fd(0), ..., d(239)g. Four ‘all zero’ tails bits are addedat the end of the block and the data are then convolutionally encoded using a one-half ratecode with the following generator polynomials:
G0 = 1+D3 +D4;
G1 = 1+D+D3 +D4:
This produces a coded data block of 488 bits, fC(0), ..., C(487)g. The block size is thenadapted for transmission on the radio path using a technique known as puncturing, whereby32 of the coded bits are deleted using the following rule:
deleted bits = C(11+15 j); where j = 0; :::;31:
This means that bits C(11), C(26), C(41), and so on are removed, resulting in a block of
2.3. THE GSM RADIO INTERFACE 125
456 bits, fc(0), ..., c(455)g. Puncturing is used to precisely tailor the rate of a convolutionalcode to the requirements of a transmission link. At the receiver, the convolutional decoderwill effectively treat the deleted bits as errors and they will be corrected in the conventionalway within the Viterbi decoder.
TCH/F4.8 The data are delivered to the coding unit at an intermediate bit rate of 6 kb/s,or to be more precise, one 60-bit block every 10 ms. Each block is extended to 76 bits bythe addition of 16 all zero bits, which are inserted in blocks of four, once every 15 bits. Twoof these blocks are then concatenated to form a single 152-bit block which is one-third rateconvolutionally encoded using the following generator polynomials:
G1 = 1+D+D3 +D4;
G2 = 1+D2 +D4;
G3 = 1+D+D2 +D3 +D4:
This results in a coded block of 456 bits.
TCH/H4.8 The data are delivered to the coding unit in blocks of 60 information bits every10 ms, i.e. 6 kb/s. Four of these blocks are grouped together to produce a block of 240 bits.The subsequent coding processes are identical to those described for the TCH/F9.6 channelabove.
TCH/F2.4 The data are delivered to the coding unit at an intermediate bit rate of 3.6 kb/sin the form of 36-bit blocks every 10 ms. The coding unit operates on blocks of 72 bitsformed by the concatenation of two 36-bit blocks. Initially four all zero tail bits are addedat the end of the block to produce a block of 76 bits. This block is then one-sixth rateconvolutionally encoded using the following generator polynomials:
G1 = 1+D+D3 +D4;
G2 = 1+D2 +D4;
G3 = 1+D+D2 +D3 +D4;
G1 = 1+D+D3 +D4;
G2 = 1+D2 +D4;
G3 = 1+D+D2 +D3 +D4:
This results in a coded data block of 456 bits.
TCH/H2.4 The information data are delivered to the coding unit at a rate of 3.6 kb/s inthe form of one 36-bit block every 10 ms. Two blocks are concatenated to form a single72-bit block and each block is expanded by the addition of four all zero tail bits at the end ofthe block. Two of these 76-bit blocks are then concatenated to form a single 152-bit blockfor the purposes of channel coding. This block is one-third rate convolutionally encoded
126 CHAPTER 2. THE GSM SYSTEM
to produce a coded data block of 456 bits using the convolutional code specified for theTCH/F4.8 channel.
2.3.10.2 Interleaving
The interleaving process may be partitioned into two levels: block diagonal and inter-burstinterleaving. The TCH/H2.4 channel uses the same interleaving scheme as the TCH/FSdescribed above. The remaining channels use a complex interleaving scheme which isdescribed below for the TCH/F9.6 channel.
We recall that the convolutional encoding process results in a 456-bit block after punc-turing. Since a data channel can, in general, accept a greater overall end-to-end delay thana speech channel, the block diagonal interleaving depth is increased to 22 bursts, therebyincreasing the system’s ability to randomise burst errors. Unfortunately, 456 bits cannotbe evenly divided between 22 bursts so, consequently, the interleaving scheme becomescomplex. The specifications present two different ways of viewing the block interleavingprocess [12].
1. The 456-bit block is sub-divided into four 114-bit sub-blocks, each of which is evenlydistributed over 19 bursts with six bits in each. The sub-blocks are block diagonallyinterleaved with a shift of one burst between each sub-block.
2. The 456-bit block is sub-divided into two blocks of six bits, which are placed in bursts0 and 21; two blocks of 12 bits, which are placed in bursts 1 and 20; two blocks of 18bits, which are placed in bursts 2 and 19; and 16 blocks of 24 bits, which are placedin bursts 3 to 18. Therefore, each 456-bit block is interleaved over 22 bursts. The datablocks are also diagonally interleaved with a new data block beginning every fourthburst.
We also note that the data bits are reordered within each burst [12].
2.3.10.3 Ciphering
The bursts are encrypted in the same manner as that described in the previous section forthe full-rate speech traffic channel.
2.3.11 Control data transmission
In this section we examine the channel coding and interleaving processes that are performedon the control data transferred between the MS and the network. Each logical control chan-nel will be dealt with separately. At the end of this section we will also discuss the type ofciphering that is applied to the control channels.
2.3. THE GSM RADIO INTERFACE 127
2.3.11.1 Slow associated control channel
The SACCH data are delivered to the coding unit in fixed blocks of 184 information bits.The initial encoding is performed using a shortened binary cyclic code defined by the fol-lowing generator polynomial:
g(D) = (D23+1)(D17+D3+1): (2.33)
This type of code is commonly referred to as a fire code and is used to detect ‘bursty’ resid-ual errors that are not corrected by the convolutional decoder. The result of this codingprocess is the generation of 40 parity bits that are appended to the end of the data block toform a 224-bit block. This block is extended to 228 bits with the addition of four all zerotail bits at the end of the block. This data block is then convolutionally encoded using aone-half rate convolutional code with the following generator polynomials:
G0 = 1+D3 +D4;
G1 = 1+D+D3 +D4:
The result is a block of 456 coded bits. The bits are reordered and divided into eight, 57-bitsub-blocks in the same way as the 456-bit speech block on the TCH/FS, i.e. some blocksoccupy the even-numbered bits and some blocks occupy the odd-numbered bits. However,in the case of the SACCH block, the block interleaving occurs over four full bursts witheach burst containing bits from the same block in both the odd and even bit positions. Thistechnique is termed block rectangular interleaving and a new data block begins once everyfourth burst and is interleaved over four bursts. We note that the SACCH bursts occur onceevery 26 bursts or 120 ms, in the case of the full-rate traffic channel, which means that thedelay caused by the interleaving and channel coding processes will be 4� 120 ms = 480 ms.In the case of a SACCH burst the stealing flags are always set to one.
2.3.11.2 Fast associated control channel
The FACCH information is delivered to the channel coder in blocks of 184 bits which areblock and convolutionally encoded using the same codes as employed for the SACCH. Theinterleaving scheme is different for FACCHs on full-rate and half-rate channels. For the full-rate channel, the interleaving scheme is identical to that used for the full-rate 456-bit codedspeech frames, i.e. the block is divided into eight 57-bit sub-blocks and block diagonallyinterleaved over eight consecutive bursts with the first four sub-blocks occupying only theeven-numbered bit positions and the last four sub-blocks occupying the odd-numbered bitpositions. Where the even-numbered bits of a burst are stolen by the FACCH, the hu flag isset to a logical 1, and the hl flag is set to a 1 when the odd-numbered bits have been stolen.The similarity between the FACCH and full-rate speech interleaving means that a 456-bit
128 CHAPTER 2. THE GSM SYSTEM
FACCH block will completely replace a 456-bit coded speech block on a one-for-one basis.Consequently, the insertion of an FACCH block will result in the loss of a 20 ms speechblock.
Since the TCH/F2.4 also uses the same interleaving scheme, the insertion of an FACCHblock results in the loss of a single 456-bit coded information block, or a 72-bit informationblock. In the case of the TCH/F9.6, the difference between the two interleaving schemesmeans that the insertion of the FACCH results in the loss of a maximum of 24 coded bits ineach 114-bit block, and in the case of the TCH/F4.8, a maximum of 48 coded bits will belost in every 228 bits.
When an FACCH is inserted on the half-rate channel, the 184-bit FACCH block is blockand convolutionally encoded in the same manner as the SACCH block to produce a 456-bit coded data block. The block is interleaved over six bursts in the following manner.The 456-bit block is divided into eight sub-blocks with the first four sub-blocks, fB(0),..., B(3)g, occupying the even-numbered bit positions and the last four blocks, fB(4), ...,B(7)g, occupying the odd-numbered bit positions. Sub-blocks B(2) and B(3) are combinedwith sub-blocks B(4) and B(5) to fill two complete bursts and the remaining sub-blocks fillhalf-bursts. The blocks are therefore effectively block diagonally interleaved over six burstswith a new data block beginning once every fourth burst. Accordingly an FACCH blocksteals the even-numbered bits of the first two bursts of the TCH/H (hu set to 1), all of thebits of the next two bursts (both hu and hl set to 1), and the odd-numbered bits of the nexttwo bursts (hl set to 1).
The effects of FACCH bit stealing on a half-rate speech channel (TCH/HS), will be theloss of two consecutive speech frames. In the case of the TCH/H4.8 and TCH/H2.4 chan-nels, a maximum of 24 in every 114 coded bits will be lost.
2.3.11.3 Random access channel (RACH)
The short RACH bursts transmitted on the up-link contain only eight information bits. Sixparity bits are generated using a simple systematic cyclic code with the following feedbackpolynomial:
G(D) = D6+D5+D3 +D2+D+1: (2.34)
The six parity bits are then added, bit-wise modulo-2, to the six-bit base station identitycode (BSIC) of the BTS for which the RACH message is intended. This process is includedto ensure that two BTSs with the same BCCH carrier frequency do not both decode andrespond to a RACH frame from a single MS. Only the BTS with the same BSIC as thatused in the RACH burst generation will be able successfully to decode the information. Thisprocess results in a 14-bit block to which four all zero tail bits are added to form an 18-bitblock. This block is then one-half rate convolutionally encoded using the same generator
2.4. CONTROL OF THE RADIO RESOURCE 129
polynomials as those used in the TCH/FS producing a 36-bit coded block. Referring toFigure 2.9, we note that this block fits exactly into a single RACH burst. We emphasise thatthere is no interleaving on the RACH channel.
2.3.11.4 Synchronisation channel (SCH)
The synchronisation bursts, each containing 25 information bits, are transmitted on timeslot zero on the down-link BCCH carrier. The data transmitted include the BSIC and theframe number of the current frame within the hyperframe. Ten parity bits are generatedusing the following polynomial:
G(D) = D10+D8 +D6+D5+D4 +D2+1; (2.35)
and four all zero tail bits are added to produce a 39-bit data block. The block is then one-halfrate convolutionally encoded using the same code as the TCH/FS to produce a coded datablock of 78 bits. Referring to Figure 2.9, this information block fits exactly into a singleburst and we note that interleaving is not used on the SCH.
2.3.11.5 Other control channels
The broadcast control channel (BCCH), the paging channel (PCH), the access grant channel(AGCH), the cell broadcast channel (CBCH) and the stand-alone dedicated control channel(SDCCH) all use the same coding and interleaving scheme as the SACCH, described above.
2.3.12 Ciphering of control data
The SCH, BCCH, PCH, AGCH and CBCH are never encrypted because they must be avail-able to every MS within a cell, and the GSM security mechanisms are designed such thatthe encrypted information may only be decoded by a single known user. Also, the RACHis never encrypted because the BTS must be able to decode this burst with no prior knowl-edge of the identity of the MS. The only control channels that may carry encryption are theSACCH, FACCH and SDCCH. The data on these channels are encrypted by EXOR-ing the114 bits in the burst with a 114-bit encryption word, thereby scrambling the data in a knownway. We will examine the manner in which the encryption word is generated in Section 2.5,which deals with the security aspects of GSM.
2.4 Control of the radio resource
In this section we consider the manner in which the radio resource is allocated and used ina GSM system. We will discuss many of the operational aspects associated with a cellular
130 CHAPTER 2. THE GSM SYSTEM
system including MS initialisation and cell selection, paging, access and handover. Wewill also consider some of the other features of GSM including power control and timingadvance.
2.4.1 Cell selection
When an MS is switched on, its first task is to locate a suitable BTS through which itcan gain access to the network, if required. This is achieved by searching the relevantfrequency band for BCCH carriers and then decoding the information they carry to select anappropriate BTS. The MS may implement one of two different search algorithms dependingon its knowledge of the BCCH carriers in use.
The first algorithm is applied when the MS has no knowledge of the BCCH carriers de-ployed in a particular PLMN. Initially the MS searches the entire down-link frequency band(i.e. 124 carriers for primary GSM900, 174 carriers for E-GSM900 and 374 carriers forDCS1800) and measures the received signal strength of each carrier. The received signallevel for each carrier is determined from the average of at least five measurements spreadevenly over a time period of 3 to 5 s [13]. The MS then retunes to the strongest carrier andwaits for an FCCH burst, i.e. a burst of pure sine wave. If an FCCH burst, which occursevery 10 or 11 time frames on time slot zero of a BCCH carrier, is not detected, then the MSretunes to the next strongest carrier and repeats the process. Once the MS identifies a BCCHcarrier by means of the FCCH burst, it synchronises to the BTS and attempts to demodulatethe synchronisation information. The FCCH burst is used by the MS to correct its internaltime base to ensure that its carrier frequency is accurate to within 0.1 part per million (ppm)compared with the signal received from the BTS. The MS employs its internal time base togenerate both the local versions of the RF carriers for demodulation, and the clock signalsfor its internal counters.
Having applied the relevant frequency correction, the mobile attempts to decode the syn-chronisation burst contained in the SCH time slot. This slot is easily located because italways follows immediately after the FCCH time slot on the same physical channel, i.e.eight time slots later. The synchronisation burst contains sufficient information for the MSto identify its position within the complete GSM frame structure. The burst contains 25 bitsof information prior to channel coding and six of these bits are used to transmit the basestation identity code (BSIC). The remaining 19 bits are used to transmit the reduced TDMAframe number (RFN) of the time slot containing the synchronisation burst. The RFN con-sists of three parameters, T1 (11 bits), T2 (5 bits) and T30 (3 bits), which are determinedusing the full frame number (FN) unique to each TDMA frame within the hyperframe. The
2.4. CONTROL OF THE RADIO RESOURCE 131
FN ranges from 0 to 2715647 and the RFN parameters are defined as follows:
T1 = FN div (26 � 51); (11 bits); range 0 to 2047;
T2 = FN mod 26; (5 bits); range 0 to 25;
T30= (T3�1) div 10; (3 bits); range 0 to 4;
where T3 is a number in the range 0 to 50 and is given by
T3 = FN mod 51: (2.36)
The ‘mod’ and ‘div’ operators return the integer result and the remainder of an integer divi-sion, respectively. This shows that T1 provides the position of the superframe containing thesynchronisation burst within the hyperframe, while T2 provides the position of the multi-frame within the superframe. The control channel multiframe contains 51 TDMA framesand the position of the frame containing the synchronisation burst within the multiframe isgiven by T3, which requires six bits. However, the synchronisation burst can only occupyone of five different positions within the multiframe and consequently this information istransmitted using three bits as T30. We note that the synchronisation burst always occupiestime slot zero of the TDMA frame and there is no requirement to transmit this information.
In addition to the FN, the mobile must also maintain the time slot number (TN) andquarter-bit number (QN) counters. The QN counter is set using the extended training se-quence located in the middle of the synchronisation burst and is incremented every 12/13 µs.The QN counts the quarter-bit periods and its value ranges from 0 to 624, i.e. 0 to 156-bitperiods. The TN counter is set to zero when the synchronisation burst is received and it isincremented each time the QN count changes from 624 to 0. The TN counter is used to holdthe position of the time slot within the TDMA frame and its value ranges from 0 to 7. Asthe value of TN changes from 7 to 0 the FN is incremented.
Having successfully synchronised to the BS, the mobile may proceed to decode the systeminformation contained on the BCCH. The BCCH is easily located since it always occupiesthe same position within the control channel multiframe. This channel contains a number ofparameters that influence the cell selection, including the maximum power that the MS maytransmit while accessing the BTS (parameter MS TXPWR MAX CCH) and the minimumreceived power at the MS for access (parameter RXLEV ACCESS MIN). These parame-ters are combined with the received power of the base station, R, and the maximum outputpower of the MS, P, to produce a radio parameter known as C1 given by [13]
C1 = A�B; for B> 0;C1 = A; for B� 0;
where
132 CHAPTER 2. THE GSM SYSTEM
A = R�RXLEV ACCESS MIN;
B = MS TXPWR MAX CCCH�P;
and all values are expressed in dBm. If C1 for a given BTS is greater than zero, then theMS is considered to have the ability to access that BTS, if required. Also, the BTS withthe highest C1 is considered to be the most suitable BTS as far as the radio interface isconcerned.
Another parameter that influences the cell selection process is the CELL BAR ACCESSflag. As its name suggests this flag indicates whether the cell has been barred for access. Itis used to prevent normal subscribers from accessing an active cell, e.g. for the purposes oftesting. Special engineering MSs will ignore this flag.
Using the cell selection algorithm, the MS will choose the unbarred cell with the highestpositive C1 value in its current location area. For cells outside the current location area, ahandicap factor is introduced into the selection algorithm to prevent an MS from switchingback and forth between two cells in different location areas, as this results in an unacceptablelocation updating load. The maximum time allowed for synchronisation to a BCCH carrieris 0.5 s, and the maximum time allowed to read the BCCH data is 1.9 s, once the MS issynchronised. When the MS has selected the most appropriate cell, it will ‘camp on’ thatcell and enter the idle mode.
A second cell selection algorithm exists for situations where the MS has a knowledge ofthe BCCH carriers used within the network. In this case the MS will initially search only thecarriers stored in its BCCH carrier list and apply the cell selection algorithm. In the eventthat this process does not produce a valid BCCH carrier, the MS will revert to the full cellselection algorithm described above. The storage of BCCH carrier information in the MSis an optional feature and the manner in which the list is derived may vary. For example,the MS may store the list of BCCH carriers in use when it was last switched on. However,this may prove inappropriate if the MS is switched off and moved to an entirely differentlocation. It is encumbent upon an MS to select the fourth strongest cell (where the threestrongest cells are inappropriate) and be able to respond to paging messages within 30 s,assuming the BCCH carriers are all received at an adquate C/I.
2.4.2 Idle mode
Having selected an appropriate cell, the MS enters the ‘idle mode’ where it must monitorthe BTS paging channel and continue to ensure that it is camped on the most appropriatecell. Each of these processes will now be described in detail.
2.4. CONTROL OF THE RADIO RESOURCE 133
2.4.2.1 Paging
A paging call, transmitted on the paging channel (PCH), is used to alert an MS to an incom-ing call. Consequently, an MS must continually monitor the relevant PCH for paging callscontaining its unique address. The MS may determine the full control channel organisationon the BCCH carrier using the data contained within the BCCH. In cells where the pagingchannels are located on more than one timeslot, the MS will determine the relevant PCHusing the last three digits of its unique international mobile subscriber identity (IMSI). Inthis way the MSs are ‘randomly’ distributed between the radio resources that have beenallocated to the PCH.
The GSM system also supports a slotted paging mode, whereby the PCH is divided intoa number of paging sub-blocks and the MS is only required to listen to the channel duringits assigned paging sub-block. The MS may be ‘powered-down’ during the periods it isnot monitoring the PCH and this leads to an increase in the MS battery recharging cycle, atechnique known as discontinuous reception (DRX).
The messages sent on the PCH will include the IMSI of the MS to be paged. Once aMS recognises its own IMSI, it will answer the paging call by entering the access mode.Unanswered paging messages will be repeated to allow for variations in the radio channel;however, the exact repetition policy is a matter for the network operator.
2.4.2.2 Cell reselection
Whilst in idle mode, the MS must continue to monitor the down-link signal strength ofsurrounding BTSs to ensure that it remains camped on the most appropriate BTS. The MSwill continue to measure the received signal strength from the serving BTS and also thereceived signal strength of the six strongest BCCH carriers contained in the neighbour listmessage carried on the BCCH of the serving BTS. At least every 5 s, the MS is required toapply the cell selection algorithm to identify whether an idle mode handover is required toa more appropriate cell. Provided the new cell is contained within the current location area,the MS may simply switch to the new cell and begin to decode the PCH data. Where thenew cell belongs to a different location area, the MS must perform a location update beforeit is in a position to receive an incoming call.
2.4.3 Access mode
The access mode is used to describe the process by which an MS in idle mode gains access tothe network and receives a dedicated channel. An MS will enter the access mode to performa location update, or to answer a paging call, or as a result of a subscriber-originated call. AnMS initially accesses a BTS using the RACH on the up-link of the BCCH carrier. Althoughan MS may only transmit an access request in the up-link slots assigned to the RACH, there
134 CHAPTER 2. THE GSM SYSTEM
is no restriction on which slots it may use. Consequently, a collision of two or more MSs’RACH signals may occur at the BTS. In this situation, either one or none of the attemptedaccesses may be decoded and answered. This means that all unanswered access requestsmust be repeated to ensure a reasonable chance of success. The repetition strategy mustbe such that it minimises the load on the RACH whilst maintaining a satisfactory level ofsuccess for access requests. We also note that the time between retransmissions cannot bea fixed parameter, otherwise two colliding MSs will continue to collide during successiveaccess attempts. For this reason, the repetition period is effectively randomised, althoughthe average time between retransmissions and the maximum number of retransmissions iscontrolled through parameters that are regularly broadcast on the BCCH.
The RACH load may also be controlled by forbidding an MS from attempting to accessthe system for a given period of time after an access attempt has failed. Alternatively theRACH load may be reduced by prohibiting fractions of the entire MS population fromattempting to access the network. Specifically, the entire subscriber population is dividedinto 10 equal subgroups using information stored in the SIM card. A subgroup may then beprohibited from accessing the network, except in specific cases (e.g. emergency calls). Inthis way the RACH load may be reduced in steps of 10% in times of congestion.
The RACH burst is very short compared with the other bursts, and it contains only eightbits of information prior to channel coding; this is insufficient to transmit the MS’s uniqueaddress, i.e. its IMSI. The main requirement of the RACH burst is that it contains sufficientinformation for the MS to identify a response to its RACH burst from the network. Accord-ingly, an MS transmits a five-bit random number chosen by itself, along with a three-bitnumber that informs the network of the reason for the access attempt, e.g. an answer toa paging call, emergency call, etc. The MS transmit power used for the access burst isdetermined using a system parameter transmitted on the BCCH. Some of the bits in theaccess burst are EXORed with the BSIC of the BTS for which the message is intended.This ensures that only the intended BTS will decode the message correctly and attempt torespond.
On receiving an access burst on its RACH channel, the BTS will relay the message tothe BSC along with an estimate of the transmission delay between the arrival of the accessburst and the BTS timing schedule. This parameter is used to initialise the timing advanceat the MS and to avoid collisions with data from other MSs at the BTS once the MS entersthe dedicated mode. At this stage the BSC will allocate a free channel on the BTS, andonce the BTS has acknowledged that the channel has been successfully activated, an initialassignment message is constructed. This message contains details of the allocated channel,the initial timing advance to be applied by the MS, the initial maximum transmission power,and an address allowing MSs to identify the destination of the message.
The timing advance parameter is transmitted as a six-bit number providing 64 timing ad-
2.4. CONTROL OF THE RADIO RESOURCE 135
vance steps each corresponding to the period of one bit, namely 3.69 µs. This means that thesystem may apply a maximum timing advance of 63� 3.69 µs� 232 µs, which correspondsto a round trip propagation distance of approximately 70 km and a maximum distance froma BS to the cell boundary of some 35 km. Large cells may be accommodated by enlargingthe time guard bands surrounding each time slot by only using every other time slot (i.e.time slots 0, 2, 4 and 6). In this way the up-link transmission can spill into the neighbouringtime slot and the cell radius may be increased to more than 120 km. This approach willresult in a decrease in the cell capacity and is deployed in special circumstances, e.g. withcoastal BTSs conducting maritime communications. This technique also explains the useof time slots 0, 2, 4 and 6 for common control channels, as these are the only time slots thatare provided in these large cells.
The initial assignment message from the BTS is addressed to the appropriate MS byincluding the exact contents of the access burst transmitted by the MS to the BTS alongwith a time reference describing the time at which the access burst was received. The initialassignment message is sent to the MS using the access grant channel (AGCH) which sharesthe same physical resources as the PCH. The MS continually monitors the AGCH until itdetects a message containing both the contents of its initial access burst and a time referencecorresponding to the time at which the message was sent. We note that at this point the MShas not been identified unambiguously, since there is a finite possibility that two MSs couldhave transmitted identical access bursts in the same RACH time slot.
Once the MS receives an appropriate initial assignment message, it retunes to the newdedicated channel and sends an initial message using the timing advance contained in theinitial assignment message. The format of this message will depend on the reason for theaccess, e.g. a response to a paging call.
The initial message contains details of the MS including its classmark and its uniqueIMSI. Once this message has been received by the BTS its contents are sent back to theMS without modification [6]. If an MS receives a message that is different from the oneit transmitted it will leave the channel immediately and restart the access process. Thisensures that any remaining ambiguity is removed and only the correct MS accesses thededicated channel. Having established a link on a dedicated channel the MS will enter thededicated mode.
2.4.4 Handover
A handover is the process by which an MS relinquishes its connection with one BTS whileestablishing a new connection with another BTS while ensuring that an existing call is main-tained. Handovers are also performed to decrease interference, or to relieve traffic conges-tion. Although the GSM specifications provide an example handover decision algorithmbased on radio criteria, these solutions are not mandatory and the equipment manufacturer
136 CHAPTER 2. THE GSM SYSTEM
is free to implement its own algorithms. The complete handover process may be sub-dividedinto two distinct phases, preparation and execution [6].
2.4.4.1 Handover preparation
The decision to perform a handover and the identification of the most suitable new BTS isbased on several different measurements, performed both at the MS and at the BTS. It isalso based on a number of static parameters and the distribution of the traffic load withinthe network. The measurements utilised in the handover process are as follows.
1. Measurements performed at the BTS.
� The level of the up-link signal received from the MS (parameter RXLEV UL).
� The quality (or BER) of the up-link signal received from the MS (parameterRXQUAL UL).
� The distance between the MS and the BTS based on the adaptive timing advanceparameter.
� The interference level in unallocated time slots.
2. Measurements performed at the MS.
� The level of the down-link signal received from the serving cell (parameterRXLEV DL).
� The quality (or BER) of the down-link signal received from the serving cell(parameter RXQUAL DL).
� The level of the down-link signal received from the nth neighbour cell (param-eter RXLEV NCELL(n)).
The RXQUAL and RXLEV parameters are coded using the schemes shown in Tables 2.18and 2.19, respectively.
The handover process also takes into account the maximum transmission powers of theMS, the serving BTS and the neighbouring BTSs. A handover may also be used to distributethe traffic more evenly throughout the network by handing MSs from congested BTSs ontoless congested neighbouring BTSs, provided the neighbours are able to support the MS.Consequently, the handover process will also take into account the traffic load within thenetwork.
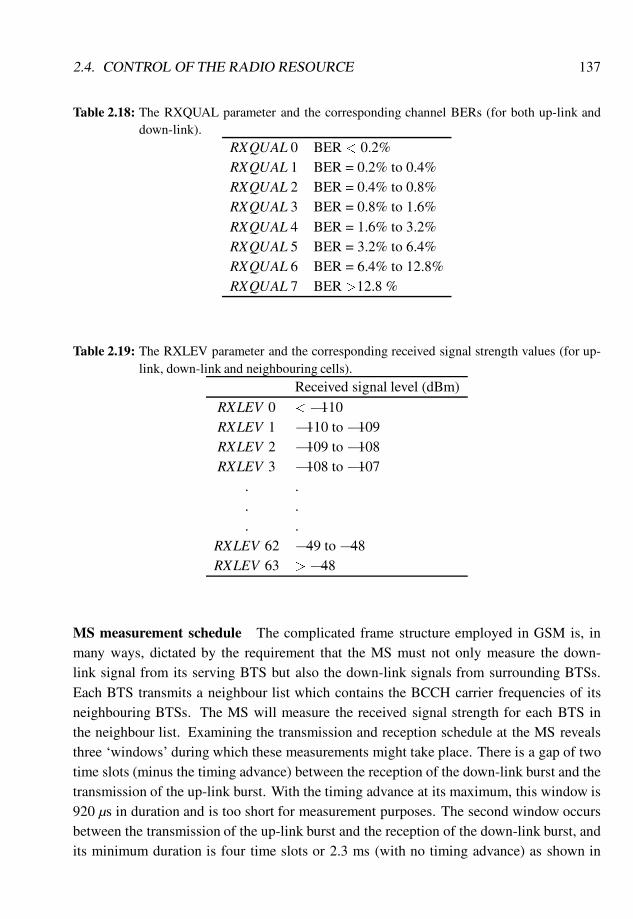
2.4. CONTROL OF THE RADIO RESOURCE 137
Table 2.18: The RXQUAL parameter and the corresponding channel BERs (for both up-link anddown-link).
RXQUAL 0 BER < 0.2%RXQUAL 1 BER = 0.2% to 0.4%RXQUAL 2 BER = 0.4% to 0.8%RXQUAL 3 BER = 0.8% to 1.6%RXQUAL 4 BER = 1.6% to 3.2%RXQUAL 5 BER = 3.2% to 6.4%RXQUAL 6 BER = 6.4% to 12.8%RXQUAL 7 BER >12.8 %
Table 2.19: The RXLEV parameter and the corresponding received signal strength values (for up-link, down-link and neighbouring cells).
Received signal level (dBm)
RXLEV 0 < �110RXLEV 1 �110 to �109RXLEV 2 �109 to �108RXLEV 3 �108 to �107
. .
. .
. .RXLEV 62 �49 to �48RXLEV 63 > �48
MS measurement schedule The complicated frame structure employed in GSM is, inmany ways, dictated by the requirement that the MS must not only measure the down-link signal from its serving BTS but also the down-link signals from surrounding BTSs.Each BTS transmits a neighbour list which contains the BCCH carrier frequencies of itsneighbouring BTSs. The MS will measure the received signal strength for each BTS inthe neighbour list. Examining the transmission and reception schedule at the MS revealsthree ‘windows’ during which these measurements might take place. There is a gap of twotime slots (minus the timing advance) between the reception of the down-link burst and thetransmission of the up-link burst. With the timing advance at its maximum, this window is920 µs in duration and is too short for measurement purposes. The second window occursbetween the transmission of the up-link burst and the reception of the down-link burst, andits minimum duration is four time slots or 2.3 ms (with no timing advance) as shown in
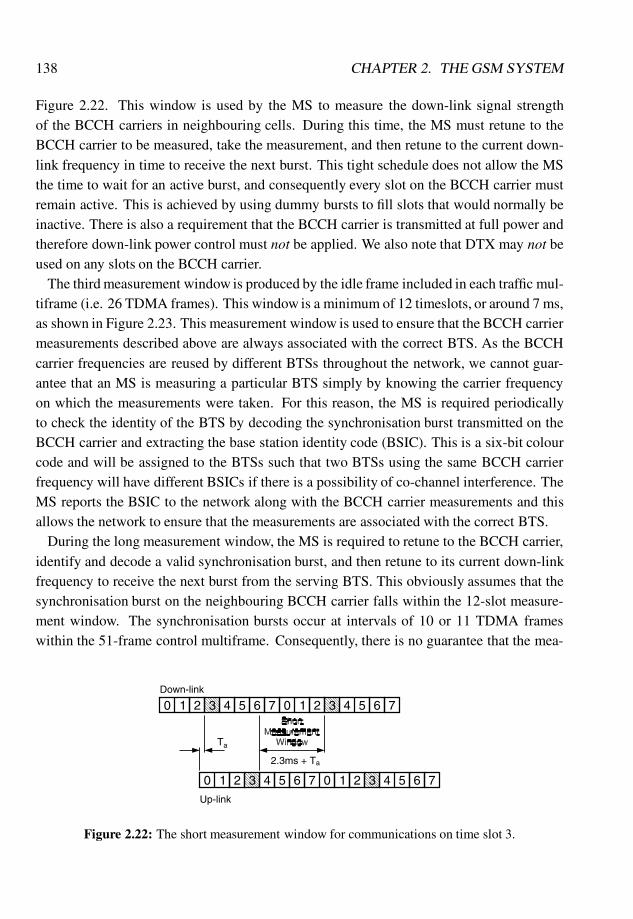
138 CHAPTER 2. THE GSM SYSTEM
Figure 2.22. This window is used by the MS to measure the down-link signal strengthof the BCCH carriers in neighbouring cells. During this time, the MS must retune to theBCCH carrier to be measured, take the measurement, and then retune to the current down-link frequency in time to receive the next burst. This tight schedule does not allow the MSthe time to wait for an active burst, and consequently every slot on the BCCH carrier mustremain active. This is achieved by using dummy bursts to fill slots that would normally beinactive. There is also a requirement that the BCCH carrier is transmitted at full power andtherefore down-link power control must not be applied. We also note that DTX may not beused on any slots on the BCCH carrier.
The third measurement window is produced by the idle frame included in each traffic mul-tiframe (i.e. 26 TDMA frames). This window is a minimum of 12 timeslots, or around 7 ms,as shown in Figure 2.23. This measurement window is used to ensure that the BCCH carriermeasurements described above are always associated with the correct BTS. As the BCCHcarrier frequencies are reused by different BTSs throughout the network, we cannot guar-antee that an MS is measuring a particular BTS simply by knowing the carrier frequencyon which the measurements were taken. For this reason, the MS is required periodicallyto check the identity of the BTS by decoding the synchronisation burst transmitted on theBCCH carrier and extracting the base station identity code (BSIC). This is a six-bit colourcode and will be assigned to the BTSs such that two BTSs using the same BCCH carrierfrequency will have different BSICs if there is a possibility of co-channel interference. TheMS reports the BSIC to the network along with the BCCH carrier measurements and thisallows the network to ensure that the measurements are associated with the correct BTS.
During the long measurement window, the MS is required to retune to the BCCH carrier,identify and decode a valid synchronisation burst, and then retune to its current down-linkfrequency to receive the next burst from the serving BTS. This obviously assumes that thesynchronisation burst on the neighbouring BCCH carrier falls within the 12-slot measure-ment window. The synchronisation bursts occur at intervals of 10 or 11 TDMA frameswithin the 51-frame control multiframe. Consequently, there is no guarantee that the mea-
0 1 2 3 4 5 6 7 0 1 2 3 754 6
64 5 73210 64 5 720 1 3
Ta
Down-link
Up-link
2.3ms + Ta
Figure 2.22: The short measurement window for communications on time slot 3.
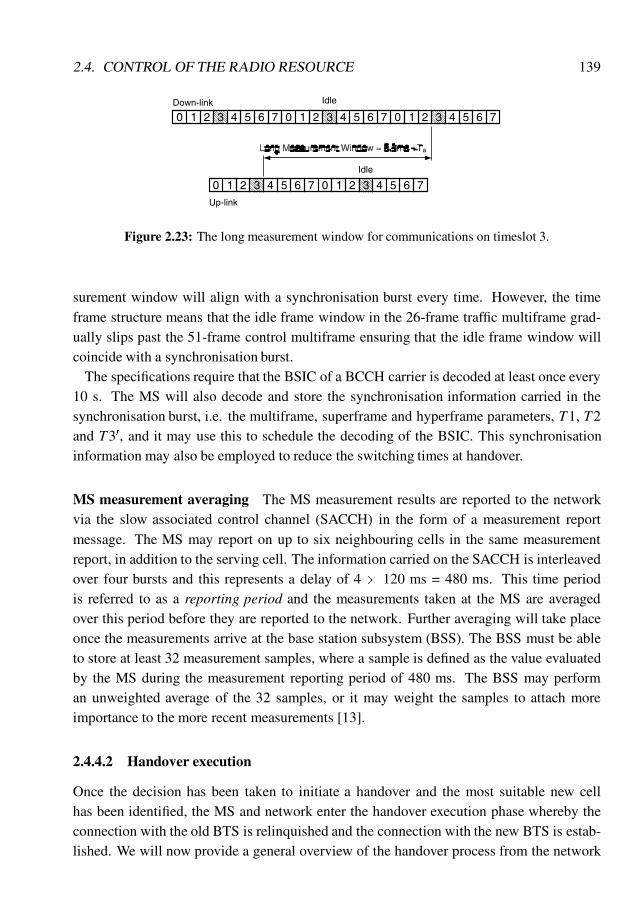
2.4. CONTROL OF THE RADIO RESOURCE 139
0 1 2 3 4 5 6 7 0 1 2 3 754 6
64 5 73210 64 5 720 1 3
Down-link
Up-link
310 2 754 6
Idle
Idle
a
Figure 2.23: The long measurement window for communications on timeslot 3.
surement window will align with a synchronisation burst every time. However, the timeframe structure means that the idle frame window in the 26-frame traffic multiframe grad-ually slips past the 51-frame control multiframe ensuring that the idle frame window willcoincide with a synchronisation burst.
The specifications require that the BSIC of a BCCH carrier is decoded at least once every10 s. The MS will also decode and store the synchronisation information carried in thesynchronisation burst, i.e. the multiframe, superframe and hyperframe parameters, T1, T2and T30, and it may use this to schedule the decoding of the BSIC. This synchronisationinformation may also be employed to reduce the switching times at handover.
MS measurement averaging The MS measurement results are reported to the networkvia the slow associated control channel (SACCH) in the form of a measurement reportmessage. The MS may report on up to six neighbouring cells in the same measurementreport, in addition to the serving cell. The information carried on the SACCH is interleavedover four bursts and this represents a delay of 4 � 120 ms = 480 ms. This time periodis referred to as a reporting period and the measurements taken at the MS are averagedover this period before they are reported to the network. Further averaging will take placeonce the measurements arrive at the base station subsystem (BSS). The BSS must be ableto store at least 32 measurement samples, where a sample is defined as the value evaluatedby the MS during the measurement reporting period of 480 ms. The BSS may performan unweighted average of the 32 samples, or it may weight the samples to attach moreimportance to the more recent measurements [13].
2.4.4.2 Handover execution
Once the decision has been taken to initiate a handover and the most suitable new cellhas been identified, the MS and network enter the handover execution phase whereby theconnection with the old BTS is relinquished and the connection with the new BTS is estab-lished. We will now provide a general overview of the handover process from the network
140 CHAPTER 2. THE GSM SYSTEM
and the MS point of view. For a more detailed description of the GSM handover process, thereader is referred to Reference [6]. The handover execution process is heavily influencedby the position of the switching point in the infrastructure, e.g. whether it is an intra-BSC,intra-MSC or inter-MSC handover, and on whether the old and new BTSs are synchronised.At this stage we will simplify the handover description by adopting the notation used inReference [6], where the terms BTS, BSC and MSC are suffixed with the word ‘old’ if theyform part of the communication path prior to the handover, e.g. BTS-old, and the word‘new’ if they from part of the communication path after the handover, e.g. BTS-new.
The position of the switching point for different scenarios is shown in Figure 2.24. WhereBTS-old and BTS-new are controlled by the same BSC, the switching point will be theBSC, see Figure 2.24(a). If BTS-old and BTS-new are controlled by different BSCs (i.e.BSC-old 6= BSC-new) but they are both connected to the same MSC, then the MSC will bethe switching point, as shown in Figure 2.24(b). Figures 2.24(c), (d) and (e) apply if theBTS-old and BTS-new are connected to different MSCs and in these cases the anchor-MSCwill provide the switching point.
The anchor-MSC is the MSC to which the MS was connected at call initiation and itremains in control of the communication for the duration of the call. Any handover betweenBTSs connected to different MSCs results in MSC-new being added to the communicationchain along with the anchor-MSC, see Figure 2.24(c). In this case MSC-new is sometimesreferred to as the relay-MSC [6]. Where the connection already includes a relay-MSC, andMSC-new is not the anchor-MSC, a different relay-MSC, i.e. MSC-new, is included in thecommunication path, as shown in Figure 2.24(d). Where MSC-new is not MSC-old andMSC-new is the anchor-MSC, the relay-MSC is removed from the communication path,see Figure 2.24(e). The position of the switching point determines the type of messages thatare transmitted between the various machines on the infrastructure side.
The first step of the handover execution phase is for BSC-new to be informed by BSC-old that a handover is required. Except where BSC-new and BSC-old are the same, thismessage is transmitted via the switching point. At this point the new communication pathis established between the switching point and BSC-new. Having been informed of therequirement for a handover, BSC-new attempts to allocate an appropriate channel on BTS-new. If this process is successful, then BSC-new sends details of the new channel back toBSC-old via the switching point (in the case where BSC-new 6= BSC-old). The switchingpoint now generates a handover command message and this is sent via BSC-old and BTS-old to the MS. The handover command message contains details of the new channel on BTS-new and some essential parameters relating to the new cell, e.g. BCCH carrier frequency.
An MS is completely unaware of the impending handover until it receives the handovercommand message. At this stage the MS retunes to the new channel. From this pointonwards the action of the MS is governed by the timing relationship between BTS-old and
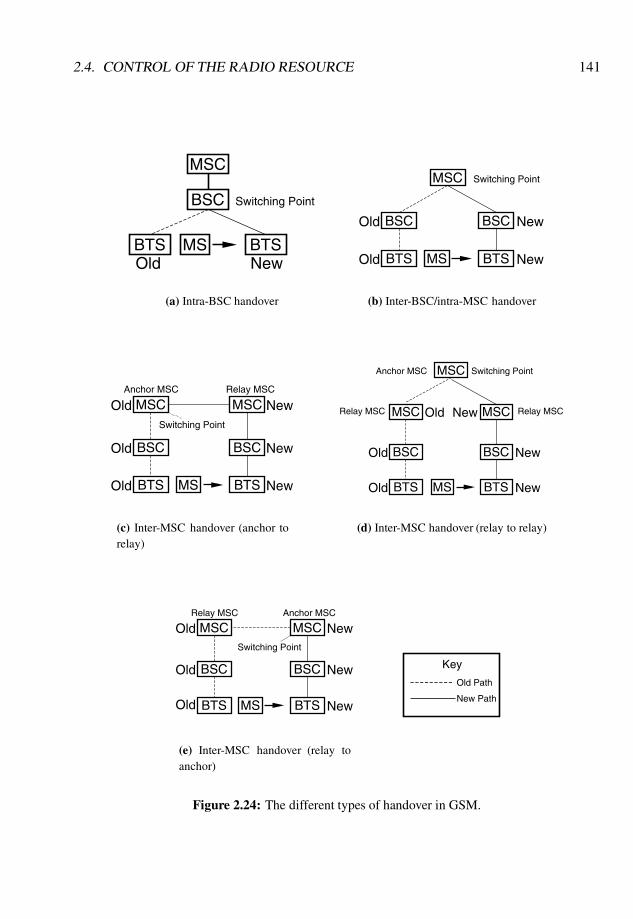
2.4. CONTROL OF THE RADIO RESOURCE 141
MSC
BSC
BTS BTS
Switching Point
MSOld New
(a) Intra-BSC handover
Switching Point
BTS BTS
BSC
MSC
BSC
MSOld
Old
New
New
(b) Inter-BSC/intra-MSC handover
BTS BTS
Switching Point
BSC BSC
MSC MSCAnchor MSC Relay MSC
MS
Old New
Old
Old
New
New
(c) Inter-MSC handover (anchor torelay)
MSCMSC
Switching Point
BSC
BTS
BSC
BTS
Anchor MSC
Relay MSC
MSC
Relay MSC
MS
New
New
New
Old
Old
Old
(d) Inter-MSC handover (relay to relay)
MSCMSCSwitching Point
BSC
BTS
BSC
BTS
Anchor MSCRelay MSC
MSOld New
Old
Old
New
New
(e) Inter-MSC handover (relay toanchor)
Key
Old Path
New Path
Figure 2.24: The different types of handover in GSM.
142 CHAPTER 2. THE GSM SYSTEM
BTS-new. The handover command message contains an indication as to whether or notBTS-old and BTS-new are synchronised. If they are synchronised, then the MS will havebeen able to determine the timing advance to be used at BTS-new beforehand. In thissituation, once tuned to the new channel, the MS transmits a few short access bursts withno timing advance to enable BTS-new to determine the required timing advance and it thencommences normal transmission using the previously computed timing advance. This is theonly time where bursts other than the normal bursts are used on a dedicated channel.
In the case where BTS-old and BTS-new are unsynchronised, the MS is unable to com-pute the new timing advance and it continues to transmit short access bursts on the newchannel. The BTS uses these bursts to determine the new timing advance and reports thisto the MS. When the MS receives this message it commences normal transmission on thenew channel. Once the MS has established a link with BTS-new, it sends a handover com-pletion message, and this is the cue for the communication path to be switched from BTS-old to BTS-new. The interruption time during handover execution can be reduced fromroughly 200 ms to 100 ms if a synchronous handover is used instead of an asynchronoushandover [6] because the MS does not need to wait for the network to compute the requiredtiming advance.
2.4.5 Power control
The GSM system employs power control to ensure that the MS and BTS only transmit suf-ficient power to maintain an acceptable link, thereby reducing interference to neighbouringcells and improving spectral efficiency. We have already seen in Section 2.2 that an MS hasthe ability to decrease its transmitted power in steps of 2 dB from the maximum for its classdown to 5 dBm for GSM900 and 0 dBm for DCS1800. The transmission power of the MSis controlled by the network conveying messages over the slow associated control channel(SACCH). After receiving a power control command, an MS adjusts its transmitted powerto the requested power level at a maximum rate of 2 dB every 60 ms. Thus a transmitterpower change of 30 dB will take around 900 ms.
The power control algorithm is based on the up-link signal measurements taken at theBTS, and although the specifications include an example algorithm, the implementationwill be manufacturer/operator specific. The BTS must be able to dynamically adjust itspower in at least 15 steps of 2 dB. The operator has the option of whether or not to use bothup-link and down-link power control, and it may be applied independently on either link.However, down-link power control may not be applied to any slots on the BCCH carrier asit must be transmitted at a constant power because it is measured by the MSs in surroundingcells for the purposes of handover preparation.
2.4. CONTROL OF THE RADIO RESOURCE 143
2.4.6 Frequency hopping
GSM employs slow frequency hopping (SFH) to mitigate the effects of multipath fadingand interference. Each burst belonging to a particular physical channel will be transmittedon a different carrier frequency in each TDAM frame. Thus the hopping rate is equal to theframe rate (i.e. ' 217 frames/s). The only physical channels that are not allowed to hop arethe broadcast and common control channels (i.e. the FCH, SCH, BCCH, PCH and AGCH).This is because an MS must be able easily to locate these channels on power-up and thisprocess would become more complex if frequency hopping were allowed on these channels.The radio carrier on which these broadcast and common control channels are transmittedis called the BCCH carrier. The BCCH carrier is measured by the MSs in neighbouringcells to determine whether the BTS is a suitable handover candidate. As a result of this,the BCCH carrier must be transmitted continuously and at a constant power. This meansthat down-link power control and discontinous transmission (DTX) may not be used on theBCCH carrier. A traffic channel or dedicated control channel may use the BCCH carrierfrequency as part of its hopping sequence, but it must obey the above rules while it is usingthat carrier, i.e. power control and DTX are not permitted. Let us now examine the twosignificant gains that acrue from deploying SFH in GSM.
The effect of frequency hopping on interference In a non-frequency hopping GSM sys-tem, an MS will tend to experience interference from the same set of MSs in neighbouringco-channel cells for the duration of a call, provided the MS is not handed over. The levelof this interference will vary depending on the relative positions of each of the MSs. Forexample, the interference levels will be high if all the MSs are situated at the edges of theirrespective cells, whereas it will be low if the MSs are situated close to their serving BTS.This means that, in situations where an MS experiences a high level of interference, it islikely that it will continue to suffer for the duration of a call. In a frequency hopped sys-tem, the hopping patterns (i.e. the sequence of transmission frequencies) are different inco-channel cells and the MS will experience interference from a different set of MSs oneach burst. This effectively randomises the interference and each MS will experience anaverage level of interference. This situation is preferable to the non-frequency hopped casewhere it is possible for some MSs to experience very high levels of interference while othersexperience very low levels of interference.
The effect of frequency hopping on multipath fading The mobile radio propagationchannel imposes large amplitude variations onto the received signal as a number of dif-ferent propagation paths are either constructively or destructively summed at the receivingantenna. The position of the signal fades is heavily dependent on the environment, e.g. po-sitions of buildings and vehicles, and the operating frequency. At high mobile speeds the
144 CHAPTER 2. THE GSM SYSTEM
rate of signal fading is high and the length of the fades will be short, and the resulting errorbursts will be combated by the symbol interleaving and channel coding. At slower speedsthe MS will spend longer periods of time in signal fades and the effectiveness of the inter-leaving and channel coding schemes is less. Frequency hopping may be used to ensure thatan MS does not spend large periods of time in signal fades. By ensuring that the frequencychange between two successive frequency hops is beyond the coherence bandwidth of thechannel an MS is unlikely to hop from one fade directly into a second one. Consequently,frequency hopping may be used to mitigate the effects of fast fading at slow MS speeds.
2.4.6.1 Frequency hopping sequences
The hopping sequence defines the order in which the different carrier frequencies are usedon the up-link and the down-link. Since the up-link and down-link frequencies alwaysremain separated by the duplex channel spacing (i.e. 45 MHz for GSM900 and 95 MHz forDCS1800) only a single hopping sequence is required to describe the complete duplex link.
The mobile allocation parameter prescribes the carrier frequencies that may be used byeach MS in its hopping sequence. For 124 possible TDMA carriers the mobile allocationparameter requires a minimum of 124 bits to uniquely describe every possible carrier com-bination. We recall that initial assignment messages are sent on the common access grantchannel (AGCH) where the message size should be kept short to preserve the access ca-pacity of the system. To avoid transmitting the full mobile allocation parameter at initialassignment a two-step approach is used. Each BTS transmits details of all the carriers it isusing in the form of a cell channel description message, carried on the BCCH. This messagetakes the form of a 124-bit map where each bit represents a carrier and a ‘1’ or ‘0’ is insertedto indicate whether each particular carrier is in use at a BTS. The MS decodes and storesthis information whilst it is in its idle mode. On initial assignment, the mobile allocationis described as a subset of the cell allocation, thus reducing the signalling overhead on theAGCH.
Having established the list of carrier frequencies assigned to the frequency hopping chan-nel, the MS must also determine the sequence in which each frequency is to be used. Thehopping sequence is described by two parameters: the hopping sequence number (HSN)and the mobile allocation index offset (MAIO). The HSN selects one of 64 predefined ‘ran-dom’ hopping sequences, while the MAIO selects the start point within the sequence. TheMAIO may take as many values as there are frequencies in the mobile allocation. The valueHSN=0 chooses a cyclic sequence where the frequencies in the mobile allocation are usedone after the other.
Frequency hopping channels with the same HSN, but having different MAIOs, will neveruse the same frequency simultaneously because they are orthogonal. Consequently, allfrequency hopping channels within a cell employ the same HSN but have different MAIOs.
2.5. SECURITY ISSUES 145
Where two frequency hopping channels use different HSNs, they will interfere for 1=n of thebursts, and consequently frequency hopping channels in co-channel cells will use differentHSNs [6]. For a complete description of the frequency hopping algorithm the reader isreferred to the specifications [11].
2.5 Security Issues
2.5.1 Introduction
The first generation cellular systems, e.g. NMT, TACS and AMPS, had few security fea-tures, and this resulted in significant levels of fraudulent activity, which harms both sub-scribers and network operators. A number of high profile incidents highlighted the sus-ceptibility of analogue phones to eavesdropping on the radio paths. The GSM system hasa number of security features which are designed to afford both the subscriber and thenetwork operator a greater level of protection against fraudulent activity. Authenticationmechanisms ensure that only bona fide subscribers possessing bona fide equipment, i.e. notstolen or non-standard, are granted access to the network. Once a connection has beenestablished, the information on the radio path is encrypted to deter eavesdropping. Eachsubscriber’s privacy is protected by ensuring that details of both her identity and locationare protected. This is achieved by assigning each user with a temporary mobile subscriberidentity (TMSI) number which changes from call to call. In this way there is no requirementto transmit the user’s IMSI over the radio interface making it very difficult for an eavesdrop-per to identify and locate a user. We will now address each of these security techniques inmore detail.
2.5.2 PIN code protection
The first and most basic level of protection against fraudulent use of the mobile phone is thepersonal identification number (PIN) code, designed to protect against the fraudulent use ofstolen SIM cards [8]. In the SIM, the PIN takes the form of a four to eight decimal digitcode. The user may have the option of disabling this level of PIN protection. The SIM alsohas the facility to store a second four to eight digit PIN known as PIN2 to protect certainfeatures that are accessible to a subscriber. Once the PIN, and where appropriate PIN2, areentered correctly, the ME will have access to the data held in the SIM.
The specifications also define the procedures that should be followed when a PIN is en-tered incorrectly. After three consecutive incorrect attempts to enter a PIN, the SIM be-comes blocked and any further attempts to enter the PIN are ignored, even if the SIM isremoved from the ME. The SIM may be unblocked by entering a further eight-digit codeknown as the PIN unblocking key (PUK) which is also stored in the SIM. After 10 incorrect
146 CHAPTER 2. THE GSM SYSTEM
attempts to enter the PUK, the unblocking key itself becomes blocked and there is no meansto unblock the SIM.
2.5.3 Authentication
The authentication procedure is triggered when the MS attempts one of the following ac-tions:
� a change of subscriber-related information stored in either the HLR or VLR; this willinclude a location update which involves the subscriber’s details being stored in a newVLR and network registration;
� accessing the network for the purposes of making or receiving a call;
� on the first access following the restart of an MSC/VLR.
Authentication is initiated by the network in the form of an authentication request mes-sage sent to the MS. This message contains a 128-bit random number, called RAND. At theMS this number is used as one input to a secret algorithm known as A3. The other input toA3 is the subscriber’s secret key, Ki. Both A3 and Ki are stored in the SIM. The securityof GSM hinges around the secrecy of Ki and for this reason the key is stored in the SIMunder heavy protection. The secret key cannot be read from the SIM itself and it is onlyaccessed when the SIM is personalised under the control of the network operator. Duringthe security procedures that occur within GSM, Ki is only used internally within the SIM.Ki may be of any format and any length. We also note that the A3 algorithm is kept secretto provide additional security. The result of applying the A3 algorithm to Ki and RANDis another number, SRES (Signed RESult), which must be 32 bits in length. Once it hasbeen computed by the MS, SRES is returned to the network in the form of an authenticationresponse message. On the network side, the AuC also stores the user’s secret key, Ki, andthe A3 algorithm, and it generates a version of SRES in an identical manner to that at theMS. The HLR then sends SRES to the visited MSC/VLR where the two versions are com-pared. If they match, then the MS is deemed to be authentic. The secret A3 algorithm hasthe property that it is a relatively simple task to generate SRES from RAND and Ki, but it isvery difficult to determine Ki from SRES and RAND or pairs of SRES and RAND.
The A3 algorithm is not unique and each operator has the freedom to choose its ownversion, although an example algorithm is available on a restricted basis. This obviouslyhas a major implication when inter-network roaming is considered between operators usingdifferent A3 algorithms. The problem is overcome by requiring that the computation ofSRES is performed in the HLR of the subscriber’s home network and sent to the visitedMSC/VLR where the authentication check is made. The MSC/VLR stores a number of
2.5. SECURITY ISSUES 147
RAND and SRES pairs for each MS to reduce the number of information transfers betweenthe HLR and MSC/VLR. The HLR and VLR may be in different countries.
2.5.4 Encryption
Once a subscriber has been authenticated, thereby protecting both the subscriber and thenetwork operator from the effects of fraudulent access, the user must be protected fromeavesdroppers. This is achieved by encrypting the data on the radio interface using a secondkey, Kc, and the secret algorithm, A5. Kc is generated during the authentication phase usingKi, RAND and the secret algorithm A8, which is also stored in the SIM. In common with theA3 algorithm, A8 is not unique and it may also be chosen by the individual operators. TheKc key for each user is computed in the home network’s AuC to overcome the problems ofinter-network roaming. In some implementations the A3 and A8 algorithms are combinedinto a single algorithm A38 which uses RAND and Ki to generate Kc and SRES.
In contrast to A3 and A8, which may not be the same for each individual operator, A5will be chosen from a list of different candidates, which will not exceed seven. Prior toencryption being enabled a negotiation phase will occur whereby the MS and the networkdecide which version of A5 to use. Where the network and the MS do not have any versionsof A5 in common, the connection must continue in unciphered mode, or it must be discon-tinued. The A5 algorithm takes the 64-bit long Kc key and a 22-bit long representation ofthe TDMA frame number and produces two 114-bit long encryption words, BLOCK1 andBLOCK2, for use on the up-link and the down-link, respectively. The encryption words areEXORed with the 114 data bits in each burst. Because the encrypted data are computedusing the TDMA frame number, the words change from burst to burst and are not repeatedover the hyperframe cycle (around 3.5 h). The authentication and encryption process issummarised in Figure 2.25, where
Lrepresents the EXOR function.
2.5.5 The temporary mobile subscriber identity (TMSI)
Some transmissions on the radio path cannot be protected by encryption. For example,following an initial assignment, the MS must transmit its identity to the network beforeencryption can be activated. This would obviously allow an eavesdropper to determine thelocation of a subscriber by intercepting this message. This problem is reduced in GSMby the introduction of the temporary mobile subscriber identity (TMSI) which is an ‘alias’assigned to each MS by the VLR. The TMSI is transmitted to an MS during a previousencrypted connection and it is used by the MS and the network in any future paging andaccess procedures. The TMSI will only be valid within the location area served by theparticular VLR.
� �
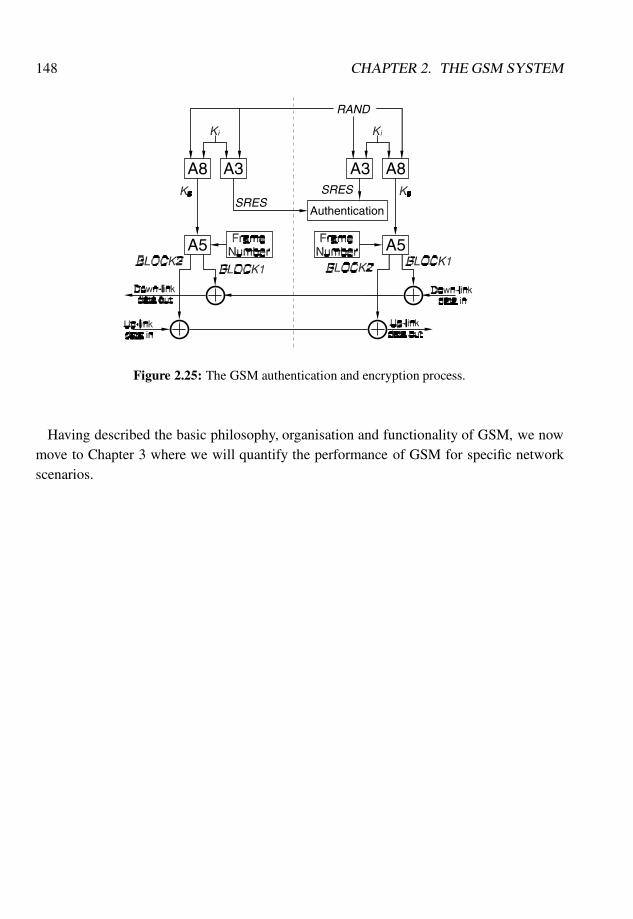
148 CHAPTER 2. THE GSM SYSTEM
A8 A3 A3 A8
Authentication
RAND
SRESSRES
A5A5
Figure 2.25: The GSM authentication and encryption process.
Having described the basic philosophy, organisation and functionality of GSM, we nowmove to Chapter 3 where we will quantify the performance of GSM for specific networkscenarios.
Bibliography
[1] Steele R., Digital cellular mobile radio scene in Europe, ISELDECS-87, Dec. 16–18,1987, India.
[2] Langewellpott U., M. Aldinger and H.P. Kuchenbecker, Perfect analysis of radio trans-mission in the fully digital cellular radio system CD900, Proc. Nordic. Semin. DigitalLand Mobile Radio Commun., 1985, Espoo, Finland.
[3] Lam W.H. and R. Steele, The error performance of CD900-like cellular mobile radiosystem, IEEE Trans. Veh. Technol. 40(4), Nov. 1991, 671–685.
[4] Steele R. (Ed.), Mobile Radio Communications, Pentech Press, London 1992.
[5] Chia S., The universal mobile telecommunication system, IEEE Commun. Mag. Dec.1992, 54–62.
[6] Mouly M. and M-B. Pautet, The GSM System for Mobile Communications. Publishedby the authors, 1992.
[7] Redl S.M., M.K. Weber and M.W. Oliphant, An Introduction to GSM, Artech House,1995.
[8] GSM 02.17 (ETS 300 509), European Digital Cellular Telecommunications System(Phase 2); Subscriber Identity Modules (SIM) Functional Characteristics.
[9] GSM 05.04 (ETS 300 576), European Digital Cellular Telecommunications System(Phase 2); Modulation.
[10] GSM 05.05 (ETS 300 577), European Digital Cellular Telecommunications System(Phase 2); Radio Transmission and Reception.
149
150 BIBLIOGRAPHY
[11] GSM 05.02 (ETS 300 574), European Digital Cellular Telecommunications System(Phase 2); Multiplexing and Multiple access on the Radio Path.
[12] GSM 05.03 (ETS 300 575) European Digital Cellular Telecommunications System(Phase 2); Channel Coding.
[13] GSM 05.08 (ETS 300 578) European Digital Cellular Telecommunications System(Phase 2); Radio Subsystem Link Control.
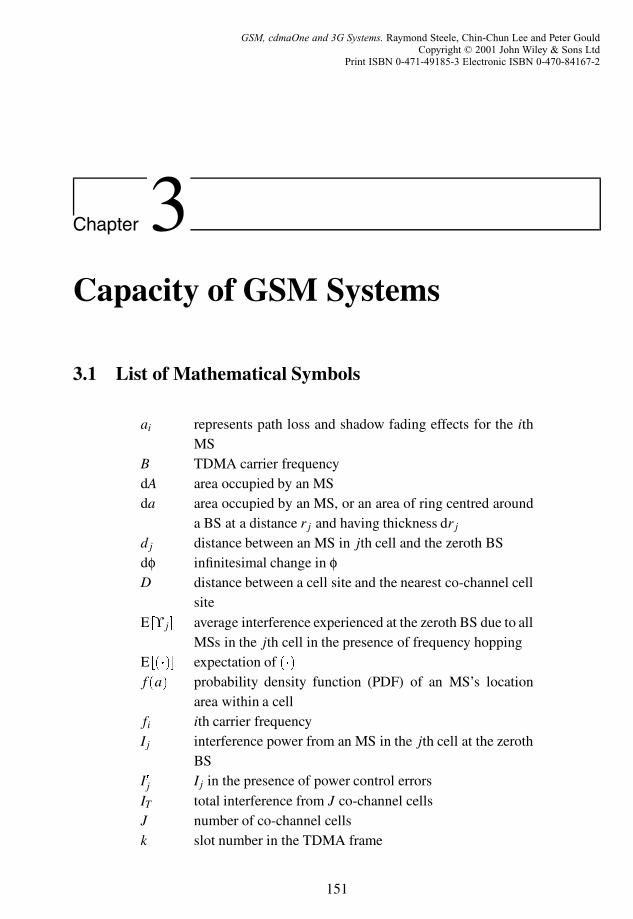
Chapter 3Capacity of GSM Systems
3.1 List of Mathematical Symbols
ai represents path loss and shadow fading effects for the ithMS
B TDMA carrier frequencydA area occupied by an MSda area occupied by an MS, or an area of ring centred around
a BS at a distance r j and having thickness dr jd j distance between an MS in jth cell and the zeroth BSdφ infinitesimal change in φD distance between a cell site and the nearest co-channel cell
siteE [ϒ j] average interference experienced at the zeroth BS due to all
MSs in the jth cell in the presence of frequency hoppingE [(�)] expectation of (�)
f (a) probability density function (PDF) of an MS’s locationarea within a cell
fi ith carrier frequencyI j interference power from an MS in the jth cell at the zeroth
BSI0
j I j in the presence of power control errorsIT total interference from J co-channel cellsJ number of co-channel cellsk slot number in the TDMA frame
151
GSM, cdmaOne and 3G Systems. Raymond Steele, Chin-Chun Lee and Peter GouldCopyright © 2001 John Wiley & Sons Ltd
Print ISBN 0-471-49185-3 Electronic ISBN 0-470-84167-2
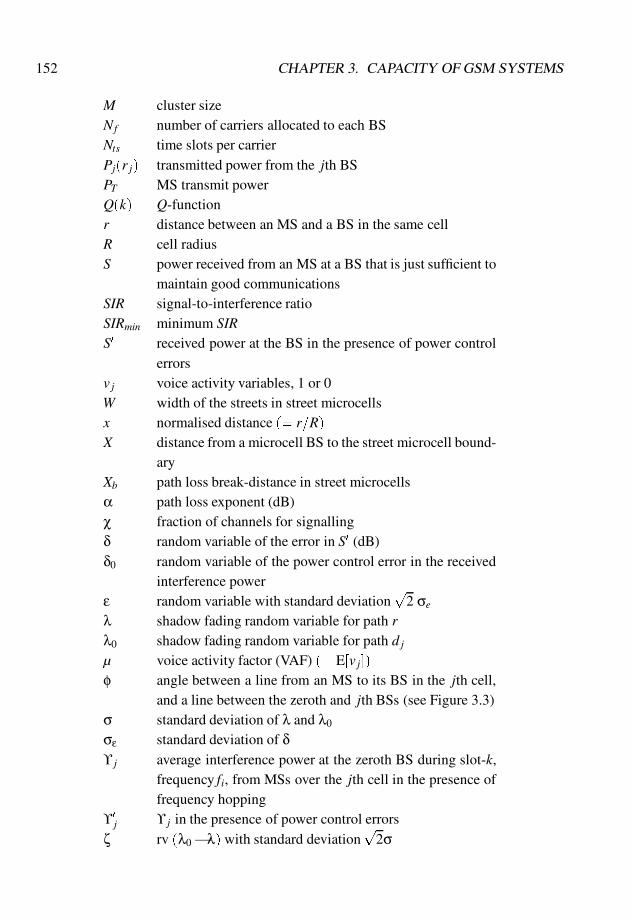
152 CHAPTER 3. CAPACITY OF GSM SYSTEMS
M cluster sizeNf number of carriers allocated to each BSNts time slots per carrierPj(r j) transmitted power from the jth BSPT MS transmit powerQ(k) Q-functionr distance between an MS and a BS in the same cellR cell radiusS power received from an MS at a BS that is just sufficient to
maintain good communicationsSIR signal-to-interference ratioSIRmin minimum SIRS0 received power at the BS in the presence of power control
errorsv j voice activity variables, 1 or 0W width of the streets in street microcellsx normalised distance (= r=R)X distance from a microcell BS to the street microcell bound-
aryXb path loss break-distance in street microcellsα path loss exponent (dB)χ fraction of channels for signallingδ random variable of the error in S0 (dB)δ0 random variable of the power control error in the received
interference powerε random variable with standard deviation
p2 σe
λ shadow fading random variable for path rλ0 shadow fading random variable for path d j
µ voice activity factor (VAF) (= E[v j])φ angle between a line from an MS to its BS in the jth cell,
and a line between the zeroth and jth BSs (see Figure 3.3)σ standard deviation of λ and λ0
σε standard deviation of δϒ j average interference power at the zeroth BS during slot-k,
frequency fi, from MSs over the jth cell in the presence offrequency hopping
ϒ0
j ϒ j in the presence of power control errorsζ rv (λ0�λ) with standard deviation
p2σ
3.2. INTRODUCTION 153
(�) average of (�)
3.2 Introduction
A precise analysis of the capacity of GSM is exceedingly complex, but by making reason-able assumptions we can provide good estimates of the capacity for a variety of conditions.We will confine ourselves to voice traffic channels since this represents the bulk of the traf-fic in GSM networks [1–8]. While cognisant that radio cells are fundamentally irregular inshape, depending on terrain, buildings, road topologies, and so forth, we will estimate thecapacity for hexagonal macrocells and for microcells in a rectilinear grid pattern of roads.These types of cells have the virtue of simplicity and they enable the performance of othersystems to be compared on the same cellular basis.
The methodology used in the analysis of macrocellular GSM networks is as follows. Wewill calculate the signal-to-interference ratios (SIRs) for different cluster sizes and identifythe cluster size (M) that will support the minimum acceptable SIR, namely SIRmin. KnowingM we will determine the number of channels per MHz per cell site, allowing for signallingchannels. The traffic carried by the network can then be computed for a given blockingprobability.
The SIR needs to be calculated for both up-link (reverse) and down-link (forward), andfor omnicells and sectorised cells. In computing the SIR we will make the following as-sumptions: that the power control is applied; that frequency hopping (FH) is used wherethe carrier in each frame hops beyond the coherence bandwidth; and that discontinuoustransmission (DTX) enables transmissions to be suspended on a link when the user is notspeaking [9–11]. All the traffic channels are considered to be occupied, and initially we willignore the signalling channels. The GSM radio link is assumed to be able to combat the ef-fect of fast fading by means of its channel coding, bit interleaving, channel equalisationand signal processing sub-systems. The radio channel is subjected to log-normal shadowfading, and path losses that increase with distance raised to the power α.
Section 3.3 provides SIR calculations for transmissions in macrocellular GSM networks,dealing with omnidirectional and sectorised cells, and examining the effect of power controlerrors. The analysis is repeated in Section 3.4 for down-link transmissions. Armed with theSIR calculations and the knowledge of cluster sizeM required to ensure SIRmin, the capacityof the hexagonal macrocellular network is determined in Section 3.5, along with the effectof sectorisation on the teletraffic performance.
Section 3.6 is concerned with a street microcellular GSM network. The models used arecross-shaped microcells formed by placing the base stations (BSs) at street intersections,and rectangular-shaped microcells where the BSs are mid-way along the sides of the cityblocks. The cluster sizes for these two models are two and four, respectively. The other
154 CHAPTER 3. CAPACITY OF GSM SYSTEMS
parameters, e.g. DTX and FH, used in the macrocellular analysis apply. After calculatingthe SIR the capacity of the microcellular GSM network is computed. Section 3.6 concludeswith a discussion of irregularly-shaped microcells.
3.3 Macrocellular GSM Network: Up-link Transmissions
3.3.1 The SIR for omnidirectional macrocells
We commence by determining the SIR for the up-link using omnidirectional antennas at thecell sites [9]. Figure 3.1 shows the pattern of co-channel hexagonal cells in a macrocellularnetwork. The other cells are not shown, but we assume that there is a continuum of tes-sellated hexagonal cells. Observe that around any cell there is an inner ring of co-channelcells followed by outer rings of co-channel cells. Only the inner rings of co-channel cellscontribute significantly to the co-channel interference. Each ring has six co-channel cells,except for a cluster size of two. This is because a hexagon has six sides. The distance be-tween a cell site and the nearest cochannel cell site is D, and the distance between a cell siteand the apex of a hexagonal cell is R. A hexagonal cell may be approximated by a circle ofradius R as shown in Figure 3.2. Using this approximation we show in Figure 3.3 two cells,the zeroth cell, and one of its co-channel cells, the jth cell.
We consider a mobile station (MS) in Figure 3.3 occupying an area da, at a distance rfrom the jth BS. The MS transmits a power PT such that the received power at the jth BS isS, a power just sufficient to maintain good communications. The received signal decreasesas the MS moves away from the cell site because of an increase in the path loss. Thereceived power at a distance r from the BS will be different at different angles because ofthe variations in the terrain and the distribution of buildings and streets. We allow for thesevariations by introducing a random variable λ having zero mean and standard deviation σ.Often λ is referred to as a shadowing random variable because it is associated with theelectromagnetic shadows cast by buildings and terrain variations. The received power indBs is
10 log10S = 10log10 PT � α10log10 r + λ; (3.1)
where the path loss is α 10log10 r , and α is called the path loss exponent. Note that λ is indBs. Measurements of λ show that it is normally distributed between�4σ and 2σ [2]. Sinceλ is in dBs, it is said to be log-normally distributed between �4α and 2σ. In order to makeS a constant, PT is varied using a closed-loop power control system. From Equation (3.1)the power transmitted by the MS is
PT = S rα10�λ=10 (3.2)
and this power causes interference at the zeroth BS. The actual interference depends on the

3.3. MACROCELLULAR GSM NETWORK: UP-LINK TRANSMISSIONS 155
D
R
D
Figure 3.1: Co-channel cells in a mosaic of tessellated hexagonal cells. Non-co-channel cells arenot displayed.
R
Figure 3.2: An hexagonal cell and its circular representation.
r
D
dj
0-th cell
j-th cell
φ
da
dφ
dr
BS
j
MS
R
Figure 3.3: Up-link: an MS in the jth cell interfering with the zeroth BS.
156 CHAPTER 3. CAPACITY OF GSM SYSTEMS
distance d j between the MS and the zeroth BS, namely
d j =
qD2
j + r2� 2Djr cosφ; (3.3)
where Dj and φ are shown in Figure 3.3. The interference also depends on the shadowfading affecting the MS’s transmissions over the path between it and the zeroth BS. Theinterference due to the MS in the jth cell at the zeroth cell site is
I j = PT d�αj 10λ0=10
; (3.4)
where λ0 is the shadowing variable for path d j. Observe that the shadowing variables λand λ0 have the same variance σ2, and that α is assumed to be universal over the entiregeographical area. SubstitutingPT from Equation (3.2) into Equation (3.4) yields
I j = S
�rd j
�α10(λ0 � λ)=10 (3.5)
andζ = λ0 � λ (3.6)
is a random variable having a normal distribution with standard deviationp
2σ, with
�4p
2σ < ζ < 2p
2σ� (3.7)
Unlike the digital enhanced cordless telecommunication (DECT) system [12], GSM cannothop onto a different radio carrier at each time slot. The radio carrier only hops to a newfrequency every GSM frame. In first generation GSM equipment the carriers are assignedto a cell site (or sector) and hopping only occurs between these carriers. This is termedbaseband frequency hopping. Second generation equipment facilitates hopping over allGSM frequencies and this is termed RF frequency hopping. We will consider the specialcase of the beacon carrier at a later stage.
Let each BS be allocated Nf carriers, say f1, f2, f3; : : : ; fN f , and each carrier supports Nts
time slots, resulting in NtsNf traffic channels per cell. The carriers are hopped on a frame-by-frame basis. Each user is assigned a specific slot in a time frame and it stays in this slotas frequency hopping occurs and the call progresses. Consider the kth timeslot supportedby carrier frequency, fi. In the jth interfering cell, although all the users change their carrierfrequency during each TDMA frame, there is always a user who occupies the kth timeslot ofthe carrier fi. Owing to frequency hopping at each TDMA frame the interference associatedwith the channel specified by the kth timeslot and fi carrier can come from users in differentlocations within the jth cell, although the interference is only from one user during anyframe. Eventually frequency fi will be used by a subset of Nf users who occupied the kthtimeslot in the jth cell. If there is a sufficiently large number of carriers, and the MSs are
3.3. MACROCELLULAR GSM NETWORK: UP-LINK TRANSMISSIONS 157
uniformly distributed over the jth cell, then the probability that an MS will be using thekth slot on carrier fi is f (a)da , where f (a) is the probability density function (PDF). Thisprobability is also da=(πR2), giving
f (a) =1
πR2 : (3.8)
The average interference power at the zeroth BS during the kth slot on frequency fi is
ϒ j =Z
cell
Z
area
I j f (a)da; (3.9)
where I j is the interference from location da. Substituting I j from Equation (3.5) into Equa-tion (3.9), and using Equation (3.6) yields
ϒ j =S
πR2
Z R
0
Z 2π
0
�rd j
�α10ζ=10r dr dφ (3.10)
where da has been replaced by r dr dφ, and dr and dφ are defined in Figure 3.3. The variableζ depends on the paths between the MS and the jth and zeroth BSs while communicatingusing the kth slot on carrier fi. Owing to hopping, the MS using the kth slot on carrier fiis located in a different part of the jth cell during each TDMA frame and thereby has adifferent shadow variable ζ. Consequently we must take the expectation or average of ϒ j toget the average of 10ζ=10 and hence obtain the total interference experienced at the zerothcell site due to all the mobiles in the jth cell, namely
E [ϒ j] =S
πR2
Z R
0
Z 2π
0
�rd j
�αE[10ζ=10]r dr dφ; (3.11)
where E[(�)] means the expectation of (�) . Normalising the distance as
x = r=R; 0 � x � 1;
E [ϒ j]
S=
1π
Z 1
0
Z 2π
0
�x
d j=R
�αEh10ζ=10
ix dx dφ: (3.12)
We now need to determine Eh10ζ=10
i.
3.3.1.1 Expectation of Eh10ζ=10
i
We have stated that the shadow random variable λ is a normal random variable, but boundedfrom �4σ to +2σ. These limits have been experimentally observed [2]. Since ζ is thedifference between two independent random variables λ, ζ is bounded as given by Inequality
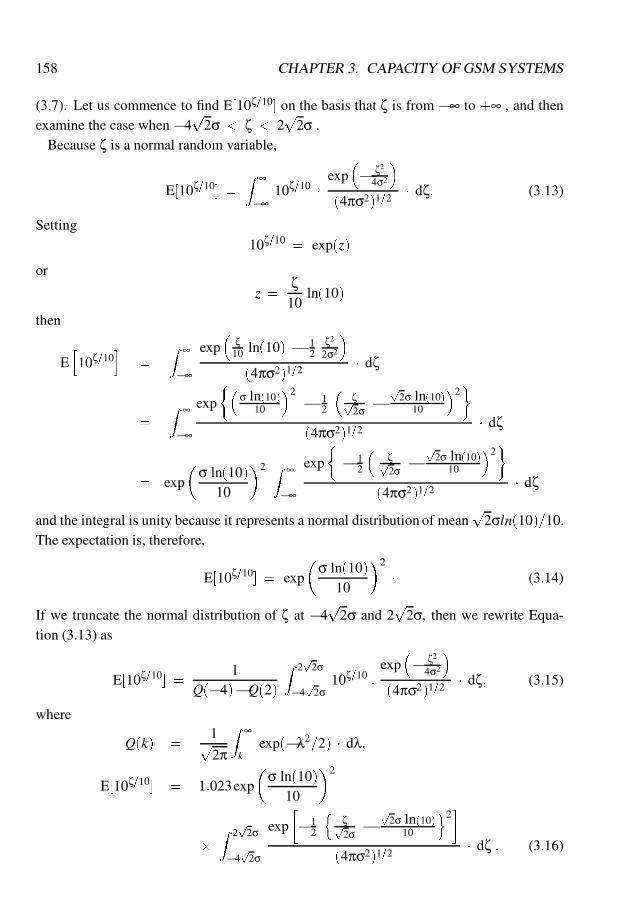
158 CHAPTER 3. CAPACITY OF GSM SYSTEMS
(3.7). Let us commence to find E[10ζ=10] on the basis that ζ is from �∞ to +∞ , and thenexamine the case when �4
p2σ < ζ < 2
p2σ .
Because ζ is a normal random variable,
E[10ζ=10] =Z ∞
�∞10ζ=10 �
exp�� ζ2
4σ2
�(4πσ2)1=2
� dζ: (3.13)
Setting10ζ=10 = exp(z)
or
z =ζ
10ln(10)
then
Eh10ζ=10
i=
Z ∞
�∞
exp�
ζ10 ln(10) � 1
2ζ2
2σ2
�(4πσ2)1=2
� dζ
=Z ∞
�∞
exp
��σ ln(10)
10
�2� 1
2
�ζp2σ �
p2σ ln(10)
10
�2�
(4πσ2)1=2� dζ
= exp
�σ ln(10)
10
�2 Z ∞
�∞
exp
�� 1
2
�ζp2σ�
p2σ ln(10)
10
�2�
(4πσ2)1=2� dζ
and the integral is unity because it represents a normal distribution of meanp
2σln(10)=10.The expectation is, therefore,
E[10ζ=10] = exp
�σ ln(10)
10
�2
� (3.14)
If we truncate the normal distribution of ζ at �4p
2σ and 2p
2σ, then we rewrite Equa-tion (3.13) as
E[10ζ=10] =1
Q(�4)�Q(2)
Z 2p
2σ
�4p
2σ10ζ=10 :
exp�� ζ2
4σ2
�(4πσ2)1=2
� dζ; (3.15)
where
Q(k) =1p2π
Z ∞
kexp(�λ2=2) � dλ;
E[10ζ=10] = 1:023exp
�σ ln(10)
10
�2
�Z 2
p2σ
�4p
2σ
exp
��1
2
nζp2σ�
p2σ ln(10)
10
o2�
(4πσ2)1=2� dζ : (3.16)
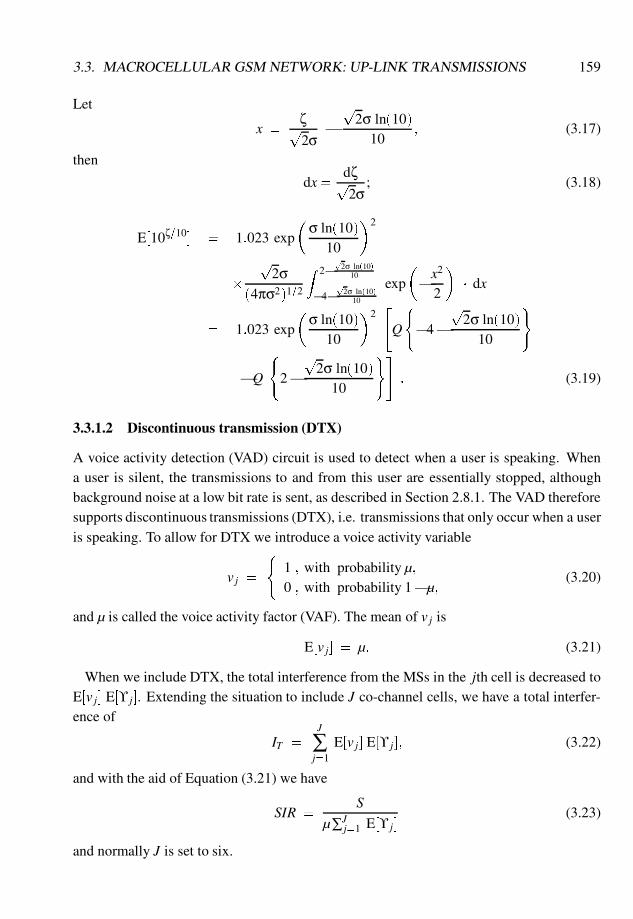
3.3. MACROCELLULAR GSM NETWORK: UP-LINK TRANSMISSIONS 159
Let
x =ζp
2σ�p
2σ ln(10)10
; (3.17)
then
dx=dζp2σ
; (3.18)
E[10ζ=10] = 1:023 exp
�σ ln(10)
10
�2
�p
2σ(4πσ2)1=2
Z 2�p
2σ ln(10)10
�4�p
2σ ln(10)10
exp
��x2
2
�� dx
= 1:023 exp
�σ ln(10)
10
�2"Q
(�4�
p2σ ln(10)
10
)
�Q
(2�
p2σ ln(10)
10
)#: (3.19)
3.3.1.2 Discontinuous transmission (DTX)
A voice activity detection (VAD) circuit is used to detect when a user is speaking. Whena user is silent, the transmissions to and from this user are essentially stopped, althoughbackground noise at a low bit rate is sent, as described in Section 2.8.1. The VAD thereforesupports discontinuous transmissions (DTX), i.e. transmissions that only occur when a useris speaking. To allow for DTX we introduce a voice activity variable
v j =
(1 ; with probability µ;
0 ; with probability 1�µ;
(3.20)
and µ is called the voice activity factor (VAF). The mean of v j is
E[v j] = µ: (3.21)
When we include DTX, the total interference from the MSs in the jth cell is decreased toE[v j] E[ϒ j]. Extending the situation to include J co-channel cells, we have a total interfer-ence of
IT =J
∑j=1
E[v j] E[ϒ j]; (3.22)
and with the aid of Equation (3.21) we have
SIR =S
µ∑Jj=1 E[ϒ j]
(3.23)
and normally J is set to six.
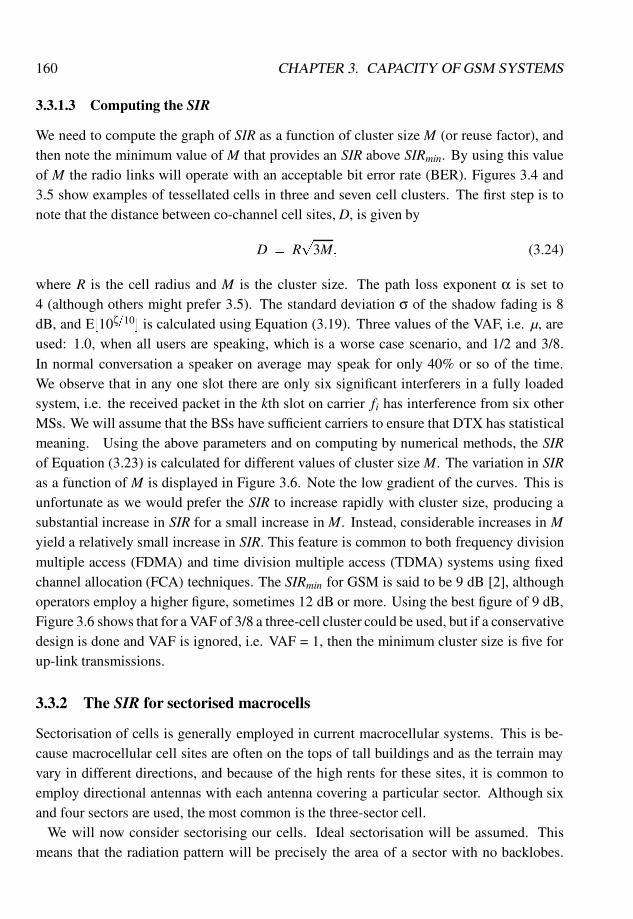
160 CHAPTER 3. CAPACITY OF GSM SYSTEMS
3.3.1.3 Computing the SIR
We need to compute the graph of SIR as a function of cluster size M (or reuse factor), andthen note the minimum value of M that provides an SIR above SIRmin. By using this valueof M the radio links will operate with an acceptable bit error rate (BER). Figures 3.4 and3.5 show examples of tessellated cells in three and seven cell clusters. The first step is tonote that the distance between co-channel cell sites, D, is given by
D = Rp
3M; (3.24)
where R is the cell radius and M is the cluster size. The path loss exponent α is set to4 (although others might prefer 3.5). The standard deviation σ of the shadow fading is 8dB, and E[10ζ=10] is calculated using Equation (3.19). Three values of the VAF, i.e. µ, areused: 1.0, when all users are speaking, which is a worse case scenario, and 1/2 and 3/8.In normal conversation a speaker on average may speak for only 40% or so of the time.We observe that in any one slot there are only six significant interferers in a fully loadedsystem, i.e. the received packet in the kth slot on carrier fi has interference from six otherMSs. We will assume that the BSs have sufficient carriers to ensure that DTX has statisticalmeaning. Using the above parameters and on computing by numerical methods, the SIRof Equation (3.23) is calculated for different values of cluster size M. The variation in SIRas a function of M is displayed in Figure 3.6. Note the low gradient of the curves. This isunfortunate as we would prefer the SIR to increase rapidly with cluster size, producing asubstantial increase in SIR for a small increase in M. Instead, considerable increases in Myield a relatively small increase in SIR. This feature is common to both frequency divisionmultiple access (FDMA) and time division multiple access (TDMA) systems using fixedchannel allocation (FCA) techniques. The SIRmin for GSM is said to be 9 dB [2], althoughoperators employ a higher figure, sometimes 12 dB or more. Using the best figure of 9 dB,Figure 3.6 shows that for a VAF of 3/8 a three-cell cluster could be used, but if a conservativedesign is done and VAF is ignored, i.e. VAF = 1, then the minimum cluster size is five forup-link transmissions.
3.3.2 The SIR for sectorised macrocells
Sectorisation of cells is generally employed in current macrocellular systems. This is be-cause macrocellular cell sites are often on the tops of tall buildings and as the terrain mayvary in different directions, and because of the high rents for these sites, it is common toemploy directional antennas with each antenna covering a particular sector. Although sixand four sectors are used, the most common is the three-sector cell.
We will now consider sectorising our cells. Ideal sectorisation will be assumed. Thismeans that the radiation pattern will be precisely the area of a sector with no backlobes.
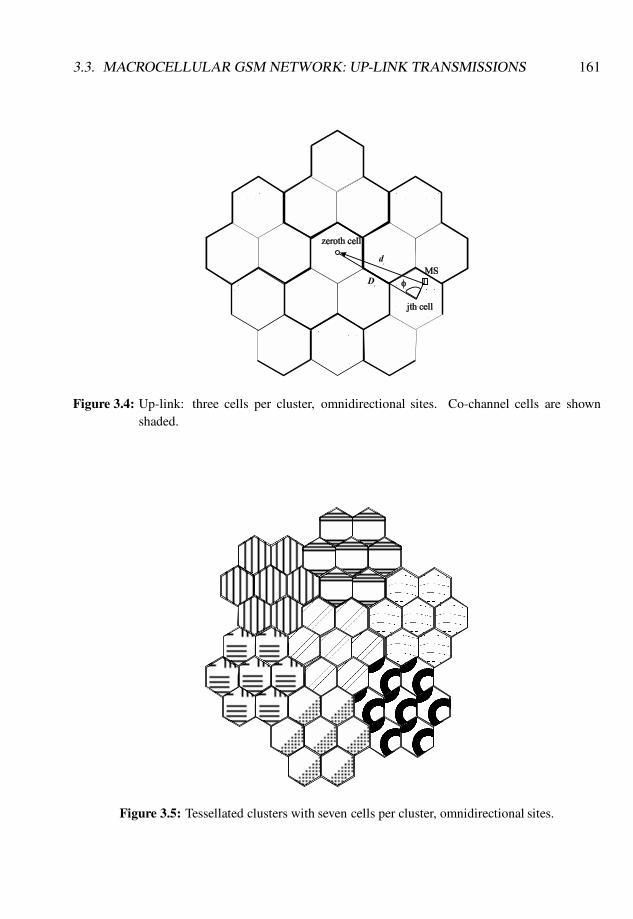
3.3. MACROCELLULAR GSM NETWORK: UP-LINK TRANSMISSIONS 161
Figure 3.4: Up-link: three cells per cluster, omnidirectional sites. Co-channel cells are shownshaded.
Figure 3.5: Tessellated clusters with seven cells per cluster, omnidirectional sites.

162 CHAPTER 3. CAPACITY OF GSM SYSTEMS
Figure 3.6: Up-link SIR versus number of cells per cluster.
The SIR will be calculated for different cluster sizes where each cell has three sectors. Thiswill eventually lead to us understand how sectorisation affects the traffic carried by thenetwork.
3.3.2.1 Sectorisation for three- and four-cell clusters
Figure 3.7 shows a three-cell cluster with three sectors per cell, while Figure 3.8 displaysa four-cell cluster with three sectors per cell. Note that sectorisation produces sectors thatare essentially smaller cells, and that the spectrum at each site has been partitioned intothree parts. The most apparent effect of sectorisation is to decrease the number of first tierco-channel cells from six to just two sectors. For the sectorised situation, Equation (3.12)becomes
E[ϒ j]
S=
3π
Z 1
0
Z 2π=3
0
�x
d j=R
�αE[10ζ=10] x dx dφ (3.25)
as φ is from 0 to 2π=3 and f (a) = 3=πR2. This equation is the interference-to-signal ratio(ISR) for the total interference in the zeroth sector from the jth sector. Since there are twosignificant interfering sectors, and allowing for DTX, the SIR for the three cell clusters withthree sectors per cell is
SIR =S
2µE[ϒ j]: (3.26)
Employing Equation (3.19), the SIR for the four cell clusters is 17.8, 20.8 and 22 dB forµ = 1; 1=2 and 3=8, respectively. The corresponding SIRs for the three-cell clusters are
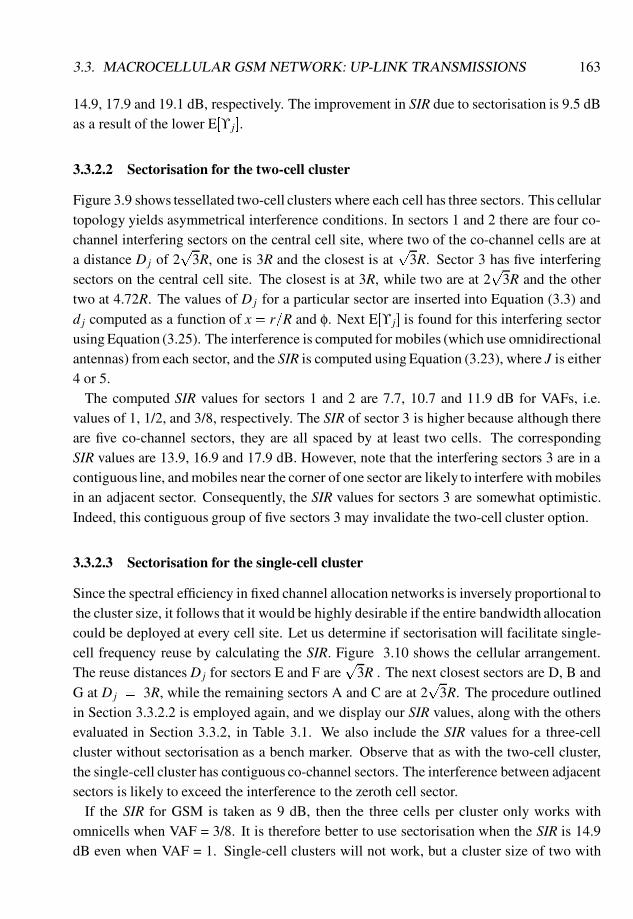
3.3. MACROCELLULAR GSM NETWORK: UP-LINK TRANSMISSIONS 163
14.9, 17.9 and 19.1 dB, respectively. The improvement in SIR due to sectorisation is 9.5 dBas a result of the lower E[ϒ j].
3.3.2.2 Sectorisation for the two-cell cluster
Figure 3.9 shows tessellated two-cell clusters where each cell has three sectors. This cellulartopology yields asymmetrical interference conditions. In sectors 1 and 2 there are four co-channel interfering sectors on the central cell site, where two of the co-channel cells are ata distance Dj of 2
p3R, one is 3R and the closest is at
p3R. Sector 3 has five interfering
sectors on the central cell site. The closest is at 3R, while two are at 2p
3R and the othertwo at 4.72R. The values of Dj for a particular sector are inserted into Equation (3.3) andd j computed as a function of x = r=R and φ. Next E[ϒ j] is found for this interfering sectorusing Equation (3.25). The interference is computed for mobiles (which use omnidirectionalantennas) from each sector, and the SIR is computed using Equation (3.23), where J is either4 or 5.
The computed SIR values for sectors 1 and 2 are 7.7, 10.7 and 11.9 dB for VAFs, i.e.values of 1, 1/2, and 3/8, respectively. The SIR of sector 3 is higher because although thereare five co-channel sectors, they are all spaced by at least two cells. The correspondingSIR values are 13.9, 16.9 and 17.9 dB. However, note that the interfering sectors 3 are in acontiguous line, and mobiles near the corner of one sector are likely to interfere with mobilesin an adjacent sector. Consequently, the SIR values for sectors 3 are somewhat optimistic.Indeed, this contiguous group of five sectors 3 may invalidate the two-cell cluster option.
3.3.2.3 Sectorisation for the single-cell cluster
Since the spectral efficiency in fixed channel allocation networks is inversely proportional tothe cluster size, it follows that it would be highly desirable if the entire bandwidth allocationcould be deployed at every cell site. Let us determine if sectorisation will facilitate single-cell frequency reuse by calculating the SIR. Figure 3.10 shows the cellular arrangement.The reuse distances Dj for sectors E and F are
p3R . The next closest sectors are D, B and
G at Dj = 3R, while the remaining sectors A and C are at 2p
3R. The procedure outlinedin Section 3.3.2.2 is employed again, and we display our SIR values, along with the othersevaluated in Section 3.3.2, in Table 3.1. We also include the SIR values for a three-cellcluster without sectorisation as a bench marker. Observe that as with the two-cell cluster,the single-cell cluster has contiguous co-channel sectors. The interference between adjacentsectors is likely to exceed the interference to the zeroth cell sector.
If the SIR for GSM is taken as 9 dB, then the three cells per cluster only works withomnicells when VAF = 3/8. It is therefore better to use sectorisation when the SIR is 14.9dB even when VAF = 1. Single-cell clusters will not work, but a cluster size of two with
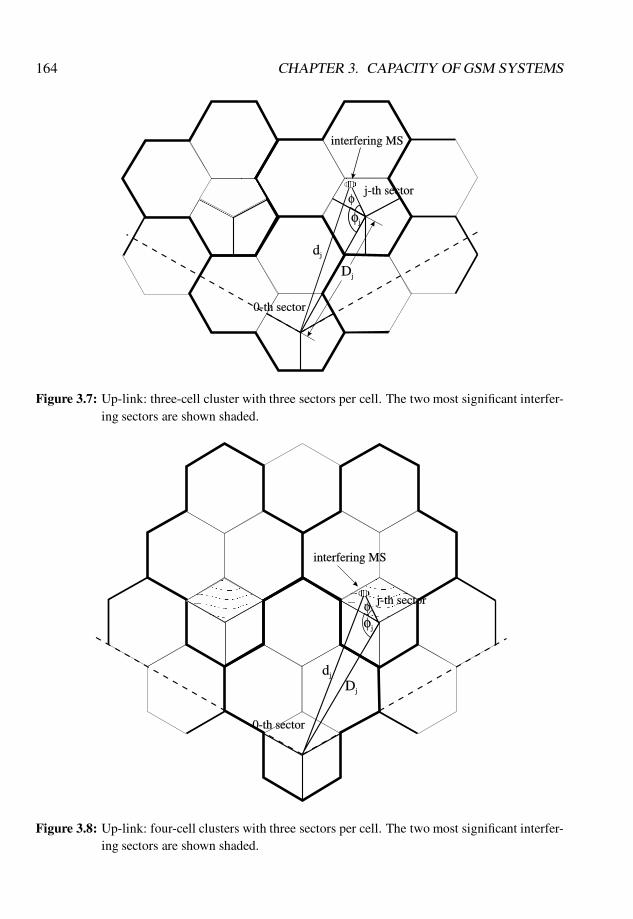
164 CHAPTER 3. CAPACITY OF GSM SYSTEMS
Dj
dj
j-th sector
φj
φ
interfering MS
0-th sector
Figure 3.7: Up-link: three-cell cluster with three sectors per cell. The two most significant interfer-ing sectors are shown shaded.
Dj
dj
j-th sector
φj
φ
interfering MS
0-th sector
Figure 3.8: Up-link: four-cell clusters with three sectors per cell. The two most significant interfer-ing sectors are shown shaded.
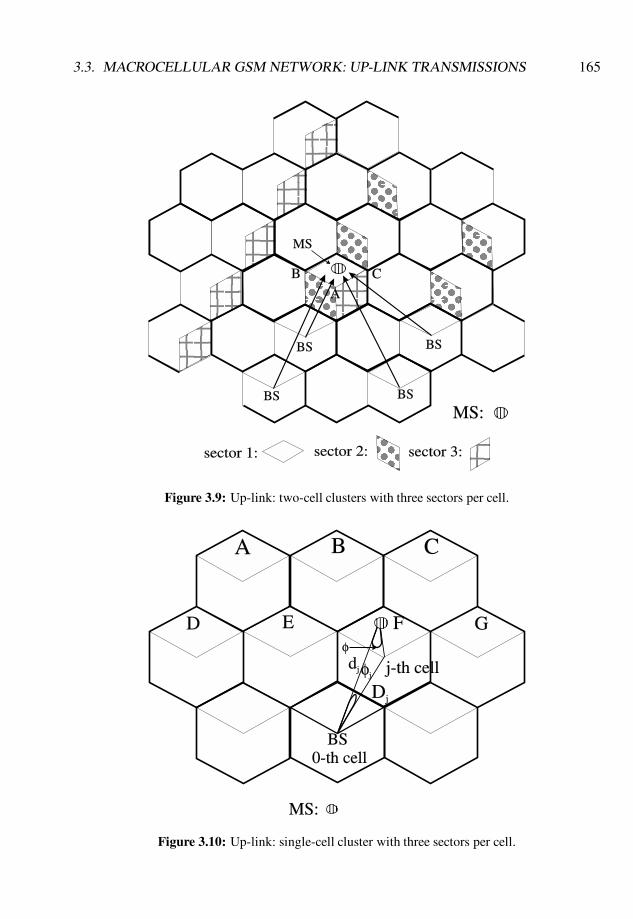
3.3. MACROCELLULAR GSM NETWORK: UP-LINK TRANSMISSIONS 165
sector 1: sector 3:sector 2:
MS:
B
BS
MS
BS
BS
BS
C
A
Figure 3.9: Up-link: two-cell clusters with three sectors per cell.
dj
Dj
MS:
BS0-th cell
j-th cell
A B C
E F GD
φj
φ
Figure 3.10: Up-link: single-cell cluster with three sectors per cell.
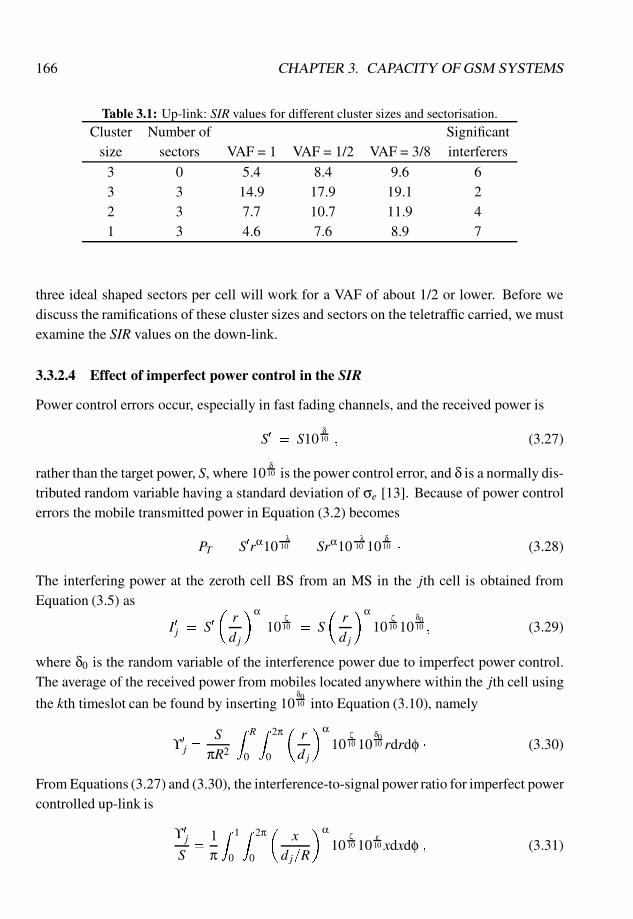
166 CHAPTER 3. CAPACITY OF GSM SYSTEMS
Table 3.1: Up-link: SIR values for different cluster sizes and sectorisation.Cluster Number of Significant
size sectors VAF = 1 VAF = 1/2 VAF = 3/8 interferers
3 0 5.4 8.4 9.6 63 3 14.9 17.9 19.1 22 3 7.7 10.7 11.9 41 3 4.6 7.6 8.9 7
three ideal shaped sectors per cell will work for a VAF of about 1/2 or lower. Before wediscuss the ramifications of these cluster sizes and sectors on the teletraffic carried, we mustexamine the SIR values on the down-link.
3.3.2.4 Effect of imperfect power control in the SIR
Power control errors occur, especially in fast fading channels, and the received power is
S0= S10
δ10 ; (3.27)
rather than the target power, S, where 10δ10 is the power control error, and δ is a normally dis-
tributed random variable having a standard deviation of σe [13]. Because of power controlerrors the mobile transmitted power in Equation (3.2) becomes
PT = S0rα10�λ10= Srα10
�λ10 10
δ10
� (3.28)
The interfering power at the zeroth cell BS from an MS in the jth cell is obtained fromEquation (3.5) as
I0
j = S0
�rd j
�α10
ζ10= S
�rd j
�α10
ζ10 10
δ010 ; (3.29)
where δ0 is the random variable of the interference power due to imperfect power control.The average of the received power from mobiles located anywhere within the jth cell using
the kth timeslot can be found by inserting 10δ010 into Equation (3.10), namely
ϒ0
j =S
πR2
Z R
0
Z 2π
0
�rd j
�α10
ζ10 10
δ010 rdrdφ � (3.30)
From Equations (3.27) and (3.30), the interference-to-signal power ratio for imperfect powercontrolled up-link is
ϒ0
j
S=
1π
Z 1
0
Z 2π
0
�x
d j=R
�α10
ζ10 10
ε10 xdxdφ ; (3.31)
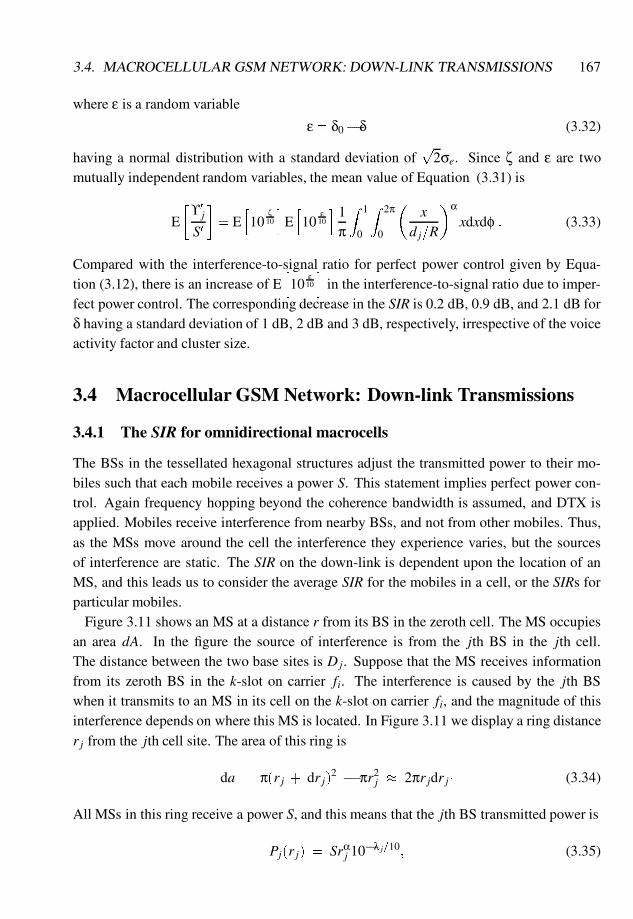
3.4. MACROCELLULAR GSM NETWORK: DOWN-LINK TRANSMISSIONS 167
where ε is a random variable
ε= δ0�δ (3.32)
having a normal distribution with a standard deviation ofp
2σe. Since ζ and ε are twomutually independent random variables, the mean value of Equation (3.31) is
E
�ϒ0
j
S0
�= E
h10
ζ10
iEh10
ε10
i 1π
Z 1
0
Z 2π
0
�x
d j=R
�αxdxdφ : (3.33)
Compared with the interference-to-signal ratio for perfect power control given by Equa-tion (3.12), there is an increase of E
h10
ε10
iin the interference-to-signal ratio due to imper-
fect power control. The corresponding decrease in the SIR is 0.2 dB, 0.9 dB, and 2.1 dB forδ having a standard deviation of 1 dB, 2 dB and 3 dB, respectively, irrespective of the voiceactivity factor and cluster size.
3.4 Macrocellular GSM Network: Down-link Transmissions
3.4.1 The SIR for omnidirectional macrocells
The BSs in the tessellated hexagonal structures adjust the transmitted power to their mo-biles such that each mobile receives a power S. This statement implies perfect power con-trol. Again frequency hopping beyond the coherence bandwidth is assumed, and DTX isapplied. Mobiles receive interference from nearby BSs, and not from other mobiles. Thus,as the MSs move around the cell the interference they experience varies, but the sourcesof interference are static. The SIR on the down-link is dependent upon the location of anMS, and this leads us to consider the average SIR for the mobiles in a cell, or the SIRs forparticular mobiles.
Figure 3.11 shows an MS at a distance r from its BS in the zeroth cell. The MS occupiesan area dA. In the figure the source of interference is from the jth BS in the jth cell.The distance between the two base sites is Dj. Suppose that the MS receives informationfrom its zeroth BS in the k-slot on carrier fi. The interference is caused by the jth BSwhen it transmits to an MS in its cell on the k-slot on carrier fi, and the magnitude of thisinterference depends on where this MS is located. In Figure 3.11 we display a ring distancer j from the jth cell site. The area of this ring is
da = π(r j + dr j)2 � πr2
j � 2πr jdr j� (3.34)
All MSs in this ring receive a power S, and this means that the jth BS transmitted power is
Pj(r j) = Srαj 10�λ j=10; (3.35)
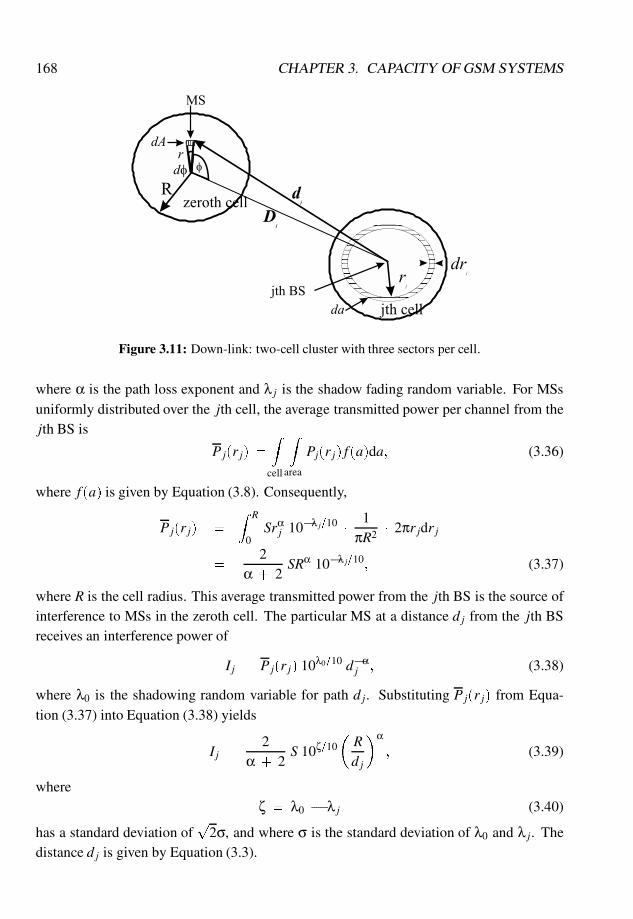
168 CHAPTER 3. CAPACITY OF GSM SYSTEMS
Figure 3.11: Down-link: two-cell cluster with three sectors per cell.
where α is the path loss exponent and λ j is the shadow fading random variable. For MSsuniformly distributed over the jth cell, the average transmitted power per channel from thejth BS is
Pj(r j) =Z
cell
Z
area
Pj(r j) f (a)da; (3.36)
where f (a) is given by Equation (3.8). Consequently,
Pj(r j) =Z R
0Srα
j 10�λ j=10�
1πR2 � 2πr jdr j
=2
α + 2SRα 10�λ j=10
; (3.37)
where R is the cell radius. This average transmitted power from the jth BS is the source ofinterference to MSs in the zeroth cell. The particular MS at a distance d j from the jth BSreceives an interference power of
I j = Pj(r j) 10λ0=10 d�αj ; (3.38)
where λ0 is the shadowing random variable for path d j. Substituting Pj(r j) from Equa-tion (3.37) into Equation (3.38) yields
I j =2
α + 2S 10ζ=10
�Rdj
�α; (3.39)
whereζ = λ0 � λ j (3.40)
has a standard deviation ofp
2σ, and where σ is the standard deviation of λ0 and λ j. Thedistance d j is given by Equation (3.3).
3.4. MACROCELLULAR GSM NETWORK: DOWN-LINK TRANSMISSIONS 169
3.4.1.1 Average SIR
The Nf carriers in the zeroth cell, associated with Nf users assigned to the kth slot, areuniformly distributed over the area of the cell. It is important to realise that for a uniformdistribution to have validity, Nf must be sufficiently large. This in turn means that the op-erator has a wide bandwidth at his disposal. We will now consider the average interferenceexperienced by mobiles in the zeroth cell from the jth BS. The area dA shown in Figure 3.11is rdφdr, and the PDF f (A) is again 1=πR2, and hence the interference average over the ze-roth cell is, with the aid of Equation (3.39),
ϒ j =Z 2π
0
Z R
0
�2S
α + 2� 10ζ=10
�
�Rdj
�α� 1πR2 � rdφdr (3.41)
and on normalising r by introducing x = r=R,
ϒ j =2S
(α + 2)π
Z 2π
0
Z 1
010ζ=10
�Rdj
�αxdφdx : (3.42)
Note that �d j
R
�2
=
�Dj
R
�2
+ x2 � 2
�Dj
R
�xcosφ
and that the number of cells per cluster from Equation (3.23) is
M =13
�Dj
R
�2
; (3.43)
giving �d j
R
�2
= 3M + x2 � 2p
3M xcosφ: (3.44)
Owing to frequency hopping, the expectation of I j is made with respect to the randomvariable ζ, because ζ is different for each hop. This expectation is
E�ϒ j�=
2S(α+2)π
Z 2π
0
Z 1
0Eh10
ζ10
i� Rdj
�αxdφdx ; (3.45)
where Eh10
ζ10
iis given by Equation (3.19). The SIR can be found from Equations (3.23)
and (3.45), namely
SI
=S
∑Jj=1 E [v j]E
�ϒ j�
=1
2µ(α+2)π ∑J
j=1R 2π
0
R 10 E
h10
ζ10
i�Rd j
�αxdφdx
� (3.46)
170 CHAPTER 3. CAPACITY OF GSM SYSTEMS
For a hexagonal pattern of cells there are six close interferers, as shown in Figure 3.12. Wecompute E
h10ζ=10
iin Equation (3.19) for a path loss exponent of α = 4, and for shadow
fading with a standard deviation of σ= 8. This expectation value is inserted into Equation(3.46) and the SIR found. When the number of cells per cluster M is changed, d j changes(as evident in Equation (3.44)), which in turn changes the SIR. Graphs of the SIR as afunction of the number of cells per cluster are displayed in Figure 3.13 for three differentvoice activity factors (VAFs) of 1, 1=2, and 3=8. For three cells per cluster, the average SIRsfor VAFs of 1, 1=2, 3=8 are 5:9 dB, 8:9 dB, and 10:1 dB, respectively. Compared with theSIR on the up-link system, the average SIR on the down-link system is 0:5 dB larger.
3.4.1.2 The SIR of mobiles in different locations
We now examine the SIR of the three-cell cluster arrangement for MSs at different locationswithin its cell, from the immediate vicinity of the BS (r = 0) to the cell boundary, r = R.As a consequence, those MSs near their BS will receive less interference power than MSsat locations away from their BS. From Equations (3.23) and (3.39), the SIR is
SI=
1
∑Jj=1 E [v j]E
hϒ j
S
i =1
2µα+2 ∑J
j=1 Eh10
ζ10
i�Rd j
�α ; (3.47)
where Eh10
ζ10
iis given by Equation (3.19). For three cells per cluster, the graphs of the
SIR for MSs along a line from the zeroth BS site to a corner of the zeroth cell, is shown inFigure 3.14. The worst SIR occurs when mobiles are located at the corner (x= 1) where theSIRs are 4:8 dB, 7:8 dB, and 9:2 dB for VAFs of 1, 1=2, and 3=8, respectively. The worstcase SIR is about 1 dB less than the average SIR, while the SIR difference between the bestand worst case is about 2 dB.
3.4.2 The SIR for sectorised macrocells
By dividing each cell into three sectors, as we did for the up-link in Section 3.3, we havethe arrangement shown in Figure 3.15. By averaging over the sector area, the average SIRcan be found from Equation (3.46), namely
SI=
S
∑Jj=1 E [v j]E
�ϒ j
� =1
6µ(α+2)π ∑J
j=1R 2π
30
R 10 E
h10
ζ10
i�Rd j
�αxdφdx
� (3.48)
From Equation (3.47), the SIR for mobiles at different locations is
SI
=S
∑Jj=1 E [v j]E
�ϒ j
� =1
2µα+2 ∑J
j=1 Eh10
ζ10
i�Rd j
�α � (3.49)

3.4. MACROCELLULAR GSM NETWORK: DOWN-LINK TRANSMISSIONS 171
Figure 3.12: Down-link: three-cell cluster, omnidirectional sites.
Figure 3.13: Down-link SIR as a function of cluster size for different VAFs. No sectorisation.
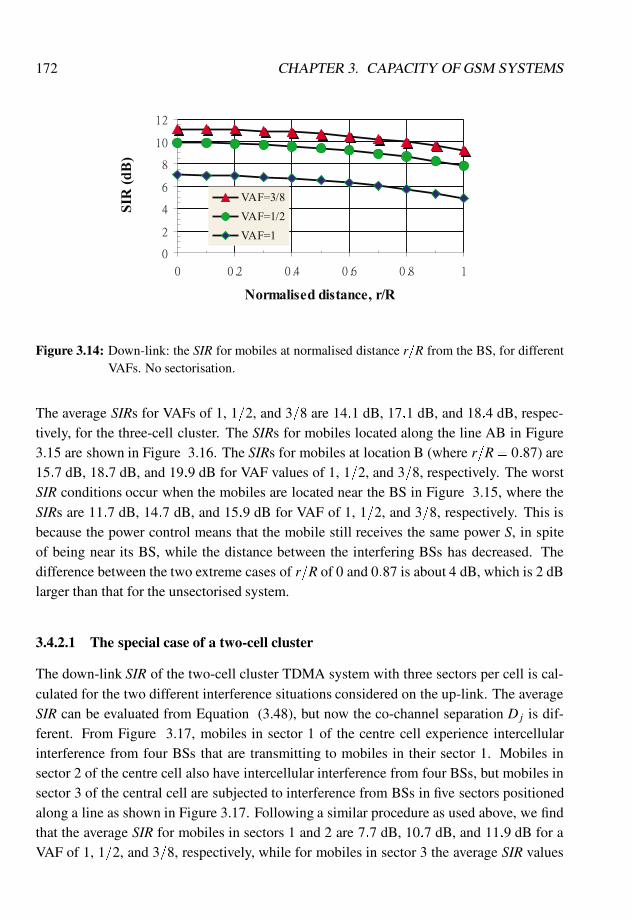
172 CHAPTER 3. CAPACITY OF GSM SYSTEMS
Figure 3.14: Down-link: the SIR for mobiles at normalised distance r=R from the BS, for differentVAFs. No sectorisation.
The average SIRs for VAFs of 1, 1=2, and 3=8 are 14:1 dB, 17:1 dB, and 18:4 dB, respec-tively, for the three-cell cluster. The SIRs for mobiles located along the line AB in Figure3.15 are shown in Figure 3.16. The SIRs for mobiles at location B (where r=R= 0:87) are15:7 dB, 18:7 dB, and 19:9 dB for VAF values of 1, 1=2, and 3=8, respectively. The worstSIR conditions occur when the mobiles are located near the BS in Figure 3.15, where theSIRs are 11:7 dB, 14:7 dB, and 15:9 dB for VAF of 1, 1=2, and 3=8, respectively. This isbecause the power control means that the mobile still receives the same power S, in spiteof being near its BS, while the distance between the interfering BSs has decreased. Thedifference between the two extreme cases of r=R of 0 and 0:87 is about 4 dB, which is 2 dBlarger than that for the unsectorised system.
3.4.2.1 The special case of a two-cell cluster
The down-link SIR of the two-cell cluster TDMA system with three sectors per cell is cal-culated for the two different interference situations considered on the up-link. The averageSIR can be evaluated from Equation (3.48), but now the co-channel separation Dj is dif-ferent. From Figure 3.17, mobiles in sector 1 of the centre cell experience intercellularinterference from four BSs that are transmitting to mobiles in their sector 1. Mobiles insector 2 of the centre cell also have intercellular interference from four BSs, but mobiles insector 3 of the central cell are subjected to interference from BSs in five sectors positionedalong a line as shown in Figure 3.17. Following a similar procedure as used above, we findthat the average SIR for mobiles in sectors 1 and 2 are 7:7 dB, 10:7 dB, and 11:9 dB for aVAF of 1, 1=2, and 3=8, respectively, while for mobiles in sector 3 the average SIR values
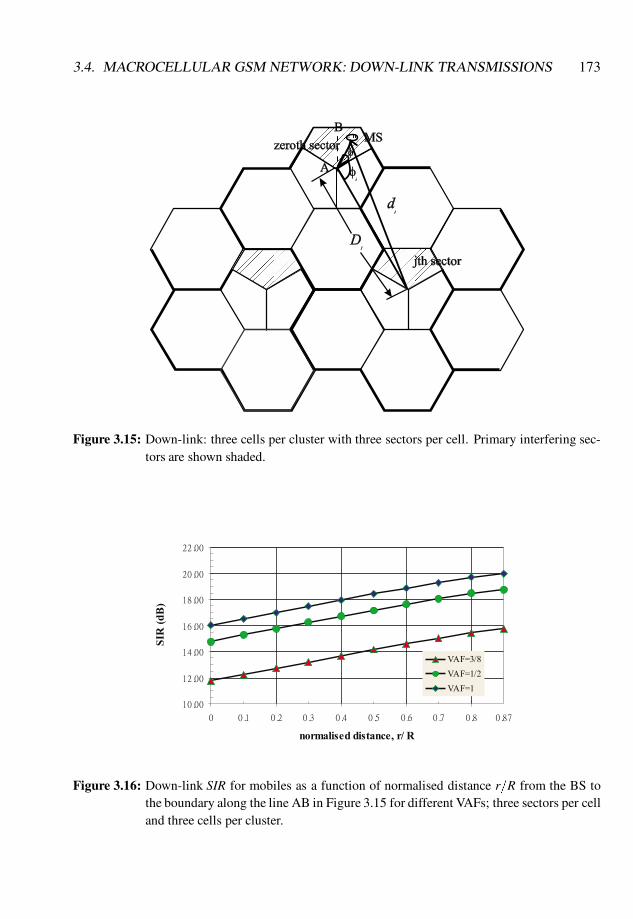
3.4. MACROCELLULAR GSM NETWORK: DOWN-LINK TRANSMISSIONS 173
Figure 3.15: Down-link: three cells per cluster with three sectors per cell. Primary interfering sec-tors are shown shaded.
Figure 3.16: Down-link SIR for mobiles as a function of normalised distance r=R from the BS tothe boundary along the line AB in Figure 3.15 for different VAFs; three sectors per celland three cells per cluster.
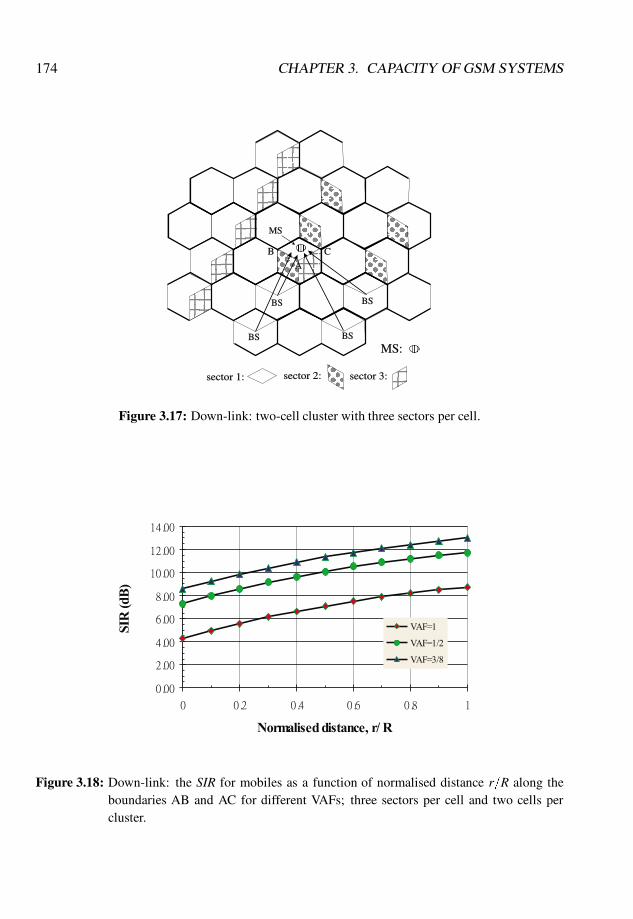
174 CHAPTER 3. CAPACITY OF GSM SYSTEMS
sector 1: sector 3:sector 2:
MS:
B
BS
MS
BS
BS
BS
C
A
Figure 3.17: Down-link: two-cell cluster with three sectors per cell.
Figure 3.18: Down-link: the SIR for mobiles as a function of normalised distance r=R along theboundaries AB and AC for different VAFs; three sectors per cell and two cells percluster.
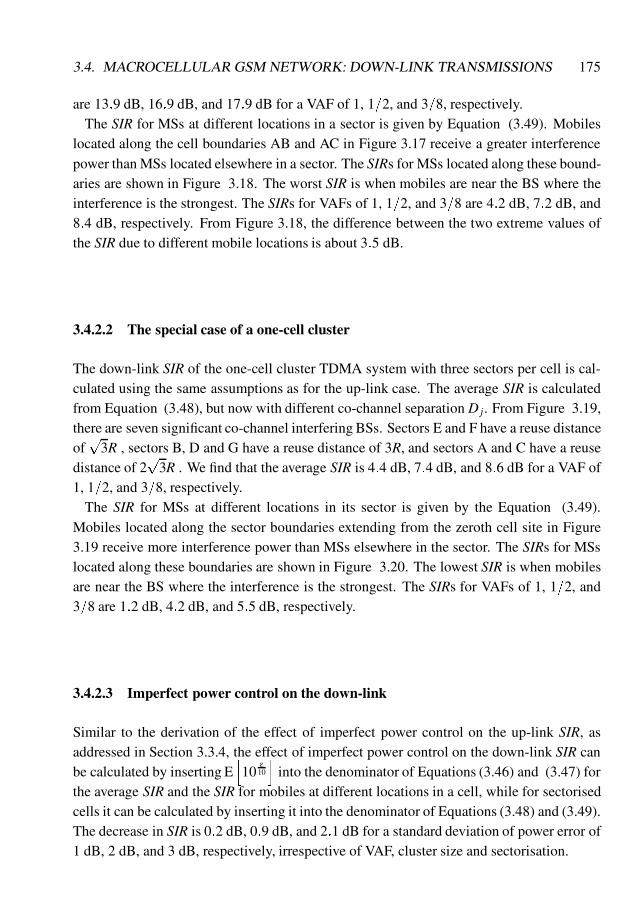
3.4. MACROCELLULAR GSM NETWORK: DOWN-LINK TRANSMISSIONS 175
are 13:9 dB, 16:9 dB, and 17:9 dB for a VAF of 1, 1=2, and 3=8, respectively.The SIR for MSs at different locations in a sector is given by Equation (3.49). Mobiles
located along the cell boundaries AB and AC in Figure 3.17 receive a greater interferencepower than MSs located elsewhere in a sector. The SIRs for MSs located along these bound-aries are shown in Figure 3.18. The worst SIR is when mobiles are near the BS where theinterference is the strongest. The SIRs for VAFs of 1, 1=2, and 3=8 are 4:2 dB, 7:2 dB, and8:4 dB, respectively. From Figure 3.18, the difference between the two extreme values ofthe SIR due to different mobile locations is about 3:5 dB.
3.4.2.2 The special case of a one-cell cluster
The down-link SIR of the one-cell cluster TDMA system with three sectors per cell is cal-culated using the same assumptions as for the up-link case. The average SIR is calculatedfrom Equation (3.48), but now with different co-channel separation Dj. From Figure 3.19,there are seven significant co-channel interfering BSs. Sectors E and F have a reuse distanceofp
3R , sectors B, D and G have a reuse distance of 3R, and sectors A and C have a reusedistance of 2
p3R . We find that the average SIR is 4:4 dB, 7:4 dB, and 8:6 dB for a VAF of
1, 1=2, and 3=8, respectively.The SIR for MSs at different locations in its sector is given by the Equation (3.49).
Mobiles located along the sector boundaries extending from the zeroth cell site in Figure3.19 receive more interference power than MSs elsewhere in the sector. The SIRs for MSslocated along these boundaries are shown in Figure 3.20. The lowest SIR is when mobilesare near the BS where the interference is the strongest. The SIRs for VAFs of 1, 1=2, and3=8 are 1:2 dB, 4:2 dB, and 5:5 dB, respectively.
3.4.2.3 Imperfect power control on the down-link
Similar to the derivation of the effect of imperfect power control on the up-link SIR, asaddressed in Section 3.3.4, the effect of imperfect power control on the down-link SIR canbe calculated by inserting E
h10
ε10
iinto the denominator of Equations (3.46) and (3.47) for
the average SIR and the SIR for mobiles at different locations in a cell, while for sectorisedcells it can be calculated by inserting it into the denominator of Equations (3.48) and (3.49).The decrease in SIR is 0:2 dB, 0:9 dB, and 2:1 dB for a standard deviation of power error of1 dB, 2 dB, and 3 dB, respectively, irrespective of VAF, cluster size and sectorisation.
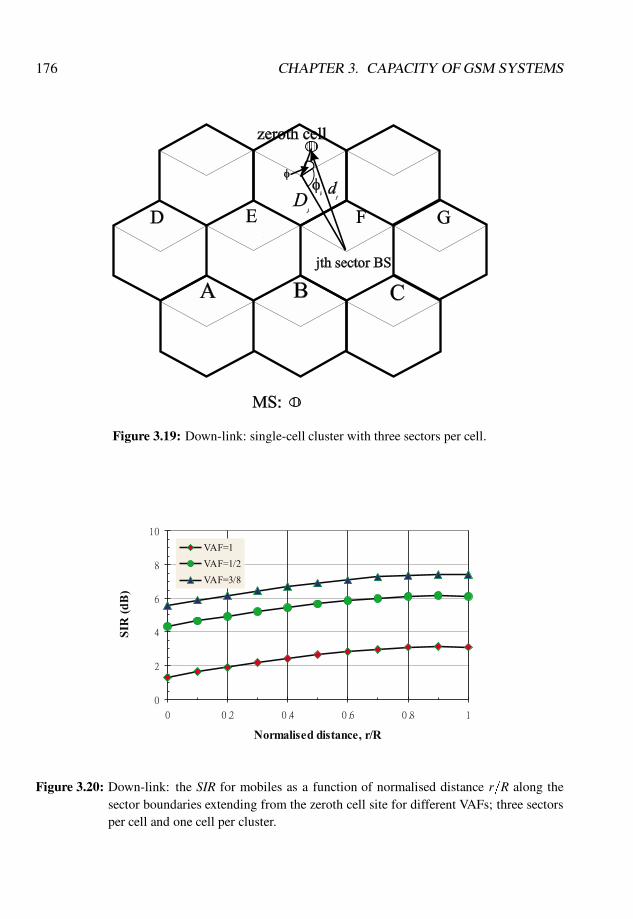
176 CHAPTER 3. CAPACITY OF GSM SYSTEMS
Figure 3.19: Down-link: single-cell cluster with three sectors per cell.
Figure 3.20: Down-link: the SIR for mobiles as a function of normalised distance r=R along thesector boundaries extending from the zeroth cell site for different VAFs; three sectorsper cell and one cell per cluster.
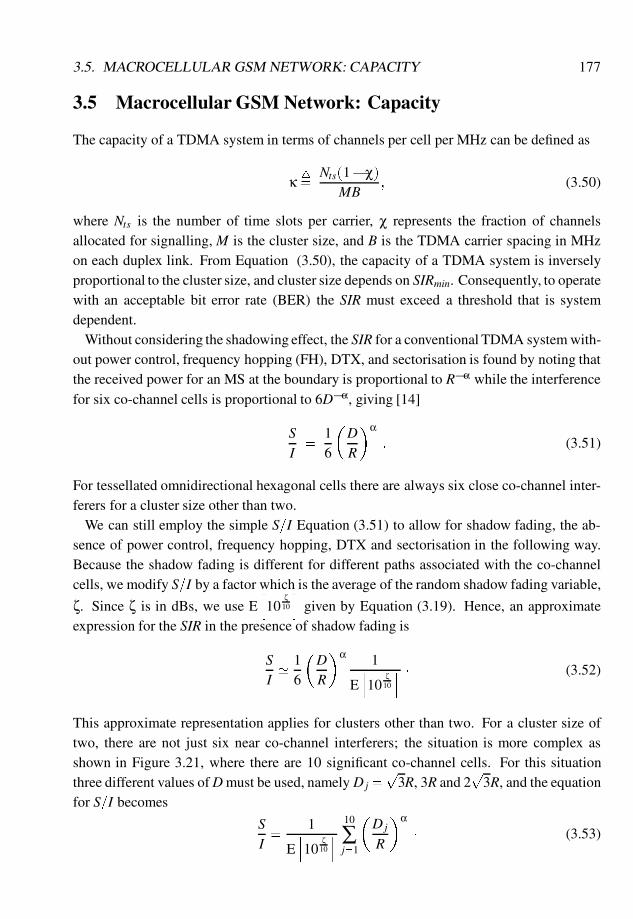
3.5. MACROCELLULAR GSM NETWORK: CAPACITY 177
3.5 Macrocellular GSM Network: Capacity
The capacity of a TDMA system in terms of channels per cell per MHz can be defined as
κ 4=Nts(1�χ)
MB; (3.50)
where Nts is the number of time slots per carrier, χ represents the fraction of channelsallocated for signalling, M is the cluster size, and B is the TDMA carrier spacing in MHzon each duplex link. From Equation (3.50), the capacity of a TDMA system is inverselyproportional to the cluster size, and cluster size depends on SIRmin. Consequently, to operatewith an acceptable bit error rate (BER) the SIR must exceed a threshold that is systemdependent.
Without considering the shadowing effect, the SIR for a conventional TDMA system with-out power control, frequency hopping (FH), DTX, and sectorisation is found by noting thatthe received power for an MS at the boundary is proportional to R�α while the interferencefor six co-channel cells is proportional to 6D�α, giving [14]
SI=
16
�DR
�α: (3.51)
For tessellated omnidirectional hexagonal cells there are always six close co-channel inter-ferers for a cluster size other than two.
We can still employ the simple S=I Equation (3.51) to allow for shadow fading, the ab-sence of power control, frequency hopping, DTX and sectorisation in the following way.Because the shadow fading is different for different paths associated with the co-channelcells, we modify S=I by a factor which is the average of the random shadow fading variable,
ζ. Since ζ is in dBs, we use Eh10
ζ10
igiven by Equation (3.19). Hence, an approximate
expression for the SIR in the presence of shadow fading is
SI' 1
6
�DR
�α 1
Eh10
ζ10
i � (3.52)
This approximate representation applies for clusters other than two. For a cluster size oftwo, there are not just six near co-channel interferers; the situation is more complex asshown in Figure 3.21, where there are 10 significant co-channel cells. For this situationthree different values of D must be used, namely Dj =
p3R, 3R and 2
p3R, and the equation
for S=I becomes
SI=
1
Eh10
ζ10
i 10
∑j=1
�Dj
R
�α� (3.53)
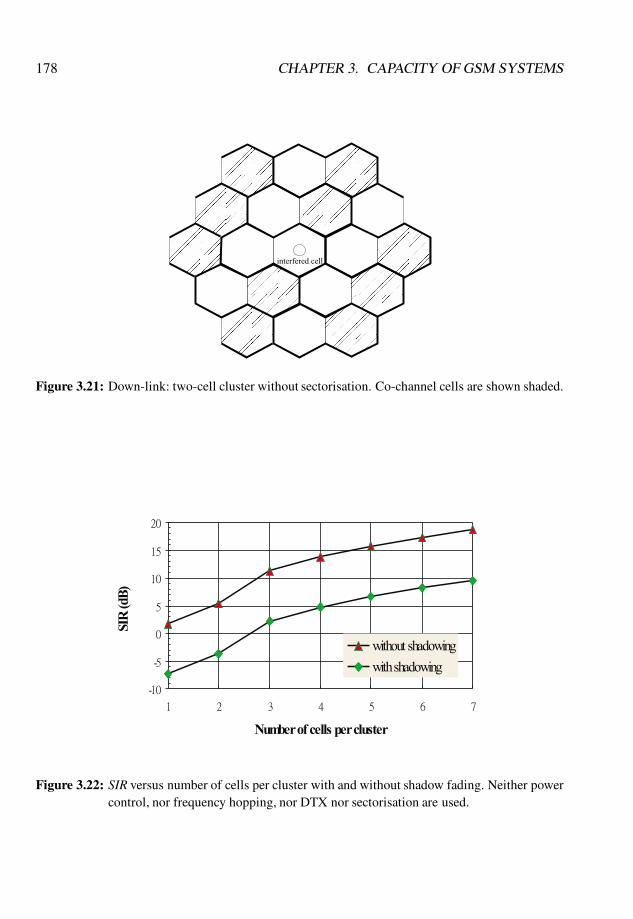
178 CHAPTER 3. CAPACITY OF GSM SYSTEMS
Figure 3.21: Down-link: two-cell cluster without sectorisation. Co-channel cells are shown shaded.
Figure 3.22: SIR versus number of cells per cluster with and without shadow fading. Neither powercontrol, nor frequency hopping, nor DTX nor sectorisation are used.
3.5. MACROCELLULAR GSM NETWORK: CAPACITY 179
For an α of 4, the SIRs without and with shadowing are computed for the basic TDMAsystem that does not have DTX, power control or FH, and the results are displayed in Figure3.22.
Suppose the minimal required SIR is 9 dB, then if there is no power control, no frequencyhopping, no DTX, and no sectorisation, then the cluster size must be at least seven. Bydividing a cell into three sectors, a gain of 4:8 dB can be attained, and the cluster sizereduces to four. With perfect power control, frequency hopping, and DTX with a VAF of1=2, the system can operate in a four-cell cluster using omnicells. By dividing each cellinto three sectors, a three-cell cluster is theoretically feasible, even without DTX. Althoughthe average SIR of the two-cell cluster with sectorisation is above 9 dB for a VAF of 1=2,as shown in Figure 3.18, the worst SIR on the down-link is below 9 dB for mobiles locatednear the BS (r< 0:3R). The minimal cluster size for an SIR of 9 dB is four cells per clusterwithout sectorisation or three cells per cluster with sectorisation. The minimum SIR valueof 9 dB is often quoted for GSM, although operators tend to design for a higher figure, suchas 12 dB or even as high as 16 dB.
For a carrier spacing of B= 200 kHz, Nts=8 channels per carrier, and χ = 0:1, the systemcapacity is 12, 9 and 5 channels per MHz per cell for omnicell sites and 3, 4, and 7 cells percluster, respectively. For a three-cell cluster with three sectors per cell, the capacity is 15channels per MHz per cell or five channels per sector per MHz. Without sectorisation, theminimal cluster size is three and four, yielding a capacity of 12 and 9 channels per MHz percell for a VAF of 3=8 and 1=2, respectively.
3.5.1 Effect of sectorisation on teletraffic
For ideal directional antennae with an infinite front-to-back ratio, the introduction of sec-torisation in a TDMA system provides a gain of 4:8 dB and 9:5 dB in the SIR for systemswithout and with both power control and frequency hopping, respectively. For a TDMAsystem without frequency hopping and power control, the 4:8 dB gain in the SIR due tothree sectors per cell can reduce the cluster size from seven to four. Hence the capacity in-creases by a factor of up to 7=4. By using frequency hopping, power control, and DTX, thesystem is able to function with four cells per cluster without sectorisation. Even when weapply frequency hopping, power control, sectorisation, and with or without DTX, the opti-mal cluster size is three. However, the number of channels per sector is decreased by threetimes compared with an unsectorised cell. With three sectors per cell, there are NfNts=3channels per sector, where Nf is the number of carriers per cell site. The offered traffic persector is Πs, and the total offered traffic per cell site is 3Πs. Without sectorisation there areNtsNf channels per cell site, and the offered traffic is Π. For a given blocking probability of2% and Nts = 8 time slots per carrier, the offered traffic versus number of carriers per cellsite for systems with and without sectorisation is shown in Figure 3.23. There is a loss of
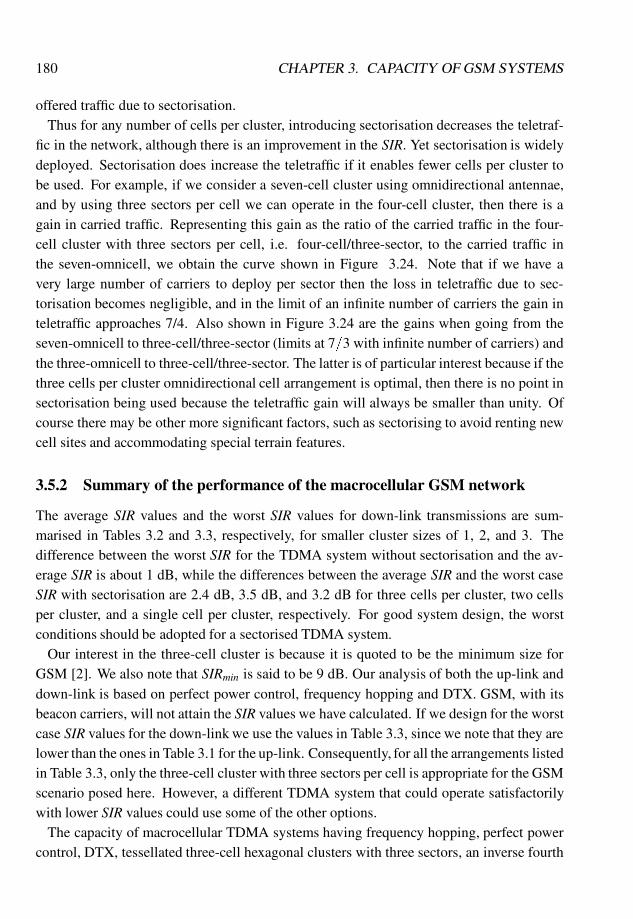
180 CHAPTER 3. CAPACITY OF GSM SYSTEMS
offered traffic due to sectorisation.Thus for any number of cells per cluster, introducing sectorisation decreases the teletraf-
fic in the network, although there is an improvement in the SIR. Yet sectorisation is widelydeployed. Sectorisation does increase the teletraffic if it enables fewer cells per cluster tobe used. For example, if we consider a seven-cell cluster using omnidirectional antennae,and by using three sectors per cell we can operate in the four-cell cluster, then there is again in carried traffic. Representing this gain as the ratio of the carried traffic in the four-cell cluster with three sectors per cell, i.e. four-cell/three-sector, to the carried traffic inthe seven-omnicell, we obtain the curve shown in Figure 3.24. Note that if we have avery large number of carriers to deploy per sector then the loss in teletraffic due to sec-torisation becomes negligible, and in the limit of an infinite number of carriers the gain inteletraffic approaches 7/4. Also shown in Figure 3.24 are the gains when going from theseven-omnicell to three-cell/three-sector (limits at 7=3 with infinite number of carriers) andthe three-omnicell to three-cell/three-sector. The latter is of particular interest because if thethree cells per cluster omnidirectional cell arrangement is optimal, then there is no point insectorisation being used because the teletraffic gain will always be smaller than unity. Ofcourse there may be other more significant factors, such as sectorising to avoid renting newcell sites and accommodating special terrain features.
3.5.2 Summary of the performance of the macrocellular GSM network
The average SIR values and the worst SIR values for down-link transmissions are sum-marised in Tables 3.2 and 3.3, respectively, for smaller cluster sizes of 1, 2, and 3. Thedifference between the worst SIR for the TDMA system without sectorisation and the av-erage SIR is about 1 dB, while the differences between the average SIR and the worst caseSIR with sectorisation are 2.4 dB, 3.5 dB, and 3.2 dB for three cells per cluster, two cellsper cluster, and a single cell per cluster, respectively. For good system design, the worstconditions should be adopted for a sectorised TDMA system.
Our interest in the three-cell cluster is because it is quoted to be the minimum size forGSM [2]. We also note that SIRmin is said to be 9 dB. Our analysis of both the up-link anddown-link is based on perfect power control, frequency hopping and DTX. GSM, with itsbeacon carriers, will not attain the SIR values we have calculated. If we design for the worstcase SIR values for the down-link we use the values in Table 3.3, since we note that they arelower than the ones in Table 3.1 for the up-link. Consequently, for all the arrangements listedin Table 3.3, only the three-cell cluster with three sectors per cell is appropriate for the GSMscenario posed here. However, a different TDMA system that could operate satisfactorilywith lower SIR values could use some of the other options.
The capacity of macrocellular TDMA systems having frequency hopping, perfect powercontrol, DTX, tessellated three-cell hexagonal clusters with three sectors, an inverse fourth
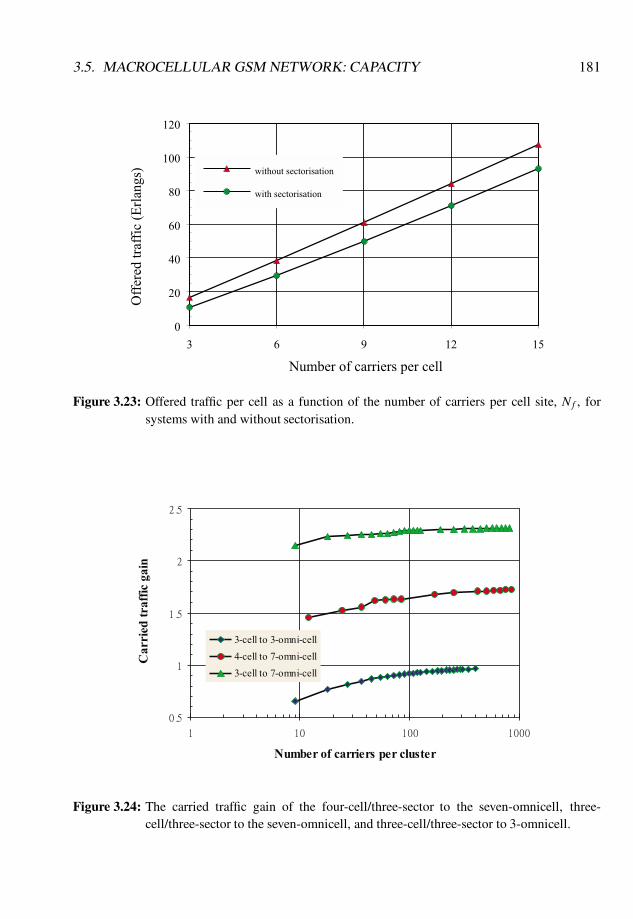
3.5. MACROCELLULAR GSM NETWORK: CAPACITY 181
Figure 3.23: Offered traffic per cell as a function of the number of carriers per cell site, Nf , forsystems with and without sectorisation.
Figure 3.24: The carried traffic gain of the four-cell/three-sector to the seven-omnicell, three-cell/three-sector to the seven-omnicell, and three-cell/three-sector to 3-omnicell.
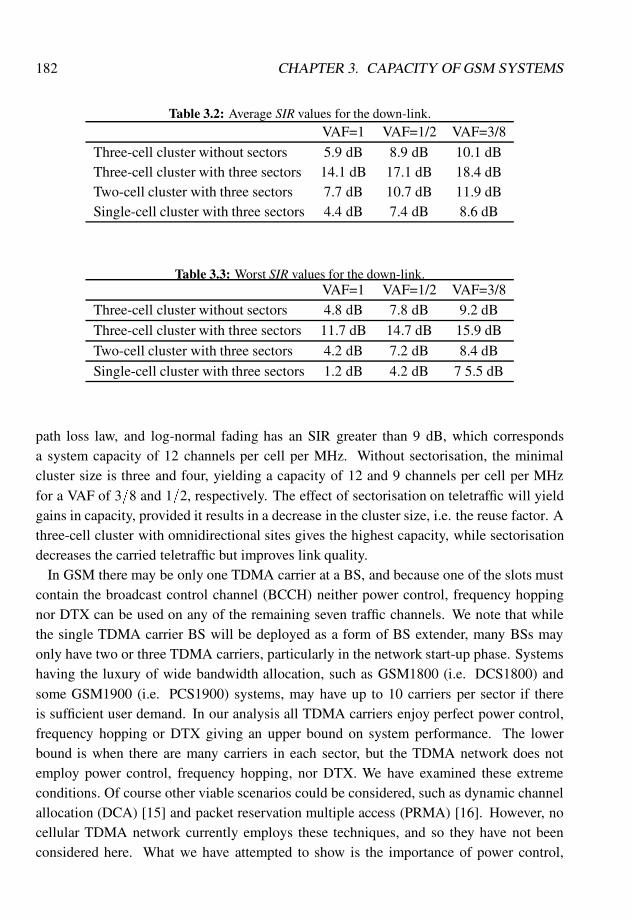
182 CHAPTER 3. CAPACITY OF GSM SYSTEMS
Table 3.2: Average SIR values for the down-link.VAF=1 VAF=1/2 VAF=3/8
Three-cell cluster without sectors 5.9 dB 8.9 dB 10.1 dBThree-cell cluster with three sectors 14.1 dB 17.1 dB 18.4 dBTwo-cell cluster with three sectors 7.7 dB 10.7 dB 11.9 dBSingle-cell cluster with three sectors 4.4 dB 7.4 dB 8.6 dB
Table 3.3: Worst SIR values for the down-link.VAF=1 VAF=1/2 VAF=3/8
Three-cell cluster without sectors 4.8 dB 7.8 dB 9.2 dB
Three-cell cluster with three sectors 11.7 dB 14.7 dB 15.9 dB
Two-cell cluster with three sectors 4.2 dB 7.2 dB 8.4 dB
Single-cell cluster with three sectors 1.2 dB 4.2 dB 7 5.5 dB
path loss law, and log-normal fading has an SIR greater than 9 dB, which correspondsa system capacity of 12 channels per cell per MHz. Without sectorisation, the minimalcluster size is three and four, yielding a capacity of 12 and 9 channels per cell per MHzfor a VAF of 3=8 and 1=2, respectively. The effect of sectorisation on teletraffic will yieldgains in capacity, provided it results in a decrease in the cluster size, i.e. the reuse factor. Athree-cell cluster with omnidirectional sites gives the highest capacity, while sectorisationdecreases the carried teletraffic but improves link quality.
In GSM there may be only one TDMA carrier at a BS, and because one of the slots mustcontain the broadcast control channel (BCCH) neither power control, frequency hoppingnor DTX can be used on any of the remaining seven traffic channels. We note that whilethe single TDMA carrier BS will be deployed as a form of BS extender, many BSs mayonly have two or three TDMA carriers, particularly in the network start-up phase. Systemshaving the luxury of wide bandwidth allocation, such as GSM1800 (i.e. DCS1800) andsome GSM1900 (i.e. PCS1900) systems, may have up to 10 carriers per sector if thereis sufficient user demand. In our analysis all TDMA carriers enjoy perfect power control,frequency hopping or DTX giving an upper bound on system performance. The lowerbound is when there are many carriers in each sector, but the TDMA network does notemploy power control, frequency hopping, nor DTX. We have examined these extremeconditions. Of course other viable scenarios could be considered, such as dynamic channelallocation (DCA) [15] and packet reservation multiple access (PRMA) [16]. However, nocellular TDMA network currently employs these techniques, and so they have not beenconsidered here. What we have attempted to show is the importance of power control,

3.6. MICROCELLULAR GSM NETWORK 183
frequency hopping and DTX on system performance, and the role of sectorisation.
3.6 Microcellular GSM Network
High densities of teletraffic in city centres can be accommodated by a microcellular per-sonal communications network (PCN) [17–23]. Small base stations (BSs) located in thestreets with their antennae below the urban sky-line provide radio coverage that is largelydependent on the road topology, position and cross-sectional area of the buildings and thelocal terrain and vegetation. For cities with irregular street patterns, as exemplified by thecity of London, the microcells also are irregularly shaped. Cities, such as Manhattan, thathave grid patterns of streets and block shape buildings yield regularly shaped microcells. Inthis section we analyse the latter microcellular patterns because of their relative simplicity.However, our theory can be modified to accommodate less regular microcellular structures.
We consider two microcellular arrangements. Figure 3.25 shows tessellated cross-shapedcity microcells formed by positioning the BSs at street intersections. Rectangular-shapedmicrocells that occupy a side of a city block are shown in Figure 3.26. When time divisionmultiple access (TDMA) systems are deployed, each cluster reuses the allotted spectrum,with the spectrum partitioned between the microcells within the cluster. We assume that thispartitioning results in the equal bandwidth assignment for each microcell. Since microcellsin different clusters use the same bandwidth we must separate them by sufficient distancesto yield a level of co-channel interference that can be tolerated by the TDMA radio link. InFigures 3.25 and 3.26 the cluster sizes are two and four, respectively. The consequences ofthe differences in these cluster sizes on capacity will be evaluated.
The city street microcells shown in Figures 3.25 and 3.26 are formed by controlling theradiated power levels to provide acceptable communications at the microcell boundaries.Although there will be penetration of electromagnetic energy into buildings this does notaffect the shape of the street microcell, assuming the buildings are of a similar type. Whilethe microcell boundary is considered to be half a city block from its BS, the radiation fromboth BS and mobile stations (MSs) will extend well beyond this microcellular boundary andthereby produce cochannel interference.
The capacity of cellular radio networks is co-channel interference limited. Co-channelinterference will decrease if the transmitted power to and from all mobiles is decreasedwhile ensuring that the received power level is sufficiently high to ensure acceptable linkquality. Similarly, discontinuous transmission (DTX), where users do not transmit whenthey are not speaking, causes co-channel interference to decrease. As users are assigned aparticular slot in a TDMA frame, the interference comes from other users communicatingin the same slot and on the same frequency in cells in the neighbouring clusters. Duringany particular time slot the interference is decreased if some of the co-channel users are not
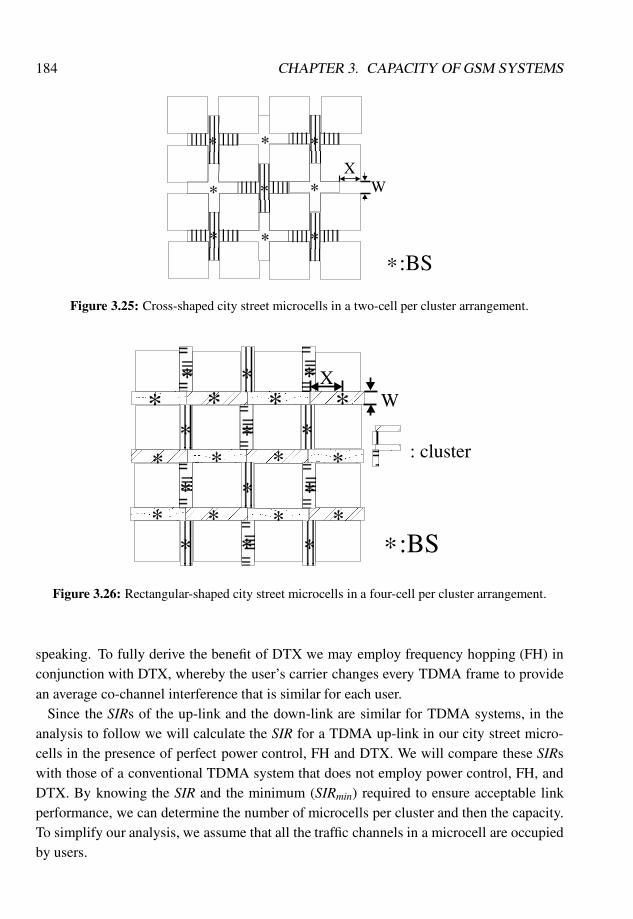
184 CHAPTER 3. CAPACITY OF GSM SYSTEMS
W
∗:BS
***
***
***
X
Figure 3.25: Cross-shaped city street microcells in a two-cell per cluster arrangement.
X
: cluster
∗:BS
W
**
*
**
*
*
*
**
*
*
*
****
* ****
*
*
Figure 3.26: Rectangular-shaped city street microcells in a four-cell per cluster arrangement.
speaking. To fully derive the benefit of DTX we may employ frequency hopping (FH) inconjunction with DTX, whereby the user’s carrier changes every TDMA frame to providean average co-channel interference that is similar for each user.
Since the SIRs of the up-link and the down-link are similar for TDMA systems, in theanalysis to follow we will calculate the SIR for a TDMA up-link in our city street micro-cells in the presence of perfect power control, FH and DTX. We will compare these SIRswith those of a conventional TDMA system that does not employ power control, FH, andDTX. By knowing the SIR and the minimum (SIRmin) required to ensure acceptable linkperformance, we can determine the number of microcells per cluster and then the capacity.To simplify our analysis, we assume that all the traffic channels in a microcell are occupiedby users.
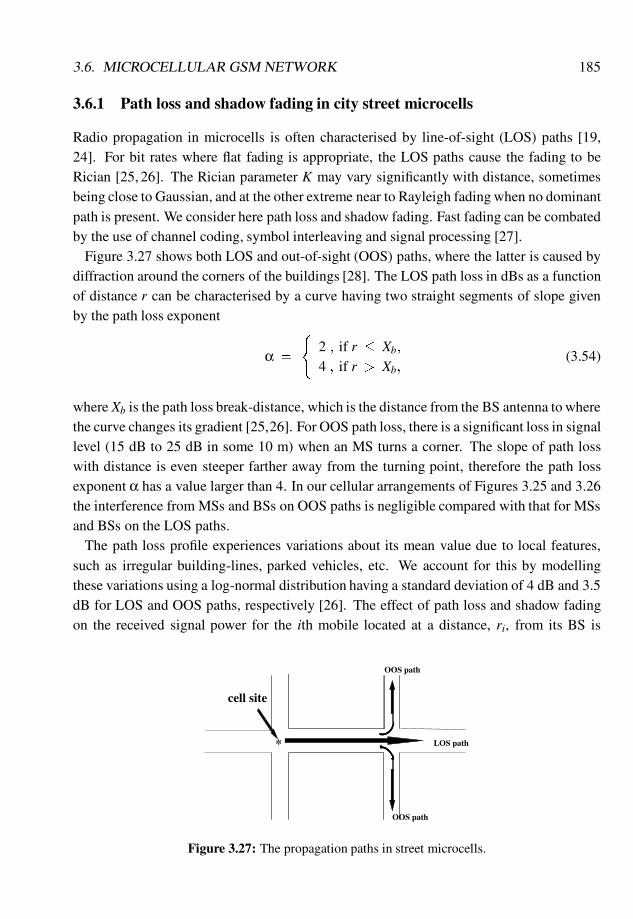
3.6. MICROCELLULAR GSM NETWORK 185
3.6.1 Path loss and shadow fading in city street microcells
Radio propagation in microcells is often characterised by line-of-sight (LOS) paths [19,24]. For bit rates where flat fading is appropriate, the LOS paths cause the fading to beRician [25, 26]. The Rician parameter K may vary significantly with distance, sometimesbeing close to Gaussian, and at the other extreme near to Rayleigh fading when no dominantpath is present. We consider here path loss and shadow fading. Fast fading can be combatedby the use of channel coding, symbol interleaving and signal processing [27].
Figure 3.27 shows both LOS and out-of-sight (OOS) paths, where the latter is caused bydiffraction around the corners of the buildings [28]. The LOS path loss in dBs as a functionof distance r can be characterised by a curve having two straight segments of slope givenby the path loss exponent
α =
(2 ; if r � Xb;
4 ; if r > Xb;(3.54)
where Xb is the path loss break-distance, which is the distance from the BS antenna to wherethe curve changes its gradient [25,26]. For OOS path loss, there is a significant loss in signallevel (15 dB to 25 dB in some 10 m) when an MS turns a corner. The slope of path losswith distance is even steeper farther away from the turning point, therefore the path lossexponent α has a value larger than 4. In our cellular arrangements of Figures 3.25 and 3.26the interference from MSs and BSs on OOS paths is negligible compared with that for MSsand BSs on the LOS paths.
The path loss profile experiences variations about its mean value due to local features,such as irregular building-lines, parked vehicles, etc. We account for this by modellingthese variations using a log-normal distribution having a standard deviation of 4 dB and 3.5dB for LOS and OOS paths, respectively [26]. The effect of path loss and shadow fadingon the received signal power for the ith mobile located at a distance, ri, from its BS is
cell site
OOS path
OOS path
LOS path*
Figure 3.27: The propagation paths in street microcells.
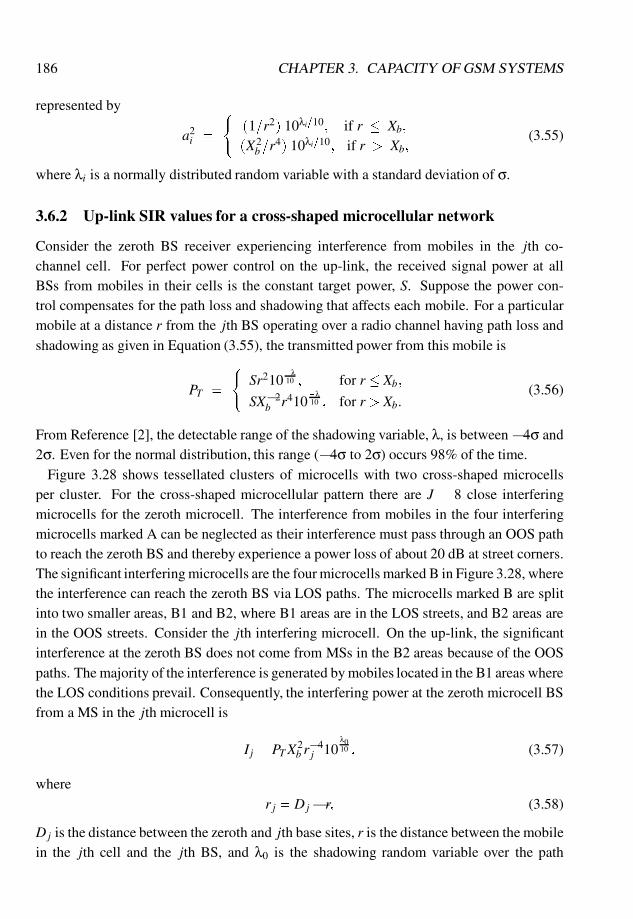
186 CHAPTER 3. CAPACITY OF GSM SYSTEMS
represented by
a2i =
((1=r2) 10λi=10; if r � Xb;
(X2b=r
4) 10λi=10; if r > Xb;(3.55)
where λi is a normally distributed random variable with a standard deviation of σ.
3.6.2 Up-link SIR values for a cross-shaped microcellular network
Consider the zeroth BS receiver experiencing interference from mobiles in the jth co-channel cell. For perfect power control on the up-link, the received signal power at allBSs from mobiles in their cells is the constant target power, S. Suppose the power con-trol compensates for the path loss and shadowing that affects each mobile. For a particularmobile at a distance r from the jth BS operating over a radio channel having path loss andshadowing as given in Equation (3.55), the transmitted power from this mobile is
PT =
(Sr210
�λ10 ; for r � Xb;
SX�2b r410
�λ10 ; for r > Xb.
(3.56)
From Reference [2], the detectable range of the shadowing variable, λ, is between �4σ and2σ. Even for the normal distribution, this range (�4σ to 2σ) occurs 98% of the time.
Figure 3.28 shows tessellated clusters of microcells with two cross-shaped microcellsper cluster. For the cross-shaped microcellular pattern there are J = 8 close interferingmicrocells for the zeroth microcell. The interference from mobiles in the four interferingmicrocells marked A can be neglected as their interference must pass through an OOS pathto reach the zeroth BS and thereby experience a power loss of about 20 dB at street corners.The significant interfering microcells are the four microcells marked B in Figure 3.28, wherethe interference can reach the zeroth BS via LOS paths. The microcells marked B are splitinto two smaller areas, B1 and B2, where B1 areas are in the LOS streets, and B2 areas arein the OOS streets. Consider the jth interfering microcell. On the up-link, the significantinterference at the zeroth BS does not come from MSs in the B2 areas because of the OOSpaths. The majority of the interference is generated by mobiles located in the B1 areas wherethe LOS conditions prevail. Consequently, the interfering power at the zeroth microcell BSfrom a MS in the jth microcell is
I j = PTX2b r�4j 10
λ010 ; (3.57)
wherer j = Dj� r; (3.58)
Dj is the distance between the zeroth and jth base sites, r is the distance between the mobilein the jth cell and the jth BS, and λ0 is the shadowing random variable over the path
3.6. MICROCELLULAR GSM NETWORK 187
Figure 3.28: Up-link interfering microcells, shown shaded, for the centre zeroth cross-shaped mi-crocell. There are two microcells per cluster.
between the zeroth BS and the interfering MS in the jth microcell. Substituting PT fromEquation (3.56) into Equation (3.57), yields
I j =
8<:
SX2b r
2
r4j
10ζ10 ; for r� Xb;
Sr4
r4j
10ζ
10 ; for r> Xb;(3.59)
whereζ= λ0�λ (3.60)
is a random variable having a normal distribution with a standard deviation ofp
2σ. Notethat ζ can vary from�4
p2σ to 2
p2σ.
Carrier fi will be used by a subset of Nf users who occupied the kth timeslot in the jthcell. Assuming the Nf users of the kth timeslot are uniformly distributed over the entire cell,and that Nf is large, then the PDF of the kth timeslot user in the area da is
f (a) =1
4XW �W 2�= 1
4XW(3.61)
188 CHAPTER 3. CAPACITY OF GSM SYSTEMS
for W � X , where X and W are defined in Figure 3.28. The average interference powerreceived at the zeroth BS is the average of the powers from mobiles located anywhere withinthe jth cell using the kth timeslot, namely
ϒ j =
Z
cell
Z
area
I j f (a)da: (3.62)
Note that whereas I j in Equation (3.59) is the interference from a mobile at a distancer j to the zeroth BS, ϒ j is the interference in the presence of FH where at each hop theinterference may arise from a different location within the jth cell. Thus ϒ j involves anaveraging over the cell area. Substituting f (a) from Equation (3.61) into Equation (3.62),and noting that da=Wdr, with W and dr defined in Figure 3.28, yields
ϒ j =1
4X
Z X
�XIjdr: (3.63)
From Equation (3.59), the value of I j depends upon whether r� Xb or r > Xb. The integra-tion in Equation (3.63) is done for Xb� X and 2X > Xb > X . When Xb� X , the integrationis divided into three sections, as shown in Figure 3.29, namely �X to �Xb, �Xb to Xb, andXb to X . In the first and third sections, r> Xb, while in the second section r� Xb. Substitut-ing the appropriate value of I j given in Equation (3.59) for each section, and then applyingthese values of I j to Equation (3.63) to yields
ϒ j =S
4X
(Z Xb
�Xb
�rr j
�4
10ζ
10 dr+Z�Xb
�X
X2b r
2
r4j
10ζ10 dr+
Z X
Xb
�rr j
�4
10ζ10 dr
): (3.64)
When 2X > Xb > X , as shown in Figure 3.30, jrj � Xb, because r is integrated from �X toX . Consequently, we have
ϒ j =S
4X
Z X
�X
X2b r
2
r4j
10ζ10 dr� (3.65)
Because of FH, as the interferer changes in each hop, the shadowing variable ζ associatedwith the interferer changes. The average of ϒ j for the jth cell is
E[ϒ j] =S
4XEh10
ζ10
i(Z�Xb
�X
�rr j
�4
dr+Z Xb
�Xb
X2b r
2dr
r4j
+Z X
Xb
�rr j
�4
dr
)(3.66)
and
E[ϒ j] =S
4XEh10
ζ10
i(Z X
�X
X2b r
2
r4j
dr
)(3.67)
for Xb � X and 2X > Xb > X , respectively, where Eh10
ζ10
iis given in Equation (3.19). By
rearranging Equations (3.66) and (3.67) and on letting x= r=X , where�1� x� 1, we have
E[ϒ j]
S=
14
Eh10
ζ10
i8<:Z�
XXb
�1
xr jX
!4
dx+Z Xb
X
�
XbX
�XbX
�2x2dx� r j
X
�4 +Z 1
XbX
xr jX
!4
dx
9=; (3.68)
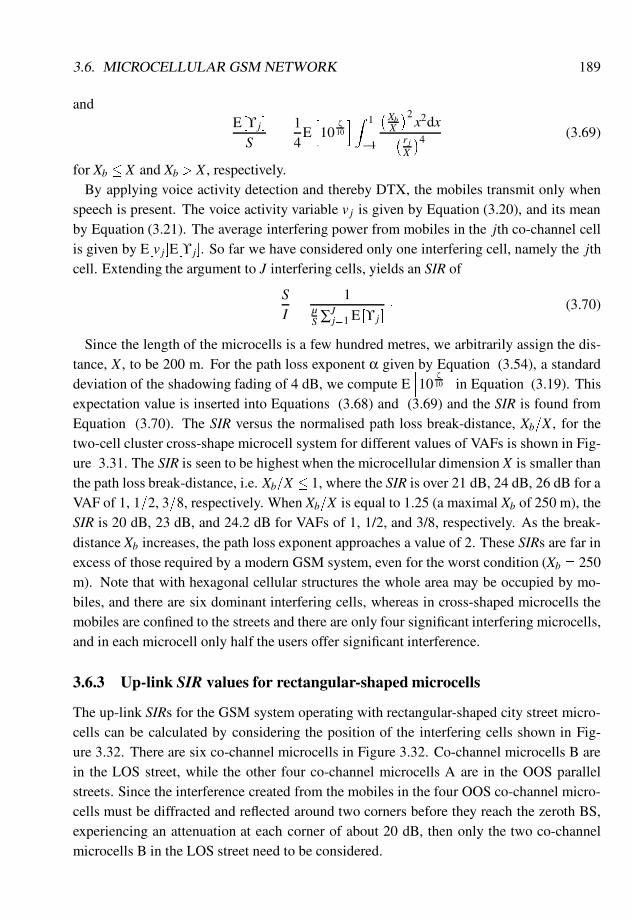
3.6. MICROCELLULAR GSM NETWORK 189
andE [ϒ j]
S=
14
Eh10
ζ10
iZ 1
�1
�XbX
�2x2dx� r j
X
�4 (3.69)
for Xb � X and Xb > X , respectively.By applying voice activity detection and thereby DTX, the mobiles transmit only when
speech is present. The voice activity variable v j is given by Equation (3.20), and its meanby Equation (3.21). The average interfering power from mobiles in the jth co-channel cellis given by E[v j]E[ϒ j]. So far we have considered only one interfering cell, namely the jthcell. Extending the argument to J interfering cells, yields an SIR of
SI=
1µS ∑J
j=1 E [ϒ j]� (3.70)
Since the length of the microcells is a few hundred metres, we arbitrarily assign the dis-tance, X , to be 200 m. For the path loss exponent α given by Equation (3.54), a standarddeviation of the shadowing fading of 4 dB, we compute E
h10
ζ10
iin Equation (3.19). This
expectation value is inserted into Equations (3.68) and (3.69) and the SIR is found fromEquation (3.70). The SIR versus the normalised path loss break-distance, Xb=X , for thetwo-cell cluster cross-shape microcell system for different values of VAFs is shown in Fig-ure 3.31. The SIR is seen to be highest when the microcellular dimension X is smaller thanthe path loss break-distance, i.e. Xb=X � 1, where the SIR is over 21 dB, 24 dB, 26 dB for aVAF of 1, 1=2, 3=8, respectively. When Xb=X is equal to 1.25 (a maximal Xb of 250 m), theSIR is 20 dB, 23 dB, and 24.2 dB for VAFs of 1, 1/2, and 3/8, respectively. As the break-distance Xb increases, the path loss exponent approaches a value of 2. These SIRs are far inexcess of those required by a modern GSM system, even for the worst condition (Xb = 250m). Note that with hexagonal cellular structures the whole area may be occupied by mo-biles, and there are six dominant interfering cells, whereas in cross-shaped microcells themobiles are confined to the streets and there are only four significant interfering microcells,and in each microcell only half the users offer significant interference.
3.6.3 Up-link SIR values for rectangular-shaped microcells
The up-link SIRs for the GSM system operating with rectangular-shaped city street micro-cells can be calculated by considering the position of the interfering cells shown in Fig-ure 3.32. There are six co-channel microcells in Figure 3.32. Co-channel microcells B arein the LOS street, while the other four co-channel microcells A are in the OOS parallelstreets. Since the interference created from the mobiles in the four OOS co-channel micro-cells must be diffracted and reflected around two corners before they reach the zeroth BS,experiencing an attenuation at each corner of about 20 dB, then only the two co-channelmicrocells B in the LOS street need to be considered.
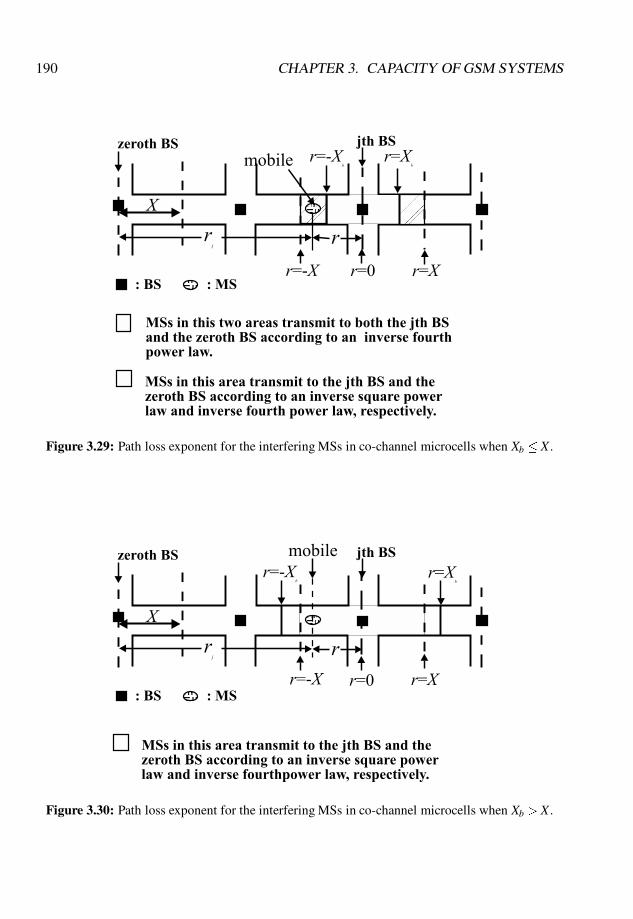
190 CHAPTER 3. CAPACITY OF GSM SYSTEMS
Figure 3.29: Path loss exponent for the interfering MSs in co-channel microcells when Xb � X .
Figure 3.30: Path loss exponent for the interfering MSs in co-channel microcells when Xb > X .
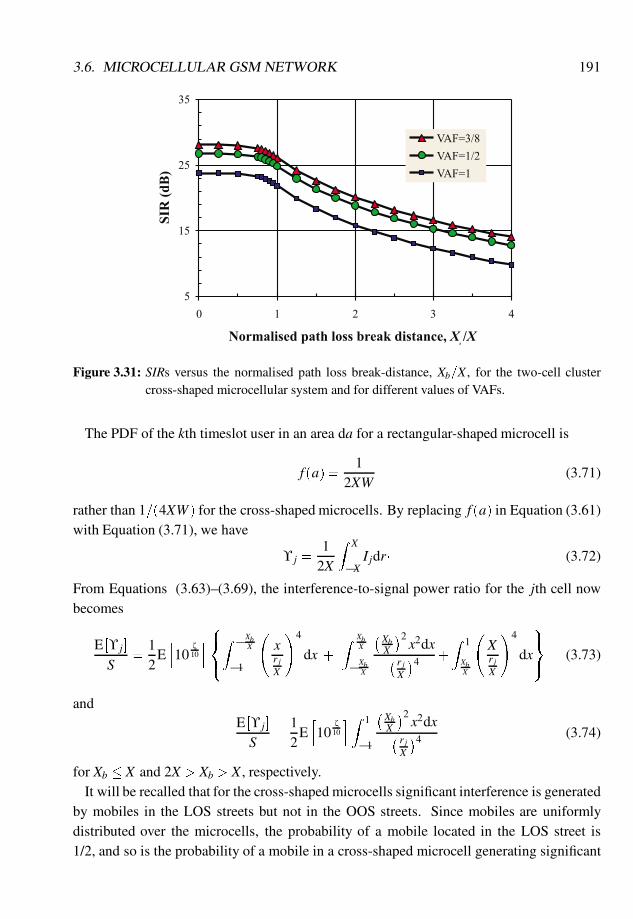
3.6. MICROCELLULAR GSM NETWORK 191
Figure 3.31: SIRs versus the normalised path loss break-distance, Xb=X , for the two-cell clustercross-shaped microcellular system and for different values of VAFs.
The PDF of the kth timeslot user in an area da for a rectangular-shaped microcell is
f (a) =1
2XW(3.71)
rather than 1=(4XW) for the cross-shaped microcells. By replacing f (a) in Equation (3.61)with Equation (3.71), we have
ϒ j =1
2X
Z X
�XIjdr� (3.72)
From Equations (3.63)–(3.69), the interference-to-signal power ratio for the jth cell nowbecomes
E [ϒ j]
S=
12
Eh10
ζ10
i8<:Z�
XbX
�1
xr jX
!4
dx +Z Xb
X
�
XbX
�XbX
�2x2dx� r j
X
�4 +Z 1
XbX
XrjX
!4
dx
9=; (3.73)
andE [ϒ j]
S=
12
Eh10
ζ10
iZ 1
�1
�XbX
�2x2dx� r j
X
�4 (3.74)
for Xb � X and 2X > Xb > X , respectively.It will be recalled that for the cross-shaped microcells significant interference is generated
by mobiles in the LOS streets but not in the OOS streets. Since mobiles are uniformlydistributed over the microcells, the probability of a mobile located in the LOS street is1/2, and so is the probability of a mobile in a cross-shaped microcell generating significant
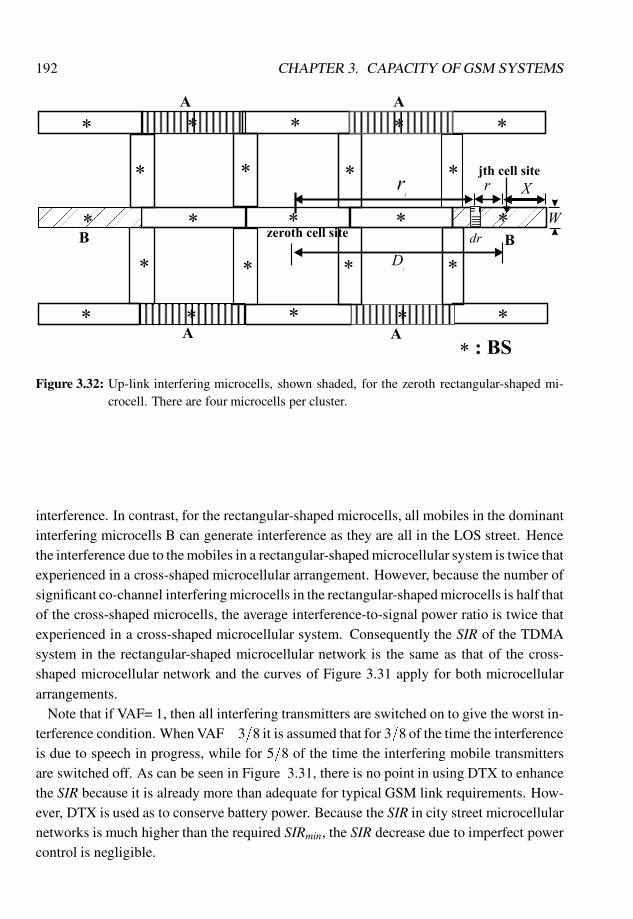
192 CHAPTER 3. CAPACITY OF GSM SYSTEMS
Figure 3.32: Up-link interfering microcells, shown shaded, for the zeroth rectangular-shaped mi-crocell. There are four microcells per cluster.
interference. In contrast, for the rectangular-shaped microcells, all mobiles in the dominantinterfering microcells B can generate interference as they are all in the LOS street. Hencethe interference due to the mobiles in a rectangular-shaped microcellular system is twice thatexperienced in a cross-shaped microcellular arrangement. However, because the number ofsignificant co-channel interfering microcells in the rectangular-shaped microcells is half thatof the cross-shaped microcells, the average interference-to-signal power ratio is twice thatexperienced in a cross-shaped microcellular system. Consequently the SIR of the TDMAsystem in the rectangular-shaped microcellular network is the same as that of the cross-shaped microcellular network and the curves of Figure 3.31 apply for both microcellulararrangements.
Note that if VAF= 1, then all interfering transmitters are switched on to give the worst in-terference condition. When VAF= 3=8 it is assumed that for 3=8 of the time the interferenceis due to speech in progress, while for 5=8 of the time the interfering mobile transmittersare switched off. As can be seen in Figure 3.31, there is no point in using DTX to enhancethe SIR because it is already more than adequate for typical GSM link requirements. How-ever, DTX is used as to conserve battery power. Because the SIR in city street microcellularnetworks is much higher than the required SIRmin, the SIR decrease due to imperfect powercontrol is negligible.
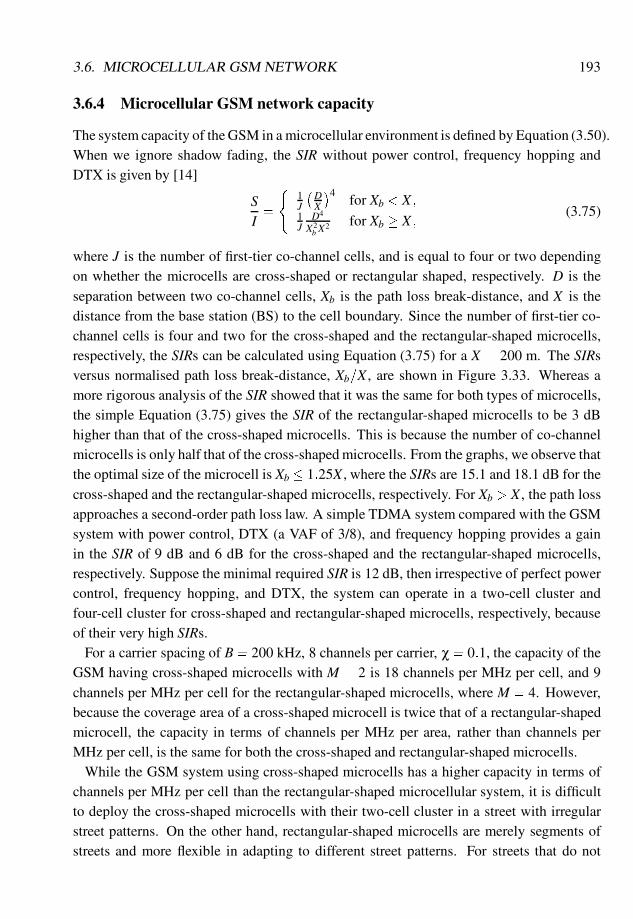
3.6. MICROCELLULAR GSM NETWORK 193
3.6.4 Microcellular GSM network capacity
The system capacity of the GSM in a microcellular environment is defined by Equation (3.50).When we ignore shadow fading, the SIR without power control, frequency hopping andDTX is given by [14]
SI=
(1J
�DX
�4for Xb < X ;
1J
D4
X2b X
2 for Xb � X ;(3.75)
where J is the number of first-tier co-channel cells, and is equal to four or two dependingon whether the microcells are cross-shaped or rectangular shaped, respectively. D is theseparation between two co-channel cells, Xb is the path loss break-distance, and X is thedistance from the base station (BS) to the cell boundary. Since the number of first-tier co-channel cells is four and two for the cross-shaped and the rectangular-shaped microcells,respectively, the SIRs can be calculated using Equation (3.75) for a X = 200 m. The SIRsversus normalised path loss break-distance, Xb=X , are shown in Figure 3.33. Whereas amore rigorous analysis of the SIR showed that it was the same for both types of microcells,the simple Equation (3.75) gives the SIR of the rectangular-shaped microcells to be 3 dBhigher than that of the cross-shaped microcells. This is because the number of co-channelmicrocells is only half that of the cross-shaped microcells. From the graphs, we observe thatthe optimal size of the microcell is Xb� 1:25X , where the SIRs are 15.1 and 18.1 dB for thecross-shaped and the rectangular-shaped microcells, respectively. For Xb > X , the path lossapproaches a second-order path loss law. A simple TDMA system compared with the GSMsystem with power control, DTX (a VAF of 3/8), and frequency hopping provides a gainin the SIR of 9 dB and 6 dB for the cross-shaped and the rectangular-shaped microcells,respectively. Suppose the minimal required SIR is 12 dB, then irrespective of perfect powercontrol, frequency hopping, and DTX, the system can operate in a two-cell cluster andfour-cell cluster for cross-shaped and rectangular-shaped microcells, respectively, becauseof their very high SIRs.
For a carrier spacing of B= 200 kHz, 8 channels per carrier, χ= 0:1, the capacity of theGSM having cross-shaped microcells with M = 2 is 18 channels per MHz per cell, and 9channels per MHz per cell for the rectangular-shaped microcells, where M = 4. However,because the coverage area of a cross-shaped microcell is twice that of a rectangular-shapedmicrocell, the capacity in terms of channels per MHz per area, rather than channels perMHz per cell, is the same for both the cross-shaped and rectangular-shaped microcells.
While the GSM system using cross-shaped microcells has a higher capacity in terms ofchannels per MHz per cell than the rectangular-shaped microcellular system, it is difficultto deploy the cross-shaped microcells with their two-cell cluster in a street with irregularstreet patterns. On the other hand, rectangular-shaped microcells are merely segments ofstreets and more flexible in adapting to different street patterns. For streets that do not
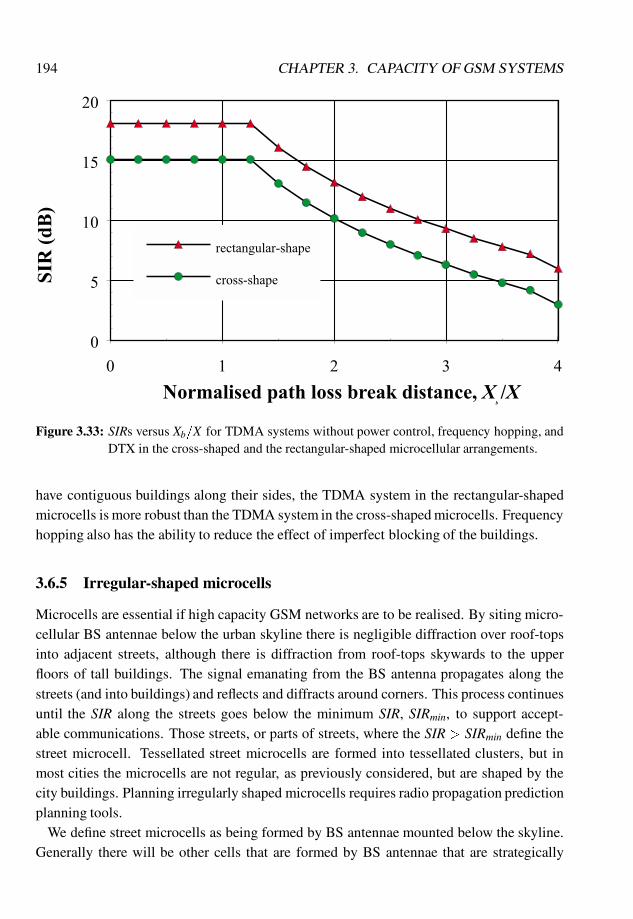
194 CHAPTER 3. CAPACITY OF GSM SYSTEMS
Figure 3.33: SIRs versus Xb=X for TDMA systems without power control, frequency hopping, andDTX in the cross-shaped and the rectangular-shaped microcellular arrangements.
have contiguous buildings along their sides, the TDMA system in the rectangular-shapedmicrocells is more robust than the TDMA system in the cross-shaped microcells. Frequencyhopping also has the ability to reduce the effect of imperfect blocking of the buildings.
3.6.5 Irregular-shaped microcells
Microcells are essential if high capacity GSM networks are to be realised. By siting micro-cellular BS antennae below the urban skyline there is negligible diffraction over roof-topsinto adjacent streets, although there is diffraction from roof-tops skywards to the upperfloors of tall buildings. The signal emanating from the BS antenna propagates along thestreets (and into buildings) and reflects and diffracts around corners. This process continuesuntil the SIR along the streets goes below the minimum SIR, SIRmin, to support accept-able communications. Those streets, or parts of streets, where the SIR > SIRmin define thestreet microcell. Tessellated street microcells are formed into tessellated clusters, but inmost cities the microcells are not regular, as previously considered, but are shaped by thecity buildings. Planning irregularly shaped microcells requires radio propagation predictionplanning tools.
We define street microcells as being formed by BS antennae mounted below the skyline.Generally there will be other cells that are formed by BS antennae that are strategically
3.6. MICROCELLULAR GSM NETWORK 195
placed at various heights within the city. By restricting the power from these antennae wecan create minicells that form cells larger than microcells, although not necessarily so, butthat operate in three dimensions. For example, they can be used to provide radio coverage inradio dead-spots within the microcells, and into multistorey buildings [29,30]. Oversailingthe microcells and minicells could be a sector of a macrocell. The macrocells, and the mini-cells, can also be used to support handovers between street microcells when microcellularchannels are not available [22].
For GSM to continue on its successful commercial path it must have low cost microcel-lular BSs and their connecting and supporting infrastructure. Although current GSM BSs,BSCs and MSCs are relatively expensive, they are not inherently so, particularly for themicrocellular environment. If they are connected by optical fibres, the innate cost of thefibres is also low. In the long term the cost of deploying microcellular networks will mainlybe the cost of installation and site rental. It is not a question of whether GSM microcellularnetworks will be deployed in vast numbers, but when.
Currently many major cities have clusters of microcells, or single microcells, to relievetraffic hot-spots. In the present cellular radio culture some operators continue to use theirexisting macrocellular planning tools to plan microcells with limited success. So let ussay a brief word about macrocellular planning tools. These tools are based on path losscalculations that include regression-line analysis of path loss with distance data, terraininformation, edge-diffraction models, and clutter-loss models of buildings in different en-vironments, such as urban and suburban areas. For urban street microcells, models thatconsider buildings as clutter are bound to give erroneous results. One single tall buildingcan cast a large radio shadow. Indeed, the specific effect of every building and the influ-ence of its local environment must be taken into consideration if the predictions of pathloss, strongest server, overlap zones for hand overs, signal-to-interference ratios and signal-to-adjacent channel ratios are to be sufficiently accurate for planning a street microcellularnetwork.
Conventional macrocellular planning tools use models that average the signal power losses(clutter losses) caused by buildings. Network operators tend to have little confidence inthese predictions and frequently resort to measurements. If the measurements and the pre-dictions show large discrepancies, then the operator tunes the planning tool. Surely thefunction of a predictor is to remove the need to make measurements. Since the clutter lossdoes not allow for individual buildings in the radio propagation path, operators must includeshadow fading margins in their link budgets, i.e. allow for the shadows cast by buildings.As an example, shadow fading is generally modelled by a log-normal distribution with astandard deviation of 8 dB. If a cell were planned such that the average signal power at thecell edge was equal to the receiver sensitivity (i.e. the minimum received power for accept-able performance), then as a consequence of shadow fading the average received signal will
196 CHAPTER 3. CAPACITY OF GSM SYSTEMS
be acceptable for 50% of the time at the cell boundary and unacceptable for the remain-ing 50% of the time. The levels of coverage may be improved by ensuring that the cell isplanned such that the signal level is greater than the receiver sensitivity by an acceptablemargin. Using the shadow fading model described above, the probability of coverage at thecell edge may be increased to 75% by including a shadow fading margin of around 5 dB.
A further drawback of conventional planning tools is their lack of resolution. The pre-diction information is usually presented by dividing the prediction area into a number ofsquares and generating a single signal strength value for each square. In some cases thesesquares may have sides from 50 m to 250 m. Tools of this nature are virtually uselesswhen it comes to predicting the coverage of a street microcell that is only 200 m to 400 macross! Prediction tools that use accurate building information can predict with a muchhigher resolution and, in some cases, this can be a few metres. This shows that as cell sizesdecrease, the radio prediction planning tools must include accurate building information intheir prediction algorithms.
A number of small cell radio planning tools use a technique known as ray tracing to pre-dict both the path loss and the propagation channel impulse response. In simple terms, raytracing involves assuming that a number of rays are emitted from the transmitting antenna.The path of each of these rays is then traced as it is reflected and diffracted by the build-ings. The characteristics of the signal at a receiving antenna are determined by examiningthe relative phase offsets and time delays of the arriving rays. Unfortunately, this approachhas two major drawbacks. First, it requires substantial processing power to track each indi-vidual ray. This means that the predictions may take a long time. The second drawback isthat the prediction accuracy of path loss and impulse response may be low because of thenumber of practical parameters and variables that cannot be included in the prediction.
A more appropriate approach to predicting radio propagation in small cells, e.g. streetmicrocells, is to generate an average value of path loss at a given resolution, say, 5 m by5 m, and make no attempt to predict the effects of fast fading of the signal characteristics,e.g. delay spread. The validity of this approach is strengthened by the fact that most moderncellular systems are designed to cope with delay spreads that are significantly larger thanthose found in microcells and so, in general, there is no need to predict fading phenomenain a microcellular network.
Figure 3.34 shows the plot of an arbitrary street microcell produced by the small cellradio planning tool, NPWorkplace.1 The tool employs an empirical prediction model thatwas developed from a large database of radio propagation measurements. The bin size, i.e.the square area where the measurements were averaged, is 5 m by 5 m. The figure is taken
1NPWorkplace is a proprietary small cell radio planning tool from Multiple Access Communications Ltd.World wide web page: http://www.macltd.com
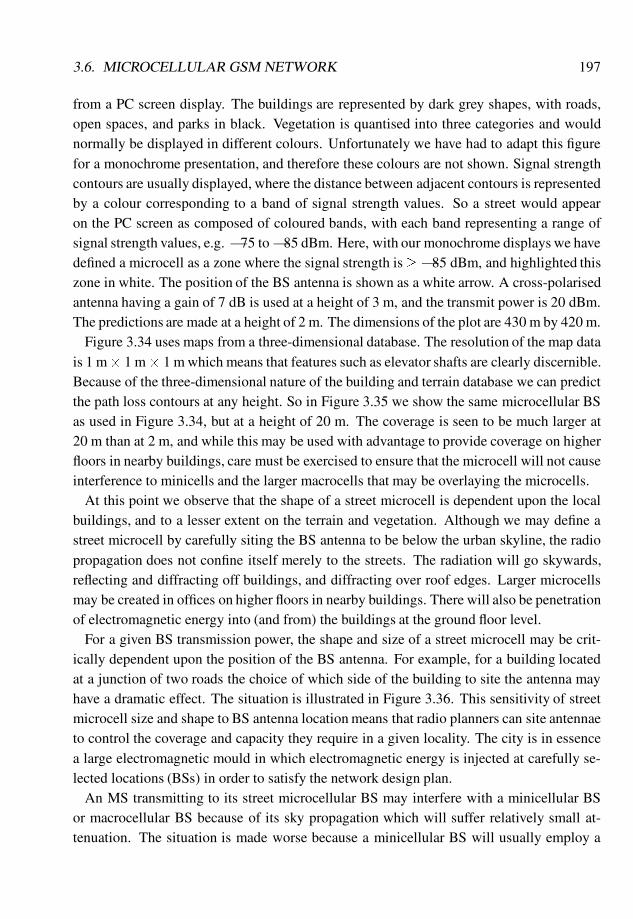
3.6. MICROCELLULAR GSM NETWORK 197
from a PC screen display. The buildings are represented by dark grey shapes, with roads,open spaces, and parks in black. Vegetation is quantised into three categories and wouldnormally be displayed in different colours. Unfortunately we have had to adapt this figurefor a monochrome presentation, and therefore these colours are not shown. Signal strengthcontours are usually displayed, where the distance between adjacent contours is representedby a colour corresponding to a band of signal strength values. So a street would appearon the PC screen as composed of coloured bands, with each band representing a range ofsignal strength values, e.g. �75 to�85 dBm. Here, with our monochrome displays we havedefined a microcell as a zone where the signal strength is� �85 dBm, and highlighted thiszone in white. The position of the BS antenna is shown as a white arrow. A cross-polarisedantenna having a gain of 7 dB is used at a height of 3 m, and the transmit power is 20 dBm.The predictions are made at a height of 2 m. The dimensions of the plot are 430 m by 420 m.
Figure 3.34 uses maps from a three-dimensional database. The resolution of the map datais 1 m� 1 m� 1 m which means that features such as elevator shafts are clearly discernible.Because of the three-dimensional nature of the building and terrain database we can predictthe path loss contours at any height. So in Figure 3.35 we show the same microcellular BSas used in Figure 3.34, but at a height of 20 m. The coverage is seen to be much larger at20 m than at 2 m, and while this may be used with advantage to provide coverage on higherfloors in nearby buildings, care must be exercised to ensure that the microcell will not causeinterference to minicells and the larger macrocells that may be overlaying the microcells.
At this point we observe that the shape of a street microcell is dependent upon the localbuildings, and to a lesser extent on the terrain and vegetation. Although we may define astreet microcell by carefully siting the BS antenna to be below the urban skyline, the radiopropagation does not confine itself merely to the streets. The radiation will go skywards,reflecting and diffracting off buildings, and diffracting over roof edges. Larger microcellsmay be created in offices on higher floors in nearby buildings. There will also be penetrationof electromagnetic energy into (and from) the buildings at the ground floor level.
For a given BS transmission power, the shape and size of a street microcell may be crit-ically dependent upon the position of the BS antenna. For example, for a building locatedat a junction of two roads the choice of which side of the building to site the antenna mayhave a dramatic effect. The situation is illustrated in Figure 3.36. This sensitivity of streetmicrocell size and shape to BS antenna location means that radio planners can site antennaeto control the coverage and capacity they require in a given locality. The city is in essencea large electromagnetic mould in which electromagnetic energy is injected at carefully se-lected locations (BSs) in order to satisfy the network design plan.
An MS transmitting to its street microcellular BS may interfere with a minicellular BSor macrocellular BS because of its sky propagation which will suffer relatively small at-tenuation. The situation is made worse because a minicellular BS will usually employ a
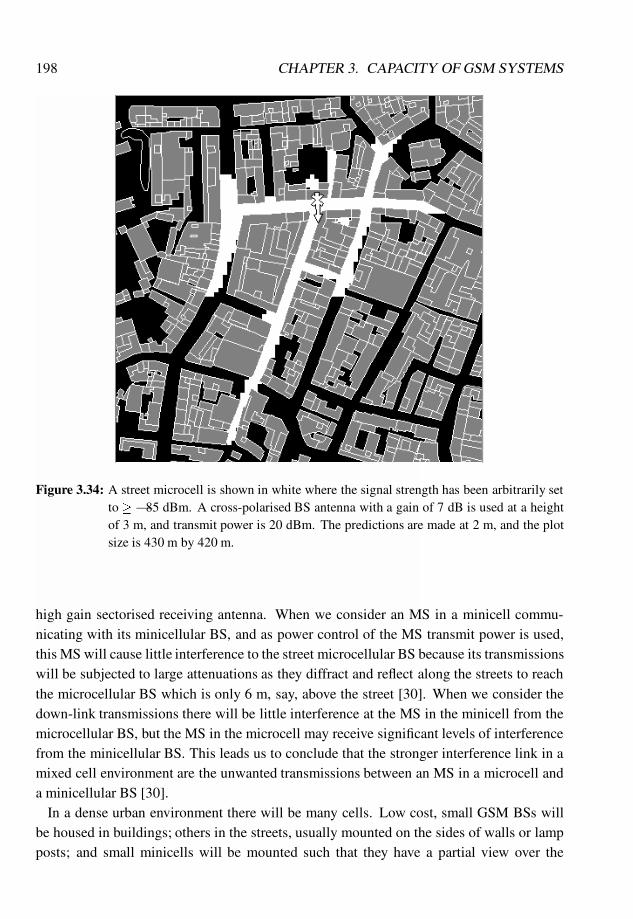
198 CHAPTER 3. CAPACITY OF GSM SYSTEMS
Figure 3.34: A street microcell is shown in white where the signal strength has been arbitrarily setto � �85 dBm. A cross-polarised BS antenna with a gain of 7 dB is used at a heightof 3 m, and transmit power is 20 dBm. The predictions are made at 2 m, and the plotsize is 430 m by 420 m.
high gain sectorised receiving antenna. When we consider an MS in a minicell commu-nicating with its minicellular BS, and as power control of the MS transmit power is used,this MS will cause little interference to the street microcellular BS because its transmissionswill be subjected to large attenuations as they diffract and reflect along the streets to reachthe microcellular BS which is only 6 m, say, above the street [30]. When we consider thedown-link transmissions there will be little interference at the MS in the minicell from themicrocellular BS, but the MS in the microcell may receive significant levels of interferencefrom the minicellular BS. This leads us to conclude that the stronger interference link in amixed cell environment are the unwanted transmissions between an MS in a microcell anda minicellular BS [30].
In a dense urban environment there will be many cells. Low cost, small GSM BSs willbe housed in buildings; others in the streets, usually mounted on the sides of walls or lampposts; and small minicells will be mounted such that they have a partial view over the
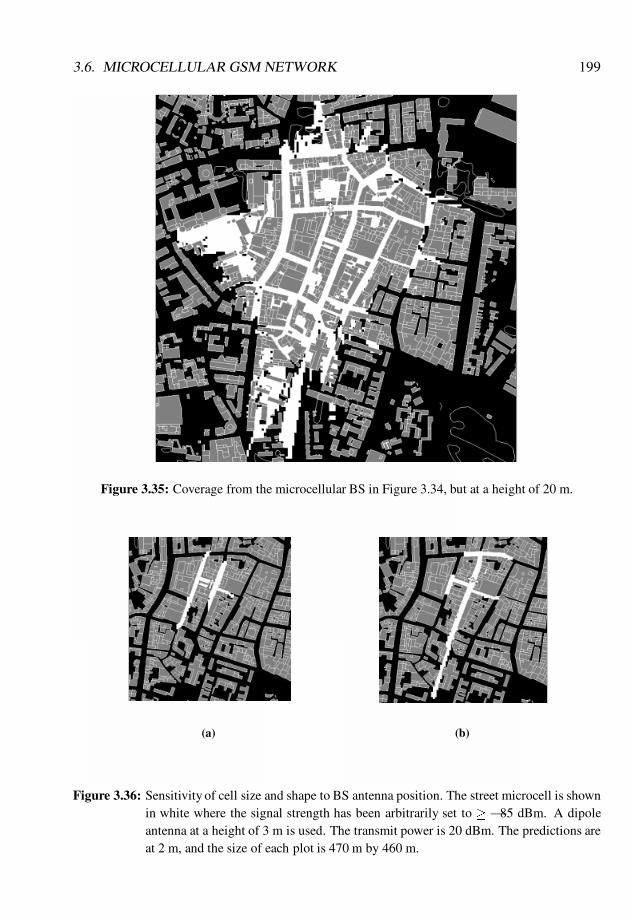
3.6. MICROCELLULAR GSM NETWORK 199
Figure 3.35: Coverage from the microcellular BS in Figure 3.34, but at a height of 20 m.
(a) (b)
Figure 3.36: Sensitivity of cell size and shape to BS antenna position. The street microcell is shownin white where the signal strength has been arbitrarily set to � �85 dBm. A dipoleantenna at a height of 3 m is used. The transmit power is 20 dBm. The predictions areat 2 m, and the size of each plot is 470 m by 460 m.
200 CHAPTER 3. CAPACITY OF GSM SYSTEMS
locality. We will not have many macrocells, i.e. large cells with antennas on the roofs ofthe tallest buildings. This is because large cells equates to low capacity. However, largecells are deployed in network start-up mode to provide coverage, and it is only as capacityincreases that smaller cells, and eventually microcells, are introduced.
If the introduced microcells are significantly smaller than the other types of cells, thenit is more spectrally efficient to partition the channel sets so that the microcells have theirown channels. This means that the larger cells will not interfere with the microcells and thespectral efficiency increases. Figure 3.37 shows a network of GSM microcells using a reuseof four. However, when the minicells approach the size of microcells to assist handovers andto cover radio dead-spots in the microcell clusters, then partitioning of the radio channelsmay be spectrally inefficient.
To provide the high capacity multimedia networks of the future, GSM Phase 2+ networks(see Chapter 6) will require a myriad of small cells stacked in three dimensions. Thissituation may be a profound challenge for radio planners who will need to grapple withcomplex interference problems. Dynamic channel allocation of radio channels is likely tobe one method of mitigating this problem.
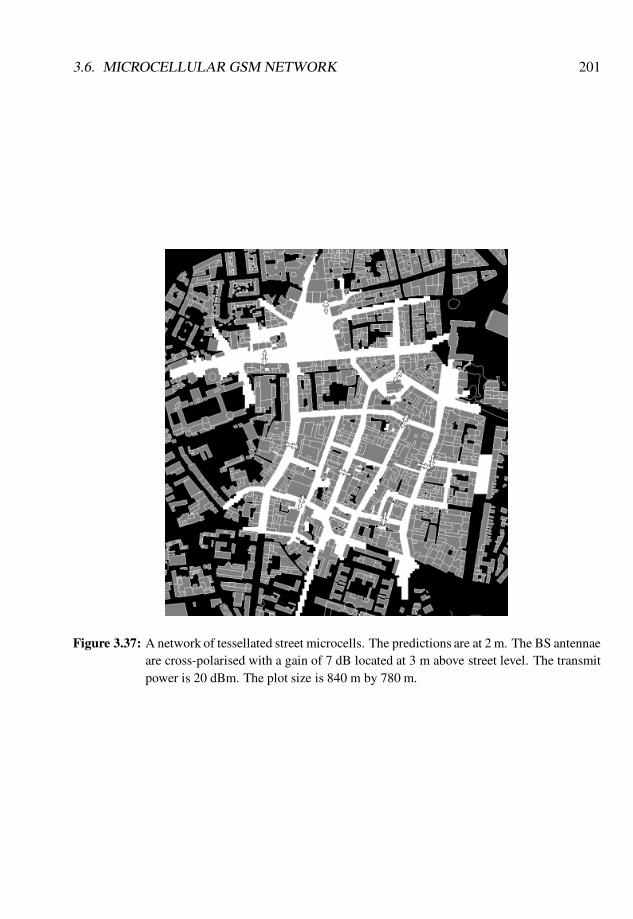
3.6. MICROCELLULAR GSM NETWORK 201
Figure 3.37: A network of tessellated street microcells. The predictions are at 2 m. The BS antennaeare cross-polarised with a gain of 7 dB located at 3 m above street level. The transmitpower is 20 dBm. The plot size is 840 m by 780 m.
Bibliography
[1] Goodman D.J., Wireless Personal Communications Systems, Addison-Wesley, 1997.
[2] Steele R. [Ed.], Mobile Radio Communications, Pentech Press, 1992.
[3] Eberspacher J. and H.J. Vogel, GSM Switching Services and Protocols. John Wiley,1998.
[4] Gibson J.D. [Ed.], The Mobile Communications Handbook, CRC Press and IEEEPress, 2nd edn, 1999.
[5] Marcario R.C.V. [Ed.], Modern Personal Radio Systems, IEE, 1996.
[6] Rappaport T.S., Wireless Communications, Prentice-Hall, 1996.
[7] Redl S.M., M.K. Weber and M.W. Oliphant, An Introduction to GSM, Artech House,1995.
[8] Heine G., GSM Networks, Artech House, 1999.
[9] Lee C.-C. and R. Steele, Signal-to-interference calculations for modern TDMA cellu-lar communication systems, IEE Proc. Commun., 142(1), Feb. 1995, 21–30.
[10] Dornstetter J.-L. and D. Verhulst, Cellular efficiency with slow frequency hopping:Analysis of the digital SFH900 mobile system, IEEE J. Sel. Area Commun., 5(5),June 1987, 835–848.
[11] Chennakeshu S., A. Hassan and J. Anderson, Analysis of the capacity of a mixed-mode slow frequency hopping cellular system, IEEE 43rd VTS Conf., Secaucus, NewJersey, May 1993, 540–543.
[12] ETSI, Digital European Cordless Telecommunications—Common Interface, RadioEquipment and Systems, Valbonne, France.
202
BIBLIOGRAPHY 203
[13] Mewson P., An analysis of the effects of power control error within a direct sequenceCDMA system for mobile radio, Proc. IEEE, Globecom, Houston, Texas, Dec 1991,924–928.
[14] Lee W.C.Y., Elements of cellular mobile radio systems, IEEE Trans. Veh. Technol.,VT-35(2), May 1986, 48–56.
[15] Everitt D. and D. Manfield, Performance analysis of cellular mobile communica-tion systems with dynamic channel assignment, IEEE J. Sel. Area Commun., 7(8),Oct. 1989, 1172–1180.
[16] Goodman D.J., Cellular packet communications, IEEE Trans. Commun., 38(8), Au-gust 1990, 1272–31280.
[17] Steele R., The cellular environment of lightweight handheld portables, IEEE Commun.Mag., 27(7), July 1989, 20–29.
[18] Steele R., Towards a high-capacity digital cellular mobile radio system, IEE Proc.,132, Pt F (5), Aug. 1985, 405–415.
[19] Greenstein L.J., N. Amitay, et al, Microcells in personal communication systems,IEEE Commun. Mag., 30(12), Dec. 1992, 76–78.
[20] Steele R., J. Widehead and W.C. Wong, System aspects of cellular radio. IEEE Com-mun. Mag., 33, Jan. 1995, 80–86.
[21] DaSilva J.S. and B.E. Fernandes, The European research program for advanced mobilesystems, IEEE Pers. Commun., Feb. 1995, 14–19.
[22] Steele R., Speech codecs for personal communications, IEEE Commun. Mag., 31,Nov. 1993, 76–83.
[23] Chia S.T.S., Radiowave propagation and handover criteria for microcells, B. TelecomTech. J., 8, Oct. 1990, 50–61.
[24] Anderson J.B., T.S. Rappaport and S. Yoshida, Propagation measurements and modelsfor wireless communications channels, IEEE Commun. Mag., Jan. 1995, 42–49.
[25] Bultitude R.J.C. and K. Bedal, Propagation characteristics on Microcellular urban mo-bile radio channel at 910 MHz, IEEE J. Sel. Area Commun., 7(1), Jan. 1989, 31–39.
[26] Berg J.-E. et al, Path loss and fading models for microcells at 900 MHz, IEEE 42ndVTS Conf., Denver, May 1992, 666–671.
204 BIBLIOGRAPHY
[27] Simpson F. and J.M. Holtzman, Direct sequence CDMA power control, interleaving,and coding, IEEE J. Sel. Area Commun., 11(7), Sept. 1993.
[28] Erceg V., S. Ghssemzadeh, M. Taylor, D. Li and D.L. Schiling, Urban/suburban out-of-sight propagation modelling, IEEE Commun. Mag., 30(6), June 1992, 56–61.
[29] Webb W.T., Sizing up the microcell for mobile radio communications, Electron. Com-mun. Eng. J., 5(3), June 1993, 133–140.
[30] Dehghan S. and R. Steele, Small cell city, IEEE Commun. Mag., 30, Aug. 1997, 52–59.
[31] Steele R., J. Williams, D. Chandler, S. Dehghan and A. Collard, Teletraffic per-formance of GSM-900/DCS-1800 in street microcells, IEEE Commun. Mag., 33,Mar. 1995, 102–108.

Chapter 4The cdmaOne System
4.1 Introduction
In contrast to the GSM system, which was designed and developed by a number of differentorganisations working together, the cdmaOne technology was designed by a single com-pany, Qualcomm Incorporated. The first commercial cdmaOne network was launched byHutchison in Hong Kong on 28 September 1995 and since that time commercial networksbased on the cdmaOne technology have been launched in many countries around the worldincluding Korea and the United States.
Qualcomm’s CDMA technology was ‘re-branded’ as cdmaOne in 1997. Prior to thisthe technology was commonly referred to as ‘IS-95’, which is the name of the standardwhich describes the cdmaOne technology in the United States (i.e. Interim Standard num-ber 95 [1]). The cdmaOne technology was originally designed to provide a high capacityoverlay for the first generation analogue Advanced Mobile Phone System (AMPS) operat-ing in the 800 MHz cellular band in the United States. This gave an AMPS operator theoption of increasing its network capacity in specific areas by replacing a number of 30 kHzAMPS carriers with one or more 1.25 MHz cdmaOne carrier. Dual mode cdmaOne/AMPSmobile stations (MSs) are able to use the cdmaOne system, where available, and they willrevert to the AMPS system in areas where there is no CDMA coverage.
With the introduction of personal communications systems (PCS) in the United States,the cdmaOne technology was modified to operate in the 1900 MHz PCS frequency bandin a single mode configuration citecdma-pcs. This version of the cdmaOne technology wascommonly referred to as ‘CDMA-PCS’ prior to the re-branding. In addition to the versionsof cdmaOne described above, other variations exist which have been modified to operate inparticular frequency bands in different countries throughout the world.
At this point it is important to clarify the terminology we shall be using in the remainder
205
GSM, cdmaOne and 3G Systems. Raymond Steele, Chin-Chun Lee and Peter GouldCopyright © 2001 John Wiley & Sons Ltd
Print ISBN 0-471-49185-3 Electronic ISBN 0-470-84167-2
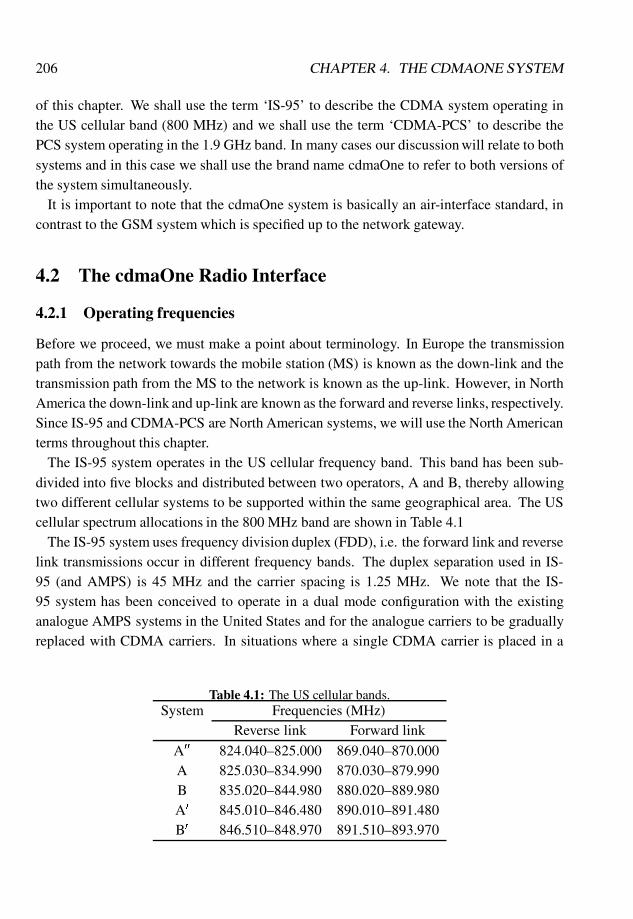
206 CHAPTER 4. THE CDMAONE SYSTEM
of this chapter. We shall use the term ‘IS-95’ to describe the CDMA system operating inthe US cellular band (800 MHz) and we shall use the term ‘CDMA-PCS’ to describe thePCS system operating in the 1.9 GHz band. In many cases our discussion will relate to bothsystems and in this case we shall use the brand name cdmaOne to refer to both versions ofthe system simultaneously.
It is important to note that the cdmaOne system is basically an air-interface standard, incontrast to the GSM system which is specified up to the network gateway.
4.2 The cdmaOne Radio Interface
4.2.1 Operating frequencies
Before we proceed, we must make a point about terminology. In Europe the transmissionpath from the network towards the mobile station (MS) is known as the down-link and thetransmission path from the MS to the network is known as the up-link. However, in NorthAmerica the down-link and up-link are known as the forward and reverse links, respectively.Since IS-95 and CDMA-PCS are North American systems, we will use the North Americanterms throughout this chapter.
The IS-95 system operates in the US cellular frequency band. This band has been sub-divided into five blocks and distributed between two operators, A and B, thereby allowingtwo different cellular systems to be supported within the same geographical area. The UScellular spectrum allocations in the 800 MHz band are shown in Table 4.1
The IS-95 system uses frequency division duplex (FDD), i.e. the forward link and reverselink transmissions occur in different frequency bands. The duplex separation used in IS-95 (and AMPS) is 45 MHz and the carrier spacing is 1.25 MHz. We note that the IS-95 system has been conceived to operate in a dual mode configuration with the existinganalogue AMPS systems in the United States and for the analogue carriers to be graduallyreplaced with CDMA carriers. In situations where a single CDMA carrier is placed in a
Table 4.1: The US cellular bands.System Frequencies (MHz)
Reverse link Forward link
A00 824.040–825.000 869.040–870.000A 825.030–834.990 870.030–879.990B 835.020–844.980 880.020–889.980A0 845.010–846.480 890.010–891.480B0 846.510–848.970 891.510–893.970
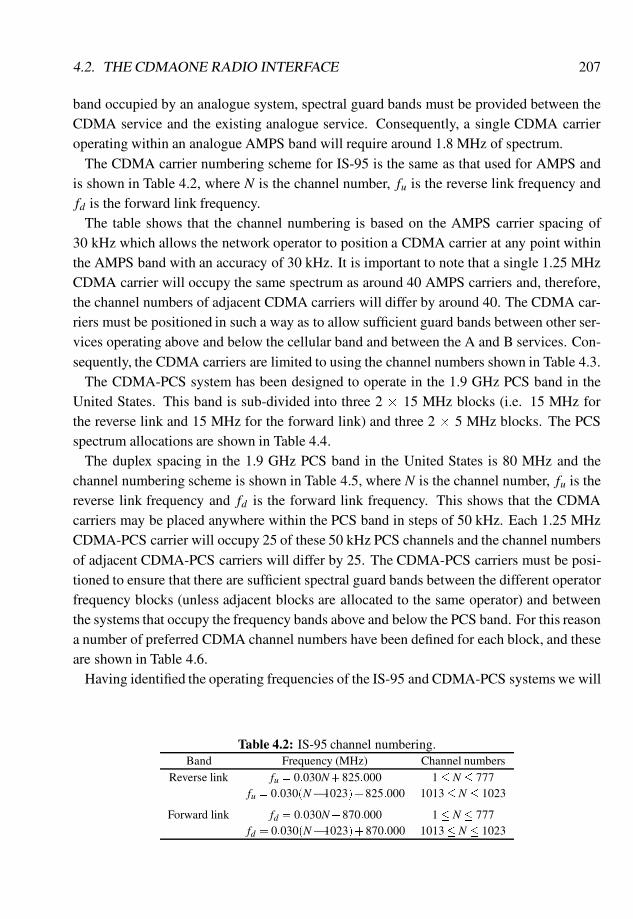
4.2. THE CDMAONE RADIO INTERFACE 207
band occupied by an analogue system, spectral guard bands must be provided between theCDMA service and the existing analogue service. Consequently, a single CDMA carrieroperating within an analogue AMPS band will require around 1.8 MHz of spectrum.
The CDMA carrier numbering scheme for IS-95 is the same as that used for AMPS andis shown in Table 4.2, where N is the channel number, fu is the reverse link frequency andfd is the forward link frequency.
The table shows that the channel numbering is based on the AMPS carrier spacing of30 kHz which allows the network operator to position a CDMA carrier at any point withinthe AMPS band with an accuracy of 30 kHz. It is important to note that a single 1.25 MHzCDMA carrier will occupy the same spectrum as around 40 AMPS carriers and, therefore,the channel numbers of adjacent CDMA carriers will differ by around 40. The CDMA car-riers must be positioned in such a way as to allow sufficient guard bands between other ser-vices operating above and below the cellular band and between the A and B services. Con-sequently, the CDMA carriers are limited to using the channel numbers shown in Table 4.3.
The CDMA-PCS system has been designed to operate in the 1.9 GHz PCS band in theUnited States. This band is sub-divided into three 2 � 15 MHz blocks (i.e. 15 MHz forthe reverse link and 15 MHz for the forward link) and three 2 � 5 MHz blocks. The PCSspectrum allocations are shown in Table 4.4.
The duplex spacing in the 1.9 GHz PCS band in the United States is 80 MHz and thechannel numbering scheme is shown in Table 4.5, where N is the channel number, fu is thereverse link frequency and fd is the forward link frequency. This shows that the CDMAcarriers may be placed anywhere within the PCS band in steps of 50 kHz. Each 1.25 MHzCDMA-PCS carrier will occupy 25 of these 50 kHz PCS channels and the channel numbersof adjacent CDMA-PCS carriers will differ by 25. The CDMA-PCS carriers must be posi-tioned to ensure that there are sufficient spectral guard bands between the different operatorfrequency blocks (unless adjacent blocks are allocated to the same operator) and betweenthe systems that occupy the frequency bands above and below the PCS band. For this reasona number of preferred CDMA channel numbers have been defined for each block, and theseare shown in Table 4.6.
Having identified the operating frequencies of the IS-95 and CDMA-PCS systems we will
Table 4.2: IS-95 channel numbering.Band Frequency (MHz) Channel numbers
Reverse link fu = 0:030N+825:000 1� N � 777fu = 0:030(N�1023)+825:000 1013� N � 1023
Forward link fd = 0:030N+870:000 1� N � 777fd = 0:030(N�1023)+870:000 1013� N � 1023
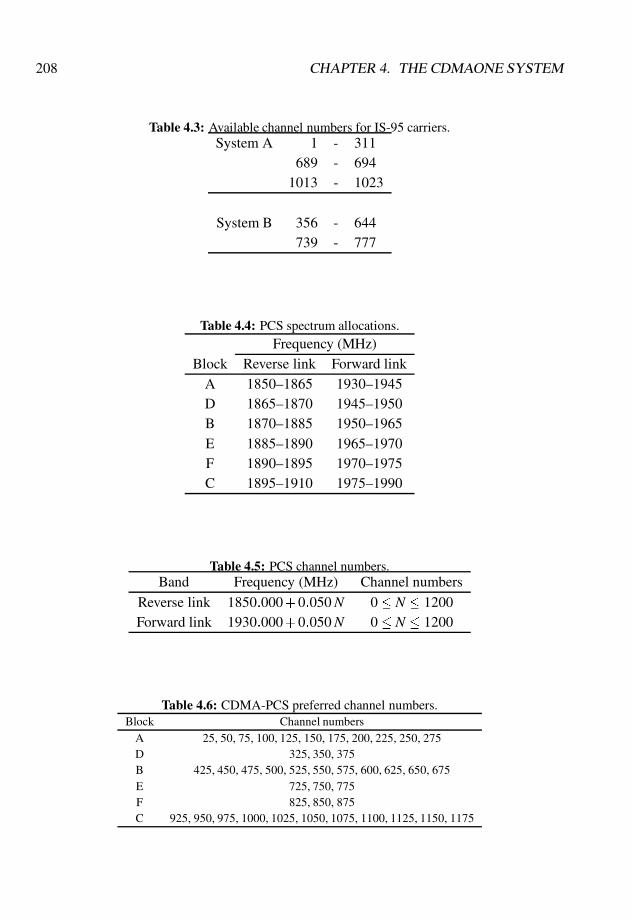
208 CHAPTER 4. THE CDMAONE SYSTEM
Table 4.3: Available channel numbers for IS-95 carriers.System A 1 - 311
689 - 6941013 - 1023
System B 356 - 644739 - 777
Table 4.4: PCS spectrum allocations.Frequency (MHz)
Block Reverse link Forward linkA 1850–1865 1930–1945D 1865–1870 1945–1950B 1870–1885 1950–1965E 1885–1890 1965–1970F 1890–1895 1970–1975C 1895–1910 1975–1990
Table 4.5: PCS channel numbers.Band Frequency (MHz) Channel numbers
Reverse link 1850:000+0:050N 0� N � 1200Forward link 1930:000+0:050N 0� N � 1200
Table 4.6: CDMA-PCS preferred channel numbers.Block Channel numbers
A 25, 50, 75, 100, 125, 150, 175, 200, 225, 250, 275D 325, 350, 375B 425, 450, 475, 500, 525, 550, 575, 600, 625, 650, 675E 725, 750, 775F 825, 850, 875C 925, 950, 975, 1000, 1025, 1050, 1075, 1100, 1125, 1150, 1175

4.2. THE CDMAONE RADIO INTERFACE 209
now examine the physical layer of the radio interface. In contrast to the GSM system, thecoding systems employed on the reverse link and forward link are very different and, forthis reason, we shall examine each link separately.
4.2.2 The cdmaOne Forward link
The forward link consists of the base station (BS) transmitter, the radio channel and theMS receiver. The cdmaOne system supports four different types of forward channels. Thepilot channel is continuously transmitted by each CDMA carrier and is used by the MSto identify the BS. The pilot channel also acts as a cell beacon and is used by MSs inneighbouring cells to assess the suitability of the cell for handover. In this respect the pilotchannel in the cdmaOne system may be likened to the BCCH carrier in the GSM system.The pilot carrier of the serving cells is also used by the MS as a coherent reference in thedemodulation process and in the reverse link power control algorithm.
Another forward channel is the synchronisation channel which, as its name suggests,allows the MS to achieve time synchronisation with the BS and the network. The synchro-nisation channel also carries information relating to system time, and the contents of theBS’s internal registers which are used in the coding, spreading and encryption processes.There are also a number of paging and traffic channels. The paging channels are used topage MSs to alert them to an incoming call. The paging channel is also used to carry generalnetwork information and channel assignment messages. The traffic channels are assignedto the users as required and they may carry speech or user data at bit rates of up to 9.6 kb/sfor IS-95 and 14.4 kb/s for CDMA-PCS.
Each forward channel on a CDMA carrier is assigned a different 64-bit Walsh code, andthese codes are shown in Figure 4.1. Each row of the table represents a different 64-bitWalsh code with the bit positions shown at the top of the table, and the index of the Walshcode shown in the left-hand column. We note that these codes are orthogonal, i.e. the valueof any two codes, multiplied together and summed over a period of 64 chips, is zero, pro-vided the ‘0’ bits are replaced by a ‘�1’ and the ‘1’ bits are replaced by a ‘+1’. Multiplyinga Walsh code by itself produces a constant level of +1 when the two codes are in time syn-chronisation. We note that although the codes shown in Figure 4.1 are true Walsh codesthey are not indexed (or numbered) in the conventional manner. A Walsh code’s index isnormally given by the number of transitions that occur between the different levels during acode period (i.e. 64 chips). In the cdmaOne specifications, however, the Walsh codes havebeen numbered as shown in Figure 4.1. In this discussion we will always use the code indexnumbers shown in Figure 4.1 to avoid confusion and we will refer to the codes as WalshHadamard (WH) codes.
The full block diagram of the cdmaOne BS transmitter is shown in Figure 4.2. Eachchannel in the cdmaOne forward link uses a different coding scheme depending on the
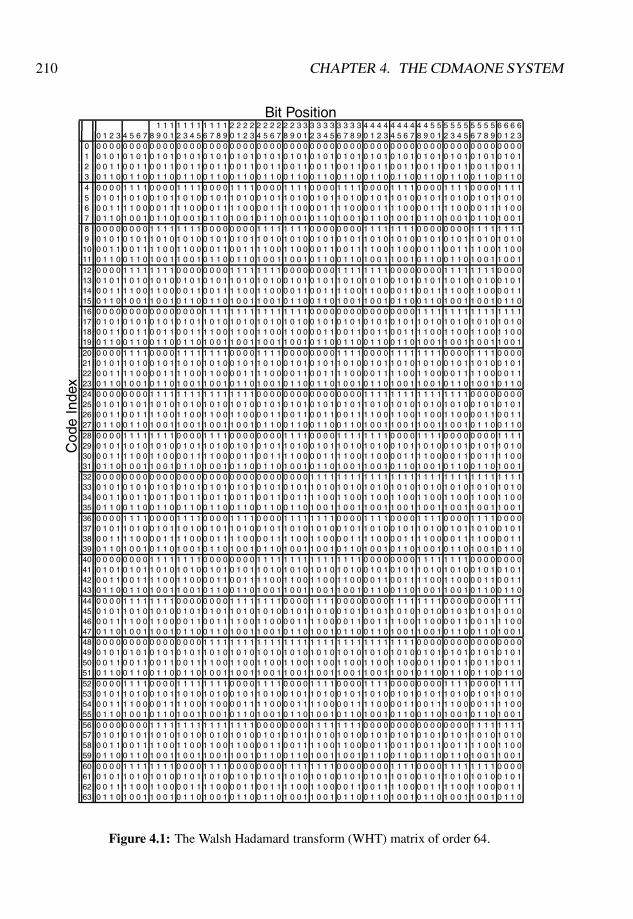
210 CHAPTER 4. THE CDMAONE SYSTEMC
ode
Inde
x
Bit Position1 1 1 1 1 1 1 1 1 1 1 2 2 2 2 2 2 2 2 2 2 3 3 3 3 3 3 3 3 3 3 4 4 4 4 4 4 4 4 4 4 5 5 5 5 5 5 5 5 5 5 6 6 6 6
0 1 2 3 4 5 6 7 8 9 0 1 2 3 4 5 6 7 8 9 0 1 2 3 4 5 6 7 8 9 0 1 2 3 4 5 6 7 8 9 0 1 2 3 4 5 6 7 8 9 0 1 2 3 4 5 6 7 8 9 0 1 2 30 0 0 0 0 0 0 0 0 0 0 0 0 0 0 0 0 0 0 0 0 0 0 0 0 0 0 0 0 0 0 0 0 0 0 0 0 0 0 0 0 0 0 0 0 0 0 0 0 0 0 0 0 0 0 0 0 0 0 0 0 0 0 0 01 0 1 0 1 0 1 0 1 0 1 0 1 0 1 0 1 0 1 0 1 0 1 0 1 0 1 0 1 0 1 0 1 0 1 0 1 0 1 0 1 0 1 0 1 0 1 0 1 0 1 0 1 0 1 0 1 0 1 0 1 0 1 0 12 0 0 1 1 0 0 1 1 0 0 1 1 0 0 1 1 0 0 1 1 0 0 1 1 0 0 1 1 0 0 1 1 0 0 1 1 0 0 1 1 0 0 1 1 0 0 1 1 0 0 1 1 0 0 1 1 0 0 1 1 0 0 1 13 0 1 1 0 0 1 1 0 0 1 1 0 0 1 1 0 0 1 1 0 0 1 1 0 0 1 1 0 0 1 1 0 0 1 1 0 0 1 1 0 0 1 1 0 0 1 1 0 0 1 1 0 0 1 1 0 0 1 1 0 0 1 1 04 0 0 0 0 1 1 1 1 0 0 0 0 1 1 1 1 0 0 0 0 1 1 1 1 0 0 0 0 1 1 1 1 0 0 0 0 1 1 1 1 0 0 0 0 1 1 1 1 0 0 0 0 1 1 1 1 0 0 0 0 1 1 1 15 0 1 0 1 1 0 1 0 0 1 0 1 1 0 1 0 0 1 0 1 1 0 1 0 0 1 0 1 1 0 1 0 0 1 0 1 1 0 1 0 0 1 0 1 1 0 1 0 0 1 0 1 1 0 1 0 0 1 0 1 1 0 1 06 0 0 1 1 1 1 0 0 0 0 1 1 1 1 0 0 0 0 1 1 1 1 0 0 0 0 1 1 1 1 0 0 0 0 1 1 1 1 0 0 0 0 1 1 1 1 0 0 0 0 1 1 1 1 0 0 0 0 1 1 1 1 0 07 0 1 1 0 1 0 0 1 0 1 1 0 1 0 0 1 0 1 1 0 1 0 0 1 0 1 1 0 1 0 0 1 0 1 1 0 1 0 0 1 0 1 1 0 1 0 0 1 0 1 1 0 1 0 0 1 0 1 1 0 1 0 0 18 0 0 0 0 0 0 0 0 1 1 1 1 1 1 1 1 0 0 0 0 0 0 0 0 1 1 1 1 1 1 1 1 0 0 0 0 0 0 0 0 1 1 1 1 1 1 1 1 0 0 0 0 0 0 0 0 1 1 1 1 1 1 1 19 0 1 0 1 0 1 0 1 1 0 1 0 1 0 1 0 0 1 0 1 0 1 0 1 1 0 1 0 1 0 1 0 0 1 0 1 0 1 0 1 1 0 1 0 1 0 1 0 0 1 0 1 0 1 0 1 1 0 1 0 1 0 1 010 0 0 1 1 0 0 1 1 1 1 0 0 1 1 0 0 0 0 1 1 0 0 1 1 1 1 0 0 1 1 0 0 0 0 1 1 0 0 1 1 1 1 0 0 1 1 0 0 0 0 1 1 0 0 1 1 1 1 0 0 1 1 0 011 0 1 1 0 0 1 1 0 1 0 0 1 1 0 0 1 0 1 1 0 0 1 1 0 1 0 0 1 1 0 0 1 0 1 1 0 0 1 1 0 1 0 0 1 1 0 0 1 0 1 1 0 0 1 1 0 1 0 0 1 1 0 0 112 0 0 0 0 1 1 1 1 1 1 1 1 0 0 0 0 0 0 0 0 1 1 1 1 1 1 1 1 0 0 0 0 0 0 0 0 1 1 1 1 1 1 1 1 0 0 0 0 0 0 0 0 1 1 1 1 1 1 1 1 0 0 0 013 0 1 0 1 1 0 1 0 1 0 1 0 0 1 0 1 0 1 0 1 1 0 1 0 1 0 1 0 0 1 0 1 0 1 0 1 1 0 1 0 1 0 1 0 0 1 0 1 0 1 0 1 1 0 1 0 1 0 1 0 0 1 0 114 0 0 1 1 1 1 0 0 1 1 0 0 0 0 1 1 0 0 1 1 1 1 0 0 1 1 0 0 0 0 1 1 0 0 1 1 1 1 0 0 1 1 0 0 0 0 1 1 0 0 1 1 1 1 0 0 1 1 0 0 0 0 1 115 0 1 1 0 1 0 0 1 1 0 0 1 0 1 1 0 0 1 1 0 1 0 0 1 1 0 0 1 0 1 1 0 0 1 1 0 1 0 0 1 1 0 0 1 0 1 1 0 0 1 1 0 1 0 0 1 1 0 0 1 0 1 1 016 0 0 0 0 0 0 0 0 0 0 0 0 0 0 0 0 1 1 1 1 1 1 1 1 1 1 1 1 1 1 1 1 0 0 0 0 0 0 0 0 0 0 0 0 0 0 0 0 1 1 1 1 1 1 1 1 1 1 1 1 1 1 1 117 0 1 0 1 0 1 0 1 0 1 0 1 0 1 0 1 1 0 1 0 1 0 1 0 1 0 1 0 1 0 1 0 0 1 0 1 0 1 0 1 0 1 0 1 0 1 0 1 1 0 1 0 1 0 1 0 1 0 1 0 1 0 1 018 0 0 1 1 0 0 1 1 0 0 1 1 0 0 1 1 1 1 0 0 1 1 0 0 1 1 0 0 1 1 0 0 0 0 1 1 0 0 1 1 0 0 1 1 0 0 1 1 1 1 0 0 1 1 0 0 1 1 0 0 1 1 0 019 0 1 1 0 0 1 1 0 0 1 1 0 0 1 1 0 1 0 0 1 1 0 0 1 1 0 0 1 1 0 0 1 0 1 1 0 0 1 1 0 0 1 1 0 0 1 1 0 1 0 0 1 1 0 0 1 1 0 0 1 1 0 0 120 0 0 0 0 1 1 1 1 0 0 0 0 1 1 1 1 1 1 1 1 0 0 0 0 1 1 1 1 0 0 0 0 0 0 0 0 1 1 1 1 0 0 0 0 1 1 1 1 1 1 1 1 0 0 0 0 1 1 1 1 0 0 0 021 0 1 0 1 1 0 1 0 0 1 0 1 1 0 1 0 1 0 1 0 0 1 0 1 1 0 1 0 0 1 0 1 0 1 0 1 1 0 1 0 0 1 0 1 1 0 1 0 1 0 1 0 0 1 0 1 1 0 1 0 0 1 0 122 0 0 1 1 1 1 0 0 0 0 1 1 1 1 0 0 1 1 0 0 0 0 1 1 1 1 0 0 0 0 1 1 0 0 1 1 1 1 0 0 0 0 1 1 1 1 0 0 1 1 0 0 0 0 1 1 1 1 0 0 0 0 1 123 0 1 1 0 1 0 0 1 0 1 1 0 1 0 0 1 1 0 0 1 0 1 1 0 1 0 0 1 0 1 1 0 0 1 1 0 1 0 0 1 0 1 1 0 1 0 0 1 1 0 0 1 0 1 1 0 1 0 0 1 0 1 1 024 0 0 0 0 0 0 0 0 1 1 1 1 1 1 1 1 1 1 1 1 1 1 1 1 0 0 0 0 0 0 0 0 0 0 0 0 0 0 0 0 1 1 1 1 1 1 1 1 1 1 1 1 1 1 1 1 0 0 0 0 0 0 0 025 0 1 0 1 0 1 0 1 1 0 1 0 1 0 1 0 1 0 1 0 1 0 1 0 0 1 0 1 0 1 0 1 0 1 0 1 0 1 0 1 1 0 1 0 1 0 1 0 1 0 1 0 1 0 1 0 0 1 0 1 0 1 0 126 0 0 1 1 0 0 1 1 1 1 0 0 1 1 0 0 1 1 0 0 1 1 0 0 0 0 1 1 0 0 1 1 0 0 1 1 0 0 1 1 1 1 0 0 1 1 0 0 1 1 0 0 1 1 0 0 0 0 1 1 0 0 1 127 0 1 1 0 0 1 1 0 1 0 0 1 1 0 0 1 1 0 0 1 1 0 0 1 0 1 1 0 0 1 1 0 0 1 1 0 0 1 1 0 1 0 0 1 1 0 0 1 1 0 0 1 1 0 0 1 0 1 1 0 0 1 1 028 0 0 0 0 1 1 1 1 1 1 1 1 0 0 0 0 1 1 1 1 0 0 0 0 0 0 0 0 1 1 1 1 0 0 0 0 1 1 1 1 1 1 1 1 0 0 0 0 1 1 1 1 0 0 0 0 0 0 0 0 1 1 1 129 0 1 0 1 1 0 1 0 1 0 1 0 0 1 0 1 1 0 1 0 0 1 0 1 0 1 0 1 1 0 1 0 0 1 0 1 1 0 1 0 1 0 1 0 0 1 0 1 1 0 1 0 0 1 0 1 0 1 0 1 1 0 1 030 0 0 1 1 1 1 0 0 1 1 0 0 0 0 1 1 1 1 0 0 0 0 1 1 0 0 1 1 1 1 0 0 0 0 1 1 1 1 0 0 1 1 0 0 0 0 1 1 1 1 0 0 0 0 1 1 0 0 1 1 1 1 0 031 0 1 1 0 1 0 0 1 1 0 0 1 0 1 1 0 1 0 0 1 0 1 1 0 0 1 1 0 1 0 0 1 0 1 1 0 1 0 0 1 1 0 0 1 0 1 1 0 1 0 0 1 0 1 1 0 0 1 1 0 1 0 0 132 0 0 0 0 0 0 0 0 0 0 0 0 0 0 0 0 0 0 0 0 0 0 0 0 0 0 0 0 0 0 0 0 1 1 1 1 1 1 1 1 1 1 1 1 1 1 1 1 1 1 1 1 1 1 1 1 1 1 1 1 1 1 1 133 0 1 0 1 0 1 0 1 0 1 0 1 0 1 0 1 0 1 0 1 0 1 0 1 0 1 0 1 0 1 0 1 1 0 1 0 1 0 1 0 1 0 1 0 1 0 1 0 1 0 1 0 1 0 1 0 1 0 1 0 1 0 1 034 0 0 1 1 0 0 1 1 0 0 1 1 0 0 1 1 0 0 1 1 0 0 1 1 0 0 1 1 0 0 1 1 1 1 0 0 1 1 0 0 1 1 0 0 1 1 0 0 1 1 0 0 1 1 0 0 1 1 0 0 1 1 0 035 0 1 1 0 0 1 1 0 0 1 1 0 0 1 1 0 0 1 1 0 0 1 1 0 0 1 1 0 0 1 1 0 1 0 0 1 1 0 0 1 1 0 0 1 1 0 0 1 1 0 0 1 1 0 0 1 1 0 0 1 1 0 0 136 0 0 0 0 1 1 1 1 0 0 0 0 1 1 1 1 0 0 0 0 1 1 1 1 0 0 0 0 1 1 1 1 1 1 1 1 0 0 0 0 1 1 1 1 0 0 0 0 1 1 1 1 0 0 0 0 1 1 1 1 0 0 0 037 0 1 0 1 1 0 1 0 0 1 0 1 1 0 1 0 0 1 0 1 1 0 1 0 0 1 0 1 1 0 1 0 1 0 1 0 0 1 0 1 1 0 1 0 0 1 0 1 1 0 1 0 0 1 0 1 1 0 1 0 0 1 0 138 0 0 1 1 1 1 0 0 0 0 1 1 1 1 0 0 0 0 1 1 1 1 0 0 0 0 1 1 1 1 0 0 1 1 0 0 0 0 1 1 1 1 0 0 0 0 1 1 1 1 0 0 0 0 1 1 1 1 0 0 0 0 1 139 0 1 1 0 1 0 0 1 0 1 1 0 1 0 0 1 0 1 1 0 1 0 0 1 0 1 1 0 1 0 0 1 1 0 0 1 0 1 1 0 1 0 0 1 0 1 1 0 1 0 0 1 0 1 1 0 1 0 0 1 0 1 1 040 0 0 0 0 0 0 0 0 1 1 1 1 1 1 1 1 0 0 0 0 0 0 0 0 1 1 1 1 1 1 1 1 1 1 1 1 1 1 1 1 0 0 0 0 0 0 0 0 1 1 1 1 1 1 1 1 0 0 0 0 0 0 0 041 0 1 0 1 0 1 0 1 1 0 1 0 1 0 1 0 0 1 0 1 0 1 0 1 1 0 1 0 1 0 1 0 1 0 1 0 1 0 1 0 0 1 0 1 0 1 0 1 1 0 1 0 1 0 1 0 0 1 0 1 0 1 0 142 0 0 1 1 0 0 1 1 1 1 0 0 1 1 0 0 0 0 1 1 0 0 1 1 1 1 0 0 1 1 0 0 1 1 0 0 1 1 0 0 0 0 1 1 0 0 1 1 1 1 0 0 1 1 0 0 0 0 1 1 0 0 1 143 0 1 1 0 0 1 1 0 1 0 0 1 1 0 0 1 0 1 1 0 0 1 1 0 1 0 0 1 1 0 0 1 1 0 0 1 1 0 0 1 0 1 1 0 0 1 1 0 1 0 0 1 1 0 0 1 0 1 1 0 0 1 1 044 0 0 0 0 1 1 1 1 1 1 1 1 0 0 0 0 0 0 0 0 1 1 1 1 1 1 1 1 0 0 0 0 1 1 1 1 0 0 0 0 0 0 0 0 1 1 1 1 1 1 1 1 0 0 0 0 0 0 0 0 1 1 1 145 0 1 0 1 1 0 1 0 1 0 1 0 0 1 0 1 0 1 0 1 1 0 1 0 1 0 1 0 0 1 0 1 1 0 1 0 0 1 0 1 0 1 0 1 1 0 1 0 1 0 1 0 0 1 0 1 0 1 0 1 1 0 1 046 0 0 1 1 1 1 0 0 1 1 0 0 0 0 1 1 0 0 1 1 1 1 0 0 1 1 0 0 0 0 1 1 1 1 0 0 0 0 1 1 0 0 1 1 1 1 0 0 1 1 0 0 0 0 1 1 0 0 1 1 1 1 0 047 0 1 1 0 1 0 0 1 1 0 0 1 0 1 1 0 0 1 1 0 1 0 0 1 1 0 0 1 0 1 1 0 1 0 0 1 0 1 1 0 0 1 1 0 1 0 0 1 1 0 0 1 0 1 1 0 0 1 1 0 1 0 0 148 0 0 0 0 0 0 0 0 0 0 0 0 0 0 0 0 1 1 1 1 1 1 1 1 1 1 1 1 1 1 1 1 1 1 1 1 1 1 1 1 1 1 1 1 1 1 1 1 0 0 0 0 0 0 0 0 0 0 0 0 0 0 0 049 0 1 0 1 0 1 0 1 0 1 0 1 0 1 0 1 1 0 1 0 1 0 1 0 1 0 1 0 1 0 1 0 1 0 1 0 1 0 1 0 1 0 1 0 1 0 1 0 0 1 0 1 0 1 0 1 0 1 0 1 0 1 0 150 0 0 1 1 0 0 1 1 0 0 1 1 0 0 1 1 1 1 0 0 1 1 0 0 1 1 0 0 1 1 0 0 1 1 0 0 1 1 0 0 1 1 0 0 1 1 0 0 0 0 1 1 0 0 1 1 0 0 1 1 0 0 1 151 0 1 1 0 0 1 1 0 0 1 1 0 0 1 1 0 1 0 0 1 1 0 0 1 1 0 0 1 1 0 0 1 1 0 0 1 1 0 0 1 1 0 0 1 1 0 0 1 0 1 1 0 0 1 1 0 0 1 1 0 0 1 1 052 0 0 0 0 1 1 1 1 0 0 0 0 1 1 1 1 1 1 1 1 0 0 0 0 1 1 1 1 0 0 0 0 1 1 1 1 0 0 0 0 1 1 1 1 0 0 0 0 0 0 0 0 1 1 1 1 0 0 0 0 1 1 1 153 0 1 0 1 1 0 1 0 0 1 0 1 1 0 1 0 1 0 1 0 0 1 0 1 1 0 1 0 0 1 0 1 1 0 1 0 0 1 0 1 1 0 1 0 0 1 0 1 0 1 0 1 1 0 1 0 0 1 0 1 1 0 1 054 0 0 1 1 1 1 0 0 0 0 1 1 1 1 0 0 1 1 0 0 0 0 1 1 1 1 0 0 0 0 1 1 1 1 0 0 0 0 1 1 1 1 0 0 0 0 1 1 0 0 1 1 1 1 0 0 0 0 1 1 1 1 0 055 0 1 1 0 1 0 0 1 0 1 1 0 1 0 0 1 1 0 0 1 0 1 1 0 1 0 0 1 0 1 1 0 1 0 0 1 0 1 1 0 1 0 0 1 0 1 1 0 0 1 1 0 1 0 0 1 0 1 1 0 1 0 0 156 0 0 0 0 0 0 0 0 1 1 1 1 1 1 1 1 1 1 1 1 1 1 1 1 0 0 0 0 0 0 0 0 1 1 1 1 1 1 1 1 0 0 0 0 0 0 0 0 0 0 0 0 0 0 0 0 1 1 1 1 1 1 1 157 0 1 0 1 0 1 0 1 1 0 1 0 1 0 1 0 1 0 1 0 1 0 1 0 0 1 0 1 0 1 0 1 1 0 1 0 1 0 1 0 0 1 0 1 0 1 0 1 0 1 0 1 0 1 0 1 1 0 1 0 1 0 1 058 0 0 1 1 0 0 1 1 1 1 0 0 1 1 0 0 1 1 0 0 1 1 0 0 0 0 1 1 0 0 1 1 1 1 0 0 1 1 0 0 0 0 1 1 0 0 1 1 0 0 1 1 0 0 1 1 1 1 0 0 1 1 0 059 0 1 1 0 0 1 1 0 1 0 0 1 1 0 0 1 1 0 0 1 1 0 0 1 0 1 1 0 0 1 1 0 1 0 0 1 1 0 0 1 0 1 1 0 0 1 1 0 0 1 1 0 0 1 1 0 1 0 0 1 1 0 0 160 0 0 0 0 1 1 1 1 1 1 1 1 0 0 0 0 1 1 1 1 0 0 0 0 0 0 0 0 1 1 1 1 1 1 1 1 0 0 0 0 0 0 0 0 1 1 1 1 0 0 0 0 1 1 1 1 1 1 1 1 0 0 0 061 0 1 0 1 1 0 1 0 1 0 1 0 0 1 0 1 1 0 1 0 0 1 0 1 0 1 0 1 1 0 1 0 1 0 1 0 0 1 0 1 0 1 0 1 1 0 1 0 0 1 0 1 1 0 1 0 1 0 1 0 0 1 0 162 0 0 1 1 1 1 0 0 1 1 0 0 0 0 1 1 1 1 0 0 0 0 1 1 0 0 1 1 1 1 0 0 1 1 0 0 0 0 1 1 0 0 1 1 1 1 0 0 0 0 1 1 1 1 0 0 1 1 0 0 0 0 1 163 0 1 1 0 1 0 0 1 1 0 0 1 0 1 1 0 1 0 0 1 0 1 1 0 0 1 1 0 1 0 0 1 1 0 0 1 0 1 1 0 0 1 1 0 1 0 0 1 0 1 1 0 1 0 0 1 1 0 0 1 0 1 1 0
Figure 4.1: The Walsh Hadamard transform (WHT) matrix of order 64.
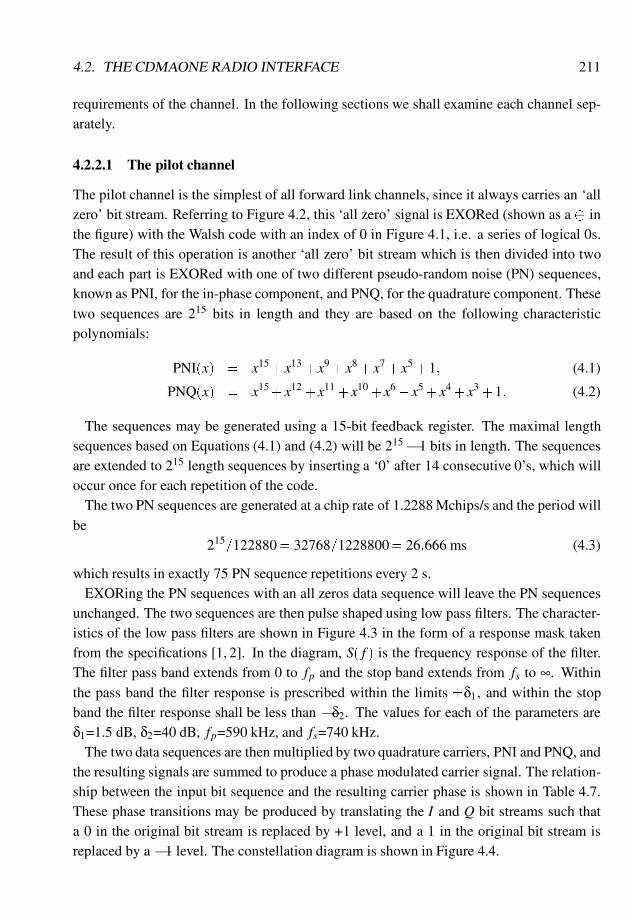
4.2. THE CDMAONE RADIO INTERFACE 211
requirements of the channel. In the following sections we shall examine each channel sep-arately.
4.2.2.1 The pilot channel
The pilot channel is the simplest of all forward link channels, since it always carries an ‘allzero’ bit stream. Referring to Figure 4.2, this ‘all zero’ signal is EXORed (shown as a � inthe figure) with the Walsh code with an index of 0 in Figure 4.1, i.e. a series of logical 0s.The result of this operation is another ‘all zero’ bit stream which is then divided into twoand each part is EXORed with one of two different pseudo-random noise (PN) sequences,known as PNI, for the in-phase component, and PNQ, for the quadrature component. Thesetwo sequences are 215 bits in length and they are based on the following characteristicpolynomials:
PNI(x) = x15+x13 +x9 +x8 +x7 +x5 +1; (4.1)
PNQ(x) = x15+x12 +x11 +x10+x6 +x5 +x4 +x3 +1: (4.2)
The sequences may be generated using a 15-bit feedback register. The maximal lengthsequences based on Equations (4.1) and (4.2) will be 215� 1 bits in length. The sequencesare extended to 215 length sequences by inserting a ‘0’ after 14 consecutive 0’s, which willoccur once for each repetition of the code.
The two PN sequences are generated at a chip rate of 1.2288 Mchips/s and the period willbe
215=122880= 32768=1228800= 26:666 ms (4.3)
which results in exactly 75 PN sequence repetitions every 2 s.EXORing the PN sequences with an all zeros data sequence will leave the PN sequences
unchanged. The two sequences are then pulse shaped using low pass filters. The character-istics of the low pass filters are shown in Figure 4.3 in the form of a response mask takenfrom the specifications [1, 2]. In the diagram, S( f ) is the frequency response of the filter.The filter pass band extends from 0 to fp and the stop band extends from fs to ∞. Withinthe pass band the filter response is prescribed within the limits �δ1, and within the stopband the filter response shall be less than �δ2. The values for each of the parameters areδ1=1.5 dB, δ2=40 dB, fp=590 kHz, and fs=740 kHz.
The two data sequences are then multiplied by two quadrature carriers, PNI and PNQ, andthe resulting signals are summed to produce a phase modulated carrier signal. The relation-ship between the input bit sequence and the resulting carrier phase is shown in Table 4.7.These phase transitions may be produced by translating the I and Q bit streams such thata 0 in the original bit stream is replaced by +1 level, and a 1 in the original bit stream isreplaced by a �1 level. The constellation diagram is shown in Figure 4.4.
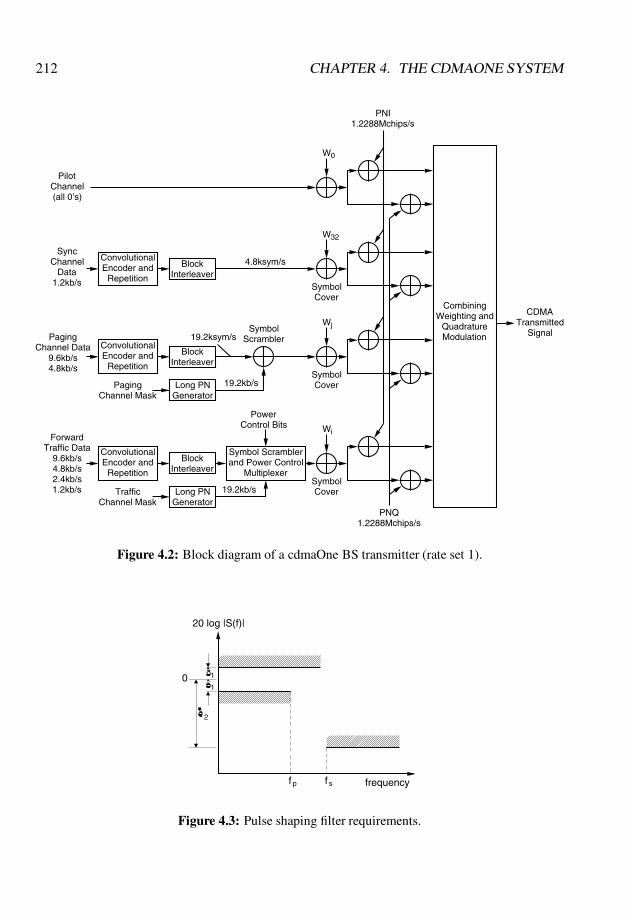
212 CHAPTER 4. THE CDMAONE SYSTEM
Wi
19.2kb/s
W
19.2kb/s
j
W32
4.8ksym/s
19.2ksym/s
W0
CDMATransmitted
Signal
CombiningWeighting and
QuadratureModulation
PilotChannel(all 0’s)
SyncChannel
Data1.2kb/s
ConvolutionalEncoder and
Repetition
RepetitionEncoder andConvolutional
RepetitionEncoder andConvolutional
BlockInterleaver
BlockInterleaver
BlockInterleaver
PagingChannel Data
9.6kb/s4.8kb/s
ForwardTraffic Data
9.6kb/s4.8kb/s2.4kb/s1.2kb/s
PagingChannel Mask
Channel MaskTraffic
Long PNGenerator
Long PNGenerator
Symbol Scramblerand Power Control
Multiplexer
SymbolScrambler
PowerControl Bits
SymbolCover
SymbolCover
SymbolCover
PNI1.2288Mchips/s
1.2288Mchips/sPNQ
Figure 4.2: Block diagram of a cdmaOne BS transmitter (rate set 1).
1
1
2
0
20 log |S(f)|
f fp s frequency
Figure 4.3: Pulse shaping filter requirements.
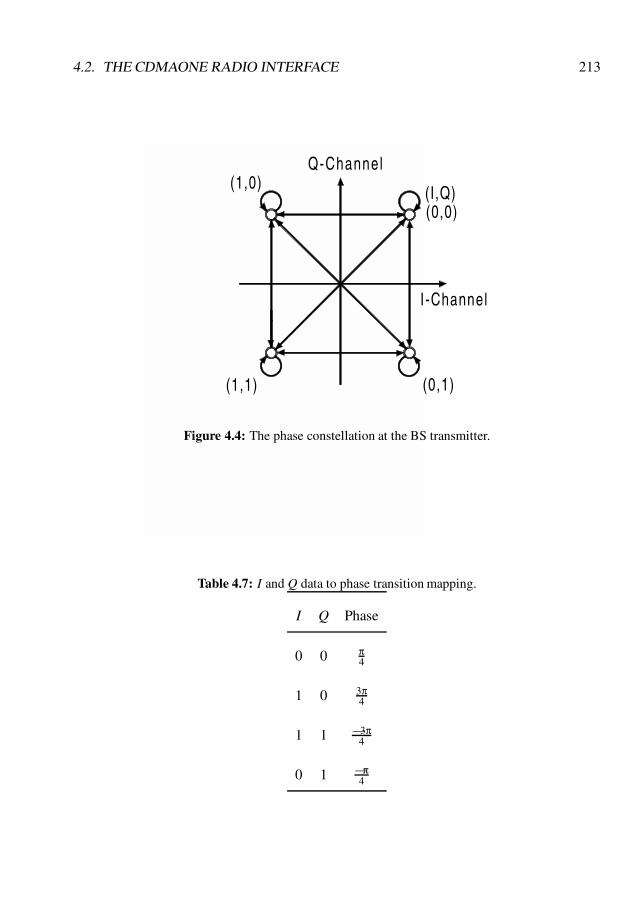
4.2. THE CDMAONE RADIO INTERFACE 213
Q-Channel
(1,1)
(1,0)
I-Channel
(0,1)
(0,0)(I,Q)
Figure 4.4: The phase constellation at the BS transmitter.
Table 4.7: I and Q data to phase transition mapping.
I Q Phase
0 0 π4
1 0 3π4
1 1 �3π4
0 1 �π4
214 CHAPTER 4. THE CDMAONE SYSTEM
We have described the construction of the pilot channel as it has been shown in the spec-ifications. However, in practice the pilot channel is merely produced by modulating thePNI and PNQ sequences onto two quadrature carriers; the use of Walsh code 0 and an ‘allzero’ data sequence is irrelevant. We have also assumed that the translation from digital bits(0 and 1) to logical levels (�1) occurs just prior to quadrature modulation; however, thistranslation may occur at an earlier stage. For example, the PNI and PNQ sequences couldbe produced as logical levels directly.
Having described the construction of the pilot channel we now examine its functions.One of the main functions of the pilot channel is to allow the MS to detect and identify theBSs. Since all BSs use the same PN sequences and the same carrier frequency, the onlyway in which the different pilot channels may be distinguished is by the phase of their PNsequences. In IS-95, each BS within a geographical area will use a different time offset forthe PN sequence and this offset will be defined in integer multiples of 64 chips.
For the PN offset to have any meaning across the system it must be referenced to a com-mon timing source. This requirement means that all BSs within a network must be timesynchronised. This is currently achieved using global positioning system (GPS) satellitelinks as a source of universal coordinated time (UTC). The network system time is synchro-nised to UTC; however, it differs from UTC because the system time does not include theleap seconds that are added to UTC. The even seconds of system time are also importantwhen we consider frame synchronisation. These represent points in system time when thenumber of accumulated seconds is divisible by two, i.e. every other second.
The 215= 32768= 512�64 length PN sequences allow 512 different offsets of 64 chips
from 0 (i.e. zero offset PN sequence) to 511. At switch-on, an MS will sweep a searchercorrelator over all possible pilot PN offsets to identify the different BSs within its local area.The amplitude of the correlator output will indicate the strength of the BS using a given pilotPN offset. An example of a searcher correlator output is shown in Figure 4.5, where boththe in-phase (I) and quadrature (Q) outputs are shown. The figure shows that the MS hasidentified four strong BSs within the geographical area.
The pilot signal is also used by the MS to provide a coherent reference in the demodulationof other signals transmitted on the same CDMA carrier. This is possible because the MSis able to extract the RF carrier phase information from the pilot signal, and this will beconstant for all the channels on a single CDMA RF carrier.
The MS also uses the pilot signals to assess the suitability of neighbouring BSs for han-dover and, in this respect, the pilot signal is similar to the BCCH carrier in the GSM system.The MS also uses the pilot channel to estimate what reverse transmitter power it should ini-tially use. This estimate is known as the open-loop estimate, and once the MS is in a call, itwill continue to be used in conjunction with a closed-loop power control mechanism to al-low more accurate control of the MS transmitted power to be made and over a wide dynamic
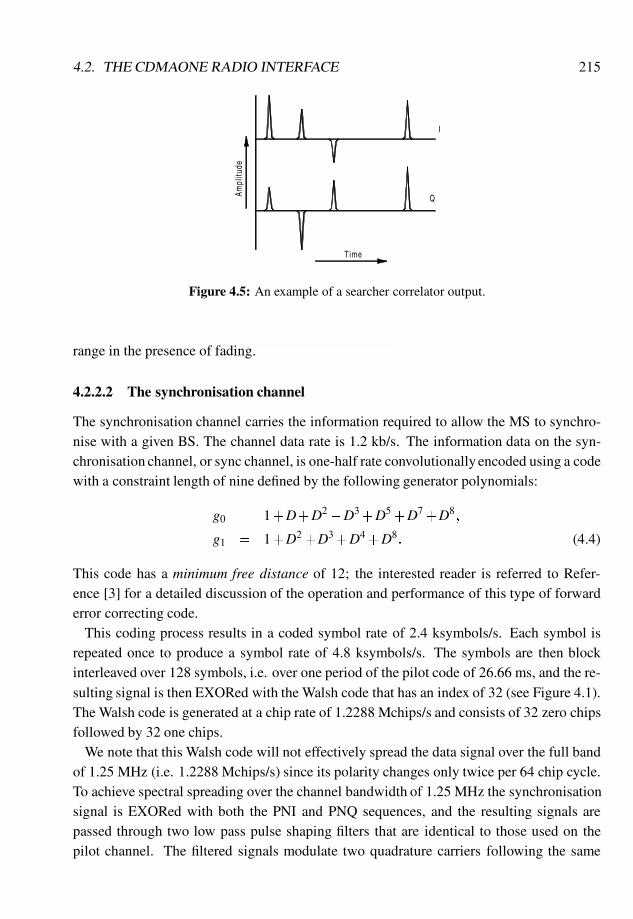
4.2. THE CDMAONE RADIO INTERFACE 215
Time
Ampl
itude
Q
I
Figure 4.5: An example of a searcher correlator output.
range in the presence of fading.
4.2.2.2 The synchronisation channel
The synchronisation channel carries the information required to allow the MS to synchro-nise with a given BS. The channel data rate is 1.2 kb/s. The information data on the syn-chronisation channel, or sync channel, is one-half rate convolutionally encoded using a codewith a constraint length of nine defined by the following generator polynomials:
g0 = 1+D+D2+D3
+D5+D7
+D8;
g1 = 1+D2+D3
+D4+D8
: (4.4)
This code has a minimum free distance of 12; the interested reader is referred to Refer-ence [3] for a detailed discussion of the operation and performance of this type of forwarderror correcting code.
This coding process results in a coded symbol rate of 2.4 ksymbols/s. Each symbol isrepeated once to produce a symbol rate of 4.8 ksymbols/s. The symbols are then blockinterleaved over 128 symbols, i.e. over one period of the pilot code of 26.66 ms, and the re-sulting signal is then EXORed with the Walsh code that has an index of 32 (see Figure 4.1).The Walsh code is generated at a chip rate of 1.2288 Mchips/s and consists of 32 zero chipsfollowed by 32 one chips.
We note that this Walsh code will not effectively spread the data signal over the full bandof 1.25 MHz (i.e. 1.2288 Mchips/s) since its polarity changes only twice per 64 chip cycle.To achieve spectral spreading over the channel bandwidth of 1.25 MHz the synchronisationsignal is EXORed with both the PNI and PNQ sequences, and the resulting signals arepassed through two low pass pulse shaping filters that are identical to those used on thepilot channel. The filtered signals modulate two quadrature carriers following the same
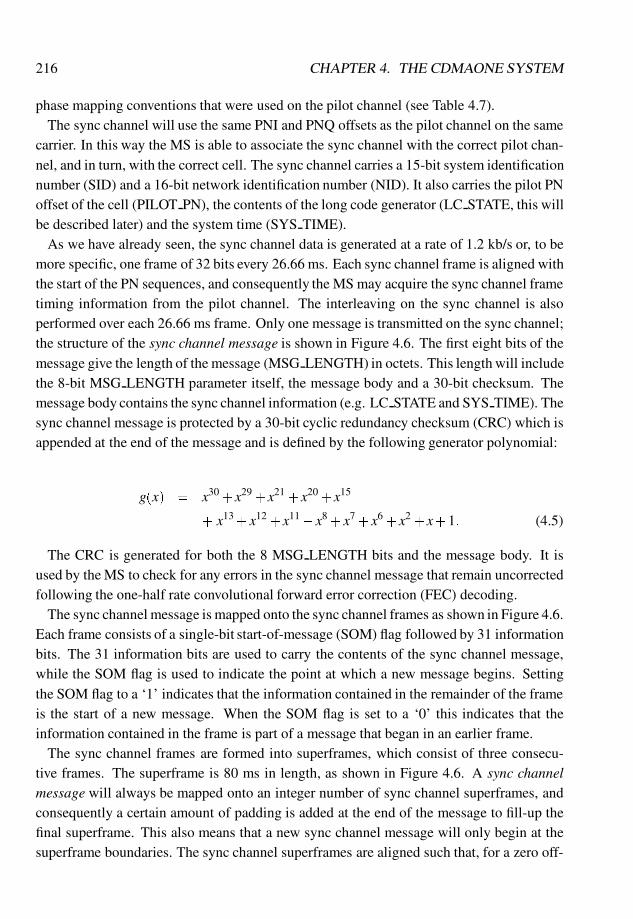
216 CHAPTER 4. THE CDMAONE SYSTEM
phase mapping conventions that were used on the pilot channel (see Table 4.7).The sync channel will use the same PNI and PNQ offsets as the pilot channel on the same
carrier. In this way the MS is able to associate the sync channel with the correct pilot chan-nel, and in turn, with the correct cell. The sync channel carries a 15-bit system identificationnumber (SID) and a 16-bit network identification number (NID). It also carries the pilot PNoffset of the cell (PILOT PN), the contents of the long code generator (LC STATE, this willbe described later) and the system time (SYS TIME).
As we have already seen, the sync channel data is generated at a rate of 1.2 kb/s or, to bemore specific, one frame of 32 bits every 26.66 ms. Each sync channel frame is aligned withthe start of the PN sequences, and consequently the MS may acquire the sync channel frametiming information from the pilot channel. The interleaving on the sync channel is alsoperformed over each 26.66 ms frame. Only one message is transmitted on the sync channel;the structure of the sync channel message is shown in Figure 4.6. The first eight bits of themessage give the length of the message (MSG LENGTH) in octets. This length will includethe 8-bit MSG LENGTH parameter itself, the message body and a 30-bit checksum. Themessage body contains the sync channel information (e.g. LC STATE and SYS TIME). Thesync channel message is protected by a 30-bit cyclic redundancy checksum (CRC) which isappended at the end of the message and is defined by the following generator polynomial:
g(x) = x30+x29+x21 +x20+x15
+ x13+x12 +x11+x8 +x7 +x6 +x2 +x+1: (4.5)
The CRC is generated for both the 8 MSG LENGTH bits and the message body. It isused by the MS to check for any errors in the sync channel message that remain uncorrectedfollowing the one-half rate convolutional forward error correction (FEC) decoding.
The sync channel message is mapped onto the sync channel frames as shown in Figure 4.6.Each frame consists of a single-bit start-of-message (SOM) flag followed by 31 informationbits. The 31 information bits are used to carry the contents of the sync channel message,while the SOM flag is used to indicate the point at which a new message begins. Settingthe SOM flag to a ‘1’ indicates that the information contained in the remainder of the frameis the start of a new message. When the SOM flag is set to a ‘0’ this indicates that theinformation contained in the frame is part of a message that began in an earlier frame.
The sync channel frames are formed into superframes, which consist of three consecu-tive frames. The superframe is 80 ms in length, as shown in Figure 4.6. A sync channelmessage will always be mapped onto an integer number of sync channel superframes, andconsequently a certain amount of padding is added at the end of the message to fill-up thefinal superframe. This also means that a new sync channel message will only begin at thesuperframe boundaries. The sync channel superframes are aligned such that, for a zero off-
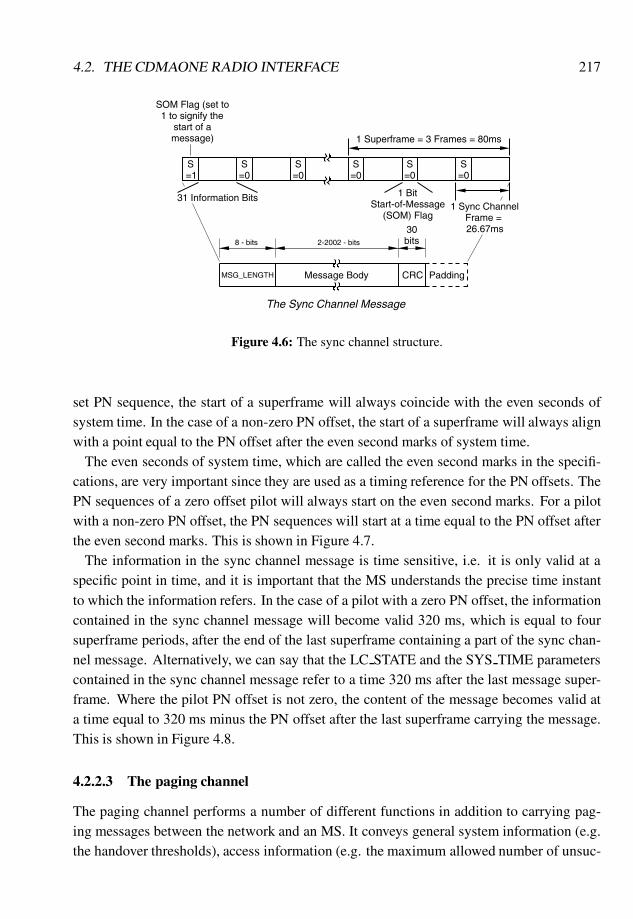
4.2. THE CDMAONE RADIO INTERFACE 217
MSG_LENGTH Message Body CRC Padding
31 Information Bits
The Sync Channel Message
1 Superframe = 3 Frames = 80ms
S=0 =0
S=0S
=0S
=0S
=1S
1 BitStart-of-Message
(SOM) Flag1 Sync Channel
Frame = 26.67ms
SOM Flag (set to1 to signify the
start of amessage)
8 - bits 2-2002 - bits
30bits
Figure 4.6: The sync channel structure.
set PN sequence, the start of a superframe will always coincide with the even seconds ofsystem time. In the case of a non-zero PN offset, the start of a superframe will always alignwith a point equal to the PN offset after the even second marks of system time.
The even seconds of system time, which are called the even second marks in the specifi-cations, are very important since they are used as a timing reference for the PN offsets. ThePN sequences of a zero offset pilot will always start on the even second marks. For a pilotwith a non-zero PN offset, the PN sequences will start at a time equal to the PN offset afterthe even second marks. This is shown in Figure 4.7.
The information in the sync channel message is time sensitive, i.e. it is only valid at aspecific point in time, and it is important that the MS understands the precise time instantto which the information refers. In the case of a pilot with a zero PN offset, the informationcontained in the sync channel message will become valid 320 ms, which is equal to foursuperframe periods, after the end of the last superframe containing a part of the sync chan-nel message. Alternatively, we can say that the LC STATE and the SYS TIME parameterscontained in the sync channel message refer to a time 320 ms after the last message super-frame. Where the pilot PN offset is not zero, the content of the message becomes valid ata time equal to 320 ms minus the PN offset after the last superframe carrying the message.This is shown in Figure 4.8.
4.2.2.3 The paging channel
The paging channel performs a number of different functions in addition to carrying pag-ing messages between the network and an MS. It conveys general system information (e.g.the handover thresholds), access information (e.g. the maximum allowed number of unsuc-
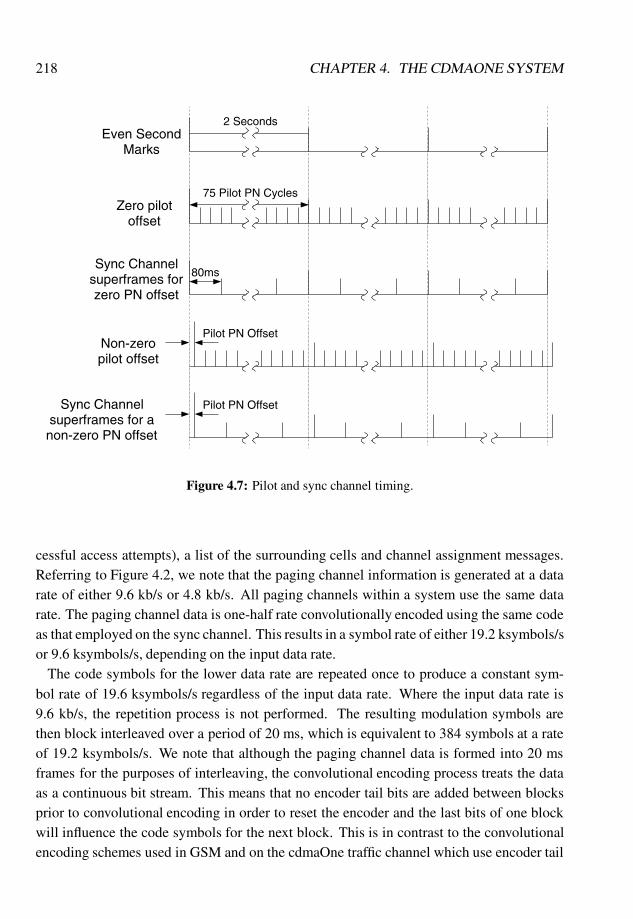
218 CHAPTER 4. THE CDMAONE SYSTEM
2 Seconds
75 Pilot PN Cycles
80ms
Pilot PN Offset
Pilot PN Offset
Even SecondMarks
Zero pilotoffset
Sync Channelsuperframes forzero PN offset
Non-zeropilot offset
Sync Channelsuperframes for anon-zero PN offset
Figure 4.7: Pilot and sync channel timing.
cessful access attempts), a list of the surrounding cells and channel assignment messages.Referring to Figure 4.2, we note that the paging channel information is generated at a datarate of either 9.6 kb/s or 4.8 kb/s. All paging channels within a system use the same datarate. The paging channel data is one-half rate convolutionally encoded using the same codeas that employed on the sync channel. This results in a symbol rate of either 19.2 ksymbols/sor 9.6 ksymbols/s, depending on the input data rate.
The code symbols for the lower data rate are repeated once to produce a constant sym-bol rate of 19.6 ksymbols/s regardless of the input data rate. Where the input data rate is9.6 kb/s, the repetition process is not performed. The resulting modulation symbols arethen block interleaved over a period of 20 ms, which is equivalent to 384 symbols at a rateof 19.2 ksymbols/s. We note that although the paging channel data is formed into 20 msframes for the purposes of interleaving, the convolutional encoding process treats the dataas a continuous bit stream. This means that no encoder tail bits are added between blocksprior to convolutional encoding in order to reset the encoder and the last bits of one blockwill influence the code symbols for the next block. This is in contrast to the convolutionalencoding schemes used in GSM and on the cdmaOne traffic channel which use encoder tail
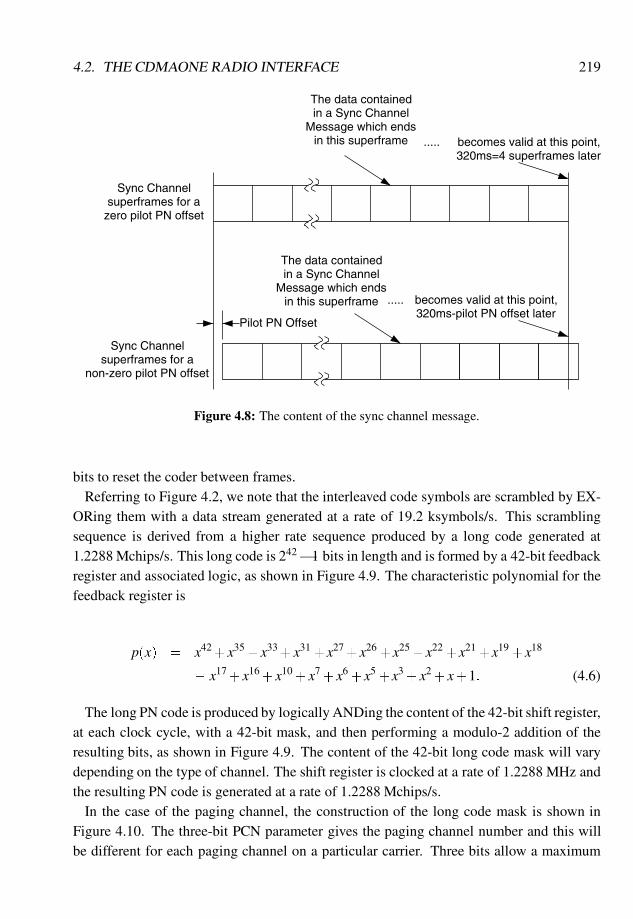
4.2. THE CDMAONE RADIO INTERFACE 219
.....
.....
Pilot PN Offset
The data containedin a Sync Channel
Message which endsin this superframe becomes valid at this point,
320ms=4 superframes later
Sync Channelsuperframes for a
zero pilot PN offset
320ms-pilot PN offset laterbecomes valid at this point,
The data containedin a Sync Channel
Message which endsin this superframe
Sync Channelsuperframes for a
non-zero pilot PN offset
Figure 4.8: The content of the sync channel message.
bits to reset the coder between frames.Referring to Figure 4.2, we note that the interleaved code symbols are scrambled by EX-
ORing them with a data stream generated at a rate of 19.2 ksymbols/s. This scramblingsequence is derived from a higher rate sequence produced by a long code generated at1.2288 Mchips/s. This long code is 242
�1 bits in length and is formed by a 42-bit feedbackregister and associated logic, as shown in Figure 4.9. The characteristic polynomial for thefeedback register is
p(x) = x42+x35 +x33+x31 +x27+x26 +x25+x22 +x21+x19 +x18
+ x17+x16+x10 +x7 +x6 +x5 +x3 +x2 +x+1: (4.6)
The long PN code is produced by logically ANDing the content of the 42-bit shift register,at each clock cycle, with a 42-bit mask, and then performing a modulo-2 addition of theresulting bits, as shown in Figure 4.9. The content of the 42-bit long code mask will varydepending on the type of channel. The shift register is clocked at a rate of 1.2288 MHz andthe resulting PN code is generated at a rate of 1.2288 Mchips/s.
In the case of the paging channel, the construction of the long code mask is shown inFigure 4.10. The three-bit PCN parameter gives the paging channel number and this willbe different for each paging channel on a particular carrier. Three bits allow a maximum
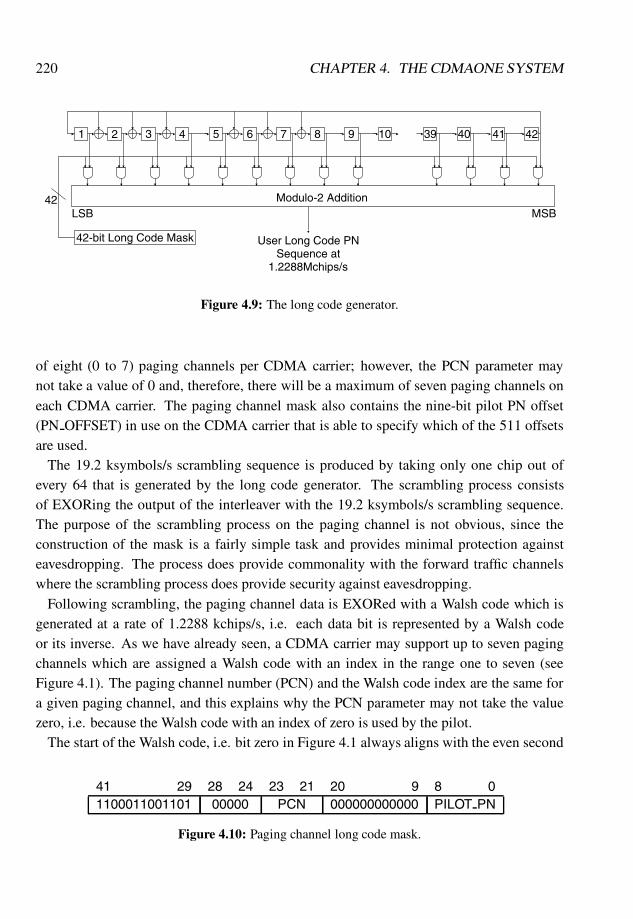
220 CHAPTER 4. THE CDMAONE SYSTEM
1 2 3 4 5 6 7 8 9 10 39 40 41 42
Modulo-2 Addition
42-bit Long Code Mask
LSB MSB
User Long Code PNSequence at
1.2288Mchips/s
42
Figure 4.9: The long code generator.
of eight (0 to 7) paging channels per CDMA carrier; however, the PCN parameter maynot take a value of 0 and, therefore, there will be a maximum of seven paging channels oneach CDMA carrier. The paging channel mask also contains the nine-bit pilot PN offset(PN OFFSET) in use on the CDMA carrier that is able to specify which of the 511 offsetsare used.
The 19.2 ksymbols/s scrambling sequence is produced by taking only one chip out ofevery 64 that is generated by the long code generator. The scrambling process consistsof EXORing the output of the interleaver with the 19.2 ksymbols/s scrambling sequence.The purpose of the scrambling process on the paging channel is not obvious, since theconstruction of the mask is a fairly simple task and provides minimal protection againsteavesdropping. The process does provide commonality with the forward traffic channelswhere the scrambling process does provide security against eavesdropping.
Following scrambling, the paging channel data is EXORed with a Walsh code which isgenerated at a rate of 1.2288 kchips/s, i.e. each data bit is represented by a Walsh codeor its inverse. As we have already seen, a CDMA carrier may support up to seven pagingchannels which are assigned a Walsh code with an index in the range one to seven (seeFigure 4.1). The paging channel number (PCN) and the Walsh code index are the same fora given paging channel, and this explains why the PCN parameter may not take the valuezero, i.e. because the Walsh code with an index of zero is used by the pilot.
The start of the Walsh code, i.e. bit zero in Figure 4.1 always aligns with the even second
41 29 28 24 23 21 20 9 8 01100011001101 00000 PCN 000000000000 PILOT PN
Figure 4.10: Paging channel long code mask.
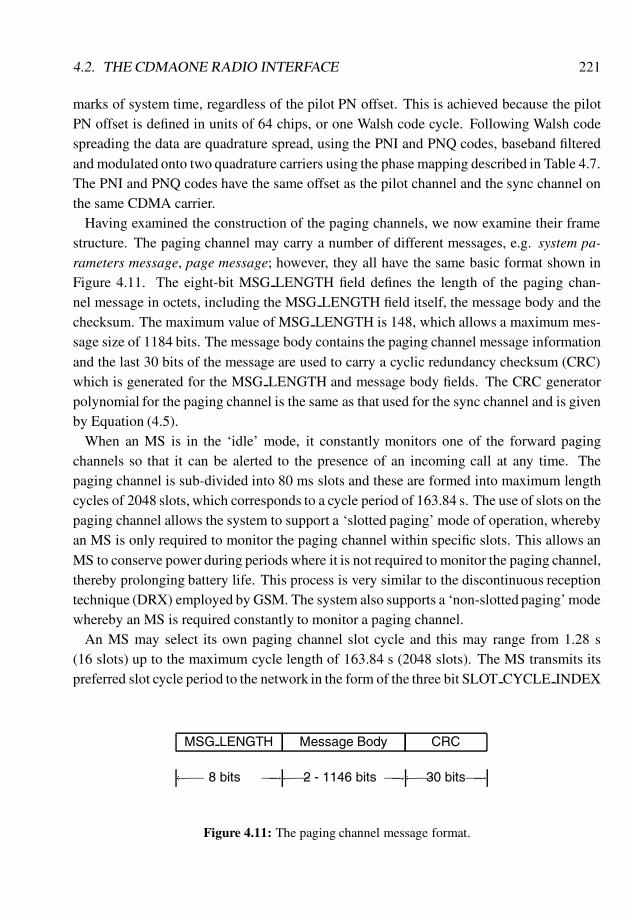
4.2. THE CDMAONE RADIO INTERFACE 221
marks of system time, regardless of the pilot PN offset. This is achieved because the pilotPN offset is defined in units of 64 chips, or one Walsh code cycle. Following Walsh codespreading the data are quadrature spread, using the PNI and PNQ codes, baseband filteredand modulated onto two quadrature carriers using the phase mapping described in Table 4.7.The PNI and PNQ codes have the same offset as the pilot channel and the sync channel onthe same CDMA carrier.
Having examined the construction of the paging channels, we now examine their framestructure. The paging channel may carry a number of different messages, e.g. system pa-rameters message, page message; however, they all have the same basic format shown inFigure 4.11. The eight-bit MSG LENGTH field defines the length of the paging chan-nel message in octets, including the MSG LENGTH field itself, the message body and thechecksum. The maximum value of MSG LENGTH is 148, which allows a maximum mes-sage size of 1184 bits. The message body contains the paging channel message informationand the last 30 bits of the message are used to carry a cyclic redundancy checksum (CRC)which is generated for the MSG LENGTH and message body fields. The CRC generatorpolynomial for the paging channel is the same as that used for the sync channel and is givenby Equation (4.5).
When an MS is in the ‘idle’ mode, it constantly monitors one of the forward pagingchannels so that it can be alerted to the presence of an incoming call at any time. Thepaging channel is sub-divided into 80 ms slots and these are formed into maximum lengthcycles of 2048 slots, which corresponds to a cycle period of 163.84 s. The use of slots on thepaging channel allows the system to support a ‘slotted paging’ mode of operation, wherebyan MS is only required to monitor the paging channel within specific slots. This allows anMS to conserve power during periods where it is not required to monitor the paging channel,thereby prolonging battery life. This process is very similar to the discontinuous receptiontechnique (DRX) employed by GSM. The system also supports a ‘non-slotted paging’ modewhereby an MS is required constantly to monitor a paging channel.
An MS may select its own paging channel slot cycle and this may range from 1.28 s(16 slots) up to the maximum cycle length of 163.84 s (2048 slots). The MS transmits itspreferred slot cycle period to the network in the form of the three bit SLOT CYCLE INDEX
MSG LENGTH Message Body CRC
� 8 bits �! �2 - 1146 bits �! �30 bits�!
Figure 4.11: The paging channel message format.
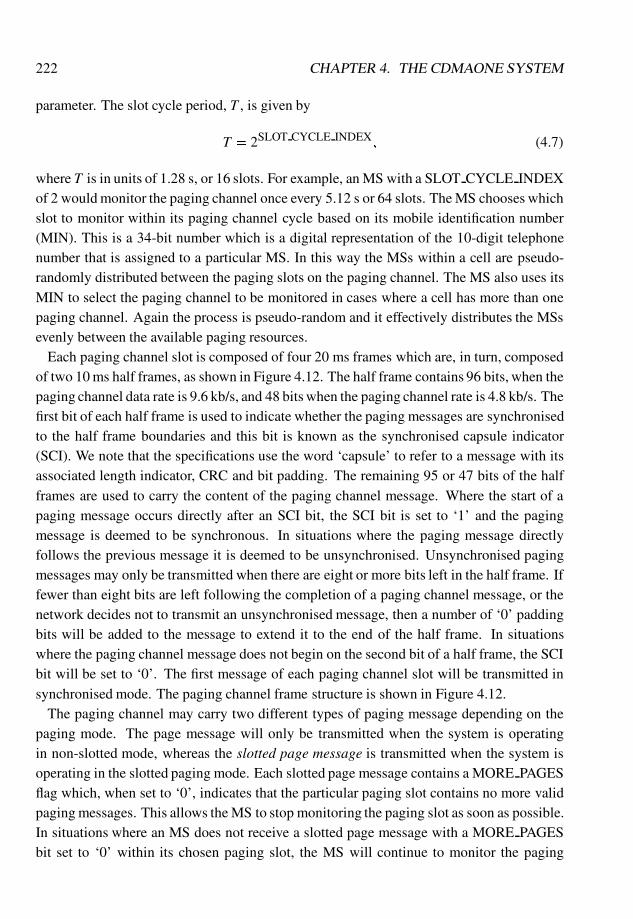
222 CHAPTER 4. THE CDMAONE SYSTEM
parameter. The slot cycle period, T , is given by
T = 2SLOT CYCLE INDEX; (4.7)
where T is in units of 1.28 s, or 16 slots. For example, an MS with a SLOT CYCLE INDEXof 2 would monitor the paging channel once every 5.12 s or 64 slots. The MS chooses whichslot to monitor within its paging channel cycle based on its mobile identification number(MIN). This is a 34-bit number which is a digital representation of the 10-digit telephonenumber that is assigned to a particular MS. In this way the MSs within a cell are pseudo-randomly distributed between the paging slots on the paging channel. The MS also uses itsMIN to select the paging channel to be monitored in cases where a cell has more than onepaging channel. Again the process is pseudo-random and it effectively distributes the MSsevenly between the available paging resources.
Each paging channel slot is composed of four 20 ms frames which are, in turn, composedof two 10 ms half frames, as shown in Figure 4.12. The half frame contains 96 bits, when thepaging channel data rate is 9.6 kb/s, and 48 bits when the paging channel rate is 4.8 kb/s. Thefirst bit of each half frame is used to indicate whether the paging messages are synchronisedto the half frame boundaries and this bit is known as the synchronised capsule indicator(SCI). We note that the specifications use the word ‘capsule’ to refer to a message with itsassociated length indicator, CRC and bit padding. The remaining 95 or 47 bits of the halfframes are used to carry the content of the paging channel message. Where the start of apaging message occurs directly after an SCI bit, the SCI bit is set to ‘1’ and the pagingmessage is deemed to be synchronous. In situations where the paging message directlyfollows the previous message it is deemed to be unsynchronised. Unsynchronised pagingmessages may only be transmitted when there are eight or more bits left in the half frame. Iffewer than eight bits are left following the completion of a paging channel message, or thenetwork decides not to transmit an unsynchronised message, then a number of ‘0’ paddingbits will be added to the message to extend it to the end of the half frame. In situationswhere the paging channel message does not begin on the second bit of a half frame, the SCIbit will be set to ‘0’. The first message of each paging channel slot will be transmitted insynchronised mode. The paging channel frame structure is shown in Figure 4.12.
The paging channel may carry two different types of paging message depending on thepaging mode. The page message will only be transmitted when the system is operatingin non-slotted mode, whereas the slotted page message is transmitted when the system isoperating in the slotted paging mode. Each slotted page message contains a MORE PAGESflag which, when set to ‘0’, indicates that the particular paging slot contains no more validpaging messages. This allows the MS to stop monitoring the paging slot as soon as possible.In situations where an MS does not receive a slotted page message with a MORE PAGESbit set to ‘0’ within its chosen paging slot, the MS will continue to monitor the paging
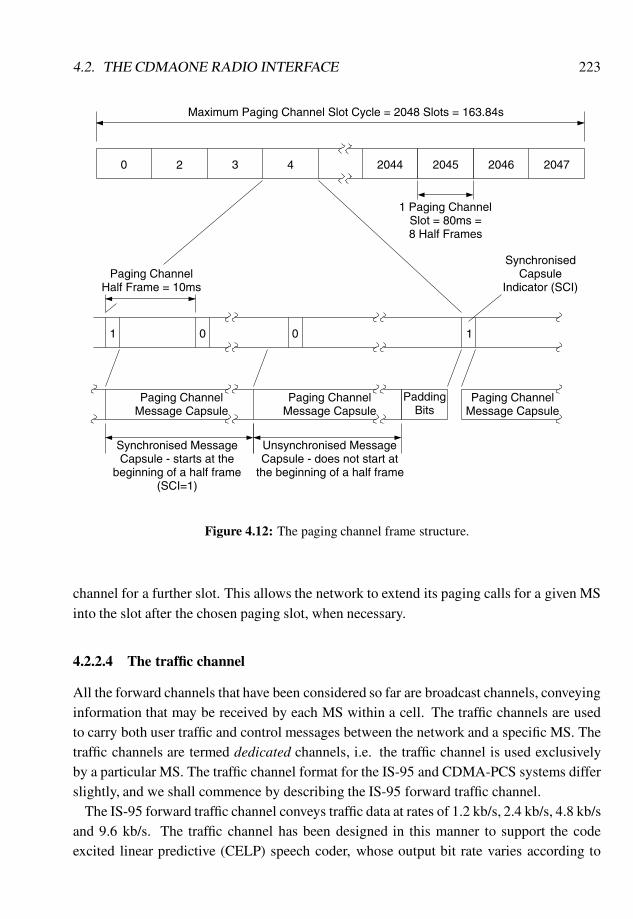
4.2. THE CDMAONE RADIO INTERFACE 223
Synchronised MessageCapsule - starts at the
beginning of a half frame(SCI=1)
Paging ChannelMessage Capsule
1 0 1
Message CapsulePaging Channel
Unsynchronised MessageCapsule - does not start at
the beginning of a half frame
0
PaddingBits
Paging ChannelMessage Capsule
Paging ChannelHalf Frame = 10ms
SynchronisedCapsule
Indicator (SCI)
204720462045204430 2 4
1 Paging ChannelSlot = 80ms =8 Half Frames
Maximum Paging Channel Slot Cycle = 2048 Slots = 163.84s
Figure 4.12: The paging channel frame structure.
channel for a further slot. This allows the network to extend its paging calls for a given MSinto the slot after the chosen paging slot, when necessary.
4.2.2.4 The traffic channel
All the forward channels that have been considered so far are broadcast channels, conveyinginformation that may be received by each MS within a cell. The traffic channels are usedto carry both user traffic and control messages between the network and a specific MS. Thetraffic channels are termed dedicated channels, i.e. the traffic channel is used exclusivelyby a particular MS. The traffic channel format for the IS-95 and CDMA-PCS systems differslightly, and we shall commence by describing the IS-95 forward traffic channel.
The IS-95 forward traffic channel conveys traffic data at rates of 1.2 kb/s, 2.4 kb/s, 4.8 kb/sand 9.6 kb/s. The traffic channel has been designed in this manner to support the codeexcited linear predictive (CELP) speech coder, whose output bit rate varies according to
224 CHAPTER 4. THE CDMAONE SYSTEM
the speech activity. The IS-95 CELP coder is an analysis-by-synthesis coder that providesacceptable speech quality at an average data rate below 8 kb/s. The design and analysis ofthis type of coder is fairly complex and beyond the scope of this book. However, the readeris referred to Reference [4] for a full treatise on analysis-by-synthesis predictive coding.
The speech signal is encoded into frames of 20 ms duration containing 192, 96, 48 or 24bits per frame, depending on the user’s speech activity. In simple terms, speech informationwill be coded at the highest data rate (i.e. 9.6 kb/s or 192 bits per frame) and backgroundnoise in silence intervals will be coded at the lowest data rate (i.e. 1.2 kb/s or 24 bits perframe). The background noise is sometimes referred to as comfort noise and it is intendedto reassure the listener that the link has not been lost when the person at the other end hasstopped speaking. Since there is no requirement to convey an accurate description of thebackground noise, it can be encoded using fewer bits than the important speech information.The two intermediate data rates of 4.8 kb/s (96 bits per frame) and 2.4 kb/s (48 bits perframe) are used to provide a smooth transition between the periods of speech and silence.
Each frame contains eight encoder tail bits which are used to reset the convolutionalencoder to a known state after the frame has been encoded. The two higher rate frames(9.6 kb/s and 4.8 kb/s) contain a frame quality indicator in the form of a CRC code. Thiscode is used to detect bit errors that have not been corrected by the convolutional decod-ing process at the receiver. Only the higher rate frames are given this additional level ofprotection because these will be carrying important speech information.
Referring to Figure 4.2, the traffic channel frames are convolutionally encoded using aone-half rate coder. The code is exactly the same as that used on the synchronisation andpaging channels, and the generator polynomials are given in Equation (4.4). The maindifference between the convolutional coding on the traffic channels and that used on thepaging and sync channels is that the convolutional coder is initialised to the ‘all zero’ stateat the end of each frame in the case of the traffic channels.
The coder output rates will be 19.2 ksymbols/s, 9.6 ksymbols/s, 4.8 ksymbols/s and2.4 ksymbols/s, depending on the input data rate. The symbols are then repeated to producea constant symbol rate of 19.2 ksymbols/s, regardless of the input data rate. For example,an input data rate of 1.2 kb/s results in a symbol rate of 2.4 ksymbols/s after convolutionalencoding. Each symbol is repeated seven times (i.e. eight copies of the symbol in total) toproduce a symbol rate of 19.2 ksymbols/s. Table 4.8 gives the number of symbol repetitionsthat are required for each input data rate.
The symbols are interleaved over each 20 ms frame, which contains 384 code symbols ata rate of 19.2 ksymbols/s. Following interleaving, the code symbols are scrambled using a19.2 ksymbols/s scrambling sequence derived from the long PN code using either the publicor private long code mask. The construction of the 42-bit public long code mask is shownin Figure 4.13, where ESN signifies the electronic serial number of the MS. This is a 32-bit

4.2. THE CDMAONE RADIO INTERFACE 225
Table 4.8: Symbol repetitions on the IS-95 traffic channel.Input data No. of symbolrate (kb/s) repetitions
9.6 04.8 12.4 31.2 7
number that is assigned to an MS by the manufacturer and is unique to each MS. The ESNis permuted, or rearranged, to prevent a high correlation between MSs with consecutiveESNs. This is important on the IS-95 reverse link where the long code is used to distinguishthe different MSs. The public long code mask may be determined for any MS once the ESNis known, but this does not provide adequate protection against eavesdropping on the radiopath. For this reason, although the private long code mask has been defined, its constructionis not contained in the specifications and it is only available on a restricted basis. By thisstrategy the private long code mask provides protection against eavesdropping on the radiopath. The 19.2 kb/s scrambling sequence is derived from the 1.2288 Mchips/s long PN codesequence by taking only one bit in each 64 and scrambling is achieved by EXORing thecoded symbols with the scrambling sequence.
Following scrambling, the coded data are multiplexed with the power control sub-channel.This sub-channel data are used to adjust the transmitter power of an MS in an attempt toensure that the received Eb=I0 is within an acceptable range for good quality communica-tions. The power control sub-channel consists of a single bit every 1.25 ms (i.e. 800 b/s)and this is used to instruct the MS either to increase its transmitter power by 1 dB, if the bitis a logical 0, or to decrease its power by 1 dB, if the bit is a logical 1.
Each 20 ms traffic channel frame on both the reverse link and the forward link is di-vided into 16� 1:25 ms power control groups, which contain 24 modulation symbols at19.2 ksymbol/s. The BS measures the reverse link received power over each power controlgroup, decides whether the MS should increase or decrease its power, and transmits thecorresponding power control bit two power control groups later on the forward link trafficchannel. This is shown in Figure 4.14. We note that, at the BS, the reverse link and forward
41 32 31 01100011000 Permuted ESN
Figure 4.13: Traffic channel public long code mask.
226 CHAPTER 4. THE CDMAONE SYSTEM
link traffic frames are displaced by the round trip propagation delay between the BS andthe MS.
Each power control bit has the same duration as two code symbols (i.e. approximately104µs) and, consequently, it will be used to replace two symbols per power control group.The position of the power control bits is effectively ‘randomised’ within each power controlgroup to prevent the generation of line spectra in the transmitted signal. Each power controlgroup consists of 24 code symbols and the start of the power control bit may occur at anypoint within the first 16 symbols. The actual position is defined by the last four bits of thescrambling sequence that was used in the previous power control group. In the example inFigure 4.14, the last four bits of the scrambling sequence are 1101. Taking the last bit (i.e.bit 24) as the most significant, this gives the four-bit number 10112 = 1110, which meansthat the power control bit starts in position 11 in the power control group and it will replacecode symbols 11 and 12.
The process of replacing the code symbols with the power control bits will introduceerrors; however, these may be corrected by the powerful one-half rate code. We also notethat the MS receiver will always know the position of the power control bits. This techniqueof removing code symbols is called puncturing and a similar technique has been used inGSM on the traffic channels to tailor a convolutional code to the channel bit rate.
Following the insertion of the power control sub-channel data, the traffic channel data arespread using a Walsh code generated at 1.2288 Mchips/s. In IS-95, the traffic channel mayuse any Walsh code with an index in the range 1 to 63 (see Figure 4.1), since Walsh codezero is reserved for the pilot channel. The spreading process consists of EXORing the trafficchannel code symbols with the Walsh code to produce a spread signal at 1.2288 Mchips/s.The signal is then spread in quadrature by the PNI and PNQ sequences and the resultingbit streams are passed through the pulse shaping filters before being used to modulate theCDMA carrier.
In IS-95 the transmitted power of each traffic channel varies according to the channeldata rate such that the transmitted energy per bit is always constant. This means that thetransmitter power must be reduced in proportion to the number of times a symbol is repeatedon each channel. We recall the example of a code symbol being repeated seven times whenthe channel bit rate is 1.2 kb/s so for this case. In order to maintain a transmitted energyper bit of Eb, each code symbol must be transmitted at a decreased power of Es = Eb=16,as each data bit results in 16 codes symbols, i.e. two symbols from the one-half rate codeplus seven repetitions. Table 4.9 shows the relative transmitter power that is used for eachdata rate. This technique allows the IS-95 system to reduce the interference caused byeach user when it is operating below the maximum channel bit rate. Coupled with thevariable rate CELP coder, this allows the IS-95 system to exploit the gaps in a user’s speechto reduce interference and increase system capacity. However, the power control bits are
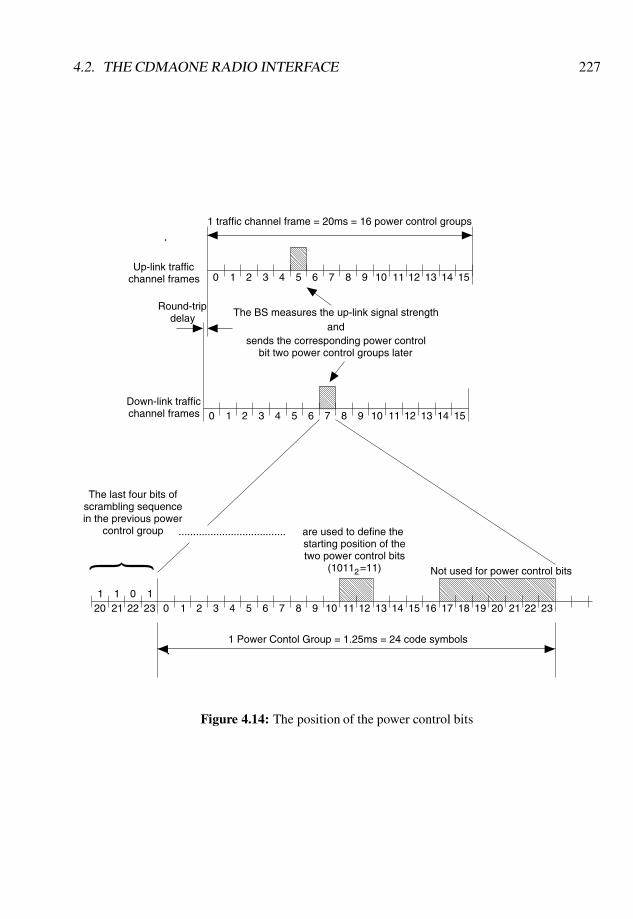
4.2. THE CDMAONE RADIO INTERFACE 227
0 1 2 3 4 5 876 9 10 131211 14 15 181716 19 2220 21 23
Not used for power control bits
232221201011
1 Power Contol Group = 1.25ms = 24 code symbols
The last four bits ofscrambling sequencein the previous power
control group
(1011 =11)two power control bitsstarting position of theare used to define the { .....................................
2
1 2 4 53 7 86 9 10 11 12 130 14 15
120 1 2 3 4 5 6 7 8 109 11 1513 14
The BS measures the up-link signal strengthand
sends the corresponding power controlbit two power control groups later
Round-tripdelay
Up-link trafficchannel frames
channel framesDown-link traffic
1 traffic channel frame = 20ms = 16 power control groups
Figure 4.14: The position of the power control bits
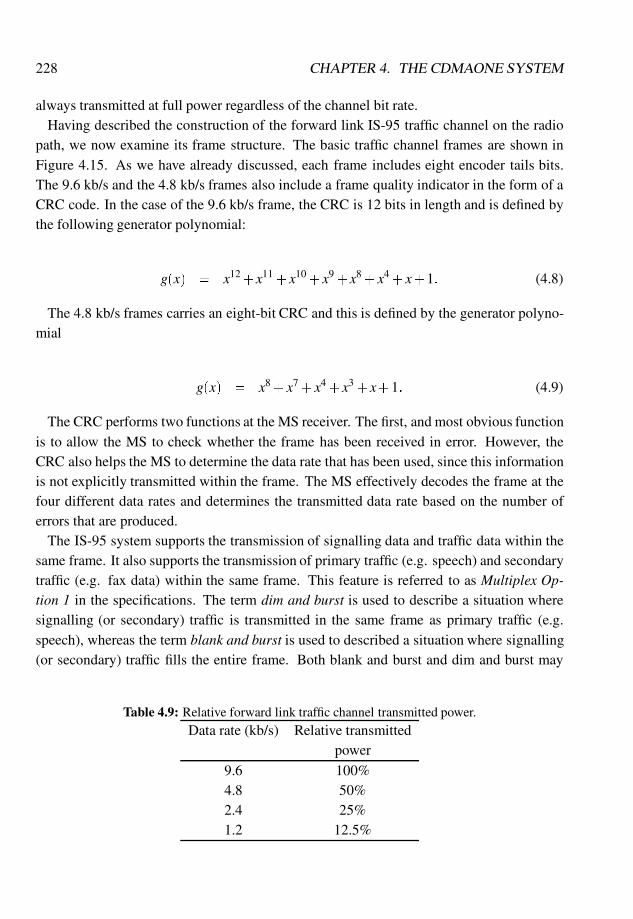
228 CHAPTER 4. THE CDMAONE SYSTEM
always transmitted at full power regardless of the channel bit rate.Having described the construction of the forward link IS-95 traffic channel on the radio
path, we now examine its frame structure. The basic traffic channel frames are shown inFigure 4.15. As we have already discussed, each frame includes eight encoder tails bits.The 9.6 kb/s and the 4.8 kb/s frames also include a frame quality indicator in the form of aCRC code. In the case of the 9.6 kb/s frame, the CRC is 12 bits in length and is defined bythe following generator polynomial:
g(x) = x12+x11 +x10 +x9+x8 +x4 +x+1: (4.8)
The 4.8 kb/s frames carries an eight-bit CRC and this is defined by the generator polyno-mial
g(x) = x8 +x7 +x4 +x3 +x+1: (4.9)
The CRC performs two functions at the MS receiver. The first, and most obvious functionis to allow the MS to check whether the frame has been received in error. However, theCRC also helps the MS to determine the data rate that has been used, since this informationis not explicitly transmitted within the frame. The MS effectively decodes the frame at thefour different data rates and determines the transmitted data rate based on the number oferrors that are produced.
The IS-95 system supports the transmission of signalling data and traffic data within thesame frame. It also supports the transmission of primary traffic (e.g. speech) and secondarytraffic (e.g. fax data) within the same frame. This feature is referred to as Multiplex Op-tion 1 in the specifications. The term dim and burst is used to describe a situation wheresignalling (or secondary) traffic is transmitted in the same frame as primary traffic (e.g.speech), whereas the term blank and burst is used to described a situation where signalling(or secondary) traffic fills the entire frame. Both blank and burst and dim and burst may
Table 4.9: Relative forward link traffic channel transmitted power.Data rate (kb/s) Relative transmitted
power
9.6 100%4.8 50%2.4 25%1.2 12.5%
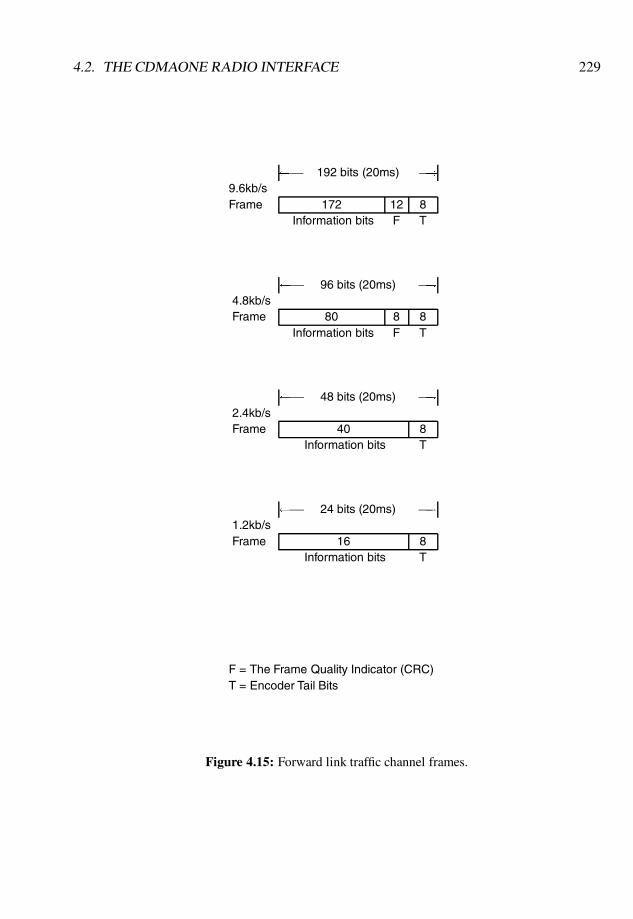
4.2. THE CDMAONE RADIO INTERFACE 229
� 192 bits (20ms) �!
9.6kb/sFrame 172 12 8
Information bits F T
� 96 bits (20ms) �!
4.8kb/sFrame 80 8 8
Information bits F T
� 48 bits (20ms) �!
2.4kb/sFrame 40 8
Information bits T
� 24 bits (20ms) �!
1.2kb/sFrame 16 8
Information bits T
F = The Frame Quality Indicator (CRC)T = Encoder Tail Bits
Figure 4.15: Forward link traffic channel frames.
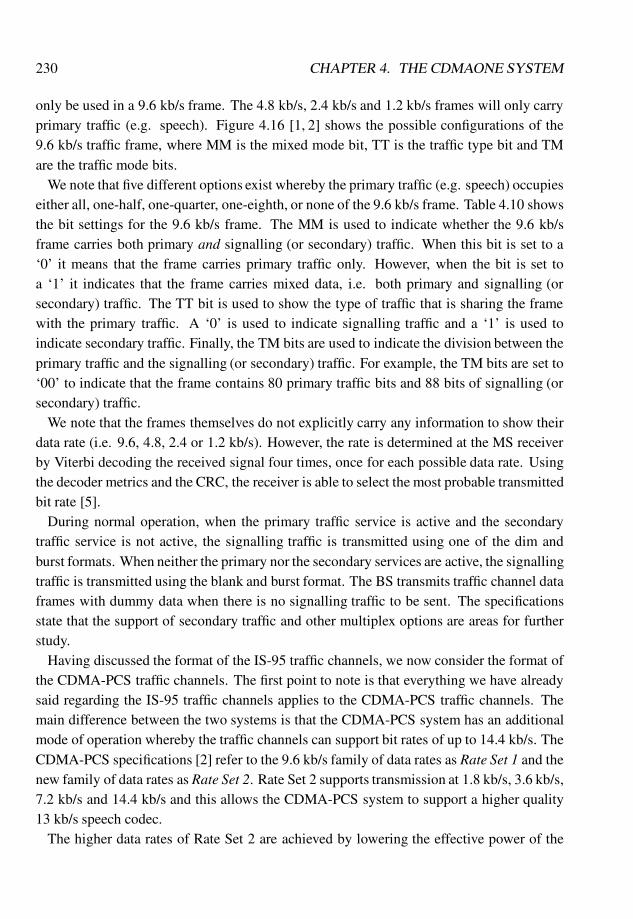
230 CHAPTER 4. THE CDMAONE SYSTEM
only be used in a 9.6 kb/s frame. The 4.8 kb/s, 2.4 kb/s and 1.2 kb/s frames will only carryprimary traffic (e.g. speech). Figure 4.16 [1, 2] shows the possible configurations of the9.6 kb/s traffic frame, where MM is the mixed mode bit, TT is the traffic type bit and TMare the traffic mode bits.
We note that five different options exist whereby the primary traffic (e.g. speech) occupieseither all, one-half, one-quarter, one-eighth, or none of the 9.6 kb/s frame. Table 4.10 showsthe bit settings for the 9.6 kb/s frame. The MM is used to indicate whether the 9.6 kb/sframe carries both primary and signalling (or secondary) traffic. When this bit is set to a‘0’ it means that the frame carries primary traffic only. However, when the bit is set toa ‘1’ it indicates that the frame carries mixed data, i.e. both primary and signalling (orsecondary) traffic. The TT bit is used to show the type of traffic that is sharing the framewith the primary traffic. A ‘0’ is used to indicate signalling traffic and a ‘1’ is used toindicate secondary traffic. Finally, the TM bits are used to indicate the division between theprimary traffic and the signalling (or secondary) traffic. For example, the TM bits are set to‘00’ to indicate that the frame contains 80 primary traffic bits and 88 bits of signalling (orsecondary) traffic.
We note that the frames themselves do not explicitly carry any information to show theirdata rate (i.e. 9.6, 4.8, 2.4 or 1.2 kb/s). However, the rate is determined at the MS receiverby Viterbi decoding the received signal four times, once for each possible data rate. Usingthe decoder metrics and the CRC, the receiver is able to select the most probable transmittedbit rate [5].
During normal operation, when the primary traffic service is active and the secondarytraffic service is not active, the signalling traffic is transmitted using one of the dim andburst formats. When neither the primary nor the secondary services are active, the signallingtraffic is transmitted using the blank and burst format. The BS transmits traffic channel dataframes with dummy data when there is no signalling traffic to be sent. The specificationsstate that the support of secondary traffic and other multiplex options are areas for furtherstudy.
Having discussed the format of the IS-95 traffic channels, we now consider the format ofthe CDMA-PCS traffic channels. The first point to note is that everything we have alreadysaid regarding the IS-95 traffic channels applies to the CDMA-PCS traffic channels. Themain difference between the two systems is that the CDMA-PCS system has an additionalmode of operation whereby the traffic channels can support bit rates of up to 14.4 kb/s. TheCDMA-PCS specifications [2] refer to the 9.6 kb/s family of data rates as Rate Set 1 and thenew family of data rates as Rate Set 2. Rate Set 2 supports transmission at 1.8 kb/s, 3.6 kb/s,7.2 kb/s and 14.4 kb/s and this allows the CDMA-PCS system to support a higher quality13 kb/s speech codec.
The higher data rates of Rate Set 2 are achieved by lowering the effective power of the
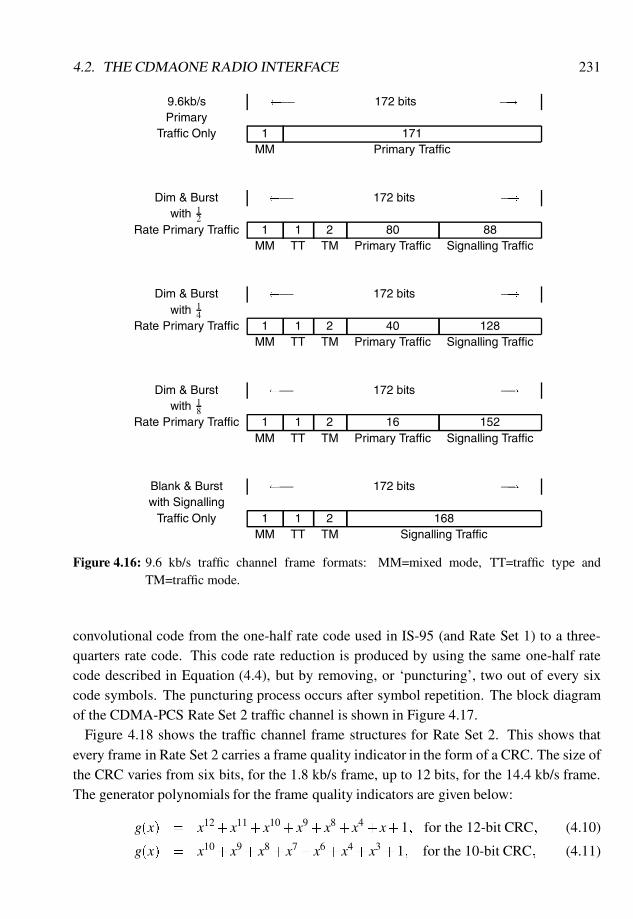
4.2. THE CDMAONE RADIO INTERFACE 231
9.6kb/s � 172 bits �!
PrimaryTraffic Only 1 171
MM Primary Traffic
Dim & Burst � 172 bits �!
with 12
Rate Primary Traffic 1 1 2 80 88MM TT TM Primary Traffic Signalling Traffic
Dim & Burst � 172 bits �!
with 14
Rate Primary Traffic 1 1 2 40 128MM TT TM Primary Traffic Signalling Traffic
Dim & Burst � 172 bits �!
with 18
Rate Primary Traffic 1 1 2 16 152MM TT TM Primary Traffic Signalling Traffic
Blank & Burst � 172 bits �!
with SignallingTraffic Only 1 1 2 168
MM TT TM Signalling Traffic
Figure 4.16: 9.6 kb/s traffic channel frame formats: MM=mixed mode, TT=traffic type andTM=traffic mode.
convolutional code from the one-half rate code used in IS-95 (and Rate Set 1) to a three-quarters rate code. This code rate reduction is produced by using the same one-half ratecode described in Equation (4.4), but by removing, or ‘puncturing’, two out of every sixcode symbols. The puncturing process occurs after symbol repetition. The block diagramof the CDMA-PCS Rate Set 2 traffic channel is shown in Figure 4.17.
Figure 4.18 shows the traffic channel frame structures for Rate Set 2. This shows thatevery frame in Rate Set 2 carries a frame quality indicator in the form of a CRC. The size ofthe CRC varies from six bits, for the 1.8 kb/s frame, up to 12 bits, for the 14.4 kb/s frame.The generator polynomials for the frame quality indicators are given below:
g(x) = x12+x11+x10 +x9 +x8 +x4 +x+1; for the 12-bit CRC; (4.10)
g(x) = x10+x9 +x8 +x7 +x6 +x4 +x3 +1; for the 10-bit CRC; (4.11)
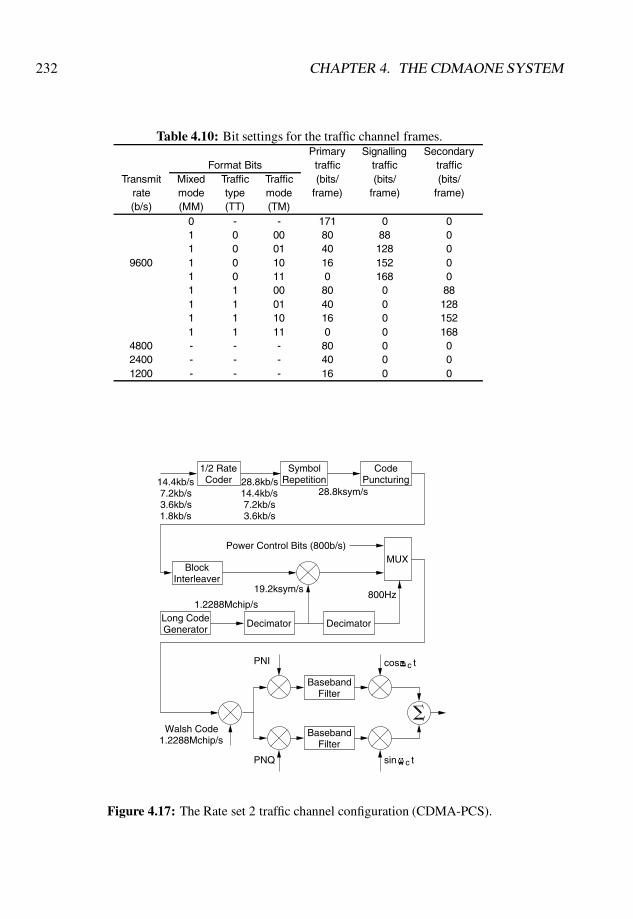
232 CHAPTER 4. THE CDMAONE SYSTEM
Table 4.10: Bit settings for the traffic channel frames.Primary Signalling Secondary
Format Bits traffic traffic trafficTransmit Mixed Traffic Traffic (bits/ (bits/ (bits/
rate mode type mode frame) frame) frame)(b/s) (MM) (TT) (TM)
0 - - 171 0 01 0 00 80 88 01 0 01 40 128 0
9600 1 0 10 16 152 01 0 11 0 168 01 1 00 80 0 881 1 01 40 0 1281 1 10 16 0 1521 1 11 0 0 168
4800 - - - 80 0 02400 - - - 40 0 01200 - - - 16 0 0
14.4kb/s7.2kb/s3.6kb/s1.8kb/s
1/2 RateCoder
SymbolRepetition
CodePuncturing
3.6kb/s7.2kb/s
14.4kb/s28.8kb/s
28.8ksym/s
BlockInterleaver
GeneratorLong Code Decimator Decimator
1.2288Mchip/s
MUXPower Control Bits (800b/s)
19.2ksym/s800Hz
Walsh Code1.2288Mchip/s
PNI
PNQ
FilterBaseband
BasebandFilter
cos c t
sin tc
Figure 4.17: The Rate set 2 traffic channel configuration (CDMA-PCS).
4.2. THE CDMAONE RADIO INTERFACE 233
g(x) = x8+x7 +x4 +x3 +x+1; for the 8-bit CRC; (4.12)
g(x) = x6+x2 +x+1; for the 6-bit CRC. (4.13)
The CDMA-PCS system supports the Multiplex Option 1 described above using RateSet 1. However, it also supports a second service option, Multiplex Option 2, using RateSet 2. Table 4.11 shows the manner in which the frame is allocated to primary, secondaryor signalling traffic in Multiplex Option 2. We can see that the 14.4 kb/s frames consistof a reserved bit followed by an MM bit, which is used to indicate whether the frame isused to carry more than one type of traffic data (i.e. primary, secondary or signalling). Inframes where the MM bit is set to a ‘1’, the next four bits form the frame mode (FM) fieldand they are used to indicate the division between the different data types. The lower rateframes have a similar construction, however they do not include a reserved bit. Observethat Multiplex Option 2 supports the transmission of the three different data types withinthe same 14.4 kb/s or 7.2 kb/s frame.
4.2.2.5 The cdmaOne forward link channel arrangement
Having discussed the construction of each of the forward link IS-95 channels, we now ex-amine the manner in which they are combined at the BS. As we have already seen, eachforward link channel is assigned one of 64 different Walsh codes, giving a maximum of 64forward link channels. WH code 0 (see Figure 4.1) is always used for the pilot channel oneach CDMA carrier and every carrier always supports a pilot channel. The remaining 63Walsh codes are distributed among the synchronisation (sync), paging and traffic channels.The sync channel, when present, always uses WH code 32 (see Figure 4.1). The speci-fications allow the possibility of a CDMA carrier without a sync channel; however, it isdifficult to see where a carrier of this nature would be used. Each carrier may support up toa maximum of seven paging channels using WH codes one to seven. Each CDMA carriermay also support between 55 and 63 traffic channels, where a traffic channel can replacea paging channel or the sync channel on a one-for-one basis. Figure 4.19 summarises thepossible forward link channel configuration for a single CDMA carrier. In situations wherethe allocated spectrum supports more than one cdmaOne carrier, the network operator canincrease the system capacity by installing more than one CDMA carrier at each BS.
4.2.2.6 The MS receiver
The IS-95 and CDMA-PCS specifications [1,2] are essentially air-interface descriptions andgive details of the formulation of the radio signals from the point of view of the transmitter.Unfortunately, the specifications provide scant details regarding the implementation of thecdmaOne receivers, except that they should perform the reverse operations to those at the
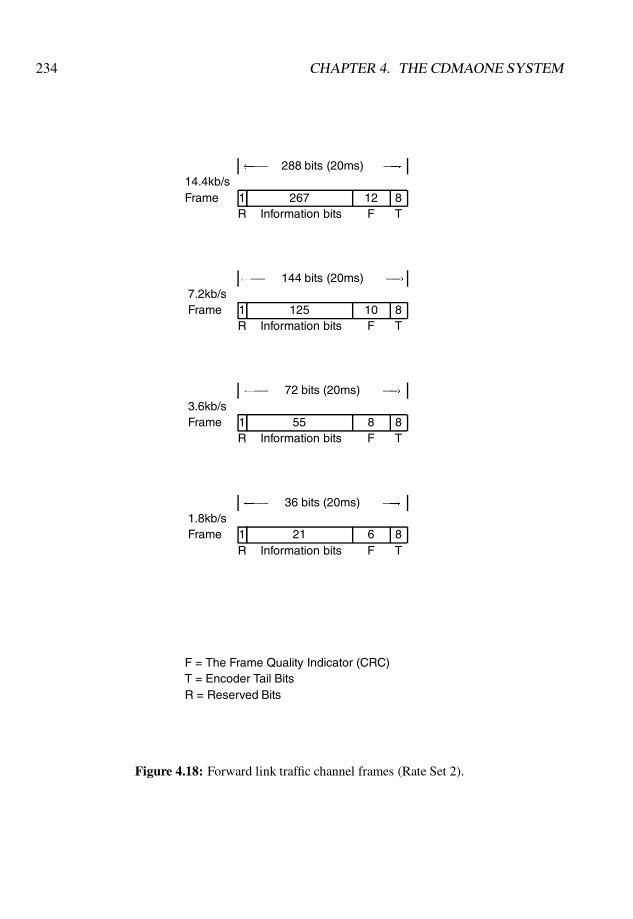
234 CHAPTER 4. THE CDMAONE SYSTEM
� 288 bits (20ms) �!
14.4kb/sFrame 1 267 12 8
R Information bits F T
� 144 bits (20ms) �!
7.2kb/sFrame 1 125 10 8
R Information bits F T
� 72 bits (20ms) �!
3.6kb/sFrame 1 55 8 8
R Information bits F T
� 36 bits (20ms) �!
1.8kb/sFrame 1 21 6 8
R Information bits F T
F = The Frame Quality Indicator (CRC)T = Encoder Tail BitsR = Reserved Bits
Figure 4.18: Forward link traffic channel frames (Rate Set 2).
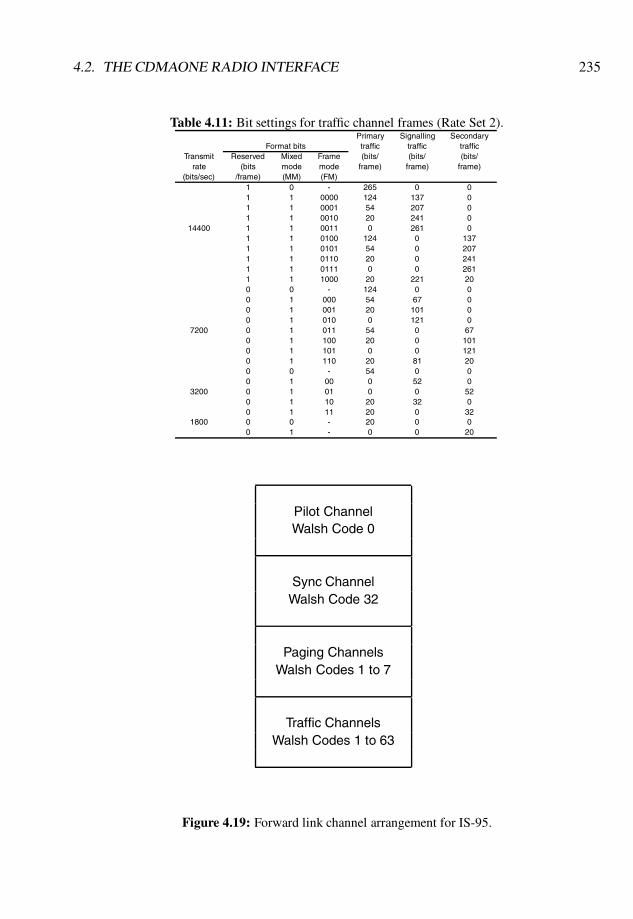
4.2. THE CDMAONE RADIO INTERFACE 235
Table 4.11: Bit settings for traffic channel frames (Rate Set 2).Primary Signalling Secondary
Format bits traffic traffic trafficTransmit Reserved Mixed Frame (bits/ (bits/ (bits/
rate (bits mode mode frame) frame) frame)(bits/sec) /frame) (MM) (FM)
1 0 - 265 0 01 1 0000 124 137 01 1 0001 54 207 01 1 0010 20 241 0
14400 1 1 0011 0 261 01 1 0100 124 0 1371 1 0101 54 0 2071 1 0110 20 0 2411 1 0111 0 0 2611 1 1000 20 221 200 0 - 124 0 00 1 000 54 67 00 1 001 20 101 00 1 010 0 121 0
7200 0 1 011 54 0 670 1 100 20 0 1010 1 101 0 0 1210 1 110 20 81 200 0 - 54 0 00 1 00 0 52 0
3200 0 1 01 0 0 520 1 10 20 32 00 1 11 20 0 32
1800 0 0 - 20 0 00 1 - 0 0 20
Pilot ChannelWalsh Code 0
Sync ChannelWalsh Code 32
Paging ChannelsWalsh Codes 1 to 7
Traffic ChannelsWalsh Codes 1 to 63
Figure 4.19: Forward link channel arrangement for IS-95.
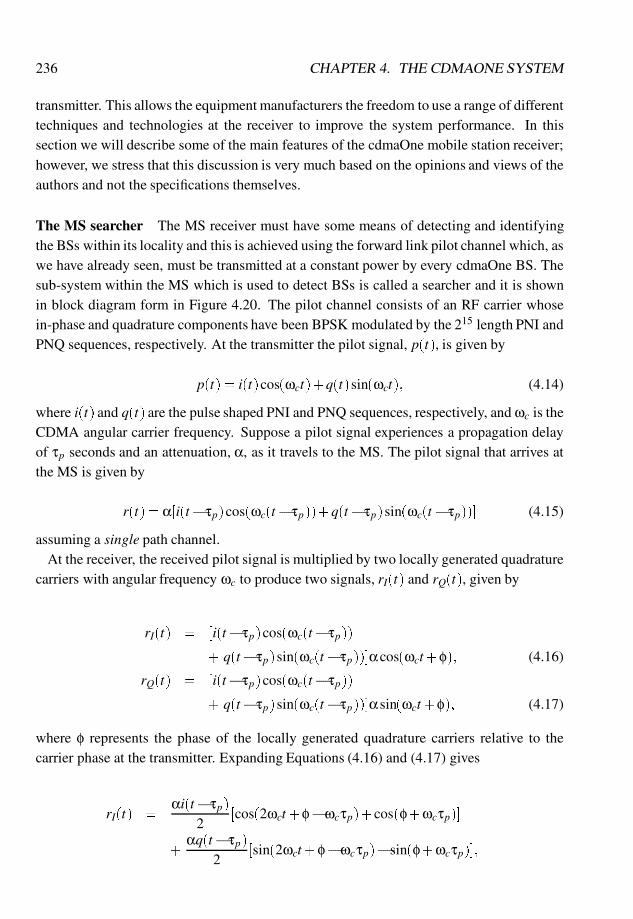
236 CHAPTER 4. THE CDMAONE SYSTEM
transmitter. This allows the equipment manufacturers the freedom to use a range of differenttechniques and technologies at the receiver to improve the system performance. In thissection we will describe some of the main features of the cdmaOne mobile station receiver;however, we stress that this discussion is very much based on the opinions and views of theauthors and not the specifications themselves.
The MS searcher The MS receiver must have some means of detecting and identifyingthe BSs within its locality and this is achieved using the forward link pilot channel which, aswe have already seen, must be transmitted at a constant power by every cdmaOne BS. Thesub-system within the MS which is used to detect BSs is called a searcher and it is shownin block diagram form in Figure 4.20. The pilot channel consists of an RF carrier whosein-phase and quadrature components have been BPSK modulated by the 215 length PNI andPNQ sequences, respectively. At the transmitter the pilot signal, p(t), is given by
p(t) = i(t)cos(ωct)+q(t)sin(ωct); (4.14)
where i(t) and q(t) are the pulse shaped PNI and PNQ sequences, respectively, and ωc is theCDMA angular carrier frequency. Suppose a pilot signal experiences a propagation delayof τp seconds and an attenuation, α, as it travels to the MS. The pilot signal that arrives atthe MS is given by
r(t) = α[i(t�τp)cos(ωc(t�τp))+q(t�τp)sin(ωc(t�τp))] (4.15)
assuming a single path channel.At the receiver, the received pilot signal is multiplied by two locally generated quadrature
carriers with angular frequency ωc to produce two signals, rI(t) and rQ(t), given by
rI(t) = [i(t�τp)cos(ωc(t�τp))
+ q(t�τp)sin(ωc(t�τp))]αcos(ωct+φ); (4.16)
rQ(t) = [i(t�τp)cos(ωc(t�τp))
+ q(t�τp)sin(ωc(t�τp))]αsin(ωct+φ); (4.17)
where φ represents the phase of the locally generated quadrature carriers relative to thecarrier phase at the transmitter. Expanding Equations (4.16) and (4.17) gives
rI(t) =αi(t�τp)
2[cos(2ωct+φ�ωcτp)+cos(φ+ωcτp)]
+αq(t�τp)
2[sin(2ωct+φ�ωcτp)� sin(φ+ωcτp)];
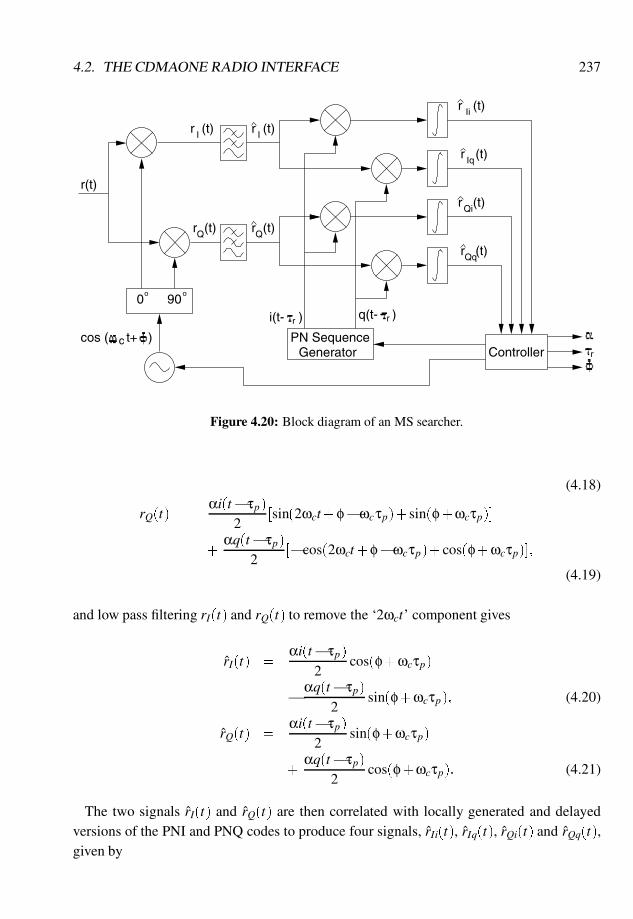
4.2. THE CDMAONE RADIO INTERFACE 237
r (t)Ii
Iqr (t)
r (t)Qq
Qir (t)
cos ( t+ )c PN SequenceGenerator Controller r
q(t- )ri(t- )r
r (t)I
r (t)Q
r (t)I
r (t)Q
0 90o o
r(t)
Figure 4.20: Block diagram of an MS searcher.
(4.18)
rQ(t) =αi(t�τp)
2[sin(2ωct+φ�ωcτp)+ sin(φ+ωcτp)]
+αq(t�τp)
2[�cos(2ωct+φ�ωcτp)+cos(φ+ωcτp)];
(4.19)
and low pass filtering rI(t) and rQ(t) to remove the ‘2ωct’ component gives
rI(t) =αi(t�τp)
2cos(φ+ωcτp)
�
αq(t�τp)2
sin(φ+ωcτp); (4.20)
rQ(t) =αi(t�τp)
2sin(φ+ωcτp)
+αq(t�τp)
2cos(φ+ωcτp): (4.21)
The two signals rI(t) and rQ(t) are then correlated with locally generated and delayedversions of the PNI and PNQ codes to produce four signals, rIi(t), rIq(t), rQi(t) and rQq(t),given by
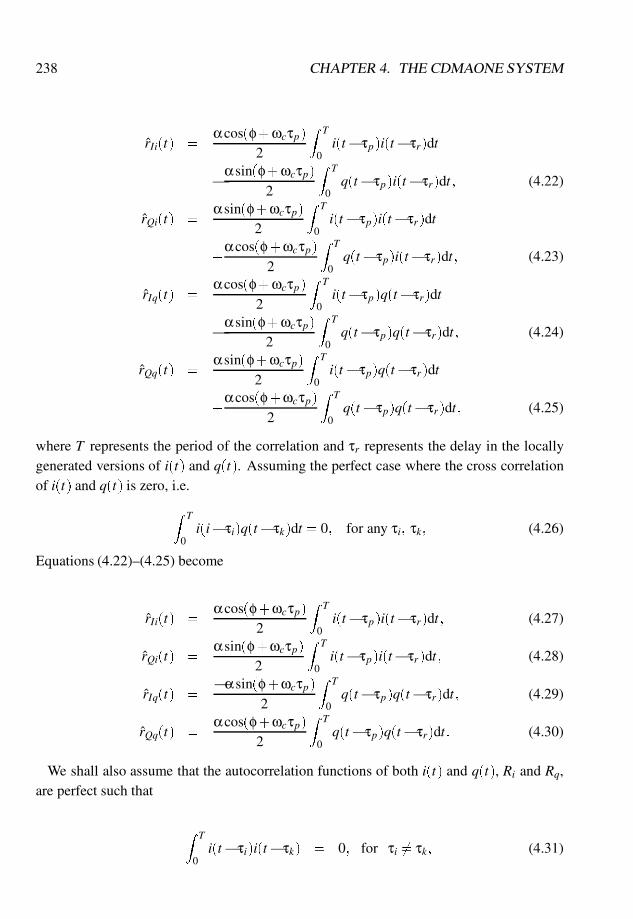
238 CHAPTER 4. THE CDMAONE SYSTEM
rIi(t) =αcos(φ+ωcτp)
2
Z T
0i(t�τp)i(t�τr)dt
�
αsin(φ+ωcτp)2
Z T
0q(t�τp)i(t�τr)dt; (4.22)
rQi(t) =αsin(φ+ωcτp)
2
Z T
0i(t�τp)i(t�τr)dt
+αcos(φ+ωcτp)
2
Z T
0q(t�τp)i(t�τr)dt; (4.23)
rIq(t) =αcos(φ+ωcτp)
2
Z T
0i(t�τp)q(t�τr)dt
�
αsin(φ+ωcτp)2
Z T
0q(t�τp)q(t�τr)dt; (4.24)
rQq(t) =αsin(φ+ωcτp)
2
Z T
0i(t�τp)q(t�τr)dt
+αcos(φ+ωcτp)
2
Z T
0q(t�τp)q(t�τr)dt; (4.25)
where T represents the period of the correlation and τr represents the delay in the locallygenerated versions of i(t) and q(t). Assuming the perfect case where the cross correlationof i(t) and q(t) is zero, i.e.
Z T
0i(i�τi)q(t�τk)dt = 0; for any τi; τk; (4.26)
Equations (4.22)–(4.25) become
rIi(t) =αcos(φ+ωcτp)
2
Z T
0i(t�τp)i(t�τr)dt; (4.27)
rQi(t) =αsin(φ+ωcτp)
2
Z T
0i(t�τp)i(t�τr)dt; (4.28)
rIq(t) =�αsin(φ+ωcτp)
2
Z T
0q(t�τp)q(t�τr)dt; (4.29)
rQq(t) =αcos(φ+ωcτp)
2
Z T
0q(t�τp)q(t�τr)dt: (4.30)
We shall also assume that the autocorrelation functions of both i(t) and q(t), Ri and Rq,are perfect such that
Z T
0i(t�τi)i(t�τk) = 0; for τi 6= τk; (4.31)
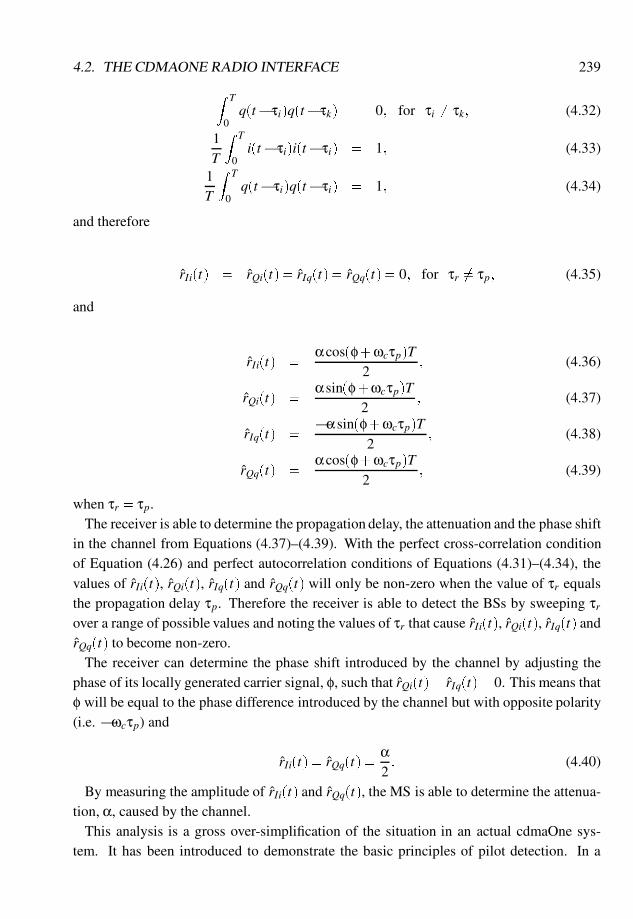
4.2. THE CDMAONE RADIO INTERFACE 239
Z T
0q(t�τi)q(t�τk) = 0; for τi 6= τk; (4.32)
1T
Z T
0i(t�τi)i(t�τi) = 1; (4.33)
1T
Z T
0q(t�τi)q(t�τi) = 1; (4.34)
and therefore
rIi(t) = rQi(t) = rIq(t) = rQq(t) = 0; for τr 6= τp; (4.35)
and
rIi(t) =αcos(φ+ωcτp)T
2; (4.36)
rQi(t) =αsin(φ+ωcτp)T
2; (4.37)
rIq(t) =�αsin(φ+ωcτp)T
2; (4.38)
rQq(t) =αcos(φ+ωcτp)T
2; (4.39)
when τr = τp.The receiver is able to determine the propagation delay, the attenuation and the phase shift
in the channel from Equations (4.37)–(4.39). With the perfect cross-correlation conditionof Equation (4.26) and perfect autocorrelation conditions of Equations (4.31)–(4.34), thevalues of rIi(t), rQi(t), rIq(t) and rQq(t) will only be non-zero when the value of τr equalsthe propagation delay τp. Therefore the receiver is able to detect the BSs by sweeping τrover a range of possible values and noting the values of τr that cause rIi(t), rQi(t), rIq(t) andrQq(t) to become non-zero.
The receiver can determine the phase shift introduced by the channel by adjusting thephase of its locally generated carrier signal, φ, such that rQi(t) = rIq(t) = 0. This means thatφ will be equal to the phase difference introduced by the channel but with opposite polarity(i.e. �ωcτp) and
rIi(t) = rQq(t) =α2
: (4.40)
By measuring the amplitude of rIi(t) and rQq(t), the MS is able to determine the attenua-tion, α, caused by the channel.
This analysis is a gross over-simplification of the situation in an actual cdmaOne sys-tem. It has been introduced to demonstrate the basic principles of pilot detection. In a
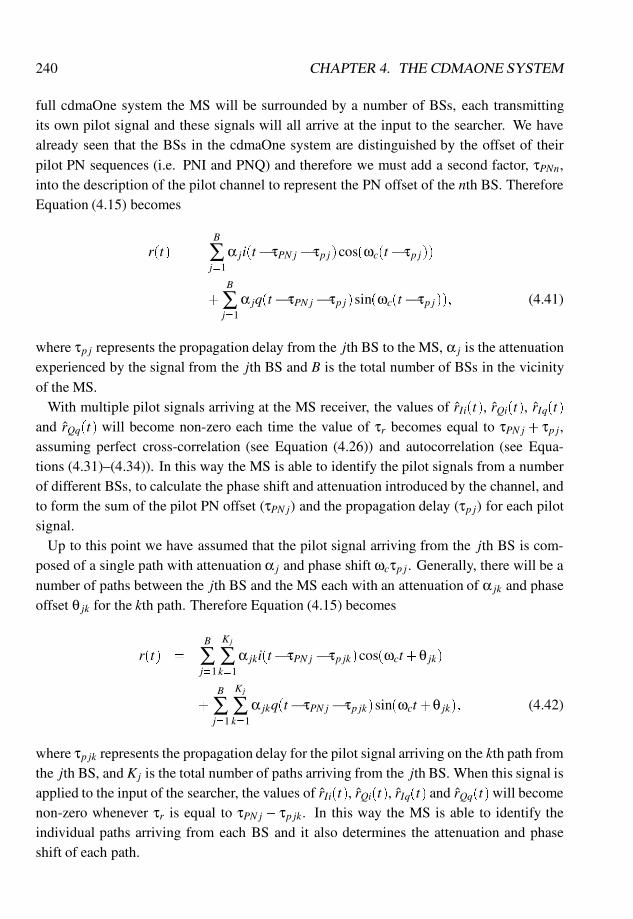
240 CHAPTER 4. THE CDMAONE SYSTEM
full cdmaOne system the MS will be surrounded by a number of BSs, each transmittingits own pilot signal and these signals will all arrive at the input to the searcher. We havealready seen that the BSs in the cdmaOne system are distinguished by the offset of theirpilot PN sequences (i.e. PNI and PNQ) and therefore we must add a second factor, τPNn,into the description of the pilot channel to represent the PN offset of the nth BS. ThereforeEquation (4.15) becomes
r(t) =B
∑j=1
α ji(t�τPN j �τp j)cos(ωc(t�τp j))
+B
∑j=1
α jq(t�τPN j�τp j)sin(ωc(t�τp j)); (4.41)
where τp j represents the propagation delay from the jth BS to the MS, α j is the attenuationexperienced by the signal from the jth BS and B is the total number of BSs in the vicinityof the MS.
With multiple pilot signals arriving at the MS receiver, the values of rIi(t), rQi(t), rIq(t)and rQq(t) will become non-zero each time the value of τr becomes equal to τPN j + τp j,assuming perfect cross-correlation (see Equation (4.26)) and autocorrelation (see Equa-tions (4.31)–(4.34)). In this way the MS is able to identify the pilot signals from a numberof different BSs, to calculate the phase shift and attenuation introduced by the channel, andto form the sum of the pilot PN offset (τPN j) and the propagation delay (τp j) for each pilotsignal.
Up to this point we have assumed that the pilot signal arriving from the jth BS is com-posed of a single path with attenuation α j and phase shift ωcτp j . Generally, there will be anumber of paths between the jth BS and the MS each with an attenuation of α jk and phaseoffset θ jk for the kth path. Therefore Equation (4.15) becomes
r(t) =B
∑j=1
Kj
∑k=1
α jki(t�τPN j �τp jk)cos(ωct+θ jk)
+B
∑j=1
Kj
∑k=1
α jkq(t�τPN j�τp jk)sin(ωct+θ jk); (4.42)
where τp jk represents the propagation delay for the pilot signal arriving on the kth path fromthe jth BS, and Kj is the total number of paths arriving from the jth BS. When this signal isapplied to the input of the searcher, the values of rIi(t), rQi(t), rIq(t) and rQq(t)will becomenon-zero whenever τr is equal to τPN j + τp jk. In this way the MS is able to identify theindividual paths arriving from each BS and it also determines the attenuation and phaseshift of each path.
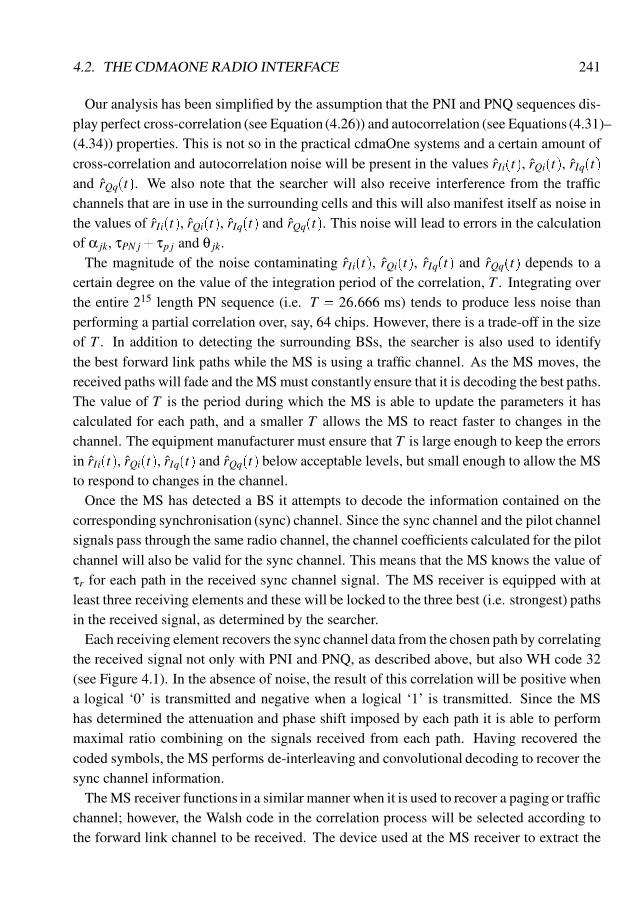
4.2. THE CDMAONE RADIO INTERFACE 241
Our analysis has been simplified by the assumption that the PNI and PNQ sequences dis-play perfect cross-correlation (see Equation (4.26)) and autocorrelation (see Equations (4.31)–(4.34)) properties. This is not so in the practical cdmaOne systems and a certain amount ofcross-correlation and autocorrelation noise will be present in the values rIi(t), rQi(t), rIq(t)and rQq(t). We also note that the searcher will also receive interference from the trafficchannels that are in use in the surrounding cells and this will also manifest itself as noise inthe values of rIi(t), rQi(t), rIq(t) and rQq(t). This noise will lead to errors in the calculationof α jk, τPN j+τp j and θ jk.
The magnitude of the noise contaminating rIi(t), rQi(t), rIq(t) and rQq(t) depends to acertain degree on the value of the integration period of the correlation, T . Integrating overthe entire 215 length PN sequence (i.e. T = 26:666 ms) tends to produce less noise thanperforming a partial correlation over, say, 64 chips. However, there is a trade-off in the sizeof T . In addition to detecting the surrounding BSs, the searcher is also used to identifythe best forward link paths while the MS is using a traffic channel. As the MS moves, thereceived paths will fade and the MS must constantly ensure that it is decoding the best paths.The value of T is the period during which the MS is able to update the parameters it hascalculated for each path, and a smaller T allows the MS to react faster to changes in thechannel. The equipment manufacturer must ensure that T is large enough to keep the errorsin rIi(t), rQi(t), rIq(t) and rQq(t) below acceptable levels, but small enough to allow the MSto respond to changes in the channel.
Once the MS has detected a BS it attempts to decode the information contained on thecorresponding synchronisation (sync) channel. Since the sync channel and the pilot channelsignals pass through the same radio channel, the channel coefficients calculated for the pilotchannel will also be valid for the sync channel. This means that the MS knows the value ofτr for each path in the received sync channel signal. The MS receiver is equipped with atleast three receiving elements and these will be locked to the three best (i.e. strongest) pathsin the received signal, as determined by the searcher.
Each receiving element recovers the sync channel data from the chosen path by correlatingthe received signal not only with PNI and PNQ, as described above, but also WH code 32(see Figure 4.1). In the absence of noise, the result of this correlation will be positive whena logical ‘0’ is transmitted and negative when a logical ‘1’ is transmitted. Since the MShas determined the attenuation and phase shift imposed by each path it is able to performmaximal ratio combining on the signals received from each path. Having recovered thecoded symbols, the MS performs de-interleaving and convolutional decoding to recover thesync channel information.
The MS receiver functions in a similar manner when it is used to recover a paging or trafficchannel; however, the Walsh code in the correlation process will be selected according tothe forward link channel to be received. The device used at the MS receiver to extract the
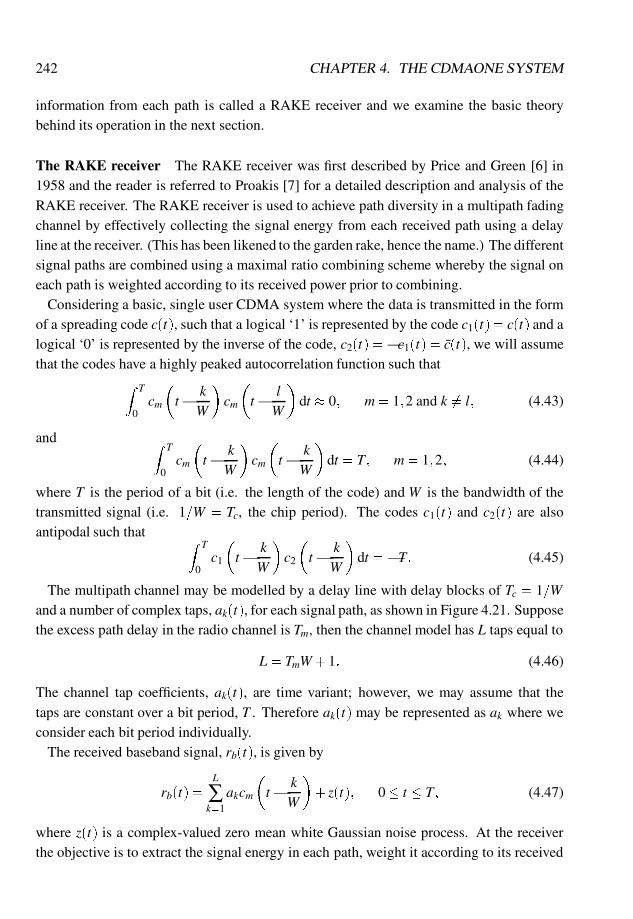
242 CHAPTER 4. THE CDMAONE SYSTEM
information from each path is called a RAKE receiver and we examine the basic theorybehind its operation in the next section.
The RAKE receiver The RAKE receiver was first described by Price and Green [6] in1958 and the reader is referred to Proakis [7] for a detailed description and analysis of theRAKE receiver. The RAKE receiver is used to achieve path diversity in a multipath fadingchannel by effectively collecting the signal energy from each received path using a delayline at the receiver. (This has been likened to the garden rake, hence the name.) The differentsignal paths are combined using a maximal ratio combining scheme whereby the signal oneach path is weighted according to its received power prior to combining.
Considering a basic, single user CDMA system where the data is transmitted in the formof a spreading code c(t), such that a logical ‘1’ is represented by the code c1(t) = c(t) and alogical ‘0’ is represented by the inverse of the code, c2(t) =�c1(t) = c(t), we will assumethat the codes have a highly peaked autocorrelation function such that
Z T
0cm
�t�
kW
�cm
�t�
lW
�dt � 0; m= 1;2 and k 6= l; (4.43)
and Z T
0cm
�t�
kW
�cm
�t�
kW
�dt = T; m= 1;2; (4.44)
where T is the period of a bit (i.e. the length of the code) and W is the bandwidth of thetransmitted signal (i.e. 1=W = Tc, the chip period). The codes c1(t) and c2(t) are alsoantipodal such that Z T
0c1
�t�
kW
�c2
�t�
kW
�dt = �T: (4.45)
The multipath channel may be modelled by a delay line with delay blocks of Tc = 1=Wand a number of complex taps, ak(t), for each signal path, as shown in Figure 4.21. Supposethe excess path delay in the radio channel is Tm, then the channel model has L taps equal to
L = TmW +1: (4.46)
The channel tap coefficients, ak(t), are time variant; however, we may assume that thetaps are constant over a bit period, T . Therefore ak(t) may be represented as ak where weconsider each bit period individually.
The received baseband signal, rb(t), is given by
rb(t) =L
∑k=1
akcm
�t�
kW
�+ z(t); 0� t � T; (4.47)
where z(t) is a complex-valued zero mean white Gaussian noise process. At the receiverthe objective is to extract the signal energy in each path, weight it according to its received
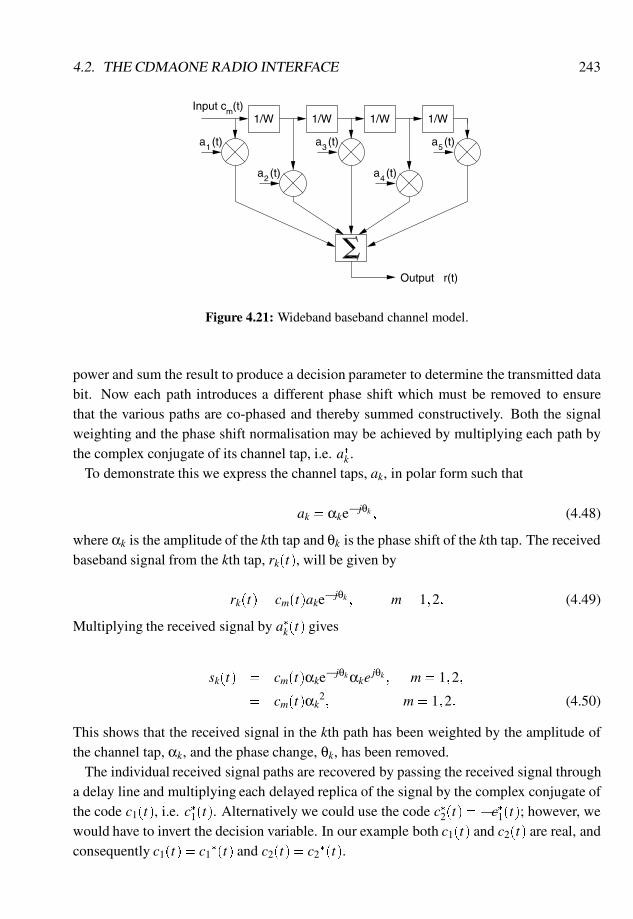
4.2. THE CDMAONE RADIO INTERFACE 243
a (t)
1/W 1/W 1/W 1/W
1 a (t)3
a (t)2
a (t)5
4a (t)
Input c (t)
Output r(t)
m
Figure 4.21: Wideband baseband channel model.
power and sum the result to produce a decision parameter to determine the transmitted databit. Now each path introduces a different phase shift which must be removed to ensurethat the various paths are co-phased and thereby summed constructively. Both the signalweighting and the phase shift normalisation may be achieved by multiplying each path bythe complex conjugate of its channel tap, i.e. a�k .
To demonstrate this we express the channel taps, ak, in polar form such that
ak = αke� jθk
; (4.48)
where αk is the amplitude of the kth tap and θk is the phase shift of the kth tap. The receivedbaseband signal from the kth tap, rk(t), will be given by
rk(t) = cm(t)ake� jθk
; m= 1;2: (4.49)
Multiplying the received signal by a�k(t) gives
sk(t) = cm(t)αke� jθkαke
jθk; m= 1;2;
= cm(t)αk2; m= 1;2: (4.50)
This shows that the received signal in the kth path has been weighted by the amplitude ofthe channel tap, αk, and the phase change, θk, has been removed.
The individual received signal paths are recovered by passing the received signal througha delay line and multiplying each delayed replica of the signal by the complex conjugate ofthe code c1(t), i.e. c�1(t). Alternatively we could use the code c�2(t) = �c
�
1(t); however, wewould have to invert the decision variable. In our example both c1(t) and c2(t) are real, andconsequently c1(t) = c1
�(t) and c2(t) = c2�(t).
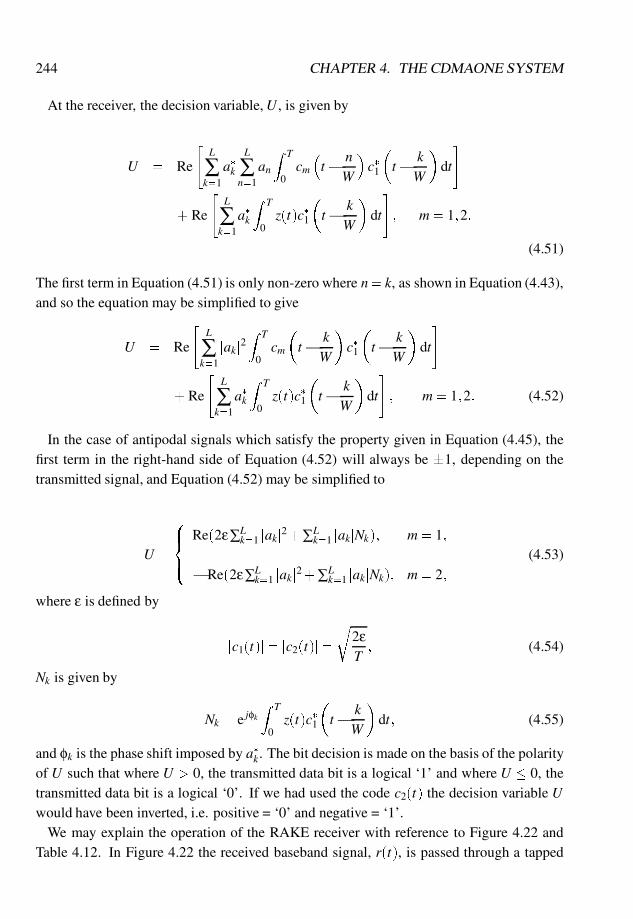
244 CHAPTER 4. THE CDMAONE SYSTEM
At the receiver, the decision variable, U , is given by
U = Re
"L
∑k=1
a�kL
∑n=1
an
Z T
0cm�t�
nW
�c�1
�t�
kW
�dt
#
+ Re
"L
∑k=1
a�k
Z T
0z(t)c�1
�t�
kW
�dt
#; m= 1;2:
(4.51)
The first term in Equation (4.51) is only non-zero where n= k, as shown in Equation (4.43),and so the equation may be simplified to give
U = Re
"L
∑k=1
jakj2Z T
0cm
�t�
kW
�c�1
�t�
kW
�dt
#
+ Re
"L
∑k=1
a�k
Z T
0z(t)c�1
�t�
kW
�dt
#; m= 1;2: (4.52)
In the case of antipodal signals which satisfy the property given in Equation (4.45), thefirst term in the right-hand side of Equation (4.52) will always be �1, depending on thetransmitted signal, and Equation (4.52) may be simplified to
U =
8><>:
Re(2ε∑Lk=1 jakj
2+∑Lk=1 jakjNk); m= 1;
� Re(2ε∑Lk=1 jakj
2+∑Lk=1 jakjNk); m= 2;
(4.53)
where ε is defined by
jc1(t)j= jc2(t)j=
r2εT
; (4.54)
Nk is given by
Nk = e jφkZ T
0z(t)c�1
�t�
kW
�dt; (4.55)
and φk is the phase shift imposed by a�k. The bit decision is made on the basis of the polarityof U such that where U > 0, the transmitted data bit is a logical ‘1’ and where U � 0, thetransmitted data bit is a logical ‘0’. If we had used the code c2(t) the decision variable Uwould have been inverted, i.e. positive = ‘0’ and negative = ‘1’.
We may explain the operation of the RAKE receiver with reference to Figure 4.22 andTable 4.12. In Figure 4.22 the received baseband signal, r(t), is passed through a tapped
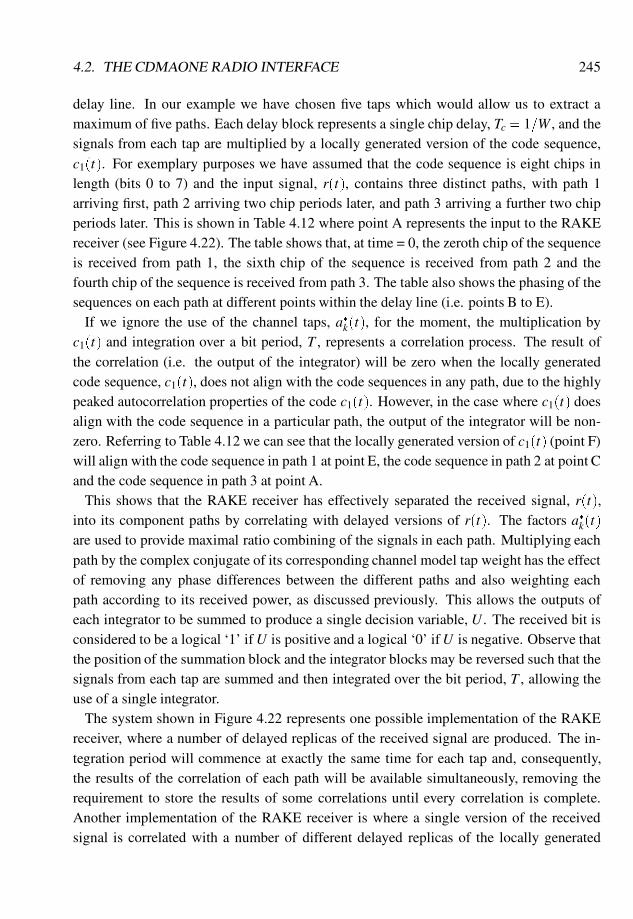
4.2. THE CDMAONE RADIO INTERFACE 245
delay line. In our example we have chosen five taps which would allow us to extract amaximum of five paths. Each delay block represents a single chip delay, Tc = 1=W , and thesignals from each tap are multiplied by a locally generated version of the code sequence,c1(t). For exemplary purposes we have assumed that the code sequence is eight chips inlength (bits 0 to 7) and the input signal, r(t), contains three distinct paths, with path 1arriving first, path 2 arriving two chip periods later, and path 3 arriving a further two chipperiods later. This is shown in Table 4.12 where point A represents the input to the RAKEreceiver (see Figure 4.22). The table shows that, at time = 0, the zeroth chip of the sequenceis received from path 1, the sixth chip of the sequence is received from path 2 and thefourth chip of the sequence is received from path 3. The table also shows the phasing of thesequences on each path at different points within the delay line (i.e. points B to E).
If we ignore the use of the channel taps, a�k(t), for the moment, the multiplication byc1(t) and integration over a bit period, T , represents a correlation process. The result ofthe correlation (i.e. the output of the integrator) will be zero when the locally generatedcode sequence, c1(t), does not align with the code sequences in any path, due to the highlypeaked autocorrelation properties of the code c1(t). However, in the case where c1(t) doesalign with the code sequence in a particular path, the output of the integrator will be non-zero. Referring to Table 4.12 we can see that the locally generated version of c1(t) (point F)will align with the code sequence in path 1 at point E, the code sequence in path 2 at point Cand the code sequence in path 3 at point A.
This shows that the RAKE receiver has effectively separated the received signal, r(t),into its component paths by correlating with delayed versions of r(t). The factors a�k(t)are used to provide maximal ratio combining of the signals in each path. Multiplying eachpath by the complex conjugate of its corresponding channel model tap weight has the effectof removing any phase differences between the different paths and also weighting eachpath according to its received power, as discussed previously. This allows the outputs ofeach integrator to be summed to produce a single decision variable, U . The received bit isconsidered to be a logical ‘1’ if U is positive and a logical ‘0’ ifU is negative. Observe thatthe position of the summation block and the integrator blocks may be reversed such that thesignals from each tap are summed and then integrated over the bit period, T , allowing theuse of a single integrator.
The system shown in Figure 4.22 represents one possible implementation of the RAKEreceiver, where a number of delayed replicas of the received signal are produced. The in-tegration period will commence at exactly the same time for each tap and, consequently,the results of the correlation of each path will be available simultaneously, removing therequirement to store the results of some correlations until every correlation is complete.Another implementation of the RAKE receiver is where a single version of the receivedsignal is correlated with a number of different delayed replicas of the locally generated
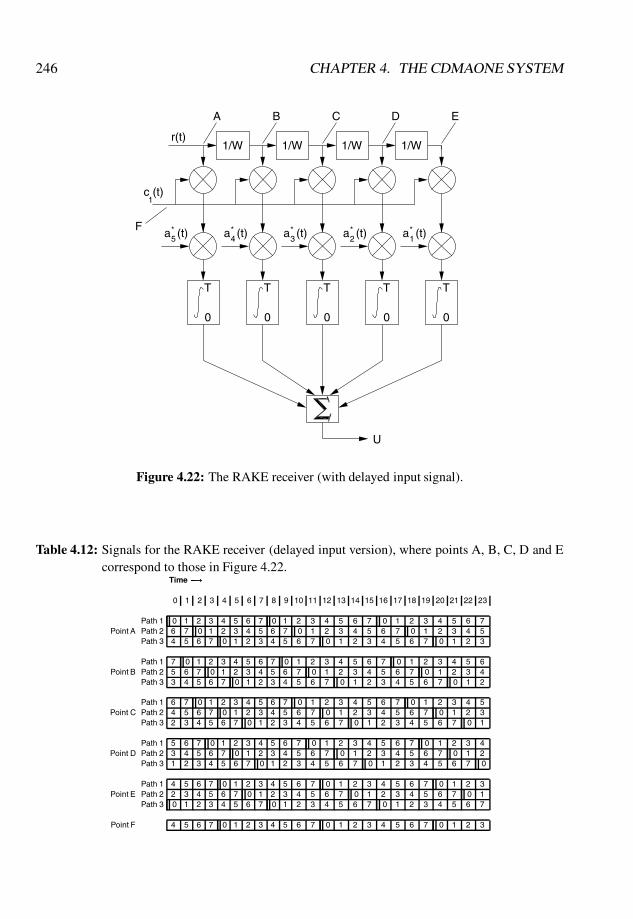
246 CHAPTER 4. THE CDMAONE SYSTEM
c (t)
1/W 1/W 1/W 1/W
1
r(t)
U
1a (t)*a (t)2*a (t)3
*a (t)4*a (t)5
*
0
T
0
T
0
T
0
T
0
T
A B C D E
F
Figure 4.22: The RAKE receiver (with delayed input signal).
Table 4.12: Signals for the RAKE receiver (delayed input version), where points A, B, C, D and Ecorrespond to those in Figure 4.22.
Time �!
0 1 2 3 4 5 6 7 8 9 10 11 12 13 14 15 16 17 18 19 20 21 22 23
Path 1 0 1 2 3 4 5 6 7 0 1 2 3 4 5 6 7 0 1 2 3 4 5 6 7Point A Path 2 6 7 0 1 2 3 4 5 6 7 0 1 2 3 4 5 6 7 0 1 2 3 4 5
Path 3 4 5 6 7 0 1 2 3 4 5 6 7 0 1 2 3 4 5 6 7 0 1 2 3
Path 1 7 0 1 2 3 4 5 6 7 0 1 2 3 4 5 6 7 0 1 2 3 4 5 6Point B Path 2 5 6 7 0 1 2 3 4 5 6 7 0 1 2 3 4 5 6 7 0 1 2 3 4
Path 3 3 4 5 6 7 0 1 2 3 4 5 6 7 0 1 2 3 4 5 6 7 0 1 2
Path 1 6 7 0 1 2 3 4 5 6 7 0 1 2 3 4 5 6 7 0 1 2 3 4 5Point C Path 2 4 5 6 7 0 1 2 3 4 5 6 7 0 1 2 3 4 5 6 7 0 1 2 3
Path 3 2 3 4 5 6 7 0 1 2 3 4 5 6 7 0 1 2 3 4 5 6 7 0 1
Path 1 5 6 7 0 1 2 3 4 5 6 7 0 1 2 3 4 5 6 7 0 1 2 3 4Point D Path 2 3 4 5 6 7 0 1 2 3 4 5 6 7 0 1 2 3 4 5 6 7 0 1 2
Path 3 1 2 3 4 5 6 7 0 1 2 3 4 5 6 7 0 1 2 3 4 5 6 7 0
Path 1 4 5 6 7 0 1 2 3 4 5 6 7 0 1 2 3 4 5 6 7 0 1 2 3Point E Path 2 2 3 4 5 6 7 0 1 2 3 4 5 6 7 0 1 2 3 4 5 6 7 0 1
Path 3 0 1 2 3 4 5 6 7 0 1 2 3 4 5 6 7 0 1 2 3 4 5 6 7
Point F 4 5 6 7 0 1 2 3 4 5 6 7 0 1 2 3 4 5 6 7 0 1 2 3
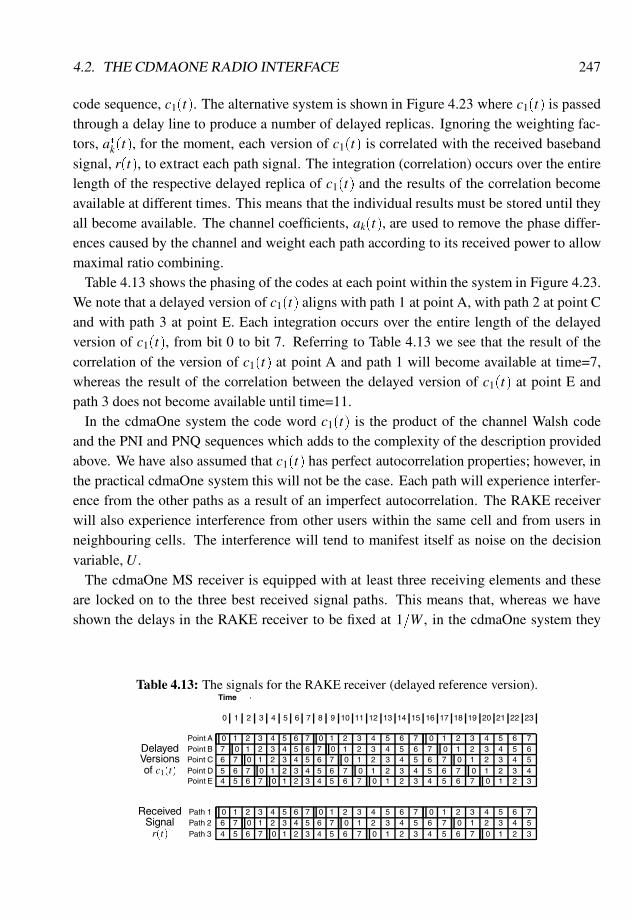
4.2. THE CDMAONE RADIO INTERFACE 247
code sequence, c1(t). The alternative system is shown in Figure 4.23 where c1(t) is passedthrough a delay line to produce a number of delayed replicas. Ignoring the weighting fac-tors, a�k(t), for the moment, each version of c1(t) is correlated with the received basebandsignal, r(t), to extract each path signal. The integration (correlation) occurs over the entirelength of the respective delayed replica of c1(t) and the results of the correlation becomeavailable at different times. This means that the individual results must be stored until theyall become available. The channel coefficients, ak(t), are used to remove the phase differ-ences caused by the channel and weight each path according to its received power to allowmaximal ratio combining.
Table 4.13 shows the phasing of the codes at each point within the system in Figure 4.23.We note that a delayed version of c1(t) aligns with path 1 at point A, with path 2 at point Cand with path 3 at point E. Each integration occurs over the entire length of the delayedversion of c1(t), from bit 0 to bit 7. Referring to Table 4.13 we see that the result of thecorrelation of the version of c1(t) at point A and path 1 will become available at time=7,whereas the result of the correlation between the delayed version of c1(t) at point E andpath 3 does not become available until time=11.
In the cdmaOne system the code word c1(t) is the product of the channel Walsh codeand the PNI and PNQ sequences which adds to the complexity of the description providedabove. We have also assumed that c1(t) has perfect autocorrelation properties; however, inthe practical cdmaOne system this will not be the case. Each path will experience interfer-ence from the other paths as a result of an imperfect autocorrelation. The RAKE receiverwill also experience interference from other users within the same cell and from users inneighbouring cells. The interference will tend to manifest itself as noise on the decisionvariable, U .
The cdmaOne MS receiver is equipped with at least three receiving elements and theseare locked on to the three best received signal paths. This means that, whereas we haveshown the delays in the RAKE receiver to be fixed at 1=W , in the cdmaOne system they
Table 4.13: The signals for the RAKE receiver (delayed reference version).Time �!
0 1 2 3 4 5 6 7 8 9 10 11 12 13 14 15 16 17 18 19 20 21 22 23
Point A 0 1 2 3 4 5 6 7 0 1 2 3 4 5 6 7 0 1 2 3 4 5 6 7Delayed Point B 7 0 1 2 3 4 5 6 7 0 1 2 3 4 5 6 7 0 1 2 3 4 5 6Versions Point C 6 7 0 1 2 3 4 5 6 7 0 1 2 3 4 5 6 7 0 1 2 3 4 5of c1(t) Point D 5 6 7 0 1 2 3 4 5 6 7 0 1 2 3 4 5 6 7 0 1 2 3 4
Point E 4 5 6 7 0 1 2 3 4 5 6 7 0 1 2 3 4 5 6 7 0 1 2 3
Received Path 1 0 1 2 3 4 5 6 7 0 1 2 3 4 5 6 7 0 1 2 3 4 5 6 7Signal Path 2 6 7 0 1 2 3 4 5 6 7 0 1 2 3 4 5 6 7 0 1 2 3 4 5r(t) Path 3 4 5 6 7 0 1 2 3 4 5 6 7 0 1 2 3 4 5 6 7 0 1 2 3
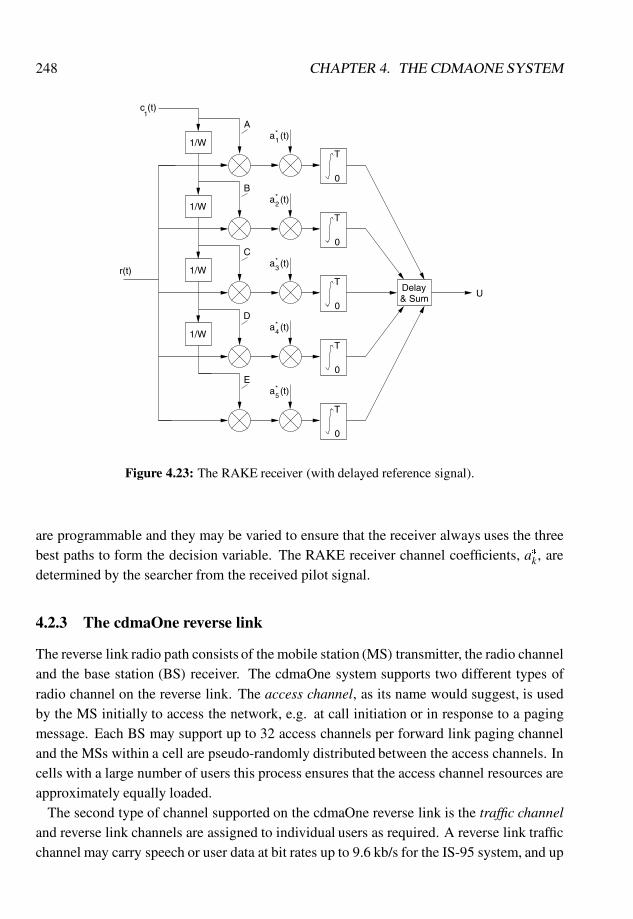
248 CHAPTER 4. THE CDMAONE SYSTEM
c (t)
1/W
1
r(t)
U
1a (t)*
0
T
A
1/Wa (t)2
0
T
B*
1/Wa (t)3
0
T
C*
1/Wa (t)4
0
T
D*
a (t)5
0
T
E*
Delay& Sum
Figure 4.23: The RAKE receiver (with delayed reference signal).
are programmable and they may be varied to ensure that the receiver always uses the threebest paths to form the decision variable. The RAKE receiver channel coefficients, a�k, aredetermined by the searcher from the received pilot signal.
4.2.3 The cdmaOne reverse link
The reverse link radio path consists of the mobile station (MS) transmitter, the radio channeland the base station (BS) receiver. The cdmaOne system supports two different types ofradio channel on the reverse link. The access channel, as its name would suggest, is usedby the MS initially to access the network, e.g. at call initiation or in response to a pagingmessage. Each BS may support up to 32 access channels per forward link paging channeland the MSs within a cell are pseudo-randomly distributed between the access channels. Incells with a large number of users this process ensures that the access channel resources areapproximately equally loaded.
The second type of channel supported on the cdmaOne reverse link is the traffic channeland reverse link channels are assigned to individual users as required. A reverse link trafficchannel may carry speech or user data at bit rates up to 9.6 kb/s for the IS-95 system, and up
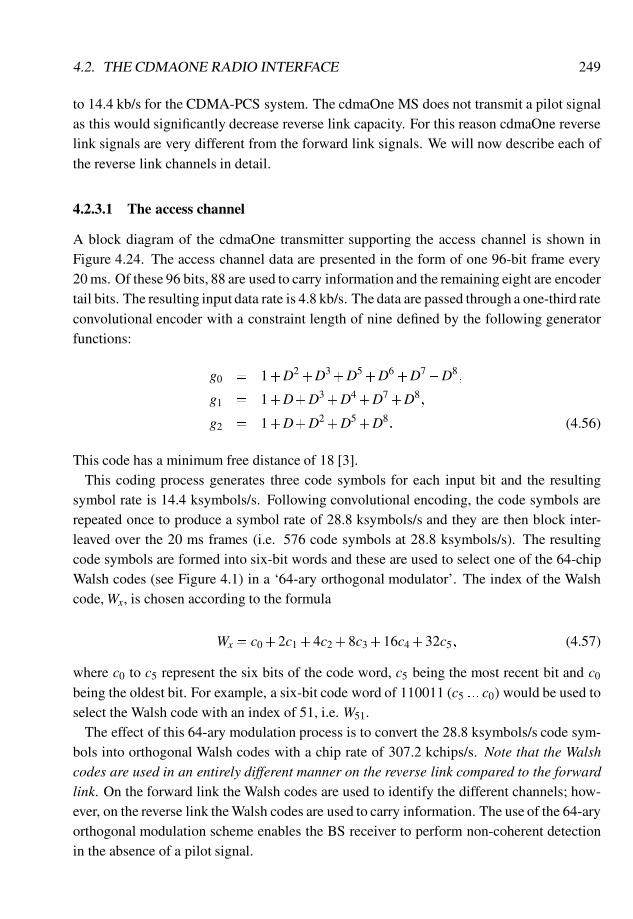
4.2. THE CDMAONE RADIO INTERFACE 249
to 14.4 kb/s for the CDMA-PCS system. The cdmaOne MS does not transmit a pilot signalas this would significantly decrease reverse link capacity. For this reason cdmaOne reverselink signals are very different from the forward link signals. We will now describe each ofthe reverse link channels in detail.
4.2.3.1 The access channel
A block diagram of the cdmaOne transmitter supporting the access channel is shown inFigure 4.24. The access channel data are presented in the form of one 96-bit frame every20 ms. Of these 96 bits, 88 are used to carry information and the remaining eight are encodertail bits. The resulting input data rate is 4.8 kb/s. The data are passed through a one-third rateconvolutional encoder with a constraint length of nine defined by the following generatorfunctions:
g0 = 1+D2+D3
+D5+D6
+D7+D8
;
g1 = 1+D+D3+D4
+D7+D8
;
g2 = 1+D+D2+D5
+D8: (4.56)
This code has a minimum free distance of 18 [3].This coding process generates three code symbols for each input bit and the resulting
symbol rate is 14.4 ksymbols/s. Following convolutional encoding, the code symbols arerepeated once to produce a symbol rate of 28.8 ksymbols/s and they are then block inter-leaved over the 20 ms frames (i.e. 576 code symbols at 28.8 ksymbols/s). The resultingcode symbols are formed into six-bit words and these are used to select one of the 64-chipWalsh codes (see Figure 4.1) in a ‘64-ary orthogonal modulator’. The index of the Walshcode, Wx, is chosen according to the formula
Wx = c0+2c1+4c2+8c3+16c4+32c5; (4.57)
where c0 to c5 represent the six bits of the code word, c5 being the most recent bit and c0
being the oldest bit. For example, a six-bit code word of 110011 (c5 ::: c0) would be used toselect the Walsh code with an index of 51, i.e. W51.
The effect of this 64-ary modulation process is to convert the 28.8 ksymbols/s code sym-bols into orthogonal Walsh codes with a chip rate of 307.2 kchips/s. Note that the Walshcodes are used in an entirely different manner on the reverse link compared to the forwardlink. On the forward link the Walsh codes are used to identify the different channels; how-ever, on the reverse link the Walsh codes are used to carry information. The use of the 64-aryorthogonal modulation scheme enables the BS receiver to perform non-coherent detectionin the absence of a pilot signal.
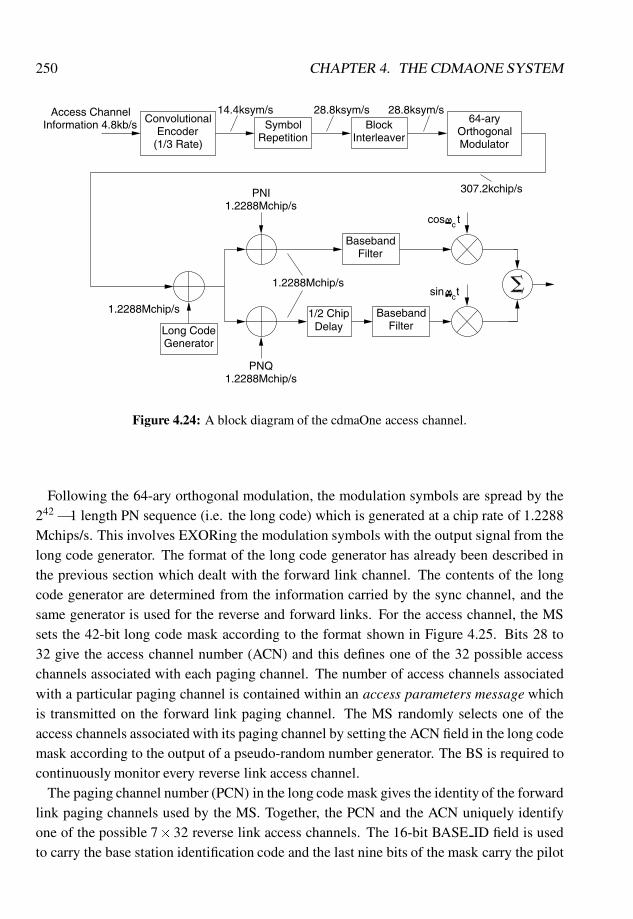
250 CHAPTER 4. THE CDMAONE SYSTEM
ConvolutionalEncoder
(1/3 Rate)Repetition
Symbol14.4ksym/s
InterleaverBlock
28.8ksym/s 28.8ksym/s
ModulatorOrthogonal
64-ary
FilterBaseband
cos tc
BasebandFilter
1.2288Mchip/ssin tc
Delay1/2 Chip
GeneratorLong Code
PNI1.2288Mchip/s
1.2288Mchip/sPNQ
1.2288Mchip/s
Access ChannelInformation 4.8kb/s
307.2kchip/s
Figure 4.24: A block diagram of the cdmaOne access channel.
Following the 64-ary orthogonal modulation, the modulation symbols are spread by the242� 1 length PN sequence (i.e. the long code) which is generated at a chip rate of 1.2288
Mchips/s. This involves EXORing the modulation symbols with the output signal from thelong code generator. The format of the long code generator has already been described inthe previous section which dealt with the forward link channel. The contents of the longcode generator are determined from the information carried by the sync channel, and thesame generator is used for the reverse and forward links. For the access channel, the MSsets the 42-bit long code mask according to the format shown in Figure 4.25. Bits 28 to32 give the access channel number (ACN) and this defines one of the 32 possible accesschannels associated with each paging channel. The number of access channels associatedwith a particular paging channel is contained within an access parameters message whichis transmitted on the forward link paging channel. The MS randomly selects one of theaccess channels associated with its paging channel by setting the ACN field in the long codemask according to the output of a pseudo-random number generator. The BS is required tocontinuously monitor every reverse link access channel.
The paging channel number (PCN) in the long code mask gives the identity of the forwardlink paging channels used by the MS. Together, the PCN and the ACN uniquely identifyone of the possible 7� 32 reverse link access channels. The 16-bit BASE ID field is usedto carry the base station identification code and the last nine bits of the mask carry the pilot
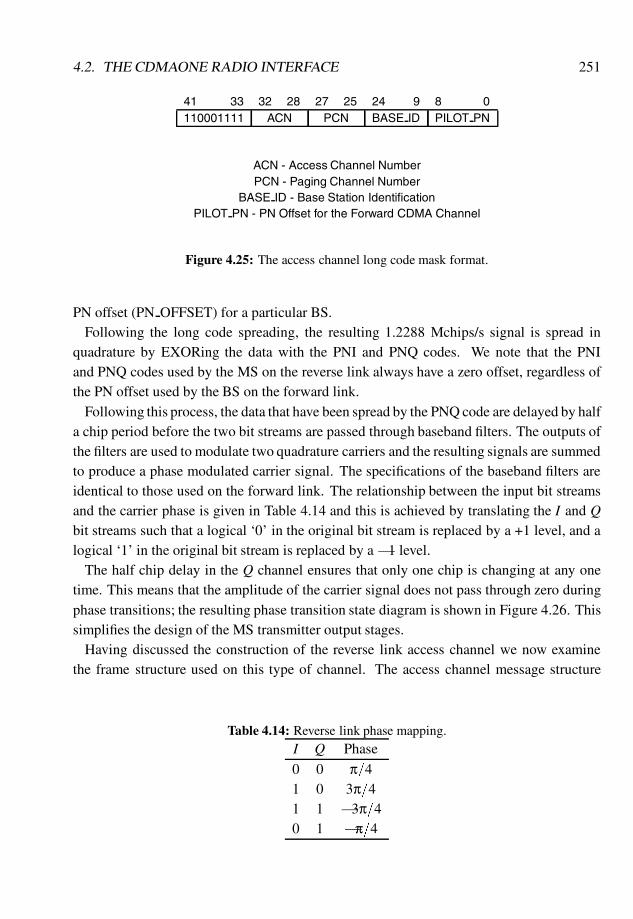
4.2. THE CDMAONE RADIO INTERFACE 251
41 33 32 28 27 25 24 9 8 0110001111 ACN PCN BASE ID PILOT PN
ACN - Access Channel NumberPCN - Paging Channel Number
BASE ID - Base Station IdentificationPILOT PN - PN Offset for the Forward CDMA Channel
Figure 4.25: The access channel long code mask format.
PN offset (PN OFFSET) for a particular BS.Following the long code spreading, the resulting 1.2288 Mchips/s signal is spread in
quadrature by EXORing the data with the PNI and PNQ codes. We note that the PNIand PNQ codes used by the MS on the reverse link always have a zero offset, regardless ofthe PN offset used by the BS on the forward link.
Following this process, the data that have been spread by the PNQ code are delayed by halfa chip period before the two bit streams are passed through baseband filters. The outputs ofthe filters are used to modulate two quadrature carriers and the resulting signals are summedto produce a phase modulated carrier signal. The specifications of the baseband filters areidentical to those used on the forward link. The relationship between the input bit streamsand the carrier phase is given in Table 4.14 and this is achieved by translating the I and Qbit streams such that a logical ‘0’ in the original bit stream is replaced by a +1 level, and alogical ‘1’ in the original bit stream is replaced by a �1 level.
The half chip delay in the Q channel ensures that only one chip is changing at any onetime. This means that the amplitude of the carrier signal does not pass through zero duringphase transitions; the resulting phase transition state diagram is shown in Figure 4.26. Thissimplifies the design of the MS transmitter output stages.
Having discussed the construction of the reverse link access channel we now examinethe frame structure used on this type of channel. The access channel message structure
Table 4.14: Reverse link phase mapping.I Q Phase
0 0 π=41 0 3π=41 1 �3π=40 1 �π=4
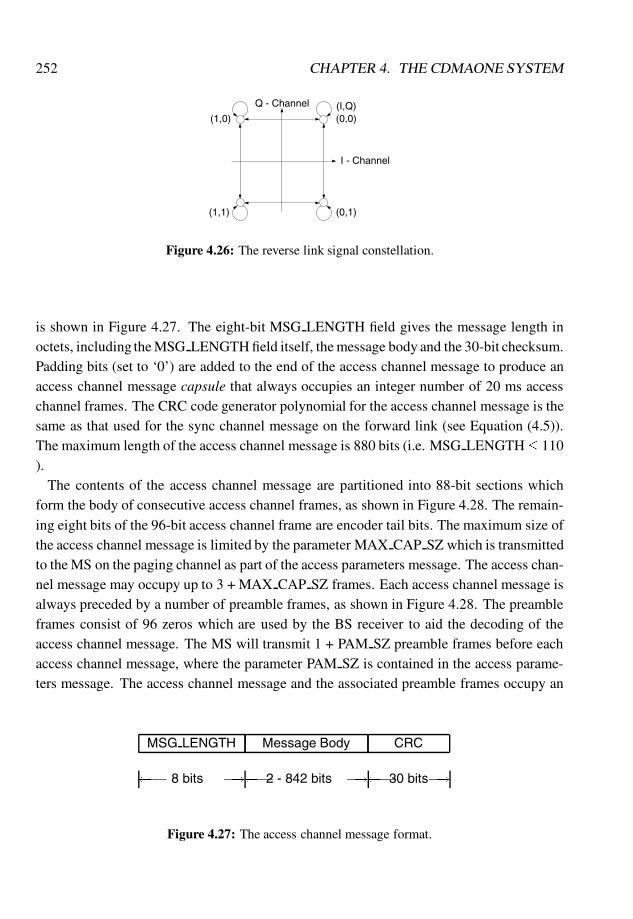
252 CHAPTER 4. THE CDMAONE SYSTEM
Q - Channel
I - Channel
(0,0)(I,Q)
(1,0)
(1,1) (0,1)
Figure 4.26: The reverse link signal constellation.
is shown in Figure 4.27. The eight-bit MSG LENGTH field gives the message length inoctets, including the MSG LENGTH field itself, the message body and the 30-bit checksum.Padding bits (set to ‘0’) are added to the end of the access channel message to produce anaccess channel message capsule that always occupies an integer number of 20 ms accesschannel frames. The CRC code generator polynomial for the access channel message is thesame as that used for the sync channel message on the forward link (see Equation (4.5)).The maximum length of the access channel message is 880 bits (i.e. MSG LENGTH� 110).
The contents of the access channel message are partitioned into 88-bit sections whichform the body of consecutive access channel frames, as shown in Figure 4.28. The remain-ing eight bits of the 96-bit access channel frame are encoder tail bits. The maximum size ofthe access channel message is limited by the parameter MAX CAP SZ which is transmittedto the MS on the paging channel as part of the access parameters message. The access chan-nel message may occupy up to 3 + MAX CAP SZ frames. Each access channel message isalways preceded by a number of preamble frames, as shown in Figure 4.28. The preambleframes consist of 96 zeros which are used by the BS receiver to aid the decoding of theaccess channel message. The MS will transmit 1 + PAM SZ preamble frames before eachaccess channel message, where the parameter PAM SZ is contained in the access parame-ters message. The access channel message and the associated preamble frames occupy an
MSG LENGTH Message Body CRC
� 8 bits �! �2 - 842 bits �! �30 bits�!
Figure 4.27: The access channel message format.
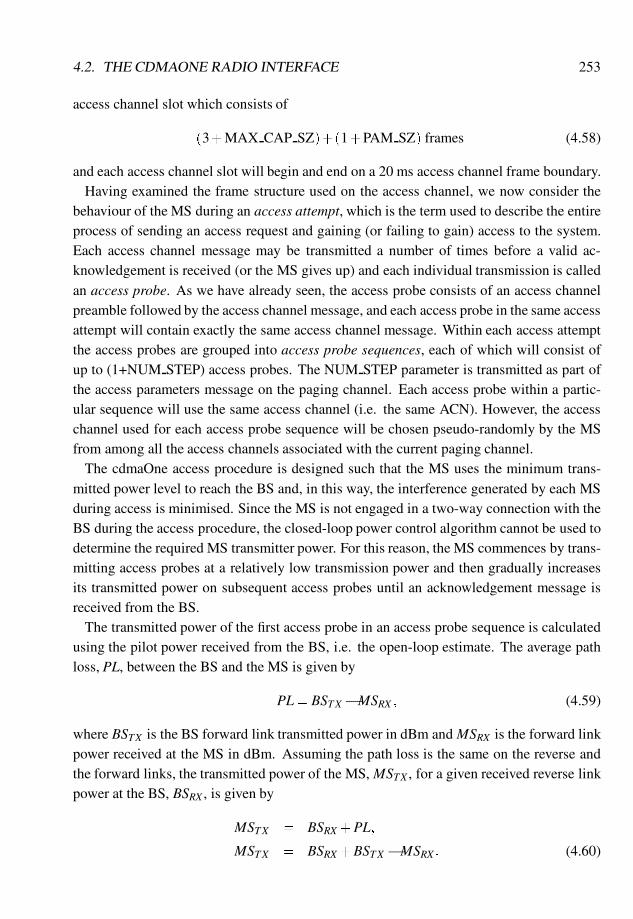
4.2. THE CDMAONE RADIO INTERFACE 253
access channel slot which consists of
(3+MAX CAP SZ)+(1+PAM SZ) frames (4.58)
and each access channel slot will begin and end on a 20 ms access channel frame boundary.Having examined the frame structure used on the access channel, we now consider the
behaviour of the MS during an access attempt, which is the term used to describe the entireprocess of sending an access request and gaining (or failing to gain) access to the system.Each access channel message may be transmitted a number of times before a valid ac-knowledgement is received (or the MS gives up) and each individual transmission is calledan access probe. As we have already seen, the access probe consists of an access channelpreamble followed by the access channel message, and each access probe in the same accessattempt will contain exactly the same access channel message. Within each access attemptthe access probes are grouped into access probe sequences, each of which will consist ofup to (1+NUM STEP) access probes. The NUM STEP parameter is transmitted as part ofthe access parameters message on the paging channel. Each access probe within a partic-ular sequence will use the same access channel (i.e. the same ACN). However, the accesschannel used for each access probe sequence will be chosen pseudo-randomly by the MSfrom among all the access channels associated with the current paging channel.
The cdmaOne access procedure is designed such that the MS uses the minimum trans-mitted power level to reach the BS and, in this way, the interference generated by each MSduring access is minimised. Since the MS is not engaged in a two-way connection with theBS during the access procedure, the closed-loop power control algorithm cannot be used todetermine the required MS transmitter power. For this reason, the MS commences by trans-mitting access probes at a relatively low transmission power and then gradually increasesits transmitted power on subsequent access probes until an acknowledgement message isreceived from the BS.
The transmitted power of the first access probe in an access probe sequence is calculatedusing the pilot power received from the BS, i.e. the open-loop estimate. The average pathloss, PL, between the BS and the MS is given by
PL= BSTX �MSRX ; (4.59)
where BSTX is the BS forward link transmitted power in dBm and MSRX is the forward linkpower received at the MS in dBm. Assuming the path loss is the same on the reverse andthe forward links, the transmitted power of the MS, MSTX , for a given received reverse linkpower at the BS, BSRX , is given by
MSTX = BSRX +PL;
MSTX = BSRX +BSTX �MSRX : (4.60)
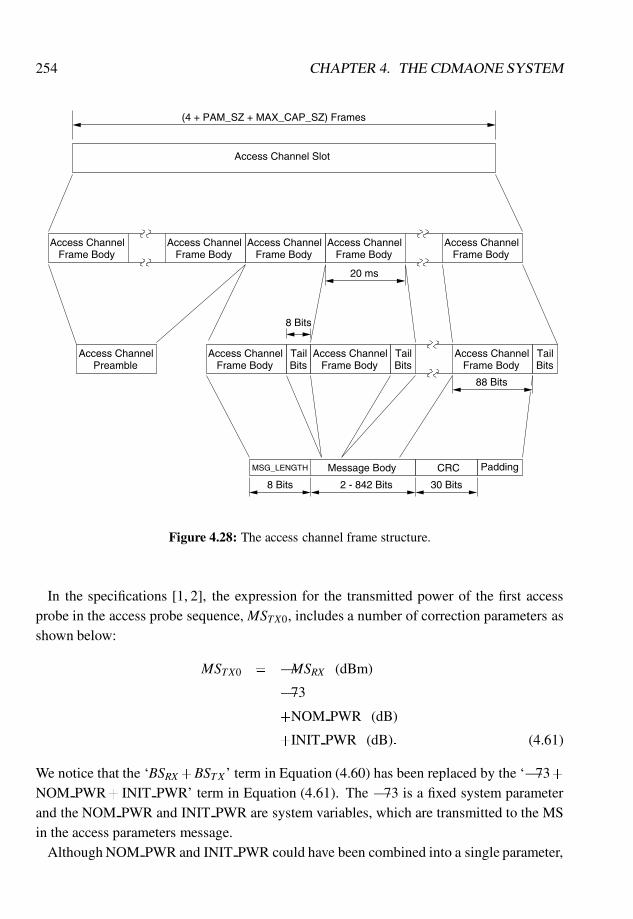
254 CHAPTER 4. THE CDMAONE SYSTEM
MSG_LENGTH Message Body CRC Padding
8 Bits 2 - 842 Bits 30 Bits
Access ChannelPreamble
Access ChannelFrame Body Bits
TailBitsTail
Frame BodyAccess Channel Access Channel
BitsTail
88 Bits
Frame Body
8 Bits
Access ChannelFrame Body Frame Body
Access ChannelFrame Body
Access Channel Access ChannelFrame Body Frame Body
Access Channel
20 ms
Access Channel Slot
(4 + PAM_SZ + MAX_CAP_SZ) Frames
Figure 4.28: The access channel frame structure.
In the specifications [1, 2], the expression for the transmitted power of the first accessprobe in the access probe sequence, MSTX0, includes a number of correction parameters asshown below:
MSTX0 = �MSRX (dBm)
�73
+NOM PWR (dB)
+INIT PWR (dB): (4.61)
We notice that the ‘BSRX +BSTX ’ term in Equation (4.60) has been replaced by the ‘�73+NOM PWR+ INIT PWR’ term in Equation (4.61). The �73 is a fixed system parameterand the NOM PWR and INIT PWR are system variables, which are transmitted to the MSin the access parameters message.
Although NOM PWR and INIT PWR could have been combined into a single parameter,
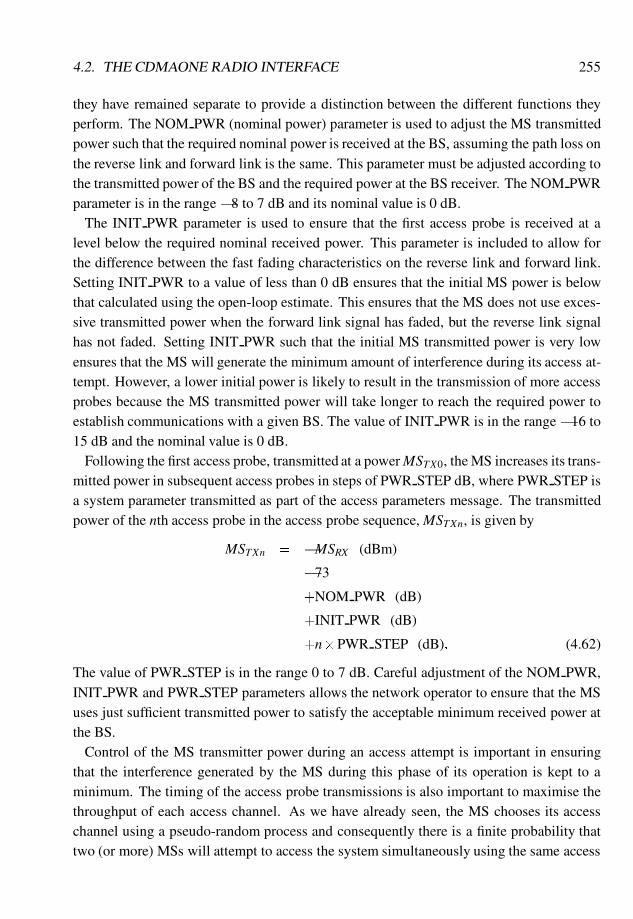
4.2. THE CDMAONE RADIO INTERFACE 255
they have remained separate to provide a distinction between the different functions theyperform. The NOM PWR (nominal power) parameter is used to adjust the MS transmittedpower such that the required nominal power is received at the BS, assuming the path loss onthe reverse link and forward link is the same. This parameter must be adjusted according tothe transmitted power of the BS and the required power at the BS receiver. The NOM PWRparameter is in the range �8 to 7 dB and its nominal value is 0 dB.
The INIT PWR parameter is used to ensure that the first access probe is received at alevel below the required nominal received power. This parameter is included to allow forthe difference between the fast fading characteristics on the reverse link and forward link.Setting INIT PWR to a value of less than 0 dB ensures that the initial MS power is belowthat calculated using the open-loop estimate. This ensures that the MS does not use exces-sive transmitted power when the forward link signal has faded, but the reverse link signalhas not faded. Setting INIT PWR such that the initial MS transmitted power is very lowensures that the MS will generate the minimum amount of interference during its access at-tempt. However, a lower initial power is likely to result in the transmission of more accessprobes because the MS transmitted power will take longer to reach the required power toestablish communications with a given BS. The value of INIT PWR is in the range �16 to15 dB and the nominal value is 0 dB.
Following the first access probe, transmitted at a power MSTX0, the MS increases its trans-mitted power in subsequent access probes in steps of PWR STEP dB, where PWR STEP isa system parameter transmitted as part of the access parameters message. The transmittedpower of the nth access probe in the access probe sequence, MSTXn, is given by
MSTXn = �MSRX (dBm)
�73
+NOM PWR (dB)
+INIT PWR (dB)
+n�PWR STEP (dB): (4.62)
The value of PWR STEP is in the range 0 to 7 dB. Careful adjustment of the NOM PWR,INIT PWR and PWR STEP parameters allows the network operator to ensure that the MSuses just sufficient transmitted power to satisfy the acceptable minimum received power atthe BS.
Control of the MS transmitter power during an access attempt is important in ensuringthat the interference generated by the MS during this phase of its operation is kept to aminimum. The timing of the access probe transmissions is also important to maximise thethroughput of each access channel. As we have already seen, the MS chooses its accesschannel using a pseudo-random process and consequently there is a finite probability thattwo (or more) MSs will attempt to access the system simultaneously using the same access
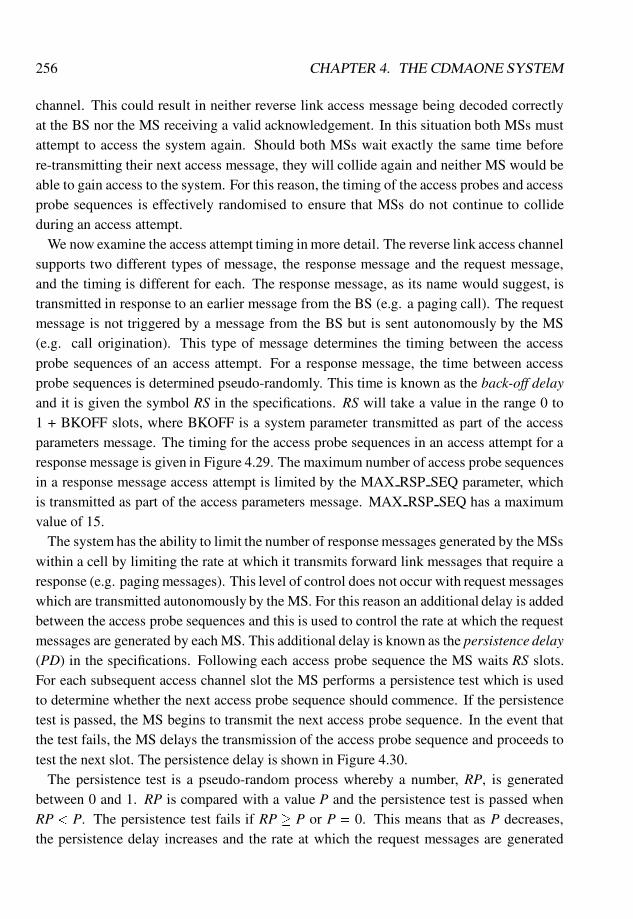
256 CHAPTER 4. THE CDMAONE SYSTEM
channel. This could result in neither reverse link access message being decoded correctlyat the BS nor the MS receiving a valid acknowledgement. In this situation both MSs mustattempt to access the system again. Should both MSs wait exactly the same time beforere-transmitting their next access message, they will collide again and neither MS would beable to gain access to the system. For this reason, the timing of the access probes and accessprobe sequences is effectively randomised to ensure that MSs do not continue to collideduring an access attempt.
We now examine the access attempt timing in more detail. The reverse link access channelsupports two different types of message, the response message and the request message,and the timing is different for each. The response message, as its name would suggest, istransmitted in response to an earlier message from the BS (e.g. a paging call). The requestmessage is not triggered by a message from the BS but is sent autonomously by the MS(e.g. call origination). This type of message determines the timing between the accessprobe sequences of an access attempt. For a response message, the time between accessprobe sequences is determined pseudo-randomly. This time is known as the back-off delayand it is given the symbol RS in the specifications. RS will take a value in the range 0 to1 + BKOFF slots, where BKOFF is a system parameter transmitted as part of the accessparameters message. The timing for the access probe sequences in an access attempt for aresponse message is given in Figure 4.29. The maximum number of access probe sequencesin a response message access attempt is limited by the MAX RSP SEQ parameter, whichis transmitted as part of the access parameters message. MAX RSP SEQ has a maximumvalue of 15.
The system has the ability to limit the number of response messages generated by the MSswithin a cell by limiting the rate at which it transmits forward link messages that require aresponse (e.g. paging messages). This level of control does not occur with request messageswhich are transmitted autonomously by the MS. For this reason an additional delay is addedbetween the access probe sequences and this is used to control the rate at which the requestmessages are generated by each MS. This additional delay is known as the persistence delay(PD) in the specifications. Following each access probe sequence the MS waits RS slots.For each subsequent access channel slot the MS performs a persistence test which is usedto determine whether the next access probe sequence should commence. If the persistencetest is passed, the MS begins to transmit the next access probe sequence. In the event thatthe test fails, the MS delays the transmission of the access probe sequence and proceeds totest the next slot. The persistence delay is shown in Figure 4.30.
The persistence test is a pseudo-random process whereby a number, RP, is generatedbetween 0 and 1. RP is compared with a value P and the persistence test is passed whenRP < P. The persistence test fails if RP � P or P = 0. This means that as P decreases,the persistence delay increases and the rate at which the request messages are generated
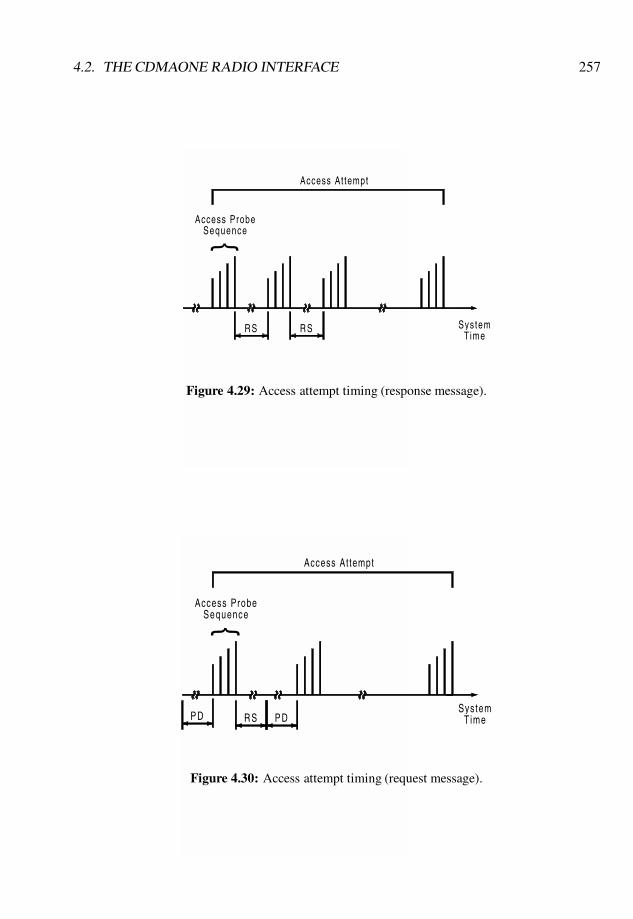
4.2. THE CDMAONE RADIO INTERFACE 257
Access At tempt
R S R S
Access ProbeSequence
�
SystemTime
Figure 4.29: Access attempt timing (response message).
Access At tempt
Access ProbeSequence
SystemTime
�
P D R S P D
Figure 4.30: Access attempt timing (request message).
258 CHAPTER 4. THE CDMAONE SYSTEM
decreases. Consequently the system may use the value of P to control the request messagerate on each access channel. The value of P depends on the type of request message (e.g.registration, call origination) and the overload class of the MS. The overload class is usedto distinguish between different MSs (e.g. normal MS, test MS, emergency MS) and assignthem different priorities in terms of the access channel resources. The actual calculation ofP is quite complex and the reader is referred to the specifications for a full description. Inthe case of a request message, the maximum number of access probe sequences in an accessattempt is given by the parameter MAX REQ SEQ which is transmitted to the MS as partof an access parameters message.
Following the transmission of each access probe the MS waits for a response from theBS. The length of this waiting period, TA, is given by
TA= (2+ACC TMO)�80 ms; (4.63)
where ACC TMO is a system parameter transmitted to the MS as part of the access pa-rameters message. If the MS receives a valid acknowledgement during this waiting period,then the access attempt ends. If the MS does not receive a valid acknowledgement duringthis waiting period, then the MS transmits the next access probe in the access probe se-quence after a further delay of RT slots, where RT is an additional back-off delay. RT is apseudo-random number in the range 0 to 1+ PROBE BKOFF, where the PROBE BKOFFparameter is transmitted as part of the access parameters message.
4.2.3.2 The traffic channel
The reverse link traffic channels are used to carry speech, user data and control data betweenthe MS and the BS in a dedicated mode. The IS-95 and CDMA-PCS traffic channels differslightly in their format and we shall commence by describing the IS-95 transmitter, as shownin Figure 4.31.
The reverse link traffic channels have been designed to support the variable rate CELPspeech coder used in the IS-95 systems and, consequently, they support data rates of 1.2,2.4, 4.8 and 9.6 kb/s. For each rate, the data are generated in the form of 20 ms framescontaining 192 bits (9.6 kb/s), 96 bits (4.8 kb/s), 48 bits (2.4 kb/s) or 24 bits (1.2 kb/s). Eachframe includes eight encoder tail bits, set to zero, and the two higher rate frames (9.6 kb/sand 4.8 kb/s) also include frame quality indicators in the form of a cyclic redundancy check(CRC) code. The 192-bit frame (9.6 kb/s) has a 12-bit CRC code and the 96-bit frame(4.8 kb/s) has an eight-bit CRC code. These frame formats and the CRC codes are identicalto those used on the forward link traffic channel for the same data rates.
Each frame is one-third rate convolutionally encoded using the same code as that usedon the access channel (see Equation (4.56)) and this results in a code symbol rate of 3.6,7.2, 14.4 or 28.8 ksymbols/s, depending on the input data rate. Following convolutional
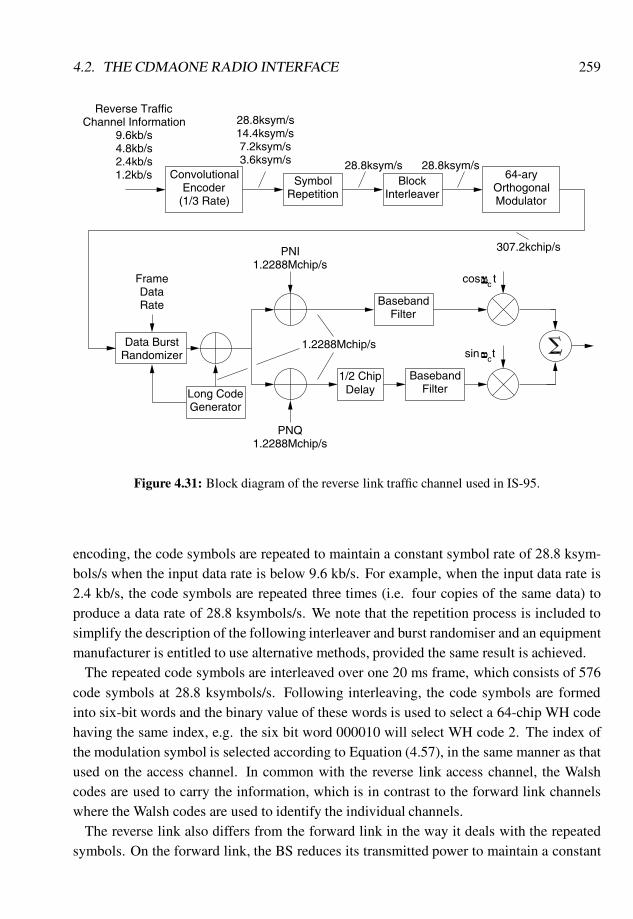
4.2. THE CDMAONE RADIO INTERFACE 259
ConvolutionalEncoder
(1/3 Rate)Repetition
SymbolInterleaver
Block28.8ksym/s 28.8ksym/s
ModulatorOrthogonal
64-ary
FilterBaseband
cos tc
BasebandFilter
1.2288Mchip/ssin tc
Delay1/2 Chip
GeneratorLong Code
PNI1.2288Mchip/s
1.2288Mchip/sPNQ
307.2kchip/s
Reverse TrafficChannel Information
9.6kb/s4.8kb/s2.4kb/s1.2kb/s
28.8ksym/s14.4ksym/s7.2ksym/s3.6ksym/s
Data BurstRandomizer
FrameDataRate
Figure 4.31: Block diagram of the reverse link traffic channel used in IS-95.
encoding, the code symbols are repeated to maintain a constant symbol rate of 28.8 ksym-bols/s when the input data rate is below 9.6 kb/s. For example, when the input data rate is2.4 kb/s, the code symbols are repeated three times (i.e. four copies of the same data) toproduce a data rate of 28.8 ksymbols/s. We note that the repetition process is included tosimplify the description of the following interleaver and burst randomiser and an equipmentmanufacturer is entitled to use alternative methods, provided the same result is achieved.
The repeated code symbols are interleaved over one 20 ms frame, which consists of 576code symbols at 28.8 ksymbols/s. Following interleaving, the code symbols are formedinto six-bit words and the binary value of these words is used to select a 64-chip WH codehaving the same index, e.g. the six bit word 000010 will select WH code 2. The index ofthe modulation symbol is selected according to Equation (4.57), in the same manner as thatused on the access channel. In common with the reverse link access channel, the Walshcodes are used to carry the information, which is in contrast to the forward link channelswhere the Walsh codes are used to identify the individual channels.
The reverse link also differs from the forward link in the way it deals with the repeatedsymbols. On the forward link, the BS reduces its transmitted power to maintain a constant
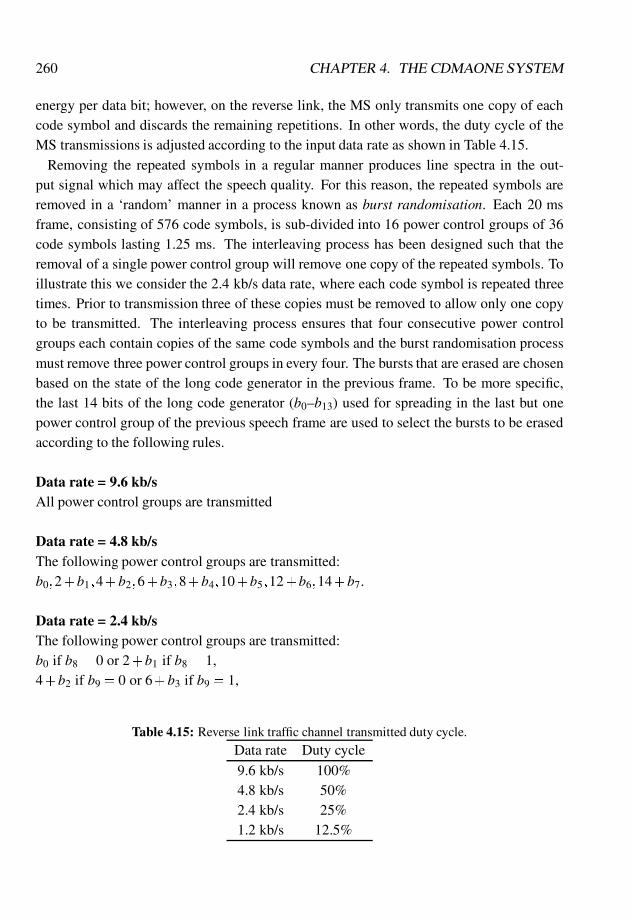
260 CHAPTER 4. THE CDMAONE SYSTEM
energy per data bit; however, on the reverse link, the MS only transmits one copy of eachcode symbol and discards the remaining repetitions. In other words, the duty cycle of theMS transmissions is adjusted according to the input data rate as shown in Table 4.15.
Removing the repeated symbols in a regular manner produces line spectra in the out-put signal which may affect the speech quality. For this reason, the repeated symbols areremoved in a ‘random’ manner in a process known as burst randomisation. Each 20 msframe, consisting of 576 code symbols, is sub-divided into 16 power control groups of 36code symbols lasting 1.25 ms. The interleaving process has been designed such that theremoval of a single power control group will remove one copy of the repeated symbols. Toillustrate this we consider the 2.4 kb/s data rate, where each code symbol is repeated threetimes. Prior to transmission three of these copies must be removed to allow only one copyto be transmitted. The interleaving process ensures that four consecutive power controlgroups each contain copies of the same code symbols and the burst randomisation processmust remove three power control groups in every four. The bursts that are erased are chosenbased on the state of the long code generator in the previous frame. To be more specific,the last 14 bits of the long code generator (b0–b13) used for spreading in the last but onepower control group of the previous speech frame are used to select the bursts to be erasedaccording to the following rules.
Data rate = 9.6 kb/sAll power control groups are transmitted
Data rate = 4.8 kb/sThe following power control groups are transmitted:b0;2+b1;4+b2;6+b3;8+b4;10+b5;12+b6;14+b7.
Data rate = 2.4 kb/sThe following power control groups are transmitted:b0 if b8 = 0 or 2+b1 if b8 = 1,4+b2 if b9 = 0 or 6+b3 if b9 = 1,
Table 4.15: Reverse link traffic channel transmitted duty cycle.Data rate Duty cycle
9.6 kb/s 100%4.8 kb/s 50%2.4 kb/s 25%1.2 kb/s 12.5%
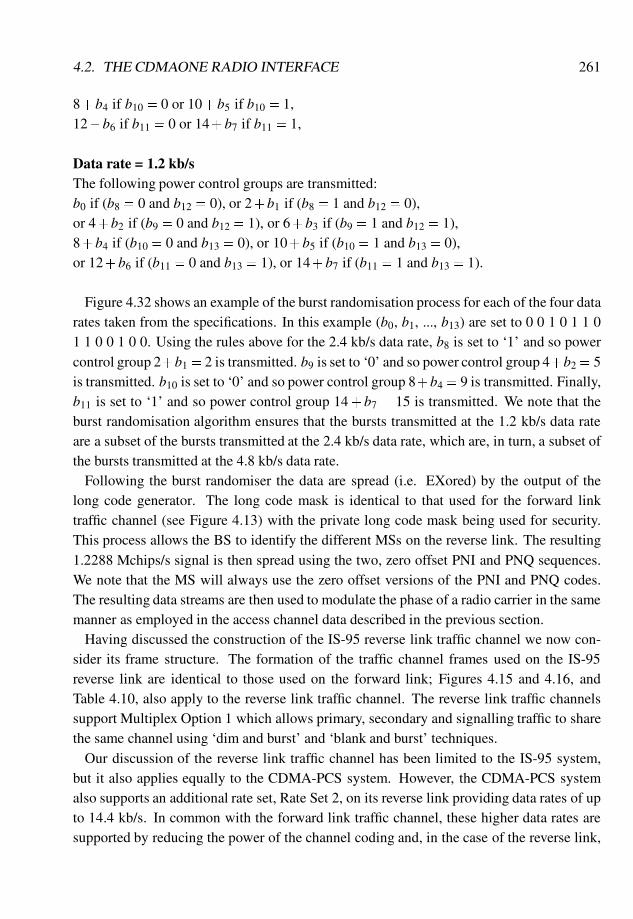
4.2. THE CDMAONE RADIO INTERFACE 261
8+b4 if b10 = 0 or 10+b5 if b10 = 1,12+b6 if b11 = 0 or 14+b7 if b11 = 1,
Data rate = 1.2 kb/sThe following power control groups are transmitted:b0 if (b8 = 0 and b12 = 0), or 2+b1 if (b8 = 1 and b12 = 0),or 4+b2 if (b9 = 0 and b12 = 1), or 6+b3 if (b9 = 1 and b12 = 1),8+b4 if (b10 = 0 and b13 = 0), or 10+b5 if (b10 = 1 and b13 = 0),or 12+b6 if (b11 = 0 and b13 = 1), or 14+b7 if (b11 = 1 and b13 = 1).
Figure 4.32 shows an example of the burst randomisation process for each of the four datarates taken from the specifications. In this example (b0, b1, ..., b13) are set to 0 0 1 0 1 1 01 1 0 0 1 0 0. Using the rules above for the 2.4 kb/s data rate, b8 is set to ‘1’ and so powercontrol group 2+b1 = 2 is transmitted. b9 is set to ‘0’ and so power control group 4+b2= 5is transmitted. b10 is set to ‘0’ and so power control group 8+b4= 9 is transmitted. Finally,b11 is set to ‘1’ and so power control group 14+ b7 = 15 is transmitted. We note that theburst randomisation algorithm ensures that the bursts transmitted at the 1.2 kb/s data rateare a subset of the bursts transmitted at the 2.4 kb/s data rate, which are, in turn, a subset ofthe bursts transmitted at the 4.8 kb/s data rate.
Following the burst randomiser the data are spread (i.e. EXored) by the output of thelong code generator. The long code mask is identical to that used for the forward linktraffic channel (see Figure 4.13) with the private long code mask being used for security.This process allows the BS to identify the different MSs on the reverse link. The resulting1.2288 Mchips/s signal is then spread using the two, zero offset PNI and PNQ sequences.We note that the MS will always use the zero offset versions of the PNI and PNQ codes.The resulting data streams are then used to modulate the phase of a radio carrier in the samemanner as employed in the access channel data described in the previous section.
Having discussed the construction of the IS-95 reverse link traffic channel we now con-sider its frame structure. The formation of the traffic channel frames used on the IS-95reverse link are identical to those used on the forward link; Figures 4.15 and 4.16, andTable 4.10, also apply to the reverse link traffic channel. The reverse link traffic channelssupport Multiplex Option 1 which allows primary, secondary and signalling traffic to sharethe same channel using ‘dim and burst’ and ‘blank and burst’ techniques.
Our discussion of the reverse link traffic channel has been limited to the IS-95 system,but it also applies equally to the CDMA-PCS system. However, the CDMA-PCS systemalso supports an additional rate set, Rate Set 2, on its reverse link providing data rates of upto 14.4 kb/s. In common with the forward link traffic channel, these higher data rates aresupported by reducing the power of the channel coding and, in the case of the reverse link,
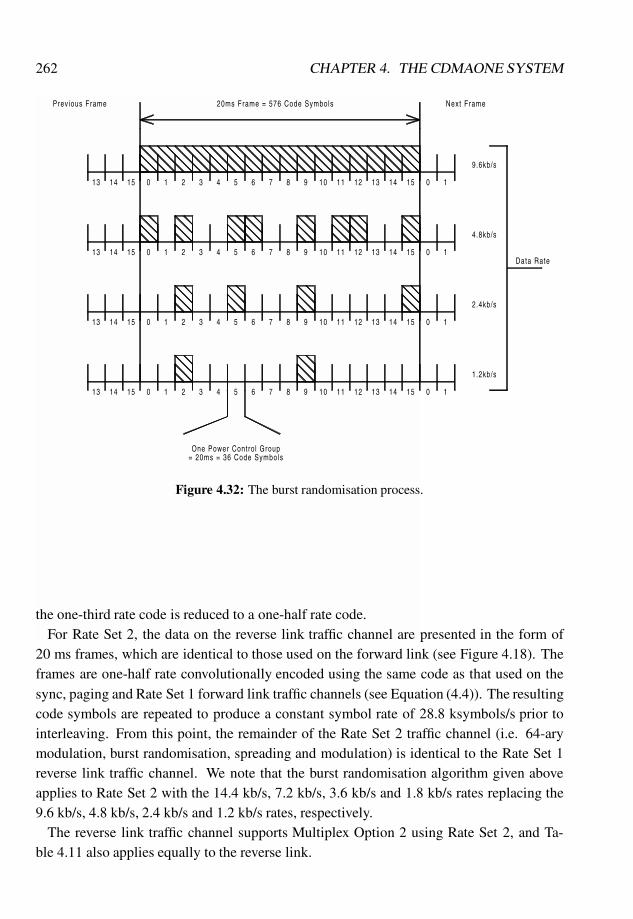
262 CHAPTER 4. THE CDMAONE SYSTEM
20ms Frame = 576 Code Symbols
One Power Contro l Group= 20ms = 36 Code Symbols
Data Rate
Previous Frame Next Frame
2
21413 0 115
1413 0 115
3 4 5 76 8
3 4 5 76 8
2
2
0 1151413
1413 015 1
73 4 5 6 8
3 4 5 76 8
9 10 11 12 13 14 15
9 10 11 12 13 14 15
1.2kb/s
0 1
2.4kb/s
0 1
9 10 11 12 13 14 15
9 10 11 12 1413 15
0 1
4.8kb/s
0 1
9.6kb/s
Figure 4.32: The burst randomisation process.
the one-third rate code is reduced to a one-half rate code.For Rate Set 2, the data on the reverse link traffic channel are presented in the form of
20 ms frames, which are identical to those used on the forward link (see Figure 4.18). Theframes are one-half rate convolutionally encoded using the same code as that used on thesync, paging and Rate Set 1 forward link traffic channels (see Equation (4.4)). The resultingcode symbols are repeated to produce a constant symbol rate of 28.8 ksymbols/s prior tointerleaving. From this point, the remainder of the Rate Set 2 traffic channel (i.e. 64-arymodulation, burst randomisation, spreading and modulation) is identical to the Rate Set 1reverse link traffic channel. We note that the burst randomisation algorithm given aboveapplies to Rate Set 2 with the 14.4 kb/s, 7.2 kb/s, 3.6 kb/s and 1.8 kb/s rates replacing the9.6 kb/s, 4.8 kb/s, 2.4 kb/s and 1.2 kb/s rates, respectively.
The reverse link traffic channel supports Multiplex Option 2 using Rate Set 2, and Ta-ble 4.11 also applies equally to the reverse link.
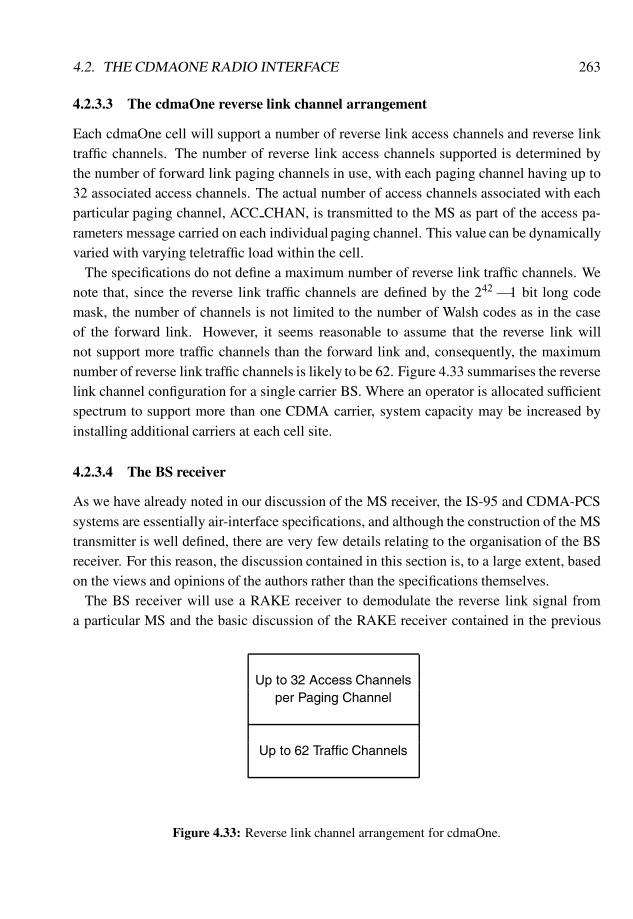
4.2. THE CDMAONE RADIO INTERFACE 263
4.2.3.3 The cdmaOne reverse link channel arrangement
Each cdmaOne cell will support a number of reverse link access channels and reverse linktraffic channels. The number of reverse link access channels supported is determined bythe number of forward link paging channels in use, with each paging channel having up to32 associated access channels. The actual number of access channels associated with eachparticular paging channel, ACC CHAN, is transmitted to the MS as part of the access pa-rameters message carried on each individual paging channel. This value can be dynamicallyvaried with varying teletraffic load within the cell.
The specifications do not define a maximum number of reverse link traffic channels. Wenote that, since the reverse link traffic channels are defined by the 242
� 1 bit long codemask, the number of channels is not limited to the number of Walsh codes as in the caseof the forward link. However, it seems reasonable to assume that the reverse link willnot support more traffic channels than the forward link and, consequently, the maximumnumber of reverse link traffic channels is likely to be 62. Figure 4.33 summarises the reverselink channel configuration for a single carrier BS. Where an operator is allocated sufficientspectrum to support more than one CDMA carrier, system capacity may be increased byinstalling additional carriers at each cell site.
4.2.3.4 The BS receiver
As we have already noted in our discussion of the MS receiver, the IS-95 and CDMA-PCSsystems are essentially air-interface specifications, and although the construction of the MStransmitter is well defined, there are very few details relating to the organisation of the BSreceiver. For this reason, the discussion contained in this section is, to a large extent, basedon the views and opinions of the authors rather than the specifications themselves.
The BS receiver will use a RAKE receiver to demodulate the reverse link signal froma particular MS and the basic discussion of the RAKE receiver contained in the previous
Up to 32 Access Channelsper Paging Channel
Up to 62 Traffic Channels
Figure 4.33: Reverse link channel arrangement for cdmaOne.
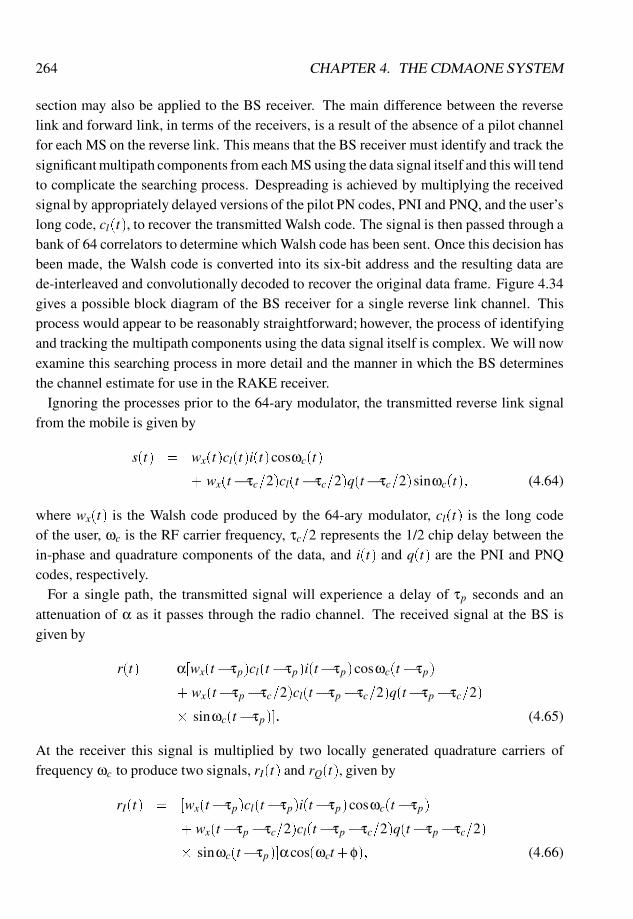
264 CHAPTER 4. THE CDMAONE SYSTEM
section may also be applied to the BS receiver. The main difference between the reverselink and forward link, in terms of the receivers, is a result of the absence of a pilot channelfor each MS on the reverse link. This means that the BS receiver must identify and track thesignificant multipath components from each MS using the data signal itself and this will tendto complicate the searching process. Despreading is achieved by multiplying the receivedsignal by appropriately delayed versions of the pilot PN codes, PNI and PNQ, and the user’slong code, cl(t), to recover the transmitted Walsh code. The signal is then passed through abank of 64 correlators to determine which Walsh code has been sent. Once this decision hasbeen made, the Walsh code is converted into its six-bit address and the resulting data arede-interleaved and convolutionally decoded to recover the original data frame. Figure 4.34gives a possible block diagram of the BS receiver for a single reverse link channel. Thisprocess would appear to be reasonably straightforward; however, the process of identifyingand tracking the multipath components using the data signal itself is complex. We will nowexamine this searching process in more detail and the manner in which the BS determinesthe channel estimate for use in the RAKE receiver.
Ignoring the processes prior to the 64-ary modulator, the transmitted reverse link signalfrom the mobile is given by
s(t) = wx(t)cl(t)i(t)cosωc(t)
+ wx(t�τc=2)cl(t�τc=2)q(t�τc=2)sinωc(t); (4.64)
where wx(t) is the Walsh code produced by the 64-ary modulator, cl(t) is the long codeof the user, ωc is the RF carrier frequency, τc=2 represents the 1/2 chip delay between thein-phase and quadrature components of the data, and i(t) and q(t) are the PNI and PNQcodes, respectively.
For a single path, the transmitted signal will experience a delay of τp seconds and anattenuation of α as it passes through the radio channel. The received signal at the BS isgiven by
r(t) = α[wx(t�τp)cl(t�τp)i(t�τp)cosωc(t�τp)
+ wx(t�τp�τc=2)cl(t�τp�τc=2)q(t�τp�τc=2)
� sinωc(t�τp)]: (4.65)
At the receiver this signal is multiplied by two locally generated quadrature carriers offrequency ωc to produce two signals, rI(t) and rQ(t), given by
rI(t) = [wx(t�τp)cl(t�τp)i(t�τp)cosωc(t�τp)
+ wx(t�τp�τc=2)cl(t�τp�τc=2)q(t�τp�τc=2)
� sinωc(t�τp)]αcos(ωct+φ); (4.66)
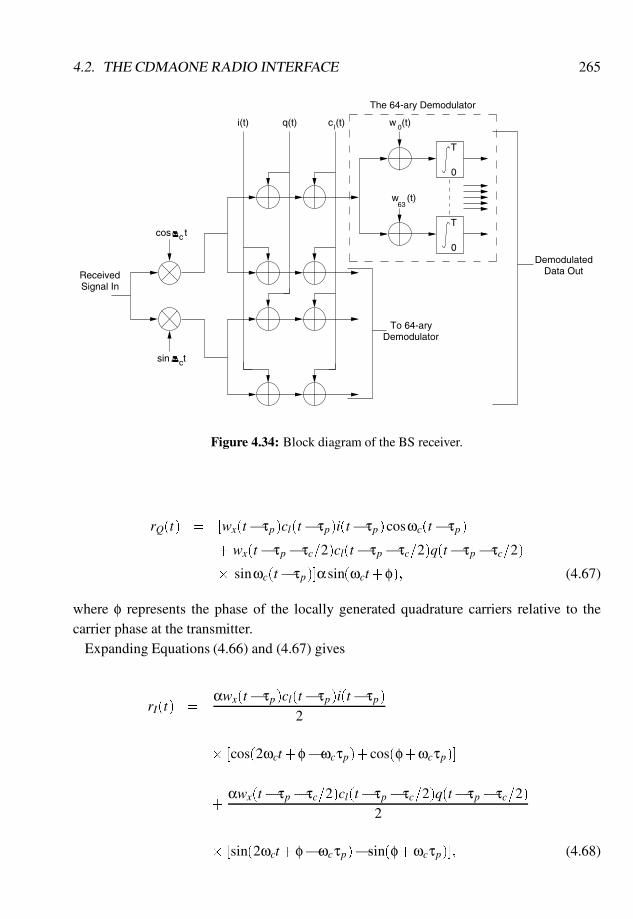
4.2. THE CDMAONE RADIO INTERFACE 265
0
T
w (t)0
0
w (t)63
T
c (t)lq(t)i(t)
To 64-aryDemodulator
Data OutDemodulated
ReceivedSignal In
cos tc
csin t
The 64-ary Demodulator
Figure 4.34: Block diagram of the BS receiver.
rQ(t) = [wx(t�τp)cl(t�τp)i(t�τp)cosωc(t�τp)
+ wx(t�τp�τc=2)cl(t�τp�τc=2)q(t�τp�τc=2)
� sinωc(t�τp)]αsin(ωct+φ); (4.67)
where φ represents the phase of the locally generated quadrature carriers relative to thecarrier phase at the transmitter.
Expanding Equations (4.66) and (4.67) gives
rI(t) =αwx(t�τp)cl(t�τp)i(t�τp)
2
� [cos(2ωct+φ�ωcτp)+cos(φ+ωcτp)]
+αwx(t�τp�τc=2)cl(t�τp�τc=2)q(t�τp�τc=2)
2
� [sin(2ωct+φ�ωcτp)� sin(φ+ωcτp)]; (4.68)
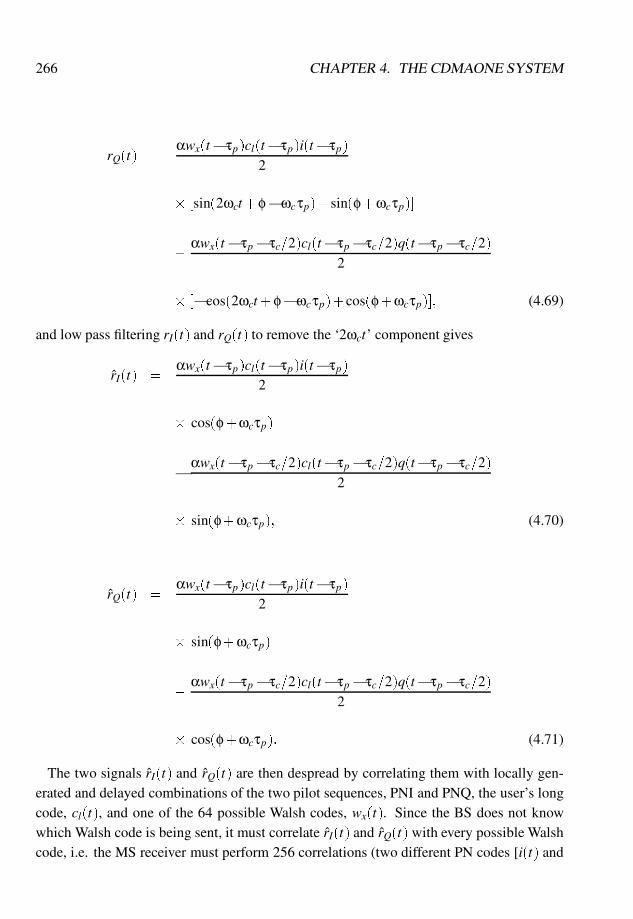
266 CHAPTER 4. THE CDMAONE SYSTEM
rQ(t) =αwx(t�τp)cl(t�τp)i(t�τp)
2
� [sin(2ωct+φ�ωcτp)+ sin(φ+ωcτp)]
+αwx(t�τp�τc=2)cl(t�τp�τc=2)q(t�τp�τc=2)
2
� [�cos(2ωct+φ�ωcτp)+cos(φ+ωcτp)]; (4.69)
and low pass filtering rI(t) and rQ(t) to remove the ‘2ωct’ component gives
rI(t) =αwx(t�τp)cl(t�τp)i(t�τp)
2
� cos(φ+ωcτp)
�
αwx(t�τp�τc=2)cl(t�τp�τc=2)q(t�τp�τc=2)2
� sin(φ+ωcτp); (4.70)
rQ(t) =αwx(t�τp)cl(t�τp)i(t�τp)
2
� sin(φ+ωcτp)
+αwx(t�τp�τc=2)cl(t�τp�τc=2)q(t�τp�τc=2)
2
� cos(φ+ωcτp): (4.71)
The two signals rI(t) and rQ(t) are then despread by correlating them with locally gen-erated and delayed combinations of the two pilot sequences, PNI and PNQ, the user’s longcode, cl(t), and one of the 64 possible Walsh codes, wx(t). Since the BS does not knowwhich Walsh code is being sent, it must correlate rI(t) and rQ(t) with every possible Walshcode, i.e. the MS receiver must perform 256 correlations (two different PN codes [i(t) and
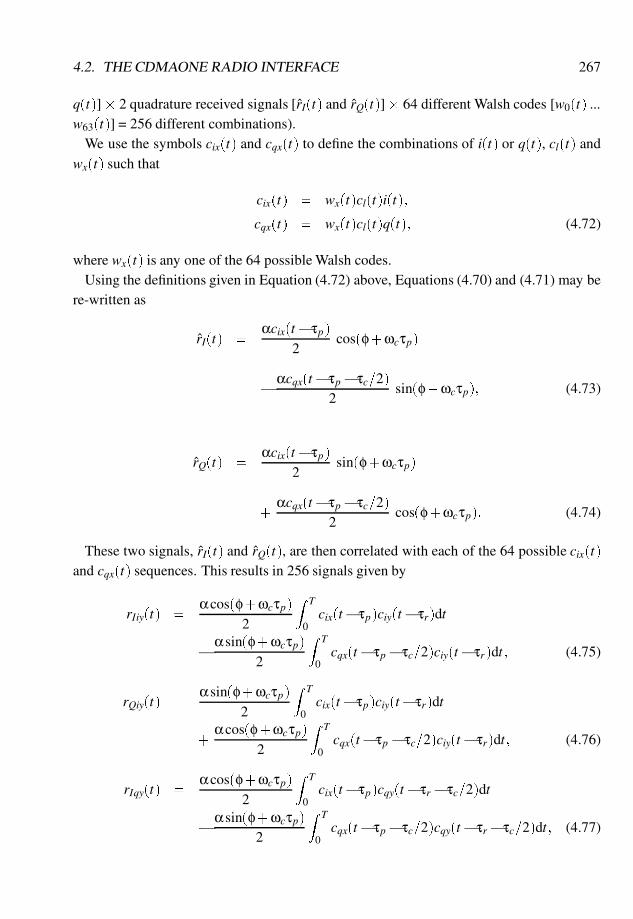
4.2. THE CDMAONE RADIO INTERFACE 267
q(t)]� 2 quadrature received signals [rI(t) and rQ(t)]� 64 different Walsh codes [w0(t) ...w63(t)] = 256 different combinations).
We use the symbols cix(t) and cqx(t) to define the combinations of i(t) or q(t), cl(t) andwx(t) such that
cix(t) = wx(t)cl(t)i(t);
cqx(t) = wx(t)cl(t)q(t); (4.72)
where wx(t) is any one of the 64 possible Walsh codes.Using the definitions given in Equation (4.72) above, Equations (4.70) and (4.71) may be
re-written as
rI(t) =αcix(t�τp)
2cos(φ+ωcτp)
�
αcqx(t�τp�τc=2)2
sin(φ+ωcτp); (4.73)
rQ(t) =αcix(t�τp)
2sin(φ+ωcτp)
+αcqx(t�τp�τc=2)
2cos(φ+ωcτp): (4.74)
These two signals, rI(t) and rQ(t), are then correlated with each of the 64 possible cix(t)and cqx(t) sequences. This results in 256 signals given by
rIiy(t) =αcos(φ+ωcτp)
2
Z T
0cix(t�τp)ciy(t�τr)dt
�
αsin(φ+ωcτp)2
Z T
0cqx(t�τp�τc=2)ciy(t�τr)dt; (4.75)
rQiy(t) =αsin(φ+ωcτp)
2
Z T
0cix(t�τp)ciy(t�τr)dt
+αcos(φ+ωcτp)
2
Z T
0cqx(t�τp�τc=2)ciy(t�τr)dt; (4.76)
rIqy(t) =αcos(φ+ωcτp)
2
Z T
0cix(t�τp)cqy(t�τr�τc=2)dt
�
αsin(φ+ωcτp)2
Z T
0cqx(t�τp�τc=2)cqy(t�τr�τc=2)dt; (4.77)
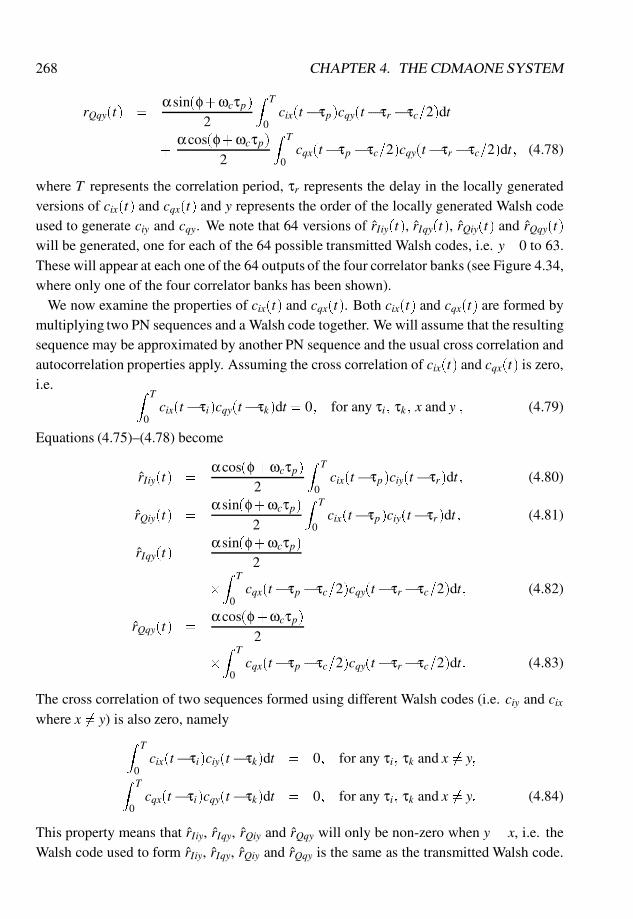
268 CHAPTER 4. THE CDMAONE SYSTEM
rQqy(t) =αsin(φ+ωcτp)
2
Z T
0cix(t�τp)cqy(t�τr�τc=2)dt
+αcos(φ+ωcτp)
2
Z T
0cqx(t�τp�τc=2)cqy(t�τr�τc=2)dt; (4.78)
where T represents the correlation period, τr represents the delay in the locally generatedversions of cix(t) and cqx(t) and y represents the order of the locally generated Walsh codeused to generate ciy and cqy. We note that 64 versions of rIiy(t), rIqy(t), rQiy(t) and rQqy(t)will be generated, one for each of the 64 possible transmitted Walsh codes, i.e. y =0 to 63.These will appear at each one of the 64 outputs of the four correlator banks (see Figure 4.34,where only one of the four correlator banks has been shown).
We now examine the properties of cix(t) and cqx(t). Both cix(t) and cqx(t) are formed bymultiplying two PN sequences and a Walsh code together. We will assume that the resultingsequence may be approximated by another PN sequence and the usual cross correlation andautocorrelation properties apply. Assuming the cross correlation of cix(t) and cqx(t) is zero,i.e. Z T
0cix(t�τi)cqy(t�τk)dt = 0; for any τi; τk; x and y ; (4.79)
Equations (4.75)–(4.78) become
rIiy(t) =αcos(φ+ωcτp)
2
Z T
0cix(t�τp)ciy(t�τr)dt; (4.80)
rQiy(t) =αsin(φ+ωcτp)
2
Z T
0cix(t�τp)ciy(t�τr)dt; (4.81)
rIqy(t) =αsin(φ+ωcτp)
2
�
Z T
0cqx(t�τp�τc=2)cqy(t�τr�τc=2)dt; (4.82)
rQqy(t) =αcos(φ+ωcτp)
2
�
Z T
0cqx(t�τp�τc=2)cqy(t�τr�τc=2)dt: (4.83)
The cross correlation of two sequences formed using different Walsh codes (i.e. ciy and cixwhere x 6= y) is also zero, namely
Z T
0cix(t�τi)ciy(t�τk)dt = 0; for any τi; τk and x 6= y;
Z T
0cqx(t�τi)cqy(t�τk)dt = 0; for any τi; τk and x 6= y: (4.84)
This property means that rIiy, rIqy, rQiy and rQqy will only be non-zero when y = x, i.e. theWalsh code used to form rIiy, rIqy, rQiy and rQqy is the same as the transmitted Walsh code.
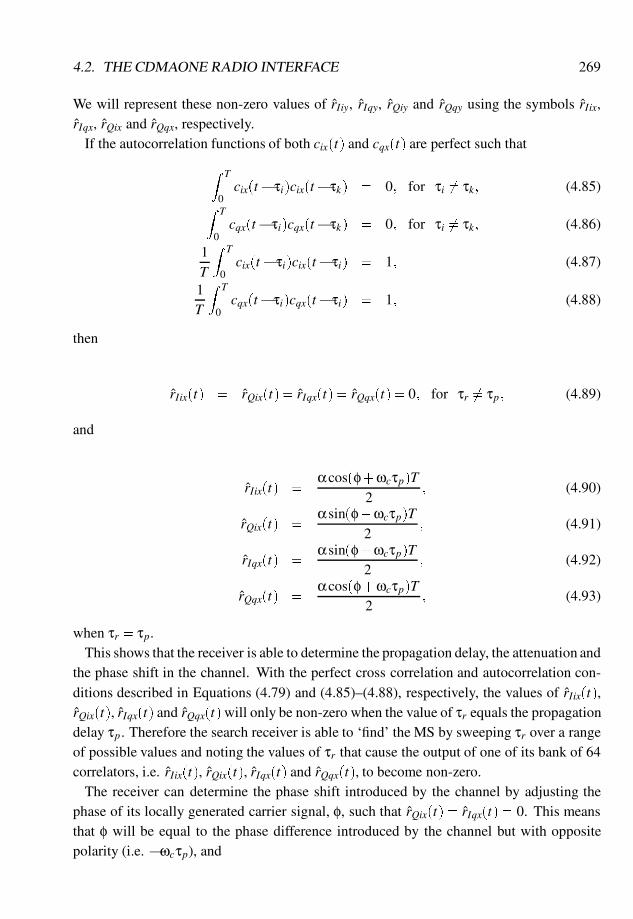
4.2. THE CDMAONE RADIO INTERFACE 269
We will represent these non-zero values of rIiy, rIqy, rQiy and rQqy using the symbols rIix,rIqx, rQix and rQqx, respectively.
If the autocorrelation functions of both cix(t) and cqx(t) are perfect such that
Z T
0cix(t�τi)cix(t�τk) = 0; for τi 6= τk; (4.85)
Z T
0cqx(t�τi)cqx(t�τk) = 0; for τi 6= τk; (4.86)
1T
Z T
0cix(t�τi)cix(t�τi) = 1; (4.87)
1T
Z T
0cqx(t�τi)cqx(t�τi) = 1; (4.88)
then
rIix(t) = rQix(t) = rIqx(t) = rQqx(t) = 0; for τr 6= τp; (4.89)
and
rIix(t) =αcos(φ+ωcτp)T
2; (4.90)
rQix(t) =αsin(φ+ωcτp)T
2; (4.91)
rIqx(t) =αsin(φ+ωcτp)T
2; (4.92)
rQqx(t) =αcos(φ+ωcτp)T
2; (4.93)
when τr = τp.This shows that the receiver is able to determine the propagation delay, the attenuation and
the phase shift in the channel. With the perfect cross correlation and autocorrelation con-ditions described in Equations (4.79) and (4.85)–(4.88), respectively, the values of rIix(t),rQix(t), rIqx(t) and rQqx(t)will only be non-zero when the value of τr equals the propagationdelay τp. Therefore the search receiver is able to ‘find’ the MS by sweeping τr over a rangeof possible values and noting the values of τr that cause the output of one of its bank of 64correlators, i.e. rIix(t), rQix(t), rIqx(t) and rQqx(t), to become non-zero.
The receiver can determine the phase shift introduced by the channel by adjusting thephase of its locally generated carrier signal, φ, such that rQix(t) = rIqx(t) = 0. This meansthat φ will be equal to the phase difference introduced by the channel but with oppositepolarity (i.e. �ωcτp), and
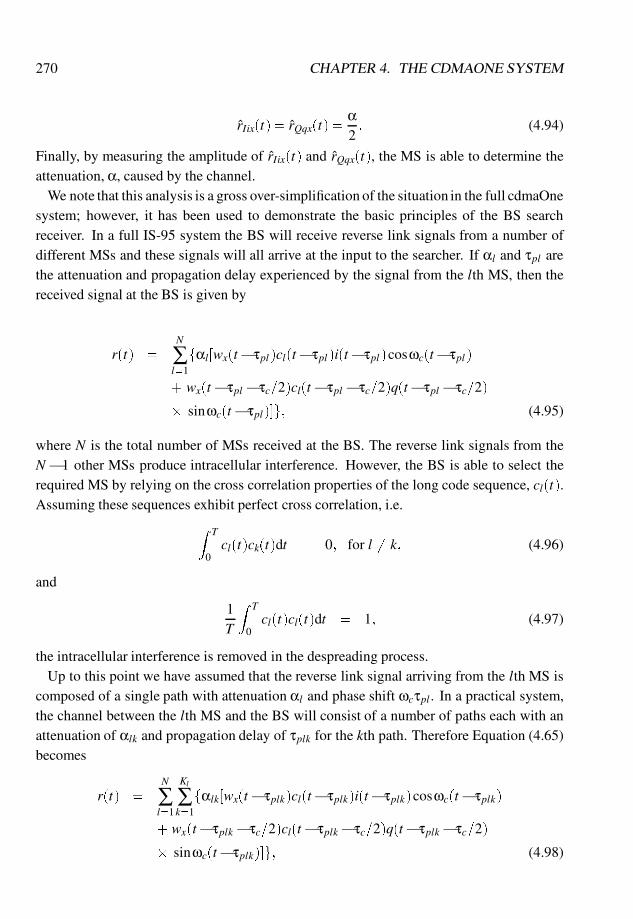
270 CHAPTER 4. THE CDMAONE SYSTEM
rIix(t) = rQqx(t) =α2
: (4.94)
Finally, by measuring the amplitude of rIix(t) and rQqx(t), the MS is able to determine theattenuation, α, caused by the channel.
We note that this analysis is a gross over-simplification of the situation in the full cdmaOnesystem; however, it has been used to demonstrate the basic principles of the BS searchreceiver. In a full IS-95 system the BS will receive reverse link signals from a number ofdifferent MSs and these signals will all arrive at the input to the searcher. If αl and τpl arethe attenuation and propagation delay experienced by the signal from the lth MS, then thereceived signal at the BS is given by
r(t) =N
∑l=1
fαl[wx(t�τpl)cl(t�τpl)i(t�τpl)cosωc(t�τpl)
+ wx(t�τpl �τc=2)cl(t�τpl �τc=2)q(t�τpl �τc=2)
� sinωc(t�τpl)]g; (4.95)
where N is the total number of MSs received at the BS. The reverse link signals from theN� 1 other MSs produce intracellular interference. However, the BS is able to select therequired MS by relying on the cross correlation properties of the long code sequence, cl(t).Assuming these sequences exhibit perfect cross correlation, i.e.
Z T
0cl(t)ck(t)dt = 0; for l 6= k; (4.96)
and
1T
Z T
0cl(t)cl(t)dt = 1; (4.97)
the intracellular interference is removed in the despreading process.Up to this point we have assumed that the reverse link signal arriving from the lth MS is
composed of a single path with attenuation αl and phase shift ωcτpl . In a practical system,the channel between the lth MS and the BS will consist of a number of paths each with anattenuation of αlk and propagation delay of τplk for the kth path. Therefore Equation (4.65)becomes
r(t) =N
∑l=1
Kl
∑k=1
fαlk[wx(t�τplk)cl(t�τplk)i(t�τplk)cosωc(t�τplk)
+ wx(t�τplk�τc=2)cl(t�τplk�τc=2)q(t�τplk�τc=2)
� sinωc(t�τplk)]g; (4.98)
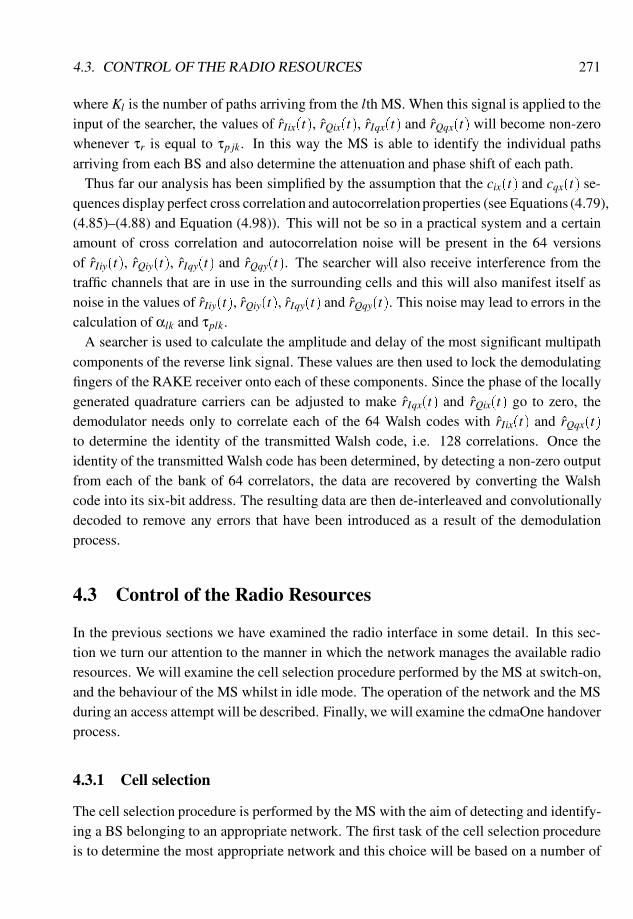
4.3. CONTROL OF THE RADIO RESOURCES 271
where Kl is the number of paths arriving from the lth MS. When this signal is applied to theinput of the searcher, the values of rIix(t), rQix(t), rIqx(t) and rQqx(t) will become non-zerowhenever τr is equal to τp jk. In this way the MS is able to identify the individual pathsarriving from each BS and also determine the attenuation and phase shift of each path.
Thus far our analysis has been simplified by the assumption that the cix(t) and cqx(t) se-quences display perfect cross correlation and autocorrelation properties (see Equations (4.79),(4.85)–(4.88) and Equation (4.98)). This will not be so in a practical system and a certainamount of cross correlation and autocorrelation noise will be present in the 64 versionsof rIiy(t), rQiy(t), rIqy(t) and rQqy(t). The searcher will also receive interference from thetraffic channels that are in use in the surrounding cells and this will also manifest itself asnoise in the values of rIiy(t), rQiy(t), rIqy(t) and rQqy(t). This noise may lead to errors in thecalculation of αlk and τplk.
A searcher is used to calculate the amplitude and delay of the most significant multipathcomponents of the reverse link signal. These values are then used to lock the demodulatingfingers of the RAKE receiver onto each of these components. Since the phase of the locallygenerated quadrature carriers can be adjusted to make rIqx(t) and rQix(t) go to zero, thedemodulator needs only to correlate each of the 64 Walsh codes with rIix(t) and rQqx(t)to determine the identity of the transmitted Walsh code, i.e. 128 correlations. Once theidentity of the transmitted Walsh code has been determined, by detecting a non-zero outputfrom each of the bank of 64 correlators, the data are recovered by converting the Walshcode into its six-bit address. The resulting data are then de-interleaved and convolutionallydecoded to remove any errors that have been introduced as a result of the demodulationprocess.
4.3 Control of the Radio Resources
In the previous sections we have examined the radio interface in some detail. In this sec-tion we turn our attention to the manner in which the network manages the available radioresources. We will examine the cell selection procedure performed by the MS at switch-on,and the behaviour of the MS whilst in idle mode. The operation of the network and the MSduring an access attempt will be described. Finally, we will examine the cdmaOne handoverprocess.
4.3.1 Cell selection
The cell selection procedure is performed by the MS with the aim of detecting and identify-ing a BS belonging to an appropriate network. The first task of the cell selection procedureis to determine the most appropriate network and this choice will be based on a number of
272 CHAPTER 4. THE CDMAONE SYSTEM
user-defined preferences. In the case of the IS-95 system, which is a dual mode standard,the user may choose from analogue and CDMA networks, whereas in the CDMA-PCS sys-tem, the user may only choose from a number of different CDMA networks. Assumingthat a CDMA network is chosen in each case, the MS tunes to the primary CDMA carrierfrequency for the chosen network. This frequency is used at every BS within the networkand the MS must store details of the primary CDMA carrier frequency associated with eachnetwork. Each network also has a secondary CDMA carrier frequency, and although thespecifications do not specifically state the purpose of this channel, it seems reasonable toassume that it may be used as an alternative to the primary channel. Once the CDMA car-rier frequency has been selected for the required network, the MS begins to search for pilotchannels on that frequency. This is achieved by sweeping the search receiver over a rangeof phase offsets as described in Section 4.2.2.6 and noting its output, with a non-zero outputindicating the presence of a pilot signal. If the MS does not ‘find’ a suitable pilot signalwithin 15 s, it returns to the network selection procedure and allows the user to select analternative network.
Once the MS identifies a suitable pilot signal it attempts to demodulate the correspondingsync channel. We note that a pilot channel and its associated sync channel are transmittedwith the same PN offset, and consequently once the MS has identified a suitable pilot sig-nal it automatically knows the PN offset of the sync channel. The MS decodes the syncchannel information by setting its code to WH code 32 (see Figure 4.1). The sync channelcarries a number of different system parameters which are used by the MS to identify andsynchronise with the network. These parameters include:
� The 15-bit system identification (SID) and 16-bit network identification (NID). Theseare used by the MS to identify the different CDMA networks.
� The Pilot PN Sequence Offset Index (PILOT PN) applie for a particular BS. Thisparameter gives the phase of the PNI and PNQ sequences relative to the zero offsetPNI and PNQ sequences which always start on the even second marks of system time.Using its pilot searcher the MS has determined the arrival time of the pilot signal, andknowing the PN offset of this signal, the MS may identify the position of the evensecond marks to the nearest chip.
� System Time (SYS TIME). This parameter gives the system time, in units of 80 ms,for a time of 320 ms minus the PN offset after the end of the last sync channel super-frame (see Figure 4.8). Using the SYS TIME and PILOT PN parameters the MS isable fully to synchronise with the network.
� The Long Code State (LC STATE). As we have already seen, the long code generatorplays an important part in both the reverse link and forward link data paths and the
4.3. CONTROL OF THE RADIO RESOURCES 273
MS uses the LC STATE parameter to synchronise its long code generator with thenetwork.
� The Paging Channel Data Rate (PRAT). The paging channel data rate may be set to4.8 kb/s or 9.6 kb/s and this parameter is used to indicate the rate used.
Once the MS has recovered the information from the sync channel and fully synchronisedwith the network, it enters the idle mode and awaits paging messages from the network.
4.3.2 The idle mode and paging
In the idle mode, the MS must monitor the paging channel of the current BS to detectincoming calls and it must also monitor the pilot channels of surrounding cells to ensurethat the MS is always ‘camped-on’ the most appropriate BS. We also note that, in additionto paging messages, the paging channels also contain network information which the MSmust decode and store. This information is carried in the form of a number of messageswhich include the following:
� The System Parameters Message. This contains general system information, includ-ing the number of paging channels available at the BS, the handover thresholds anda number of registration parameters which allow the MS to identify the location areaand determine whether a location update is required.
� The Access Parameters Message. This carries a number of different parameters re-lating to system access (e.g. NOM PWR, INIT PWR and PWR STEP). We havealready discussed the function of a number of these parameters in Section 4.2.3.1 .
� Neighbour List Message. This message gives details (i.e. the Pilot PN offset) ofthe neighbouring BSs. The MS uses this information to determine the cells that arepossible handover candidates.
� The CDMA Channel List Message. This message lists all the CDMA frequenciesavailable at a BS which support at least one paging channel.
Prior to receiving a System Parameters Message and CDMA Channel List Message, anMS is not aware of the paging channel arrangement at the particular BS and is thereforeunable to determine its own allocated paging channel. For this reason, the MS initiallytunes to the primary paging channel which is always present on Channel 1 (i.e. Walsh codeW1, see Figure 4.1). Once the MS has received the information carried by this channel itis able to determine its allocated paging channel and slot as described in Section 4.2.2.3dealing with the forward link paging channel.
274 CHAPTER 4. THE CDMAONE SYSTEM
Whilst in the idle mode, the MS continually monitors the received signal strength of thepilot channel in neighbouring cells. If the MS detects that a neighbouring BS is strongerthan the current BS, it performs an idle mode handover whereby it will camp-on the newBS.
4.3.3 The access procedure
The access procedure is used by the MS to access the network. It may be triggered bythe network (e.g. by paging the MS) or by the user (e.g. by originating a call). We havealready examined the timing of access messages on the access channel. We now discuss thecontents of these messages and the data flow between the MS and the network.
The access channel may carry a number of different messages which include the follow-ing:
� The Registration Message. This is used to perform a location update which allows thenetwork to track the MS. The message contains the identity of the MS and a field toindicate the reason for the message (e.g. the MS has moved between location areas,or a preset period of time has elapsed since the previous location update).
� The Order Message. A degree of signalling information may be carried between theMS and the network without the need to set up a dedicated signalling link. This typeof information is known as orders and they are carried in the form of order messageson both the forward link paging channel and the reverse link access channel.
� The Origination Message. This message is used to indicate that the user has originateda call. The message contains the identity of the MS and its class mark, details ofthe service that has been requested by the user, and as many of the dialled digits aspossible without exceeding the message capsule size.
� The Page Response Message. This message is used by the MS to respond to a pagingmessage on the forward link paging channel. It contains the MS identity and the MSclass mark.
Once the MS has transmitted a message on the access channel it monitors its assignedpaging channel for a valid response. In general, the MS’s access request will either be ac-cepted or denied and the network’s response will reflect this decision. In the situation wherethe access attempt is accepted the BS will respond with a channel assignment message onthe paging channel. Where access is denied the BS responds with a release order and theMS returns to the idle mode.
The channel assignment message contains full details of the channel that has been allo-cated by the network including the CDMA frequency and the channel number (i.e. W1 to

4.3. CONTROL OF THE RADIO RESOURCES 275
W63). On receiving this message the MS retunes to the new channel and attempts to receivethe null traffic channel frames transmitted by the BS. These frames are transmitted at the1.2 kb/s rate and consist of 16 1s followed by eight 0s (i.e. the encoder tail bits). The MSmust receive at least two consecutive ‘good’ frames within 0.2 s of tuning to the forwardlink traffic channel. If this is achieved, then the MS begins to transmit preamble traffic chan-nel frames on the corresponding reverse link traffic channel. These frames are transmittedat the 9.6 kb/s data rate and they consist of 192 0s. (We note that this applies to the IS-95system and the preamble frame construction may vary for the CDMA-PCS system.)
The BS attempts to acquire the reverse link signal transmitted by the MS and when this hasbeen achieved it transmits a base station acknowledgement order on the forward link trafficchannel. When this message has been received at the MS, the link has been successfullyestablished and the call may be setup. The access procedure is summarised in Figure 4.35for a mobile terminated call.
4.3.4 Handover
The cdmaOne system supports three main types of handover: idle mode handover, softhandover, and hard handover. An idle mode handover occurs when an MS moves from thecoverage area of one BS into the coverage area of a second BS while an MS is in idle mode.The MS determines that an idle mode handover should occur when it detects a sufficientlystrong pilot channel signal from a BS other than from its current BS. A soft handover is usedbetween BSs having CDMA carriers with identical frequency assignments, and the mobilecommunicates simultaneously with these BSs until it is evident that only one BS is required.Hard handovers occur when a mobile is switched between two BSs using different carriers.There is also handover that occurs when a mobile is switched between the IS-95 BS and anAMPS BS. We will focus here on the commonly used soft handover process.
To expedite the handover process, four types of channel sets are defined. The active setcontains those channels that are carrying forward traffic to the MS. During normal operationthere is usually only one channel in the active set. However, during a soft handover whenthe MS is communicating with more than one BS, there will be at least two channels in theactive set. Note that a forward CDMA pilot channel is fully defined by its PN offset indexand its frequency assignment.
The channels that are likely candidates for soft handover are held in the candidate set. Achannel is added to this set if its received pilot power exceeds a threshold value T ADD andit is removed if the power falls below a threshold value T DROP for a fixed period of time,or if the channel is transferred to the active set during the handover process.
The neighbour set contains pilot channel offsets for BSs that are close to the mobile.Initially this set is composed of channels received in a neighbour list message from thecurrent BS. Members are added to the set in a number of circumstances. For example, a

276 CHAPTER 4. THE CDMAONE SYSTEM
Mobile Station Channel Base Station
Paging Channel Send PagingMessage
Send Page ! Access Channel ! Activates Traffic ChannelResponse Message and
Forward link Traffic Begin sending nullChannel Traffic Channel Data
Retune to assigned Paging Channel Send Channel AssignmentTraffic Channel Message
andReceive two consecutive
‘good’ frames
Begin sending the ! Reverse link Traffic! Acquire Reverse linkTraffic Channel Preamble Channel Traffic Channel
Base Station Forward link Traffic Send Base StationAcknowledgement Channel Acknowledgement Order
Order ReceivedSuccessfully
Figure 4.35: Simplified data flow for the access procedure of a mobile terminated call.
neighbour list update message may be received by the MS. Also, if an active set member,i.e. the current BS, becomes inactive due to a handover, then the current BS is now aneighbour and is added to the list. Finally, if the received signal strength of a pilot in thecandidate set falls below T DROP for a given period of time, then it is also added to theneighbour list. All members of the neighbour set are assigned a variable that relates to theirduration in the set. The variable is incremented when a handover occurs, or a neighbour listupdate message is received. Members are dropped from the set when their age has exceededa threshold, or when they become a member of the candidate set as a result of their pilotpower exceeding T ADD.
The final type of channel set is the remaining set. This contains all possible pilot offsetsin use on the current CDMA frequency, excluding those contained in other sets.
Each of the channel sets above has an associated ‘search window’ in which the MS mustsearch for usable multipath components. Details of window size are transmitted as part ofthe system parameters message on the forward link paging channel. The search windowsize may vary from 4 to 452 chips (i.e. 3.3 µs to 368 µs). In the case of the active andcandidate sets, the search window is centred on the earliest arriving usable multipath foreach pilot. For example, if the search window is 40 chips wide, the MS will search for
4.3. CONTROL OF THE RADIO RESOURCES 277
multipath components �20 chips either side of the earliest usable multipath for each pilotin the set. In the case of the neighbour and remaining sets, the search window is centred onthe PN offset of each pilot in the set.
The MS assists in the handover process by measuring the strength of the pilot channels inthe active and candidate sets and reporting these measurements to the network in the formof a pilot strength measurement message on the reverse link traffic channel. The signalstrength of each pilot is computed as the ratio of the received energy per chip, Ec, to thetotal received spectral density (noise and signals), I0. Where a base station has a numberof usable multipath components, the Ec=I0 values are summed for the k best paths, where krepresents the number of demodulating elements at the MS. This value is sent as a six-bitnumber which is given by the integer value of
�2�10� log10Ec
I0: (4.99)
Note that the energy per chip, Ec, is used instead of the energy per bit, Eb, because the pilotchannel does not carry any information bits. The sending of a pilot strength measurementmessage may be triggered by any one of a number of different events including
� if a Pilot Measurement Request Order is received from the BS;
� if the strength of a pilot in either the neighbour set or in the remaining set exceedsT ADD;
� if the strength of a pilot in the candidate set exceeds the strength of a pilot in the activeset by more than T COMP �0.5 dB, where T COMP is a system parameter whichis transmitted as part of the system parameters message on the forward link pagingchannel;
� if the strength of a pilot in the active set falls below T DROP for a predeterminedperiod of time, measured by the handoff drop timer, T TDROP.
4.3.4.1 Soft handover
During a soft handover, the MS maintains simultaneous connections with more than one BS.The MS is allocated a forward link channel at each of the BSs, and the information trans-mitted on each channel is the same (except for the power control bits). The MS performsdiversity combining of the forward link signals by directing its demodulating elements tothe three best forward link paths, regardless of their origin. This is shown graphically inFigure 4.36 where we have shown that the received signal at a particular MS consists ofa number of paths from two different BSs (cell A and cell B). The MS continually scansthe pilot signal of each BS to search for usable multipath components and it always assigns
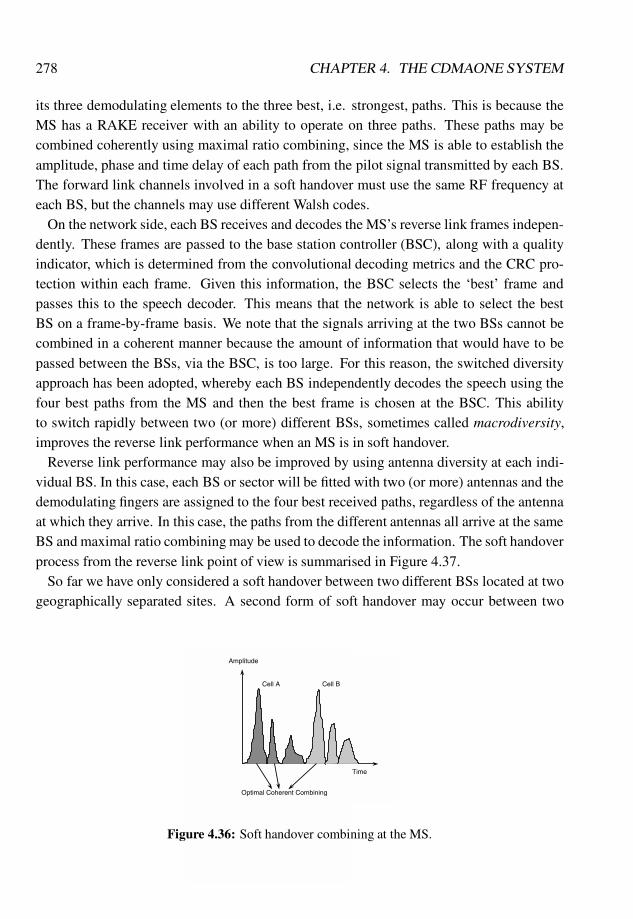
278 CHAPTER 4. THE CDMAONE SYSTEM
its three demodulating elements to the three best, i.e. strongest, paths. This is because theMS has a RAKE receiver with an ability to operate on three paths. These paths may becombined coherently using maximal ratio combining, since the MS is able to establish theamplitude, phase and time delay of each path from the pilot signal transmitted by each BS.The forward link channels involved in a soft handover must use the same RF frequency ateach BS, but the channels may use different Walsh codes.
On the network side, each BS receives and decodes the MS’s reverse link frames indepen-dently. These frames are passed to the base station controller (BSC), along with a qualityindicator, which is determined from the convolutional decoding metrics and the CRC pro-tection within each frame. Given this information, the BSC selects the ‘best’ frame andpasses this to the speech decoder. This means that the network is able to select the bestBS on a frame-by-frame basis. We note that the signals arriving at the two BSs cannot becombined in a coherent manner because the amount of information that would have to bepassed between the BSs, via the BSC, is too large. For this reason, the switched diversityapproach has been adopted, whereby each BS independently decodes the speech using thefour best paths from the MS and then the best frame is chosen at the BSC. This abilityto switch rapidly between two (or more) different BSs, sometimes called macrodiversity,improves the reverse link performance when an MS is in soft handover.
Reverse link performance may also be improved by using antenna diversity at each indi-vidual BS. In this case, each BS or sector will be fitted with two (or more) antennas and thedemodulating fingers are assigned to the four best received paths, regardless of the antennaat which they arrive. In this case, the paths from the different antennas all arrive at the sameBS and maximal ratio combining may be used to decode the information. The soft handoverprocess from the reverse link point of view is summarised in Figure 4.37.
So far we have only considered a soft handover between two different BSs located at twogeographically separated sites. A second form of soft handover may occur between two
Cell A Cell B
Time
Amplitude
Optimal Coherent Combining
Figure 4.36: Soft handover combining at the MS.
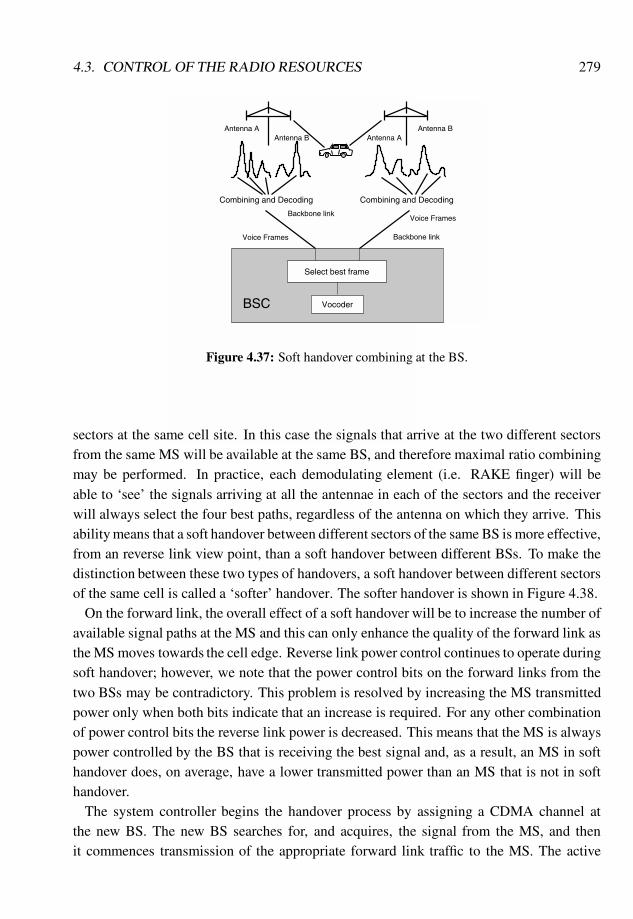
4.3. CONTROL OF THE RADIO RESOURCES 279
Select best frame
VocoderBSC
Combining and Decoding Combining and Decoding
Backbone linkVoice Frames
Backbone linkVoice Frames
Antenna AAntenna B Antenna A
Antenna B
Figure 4.37: Soft handover combining at the BS.
sectors at the same cell site. In this case the signals that arrive at the two different sectorsfrom the same MS will be available at the same BS, and therefore maximal ratio combiningmay be performed. In practice, each demodulating element (i.e. RAKE finger) will beable to ‘see’ the signals arriving at all the antennae in each of the sectors and the receiverwill always select the four best paths, regardless of the antenna on which they arrive. Thisability means that a soft handover between different sectors of the same BS is more effective,from an reverse link view point, than a soft handover between different BSs. To make thedistinction between these two types of handovers, a soft handover between different sectorsof the same cell is called a ‘softer’ handover. The softer handover is shown in Figure 4.38.
On the forward link, the overall effect of a soft handover will be to increase the number ofavailable signal paths at the MS and this can only enhance the quality of the forward link asthe MS moves towards the cell edge. Reverse link power control continues to operate duringsoft handover; however, we note that the power control bits on the forward links from thetwo BSs may be contradictory. This problem is resolved by increasing the MS transmittedpower only when both bits indicate that an increase is required. For any other combinationof power control bits the reverse link power is decreased. This means that the MS is alwayspower controlled by the BS that is receiving the best signal and, as a result, an MS in softhandover does, on average, have a lower transmitted power than an MS that is not in softhandover.
The system controller begins the handover process by assigning a CDMA channel atthe new BS. The new BS searches for, and acquires, the signal from the MS, and thenit commences transmission of the appropriate forward link traffic to the MS. The active
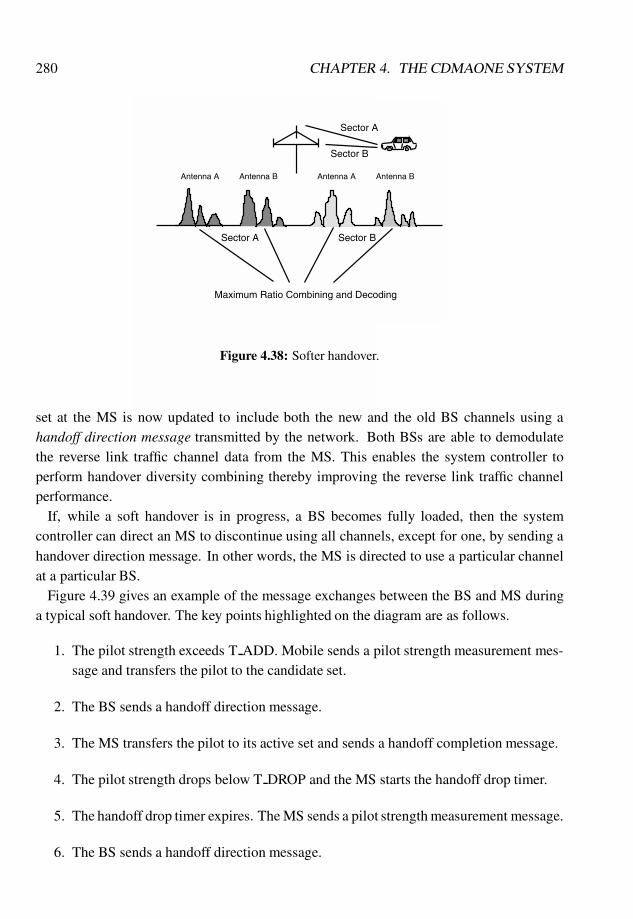
280 CHAPTER 4. THE CDMAONE SYSTEM
Maximum Ratio Combining and Decoding
Antenna A Antenna B Antenna A Antenna B
Sector A
Sector B
Sector BSector A
Figure 4.38: Softer handover.
set at the MS is now updated to include both the new and the old BS channels using ahandoff direction message transmitted by the network. Both BSs are able to demodulatethe reverse link traffic channel data from the MS. This enables the system controller toperform handover diversity combining thereby improving the reverse link traffic channelperformance.
If, while a soft handover is in progress, a BS becomes fully loaded, then the systemcontroller can direct an MS to discontinue using all channels, except for one, by sending ahandover direction message. In other words, the MS is directed to use a particular channelat a particular BS.
Figure 4.39 gives an example of the message exchanges between the BS and MS duringa typical soft handover. The key points highlighted on the diagram are as follows.
1. The pilot strength exceeds T ADD. Mobile sends a pilot strength measurement mes-sage and transfers the pilot to the candidate set.
2. The BS sends a handoff direction message.
3. The MS transfers the pilot to its active set and sends a handoff completion message.
4. The pilot strength drops below T DROP and the MS starts the handoff drop timer.
5. The handoff drop timer expires. The MS sends a pilot strength measurement message.
6. The BS sends a handoff direction message.
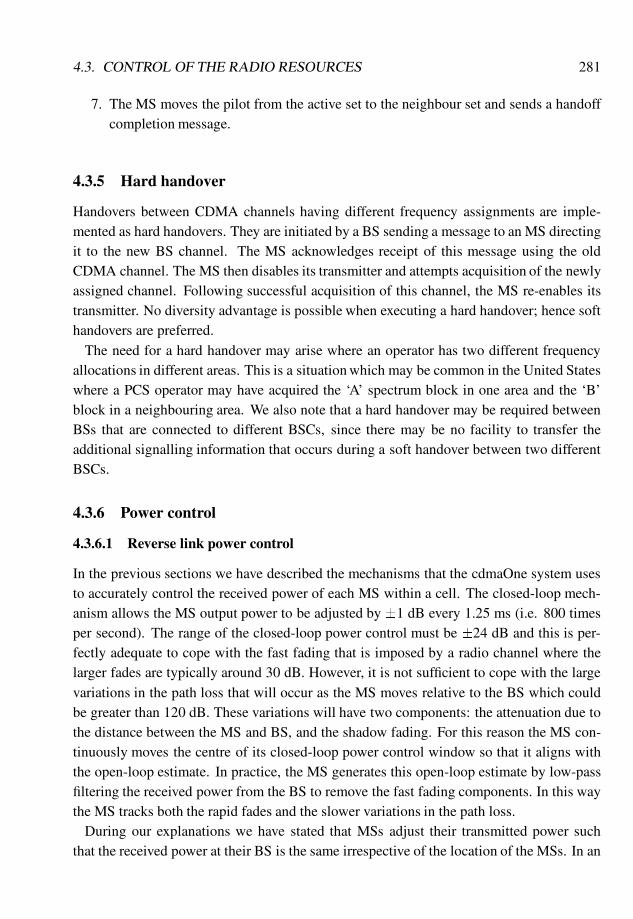
4.3. CONTROL OF THE RADIO RESOURCES 281
7. The MS moves the pilot from the active set to the neighbour set and sends a handoffcompletion message.
4.3.5 Hard handover
Handovers between CDMA channels having different frequency assignments are imple-mented as hard handovers. They are initiated by a BS sending a message to an MS directingit to the new BS channel. The MS acknowledges receipt of this message using the oldCDMA channel. The MS then disables its transmitter and attempts acquisition of the newlyassigned channel. Following successful acquisition of this channel, the MS re-enables itstransmitter. No diversity advantage is possible when executing a hard handover; hence softhandovers are preferred.
The need for a hard handover may arise where an operator has two different frequencyallocations in different areas. This is a situation which may be common in the United Stateswhere a PCS operator may have acquired the ‘A’ spectrum block in one area and the ‘B’block in a neighbouring area. We also note that a hard handover may be required betweenBSs that are connected to different BSCs, since there may be no facility to transfer theadditional signalling information that occurs during a soft handover between two differentBSCs.
4.3.6 Power control
4.3.6.1 Reverse link power control
In the previous sections we have described the mechanisms that the cdmaOne system usesto accurately control the received power of each MS within a cell. The closed-loop mech-anism allows the MS output power to be adjusted by �1 dB every 1.25 ms (i.e. 800 timesper second). The range of the closed-loop power control must be �24 dB and this is per-fectly adequate to cope with the fast fading that is imposed by a radio channel where thelarger fades are typically around 30 dB. However, it is not sufficient to cope with the largevariations in the path loss that will occur as the MS moves relative to the BS which couldbe greater than 120 dB. These variations will have two components: the attenuation due tothe distance between the MS and BS, and the shadow fading. For this reason the MS con-tinuously moves the centre of its closed-loop power control window so that it aligns withthe open-loop estimate. In practice, the MS generates this open-loop estimate by low-passfiltering the received power from the BS to remove the fast fading components. In this waythe MS tracks both the rapid fades and the slower variations in the path loss.
During our explanations we have stated that MSs adjust their transmitted power suchthat the received power at their BS is the same irrespective of the location of the MSs. In an
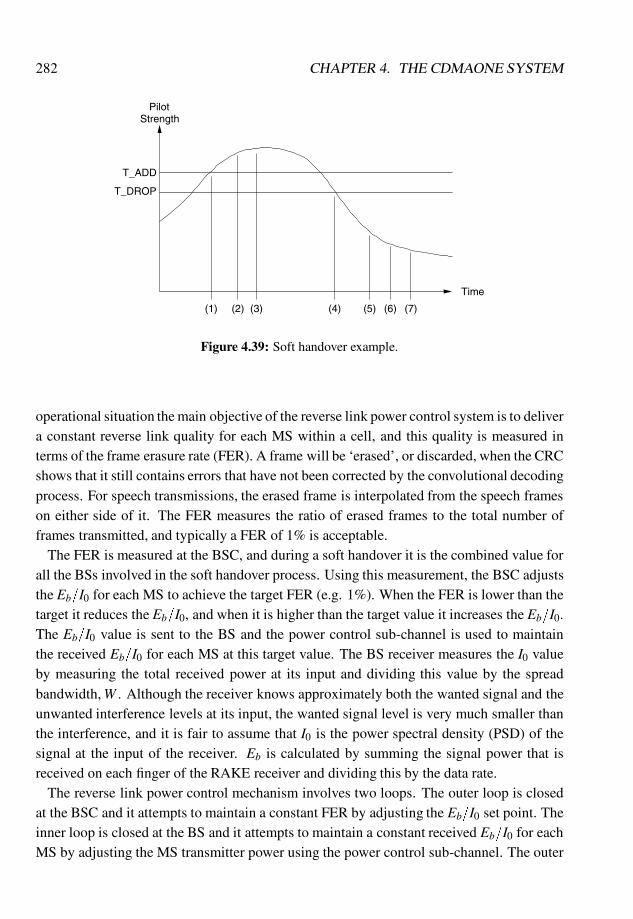
282 CHAPTER 4. THE CDMAONE SYSTEM
PilotStrength
Time
(1) (2) (3) (4) (5) (6) (7)
T_ADD
T_DROP
Figure 4.39: Soft handover example.
operational situation the main objective of the reverse link power control system is to delivera constant reverse link quality for each MS within a cell, and this quality is measured interms of the frame erasure rate (FER). A frame will be ‘erased’, or discarded, when the CRCshows that it still contains errors that have not been corrected by the convolutional decodingprocess. For speech transmissions, the erased frame is interpolated from the speech frameson either side of it. The FER measures the ratio of erased frames to the total number offrames transmitted, and typically a FER of 1% is acceptable.
The FER is measured at the BSC, and during a soft handover it is the combined value forall the BSs involved in the soft handover process. Using this measurement, the BSC adjuststhe Eb=I0 for each MS to achieve the target FER (e.g. 1%). When the FER is lower than thetarget it reduces the Eb=I0, and when it is higher than the target value it increases the Eb=I0.The Eb=I0 value is sent to the BS and the power control sub-channel is used to maintainthe received Eb=I0 for each MS at this target value. The BS receiver measures the I0 valueby measuring the total received power at its input and dividing this value by the spreadbandwidth,W . Although the receiver knows approximately both the wanted signal and theunwanted interference levels at its input, the wanted signal level is very much smaller thanthe interference, and it is fair to assume that I0 is the power spectral density (PSD) of thesignal at the input of the receiver. Eb is calculated by summing the signal power that isreceived on each finger of the RAKE receiver and dividing this by the data rate.
The reverse link power control mechanism involves two loops. The outer loop is closedat the BSC and it attempts to maintain a constant FER by adjusting the Eb=I0 set point. Theinner loop is closed at the BS and it attempts to maintain a constant received Eb=I0 for eachMS by adjusting the MS transmitter power using the power control sub-channel. The outer
4.3. CONTROL OF THE RADIO RESOURCES 283
loop will have a much larger time constant than the inner loop.Within a cdmaOne system, each MS has its own target Eb=I0 which will vary according to
its location and speed. For example, a stationary or slow moving MS is likely to have a verylow target Eb=I0, since its channel will be changing very slowly and the search receiver andpower control system are able to track these changes. As the MS speed increases, the targetEb=I0 increases as the receiver and power control mechanism are less able to track the morerapid changes in the channel, and this leads to bursts of errors as the MS moves throughfades. At slow MS speeds these error bursts will be relatively long, i.e. longer than theinterleaving depth of 20 ms and they are likely to overload the error correction processes atthe receiver. As the MS speed increases further the length of the error bursts reduces, sincethe MS moves through the fades more rapidly. Where the error bursts are relatively short,compared with the interleaving depth, the error correction processes at the receiver will bemore effective and this will result in a reduction in the target Eb=I0. Reference [5] includesa graph of the target Eb=I0 versus MS speed for an operating frequency of 850 MHz andan FER of 1%. This shows that the Eb=I0 value reaches a peak of around 6dB at around60 km/h. It also shows that the required Eb=I0 is around 3 dB for stationary MSs and around5 dB for a MS speed of 200 km/h. The power control mechanism will also tend to reducethe target Eb=I0 for an MS in a soft handover, since the use of two BSs will result in thesystem being able to achieve the required FER at a lower Eb=I0.
4.3.6.2 Forward link power control
In a single cell CDMA system there would be no requirement for forward link power con-trol. However, in a practical system consisting of a number of cells, the forward link per-formance is improved by transmitting more power to MSs at a cell edge, since these areexperiencing more interference from the neighbouring cell sites. The forward link powerfor a particular MS is adjusted in steps of around 0.5 dB once every 15–20 ms and the totaldynamic range is limited to around �6 dB [8]. The forward link power control mechanismis a closed-loop process whereby the BS periodically reduces the power that is transmittedto each subscriber. This process continues until the FER at the MS exceeds an acceptablelevel and triggers a request for an increase in the forward link power from the MS. At thispoint the BS increases the power that is allocated to the particular MS until the requests foradditional power cease.

Bibliography
[1] TIA/EIA/IS-95, Mobile Station – Base Station Compatibility Standard for Dual-ModeWideband Spread Spectrum Cellular System, July 1993.
[2] JTC(AIR)/94.08.01-022R2, PN-3384, Personal Station – Base Station CompatibilityRequirements for 1.8 to 2.0 GHz Code Division Multiple Access (CDMA) PersonalCommunications Systems, 1 Aug. 1994.
[3] Viterbi A.J., CDMA – Principles of Spread SpectrumCommunication, Addison-Wesley,1995.
[4] Steele R. (Ed.), Mobile Radio Communications, Pentech Press, 1992.
[5] Padovani R., Reverse link performance of IS-95 based cellular systems, IEEE Pers.Commun., Third Quarter 1994, 28–34.
[6] Price R. and P.E. Green Jr, A communication technique for multipath channels, Proc.IRE, 46, Mar. 1958, 555–570.
[7] Proakis J.G., Digital Communications, McGraw-Hill, 1989.
[8] Qualcomm Inc., An Overview of the Application of Code Division Multiple Access(CDMA) to Digital Cellular Systems and Personal Cellular Networks, Qualcomm Inc.Doc. No. EX60-10010, 21 May 1992.
284
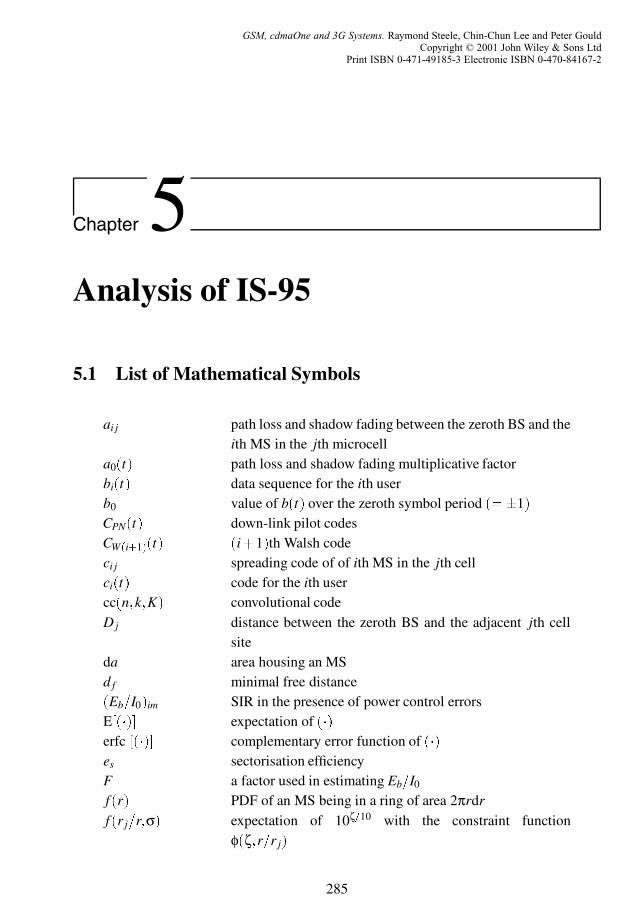
Chapter 5Analysis of IS-95
5.1 List of Mathematical Symbols
ai j path loss and shadow fading between the zeroth BS and theith MS in the jth microcell
a0(t) path loss and shadow fading multiplicative factorbi(t) data sequence for the ith userb0 value of b(t) over the zeroth symbol period (=�1)CPN(t) down-link pilot codesCW (i+1)(t) (i+1)th Walsh codeci j spreading code of of ith MS in the jth cellci(t) code for the ith usercc(n;k;K) convolutional codeDj distance between the zeroth BS and the adjacent jth cell
siteda area housing an MSd f minimal free distance(Eb=I0)im SIR in the presence of power control errorsE[(�)] expectation of (�)erfc [(�)] complementary error function of (�)es sectorisation efficiencyF a factor used in estimating Eb=I0f (r) PDF of an MS being in a ring of area 2πrdrf (r j=r;σ) expectation of 10ζ=10 with the constraint function
φ(ζ;r=r j)
285
GSM, cdmaOne and 3G Systems. Raymond Steele, Chin-Chun Lee and Peter GouldCopyright © 2001 John Wiley & Sons Ltd
Print ISBN 0-471-49185-3 Electronic ISBN 0-470-84167-2
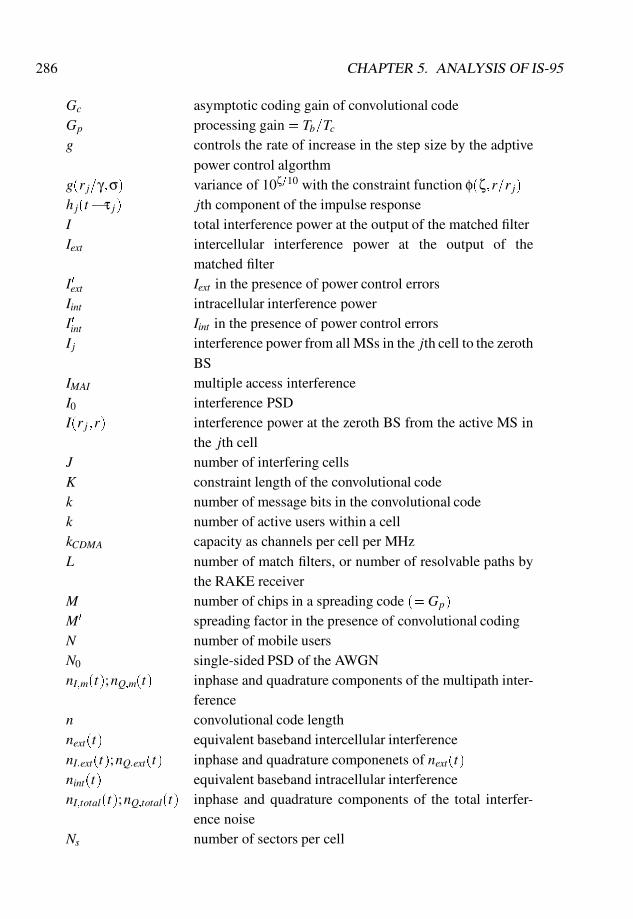
286 CHAPTER 5. ANALYSIS OF IS-95
Gc asymptotic coding gain of convolutional codeGp processing gain = Tb=Tcg controls the rate of increase in the step size by the adptive
power control algorthmg(r j=γ;σ) variance of 10ζ=10 with the constraint function φ(ζ;r=r j)h j(t�τ j) jth component of the impulse responseI total interference power at the output of the matched filterIext intercellular interference power at the output of the
matched filterI0
ext Iext in the presence of power control errorsIint intracellular interference powerI0
int Iint in the presence of power control errorsI j interference power from all MSs in the jth cell to the zeroth
BSIMAI multiple access interferenceI0 interference PSDI(r j;r) interference power at the zeroth BS from the active MS in
the jth cellJ number of interfering cellsK constraint length of the convolutional codek number of message bits in the convolutional codek number of active users within a cellkCDMA capacity as channels per cell per MHzL number of match filters, or number of resolvable paths by
the RAKE receiverM number of chips in a spreading code (= Gp)
M0 spreading factor in the presence of convolutional codingN number of mobile usersN0 single-sided PSD of the AWGNnI;m(t);nQ;m(t) inphase and quadrature components of the multipath inter-
ferencen convolutional code lengthnext(t) equivalent baseband intercellular interferencenI;ext(t);nQ;ext(t) inphase and quadrature componenets of next(t)nint(t) equivalent baseband intracellular interferencenI;total(t);nQ;total(t) inphase and quadrature components of the total interfer-
ence noiseNs number of sectors per cell
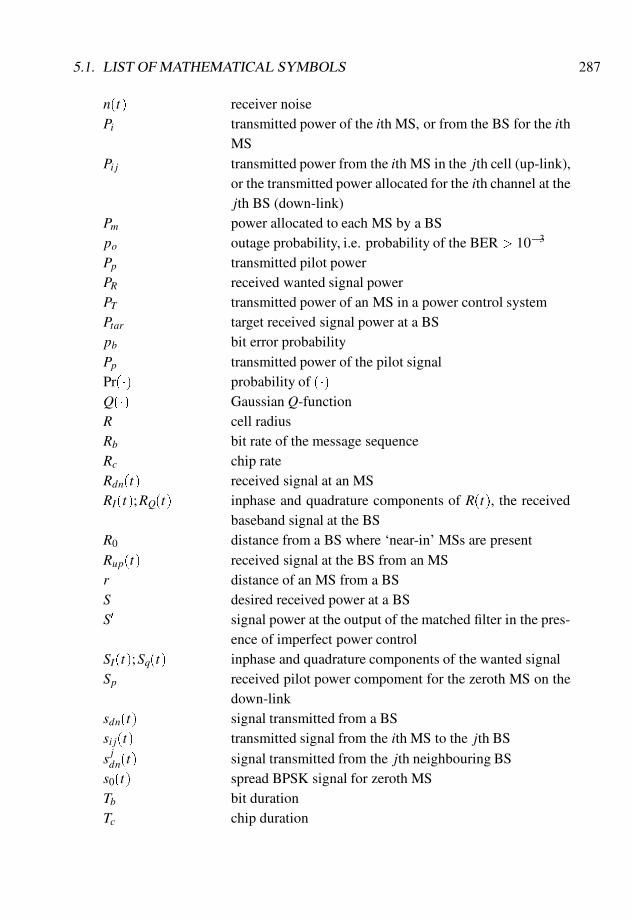
5.1. LIST OF MATHEMATICAL SYMBOLS 287
n(t) receiver noisePi transmitted power of the ith MS, or from the BS for the ith
MSPi j transmitted power from the ith MS in the jth cell (up-link),
or the transmitted power allocated for the ith channel at thejth BS (down-link)
Pm power allocated to each MS by a BSpo outage probability, i.e. probability of the BER > 10�3
Pp transmitted pilot powerPR received wanted signal powerPT transmitted power of an MS in a power control systemPtar target received signal power at a BSpb bit error probabilityPp transmitted power of the pilot signalPr(�) probability of (�)
Q(�) Gaussian Q-functionR cell radiusRb bit rate of the message sequenceRc chip rateRdn(t) received signal at an MSRI(t);RQ(t) inphase and quadrature components of R(t), the received
baseband signal at the BSR0 distance from a BS where ‘near-in’ MSs are presentRup(t) received signal at the BS from an MSr distance of an MS from a BSS desired received power at a BSS0 signal power at the output of the matched filter in the pres-
ence of imperfect power controlSI(t);Sq(t) inphase and quadrature components of the wanted signalSp received pilot power compoment for the zeroth MS on the
down-linksdn(t) signal transmitted from a BSsi j(t) transmitted signal from the ith MS to the jth BS
s jdn(t) signal transmitted from the jth neighbouring BSs0(t) spread BPSK signal for zeroth MSTb bit durationTc chip duration

288 CHAPTER 5. ANALYSIS OF IS-95
W chip rate and bandwidth of the CDMA signal, also thewidth of a street in a street microcell
X distance from a street microcellualr BS to the end of themicrocell
Xb a break distance in a street microcell where the propagationpath loss exponent changes
xi j(t) transmitted baseband signal from the ith MS to the jth BSZext(Tb) intercellular interference component of Z(Tb)Zint(Tb) intracellular interference at the output of the matched filterZn(Tb) receiver noise at the output of the matched filterZ(Tb) output of the matched filter at time t = TbZw(Tb) wanted component of Z(Tb)βd coefficient of the transfer function T (D;H) of the convolu-
tional codeβl magnitude of the lth path of the fast fading channel impulse
responseL
exclusive-OR operationV
system parameter in the power control algorithmδi normally distributed received error power random variable
at a BS for MSiδi j power control error for the ith MS in the jth cellδ(t�u) delta function at time uη AWGN power at the output of the matched filterγb Eb=I0, or energy per bit per interference PSDγc Ec=I0, or energy per symbol per interference PSDγreq required (Eb=Io) for BER < 10�3
λi j normally distributed random variable with standard devia-tion σ and zero mean
µ voice activity factor (VAF)νi voice activity variable of the ith userνi j voice activity variable of the ith user in the jth cellω2 down-link angular carrier frequencyω1 up-link angular carrier frequencyΦ fixed step size used in power control algorithmφi j carrier phase between the interference signal from the ith
MS in the jth cell and the zeroth MS in the zeroth cellφ0 carrier phase difference θ0� θφ(ζ; r
r j) constraint function

5.2. INTRODUCTION 289
ρ density of MSs in a cellσε standard deviation of εσe standard deviation of δiτi random delay of the ith user signal at the BS on the up-link,
or the random offset at the BS on the down-linkτi j relative propagation delays of the ith MS in the jth cell
with respect to the zeroth MS in the zeroth cellτp time offset of the pilot signal at the BSθ received carrier phase angle at the BS, or the transmitted
phase angle of the carrier at the BSθi random phase angle of the trnsmitted ith mobile carrierθi change in the phase angle of the ith MS = ω1(τ0�τi)+θi
θi j carrier phase of ith MS in the jth cellθ0 overlapping angle of adjacent sectors4i adaptive step size used in the power control algorithmvar[(�)] variance of (�)ε δ j�δ0 random variable having a normal distributionξ error in estimating PR in the power controlζ λi j�λ0
5.2 Introduction
In CDMA many mobiles use the same RF bandwidth at the same time, and a CDMA re-ceiver is able to separate the wanted signal from the other mobile signals if it knows thespreading code used in the generation of the wanted CDMA signal. This demodulationprocess occurs in the presence of interference generated by other mobile users. This inter-ference is a major limitation on the capacity of a CDMA system.
In this chapter the capacity of a CDMA system in tessellated hexagonal cells and citystreet microcells is investigated. The system performance in terms of outage probabilityfor a bit error rate (BER) larger than a minimal required level is analysed. The numberof users that can be supported by a cell for a given outage probability is evaluated. Thecorresponding capacity in terms of channels per cell per MHz is calculated according to thisnumber of users per cell. Our discussion concentrates on the capacity evaluation rather thanon other issues, such as code synchronisation. We begin by examining a single cell CDMAsystem before moving on to a multiple cell CDMA system. Since the arrangement of theup-link, or forward link, is different from the down-link, or reverse link, the performancesof both the up-link and down-link are considered. The effect of sectorisation and channelcoding on CDMA systems is also discussed.
290 CHAPTER 5. ANALYSIS OF IS-95
5.3 CDMA in a Single Macrocell
Consider a single cell CDMA communication system using binary phase shift keying (BPSK)spread spectrum modulation. As shown in Figure 5.1, the BS uses the angular carrier fre-quency ω2 on the down-link to communicate with all its mobiles, while mobiles transmit totheir base stations (BSs) via the angular carrier frequency ω1.
5.3.1 The up-link system
The CDMA single cell system consists of N mobile users transmitting to a BS receiver onthe up-link. We consider a simplified mobile transmitter consisting of a BPSK modulator,formed by multiplying the data sequence for the ith user bi(t), by a carrier cosω1t. Spread-ing occurs when the BPSK signal is multiplied by the code ci(t). This is equivalent tomultiplying the data signal, bi(t), by ci(t) and this spread data signal modulates the carriercosω1t. Figure 5.2 shows the arrangement.
Let us consider a particular user, say the zeroth one. The spread BPSK signal s0(t) isapplied to the radio channel shown in Figure 5.3. We have separated this channel into a partthat allows for path loss and slow fading and is represented by the multiplicative factor a0.The fast fading is represented by a number of impulse responses h j(t� τ j); j= 0;1; : : :;L.The input of the receiver consists of: interference from the other users in the cell and isknown as intracellular interference; the receiver noise n(t); and the received signal for thezeroth user. The sum of these signals, Rup(t), is demodulated by multiplying by a recoveredcarrier having the same frequency but different phase, relative to the transmitted carrier.
The resulting signal is applied to a RAKE receiver that may be considered to be composedof L matched filters, one for each significant path in the impulse response of the channel.We note that in general the number of matched filters and the number of channels will notbe the same, but it is desirable if there are at least as many matched filters as there aresignificant paths in the channel. The RAKE receiver is a maximum ratio diversity systemif it can obtain accurate estimates of the complex impulse responses h j(t�τ j). The RAKEreceiver is described in Section 2.3.2.6.
A CDMA system has other attributes to combat the effects of fast fading on the signals0(t). These include symbol interleaving, forward error correction (FEC) coding, spacediversity reception, power control, and so forth. Using this battery of techniques we caneffectively compensate for the effects of fast fading. The channel model is now reduced tothe multiplicative factor a0 which accounts for path loss and slow fading. The BS receivermay now be configured for our analysis as one having despreading followed by a matchedfilter, i.e. single stage RAKE, which is an integrator and dump circuit for each mobile. Oursimplified model of the radio channel and the BS receiver is depicted in Figure 5.4.
Each user has a unique spreading code that is known to the BS. The spreading codes are

5.3. CDMA IN A SINGLE MACROCELL 291
ω1
ω2
ω1
ω1
ω2
ω2
BS
ω1
Figure 5.1: Single cell mobile radio communications in a hexagonal cell.
ci(t)
spreader modulator
spreading codegenerator
carriergenerator
i-th userbi(t) si(t)
cos(ω1t+θi)2Pi
Figure 5.2: A mobile’s CDMA transmitter diagram.
of length M chips, or an M-chip segment from the long psuedo noise (PN) sequence [1,2].As the mobiles are in different locations within the cell, the transmission delay for eachmobile is different. The signal transmitted from the ith user to its BS is
si(t) =p
2Pibi(t)ci(t)cos(ω1t + θi); (5.1)
where Pi is the transmitted power of the ith user, bi(t) is the data sequence of the ith userwhere each bit has an amplitude of �1 and a duration of Tb, ci(t) is the spreading codesequence of ith user and each of the M chips per code has a duration Tc, and θi is the randomphase of the ith mobile carrier and is uniformly distributed in [0;2π). All the mobilestransmit their signals to the BS receiver over the same radio channel, and the received signalat the BS receiver is
Rup(t) =N�1
∑i=0
aisi(t � τi) + n(t)
=N�1
∑i=0
aip
2Pibi(t � τi)ci(t � τi)cos [ω1(t � τi) + θi]
+ n(t); (5.2)
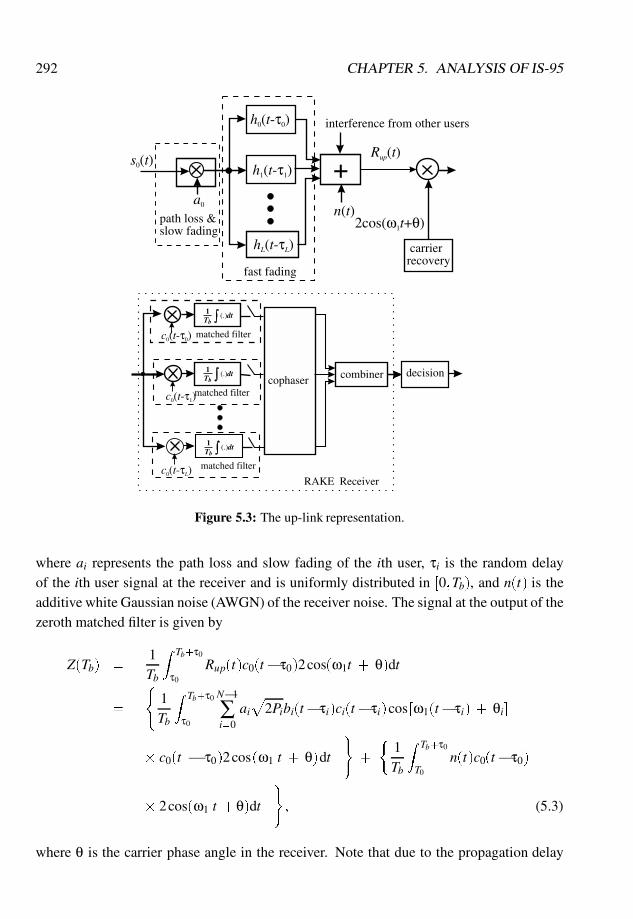
292 CHAPTER 5. ANALYSIS OF IS-95
Tb
1(.)dt
Tb
1(.)dt
Tb
1(.)dt
c0(t-τ1)
c0(t-τL)
c0(t-τ0)
h0(t-τ0)
fast fading
n(t)a0
s0(t)Rup(t)
hL(t-τL)
interference from other users
2cos(ω1t+θ)path loss &slow fading
carrier recovery
decision
matched filter
combiner
matched filter
matched filter
RAKE Receiver
cophaser
h1(t-τ1) +
Figure 5.3: The up-link representation.
where ai represents the path loss and slow fading of the ith user, τi is the random delayof the ith user signal at the receiver and is uniformly distributed in [0;Tb), and n(t) is theadditive white Gaussian noise (AWGN) of the receiver noise. The signal at the output of thezeroth matched filter is given by
Z(Tb) =1Tb
Z Tb+τ0
τ0
Rup(t)c0(t�τ0)2cos(ω1t + θ)dt
=
(1Tb
Z Tb+τ0
τ0
N�1
∑i=0
aip
2Pibi(t�τi)ci(t�τi)cos [ω1(t�τi) + θi]
� c0(t � τ0)2cos(ω1 t + θ)dt
)+
�1Tb
Z Tb+τ0
T0
n(t)c0(t�τ0)
� 2cos(ω1 t +θ)dt
); (5.3)
where θ is the carrier phase angle in the receiver. Note that due to the propagation delay
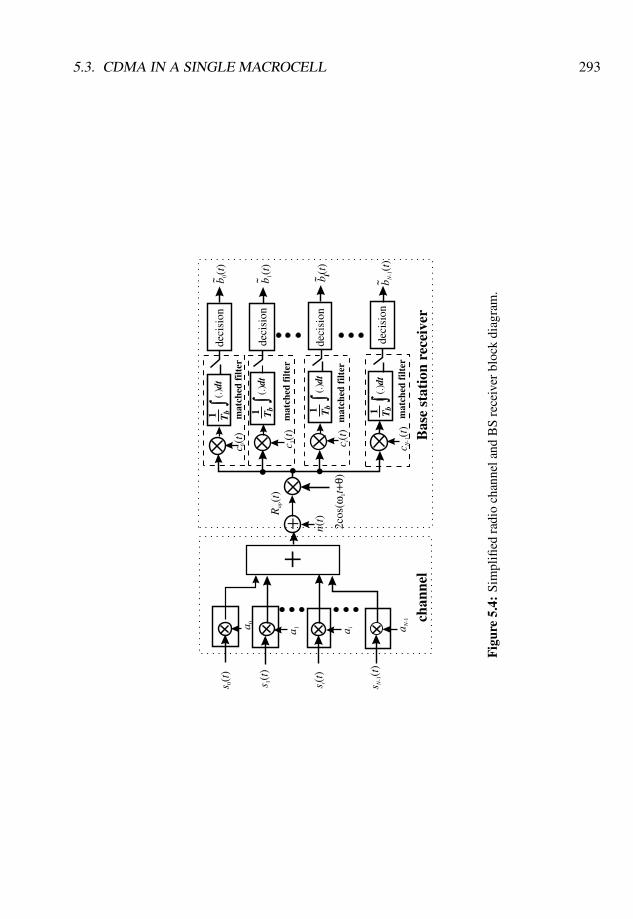
5.3. CDMA IN A SINGLE MACROCELL 293
Tb1
(.)d
t
Tb1
(.)d
t
Tb1
(.)d
t
a N-1
+n(t)
chan
nel
Rup(t
)
c i(t
)
c 0(t
)
c 1(t
)
deci
sion
deci
sion
deci
sion
b N-1(t
)
ib i(t
)
b 1(t
)
2cos
(ω1t+
θ)
Bas
e st
atio
n re
ceiv
er
deci
sion
b 0(t
)s 0
(t)
s 1(t
)
s i(t)
s N-1(t
)
a 0 a 1 a i
c N-1(t
)
mat
ched
filt
er
mat
ched
filt
er
mat
ched
filt
er
mat
ched
filt
er
+
Tb1
(.)d
t
Fig
ure
5.4:
Sim
plifi
edra
dio
chan
nela
ndB
Sre
ceiv
erbl
ock
diag
ram
.

294 CHAPTER 5. ANALYSIS OF IS-95
of the radio path associated with the zeroth user, the integration is done from t = τ0 tot = τ0 + Tb. Letting t = t +τ0 in Equation (5.3), we have
Z(Tb) =
(1Tb
Z Tb
0
N�1
∑i=0
aip
2Pibi(t + τ0 � τi) ci(t + τ0 � τi)
� cos(ω1t + θi)
� c0(t)2cos(ω1t + θ)dt
)+
�1Tb
Z Tb
0n(t + τ0) c0(t)
� 2cos(ω1t + θ)dt
); (5.4)
where θ = ω1 τ0 + θ and θi = ω1(τ0 � τi) + θi are the changes in the phase angle of θand θi, respectively. We define a relative time delay for the N� 1 users with respect to thezeroth user of τi0 = τi � τ0, and on substituting into Equation (5.4) we have
Z(Tb) =
(1Tb
Z Tb
0
N�1
∑i=0
aip
2Pibi (t � τio) ci (t � τi0)cos(ω1t + θi)
� c0(t)2cos(ω1t + θ) dt
)+
�1Tb
Z Tb
0n(t + τ0) c0(t)
� 2cos(ω1t + θ) dt
): (5.5)
Owing to the stationary property of the AWGN, n(t + τ0) in the above equation can besubstituted by n(t), and Equation (5.5) can be rewritten as
Z(Tb) =
(1Tb
Z Tb
0
N�1
∑i=0
aip
2Pibi (t � τi0) ci (t � τi0) cos(ω1t + θi)
� c0(t)2cos(ω1t+ θ) dt
)
+1Tb
Z Tb
0n(t)c0(t)2cos(ω1t+ θ)dt: (5.6)
Assuming the receiver is chip synchronised to the zeroth mobile, then for the zeroth mobile,ci(t� τi0) becomes c0(t) and from Equation (5.6) ci(t � τi0) for i= 0, multiplied by c0(t)
yields unity, and therefore the wanted component of Z(Tb) is
Zw(Tb) =1Tb
Z Tb
0a0
p2P0b0(t)
�cosφ0 + cos(2ω1t+ θ0 + θ)
�dt
5.3. CDMA IN A SINGLE MACROCELL 295
= a0
p2P0b0 cosφ0 (5.7)
since the average of a cosine wave over many periods is zero, b0 is the value of b(t) over asymbol period having values of +1 or �1, and φ0 = θ0 � θ. Note that the term Zw(Tb)contains the original data sequence b0 scaled by a0
p2P0 cosφ0.
The intracellular interference at the output of the matched filter is
Zint(Tb) =N�1
∑i=1
1Tb
Z Tb
0aip
2Pibi(t�τi0)ci(t�τi0)c0(t)
��
cos(φi)+cos[2ω1t+ θ+ θi]
dt (5.8)
and since the term involving cos2ω1t is averaged to zero,
Zint(Tb) =N�1
∑i=1
1Tb
Z Tb
0aip
2Pibi(t�τi0)ci(t�τi0)c0(t)cosφidt; (5.9)
where
φi = θi� θ: (5.10)
We may express Zint(Tb) as
Zint(Tb) =1Tb
Z Tb
0nint(t)c0(t); (5.11)
where
nint(t) =N�1
∑i=1
aip
2Pibi(t�τi0)ci(t�τi0)cosφi (5.12)
is the equivalent baseband intracellular interference. The receiver noise term is, from Equa-tion (5.6),
Zn(Tb) =2Tb
Z Tb
0n(t)c0(t)cos(ω1t+ θ)dt: (5.13)
Let us consider the intracellular interference shown in Equation (5.12) that comes from theother N� 1 users. We are cognisant that ci(t � τi0) are the independent spreading codesfor different users and that the relative time offset of the data transmitted from each mobileis a random variable, i.e. τi0 is an independent random variable that is uniformly distributedover [0;Tb). We further assume that bi(t) represents random independent binary data, andas a consequence the intracellular interference is a stationary random process. From theCentral Limit Theorem, the summation of N � 1 independent random process means thatnint can be approximated as a Gaussian random variable [3,4].
296 CHAPTER 5. ANALYSIS OF IS-95
5.3.1.1 Perfect power control
Since all users are sharing the same radio frequency, a strong signal from mobiles closeto the BS will mask weak signals from distant users. To reduce this so-called near–farproblem, as well as to reduce the interference from other users, it is important to exercisea power control on the up- link of CDMA transmissions so that the received signal powerlevels from all users remain close to a target power, Ptar. Identically, the received powerfrom each user at the BS is controlled to be the constant target power, Ptar, namely
a2i Pi = Ptar; for i = 0;1; : : :;N�1: (5.14)
With the aid of Equations (5.14), (5.7), (5.9) and (5.13) we may express Equation (5.3) as
Z(Tb) =p
2Ptarb0 cosφ0 + Zint(Tb) + Zn(Tb); (5.15)
where the first term is the desired signal, the second term is the interference from the N�1users in the cell, and the last term is the AWGN component. The bit error probability atthe output of the bit regeneration circuit depends upon the bit-energy-to-total-interferencepower spectral density (PSD) ratio or signal-to-total-interference power ratio (SIR). Accord-ing to Equation (5.15), the average power of the wanted signal component is
S = Ptarb20 = Ptar; (5.16)
while the total noise power is the sum of the interference power coming from other usersand the AWGN power of the receiver. The AWGN power at the output of the matched filteris given as
η = var[Zn(Tb)] = var
�2Tb
Z Tb
0n(t)c0(t)cos(ω1t+ θ)dt
�; (5.17)
where n(t) is the AWGN component. Consequently,
η =4
T 2b
E
�Z Tb
0n(t)c0(t)cos(ω1t + θ)dt
�2
=4
T 2b
E
�Z Tb
0
Z Tb
0n(t)n(u)c0(t)c0(u)cos(ω1u + θ)cos(ω1t + θ)dudt
�
=4T 2b
Z Tb
0
Z Tb
0E [n(t)n(u)]E
�c0(t)c0(u)cos(ω1u+ θ)
�cos(ω1t+ θ)�
dt du: (5.18)
But for an AWGN having a double-sided PSD of 12N0,
E[n(t)n(u)]=12N0δ(t�u); (5.19)
5.3. CDMA IN A SINGLE MACROCELL 297
where δ(t�u) is a delta function at t = u. So,
η =4
T 2b
Z Tb
0
Z Tb
0
12N0δ(t�u) E
�c0(t)c0(u)cos(ω1u + θ)
�cos(ω1t + θ)
dudt
=2N0
T 2b
Z Tb
0c2
0(u)cos2(ω1u + θ)du
=2N0
T 2b
12
"u +
sin(2ω1u + 2θ)2ω1
#Tb0
=2N0
T 2b
12Tb = N0Rb =
�N0
Tc
�TcRb =
N0WGp
; (5.20)
where Rb = 1=Tb is the bit rate of the message sequence bi(t), W = 1=Tc is the chip rateand we assume it is also the bandwidth of the CDMA signal, and WN0 is the noise powerat the receiver input. Thus, after despreading, the noise power η is the input noise powerdecreased by the processing gain Gp = Tb=Tc. The intracellular interference power is
Iint = var
�1Tb
Z Tb
0nint(t)c0(t)dt
�
=1
T 2b
E
�Z Tb
0nint(t)c0(t)dt
�2
; (5.21)
since E[nint(t)c0(t)] = 0. Because the nint(t) in Equation (5.21) is a Gaussian random vari-able, its variance can be found as
Iint =1
T 2b
Z Tb
0
Z Tb
0E [nint(t)nint(u)] E [c0(t)c0(u)]dudt: (5.22)
Since nint(t) is Gaussian distributed having a power of E[n2int(t)] and a double-sided band-
width of W , its double-sided PSD is
E[nint(t)nint(u)] =E�n2int(t)
�W
δ(t � u): (5.23)
Substituting the above equation into Equation (5.22):
Iint =1
T 2b
Z Tb
0
Z Tb
0
E�n2int(t)
�W
δ(t�u) E [c0(t)c0(u)]dudt
=1
T 2b
E�n2int(t)
�W
Z Tb
0du =
E�n2int(t)
�Gp
; (5.24)
298 CHAPTER 5. ANALYSIS OF IS-95
where the intracellular interference power is
E[nint(t)]2 = E
"N�1
∑i=1
2a2i Pib
2i (t�τi0)c2
i (t � τi0)cos2 φi
#=
N�1
∑i=1
a2i Pi (5.25)
because the expectation of cos2 φi is 0:5.By applying voice activity detection (VAD) and thereby discontinuous transmitting (DTX),
the mobiles transmit only when speech signal is present. We introduce a voice activity vari-able vi which is equal to 1 with probability of µ, and to 0 with probability of 1�µ, where µis defined as the voice activity factor (VAF). By multiplying Equation (5.25) by vi, and withthe aid of Equations (5.14) and (5.16),
IintS
=1Gp
N�1
∑i=1
via2i PiS
=1Gp
N�1
∑i=1
vi ; (5.26)
where S is the target power Ptar of Equation (5.16) for this case of perfect power control.Thus the intracellular interference-to-signal power ratio given by the summation term inEquation (5.26) is also reduced by a factor of Gp after the process of matched filtering.
The energy per bit Eb measured at the output of the matched filter is a random variablebecause of the variations in the path loss, slow fading and fast fading of the mobile chan-nel. The interference PSD I0 measured at the output of the matched filter is also a randomvariable because it depends on the interference being generated by mobiles roaming withinthe cell. We therefore need to take the expectation of the ratio of Eb to I0, namely Eb=I0, indetermining the probability of symbol error. Now Eb = STb and I0 = I=Rb = ITb, whereI is the total interference power at the output of the matched filter. Consequently,
Eb
I0=
SI
= SIR: (5.27)
Now the I is the sum of Iint and η, enabling us to express
Eb
I0=
1IintS + η
S
: (5.28)
In Equation (5.26), the summation of vi over (N � 1) users may be expressed, upon takingits expectation, as
E
"N�1
∑i=1
vi
#= µ(N�1) (5.29)
so that
Eb
I0=
1µ(N�1)
Gp+ η
S
(5.30)
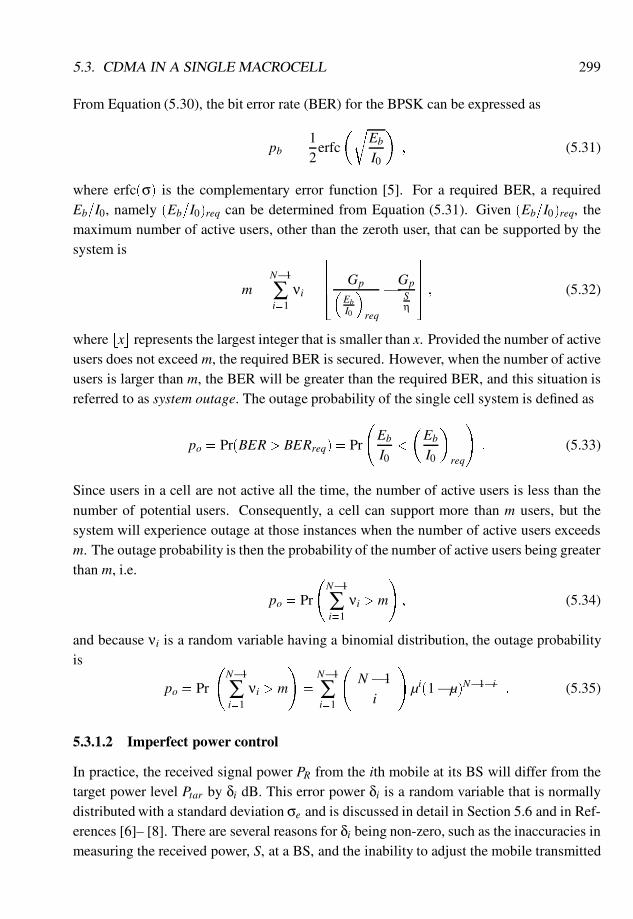
5.3. CDMA IN A SINGLE MACROCELL 299
From Equation (5.30), the bit error rate (BER) for the BPSK can be expressed as
pb =12
erfc
�rEb
I0
�; (5.31)
where erfc(σ) is the complementary error function [5]. For a required BER, a requiredEb=I0, namely (Eb=I0)req can be determined from Equation (5.31). Given (Eb=I0)req, themaximum number of active users, other than the zeroth user, that can be supported by thesystem is
m=N�1
∑i=1
νi =
66664 Gp�EbI0
�req
�
GpSη
77775 ; (5.32)
where bxc represents the largest integer that is smaller than x. Provided the number of activeusers does not exceed m, the required BER is secured. However, when the number of activeusers is larger than m, the BER will be greater than the required BER, and this situation isreferred to as system outage. The outage probability of the single cell system is defined as
po = Pr(BER> BERreq) = Pr
Eb
I0<
�Eb
I0
�req
!: (5.33)
Since users in a cell are not active all the time, the number of active users is less than thenumber of potential users. Consequently, a cell can support more than m users, but thesystem will experience outage at those instances when the number of active users exceedsm. The outage probability is then the probability of the number of active users being greaterthan m, i.e.
po = Pr
N�1
∑i=1
νi > m
!; (5.34)
and because νi is a random variable having a binomial distribution, the outage probabilityis
po = Pr
N�1
∑i=1
νi > m
!=
N�1
∑i=1
N�1
i
!µi(1�µ)N�1�i : (5.35)
5.3.1.2 Imperfect power control
In practice, the received signal power PR from the ith mobile at its BS will differ from thetarget power level Ptar by δi dB. This error power δi is a random variable that is normallydistributed with a standard deviation σe and is discussed in detail in Section 5.6 and in Ref-erences [6]– [8]. There are several reasons for δi being non-zero, such as the inaccuracies inmeasuring the received power, S, at a BS, and the inability to adjust the mobile transmitted

300 CHAPTER 5. ANALYSIS OF IS-95
power sufficiently fast to force δi to zero. The relationship between PR and Ptar for the ithmobile may be expressed as
PR = a2i Pi10
δi10= Ptar10
δi10
: (5.36)
According to Equation (5.36), the signal power at the output of the matched filter for thewanted zeroth mobile is
S0= Ptar10
δ010 ; (5.37)
and the intracellular interference is
Iint =1Gp
N�1
∑i=1
viPtar 10δi10 : (5.38)
Consequently, the intracellular interference-to-signal ratio at the output of the matched filterbecomes
I0intS0=
1Gp
N�1
∑i=1
vi10δi�δ0
10 ; (5.39)
where δ0 and δi are two mutually independent random variables of power control errors forthe signal and the intracellular interferers, respectively. By setting ε= δi�δ0, we have fromEquations (5.39),
I0intS0
=
1Gp
N�1
∑i=1
vi10ε
10
=
IintS
10ε
10 ; (5.40)
where ε is a random variable with zero mean and a normal distribution having a standarddeviation of σε =
p2σe. Following the same procedure as in the perfect power control case,
the signal-to-interference power ratio can be written as�Eb
I0
�im=
1I0intS0 + η
S0
=1
IintS 10
ε10 + η
S0: (5.41)
Owing to imperfect power control, there is an error, ε, in (Eb=I0)im. Because ε is a normallydistributed random variable, the BER varies accordingly. In order to evaluate the systemperformance, we introduce the outage probability that is defined as the probability of asystem’s BER being greater than 10�3, i.e.
po = Pr(BER> 10�3)
= Pr
��Eb
I0
�im
=S0
I0int +η< γreq
�
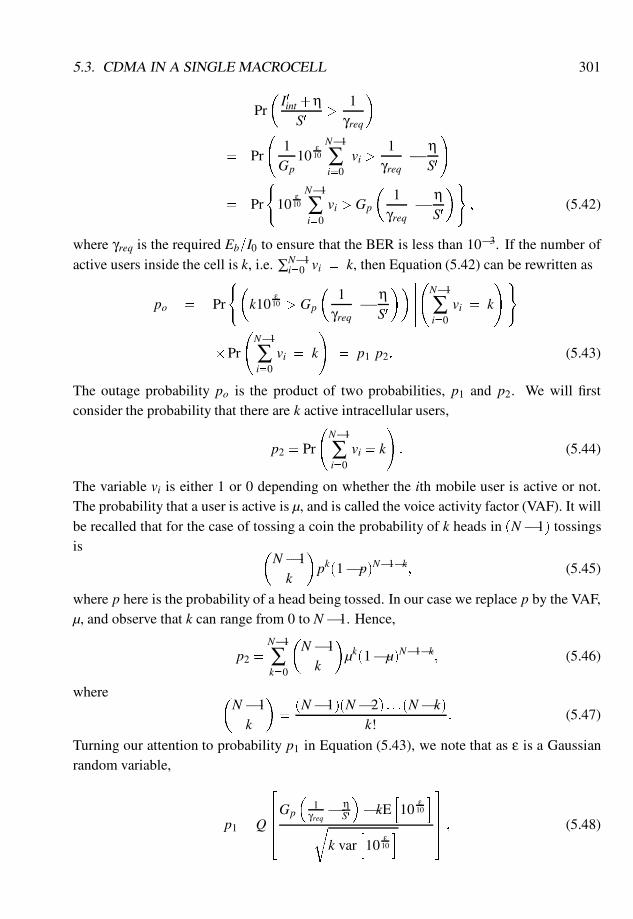
5.3. CDMA IN A SINGLE MACROCELL 301
= Pr
�I0
int +ηS0
>1
γreq
�
= Pr
1Gp
10ε
10
N�1
∑i=0
vi >1
γreq�
ηS0
!
= Pr
(10
ε10
N�1
∑i=0
vi > Gp
�1
γreq�
ηS0
�); (5.42)
where γreq is the required Eb=I0 to ensure that the BER is less than 10�3. If the number ofactive users inside the cell is k, i.e. ∑N�1
i=0 vi = k, then Equation (5.42) can be rewritten as
po = Pr
(�k10
ε10 > Gp
�1
γreq�
ηS0
�������
N�1
∑i=0
vi = k
!)
�Pr
N�1
∑i=0
vi = k
!= p1 p2: (5.43)
The outage probability po is the product of two probabilities, p1 and p2. We will firstconsider the probability that there are k active intracellular users,
p2 = Pr
N�1
∑i=0
vi = k
!: (5.44)
The variable vi is either 1 or 0 depending on whether the ith mobile user is active or not.The probability that a user is active is µ, and is called the voice activity factor (VAF). It willbe recalled that for the case of tossing a coin the probability of k heads in (N� 1) tossingsis �
N�1k
�pk(1� p)N�1�k; (5.45)
where p here is the probability of a head being tossed. In our case we replace p by the VAF,µ, and observe that k can range from 0 to N�1. Hence,
p2 =N�1
∑k=0
�N�1k
�µk(1�µ)N�1�k; (5.46)
where �N�1k
�=(N�1)(N�2) : : :(N�k)
k!: (5.47)
Turning our attention to probability p1 in Equation (5.43), we note that as ε is a Gaussianrandom variable,
p1 = Q
2664Gp
�1
γreq �ηS0
��kE
h10
ε10
ir
k varh10
ε10
i3775 ; (5.48)
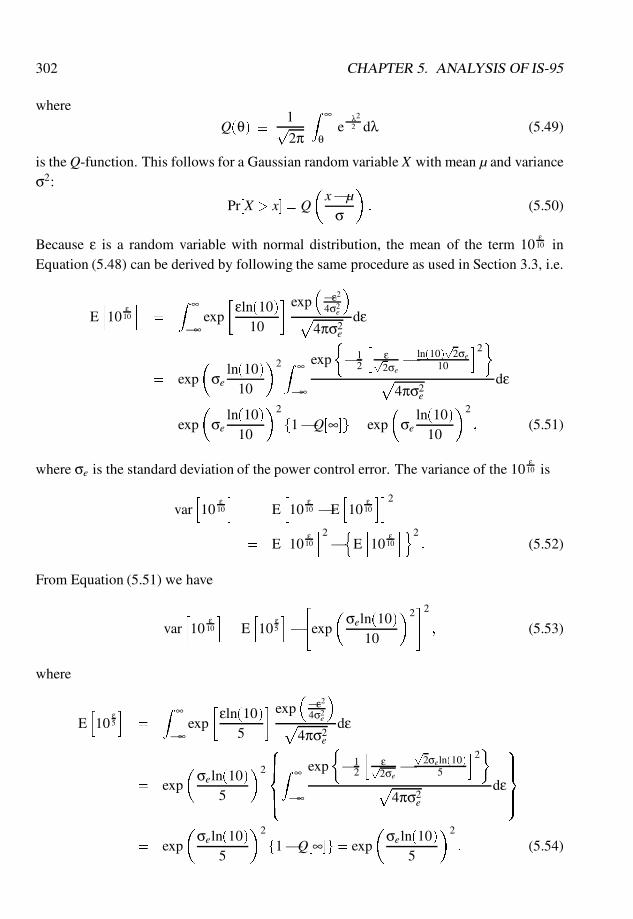
302 CHAPTER 5. ANALYSIS OF IS-95
where
Q(θ) � 1p2π
Z ∞
θe�λ2
2 dλ (5.49)
is the Q-function. This follows for a Gaussian random variable X with mean µ and varianceσ2:
Pr[X > x] = Q
�x�µ
σ
�: (5.50)
Because ε is a random variable with normal distribution, the mean of the term 10ε
10 inEquation (5.48) can be derived by following the same procedure as used in Section 3.3, i.e.
Eh10
ε10
i=
Z ∞
�∞exp
�εln(10)
10
� exp��ε2
4σ2e
�p
4πσ2e
dε
= exp
�σe
ln(10)10
�2 Z ∞
�∞
exp
��1
2
hεp2σe� ln(10)
p2σe
10
i2�
p4πσ2
e
dε
= exp
�σe
ln(10)10
�2
f1�Q[∞]g= exp
�σe
ln(10)10
�2
; (5.51)
where σe is the standard deviation of the power control error. The variance of the 10ε
10 is
varh10
ε10
i= E
h10
ε10 �E
h10
ε10
ii2
= Eh10
ε10
i2�n
Eh10
ε10
io2: (5.52)
From Equation (5.51) we have
varh10
ε10
i= E
h10
ε5
i�"
exp
�σeln(10)
10
�2#2
; (5.53)
where
Eh10
ε5
i=
Z ∞
�∞exp
�εln(10)
5
� exp��ε2
4σ2e
�p
4πσ2e
dε
= exp
�σeln(10)
5
�2
8>><>>:Z ∞
�∞
exp
��1
2
hεp2σe�p
2σeln(10)5
i2�
p4πσ2
e
dε
9>>=>>;
= exp
�σeln(10)
5
�2
f1�Q[∞]g= exp
�σeln(10)
5
�2
: (5.54)
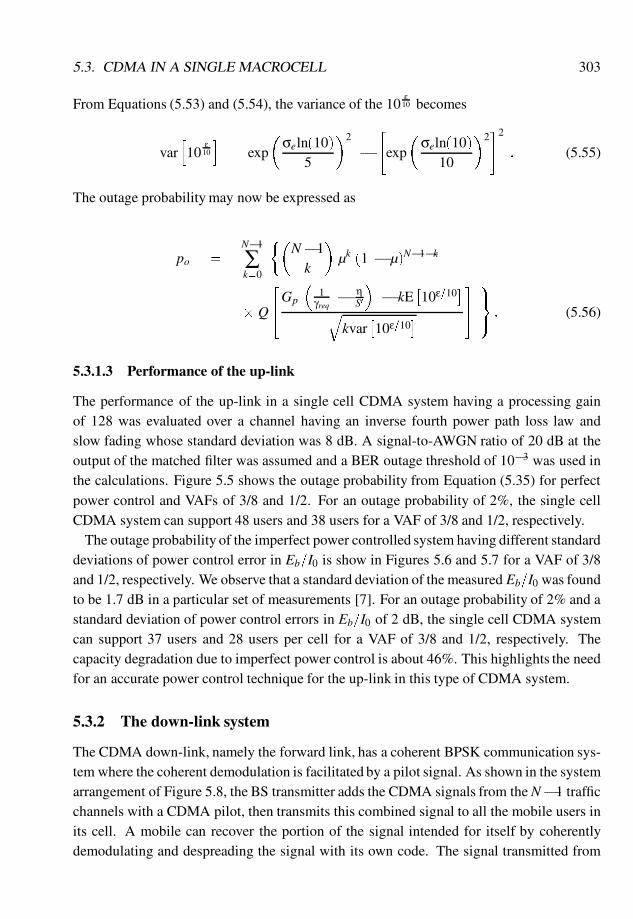
5.3. CDMA IN A SINGLE MACROCELL 303
From Equations (5.53) and (5.54), the variance of the 10ε
10 becomes
varh10
ε10
i= exp
�σeln(10)
5
�2
�
"exp
�σeln(10)
10
�2#2
: (5.55)
The outage probability may now be expressed as
po =N�1
∑k=0
��N�1k
�µk (1 � µ)N�1�k
� Q
24Gp
�1
γreq �ηS0
�� kE
�10ε=10
�q
kvar�10ε=10
�359=; : (5.56)
5.3.1.3 Performance of the up-link
The performance of the up-link in a single cell CDMA system having a processing gainof 128 was evaluated over a channel having an inverse fourth power path loss law andslow fading whose standard deviation was 8 dB. A signal-to-AWGN ratio of 20 dB at theoutput of the matched filter was assumed and a BER outage threshold of 10�3 was used inthe calculations. Figure 5.5 shows the outage probability from Equation (5.35) for perfectpower control and VAFs of 3/8 and 1/2. For an outage probability of 2%, the single cellCDMA system can support 48 users and 38 users for a VAF of 3/8 and 1/2, respectively.
The outage probability of the imperfect power controlled system having different standarddeviations of power control error in Eb=I0 is show in Figures 5.6 and 5.7 for a VAF of 3/8and 1/2, respectively. We observe that a standard deviation of the measured Eb=I0 was foundto be 1.7 dB in a particular set of measurements [7]. For an outage probability of 2% and astandard deviation of power control errors in Eb=I0 of 2 dB, the single cell CDMA systemcan support 37 users and 28 users per cell for a VAF of 3/8 and 1/2, respectively. Thecapacity degradation due to imperfect power control is about 46%. This highlights the needfor an accurate power control technique for the up-link in this type of CDMA system.
5.3.2 The down-link system
The CDMA down-link, namely the forward link, has a coherent BPSK communication sys-tem where the coherent demodulation is facilitated by a pilot signal. As shown in the systemarrangement of Figure 5.8, the BS transmitter adds the CDMA signals from the N�1 trafficchannels with a CDMA pilot, then transmits this combined signal to all the mobile users inits cell. A mobile can recover the portion of the signal intended for itself by coherentlydemodulating and despreading the signal with its own code. The signal transmitted from
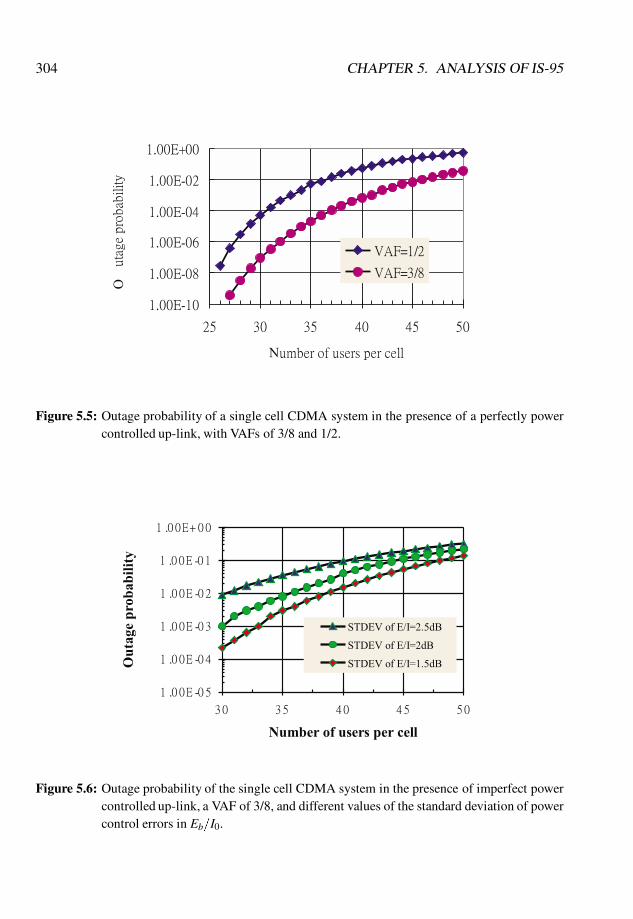
304 CHAPTER 5. ANALYSIS OF IS-95
Figure 5.5: Outage probability of a single cell CDMA system in the presence of a perfectly powercontrolled up-link, with VAFs of 3/8 and 1/2.
Figure 5.6: Outage probability of the single cell CDMA system in the presence of imperfect powercontrolled up-link, a VAF of 3/8, and different values of the standard deviation of powercontrol errors in Eb=I0.
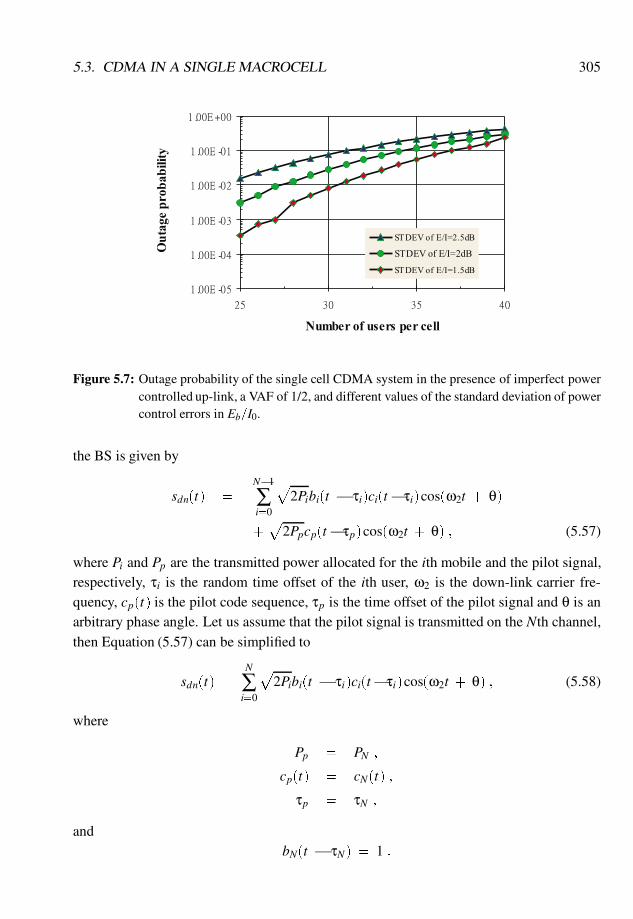
5.3. CDMA IN A SINGLE MACROCELL 305
Figure 5.7: Outage probability of the single cell CDMA system in the presence of imperfect powercontrolled up-link, a VAF of 1/2, and different values of the standard deviation of powercontrol errors in Eb=I0.
the BS is given by
sdn(t) =N�1
∑i=0
p2Pibi(t � τi)ci(t�τi)cos(ω2t + θ)
+p
2Ppcp(t�τp)cos(ω2t + θ) ; (5.57)
where Pi and Pp are the transmitted power allocated for the ith mobile and the pilot signal,respectively, τi is the random time offset of the ith user, ω2 is the down-link carrier fre-quency, cp(t) is the pilot code sequence, τp is the time offset of the pilot signal and θ is anarbitrary phase angle. Let us assume that the pilot signal is transmitted on the Nth channel,then Equation (5.57) can be simplified to
sdn(t) =N
∑i=0
p2Pibi(t � τi)ci(t�τi)cos(ω2t + θ) ; (5.58)
where
Pp = PN ;
cp(t) = cN(t) ;
τp = τN ;
andbN(t � τN) = 1 :
306 CHAPTER 5. ANALYSIS OF IS-95
During the down-link transmission there is no relative time delay between each user’sCDMA signal. For convenience we will set the signal delay on the down-link to zero.While the signal is transmitted by the zeroth BS to its service area, the signal received byone of its users, say, the zeroth mobile, has the form
Rdn(t) = a0sdn(t)+n(t)
= a0
p2P0b0(t�τ0)c0(t�τ0)cos(ω2t+θ)
+N
∑i=1
a0
p2Pibi(t�τi)ci(t�τi)cos(ω2t + θ)+n(t); (5.59)
where the first term is the signal for zeroth mobile, the second term is the intracellular inter-ference, and the last term is the AWGN component. Assuming that the receiver is correctlychip synchronised to the zeroth user, we can set τ0 to zero without loss of generality. Af-ter demodulating and despreading, the signal at the output of the matched filter is, afterfollowing a similar procedure to that in Section 5.3.1,
Z(Tb) = a0
p2P0b0 +
1Tb
Z Tb
0nint(t)c0(t)dt
+1Tb
Z Tb
0n(t)c0(t)2cos(ω2t + θ)dt ; (5.60)
where
nint(t) = a0
N
∑i=1
p2Pibi(t � τi)ci(t�τi) (5.61)
is the equivalent baseband intracellular interference. The first term in Equation (5.60) is thedesired signal, the second term is the intracellular interference, while the last term is theAWGN component.
The performance of the down-link can be obtained by following the same procedure asused in the up-link. From Equation (5.60), the received signal power component for thezeroth mobile receiver is
S = 2a20P0 ; (5.62)
and the power in the received pilot is
Sp = 2a20Pp: (5.63)
If discontinuous transmission is applied to all the traffic channels, then the interferenceis the summation of 2a2
0Pivi for i ranging from 0 to N � 1. The pilot channel is usuallytransmitted at a higher power level than a traffic channel and also at a constant power level.The intracellular interference is therefore
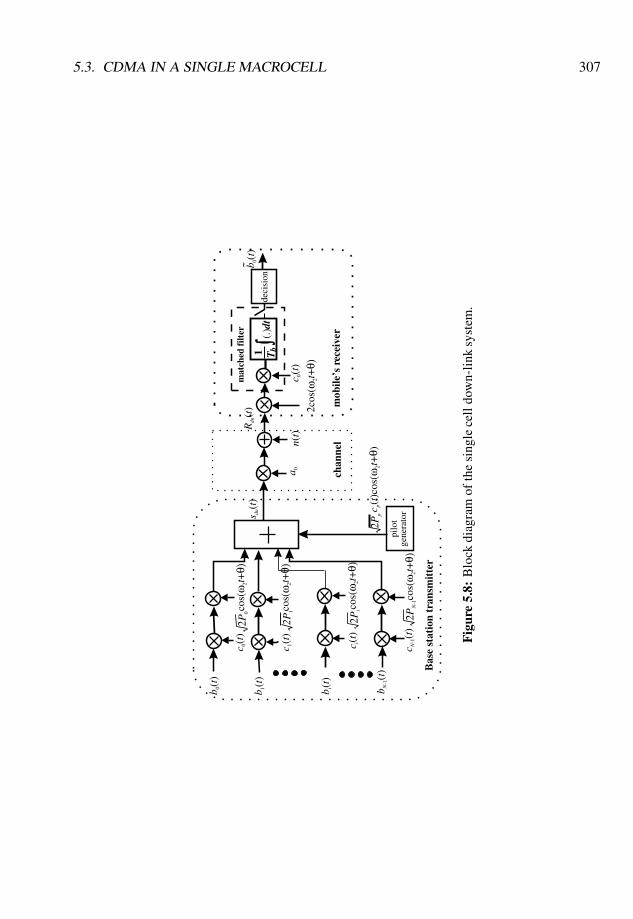
5.3. CDMA IN A SINGLE MACROCELL 307
Tb1
(.)d
t
cos(
ω2t+
θ)
cos(
ω2t+
θ)
cos(
ω2t+
θ)c 0
(t)
b 0(t
)
cos(
ω2t+
θ)
c 1(t
)
2cos
(ω2t+
θ)
2P0
b 1(t
)
pilo
tge
nera
tors dn(t)
c N-1(t
)2P
N-1
b N-1(t
) Bas
e st
atio
n tr
ansm
itte
r
2Pp
a 0 chan
nel
2P1
c i(t
)2P
i
b i(t
)
Rdn(t
) mob
ile’s
rec
eive
r
c 0(t
)
deci
sion
b 0(t
)
n(t)
mat
ched
filt
er
c p(t
)cos
(ω2t+
θ)
Fig
ure
5.8:
Blo
ckdi
agra
mof
the
sing
lece
lldo
wn-
link
syst
em.
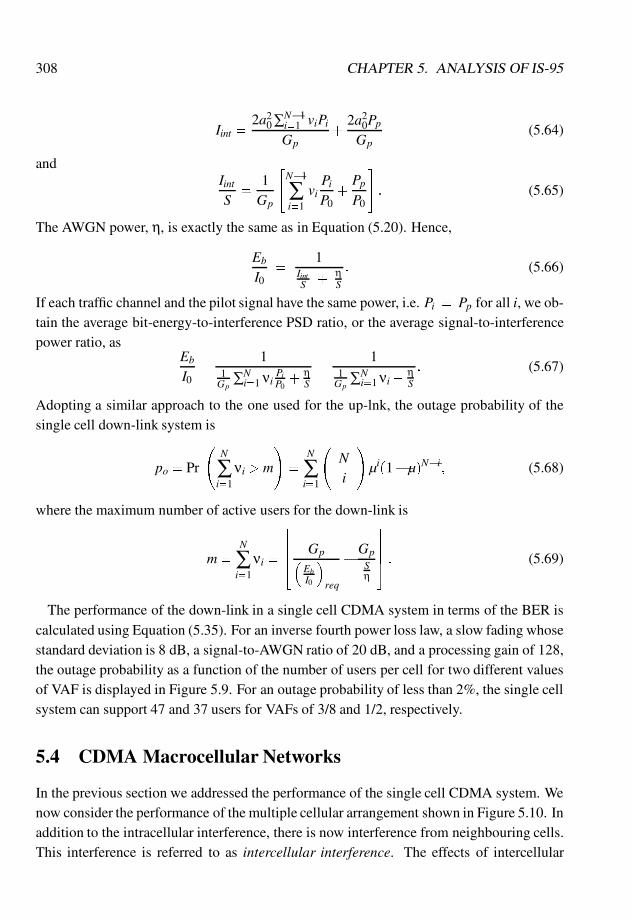
308 CHAPTER 5. ANALYSIS OF IS-95
Iint =2a2
0 ∑N�1i=1 viPiGp
+2a2
0PpGp
(5.64)
andIintS
=1Gp
"N�1
∑i=1
viPiP0
+PpP0
#: (5.65)
The AWGN power, η, is exactly the same as in Equation (5.20). Hence,
Eb
I0=
1IintS + η
S
: (5.66)
If each traffic channel and the pilot signal have the same power, i.e. Pi = Pp for all i, we ob-tain the average bit-energy-to-interference PSD ratio, or the average signal-to-interferencepower ratio, as
Eb
I0=
11Gp
∑Ni=1 νi
PiP0+ η
S
=1
1Gp
∑Ni=1 νi+
ηS
: (5.67)
Adopting a similar approach to the one used for the up-lnk, the outage probability of thesingle cell down-link system is
po = Pr
N
∑i=1
νi > m
!=
N
∑i=1
Ni
!µi(1�µ)N�i; (5.68)
where the maximum number of active users for the down-link is
m=N
∑i=1
νi =
66664 Gp�EbI0
�req
�
GpSη
77775 : (5.69)
The performance of the down-link in a single cell CDMA system in terms of the BER iscalculated using Equation (5.35). For an inverse fourth power loss law, a slow fading whosestandard deviation is 8 dB, a signal-to-AWGN ratio of 20 dB, and a processing gain of 128,the outage probability as a function of the number of users per cell for two different valuesof VAF is displayed in Figure 5.9. For an outage probability of less than 2%, the single cellsystem can support 47 and 37 users for VAFs of 3/8 and 1/2, respectively.
5.4 CDMA Macrocellular Networks
In the previous section we addressed the performance of the single cell CDMA system. Wenow consider the performance of the multiple cellular arrangement shown in Figure 5.10. Inaddition to the intracellular interference, there is now interference from neighbouring cells.This interference is referred to as intercellular interference. The effects of intercellular
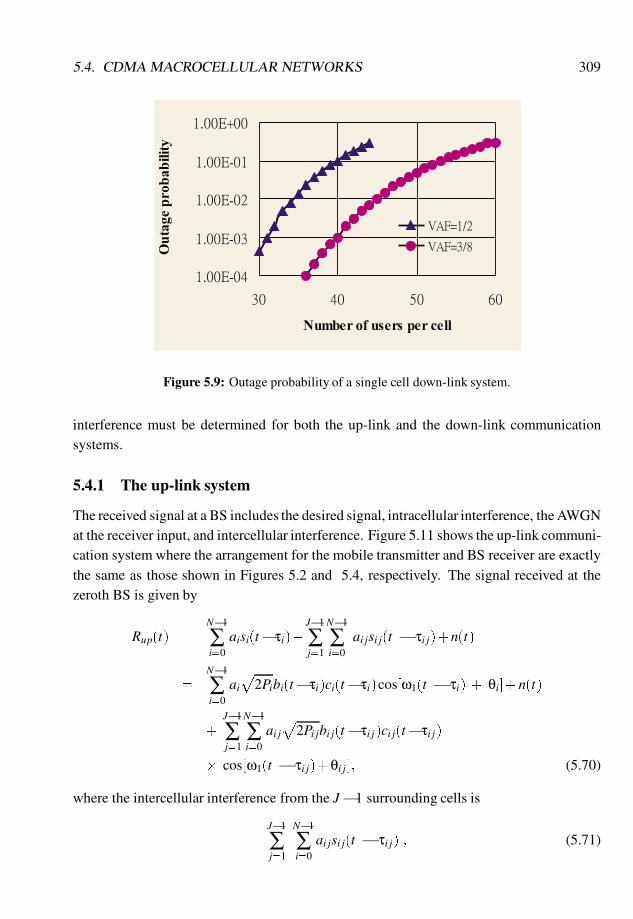
5.4. CDMA MACROCELLULAR NETWORKS 309
Figure 5.9: Outage probability of a single cell down-link system.
interference must be determined for both the up-link and the down-link communicationsystems.
5.4.1 The up-link system
The received signal at a BS includes the desired signal, intracellular interference, the AWGNat the receiver input, and intercellular interference. Figure 5.11 shows the up-link communi-cation system where the arrangement for the mobile transmitter and BS receiver are exactlythe same as those shown in Figures 5.2 and 5.4, respectively. The signal received at thezeroth BS is given by
Rup(t) =N�1
∑i=0
aisi(t�τi)+J�1
∑j=1
N�1
∑i=0
ai jsi j(t � τi j)+n(t)
=N�1
∑i=0
aip
2Pibi(t�τi)ci(t�τi)cos[ω1(t � τi) + θi]+n(t)
+J�1
∑j=1
N�1
∑i=0
ai jp
2Pi jbi j(t�τi j)ci j(t�τi j)
� cos[ω1(t � τi j)+θi j]; (5.70)
where the intercellular interference from the J�1 surrounding cells is
J�1
∑j=1
N�1
∑i=0
ai jsi j(t � τi j) ; (5.71)
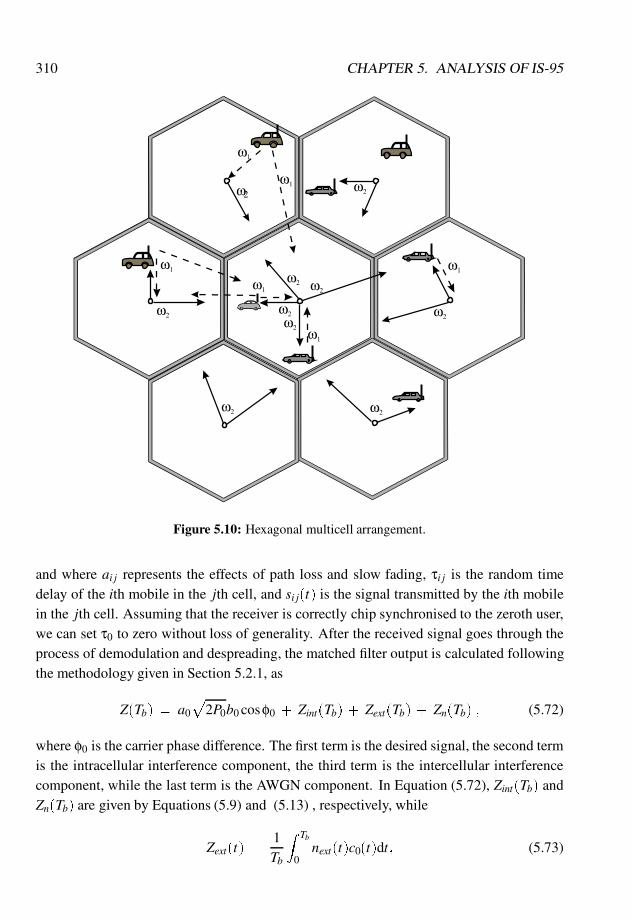
310 CHAPTER 5. ANALYSIS OF IS-95
ω2
ω2
ω2
ω2 ω2
ω2
ω1
ω1
ω2
ω2
ω2
ω2
ω1
ω1
ω1
ω1
Figure 5.10: Hexagonal multicell arrangement.
and where ai j represents the effects of path loss and slow fading, τi j is the random timedelay of the ith mobile in the jth cell, and si j(t) is the signal transmitted by the ith mobilein the jth cell. Assuming that the receiver is correctly chip synchronised to the zeroth user,we can set τ0 to zero without loss of generality. After the received signal goes through theprocess of demodulation and despreading, the matched filter output is calculated followingthe methodology given in Section 5.2.1, as
Z(Tb) = a0
p2P0b0 cosφ0 + Zint(Tb) + Zext(Tb) + Zn(Tb) ; (5.72)
where φ0 is the carrier phase difference. The first term is the desired signal, the second termis the intracellular interference component, the third term is the intercellular interferencecomponent, while the last term is the AWGN component. In Equation (5.72), Zint(Tb) andZn(Tb) are given by Equations (5.9) and (5.13) , respectively, while
Zext(t) =1Tb
Z Tb
0next(t)c0(t)dt; (5.73)
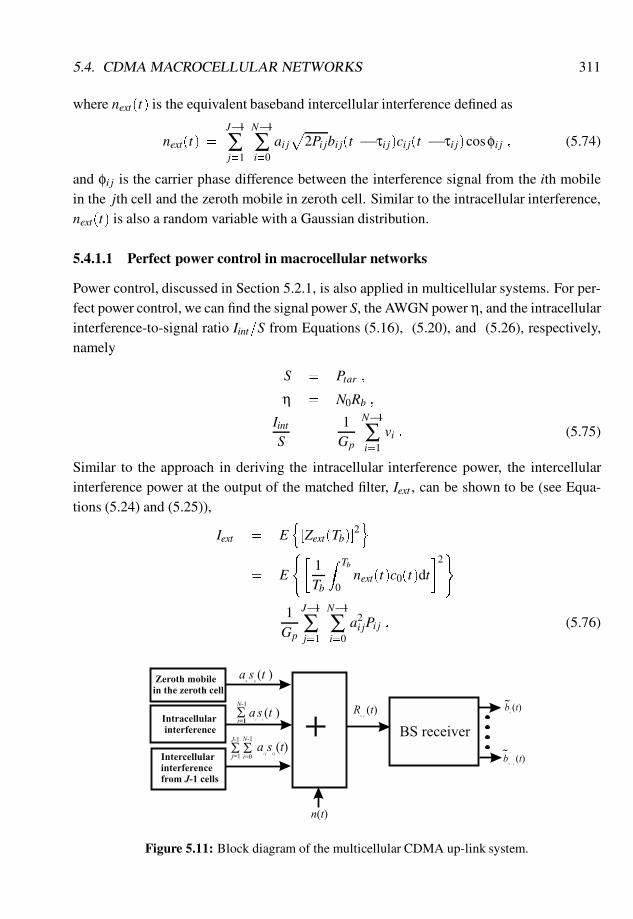
5.4. CDMA MACROCELLULAR NETWORKS 311
where next(t) is the equivalent baseband intercellular interference defined as
next(t) =J�1
∑j=1
N�1
∑i=0
ai jp
2Pi jbi j(t � τi j)ci j(t � τi j)cosφi j ; (5.74)
and φi j is the carrier phase difference between the interference signal from the ith mobilein the jth cell and the zeroth mobile in zeroth cell. Similar to the intracellular interference,next(t) is also a random variable with a Gaussian distribution.
5.4.1.1 Perfect power control in macrocellular networks
Power control, discussed in Section 5.2.1, is also applied in multicellular systems. For per-fect power control, we can find the signal power S, the AWGN power η, and the intracellularinterference-to-signal ratio Iint=S from Equations (5.16), (5.20), and (5.26), respectively,namely
S = Ptar ;
η = N0Rb ;
IintS
=1Gp
N�1
∑i=1
vi : (5.75)
Similar to the approach in deriving the intracellular interference power, the intercellularinterference power at the output of the matched filter, Iext , can be shown to be (see Equa-tions (5.24) and (5.25)),
Iext = En[Zext(Tb)]
2o
= E
(�1Tb
Z Tb
0next(t)c0(t)dt
�2)
=1Gp
J�1
∑j=1
N�1
∑i=0
a2i jPi j : (5.76)
Figure 5.11: Block diagram of the multicellular CDMA up-link system.
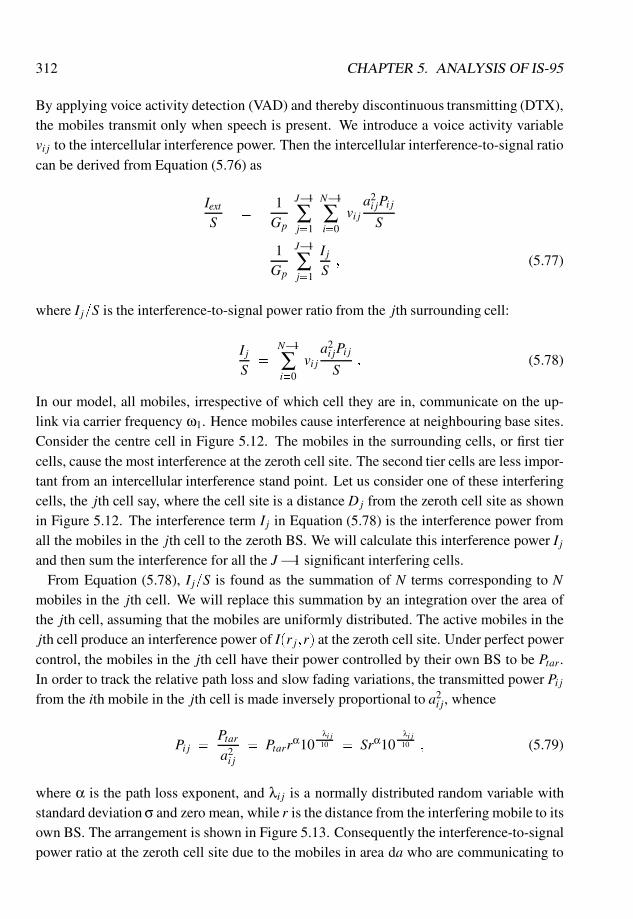
312 CHAPTER 5. ANALYSIS OF IS-95
By applying voice activity detection (VAD) and thereby discontinuous transmitting (DTX),the mobiles transmit only when speech is present. We introduce a voice activity variablevi j to the intercellular interference power. Then the intercellular interference-to-signal ratiocan be derived from Equation (5.76) as
IextS
=
1Gp
J�1
∑j=1
N�1
∑i=0
vi ja2i jPi jS
=
1Gp
J�1
∑j=1
I jS
; (5.77)
where I j=S is the interference-to-signal power ratio from the jth surrounding cell:
I jS=
N�1
∑i=0
vi ja2i jPi jS
: (5.78)
In our model, all mobiles, irrespective of which cell they are in, communicate on the up-link via carrier frequency ω1. Hence mobiles cause interference at neighbouring base sites.Consider the centre cell in Figure 5.12. The mobiles in the surrounding cells, or first tiercells, cause the most interference at the zeroth cell site. The second tier cells are less impor-tant from an intercellular interference stand point. Let us consider one of these interferingcells, the jth cell say, where the cell site is a distance Dj from the zeroth cell site as shownin Figure 5.12. The interference term I j in Equation (5.78) is the interference power fromall the mobiles in the jth cell to the zeroth BS. We will calculate this interference power I jand then sum the interference for all the J�1 significant interfering cells.
From Equation (5.78), I j=S is found as the summation of N terms corresponding to Nmobiles in the jth cell. We will replace this summation by an integration over the area ofthe jth cell, assuming that the mobiles are uniformly distributed. The active mobiles in thejth cell produce an interference power of I(r j;r) at the zeroth cell site. Under perfect powercontrol, the mobiles in the jth cell have their power controlled by their own BS to be Ptar.In order to track the relative path loss and slow fading variations, the transmitted power Pi jfrom the ith mobile in the jth cell is made inversely proportional to a2
i j, whence
Pi j =Ptara2i j
= Ptarrα10�λi j
10 = Srα10�λi j
10 ; (5.79)
where α is the path loss exponent, and λi j is a normally distributed random variable withstandard deviation σ and zero mean, while r is the distance from the interfering mobile to itsown BS. The arrangement is shown in Figure 5.13. Consequently the interference-to-signalpower ratio at the zeroth cell site due to the mobiles in area da who are communicating to
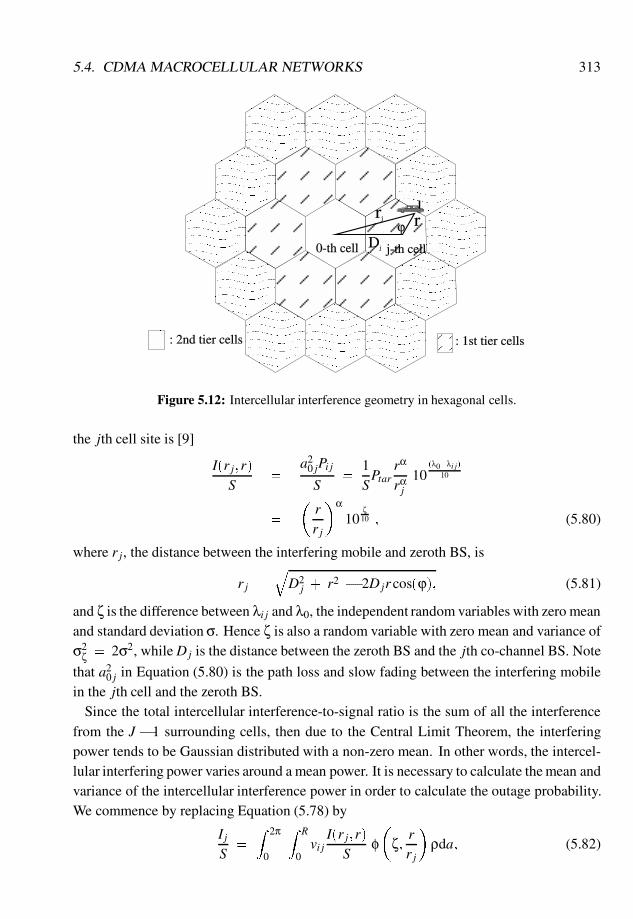
5.4. CDMA MACROCELLULAR NETWORKS 313
0-th cell
: 1st tier cells
rrj
Dj
ϕ
j-th cell
: 2nd tier cells
Figure 5.12: Intercellular interference geometry in hexagonal cells.
the jth cell site is [9]
I(r j;r)S
=a2
0 jPi jS
=1SPtar
rα
rαj
10(λ0�λi j)
10
=
�rr j
�α10
ζ10
; (5.80)
where r j, the distance between the interfering mobile and zeroth BS, is
r j =q
D2j + r2
� 2Djr cos(ϕ); (5.81)
and ζ is the difference between λi j and λ0, the independent random variables with zero meanand standard deviation σ. Hence ζ is also a random variable with zero mean and variance ofσ2
ζ = 2σ2, while Dj is the distance between the zeroth BS and the jth co-channel BS. Note
that a20 j in Equation (5.80) is the path loss and slow fading between the interfering mobile
in the jth cell and the zeroth BS.Since the total intercellular interference-to-signal ratio is the sum of all the interference
from the J � 1 surrounding cells, then due to the Central Limit Theorem, the interferingpower tends to be Gaussian distributed with a non-zero mean. In other words, the intercel-lular interfering power varies around a mean power. It is necessary to calculate the mean andvariance of the intercellular interference power in order to calculate the outage probability.We commence by replacing Equation (5.78) by
I jS
=Z 2π
0
Z R
0vi j
I(r j;r)S
φ�
ζ;
rr j
�ρda; (5.82)
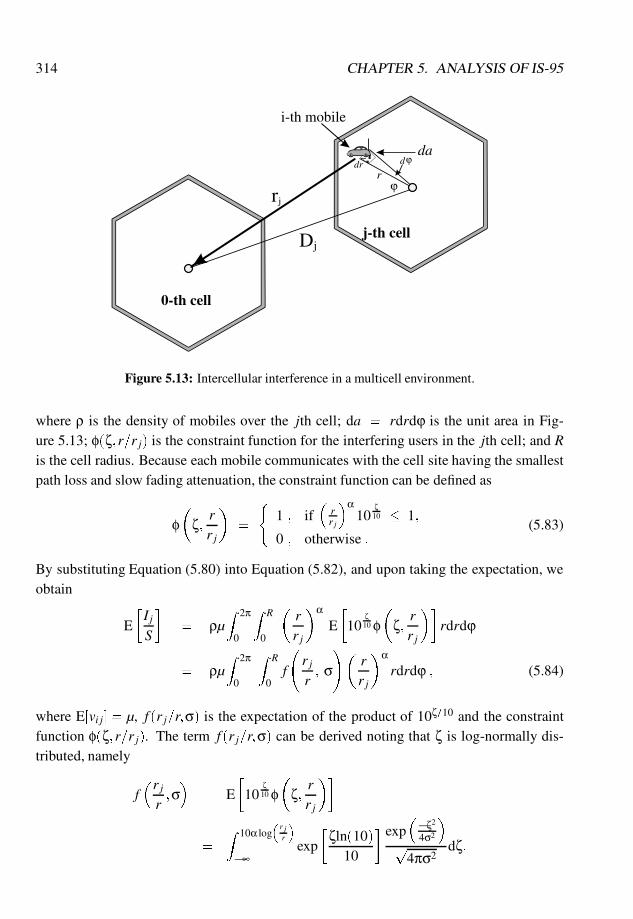
314 CHAPTER 5. ANALYSIS OF IS-95
d
rr
j-th cell
0-th cell
i-th mobile
da
ϕ
ϕdr
Dj
j
Figure 5.13: Intercellular interference in a multicell environment.
where ρ is the density of mobiles over the jth cell; da = rdrdϕ is the unit area in Fig-ure 5.13; φ(ζ;r=r j) is the constraint function for the interfering users in the jth cell; and Ris the cell radius. Because each mobile communicates with the cell site having the smallestpath loss and slow fading attenuation, the constraint function can be defined as
φ�
ζ;rr j
�=
(1 ; if
�rr j
�α10
ζ10 � 1;
0 ; otherwise :(5.83)
By substituting Equation (5.80) into Equation (5.82), and upon taking the expectation, weobtain
E
�I jS
�= ρµ
Z 2π
0
Z R
0
�rr j
�αE
�10
ζ10 φ�
ζ;rr j
��rdrdϕ
= ρµZ 2π
0
Z R
0f
r jr; σ
!�rr j
�αrdrdϕ ; (5.84)
where E[vi j] = µ, f (r j=r;σ) is the expectation of the product of 10ζ=10 and the constraintfunction φ(ζ;r=r j). The term f (r j=r;σ) can be derived noting that ζ is log-normally dis-tributed, namely
f�r jr;σ�
= E
�10
ζ10 φ�
ζ;rr j
��
=Z 10α log
�r jr
�
�∞exp
�ζln(10)
10
� exp��ζ2
4σ2
�p
4πσ2dζ:
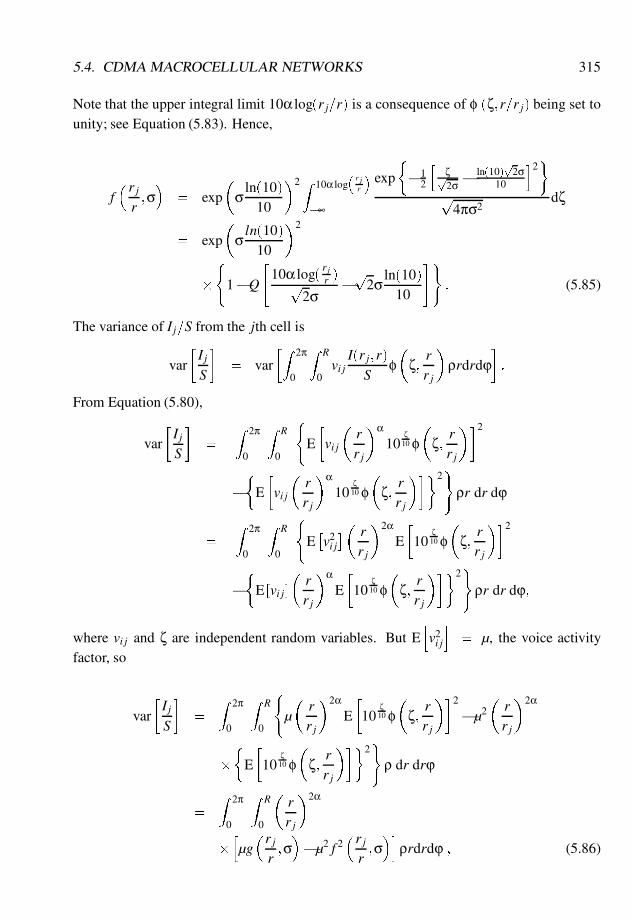
5.4. CDMA MACROCELLULAR NETWORKS 315
Note that the upper integral limit 10α log(r j=r) is a consequence of φ (ζ;r=r j) being set tounity; see Equation (5.83). Hence,
f� r jr;σ�
= exp
�σ
ln(10)10
�2 Z 10α log�r jr
�
�∞
exp
��
12
hζp2σ �
ln(10)p
2σ10
i2�
p4πσ2
dζ
= exp
�σln(10)
10
�2
�(
1�Q
"10α log( r jr )p
2σ�p
2σln(10)
10
#): (5.85)
The variance of I j=S from the jth cell is
var
�I jS
�= var
�Z 2π
0
Z R
0vi j
I(r j;r)
Sφ�
ζ;rr j
�ρrdrdϕ
�:
From Equation (5.80),
var
�I jS
�=
Z 2π
0
Z R
0
(E
�vi j
�rr j
�α10
ζ10 φ
�ζ;
rr j
��2
��
E
�vi j
�rr j
�α10
ζ10 φ
�ζ;
rr j
���2)
ρr dr dϕ
=Z 2π
0
Z R
0
(E�v2i j
�� rr j
�2αE
�10
ζ10 φ
�ζ;
rr j
��2
��
E [vi j]
�rr j
�αE
�10
ζ10 φ
�ζ;
rr j
���2)
ρr dr dϕ;
where vi j and ζ are independent random variables. But Ehv2i j
i= µ, the voice activity
factor, so
var
�I jS
�=
Z 2π
0
Z R
0
(µ
�rr j
�2αE
�10
ζ10 φ
�ζ;
rr j
��2
�µ2�
rr j
�2α
��
E
�10
ζ10 φ
�ζ;
rr j
���2)
ρ dr drϕ
=Z 2π
0
Z R
0
�rr j
�2α
�hµg�r jr;σ��µ2 f 2
�r jr;σ�i
ρrdrdϕ ; (5.86)
316 CHAPTER 5. ANALYSIS OF IS-95
where f (r j=r;σ) is given by Equation (5.85) and g(r j=r;σ) is
g�r jr;σ�= E
�10
ζ10 φ
�ζ;
rr j
��2
: (5.87)
Using Equation (5.83) enables g(r j=r;σ) to be found as
g�r jr;σ�
=Z 10α log
�r jr
�
�∞exp
�ζln(10)
5
� exp��ζ2
4σ2
�p
4πσ2dζ
= exp
�σln(10)
5
�2Z 10α log�r jr
�
�∞
exp
��1
2
hζp2σ�p
2σln(10)5
i2�
p4πσ2
dζ
= exp
�σln(10)
5
�2
�(
1�Q
"10α log
� r jr
�p
2σ�p
2σln(10)5
#): (5.88)
By knowing the mean and variance of I j=S we can now calculate the mean and variance ofthe total interference-power-to-signal-power ratio for all the surrounding cells. The expres-sion Iext=S in Equation (5.77) has a mean and variance of
E
�IextS
�=
1Gp
J�1
∑j=1
E
�I jS
�; (5.89)
and
var
�IextS
�=
�1Gp
�2 J�1
∑j=1
var
�I jS
�; (5.90)
respectively. The bit energy-to-interference PSD ratio at the output of the matched filter(the input of the decision circuit) is
Eb
I0=
SI=
1IintS + Iext
S + ηS
: (5.91)
Note that η=S is a constant, and Iint=S is a function of the voice activity variable which isbinomially distributed, while Iext=S is a Gaussian random variable with a mean and varianceof
E
�IextS
�=
1Gp
J�1
∑j=1
ρµZ 2π
0
Z R
0f�r jr;σ�� r
r j
�αrdrdϕ (5.92)
and

5.4. CDMA MACROCELLULAR NETWORKS 317
var
�IextS
�=
1G2
p
J�1
∑j=1
ρZ 2π
0
Z R
0
�rr j
�2α
�
hµg�r jr
; σ�� µ2 f 2
�r jr
; σ�i
rdrdϕ : (5.93)
The system performance in terms of the outage probability that has a BER greater than 10�3
is
po = Pr(BER > 10�3)
= Pr
�SI< γreq
�= Pr
�IS>
1γreq
�
= Pr
�IextS
>1
γreq�
IintS�
ηS
�; (5.94)
where γreq is the Eb=N0 required to have a BER < 10�3. Substituting for Iint=S gives
po = Pr
"IextS
>
1
γreq�
ηS�
1Gp
N�1
∑i=1
vi
!#; (5.95)
and if the number of active users in the centre cell of Figure 5.13 is k, then we proceed asin Section 5.2.1, namely
po = Pr
"IextS
>
�1
γreq�
ηS�
kGp
������N�1
∑i=1
vi = k
#
� Pr
"N�1
∑i=0
vi = k
#: (5.96)
We note that
Pr
"N�1
∑i=0
vi = k
#(5.97)
has been determined before; see Equation (5.46). We now consider the first probability termin Equation (5.96). On applying Equation (5.50),
Prh
IextS >
�1
γreq �ηS �
kGp
�i
= Q
" �1
γreq �ηS �
kGp
�� E[ Iext
S ]qvar[ Iext
S ]
#; (5.98)
where E [Iext=S] and var [Iext=S] are given by Equations (5.89) and (5.90), respectively.Hence the outage probability is
318 CHAPTER 5. ANALYSIS OF IS-95
=
N�1
∑k=0
(N � 1)!(N � 1 � k)!k!
µk(1 � µ)N�k�1
� Q
24 1
γreq �ηS � k
Gp� E
� IextS
�q
var� Iext
S
�35
: (5.99)
5.4.1.2 Imperfect power control in macrocellular networks
The received signal power S0 from a mobile at its BS will differ from the target powerlevel Ptar by δ0 dB. This error power δ0 is a random variable that is normally distributedwith standard deviation σe. The received signal S0 at the BS for the zeroth mobile, and theintracellular interference-to-signal ratio are given by Equations (5.37) and (5.40), respec-tively. Using Equations (5.37) and (5.80), the mobiles in area da in the jth cell produce aninterfering power-to-received-signal-power ratio at the zeroth BS of
I0(r j;r)
S0=
a20 jPi j
Ptar10δ0=10
=
�rr j
�α10
ζ10 10
δi j�δ010
=
�rr j
�α10
ζ10 10
ε10
; (5.100)
where δi j is the power error for the ith mobile in the jth cell, and ε is a random variablehaving zero mean and normal distribution with a standard deviation of σε =
p2σe. From
Equations (5.82) and (5.100), the total intercellular interference-to-signal ratio is
I0extS0
=1Gp
J�1
∑j=1
Z 2π
0
Z R
0vi j
�rr j
�α10
ζ10 φ
�ζ;
rr j
�10
ε10 ρrdrdϕ
=IextS
10ε
10 : (5.101)
From Equations (5.37), (5.40), and (5.101), the bit energy-to-interference PSD ratio at theinput of the decision circuit for imperfect power control is
�Eb
I0
�im
=S0
I0=
1I0intS0 + I0ext
S0 + ηS0
=1
IintS 10ε=10 + Iext
S 10ε=10 + ηS0
; (5.102)
5.4. CDMA MACROCELLULAR NETWORKS 319
where ε is the error in Eb=I0 due to imperfect power control. Following the same procedureas employed for the perfect power control case, the outage probability is found as
po = Pr(BER > 10�3)
= Pr
�I0intS0
+I0extS0
+ηS0
>1
γreq
�
= Pr
�I0intS0
+I0extS0
>1
γreq�
ηS0
�: (5.103)
In Equation (5.103), I0int=S0 and I0ext=S
0 are two independent Gaussian distributed randomvariables, whose mean and variance may be expressed as
E
�I0intS0
+I0extS0
�= E
�IintS
10ε
10
�+E
�IextS
10ε
10
�and
var
�I0intS0
+I0extS0
�= var
�IintS
10ε
10
�+var
�IextS
10ε
10
�: (5.104)
Before we derive the outage probability, we have to calculate the mean and variance of theintracellular interference-to-signal ratio, and the intercellular interference-to-signal ratio.The mean and variance of the intracellular interference-to-signal power ratio are
E
�I0intS0
�=
N�1
∑i=1
viEh10
ε10
i=
N�1
∑i=1
vi exp
24 ln(10)
p2σe
10
!235
and
var
�I0intS0
�=
N�1
∑i=1
vi varh10
ε10
i(5.105)
=N�1
∑i=1
vi
8<:exp
24 p2σeln(10)
5
!235
� exp
24
ln(10)p
2σe
10
!4359=; : (5.106)
In Equation (5.101), the random variables ζ and ε are uncorrelated. Consequently the ex-pectation of Equation (5.101) can be expressed as
E
�I0extS0
�= E
�IextS
�Eh10
ε10
i; (5.107)
and from Equations (5.92) and (5.51) the expectation can be calculated. The variance ofEquation (5.101) is
320 CHAPTER 5. ANALYSIS OF IS-95
var
�I0
ext
S0
�= E
"�IextS
�2#
E
��10
ε10
�2��
�E
�IextS
�Eh10
ε10
i�2
; (5.108)
where E [Iext=S], E�10ε=10
�, and E
�10ε=5
�are given in Equations (5.92), (5.51) and (5.54),
respectively, while
E
" �IextS
�2#
=1G2
p
J�1
∑j=1
Z 2π
0
Z R
0E
�vi j
�rr j
�α10
ζ10 φ
�ζ;
rr j
��2
ρrdrdϕ
=1G2
p
J�1
∑j=1
Z 2π
0
Z R
0µE
� �rr j
�α10
ζ10 φ
�ζ;
rr j
� �2
ρrdrdϕ
=1G2
p
J�1
∑j=1
Z 2π
0
Z R
0µ
�rr j
�2αg�r jr;σ�
ρrdrdϕ ; (5.109)
and g(r j=r;σ) is given in Equation (5.88). From Equations (5.107) and (5.108) the expec-tation and variance of I0ext=S
0 can be calculated.The outage probability of Equation (5.103) can be written following the same procedure
as used for the perfect power control case:
po =N�1
∑k=0
(N � 1)!(N � 1 � k)!k!
µk(1 � µ)N�1�k
�Q
0BB@
1γreq �
ηS0 � E
hI0
intS0
i� E
hI0
extS0
ir
varhI0
intS0
i+ var
hI0
extS0
i1CCA : (5.110)
For a processing gain of 128 and a signal-to-AWGN ratio of 20 dB at the output of thematched filter, the performance of the up-link CDMA system is shown in Figure 5.14 for aVAF of 1/2, and in Figure 5.15 for a VAF of 3/8. For an outage probability of 2%, the perfectpower controlled CDMA system can support 23 users and 30 users for a VAF of 1/2 and 3/8,respectively. The number of users per cell for different values of the standard deviation ofpower control errors in Eb=I0, and the percentage decrease in users due to imperfect powercontrol, are displayed in Table 5.1 for an outage of 2%.
From Table 5.1, the imperfect power control system having a standard deviation of 2 dBcan only support 22 users and 28 users for VAFs of 1/2 and 3/8, respectively. The reductionin capacity caused by power control error is about 6.3% and 4.3% for VAFs of 3/8 and 1/2,respectively, for a standard deviation of 2 dB. For a 2.5 dB standard deviation of powercontrol error, the percentage of capacity loss increases to 13%.
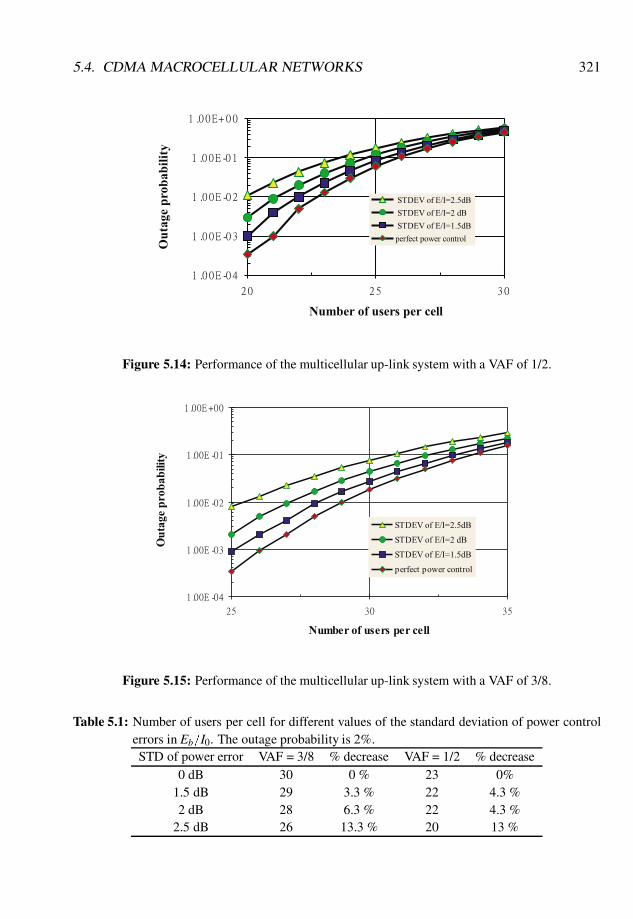
5.4. CDMA MACROCELLULAR NETWORKS 321
Figure 5.14: Performance of the multicellular up-link system with a VAF of 1/2.
Figure 5.15: Performance of the multicellular up-link system with a VAF of 3/8.
Table 5.1: Number of users per cell for different values of the standard deviation of power controlerrors in Eb=I0. The outage probability is 2%.STD of power error VAF = 3/8 % decrease VAF = 1/2 % decrease
0 dB 30 0 % 23 0%1.5 dB 29 3.3 % 22 4.3 %2 dB 28 6.3 % 22 4.3 %
2.5 dB 26 13.3 % 20 13 %
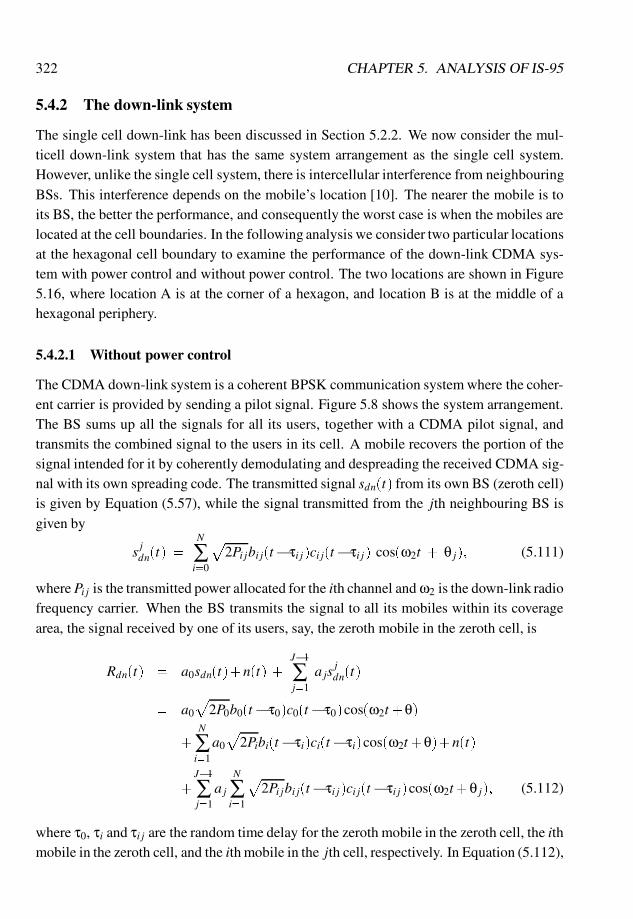
322 CHAPTER 5. ANALYSIS OF IS-95
5.4.2 The down-link system
The single cell down-link has been discussed in Section 5.2.2. We now consider the mul-ticell down-link system that has the same system arrangement as the single cell system.However, unlike the single cell system, there is intercellular interference from neighbouringBSs. This interference depends on the mobile’s location [10]. The nearer the mobile is toits BS, the better the performance, and consequently the worst case is when the mobiles arelocated at the cell boundaries. In the following analysis we consider two particular locationsat the hexagonal cell boundary to examine the performance of the down-link CDMA sys-tem with power control and without power control. The two locations are shown in Figure5.16, where location A is at the corner of a hexagon, and location B is at the middle of ahexagonal periphery.
5.4.2.1 Without power control
The CDMA down-link system is a coherent BPSK communication system where the coher-ent carrier is provided by sending a pilot signal. Figure 5.8 shows the system arrangement.The BS sums up all the signals for all its users, together with a CDMA pilot signal, andtransmits the combined signal to the users in its cell. A mobile recovers the portion of thesignal intended for it by coherently demodulating and despreading the received CDMA sig-nal with its own spreading code. The transmitted signal sdn(t) from its own BS (zeroth cell)is given by Equation (5.57), while the signal transmitted from the jth neighbouring BS isgiven by
s jdn(t) =N
∑i=0
p2Pi jbi j(t�τi j)ci j(t�τi j) cos(ω2t + θ j); (5.111)
where Pi j is the transmitted power allocated for the ith channel and ω2 is the down-link radiofrequency carrier. When the BS transmits the signal to all its mobiles within its coveragearea, the signal received by one of its users, say, the zeroth mobile in the zeroth cell, is
Rdn(t) = a0sdn(t)+n(t) +J�1
∑j=1
a jsjdn(t)
= a0
p2P0b0(t�τ0)c0(t�τ0)cos(ω2t+θ)
+N
∑i=1
a0
p2Pibi(t�τi)ci(t�τi)cos(ω2t+θ)+n(t)
+J�1
∑j=1
a j
N
∑i=1
p2Pi jbi j(t�τi j)ci j(t�τi j)cos(ω2t+θ j); (5.112)
where τ0, τi and τi j are the random time delay for the zeroth mobile in the zeroth cell, the ithmobile in the zeroth cell, and the ith mobile in the jth cell, respectively. In Equation (5.112),
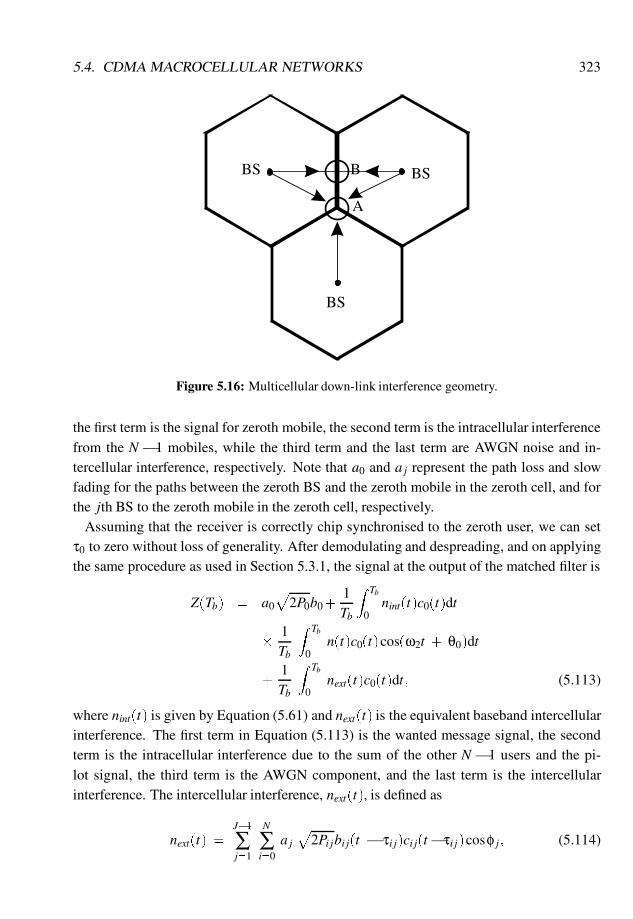
5.4. CDMA MACROCELLULAR NETWORKS 323
A
BBS BS
BS
Figure 5.16: Multicellular down-link interference geometry.
the first term is the signal for zeroth mobile, the second term is the intracellular interferencefrom the N � 1 mobiles, while the third term and the last term are AWGN noise and in-tercellular interference, respectively. Note that a0 and a j represent the path loss and slowfading for the paths between the zeroth BS and the zeroth mobile in the zeroth cell, and forthe jth BS to the zeroth mobile in the zeroth cell, respectively.
Assuming that the receiver is correctly chip synchronised to the zeroth user, we can setτ0 to zero without loss of generality. After demodulating and despreading, and on applyingthe same procedure as used in Section 5.3.1, the signal at the output of the matched filter is
Z(Tb) = a0
p2P0b0+
1Tb
Z Tb
0nint(t)c0(t)dt
�
1Tb
Z Tb
0n(t)c0(t)cos(ω2t + θ0)dt
+1Tb
Z Tb
0next(t)c0(t)dt; (5.113)
where nint(t) is given by Equation (5.61) and next(t) is the equivalent baseband intercellularinterference. The first term in Equation (5.113) is the wanted message signal, the secondterm is the intracellular interference due to the sum of the other N � 1 users and the pi-lot signal, the third term is the AWGN component, and the last term is the intercellularinterference. The intercellular interference, next(t), is defined as
next(t) =J�1
∑j=1
N
∑i=0
a jp
2Pi jbi j(t � τi j)ci j(t�τi j)cosφ j; (5.114)
324 CHAPTER 5. ANALYSIS OF IS-95
where φ j is the phase difference between the neighbouring BS carrier and the zeroth BScarrier.
The performance of the down-link can be analysed by following the procedure used in theup-link analysis. The signal power and the AWGN power are given by
S = 2a20 P0 (5.115)
andη = N0 Rb: (5.116)
With reference to Equation (5.65), the intracellular interference-to-signal power ratio is, onthe assumption that the pilot channel has the same power as the traffic channels,
IintS=
1Gp
N
∑i=1
viPiP0=
1Gp
N
∑i=1
vi : (5.117)
Similarly, the intercellular interference-to-signal power ratio can be shown to be
IextS=
12Gp
J�1
∑j=1
N
∑i=0
vi ja2jPi j
a20P0
; (5.118)
and with the aid of Equation (5.79) we can find (a j=a0)2 to give
IextS
=1
2Gp
J�1
∑j=1
N
∑i=0
vi jPi jP0
�r0
r j
�α10
λ j�λ010 : (5.119)
Since there is no power control considered on the down-link, pi j = p0, and hence
IextS
=12
1Gp
J�1
∑j=1
N
∑i=0
vi j
�r0
r j
�α10
ζ j10 ; (5.120)
where Pi j is the transmitted power from the jth BS for the ith mobile in the jth cell, vi j isthe mobile’s voice activity variable, N is the number of users in the cell, R is the cell radius,r j is the distance between the neighbouring jth BS and the zeroth mobile in the zeroth cell,and r0 is the distance between the zeroth mobile and the zeroth BS. Note that there is afactor of 1/2 in Iext=S, due to the carrier incoherence between the zeroth and jth BSs.
Because the system should be designed to give a required performance for any mobilewithin its cell area, the performance of a mobile located at the cell boundary is particularlycritical in the system analysis. Therefore we consider two locations, A and B, at the bound-ary, as shown in Figure 5.16, to examine the performance in the down-link. By combiningEquations (5.115), (5.116), (5.117), and (5.120), the output of the matched filter has abit-energy- to-interference PSD of
Eb
I0=
SI=
1
1Gp
�∑Ni=1 vi + ∑J�1
j=1 ∑Ni=0
12vi j10
ζ j10
�r0r j
�α�+ η
S
; (5.121)
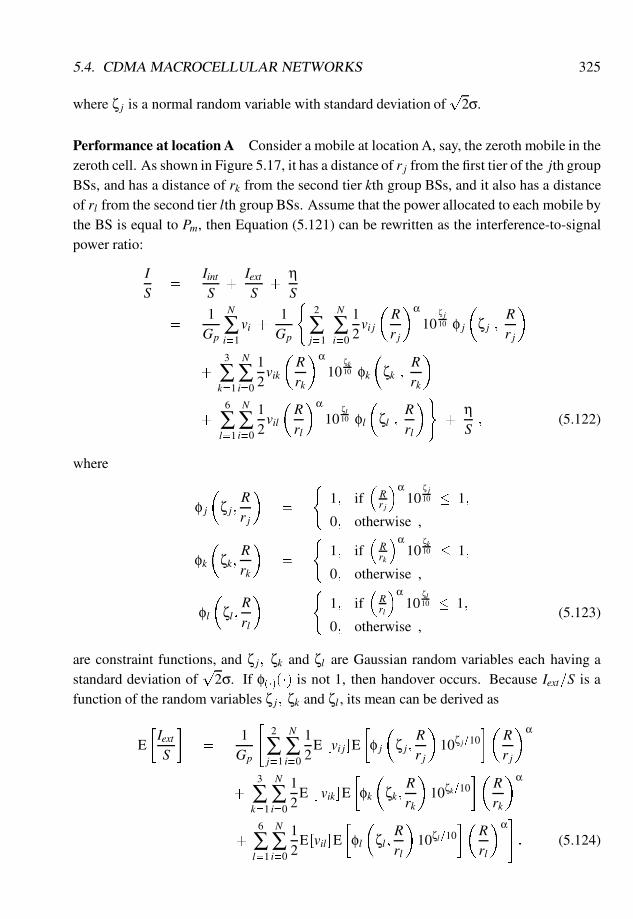
5.4. CDMA MACROCELLULAR NETWORKS 325
where ζ j is a normal random variable with standard deviation ofp
2σ.
Performance at location A Consider a mobile at location A, say, the zeroth mobile in thezeroth cell. As shown in Figure 5.17, it has a distance of r j from the first tier of the jth groupBSs, and has a distance of rk from the second tier kth group BSs, and it also has a distanceof rl from the second tier lth group BSs. Assume that the power allocated to each mobile bythe BS is equal to Pm, then Equation (5.121) can be rewritten as the interference-to-signalpower ratio:
IS
=
IintS
+IextS
+ηS
=1Gp
N
∑i=1
vi +1Gp
(2
∑j=1
N
∑i=0
12vi j
�Rr j
�α10
ζ j10 φ j
�ζ j ;
Rr j
�
+3
∑k=1
N
∑i=0
12vik
�Rrk
�α10
ζk10 φk
�ζk ;
Rrk
�
+6
∑l=1
N
∑i=0
12vil
�Rrl
�α10
ζl10 φl
�ζl ;
Rrl
�)+
ηS
; (5.122)
where
φ j
�ζ j;
Rr j
�=
(1; if
�Rr j
�α10
ζ j10 � 1;
0; otherwise ,
φk
�ζk;
Rrk
�=
(1; if
�Rrk
�α10
ζk10 � 1;
0; otherwise ,
φl
�ζl ;
Rrl
�=
(1; if
�Rrl
�α10
ζl10 � 1;
0; otherwise ,(5.123)
are constraint functions, and ζ j; ζk and ζl are Gaussian random variables each having astandard deviation of
p2σ. If φ(�)(�) is not 1, then handover occurs. Because Iext=S is a
function of the random variables ζ j; ζk and ζl , its mean can be derived as
E
�IextS
�=
1Gp
"2
∑j=1
N
∑i=0
12
E [vi j]E
�φ j
�ζ j;
Rr j
�10ζ j=10
��Rr j
�α
+3
∑k=1
N
∑i=0
12
E [ vik]E
�φk
�ζk;
Rrk
�10ζk=10
��Rrk
�α
+6
∑l=1
N
∑i=0
12
E [vil]E
�φl
�ζl;
Rrl
�10ζl=10
��Rrl
�α#: (5.124)
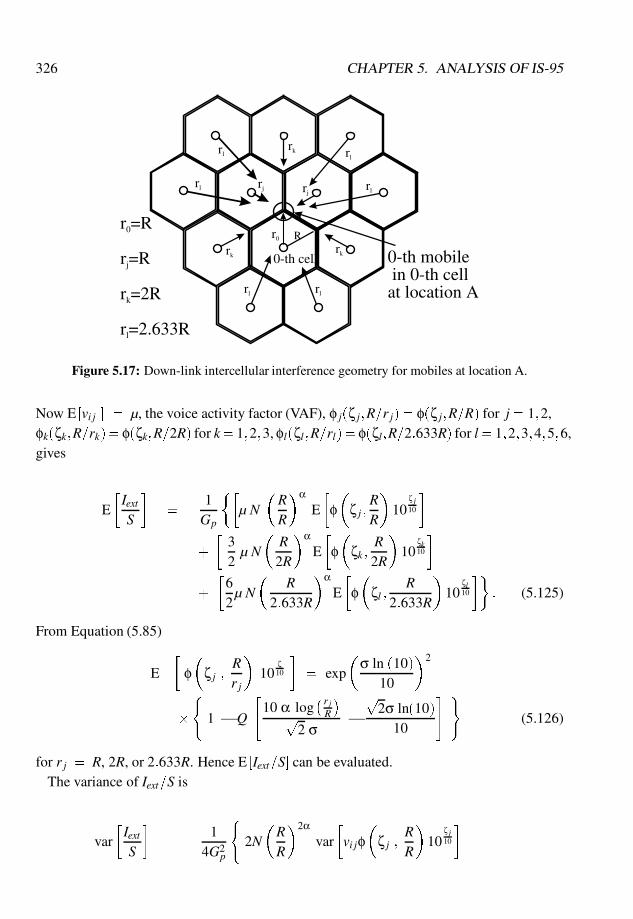
326 CHAPTER 5. ANALYSIS OF IS-95
rj
r0
rl
rjrl
rl rl
rl
rk
rl
rk
rk0-th cell
R
0-th mobilein 0-th cell
at location A
r0=R
rj=R
rk=2R
rl=2.633R
Figure 5.17: Down-link intercellular interference geometry for mobiles at location A.
Now E [vi j ] = µ, the voice activity factor (VAF), φ j(ζ j;R=r j) = φ(ζ j;R=R) for j= 1;2,φk(ζk;R=rk) = φ(ζk;R=2R) for k= 1;2;3, φl(ζl;R=rl) = φ(ζl;R=2:633R) for l= 1;2;3;4;5;6,gives
E
�IextS
�=
1Gp
��µ N
�RR
�αE
�φ�
ζ j;RR
�10
ζ j10
�
+
�32µ N
�R
2R
�αE
�φ�
ζk;R2R
�10
ζk10
�
+
�62µ N
�R
2:633R
�αE
�φ�
ζl ;R
2:633R
�10
ζl10
��: (5.125)
From Equation (5.85)
E
�φ�
ζ j ;Rr j
�10
ζ10
�= exp
�σ ln (10)
10
�2
�
(1 � Q
"10 α log
� r jR
�p
2 σ�p
2σ ln(10)10
# )(5.126)
for r j = R, 2R, or 2:633R. Hence E [Iext=S] can be evaluated.The variance of Iext=S is
var
�IextS
�=
14G2
p
(2N
�RR
�2αvar
�vi jφ
�ζ j ;
RR
�10
ζ j10
�

5.4. CDMA MACROCELLULAR NETWORKS 327
+ 3N
�R
2R
�2αvar
�vikφ
�ζk ;
R2R
�10
ζk10
�
+ 6N
�R
2:633R
�2αvar
�vilφ�
ζl ;R
2:633R
�10
ζl10
�)(5.127)
and
var
�vi jφ
�ζ j;
Rr j
�10
ζ j10
�= µexp
�σln(10)
5
�2
�
(1�Q
"10α log
� r jR
�p
2σ�p
2σln(10)5
#)
� µ2E
�φ j
�ζ j;
Rr j
�10
ζ10
�2
; (5.128)
for r j = R, 2R or 2:633R. Armed with these variances in Equation 5.128 we can computevar [Iext=S].
While the intracellular interference-to-signal ratio in Equation (5.122) is not affected byshadowing, the intercellular interference-to-signal ratio is affected. As a result, the overallEb=I0 varies about a mean value. Applying the same method that led to the derivation ofEquation (5.99), the outage probability of the down-link becomes
po = Pr
�SI< γreq
�= Pr
�IS>
1γreq
�
= Pr
IextS
>1
γreq� η
S� Iint
S
�����N�1
∑i=0
vi = k
!Pr
N�1
∑i=0
vi = k
!
=N
∑k=1
�Nk
�µk(1�µ)N�k
� Q
1=γreq�η=S�k=Gp�E[Iext=S]p
var[Iext=S]
!: (5.129)
Since the pilot signal is transmitted all the time, the minimal number of active channels isone. As a result, the summation in Equation (5.129) is from 1 to N.
For a CDMA system having a processing gain of 128, a signal-to-AWGN ratio of 20 dBat the matched filter output, a radio channel with an inverse fourth power path loss law, andan 8 dB standard deviation for the slow fading, the performance of a mobile at location Afor a VAF of 1/2 and 3/8 is shown in Figure 5.18. While maintaining an outage probabilityof 2%, the down-link can support up to 23 users and 30 users for a VAF of 1/2 and 3/8,respectively.
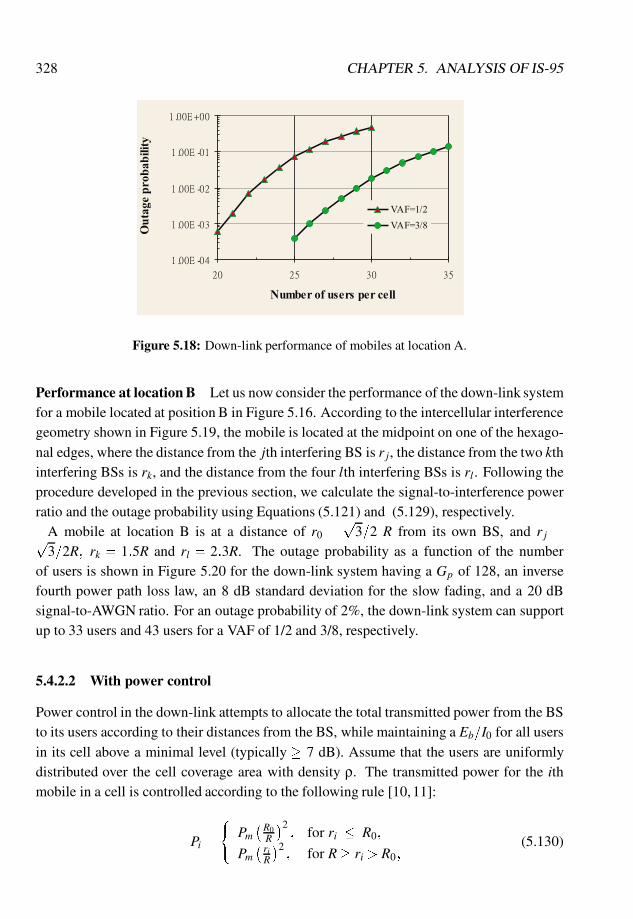
328 CHAPTER 5. ANALYSIS OF IS-95
Figure 5.18: Down-link performance of mobiles at location A.
Performance at location B Let us now consider the performance of the down-link systemfor a mobile located at position B in Figure 5.16. According to the intercellular interferencegeometry shown in Figure 5.19, the mobile is located at the midpoint on one of the hexago-nal edges, where the distance from the jth interfering BS is r j, the distance from the two kthinterfering BSs is rk, and the distance from the four lth interfering BSs is rl . Following theprocedure developed in the previous section, we calculate the signal-to-interference powerratio and the outage probability using Equations (5.121) and (5.129), respectively.
A mobile at location B is at a distance of r0 =p
3=2 R from its own BS, and r j =p3=2R; rk = 1:5R and rl = 2:3R. The outage probability as a function of the number
of users is shown in Figure 5.20 for the down-link system having a Gp of 128, an inversefourth power path loss law, an 8 dB standard deviation for the slow fading, and a 20 dBsignal-to-AWGN ratio. For an outage probability of 2%, the down-link system can supportup to 33 users and 43 users for a VAF of 1/2 and 3/8, respectively.
5.4.2.2 With power control
Power control in the down-link attempts to allocate the total transmitted power from the BSto its users according to their distances from the BS, while maintaining a Eb=I0 for all usersin its cell above a minimal level (typically � 7 dB). Assume that the users are uniformlydistributed over the cell coverage area with density ρ. The transmitted power for the ithmobile in a cell is controlled according to the following rule [10,11]:
Pi =
(Pm
�R0R
�2; for ri � R0;
Pm� riR
�2; for R� ri > R0;
(5.130)

5.4. CDMA MACROCELLULAR NETWORKS 329
2.6R
rl
rk
rk
rl
rl
2.6R
rlrj
r0
r0=0.87R
rj=0.87R
rk=1.5R
rl=2.3R
0-th cell
rl
R
0-th mobileat location B
Figure 5.19: Down-link intercellular interference geometry for mobiles at location B.
Figure 5.20: Down-link performance of a mobile at location B.
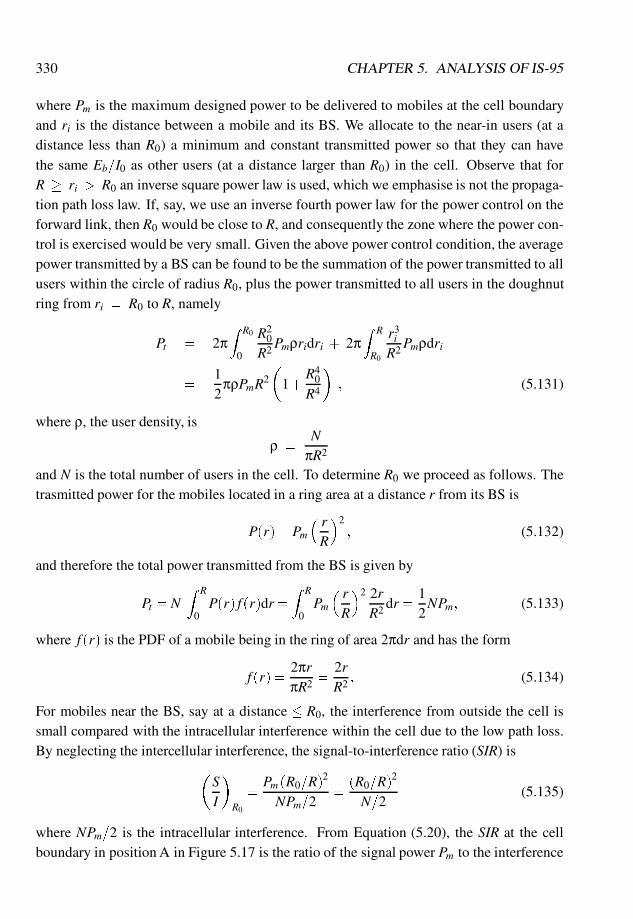
330 CHAPTER 5. ANALYSIS OF IS-95
where Pm is the maximum designed power to be delivered to mobiles at the cell boundaryand ri is the distance between a mobile and its BS. We allocate to the near-in users (at adistance less than R0) a minimum and constant transmitted power so that they can havethe same Eb=I0 as other users (at a distance larger than R0) in the cell. Observe that forR � ri > R0 an inverse square power law is used, which we emphasise is not the propaga-tion path loss law. If, say, we use an inverse fourth power law for the power control on theforward link, then R0 would be close to R, and consequently the zone where the power con-trol is exercised would be very small. Given the above power control condition, the averagepower transmitted by a BS can be found to be the summation of the power transmitted to allusers within the circle of radius R0, plus the power transmitted to all users in the doughnutring from ri = R0 to R, namely
Pt = 2πZ R0
0
R20
R2Pmρridri + 2πZ R
R0
r3i
R2Pmρdri
=12
πρPmR2�
1+R4
0
R4
�; (5.131)
where ρ, the user density, is
ρ =N
πR2
and N is the total number of users in the cell. To determine R0 we proceed as follows. Thetrasmitted power for the mobiles located in a ring area at a distance r from its BS is
P(r) = Pm� rR
�2; (5.132)
and therefore the total power transmitted from the BS is given by
Pt = NZ R
0P(r) f (r)dr=
Z R
0Pm� rR
�2 2rR2 dr=
12NPm; (5.133)
where f (r) is the PDF of a mobile being in the ring of area 2πdr and has the form
f (r) =2πrπR2 =
2rR2 : (5.134)
For mobiles near the BS, say at a distance � R0, the interference from outside the cell issmall compared with the intracellular interference within the cell due to the low path loss.By neglecting the intercellular interference, the signal-to-interference ratio (SIR) is
�SI
�R0
=Pm (R0=R)
2
NPm=2=(R0=R)
2
N=2(5.135)
where NPm=2 is the intracellular interference. From Equation (5.20), the SIR at the cellboundary in position A in Figure 5.17 is the ratio of the signal power Pm to the interference
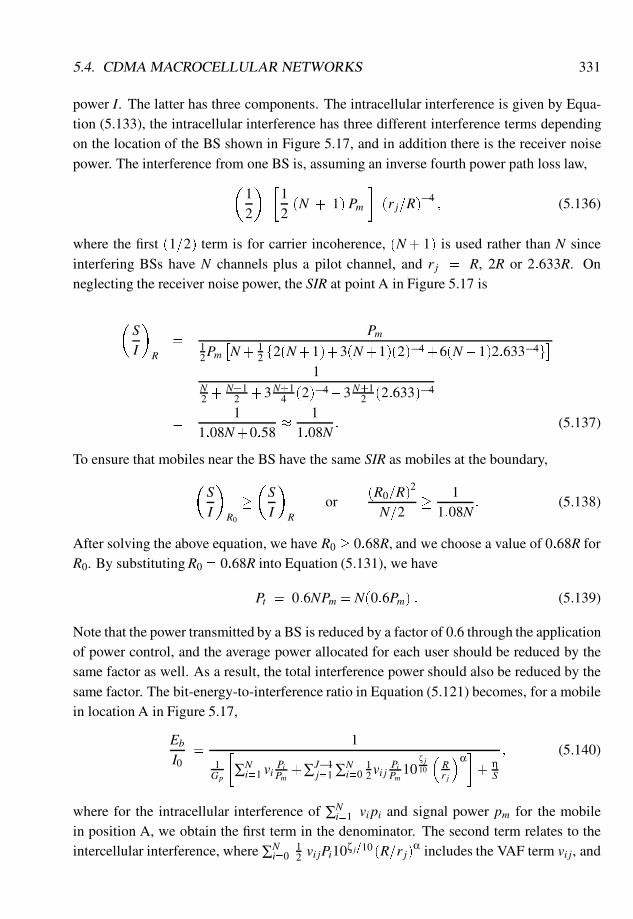
5.4. CDMA MACROCELLULAR NETWORKS 331
power I. The latter has three components. The intracellular interference is given by Equa-tion (5.133), the intracellular interference has three different interference terms dependingon the location of the BS shown in Figure 5.17, and in addition there is the receiver noisepower. The interference from one BS is, assuming an inverse fourth power path loss law,
�12
� �12(N + 1) Pm
�(r j=R)
�4 ; (5.136)
where the first (1=2) term is for carrier incoherence, (N + 1) is used rather than N sinceinterfering BSs have N channels plus a pilot channel, and r j = R, 2R or 2:633R. Onneglecting the receiver noise power, the SIR at point A in Figure 5.17 is
�SI
�R
=Pm
12Pm
�N+ 1
2 f2(N+1)+3(N+1)(2)�4+6(N+1)2:633�4g�
=1
N2 +
N+12 +3N+1
4 (2)�4+3N+12 (2:633)�4
=1
1:08N+0:58�
11:08N
: (5.137)
To ensure that mobiles near the BS have the same SIR as mobiles at the boundary,
�SI
�R0
�
�SI
�R
or(R0=R)
2
N=2�
11:08N
: (5.138)
After solving the above equation, we have R0 � 0:68R, and we choose a value of 0:68R forR0. By substitutingR0 = 0:68R into Equation (5.131), we have
Pt = 0:6NPm = N(0:6Pm) : (5.139)
Note that the power transmitted by a BS is reduced by a factor of 0.6 through the applicationof power control, and the average power allocated for each user should be reduced by thesame factor as well. As a result, the total interference power should also be reduced by thesame factor. The bit-energy-to-interference ratio in Equation (5.121) becomes, for a mobilein location A in Figure 5.17,
Eb
I0=
1
1Gp
�∑Ni=1 vi
PiPm+∑J�1
j=1 ∑Ni=0
12vi j
PiPm
10ζ j10
�Rr j
�α�+ η
S
; (5.140)
where for the intracellular interference of ∑Ni=1 vi pi and signal power pm for the mobile
in position A, we obtain the first term in the denominator. The second term relates to theintercellular interference, where ∑N
i=012 vi jPi10ζ j=10 (R=r j)
α includes the VAF term vi j, and
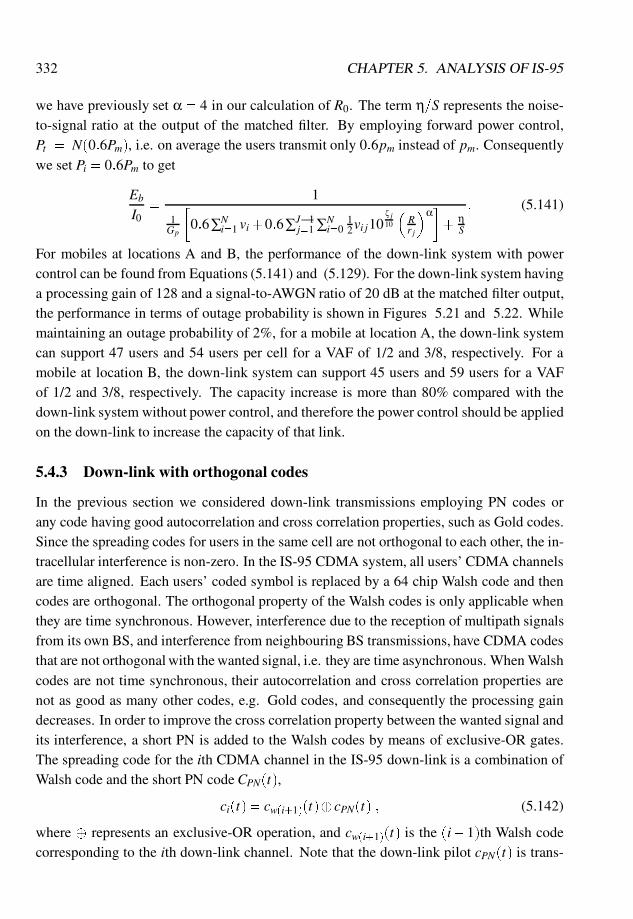
332 CHAPTER 5. ANALYSIS OF IS-95
we have previously set α= 4 in our calculation of R0. The term η=S represents the noise-to-signal ratio at the output of the matched filter. By employing forward power control,Pt = N(0:6Pm), i.e. on average the users transmit only 0:6pm instead of pm. Consequentlywe set Pi = 0:6Pm to get
Eb
I0=
1
1Gp
�0:6∑N
i=1 vi+0:6∑J�1j=1 ∑N
i=012vi j10
ζ j10
�Rr j
�α�+ η
S
: (5.141)
For mobiles at locations A and B, the performance of the down-link system with powercontrol can be found from Equations (5.141) and (5.129). For the down-link system havinga processing gain of 128 and a signal-to-AWGN ratio of 20 dB at the matched filter output,the performance in terms of outage probability is shown in Figures 5.21 and 5.22. Whilemaintaining an outage probability of 2%, for a mobile at location A, the down-link systemcan support 47 users and 54 users per cell for a VAF of 1/2 and 3/8, respectively. For amobile at location B, the down-link system can support 45 users and 59 users for a VAFof 1/2 and 3/8, respectively. The capacity increase is more than 80% compared with thedown-link system without power control, and therefore the power control should be appliedon the down-link to increase the capacity of that link.
5.4.3 Down-link with orthogonal codes
In the previous section we considered down-link transmissions employing PN codes orany code having good autocorrelation and cross correlation properties, such as Gold codes.Since the spreading codes for users in the same cell are not orthogonal to each other, the in-tracellular interference is non-zero. In the IS-95 CDMA system, all users’ CDMA channelsare time aligned. Each users’ coded symbol is replaced by a 64 chip Walsh code and thencodes are orthogonal. The orthogonal property of the Walsh codes is only applicable whenthey are time synchronous. However, interference due to the reception of multipath signalsfrom its own BS, and interference from neighbouring BS transmissions, have CDMA codesthat are not orthogonal with the wanted signal, i.e. they are time asynchronous. When Walshcodes are not time synchronous, their autocorrelation and cross correlation properties arenot as good as many other codes, e.g. Gold codes, and consequently the processing gaindecreases. In order to improve the cross correlation property between the wanted signal andits interference, a short PN is added to the Walsh codes by means of exclusive-OR gates.The spreading code for the ith CDMA channel in the IS-95 down-link is a combination ofWalsh code and the short PN code CPN(t),
ci(t) = cw(i+1)(t)�cPN(t) ; (5.142)
where � represents an exclusive-OR operation, and cw(i+1)(t) is the (i+ 1)th Walsh codecorresponding to the ith down-link channel. Note that the down-link pilot cPN(t) is trans-
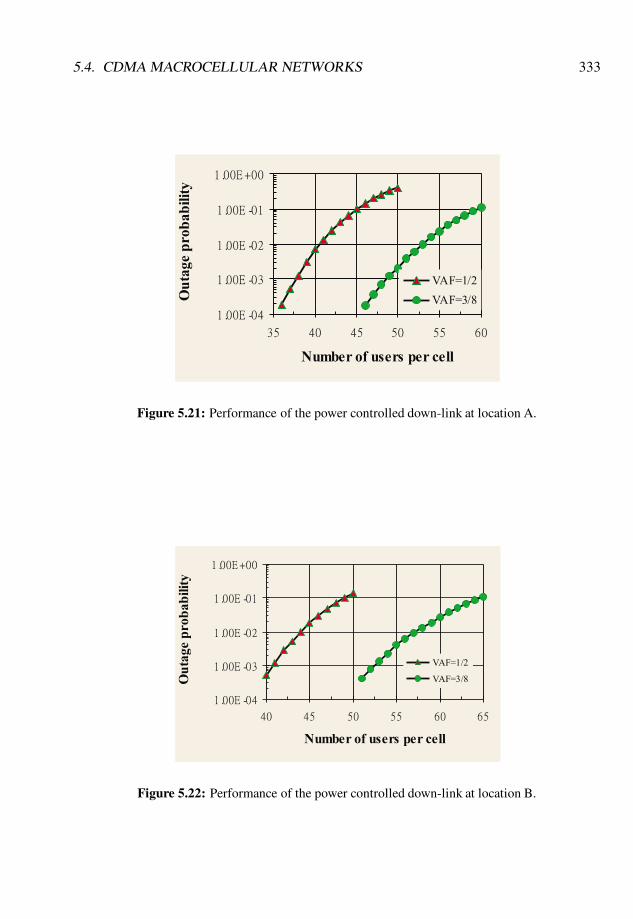
5.4. CDMA MACROCELLULAR NETWORKS 333
Figure 5.21: Performance of the power controlled down-link at location A.
Figure 5.22: Performance of the power controlled down-link at location B.

334 CHAPTER 5. ANALYSIS OF IS-95
mitted on the Nth channel and is in fact the code CPN(t) exclusively-ORed with the zerothWalsh code cw0(t), which is a constant, i.e.
cN(t) = cw0(t)�cPN(t) = cPN(t): (5.143)
By arranging for a logical 1 to be represented by +1 and a logical 0 by�1, the exclusive-ORoperation may be expressed as
ci(t) =�cw(i+1)(t)cPN(t)� (5.144)
When the orthogonal spreading codes are used on the down-link, and the multipath inter-ference is removed by the RAKE, FEC coding and symbol interleaving, the performance isimproved, as we will now describe. Let us consider the zeroth mobile user who is commu-nicating with the zeroth BS. The intracellular interference component at the output of thematched filter now becomes
Zint(Tb) =1Tb
Z Tb
0nint(t)c0(t)dt
=1Tb
Z Tb
0nint(t) [�cw1(t)cPN(t)]dt ; (5.145)
where cw1(t) is the Walsh code for the zeroth channel. The equivalent baseband intracellularinterference now becomes
nint(t) = a0
N
∑i=1
p2Pibi(t)ci(t)
= a0
N�1
∑i=1
p2Pibi(t)
��cw(i+1)(t)cPN(t)
�
� a0p
2Ppcw0(t)cPN(t) (5.146)
where the second term in the equation relates to the pilot signal, since bN(t)= 1 and PN =Ppis the transmitted power, and a0 is due to the path loss and shadow fading. The pilot powerPp takes 20% of the total down-link power. Substituting nint(t) from Equation (5.146) intoEquation (5.145) gives
Zint(Tb) =a0
Tb
N�1
∑i=1
p2Pi
Z Tb
0bi(t)
��cw(i+1)(t)cPN(t)
�[�cw1(t)cPN(t)]dt
+a0
Tb
p2Pp
Z Tb
0[�cw0(t)cPN(t)][�cw1(t)cPN(t)]dt
=a0
Tb
N�1
∑i=1
p2Pi
Z Tb
0bi(t) [cPN(t)cPN(t)]
�cw1(t)cw(i+1)(t)
�dt
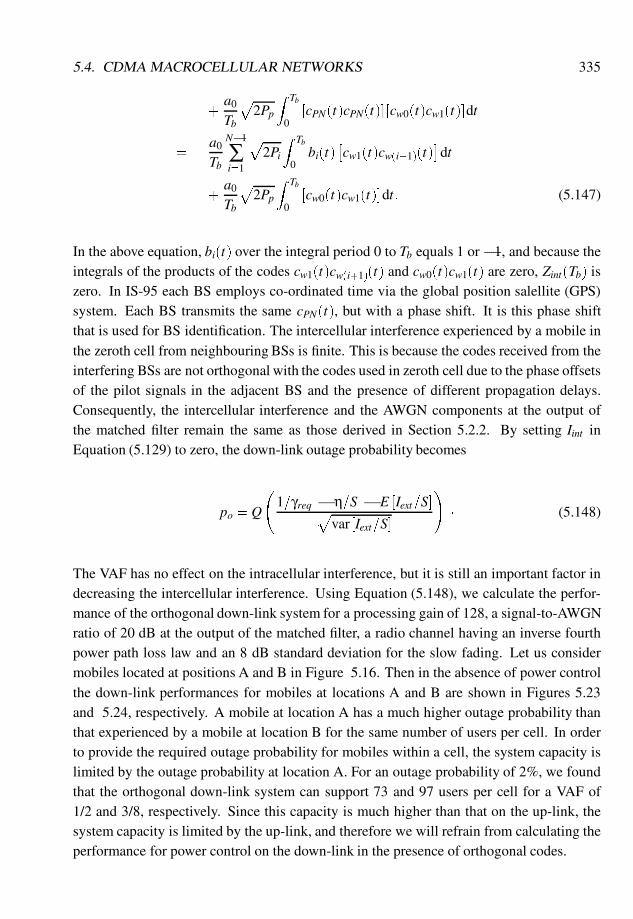
5.4. CDMA MACROCELLULAR NETWORKS 335
+a0
Tb
p2Pp
Z Tb
0[cPN(t)cPN(t)][cw0(t)cw1(t)]dt
=a0
Tb
N�1
∑i=1
p2Pi
Z Tb
0bi(t)
�cw1(t)cw(i+1)(t)
�dt
+a0
Tb
p2Pp
Z Tb
0[cw0(t)cw1(t)]dt: (5.147)
In the above equation, bi(t) over the integral period 0 to Tb equals 1 or �1, and because theintegrals of the products of the codes cw1(t)cw(i+1)(t) and cw0(t)cw1(t) are zero, Zint(Tb) iszero. In IS-95 each BS employs co-ordinated time via the global position salellite (GPS)system. Each BS transmits the same cPN(t), but with a phase shift. It is this phase shiftthat is used for BS identification. The intercellular interference experienced by a mobile inthe zeroth cell from neighbouring BSs is finite. This is because the codes received from theinterfering BSs are not orthogonal with the codes used in zeroth cell due to the phase offsetsof the pilot signals in the adjacent BS and the presence of different propagation delays.Consequently, the intercellular interference and the AWGN components at the output ofthe matched filter remain the same as those derived in Section 5.2.2. By setting Iint inEquation (5.129) to zero, the down-link outage probability becomes
po = Q
1=γreq � η=S � E [Iext=S]p
var [Iext=S]
!� (5.148)
The VAF has no effect on the intracellular interference, but it is still an important factor indecreasing the intercellular interference. Using Equation (5.148), we calculate the perfor-mance of the orthogonal down-link system for a processing gain of 128, a signal-to-AWGNratio of 20 dB at the output of the matched filter, a radio channel having an inverse fourthpower path loss law and an 8 dB standard deviation for the slow fading. Let us considermobiles located at positions A and B in Figure 5.16. Then in the absence of power controlthe down-link performances for mobiles at locations A and B are shown in Figures 5.23and 5.24, respectively. A mobile at location A has a much higher outage probability thanthat experienced by a mobile at location B for the same number of users per cell. In orderto provide the required outage probability for mobiles within a cell, the system capacity islimited by the outage probability at location A. For an outage probability of 2%, we foundthat the orthogonal down-link system can support 73 and 97 users per cell for a VAF of1/2 and 3/8, respectively. Since this capacity is much higher than that on the up-link, thesystem capacity is limited by the up-link, and therefore we will refrain from calculating theperformance for power control on the down-link in the presence of orthogonal codes.

336 CHAPTER 5. ANALYSIS OF IS-95
Figure 5.23: Down-link performance of mobiles at location A when the CDMA codes are orthogo-nal.
Figure 5.24: Down-link performance of mobiles at location B when the CDMA codes are orthogo-nal.
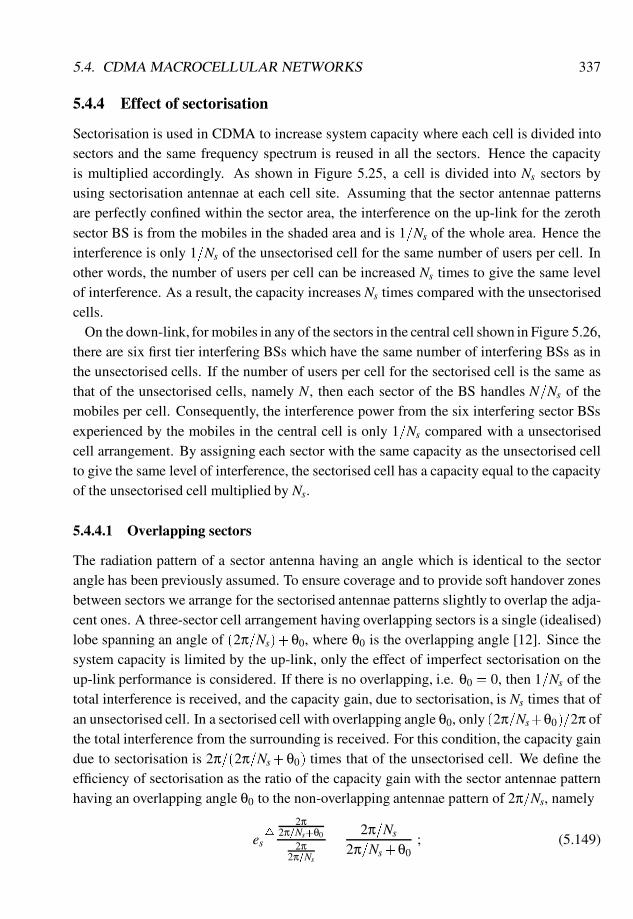
5.4. CDMA MACROCELLULAR NETWORKS 337
5.4.4 Effect of sectorisation
Sectorisation is used in CDMA to increase system capacity where each cell is divided intosectors and the same frequency spectrum is reused in all the sectors. Hence the capacityis multiplied accordingly. As shown in Figure 5.25, a cell is divided into Ns sectors byusing sectorisation antennae at each cell site. Assuming that the sector antennae patternsare perfectly confined within the sector area, the interference on the up-link for the zerothsector BS is from the mobiles in the shaded area and is 1=Ns of the whole area. Hence theinterference is only 1=Ns of the unsectorised cell for the same number of users per cell. Inother words, the number of users per cell can be increased Ns times to give the same levelof interference. As a result, the capacity increases Ns times compared with the unsectorisedcells.
On the down-link, for mobiles in any of the sectors in the central cell shown in Figure 5.26,there are six first tier interfering BSs which have the same number of interfering BSs as inthe unsectorised cells. If the number of users per cell for the sectorised cell is the same asthat of the unsectorised cells, namely N, then each sector of the BS handles N=Ns of themobiles per cell. Consequently, the interference power from the six interfering sector BSsexperienced by the mobiles in the central cell is only 1=Ns compared with a unsectorisedcell arrangement. By assigning each sector with the same capacity as the unsectorised cellto give the same level of interference, the sectorised cell has a capacity equal to the capacityof the unsectorised cell multiplied by Ns.
5.4.4.1 Overlapping sectors
The radiation pattern of a sector antenna having an angle which is identical to the sectorangle has been previously assumed. To ensure coverage and to provide soft handover zonesbetween sectors we arrange for the sectorised antennae patterns slightly to overlap the adja-cent ones. A three-sector cell arrangement having overlapping sectors is a single (idealised)lobe spanning an angle of (2π=Ns)+θ0, where θ0 is the overlapping angle [12]. Since thesystem capacity is limited by the up-link, only the effect of imperfect sectorisation on theup-link performance is considered. If there is no overlapping, i.e. θ0 = 0, then 1=Ns of thetotal interference is received, and the capacity gain, due to sectorisation, is Ns times that ofan unsectorised cell. In a sectorised cell with overlapping angle θ0, only (2π=Ns+θ0)=2π ofthe total interference from the surrounding is received. For this condition, the capacity gaindue to sectorisation is 2π=(2π=Ns+θ0) times that of the unsectorised cell. We define theefficiency of sectorisation as the ratio of the capacity gain with the sector antennae patternhaving an overlapping angle θ0 to the non-overlapping antennae pattern of 2π=Ns, namely
es4=
2π2π=Ns+θ0
2π2π=Ns
=2π=Ns
2π=Ns+θ0; (5.149)
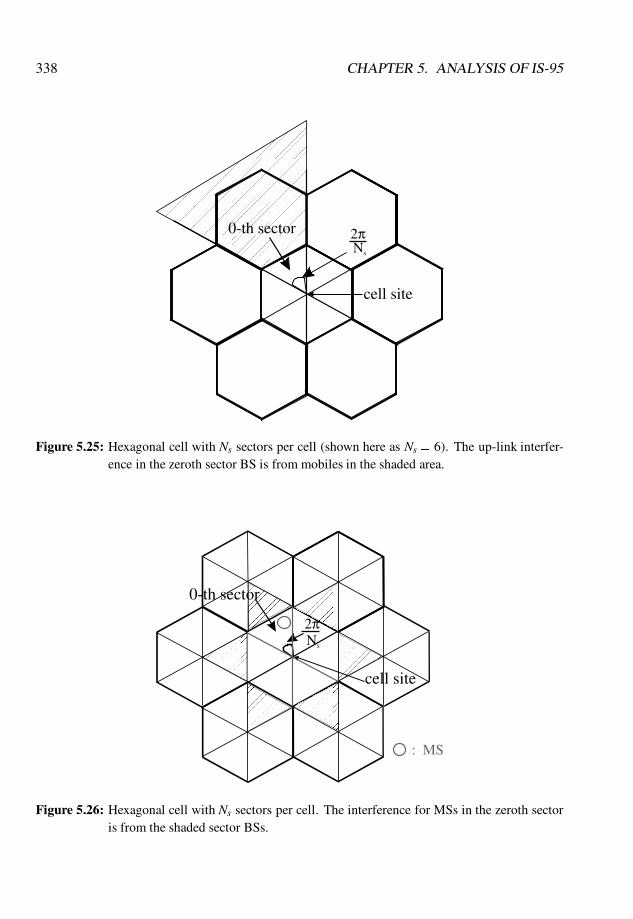
338 CHAPTER 5. ANALYSIS OF IS-95
0-th sector 2πNs
cell site
Figure 5.25: Hexagonal cell with Ns sectors per cell (shown here as Ns = 6). The up-link interfer-ence in the zeroth sector BS is from mobiles in the shaded area.
0-th sector
: MS
2πNs
cell site
Figure 5.26: Hexagonal cell with Ns sectors per cell. The interference for MSs in the zeroth sectoris from the shaded sector BSs.

5.4. CDMA MACROCELLULAR NETWORKS 339
360ο/Ns +θo
R
θo/2
overlapping angle θο
Figure 5.27: A model for imperfect sectorisation in a hexagonal cell, shown with a three sectors percell arrangement.
the corresponding gain is Nses.For a three sectors per cell arrangement, the capacity gain due to sectorisation, and its
corresponding sectorisation efficiency, for different values of overlapping angle θ0 in de-grees is shown in Figure 5.28 where θ0 = 0 denotes a nominal antenna pattern of 120�. Theinterference on the up-link increases as the overlapping angle θ0 is increased, which causesthe capacity gain and sectorisation efficiency to decrease proportionately. Increasing θ0
from 0� to 5� causes the capacity gain to decrease from 3 to 2:88, while the correspondingsectorisation efficiency drops from 100% to 96%.
Observe that by using overlapping sectors soft handovers can be used where the transmit-ted power of MSs in the overlapping sectors is decreased due to both adjacent sector BSshandling the call. Soft handovers, often called softer handovers, are between sectors, andtherefore decrease the total interference and thereby increase the capacity.
5.4.5 The capacity of the IS-95 CDMA in macrocells
In the previous subsections we investigated the performance of the up-link and down-linkin terms of the number of users per cell. We will now evaluate the capacity of the CDMAsystem in terms of channels per cell per MHz and compare our findings with the capacityof the modern TDMA system described in Chapter 3.
For the down-link, when power control is not used, and a mobile is located at an apex of acell (position A in Figure 5.17) the number of users per cell is the same as the performanceof the up-link when this link has perfect power control. Consequently, when the up- linkhas imperfect power control, the performance of the down-link is superior. The down-link,or forward link, is enhanced when it has power control.

340 CHAPTER 5. ANALYSIS OF IS-95
Figure 5.28: Capacity gain due to sectorisation and sectorisation efficiency as a function of theoverlapping angle θ0 for the three sectors per cell arrangement.
Therefore it is reasonable to say that the capacity of a CDMA system is limited by theup-link performance. With a message bit rate of 10 kb/s, a processing gain of 128, and threesectors per cell, the capacity of the CDMA system in terms of numbers of channels per cellper MHz is given as
kCDMA =NNsesW
=
NNsesRbM
=
NNses1:27
; (5.150)
where N is the number of users per sector, Ns is the number of sectors per cell, es is thesectorisation efficiency andW is the bandwidth in MHz. Note that we equate the number ofusers with the number of channels because of the soft capacity of CDMA. Consequently, Nis the number of channels per sector that provides an acceptable outage probability.
For a standard deviation of power control errors in Eb=I0 of 2 dB, the capacity of theunsectorised CDMA system is 22 and 17 channels per cell per MHz for VAFs of 3/8 and1/2, respectively, while the capacity of the sectorised CDMA system having a sectorisationefficiency of 1, is 66 and 51 channels per cell per MHz for VAFs of 3/8 and 1/2, respectively.This capacity is much higher than that of a modern TDMA system which has 12 channelsper cell per MHz for a three-cell cluster arrangement as described in Chapter 3.
5.4.6 The effect of channel coding on CDMA systems
In the previous sections, the IS-95 system without channel coding and bit interleaving hasbeen addressed. The simplified block diagram of an uncoded system is shown in Fig-ure 5.29. Each message bit is spread by an M-chip spreading code prior to RF modulation.
5.4. CDMA MACROCELLULAR NETWORKS 341
The received signal experiences an interference power of I, which includes a multiple ac-cess interference (MAI) power of IMAI , and an AWGN power of η. The multiple accessinterference consists of intracellular and intercellular interference. The signal received atthe receiver is demodulated and despread at the matched filter, and a recovered bit stream isobtained. Assuming that the received wanted signal power at the input to the receiver is PRand that its chip rate is Rc = 1=Tc, than of an interference power I = IMAI + η, the receivedEb=I0 at the output of the matched filter is
γb =Eb
I0=
8><>:
GpPRI = Gp
PRIMAI+η ; for non-coherent demodulation;
Gp2PRI = Gp
2PRIMAI+η ; for coherent demodulation;
(5.151)
where Gp = Tb=Tc = M is the processing gain. Because CDMA systems normally useBPSK and QPSK as their modulation schemes, the bit error probability for the Eb=I0 shownin Equation (5.151) is
Pb = Q(p
γb) ; (5.152)
where Q(�) is a Gaussian Q-function. This function becomes smaller as γb increases. Hencefor a small bit error probability, a large γb is required for good communication quality.Channel coding, especially convolution coding, and bit interleaving are widely used to im-prove the communication quality in CDMA systems. A CDMA link having a convolutionalcodec is shown in Figure 5.30. The message bits are forward error corrected (FEC) codedand interleaved, followed by spreading and modulation to transform a bursty error channelinto a random error channel when de-interleaving is performed at the receiver. In the FECcoder a cc(n;k;K) convolutional encoder generates an n-bit code word for each k-bit inputmessage and has a constraint length of K. The block diagram of the convolutional coderis shown in Figure 5.31. This channel coding scheme has a coding rate of r = k=n, wherek< n. For the same spreading chip rate as we have in an uncoded system, the spreading fac-tor is reduced to M0 =Mk=n because the bit rate has increased by n=k after channel coding.
At the receiver, the PSD of the total interference at the input of the channel decoder is I0,while the received FEC coded bit energy becomes Ec instead of Eb. As a result, the codedbit-energy-to-interference PSD ratio is
γc =Ec
I0=
rRb
I0= rγb � (5.153)
By employing soft decision coding, the bit error probability after decoding becomes upperbound by [13,14]
pb �1k
∞
∑d=d f
βdQ�p
γcd�=
1k
∞
∑d=d f
βdQ�p
γbrd�; (5.154)
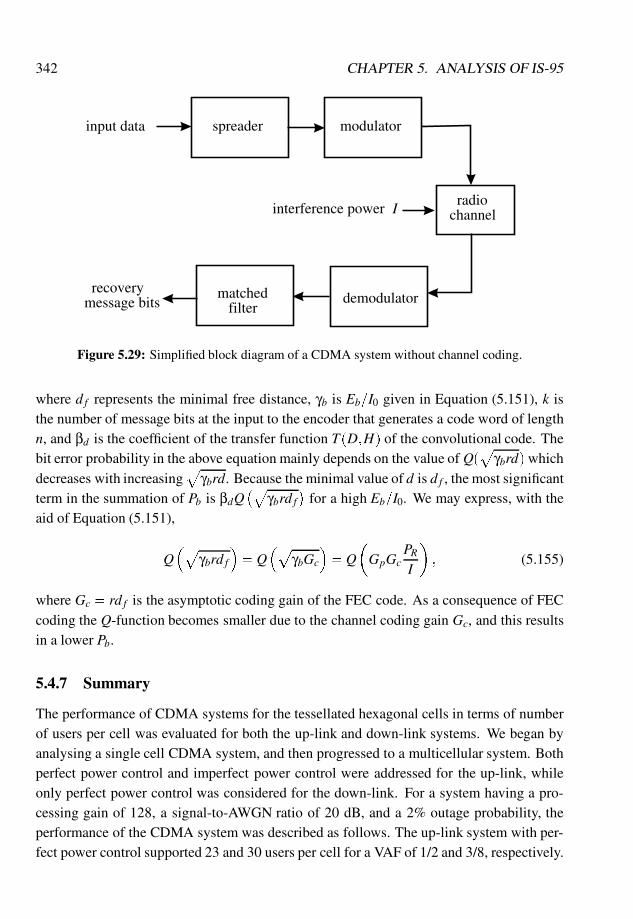
342 CHAPTER 5. ANALYSIS OF IS-95
recovery message bits
matchedfilter
spreader
interference power Iradio
channel
modulatorinput data
demodulator
Figure 5.29: Simplified block diagram of a CDMA system without channel coding.
where d f represents the minimal free distance, γb is Eb=I0 given in Equation (5.151), k isthe number of message bits at the input to the encoder that generates a code word of lengthn, and βd is the coefficient of the transfer function T (D;H) of the convolutional code. Thebit error probability in the above equation mainly depends on the value of Q(
pγbrd) which
decreases with increasingp
γbrd. Because the minimal value of d is d f , the most significantterm in the summation of Pb is βdQ
�pγbrd f
�for a high Eb=I0. We may express, with the
aid of Equation (5.151),
Q�p
γbrd f
�= Q
�pγbGc
�= Q
�GpGc
PRI
�; (5.155)
where Gc = rd f is the asymptotic coding gain of the FEC code. As a consequence of FECcoding the Q-function becomes smaller due to the channel coding gain Gc, and this resultsin a lower Pb.
5.4.7 Summary
The performance of CDMA systems for the tessellated hexagonal cells in terms of numberof users per cell was evaluated for both the up-link and down-link systems. We began byanalysing a single cell CDMA system, and then progressed to a multicellular system. Bothperfect power control and imperfect power control were addressed for the up-link, whileonly perfect power control was considered for the down-link. For a system having a pro-cessing gain of 128, a signal-to-AWGN ratio of 20 dB, and a 2% outage probability, theperformance of the CDMA system was described as follows. The up-link system with per-fect power control supported 23 and 30 users per cell for a VAF of 1/2 and 3/8, respectively.
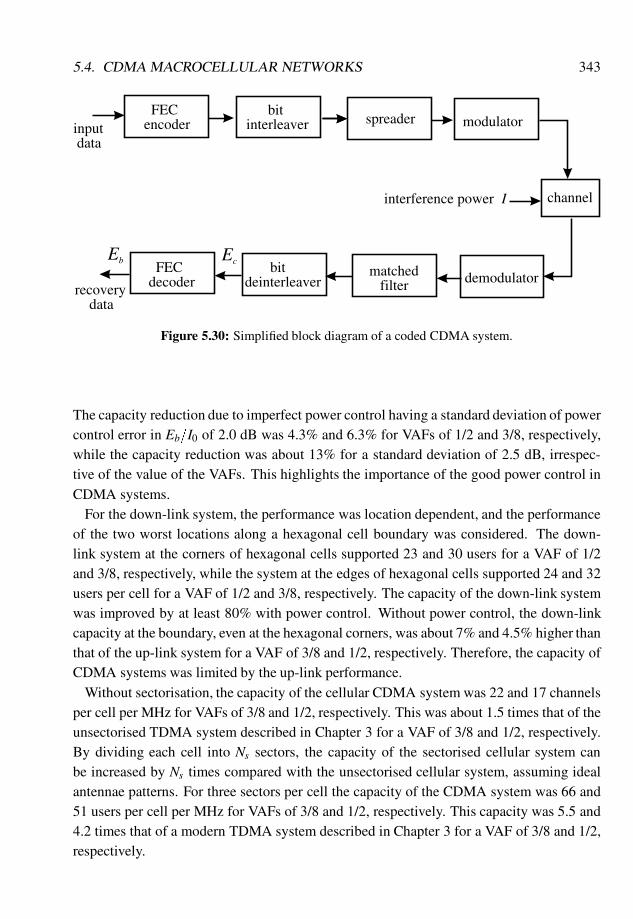
5.4. CDMA MACROCELLULAR NETWORKS 343
Eb Ec
inputdata
FECdecoder
bitdeinterleaver
spreaderFEC
encoder
matchedfilter
bitinterleaver
interference power I channel
modulator
recovery data
demodulator
Figure 5.30: Simplified block diagram of a coded CDMA system.
The capacity reduction due to imperfect power control having a standard deviation of powercontrol error in Eb=I0 of 2.0 dB was 4.3% and 6.3% for VAFs of 1/2 and 3/8, respectively,while the capacity reduction was about 13% for a standard deviation of 2.5 dB, irrespec-tive of the value of the VAFs. This highlights the importance of the good power control inCDMA systems.
For the down-link system, the performance was location dependent, and the performanceof the two worst locations along a hexagonal cell boundary was considered. The down-link system at the corners of hexagonal cells supported 23 and 30 users for a VAF of 1/2and 3/8, respectively, while the system at the edges of hexagonal cells supported 24 and 32users per cell for a VAF of 1/2 and 3/8, respectively. The capacity of the down-link systemwas improved by at least 80% with power control. Without power control, the down-linkcapacity at the boundary, even at the hexagonal corners, was about 7% and 4.5% higher thanthat of the up-link system for a VAF of 3/8 and 1/2, respectively. Therefore, the capacity ofCDMA systems was limited by the up-link performance.
Without sectorisation, the capacity of the cellular CDMA system was 22 and 17 channelsper cell per MHz for VAFs of 3/8 and 1/2, respectively. This was about 1.5 times that of theunsectorised TDMA system described in Chapter 3 for a VAF of 3/8 and 1/2, respectively.By dividing each cell into Ns sectors, the capacity of the sectorised cellular system canbe increased by Ns times compared with the unsectorised cellular system, assuming idealantennae patterns. For three sectors per cell the capacity of the CDMA system was 66 and51 users per cell per MHz for VAFs of 3/8 and 1/2, respectively. This capacity was 5.5 and4.2 times that of a modern TDMA system described in Chapter 3 for a VAF of 3/8 and 1/2,respectively.
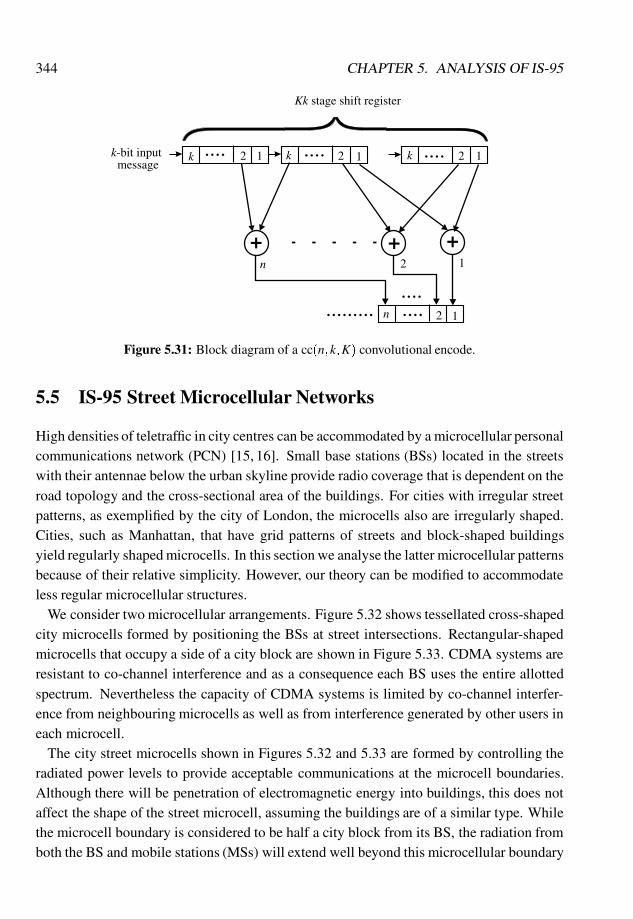
344 CHAPTER 5. ANALYSIS OF IS-95
n 2 1
+ +
....
k 1
2
.............
n
k2 21
1
.... ....1....kk-bit inputmessage
Kk stage shift register
2
+
Figure 5.31: Block diagram of a cc(n;k;K) convolutional encode.
5.5 IS-95 Street Microcellular Networks
High densities of teletraffic in city centres can be accommodated by a microcellular personalcommunications network (PCN) [15, 16]. Small base stations (BSs) located in the streetswith their antennae below the urban skyline provide radio coverage that is dependent on theroad topology and the cross-sectional area of the buildings. For cities with irregular streetpatterns, as exemplified by the city of London, the microcells also are irregularly shaped.Cities, such as Manhattan, that have grid patterns of streets and block-shaped buildingsyield regularly shaped microcells. In this section we analyse the latter microcellular patternsbecause of their relative simplicity. However, our theory can be modified to accommodateless regular microcellular structures.
We consider two microcellular arrangements. Figure 5.32 shows tessellated cross-shapedcity microcells formed by positioning the BSs at street intersections. Rectangular-shapedmicrocells that occupy a side of a city block are shown in Figure 5.33. CDMA systems areresistant to co-channel interference and as a consequence each BS uses the entire allottedspectrum. Nevertheless the capacity of CDMA systems is limited by co-channel interfer-ence from neighbouring microcells as well as from interference generated by other users ineach microcell.
The city street microcells shown in Figures 5.32 and 5.33 are formed by controlling theradiated power levels to provide acceptable communications at the microcell boundaries.Although there will be penetration of electromagnetic energy into buildings, this does notaffect the shape of the street microcell, assuming the buildings are of a similar type. Whilethe microcell boundary is considered to be half a city block from its BS, the radiation fromboth the BS and mobile stations (MSs) will extend well beyond this microcellular boundary
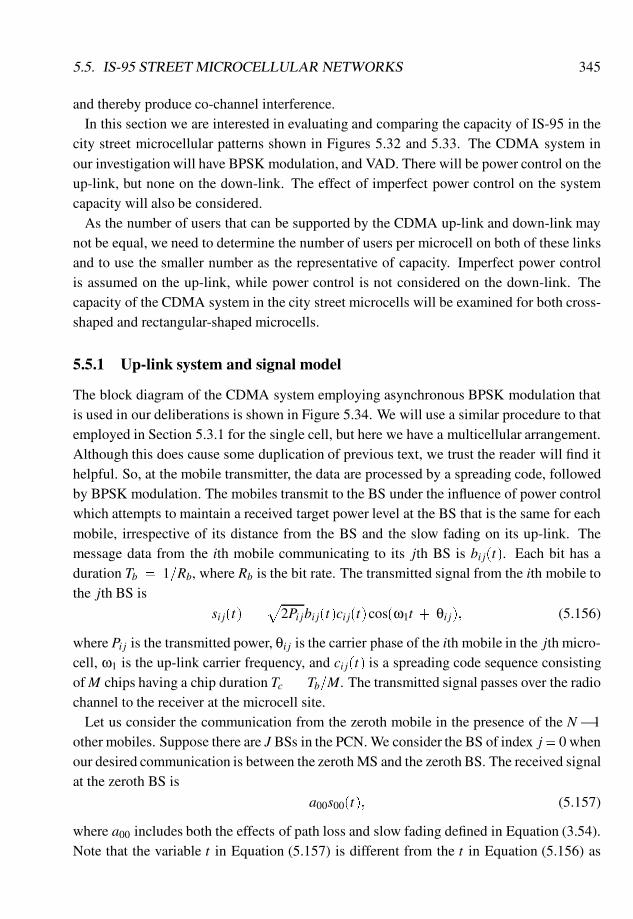
5.5. IS-95 STREET MICROCELLULAR NETWORKS 345
and thereby produce co-channel interference.In this section we are interested in evaluating and comparing the capacity of IS-95 in the
city street microcellular patterns shown in Figures 5.32 and 5.33. The CDMA system inour investigation will have BPSK modulation, and VAD. There will be power control on theup-link, but none on the down-link. The effect of imperfect power control on the systemcapacity will also be considered.
As the number of users that can be supported by the CDMA up-link and down-link maynot be equal, we need to determine the number of users per microcell on both of these linksand to use the smaller number as the representative of capacity. Imperfect power controlis assumed on the up-link, while power control is not considered on the down-link. Thecapacity of the CDMA system in the city street microcells will be examined for both cross-shaped and rectangular-shaped microcells.
5.5.1 Up-link system and signal model
The block diagram of the CDMA system employing asynchronous BPSK modulation thatis used in our deliberations is shown in Figure 5.34. We will use a similar procedure to thatemployed in Section 5.3.1 for the single cell, but here we have a multicellular arrangement.Although this does cause some duplication of previous text, we trust the reader will find ithelpful. So, at the mobile transmitter, the data are processed by a spreading code, followedby BPSK modulation. The mobiles transmit to the BS under the influence of power controlwhich attempts to maintain a received target power level at the BS that is the same for eachmobile, irrespective of its distance from the BS and the slow fading on its up-link. Themessage data from the ith mobile communicating to its jth BS is bi j(t). Each bit has aduration Tb = 1=Rb, where Rb is the bit rate. The transmitted signal from the ith mobile tothe jth BS is
si j(t) =p
2Pi jbi j(t)ci j(t)cos(ω1t + θi j); (5.156)
where Pi j is the transmitted power, θi j is the carrier phase of the ith mobile in the jth micro-cell, ω1 is the up-link carrier frequency, and ci j(t) is a spreading code sequence consistingof M chips having a chip duration Tc = Tb=M. The transmitted signal passes over the radiochannel to the receiver at the microcell site.
Let us consider the communication from the zeroth mobile in the presence of the N� 1other mobiles. Suppose there are J BSs in the PCN. We consider the BS of index j= 0 whenour desired communication is between the zeroth MS and the zeroth BS. The received signalat the zeroth BS is
a00s00(t); (5.157)
where a00 includes both the effects of path loss and slow fading defined in Equation (3.54).Note that the variable t in Equation (5.157) is different from the t in Equation (5.156) as

346 CHAPTER 5. ANALYSIS OF IS-95
∗ : BS
∗ ∗∗∗ W
X
∗ ∗∗ ∗
∗ ∗ ∗ *
Figure 5.32: Cross-shaped city street microcells in a two-cell per cluster arrangement.
∗ WX
∗ ∗∗∗∗
∗
∗*
∗**
∗
∗
∗ ∗ ∗∗
∗ ∗ ∗
∗ ∗ ∗∗: BS
: cluster
Figure 5.33: Rectangular-shaped city street microcells in a four cell per cluster arrangement.
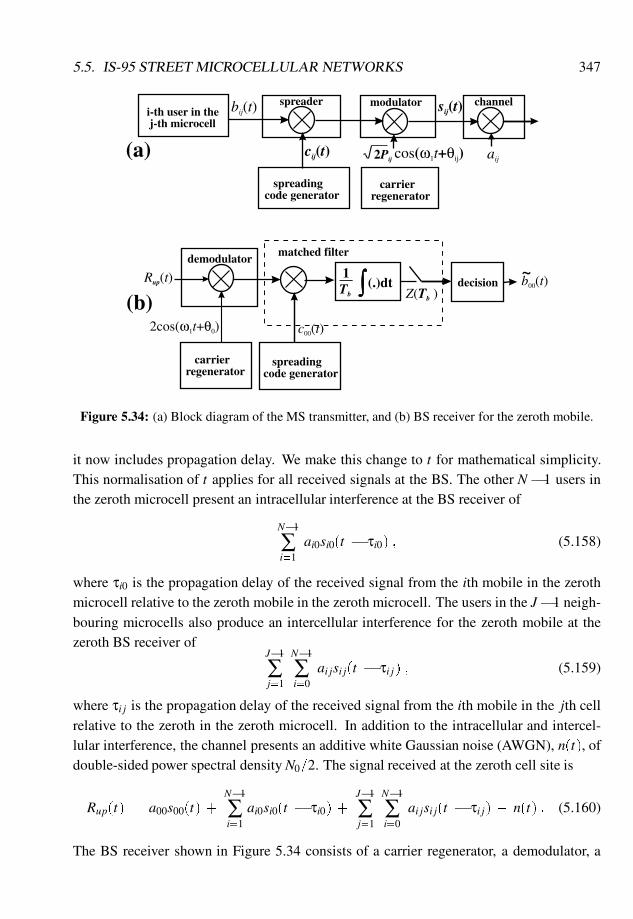
5.5. IS-95 STREET MICROCELLULAR NETWORKS 347
carrierregenerator
spreadingcode generator
(b)
demodulator
cos(ω1t+θij)2Pij
sij(t)spreader modulator
i-th user in thej-th microcell
cij(t)
bij(t)
aij
channel
decisionRup(t) 1Tb
(.)dt
c00(t) 2cos(ω1t+θ0)
b00(t)~
Z(Tb )
carrierregenerator
spreadingcode generator
(a)
matched filter
Figure 5.34: (a) Block diagram of the MS transmitter, and (b) BS receiver for the zeroth mobile.
it now includes propagation delay. We make this change to t for mathematical simplicity.This normalisation of t applies for all received signals at the BS. The other N� 1 users inthe zeroth microcell present an intracellular interference at the BS receiver of
N�1
∑i=1
ai0si0(t � τi0) ; (5.158)
where τi0 is the propagation delay of the received signal from the ith mobile in the zerothmicrocell relative to the zeroth mobile in the zeroth microcell. The users in the J�1 neigh-bouring microcells also produce an intercellular interference for the zeroth mobile at thezeroth BS receiver of
J�1
∑j=1
N�1
∑i=0
ai jsi j(t � τi j) ; (5.159)
where τi j is the propagation delay of the received signal from the ith mobile in the jth cellrelative to the zeroth in the zeroth microcell. In addition to the intracellular and intercel-lular interference, the channel presents an additive white Gaussian noise (AWGN), n(t), ofdouble-sided power spectral density N0=2. The signal received at the zeroth cell site is
Rup(t) = a00s00(t) +N�1
∑i=1
ai0si0(t � τi0) +J�1
∑j=1
N�1
∑i=0
ai jsi j(t � τi j) + n(t) : (5.160)
The BS receiver shown in Figure 5.34 consists of a carrier regenerator, a demodulator, a
348 CHAPTER 5. ANALYSIS OF IS-95
matched filter, and a decision circuit. Assuming that the receiver is correctly chip synchro-nised to the zeroth user, after demodulating and despreading, we have
Z(Tb) =1Tb
Z Tb
0Rup(t)c00(t)2cos(ω1t + θ)dt
= Zw(Tb) + Zn(Tb) + Zint(Tb) + Zext(Tb); (5.161)
where Zw(Tb); Zn(Tb); Zint(Tb), and Zext(Tb) are the desired signal, the AWGN component,the intracellular interference component, and the intercellular interference component, re-spectively, where
Zw(Tb) =p
2P00a00b00 cosφ00; (5.162)
Zn(Tb) =1Tb
Z Tb
0n(t)c00(t)2cos(ω1t + θ)dt; (5.163)
Zint(Tb) =1Tb
Z Tb
0nint(t)c00(t)dt; (5.164)
and
Zext(Tb) =1Tb
Z Tb
0next(t)c00(t)dt: (5.165)
In Equations (5.164) and (5.165), nint(t) and next(t) are the intracellular and intercellularequivalent baseband interference components, respectively, defined as
nint(t) =N�1
∑i=1
ai0p
2Pi0bi0(t � τi0)ci0(t � τi0)cosφi0 (5.166)
and
next(t) =J�1
∑j=1
N�1
∑i=0
ai jp
2Pi jbi0(t � τi j)ci j(t � τi j)cosφi j; (5.167)
where φi0 = θi0�θ and φi j = θi j�θ.
5.5.2 Performance of the up-link
The bit error probability at the output of the decision circuit depends on the bit-energy-to-total-interference ratio in the signal, Z(Tb). The power of the desired signal is
S = E[Z2w(Tb)] = a2
00P00 (5.168)
as b200 = (�1)2 = 1 and E[cos2φ00] = 1=2. The AWGN component at the output of the
matched filter from Equation (5.20) is
η = var[Zn(Tb)] = N0Rb : (5.169)
5.5. IS-95 STREET MICROCELLULAR NETWORKS 349
In deriving the interference power, we are cognisant that the received carrier phase differsfrom the transmitted carrier phase, that the relative time delay of the data transmitted fromeach mobile is a random variable, i.e. that τi0 and τi j are independent random variablesuniformly distributed over [0;Tb), and that φi0 and φi j are independent random variablesuniformly distributed over [0;2π). We further assume that bi j(t) is random independentbinary data, ci j(t) is a random sequence, and as a consequence nint(t) and next(t) are twoGaussian random processes.
Similar to the approach adopted in Section 5.2.1, the intracellular interference power for,
Iint =1Gp
N�1
∑i=1
vi0a2i0Pi0 : (5.170)
5.5.2.1 Perfect power control
With perfect power control, the received power from each mobile at the cell site remains atthe constant target power level
Ptar = a2i jPi j : (5.171)
Replacing a200P
200 in Equation (5.168) with Ptar gives the signal power
S = Ptar : (5.172)
From Equations (5.170), (5.171), and (5.172), the intracellular interference-to-signal-powerratio is
IintS
=1
SGp
N�1
∑i=1
vi0Ptar =1Gp
N�1
∑i=1
vi0 : (5.173)
The intracellular interference-to-signal ratio in Equation (5.173) is a function of the num-ber of users per microcell irrespective of the shape of the microcell. The intercellularinterference-to-signal ratio is given by Equation (5.77) where I j=S is the interference-to-signal-power ratio from the jth adjacent cell. Assuming the users are uniformly distributedwithin their microcells, I j=S can be calculated by integration instead of summation. Unlikethe intracellular interference, the intercellular interference depends on the microcellular ar-rangement. The intercellular interference from the cross-shaped and the rectangular-shapedmicrocells is now calculated.
Cross-shaped microcells In the cross-shaped microcells, the microcell sites are locatedat the cross-sections of streets, as shown in Figure 5.35. Owing to the sudden decrease insignal levels at street corners and the steeper path loss slopes associated with the OOS paths,the main intercellular interference comes from the LOS paths. For street blocks of side 2Xand street width of W (see Figure 5.35), the number of users per area is
ρ =N
4WX � W2 �N
4WX; (5.174)
350 CHAPTER 5. ANALYSIS OF IS-95
for W << X . Since W << X , all the mobile users in area da in Figure 5.35 are at a distancer j from the zeroth cell site. These users in area da are also at a distance r from the jth cellsite. Mobiles in the jth microcell when active produce an interfering power of I(r j;r) atthe zeroth microcell site. Under perfect power control, the mobiles in the jth cell have theirpower controlled by their own BS to be Ptar . In order to track the relative path loss and slowfading variations, the transmitted power Pi j from the ith mobile in the jth microcell is madeinversely proportion to a2
i j , whence
Pi j =Ptara2i j
(5.175)
and ai j is the path loss and shadow fading between the zeroth BS and the ith mobile inthe jth microcell. This power Pi j is the interference due to the ith mobile at the zerothBS. Consequently, the interference-to-signal-power ratio at the zeroth microcell site due tomobiles in area da who are communicating to the jth microcell site is
I(r j;r)
S=
�a0 j
ai j
�2
� (5.176)
where a20 j is the path loss and shadow fading between the interfering mobile in the jth
microcell and the zeroth BS. From Equation (3.54), (a0 j=ai j)2 in Equation (5.176) has theform
�a0 j
ai j
�2
=
8>>>><>>>>:
�rr j
�210
λ j�λ10 =
�rr j
�210
ζ j10 ; for r and r j � Xb;�
rr j
�410
λ j�λ10 =
�rr j
�410
ζ j10 ; for r and r j > Xb;
X2b r
2
r4j
10λ j�λ
10 =
X2b r
2
r4j
10ζ j10 ; for r � Xb and r j > Xb,
(5.177)
where λ j and λ are random variables with zero mean and standard deviation σ, and ζ j = λ j�
λ is also a random variable with zero mean and variance of σ2ζ = 2σ2 (λ j and λ are inde-
pendent). In Equation (5.177),r j = Dj � r; (5.178)
where Dj is the frequency reuse distance between the zeroth and jth microcellular BSs.The total intercellular interference-to-signal-power ratio at the zeroth microcell site due toall the mobiles in the jth adjacent microcell is [3],
I jS
=Z
cell
Z
area
vi jI(r j;r)
Sφl
�ζ;
rr j
�ρda; (5.179)
where the subscript in φl(ζ;r=r j) is the constraint function of the interference from mobilesin the jth microcell. Owing to the two-slope path loss law, the constraint function is defined
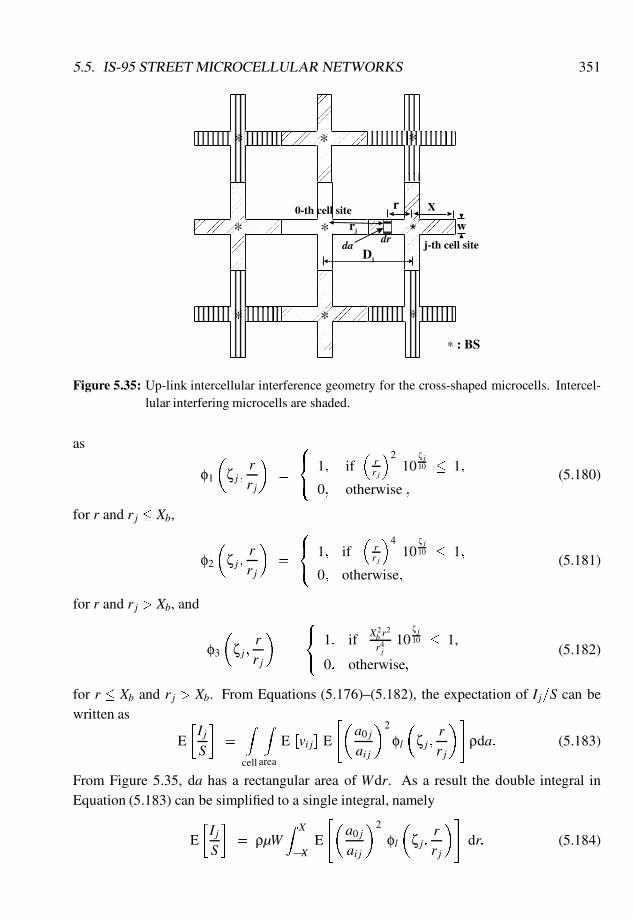
5.5. IS-95 STREET MICROCELLULAR NETWORKS 351
∗∗ : BS
*∗∗0-th cell site r
wdr
X
j-th cell site
∗
∗
rj
Dj
da
∗
∗ ∗
Figure 5.35: Up-link intercellular interference geometry for the cross-shaped microcells. Intercel-lular interfering microcells are shaded.
as
φ1
�ζ j;
rr j
�=
8<: 1; if
�rr j
�210
ζ j10 � 1;
0; otherwise ;
(5.180)
for r and r j � Xb,
φ2
�ζ j;
rr j
�=
8<: 1; if
�rr j
�410
ζ j10 � 1;
0; otherwise;(5.181)
for r and r j > Xb, and
φ3
�ζ j;
rr j
�=
8<: 1; if X2
b r2
r4j
10ζ j10 � 1,
0; otherwise;(5.182)
for r � Xb and r j > Xb. From Equations (5.176)–(5.182), the expectation of I j=S can bewritten as
E
�I jS
�=
Z
cell
Z
area
E [vi j] E
"�a0 j
ai j
�2
φl
�ζ j;
rr j
�#ρda: (5.183)
From Figure 5.35, da has a rectangular area of Wdr. As a result the double integral inEquation (5.183) can be simplified to a single integral, namely
E
�I jS
�= ρµW
Z X
�XE
"�a0 j
ai j
�2
φl
�ζ j;
rr j
�#dr: (5.184)
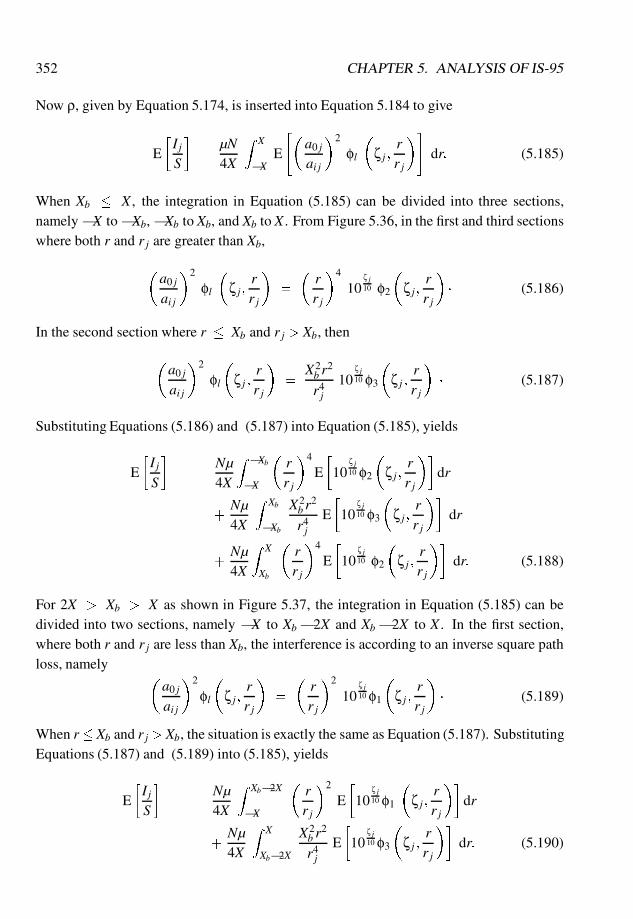
352 CHAPTER 5. ANALYSIS OF IS-95
Now ρ, given by Equation 5.174, is inserted into Equation 5.184 to give
E
�I jS
�=
µN4X
Z X
�XE
"�a0 j
ai j
�2
φl
�ζ j;
rr j
�#dr: (5.185)
When Xb � X , the integration in Equation (5.185) can be divided into three sections,namely �X to �Xb, �Xb to Xb, and Xb to X . From Figure 5.36, in the first and third sectionswhere both r and r j are greater than Xb,
�a0 j
ai j
�2
φl
�ζ j;
rr j
�=
�rr j
�4
10ζ j10 φ2
�ζ j;
rr j
�� (5.186)
In the second section where r � Xb and r j > Xb, then
�a0 j
ai j
�2
φl
�ζ j;
rr j
�=
X2b r
2
r4j
10ζ j10 φ3
�ζ j;
rr j
�� (5.187)
Substituting Equations (5.186) and (5.187) into Equation (5.185), yields
E
�I jS
�=
Nµ4X
Z�Xb
�X
�rr j
�4
E
�10
ζ j10 φ2
�ζ j;
rr j
��dr
+Nµ4X
Z Xb
�Xb
X2b r
2
r4j
E
�10
ζ j10 φ3
�ζ j;
rr j
��dr
+Nµ4X
Z X
Xb
�rr j
�4
E
�10
ζ j10 φ2
�ζ j;
rr j
��dr: (5.188)
For 2X > Xb > X as shown in Figure 5.37, the integration in Equation (5.185) can bedivided into two sections, namely �X to Xb� 2X and Xb� 2X to X . In the first section,where both r and r j are less than Xb, the interference is according to an inverse square pathloss, namely �
a0 j
ai j
�2
φl
�ζ j;
rr j
�=
�rr j
�2
10ζ j10 φ1
�ζ j;
rr j
�� (5.189)
When r� Xb and r j > Xb, the situation is exactly the same as Equation (5.187). SubstitutingEquations (5.187) and (5.189) into (5.185), yields
E
�I jS
�=
Nµ4X
Z Xb�2X
�X
�rr j
�2
E
�10
ζ j10 φ1
�ζ j;
rr j
��dr
+Nµ4X
Z X
Xb�2X
X2b r
2
r4j
E
�10
ζ j10 φ3
�ζ j;
rr j
��dr: (5.190)
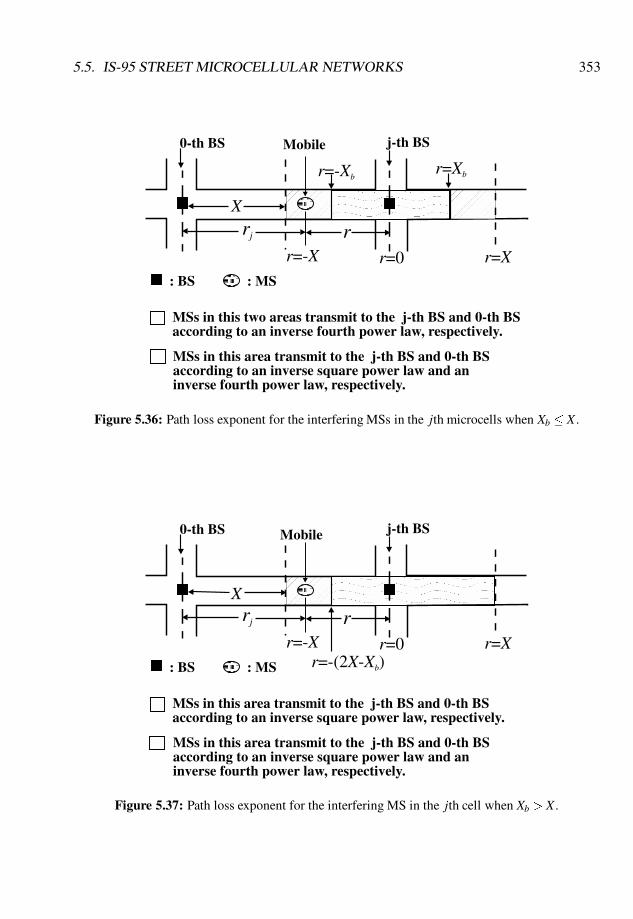
5.5. IS-95 STREET MICROCELLULAR NETWORKS 353
MSs in this two areas transmit to the j-th BS and 0-th BSaccording to an inverse fourth power law, respectively.
0-th BS Mobile j-th BS
MSs in this area transmit to the j-th BS and 0-th BS according to an inverse square power law and an inverse fourth power law, respectively.
r=-X r=X
r=Xb
r=0
r=-Xb
rj rX
: BS : MS
Figure 5.36: Path loss exponent for the interfering MSs in the jth microcells when Xb � X .
MSs in this area transmit to the j-th BS and 0-th BSaccording to an inverse square power law, respectively.
0-th BS Mobile j-th BS
MSs in this area transmit to the j-th BS and 0-th BS according to an inverse square power law and an inverse fourth power law, respectively.
r=-X r=Xr=0r=-(2X-Xb)
rj rX
: BS : MS
Figure 5.37: Path loss exponent for the interfering MS in the jth cell when Xb > X .
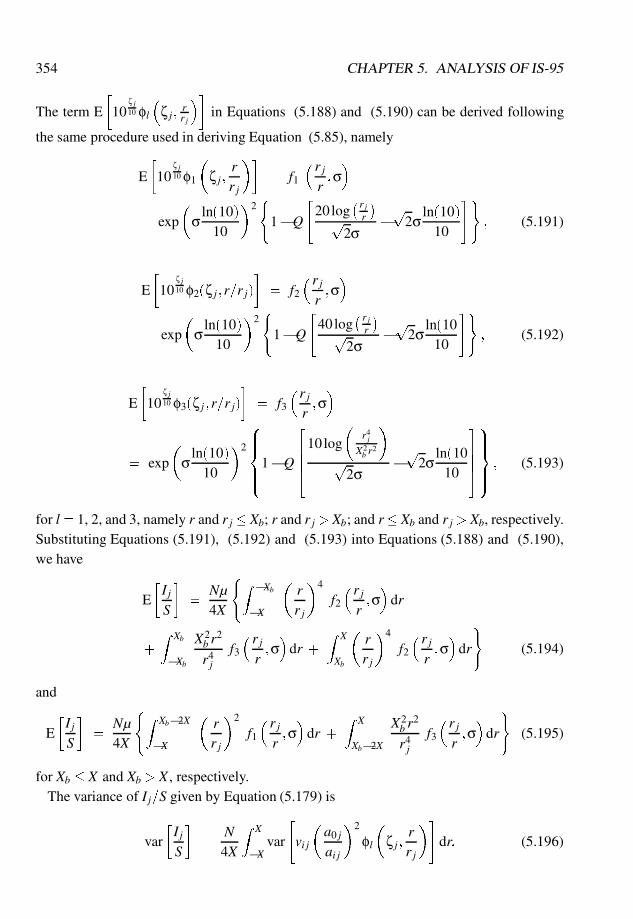
354 CHAPTER 5. ANALYSIS OF IS-95
The term E
�10
ζ j10 φl
�ζ j;
rr j
��in Equations (5.188) and (5.190) can be derived following
the same procedure used in deriving Equation (5.85), namely
E
�10
ζ j10 φ1
�ζ j;
rr j
��= f1
�r jr
;σ�
= exp
�σ
ln(10)10
�2(
1�Q
"20log
� r jr
�p
2σ�p
2σln(10)
10
#); (5.191)
E
�10
ζ j10 φ2(ζ j;r=r j)
�= f2
�r jr;σ�
= exp
�σ
ln(10)10
�2(
1�Q
"40log
� r jr
�p
2σ�p
2σln(10
10
#); (5.192)
E
�10
ζ j10 φ3(ζ j;r=r j)
�= f3
�r jr;σ�
= exp
�σ
ln(10)10
�2
8>><>>:1�Q
2664
10log
�r4j
X2b r
2
�p
2σ�p
2σln(10
10
37759>>=>>; ; (5.193)
for l= 1, 2, and 3, namely r and r j � Xb; r and r j >Xb; and r� Xb and r j > Xb, respectively.Substituting Equations (5.191), (5.192) and (5.193) into Equations (5.188) and (5.190),we have
E
�I jS
�=
Nµ4X
(Z�Xb
�X
�rr j
�4
f2�r jr;σ�
dr
+Z Xb
�Xb
X2b r
2
r4j
f3�r jr;σ�
dr +Z X
Xb
�rr j
�4
f2�r jr;σ�
dr
)(5.194)
and
E
�I jS
�=
Nµ4X
(Z Xb�2X
�X
�rr j
�2
f1� r jr;σ�
dr +Z X
Xb�2X
X2b r
2
r4j
f3�r jr;σ�
dr
)(5.195)
for Xb � X and Xb > X , respectively.The variance of I j=S given by Equation (5.179) is
var
�I jS
�=
N4X
Z X
�Xvar
"vi j
�a0 j
ai j
�2
φl
�ζ j;
rr j
�#dr: (5.196)
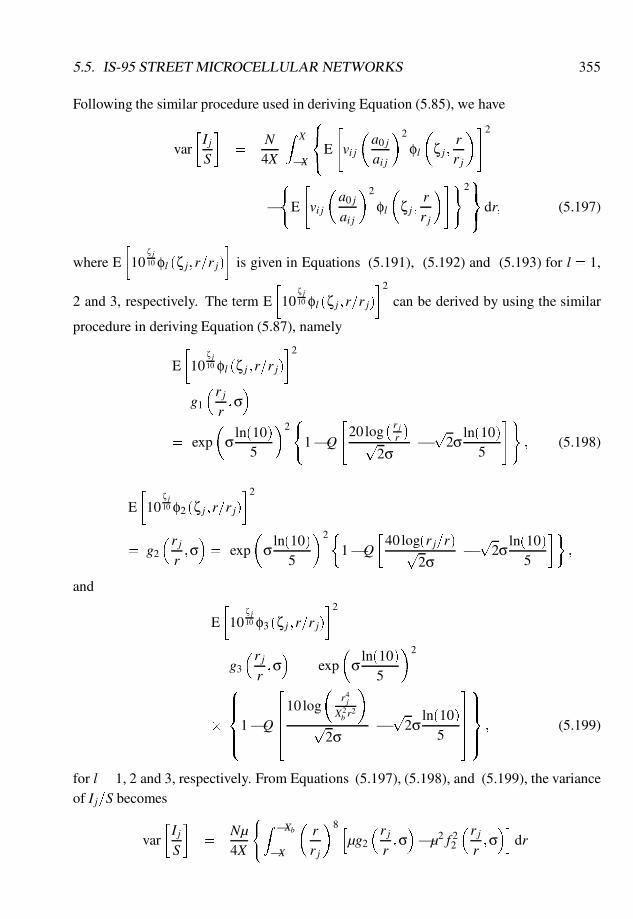
5.5. IS-95 STREET MICROCELLULAR NETWORKS 355
Following the similar procedure used in deriving Equation (5.85), we have
var
�I jS
�=
N4X
Z X
�X
8<:E
"vi j
�a0 j
ai j
�2
φl
�ζ j;
rr j
�#2
�
(E
"vi j
�a0 j
ai j
�2
φl
�ζ j;
rr j
�#)29=;dr; (5.197)
where E
�10
ζ j10 φl (ζ j;r=r j)
�is given in Equations (5.191), (5.192) and (5.193) for l = 1,
2 and 3, respectively. The term E
�10
ζ j10 φl (ζ j;r=r j)
�2
can be derived by using the similar
procedure in deriving Equation (5.87), namely
E
�10
ζ j10 φl (ζ j;r=r j)
�2
= g1
�r jr;σ�
= exp
�σ
ln(10)5
�2(
1�Q
"20log
� r jr
�p
2σ�p
2σln(10)
5
#); (5.198)
E
�10
ζ j10 φ2 (ζ j;r=r j)
�2
= g2
�r jr;σ�= exp
�σ
ln(10)5
�2�1�Q
�40log(r j=r)p
2σ�p
2σln(10)
5
��;
and
E
�10
ζ j10 φ3 (ζ j;r=r j)
�2
= g3
�r jr;σ�
= exp
�σ
ln(10)5
�2
�
8>><>>:1�Q
2664
10log
�r4j
X2b r
2
�p
2σ�p
2σln(10)
5
37759>>=>>; ; (5.199)
for l = 1, 2 and 3, respectively. From Equations (5.197), (5.198), and (5.199), the varianceof I j=S becomes
var
�I jS
�=
Nµ4X
(Z�Xb
�X
�rr j
�8 hµg2
�r jr;�2 f 2
2
�r jr;σ�i
dr
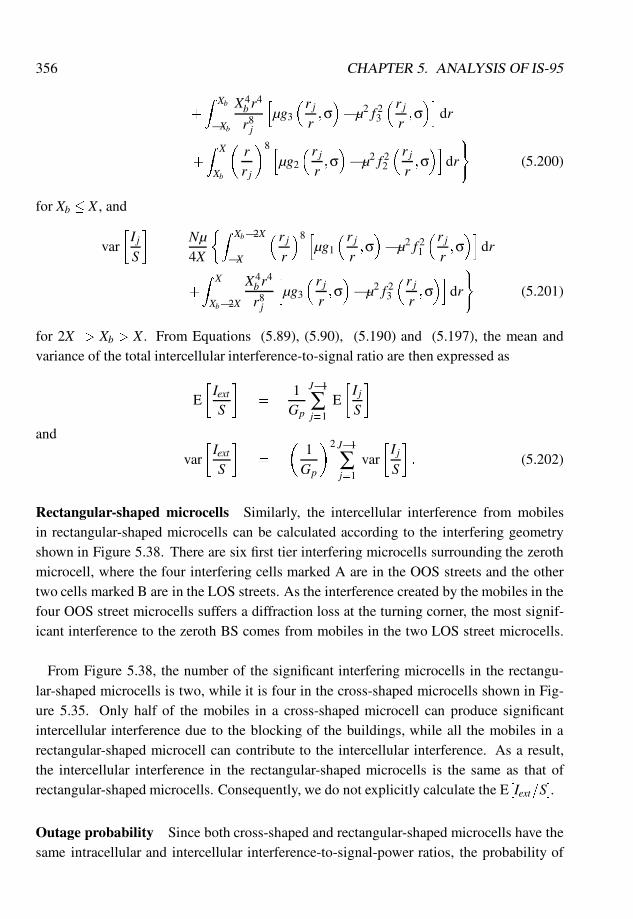
356 CHAPTER 5. ANALYSIS OF IS-95
+
Z Xb
�Xb
X4b r
4
r8j
hµg3
�r jr
;�2 f 2
3
�r jr
;σ�i
dr
+
Z X
Xb
�rr j
�8 hµg2
� r jr
;�2 f 2
2
�r jr
;σ�i
dr
)(5.200)
for Xb � X , and
var
�I jS
�=
Nµ4X
�Z Xb�2X
�X
�r jr
�8 hµg1
�r jr
;�2 f 2
1
�r jr
;σ�i
dr
+
Z X
Xb�2X
X4b r
4
r8j
hµg3
� r jr
;�2 f 2
3
�r jr
;σ�i
dr
)(5.201)
for 2X > Xb > X . From Equations (5.89), (5.90), (5.190) and (5.197), the mean andvariance of the total intercellular interference-to-signal ratio are then expressed as
E
�IextS
�=
1Gp
J�1
∑j=1
E
�I jS
�
and
var
�IextS
�=
�1Gp
�2 J�1
∑j=1
var
�I jS
�: (5.202)
Rectangular-shaped microcells Similarly, the intercellular interference from mobilesin rectangular-shaped microcells can be calculated according to the interfering geometryshown in Figure 5.38. There are six first tier interfering microcells surrounding the zerothmicrocell, where the four interfering cells marked A are in the OOS streets and the othertwo cells marked B are in the LOS streets. As the interference created by the mobiles in thefour OOS street microcells suffers a diffraction loss at the turning corner, the most signif-icant interference to the zeroth BS comes from mobiles in the two LOS street microcells.
From Figure 5.38, the number of the significant interfering microcells in the rectangu-lar-shaped microcells is two, while it is four in the cross-shaped microcells shown in Fig-ure 5.35. Only half of the mobiles in a cross-shaped microcell can produce significantintercellular interference due to the blocking of the buildings, while all the mobiles in arectangular-shaped microcell can contribute to the intercellular interference. As a result,the intercellular interference in the rectangular-shaped microcells is the same as that ofrectangular-shaped microcells. Consequently, we do not explicitly calculate the E [Iext=S].
Outage probability Since both cross-shaped and rectangular-shaped microcells have thesame intracellular and intercellular interference-to-signal-power ratios, the probability of
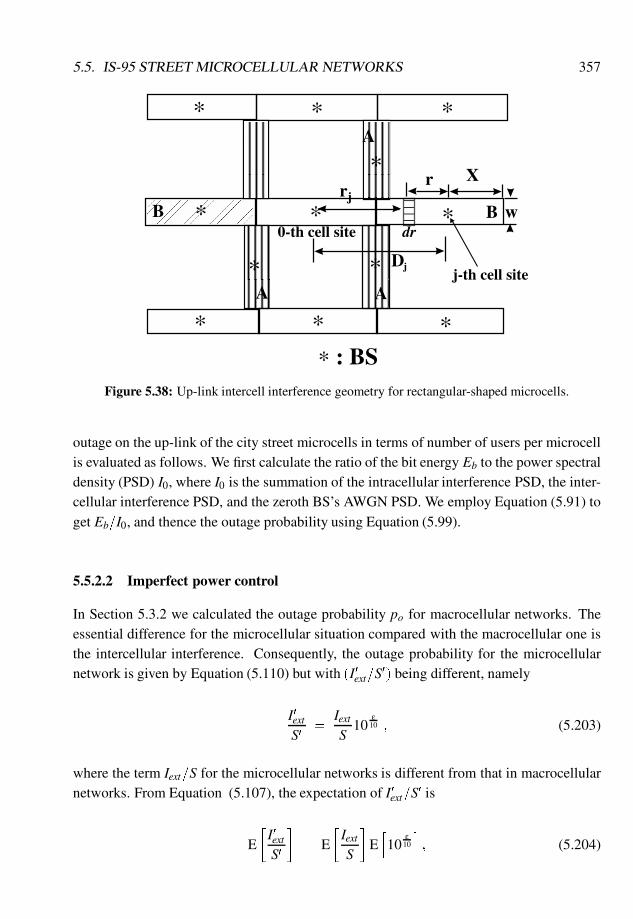
5.5. IS-95 STREET MICROCELLULAR NETWORKS 357
∗
∗ ∗ ∗
∗ ∗∗ : BS
∗
∗
j-th cell site
0-th cell site dr
Xrr
w
D
∗
∗ ∗
j
A
AA
A
B B
j
∗
∗
Figure 5.38: Up-link intercell interference geometry for rectangular-shaped microcells.
outage on the up-link of the city street microcells in terms of number of users per microcellis evaluated as follows. We first calculate the ratio of the bit energy Eb to the power spectraldensity (PSD) I0, where I0 is the summation of the intracellular interference PSD, the inter-cellular interference PSD, and the zeroth BS’s AWGN PSD. We employ Equation (5.91) toget Eb=I0, and thence the outage probability using Equation (5.99).
5.5.2.2 Imperfect power control
In Section 5.3.2 we calculated the outage probability po for macrocellular networks. Theessential difference for the microcellular situation compared with the macrocellular one isthe intercellular interference. Consequently, the outage probability for the microcellularnetwork is given by Equation (5.110) but with (I0
ext=S0) being different, namely
I0
ext
S0=
IextS
10ε
10 ; (5.203)
where the term Iext=S for the microcellular networks is different from that in macrocellularnetworks. From Equation (5.107), the expectation of I0
ext=S0 is
E
�I0
ext
S0
�= E
�IextS
�Eh10
ε10
i; (5.204)
358 CHAPTER 5. ANALYSIS OF IS-95
where E [Iext=S] and Eh10
ε10
iare given in Equation (5.202) and (5.51), respectively. From
Equation (5.108), the variance of I0
ext=S0, is
var
�I0
ext
S0
�= E
"�IextS
�2#
E
��10
ε10
�2��
�E
�IextS
�Eh10
ε10
i�2
; (5.205)
where Eh10
ε10
iis given in Equation (5.51), E [Iext=S] is given in Equation (5.202), E
h(Iext=S)
2i
can be calculated from Equations (5.109) and (5.198)–(5.199) and Eh10
ε5
iis given in
Equation (5.54).The outage probability is calculated for the intracellular interference plus the intercellular
interference from mobiles in the four first tier co-channel microcells, where a signal-to-AWGN ratio of 20 dB is assumed at the matched filter output. A spreading code sequenceof 128 chips per code and a microcell with X = 200 m are used in our analytical results.The variations of po versus the number of users per microcell for perfect power controland for different levels of imperfect power control are shown in Figures 5.39, 5.40, 5.41,5.42, 5.43, and 5.44. Figures 5.39, 5.40, and 5.41 refer to a path loss break-distanceof Xb = 3=4X , while Figures 5.42, 5.43, and 5.44 refer to a path loss break-distance ofXb = 5=4X . These values of Xb were selected because experimental results have reportedthat 150< Xb < 250 [17,18], and in our calculation we set X = 200 m. The system capacitycan be estimated by the number of users per microcell for an outage probability below 2%.If the mobiles are perfectly power controlled, then for Xb = 3=4X , the CDMA system cansupport 35 and 45 users for VAFs of 1/2 and 3/8, respectively, and for Xb = 5=4X , theCDMA system can support 34 and 44 users for VAFs of 1/2 and for 3/8, respectively. Theprobability of outage increases as the standard deviation of the imperfect power controlerror increases, and the capacity of the CDMA system decreases accordingly. For an outageprobability of less than 2%, the capacity and percentage of capacity degradation for differentlevels of standard deviation of the errors in Eb=I0 are summarised in Tables 5.2 and 5.3corresponding to Xb = 3=4X and Xb = 5=4X , respectively.
For an outage probability of 2% and perfect power control, the CDMA system in thehexagonal cells can support 30 and 23 users per cell for a VAF of 3/8 and 1/2, respectively,as shown in Section 5.3. For the same conditions, the CDMA system in city street microcellscan support 44 and 34 users for a VAF of 3/8 and 1/2, respectively, which is 60% higherthan that in hexagonal cellular schemes. The probability of outage increases as the standarddeviation of the imperfect power control in Eb=I0 increases, and the capacity of the CDMAsystem decreases accordingly.
From Tables 5.2 and Table 5.3, we observe that the reduction in capacity for the best caseof Xb = 3=4X in the presence of imperfect power control is about 8.8%, 11.1%, and 13.3%for ε having a standard deviation of 1.5 dB, 1.7 dB, and 2.0 dB, respectively, while the cor-responding reductions in capacity for Xb = 5=4X is 8.8%, 11.8%, and 14.7%, respectively.
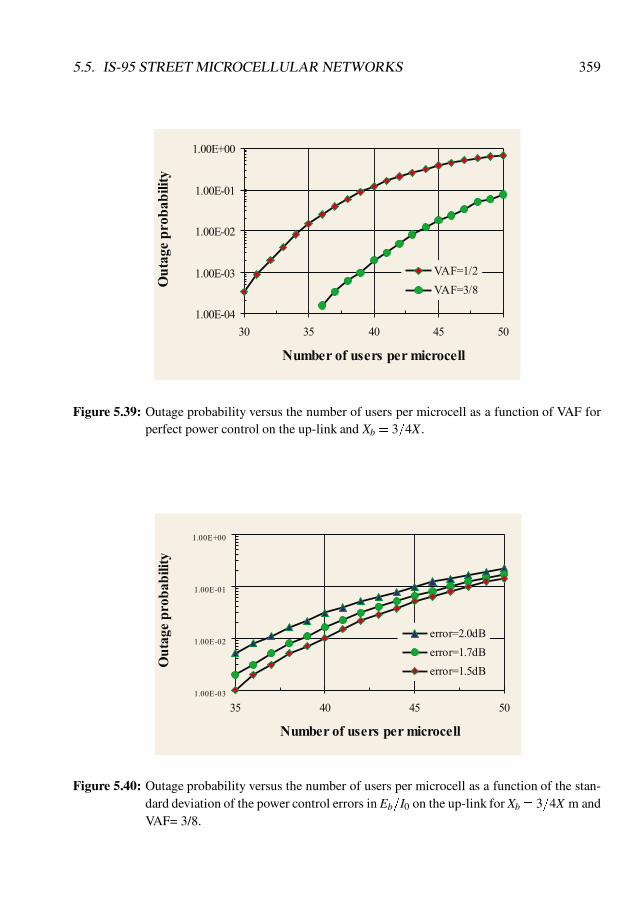
5.5. IS-95 STREET MICROCELLULAR NETWORKS 359
Figure 5.39: Outage probability versus the number of users per microcell as a function of VAF forperfect power control on the up-link and Xb = 3=4X .
Figure 5.40: Outage probability versus the number of users per microcell as a function of the stan-dard deviation of the power control errors in Eb=I0 on the up-link for Xb = 3=4X m andVAF= 3/8.
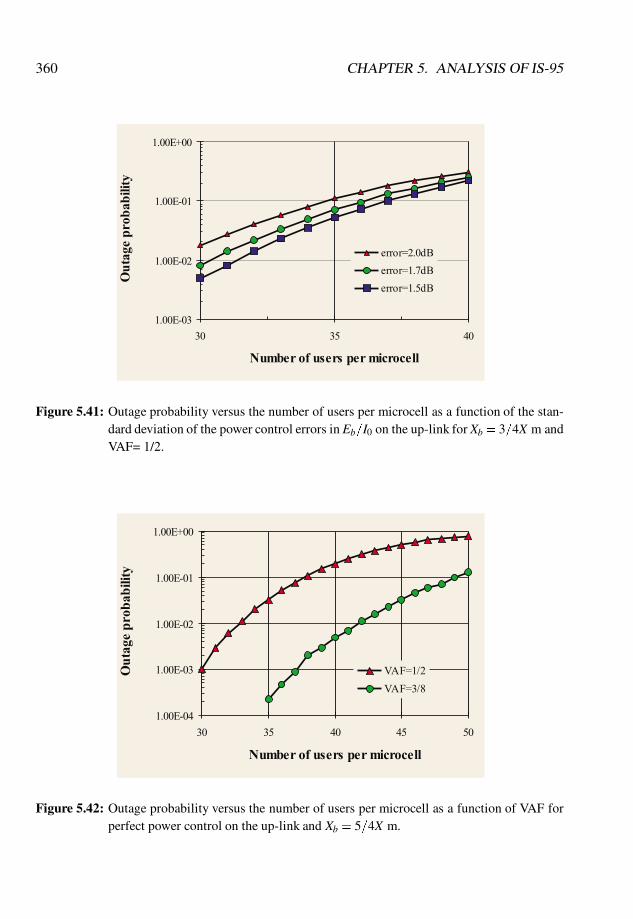
360 CHAPTER 5. ANALYSIS OF IS-95
Figure 5.41: Outage probability versus the number of users per microcell as a function of the stan-dard deviation of the power control errors in Eb=I0 on the up-link for Xb = 3=4X m andVAF= 1/2.
Figure 5.42: Outage probability versus the number of users per microcell as a function of VAF forperfect power control on the up-link and Xb = 5=4X m.
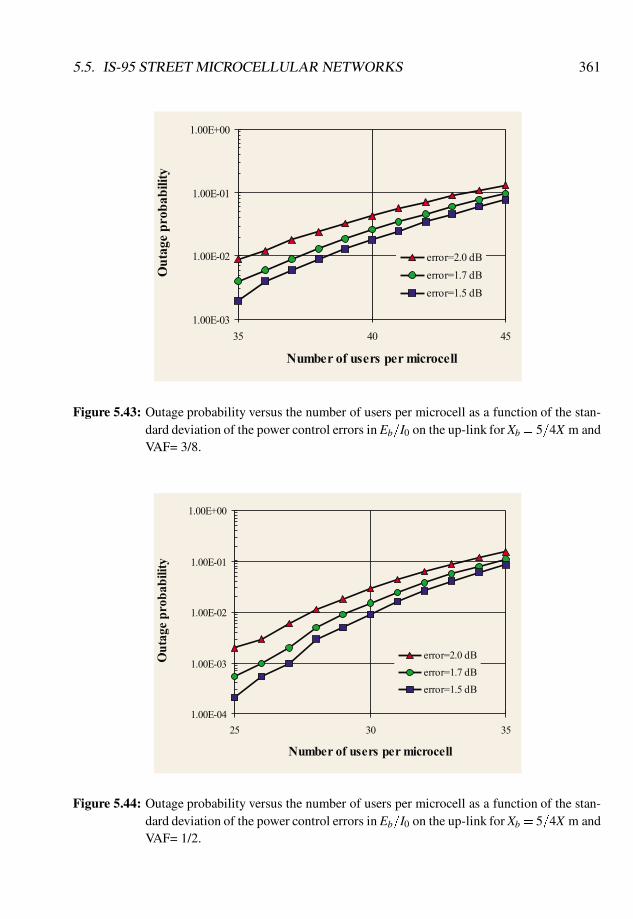
5.5. IS-95 STREET MICROCELLULAR NETWORKS 361
Figure 5.43: Outage probability versus the number of users per microcell as a function of the stan-dard deviation of the power control errors in Eb=I0 on the up-link for Xb = 5=4X m andVAF= 3/8.
Figure 5.44: Outage probability versus the number of users per microcell as a function of the stan-dard deviation of the power control errors in Eb=I0 on the up-link for Xb = 5=4X m andVAF= 1/2.
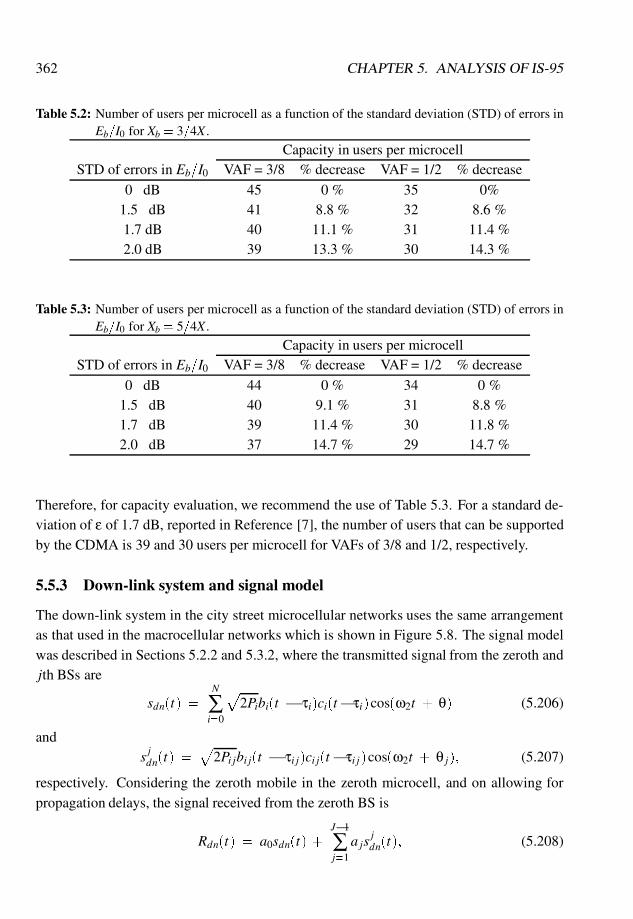
362 CHAPTER 5. ANALYSIS OF IS-95
Table 5.2: Number of users per microcell as a function of the standard deviation (STD) of errors inEb=I0 for Xb = 3=4X .
Capacity in users per microcellSTD of errors in Eb=I0 VAF = 3/8 % decrease VAF = 1/2 % decrease
0 dB 45 0 % 35 0%1.5 dB 41 8.8 % 32 8.6 %1.7 dB 40 11.1 % 31 11.4 %2.0 dB 39 13.3 % 30 14.3 %
Table 5.3: Number of users per microcell as a function of the standard deviation (STD) of errors inEb=I0 for Xb = 5=4X .
Capacity in users per microcellSTD of errors in Eb=I0 VAF = 3/8 % decrease VAF = 1/2 % decrease
0 dB 44 0 % 34 0 %1.5 dB 40 9.1 % 31 8.8 %1.7 dB 39 11.4 % 30 11.8 %2.0 dB 37 14.7 % 29 14.7 %
Therefore, for capacity evaluation, we recommend the use of Table 5.3. For a standard de-viation of ε of 1.7 dB, reported in Reference [7], the number of users that can be supportedby the CDMA is 39 and 30 users per microcell for VAFs of 3/8 and 1/2, respectively.
5.5.3 Down-link system and signal model
The down-link system in the city street microcellular networks uses the same arrangementas that used in the macrocellular networks which is shown in Figure 5.8. The signal modelwas described in Sections 5.2.2 and 5.3.2, where the transmitted signal from the zeroth andjth BSs are
sdn(t) =N
∑i=0
p2Pibi(t � τi)ci(t�τi)cos(ω2t + θ) (5.206)
ands jdn(t) =
p2Pi jbi j(t � τi j)ci j(t�τi j)cos(ω2t + θ j); (5.207)
respectively. Considering the zeroth mobile in the zeroth microcell, and on allowing forpropagation delays, the signal received from the zeroth BS is
Rdn(t) = a0sdn(t) +J�1
∑j=1
a jsjdn(t); (5.208)
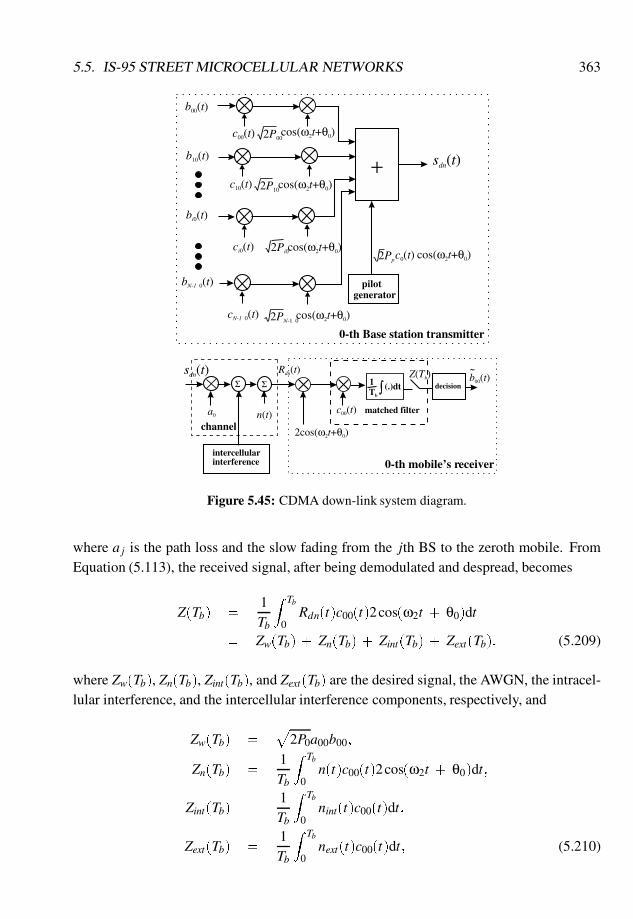
5.5. IS-95 STREET MICROCELLULAR NETWORKS 363
2Pi0cos(ω2t+θ0)
2P00cos(ω2t+θ0)
2PN-1 0cos(ω2t+θ0)
ci0(t)
c00(t)
cN-1 0(t)
bi0(t)
b00(t)
bN-1 0(t)
c10(t) cos(ω2t+θ0)2P10
pilotgenerator
+b10(t)
0-th Base station transmitter
cos(ω2t+θ0)2Ppc0(t)
sdn(t)
Rdn(t)
2cos(ω2t+θ0)
0-th mobile’s receiver
c00(t)
b00(t)decision(.)dt
Tb
1
matched filtera0
channel
Σ
n(t)
Σ
intercellularinterference
Z(Tb)sdn(t)
Figure 5.45: CDMA down-link system diagram.
where a j is the path loss and the slow fading from the jth BS to the zeroth mobile. FromEquation (5.113), the received signal, after being demodulated and despread, becomes
Z(Tb) =1Tb
Z Tb
0Rdn(t)c00(t)2cos(ω2t + θ0)dt
= Zw(Tb) + Zn(Tb) + Zint(Tb) + Zext(Tb); (5.209)
where Zw(Tb), Zn(Tb), Zint(Tb), and Zext(Tb) are the desired signal, the AWGN, the intracel-lular interference, and the intercellular interference components, respectively, and
Zw(Tb) =p
2P0a00b00;
Zn(Tb) =1Tb
Z Tb
0n(t)c00(t)2cos(ω2t + θ0)dt;
Zint(Tb) =1Tb
Z Tb
0nint(t)c00(t)dt;
Zext(Tb) =1Tb
Z Tb
0next(t)c00(t)dt; (5.210)
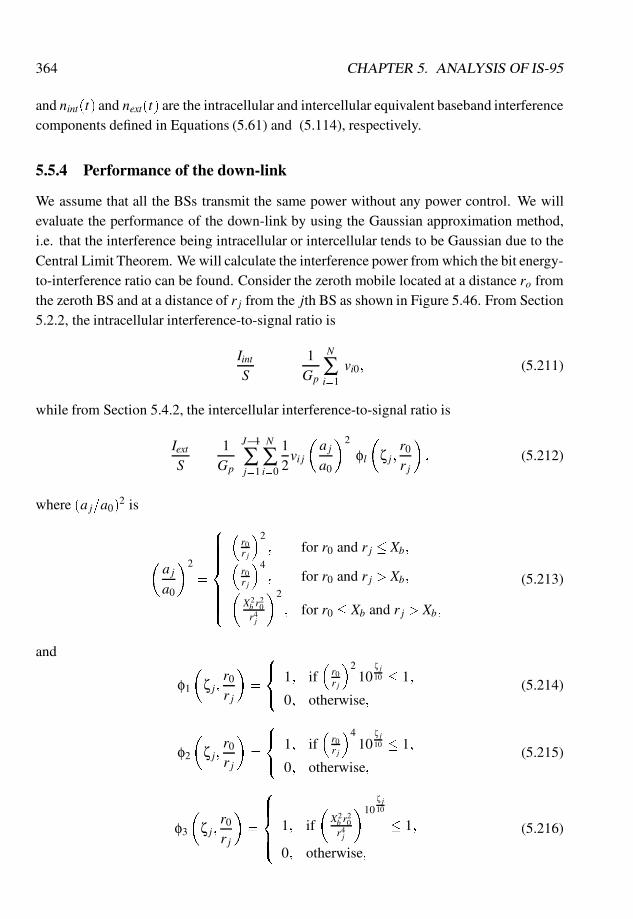
364 CHAPTER 5. ANALYSIS OF IS-95
and nint(t) and next(t) are the intracellular and intercellular equivalent baseband interferencecomponents defined in Equations (5.61) and (5.114), respectively.
5.5.4 Performance of the down-link
We assume that all the BSs transmit the same power without any power control. We willevaluate the performance of the down-link by using the Gaussian approximation method,i.e. that the interference being intracellular or intercellular tends to be Gaussian due to theCentral Limit Theorem. We will calculate the interference power from which the bit energy-to-interference ratio can be found. Consider the zeroth mobile located at a distance ro fromthe zeroth BS and at a distance of r j from the jth BS as shown in Figure 5.46. From Section5.2.2, the intracellular interference-to-signal ratio is
IintS
=1Gp
N
∑i=1
vi0; (5.211)
while from Section 5.4.2, the intercellular interference-to-signal ratio is
IextS
=1Gp
J�1
∑j=1
N
∑i=0
12vi j
�a j
a0
�2
φl
�ζ j;
r0
r j
�; (5.212)
where (a j=a0)2 is
�a j
a0
�2
=
8>>>>><>>>>>:
�r0r j
�2; for r0 and r j � Xb;�
r0r j
�4; for r0 and r j > Xb;�
X2b r
20
r4j
�2
; for r0 � Xb and r j > Xb;
(5.213)
and
φ1
�ζ j;
r0
r j
�=
8<:
1; if�r0r j
�210
ζ j10 � 1;
0; otherwise;(5.214)
φ2
�ζ j;
r0
r j
�=
8<:
1; if�r0r j
�410
ζ j10 � 1;
0; otherwise;(5.215)
φ3
�ζ j;
r0
r j
�=
8>><>>:
1; if
�X2b r
20
r4j
�10ζ j10
� 1;
0; otherwise;
(5.216)
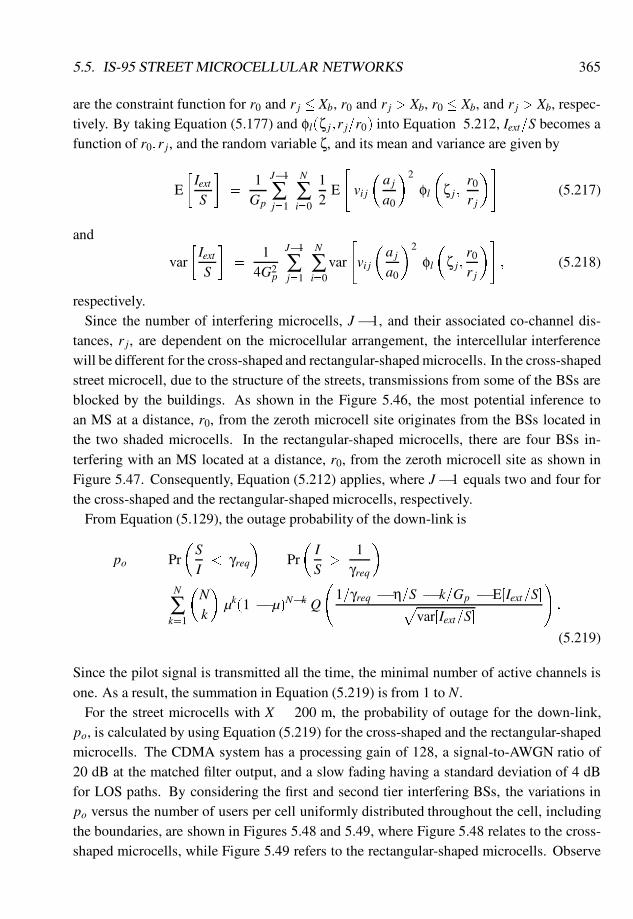
5.5. IS-95 STREET MICROCELLULAR NETWORKS 365
are the constraint function for r0 and r j � Xb, r0 and r j > Xb, r0 � Xb, and r j > Xb, respec-tively. By taking Equation (5.177) and φl(ζ j;r j=r0) into Equation 5.212, Iext=S becomes afunction of r0;r j, and the random variable ζ, and its mean and variance are given by
E
�IextS
�=
1Gp
J�1
∑j=1
N
∑i=0
12
E
"vi j
�a j
a0
�2
φl
�ζ j;
r0
r j
�#(5.217)
and
var
�IextS
�=
14G2
p
J�1
∑j=1
N
∑i=0
var
"vi j
�a j
a0
�2
φl
�ζ j;
r0
r j
�#; (5.218)
respectively.Since the number of interfering microcells, J� 1, and their associated co-channel dis-
tances, r j, are dependent on the microcellular arrangement, the intercellular interferencewill be different for the cross-shaped and rectangular-shaped microcells. In the cross-shapedstreet microcell, due to the structure of the streets, transmissions from some of the BSs areblocked by the buildings. As shown in the Figure 5.46, the most potential inference toan MS at a distance, r0, from the zeroth microcell site originates from the BSs located inthe two shaded microcells. In the rectangular-shaped microcells, there are four BSs in-terfering with an MS located at a distance, r0, from the zeroth microcell site as shown inFigure 5.47. Consequently, Equation (5.212) applies, where J� 1 equals two and four forthe cross-shaped and the rectangular-shaped microcells, respectively.
From Equation (5.129), the outage probability of the down-link is
po = Pr
�SI< γreq
�= Pr
�IS
>1
γreq
�
=N
∑k=1
�Nk
�µk(1 � µ)N�k Q
1=γreq � η=S � k=Gp � E[Iext=S]p
var[Iext=S]
!:
(5.219)
Since the pilot signal is transmitted all the time, the minimal number of active channels isone. As a result, the summation in Equation (5.219) is from 1 to N.
For the street microcells with X = 200 m, the probability of outage for the down-link,po, is calculated by using Equation (5.219) for the cross-shaped and the rectangular-shapedmicrocells. The CDMA system has a processing gain of 128, a signal-to-AWGN ratio of20 dB at the matched filter output, and a slow fading having a standard deviation of 4 dBfor LOS paths. By considering the first and second tier interfering BSs, the variations inpo versus the number of users per cell uniformly distributed throughout the cell, includingthe boundaries, are shown in Figures 5.48 and 5.49, where Figure 5.48 relates to the cross-shaped microcells, while Figure 5.49 refers to the rectangular-shaped microcells. Observe
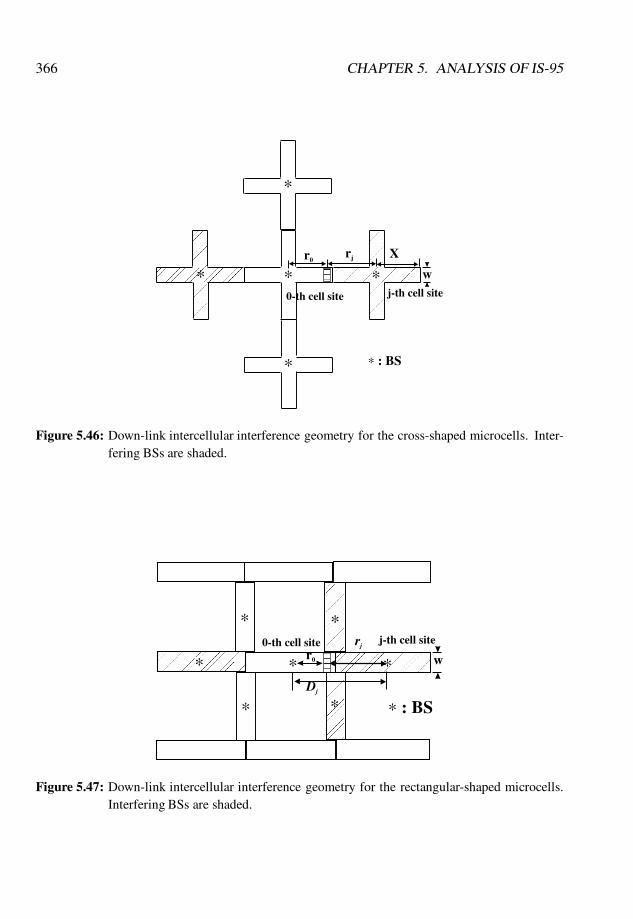
366 CHAPTER 5. ANALYSIS OF IS-95
∗ : BS
∗∗∗0-th cell site
r0
w
Xrj
j-th cell site
∗
∗
Figure 5.46: Down-link intercellular interference geometry for the cross-shaped microcells. Inter-fering BSs are shaded.
∗ : BS
∗∗ ∗j-th cell site0-th cell site
r0
rj
w
Dj
∗
∗ ∗
∗
Figure 5.47: Down-link intercellular interference geometry for the rectangular-shaped microcells.Interfering BSs are shaded.

5.5. IS-95 STREET MICROCELLULAR NETWORKS 367
that the performance curves in Figures 5.48 and 5.49 are only relevant when there is at leastone mobile at a boundary. If this is not the case, then more users can be supported. We foundthat the difference in performance due to path loss break distance is quite small. However,the performance for Xb = 150 m is slightly better than that for Xb = 250 m. Consider theworst case, namely Xb = 250 m, for an outage probability Po � 2% at the microcellularboundary (where the interference from the neighbouring BS is strongest), the cross-shapedmicrocell can support 30 and 39 users for a VAF of 1=2 and 3=8, respectively. Since thereare two more interfering BSs in the rectangular-shaped microcells compared with the cross-shaped microcell, the rectangular-shaped microcell can only support 32 and 25 users permicrocell for a VAF of 3=8 and 1=2, respectively.
The main intercellular interference on the down-link comes from the nearest neighbourBSs, where the number of nearest interfering BSs depends on the cellular arrangement. Formobiles located at the corners of a hexagonal cell, there are two BSs at an equal distancefrom the mobiles, while there is one interfering BS that is closer than the other interferingBSs for mobiles located at the edges of a hexagonal cell. In city street microcells, there areeither one or three nearest interfering BSs for the cross-shaped and the rectangular-shapedmicrocells, respectively.
The cross-shaped microcells can support more users than the rectangular-shaped micro-cells because they have two more significant interfering BSs. The capacity of the cross-shaped microcells is limited by the up-link for power control errors where the standarddeviation exceeds 1 dB, while the capacity of the rectangular-shaped microcells is limitedby the down-link transmissions.
Orthogonal spreading codes are used in the down-link of the IS-95 system as discussed inSection 5.3.3. We found that the down-link capacity of the IS-95 system in macrocellularnetworks is approximately three times that of a system using non-orthogonal codes. Simi-larly, by employing orthogonal codes in the down-link, the capacity of the CDMA system inthe rectangular-shaped microcells is no longer down- link limited. Therefore, the capacityof the IS-95 system in city street microcells becomes up-link limited.
5.5.5 Capacity of IS-95 in street microcells
For a message bit rate of 10 kHz and a spreading factor of 128, the capacity of the CDMAsystem in terms of numbers of channels per cell per MHz is evaluated using Equation (5.120).For a standard deviation of ε of 1.7 dB, the CDMA system in the cross-shaped microcellscan support 39 and 30 users per microcell for VAFs of 3/8 and 1/2, which is a capacityof 31 and 24 channels per microcell per MHz for VAFs of 3/8 and 1/2, respectively. Thecorresponding values for the rectangular-shaped microcells are 32 and 25 users per micro-cell for VAFs of 3/8 and 1/2, respectively, which is 25 and 20 channels per microcell perMHz for VAFs of 3/8 and 1/2, respectively. Compared with the capacity of CDMA systems
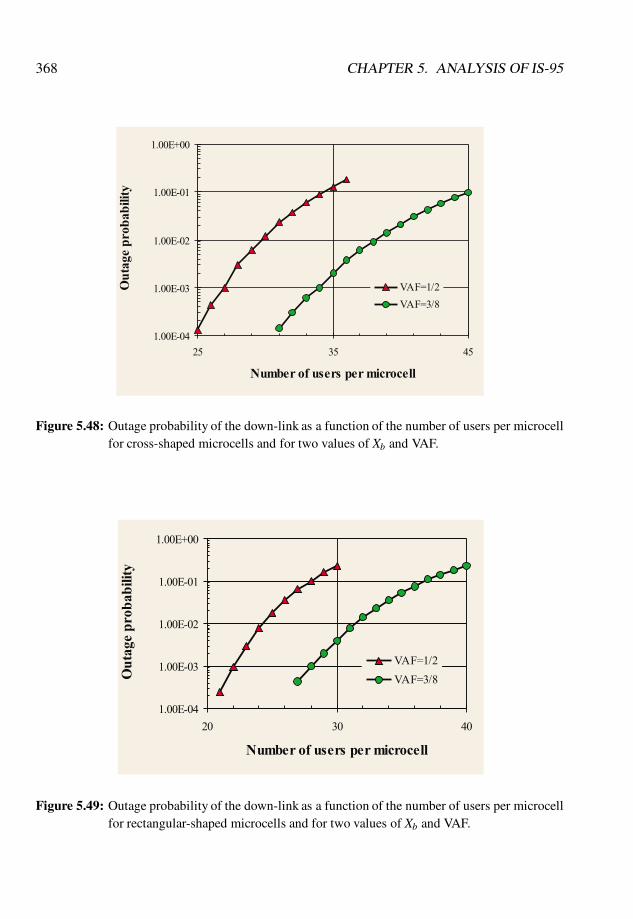
368 CHAPTER 5. ANALYSIS OF IS-95
Figure 5.48: Outage probability of the down-link as a function of the number of users per microcellfor cross-shaped microcells and for two values of Xb and VAF.
Figure 5.49: Outage probability of the down-link as a function of the number of users per microcellfor rectangular-shaped microcells and for two values of Xb and VAF.
5.5. IS-95 STREET MICROCELLULAR NETWORKS 369
in hexagonal omni cells, CDMA systems for city street microcells have capacities 15%and 40% higher than CDMA systems in the hexagonal cells for rectangular-shaped andcross-shaped microcells, respectively. Since the coverage area of the rectangular-shapedmicrocells is only half of the cross-shaped microcells, the rectangular-shaped microcellshave a capacity in terms of channels per MHz per area that is 1.65 and 1.66 times that of thecross-shaped microcells for a VAF of 3/8 and 1/2, respectively.
Since the IS-95 system uses orthogonal codes on its down-link, its capacity is basicallyup-link limited. The capacity of the IS-95 system in both the cross-shaped and rectangular-shaped microcellular networks has the same capacity, which is 31 and 24 channels permicrocell per MHz for a VAF of 3/8 and 1/2, respectively.
5.5.6 Summary
For CDMA, the most significant interference on the up-link originated from users inside themicrocell, as approximately half of the interference generated from outside the microcellwas prevented from entering due to shielding from surrounding buildings. We observedthat in hexagonal cellular structures all the mobiles were able to cause interference, andconsequently a CDMA system for the city street microcells had a capacity that was 25%and 35% higher than CDMA systems in the hexagonal cells for rectangular-shaped andcross-shaped microcells, respectively. The intracellular interference on the down-link wasthe same as on the up-link, irrespective of cell shape, while dominant intercellular inter-ference was from the nearest neighbour cells. In hexagonal cells, there were two and onedominant interfering BSs for mobiles located at the corners and edges of a hexagonal cells,respectively. In city street microcells, there were one and three dominant interfering BSsfor the cross-shaped and the rectangular-shaped microcells, respectively. Unlike on the up-link, there was only a small decrease in the intercellular interference on the down-link in thecross-shaped microcells, while for the rectangular-shaped microcells there was an increasein the intercellular interference.
For perfect power control, the CDMA system supported 34 and 44 users for a VAF of1/2 and for 3/8, respectively. There were errors in the Eb=I0 on the up-link power controlerrors in the received Eb=I0 had a standard deviation of 1.5dB, 1.7 dB, and 2.0 dB, thecorresponding decrease in capacity was approximately 9% , 12%, and 15%, respectively.For Eb=I0 having a standard deviation of 1.7 dB, the CDMA system using cross-shapedmicrocells supported 39 users and 30 per microcell for VAFs of 3/8 and 1/2, correspondingto a capacity of 30 and 24 channels per cell per MHz for VAFs of 3/8 and 1/2, respectively.With rectangular-shaped microcells whose capacity, on the other hand, is limited by thedown-link, 32 and 25 users per microcell were supported, which was 25 and 20 channelsper cell per MHz for VAFs of 3/8 and 1/2, respectively.

370 CHAPTER 5. ANALYSIS OF IS-95
5.6 Power Control in CDMA Systems
CDMA technology has the potential to provide a significant improvement in the capacity ofcellular mobile radio systems compared with FDMA and TDMA systems [19]. However,the improvement is dependent upon the effectiveness of the power control system [6], espe-cially on the up-link. In the absence of power control, a BS would receive a much strongersignal from a mobile that is geographically close to it than from a mobile that is fartheraway. The consequence is a dramatic decrease in system capacity. This is the so-called‘near–far’ problem. A power control scheme is needed not only to eliminate the near–farproblem, but also to equalise and minimise the power transmitted by each mobile.
Power control on the up-link, or reverse link, in CDMA attempts to adjust the transmittedpower of each mobile such that nominal received power from each mobile station (MS) atthe base station (BS) is the same. To achieve this goal, a power control scheme is requiredto monitor and track the power transmitted by each mobile. Since the path loss and slowfading can be assumed to be identical on both up-link and down-link, the open-loop powercontrol is used to estimate the path loss and slow fading from the CDMA pilot transmittedon the down-link, while the effect of fast fading is mitigated by a closed-loop power controlscheme [20].
In a fixed-step-size, closed-loop power control system, the BS measures the receivedpower from an MS and compares it with a reference target power. A command bit is thengenerated and sent to the MS. If the command bit is a logical 1 it signifies that the receivedpower is less than the target power, while a logical 0 bit signifies the power is greater thanthe target power. The MS adjusts its transmitted power according to the command bit witha fixed increment or decrement of power. The closed-loop power control scheme used inIS-95 is a fixed-step-size power control with the transmitted power changing by +1 dB inresponse to each transmitted BS command bit [20].
In this section we consider an adaptive-step-size closed-loop power control scheme inwhich a mobile automatically adjusts its power step size according to the pattern of itsreceived power control bits, without an increase in the control bit rate. Our results are com-pared to a fixed-step power control scheme. Multi-tap RAKE receivers are employed. Sincethe efficiency of the power control relies on how accurately we can measure the receivedpower, power measurement plays an important role in the power control mechanism. Wefirst describe our method of estimating the received power, and then describe our powercontrol algorithm.
5.6.1 Channel model
The desired CDMA signal from an MS and the interference power received at the BS are keyparameters in a power control system. Another major factor is the dispersive mobile radio
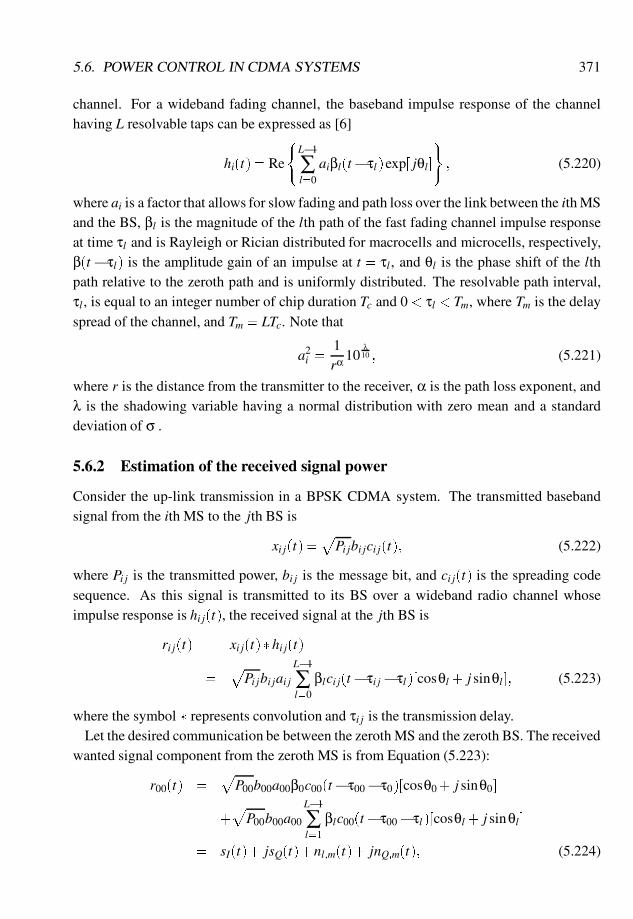
5.6. POWER CONTROL IN CDMA SYSTEMS 371
channel. For a wideband fading channel, the baseband impulse response of the channelhaving L resolvable taps can be expressed as [6]
hi(t) = Re
(L�1
∑l=0
aiβl(t�τl)exp[ jθl]
); (5.220)
where ai is a factor that allows for slow fading and path loss over the link between the ith MSand the BS, βl is the magnitude of the lth path of the fast fading channel impulse responseat time τl and is Rayleigh or Rician distributed for macrocells and microcells, respectively,β(t� τl) is the amplitude gain of an impulse at t = τl , and θl is the phase shift of the lthpath relative to the zeroth path and is uniformly distributed. The resolvable path interval,τl , is equal to an integer number of chip duration Tc and 0 < τl < Tm, where Tm is the delayspread of the channel, and Tm = LTc. Note that
a2i =
1rα 10
λ10 ; (5.221)
where r is the distance from the transmitter to the receiver, α is the path loss exponent, andλ is the shadowing variable having a normal distribution with zero mean and a standarddeviation of σ .
5.6.2 Estimation of the received signal power
Consider the up-link transmission in a BPSK CDMA system. The transmitted basebandsignal from the ith MS to the jth BS is
xi j(t) =p
Pi jbi jci j(t); (5.222)
where Pi j is the transmitted power, bi j is the message bit, and ci j(t) is the spreading codesequence. As this signal is transmitted to its BS over a wideband radio channel whoseimpulse response is hi j(t), the received signal at the jth BS is
ri j(t) = xi j(t)�hi j(t)
=pPi jbi jai j
L�1
∑l=0
βlci j(t�τi j�τl)[cosθl + j sinθl]; (5.223)
where the symbol � represents convolution and τi j is the transmission delay.Let the desired communication be between the zeroth MS and the zeroth BS. The received
wanted signal component from the zeroth MS is from Equation (5.223):
r00(t) =p
P00b00a00β0c00(t�τ00�τ0)[cosθ0 + j sinθ0]
+p
P00b00a00
L�1
∑l=1
βlc00(t�τ00�τl)[cosθl + j sinθl]
= sI(t)+ jsQ(t)+nl;m(t)+ jnQ;m(t); (5.224)
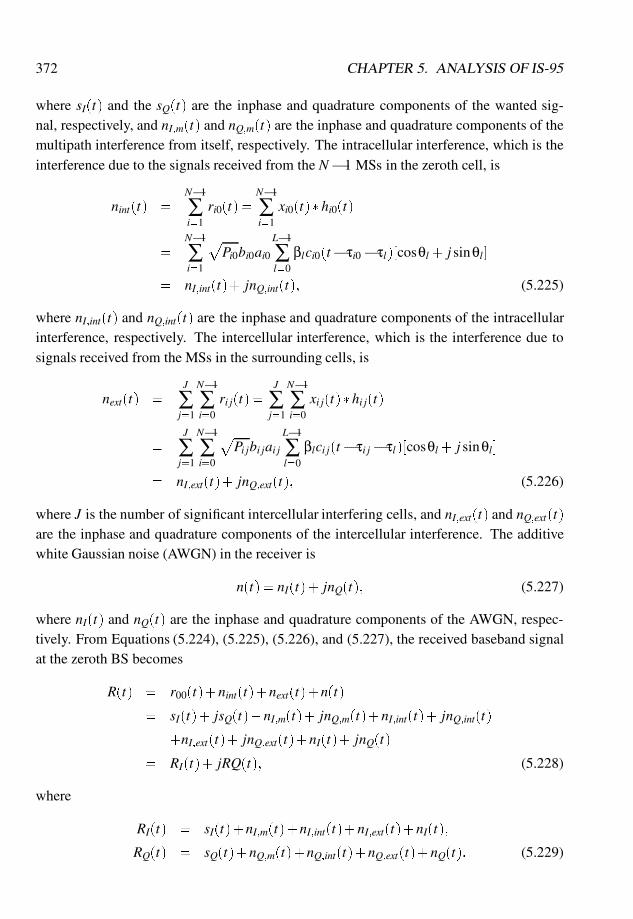
372 CHAPTER 5. ANALYSIS OF IS-95
where sI(t) and the sQ(t) are the inphase and quadrature components of the wanted sig-nal, respectively, and nI;m(t) and nQ;m(t) are the inphase and quadrature components of themultipath interference from itself, respectively. The intracellular interference, which is theinterference due to the signals received from the N�1 MSs in the zeroth cell, is
nint(t) =N�1
∑i=1
ri0(t) =N�1
∑i=1
xi0(t)�hi0(t)
=N�1
∑i=1
pPi0bi0ai0
L�1
∑l=0
βlci0(t�τi0�τl)[cosθl + j sinθl]
= nI;int(t)+ jnQ;int(t); (5.225)
where nI;int(t) and nQ;int(t) are the inphase and quadrature components of the intracellularinterference, respectively. The intercellular interference, which is the interference due tosignals received from the MSs in the surrounding cells, is
next(t) =J
∑j=1
N�1
∑i=0
ri j(t) =J
∑j=1
N�1
∑i=0
xi j(t)�hi j(t)
=J
∑j=1
N�1
∑i=0
pPi jbi jai j
L�1
∑l=0
βlci j(t�τi j�τl)[cosθl + j sinθl]
= nI;ext(t)+ jnQ;ext(t); (5.226)
where J is the number of significant intercellular interfering cells, and nI;ext(t) and nQ;ext(t)are the inphase and quadrature components of the intercellular interference. The additivewhite Gaussian noise (AWGN) in the receiver is
n(t) = nI(t)+ jnQ(t); (5.227)
where nI(t) and nQ(t) are the inphase and quadrature components of the AWGN, respec-tively. From Equations (5.224), (5.225), (5.226), and (5.227), the received baseband signalat the zeroth BS becomes
R(t) = r00(t)+nint(t)+next(t)+n(t)
= sI(t)+ jsQ(t)+nI;m(t)+ jnQ;m(t)+nI;int(t)+ jnQ;int(t)
+nI;ext(t)+ jnQ;ext(t)+nI(t)+ jnQ(t)
= RI(t)+ jRQ(t); (5.228)
where
RI(t) = sI(t)+nI;m(t)+nI;int(t)+nI;ext(t)+nI(t);
RQ(t) = sQ(t)+nQ;m(t)+nQ;int(t)+nQ;ext(t)+nQ(t): (5.229)
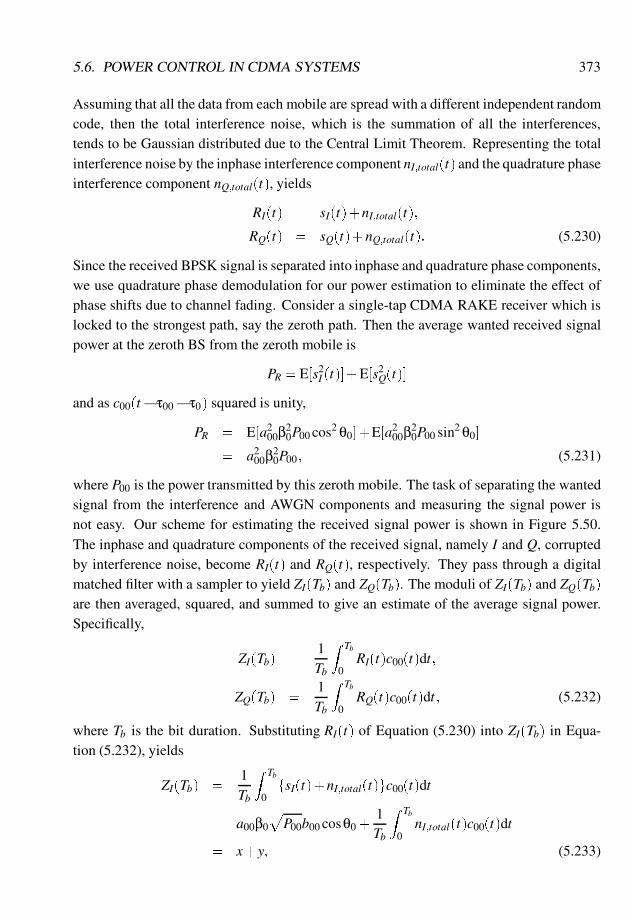
5.6. POWER CONTROL IN CDMA SYSTEMS 373
Assuming that all the data from each mobile are spread with a different independent randomcode, then the total interference noise, which is the summation of all the interferences,tends to be Gaussian distributed due to the Central Limit Theorem. Representing the totalinterference noise by the inphase interference component nI;total(t) and the quadrature phaseinterference component nQ;total(t), yields
RI(t) = sI(t)+nI;total(t);
RQ(t) = sQ(t)+nQ;total(t): (5.230)
Since the received BPSK signal is separated into inphase and quadrature phase components,we use quadrature phase demodulation for our power estimation to eliminate the effect ofphase shifts due to channel fading. Consider a single-tap CDMA RAKE receiver which islocked to the strongest path, say the zeroth path. Then the average wanted received signalpower at the zeroth BS from the zeroth mobile is
PR = E[s2I (t)]+E[s2
Q(t)]
and as c00(t�τ00�τ0) squared is unity,
PR = E[a200β2
0P00 cos2 θ0]+E[a200β2
0P00 sin2 θ0]
= a200β2
0P00; (5.231)
where P00 is the power transmitted by this zeroth mobile. The task of separating the wantedsignal from the interference and AWGN components and measuring the signal power isnot easy. Our scheme for estimating the received signal power is shown in Figure 5.50.The inphase and quadrature components of the received signal, namely I and Q, corruptedby interference noise, become RI(t) and RQ(t), respectively. They pass through a digitalmatched filter with a sampler to yield ZI(Tb) and ZQ(Tb). The moduli of ZI(Tb) and ZQ(Tb)are then averaged, squared, and summed to give an estimate of the average signal power.Specifically,
ZI(Tb) =1Tb
Z Tb
0RI(t)c00(t)dt;
ZQ(Tb) =1Tb
Z Tb
0RQ(t)c00(t)dt; (5.232)
where Tb is the bit duration. Substituting RI(t) of Equation (5.230) into ZI(Tb) in Equa-tion (5.232), yields
ZI(Tb) =1Tb
Z Tb
0fsI(t)+nI;total(t)gc00(t)dt
= a00β0
pP00b00 cosθ0 +
1Tb
Z Tb
0nI;total(t)c00(t)dt
= x+y; (5.233)

374 CHAPTER 5. ANALYSIS OF IS-95
where the meanings of x and y are obvious assuming that c00(t� τ00� τ0) and c00(t) aretime aligned. The first term in Equation (5.233) is the wanted inphase signal componenthaving a magnitude a00β0
pP00 cosθ0 and a bipolar data bit of b00. The second term is due
to inphase interference noise, and as c00(t) is uncorrelated with the interference noise, thiscomponent is a random Gaussian process. Similarly we have
ZQ(Tb) =1Tb
Z Tb
0fsQ(t)+nQ;total(t)gc00(t)dt
= a00β0
pP00b00 sinθ0 +
1Tb
Z Tb
0nQ;total(t)c00(t)dt (5.234)
for the quadrature phase channel. The inphase component at the output of the digitalmatched filter in Equation (5.233) is x, representing the wanted signal, plus y, represent-ing the interference component. For satisfactory performance, the magnitude of the wantedsignal should be larger than the magnitude of the interference noise, i.e.
jxj � jyj: (5.235)
From Equation (5.235), the absolute value of Equation (5.233) can be found to be
jZI(Tb)j= jx+yj =(
x+y; for x� 0;�(x+y); for x< 0:
(5.236)
Because y is a random variable with Gaussian distribution, the mean of y tends to be zero.Therefore Equation (5.236) becomes
E[jZI(Tb)j] = E[jxj] = E[ja00β0
pP00 cosθ0j]: (5.237)
Similarly, the quadrature component at the output of the digital matched filter can be shownto be
E[jZQ(Tb)j] = E[ja00β0
pP00 sinθ0j]: (5.238)
From Equations (5.231), (5.237), and (5.238), the received signal power prior to bit detec-tion is
PR = a200β2
0P00 = fE[jZI(Tb)j]g2 +fE[jZQ(Tb)j]g2: (5.239)
The expectations in Equation (5.239) are computed over a window of WTb width, namely
PR =
"1W
W
∑k=1
jZI(Tb)j#2
+
"1W
W
∑k=1
jZQ(Tb)j#2
+ξ; (5.240)
where ξ is the estimation error due to finite window duration.
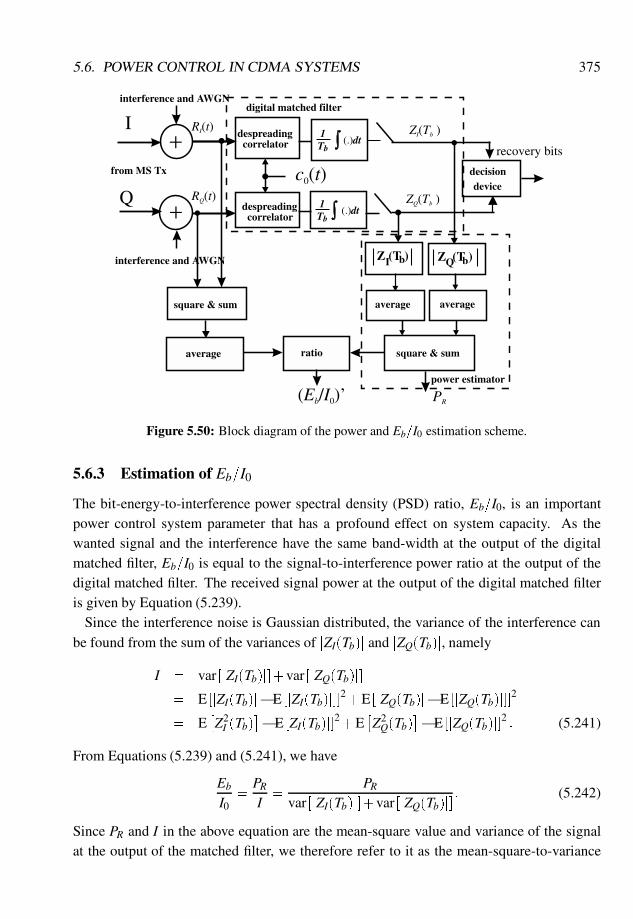
5.6. POWER CONTROL IN CDMA SYSTEMS 375
Tb
1despreadingcorrelator
RI(t) ZI(Tb )(.)dt
decisiondevice
interference and AWGN
+from MS Tx
digital matched filter
despreadingcorrelator
ZQ(Tb )
c0(t)
(.)dtTb
1
recovery bits
+RQ(t)
interference and AWGN
I
Q
square & sum
PR
average
ratio
(Eb/I0)’
Z (T )bI Z (T )bQ
averagesquare & sum
average
power estimator
Figure 5.50: Block diagram of the power and Eb=I0 estimation scheme.
5.6.3 Estimation of Eb=I0
The bit-energy-to-interference power spectral density (PSD) ratio, Eb=I0, is an importantpower control system parameter that has a profound effect on system capacity. As thewanted signal and the interference have the same band-width at the output of the digitalmatched filter, Eb=I0 is equal to the signal-to-interference power ratio at the output of thedigital matched filter. The received signal power at the output of the digital matched filteris given by Equation (5.239).
Since the interference noise is Gaussian distributed, the variance of the interference canbe found from the sum of the variances of jZI(Tb)j and jZQ(Tb)j, namely
I = var [jZI(Tb)j]+var [jZQ(Tb)j]
= E [jZI(Tb)j�E [jZI(Tb)j]]2 +E [jZQ(Tb)j�E [jZQ(Tb)j]]
2
= E�Z2I (Tb)
��E [ZI(Tb)j]
2 +E�Z2Q(Tb)
��E [jZQ(Tb)j]
2 : (5.241)
From Equations (5.239) and (5.241), we have
Eb
I0=
PRI
=PR
var [jZI(Tb)j]+var [jZQ(Tb)j]: (5.242)
Since PR and I in the above equation are the mean-square value and variance of the signalat the output of the matched filter, we therefore refer to it as the mean-square-to-variance

376 CHAPTER 5. ANALYSIS OF IS-95
ratio (MSVR) method. To calculate var[jZI(Tb)j] and var[jZQ(Tb)j] in the denominator ofEquation (5.242), as shown in Equation (5.241), in addition to an error ξ in performing themean square of jZI(Tb)j and jZQ(Tb)j, there will also be another error in performing themean of Z2
I (Tb) and Z2Q(Tb).
In order to improve the accuracy of the estimation of Eb=I0, we proposed a method toestimate the interference power, which will be derived as follows. As the interference signalpasses through the digital matched filter, the total interference power is decreased by theprocessing gain, Gp, i.e.
I =1Gp
�E[nI;total(t)]
2+E[nQ;total(t)]2 : (5.243)
Because the total received signal is the sum of all the signals from all the mobiles, bothinside and outside the cell, the total received signal tends to be Gaussian distributed due tothe Central Limit Theorem. Because the wanted signal, s(t), is mutually independent of theinterference component, the total average received power before detection is given by
E[R2(t)] = E[s2I (t)]+E[s2
Q(t)]+E[nI;total(t)]2+E[nQ;total(t)]2
= PR+E[nI;total(t)]2+E[nQ;total(t)]
2: (5.244)
From Equations (5.231), (5.243) and (5.244), the value of Eb=I0 at the output of the digitalmatched filter can be represented by
Eb
I0=
PR1Gp
fE[nI;total(t)]2+E[nQ;total(t)]2g
=F
1� FGp
; (5.245)
where
F =PR
E[R2(t)]=Gp: (5.246)
From Equation 5.246, we can estimate the Eb=I0 from F. As an example, for a processinggain Gp of 128 or 64, an Eb=I0 of 7 dB is obtained by F=6.82 or 7.0dB, respectively. Bytaking the ratio of the measured average received power at the output of the digital matchedfilter to the average total received power at received front-end we obtain the value of F.
5.6.4 Estimation of Eb=I0 for RAKE receivers
The system performance is determined by Eb=I0 at the output of the RAKE receiver, wherethe Eb=I0 is dependent on the combining schemes. For a maximal ratio combining scheme
5.6. POWER CONTROL IN CDMA SYSTEMS 377
the Eb=I0 at the output of the RAKE receiver equals the summation of the Eb=I0 from the Ltaps, and is equal to [21]
�Eb
I0
�c=
L�1
∑l=0
�Eb
I0
�l=
L�1
∑l=0
GpPR;l
Il; (5.247)
where PR;l is the received signal power of the lth tap and Il is the interference power associ-ated with the lth tap. Since the interference power in the L taps is approximately the same,Il can be estimated as
Il = E[R2(t)]�E[PR;l] = E[R2(t)]�1L
L�1
∑l=0
PR;l : (5.248)
Substituting Equation (5.248) into (5.247), yields
�Eb
I0
�c=
Gp ∑L�1l=0 PR;l
E[R2(t)]�1=L∑L�1l=0 PR;l
=
Gp ∑L�1l=0 PR;l
E[R2(t)]
1� ∑L�1l=0 PR;l
E[R2(t)]L
: (5.249)
Let the power sum of the L taps be the received signal power of an L-tap RAKE receiver,i.e.
PR =L�1
∑l=0
PR;l ; (5.250)
then Equation (5.249) can be rewritten as
�Eb
I0
�c=
GpPRE[R2(t)]
1� PRE[R2(t)]L
=F
1� FGpL
: (5.251)
For an equal gain combining scheme, the Eb=I0 at the output of the RAKE receiver is 1 dBless than that for a maximal ratio combining scheme [21,22].
5.6.5 Power control scheme
The power control system diagram is shown in Figure 5.51. In the BS receiver there is aRAKE receiver, power estimator circuits based on the power estimation theory describedin the previous section, a comparison circuit, and monitoring of the received bit energy-to-power spectral density ratio. In the mobile receiver, there is step-size logic that is used toadjust the transmitted power PT of the MS in an attempt to ensure that the received basebandpower at the BS, PR, is close to the target power, Ptarget, at all times. Ptarget is determinedfrom Equations (5.246) and (5.251) according to the required Eb=I0 at the output of theRAKE receiver and the interference level.
378 CHAPTER 5. ANALYSIS OF IS-95
The power PR is compared with a target power Ptarget . A logical 0 command bit is gen-erated if PR � Ptarget, otherwise a logical 1 is formed. The command bit is embedded inthe BS traffic stream for transmission on the down-link. When the MS receives the CDMAsignal, it removes the command bit from the data stream and inserts it into a shift registerwhich stores the current and six previous power command bits. For a fixed-step-size controlscheme, only the present control bit, R0, is used, while for the adaptive-step-size schemethe logic pattern of the seven bits stored in the shift register are employed to adjust the MStransmitted power. A pattern of 0,1,0,1,0,1,0 or 1,0,1,0,1,0,1 means the received power PRat the BS is approximately the same as the required target power, while consecutive groupsof 1s or 0s means the transmitted power from an MS is much larger or smaller than thetarget power, respectively. Hence, we can predict the power control error according to thepattern of the previous control bits [23]. The performance of the power control scheme isalso monitored by the received bit-to-interference PSD in the BS, where the statistics of themeasured Eb=I0 can be examined.
5.6.5.1 Adaptive-step-size control algorithm
In order to track the target power and to minimise the power control error at the BS, the stepsize ∆i applied to the integrator whose output adjusts the transmitted power PT should varyaccording to the power error. If a large power error occurs, the step size should increaseproportionally. If a smaller power error occurs, then a small step should be assigned. Thevariable step size ∆i is based on the previous control bits stored in the mobile receiver.
There are three factors that cause the received power at the BS to vary. These are thepath loss, slow fading, and fast fading. As long as the power control bit rate is fast enough,the dominant factor becomes the fast fading. A simplified representation of the receivedsignal level versus distance profile is shown in Figure 5.52. The fading rate is proportionalto the vehicle speed, while the depth of each fade is a random variable. We divide the fastfading shown by the dotted line into two zones A and B shown in Figure 5.52, where zoneA relates to the situation where the variation in the fading is relatively slow compared withthat in zone B. In order to track the fast fading, the power should be adjusted according tothe inverse of the fast fading characteristics as shown by the dashed line in Figure 5.52. Thisis achieved by formulating a variable g whose value is determined by the logical values inthe shift register, namely R0, R1, R2, R3, R4, R5, and R6. The step size is
∆i =Φ+gΛ; (5.252)
where ∆i =Φ when g is zero, and Λ is a system parameter. For the slow variation in zone A,a fixed step size of Φ is sufficient to track the power variation. For the rapid power variationin zone B, the step size ∆i should be larger. This is achieved by increasing the value of gto compensate for the abrupt signal variations around the deep fades. The value of g for
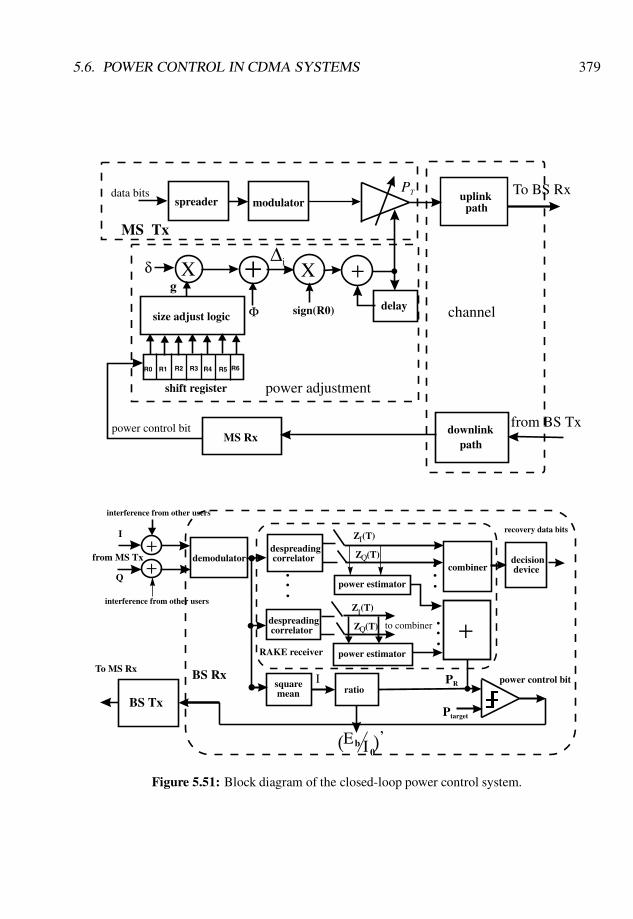
5.6. POWER CONTROL IN CDMA SYSTEMS 379
despreadingcorrelator
MS Rxpower control bit
g
size adjust logic
shift register
uplinkpath
channel
downlinkpath
from BS Tx
To BS RxPT
MS Tx
data bitsspreader modulator
power adjustment
sign(R0)
δ Χ Χ∆i+
Φ
+delay
power control bit
BS Tx
BS Rx
+demodulator
ratio
recovery data bits
interference from other users
from MS Tx
To MS Rx
decisiondevice
despreadingcorrelator
combiner
..
.
..
.
Isquaremean
RAKE receiver
targetP
I
Q+
interference from other users
Z (T)I
Z (T)Q
Eb I 0( )’
power estimator
power estimator
Z (T)I
Z (T)Q +to combiner
..
.
RP
R0 R1 R2 R4 R5R3 R6
Figure 5.51: Block diagram of the closed-loop power control system.
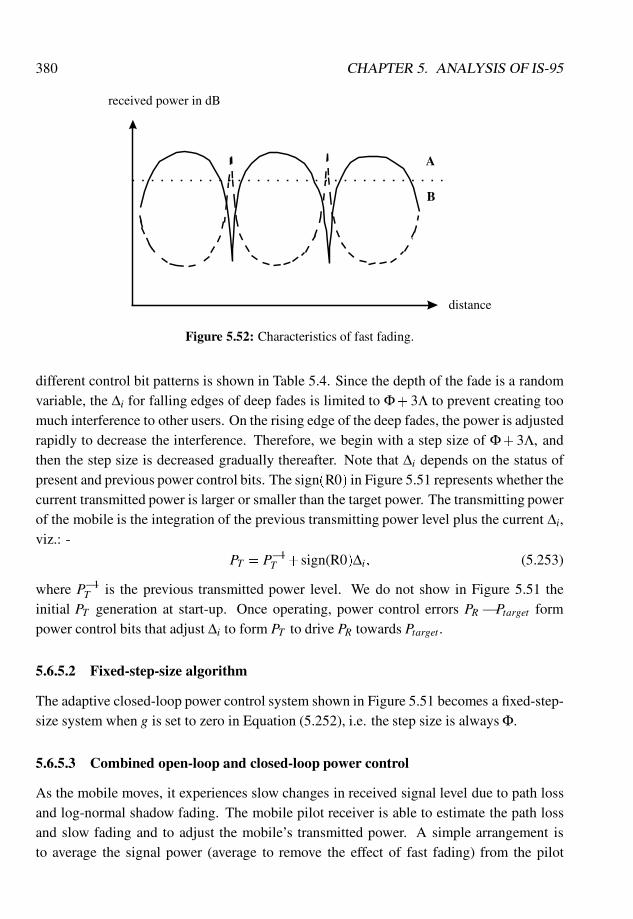
380 CHAPTER 5. ANALYSIS OF IS-95
A
B
received power in dB
distance
Figure 5.52: Characteristics of fast fading.
different control bit patterns is shown in Table 5.4. Since the depth of the fade is a randomvariable, the ∆i for falling edges of deep fades is limited to Φ+ 3Λ to prevent creating toomuch interference to other users. On the rising edge of the deep fades, the power is adjustedrapidly to decrease the interference. Therefore, we begin with a step size of Φ+ 3Λ, andthen the step size is decreased gradually thereafter. Note that ∆i depends on the status ofpresent and previous power control bits. The sign(R0) in Figure 5.51 represents whether thecurrent transmitted power is larger or smaller than the target power. The transmitting powerof the mobile is the integration of the previous transmitting power level plus the current ∆i,viz.: -
PT = P�1T + sign(R0)∆i; (5.253)
where P�1T is the previous transmitted power level. We do not show in Figure 5.51 the
initial PT generation at start-up. Once operating, power control errors PR � Ptarget formpower control bits that adjust ∆i to form PT to drive PR towards Ptarget .
5.6.5.2 Fixed-step-size algorithm
The adaptive closed-loop power control system shown in Figure 5.51 becomes a fixed-step-size system when g is set to zero in Equation (5.252), i.e. the step size is always Φ.
5.6.5.3 Combined open-loop and closed-loop power control
As the mobile moves, it experiences slow changes in received signal level due to path lossand log-normal shadow fading. The mobile pilot receiver is able to estimate the path lossand slow fading and to adjust the mobile’s transmitted power. A simple arrangement isto average the signal power (average to remove the effect of fast fading) from the pilot

5.6. POWER CONTROL IN CDMA SYSTEMS 381
Table 5.4: Adaptive step size of the power adjustment. In any row x may be a logical 1 or 0. Allother combinations not shown in the table have g= 0.
R0 R1 R2 R3 R4 R5 R6 g
1 1 1 0 x x x 11 1 1 1 0 x x 31 1 1 1 1 0 x 21 1 1 1 1 1 0 11 1 1 1 1 1 1 00 1 1 1 1 1 1 30 1 1 1 1 1 0 20 0 1 1 1 1 1 30 0 0 1 1 1 1 20 0 0 1 x x x 10 0 0 0 1 x x 10 0 0 0 0 1 x 20 0 0 0 0 0 1 0
correlator and subtract it from the previous average value [24]. The difference power signalis then added to the signal from the output closed-loop power adjustment sub-system, andthe combined signal is used to modify the transmitted power of the mobile.
5.6.6 Simulations and results
This closed-loop power control system has been simulated for mobiles experiencing pathloss profiles measured in city areas and fast fading when travelling at speeds of 12, 24, 48and 96 km/h. We considered two closed-loop power control algorithms, the fixed-step-size(FS) algorithm and the adaptive-step-size (AS) algorithm. These control schemes couldoperate in a closed-loop incorporated with an open-loop mode (/C/O) and in a closed-loopmode (/C). The received power was measured every 1.25 ms. The fixed-step-size controlscheme used a fixed step size of 1 dB for both the Rayleigh and Rician fading channels. Theadaptive-step-size control scheme was simulated with a Φ of 1 dB, and a Λ which dependson the architecture of the RAKE receiver and types of fading. In fading channels whereeach component fades according to Rayleigh statistics, a Λ of 0.9 dB, 0.5 dB and 0.3 dBwas used for a one-tap, two-tap, and three-tap RAKE receiver, respectively. In Rician fadingchannels having a K factor of 6 dB, a Λ of 0.7 dB, 0.4 dB, and 0.2 dB was used for a one-tap, two-tap, and three-tap RAKE receiver, respectively. In Rician fading channels havinga K factor of 12 dB, a Λ of 0.1 was used. Since the transmitted power was updated every
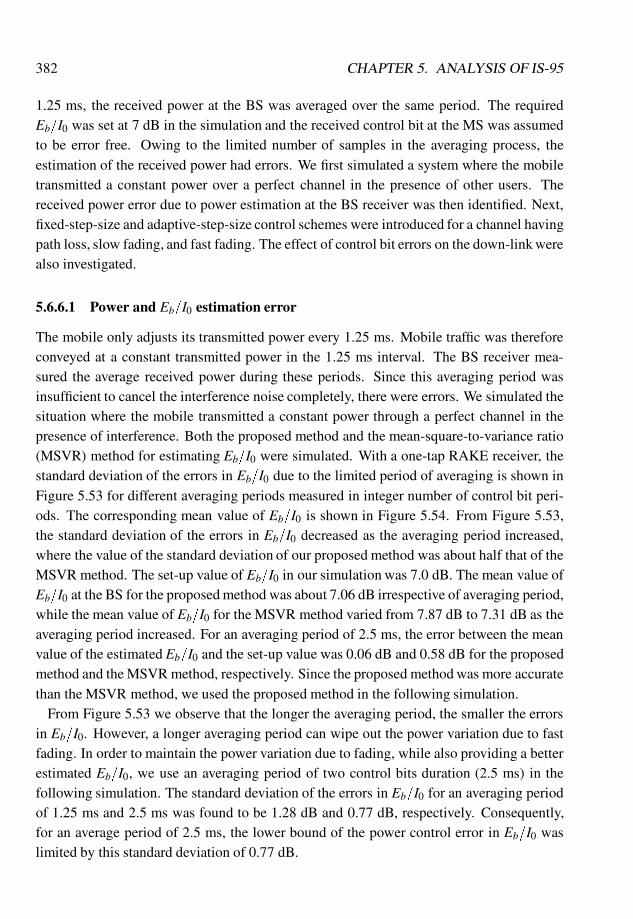
382 CHAPTER 5. ANALYSIS OF IS-95
1.25 ms, the received power at the BS was averaged over the same period. The requiredEb=I0 was set at 7 dB in the simulation and the received control bit at the MS was assumedto be error free. Owing to the limited number of samples in the averaging process, theestimation of the received power had errors. We first simulated a system where the mobiletransmitted a constant power over a perfect channel in the presence of other users. Thereceived power error due to power estimation at the BS receiver was then identified. Next,fixed-step-size and adaptive-step-size control schemes were introduced for a channel havingpath loss, slow fading, and fast fading. The effect of control bit errors on the down-link werealso investigated.
5.6.6.1 Power and Eb=I0 estimation error
The mobile only adjusts its transmitted power every 1.25 ms. Mobile traffic was thereforeconveyed at a constant transmitted power in the 1.25 ms interval. The BS receiver mea-sured the average received power during these periods. Since this averaging period wasinsufficient to cancel the interference noise completely, there were errors. We simulated thesituation where the mobile transmitted a constant power through a perfect channel in thepresence of interference. Both the proposed method and the mean-square-to-variance ratio(MSVR) method for estimating Eb=I0 were simulated. With a one-tap RAKE receiver, thestandard deviation of the errors in Eb=I0 due to the limited period of averaging is shown inFigure 5.53 for different averaging periods measured in integer number of control bit peri-ods. The corresponding mean value of Eb=I0 is shown in Figure 5.54. From Figure 5.53,the standard deviation of the errors in Eb=I0 decreased as the averaging period increased,where the value of the standard deviation of our proposed method was about half that of theMSVR method. The set-up value of Eb=I0 in our simulation was 7.0 dB. The mean value ofEb=I0 at the BS for the proposed method was about 7.06 dB irrespective of averaging period,while the mean value of Eb=I0 for the MSVR method varied from 7.87 dB to 7.31 dB as theaveraging period increased. For an averaging period of 2.5 ms, the error between the meanvalue of the estimated Eb=I0 and the set-up value was 0.06 dB and 0.58 dB for the proposedmethod and the MSVR method, respectively. Since the proposed method was more accuratethan the MSVR method, we used the proposed method in the following simulation.
From Figure 5.53 we observe that the longer the averaging period, the smaller the errorsin Eb=I0. However, a longer averaging period can wipe out the power variation due to fastfading. In order to maintain the power variation due to fading, while also providing a betterestimated Eb=I0, we use an averaging period of two control bits duration (2.5 ms) in thefollowing simulation. The standard deviation of the errors in Eb=I0 for an averaging periodof 1.25 ms and 2.5 ms was found to be 1.28 dB and 0.77 dB, respectively. Consequently,for an average period of 2.5 ms, the lower bound of the power control error in Eb=I0 waslimited by this standard deviation of 0.77 dB.
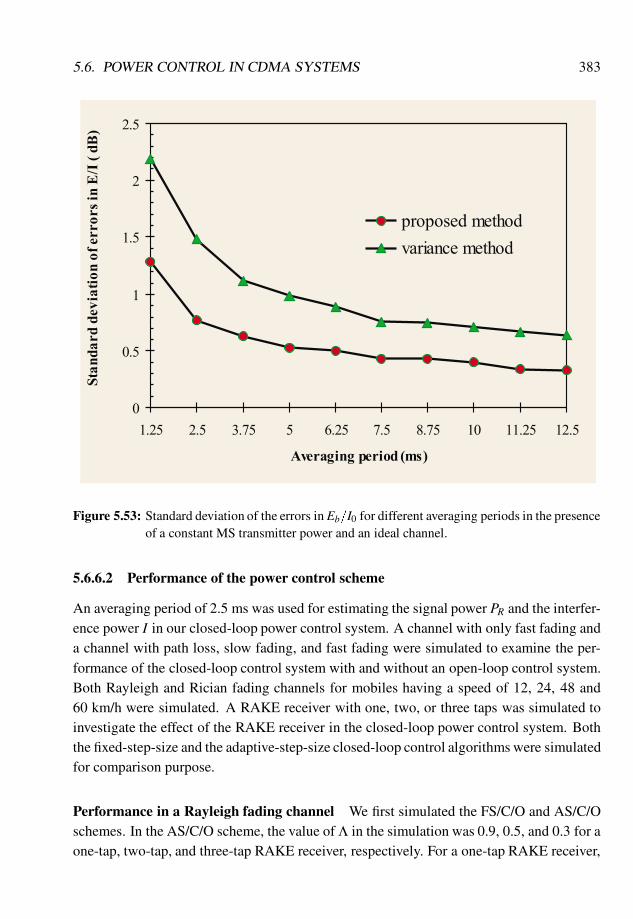
5.6. POWER CONTROL IN CDMA SYSTEMS 383
Figure 5.53: Standard deviation of the errors in Eb=I0 for different averaging periods in the presenceof a constant MS transmitter power and an ideal channel.
5.6.6.2 Performance of the power control scheme
An averaging period of 2.5 ms was used for estimating the signal power PR and the interfer-ence power I in our closed-loop power control system. A channel with only fast fading anda channel with path loss, slow fading, and fast fading were simulated to examine the per-formance of the closed-loop control system with and without an open-loop control system.Both Rayleigh and Rician fading channels for mobiles having a speed of 12, 24, 48 and60 km/h were simulated. A RAKE receiver with one, two, or three taps was simulated toinvestigate the effect of the RAKE receiver in the closed-loop power control system. Boththe fixed-step-size and the adaptive-step-size closed-loop control algorithms were simulatedfor comparison purpose.
Performance in a Rayleigh fading channel We first simulated the FS/C/O and AS/C/Oschemes. In the AS/C/O scheme, the value of Λ in the simulation was 0.9, 0.5, and 0.3 for aone-tap, two-tap, and three-tap RAKE receiver, respectively. For a one-tap RAKE receiver,
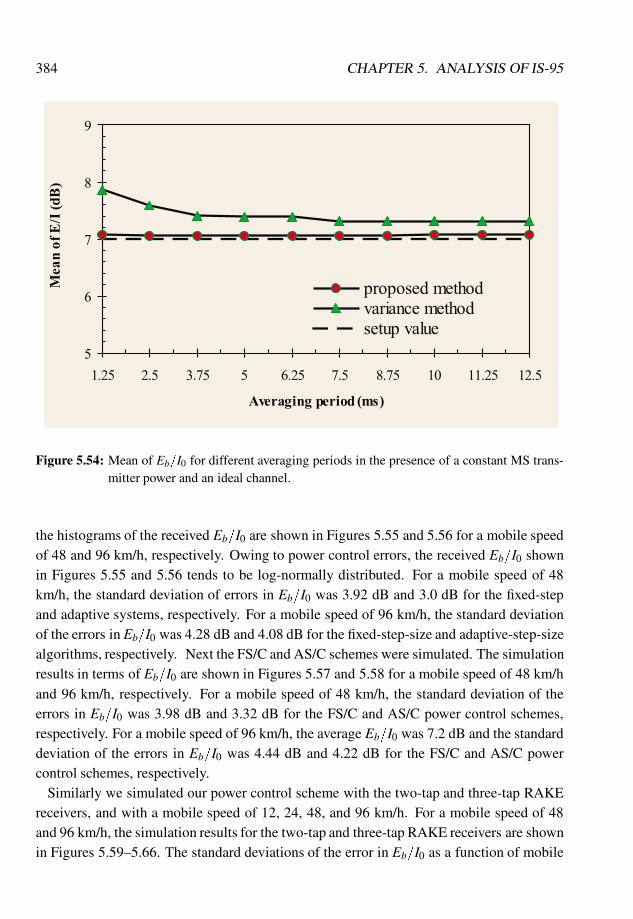
384 CHAPTER 5. ANALYSIS OF IS-95
Figure 5.54: Mean of Eb=I0 for different averaging periods in the presence of a constant MS trans-mitter power and an ideal channel.
the histograms of the received Eb=I0 are shown in Figures 5.55 and 5.56 for a mobile speedof 48 and 96 km/h, respectively. Owing to power control errors, the received Eb=I0 shownin Figures 5.55 and 5.56 tends to be log-normally distributed. For a mobile speed of 48km/h, the standard deviation of errors in Eb=I0 was 3.92 dB and 3.0 dB for the fixed-stepand adaptive systems, respectively. For a mobile speed of 96 km/h, the standard deviationof the errors in Eb=I0 was 4.28 dB and 4.08 dB for the fixed-step-size and adaptive-step-sizealgorithms, respectively. Next the FS/C and AS/C schemes were simulated. The simulationresults in terms of Eb=I0 are shown in Figures 5.57 and 5.58 for a mobile speed of 48 km/hand 96 km/h, respectively. For a mobile speed of 48 km/h, the standard deviation of theerrors in Eb=I0 was 3.98 dB and 3.32 dB for the FS/C and AS/C power control schemes,respectively. For a mobile speed of 96 km/h, the average Eb=I0 was 7.2 dB and the standarddeviation of the errors in Eb=I0 was 4.44 dB and 4.22 dB for the FS/C and AS/C powercontrol schemes, respectively.
Similarly we simulated our power control scheme with the two-tap and three-tap RAKEreceivers, and with a mobile speed of 12, 24, 48, and 96 km/h. For a mobile speed of 48and 96 km/h, the simulation results for the two-tap and three-tap RAKE receivers are shownin Figures 5.59–5.66. The standard deviations of the error in Eb=I0 as a function of mobile
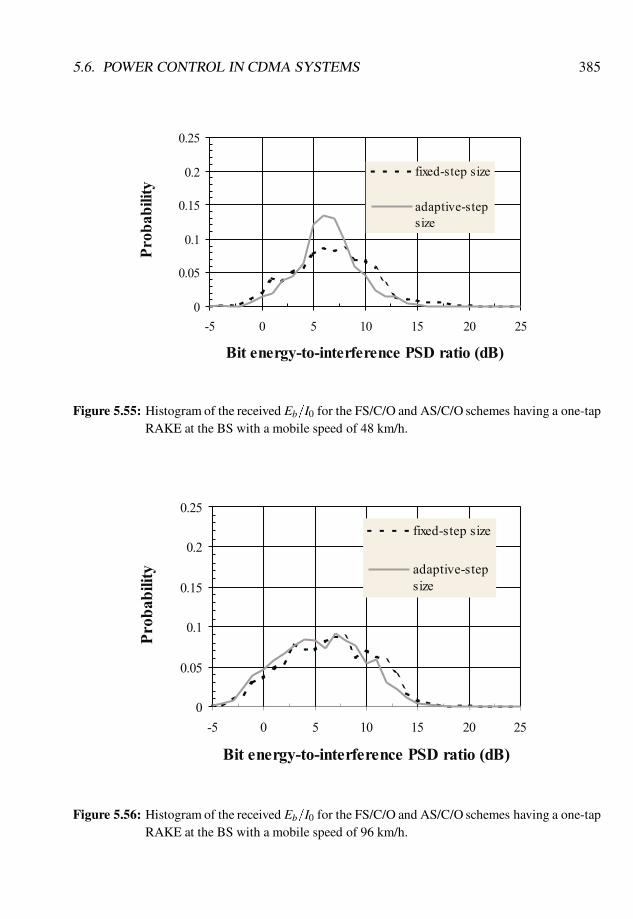
5.6. POWER CONTROL IN CDMA SYSTEMS 385
Figure 5.55: Histogram of the received Eb=I0 for the FS/C/O and AS/C/O schemes having a one-tapRAKE at the BS with a mobile speed of 48 km/h.
Figure 5.56: Histogram of the received Eb=I0 for the FS/C/O and AS/C/O schemes having a one-tapRAKE at the BS with a mobile speed of 96 km/h.
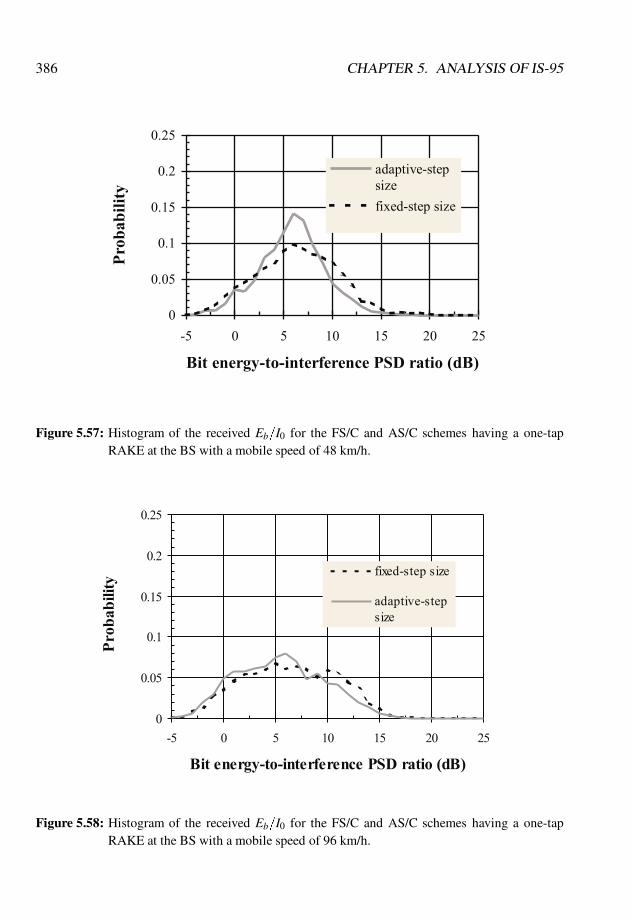
386 CHAPTER 5. ANALYSIS OF IS-95
Figure 5.57: Histogram of the received Eb=I0 for the FS/C and AS/C schemes having a one-tapRAKE at the BS with a mobile speed of 48 km/h.
Figure 5.58: Histogram of the received Eb=I0 for the FS/C and AS/C schemes having a one-tapRAKE at the BS with a mobile speed of 96 km/h.
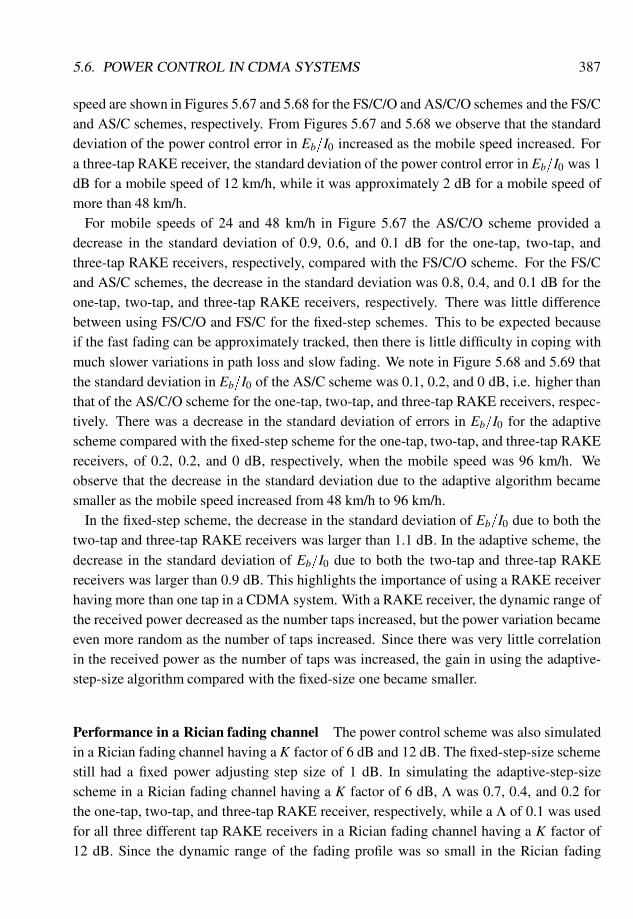
5.6. POWER CONTROL IN CDMA SYSTEMS 387
speed are shown in Figures 5.67 and 5.68 for the FS/C/O and AS/C/O schemes and the FS/Cand AS/C schemes, respectively. From Figures 5.67 and 5.68 we observe that the standarddeviation of the power control error in Eb=I0 increased as the mobile speed increased. Fora three-tap RAKE receiver, the standard deviation of the power control error in Eb=I0 was 1dB for a mobile speed of 12 km/h, while it was approximately 2 dB for a mobile speed ofmore than 48 km/h.
For mobile speeds of 24 and 48 km/h in Figure 5.67 the AS/C/O scheme provided adecrease in the standard deviation of 0.9, 0.6, and 0.1 dB for the one-tap, two-tap, andthree-tap RAKE receivers, respectively, compared with the FS/C/O scheme. For the FS/Cand AS/C schemes, the decrease in the standard deviation was 0.8, 0.4, and 0.1 dB for theone-tap, two-tap, and three-tap RAKE receivers, respectively. There was little differencebetween using FS/C/O and FS/C for the fixed-step schemes. This to be expected becauseif the fast fading can be approximately tracked, then there is little difficulty in coping withmuch slower variations in path loss and slow fading. We note in Figure 5.68 and 5.69 thatthe standard deviation in Eb=I0 of the AS/C scheme was 0.1, 0.2, and 0 dB, i.e. higher thanthat of the AS/C/O scheme for the one-tap, two-tap, and three-tap RAKE receivers, respec-tively. There was a decrease in the standard deviation of errors in Eb=I0 for the adaptivescheme compared with the fixed-step scheme for the one-tap, two-tap, and three-tap RAKEreceivers, of 0.2, 0.2, and 0 dB, respectively, when the mobile speed was 96 km/h. Weobserve that the decrease in the standard deviation due to the adaptive algorithm becamesmaller as the mobile speed increased from 48 km/h to 96 km/h.
In the fixed-step scheme, the decrease in the standard deviation of Eb=I0 due to both thetwo-tap and three-tap RAKE receivers was larger than 1.1 dB. In the adaptive scheme, thedecrease in the standard deviation of Eb=I0 due to both the two-tap and three-tap RAKEreceivers was larger than 0.9 dB. This highlights the importance of using a RAKE receiverhaving more than one tap in a CDMA system. With a RAKE receiver, the dynamic range ofthe received power decreased as the number taps increased, but the power variation becameeven more random as the number of taps increased. Since there was very little correlationin the received power as the number of taps was increased, the gain in using the adaptive-step-size algorithm compared with the fixed-size one became smaller.
Performance in a Rician fading channel The power control scheme was also simulatedin a Rician fading channel having a K factor of 6 dB and 12 dB. The fixed-step-size schemestill had a fixed power adjusting step size of 1 dB. In simulating the adaptive-step-sizescheme in a Rician fading channel having a K factor of 6 dB, Λ was 0.7, 0.4, and 0.2 forthe one-tap, two-tap, and three-tap RAKE receiver, respectively, while a Λ of 0.1 was usedfor all three different tap RAKE receivers in a Rician fading channel having a K factor of12 dB. Since the dynamic range of the fading profile was so small in the Rician fading

388 CHAPTER 5. ANALYSIS OF IS-95
Figure 5.59: Histogram of the received Eb=I0 for the FS/C/O and AS/C/O schemes having a two-tapRAKE at the BS with a mobile speed of 48 km/h.
Figure 5.60: Histogram of the received Eb=I0 for the FS/C/O and AS/C/O schemes having a two-tapRAKE at the BS with a mobile speed of 96 km/h.
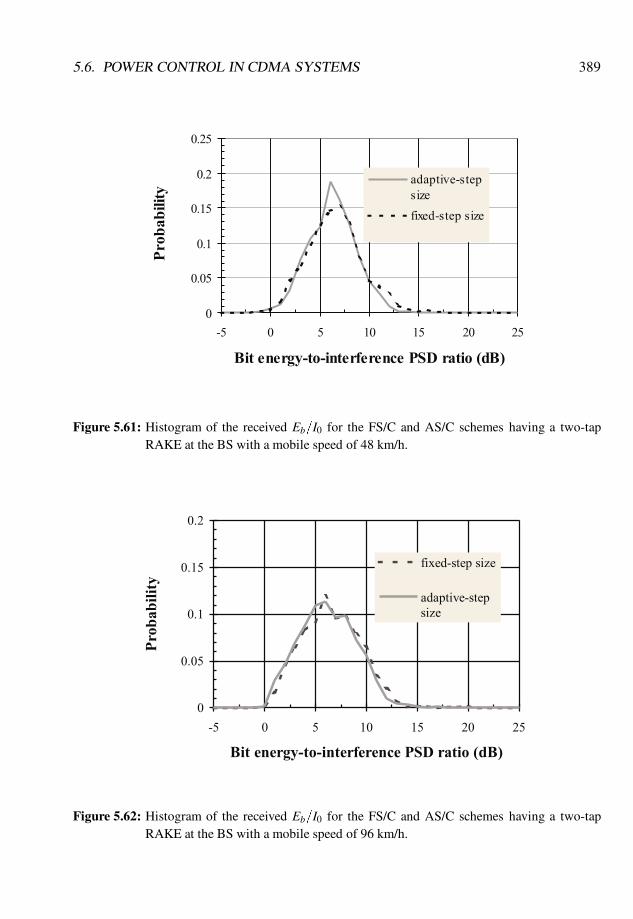
5.6. POWER CONTROL IN CDMA SYSTEMS 389
Figure 5.61: Histogram of the received Eb=I0 for the FS/C and AS/C schemes having a two-tapRAKE at the BS with a mobile speed of 48 km/h.
Figure 5.62: Histogram of the received Eb=I0 for the FS/C and AS/C schemes having a two-tapRAKE at the BS with a mobile speed of 96 km/h.
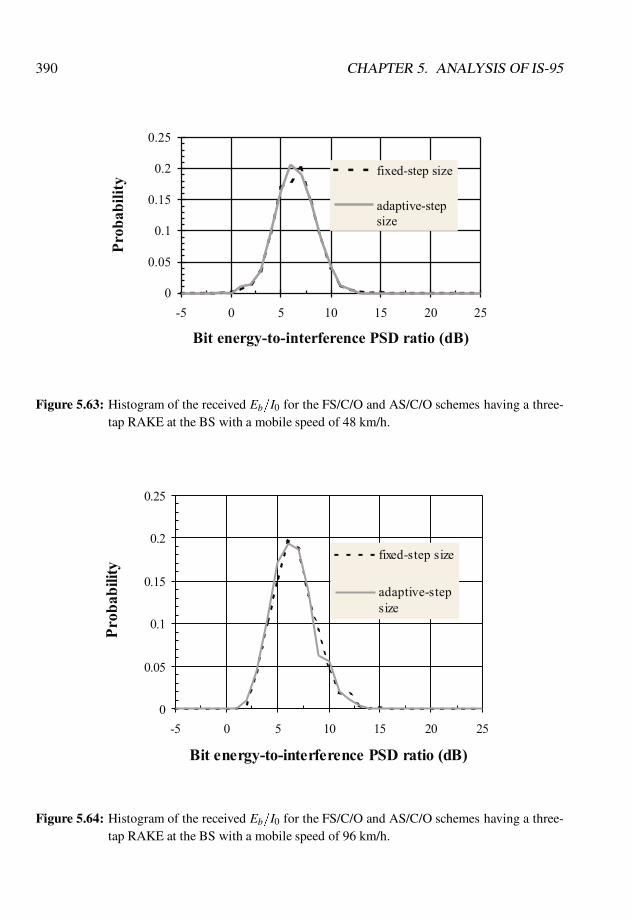
390 CHAPTER 5. ANALYSIS OF IS-95
Figure 5.63: Histogram of the received Eb=I0 for the FS/C/O and AS/C/O schemes having a three-tap RAKE at the BS with a mobile speed of 48 km/h.
Figure 5.64: Histogram of the received Eb=I0 for the FS/C/O and AS/C/O schemes having a three-tap RAKE at the BS with a mobile speed of 96 km/h.
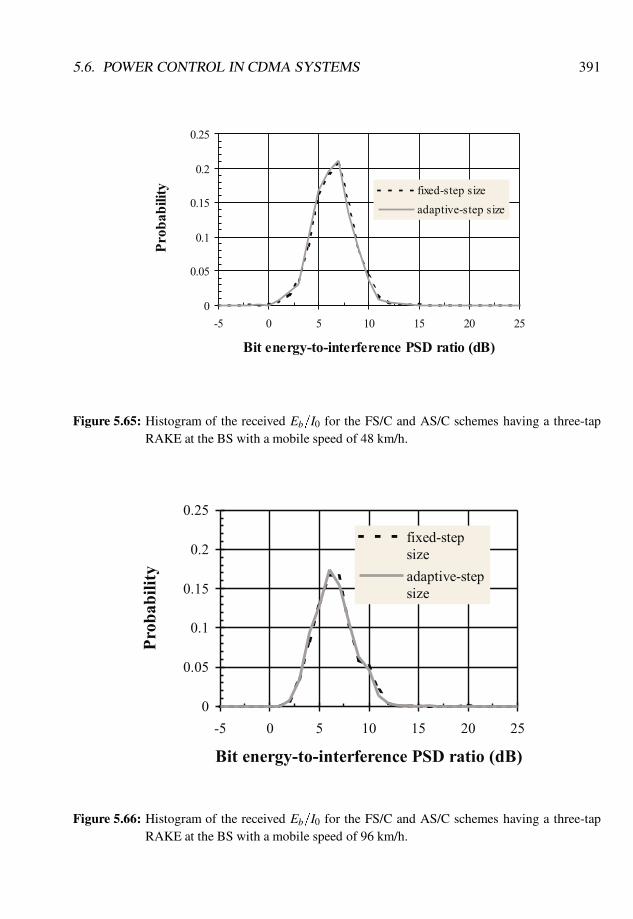
5.6. POWER CONTROL IN CDMA SYSTEMS 391
Figure 5.65: Histogram of the received Eb=I0 for the FS/C and AS/C schemes having a three-tapRAKE at the BS with a mobile speed of 48 km/h.
Figure 5.66: Histogram of the received Eb=I0 for the FS/C and AS/C schemes having a three-tapRAKE at the BS with a mobile speed of 96 km/h.
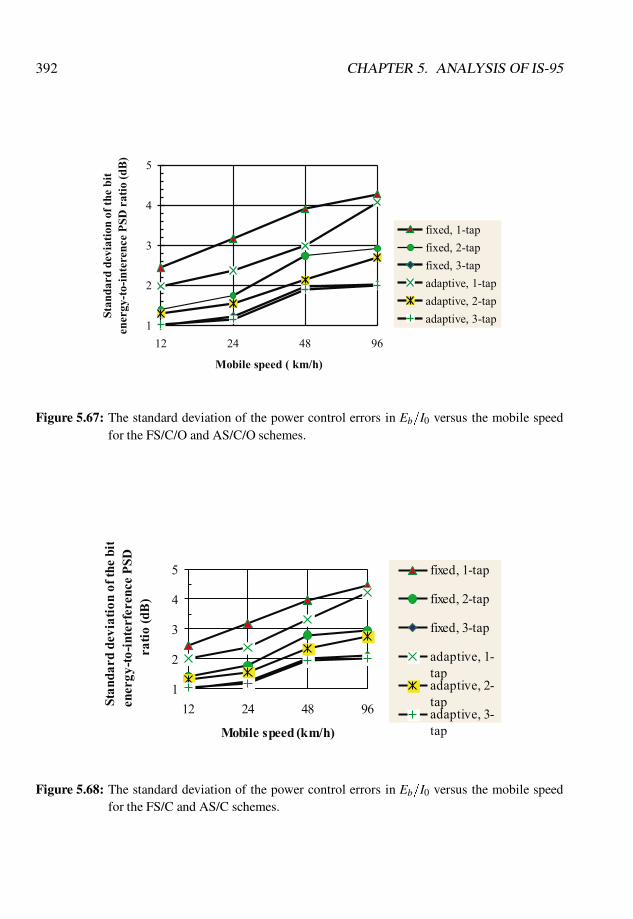
392 CHAPTER 5. ANALYSIS OF IS-95
Figure 5.67: The standard deviation of the power control errors in Eb=I0 versus the mobile speedfor the FS/C/O and AS/C/O schemes.
Figure 5.68: The standard deviation of the power control errors in Eb=I0 versus the mobile speedfor the FS/C and AS/C schemes.
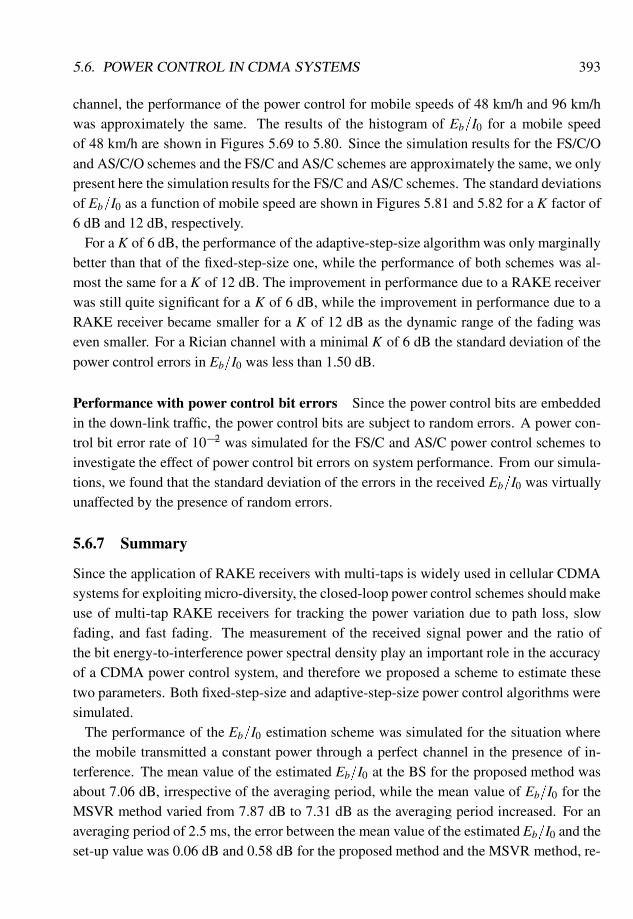
5.6. POWER CONTROL IN CDMA SYSTEMS 393
channel, the performance of the power control for mobile speeds of 48 km/h and 96 km/hwas approximately the same. The results of the histogram of Eb=I0 for a mobile speedof 48 km/h are shown in Figures 5.69 to 5.80. Since the simulation results for the FS/C/Oand AS/C/O schemes and the FS/C and AS/C schemes are approximately the same, we onlypresent here the simulation results for the FS/C and AS/C schemes. The standard deviationsof Eb=I0 as a function of mobile speed are shown in Figures 5.81 and 5.82 for a K factor of6 dB and 12 dB, respectively.
For a K of 6 dB, the performance of the adaptive-step-size algorithm was only marginallybetter than that of the fixed-step-size one, while the performance of both schemes was al-most the same for a K of 12 dB. The improvement in performance due to a RAKE receiverwas still quite significant for a K of 6 dB, while the improvement in performance due to aRAKE receiver became smaller for a K of 12 dB as the dynamic range of the fading waseven smaller. For a Rician channel with a minimal K of 6 dB the standard deviation of thepower control errors in Eb=I0 was less than 1.50 dB.
Performance with power control bit errors Since the power control bits are embeddedin the down-link traffic, the power control bits are subject to random errors. A power con-trol bit error rate of 10�2 was simulated for the FS/C and AS/C power control schemes toinvestigate the effect of power control bit errors on system performance. From our simula-tions, we found that the standard deviation of the errors in the received Eb=I0 was virtuallyunaffected by the presence of random errors.
5.6.7 Summary
Since the application of RAKE receivers with multi-taps is widely used in cellular CDMAsystems for exploiting micro-diversity, the closed-loop power control schemes should makeuse of multi-tap RAKE receivers for tracking the power variation due to path loss, slowfading, and fast fading. The measurement of the received signal power and the ratio ofthe bit energy-to-interference power spectral density play an important role in the accuracyof a CDMA power control system, and therefore we proposed a scheme to estimate thesetwo parameters. Both fixed-step-size and adaptive-step-size power control algorithms weresimulated.
The performance of the Eb=I0 estimation scheme was simulated for the situation wherethe mobile transmitted a constant power through a perfect channel in the presence of in-terference. The mean value of the estimated Eb=I0 at the BS for the proposed method wasabout 7.06 dB, irrespective of the averaging period, while the mean value of Eb=I0 for theMSVR method varied from 7.87 dB to 7.31 dB as the averaging period increased. For anaveraging period of 2.5 ms, the error between the mean value of the estimated Eb=I0 and theset-up value was 0.06 dB and 0.58 dB for the proposed method and the MSVR method, re-

394 CHAPTER 5. ANALYSIS OF IS-95
Figure 5.69: Histogram of the received Eb=I0 for the FS/C/O and AS/C/O schemes having a one-tapRAKE at the BS; K = 6 dB; MS speed=48 km/h.
Figure 5.70: Histogram of the received Eb=I0 for the FS/C and AS/C schemes having a one-tapRAKE at the BS; K = 6 dB; MS speed=48 km/h.
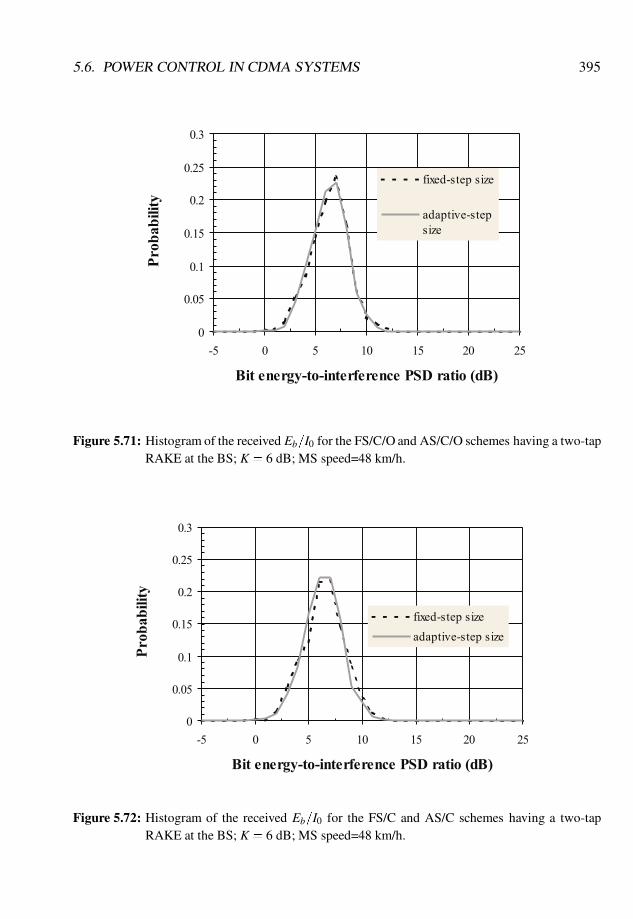
5.6. POWER CONTROL IN CDMA SYSTEMS 395
Figure 5.71: Histogram of the received Eb=I0 for the FS/C/O and AS/C/O schemes having a two-tapRAKE at the BS; K = 6 dB; MS speed=48 km/h.
Figure 5.72: Histogram of the received Eb=I0 for the FS/C and AS/C schemes having a two-tapRAKE at the BS; K = 6 dB; MS speed=48 km/h.
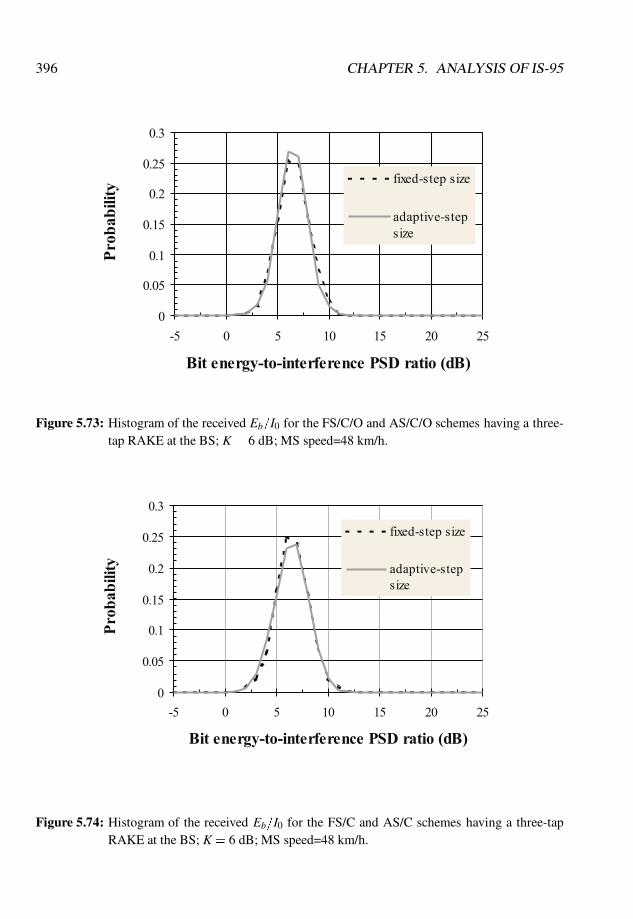
396 CHAPTER 5. ANALYSIS OF IS-95
Figure 5.73: Histogram of the received Eb=I0 for the FS/C/O and AS/C/O schemes having a three-tap RAKE at the BS; K = 6 dB; MS speed=48 km/h.
Figure 5.74: Histogram of the received Eb=I0 for the FS/C and AS/C schemes having a three-tapRAKE at the BS; K = 6 dB; MS speed=48 km/h.
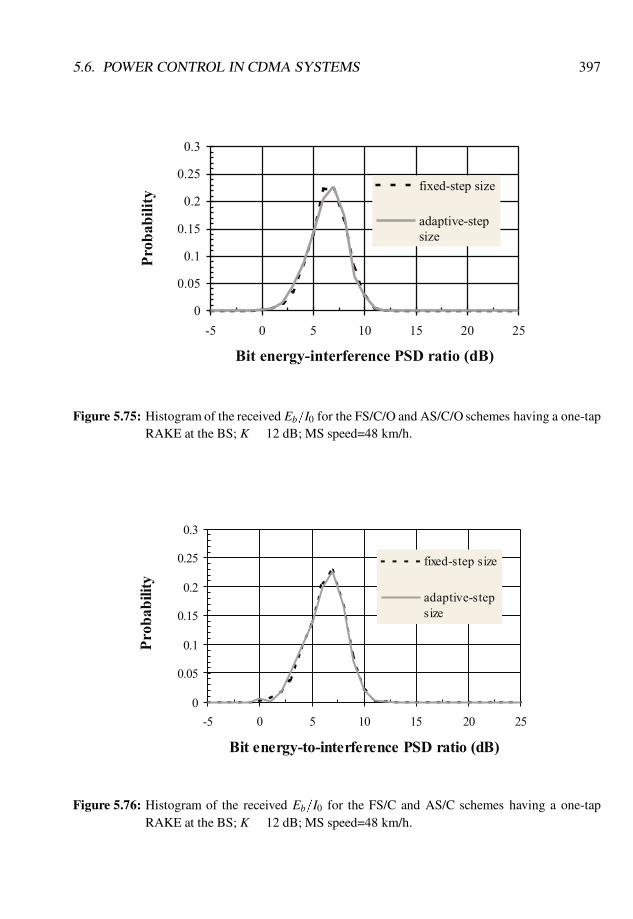
5.6. POWER CONTROL IN CDMA SYSTEMS 397
Figure 5.75: Histogram of the received Eb=I0 for the FS/C/O and AS/C/O schemes having a one-tapRAKE at the BS; K = 12 dB; MS speed=48 km/h.
Figure 5.76: Histogram of the received Eb=I0 for the FS/C and AS/C schemes having a one-tapRAKE at the BS; K = 12 dB; MS speed=48 km/h.
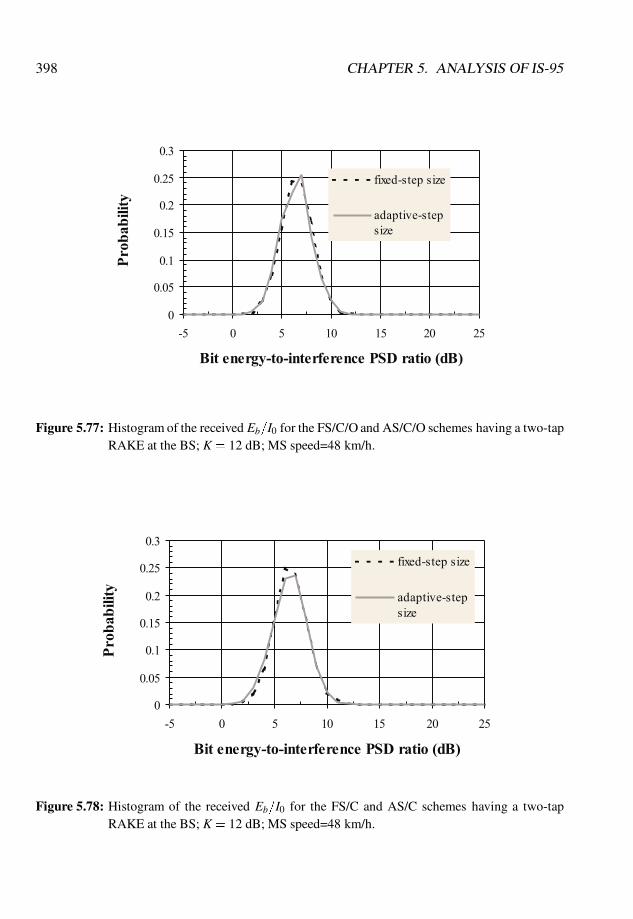
398 CHAPTER 5. ANALYSIS OF IS-95
Figure 5.77: Histogram of the received Eb=I0 for the FS/C/O and AS/C/O schemes having a two-tapRAKE at the BS; K = 12 dB; MS speed=48 km/h.
Figure 5.78: Histogram of the received Eb=I0 for the FS/C and AS/C schemes having a two-tapRAKE at the BS; K = 12 dB; MS speed=48 km/h.
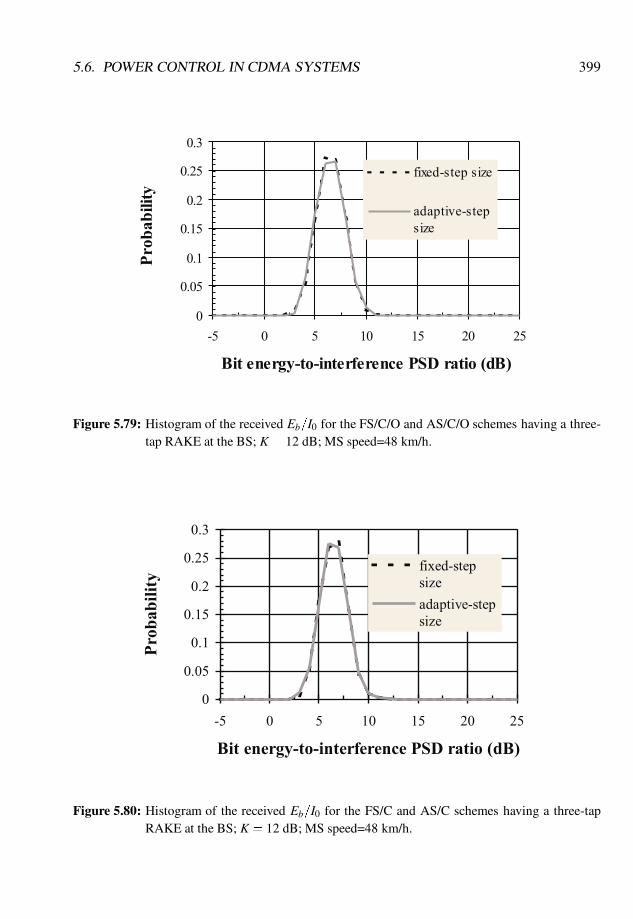
5.6. POWER CONTROL IN CDMA SYSTEMS 399
Figure 5.79: Histogram of the received Eb=I0 for the FS/C/O and AS/C/O schemes having a three-tap RAKE at the BS; K = 12 dB; MS speed=48 km/h.
Figure 5.80: Histogram of the received Eb=I0 for the FS/C and AS/C schemes having a three-tapRAKE at the BS; K = 12 dB; MS speed=48 km/h.
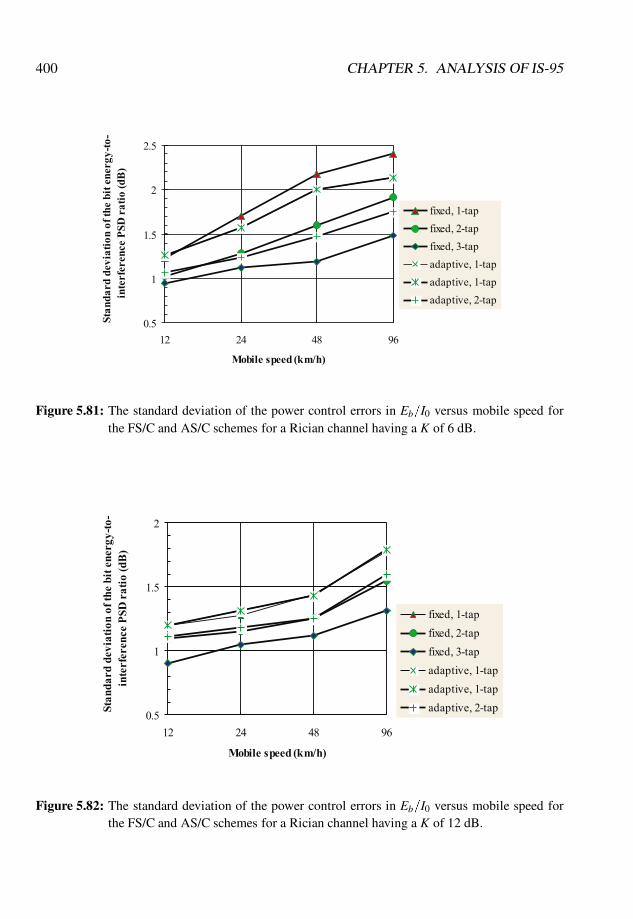
400 CHAPTER 5. ANALYSIS OF IS-95
Figure 5.81: The standard deviation of the power control errors in Eb=I0 versus mobile speed forthe FS/C and AS/C schemes for a Rician channel having a K of 6 dB.
Figure 5.82: The standard deviation of the power control errors in Eb=I0 versus mobile speed forthe FS/C and AS/C schemes for a Rician channel having a K of 12 dB.

5.6. POWER CONTROL IN CDMA SYSTEMS 401
spectively. The standard deviation of Eb=I0 for the proposed method was about half that forthe MSVR method. By using the proposed method, the standard deviation of the errors ofEb=I0 for an averaging period of 1.25 ms and 2.5 ms was 1.28 dB and 0.77 dB, respectively.Consequently, for an averaging period of 2.5 ms, the lower bound of the power control errorin Eb=I0 was limited by this standard deviation of 0.77 dB.
The performance of the closed-loop power control scheme in terms of the standard devi-ation in Eb=I0 was simulated for RAKE receivers having a different number of taps. For amobile speed of 96 km/h and a three-tap RAKE receiver, the standard deviation of powercontrol errors in Eb=I0 was 2.0 dB and 1.5 dB for Rayleigh and Rician fading channels hav-ing a K factor of 6 dB, respectively. For a control bit error rate of 10�2, the performanceof the power control scheme in terms of the standard deviation of the errors in Eb=I0 wasessentially unaffected.
The decrease in the standard deviation of the errors in Eb=I0 due to both the two-tap andthree-tap RAKE receivers was larger than 1.0 dB for Rayleigh fading channels. For Ricianfading channels, the improvement in performance due to a RAKE receiver was still quitesignificant for a K of 6 dB, while only marginal for a K of 12 dB. As the number of taps ina RAKE receiver increased, the dynamic range of fading decreased, while the variation inthe received power became more random. The reduction in the standard deviation of errorsin Eb=I0 for the adaptive-step-size algorithm compared with the fixed-step-size algorithmdecreased as the number of taps increased. For a three-tap RAKE receiver, the decrease inthe standard deviation of Eb=I0 from the adaptive-step-size algorithm was marginal, whilethe use of a RAKE receiver provided a significant reduction in the standard deviation of theerrors in Eb=I0 for the fixed-step-size power control algorithm. From a power control pointof view it was desirable to have a three-tap RAKE receiver.
Bibliography
[1] Salmasi A. and K.S. Gilhousen, On the system design aspects of code division multipleaccess (CDMA) applied to digital cellular and personal communications networks,IEEE 41st VTS Conf., St Louis, May 1991, 264–275.
[2] Torrieri D.J., Performance of direct-sequence systems with long pseudo noise se-quence, IEEE J. Sel. Area Commun., 10(4), May 1992, 770–781.
[3] Papoulis A., Probability, Random Variables, and Stochastic Processes, McGraw-Hill,1991.
[4] Pickholtz R.L., D.-L. Shilling and L.B. Miltein, Theory of spread spectrumcommunications–A tutorial, IEEE Trans. Commun., COM-30, May 1982, 855–884.
[5] Proakis J.G., Digital Communications, McGraw-Hill, 1983.
[6] Lee C.-C. and R. Steele, Closed-loop power control in CDMA systems, IEE Proc.Commun., 143(4), Aug. 1996, 231–239.
[7] Viterbi A.J. and R. Padovani, Implications of mobile cellular CDMA, IEEE Commun.Mag., 30(12), Dec. 1992, 38–41.
[8] Cameron R. and B.D. Woerner, An analysis of CDMA with imperfect power control,IEEE 42nd VTS Conf., Denver, May 1992, 97–98.
[9] Gilhousen K.S., I.M. Jacobs, R. Padovani, A.J. Viterbi, L.A. Weaver and C.E. Wheat-ley, On the capacity of a cellular CDMA system, IEEE Trans. Veh. Tech., 40(2),May 1991, 303–311.
[10] Lee W.C.Y., Overview of cellular CDMA, IEEE Trans. Veh. Technol., 40(2),May 1991.
402
BIBLIOGRAPHY 403
[11] Gejji R.R., Forward-link-power control in CDMA cellular systems, IEEE Trans. Veh.Technol., 41(4), Nov. 1992, 532–536.
[12] Prasad R., CDMA for Wireless Personal Communications, Artech House, 1996.
[13] Viterbi A.J., CDMA: Principle of Spread Spectrum Communication, Addison-Wesley,1995.
[14] Steele R. [Ed.], Mobile Radio Communications, Pentech Press, 1992.
[15] Steele R., The cellular environment of lightweight handheld portables, IEEE Commun.Mag., 27(7), July 1989, 20–29.
[16] Steele R., Towards a high-capacity digital cellular mobile radio system, IEE Proc.,132, Pt F (5), Aug. 1985, 405–415.
[17] Berg J.-E. et al, Path loss and fading models for microcells at 900MHz, IEEE 42ndVTS Conf., Denver, May 1992, 666–671.
[18] Erceg V., et al, Propagation modelling and measurements in an urban and suburbanenvironment using broadband direct-sequence spread spectrum, IEEE 42nd VTS Conf.,Denver, May 1992, 317–320.
[19] Pickholtz R.L. and I.S. Stojanovic, A comparison of TDMA and CDMA in microcel-lular radio channels, IEEE 41st VTS Conf., Denver, May 1991, 233–235.
[20] Qualcomm, Inc., CDMA Digital CAI Standard, October 1990.
[21] Jakes W.C., Microwave Mobile Radio Communications, John Wiley, 1974.
[22] Lee W.C.Y., Mobile Communications Design Fundamentals, John Wiley 1993.
[23] Steele R., Delta Modulation Systems, Pentech Press, 1975.
[24] Lee W.C.Y., Estimate of local average power of a mobile radio signal, IEEE Trans.Veh. Technol., 34(1), Feb. 1985, 22–27.
Chapter 6Evolution of GSM and cdmaOne to3G Systems
6.1 Introduction
The previous chapters have concentrated on the two leading second generation (2G) cellularsystems: GSM and IS-95. These systems are deployed in many parts of the world and willcontinue to operate and evolve during the next decade as third generation (3G) systems arerolled out. We may expect that the new 3G systems will be harmonised with their evolved2G counterparts, and that slowly 2G spectra will be refarmed to provide extra 3G spectra.No 3G systems are currently deployed, although trials are in progress. As a consequence,this chapter, which deals with systems that are about to be deployed, is treated in a qual-itative manner, describing how they will work rather than quantifying their performances.Before getting into detail, let us briefly review how cellular communications arrived at to-day’s position.
6.1.1 The generation game
There is no doubt that there was pent-up demand for public mobile telephony networks,and when they arrived in the 1980s as the so-called first generation (1G) analogue cellularnetworks, they grew at phenomenal rates. These networks initially offered only telephony,but the un-tethering of people from their fixed phones meant that they and businesses couldoperate in completely new ways. The Europeans identified in the early 1980s the need for asecond generation (2G) cellular system that would be totally digital. This 2G system becameGSM, and a brief history of GSM has already been provided in Section 2.1. The Europeanshave a long view in cellular radio and in 1988 they launched their RACE 1043 project with
404
GSM, cdmaOne and 3G Systems. Raymond Steele, Chin-Chun Lee and Peter GouldCopyright © 2001 John Wiley & Sons Ltd
Print ISBN 0-471-49185-3 Electronic ISBN 0-470-84167-2
6.1. INTRODUCTION 405
the aim of identifying the services and technologies for an advanced third generation (3G)system for deployment by the year 2000 [1, 2]. Their 3G system soon became known asthe universal mobile telecommunications system (UMTS) [3–5]. The concept was that their1G, 2G and 3G systems would be independent, and that their deployment would overlapsuch that the total access communications system (TACS), say, would slowly be replacedby GSM, which in turn would be slowly phased out for UMTS. However, the success ofGSM has been so great that evolutionary paths from 2G to 3G needed to be considered.Although the back-haul networks of GSM and UMTS have considerable commonality, theirradio interfaces are significantly different.
There were initially great expectations for UMTS [5,6]. It would not only be cellular, butit would embrace other types of networks from private mobile radio (PMR) (called specialmobile radio (SMR) in the United States), to wireless local area networks (WLANs), tomobile satellite systems (MSSs). The cardinal points were that it would operate globally,support high bit rate services and, most importantly, be service orientated. While the Eu-ropeans referred to the global 3G network for the turn of the century as UMTS, most oftheir engineers working on UMTS expected that they would have to yield to internationalagreements from the ITU to modify UMTS, but that basically UMTS would be accepted asthe global standard.
To explain this early expectation we need to point out that the ITU has been in the 3Ggame from the beginning [6]. Paralleling the European Union (EU) RACE initiative, ITUformed task group TG8/1, originally under the auspices of CCIR. This committee referredto their 3G system as the future public land mobile telecommunications system (FPLMTS).Europeans were, of course, also members of TG8/1, and with commercial and political pres-sures a long way in the future, FPLMTS and UMTS seemed synonymous in terms of aimsand objectives. The important difference between TG8/1 and the happenings in Europe,was that in Europe there was an actual research and development (R&D) 3G programme inprocess, while TG8/1 was more like a forum.
The Americans did not launch concerted national R&D programmes, neither for 2G nor3G systems. Their advanced mobile phone service (AMPS) 1G system did evolve into the2G IS-136, and became dual-mode with IS-95. The United States also introduced the iDENsystem with its ability to offer both cellular and dispatch services. It then auctioned a largepart of its 3G spectrum for PCS licenses, and allowed GSM to enter the United States inthe form of PCS1900. This auctioning of the 3G spectrum meant that there were significantadvantages if existing 2G networks could evolve into 3G ones, preferably in a seamlessmanner.
A big factor, not just in the United States, but in the world, was the advent of IS-95 [7–11].It arrived late compared with GSM, and some engineers argued that it was a 2.5G system.It had to fight to be born because of the lack of spectrum, and the quasi-religious attitudes
406 CHAPTER 6. EVOLUTION OF GSM AND CDMAONE TO 3G SYSTEMS
of engineers towards methods of multiple access. The meagre spectrum of 1.25 MHz at thetop of the AMPS band was just about adequate for cellular CDMA, which was just as wellbecause that was all there was available. CDMA entered the cellular world with a host oftechnical problems, not made easier as the transceivers from day one had to be dual-modewith AMPS. Its advocates were clear in that CDMA has a high spectral efficiency and iswell suited to the 3G multiservice environment. The real significance of IS-95 is that it wonthe technical argument in that the UMTS and the Japanese Association of Radio Industriesand Businesses (ARIB) proposals have CDMA radio interfaces, albeit of wider bandwidthsystems as more bandwidth is available for 3G networks. We therefore agree that IS-95 is a2.5G system and its evolution to 3G should be smooth. This is not so for 2G TDMA systemswhich will need to migrate to 3G CDMA ones. However, as we will show in Section 6.2,GSM with its TDMA is able to evolve closely to 3G without picking up the CDMA card.Nevertheless there is an evolutionary route from GSM Phase 2+ to UMTS as discussed inSection 6.2
The TG8/1 Committee discarded the unwieldy FPLMTS name for its 3G system, andreplaced it with international mobile telecommunications for the year 2000, or simply IMT-2000. It then abandoned all hope of the difficult political objective of a single standard,and has instead opted for a family of standards. Each member of the family had to beable to meet a minimum specification. Sixteen proposals were accepted, ten for terrestrial3G networks, and six for MSSs. The majority of the proposals advocated CDMA as themultiple access method. A degree of harmonisation between the proposals ensued, and atthe time of writing the ITU has agreed that the IMT-2000 family will be composed of thefollowing five technologies.
� IMT DS (Direct Sequence). This is widely known as UTRA FDD and W-CDMA,where UTRA stands for the UMTS Terrestrial Radio Access, and the ‘W’ in W-CDMA means wideband. We will refer to this system here as UTRA FDD.
� IMT MC (Multicarrier). This system is the 3G version of IS-95 (now calledcdmaOne), and is also known as cdma2000. We will use the term cdma2000 as thisis its widely used name.
� IMT TC (Time Code). This is the UTRA TDD, namely the UTRA mode that usestime division duplexing.
� IMT SC (Single Carrier). This is essentially a particular manifestation of GSM Phase2+, known as EDGE, standing for Enhanced Data Rates for GSM Evolution.
� IMT FT (Frequency Time). This is the digitally enhanced cordless telecommunica-tions (DECT) system.
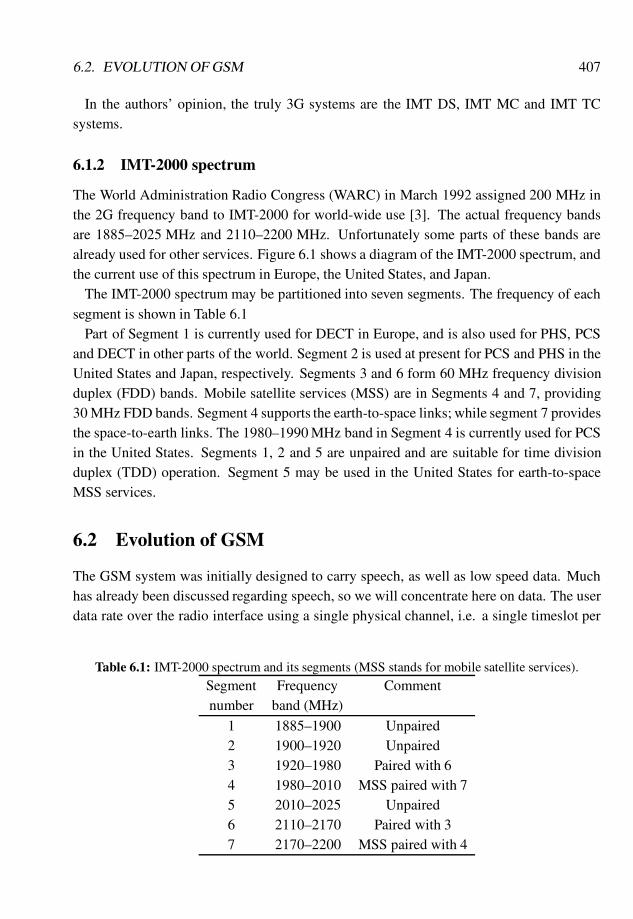
6.2. EVOLUTION OF GSM 407
In the authors’ opinion, the truly 3G systems are the IMT DS, IMT MC and IMT TCsystems.
6.1.2 IMT-2000 spectrum
The World Administration Radio Congress (WARC) in March 1992 assigned 200 MHz inthe 2G frequency band to IMT-2000 for world-wide use [3]. The actual frequency bandsare 1885–2025 MHz and 2110–2200 MHz. Unfortunately some parts of these bands arealready used for other services. Figure 6.1 shows a diagram of the IMT-2000 spectrum, andthe current use of this spectrum in Europe, the United States, and Japan.
The IMT-2000 spectrum may be partitioned into seven segments. The frequency of eachsegment is shown in Table 6.1
Part of Segment 1 is currently used for DECT in Europe, and is also used for PHS, PCSand DECT in other parts of the world. Segment 2 is used at present for PCS and PHS in theUnited States and Japan, respectively. Segments 3 and 6 form 60 MHz frequency divisionduplex (FDD) bands. Mobile satellite services (MSS) are in Segments 4 and 7, providing30 MHz FDD bands. Segment 4 supports the earth-to-space links; while segment 7 providesthe space-to-earth links. The 1980–1990 MHz band in Segment 4 is currently used for PCSin the United States. Segments 1, 2 and 5 are unpaired and are suitable for time divisionduplex (TDD) operation. Segment 5 may be used in the United States for earth-to-spaceMSS services.
6.2 Evolution of GSM
The GSM system was initially designed to carry speech, as well as low speed data. Muchhas already been discussed regarding speech, so we will concentrate here on data. The userdata rate over the radio interface using a single physical channel, i.e. a single timeslot per
Table 6.1: IMT-2000 spectrum and its segments (MSS stands for mobile satellite services).
Segment Frequency Commentnumber band (MHz)
1 1885–1900 Unpaired2 1900–1920 Unpaired3 1920–1980 Paired with 64 1980–2010 MSS paired with 75 2010–2025 Unpaired6 2110–2170 Paired with 37 2170–2200 MSS paired with 4
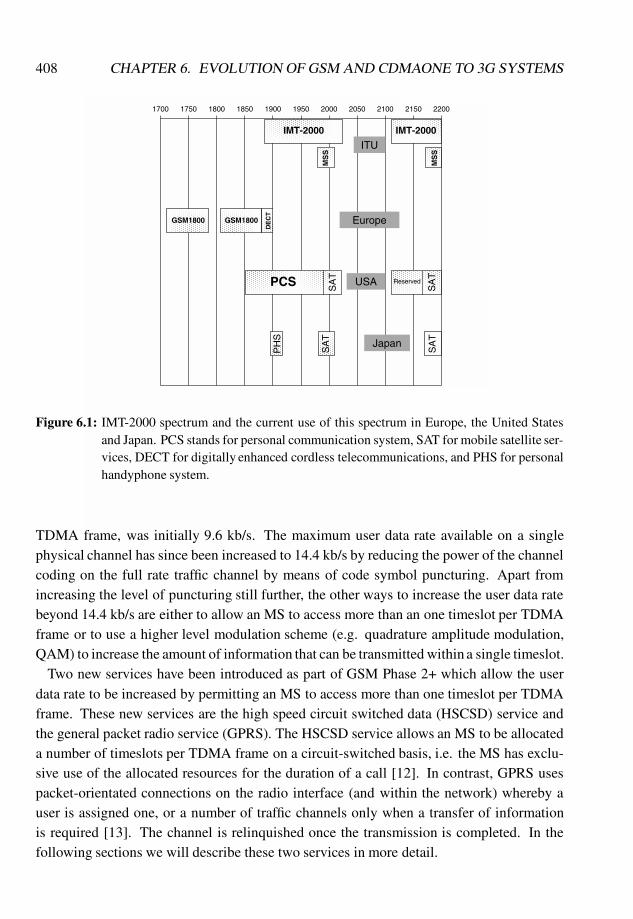
408 CHAPTER 6. EVOLUTION OF GSM AND CDMAONE TO 3G SYSTEMS
1700 1750 1800 1850 1900 1950 2000 2050 2100 22002150
IMT-2000 IMT-2000
MS
S
MS
S
ITU
EuropeGSM1800 GSM1800
DE
CT
PCS SA
T
SA
T
USAP
HS
SA
T
SA
T
Japan
Reserved
Figure 6.1: IMT-2000 spectrum and the current use of this spectrum in Europe, the United Statesand Japan. PCS stands for personal communication system, SAT for mobile satellite ser-vices, DECT for digitally enhanced cordless telecommunications, and PHS for personalhandyphone system.
TDMA frame, was initially 9.6 kb/s. The maximum user data rate available on a singlephysical channel has since been increased to 14.4 kb/s by reducing the power of the channelcoding on the full rate traffic channel by means of code symbol puncturing. Apart fromincreasing the level of puncturing still further, the other ways to increase the user data ratebeyond 14.4 kb/s are either to allow an MS to access more than an one timeslot per TDMAframe or to use a higher level modulation scheme (e.g. quadrature amplitude modulation,QAM) to increase the amount of information that can be transmitted within a single timeslot.
Two new services have been introduced as part of GSM Phase 2+ which allow the userdata rate to be increased by permitting an MS to access more than one timeslot per TDMAframe. These new services are the high speed circuit switched data (HSCSD) service andthe general packet radio service (GPRS). The HSCSD service allows an MS to be allocateda number of timeslots per TDMA frame on a circuit-switched basis, i.e. the MS has exclu-sive use of the allocated resources for the duration of a call [12]. In contrast, GPRS usespacket-orientated connections on the radio interface (and within the network) whereby auser is assigned one, or a number of traffic channels only when a transfer of informationis required [13]. The channel is relinquished once the transmission is completed. In thefollowing sections we will describe these two services in more detail.
6.2. EVOLUTION OF GSM 409
The second approach to increasing the user data rate by employing a higher level modu-lation scheme is currently being studied under the Enhanced Data Rates for GSM Evolution(EDGE) project [14]. The basic principle behind EDGE is that the modulation scheme usedon the GSM radio interface should be chosen on the basis of the quality of the radio link. Ahigher level modulation scheme is preferred when the link quality is ‘good’, but the systemreverts to a lower level modulation scheme when the link quality becomes ‘poor’. At thetime of writing it appears that EDGE will use the existing Gaussian minimum shift keying(GMSK) modulation scheme in poor quality channels and eight-level phase shift keying (8-PSK) in good quality channels. EDGE will also include link adaption functions to allow theMS and BS to assess the link quality and switch between the different types of modulationas necessary.
Once developed, the EDGE technology will enhance the range of services offered byGSM. The initial version of the EDGE technology (Phase 1) will be used to enhance theGPRS and HSCSD services, leading to enhanced GPRS (EGPRS) and enhanced circuit-switched data (ECSD). In later releases of EDGE (Phase 2 and beyond) further serviceswill be introduced which utilise the different modulation schemes [14].
In addition to the developments described above, GSM Phase 2+ contains two other im-portant enhancements that have a significant impact on the technology from a radio point ofview. In 1993 the European railways, in the form of the Union Internationale des Cheminsde Fer (UIC), chose the GSM technology as the basis of all their future mobile radio com-munication systems [15]. This led to the introduction of a number of advanced speech callitems (ASCI) which provide the additional functionality required for railways and otherprivate mobile radio (PMR) environments. The three key elements of ASCI are the voicebroadcast service (VBS), the voice group call service (VGCS) and the enhanced multi-levelprecedence and pre-emption (eMLPP) service. The VBS will allow GSM users to broadcasttheir voice simultaneously to a number of other users in a chosen talk group. A VBS callwill only occupy a single down-link channel in each cell within which the call is broadcastand all ‘listening’ MSs will monitor this same channel. VBS calls are simplex in that thecall originator is the only person who can speak during the call. Many applications requireany member of the talk group to become the talker and this functionality is supported in theVGCS. In this case any member of the talk group may become the ‘talker’ and contentionresolution schemes are included to handle situations where more that one user tries to be-come the talker simultaneously. These PMR systems also support a facility to ensure thatimportant calls are successfully completed even at the expense of less important calls. TheeMLPP service allows calls to be prioritised and ensures that the most important calls arecompleted, regardless of the network loading.
Another important Phase 2+ item from a radio perspective is the adaptive multi-rate(AMR) speech coder [16]. The deployment of the GSM half-rate (HR) codec has been
410 CHAPTER 6. EVOLUTION OF GSM AND CDMAONE TO 3G SYSTEMS
somewhat limited because of concerns relating to the speech quality, but the enhanced full-rate (EFR) codec is more popular amongst GSM operators. The basic concept behind theAMR technology is that the speech coding rate and the degree of channel coding shouldbe chosen according to the channel quality. For example, in ‘good’ channels a lower ratespeech coder can be used in an HR traffic channel thereby increasing the system capacity.However, if the link quality is ‘poor’ FR then a traffic channel will be used and the level ofchannel coding increased. At the time of writing the candidate AMR codecs have not yetbeen chosen.
6.2.1 High speed circuit-switched data
The HSCSD service [12] is a natural extension of the circuit-switched data services thatwere supported in earlier versions of GSM. No changes to the physical layer interfaces be-tween the different network elements are required for HSCSD. At the higher layers the MSand the network support the additional functionality required to multiplex and demultiplexa user’s data onto a number of traffic channels for transmission over both the Abis interfaceand the radio interface. Additional functionality is also included at the radio resource man-agement level to handle the new situation where a number of different traffic channels areassociated with the same connection. For example, when an HSCSD user is handed overbetween two cells, there must be a mechanism to ensure that sufficient traffic channels areavailable in the new cell before the handover occurs. An HSCSD connection is, however,limited to a single 64 kb/s circuit on the A interface.
On call set-up the MS provides information to the network which defines the nature of theHSCSD connection. The multislot class of the MS is used by the network to determine themaximum number of timeslots that may be accessed by the MS, and the amount of time thatmust be allowed between timeslots, e.g. for the purposes of neighbour cell measurements.This information is used to define the MS’s capabilities for both the HSCSD and GPRSservices. The multislot classes are listed in Table 6.2 along with their associated parameters[17].
Multislot MSs can be either type 1 or type 2 and this information is shown in the right-hand column of Table 6.2. Type 2 MSs are required to be able to transmit and receivesimultaneously, whereas type 1 MSs are not. The ‘Rx’ and ‘Tx’ columns give the maxi-mum number of receive and transmit timeslots that the MS may occupy per TDMA frame,respectively. The ‘Sum’ column gives the total number of transmit and receive timeslotsthe MS may access per TDMA frame. For example, for multislot class 12, ‘Sum’ is 5which means that the maximum number of transmit and receive slots cannot exceed 5. Soif we have 3 received slots, then we cannot have more than 2 transmit slots in one TDMAframe. The Tta parameter represents the time required for the MS to make a neighbour cellmeasurement prior to an up-link transmission. This parameter is not applicable to type 2
6.2. EVOLUTION OF GSM 411
MSs because they are capable of making measurements and transmitting simultaneously.When the MS is not required to make measurements on neighbouring cells, the Ttb param-eter defines the minimum number of timeslots that must be allowed between the end of theprevious down-link timeslot and the next up-link timeslot, or the time between two con-secutive down-link timeslots that are on different frequencies. In other words, Ttb is theamount of time the MS needs to prepare to transmit on the up-link after it has received ortransmitted on a different frequency. The Tra parameter is the number of timeslots requiredby the MS to make a neighbour cell measurement prior to the reception of a down-linkburst, whereas the Trb parameter is the number of timeslots required between the previousup-link transmission and the next down-link reception, or the time between two consecutivedown-link receptions when the frequency is changed in between receptions. In additionto its multislot class, the MS provides a range of additional information on call set-up toallow the network to determine the most appropriate HSCSD configuration. This infor-mation includes the fixed network user rate, i.e. the data rate that the MS would like toachieve over the fixed network, the channel coding schemes supported by the MS, and themaximum number of traffic channels to be used during the connection. This final param-eter allows the user to control the call cost by limiting the number of traffic channels thatwill be occupied. The final multislot configuration is chosen by the network based on theMS capabilities and the requirements imposed by the services, e.g. whether neighbour cellmeasurements are required. The HSCSD service can support both symmetric transmissions,i.e. the same number of up-link and down-link timeslots, or asymmetric transmissions, i.e.more timeslots are allocated in one direction. However, in the case of HSCSD connections,only down-link biased asymmetry is allowed and the up-link timeslot numbers must be asubset of the down-link timeslot numbers.
6.2.2 The general packet radio service
Many services do not require a continuous bi-directional flow of user data across the radiointerface. To illustrate this, consider the example of a user browsing the Worldwide Web(WWW) on her lap-top computer using a dial-up connection via a cellular network. Oncea page of information has been downloaded, there will be a pause in the information flowbetween the MS and the network as the user reads the information and before more infor-mation is requested. Using circuit-switched connections for ‘bursty’ services of this naturerepresents an inefficient use of the radio resources because a user will continue to occupy aradio channel for the duration of a call (or browsing session) even though this channel mayonly be utilised for a small fraction of the time. Inefficiencies of this type can be overcomeby carrying these services using packet-orientated connections.
The GSM system was initially designed to support only circuit-switched connections atthe radio interface level with user data rates of up to 9.6 kb/s. However, the Phase 2+
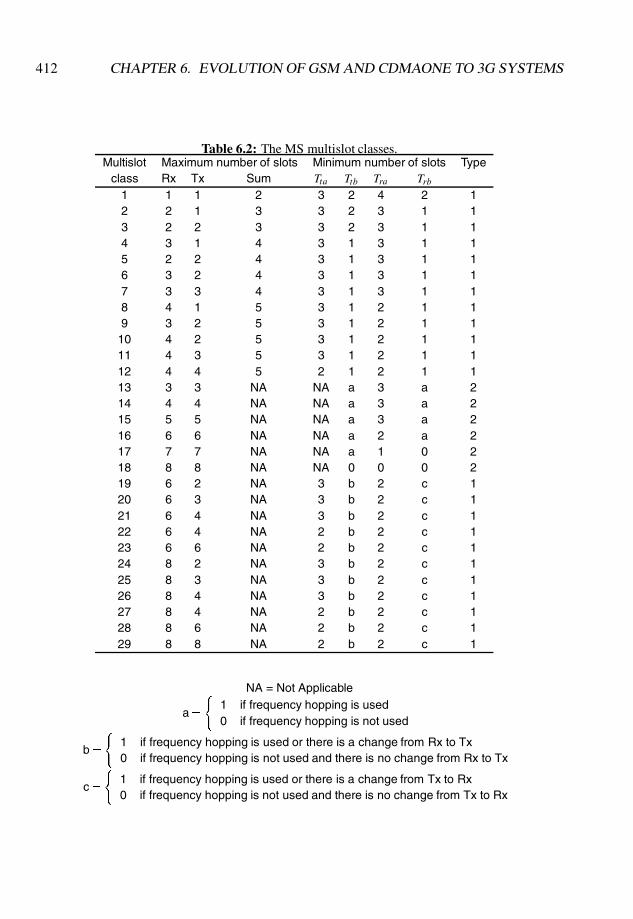
412 CHAPTER 6. EVOLUTION OF GSM AND CDMAONE TO 3G SYSTEMS
Table 6.2: The MS multislot classes.Multislot Maximum number of slots Minimum number of slots Type
class Rx Tx Sum Tta Ttb Tra Trb1 1 1 2 3 2 4 2 12 2 1 3 3 2 3 1 13 2 2 3 3 2 3 1 14 3 1 4 3 1 3 1 15 2 2 4 3 1 3 1 16 3 2 4 3 1 3 1 17 3 3 4 3 1 3 1 18 4 1 5 3 1 2 1 19 3 2 5 3 1 2 1 1
10 4 2 5 3 1 2 1 111 4 3 5 3 1 2 1 112 4 4 5 2 1 2 1 113 3 3 NA NA a 3 a 214 4 4 NA NA a 3 a 215 5 5 NA NA a 3 a 216 6 6 NA NA a 2 a 217 7 7 NA NA a 1 0 218 8 8 NA NA 0 0 0 219 6 2 NA 3 b 2 c 120 6 3 NA 3 b 2 c 121 6 4 NA 3 b 2 c 122 6 4 NA 2 b 2 c 123 6 6 NA 2 b 2 c 124 8 2 NA 3 b 2 c 125 8 3 NA 3 b 2 c 126 8 4 NA 3 b 2 c 127 8 4 NA 2 b 2 c 128 8 6 NA 2 b 2 c 129 8 8 NA 2 b 2 c 1
NA = Not Applicable
a=
(1 if frequency hopping is used0 if frequency hopping is not used
b=
(1 if frequency hopping is used or there is a change from Rx to Tx0 if frequency hopping is not used and there is no change from Rx to Tx
c=
(1 if frequency hopping is used or there is a change from Tx to Rx0 if frequency hopping is not used and there is no change from Tx to Rx

6.2. EVOLUTION OF GSM 413
specifications now include provision for the support of a packet-orientated service knownas the general packet radio service (GPRS) [13, 18–20]. GPRS attempts to optimise thenetwork and radio resources, and strict separation between the radio subsystem and thenetwork subsystem is maintained, although the network subsystem is compatible with theother GSM radio access procedures. Consequently, the GSM MSC is unaffected. Theallocation of a GPRS radio channel is flexible, ranging from one to eight radio interfacetimeslots in a TDMA frame. Up-link and down-link timeslots are allocated separately. Theradio interface resources are able to be shared dynamically between circuit switched andpacket services as a function of service load and operator preference. Bit rates vary from9 kb/s to more than 150 kb/s per user. GPRS can interwork with IP and X.25 networks.Point-to-point and multipoint services are also supported, as well as short message services(SMS).
GPRS is able to accommodate both intermittent, bursty data transfers as well as largecontinuous data transmissions. Reservation times are typically from 0.5 s to 1 s. ThreeMS modes are supported, each having a different arrangement with circuit switched GSMservices. In this section we provide an overview of the GPRS technology and examine itsimpact on the GSM radio interface.
6.2.2.1 The GPRS logical architecture
Figure 6.2 is a block diagram showing the architecture of a GSM network that supportsGPRS, and the names that have been given to the interfaces that exist between the differentnetwork components. GPRS services require two additional network components, the gate-way GPRS support node (GGSN), and the serving GPRS support node (SGSN). As its namesuggests, the GGSN acts as the gateway between external packet data networks (PDN), anda GSM network that supports GPRS. The GGSN contains sufficient information to routeincoming data packets to the SGSN that is serving a particular MS and it is connected toexternal networks via the Gi reference point. (We note that this point of interconnection isreferred to a ‘reference point’ and not an ‘interface’ because no GPRS-specific informationis exchanged at this point.) The SGSN is connected by the Gn interface to GGSNs belong-ing to its own public land mobile network (PLMN) and it is connected by the Gp interfaceto GGSNs belonging to other PLMNs. These two interfaces are very similar, but the Gpsupports additional security functions that are necessary for inter-PLMN communications.The GGSN may also interface directly with the home location register (HLR) over the Gcinterface, but this is not mandatory.
A SGSN keeps track of the location information and the security information associ-ated with the MSs that are within its service area. A SGSN communicates with GGSNsand SGSNs in its own PLMN using the Gn interface and GGSNs in other PLMNs via theGp interface. Interfaces also exist between an SGSN and an MSC/VLR (Gs interface),
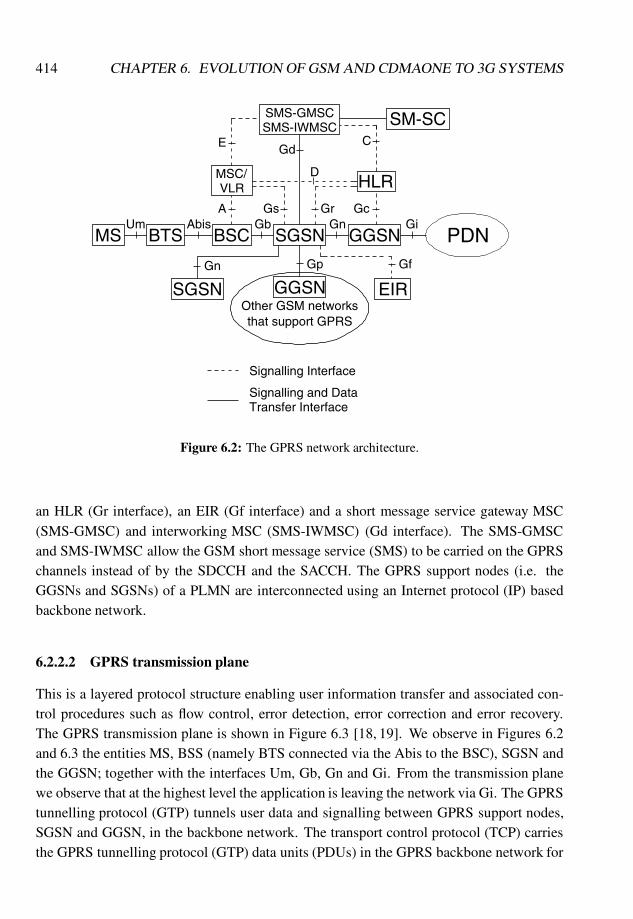
414 CHAPTER 6. EVOLUTION OF GSM AND CDMAONE TO 3G SYSTEMS
MS BTS BSC
MSC/VLR
Um AbisA
SGSNGb
GGSNGn
HLRGcGrGs
GGSNGp
SGSNOther GSM networks
D
SMS-GMSCSMS-IWMSC
GdE C
EIR
GfGn
SM-SC
GiPDN
Signalling Interface
Signalling and DataTransfer Interface
that support GPRS
Figure 6.2: The GPRS network architecture.
an HLR (Gr interface), an EIR (Gf interface) and a short message service gateway MSC(SMS-GMSC) and interworking MSC (SMS-IWMSC) (Gd interface). The SMS-GMSCand SMS-IWMSC allow the GSM short message service (SMS) to be carried on the GPRSchannels instead of by the SDCCH and the SACCH. The GPRS support nodes (i.e. theGGSNs and SGSNs) of a PLMN are interconnected using an Internet protocol (IP) basedbackbone network.
6.2.2.2 GPRS transmission plane
This is a layered protocol structure enabling user information transfer and associated con-trol procedures such as flow control, error detection, error correction and error recovery.The GPRS transmission plane is shown in Figure 6.3 [18, 19]. We observe in Figures 6.2and 6.3 the entities MS, BSS (namely BTS connected via the Abis to the BSC), SGSN andthe GGSN; together with the interfaces Um, Gb, Gn and Gi. From the transmission planewe observe that at the highest level the application is leaving the network via Gi. The GPRStunnelling protocol (GTP) tunnels user data and signalling between GPRS support nodes,SGSN and GGSN, in the backbone network. The transport control protocol (TCP) carriesthe GPRS tunnelling protocol (GTP) data units (PDUs) in the GPRS backbone network for
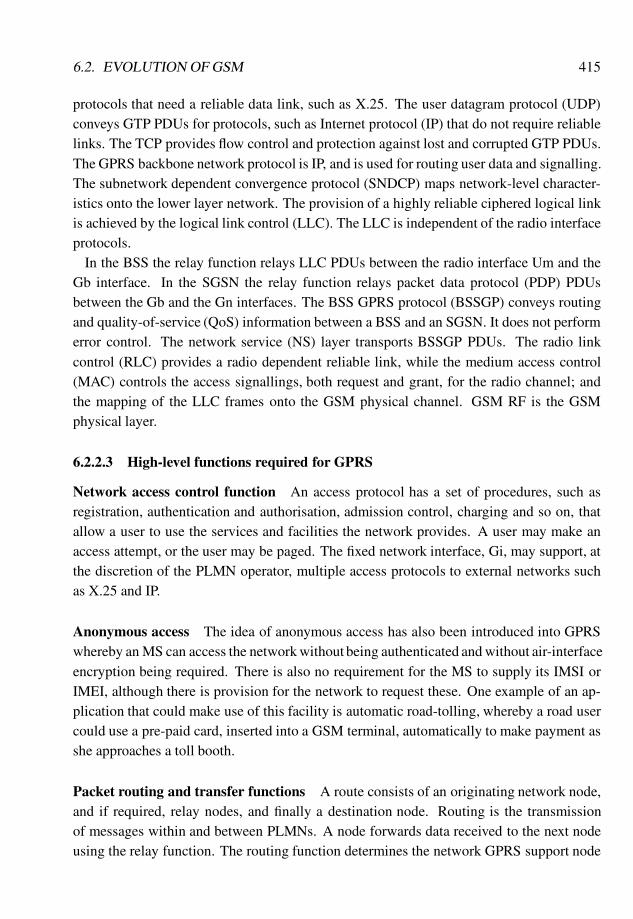
6.2. EVOLUTION OF GSM 415
protocols that need a reliable data link, such as X.25. The user datagram protocol (UDP)conveys GTP PDUs for protocols, such as Internet protocol (IP) that do not require reliablelinks. The TCP provides flow control and protection against lost and corrupted GTP PDUs.The GPRS backbone network protocol is IP, and is used for routing user data and signalling.The subnetwork dependent convergence protocol (SNDCP) maps network-level character-istics onto the lower layer network. The provision of a highly reliable ciphered logical linkis achieved by the logical link control (LLC). The LLC is independent of the radio interfaceprotocols.
In the BSS the relay function relays LLC PDUs between the radio interface Um and theGb interface. In the SGSN the relay function relays packet data protocol (PDP) PDUsbetween the Gb and the Gn interfaces. The BSS GPRS protocol (BSSGP) conveys routingand quality-of-service (QoS) information between a BSS and an SGSN. It does not performerror control. The network service (NS) layer transports BSSGP PDUs. The radio linkcontrol (RLC) provides a radio dependent reliable link, while the medium access control(MAC) controls the access signallings, both request and grant, for the radio channel; andthe mapping of the LLC frames onto the GSM physical channel. GSM RF is the GSMphysical layer.
6.2.2.3 High-level functions required for GPRS
Network access control function An access protocol has a set of procedures, such asregistration, authentication and authorisation, admission control, charging and so on, thatallow a user to use the services and facilities the network provides. A user may make anaccess attempt, or the user may be paged. The fixed network interface, Gi, may support, atthe discretion of the PLMN operator, multiple access protocols to external networks suchas X.25 and IP.
Anonymous access The idea of anonymous access has also been introduced into GPRSwhereby an MS can access the network without being authenticated and without air-interfaceencryption being required. There is also no requirement for the MS to supply its IMSI orIMEI, although there is provision for the network to request these. One example of an ap-plication that could make use of this facility is automatic road-tolling, whereby a road usercould use a pre-paid card, inserted into a GSM terminal, automatically to make payment asshe approaches a toll booth.
Packet routing and transfer functions A route consists of an originating network node,and if required, relay nodes, and finally a destination node. Routing is the transmissionof messages within and between PLMNs. A node forwards data received to the next nodeusing the relay function. The routing function determines the network GPRS support node
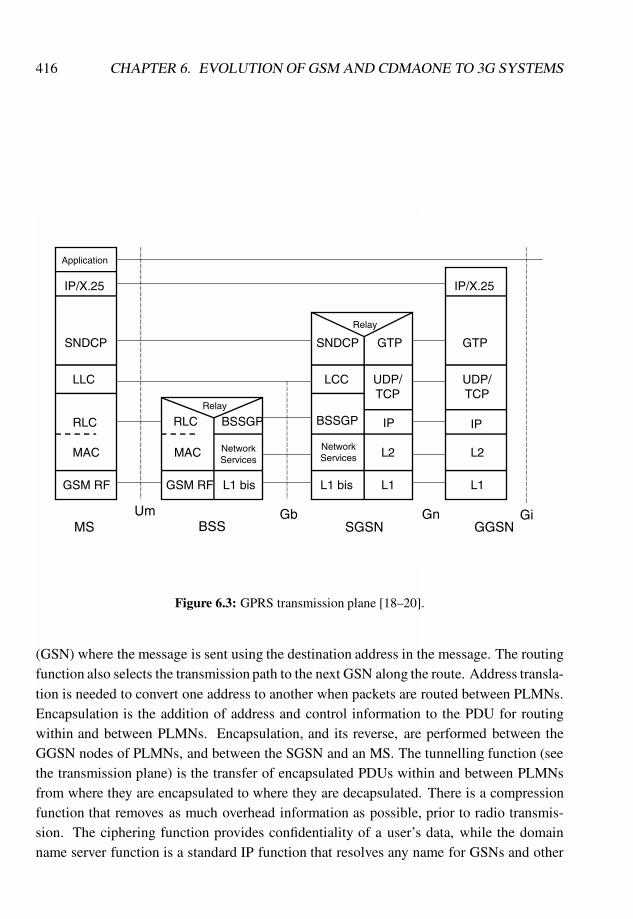
416 CHAPTER 6. EVOLUTION OF GSM AND CDMAONE TO 3G SYSTEMS
Application
IP/X.25
SNDCP
LLC
GSM RF
MAC
RLC
MSUm
Relay
RLC
MAC
GSM RF
BSSGP
NetworkServices
L1 bis
Relay
SNDCP
LCC
BSSGP
NetworkServices
L1 bis
GbBSS
GTP
UDP/TCP
IP
L2
L1
SGSN GGSN
IP/X.25
GTP
UDP/TCP
IP
L2
L1
Gn Gi
Figure 6.3: GPRS transmission plane [18–20].
(GSN) where the message is sent using the destination address in the message. The routingfunction also selects the transmission path to the next GSN along the route. Address transla-tion is needed to convert one address to another when packets are routed between PLMNs.Encapsulation is the addition of address and control information to the PDU for routingwithin and between PLMNs. Encapsulation, and its reverse, are performed between theGGSN nodes of PLMNs, and between the SGSN and an MS. The tunnelling function (seethe transmission plane) is the transfer of encapsulated PDUs within and between PLMNsfrom where they are encapsulated to where they are decapsulated. There is a compressionfunction that removes as much overhead information as possible, prior to radio transmis-sion. The ciphering function provides confidentiality of a user’s data, while the domainname server function is a standard IP function that resolves any name for GSNs and other
6.2. EVOLUTION OF GSM 417
GPRS nodes within the GPRS backbone networks.
GPRS mobility management and the MS states Mobility management describes theprocesses in the mobile radio system that are associated with tracking the movements ofsubscribers as they travel around a network. The non-GPRS GSM system uses locationareas and location update procedures to ensure that it always knows the whereabouts of itsMSs. The GPRS uses a similar approach, but instead of using the existing location areas(LAs) it uses routing areas (RAs). If an MS detects that it has entered a new RA it willsubmit a routing area update request message to the network, which if successful, will beacknowledged with a routing area update accept message. The decision as to whether aGPRS-equipped MS should perform the RA update procedure as it moves between RAswill depend on the GPRS state of the MS.
A GPRS-equipped MS may be in any one of three different states for the purposes ofmobility management. In the idle state the MS is ‘not reachable’ as far as the GPRS isconcerned. If an MS is in the idle state, the network does not hold any information regardingthe location of the MS, and hence the MS cannot be paged. It also means that the MS doesnot need to perform any RA updates as it moves around the network. MSs in the idle statecannot access the packet data services without first performing a procedure known as GPRSattach where the MS announces its identity.
In the standby state the user is attached to the GPRS mobility management (MM). TheMS performs RA and cell selection, and may receive point-to-multipoint multicast (PTM-M) and point-to-point multipoint group call (PTM-G) data. The SGSN may send data orsignalling information to an MS. The MM state in the MS changes to ready when an MS re-sponds to a page, as does the state in the SGSN when the response from the MS is received.The MM state in the MS goes to ready when data or signalling information is sent by theMS to the network, hence the MM in the SGSN also changes to the ready state. Either theMS or the SGSN may initiate the GPRS detach procedure to move to the idle state.
In the ready state, the MS informs the network of the selected cell by means of an identifierincluded in the BSSGP header of the data packet from the MS. The MS is able to send andreceive PDP PDUs. The network initiates no pages for an MS in the ready state, but pagesfor other services may be executed via the SGSN. The ready state is supervised by a timer,and when the timer expires the MM moves from ready to standby. To move from ready toidle states, the MS initiates the GPRS detach procedure.
Logical link management functions These are involved with link establishment, main-tenance and release procedures between an MS and the PLMN over the radio interface.These functions involve the co-ordination of link state information and the supervision ofdata activity over the logical link.

418 CHAPTER 6. EVOLUTION OF GSM AND CDMAONE TO 3G SYSTEMS
Radio resource management functions Allocation and maintenance of radio communi-cation channels are provided by these functions. The GSM radio resources are dynamicallyshared between the circuit mode and GPRS. The GPRS radio resource management is con-cerned with the allocation and release of timeslots for a GPRS channel; monitoring GPRSchannel utilisation; congestion control; and the distribution of GPRS channel configurationinformation that is broadcast on the common control channels.
Network management functions These support operation and management functions forGPRS.
6.2.2.4 Low-level functions
The radio interface functions for GPRS are the medium access control (MAC) and radiolink control (RLC) that operate above the physical layer. The MAC function arbitrates be-tween MSs attempting to transmit at the same time. It is therefore concerned with collisionavoidance, detection, and recovery following a collision. The MAC function may let a sin-gle MS use several physical channels simultaneously. The multiplexing of data and controlsignalling on both links is affected by the MAC function, as well as by priority scheduling.
The GPRS RLC function supports the transfer of logical link control layer PDUs (LLC-PDU) between the LLC and MAC entities, the segmentation and reassembly of LLC-PDUsinto RLC data blocks, and backward error correction for the retransmission of uncorrectablecode words.
Packet data logical channels Although circuit switched and GPRS services use the samephysical channels, they have different logical channels. The physical channel dedicated topacket data is called a packet data channel (PDCH). The logical channels for common con-trol signalling for packet data are carried by the packet common control channel (PCCCH),and there is also the packet random access channel (PRACH), an up-link-only channel usedby MSs to initiate data or signalling packet transmission. The other PCCCHs are all down-link ones. There is the packet paging channel (PPCH) that uses paging groups of MSsto enable discontinuous reception (DRX) to be used. PPCH can be used for both circuitswitched and packet services. The packet access grant channel (PAGCH) identifies the re-source assignment to be used by an MS prior to packet transfer, while the packet notificationchannel (PNCH) provides notification to a group of MSs that a PTM-M packet transfer isimminent. The packet broadcast control channel (PBCCH) informs the MSs of packet dataspecific information. This information may also be transmitted on the BCCH if a PBCCHhas not been allocated.
The packet data traffic channel (PDTCH) is allocated for data transmissions. It is tem-porarily allocated to an MS (or a group of MSs in the PTM-M case). An MS may be
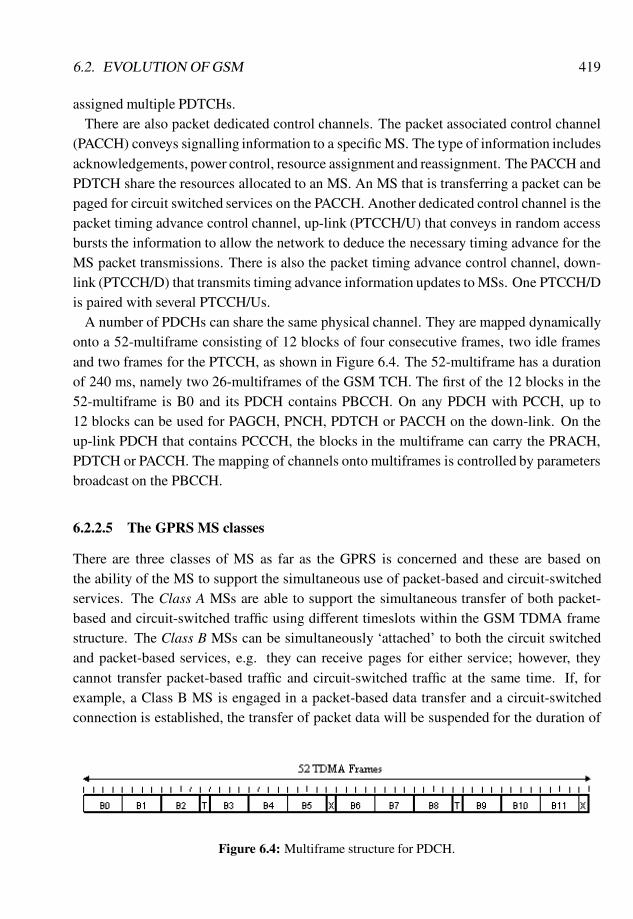
6.2. EVOLUTION OF GSM 419
assigned multiple PDTCHs.There are also packet dedicated control channels. The packet associated control channel
(PACCH) conveys signalling information to a specific MS. The type of information includesacknowledgements, power control, resource assignment and reassignment. The PACCH andPDTCH share the resources allocated to an MS. An MS that is transferring a packet can bepaged for circuit switched services on the PACCH. Another dedicated control channel is thepacket timing advance control channel, up-link (PTCCH/U) that conveys in random accessbursts the information to allow the network to deduce the necessary timing advance for theMS packet transmissions. There is also the packet timing advance control channel, down-link (PTCCH/D) that transmits timing advance information updates to MSs. One PTCCH/Dis paired with several PTCCH/Us.
A number of PDCHs can share the same physical channel. They are mapped dynamicallyonto a 52-multiframe consisting of 12 blocks of four consecutive frames, two idle framesand two frames for the PTCCH, as shown in Figure 6.4. The 52-multiframe has a durationof 240 ms, namely two 26-multiframes of the GSM TCH. The first of the 12 blocks in the52-multiframe is B0 and its PDCH contains PBCCH. On any PDCH with PCCH, up to12 blocks can be used for PAGCH, PNCH, PDTCH or PACCH on the down-link. On theup-link PDCH that contains PCCCH, the blocks in the multiframe can carry the PRACH,PDTCH or PACCH. The mapping of channels onto multiframes is controlled by parametersbroadcast on the PBCCH.
6.2.2.5 The GPRS MS classes
There are three classes of MS as far as the GPRS is concerned and these are based onthe ability of the MS to support the simultaneous use of packet-based and circuit-switchedservices. The Class A MSs are able to support the simultaneous transfer of both packet-based and circuit-switched traffic using different timeslots within the GSM TDMA framestructure. The Class B MSs can be simultaneously ‘attached’ to both the circuit switchedand packet-based services, e.g. they can receive pages for either service; however, theycannot transfer packet-based traffic and circuit-switched traffic at the same time. If, forexample, a Class B MS is engaged in a packet-based data transfer and a circuit-switchedconnection is established, the transfer of packet data will be suspended for the duration of
Figure 6.4: Multiframe structure for PDCH.
420 CHAPTER 6. EVOLUTION OF GSM AND CDMAONE TO 3G SYSTEMS
the circuit-switched connection. However, in this example there is no requirement for theGPRS to be deactivated for the particular MS. Class C MSs do not support any simultaneoususe of circuit-switched and packet-based services. A Class C MS can be viewed as operatingin two distinct modes, the GPRS mode and the circuit-switched mode, and it can only bein one mode at a particular time. For example, if the class C MS is in GPRS mode (i.e. itis engaged in a packet-based data transfer) and a circuit-switched call arrives at the PLMNfor this particular MS, then the MS will be considered ‘not reachable’ as far as the circuit-switched call is concerned. It should be noted that the GPRS class of an MS and its multislotclass (see Table 6.2) are separate parameters and there is no direct correlation between thetwo.
6.2.2.6 The GPRS quality-of-service
There are four different quality-of-service (QoS) profiles supported in GPRS and these aredependent on the type of service. For example, an email transaction can tolerate greater de-lays than, say, an interactive video service, and the QoS profile will be chosen appropriatelyin each case. The MS and the network will agree on a particular QoS profile during theinitial service negotiation stages and, as far as possible, the network will attempt to deliverthis QoS to the MS. The QoS service profile is made up of a number of factors, includingthe delay class (i.e. the average packet transmission delay), the precedence class (i.e. thepriority value attached to the packets in the event of packet erasure being required as a re-sult of network congestion), the reliability class (i.e. the probability of errors in the receiveddata packet), and the peak and average throughput class (i.e. the peak and average rates atwhich data are transferred through the network, respectively).
6.2.3 The enhanced data rates for GSM evolution (EDGE)
The driving force behind EDGE is to improve the data rates of GSM by means of enhanc-ing the modulation methods [14, 21]; specifically, to increase the data rate transmissionper radio timeslot compared with GMSK modulation. Different types of enhanced modu-lation methods have been considered starting with quaternary offset quadrature amplitudemodulation (Q-O-QAM) and binary offset quadrature amplitude modulation (B-O-QAM),and ending with 8-level phase shift keying (8-PSK). Although the initial drivers were toincrease the user bit rates and thereby increase the range of services, EDGE has been gildedas a 3G system and is now a member of the IMT-2000 family. EDGE’s new heady role hasa lot to do with the evolutionary strategy of IS-136, the US TDMA system that is itself anevolution of the former analogue system, AMPS. The Universe Wireless Communications(UWC) Consortium advocated a family of mutually compatible TDMA standards known asUWC-136 that would be developed from the second generation IS-136. The concept was
6.2. EVOLUTION OF GSM 421
that voice services would be provided by the existing IS-136 network and by a new variantcalled 136+ which would employ enhanced modulation methods, such as π=4 differentialquadrature phase shift keying (π=4 DQPSK), coherent QPSK, and coherent 8-PSK offeringa maximum user rate of 43.2 kb/s. Higher rate services would be provided by 136 HS,which supports user rates up to 521 kb/s for pedestrian mobiles and for vehicular mobiles atspeeds up to 100 km/h. For speeds in the range of 100–500 km/h, rates of 182 kb/s wouldbe accommodated. In indoor environments, the maximum bit rate would be 4.7 Mb/s. For136 HS the carrier spacing is 200 kHz (as in GSM) for outdoor/vehicular environments, and1600 kHz for offices.
The 136 HS (outdoor/vehicular) with its 200 kHz carrier spacing, eight slots per frame,FDD, with multilevel modulation was part of the UWC-136 IMT EDGE proposal. Theevolution of GSM to EDGE and IS-136 to EDGE is now undertaken jointly by ETSI andthe UWC Consortium. Consequently, EDGE will be compatible with both GSM and IS-136. The plan [14] is to deploy GPRS, then enhanced GPRS (EDPRS) and enhanced circuitswitch data (ECSD). Then the high level of modulation will be deployed to realise 3GEDGE services.
EDGE radio interface The radio interface will continue to have GMSK available, butwill be able to use 8-PSK which has three bits per symbol instead of the one-bit type symbolof GMSK. Since the symbol rate is 271 ksymbols/s then the gross bit rates per slot (includesoverhead) is 22.8 and 69.2 kb/s for GMSK and 8-PSK, respectively. The pulse shape for8-PSK is such that the 8-PSK spectrum fits within the GMSK spectrum mask. The normalburst format for EDGE is the same as for GSM, except the two sets of 58 symbols now havethree bits per symbol.
Packet switched transmission The EDGE concept has both packet switched and circuitswitched modes. Indeed, EDGE is more like the grand evolutionary plan of GSM that in-cludes both GPRS and HSCSD. The enhanced GPRS (EGPRS) differs from GPRS becausewith multilevel modulation the channel coding must be improved because it is more vul-nerable to interference and noise. Accordingly a link adaption scheme regularly estimateslink quality and selects GMSK or 8-PSK and the appropriate channel coding to provide thehighest user bit rate. At the time of writing various schemes are being considered for stan-dardisation. The coding rate is determined by the amount of puncturing. The rate per timeslot for GMSK is 11.2, 14.5, 16.7 and 22.8 kb/s for code rates of 0.49, 0.64, 0.73, and 1.0,respectively. For 8-PSK the rate per time slot is 22.8. 34.3, 41.25, 51.6, 57.35 and 69.2 kb/sfor code rates of 0.33, 0.50, 0.60, 0.75, 0.83 and 1.0, respectively.
The enhanced circuit switched (ECSD) mode has the data interleaved over 22 TDMAframes. For GMSK modulation the rate per time slot is 3.6, 6, 12 and 14.5 kb/s for a code
422 CHAPTER 6. EVOLUTION OF GSM AND CDMAONE TO 3G SYSTEMS
rate of 0.16, 0.26, 0.53 and 0.64, respectively; while for 8-PSK the bit rates have the highervalues of 14.5, 29, 32 and 38.8 kb/s for code rates of 0.42, 0.46, and 0.56, respectively.
For EGPRS when QoS issues are addressed where different factors, such as priority ofpacket transmissions, packet delay, packet throughput, maximum and minimum bit ratesthat must be handled, and so on, need to be considered, then the maximum bearer rateshould be able to accommodate data rates of 384 kb/s for MS speeds up to 100 km/h and144 kb/s for an MS travelling at 250 km/h. These rates require a user to make use of multipleslots per frame if these high bit rates are to be achieved. Fewer slots are required if 8-PSKis used. Similar comments can be made regarding bearer rates for ECSD. For low bit errorrate transmissions the maximum user bit rate is 57.6 kb/s.
Because of different user requirements there is one class of MSs where 8-PSK is usedin the down-link and only GMSK in the up-link. This provides higher bit rate down-linktransmissions than the up-link ones while at the same time decreasing the complexity of theMS. Another class of MS will support 8-PSK transmissions on both links.
As with all the 3G standards, we await with interest to see how well they will performwhen they are deployed in operational networks.
6.3 The Universal Mobile Telecommunication System
The universal mobile telecommunication system (UMTS) is, at the time of writing, be-ing shaped within the Third Generation Partnership Project (3GPP) [22]. The participantshave come together for the specific task of specifying a 3G system based on an evolvedGSM core network and the UTRA FDD and TDD radio interfaces. The 3GPP is composedof organisational partners, market representation partners and observers. The organisationpartners, i.e. standards organisations, are: ARIB (Japan), CWTS (China), ETSI (Europe),TI (USA), TTA (Korea) and TTC (Japan). The market representation partners are: GlobalMobile Suppliers Association (GSA), the GSM Association, the UMTS Forum, the Univer-sal Wireless Communications Consortium (UWCC), and the IPv6 Forum. The observersare TIA (USA) and TSACC (Canada). The 3GPP activity is overseen by a project coordina-tion group (PCG). The specifications are developed by four technical specification groups(TSGs) responsible for the core network, the radio access networks, services and systemaspects, and terminals. Each TSG has a number of working groups. There will be a roll-outof the specifications; the initial release of the specifications is Phase 1 Release 99. Newcapabilities and services will be introduced according to annual specification releases.
The UMTS terminology introduces a number of new terms, and re-names some familiarones. Many of these new terms will be defined as they appear in the text, but to assist thereader give a list of UMTS abbreviations in Table 6.3. We also draw the reader’s attentionto some familiar GSM terms that are different in UMTS. These are presented in Table 6.4
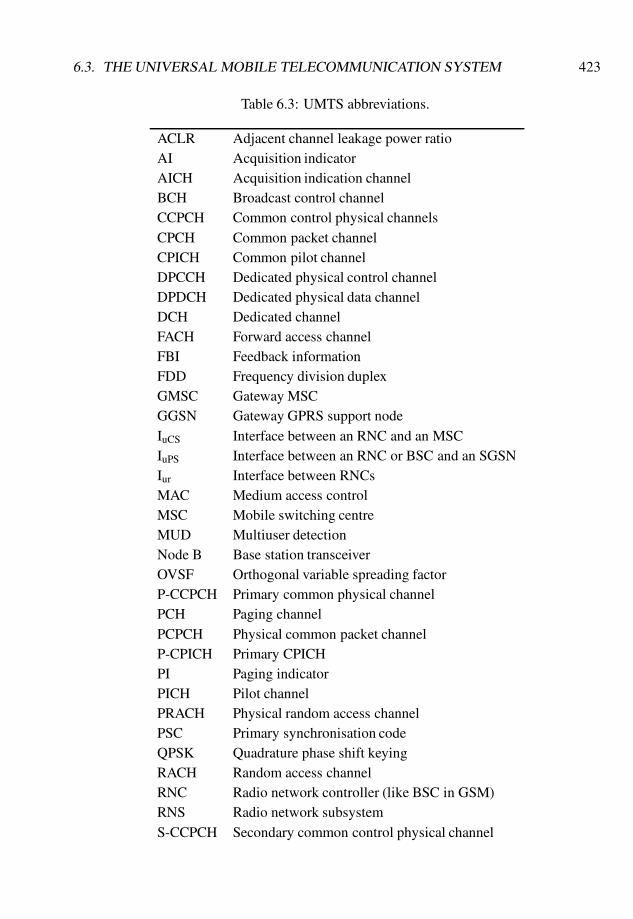
6.3. THE UNIVERSAL MOBILE TELECOMMUNICATION SYSTEM 423
Table 6.3: UMTS abbreviations.
ACLR Adjacent channel leakage power ratioAI Acquisition indicatorAICH Acquisition indication channelBCH Broadcast control channelCCPCH Common control physical channelsCPCH Common packet channelCPICH Common pilot channelDPCCH Dedicated physical control channelDPDCH Dedicated physical data channelDCH Dedicated channelFACH Forward access channelFBI Feedback informationFDD Frequency division duplexGMSC Gateway MSCGGSN Gateway GPRS support nodeIuCS Interface between an RNC and an MSCIuPS Interface between an RNC or BSC and an SGSNIur Interface between RNCsMAC Medium access controlMSC Mobile switching centreMUD Multiuser detectionNode B Base station transceiverOVSF Orthogonal variable spreading factorP-CCPCH Primary common physical channelPCH Paging channelPCPCH Physical common packet channelP-CPICH Primary CPICHPI Paging indicatorPICH Pilot channelPRACH Physical random access channelPSC Primary synchronisation codeQPSK Quadrature phase shift keyingRACH Random access channelRNC Radio network controller (like BSC in GSM)RNS Radio network subsystemS-CCPCH Secondary common control physical channel
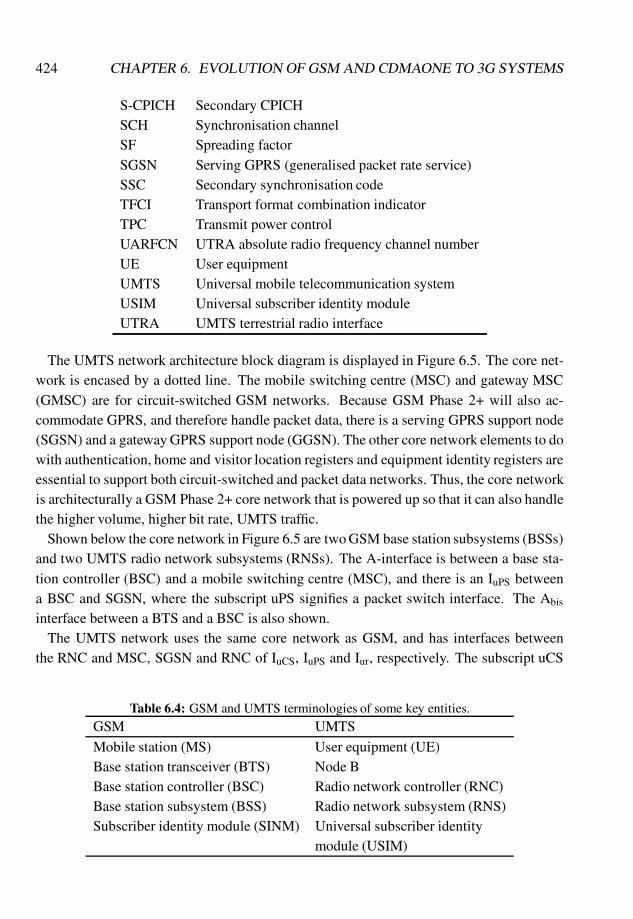
424 CHAPTER 6. EVOLUTION OF GSM AND CDMAONE TO 3G SYSTEMS
S-CPICH Secondary CPICHSCH Synchronisation channelSF Spreading factorSGSN Serving GPRS (generalised packet rate service)SSC Secondary synchronisation codeTFCI Transport format combination indicatorTPC Transmit power controlUARFCN UTRA absolute radio frequency channel numberUE User equipmentUMTS Universal mobile telecommunication systemUSIM Universal subscriber identity moduleUTRA UMTS terrestrial radio interface
The UMTS network architecture block diagram is displayed in Figure 6.5. The core net-work is encased by a dotted line. The mobile switching centre (MSC) and gateway MSC(GMSC) are for circuit-switched GSM networks. Because GSM Phase 2+ will also ac-commodate GPRS, and therefore handle packet data, there is a serving GPRS support node(SGSN) and a gateway GPRS support node (GGSN). The other core network elements to dowith authentication, home and visitor location registers and equipment identity registers areessential to support both circuit-switched and packet data networks. Thus, the core networkis architecturally a GSM Phase 2+ core network that is powered up so that it can also handlethe higher volume, higher bit rate, UMTS traffic.
Shown below the core network in Figure 6.5 are two GSM base station subsystems (BSSs)and two UMTS radio network subsystems (RNSs). The A-interface is between a base sta-tion controller (BSC) and a mobile switching centre (MSC), and there is an IuPS betweena BSC and SGSN, where the subscript uPS signifies a packet switch interface. The Abis
interface between a BTS and a BSC is also shown.The UMTS network uses the same core network as GSM, and has interfaces between
the RNC and MSC, SGSN and RNC of IuCS, IuPS and Iur, respectively. The subscript uCS
Table 6.4: GSM and UMTS terminologies of some key entities.GSM UMTS
Mobile station (MS) User equipment (UE)Base station transceiver (BTS) Node BBase station controller (BSC) Radio network controller (RNC)Base station subsystem (BSS) Radio network subsystem (RNS)Subscriber identity module (SINM) Universal subscriber identity
module (USIM)
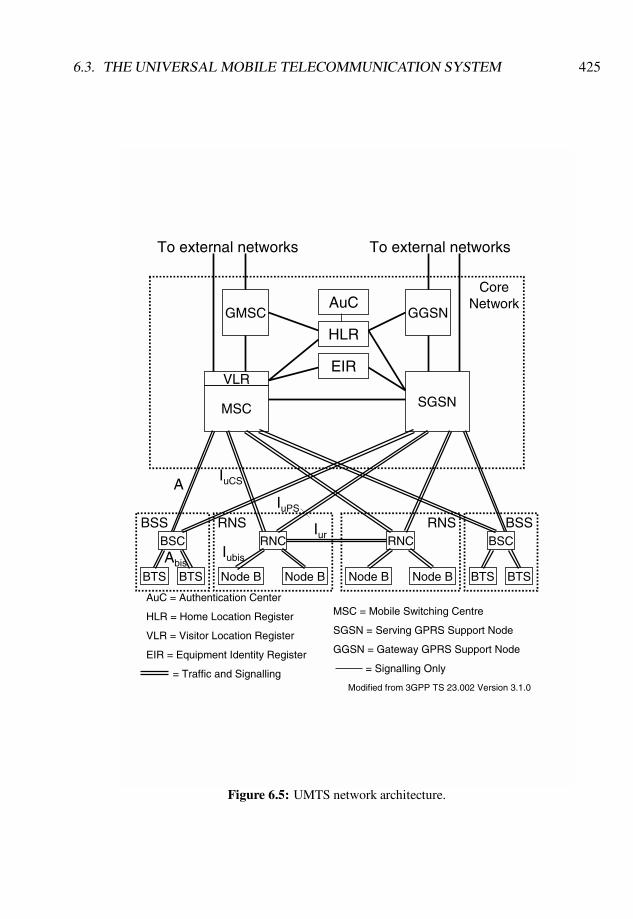
6.3. THE UNIVERSAL MOBILE TELECOMMUNICATION SYSTEM 425
BTS
BSC
BTS Node B
RNC
Node B BTS
BSC
BTSNode B
RNC
Node B
RNS RNSBSS BSS
MSC
VLR
SGSN
GMSC GGSNAuC
HLR
EIR
AuC = Authentication Center
HLR = Home Location Register
VLR = Visitor Location Register
EIR = Equipment Identity Register
= Traffic and Signalling
MSC = Mobile Switching Centre
SGSN = Serving GPRS Support Node
GGSN = Gateway GPRS Support Node
= Signalling Only
Modified from 3GPP TS 23.002 Version 3.1.0
Core Network
To external networks To external networks
A
IubisAbis
Iur
IuCS
IuPS
Figure 6.5: UMTS network architecture.
426 CHAPTER 6. EVOLUTION OF GSM AND CDMAONE TO 3G SYSTEMS
represents circuit-switched. The equivalent of the Abis in UMTS is Iubis.This figure is important because it illustrates the evolutionary path from GSM Phase2+ to
UMTS. We see the different radio interfaces of GSM and UMTS plugging into a commonbackbone network.
The physical channels in UMTS transfer information across the radio interface. In theFDD version of UMTS, a physical channel is defined by its code and carrier frequency,while in TDD it is in terms of its code, carrier frequency and timeslot. The physical layer(layer 1) of the protocol stack supports transport channels to the medium access control(MAC) in layer 2. The MAC layer offers logical layers, e.g. radio link control, to the higherlayers. A logical channel is characterised by the type of information transferred, e.g. it maybe handling control information of data traffic.
Figure 6.6 is a block diagram of a UMTS transmitter at the physical layer. Transportchannel data from layer 2 and above are arranged in blocks depending on the type of data.These blocks are cyclically redundancy coded (CRC) to facilitate error detection at thereceiver. The data are segmented into blocks and channel coding ensues. The coding maybe convolutional or turbo. Sometimes channel coding is not used. Data are then interleavedto decrease the memory of the radio channel and thereby render the channel more Gaussian-like. The interleaved data are then segmented into frames compatible with the requirementsof the UTRA interface. Rate matching is performed next. This uses code-puncturing anddata repetition, where appropriate, so that after transport channel multiplexing the data rateis matched to the channel rate of the dedicated physical channels. A second stage of bitinterleaving is executed, and the data are then mapped to the radio interface frame structure.
Suffice to say at this point is that there are different types of physical channels, namelypilot channels that provide a demodulation reference for other channels; synchronisationchannels that provide synchronisation to all UEs within a cell; common channels that carryinformation to and from any user equipment (UE); and dedicated channels that carry infor-mation to and from specific UEs.
The physical layer procedures include cell search for the initial synchronisation of a UEwith a nearby cell; cell reselection which involves a UE changing cells while not engaged ina call; access procedure that allows a UE to initially access a cell; power control to ensurethat a UE and a BS transmit at optimum power levels; and handover, the mechanism thatswitches a serving cell to another cell during a call.
6.3.1 The UTRA FDD mode
The UMTS terrestrial radio interface (UTRA) frequency duplex (FDD) mode is the W-CDMA radio interface of the UMTS, and is designated by the ITU as IMT DS. Referring toTable 6.1, the UTRA FDD mode uses segment 3 for up-link transmission, and segment 6 fordown-link transmission, i.e. from node B to UE communications. These two segments are

6.3. THE UNIVERSAL MOBILE TELECOMMUNICATION SYSTEM 427
Transport Channel
Data From Higher Layers
CRC Attachment
Block Concatenation/ Segmentation
Channel Coding
1st
InterleavingRadio Frame Segmentation
Rate Matching
Traffic Channel Multiplexing
Physical Channel
Segmentation
2nd
Interleaving
Physical Channel Mapping
To radio interface
Convolutional CodingTurbo Coding
No CodingOther Channels
Figure 6.6: Block diagram of a UMTS transmitter at the physical layer.
called band A. (There is a band B for PCS services in the United States, where 1850–1910and 1930–1990 MHz are for the up-link and down-link transmission, respectively).
For the UTRA FDD the duplex spacing, i.e. the frequency separation between pairedchannels, is in the range 134.8 MHz to 245.2 MHz, and all UE must support a duplexspacing of 190 MHz. The nominal spacing between radio carriers is 5 MHz, with a chan-nel raster of 0.2 MHz. This means that the carrier separation may be adjusted in steps of0.2 MHz, e.g. the carrier spacing may be 4.8 MHz.
The carrier frequency is defined by the UTRA absolute radio frequency channel number(UARFCN). This number is defined over a frequency band from 0 to 3.7 GHz, and it is thetransmission frequency multiplexed by five. Consequently, the UARFCN, which we denoteas Nu and Nd for the up-link and down-link, respectively, will always be an integer becauseof the raster frequency of 0.2 MHz. Note that the radio channels in the UTRA FDD are notnecessarily paired as they are in GSM.
Transmitted spectrum The CDMA chip rate is 3.84 Mchips/s, and the transmitted spec-trum must conform to, i.e. be within, a spectrum mask [23]. As an example, the mask for aBS with a maximum output power of � 43 dBm is shown in Figure 6.7. The abscissa is thefrequency offset, 4 f , from the carrier. The carrier is at 4 f = 0, not shown in the figure,and the adjacent carrier would be positioned at 4 f = 5 MHz. The lightly shaded part ofthe figure corresponds to the left-hand ordinate, which is the power measured by a spectral

428 CHAPTER 6. EVOLUTION OF GSM AND CDMAONE TO 3G SYSTEMS
analyser using a bandwidth of 30 KHz. The maximum output power as a function of 4 fbetween 2.7 and 3.5 MHz must be less than �14�15(4 f �2:7) dBm. The darker shadedarea of the figure is associated with the right-hand ordinate, which is the power measured ina 1 MHz bandwidth. The value of4 fmax is 12.5 MHz, or the edge of the allotted frequencyband for UMTS, whichever is the greater.
The adjacent channel leakage power ratio (ACLR) is the ratio of the transmitted powerto the power measured in an adjacent band following a receiver filter. Both the transmittedand received power are measured at the output of a raised cosine filter with a 0.22 roll-offfactor and a noise power bandwidth equal to the chip rate. For an adjacent channel offset of5 MHz. i.e. 4 f = 5 MHz in Figure 6.7, the ACLR limit for the BS is 45 dB less than thetransmitted signal power, while for a UE it is 33 dB down on the transmitted power of theadjacent carrier, or if the transmitted power of the adjacent carrier is �50 dBm, whicheveris the higher. The corresponding figures for4 f = 10 MHz are 50 dB for the BS, and 43 dBor �50 dBm, whichever is the greater, for the MS.
Physical channels We have already introduced the concept of UTRA physical channels,and that for UTRA FDD they are defined by a specific carrier frequency and code. Thereare two basic types of physical channels, called dedicated channels and common channels.The former are used by UEs for the duration of a call, while the latter carry information toall UEs within a cell and are used by the UEs to access the network.
There are two types of dedicated physical channels. The dedicated physical control chan-nel (DPCCH) carries physical layer (i.e. layer 1) control information and the dedicatedphysical data channel (DPDCH) transports the user traffic, as well as control informationfrom layer 2 and from higher layers.
The DPCCH contains pilot symbols, transmit power control (TPC) symbols, and a trans-port format combination indicator (TFCI). The pilot symbols enable the receiver to estimatethe impulse response of the radio channel and to perform coherent detection. They are alsonecessary when adaptive antennae are used that have narrow beams. The pilot symbolsconstitute a pilot word having a duration of 0.667 ms.
The TPC commands the fast closed-loop power control, and are used on both the up-linkand down-link. TPC symbols are included in every transmitted packet, and they conveya binary instruction, namely to increase or decrease the transmitted power by a specificamount.
The TFCI informs the receiver of the instantaneous parameters of the different transportchannels; that is, it tells the receiver of the data rates currently in use. The TFCI alsocontains feedback information (FBI) on the up-link which is used to provide a feedbackloop for transmit diversity and selection diversity.
The frame structure, multiplexing arrangement and spreading schemes are different for
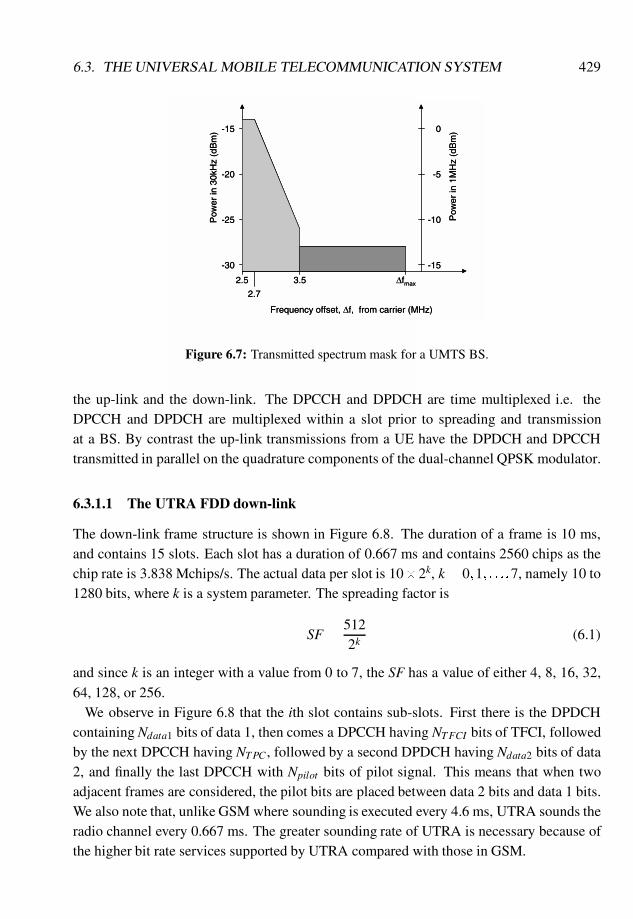
6.3. THE UNIVERSAL MOBILE TELECOMMUNICATION SYSTEM 429
Frequency offset, ∆f, from carrier (MHz)
-15
-20
-25
-30
0
-5
-10
-15
Pow
er in
30k
Hz
(dB
m)
Pow
er in
1M
Hz
(dB
m)
2.5
2.7
3.5 ∆fmax
Frequency offset, ∆f, from carrier (MHz)
-15
-20
-25
-30
0
-5
-10
-15
Pow
er in
30k
Hz
(dB
m)
Pow
er in
1M
Hz
(dB
m)
2.5
2.7
3.5 ∆fmax
Figure 6.7: Transmitted spectrum mask for a UMTS BS.
the up-link and the down-link. The DPCCH and DPDCH are time multiplexed i.e. theDPCCH and DPDCH are multiplexed within a slot prior to spreading and transmissionat a BS. By contrast the up-link transmissions from a UE have the DPDCH and DPCCHtransmitted in parallel on the quadrature components of the dual-channel QPSK modulator.
6.3.1.1 The UTRA FDD down-link
The down-link frame structure is shown in Figure 6.8. The duration of a frame is 10 ms,and contains 15 slots. Each slot has a duration of 0.667 ms and contains 2560 chips as thechip rate is 3.838 Mchips/s. The actual data per slot is 10�2k, k= 0;1; : : :;7, namely 10 to1280 bits, where k is a system parameter. The spreading factor is
SF =5122k
(6.1)
and since k is an integer with a value from 0 to 7, the SF has a value of either 4, 8, 16, 32,64, 128, or 256.
We observe in Figure 6.8 that the ith slot contains sub-slots. First there is the DPDCHcontaining Ndata1 bits of data 1, then comes a DPCCH having NTFCI bits of TFCI, followedby the next DPCCH having NTPC , followed by a second DPDCH having Ndata2 bits of data2, and finally the last DPCCH with Npilot bits of pilot signal. This means that when twoadjacent frames are considered, the pilot bits are placed between data 2 bits and data 1 bits.We also note that, unlike GSM where sounding is executed every 4.6 ms, UTRA sounds theradio channel every 0.667 ms. The greater sounding rate of UTRA is necessary because ofthe higher bit rate services supported by UTRA compared with those in GSM.
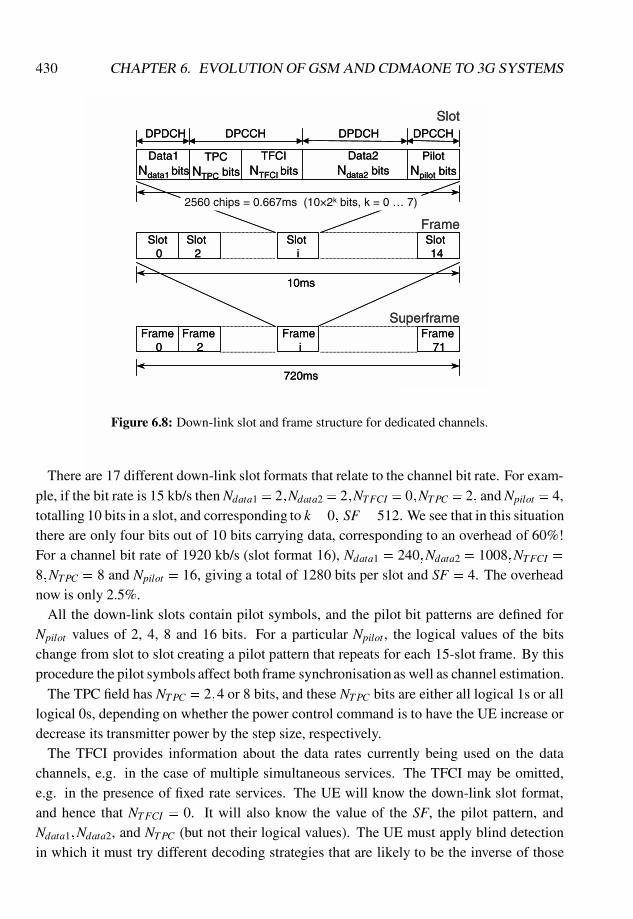
430 CHAPTER 6. EVOLUTION OF GSM AND CDMAONE TO 3G SYSTEMS
TFCINTFCI bits
Data1Ndata1 bits
TPCNTPC bits
Data2Ndata2 bits
DPCCH
Slot 0
Frame 0
Slot 2
Frame 2
Slot i
Frame i
Slot 14
Frame 71
Frame
Superframe
2560 chips = 0.667ms (10×2k bits, k = 0 … 7)
10ms
720ms
Slot
PilotNpilot bits
DPDCH DPDCH DPCCH
TFCINTFCI bits
Data1Ndata1 bits
TPCNTPC bits
Data2Ndata2 bits
DPCCH
Slot 0
Frame 0
Slot 2
Frame 2
Slot i
Frame i
Slot 14
Frame 71
Frame
Superframe
2560 chips = 0.667ms (10×2k bits, k = 0 … 7)
10ms
720ms
Slot
PilotNpilot bits
DPDCH DPDCH DPCCH
Figure 6.8: Down-link slot and frame structure for dedicated channels.
There are 17 different down-link slot formats that relate to the channel bit rate. For exam-ple, if the bit rate is 15 kb/s then Ndata1= 2;Ndata2= 2;NTFCI = 0;NTPC = 2; and Npilot = 4,totalling 10 bits in a slot, and corresponding to k= 0; SF = 512. We see that in this situationthere are only four bits out of 10 bits carrying data, corresponding to an overhead of 60%!For a channel bit rate of 1920 kb/s (slot format 16), Ndata1 = 240;Ndata2 = 1008;NTFCI =
8;NTPC = 8 and Npilot = 16, giving a total of 1280 bits per slot and SF = 4. The overheadnow is only 2.5%.
All the down-link slots contain pilot symbols, and the pilot bit patterns are defined forNpilot values of 2, 4, 8 and 16 bits. For a particular Npilot , the logical values of the bitschange from slot to slot creating a pilot pattern that repeats for each 15-slot frame. By thisprocedure the pilot symbols affect both frame synchronisation as well as channel estimation.
The TPC field has NTPC = 2;4 or 8 bits, and these NTPC bits are either all logical 1s or alllogical 0s, depending on whether the power control command is to have the UE increase ordecrease its transmitter power by the step size, respectively.
The TFCI provides information about the data rates currently being used on the datachannels, e.g. in the case of multiple simultaneous services. The TFCI may be omitted,e.g. in the presence of fixed rate services. The UE will know the down-link slot format,and hence that NTFCI = 0. It will also know the value of the SF, the pilot pattern, andNdata1;Ndata2, and NTPC (but not their logical values). The UE must apply blind detectionin which it must try different decoding strategies that are likely to be the inverse of those
6.3. THE UNIVERSAL MOBILE TELECOMMUNICATION SYSTEM 431
used in conditioning the data. The decoding strategies that provide the lowest bit error rate(BER) is deemed to be the correct one.
We have seen that the DPCCH carries the TFCI, TPC and pilot bits on a time divisionbasis within each slot, while the DPDCH carries data 1 and data 2 also on in a time divisionmode within a slot. Further more, both the DPCCH and DPDCH are multiplexed together.The DPCCH and DPDCH signals are converted from a serial stream to two parallel streams,one called the inphase component and the other the quadrature component. At this pointalthough they are designated as inphase and quadrature components, they are, in fact, of thesame phase. Both bit streams are then spread to 3.84 Mchips/s using the same code, knownas the channelisation code, Cch;SF;n, and SF = 2n. Note that if a bit from the converter is alogical 0, then the code replaces the bit, and if the bit is a logical 1, then the code is inverted.The SF must be chosen so that the chip rate is always 3.84 Mchips/s. As an example, if thecombined DPDCH/DPCCH is 960 kb/s, then the I and Q branches will operate at 480 kb/s,and the SF is 3.84 Mchips/s divided by 480 kb/s, namely 8.
If the required data rate exceeds the capacity of a single DPDCH channel, then additionalDPDCHs can be added. Suppose N DPDCHs are required, then we still need only oneDPCCH, but each DPDCH requires its own channelisation code. The arrangement is shownin Figure 6.9 [24], where the DPCCH is multiplexed with DPDCH1. The absence of anycontrol data on DPDCHi, i = 2;3; : : :;N; means that transmissions are suspended duringthose portions of the slots when DPCCH transmission would normally occur. The down-link slot format for these multicode transmissions is displayed in Figure 6.10 [25].
The so-called inphase and quadrature spread signals from each set of multipliers in Fig-ure 6.9 are applied to adders to create the so-called inphase signal I and quadrature signalQ for multicode transmissions. The Q signal is shifted through 90� degrees so that the Iand Q signals are now really in quadrature, and on adding these signals we have I+ jQ.This resulting signal is scrambled by a code, Cscramb, but before discussing this code wewill describe the channelisation codes.
Channelisation codes Channelisation codes are orthogonal variable spreading factor(OVSF) codes that identify the down-link channel. They are basically Walsh codes of dif-ferent lengths that are able to preserve orthogonality between channels even when they areoperating at different data rates. The OVSF codes are arranged in a tree structure for codeallocation purposes. The OVSF code tree is shown in Figure 6.11. For a spreading factor ofSF = 1 there is a channelisation code Cch;1;0 = (1), i.e. a word of one bit that is a logical 1.For SF = 2, there are two codesCch;1;0 = (1;1) and Cch;2;1 = (1;�1). Doubling the SF to 4gives four codes: Cch;4;0 = (1;1;1;1);Cch;4;1 = (1;1;�1;�1);Cch;4;2 = (1;�1;1;�1) ; andCch;4;3 = (1;�1;�1;1). We observe that Cch;4;0 is Cch;2;0 followed by Cch;2;0, i.e. the Cch;2;0
and its repeat, whereas Cch;4;1 is Cch;2;0 followed by its Cch;2;0 but with its bits inverted. In
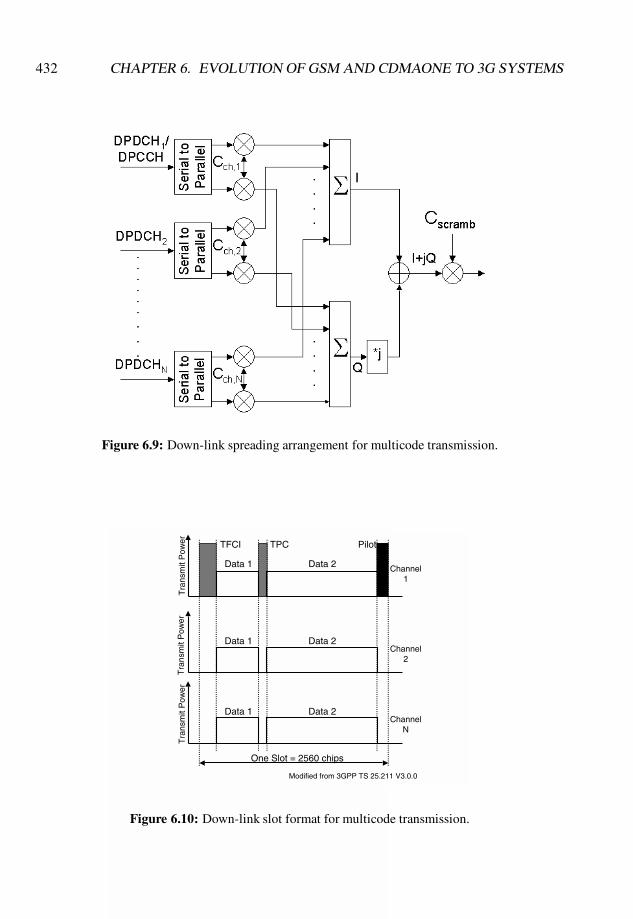
432 CHAPTER 6. EVOLUTION OF GSM AND CDMAONE TO 3G SYSTEMS
Figure 6.9: Down-link spreading arrangement for multicode transmission.
One Slot = 2560 chips
TFCI TPC Pilot
Tra
nsm
it P
ower
Data 1 Data 2
Data 1 Data 2
Data 1 Data 2
Tra
nsm
it P
ower
Tra
nsm
it P
ower
Channel1
Channel2
ChannelN
Modified from 3GPP TS 25.211 V3.0.0
Figure 6.10: Down-link slot format for multicode transmission.
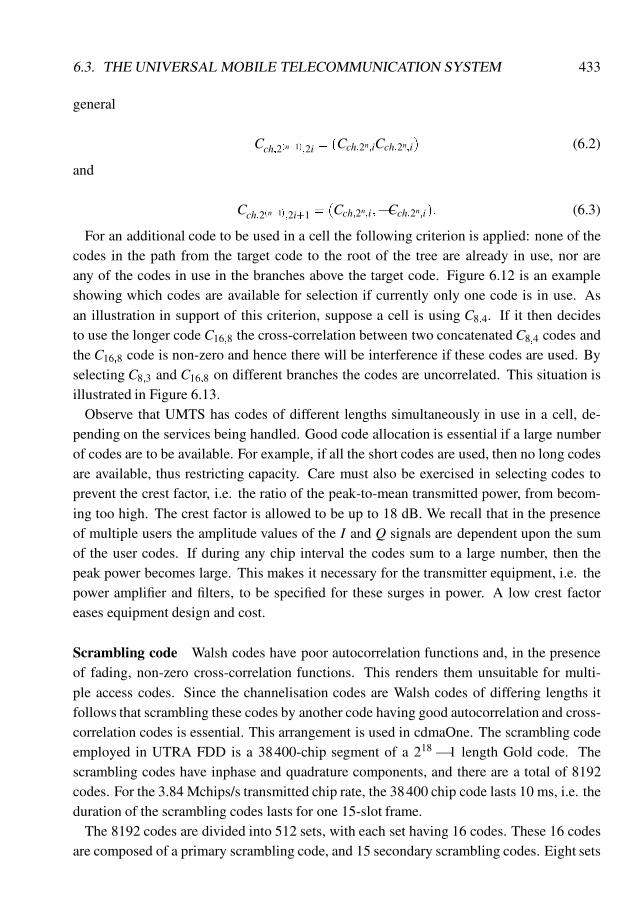
6.3. THE UNIVERSAL MOBILE TELECOMMUNICATION SYSTEM 433
general
Cch;2(n+1);2i = (Cch;2n;iCch;2n;i) (6.2)
and
Cch;2(n+1);2i+1 = (Cch;2n;i;�Cch;2n;i): (6.3)
For an additional code to be used in a cell the following criterion is applied: none of thecodes in the path from the target code to the root of the tree are already in use, nor areany of the codes in use in the branches above the target code. Figure 6.12 is an exampleshowing which codes are available for selection if currently only one code is in use. Asan illustration in support of this criterion, suppose a cell is using C8;4. If it then decidesto use the longer code C16;8 the cross-correlation between two concatenated C8;4 codes andthe C16;8 code is non-zero and hence there will be interference if these codes are used. Byselecting C8;3 and C16;8 on different branches the codes are uncorrelated. This situation isillustrated in Figure 6.13.
Observe that UMTS has codes of different lengths simultaneously in use in a cell, de-pending on the services being handled. Good code allocation is essential if a large numberof codes are to be available. For example, if all the short codes are used, then no long codesare available, thus restricting capacity. Care must also be exercised in selecting codes toprevent the crest factor, i.e. the ratio of the peak-to-mean transmitted power, from becom-ing too high. The crest factor is allowed to be up to 18 dB. We recall that in the presenceof multiple users the amplitude values of the I and Q signals are dependent upon the sumof the user codes. If during any chip interval the codes sum to a large number, then thepeak power becomes large. This makes it necessary for the transmitter equipment, i.e. thepower amplifier and filters, to be specified for these surges in power. A low crest factoreases equipment design and cost.
Scrambling code Walsh codes have poor autocorrelation functions and, in the presenceof fading, non-zero cross-correlation functions. This renders them unsuitable for multi-ple access codes. Since the channelisation codes are Walsh codes of differing lengths itfollows that scrambling these codes by another code having good autocorrelation and cross-correlation codes is essential. This arrangement is used in cdmaOne. The scrambling codeemployed in UTRA FDD is a 38400-chip segment of a 218
� 1 length Gold code. Thescrambling codes have inphase and quadrature components, and there are a total of 8192codes. For the 3.84 Mchips/s transmitted chip rate, the 38400 chip code lasts 10 ms, i.e. theduration of the scrambling codes lasts for one 15-slot frame.
The 8192 codes are divided into 512 sets, with each set having 16 codes. These 16 codesare composed of a primary scrambling code, and 15 secondary scrambling codes. Eight sets
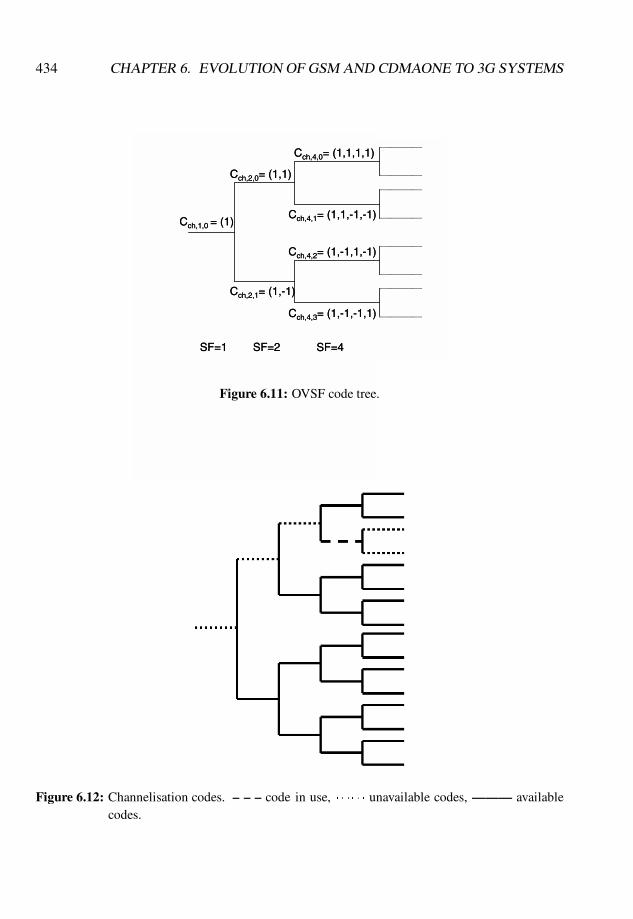
434 CHAPTER 6. EVOLUTION OF GSM AND CDMAONE TO 3G SYSTEMS
Cch,1,0 = (1)
Cch,2,0= (1,1)
Cch,2,1= (1,-1)
Cch,4,0= (1,1,1,1)
Cch,4,2= (1,-1,1,-1)
Cch,4,3= (1,-1,-1,1)
Cch,4,1= (1,1,-1,-1)
SF=1 SF=2 SF=4
Cch,1,0 = (1)
Cch,2,0= (1,1)
Cch,2,1= (1,-1)
Cch,4,0= (1,1,1,1)
Cch,4,2= (1,-1,1,-1)
Cch,4,3= (1,-1,-1,1)
Cch,4,1= (1,1,-1,-1)
SF=1 SF=2 SF=4
Figure 6.11: OVSF code tree.
Figure 6.12: Channelisation codes. – – – code in use, � � �� � � unavailable codes, ——— availablecodes.
6.3. THE UNIVERSAL MOBILE TELECOMMUNICATION SYSTEM 435
c 8,4
c 16,8 -11 -11 -11 -11 -11 -11 -11 -11
-11 -11 -11 -11 -11 -11 -11 -11
c 8,4
11 11 11 11 11 11 11 11
×
Σ of bits ≠ 0 Σ of bits ≠ 0
Σ of bits ≠ 0
c 8,4
c 16,8 -11 -11 -11 -11 -11 -11 -11 -11
-11 -11 -11 -11 -11 -11 -11 -11
c 8,4
11 11 11 11 11 11 11 11
×
Σ of bits ≠ 0 Σ of bits ≠ 0
Σ of bits ≠ 0
c 16,8
c 8,3
-11 -11 -11 -11 -11 -11 -11 -11
11 -1-1 -1-1 11 11 -1-1 -1-1 11
c 8,3
-11 1-1 1-1 -11 -11 1-1 1-1 -11
×
Σ of bits = 0 Σ of bits = 0
Σ of bits = 0
c 16,8
c 8,3
-11 -11 -11 -11 -11 -11 -11 -11
11 -1-1 -1-1 11 11 -1-1 -1-1 11
c 8,3
-11 1-1 1-1 -11 -11 1-1 1-1 -11
×
Σ of bits = 0 Σ of bits = 0
Σ of bits = 0
c 8,3
-11 -11 -11 -11 -11 -11 -11 -11
11 -1-1 -1-1 11 11 -1-1 -1-1 11
c 8,3
-11 1-1 1-1 -11 -11 1-1 1-1 -11
×
Σ of bits = 0 Σ of bits = 0
Σ of bits = 0
Figure 6.13: Code allocation is branch sensitive. (a) Codes C16;8 and C8;4 are on the same branchand must not be used; (b) codes C16;8 and C8;3 are permissible.
are formed (having 8� 16= 128 codes) to give a group of codes, and there are 64 groups.Each cell is allocated only one primary scrambling code. The scrambling code hierarchy isshown in Figure 6.14.
The block diagram for the down-link spreading and modulation is shown in Figure 6.15.The two outputs from the serial-to-parallel converter are multiplied by the channelisationcode, Cch, followed by multiplication by the complex scrambling code Cscramb. The outputof each multiplier is low pass filtered (LPF) by filters having a raised cosine impulse re-sponse with a frequency roll-off of 0.22. They are then multiplied by the quadrature carrierscos(ωct) and sin(ωct) and the quadrature signals added to give the transmitted carrier sig-nal, where ωc is the angular carrier frequency. The arrangement is quadrature phase shiftkeying (QPSK) modulation.
Down-link common physical channels These are: the common pilot channel (CPICH)that provides a common demodulation reference over all or part of a cell; the primary com-mon control physical channel (P-CCPCH) that carries general network information; thesecondary common control physical channel (S-CCPCH) for paging and packet data; the
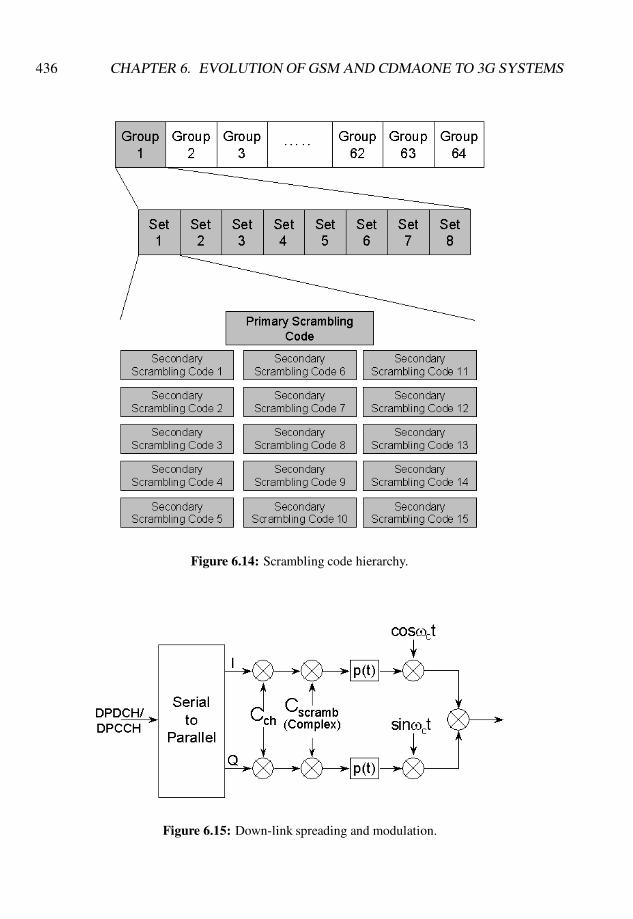
436 CHAPTER 6. EVOLUTION OF GSM AND CDMAONE TO 3G SYSTEMS
Figure 6.14: Scrambling code hierarchy.
Figure 6.15: Down-link spreading and modulation.
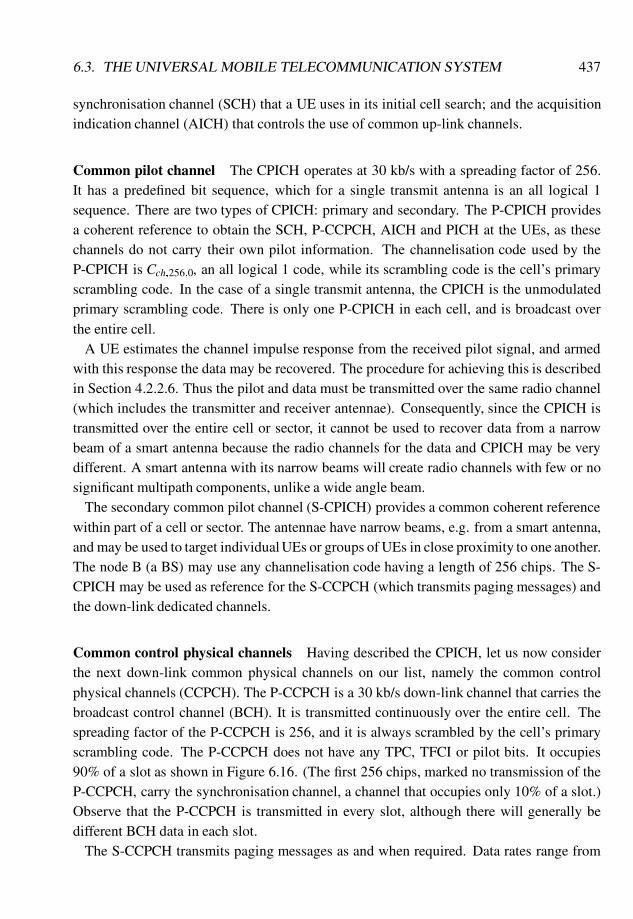
6.3. THE UNIVERSAL MOBILE TELECOMMUNICATION SYSTEM 437
synchronisation channel (SCH) that a UE uses in its initial cell search; and the acquisitionindication channel (AICH) that controls the use of common up-link channels.
Common pilot channel The CPICH operates at 30 kb/s with a spreading factor of 256.It has a predefined bit sequence, which for a single transmit antenna is an all logical 1sequence. There are two types of CPICH: primary and secondary. The P-CPICH providesa coherent reference to obtain the SCH, P-CCPCH, AICH and PICH at the UEs, as thesechannels do not carry their own pilot information. The channelisation code used by theP-CPICH is Cch;256;0, an all logical 1 code, while its scrambling code is the cell’s primaryscrambling code. In the case of a single transmit antenna, the CPICH is the unmodulatedprimary scrambling code. There is only one P-CPICH in each cell, and is broadcast overthe entire cell.
A UE estimates the channel impulse response from the received pilot signal, and armedwith this response the data may be recovered. The procedure for achieving this is describedin Section 4.2.2.6. Thus the pilot and data must be transmitted over the same radio channel(which includes the transmitter and receiver antennae). Consequently, since the CPICH istransmitted over the entire cell or sector, it cannot be used to recover data from a narrowbeam of a smart antenna because the radio channels for the data and CPICH may be verydifferent. A smart antenna with its narrow beams will create radio channels with few or nosignificant multipath components, unlike a wide angle beam.
The secondary common pilot channel (S-CPICH) provides a common coherent referencewithin part of a cell or sector. The antennae have narrow beams, e.g. from a smart antenna,and may be used to target individual UEs or groups of UEs in close proximity to one another.The node B (a BS) may use any channelisation code having a length of 256 chips. The S-CPICH may be used as reference for the S-CCPCH (which transmits paging messages) andthe down-link dedicated channels.
Common control physical channels Having described the CPICH, let us now considerthe next down-link common physical channels on our list, namely the common controlphysical channels (CCPCH). The P-CCPCH is a 30 kb/s down-link channel that carries thebroadcast control channel (BCH). It is transmitted continuously over the entire cell. Thespreading factor of the P-CCPCH is 256, and it is always scrambled by the cell’s primaryscrambling code. The P-CCPCH does not have any TPC, TFCI or pilot bits. It occupies90% of a slot as shown in Figure 6.16. (The first 256 chips, marked no transmission of theP-CCPCH, carry the synchronisation channel, a channel that occupies only 10% of a slot.)Observe that the P-CCPCH is transmitted in every slot, although there will generally bedifferent BCH data in each slot.
The S-CCPCH transmits paging messages as and when required. Data rates range from
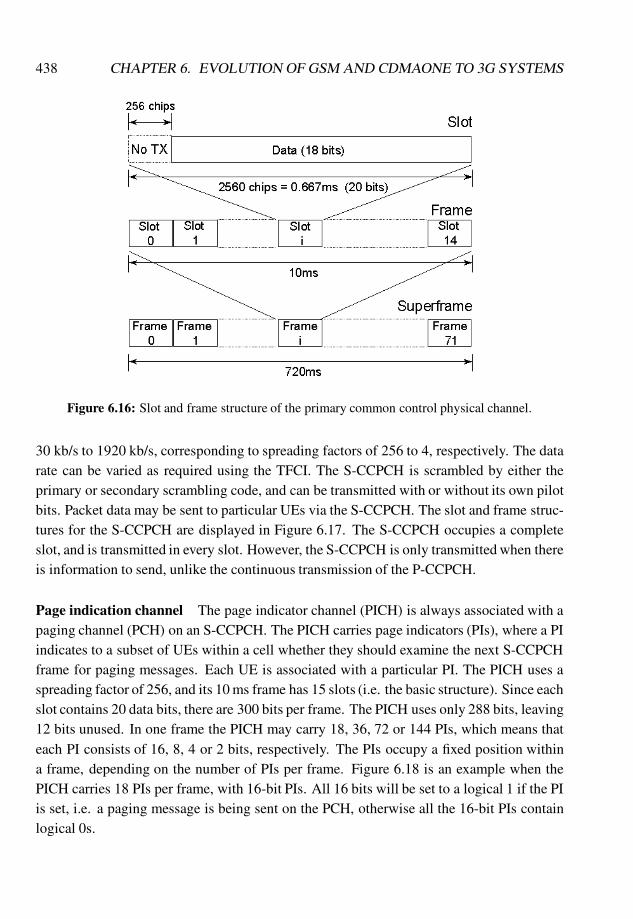
438 CHAPTER 6. EVOLUTION OF GSM AND CDMAONE TO 3G SYSTEMS
Figure 6.16: Slot and frame structure of the primary common control physical channel.
30 kb/s to 1920 kb/s, corresponding to spreading factors of 256 to 4, respectively. The datarate can be varied as required using the TFCI. The S-CCPCH is scrambled by either theprimary or secondary scrambling code, and can be transmitted with or without its own pilotbits. Packet data may be sent to particular UEs via the S-CCPCH. The slot and frame struc-tures for the S-CCPCH are displayed in Figure 6.17. The S-CCPCH occupies a completeslot, and is transmitted in every slot. However, the S-CCPCH is only transmitted when thereis information to send, unlike the continuous transmission of the P-CCPCH.
Page indication channel The page indicator channel (PICH) is always associated with apaging channel (PCH) on an S-CCPCH. The PICH carries page indicators (PIs), where a PIindicates to a subset of UEs within a cell whether they should examine the next S-CCPCHframe for paging messages. Each UE is associated with a particular PI. The PICH uses aspreading factor of 256, and its 10 ms frame has 15 slots (i.e. the basic structure). Since eachslot contains 20 data bits, there are 300 bits per frame. The PICH uses only 288 bits, leaving12 bits unused. In one frame the PICH may carry 18, 36, 72 or 144 PIs, which means thateach PI consists of 16, 8, 4 or 2 bits, respectively. The PIs occupy a fixed position withina frame, depending on the number of PIs per frame. Figure 6.18 is an example when thePICH carries 18 PIs per frame, with 16-bit PIs. All 16 bits will be set to a logical 1 if the PIis set, i.e. a paging message is being sent on the PCH, otherwise all the 16-bit PIs containlogical 0s.
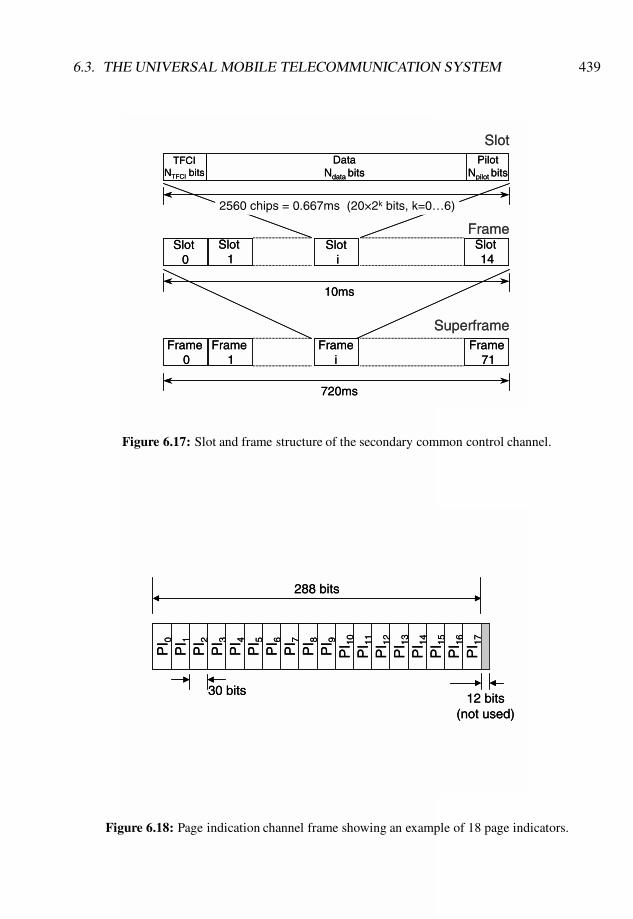
6.3. THE UNIVERSAL MOBILE TELECOMMUNICATION SYSTEM 439
DataNdata bits
Slot 0
Frame 0
Slot 1
Frame 1
Slot i
Framei
Slot 14
Frame 71
Frame
Superframe
2560 chips = 0.667ms (20×2k bits, k=0…6)
10ms
720ms
SlotTFCI
NTFCI bitsPilot
Npilot bitsData
Ndata bits
Slot 0
Frame 0
Slot 1
Frame 1
Slot i
Framei
Slot 14
Frame 71
Frame
Superframe
2560 chips = 0.667ms (20×2k bits, k=0…6)
10ms
720ms
SlotTFCI
NTFCI bitsPilot
Npilot bits
Figure 6.17: Slot and frame structure of the secondary common control channel.
PI 0
PI 1
PI 2
PI 3
PI 4
PI 5
PI 6
PI 7
PI 8
PI 9
PI 1
0
PI 1
1
PI 1
2
PI 1
3
PI 1
4
PI 1
5
PI 1
6
PI 1
7
288 bits
30 bits12 bits
(not used)
PI 0
PI 1
PI 2
PI 3
PI 4
PI 5
PI 6
PI 7
PI 8
PI 9
PI 1
0
PI 1
1
PI 1
2
PI 1
3
PI 1
4
PI 1
5
PI 1
6
PI 1
7
288 bits
30 bits12 bits
(not used)
Figure 6.18: Page indication channel frame showing an example of 18 page indicators.
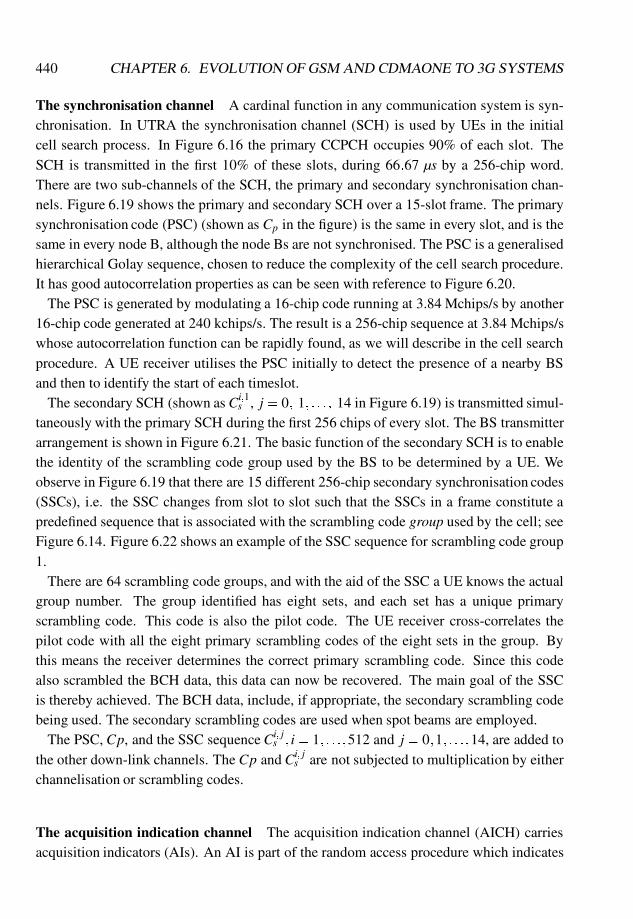
440 CHAPTER 6. EVOLUTION OF GSM AND CDMAONE TO 3G SYSTEMS
The synchronisation channel A cardinal function in any communication system is syn-chronisation. In UTRA the synchronisation channel (SCH) is used by UEs in the initialcell search process. In Figure 6.16 the primary CCPCH occupies 90% of each slot. TheSCH is transmitted in the first 10% of these slots, during 66:67 µs by a 256-chip word.There are two sub-channels of the SCH, the primary and secondary synchronisation chan-nels. Figure 6.19 shows the primary and secondary SCH over a 15-slot frame. The primarysynchronisation code (PSC) (shown as Cp in the figure) is the same in every slot, and is thesame in every node B, although the node Bs are not synchronised. The PSC is a generalisedhierarchical Golay sequence, chosen to reduce the complexity of the cell search procedure.It has good autocorrelation properties as can be seen with reference to Figure 6.20.
The PSC is generated by modulating a 16-chip code running at 3.84 Mchips/s by another16-chip code generated at 240 kchips/s. The result is a 256-chip sequence at 3.84 Mchips/swhose autocorrelation function can be rapidly found, as we will describe in the cell searchprocedure. A UE receiver utilises the PSC initially to detect the presence of a nearby BSand then to identify the start of each timeslot.
The secondary SCH (shown as Ci;1s , j = 0; 1; : : :; 14 in Figure 6.19) is transmitted simul-
taneously with the primary SCH during the first 256 chips of every slot. The BS transmitterarrangement is shown in Figure 6.21. The basic function of the secondary SCH is to enablethe identity of the scrambling code group used by the BS to be determined by a UE. Weobserve in Figure 6.19 that there are 15 different 256-chip secondary synchronisation codes(SSCs), i.e. the SSC changes from slot to slot such that the SSCs in a frame constitute apredefined sequence that is associated with the scrambling code group used by the cell; seeFigure 6.14. Figure 6.22 shows an example of the SSC sequence for scrambling code group1.
There are 64 scrambling code groups, and with the aid of the SSC a UE knows the actualgroup number. The group identified has eight sets, and each set has a unique primaryscrambling code. This code is also the pilot code. The UE receiver cross-correlates thepilot code with all the eight primary scrambling codes of the eight sets in the group. Bythis means the receiver determines the correct primary scrambling code. Since this codealso scrambled the BCH data, this data can now be recovered. The main goal of the SSCis thereby achieved. The BCH data, include, if appropriate, the secondary scrambling codebeing used. The secondary scrambling codes are used when spot beams are employed.
The PSC, Cp, and the SSC sequence Ci; js ; i= 1; : : :;512 and j = 0;1; : : :;14, are added to
the other down-link channels. The Cp and Ci; js are not subjected to multiplication by either
channelisation or scrambling codes.
The acquisition indication channel The acquisition indication channel (AICH) carriesacquisition indicators (AIs). An AI is part of the random access procedure which indicates
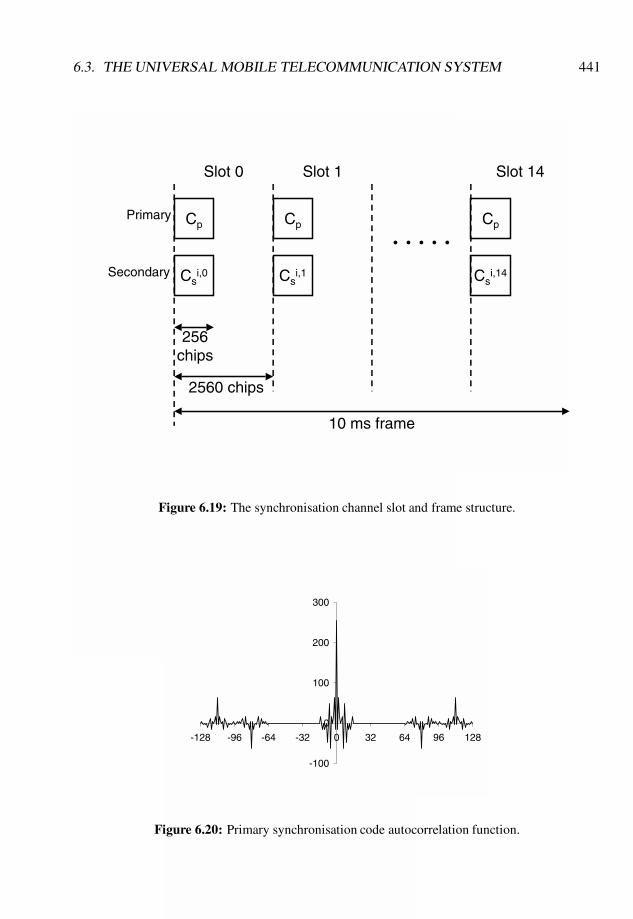
6.3. THE UNIVERSAL MOBILE TELECOMMUNICATION SYSTEM 441
Cp Cp Cp
Csi,0 Cs
i,1 Csi,14
Slot 0 Slot 1 Slot 14
· · · · ·
256 chips
2560 chips
10 ms frame
Primary
Secondary
Figure 6.19: The synchronisation channel slot and frame structure.
-100
0
100
200
300
-128 -96 -64 -32 0 32 64 96 128
Figure 6.20: Primary synchronisation code autocorrelation function.
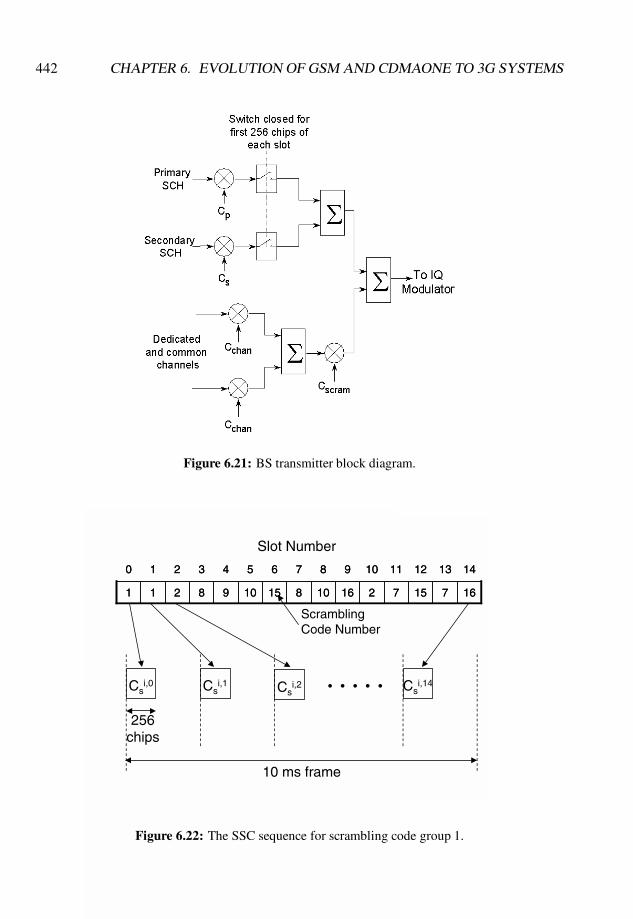
442 CHAPTER 6. EVOLUTION OF GSM AND CDMAONE TO 3G SYSTEMS
Figure 6.21: BS transmitter block diagram.
167157216108151098211
14131211109876543210
167157216108151098211
14131211109876543210
Slot Number
Csi,0 Cs
i,1 Csi,14· · · · ·
256 chips
10 ms frame
Csi,2
Scrambling Code Number
Figure 6.22: The SSC sequence for scrambling code group 1.
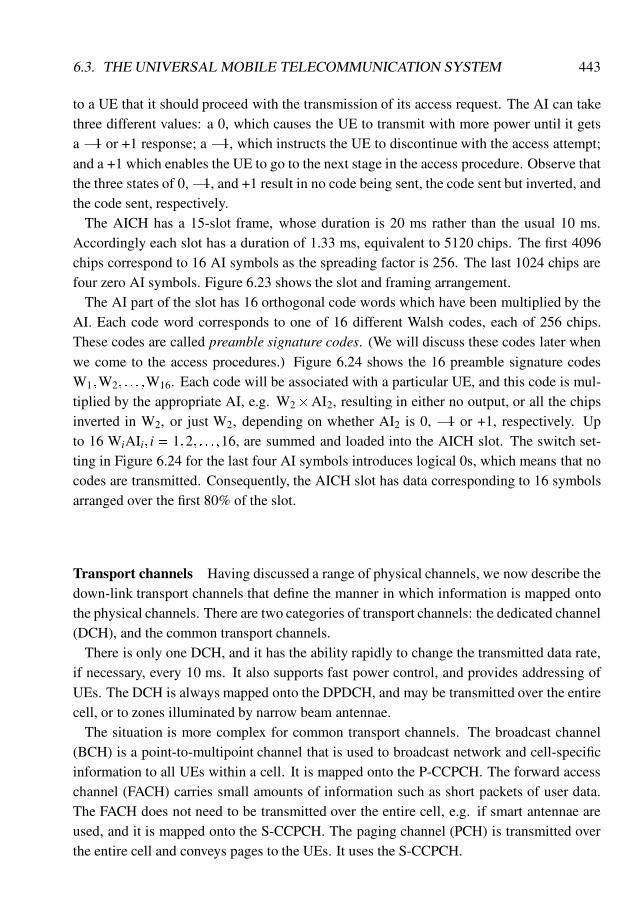
6.3. THE UNIVERSAL MOBILE TELECOMMUNICATION SYSTEM 443
to a UE that it should proceed with the transmission of its access request. The AI can takethree different values: a 0, which causes the UE to transmit with more power until it getsa �1 or +1 response; a �1, which instructs the UE to discontinue with the access attempt;and a +1 which enables the UE to go to the next stage in the access procedure. Observe thatthe three states of 0, �1, and +1 result in no code being sent, the code sent but inverted, andthe code sent, respectively.
The AICH has a 15-slot frame, whose duration is 20 ms rather than the usual 10 ms.Accordingly each slot has a duration of 1.33 ms, equivalent to 5120 chips. The first 4096chips correspond to 16 AI symbols as the spreading factor is 256. The last 1024 chips arefour zero AI symbols. Figure 6.23 shows the slot and framing arrangement.
The AI part of the slot has 16 orthogonal code words which have been multiplied by theAI. Each code word corresponds to one of 16 different Walsh codes, each of 256 chips.These codes are called preamble signature codes. (We will discuss these codes later whenwe come to the access procedures.) Figure 6.24 shows the 16 preamble signature codesW1;W2; : : :;W16. Each code will be associated with a particular UE, and this code is mul-tiplied by the appropriate AI, e.g. W2�AI2, resulting in either no output, or all the chipsinverted in W2, or just W2, depending on whether AI2 is 0, �1 or +1, respectively. Upto 16 WiAIi; i = 1;2; : : :;16, are summed and loaded into the AICH slot. The switch set-ting in Figure 6.24 for the last four AI symbols introduces logical 0s, which means that nocodes are transmitted. Consequently, the AICH slot has data corresponding to 16 symbolsarranged over the first 80% of the slot.
Transport channels Having discussed a range of physical channels, we now describe thedown-link transport channels that define the manner in which information is mapped ontothe physical channels. There are two categories of transport channels: the dedicated channel(DCH), and the common transport channels.
There is only one DCH, and it has the ability rapidly to change the transmitted data rate,if necessary, every 10 ms. It also supports fast power control, and provides addressing ofUEs. The DCH is always mapped onto the DPDCH, and may be transmitted over the entirecell, or to zones illuminated by narrow beam antennae.
The situation is more complex for common transport channels. The broadcast channel(BCH) is a point-to-multipoint channel that is used to broadcast network and cell-specificinformation to all UEs within a cell. It is mapped onto the P-CCPCH. The forward accesschannel (FACH) carries small amounts of information such as short packets of user data.The FACH does not need to be transmitted over the entire cell, e.g. if smart antennae areused, and it is mapped onto the S-CCPCH. The paging channel (PCH) is transmitted overthe entire cell and conveys pages to the UEs. It uses the S-CCPCH.
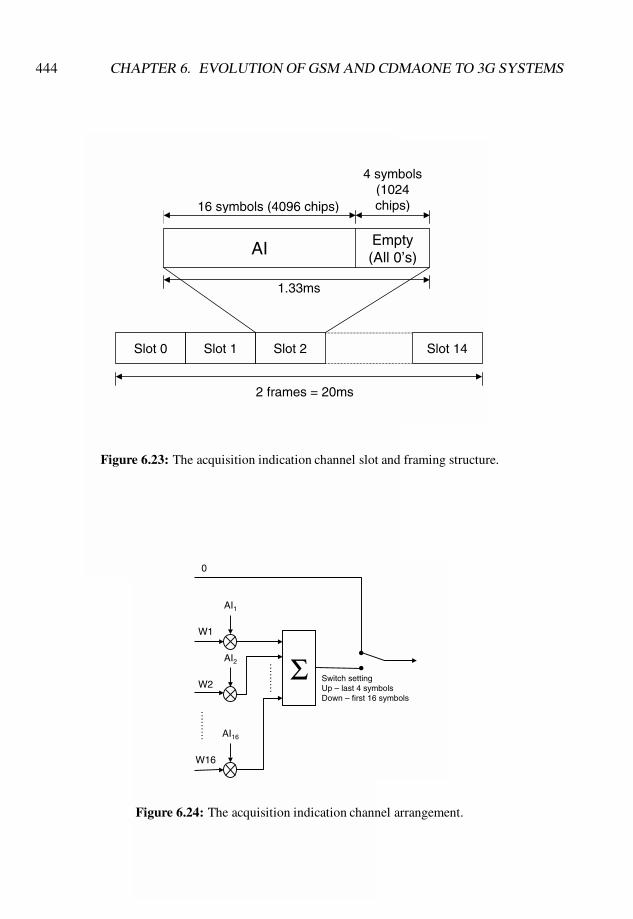
444 CHAPTER 6. EVOLUTION OF GSM AND CDMAONE TO 3G SYSTEMS
AI Empty(All 0’s)
Slot 0
16 symbols (4096 chips)
4 symbols (1024 chips)
Slot 1 Slot 2 Slot 14
2 frames = 20ms
1.33ms
Figure 6.23: The acquisition indication channel slot and framing structure.
W1
W2
W16
……
…
Σ
0
AI1
AI2
AI16
……
…
Switch settingUp – last 4 symbolsDown – first 16 symbols
Figure 6.24: The acquisition indication channel arrangement.
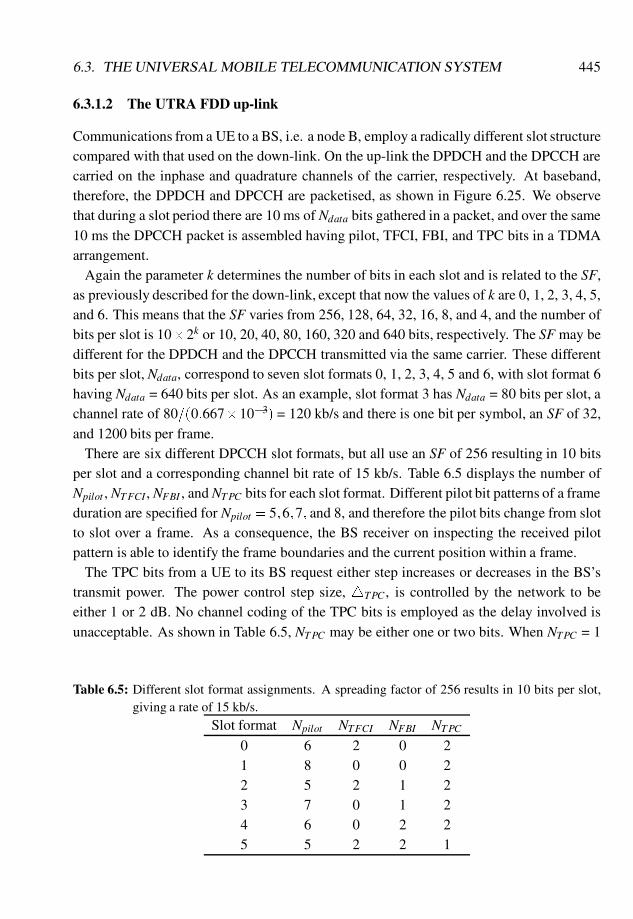
6.3. THE UNIVERSAL MOBILE TELECOMMUNICATION SYSTEM 445
6.3.1.2 The UTRA FDD up-link
Communications from a UE to a BS, i.e. a node B, employ a radically different slot structurecompared with that used on the down-link. On the up-link the DPDCH and the DPCCH arecarried on the inphase and quadrature channels of the carrier, respectively. At baseband,therefore, the DPDCH and DPCCH are packetised, as shown in Figure 6.25. We observethat during a slot period there are 10 ms of Ndata bits gathered in a packet, and over the same10 ms the DPCCH packet is assembled having pilot, TFCI, FBI, and TPC bits in a TDMAarrangement.
Again the parameter k determines the number of bits in each slot and is related to the SF,as previously described for the down-link, except that now the values of k are 0, 1, 2, 3, 4, 5,and 6. This means that the SF varies from 256, 128, 64, 32, 16, 8, and 4, and the number ofbits per slot is 10�2k or 10, 20, 40, 80, 160, 320 and 640 bits, respectively. The SF may bedifferent for the DPDCH and the DPCCH transmitted via the same carrier. These differentbits per slot, Ndata, correspond to seven slot formats 0, 1, 2, 3, 4, 5 and 6, with slot format 6having Ndata = 640 bits per slot. As an example, slot format 3 has Ndata = 80 bits per slot, achannel rate of 80=(0:667�10�3) = 120 kb/s and there is one bit per symbol, an SF of 32,and 1200 bits per frame.
There are six different DPCCH slot formats, but all use an SF of 256 resulting in 10 bitsper slot and a corresponding channel bit rate of 15 kb/s. Table 6.5 displays the number ofNpilot , NTFCI , NFBI , and NTPC bits for each slot format. Different pilot bit patterns of a frameduration are specified for Npilot = 5;6;7; and 8, and therefore the pilot bits change from slotto slot over a frame. As a consequence, the BS receiver on inspecting the received pilotpattern is able to identify the frame boundaries and the current position within a frame.
The TPC bits from a UE to its BS request either step increases or decreases in the BS’stransmit power. The power control step size, 4TPC , is controlled by the network to beeither 1 or 2 dB. No channel coding of the TPC bits is employed as the delay involved isunacceptable. As shown in Table 6.5, NTPC may be either one or two bits. When NTPC = 1
Table 6.5: Different slot format assignments. A spreading factor of 256 results in 10 bits per slot,giving a rate of 15 kb/s.
Slot format Npilot NTFCI NFBI NTPC
0 6 2 0 21 8 0 0 22 5 2 1 23 7 0 1 24 6 0 2 25 5 2 2 1
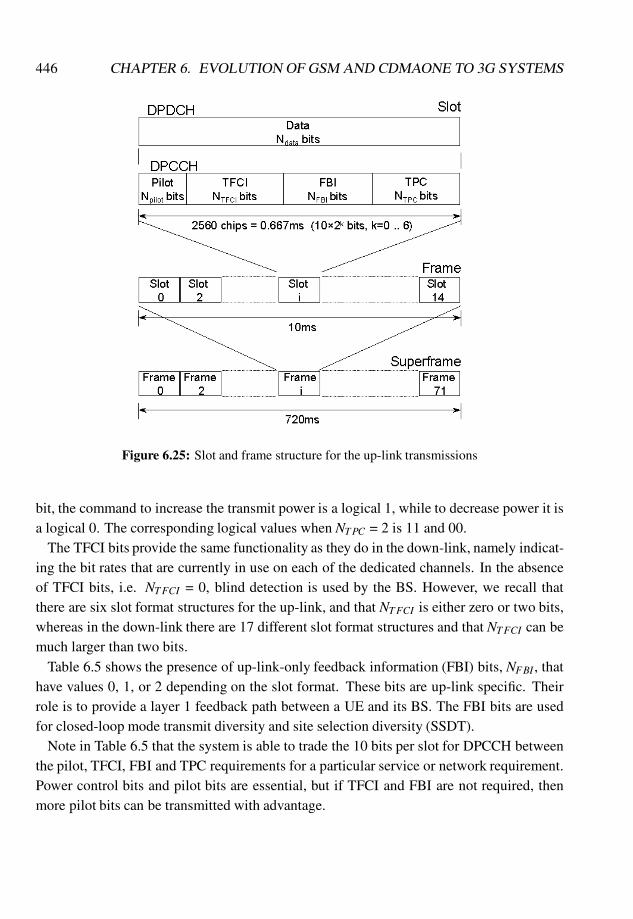
446 CHAPTER 6. EVOLUTION OF GSM AND CDMAONE TO 3G SYSTEMS
Figure 6.25: Slot and frame structure for the up-link transmissions
bit, the command to increase the transmit power is a logical 1, while to decrease power it isa logical 0. The corresponding logical values when NTPC = 2 is 11 and 00.
The TFCI bits provide the same functionality as they do in the down-link, namely indicat-ing the bit rates that are currently in use on each of the dedicated channels. In the absenceof TFCI bits, i.e. NTFCI = 0, blind detection is used by the BS. However, we recall thatthere are six slot format structures for the up-link, and that NTFCI is either zero or two bits,whereas in the down-link there are 17 different slot format structures and that NTFCI can bemuch larger than two bits.
Table 6.5 shows the presence of up-link-only feedback information (FBI) bits, NFBI , thathave values 0, 1, or 2 depending on the slot format. These bits are up-link specific. Theirrole is to provide a layer 1 feedback path between a UE and its BS. The FBI bits are usedfor closed-loop mode transmit diversity and site selection diversity (SSDT).
Note in Table 6.5 that the system is able to trade the 10 bits per slot for DPCCH betweenthe pilot, TFCI, FBI and TPC requirements for a particular service or network requirement.Power control bits and pilot bits are essential, but if TFCI and FBI are not required, thenmore pilot bits can be transmitted with advantage.
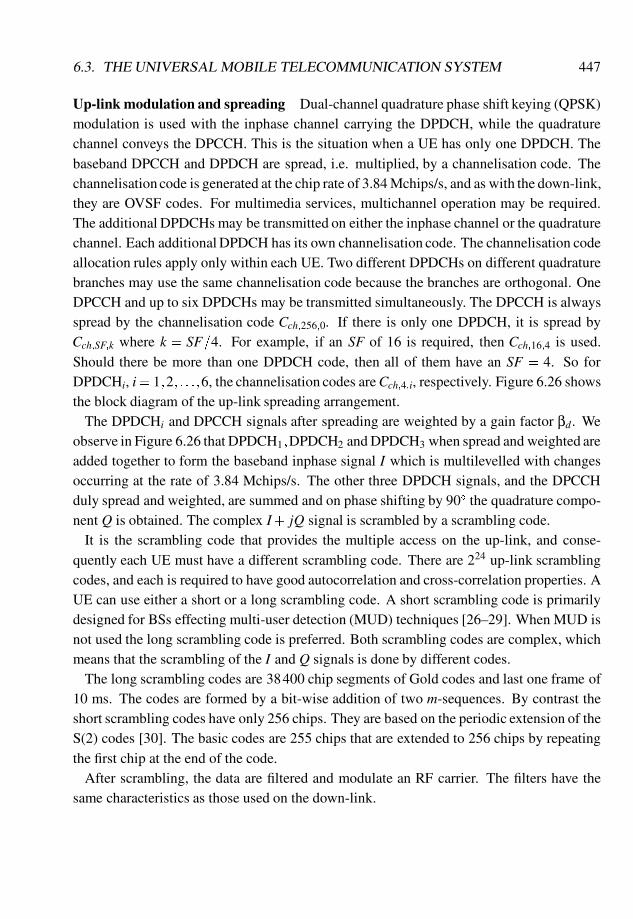
6.3. THE UNIVERSAL MOBILE TELECOMMUNICATION SYSTEM 447
Up-link modulation and spreading Dual-channel quadrature phase shift keying (QPSK)modulation is used with the inphase channel carrying the DPDCH, while the quadraturechannel conveys the DPCCH. This is the situation when a UE has only one DPDCH. Thebaseband DPCCH and DPDCH are spread, i.e. multiplied, by a channelisation code. Thechannelisation code is generated at the chip rate of 3.84 Mchips/s, and as with the down-link,they are OVSF codes. For multimedia services, multichannel operation may be required.The additional DPDCHs may be transmitted on either the inphase channel or the quadraturechannel. Each additional DPDCH has its own channelisation code. The channelisation codeallocation rules apply only within each UE. Two different DPDCHs on different quadraturebranches may use the same channelisation code because the branches are orthogonal. OneDPCCH and up to six DPDCHs may be transmitted simultaneously. The DPCCH is alwaysspread by the channelisation code Cch;256;0. If there is only one DPDCH, it is spread byCch;SF;k where k = SF=4. For example, if an SF of 16 is required, then Cch;16;4 is used.Should there be more than one DPDCH code, then all of them have an SF = 4. So forDPDCHi, i= 1;2; : : :;6, the channelisation codes areCch;4;i, respectively. Figure 6.26 showsthe block diagram of the up-link spreading arrangement.
The DPDCHi and DPCCH signals after spreading are weighted by a gain factor βd. Weobserve in Figure 6.26 that DPDCH1;DPDCH2 and DPDCH3 when spread and weighted areadded together to form the baseband inphase signal I which is multilevelled with changesoccurring at the rate of 3.84 Mchips/s. The other three DPDCH signals, and the DPCCHduly spread and weighted, are summed and on phase shifting by 90� the quadrature compo-nent Q is obtained. The complex I+ jQ signal is scrambled by a scrambling code.
It is the scrambling code that provides the multiple access on the up-link, and conse-quently each UE must have a different scrambling code. There are 224 up-link scramblingcodes, and each is required to have good autocorrelation and cross-correlation properties. AUE can use either a short or a long scrambling code. A short scrambling code is primarilydesigned for BSs effecting multi-user detection (MUD) techniques [26–29]. When MUD isnot used the long scrambling code is preferred. Both scrambling codes are complex, whichmeans that the scrambling of the I and Q signals is done by different codes.
The long scrambling codes are 38400 chip segments of Gold codes and last one frame of10 ms. The codes are formed by a bit-wise addition of two m-sequences. By contrast theshort scrambling codes have only 256 chips. They are based on the periodic extension of theS(2) codes [30]. The basic codes are 255 chips that are extended to 256 chips by repeatingthe first chip at the end of the code.
After scrambling, the data are filtered and modulate an RF carrier. The filters have thesame characteristics as those used on the down-link.
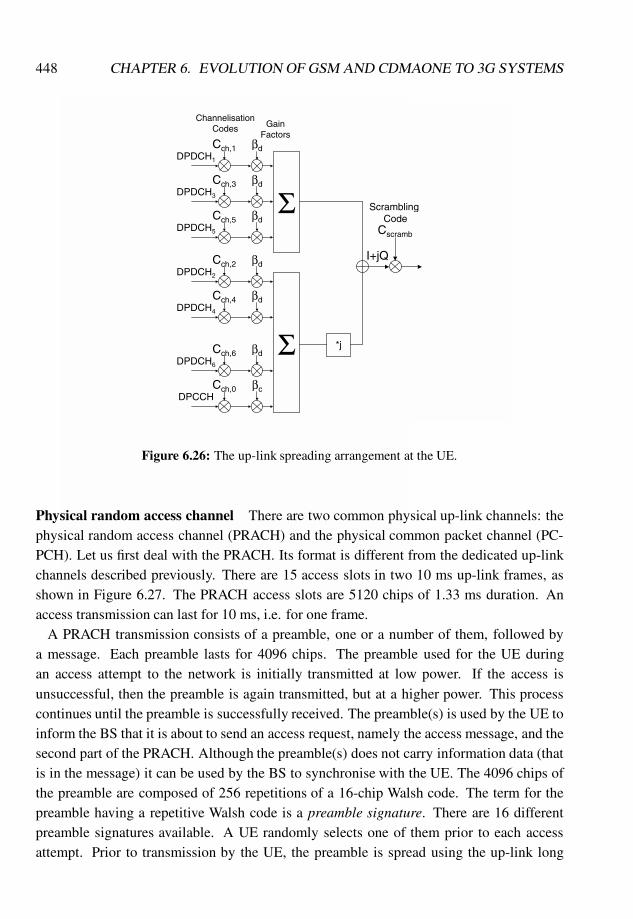
448 CHAPTER 6. EVOLUTION OF GSM AND CDMAONE TO 3G SYSTEMS
DPDCH1
Cch,1 βd
DPDCH3
Cch,3 βd
DPDCH5
Cch,5 βdΣ
ChannelisationCodes Gain
Factors
DPDCH2
Cch,2 βd
DPDCH4
Cch,4 βd
DPCCHCch,0 βc
ΣDPDCH6
Cch,6 βd*j
I+jQ
Cscramb
Scrambling Code
Figure 6.26: The up-link spreading arrangement at the UE.
Physical random access channel There are two common physical up-link channels: thephysical random access channel (PRACH) and the physical common packet channel (PC-PCH). Let us first deal with the PRACH. Its format is different from the dedicated up-linkchannels described previously. There are 15 access slots in two 10 ms up-link frames, asshown in Figure 6.27. The PRACH access slots are 5120 chips of 1.33 ms duration. Anaccess transmission can last for 10 ms, i.e. for one frame.
A PRACH transmission consists of a preamble, one or a number of them, followed bya message. Each preamble lasts for 4096 chips. The preamble used for the UE duringan access attempt to the network is initially transmitted at low power. If the access isunsuccessful, then the preamble is again transmitted, but at a higher power. This processcontinues until the preamble is successfully received. The preamble(s) is used by the UE toinform the BS that it is about to send an access request, namely the access message, and thesecond part of the PRACH. Although the preamble(s) does not carry information data (thatis in the message) it can be used by the BS to synchronise with the UE. The 4096 chips ofthe preamble are composed of 256 repetitions of a 16-chip Walsh code. The term for thepreamble having a repetitive Walsh code is a preamble signature. There are 16 differentpreamble signatures available. A UE randomly selects one of them prior to each accessattempt. Prior to transmission by the UE, the preamble is spread using the up-link long
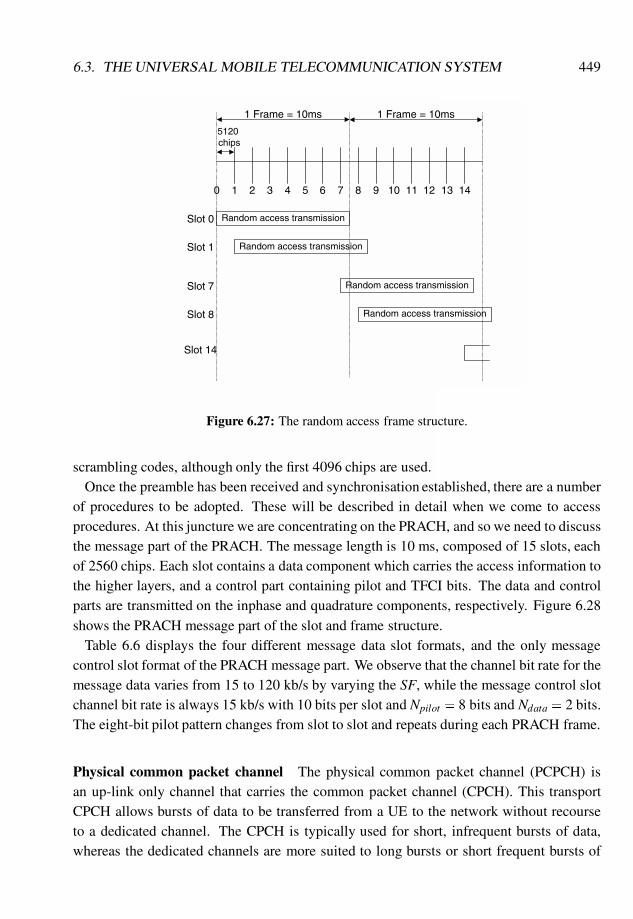
6.3. THE UNIVERSAL MOBILE TELECOMMUNICATION SYSTEM 449
1 Frame = 10ms 1 Frame = 10ms
5120 chips
0 1 2 3 4 5 6 7 8 9 10 11 12 13 14
Random access transmissionSlot 0
Random access transmissionSlot 1
Random access transmission
Random access transmission
Slot 7
Slot 8
Slot 14
Figure 6.27: The random access frame structure.
scrambling codes, although only the first 4096 chips are used.Once the preamble has been received and synchronisation established, there are a number
of procedures to be adopted. These will be described in detail when we come to accessprocedures. At this juncture we are concentrating on the PRACH, and so we need to discussthe message part of the PRACH. The message length is 10 ms, composed of 15 slots, eachof 2560 chips. Each slot contains a data component which carries the access information tothe higher layers, and a control part containing pilot and TFCI bits. The data and controlparts are transmitted on the inphase and quadrature components, respectively. Figure 6.28shows the PRACH message part of the slot and frame structure.
Table 6.6 displays the four different message data slot formats, and the only messagecontrol slot format of the PRACH message part. We observe that the channel bit rate for themessage data varies from 15 to 120 kb/s by varying the SF, while the message control slotchannel bit rate is always 15 kb/s with 10 bits per slot and Npilot = 8 bits and Ndata = 2 bits.The eight-bit pilot pattern changes from slot to slot and repeats during each PRACH frame.
Physical common packet channel The physical common packet channel (PCPCH) isan up-link only channel that carries the common packet channel (CPCH). This transportCPCH allows bursts of data to be transferred from a UE to the network without recourseto a dedicated channel. The CPCH is typically used for short, infrequent bursts of data,whereas the dedicated channels are more suited to long bursts or short frequent bursts of
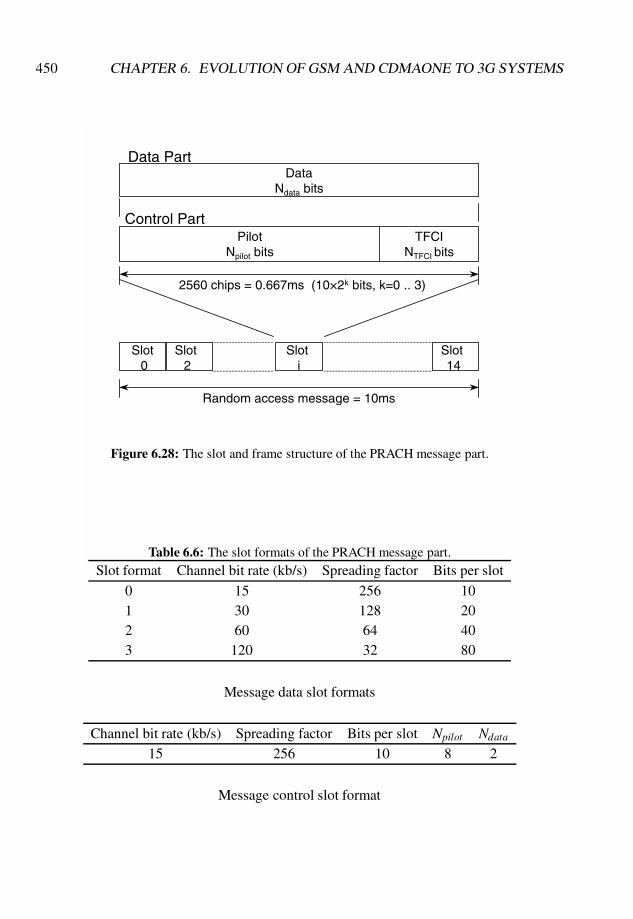
450 CHAPTER 6. EVOLUTION OF GSM AND CDMAONE TO 3G SYSTEMS
DataNdata bits
PilotNpilot bits
TFCINTFCI bits
Data Part
Slot 0
Slot 2
Slot i
Slot 14
2560 chips = 0.667ms (10×2k bits, k=0 .. 3)
Random access message = 10ms
Control Part
Figure 6.28: The slot and frame structure of the PRACH message part.
Table 6.6: The slot formats of the PRACH message part.Slot format Channel bit rate (kb/s) Spreading factor Bits per slot
0 15 256 101 30 128 202 60 64 403 120 32 80
Message data slot formats
Channel bit rate (kb/s) Spreading factor Bits per slot Npilot Ndata
15 256 10 8 2
Message control slot format
6.3. THE UNIVERSAL MOBILE TELECOMMUNICATION SYSTEM 451
traffic.The PCPCH transmissions are closed-loop power controlled. This is achieved by utilising
the PCPCH to carry power control information during the packet transmission to control thetransmit power of the BS, and the down-link DPCCH to adjust the transmit power of theUE.
The PCPCH is similar to the PRACH, but offers a higher data capacity. The PCPCH hasfour parts: an access preamble, a collision detection preamble, a power control preamble,and the message data. The access preamble, like that for the PRACH, indicates to the BSthat the UE seeks to commence packet transmission on the PCPCH. The preamble consistsof a preamble signature (one of a possible 16) modulated by a preamble scrambling code.These preamble signatures are identical to those used on the PRACH, while the preamblescrambling codes are 4096-chip codes that are similar to those used by the PRACH codes.A UE transmits an access preamble, and if this is successfully received it will transmit nomore. However, it may be necessary to transmit a number of access preambles, each at ahigher power level, until one is correctly received, or the access attempt is aborted.
Once an access preamble attempt is completed, the UE transmits the collision detectionpreamble. This is only transmitted once, and its function is to inform other UEs not totransmit their packets on the same PCPCH at this time. The collision detection preamble issimilar to the access preamble, consisting of a signature and a scrambling code.
After the collision detection preamble has been sent the UE transmits a power controlpreamble. This is a DPCCH that contains only the pilot, FBI and TPC bits. The BS usesthis PDPCCH to measure the power received from the UE, and in addition, the DPCCHenables the UE to control the power of the associated down-link DPCCH. The power controlpreamble lasts for 10 ms.
The last part of the PCPCH is the message part. This may consist of one or a numberof 10 ms frames, each consisting of 15 slots. Each slot carries a DPCCH and a DPDCH,transmitted on quadrature arms of the carrier. The DPDCH can use any spreading factorbetween 4 and 256, but the DPCCH always uses a spreading factor of 256.
The four parts of PCPCH are displayed in Figure 6.29.
6.3.1.3 System procedures
Cell search procedure The cell search is initiated each time a UE is switched on, or if aUE loses contact with the network. The process is divided into three steps. The first is forthe UE to achieve slot synchronisation. The UE searches for the primary synchronisationcode (PSC) using a correlator. This code is the same for all cells in the network. Referringto Figure 6.19, we observe that the PSC (shown as Cp) is transmitted at the beginning ofevery slot (for 10% of the slot). A peak at the output of the PSC correlator enables thecommencement of the next slot to be known. We recall that the PSC is produced by taking
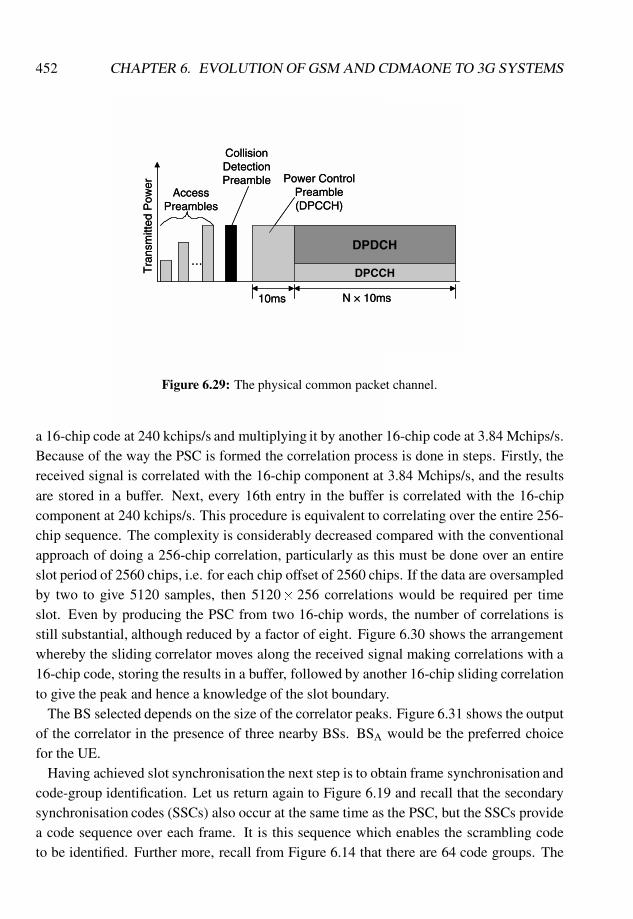
452 CHAPTER 6. EVOLUTION OF GSM AND CDMAONE TO 3G SYSTEMS
…
Access Preambles
Collision Detection Preamble Power Control
Preamble (DPCCH)
DPCCH
DPDCH
10ms N × 10ms
Tra
nsm
itted
Pow
er
…
Access Preambles
Collision Detection Preamble Power Control
Preamble (DPCCH)
DPCCH
DPDCH
10ms N × 10ms
Tra
nsm
itted
Pow
er
Figure 6.29: The physical common packet channel.
a 16-chip code at 240 kchips/s and multiplying it by another 16-chip code at 3.84 Mchips/s.Because of the way the PSC is formed the correlation process is done in steps. Firstly, thereceived signal is correlated with the 16-chip component at 3.84 Mchips/s, and the resultsare stored in a buffer. Next, every 16th entry in the buffer is correlated with the 16-chipcomponent at 240 kchips/s. This procedure is equivalent to correlating over the entire 256-chip sequence. The complexity is considerably decreased compared with the conventionalapproach of doing a 256-chip correlation, particularly as this must be done over an entireslot period of 2560 chips, i.e. for each chip offset of 2560 chips. If the data are oversampledby two to give 5120 samples, then 5120� 256 correlations would be required per timeslot. Even by producing the PSC from two 16-chip words, the number of correlations isstill substantial, although reduced by a factor of eight. Figure 6.30 shows the arrangementwhereby the sliding correlator moves along the received signal making correlations with a16-chip code, storing the results in a buffer, followed by another 16-chip sliding correlationto give the peak and hence a knowledge of the slot boundary.
The BS selected depends on the size of the correlator peaks. Figure 6.31 shows the outputof the correlator in the presence of three nearby BSs. BSA would be the preferred choicefor the UE.
Having achieved slot synchronisation the next step is to obtain frame synchronisation andcode-group identification. Let us return again to Figure 6.19 and recall that the secondarysynchronisation codes (SSCs) also occur at the same time as the PSC, but the SSCs providea code sequence over each frame. It is this sequence which enables the scrambling codeto be identified. Further more, recall from Figure 6.14 that there are 64 code groups. The
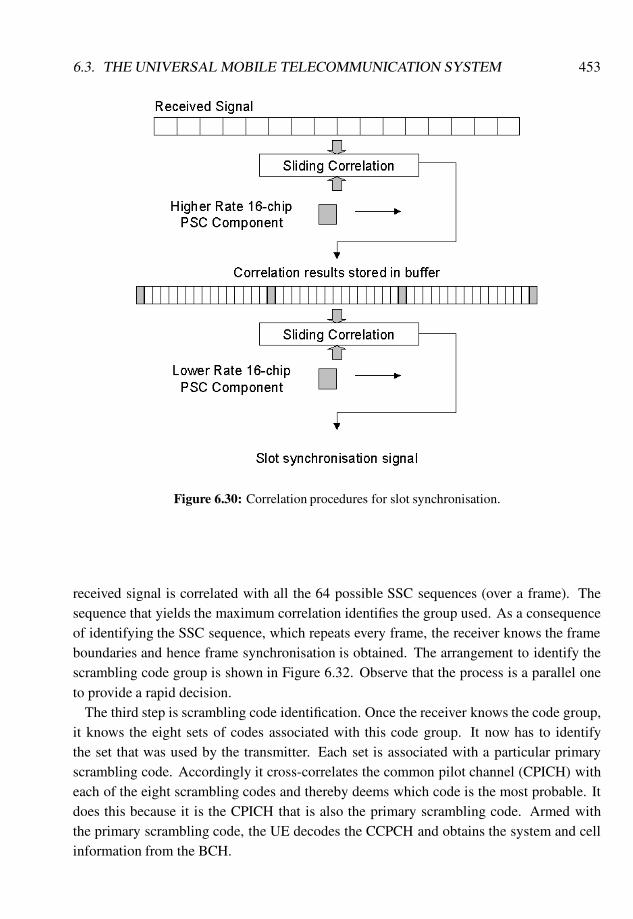
6.3. THE UNIVERSAL MOBILE TELECOMMUNICATION SYSTEM 453
Figure 6.30: Correlation procedures for slot synchronisation.
received signal is correlated with all the 64 possible SSC sequences (over a frame). Thesequence that yields the maximum correlation identifies the group used. As a consequenceof identifying the SSC sequence, which repeats every frame, the receiver knows the frameboundaries and hence frame synchronisation is obtained. The arrangement to identify thescrambling code group is shown in Figure 6.32. Observe that the process is a parallel oneto provide a rapid decision.
The third step is scrambling code identification. Once the receiver knows the code group,it knows the eight sets of codes associated with this code group. It now has to identifythe set that was used by the transmitter. Each set is associated with a particular primaryscrambling code. Accordingly it cross-correlates the common pilot channel (CPICH) witheach of the eight scrambling codes and thereby deems which code is the most probable. Itdoes this because it is the CPICH that is also the primary scrambling code. Armed withthe primary scrambling code, the UE decodes the CCPCH and obtains the system and cellinformation from the BCH.
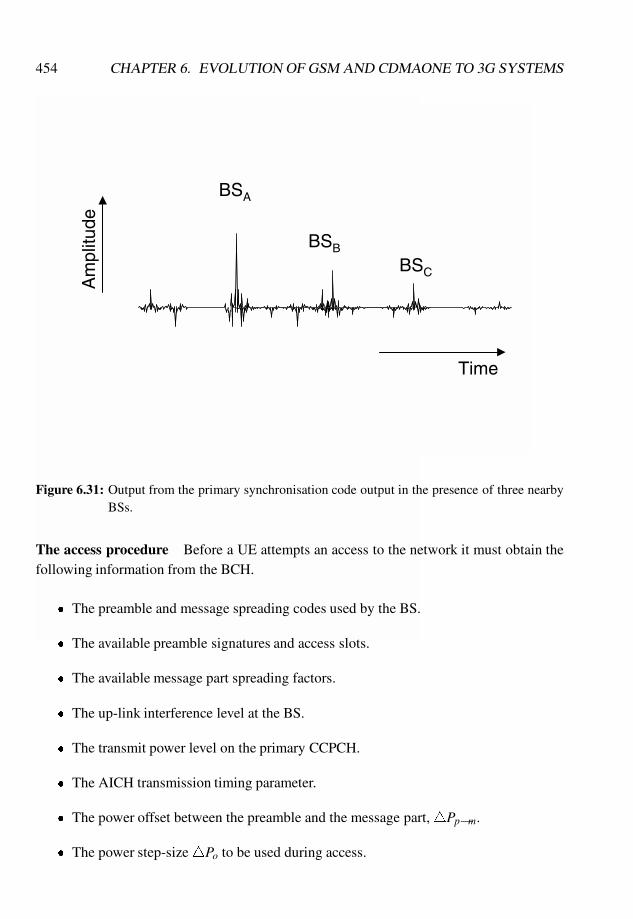
454 CHAPTER 6. EVOLUTION OF GSM AND CDMAONE TO 3G SYSTEMS
-100
0
100
200
300
-128 -96 -64 -32 0 32 64 96 128- 1 0 0
0
1 0 0
2 0 0
3 0 0
- 1 2 8 - 9 6 - 6 4 - 3 2 0 3 2 6 4 9 6 1 2 8- 1 0 0
0
1 0 0
2 0 0
3 0 0
- 1 2 8 - 9 6 - 6 4 - 3 2 0 3 2 6 4 9 6 1 2 8
-100
0
100
200
300
-128 -96 -64 -32 0 32 64 96 128- 1 0 0
0
1 0 0
2 0 0
3 0 0
- 1 2 8 - 9 6 - 6 4 - 3 2 0 3 2 6 4 9 6 1 2 8- 1 0 0
0
1 0 0
2 0 0
3 0 0
- 1 2 8 - 9 6 - 6 4 - 3 2 0 3 2 6 4 9 6 1 2 8
BSA
BSB
BSC
Time
Am
plitu
de
Figure 6.31: Output from the primary synchronisation code output in the presence of three nearbyBSs.
The access procedure Before a UE attempts an access to the network it must obtain thefollowing information from the BCH.
� The preamble and message spreading codes used by the BS.
� The available preamble signatures and access slots.
� The available message part spreading factors.
� The up-link interference level at the BS.
� The transmit power level on the primary CCPCH.
� The AICH transmission timing parameter.
� The power offset between the preamble and the message part,4Pp�m.
� The power step-size4Po to be used during access.

6.3. THE UNIVERSAL MOBILE TELECOMMUNICATION SYSTEM 455
Figure 6.32: Identification of the scrambling code group.
The UE randomly selects one of the preamble codes specified by the BCH, and sets thetransmit power for its PRACH transmission according to
PPRACH (dBm) = Lp(dB)+ IBS(dBm)+C; (6.4)
where Lp is the path loss between the UE and the BS, IBS is the interference power at the BS,and C is a constant. The parameter Lp is deduced from the transmit power on the primaryCCPCH, IBS is part of the BCH message, andC is a fine adjustment parameter conveyed bythe BCH.
Next the UE employs a dynamic persistence algorithm to determine whether it shouldproceed with the access attempt. This algorithm regulates the access load to the network.The persistence factor N is downloaded from the BCH. If it is zero, the UE is allowed toproceed with its access attempt, but should N 6= 0, the UE generates a random integer Rbetween 0 and 2N�1. When R 6= 0, the UE waits for one frame and repeats the persistencetest. If R= 0, the UE continues with the access attempt. When the BS deems the RACH tobe too high, it increases the value of N on the BCH.
456 CHAPTER 6. EVOLUTION OF GSM AND CDMAONE TO 3G SYSTEMS
The UE randomly selects an access slot and a preamble signature from those available,and transmits its access preamble. It then examines the acquisition indicator (AI) it re-ceives on the BCH. However, if the UE does not detect an AI that corresponds to its accesspreamble it randomly selects another preamble signature. The transmission power is nowincreased by the step size 4P0 and the preamble is transmitted. The number of times thisprocedure may be repeated is controlled by the network via the BCH. Should the UE re-ceive a negative AI it ceases its access attempt, i.e. the access attempt has failed. A positiveAI causes the UE to transmit its access message three or four access slots later, with thetransmit power4Pp�m above that of the last transmitted preamble.
Power control Closed-loop up-link power control attempts to maintain the up-link SIRat a target value of SIRTarget. The BS estimates the up-link SIR, namely SIREst , on thededicated physical channel. If SIREst > SIRTarget, then the BS sets the down-link TPC bitsto decrease the UE’s transmit power, and vice versa when SIREst � SIRTarget. On receivinga power control command, the UE adjusts its transmitted power by the power control stepsize, 4TPC, which is either 1 or 2 dB. Figure 6.33 shows the block diagram of the powercontrol elements between the UE and the BS (or Node B). We also note in Figure 6.33 therole of the RNC which provides an outer control loop that is concerned with ensuring thatthe bit error rate (BER) is satisfactory.
In soft handover (SHO) a UE is able to communicate simultaneously with two or moreBSs. As a consequence, the UE can get conflicting power control commands from the BSs.In this situation the UE examines the quality of the TPC bits. If one TPC commands a powerdecrease, then this is executed, irrespective of the TPC from the other BSs. This results inthe UE always being power controlled to the satisfaction of the BS receiving the best signallevel.
Fast down-link power control is also supported. The UE compares the received SIR witha target SIR and sets its transmitted TPC bits accordingly. This way the transmit power ofthe BS(s) is regulated. The range of down-link power control is, however, smaller than thatof the up-link range.
6.3.1.4 Handover
The handover procedure is the key factor in supporting roaming. In UMTS there are five dif-ferent types of handover. Softer handover involves the UE communicating with two sectorson the same cell site using a common carrier frequency. Eventually the UE changes fromits original sector to the new sector. When two or more BSs forming different cells commu-nicate simultaneously via a common carrier frequency with a UE as it roams between cells,then a soft handover is said to be in process. The process ends when the UE is commu-nicating with a single BS. Sometimes a UE entering a different cell has to have its carrier
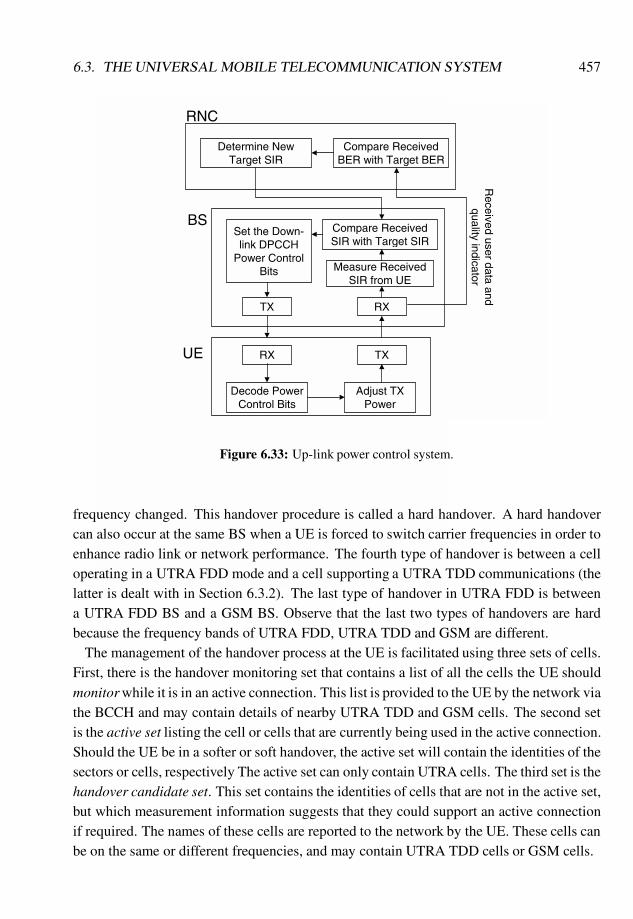
6.3. THE UNIVERSAL MOBILE TELECOMMUNICATION SYSTEM 457
RX
Decode Power Control Bits
Adjust TX Power
TXUE
RXTX
Measure Received SIR from UE
Compare Received SIR with Target SIR
Set the Down-link DPCCH
Power Control Bits
BS
Compare Received BER with Target BER
Determine New Target SIR
Received user data and
quality indicator
RNC
Figure 6.33: Up-link power control system.
frequency changed. This handover procedure is called a hard handover. A hard handovercan also occur at the same BS when a UE is forced to switch carrier frequencies in order toenhance radio link or network performance. The fourth type of handover is between a celloperating in a UTRA FDD mode and a cell supporting a UTRA TDD communications (thelatter is dealt with in Section 6.3.2). The last type of handover in UTRA FDD is betweena UTRA FDD BS and a GSM BS. Observe that the last two types of handovers are hardbecause the frequency bands of UTRA FDD, UTRA TDD and GSM are different.
The management of the handover process at the UE is facilitated using three sets of cells.First, there is the handover monitoring set that contains a list of all the cells the UE shouldmonitorwhile it is in an active connection. This list is provided to the UE by the network viathe BCCH and may contain details of nearby UTRA TDD and GSM cells. The second setis the active set listing the cell or cells that are currently being used in the active connection.Should the UE be in a softer or soft handover, the active set will contain the identities of thesectors or cells, respectively The active set can only contain UTRA cells. The third set is thehandover candidate set. This set contains the identities of cells that are not in the active set,but which measurement information suggests that they could support an active connectionif required. The names of these cells are reported to the network by the UE. These cells canbe on the same or different frequencies, and may contain UTRA TDD cells or GSM cells.
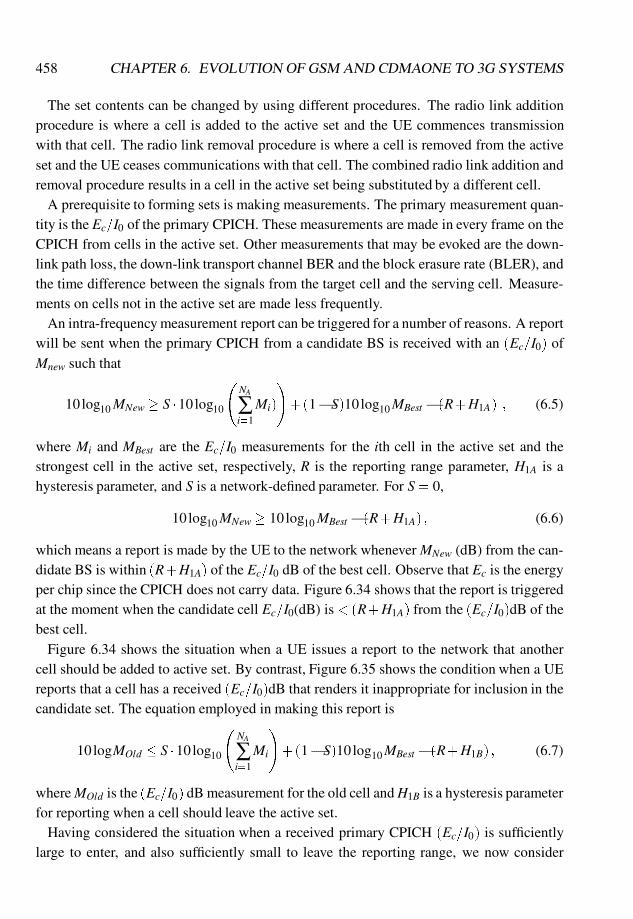
458 CHAPTER 6. EVOLUTION OF GSM AND CDMAONE TO 3G SYSTEMS
The set contents can be changed by using different procedures. The radio link additionprocedure is where a cell is added to the active set and the UE commences transmissionwith that cell. The radio link removal procedure is where a cell is removed from the activeset and the UE ceases communications with that cell. The combined radio link addition andremoval procedure results in a cell in the active set being substituted by a different cell.
A prerequisite to forming sets is making measurements. The primary measurement quan-tity is the Ec=I0 of the primary CPICH. These measurements are made in every frame on theCPICH from cells in the active set. Other measurements that may be evoked are the down-link path loss, the down-link transport channel BER and the block erasure rate (BLER), andthe time difference between the signals from the target cell and the serving cell. Measure-ments on cells not in the active set are made less frequently.
An intra-frequency measurement report can be triggered for a number of reasons. A reportwill be sent when the primary CPICH from a candidate BS is received with an (Ec=I0) ofMnew such that
10 log10MNew � S �10log10
NA
∑i=1
Mi)
!+(1�S)10log10MBest � (R+H1A) ; (6.5)
where Mi and MBest are the Ec=I0 measurements for the ith cell in the active set and thestrongest cell in the active set, respectively, R is the reporting range parameter, H1A is ahysteresis parameter, and S is a network-defined parameter. For S= 0,
10 log10MNew � 10log10MBest � (R+H1A) ; (6.6)
which means a report is made by the UE to the network whenever MNew (dB) from the can-didate BS is within (R+H1A) of the Ec=I0 dB of the best cell. Observe that Ec is the energyper chip since the CPICH does not carry data. Figure 6.34 shows that the report is triggeredat the moment when the candidate cell Ec=I0(dB) is < (R+H1A) from the (Ec=I0)dB of thebest cell.
Figure 6.34 shows the situation when a UE issues a report to the network that anothercell should be added to active set. By contrast, Figure 6.35 shows the condition when a UEreports that a cell has a received (Ec=I0)dB that renders it inappropriate for inclusion in thecandidate set. The equation employed in making this report is
10 logMOld � S �10log10
NA
∑i=1
Mi
!+(1�S)10log10MBest � (R+H1B) ; (6.7)
where MOld is the (Ec=I0) dB measurement for the old cell and H1B is a hysteresis parameterfor reporting when a cell should leave the active set.
Having considered the situation when a received primary CPICH (Ec=I0) is sufficientlylarge to enter, and also sufficiently small to leave the reporting range, we now consider
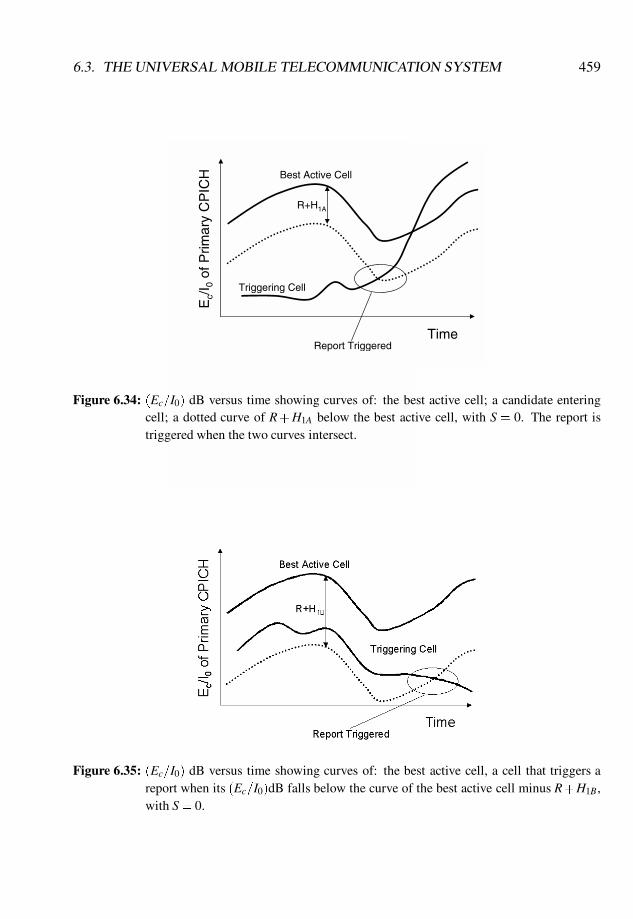
6.3. THE UNIVERSAL MOBILE TELECOMMUNICATION SYSTEM 459
Ec/
I 0of
Prim
ary
CP
ICH
Time
Best Active Cell
Triggering Cell
R+H1A
Report Triggered
Figure 6.34: (Ec=I0) dB versus time showing curves of: the best active cell; a candidate enteringcell; a dotted curve of R+H1A below the best active cell, with S = 0. The report istriggered when the two curves intersect.
Figure 6.35: (Ec=I0) dB versus time showing curves of: the best active cell, a cell that triggers areport when its (Ec=I0)dB falls below the curve of the best active cell minus R+H1B ,with S= 0.
460 CHAPTER 6. EVOLUTION OF GSM AND CDMAONE TO 3G SYSTEMS
reporting when a non-active primary CPICH (Ec=I0) becomes greater than that of an activeprimary CPICH. Initially, say, there are three active cells, and a non-active cell. As the UEroams towards the non-active cell, the (Ec=I0) of the non-active cell increases, as shown inFigure 6.36, until eventually it exceeds the Ec=I0 of an active cell. A report is duly filedwith the network. Later the Ec=I0 of the non-active cell exceeds that of another active cell,and again a report is sent to the network.
From the last two equations it is evident that the network needs to be kept informed of thecurrent BS that provides the best Ec=I0 at the UE. In Figure 6.37 we observe that initiallythe best cell is the cell associated with curve (a), but later there is a period when the cell ofcurve (c) is best, until curve (a) again becomes best. The reports are triggered when curves(a) and (c) intersect.
Reports are also sent when the (Ec=I0) of the primary CPICH becomes either better orworse than an absolute threshold. This threshold is a system parameter, and sets a minimumEc=I0 that can be used in the handover process.
The UTRA specifications define the format of the measurement information delivered bya UE to the network. It is up to the equipment manufacturers to decide how the networkwill use the reports to determine whether a soft handover should be performed, i.e. the softhandover algorithm is not in the UTRA specifications. However, these specifications dooffer the following suggestions for a soft handover algorithm. There are four parameters:an active set threshold (ThreshAS) and an active set hysteresis (HystAS) level for entry to,or removal from, the active set; an active set replacement hysteresis (HystAS�REP) valuerequired for one cell to replace another in the active set; and a time to trigger (4T) that setsthe time between a trigger event (a report) occurring and the resulting action.
The algorithm utilises these parameters as follows. A cell is removed from the activeset if its Ec=I0 falls (ThreshAS+HystAS) below that of the best active cell. Alternatively,a cell is added to the active set when its Ec=I0 exceeds the trigger level which is set at(ThreshAS�HystAS) below the Ec=I0 of the active cell. Should the active set be full and thebest non-active cell is better than HystAS�REP above the worst active cell, then the latter isreplaced by the former cell. Figure 6.38 shows the variation of Ec=I0 as a function of timefor three cells. Observe that actions follow4T after reports are made to the network. Allthe handover algorithm changes are shown in Figure 6.38.
Having described the types of handover, handover sets and a soft handover algorithm, thehandover execution is done by the network. After the UE provides down-link measurementsinformation to the network, and the BS provides the network with measurements of thereceived signal from the UE, the network considers the overall impact of a handover beforeit is executed, e.g. the network will need to assess whether there is sufficient capacity in thetarget cell.
So far we have concentrated on soft handovers. With these type of handovers it is rela-
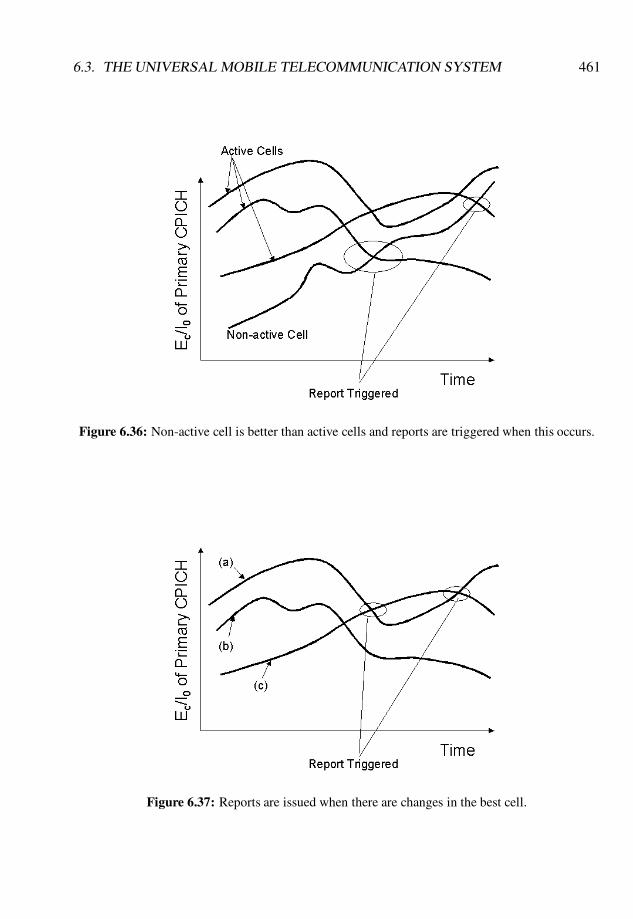
6.3. THE UNIVERSAL MOBILE TELECOMMUNICATION SYSTEM 461
Figure 6.36: Non-active cell is better than active cells and reports are triggered when this occurs.
Figure 6.37: Reports are issued when there are changes in the best cell.
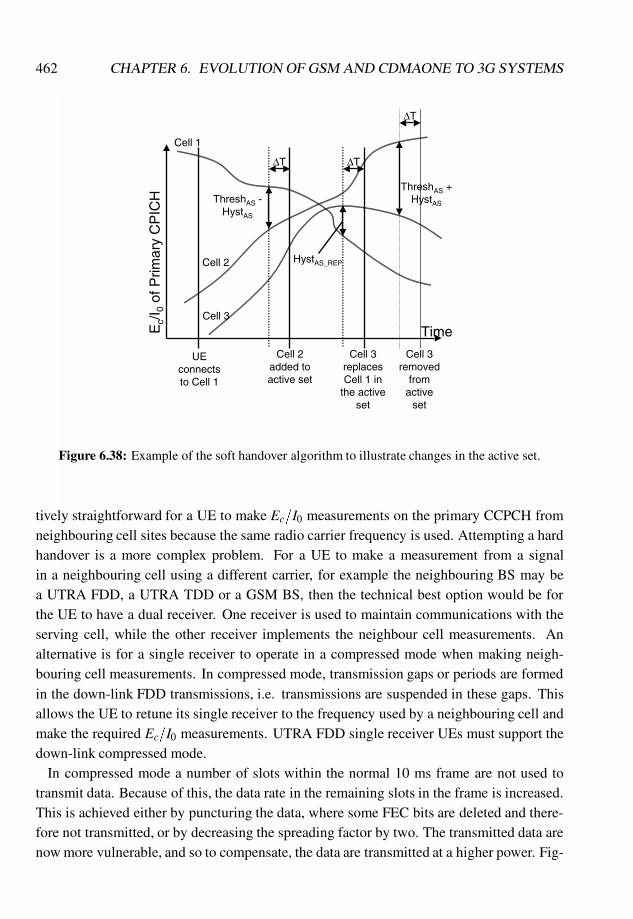
462 CHAPTER 6. EVOLUTION OF GSM AND CDMAONE TO 3G SYSTEMS
Ec/
I 0of
Prim
ary
CP
ICH
Time
Cell 2
Cell 1
Cell 3
Cell 2 added to active set
ThreshAS -HystAS
∆T
HystAS_REP
∆T
Cell 3 replaces Cell 1 in
the active set
ThreshAS +HystAS
∆T
Cell 3 removed
from active
set
UE connects to Cell 1
Figure 6.38: Example of the soft handover algorithm to illustrate changes in the active set.
tively straightforward for a UE to make Ec=I0 measurements on the primary CCPCH fromneighbouring cell sites because the same radio carrier frequency is used. Attempting a hardhandover is a more complex problem. For a UE to make a measurement from a signalin a neighbouring cell using a different carrier, for example the neighbouring BS may bea UTRA FDD, a UTRA TDD or a GSM BS, then the technical best option would be forthe UE to have a dual receiver. One receiver is used to maintain communications with theserving cell, while the other receiver implements the neighbour cell measurements. Analternative is for a single receiver to operate in a compressed mode when making neigh-bouring cell measurements. In compressed mode, transmission gaps or periods are formedin the down-link FDD transmissions, i.e. transmissions are suspended in these gaps. Thisallows the UE to retune its single receiver to the frequency used by a neighbouring cell andmake the required Ec=I0 measurements. UTRA FDD single receiver UEs must support thedown-link compressed mode.
In compressed mode a number of slots within the normal 10 ms frame are not used totransmit data. Because of this, the data rate in the remaining slots in the frame is increased.This is achieved either by puncturing the data, where some FEC bits are deleted and there-fore not transmitted, or by decreasing the spreading factor by two. The transmitted data arenow more vulnerable, and so to compensate, the data are transmitted at a higher power. Fig-
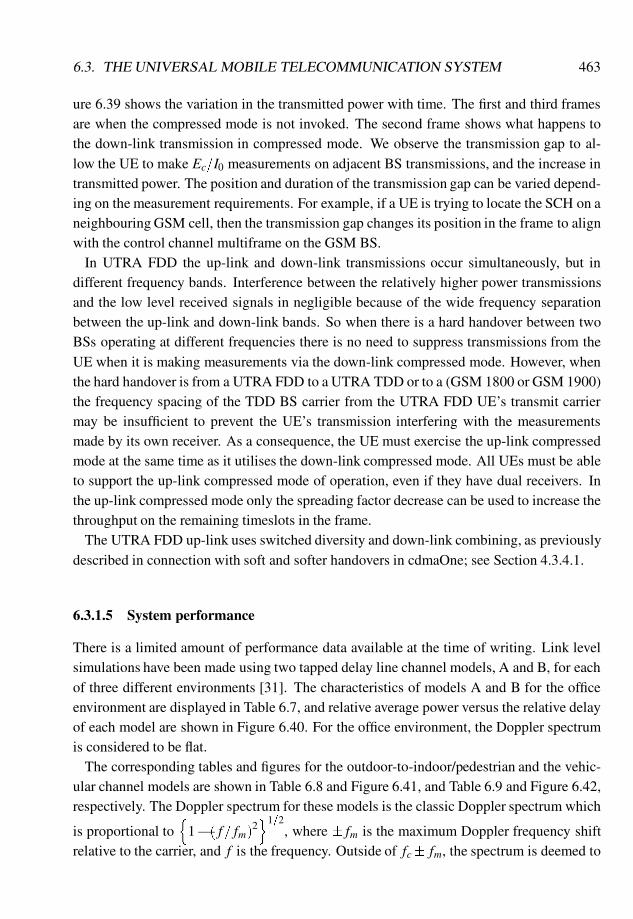
6.3. THE UNIVERSAL MOBILE TELECOMMUNICATION SYSTEM 463
ure 6.39 shows the variation in the transmitted power with time. The first and third framesare when the compressed mode is not invoked. The second frame shows what happens tothe down-link transmission in compressed mode. We observe the transmission gap to al-low the UE to make Ec=I0 measurements on adjacent BS transmissions, and the increase intransmitted power. The position and duration of the transmission gap can be varied depend-ing on the measurement requirements. For example, if a UE is trying to locate the SCH on aneighbouring GSM cell, then the transmission gap changes its position in the frame to alignwith the control channel multiframe on the GSM BS.
In UTRA FDD the up-link and down-link transmissions occur simultaneously, but indifferent frequency bands. Interference between the relatively higher power transmissionsand the low level received signals in negligible because of the wide frequency separationbetween the up-link and down-link bands. So when there is a hard handover between twoBSs operating at different frequencies there is no need to suppress transmissions from theUE when it is making measurements via the down-link compressed mode. However, whenthe hard handover is from a UTRA FDD to a UTRA TDD or to a (GSM 1800 or GSM 1900)the frequency spacing of the TDD BS carrier from the UTRA FDD UE’s transmit carriermay be insufficient to prevent the UE’s transmission interfering with the measurementsmade by its own receiver. As a consequence, the UE must exercise the up-link compressedmode at the same time as it utilises the down-link compressed mode. All UEs must be ableto support the up-link compressed mode of operation, even if they have dual receivers. Inthe up-link compressed mode only the spreading factor decrease can be used to increase thethroughput on the remaining timeslots in the frame.
The UTRA FDD up-link uses switched diversity and down-link combining, as previouslydescribed in connection with soft and softer handovers in cdmaOne; see Section 4.3.4.1.
6.3.1.5 System performance
There is a limited amount of performance data available at the time of writing. Link levelsimulations have been made using two tapped delay line channel models, A and B, for eachof three different environments [31]. The characteristics of models A and B for the officeenvironment are displayed in Table 6.7, and relative average power versus the relative delayof each model are shown in Figure 6.40. For the office environment, the Doppler spectrumis considered to be flat.
The corresponding tables and figures for the outdoor-to-indoor/pedestrian and the vehic-ular channel models are shown in Table 6.8 and Figure 6.41, and Table 6.9 and Figure 6.42,respectively. The Doppler spectrum for these models is the classic Doppler spectrum which
is proportional ton
1� ( f= fm)2o1=2
, where � fm is the maximum Doppler frequency shiftrelative to the carrier, and f is the frequency. Outside of fc� fm, the spectrum is deemed to
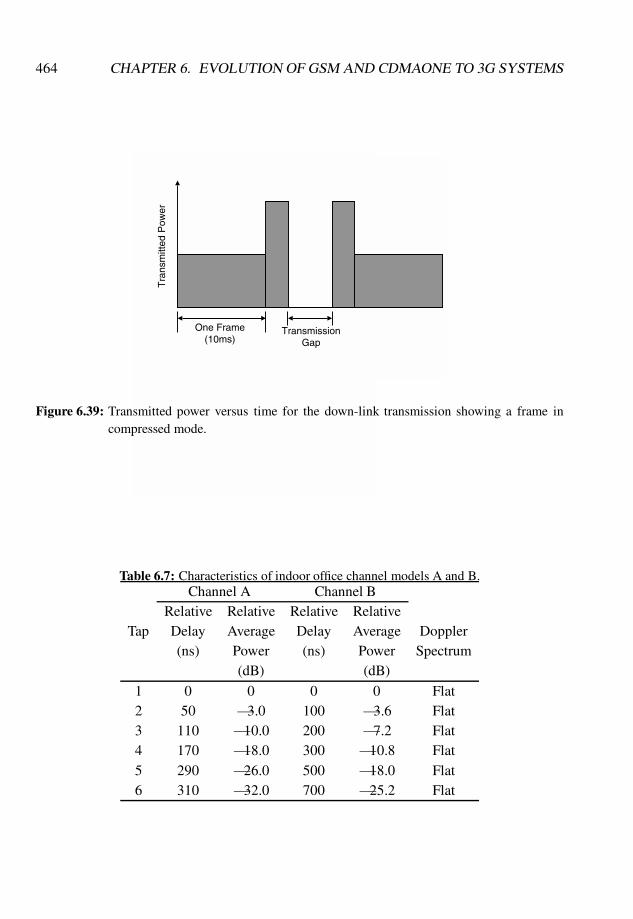
464 CHAPTER 6. EVOLUTION OF GSM AND CDMAONE TO 3G SYSTEMS
Tra
nsm
itted
Pow
er
One Frame(10ms)
TransmissionGap
Figure 6.39: Transmitted power versus time for the down-link transmission showing a frame incompressed mode.
Table 6.7: Characteristics of indoor office channel models A and B.Channel A Channel B
Relative Relative Relative RelativeTap Delay Average Delay Average Doppler
(ns) Power (ns) Power Spectrum(dB) (dB)
1 0 0 0 0 Flat2 50 �3.0 100 �3.6 Flat3 110 �10.0 200 �7.2 Flat4 170 �18.0 300 �10.8 Flat5 290 �26.0 500 �18.0 Flat6 310 �32.0 700 �25.2 Flat
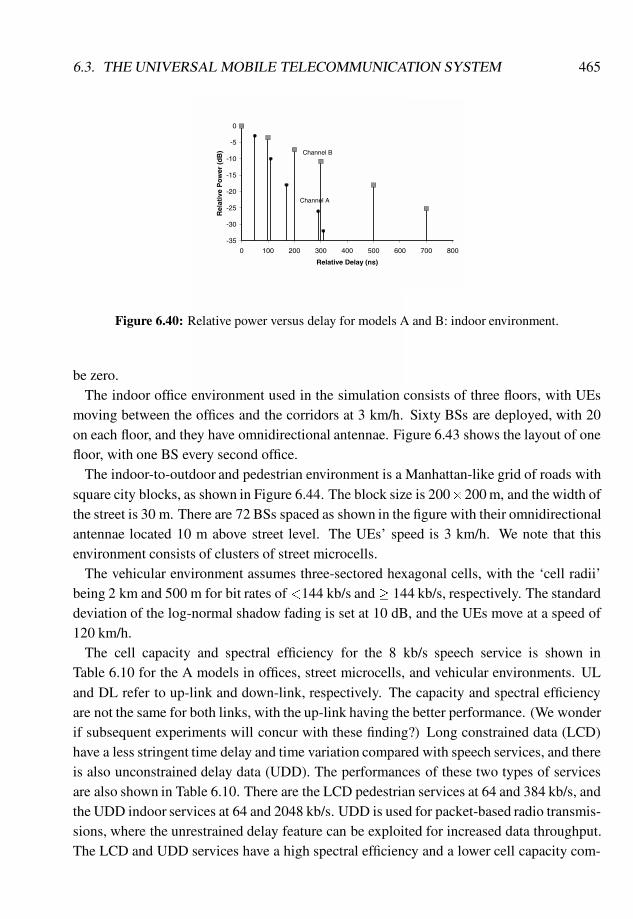
6.3. THE UNIVERSAL MOBILE TELECOMMUNICATION SYSTEM 465
-35
-30
-25
-20
-15
-10
-5
0
0 100 200 300 400 500 600 700 800
Relative Delay (ns)
Rel
ativ
e P
ow
er (
dB
) Channel B
Channel A
Figure 6.40: Relative power versus delay for models A and B: indoor environment.
be zero.The indoor office environment used in the simulation consists of three floors, with UEs
moving between the offices and the corridors at 3 km/h. Sixty BSs are deployed, with 20on each floor, and they have omnidirectional antennae. Figure 6.43 shows the layout of onefloor, with one BS every second office.
The indoor-to-outdoor and pedestrian environment is a Manhattan-like grid of roads withsquare city blocks, as shown in Figure 6.44. The block size is 200�200 m, and the width ofthe street is 30 m. There are 72 BSs spaced as shown in the figure with their omnidirectionalantennae located 10 m above street level. The UEs’ speed is 3 km/h. We note that thisenvironment consists of clusters of street microcells.
The vehicular environment assumes three-sectored hexagonal cells, with the ‘cell radii’being 2 km and 500 m for bit rates of <144 kb/s and� 144 kb/s, respectively. The standarddeviation of the log-normal shadow fading is set at 10 dB, and the UEs move at a speed of120 km/h.
The cell capacity and spectral efficiency for the 8 kb/s speech service is shown inTable 6.10 for the A models in offices, street microcells, and vehicular environments. ULand DL refer to up-link and down-link, respectively. The capacity and spectral efficiencyare not the same for both links, with the up-link having the better performance. (We wonderif subsequent experiments will concur with these finding?) Long constrained data (LCD)have a less stringent time delay and time variation compared with speech services, and thereis also unconstrained delay data (UDD). The performances of these two types of servicesare also shown in Table 6.10. There are the LCD pedestrian services at 64 and 384 kb/s, andthe UDD indoor services at 64 and 2048 kb/s. UDD is used for packet-based radio transmis-sions, where the unrestrained delay feature can be exploited for increased data throughput.The LCD and UDD services have a high spectral efficiency and a lower cell capacity com-
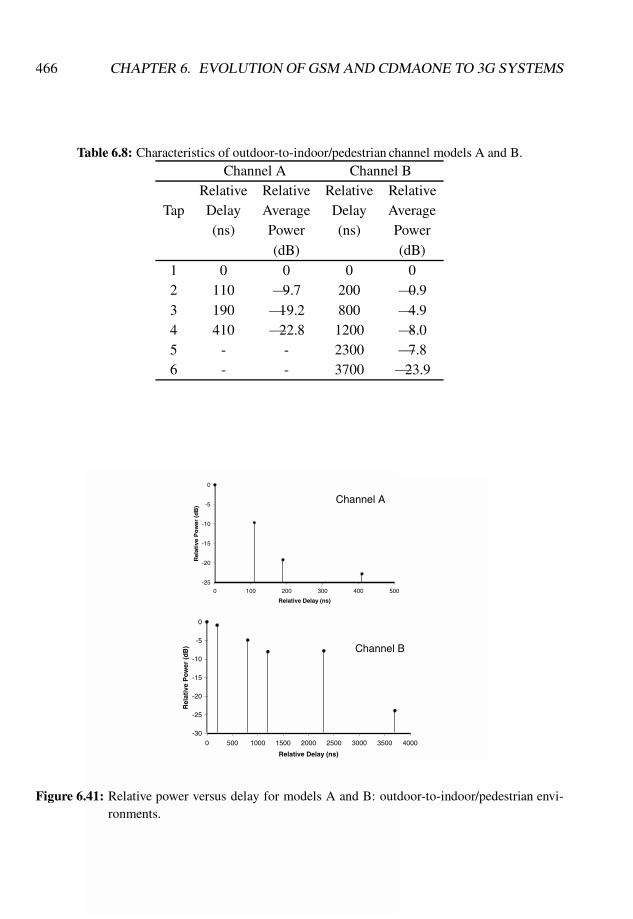
466 CHAPTER 6. EVOLUTION OF GSM AND CDMAONE TO 3G SYSTEMS
Table 6.8: Characteristics of outdoor-to-indoor/pedestrian channel models A and B.Channel A Channel B
Relative Relative Relative RelativeTap Delay Average Delay Average
(ns) Power (ns) Power(dB) (dB)
1 0 0 0 02 110 �9.7 200 �0.93 190 �19.2 800 �4.94 410 �22.8 1200 �8.05 - - 2300 �7.86 - - 3700 �23.9
-30
-25
-20
-15
-10
-5
0
0 500 1000 1500 2000 2500 3000 3500 4000
Relative Delay (ns)
Rel
ativ
e P
ow
er (
dB
)
-25
-20
-15
-10
-5
0
0 100 200 300 400 500
Relative Delay (ns)
Rel
ativ
e P
ow
er (
dB
)
Channel A
Channel B
Figure 6.41: Relative power versus delay for models A and B: outdoor-to-indoor/pedestrian envi-ronments.
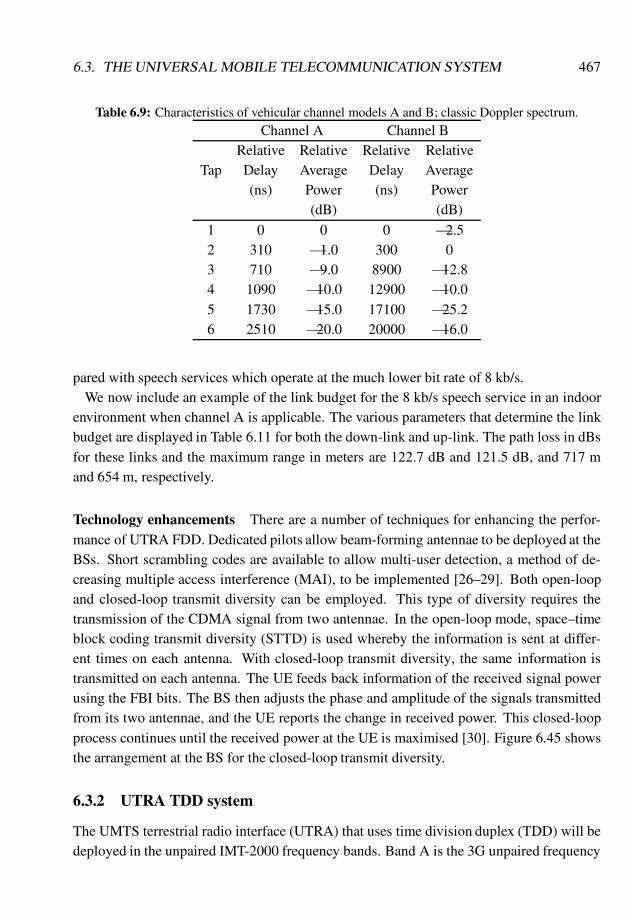
6.3. THE UNIVERSAL MOBILE TELECOMMUNICATION SYSTEM 467
Table 6.9: Characteristics of vehicular channel models A and B; classic Doppler spectrum.Channel A Channel B
Relative Relative Relative RelativeTap Delay Average Delay Average
(ns) Power (ns) Power(dB) (dB)
1 0 0 0 �2.52 310 �1.0 300 03 710 �9.0 8900 �12.84 1090 �10.0 12900 �10.05 1730 �15.0 17100 �25.26 2510 �20.0 20000 �16.0
pared with speech services which operate at the much lower bit rate of 8 kb/s.We now include an example of the link budget for the 8 kb/s speech service in an indoor
environment when channel A is applicable. The various parameters that determine the linkbudget are displayed in Table 6.11 for both the down-link and up-link. The path loss in dBsfor these links and the maximum range in meters are 122.7 dB and 121.5 dB, and 717 mand 654 m, respectively.
Technology enhancements There are a number of techniques for enhancing the perfor-mance of UTRA FDD. Dedicated pilots allow beam-forming antennae to be deployed at theBSs. Short scrambling codes are available to allow multi-user detection, a method of de-creasing multiple access interference (MAI), to be implemented [26–29]. Both open-loopand closed-loop transmit diversity can be employed. This type of diversity requires thetransmission of the CDMA signal from two antennae. In the open-loop mode, space–timeblock coding transmit diversity (STTD) is used whereby the information is sent at differ-ent times on each antenna. With closed-loop transmit diversity, the same information istransmitted on each antenna. The UE feeds back information of the received signal powerusing the FBI bits. The BS then adjusts the phase and amplitude of the signals transmittedfrom its two antennae, and the UE reports the change in received power. This closed-loopprocess continues until the received power at the UE is maximised [30]. Figure 6.45 showsthe arrangement at the BS for the closed-loop transmit diversity.
6.3.2 UTRA TDD system
The UMTS terrestrial radio interface (UTRA) that uses time division duplex (TDD) will bedeployed in the unpaired IMT-2000 frequency bands. Band A is the 3G unpaired frequency
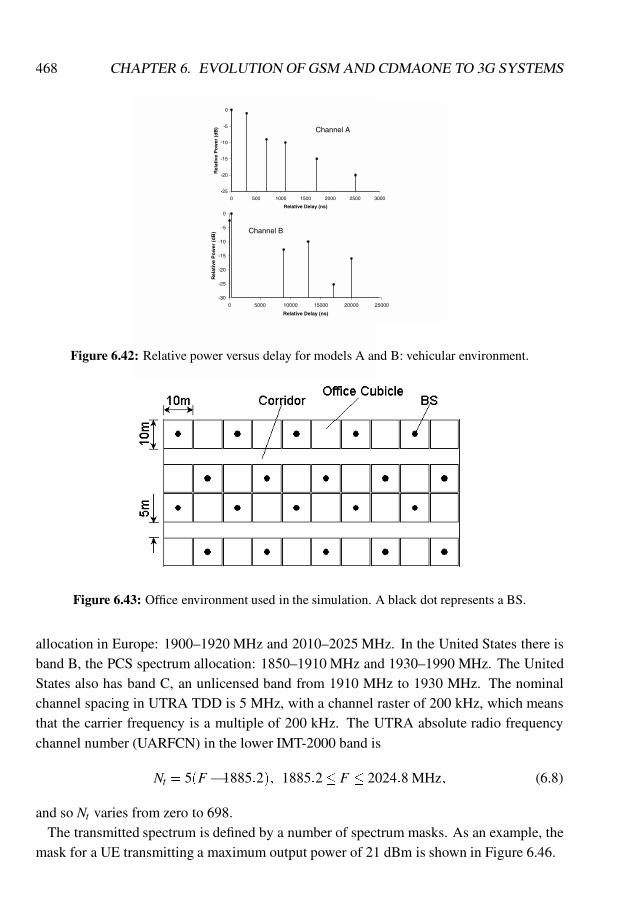
468 CHAPTER 6. EVOLUTION OF GSM AND CDMAONE TO 3G SYSTEMS
-25
-20
-15
-10
-5
0
0 500 1000 1500 2000 2500 3000
Relative Delay (ns)R
elat
ive
Po
wer
(d
B) Channel A
-30
-25
-20
-15
-10
-5
0
0 5000 10000 15000 20000 25000
Relative Delay (ns)
Rel
ativ
e P
ow
er (
dB
) Channel B
Figure 6.42: Relative power versus delay for models A and B: vehicular environment.
Figure 6.43: Office environment used in the simulation. A black dot represents a BS.
allocation in Europe: 1900–1920 MHz and 2010–2025 MHz. In the United States there isband B, the PCS spectrum allocation: 1850–1910 MHz and 1930–1990 MHz. The UnitedStates also has band C, an unlicensed band from 1910 MHz to 1930 MHz. The nominalchannel spacing in UTRA TDD is 5 MHz, with a channel raster of 200 kHz, which meansthat the carrier frequency is a multiple of 200 kHz. The UTRA absolute radio frequencychannel number (UARFCN) in the lower IMT-2000 band is
Nt = 5(F�1885:2); 1885:2� F � 2024:8 MHz; (6.8)
and so Nt varies from zero to 698.The transmitted spectrum is defined by a number of spectrum masks. As an example, the
mask for a UE transmitting a maximum output power of 21 dBm is shown in Figure 6.46.
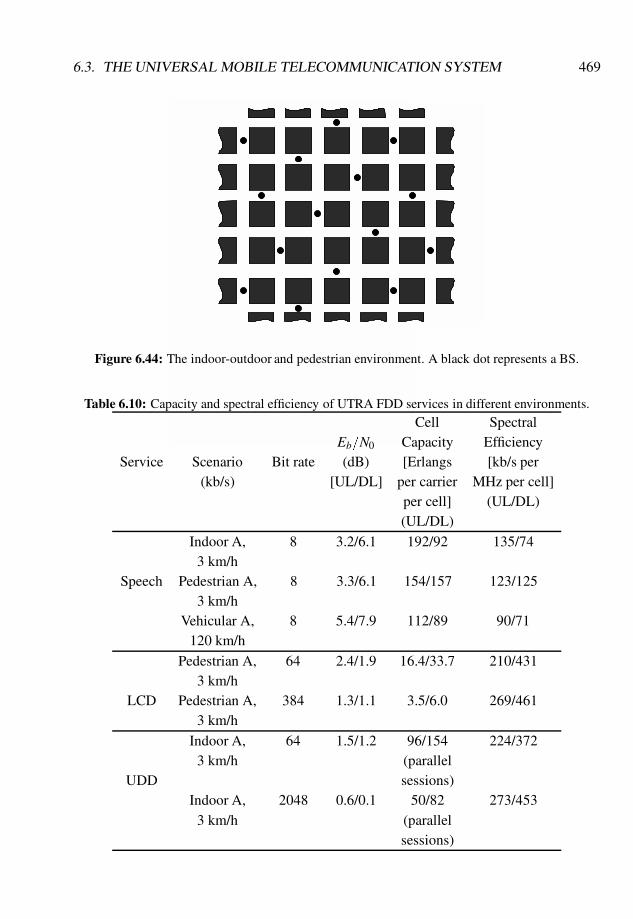
6.3. THE UNIVERSAL MOBILE TELECOMMUNICATION SYSTEM 469
Figure 6.44: The indoor-outdoor and pedestrian environment. A black dot represents a BS.
Table 6.10: Capacity and spectral efficiency of UTRA FDD services in different environments.
Cell SpectralEb=N0 Capacity Efficiency
Service Scenario Bit rate (dB) [Erlangs [kb/s per(kb/s) [UL/DL] per carrier MHz per cell]
per cell] (UL/DL)(UL/DL)
Indoor A, 8 3.2/6.1 192/92 135/743 km/h
Speech Pedestrian A, 8 3.3/6.1 154/157 123/1253 km/h
Vehicular A, 8 5.4/7.9 112/89 90/71120 km/h
Pedestrian A, 64 2.4/1.9 16.4/33.7 210/4313 km/h
LCD Pedestrian A, 384 1.3/1.1 3.5/6.0 269/4613 km/h
Indoor A, 64 1.5/1.2 96/154 224/3723 km/h (parallel
UDD sessions)Indoor A, 2048 0.6/0.1 50/82 273/453
3 km/h (parallelsessions)

470 CHAPTER 6. EVOLUTION OF GSM AND CDMAONE TO 3G SYSTEMS
Table 6.11: Link budget for the speech service in an indoor environment; model A used.Parameter (units) Down-link Up-link
TX power (dBm) 10 4Cable/combiner losses (dB) 2 0TX antenna gain (dBi) 2 0TX EIRP (dB) 10 4RX antenna gain (dBi) 0 2Cable/combiner losses (dB) 0 2RX noise figure (dB) 5 5Thermal noise density (dB/Hz) �174 �174RX noise floor (dBm/Hz) �169 �169Data rate (dB/Hz) 39 39Required Eb=I0 (dB) 6.0 3.2RX sensitivity (dBm) �124.0 �126.8Power control TX power increase (dB) 2.0 2.0Handoff gain (dB) 6.1 6.1Log-normal fading margin (dB) 15.4 15.4Maximum path loss (dB) 122.7 121.5Maximum range (m) 717.2 654.1
Figure 6.45: The closed-loop transmit diversity system at the BS.
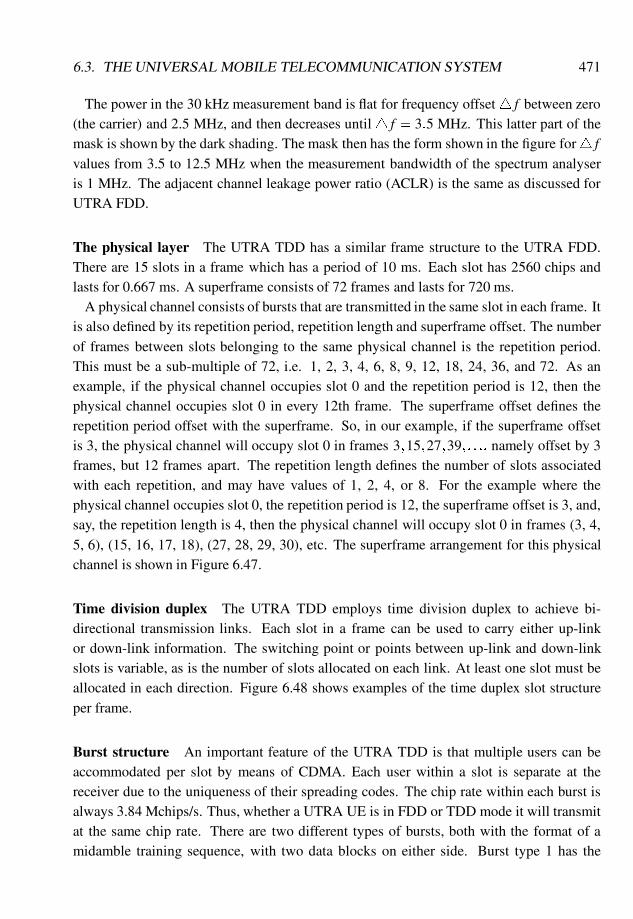
6.3. THE UNIVERSAL MOBILE TELECOMMUNICATION SYSTEM 471
The power in the 30 kHz measurement band is flat for frequency offset4 f between zero(the carrier) and 2.5 MHz, and then decreases until4 f = 3:5 MHz. This latter part of themask is shown by the dark shading. The mask then has the form shown in the figure for4 f
values from 3.5 to 12.5 MHz when the measurement bandwidth of the spectrum analyseris 1 MHz. The adjacent channel leakage power ratio (ACLR) is the same as discussed forUTRA FDD.
The physical layer The UTRA TDD has a similar frame structure to the UTRA FDD.There are 15 slots in a frame which has a period of 10 ms. Each slot has 2560 chips andlasts for 0.667 ms. A superframe consists of 72 frames and lasts for 720 ms.
A physical channel consists of bursts that are transmitted in the same slot in each frame. Itis also defined by its repetition period, repetition length and superframe offset. The numberof frames between slots belonging to the same physical channel is the repetition period.This must be a sub-multiple of 72, i.e. 1, 2, 3, 4, 6, 8, 9, 12, 18, 24, 36, and 72. As anexample, if the physical channel occupies slot 0 and the repetition period is 12, then thephysical channel occupies slot 0 in every 12th frame. The superframe offset defines therepetition period offset with the superframe. So, in our example, if the superframe offsetis 3, the physical channel will occupy slot 0 in frames 3;15;27;39; : : :; namely offset by 3frames, but 12 frames apart. The repetition length defines the number of slots associatedwith each repetition, and may have values of 1, 2, 4, or 8. For the example where thephysical channel occupies slot 0, the repetition period is 12, the superframe offset is 3, and,say, the repetition length is 4, then the physical channel will occupy slot 0 in frames (3, 4,5, 6), (15, 16, 17, 18), (27, 28, 29, 30), etc. The superframe arrangement for this physicalchannel is shown in Figure 6.47.
Time division duplex The UTRA TDD employs time division duplex to achieve bi-directional transmission links. Each slot in a frame can be used to carry either up-linkor down-link information. The switching point or points between up-link and down-linkslots is variable, as is the number of slots allocated on each link. At least one slot must beallocated in each direction. Figure 6.48 shows examples of the time duplex slot structureper frame.
Burst structure An important feature of the UTRA TDD is that multiple users can beaccommodated per slot by means of CDMA. Each user within a slot is separate at thereceiver due to the uniqueness of their spreading codes. The chip rate within each burst isalways 3.84 Mchips/s. Thus, whether a UTRA UE is in FDD or TDD mode it will transmitat the same chip rate. There are two different types of bursts, both with the format of amidamble training sequence, with two data blocks on either side. Burst type 1 has the
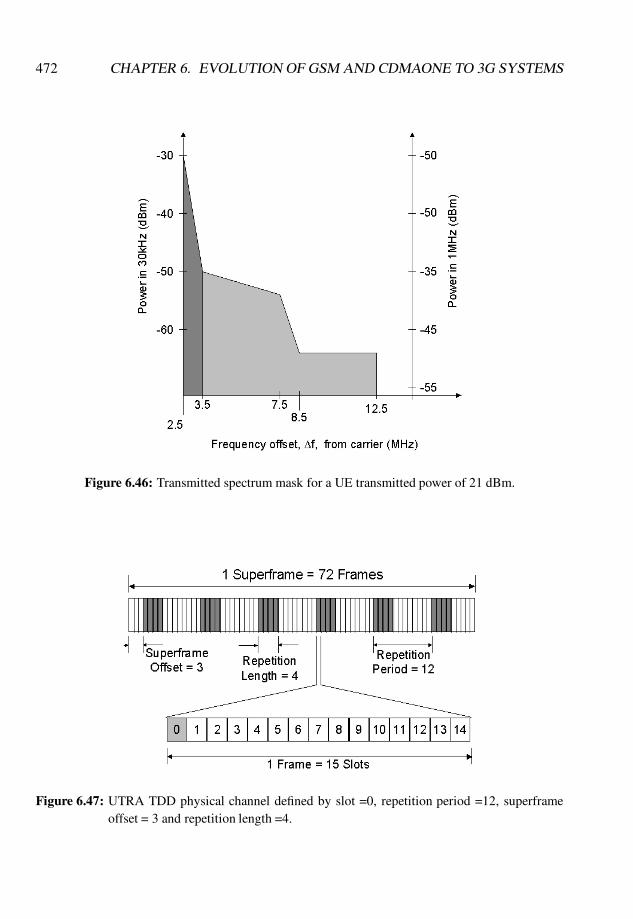
472 CHAPTER 6. EVOLUTION OF GSM AND CDMAONE TO 3G SYSTEMS
Figure 6.46: Transmitted spectrum mask for a UE transmitted power of 21 dBm.
Figure 6.47: UTRA TDD physical channel defined by slot =0, repetition period =12, superframeoffset = 3 and repetition length =4.
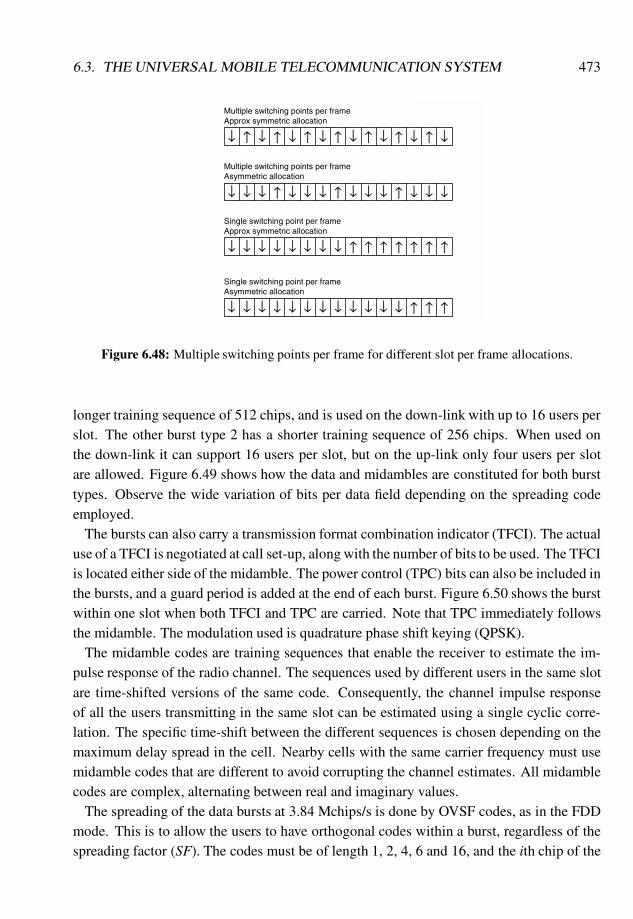
6.3. THE UNIVERSAL MOBILE TELECOMMUNICATION SYSTEM 473
↓
↓
↓
↓
↓
↓
↓
↓
↓
↓
↓
↓
↓
↓
↓
↓ ↓ ↓
↓
↓ ↓ ↓
↓
↓ ↓ ↓
↓
↓ ↓ ↓
↓ ↓ ↓ ↓ ↓ ↓ ↓ ↓
↓ ↓ ↓ ↓ ↓ ↓ ↓
↓ ↓ ↓ ↓ ↓ ↓ ↓ ↓ ↓ ↓ ↓ ↓
↓ ↓ ↓
Multiple switching points per frameApprox symmetric allocation
Multiple switching points per frameAsymmetric allocation
Single switching point per frameApprox symmetric allocation
Single switching point per frameAsymmetric allocation
Figure 6.48: Multiple switching points per frame for different slot per frame allocations.
longer training sequence of 512 chips, and is used on the down-link with up to 16 users perslot. The other burst type 2 has a shorter training sequence of 256 chips. When used onthe down-link it can support 16 users per slot, but on the up-link only four users per slotare allowed. Figure 6.49 shows how the data and midambles are constituted for both bursttypes. Observe the wide variation of bits per data field depending on the spreading codeemployed.
The bursts can also carry a transmission format combination indicator (TFCI). The actualuse of a TFCI is negotiated at call set-up, along with the number of bits to be used. The TFCIis located either side of the midamble. The power control (TPC) bits can also be included inthe bursts, and a guard period is added at the end of each burst. Figure 6.50 shows the burstwithin one slot when both TFCI and TPC are carried. Note that TPC immediately followsthe midamble. The modulation used is quadrature phase shift keying (QPSK).
The midamble codes are training sequences that enable the receiver to estimate the im-pulse response of the radio channel. The sequences used by different users in the same slotare time-shifted versions of the same code. Consequently, the channel impulse responseof all the users transmitting in the same slot can be estimated using a single cyclic corre-lation. The specific time-shift between the different sequences is chosen depending on themaximum delay spread in the cell. Nearby cells with the same carrier frequency must usemidamble codes that are different to avoid corrupting the channel estimates. All midamblecodes are complex, alternating between real and imaginary values.
The spreading of the data bursts at 3.84 Mchips/s is done by OVSF codes, as in the FDDmode. This is to allow the users to have orthogonal codes within a burst, regardless of thespreading factor (SF). The codes must be of length 1, 2, 4, 6 and 16, and the ith chip of the
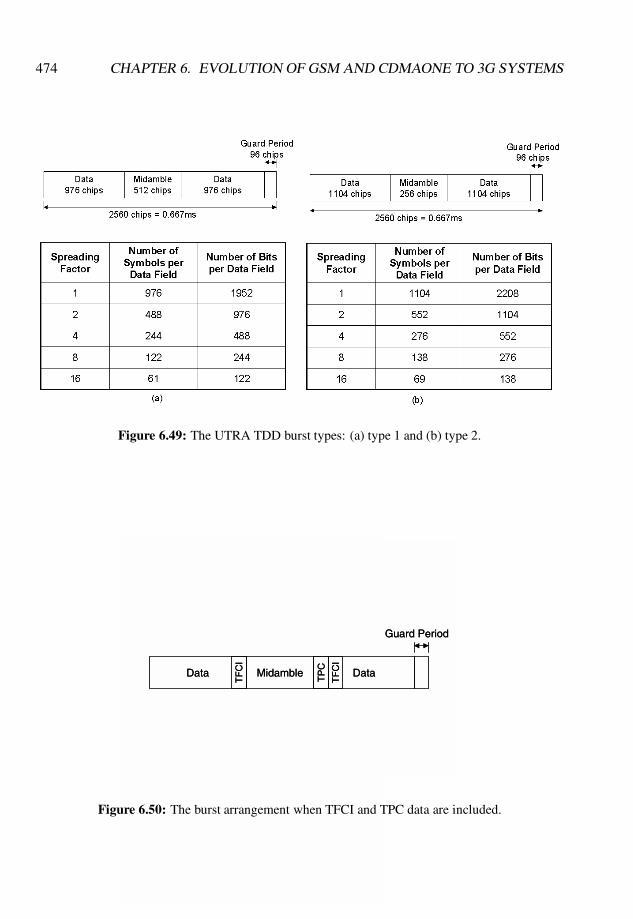
474 CHAPTER 6. EVOLUTION OF GSM AND CDMAONE TO 3G SYSTEMS
Figure 6.49: The UTRA TDD burst types: (a) type 1 and (b) type 2.
Data DataMidamble
Guard Period
TF
CI
TF
CI
TP
C
Data DataMidamble
Guard Period
TF
CI
TF
CI
TP
C
Figure 6.50: The burst arrangement when TFCI and TPC data are included.
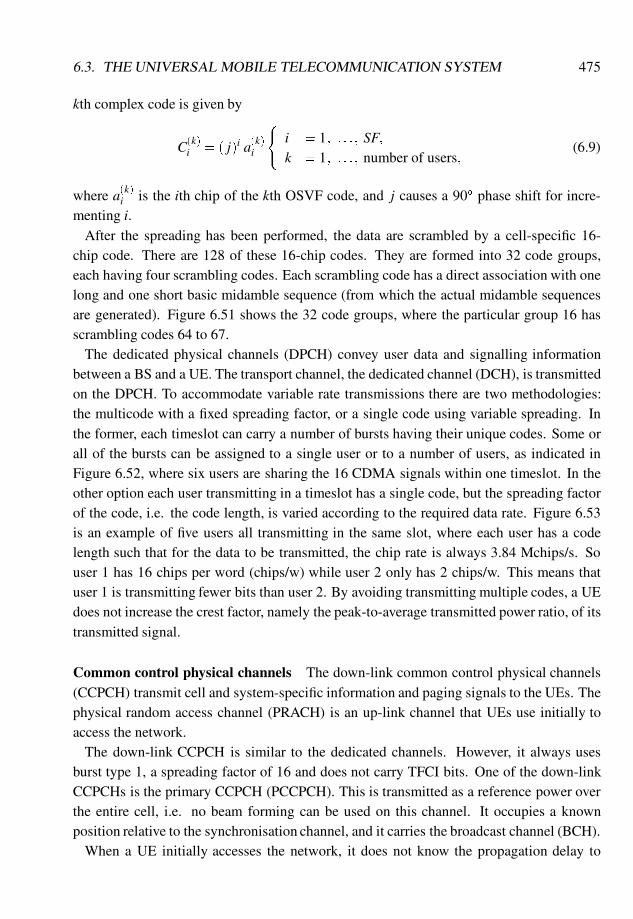
6.3. THE UNIVERSAL MOBILE TELECOMMUNICATION SYSTEM 475
kth complex code is given by
C(k)i = ( j)i a(k)
i
(i = 1; : : : ; SF;
k = 1; : : : ; number of users;(6.9)
where a(k)i is the ith chip of the kth OSVF code, and j causes a 90� phase shift for incre-
menting i.After the spreading has been performed, the data are scrambled by a cell-specific 16-
chip code. There are 128 of these 16-chip codes. They are formed into 32 code groups,each having four scrambling codes. Each scrambling code has a direct association with onelong and one short basic midamble sequence (from which the actual midamble sequencesare generated). Figure 6.51 shows the 32 code groups, where the particular group 16 hasscrambling codes 64 to 67.
The dedicated physical channels (DPCH) convey user data and signalling informationbetween a BS and a UE. The transport channel, the dedicated channel (DCH), is transmittedon the DPCH. To accommodate variable rate transmissions there are two methodologies:the multicode with a fixed spreading factor, or a single code using variable spreading. Inthe former, each timeslot can carry a number of bursts having their unique codes. Some orall of the bursts can be assigned to a single user or to a number of users, as indicated inFigure 6.52, where six users are sharing the 16 CDMA signals within one timeslot. In theother option each user transmitting in a timeslot has a single code, but the spreading factorof the code, i.e. the code length, is varied according to the required data rate. Figure 6.53is an example of five users all transmitting in the same slot, where each user has a codelength such that for the data to be transmitted, the chip rate is always 3.84 Mchips/s. Souser 1 has 16 chips per word (chips/w) while user 2 only has 2 chips/w. This means thatuser 1 is transmitting fewer bits than user 2. By avoiding transmitting multiple codes, a UEdoes not increase the crest factor, namely the peak-to-average transmitted power ratio, of itstransmitted signal.
Common control physical channels The down-link common control physical channels(CCPCH) transmit cell and system-specific information and paging signals to the UEs. Thephysical random access channel (PRACH) is an up-link channel that UEs use initially toaccess the network.
The down-link CCPCH is similar to the dedicated channels. However, it always usesburst type 1, a spreading factor of 16 and does not carry TFCI bits. One of the down-linkCCPCHs is the primary CCPCH (PCCPCH). This is transmitted as a reference power overthe entire cell, i.e. no beam forming can be used on this channel. It occupies a knownposition relative to the synchronisation channel, and it carries the broadcast channel (BCH).
When a UE initially accesses the network, it does not know the propagation delay to
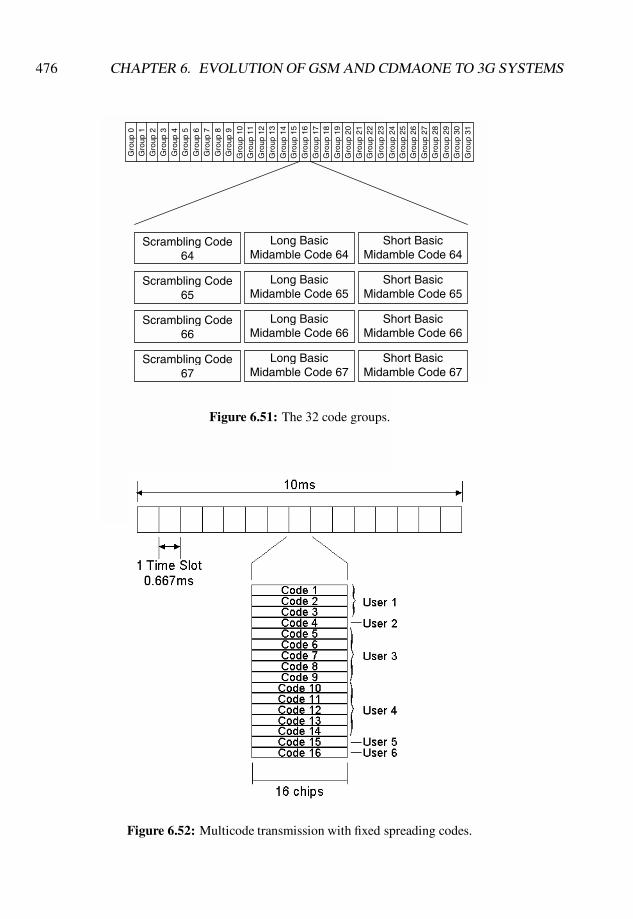
476 CHAPTER 6. EVOLUTION OF GSM AND CDMAONE TO 3G SYSTEMS
Gro
up 1
Gro
up 2
Gro
up 3
Gro
up 4
Gro
up 5
Gro
up 6
Gro
up 7
Gro
up 8
Gro
up 9
Gro
up 1
0G
roup
11
Gro
up 1
2G
roup
13
Gro
up 1
4G
roup
15
Gro
up 1
6G
roup
17
Gro
up 1
8G
roup
19
Gro
up 2
0G
roup
21
Gro
up 2
2G
roup
23
Gro
up 2
5G
roup
26
Gro
up 2
7G
roup
28
Gro
up 2
9G
roup
30
Gro
up 3
1
Gro
up 2
4
Scrambling Code 64
Long Basic Midamble Code 64
Short Basic Midamble Code 64
Scrambling Code 65
Long Basic Midamble Code 65
Short Basic Midamble Code 65
Scrambling Code 66
Long Basic Midamble Code 66
Short Basic Midamble Code 66
Scrambling Code 67
Long Basic Midamble Code 67
Short Basic Midamble Code 67
Gro
up 0
Figure 6.51: The 32 code groups.
Figure 6.52: Multicode transmission with fixed spreading codes.
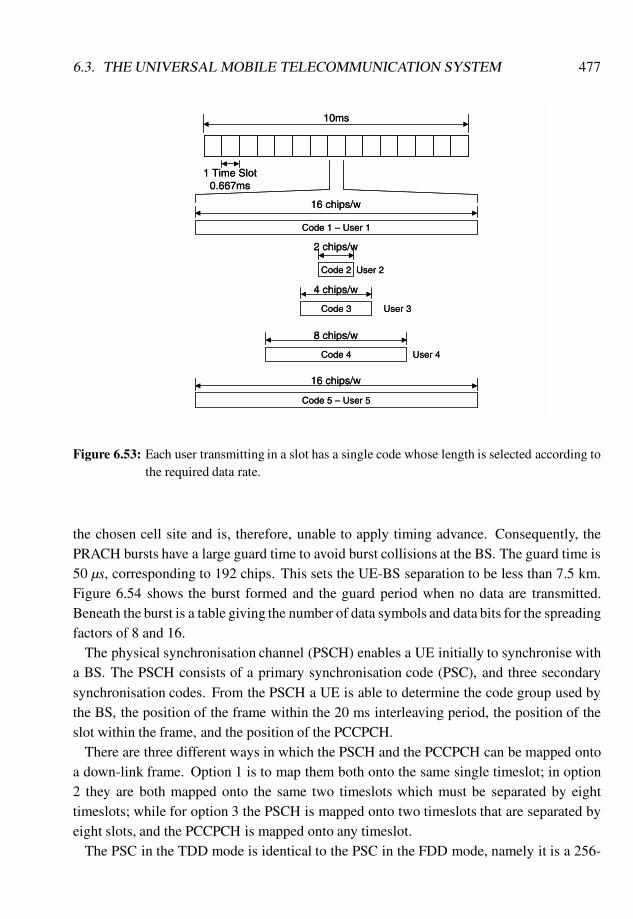
6.3. THE UNIVERSAL MOBILE TELECOMMUNICATION SYSTEM 477
Code 1 – User 1
Code 2
10ms
1 Time Slot0.667ms
User 2
2 chips/w
16 chips/w
Code 3 User 3
4 chips/w
Code 4 User 4
8 chips/w
Code 5 – User 5
16 chips/w
Code 1 – User 1
Code 2
10ms
1 Time Slot0.667ms
User 2
2 chips/w
16 chips/w
Code 3 User 3
4 chips/w
Code 4 User 4
8 chips/w
Code 5 – User 5
16 chips/w
Figure 6.53: Each user transmitting in a slot has a single code whose length is selected according tothe required data rate.
the chosen cell site and is, therefore, unable to apply timing advance. Consequently, thePRACH bursts have a large guard time to avoid burst collisions at the BS. The guard time is50 µs, corresponding to 192 chips. This sets the UE-BS separation to be less than 7.5 km.Figure 6.54 shows the burst formed and the guard period when no data are transmitted.Beneath the burst is a table giving the number of data symbols and data bits for the spreadingfactors of 8 and 16.
The physical synchronisation channel (PSCH) enables a UE initially to synchronise witha BS. The PSCH consists of a primary synchronisation code (PSC), and three secondarysynchronisation codes. From the PSCH a UE is able to determine the code group used bythe BS, the position of the frame within the 20 ms interleaving period, the position of theslot within the frame, and the position of the PCCPCH.
There are three different ways in which the PSCH and the PCCPCH can be mapped ontoa down-link frame. Option 1 is to map them both onto the same single timeslot; in option2 they are both mapped onto the same two timeslots which must be separated by eighttimeslots; while for option 3 the PSCH is mapped onto two timeslots that are separated byeight slots, and the PCCPCH is mapped onto any timeslot.
The PSC in the TDD mode is identical to the PSC in the FDD mode, namely it is a 256-
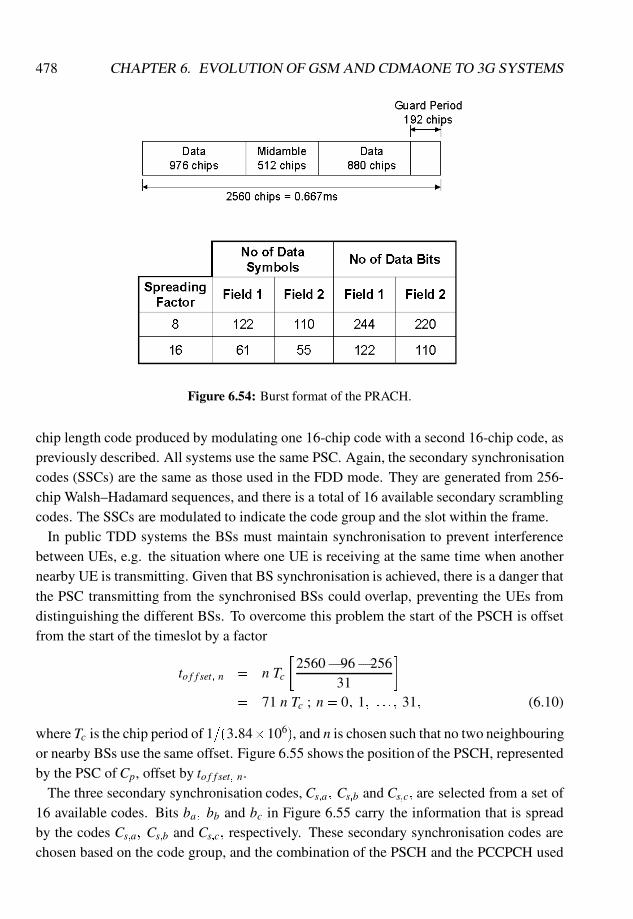
478 CHAPTER 6. EVOLUTION OF GSM AND CDMAONE TO 3G SYSTEMS
Figure 6.54: Burst format of the PRACH.
chip length code produced by modulating one 16-chip code with a second 16-chip code, aspreviously described. All systems use the same PSC. Again, the secondary synchronisationcodes (SSCs) are the same as those used in the FDD mode. They are generated from 256-chip Walsh–Hadamard sequences, and there is a total of 16 available secondary scramblingcodes. The SSCs are modulated to indicate the code group and the slot within the frame.
In public TDD systems the BSs must maintain synchronisation to prevent interferencebetween UEs, e.g. the situation where one UE is receiving at the same time when anothernearby UE is transmitting. Given that BS synchronisation is achieved, there is a danger thatthe PSC transmitting from the synchronised BSs could overlap, preventing the UEs fromdistinguishing the different BSs. To overcome this problem the start of the PSCH is offsetfrom the start of the timeslot by a factor
to f f set; n = n Tc
�2560�96�256
31
�
= 71 n Tc ; n= 0; 1; : : : ; 31; (6.10)
where Tc is the chip period of 1=(3:84�106), and n is chosen such that no two neighbouringor nearby BSs use the same offset. Figure 6.55 shows the position of the PSCH, representedby the PSC of Cp, offset by to f f set; n.
The three secondary synchronisation codes, Cs;a; Cs;b and Cs;c; are selected from a set of16 available codes. Bits ba; bb and bc in Figure 6.55 carry the information that is spreadby the codes Cs;a; Cs;b and Cs;c; respectively. These secondary synchronisation codes arechosen based on the code group, and the combination of the PSCH and the PCCPCH used
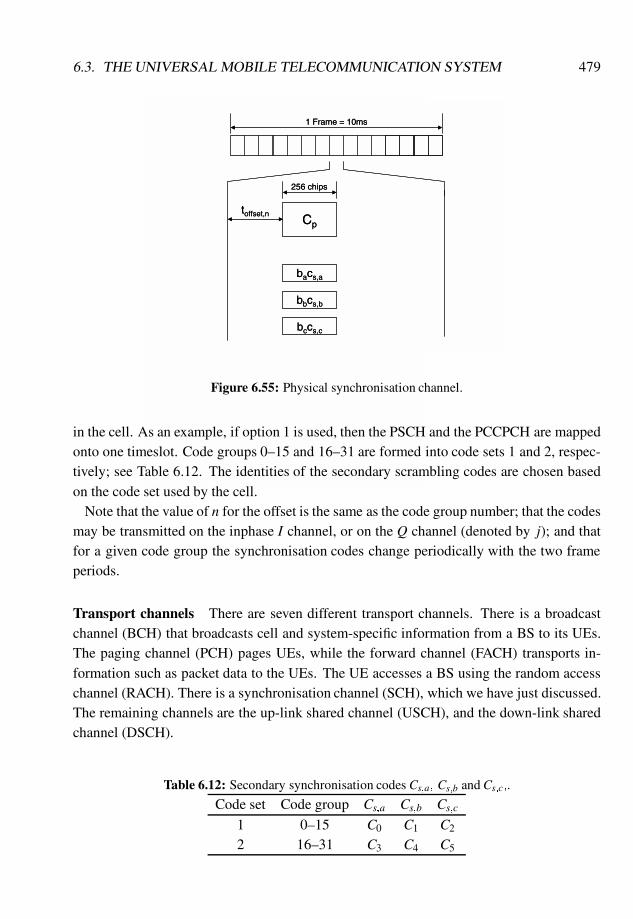
6.3. THE UNIVERSAL MOBILE TELECOMMUNICATION SYSTEM 479
Cp
bacs,a
bccs,c
toffset,n
256 chips
1 Frame = 10ms
bbcs,b
Cp
bacs,a
bccs,c
toffset,n
256 chips
1 Frame = 10ms
bbcs,b
Figure 6.55: Physical synchronisation channel.
in the cell. As an example, if option 1 is used, then the PSCH and the PCCPCH are mappedonto one timeslot. Code groups 0–15 and 16–31 are formed into code sets 1 and 2, respec-tively; see Table 6.12. The identities of the secondary scrambling codes are chosen basedon the code set used by the cell.
Note that the value of n for the offset is the same as the code group number; that the codesmay be transmitted on the inphase I channel, or on the Q channel (denoted by j); and thatfor a given code group the synchronisation codes change periodically with the two frameperiods.
Transport channels There are seven different transport channels. There is a broadcastchannel (BCH) that broadcasts cell and system-specific information from a BS to its UEs.The paging channel (PCH) pages UEs, while the forward channel (FACH) transports in-formation such as packet data to the UEs. The UE accesses a BS using the random accesschannel (RACH). There is a synchronisation channel (SCH), which we have just discussed.The remaining channels are the up-link shared channel (USCH), and the down-link sharedchannel (DSCH).
Table 6.12: Secondary synchronisation codes Cs;a; Cs;b and Cs;c;.
Code set Code group Cs;a Cs;b Cs;c
1 0–15 C0 C1 C2
2 16–31 C3 C4 C5
480 CHAPTER 6. EVOLUTION OF GSM AND CDMAONE TO 3G SYSTEMS
Power control The UE adjusts its initial up-link transmit power of the PRACH as in thecase of the FDD mode according to Equation (6.4), where Lp is the path loss measuredusing the PCCPCH. The value of the interference level IBS at the BS is broadcast on theBCH. Once a dedicated connection is established, the UE utilises open-loop power controlwhere the transmitted power of the UE is
PUE = αLp+(1�α)L0 + IBS+SIRtarget+C (6.11)
and L0 is the average long-term path loss, SIRtarget is the SIR the UE attempts to provideat the BS receiver, α is a weighting factor to smooth the changes in the UE transmit powerand C is a constant. The value of α can be selected as a function of the delay between thecurrent up-link timeslot and the most recent down-link access timeslot.
In addition to the open-loop power control exercised on the up-link, there is fast closed-loop power control on the down-link which is implemented using the TPC bits in the up-link burst. The UE periodically measures the down-link SIR and compares this with a targetvalue. If the target SIR value is less than the received SIR, then the UE sets its up-link TPCbit to a logical 0. The TPC bit is made a logical 1 if the target SIR exceeds the received SIR,causing the BS to increase its transmit power. The target SIR is set by a higher level outerloop.
Timing advance The UTRA TDD system can be used in wide area cells, but to achievethis a timing advance mechanism is necessary in order to prevent up-link burst collisions atthe BS receiver. The timing advance operates to a resolution of four chips or 1.04 µs. TheBS measures the time offset on the UE’s PRACH transmissions and calculates the UE’sinitial timing advance. The timing advance parameter is transmitted as an 8-bit numbergiving a maximum timing advance of 256� 1:04 µs corresponding to a range of 40 km.During a call the BS continuously measures the arrival time of the up-link transmissionsfrom the UE and transmits the appropriate timing advance parameter to the UE so that slotcollisions with other UEs are avoided.
There are proposals to have an enhanced timing advance mechanism with a resolutionof one-eighth of a chip period. This opens up the prospect of all the up-link transmissionswithin a slot arriving in synchronisation, and this will decrease the multiple access interfer-ence since all the transmitted codes from the UEs are orthogonal.
Handover The UE uses the same cell set classification as employed in the FDD mode,namely an active set, a handover monitoring set and a handover candidate set. An advantageof UTRA TDD over the FDD version is that the slotted mode of operation for neighbourBS measurements is not required because the TDMA structure provides this inherently.

6.3. THE UNIVERSAL MOBILE TELECOMMUNICATION SYSTEM 481
System performance Little information is available on system performance at the timeof writing. System level simulation results from UTRA Evaluation Document submitted tothe ITU in September 1988 are collated in Table 6.13 [31]. The speech service is at 8 kb/s;LCD means long constrained data bearer services and the numbers following LCD signifythe bit rate in kb/s; and UDD stands for unconstrained delay data bearer services which areat either 144, 384 or 2048 kb/s. LCD and UDD services are described in Section 6.3.1.5.The spectral efficiency for three different services in three different environments is shownin Table 6.13. We observe that for speech the spectral efficiency is the same for the vehicularand indoor environments, but is double for pedestrians in microcells.
An example of the link budget for the speech service in an indoor environment for UEsmoving at 3 km/h is provided in Table 6.14. We observe that the maximum range is greateron the down-link compared with the up-link.
Multiuser detection In Chapter 4 we described the single-user detection method used incdmaOne, where at a BS there is a separate receiver for each MS signal. This is a suboptimalapproach because the multiple access interference (MAI) between the users is not removed.Instead the presence of MAI is compensated for by a number of measures, such as accuratepower control, FEC coding, space diversity, variable bit rate source encoders, sectorisation,and so forth. The presence of MAI is due to radio channels that significantly degrade theorthogonality of the spreading codes used by the MSs when they arrive at their BS. Insteadthe cross-correlations between the received codes from the MSs at the BS are non-zeroand this creates the MAI. Failure to remove the MAI results in an irreducible bit error rate(BER).
Multiuser detection (MUD) CDMA receivers may be classified as optimal when usingmaximum likelihood sequence detection, and suboptimal when employing either joint de-tection (JD) or subtractive interference cancellation (SIC). JD receivers apply a linear map-ping to the soft outputs of the conventional matched filter detectors (MFDs), whereas anSIC receiver creates estimates of the interference that are then cancelled from the wantedsignals.
MUD receivers can be implemented at both the BS and MS. However, to avoid addedcomplexity at an MS the MUD can be used only at the BS receiver. Because the MAI islargely removed at the BS the MS can use less spreading (or less powerful FEC codes) andtherefore less bandwidth. Consequently, more bandwidth can now be assigned to the down-link, enabling high spreading codes to be deployed and thus raising the processing gain atthe MS receivers. The QoS on both links is subsequently enhanced.
The subject of MUD is vast and the reader is advised to consult References [26]– [29].All we will do here is to provide a brief introduction to this complex subject. The startingpoint is to appreciate that if there are K mobiles transmitting to a conventional CDMA BS
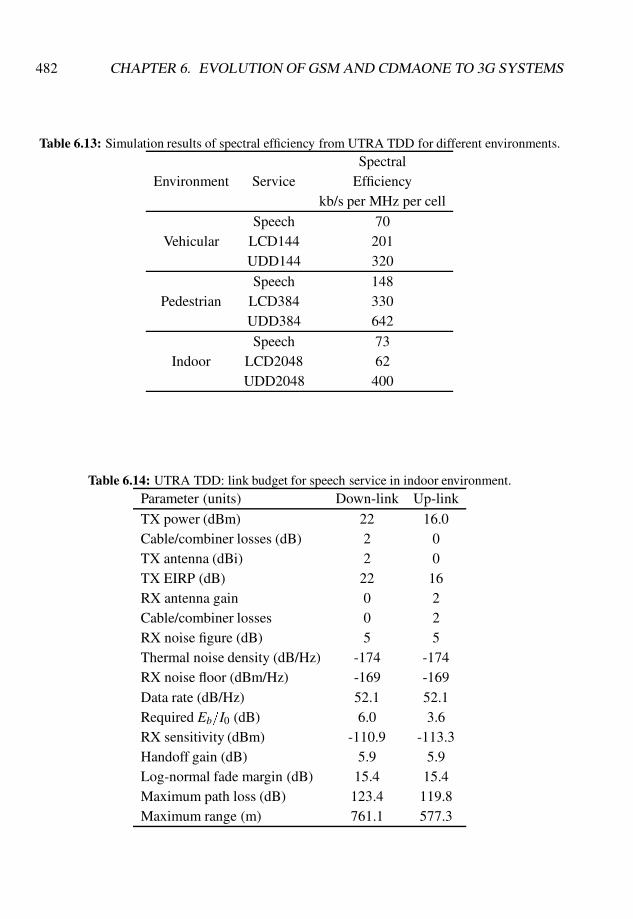
482 CHAPTER 6. EVOLUTION OF GSM AND CDMAONE TO 3G SYSTEMS
Table 6.13: Simulation results of spectral efficiency from UTRA TDD for different environments.Spectral
Environment Service Efficiencykb/s per MHz per cell
Speech 70Vehicular LCD144 201
UDD144 320
Speech 148Pedestrian LCD384 330
UDD384 642
Speech 73Indoor LCD2048 62
UDD2048 400
Table 6.14: UTRA TDD: link budget for speech service in indoor environment.Parameter (units) Down-link Up-link
TX power (dBm) 22 16.0Cable/combiner losses (dB) 2 0TX antenna (dBi) 2 0TX EIRP (dB) 22 16RX antenna gain 0 2Cable/combiner losses 0 2RX noise figure (dB) 5 5Thermal noise density (dB/Hz) -174 -174RX noise floor (dBm/Hz) -169 -169Data rate (dB/Hz) 52.1 52.1Required Eb=I0 (dB) 6.0 3.6RX sensitivity (dBm) -110.9 -113.3Handoff gain (dB) 5.9 5.9Log-normal fade margin (dB) 15.4 15.4Maximum path loss (dB) 123.4 119.8Maximum range (m) 761.1 577.3
6.3. THE UNIVERSAL MOBILE TELECOMMUNICATION SYSTEM 483
(we will ignore for simplicity intercellular interference) there are K single-user MFDs. Justprior to the hard-limiting detections we have the soft outputs of the MFDs. Since there areK of these soft outputs (yk;k = 1;2; : : :;K), then we may view the K outputs of the MSstransmitting to a BS as a vector y having K elements. A JD acts on this vector by applyinga linear mapping to either remove the MAI or drastically to decrease it. We may representthe vector of the soft outputs at a symbol epoch as
y = RAd+z (6.12)
where R is the matrix containing the partial cross-correlation functions between the receivedsignals from the MSs, A is a matrix containing the amplitude components of the channelimpulse response, d is the data vector and z is the noise vector. In the decorrelation detectorversions of the JD, the BS performs a subsequent operation on the y vector, namely
R�1y = R�1(RAd+z) (6.13)
= Ad+R�1z
= ddet:
All the MAI has been removed to yield Ad, but the noise is increased to R�1z by thematrix inversion. Computations of R�1 are difficult in real-time processing, particularly asK and the multipath delays are varying with time. The noise-enhancing effect is acceptable,provided K is not excessive, and that is why in UTRA TDD, K is restricted to a maximumvalue of four users per slot on the up-link when burst type 2 is used.
Another JD method is the minimum mean-squared error (MMSE) detector, which at-tempts to minimise the error between the true data d that is transmitted and the estimateddata d at the output of the JD. The error vector (d� d) is set to be orthogonal to the softoutput vector y. Rather than performing R�1y, the MMSE detector performs
�R+(No=2)A�2��1
; (6.14)
where No/2 is the power spectral density (PSD) of the additive white Gaussian noise (A-WGN). (We are conveniently avoiding channel fading here.) Using the MMSE detectorthe MAI is not completely removed, but the noise enhancement is less than that for thedecorrelation detector.
In our discourse we have described how a conventional bank of MFDs yields a vector ywhich is subsequently processed by a second receiver called a joint detection (JD) receiver.This latter receiver produces all K output symbols per system epoch, but from a joint pro-cess rather than from a set of parallel detectors as used in the first stage. It is by using JDthat the MAI can be eliminated or greatly decreased. JD is independent of the modulation
484 CHAPTER 6. EVOLUTION OF GSM AND CDMAONE TO 3G SYSTEMS
used (which is important in adaptive radio interfaces) and provides both MAI reduction,equalisation to mitigate intersymbol interference (ISI) and, when used with coherent re-ceiver diversity, it combats the effects of multipath fading. The receiver must know all thecodes used by the MSs; channel estimation is necessary for every MS, and estimation of thereceived signal levels may be required.
We turn now to the other form of multiuser detectors, namely SIC. These multiuser in-terference cancellation detectors are impressive, particularly when the y vector is processedfirst by a serial canceller followed by a cascade of parallel cancellers [32]. The single-userbound is attainable, which means that with K users the performance is as good as if onlyone user is present. The operation of a serial canceller will now be described with referenceto Figure 6.56. The received signal is a composite of K CDMA signals from the K MSs.Single-user MFD is done as previously described and the yk;k = 1; 2; : : : ;K; soft outputsare obtained as previously discussed in connection with JD. This time these soft outputs arenot processed as a vector. Instead the soft outputs are ranked in terms of amplitude. Forsimplicity we will assume that y1 is the largest amplitude, y2 the next largest amplitude,etc., with yK the smallest amplitude. In order to perform interference cancellation the re-ceived composite signal must be decomposed into its separate CDMA signals. A delay isintroduced into the received signal to allow for the MFD and the ranking process, and thedelayed received signal r(t) is applied to the serial canceller.
Because y1(t) has been identified as the largest amplitude we are very confident that ahard decision of y1(t) will not yield an error, and so the MFD of y1(t) is used to realise therecovered bit b1(t+τ0), where τ0 is the time for a signal to pass through a multiplier and anestimate of the channel. However, the other users will experience considerable interferencefrom MS1 as y1(t) is the largest soft output from the K MFDs. So b1(t+τ0) is multiplied byits code c1 (known to the BS) and the resulting signal is passed through an estimate of thebaseband radio channel for MS1 (which is computed by the BS, for example, with the aid ofa sounding sequence transmitted by MS1). This yields an estimate of the received CDMAsignal s1(t) from MS1, i.e. we have separated s1(t) from r(t). This CDMA componentis subtracted from r(t) and MFD ensues using c2 to give b2(t � τ+ τ0). This MFD isperformed in the presence of a lower MAI than originally experienced when the MAI fromthe strongest interferer MS1 was present. The next strongest component in r(t) is nowobtained by multiplying b2(t� τ+ τ0) by c2 and convolving it with the estimated impulseresponse h2(t) of MS2 to yield s2(t� τ), where τ is the added processing time. We nowdelay s1(t) by τ to give s1(t� τ) which is now co-phased with s2(t� τ), delay r(t) by τ togive r(t� τ), and then subtract these two large sources of MAI from r(t� τ). FollowingMFD we obtain a more accurate estimate of b3(t� 2τ+ τ0). The CDMA signal associatedwith MS3 is formed as s3(t� 2τ), i.e. delayed by 2τ relative to s1(t). To generate bitb4(t� 3τ+ τ0) we proceed in a similar fashion. This time signals r(t), s1(t); s2(t� τ) and
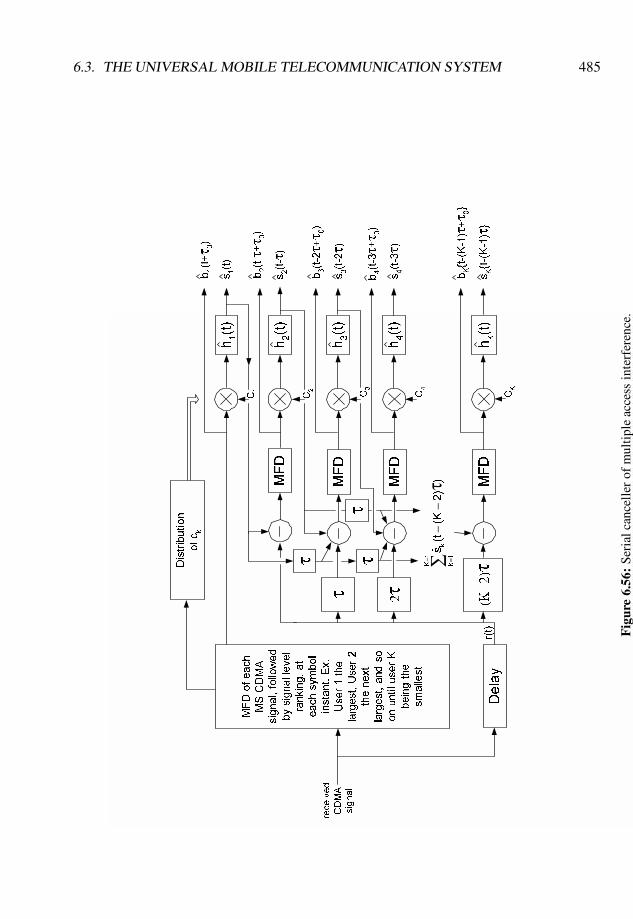
6.3. THE UNIVERSAL MOBILE TELECOMMUNICATION SYSTEM 485
0)'RIHDFK
06&'0$
VLJQDO�IROORZHG
E\VLJQDOOHYHO
UDQNLQJ�DW
HDFKV\P
ERO
LQVWDQW�([�
8VHU�WKH
ODUJHVW�8VHU�
WKHQH[W
ODUJHVW�DQGVR
RQXQWLOXVHU.
EHLQJWKH
VPDOOHVW
'HOD\
K��W�
K��W�
K��W�
KN�W�
W
W
0)'
0)'
0)'
'LVWULEXWLRQ
RIFN
&�
E��W�W��
V��W�
K��W�
W
0)'
E��W� W�W ��
&�
V��W� W�
E��W��W�W��
V��W��W�
�W
E��W��W�W ��
&�
V��W��W�
�.���W
W
UHFHLYHG
&'0$
VLJQDO
&.
E.^W��.��� W�W �`
V.^W��.��� W`
&�
U�W�
∑τ
− =
−−
�.
�N
N�
��
�.�W
VÖ
Fig
ure
6.56
:Se
rial
canc
elle
rof
mul
tipl
eac
cess
inte
rfer
ence
.
486 CHAPTER 6. EVOLUTION OF GSM AND CDMAONE TO 3G SYSTEMS
s3(t� 2τ) are involved. They must all be co-phased such that all are delayed by 2τ relativeto s1(t) by introducing additional delays shown by the blocks marked τ in Figure 6.56. Thisprocess of removing the interference by progressively using the separated CDMA signalsas they become available continues until we arrive at the MS that has the lowest soft output,namely MSK . For this MS, r(t) is delayed by (K � 2)τ and all the interferring CDMAsignals are co-phased with this delay relative to s1(t). MFD on the difference signal betweenr(t� (K� 2)τ) and all the co-phase interferring signals yields bK(t� (K� 1)τ+ τ0). Thenew sequence of bits fbkg is less likely to have errors compared with the sequence fbkgobtained from the outputs of the original set of MFD.
During the next symbol interval the ranking of the set of soft outputs from the single-userbank of MFDs may change. MSK may now not be the smallest user, nor MS1 the largest,say, and distribution of ck for each row of Figure 6.56 may change. The generation ofbk differs, but the time difference between the first symbol and the last is approximately(K�1)τ plus the delay in the MFD and ranking process. In general, this is a small fractionof a bit period.
We could continue with this serial cancellation technique using fbi(t)g, but it is better toemploy a parallel canceller [33]. The received signal r(t) is delayed some more (to allowfor the processing delay) to be rd(t). To create improved estimates of the data bits for MSi
(the ith ranked MS), we form
si(t�τ) = rd(t�τ)�K
∑k=1k6=i
sk(t�τ); i= 1;2; : : :;K; (6.15)
and these subtractions are implemented in parallel. Next, si(t�τ) for all i are MFD to yielda detected symbol for each MS. These symbols may be used as inputs to the next parallelcancellation stage. This process can continue until the single-user bound is approached.
Multiuser detection systems are likely to be introduced into both FDD and TDD CDMAsystems, but because of their complexity we may expect their arrival to be delayed.
6.4 Evolution of IS-95 to cdma2000
The pioneering of CDMA in cellular radio is due to Qualcomm Inc. Starting in the late1980s, Qualcomm embarked on a series of experiments that culminated in demonstratingthat CDMA had the potential to provide an efficient radio interface for use in cellular net-works. By July 1993, the Qualcomm proposals were adopted by the TelecommunicationsIndustry Association as Interim Standard 95 (IS-95) [34].
From its dual-mode beginnings with AMPS in the 800 MHz band, the auctioning of spec-trum in the 1900 MHz band (a 3G band) for PCS resulted in IS-95 operating in this higherband as a system in its own right. This enabled IS-95, in conjunction with IS-41-C [35], to
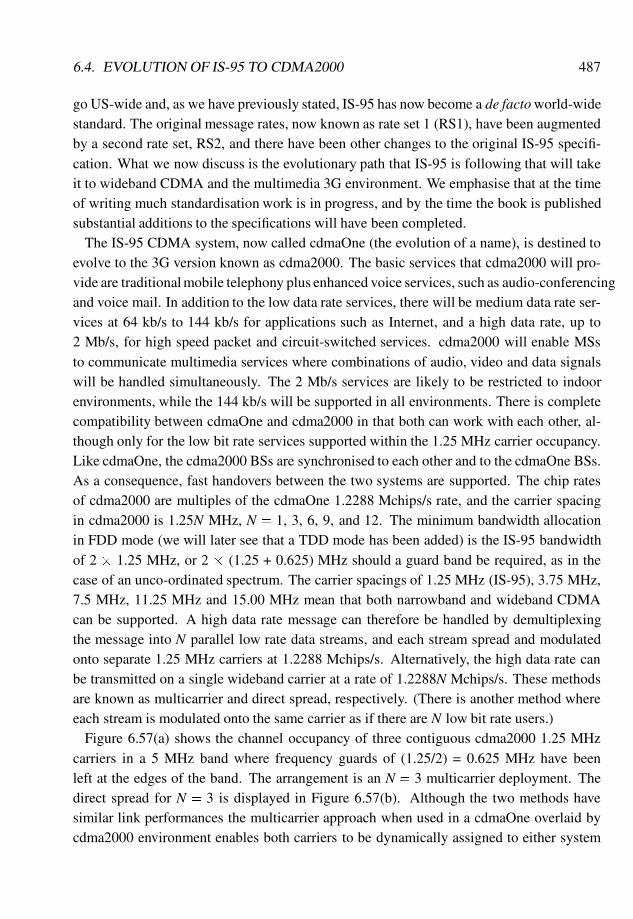
6.4. EVOLUTION OF IS-95 TO CDMA2000 487
go US-wide and, as we have previously stated, IS-95 has now become a de factoworld-widestandard. The original message rates, now known as rate set 1 (RS1), have been augmentedby a second rate set, RS2, and there have been other changes to the original IS-95 specifi-cation. What we now discuss is the evolutionary path that IS-95 is following that will takeit to wideband CDMA and the multimedia 3G environment. We emphasise that at the timeof writing much standardisation work is in progress, and by the time the book is publishedsubstantial additions to the specifications will have been completed.
The IS-95 CDMA system, now called cdmaOne (the evolution of a name), is destined toevolve to the 3G version known as cdma2000. The basic services that cdma2000 will pro-vide are traditional mobile telephony plus enhanced voice services, such as audio-conferencingand voice mail. In addition to the low data rate services, there will be medium data rate ser-vices at 64 kb/s to 144 kb/s for applications such as Internet, and a high data rate, up to2 Mb/s, for high speed packet and circuit-switched services. cdma2000 will enable MSsto communicate multimedia services where combinations of audio, video and data signalswill be handled simultaneously. The 2 Mb/s services are likely to be restricted to indoorenvironments, while the 144 kb/s will be supported in all environments. There is completecompatibility between cdmaOne and cdma2000 in that both can work with each other, al-though only for the low bit rate services supported within the 1.25 MHz carrier occupancy.Like cdmaOne, the cdma2000 BSs are synchronised to each other and to the cdmaOne BSs.As a consequence, fast handovers between the two systems are supported. The chip ratesof cdma2000 are multiples of the cdmaOne 1.2288 Mchips/s rate, and the carrier spacingin cdma2000 is 1.25N MHz, N = 1, 3, 6, 9, and 12. The minimum bandwidth allocationin FDD mode (we will later see that a TDD mode has been added) is the IS-95 bandwidthof 2 � 1.25 MHz, or 2 � (1.25 + 0.625) MHz should a guard band be required, as in thecase of an unco-ordinated spectrum. The carrier spacings of 1.25 MHz (IS-95), 3.75 MHz,7.5 MHz, 11.25 MHz and 15.00 MHz mean that both narrowband and wideband CDMAcan be supported. A high data rate message can therefore be handled by demultiplexingthe message into N parallel low rate data streams, and each stream spread and modulatedonto separate 1.25 MHz carriers at 1.2288 Mchips/s. Alternatively, the high data rate canbe transmitted on a single wideband carrier at a rate of 1.2288N Mchips/s. These methodsare known as multicarrier and direct spread, respectively. (There is another method whereeach stream is modulated onto the same carrier as if there are N low bit rate users.)
Figure 6.57(a) shows the channel occupancy of three contiguous cdma2000 1.25 MHzcarriers in a 5 MHz band where frequency guards of (1.25/2) = 0.625 MHz have beenleft at the edges of the band. The arrangement is an N = 3 multicarrier deployment. Thedirect spread for N = 3 is displayed in Figure 6.57(b). Although the two methods havesimilar link performances the multicarrier approach when used in a cdmaOne overlaid bycdma2000 environment enables both carriers to be dynamically assigned to either system
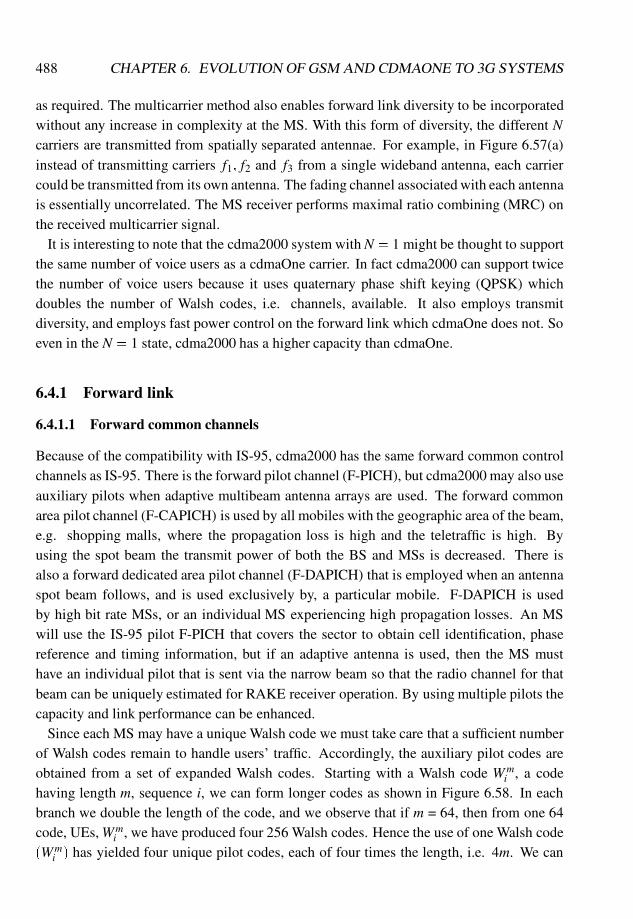
488 CHAPTER 6. EVOLUTION OF GSM AND CDMAONE TO 3G SYSTEMS
as required. The multicarrier method also enables forward link diversity to be incorporatedwithout any increase in complexity at the MS. With this form of diversity, the different Ncarriers are transmitted from spatially separated antennae. For example, in Figure 6.57(a)instead of transmitting carriers f1; f2 and f3 from a single wideband antenna, each carriercould be transmitted from its own antenna. The fading channel associated with each antennais essentially uncorrelated. The MS receiver performs maximal ratio combining (MRC) onthe received multicarrier signal.
It is interesting to note that the cdma2000 system with N = 1 might be thought to supportthe same number of voice users as a cdmaOne carrier. In fact cdma2000 can support twicethe number of voice users because it uses quaternary phase shift keying (QPSK) whichdoubles the number of Walsh codes, i.e. channels, available. It also employs transmitdiversity, and employs fast power control on the forward link which cdmaOne does not. Soeven in the N = 1 state, cdma2000 has a higher capacity than cdmaOne.
6.4.1 Forward link
6.4.1.1 Forward common channels
Because of the compatibility with IS-95, cdma2000 has the same forward common controlchannels as IS-95. There is the forward pilot channel (F-PICH), but cdma2000 may also useauxiliary pilots when adaptive multibeam antenna arrays are used. The forward commonarea pilot channel (F-CAPICH) is used by all mobiles with the geographic area of the beam,e.g. shopping malls, where the propagation loss is high and the teletraffic is high. Byusing the spot beam the transmit power of both the BS and MSs is decreased. There isalso a forward dedicated area pilot channel (F-DAPICH) that is employed when an antennaspot beam follows, and is used exclusively by, a particular mobile. F-DAPICH is usedby high bit rate MSs, or an individual MS experiencing high propagation losses. An MSwill use the IS-95 pilot F-PICH that covers the sector to obtain cell identification, phasereference and timing information, but if an adaptive antenna is used, then the MS musthave an individual pilot that is sent via the narrow beam so that the radio channel for thatbeam can be uniquely estimated for RAKE receiver operation. By using multiple pilots thecapacity and link performance can be enhanced.
Since each MS may have a unique Walsh code we must take care that a sufficient numberof Walsh codes remain to handle users’ traffic. Accordingly, the auxiliary pilot codes areobtained from a set of expanded Walsh codes. Starting with a Walsh code Wm
i , a codehaving length m, sequence i, we can form longer codes as shown in Figure 6.58. In eachbranch we double the length of the code, and we observe that if m = 64, then from one 64code, UEs, Wm
i , we have produced four 256 Walsh codes. Hence the use of one Walsh code(Wm
i ) has yielded four unique pilot codes, each of four times the length, i.e. 4m. We can
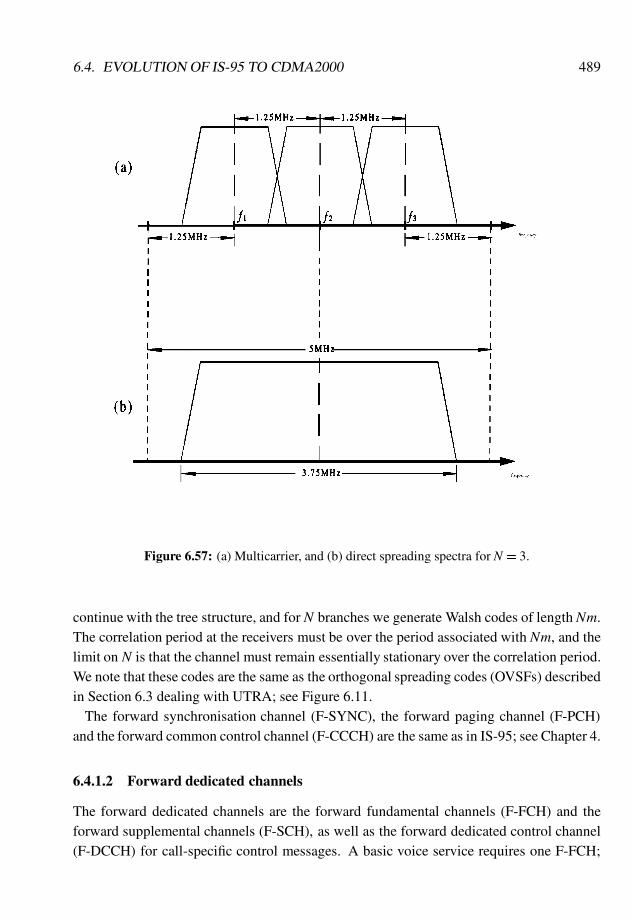
6.4. EVOLUTION OF IS-95 TO CDMA2000 489
Figure 6.57: (a) Multicarrier, and (b) direct spreading spectra for N = 3.
continue with the tree structure, and for N branches we generate Walsh codes of length Nm.The correlation period at the receivers must be over the period associated with Nm, and thelimit on N is that the channel must remain essentially stationary over the correlation period.We note that these codes are the same as the orthogonal spreading codes (OVSFs) describedin Section 6.3 dealing with UTRA; see Figure 6.11.
The forward synchronisation channel (F-SYNC), the forward paging channel (F-PCH)and the forward common control channel (F-CCCH) are the same as in IS-95; see Chapter 4.
6.4.1.2 Forward dedicated channels
The forward dedicated channels are the forward fundamental channels (F-FCH) and theforward supplemental channels (F-SCH), as well as the forward dedicated control channel(F-DCCH) for call-specific control messages. A basic voice service requires one F-FCH;
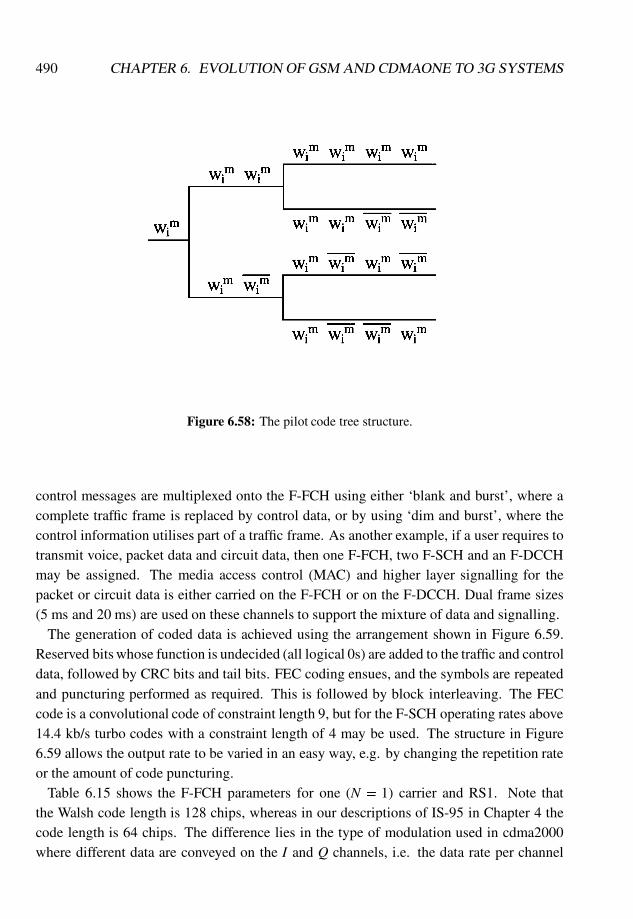
490 CHAPTER 6. EVOLUTION OF GSM AND CDMAONE TO 3G SYSTEMS
Figure 6.58: The pilot code tree structure.
control messages are multiplexed onto the F-FCH using either ‘blank and burst’, where acomplete traffic frame is replaced by control data, or by using ‘dim and burst’, where thecontrol information utilises part of a traffic frame. As another example, if a user requires totransmit voice, packet data and circuit data, then one F-FCH, two F-SCH and an F-DCCHmay be assigned. The media access control (MAC) and higher layer signalling for thepacket or circuit data is either carried on the F-FCH or on the F-DCCH. Dual frame sizes(5 ms and 20 ms) are used on these channels to support the mixture of data and signalling.
The generation of coded data is achieved using the arrangement shown in Figure 6.59.Reserved bits whose function is undecided (all logical 0s) are added to the traffic and controldata, followed by CRC bits and tail bits. FEC coding ensues, and the symbols are repeatedand puncturing performed as required. This is followed by block interleaving. The FECcode is a convolutional code of constraint length 9, but for the F-SCH operating rates above14.4 kb/s turbo codes with a constraint length of 4 may be used. The structure in Figure6.59 allows the output rate to be varied in an easy way, e.g. by changing the repetition rateor the amount of code puncturing.
Table 6.15 shows the F-FCH parameters for one (N = 1) carrier and RS1. Note thatthe Walsh code length is 128 chips, whereas in our descriptions of IS-95 in Chapter 4 thecode length is 64 chips. The difference lies in the type of modulation used in cdma2000where different data are conveyed on the I and Q channels, i.e. the data rate per channel
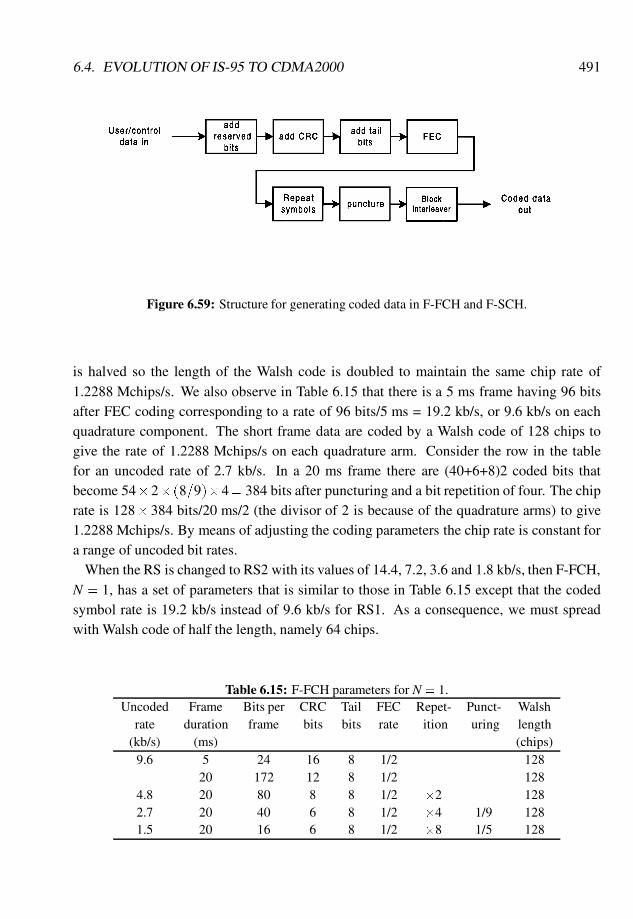
6.4. EVOLUTION OF IS-95 TO CDMA2000 491
Figure 6.59: Structure for generating coded data in F-FCH and F-SCH.
is halved so the length of the Walsh code is doubled to maintain the same chip rate of1.2288 Mchips/s. We also observe in Table 6.15 that there is a 5 ms frame having 96 bitsafter FEC coding corresponding to a rate of 96 bits/5 ms = 19.2 kb/s, or 9.6 kb/s on eachquadrature component. The short frame data are coded by a Walsh code of 128 chips togive the rate of 1.2288 Mchips/s on each quadrature arm. Consider the row in the tablefor an uncoded rate of 2.7 kb/s. In a 20 ms frame there are (40+6+8)2 coded bits thatbecome 54�2� (8=9)�4= 384 bits after puncturing and a bit repetition of four. The chiprate is 128� 384 bits/20 ms/2 (the divisor of 2 is because of the quadrature arms) to give1.2288 Mchips/s. By means of adjusting the coding parameters the chip rate is constant fora range of uncoded bit rates.
When the RS is changed to RS2 with its values of 14.4, 7.2, 3.6 and 1.8 kb/s, then F-FCH,N = 1, has a set of parameters that is similar to those in Table 6.15 except that the codedsymbol rate is 19.2 kb/s instead of 9.6 kb/s for RS1. As a consequence, we must spreadwith Walsh code of half the length, namely 64 chips.
Table 6.15: F-FCH parameters for N = 1.Uncoded Frame Bits per CRC Tail FEC Repet- Punct- Walsh
rate duration frame bits bits rate ition uring length(kb/s) (ms) (chips)
9.6 5 24 16 8 1/2 12820 172 12 8 1/2 128
4.8 20 80 8 8 1/2 �2 1282.7 20 40 6 8 1/2 �4 1/9 1281.5 20 16 6 8 1/2 �8 1/5 128
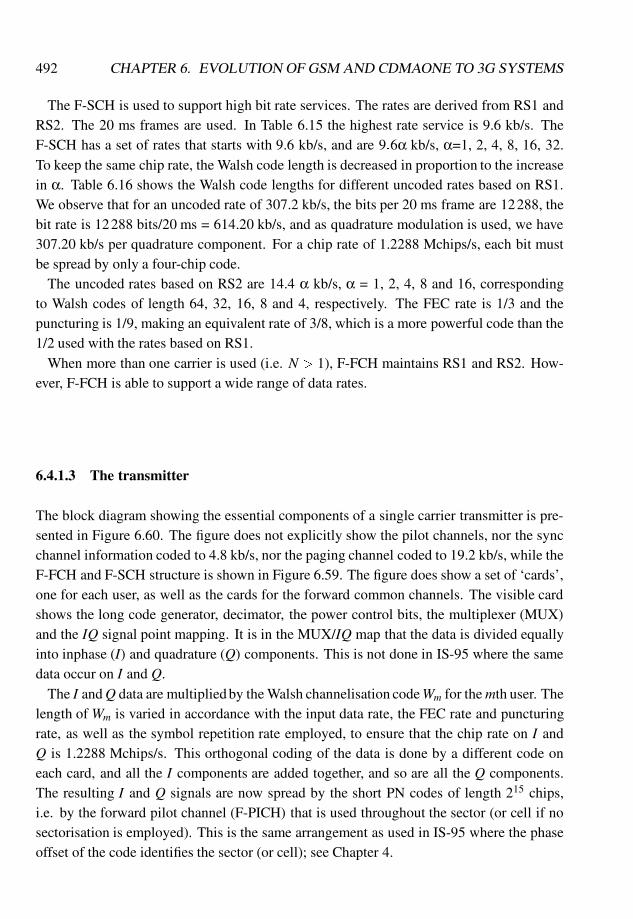
492 CHAPTER 6. EVOLUTION OF GSM AND CDMAONE TO 3G SYSTEMS
The F-SCH is used to support high bit rate services. The rates are derived from RS1 andRS2. The 20 ms frames are used. In Table 6.15 the highest rate service is 9.6 kb/s. TheF-SCH has a set of rates that starts with 9.6 kb/s, and are 9:6α kb/s, α=1, 2, 4, 8, 16, 32.To keep the same chip rate, the Walsh code length is decreased in proportion to the increasein α. Table 6.16 shows the Walsh code lengths for different uncoded rates based on RS1.We observe that for an uncoded rate of 307.2 kb/s, the bits per 20 ms frame are 12288, thebit rate is 12288 bits/20 ms = 614.20 kb/s, and as quadrature modulation is used, we have307.20 kb/s per quadrature component. For a chip rate of 1.2288 Mchips/s, each bit mustbe spread by only a four-chip code.
The uncoded rates based on RS2 are 14.4 α kb/s, α = 1, 2, 4, 8 and 16, correspondingto Walsh codes of length 64, 32, 16, 8 and 4, respectively. The FEC rate is 1/3 and thepuncturing is 1/9, making an equivalent rate of 3/8, which is a more powerful code than the1/2 used with the rates based on RS1.
When more than one carrier is used (i.e. N > 1), F-FCH maintains RS1 and RS2. How-ever, F-FCH is able to support a wide range of data rates.
6.4.1.3 The transmitter
The block diagram showing the essential components of a single carrier transmitter is pre-sented in Figure 6.60. The figure does not explicitly show the pilot channels, nor the syncchannel information coded to 4.8 kb/s, nor the paging channel coded to 19.2 kb/s, while theF-FCH and F-SCH structure is shown in Figure 6.59. The figure does show a set of ‘cards’,one for each user, as well as the cards for the forward common channels. The visible cardshows the long code generator, decimator, the power control bits, the multiplexer (MUX)and the IQ signal point mapping. It is in the MUX/IQ map that the data is divided equallyinto inphase (I) and quadrature (Q) components. This is not done in IS-95 where the samedata occur on I and Q.
The I andQ data are multiplied by the Walsh channelisation codeWm for the mth user. Thelength of Wm is varied in accordance with the input data rate, the FEC rate and puncturingrate, as well as the symbol repetition rate employed, to ensure that the chip rate on I andQ is 1.2288 Mchips/s. This orthogonal coding of the data is done by a different code oneach card, and all the I components are added together, and so are all the Q components.The resulting I and Q signals are now spread by the short PN codes of length 215 chips,i.e. by the forward pilot channel (F-PICH) that is used throughout the sector (or cell if nosectorisation is employed). This is the same arrangement as used in IS-95 where the phaseoffset of the code identifies the sector (or cell); see Chapter 4.
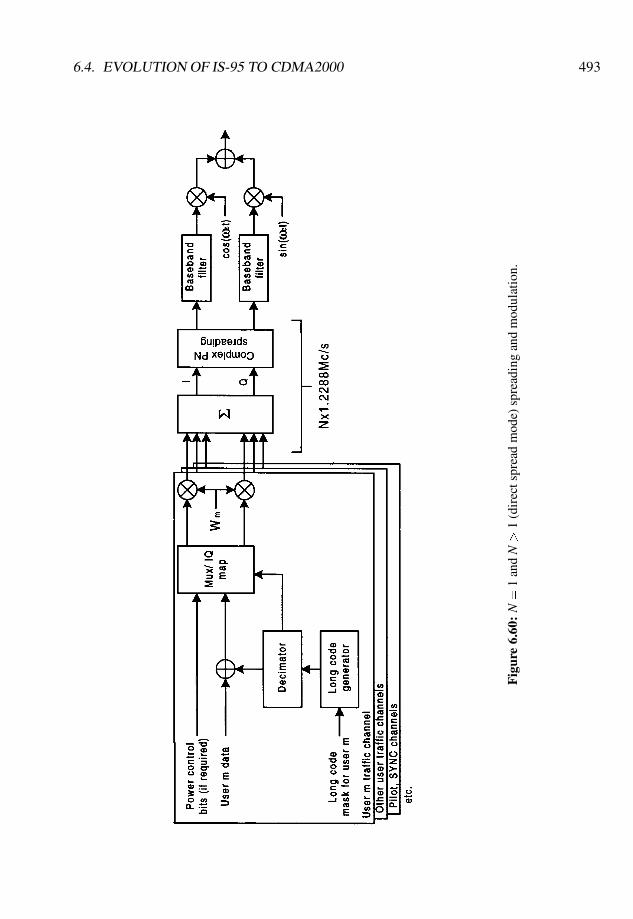
6.4. EVOLUTION OF IS-95 TO CDMA2000 493
Fig
ure
6.60
:N
=
1an
dN
>
1(d
irec
tspr
ead
mod
e)sp
read
ing
and
mod
ulat
ion.

494 CHAPTER 6. EVOLUTION OF GSM AND CDMAONE TO 3G SYSTEMS
Table 6.16: F-SCH parameters for N = 1.Uncoded Bits per CRC Tail FEC Punct- Rate out Walshrate (kb/s) frame bits bits rate uring (ks/s) length
9.6 168 16 8 1/2 9.6 12819.2 360 16 8 1/2 19.2 64
Rate set 38.4 744 16 8 1/2 38.4 321 (RS1) 76.8 1512 16 8 1/2 76.8 16
153.6 3048 16 8 1/2 153.6 8307.2 6120 16 8 1/2 307.2 414.4 264 16 8 1/3 1/9 19.2 64
Rate set 28.8 552 16 8 1/3 1/9 38.4 322 (RS2) 57.6 1128 16 8 1/3 1/9 76.8 16
115.2 2288 16 8 1/3 1/9 153.6 8230.4 4584 16 8 1/3 1/9 307.2 4
6.4.2 Reverse link
The reverse access channel (R-ACH) is used in conjunction with the reverse pilot channel(R-PICH) when an MS is attempting to access the network. These are the only reversecommon control channels. When operating at 9.6 kb/s, 172 bits containing the request have12 CRC and eight tail bits appended in a 20 ms frame. This is equivalent to 9.6 kb/s foreach quadrature signal. The R-ACH rate may be switched to 4.8 kb/s when the number ofinformation bits per packet decreases from 172 to 80. Figure 6.61 shows the block diagramof the R-ACH coding parameters for the 9.6 kb/s and 4.8 kb/s conditions.
The R-PICH that accompanies the R-ACH is a code that carries no data. Both the R-PICHand the R-ACH are the same for all MSs within a cell, and consequently MSs make their
Figure 6.61: R-ACH coding parameters: (a) 9.6 kb/s, (b) 4.8 kb/s.
6.4. EVOLUTION OF IS-95 TO CDMA2000 495
access attempts randomly, using a slotted ALOHA protocol. An access attempt is made upof access sub-attempts, which in turn consist of access probe sequences that have accessprobes. The access probe consists of an access preamble that is an integer multiple of 1.25ms, where the duration of this preamble is known to an MS from the BS broadcast message.The R-PICH is part of the access preamble, and successive access probes, each consisting ofan access preamble followed by an access message on the R-ACH, within an access probesequence, are transmitted at increased power until either the BS receives the sequence andresponds, or the maximum power level is reached without a BS response, which means theaccess attempt failed.
Having discussed the two reverse common control channels, namely the R-ACH and theR-PICH, we now consider the reverse dedicated channels. These are the reverse fundamen-tal channel (R-FCH), the reverse supplemental channel (R-DCCH) and the reverse pilotchannel (R-PICH). The R-PICH is identical to the R-PICH used with the R-ACH. Whenused as a dedicated channel, R-PICH is multiplexed with the power control (PC) bits in aframe consisting of three pilots followed by one PC bit. The duration of the frame is 1.25ms. The PC bit is repeated 384N times, N = 1, 3, 6, 9 or 12, to give 384N chips in 1.25ms, so the PC bit rate is 800 b/s transmitted at 307.2N kb/s. The three pilots and one PC bitevery 1.25 ms constitutes a power control group (PCG) having 4� 384N chips transmittedat a rate of 1.2288N Mchips/s. We observe that each pilot has 384N chips, and that thereare 16 PCGs in each 20 ms frame.
The R-FCH, R-SCH and R-DCCH are similar to the forward link counterparts, exceptthat only Walsh codes of 2 or 4 are used. Table 6.17 provides the coding parameters forR-FCH for N = 1. For RS1, 5 ms frame, we have 48 bits per frame that are 1/4 FEC codedand then each symbol is repeated eight times to give 1536 bits in 5 ms, corresponding toa rate of 307.2 kb/s. Again, for RS1, 20 ms frame, 16 message bits per frame, the outputrate is 30� 4� 8� (4=5)� 8 divided by 20 ms, namely 307.2 kb/s. This output rate of307.2 kb/s is obtained for all RS1 and RS2 rates, and by replacing each output symbol by afour-chip Walsh code yields a chip rate of 1.2288 Mchips/s. Both R-FCH and R-DCCH usea four-chip Walsh code. R-DCCH operates at a 9.6 kb/s uncoded rate, and uses the sameparameters as the R-FCH at this rate for either 5 ms or 20 ms frames; see rows one and twoin Table 6.17, respectively.
R-SCH has a wide range of rates and coding parameters as discussed in connection withTable 6.16. However, only two-chip Walsh codes are used when a single R-SCH is em-ployed, and a four-chip Walsh code when two R-SCH, are needed. This means that differentsequence and symbol repetition rates are necessary for RS1 and RS2 rates in order that onlytwo Walsh codes need be employed.
The low bit rate services only need one R-FCH, but higher rate and multimedia serviceswill require additional dedicated channels. Figure 6.62 shows reverse dedicated channel
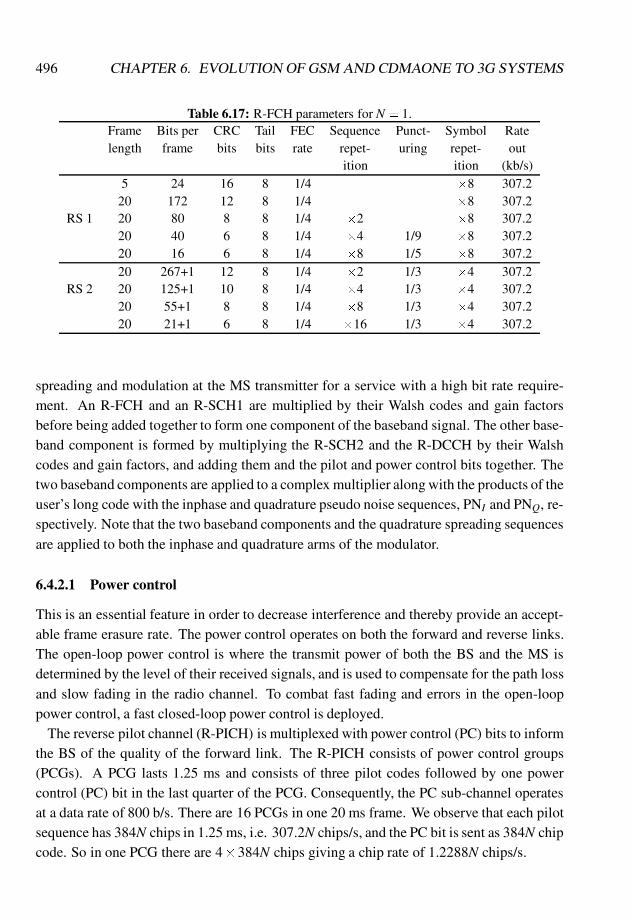
496 CHAPTER 6. EVOLUTION OF GSM AND CDMAONE TO 3G SYSTEMS
Table 6.17: R-FCH parameters for N = 1.Frame Bits per CRC Tail FEC Sequence Punct- Symbol Ratelength frame bits bits rate repet- uring repet- out
ition ition (kb/s)5 24 16 8 1/4 �8 307.2
20 172 12 8 1/4 �8 307.2RS 1 20 80 8 8 1/4 �2 �8 307.2
20 40 6 8 1/4 �4 1/9 �8 307.220 16 6 8 1/4 �8 1/5 �8 307.220 267+1 12 8 1/4 �2 1/3 �4 307.2
RS 2 20 125+1 10 8 1/4 �4 1/3 �4 307.220 55+1 8 8 1/4 �8 1/3 �4 307.220 21+1 6 8 1/4 �16 1/3 �4 307.2
spreading and modulation at the MS transmitter for a service with a high bit rate require-ment. An R-FCH and an R-SCH1 are multiplied by their Walsh codes and gain factorsbefore being added together to form one component of the baseband signal. The other base-band component is formed by multiplying the R-SCH2 and the R-DCCH by their Walshcodes and gain factors, and adding them and the pilot and power control bits together. Thetwo baseband components are applied to a complex multiplier along with the products of theuser’s long code with the inphase and quadrature pseudo noise sequences, PNI and PNQ, re-spectively. Note that the two baseband components and the quadrature spreading sequencesare applied to both the inphase and quadrature arms of the modulator.
6.4.2.1 Power control
This is an essential feature in order to decrease interference and thereby provide an accept-able frame erasure rate. The power control operates on both the forward and reverse links.The open-loop power control is where the transmit power of both the BS and the MS isdetermined by the level of their received signals, and is used to compensate for the path lossand slow fading in the radio channel. To combat fast fading and errors in the open-looppower control, a fast closed-loop power control is deployed.
The reverse pilot channel (R-PICH) is multiplexed with power control (PC) bits to informthe BS of the quality of the forward link. The R-PICH consists of power control groups(PCGs). A PCG lasts 1.25 ms and consists of three pilot codes followed by one powercontrol (PC) bit in the last quarter of the PCG. Consequently, the PC sub-channel operatesat a data rate of 800 b/s. There are 16 PCGs in one 20 ms frame. We observe that each pilotsequence has 384N chips in 1.25 ms, i.e. 307.2N chips/s, and the PC bit is sent as 384N chipcode. So in one PCG there are 4�384N chips giving a chip rate of 1.2288N chips/s.

6.4. EVOLUTION OF IS-95 TO CDMA2000 497
Fig
ure
6.62
:R
ever
sede
dica
ted
chan
nels
prea
ding
and
mod
ulat
ion
atth
eM
Str
ansm
itte
r.
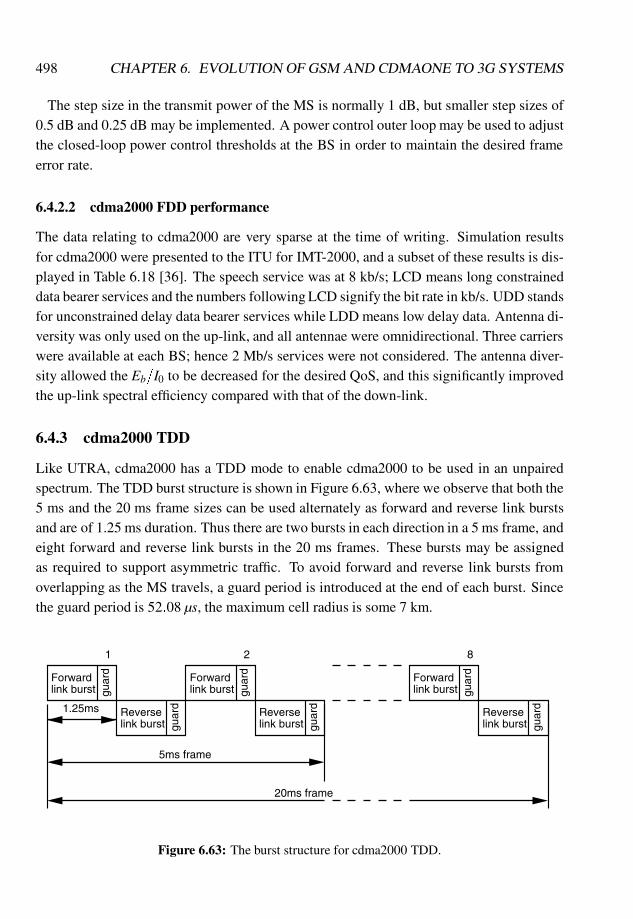
498 CHAPTER 6. EVOLUTION OF GSM AND CDMAONE TO 3G SYSTEMS
The step size in the transmit power of the MS is normally 1 dB, but smaller step sizes of0.5 dB and 0.25 dB may be implemented. A power control outer loop may be used to adjustthe closed-loop power control thresholds at the BS in order to maintain the desired frameerror rate.
6.4.2.2 cdma2000 FDD performance
The data relating to cdma2000 are very sparse at the time of writing. Simulation resultsfor cdma2000 were presented to the ITU for IMT-2000, and a subset of these results is dis-played in Table 6.18 [36]. The speech service was at 8 kb/s; LCD means long constraineddata bearer services and the numbers following LCD signify the bit rate in kb/s. UDD standsfor unconstrained delay data bearer services while LDD means low delay data. Antenna di-versity was only used on the up-link, and all antennae were omnidirectional. Three carrierswere available at each BS; hence 2 Mb/s services were not considered. The antenna diver-sity allowed the Eb=I0 to be decreased for the desired QoS, and this significantly improvedthe up-link spectral efficiency compared with that of the down-link.
6.4.3 cdma2000 TDD
Like UTRA, cdma2000 has a TDD mode to enable cdma2000 to be used in an unpairedspectrum. The TDD burst structure is shown in Figure 6.63, where we observe that both the5 ms and the 20 ms frame sizes can be used alternately as forward and reverse link burstsand are of 1.25 ms duration. Thus there are two bursts in each direction in a 5 ms frame, andeight forward and reverse link bursts in the 20 ms frames. These bursts may be assignedas required to support asymmetric traffic. To avoid forward and reverse link bursts fromoverlapping as the MS travels, a guard period is introduced at the end of each burst. Sincethe guard period is 52:08 µs, the maximum cell radius is some 7 km.
Forwardlink burst gu
ard
link burstReverse
guar
d
link burstForward
guar
d
link burstReverse
guar
d1.25ms
5ms frame
Reverselink burst
link burstForward
guar
d
guar
d
20ms frame
1 2 8
Figure 6.63: The burst structure for cdma2000 TDD.
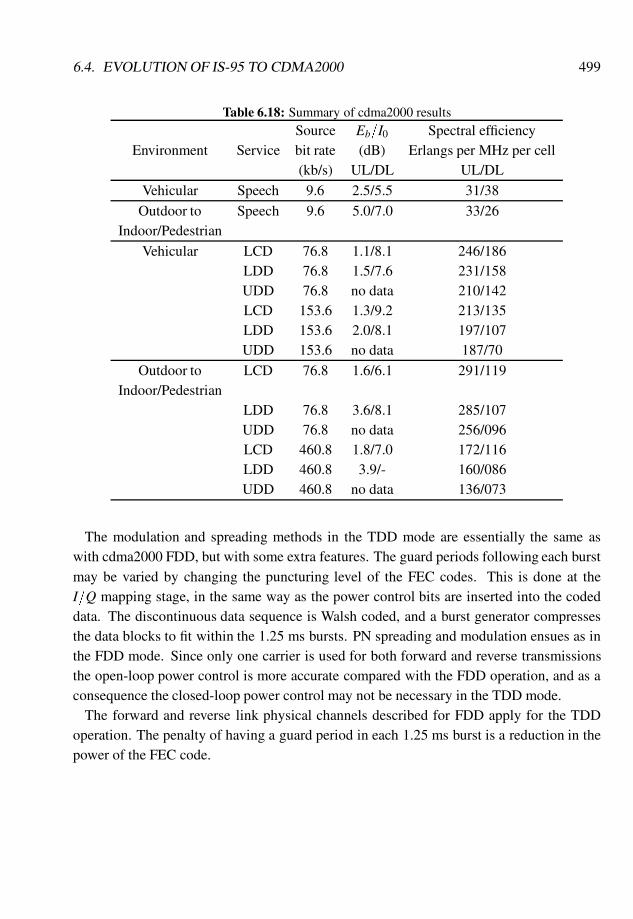
6.4. EVOLUTION OF IS-95 TO CDMA2000 499
Table 6.18: Summary of cdma2000 resultsSource Eb=I0 Spectral efficiency
Environment Service bit rate (dB) Erlangs per MHz per cell(kb/s) UL/DL UL/DL
Vehicular Speech 9.6 2.5/5.5 31/38
Outdoor to Speech 9.6 5.0/7.0 33/26Indoor/Pedestrian
Vehicular LCD 76.8 1.1/8.1 246/186LDD 76.8 1.5/7.6 231/158UDD 76.8 no data 210/142LCD 153.6 1.3/9.2 213/135LDD 153.6 2.0/8.1 197/107UDD 153.6 no data 187/70
Outdoor to LCD 76.8 1.6/6.1 291/119Indoor/Pedestrian
LDD 76.8 3.6/8.1 285/107UDD 76.8 no data 256/096LCD 460.8 1.8/7.0 172/116LDD 460.8 3.9/- 160/086UDD 460.8 no data 136/073
The modulation and spreading methods in the TDD mode are essentially the same aswith cdma2000 FDD, but with some extra features. The guard periods following each burstmay be varied by changing the puncturing level of the FEC codes. This is done at theI=Q mapping stage, in the same way as the power control bits are inserted into the codeddata. The discontinuous data sequence is Walsh coded, and a burst generator compressesthe data blocks to fit within the 1.25 ms bursts. PN spreading and modulation ensues as inthe FDD mode. Since only one carrier is used for both forward and reverse transmissionsthe open-loop power control is more accurate compared with the FDD operation, and as aconsequence the closed-loop power control may not be necessary in the TDD mode.
The forward and reverse link physical channels described for FDD apply for the TDDoperation. The penalty of having a guard period in each 1.25 ms burst is a reduction in thepower of the FEC code.
Bibliography
[1] System structure document, RACE 1043 (RACE MOBILE), Dec. 1991.
[2] de Boer H., RACE mobile communications, IEE Electron. Commun. Eng. J., 5(3),June 1993, 157–158.
[3] Chia S., The universal mobile telecommunication system, IEEE Commun. Mag.,30(12), Dec. 1992, 54–62.
[4] van den Broek ���, A.N. Brydon, J.M. Cullen, S. Kukkonen, A. Lensink, P.C. Masonand A. Tuoriniemi, Functional models of UMTS and integration into future networks,IEE Electron. Commun. Eng. J., 5(3), June 1993, 165–172.
[5] Steele R., The evolution of personal communications, IEEE Pers. Commun., 1(2),Second Quarter 1994, 6–11.
[6] Steele R., The therapy of Percy Comms: A dialogue on PCS issues, Int. J. WirelessCommun., 2(3), 1995, 123–132.
[7] Viterbi A.J., CDMA, Principles of Spread Spectrum Communications, Addison-Wesley, 1995.
[8] Prasad R., CDMA for Wireless Personal Communications, Artech House, 1996.
[9] Kohno R., R. Meidan and L.B. Milstein, Spread spectrum access methods for wirelesscommunications, IEEE Commun. Mag., Jan. 1995, 58–67.
[10] Gilhousen K.S., I.M. Jacobs, R. Padovani, A.J. Viterbi, L.A. Weaver and C.E. Wheat-ley, On the capacity of a cellular CDMA system, IEEE Trans. Veh. Technol., 40(2),1991, 303–312.
500
BIBLIOGRAPHY 501
[11] Padovani R., Reverse link performance of IS-95 based cellular systems, IEEE Pers.Commun. Mag., 1, Third Quarter 1994, 28–34.
[12] ETSI TS 101 038 Version 5.0.1 (1997-04), Digital Cellular Telecommunicatiions Sys-tem (Phase 2+); High Speed Circuit Switched Data (HSCSD)-Stage 2 (GSM 03.34).
[13] ETSI TS 03 64 Version 5.1.0 (1997-11), Digital Cellular Telecommunications System(Phase 2+); General Packet Radio Service (GPRS); Overall Description of the GPRSRadio Interface; Stage 2 (GSM 03.64, Version 5.1.0).
[14] Furuskar A., S. Mazur, F. Muller and H. Olofsson, EDGE: Enhanced data rates forGSM and TDMA/136 evolution, IEEE Pers. Commun., 6(3), June 1999, 56–66.
[15] Webb W.T. and R.D. Shenton, Pan-European railway communications: Where PMRand cellular meet, Electron. Commun. Eng. J., Aug. 1994, 195–202.
[16] Zvonar Z., P. Jung and K. Kammerlander, GSM, Evolution Towards 3rd GenerationSystems, Kluwer Academic Press, 1999.
[17] GSM 05.02, Digital Cellular Telecommunications System (Phase 2+); Multiplexingand Multiple Access on the Radio Path (GSM 05.02, Version 6.2.0, Release 1997).
[18] GSM 03.64, Digital Cellular TelecommunicationsSystem (Phase 2+); General PacketRadio Service (GPRS); Overall Description of the GPRS Radio Interface; Stage2(GSM 03.64, Version 7.1.0, Release 1998).
[19] GSM 03.60, Digital Cellular TelecommunicationsSystem (Phase 2+); General PacketRadio Service (GPRS); Service Description; Stage2 (GSM 03.60, Version 7.1.1, Re-lease 1998).
[20] Balachandran K., R. Ejzak, S. Nanda, S. Vitebskiy and S. Seth, GPRS-136: High-ratepacket data service for North America TDMA digital cellular systems, IEEE Pers.Commun., 6(3), June 1999, 34–47.
[21] EDGE Feasibility study, Work Item 184, Improved Data Rates Through OptimisedModulation, Version 1.0, 15–19 Dec. 1997.
[22] WWW.3GPP.ORG
[23] 3GPP Technical Specification Group (TSG) RAN WG4 UTRA (BS) FDD; RadioTransmission and Reception, 3GPP, TS 25.104, Version 3.0.0.
[24] 3GPP Technical Specification Group Radio Access Network; Spreading and Modula-tion (FDD), 3GPP, TS 25.213, Version 3.0.0.
502 BIBLIOGRAPHY
[25] 3GPP Technical Specification Group Radio Access Network; Physical Channels andMapping of Transport Channels (FDD), 3GPP, TS 25.211, Version 3.0.0.
[26] Verdu S., Multiuser Detection, Cambridge University Press, 1998.
[27] Ojanpera T., Multirate Multiuser Detectors for Wideband CDMA, Gummerus OY,Helsinki, Finland, 1999.
[28] Duel-Hallen A., J. Holtzman and Z. Zvonar, Multiuser detection for CDMA systems,IEEE Pers. Commun., 2(4) 1995, 46–58.
[29] Duel-Hallen A., A family of multiuser decision-feedback detectors for asynchronousCDMA channels, IEEE Trans. Commun., 43(2/3/4), 1995, 421–433.
[30] Optimum quadriphase primary scrambling codes for the uplink of UTRA/FDD, TdocSMG2 UMTS-L1, April 1998.
[31] UTRA Evaluation document (submitted to the ITU in September 1998), see ITU Website www.itu.int.
[32] Oon T.-B., R. Steele and Y. Li, Performance of an adaptive successive serial-parallelcancellation scheme in flat Rayleigh fading channels, Proc. IEEE VTC’97, Phoenix,USA, May 1997, 193–197.
[33] Mowbray R., R. Pringle and P. Grant, Increased CDMA system capacity through adap-tive channel interference regeneration and cancellation, IEE Proc.-I, 139(5), 1992,515–524.
[34] TIA/EIA Interim standard-95, ‘Mobile station – base station compatibility standardfor dual-mode wideband spread spectrum cellular systems, July 1993.
[35] Goodman D.J., Wireless Personal Communication Systems, Addison-Wesley, 1997.
[36] TIA Technical sub-committee TR-45.4, The cdma2000 ITU-RTT candidate submis-sion, Document TR45.5.4/98.06.15.04, 2, June 1998.
Index
Symbolsπ=4 Differential Quadrature Phase Shift Key-
ing : : : : : : : : : : : : : : : : : : : : : : : : : 421136 HS : : : : : : : : : : : : : : : : : : : : : : : : : : : : : : 421136+ : : : : : : : : : : : : : : : : : : : : : : : : : : : : : : : : 4218-Level Phase Shift Keying : : : : : : : : : : : : 420
AA Interface: : : : : : : : : : : : : : : : : : : : : : : :73, 424Abis Interface : : : : : : : : : : : : : : : : : : : : : : : : : 73Absolute Radio Frequency Carrier Number (AR-
FCN) : : : : : : : : : : : : : : : : : : : : : : : : 83Access Attempt : : : : : : : : : : : : : : : : : : : : : : :495Access Burst : : : : : : : : : : : : : : : : : : : : : : : : : : 88Access Channel
cdmaOne : : : : : : : : : : : : : : : : : : : 248, 249Access Channel Number (ACN) : : : : : : : : 250Access Grant Channel (AGCH)106, 129, 135Access Preamble : : : : : : : : : : : : : : : : : 451, 495Access Probe : : : : : : : : : : : : : : : : : : : : : : : : : 495Access Procedure : : : : : : : : : : : : : : : : : : : : : : 59Acquisition Indication Channel : : : : 437, 440Acquisition Indicator : : : : : : : : : : : : : 440, 456Active Set : : : : : : : : : : : : : : : : : : : : : : : : : : : :275Adaptive Multi-rate (AMR) Speech Coder409Adaptive-Step-Size Control Algorithm : : 378Additive White Gaussian Noise: : : : : : : : :292Adjacent Channel Leakage Power Ratio 428,
471Administration Centre (ADC) : : : : : : : : : : : 76Advanced Mobile Phone System (AMPS)205,
405
Advanced Speech Call Items (ASCI) : : : :409Algorithm A3 : : : : : : : : : : : : : : : : : :71, 74, 146Algorithm A5 : : : : : : : : : : : : : : : : : : : : : : : : 147Algorithm A8 : : : : : : : : : : : : : : : : : :71, 74, 147Ambiguity Function : : : : : : : : : : : : : : : : : : : : 93Antenna
BS : : : : : : : : : : : : : : : : : : : : : : : : : : : : : : : : 2MS : : : : : : : : : : : : : : : : : : : : : : : : : : : : : : : :2
Antenna Diversity : : : : : : : : : : : : : : : : : : : : :498Asymmetric Transmissions : : : : : : : : : : : : 411Authentication Centre (AuC): : : : : : : : :57, 74Authentication Procedures : : : : : : : : : : : : : : : 2Autocorrelation Function (ACF) : : : : : : : :238
BBack-off Delay : : : : : : : : : : : : : : : : : : : : : : : 256Bandwidth
coherence : : : : : : : : : : : : : : : : : : : : : : : 153Bandwidth Allocation : : : : : : : : : : : : : : : : : 163Base Station Controller (BSC) : : : : : : : : : :424
GSM : : : : : : : : : : : : : : : : : : : : : : : : : : : : :72Base Station Identity Code (BSIC) :104, 130,
138Base Station Subsystem (BSS) : : : : : : : : : : 73Base Transceiver Station (BTS) : : : : : : : : : :72Base Transceiver Station Class : : : : : : : : : : 85BCCH Carrier : : : : : : : : : : : : : : : : : : : : :87, 107Binary Frequency Shift Keying (BFSK) : : 49Binary Offset Quadrature Amplitude Modu-
lation : : : : : : : : : : : : : : : : : : : : : : : 420Binary Phase Shift Keying : : : : : : : : : : : : : : 27Bit Energy-to-Interference Power Spectral Den-
sity (PSD) Ratio : : : : : : : : : : : : : 375
503
504 INDEX
Bit Error Probability : : : : : : : : : : : : : : : : : : 341Bit Error Rate (BER) : : : : : : : : : : : 2, 160, 300Bit Interleaving : : : : : : : : : : : : : : : : : : : : : : : 426Blank and Burst : : : : : : : : : : : : : : : : : : : : : : 228Blocking Probability :: : : : : : : : : : : : : : : : : 153Broadcast Channel : : : : : : : : : : : 443, 475, 479Broadcast Control Channel (BCCH) : : : :105,
129, 131, 182Burst Randomisation : : : : : : : : : : : : : : : : : : 260Burst Structure : : : : : : : : : : : : : : : : : : : : : : : 471
CC Interface : : : : : : : : : : : : : : : : : : : : : : : : : : : : 74Candidate Set : : : : : : : : : : : : : : : : : : : : : : : : 275Capacity: : : : : : : : : : : : : : : : : : : : : : : : :179, 337
of a TDMA system : : : : : : : : : : : : : : : 177Capacity Degradation : : : : : : : : : : : : : : : : : 303Capacity Gain : : : : : : : : : : : : : : : : : : : : : : : : 337Capacity of IS-95 CDMA in Macrocells : 339Capacity of IS-95 in Street Microcells : : :367Carrier Frequency : : : : : : : : : : : : : : : : : : : : :156CDMA in a Single Macrocell : : : : : : : : : : 290CDMA Macrocellular Networks : : : : : : : : 308CDMA-PCS: : : : : : : : : : : : : : : : : : : : : : : : : :206cdma2000 : : : : : : : : : : : : : : : : : : : : : : : : : : : :487cdmaOne : : : : : : : : : : : : : : : : : : : : : : : : : : : : 487Cell : : : : : : : : : : : : : : : : : : : : : : : : : : : : : : : : : : : :7
cochannel : : : : : : : : : : : : : : 159, 162, 163cochannel hexagonal : : : : : : : : : : : : : :154multiple : : : : : : : : : : : : : : : : : : : : : : : : : : : 7omni : : : : : : : : : : : : : : : : : : : : : : : : : : : : 153per cluster : : : : : : : : : : : : : : : : : : : : : : : 170radius : : : : : : : : : : : : : : : : : : : : : : : : : : : 168sectorised: : : : : : : : : : : : : : : : : : : : : : : :153single : : : : : : : : : : : : : : : : : : : : : : : : : : : : : 2size : : : : : : : : : : : : : : : : : : : : : : : : : : : : : : 44
Cell Broadcast Channel (CBCH) : : : 105, 129Cell Capacity : : : : : : : : : : : : : : : : : : : : : : : : : 465Cell Search Procedure : : : : : : : : : : : : : : : : : 451CEPT : : : : : : : : : : : : : : : : : : : : : : : : : : : : : : : : : 65Channel
access : : : : : : : : : : : : : : : : : : : : : : : : : : : : 55associated control : : : : : : : : : : : : : : : : : 54broadcast : : : : : : : : : : : : : : : : : : : : : : : : : 55
coding : : : : : : : : : : : : : : : : : : : : : : : : 2, 153common control : : : : : : : : : : : : : : : : : : : 55dedicated control : : : : : : : : : : : : : : : : : : 54equalisation : : : : : : : : : : : : : : : : : : : 2, 153impulse response : : : : : : : : : : : : : : : : : : : 5logical: : : : : : : : : : : : : : : : : : : : : : : : : : : :54narrow band: : : : : : : : : : : : : : : : : : : : : : : :5paging: : : : : : : : : : : : : : : : : : : : : : : : : : : :55physical : : : : : : : : : : : : : : : : : : : : : : : : : : 54signalling : : : : : : : : : : : : : : : : : : : : : : : :153signalling or control : : : : : : : : : : : : : : : 54sounding : : : : : : : : : : : : : : : : : : : : : : : : : 24traffic : : : : : : : : : : : : : : : : : : : : : : : : 54, 153wideband : : : : : : : : : : : : : : : : : : : : : : : : : : 4
Channel Model : : : : : : : : : : : : : : : : : : : : 95, 370Channelisation Code : : : : : : : : : : : : : :431, 435Chip Rate : : : : : : : : : : : : : : : : : : : : : : : : : : : : 491Circuit-Switched : : : : : : : : : : : : : : : : : : : : : :413Closed Loop System : : : : : : : : : : : : : : : : : : : 43Closed-loop Power Control : : : 214, 281, 496Closed-loop Transmit Diversity : : : : : : : : :467Cluster : : : : : : : : : : : : : : : : : : : : : : : : : : : : : : : : : 8Cluster Size : : : : : : : : : : : : : : : : : 160, 163, 182Cochannel Separation : : : : : : : : : : : : : : : : : 172Code Division Multiple Access (CDMA) : :1,
26Code Excited Linear Predictive Codec (CELP)
18Code-Puncturing : : : : : : : : : : : : : : : : : : : : : :426Coding
FEC: : : : : : : : : : : : : : : : : : : : : : : : : : : : : :45rate : : : : : : : : : : : : : : : : : : : : : : : : : : : : : : 19
Coding Parameters : : : : : : : : : : : : : : : : : : : : 495Coherent 8-PSK : : : : : : : : : : : : : : : : : : : : : : 421Coherent QPSK : : : : : : : : : : : : : : : : : : : : : : 421Collision Detection Preamble : : : : : : : : : : 451Combined Open-Loop and Closed-Loop Power
Control : : : : : : : : : : : : : : : : : : : : : 380Common Control Physical Channels : : : : 475Common Pilot Channel : : : : : : : : : : : 435, 453Common Transport Channels : : : : : : : : : : 443Complimentary Error Function : : : : : : : : : 299Compressed Mode : : : : : : : : : : : : : : : : : : : : 462
INDEX 505
Convolutionalcoding: : : : : : : : : : : : : : : : : : : : : : : : : : : :18decoding : : : : : : : : : : : : : : : : : : : : : : : : : 23
Convolutional Codec : : : : : : : : : : : : : : : : : : 341Convolutional Coder : : : : : : : : : : : : : : : : : : 341Cross Correlation : : : : : : : : : : : : : : : : : : : : : 238Cross-Shaped Microcells : : : : : : : : : : : : : : 349Cyclically Redundancy Coded : : : : : : : : : :426
DD interface : : : : : : : : : : : : : : : : : : : : : : : : : : : : 74De-interleaving : : : : : : : : : : : : : : : : : : : : : : : : 23Dedicated Channel : : : : : : : : : : : : : : : : : : : : 443Dedicated Physical Channel : : : : : : : : : : : :475Dedicated Physical Control Channel : : : : 428Differential Phase Shift Keying (DPSK) : : 51Diffraction : : : : : : : : : : : : : : : : : : : : : : : : : : : 185Digital Enhanced Cordless Telecommunica-
tion System (DECT) : : : : : : : : : 156Dim and Burst : : : : : : : : : : : : : : : : : : : : : : : : 228Discontinuous Reception (DRX) : : : 133, 418Discontinuous Transmission (DTX) : 46, 153,
159, 177, 180, 182, 184, 189, 298Distribution
log-normal : : : : : : : : : : : : : : : : : : : : : : : : : 3Diversity Techniques : : : : : : : : : : : : : : : : : : : : 2Doppler Effect : : : : : : : : : : : : : : : : : : : : : : : : : : 5Down-link Common Physical Channel : :435,
437Down-link Outage Probability : : : : : : : : : :335Down-link Slot Format : : : : : : : : : : : : : : : : 430Down-link System : : : : : : : : : : : : : : : : : : : : 322Down-link with Orthogonal Codes : : : : : : 332Dummy Burst : : : : : : : : : : : : : : : : : : : : : : : : : 88Dwell Time : : : : : : : : : : : : : : : : : : : : : : : : : : : 49Dynamic Channel Allocation (DCA) : : : : 182
EE Interface : : : : : : : : : : : : : : : : : : : : : : : : : : : : 73EDGE Radio Interface: : : : : : : : : : : : : : : : :421Efficiency
modulation: : : : : : : : : : : : : : : : : : : : : : : : :9spectral : : : : : : : : : : : : : : : : : : : : : : : 9, 163trunking : : : : : : : : : : : : : : : : : : : : : : : : : : 15
EIRBlack List : : : : : : : : : : : : : : : : : : : : : : : : 75White List : : : : : : : : : : : : : : : : : : : : : : : : 75
Electronic Serial Number (ESN) : : : : : : : : : 57Encryption : : : : : : : : : : : : : : : : : : : : : : : : : : : : : 2Enhanced Circuit Switch Data : : : : : : : : : :421Enhanced Data Rates for GSM Evolution (EDGE)
420Enhanced GPRS : : : : : : : : : : : : : : : : : 409, 421Enhanced Multi-Level Precedence and Preemp-
tion service (eMLPP) : : : : : : : : :409Equaliser Test (EQ) Channel : : : : : : : : : : : : 96Equipment Identity Register (EIR) : : : :57, 75Even Second Marks : : : : : : : : : : : : : : 217, 221Evolution of GSM : : : : : : : : : : : : : : : : : : : : 407Evolution of GSM and cdmaone to 3G Sys-
tems : : : : : : : : : : : : : : : : : : : : : : : : 404Evolution of IS-95 to cdma 2000 : : : : : : : 486
FF interface: : : : : : : : : : : : : : : : : : : : : : : : : : : : :75Fading
fast : : : : : : : : : : : : : : : : : : : : : : : : : : : : : 166flat : : : : : : : : : : : : : : : : : : : : : : : : : : : : : : : : 4frequency selective : : : : : : : : : : : : : : : : : 4lognormal : : : : : : : : : : : : : : : : : : : : : : : 182shadow : : : : : : : : : : : : : : 3, 168, 177, 185
Fast Associated Control Channel (FACCH)105,127
Fast Closed-loop Power Control : : : : : : : : 480Fast Fading: : : : : : : : : : : : : : : : : : : : : : : : : : :290Feedback Information : : : : : : : : : : : : :428, 446Final Assembly Code (FAC) : : : : : : : : : : : : 75Fixed Channel Allocation (FCA) : : : : : : : 160Fixed-Step-Size Algorithm: : : : : : : : : : : : :380Forward Access Channel : : : : : : : : : : : : : : 443Forward Channel : : : : : : : : : : : : : : : : : : : : : 479Forward Common Area Pilot Channel : : :488Forward Common Channels : : : : : : : : : : : :488Forward Common Control Channel : : : : : 489Forward Dedicated Area Pilot Channel : : 488Forward Dedicated Channels : : : : : : : : : : : 489Forward Dedicated Control Channel : : : : 489Forward Error Correction (FEC) : : : : 19, 290
506 INDEX
Forward Fundamental Channels : : : : : : : : 489Forward link : : : : : : : : : : : : : : : : : : : : : : : : : 488Forward Paging Channel : : : : : : : : : : : : : : :489Forward Pilot Channel : : : : : : : : : : : : : : : : :488Forward Supplemental Channels : : : : : : : :489Forward Synchronisation Channel : : : : : : 489Frame Erasure Rate : : : : : : : : : : : : : : : : : : : 496Frame Synchronisation : : : : : : : : : : : : : : : : 452Frequency Correction Burst : : : : : : : : : : : : : 85Frequency Correction Channel (FCCH) :104,
130Frequency Division Duplex (FDD) : : : : : : : 16Frequency Division Multiple Access (FDMA)
16, 160Frequency Duplex : : : : : : : : : : : : : : : : : : : : 426Frequency Hopping : 153, 167, 177, 184, 188
baseband : : : : : : : : : : : : : : : : : : : : : : : : 156CDMA : : : : : : : : : : : : : : : : : : : : : : : : : : : 49
fast : : : : : : : : : : : : : : : : : : : : : : : : : : : : 49slow : : : : : : : : : : : : : : : : : : : : : : : : : : : 49
RF : : : : : : : : : : : : : : : : : : : : : : : : : : : : : : 156Frequency hopping : : : : : : : : : : : : : : : : : : : :180Frequency Planning : : : : : : : : : : : : : : : : : : : : 18
CDMA : : : : : : : : : : : : : : : : : : : : : : : : : : : 48Frequency Reuse : : : : : : : : : : : : : : : : : : : : : : : : 7Full-Rate Traffic Channel (TCH/F)
GSM : : : : : : : : : : : : : : : : : : : : : : : : : : : :102
GG Interface : : : : : : : : : : : : : : : : : : : : : : : : : : : : 74Gain Factor : : : : : : : : : : : : : : : : : : : : : : : : : : 447Gateway GPRS Support Node : : : : : : : : : : 413Gateway MSC (GMSC) : : : : : : : : : : : : : : : : 73Gateway Switch : : : : : : : : : : : : : : : : : : : : : : : 59Gaussian Q-function : : : : : : : : : : : : : : : : : : 341Gaussian Minimum Shift Keying (GMSK)24,
409Gaussian Random Variable: : : : : : : : : : : : :302General Packet Radio Service (GPRS) : : 408,
411Global Mobile Suppliers Association : : : :422Global System for Mobile Communications
(GSM) : : : : : : : : : : : : : : : : : : : : : : : : 1Gold Code : : : : : : : : : : : : : : : : : : : : : : : : 32, 433
GPRS Attach : : : : : : : : : : : : : : : : : : : : : : : : : 417GPRS Logical Architecture : : : : : : : : : : : : 413GPRS Mobility Management : : : : : : : : : : :417GPRS MS Classes : : : : : : : : : : : : : : : : : : : : 419GPRS Quality-of-Service : : : : : : : : : : : : : : 420GPRS Transmission Plane : : : : : : : : : : : : : 414GPRS Tunnelling Protocol : : : : : : : : : : : : : 414GPRS-equipped MS : : : : : : : : : : : : : : : : : : :417GSM
macrocellular network : : : : : : : : : : : : 154microcellular network : : : : : : : : : : : : :183
GSM Association : : : : : : : : : : : : : : : : : : : : : 422GSM Evolution (EDGE) : : : : : : : : : : : : : : :409GSM Phase 2+ : : : : : : : : : : : : : : : : : : : : : : : 408GSM Phase 2+ Core Network : : : : : : : : : : 424Guard Period : : : : : : : : : : : : : : : : : : : : : : : : : 473
HH Interface : : : : : : : : : : : : : : : : : : : : : : : : : : : : 74Hadamard Matrix : : : : : : : : : : : : : : : : : : : : : : 34Half-Rate Traffic Channel (TCH/H)
GSM : : : : : : : : : : : : : : : : : : : : : : : : : : : :103Hamming Distance : : : : : : : : : : : : : : : : : : : : : 19Handover : : : : : : : : : : : : : : : : : : : : : 47, 60, 480
hard (HHO) : : : : : : : : : : : : : : : : : : : : : : : 47idle mode : : : : : : : : : : : : : : : : : : : : : : : : : 59soft (SHO) : : : : : : : : : : : : : : : : : : : : : : : : 47softer (SSHO) : : : : : : : : : : : : : : : : : : : : : 47
Handover Candidate Set : : : : : : : : : : : : : : : 457Handover Procedure: : : : : : : : : : : : : : : : : : :456Hard Handover : : : : : : : : : : : : : : : : : : :275, 457Hard-decision Decoding : : : : : : : : : : : : : : : : 23High Speed Circuit Switched Data Service (HSCSD)
408, 410High-level Functions Required for GPRS 415Hilly Terrain (HT) Channel Model : : : : : : : 96Home Location Register (HLR) : :57, 74, 413Hopping Sequence Number (HSN) : : : : : 144Hyperframe : : : : : : : : : : : : : : : : : : : : : : : : : : 110
IiDEN System: : : : : : : : : : : : : : : : : : : : : : : : :405Idle Mode Handover : : : : : : : : : : : : : : : : : : 275Idle Time Slot : : : : : : : : : : : : : : : : : : : : : : : : 108
INDEX 507
Imperfect Power Control : : : : : : : : : : : : : : :299Imperfect Power Control in Macrocellular Net-
works : : : : : : : : : : : : : : : : : : : : : : :318IMT-2000 Family : : : : : : : : : : : : : : : : : : : : : 406IMT-2000 Frequency Bands : : : : : : : : : : : :467IMT-2000 Spectrum : : : : : : : : : : : : : : : : : : :407Inphase and Quadrature Spread Signals: :431Inphase Channel : : : : : : : : : : : : : : : : : : : : : : 447Integrated Services Digital Network (ISDN)2Intercellular Interference: : : : : : : : : : : : : : :309Intercellular Interference-to-Signal Ratio313,
318, 319Interference : : : : : : : : : : : : : : : : : : : : : : : : : : 156
adjacent channel : : : : : : : : : : : : : : : : : : :18cancellation : : : : : : : : : : : : : : : : : : : : : : : 49cochannel : : : : : : : : : : : : : : : : : : : : : : : 183cochannel,intercellular : : : : : : : : : : : : : : 8intercellular : : : : : : : : : : : : : : : 43, 44, 172intersymbol(ISI) : : : : : : : : : : : : : : : : 5, 25intracellular : : : : : : : : : : : : : : : : : : : : : : : 41power : : : : : : : : : : : : : : : : : : : : : : : : : : : 168
Interfering Sector : : : : : : : : : : : : : : : : :162, 163Interleavers : : : : : : : : : : : : : : : : : : : : : : : : : : : : : 2Interleaving : : : : : : : : : : : : : : : : : : : : : : : : : : : 23International Mobile Equipment Identity (IMEI)
75International Mobile Subscriber Identity (IMSI)
70, 133Internet Protocol (IP) : : : : : : : : : : : : : : : : : : 414Intracellular Interference: : : : : : : : : : : : : : :290Intracellular Interference-to-Signal ratio : 319Inverse Fourth Power Path Loss Law : : : : 303IPv6 Forum : : : : : : : : : : : : : : : : : : : : : : : : : : 422IS-136 : : : : : : : : : : : : : : : : : : : : : : : : : : : : : : : 420IS-95: : : : : : : : : : : : : : : : : : : : : : : : : : : :285, 487IS-95 Street Microcellular Networks : : : : 344Isotropic Radiator : : : : : : : : : : : : : : : : : : : : : : : 2
JJoint Detection : : : : : : : : : : : : : : : : : : : : : : : 481
KKc Key: : : : : : : : : : : : : : : : : : : : : : : : : : : : : : :147Ki Key : : : : : : : : : : : : : : : : : : : : : : : : 71, 74, 146
LLine-of-Sight (LOS)Path: : : : : : : : : : : : : : :185Link
down,forward : : : : : : : : : : : : : : : : : : : : : 16quality : : : : : : : : : : : : : : : : : : : : : : : : : : 182up,reverse : : : : : : : : : : : : : : : : : : : : : : : : 16
Location Area : : : : : : : : : : : : : : : : : 55, 74, 417Location Updating : : : : : : : : : : : : : : : : : : : : : 74Logical Channel
GSM : : : : : : : : : : : : : : : : : : : : : : : : : : : :102Logical Link Control : : : : : : : : : : : : : : : : : : 415Logical Link Management Functions : : : :417Lognormal Distribution : : : : : : : : : : : : : : : :185Long Code : : : : : : : : : : : : : : : : : : : : : : : : : : : 219Long Code Generator : : : : 216, 219, 250, 261Long Code Mask : : : : : : : : : : : : : : : : : 219, 261Long Code State : : : : : : : : : : : : : : : : : : : : : : 272Long PN Code: : : : : : : : : : : : : : : : : : : : : : : :219Long Scrambling Code : : : : : : : : : : : : : : : : 447Low Delay Data : : : : : : : : : : : : : : : : : : : : : : 498
Mm-sequences : : : : : : : : : : : : : : : : : : : : : : : : : : :32Macrocellular Planning Tools : : : : : : : : : : 195Macrodiversity: : : : : : : : : : : : : : : : : : : : : : : : :46Matched Filter Detection : : : : : : : : : : : : : : 481Matched Filters : : : : : : : : : : : : : : : : : : : : : : : 290Mathematical Symbols : : : : : : : : : : : : : : : : 285Maximal Ratio Combining (MRC) : : : 41, 47Maximum Ratio Diversity : : : : : : : : : : : : : 290Media Access Control : : : : : : : : : : : : : : : : : 490Medium Access Control: : : : : : : : : : :415, 418Microcells
boundaries : : : : : : : : : : : : : : : : : : : : : : :183cross-shape : : : : : : : : : : : : : : : : : : : : : : 191cross-shape city : : : : : : : : : : : : : : : : : : 183in city street : : : : : : : : : : : : : : : : : : : : : 185interfering : : : : : : : : : : : : : : : : : : : : : : : 186irregular shaped : : : : : : : : : : : : : : : : : : 194rectangular-shape : : : : : : : : : : : : 183, 192tessellated : : : : : : : : : : : : : : : : : : : : : : : 194
Midamble Training Sequence : : : : : : : : : : 471Minicells: : : : : : : : : : : : : : : : : : : : : : : : : : : : :195Minimal Free Distance : : : : : : : : : : : : : : : : : 22
508 INDEX
Mobile Allocation : : : : : : : : : : : : : : : : : : : : 144Mobile Allocation Index Offset (MAIO) :144Mobile Country Code (MCC) : : : : : : : : : : : 70Mobile Satellite Systems: : : : : : : : : : : : : : :405Mobile Services Switching Centre (MSC) 73Mobile Station (MS)
GSM : : : : : : : : : : : : : : : : : : : : : : : : : : : : : 69Mobile Station Class
GSM : : : : : : : : : : : : : : : : : : : : : : : : : : : : : 84Mobile Station International ISDN Number
(MSISDN) : : : : : : : : : : : : : : : : : : : 74Mobile Switching Centre (MSC) : : : : 56, 424Mobile Termination (MT) : : : : : : : : : : : : : : : 69Modulation
quadrature amplitude (QAM) : : : : : : : : 9MS Search Receiver : : : : : : : : : : : : : : : : : : :236MSC Area : : : : : : : : : : : : : : : : : : : : : : : : : : : : 73Multi-code Transmission : : : : : : : : : : : : : : 431Multicarrier Method : : : : : : : : : : : : : : : : : : :488Multiframe : : : : : : : : : : : : : : : : : : : : : : : : : : : 108Multimedia Services : : : : : : : : : : : : : : : : : : 447Multipath
signals: : : : : : : : : : : : : : : : : : : : : : : : : : : : :4Multiple Access Interference : : : : : : 341, 481Multiplex Option 1 : : : : : : : : : : : : : : : : : : : :228Multislot MSs : : : : : : : : : : : : : : : : : : : : : : : : 410Multiuser Detection : : : : : : : : : : : : : : : : : : : 481
NNarrow-band CDMA : : : : : : : : : : : : : : : : : : : 45Near–far Problem : : : : : : : : : : : : : : : : : : : : : 296Neighbour Set : : : : : : : : : : : : : : : : : : : : : : : : 275Network Management Centre (NMC) : : : : 76Network Switching Subsystem (NSS) : : : : 76Network Topology : : : : : : : : : : : : : : : : : : : : : 56Node B : : : : : : : : : : : : : : : : : : : : : : : : : : : : : : 445Normal
distribution : : : : : : : : : : : : : : : : : :156, 158random variable : : : : : : : : : : : : : 157, 158
Normal Burst : : : : : : : : : : : : : : : : : : : : : : : : : : 85Normal Distribution : : : : : : : : : : : : : : : : : : : 302
OOpen Loop System : : : : : : : : : : : : : : : : : : : : : 43
Open-loop Estimate : : : : : : : : : : : : : : 214, 253Open-loop Power Control : : : : : : : : : 480, 496Operations and Maintenance Centre (OMC)
57, 76Orthogonal Spreading Codes : : : : : : : : : : : 489Orthogonal Variable Spreading Factor : : :431Out-of-Sight (OOS) Path : : : : : : : : : : : : : : 185Outage Probability : : 299, 303, 320, 358, 365Overlapping Sectors : : : : : : : : : : : : : : : : : : :337
PPacket Access Grant Channel : : : : : : : : : : 418Packet Associated Control Channel : : : : : 419Packet Broadcast Control Channel : : : : : : 418Packet Common Control Channel : : : : : : :418Packet Data Channel : : : : : : : : : : : : : : : : : : 418Packet Data Logical Channels : : : : : : : : : : 418Packet Data Networks : : : : : : : : : : : : : : : : : 413Packet Data Protocol : : : : : : : : : : : : : : : : : : 415Packet Data Traffic Channel : : : : : : : : : : : :418Packet Notification Channel : : : : : : : : : : : :418Packet Paging Channel : : : : : : : : : : : : : : : : 418Packet Random Access Channel : : : : : : : : 418Packet Reservation Multiple Access (PRMA)
182Packet Services : : : : : : : : : : : : : : : : : : : : : : : 413Packet Switched Transmission: : : : : : : : : :421Packet Timing Advance Control Channel 419Packetisation Techniques : : : : : : : : : : : : : : : : :2Page Indication Channel : : : : : : : : : : : : : : : 438Page Indicators : : : : : : : : : : : : : : : : : : : : : : : 438Paging Channel : : : : : : : : : : : : : : : : : : 443, 479
cdmaOne : : : : : : : : : : : : : : : : : : : 209, 217GSM : : : : : : : : : : : : : : : : : : :106, 129, 133
Paging Channel Number (PCN) : : : : : : : : 219Path Loss : : : 2, 154, 160, 185, 290, 455, 480
break-distance : : : : : : : : : : : : : : : : : : : 185exponent : : : : : : : : : : : : : : : : : : : : : : : : 154law : : : : : : : : : : : : : : : : : : : : : : : : : : : : : 182
Path Loss Break-Distance : : : : : : : : : : : : : :358Performance of the Down-link: : : : : : : : : :364Persistence Algorithm : : : : : : : : : : : : : : : : : 455Personal Communications Network (PCN)183Phase Constellation

INDEX 509
cdmaOne : : : : : : : : : : : : : : : : : : : 211, 251Phase Shift Keying : : : : : : : : : : : : : : : : : : : : 290Physical Channel
GSM : : : : : : : : : : : : : : : : : : : : : : : : : : : :102Physical Common Packet Channel : : : : : : 449Physical Layer : : : : : : : : : : : : : : : : : : : 426, 471Physical Random Access Channel : : 447, 475Pilot Bit Patterns : : : : : : : : : : : : : : : : : 430, 445Pilot Bits : : : : : : : : : : : : : : : : : : : : : : : : : : : : :446Pilot Channel : : : : : : : : : : : : : : : : 209, 211, 272Pilot PN Offset : : : : : : : : : : : : : : 214, 221, 272Pilot Signal : : : : : : : : : : : : : : : : : : : : : : : : : : 305PNI : : : : : : : : : : : : : : : : : : : : : : : : : : : : : : : : : 211PNQ : : : : : : : : : : : : : : : : : : : : : : : : : : : : : : : : :211Point-to-Multipoint Multicast : : : : : : : : : : 417Point-to-Point Multipoint Group Call : : : 417Power Control :177, 180, 186, 290, 456, 473,
480, 495, 496errors : : : : : : : : : : : : : : : : : : : : : : : : : : : 166on the down-link : : : : : : : : : : : : : : : : : 175
Power Control Bits : : : : : : : : : : : : : : : : : : : : 446Power Control Group : : : : : : : : : : : : : : : : : :225Power Control in CDMA Systems : : : : : : 370Power Control Preamble : : : : : : : : : : : : : : : 451Power Control Scheme : : : : : : : : : : : : : : : : 377Power Control Sub-channel : : : : : : : : : : : : 225Preamble Scrambling Codes : : : : : : : : : : : 451Preamble Signature Codes : : : : : : : : : : : : : 443Preamble Signatures : : : : : : : : : : : : : : : : : : 448Primary Common Control Physical Channel
435Primary Scrambling Code: : : : :433, 440, 453Primary Synchronisation Code : : : : : 440, 451Private Long Code Mask : : : : : : : : : : : : : : :224Private Mobile Radio (PMR) : : : : : : 405, 409Processing Gain : : : : : : : : : : : : : : : : : : : : 37, 44Project Coordination Group : : : : : : : : : : : : 422Propagation Delay : : : : : : : : : : : : : : : : : : : : 292Protocol Data Unit (PDU) : : : : : : : : : : : : : 414Pseudo Noise Codes
PNI : : : : : : : : : : : : : : : : : : : : 251, 261, 272PNQ : : : : : : : : : : : : : : : : : : : 251, 261, 272
Public Land Mobile Network (PLMN) : : 413
Public Long Code Mask : : : : : : : : : : : : : : : 224Public Switch Telephone Network (PSTN) : 2Pulse Excited Linear Predictive Codec (RPE-
LTP) : : : : : : : : : : : : : : : : : : : : : : : : :18
QQPSK Modulator : : : : : : : : : : : : : : : : : : : : : 429Quadrature Channel : : : : : : : : : : : : : : : : : : : 447Quadrature Modulation : : : : : : : : : : : : : : : : 492Quadrature Phase Shift Keying : : : : : : : : : 473Quality-of-Service: : : : : : : : : : : : : : : :415, 420Quaternary Offset Quadrature Amplitude Mod-
ulation : : : : : : : : : : : : : : : : : : : : : : 420
RRadio
CDMA radio interface : : : : : : : : : : : : : 26cellular : : : : : : : : : : : : : : : : : : : : : : : : : : 2, 9modems : : : : : : : : : : : : : : : : : : : : : : : : : : : 2planning of cells : : : : : : : : : : : : : : : : : : : : 2propagation : : : : : : : : : : : : : : : : : : : : : : : : 2propagation in microcells: : : : : : : : : :185TDMA radio interface : : : : : : : : : : : : : 15
Radio Link Control : : : : : : : : : : : : : : : 415, 418Radio Resource Management Functions : 418RAKE Receiver : : : 2, 48, 242, 263, 290, 488RAND : : : : : : : : : : : : : : : : : : : : : : : : : : : : : : : 146Random Access Channel (RACH) : :106, 128Random Access Frame Structure : : : : : : : 449Rate Set 1 : : : : : : : : : : : : : : : : : : : : : : : 230, 487Rate Set 2 : : : : : : : : : : : : : : : : : : : : : : : 230, 261Received Power: : : : : : : : : : : : : : : : : : : : : : :154Received Signal Power : : : : : : : : : : : : : : : : 371Receiver
sensitivity : : : : : : : : : : : : : : : : : : : : : : : 4, 6Rectangular-Shaped Microcells : : : : : : : : :356Reduced TDMA Frame Number : : : : : : : :130Remaining Set : : : : : : : : : : : : : : : : : : : : : : : :276Repetition Length : : : : : : : : : : : : : : : : : : : : :471Reuse
distance : : : : : : : : : : : : : : : : : : : : : : : : : 163factor : : : : : : : : : : : : : : : : : : : : : : : : : : : 182
Reverse Access Channel : : : : : : : : : : : : : : : 494Reverse Fundamental Channel : : : : : : : : : 495
510 INDEX
Reverse Pilot Channel : : : : : : : : : : : : : : : : : 494Reverse Supplemental Channel : : : : : : : : : 495Routing Area : : : : : : : : : : : : : : : : : : : : : : : : : 417RS1 : : : : : : : : : : : : : : : : : : : : : : : : : : : : : : : : : 490RS2 : : : : : : : : : : : : : : : : : : : : : : : : : : : : : : : : : 492Rural Area (RA) Channel Model: : : : : : : : :95
SScrambling : : : : : : : : : : : : : : : : : : : : : : : : : : :219Scrambling Code : : : : : : : : : : : : : : : : : 433, 435Scrambling Code Group: : : : : : : : : : :440, 453Scrambling Code Identification : : : : : : : : : 453Secondary Code-group Identification : : : :452Secondary Common Control Physical Chan-
nel : : : : : : : : : : : : : : : : : : : : : : : : : 435Secondary Common Pilot Channel : : : : : :437Secondary Scrambling Code : : : : : : : : : : : 440Secondary Scrambling Codes : : : : : : : : : : 433Secondary Synchronisation Codes : 440, 452,
478Sector Antennae Patterns : : : : : : : : : : : : : : 337Sectorisation : : : : : : : : 13, 163, 179, 182, 337Sectorisation Efficiency : : : : : : : : : : : : : : : :340Selection Diversity : : : : : : : : : : : : : : : : : : : : 446Serial Number (SNR): : : : : : : : : : : : : : : : : : :75Serving GPRS Support Node : : : : : : : : : : : 413Shadowing Random Variable : : : : : : : : : : :154Shared Channel : : : : : : : : : : : : : : : : : : : : : : : 479Short Message Service (SMS) : : : : : : : : : : 414Short Scrambling Code : : : : : : : : : : : : : : : : 447Signal-to-Adjacent Channel Interference: :18Signal-to-Cochannel Interference : : : : : : : : 18Signal-to-Interference Ratio (SIR) : : : 2, 153,
163, 170, 175down-link : : : : : : : : : : : : : : : : : : : : : : : 175
Signal-to-Total-Interference Power Ratio 296Signalling
systems : : : : : : : : : : : : : : : : : : : : : : : : : : : :2Silence Descriptor Frame : : : : : : : : : : : : : : 119SIRmin : : : : : : : : : : : : : : : : : : : : : : : : : : :180, 184Slot and Frame Structure for the Up-link Trans-
missions. : : : : : : : : : : : : : : : : : : : :446Slot Format Structures : : : : : : : : : : : : : : : : :446Slot Synchronisation : : : : : : : : : : : : : : : : : : 451
Slotted ALOHA Protocol : : : : : : : : : : : : : : 495Slotted Paging
cdmaOne : : : : : : : : : : : : : : : : : : : : : : : : 221Slow Associated Control Channel (SACCH)
105, 127, 139, 142Slow Fading : : : : : : : : : : : : : : : : : : : : : : : : : :290Smart Antenna : : : : : : : : : : : : : : : : : : : : : : : 437Soft Capacity : : : : : : : : : : : : : : : : : : : : : : : : :340Soft Handover : : : : : : : : : : : : : : : 275, 277, 456Soft Handover Zones : : : : : : : : : : : : : : : : : : 337Soft-decision Decoding : : : : : : : : : : : : : : : : : 23Softer Handover : : : : : : : : : : : : : : : : : :279, 456Space Diversity Reception : : : : : : : : : : : : : 290Space–time Block Coding Transmit Diversity
467Special Mobile Radio (SMR) : : : : : : : : : : :405Spectral Efficiency : : : : : : : : : : : : : : : : : : : : 465Spectrum Spreading : : : : : : : : : : : : : : : : : : : : 30Speech
analysis-by-synthesis coding : : : : : : : :18coding : : : : : : : : : : : : : : : : : : : : : : : : : : : : :2
Spread Spectrum : : : : : : : : : : : : : : : : : : : : : : : 26Spreading : : : : : : : : : : : : : : : : : : : : : : : : : : : : 290Spreading Factor : : : : : : : : : : : : : : : : : 341, 429SRES : : : : : : : : : : : : : : : : : : : : : : : : : : : : : : : : 146Stand-alone Dedicated Control Channel (SD-
CCH) : : : : : : : : : : : : : : : : : : : : : : 106,129
Standard Deviation of Power Control Error302
Start-of-Message Flag (SOM) : : : : : : : : : : 216Subnetwork Dependent Convergence Proto-
col : : : : : : : : : : : : : : : : : : : : : : : : : 415Subscriber Identity Module (SIM) : : : : 69, 70Subtractive Interference Cancellation : : : 481Superframe: : : : : : : : : : : : : : : : : :110, 114, 471Superframe Offset : : : : : : : : : : : : : : : : : : : : 471Symbol Interleaving : : : : : : : : : : : : : : : : : : :290Symmetric Transmissions : : : : : : : : : : : : : :411Sync Channel
cdmaOne : : : : : : : : : : : : : : : 209, 215, 272Sync Channel Message : : : : : : : : : : : : : : : : 216Synchronisation Burst : : : : : : : : : : : : : : : : : : 87

INDEX 511
Synchronisation Channel : : : : : 438, 475, 479Synchronisation Channel (SCH) : : : 104, 129,
130System Capacity : : : : : : : : : : : : : : : : : : : : : : 358System Time : : : : : : : : : : : : : : : : : : : : :216, 272
TTDMA Frame : : : : : : : : : : : : : : : : : : : : : : : : 156Teletraffic : : : : : : : : : : : : : : : : : : : 179, 182, 183Temporary Mobile Subscriber Identity (TMSI)
145, 147Terminal Adapter (TA) : : : : : : : : : : : : : : : : : 70Terminal Equipment (TE) : : : : : : : : : : : : : : : 69The Dedicated Physical Data Channel : : : 428Third Generation (3G) : : : : : : : : : : : : : : : : :404Third Generation Partnership Project : : : : 422Time Division Duplex (TDD) : : : : : : : : : : 467Time Division Multiple Access (TDMA) : : 1,
16, 160, 180Time Slot : : : : : : : : : : : : : : : : : : : : : : : : : : : : 156Timing Advance : : : : : : : : : : : : : : : : : : : : : : 480Total Access Communications System (TACS)
405Traffic : : : : : : : : : : : : : : : : : : : : : : : : : : : : : : : 153Traffic Burst : : : : : : : : : : : : : : : : : : : : : : : : : : : 16Traffic Channel
cdmaOne : : : : : : : : : : 209, 223, 248, 258GSM : : : : : : : : : : : : : : : : : : : : : : : : : : : :102
Training Sequence : : : : : : : : : : : : : : : : : : : : : 85Training Sequence Code (TSC) : : : : : : : : : : 85Transmission Format Combination Indicator
473Transmit Diversity : : : : : : : : : : : : : : : : : : : : 446Transmit Power : : : : : : : : : : : : : : : : : : : : : : : 455Transmit Power Control : : : : : : : : : : : : : : : 428Transmitted Power : : : : : : : : : : : : : : : : : : : : 168Transmitted Spectrum: : : : : : : : : : : : :427, 468Transport Channels : : : : : : : : : : : : : : : 443, 479Transport Control Protocol (TCP): : : : : : :414Transport Format Combination Indicator 428Trellis Diagram : : : : : : : : : : : : : : : : : : : : : : : : 20Turbo Coding : : : : : : : : : : : : : : : : : : : : : : : : 426Type Approval Code (TAC) : : : : : : : : : : : : : 75Typical Urban (TU) Channel Model : : : : : : 96
UUMTS Forum : : : : : : : : : : : : : : : : : : : : : : : : 422UMTS Network Architecture: : : : : : : : : : :424UMTS Terrestrial Radio Interface (UTRA)426,
467Unconstrained Delay Data Bearer Services498Universal Coordinated Time (UTC) : : : : : 214Universal Mobile Telecommunication System
(UMTS) : : : : : : : : : : : : : : : : : : : : 422Universal Mobile Telecommunications System
(UMTS) : : : : : : : : : : : : : : : : : : : : 405Universal Wireless Communications Consor-
tium : : : : : : : : : : : : : : : : : : : : : : : : 422Universe Wireless Communications (UWC)
Consortium : : : : : : : : : : : : : : : : : 420Up-link Modulation and Spreading : : : : : 446Up-link SIR for
cross-shape microcellular network: :186rectangular-shape microcells : : : : : : :189
Up-Link System : : : : : : : : : : : : : : : : : : : : : : 309Up-link System : : : : : : : : : : : : : : : : : : : : : : : 290User Datagram Protocol (UDP) : : : : : : : : :415User Equipment : : : : : : : : : : : : : : : : : : : : : : 424UTRA Absolute Radio Frequency Channel Num-
ber : : : : : : : : : : : : : : : : : : : : : : : : :427,468
UTRA FDD Down-link : : : : : : : : : : : : : : : :429UTRA FDD Mode : : : : : : : : : : : : : : : : : : : : 426UTRA FDD Up-link : : : : : : : : : : : : : : : : : : 445UTRA Physical Channels : : : : : : : : : : : : : : 428UTRA TDD System: : : : : : : : : : : : : : : : : : :467UWC-136 : : : : : : : : : : : : : : : : : : : : : : : : : : : :420UWC-136 IMT EDGE : : : : : : : : : : : : : : : : 421
VVariable Rate Transmissions : : : : : : : : : : : 475Visitor Location Register (VLR) : : : : : 57, 74Viterbi
algorithm : : : : : : : : : : : : : : : : : : : : : : : : : 23equalisation : : : : : : : : : : : : : : : : : : : : : : : 26processor : : : : : : : : : : : : : : : : : : : : : : : : : 25
Viterbi Equaliser : : : : : : : : : : : : : : : : : : : : : : : 89Voice Activity
detection (VAD) : : : : : : : : : : : : : 159, 298
512 INDEX
factor (VAF) : : : : : : : : : : : : 159, 179, 301variable : : : : : : : : : : : : : : : : : : : : : 159, 298
Voice Broadcast Service (VBS) : : : : : : : : :409Voice Group Call Service (VGCS) : : : : : : 409
WWalsh Code32, 209, 220, 233, 249, 433, 443,
488Wideband CDMA : : : : : : : : : : : : : : : : : : : : : : 45Wireless Local Area Networks : : : : : : : : : 405


![CDMA JULIO [Modo de compatibilidad] - Ivan Bernalclusterfie.epn.edu.ec/.../ComInalam/ClasesNuevas/CDMA_JULIO.pdf · 4 Introducción • cdmaOne: denota la familia de tecnologías](https://img.pdfslide.net/doc/110x75/5b202b047f8b9ad34c8b5327/cdma-julio-modo-de-compatibilidad-ivan-4-introduccion-cdmaone-denota.jpg)