Embed Size (px)
Citation preview
General rights Copyright and moral rights for the publications made accessible in the public portal are retained by the authors and/or other copyright owners and it is a condition of accessing publications that users recognise and abide by the legal requirements associated with these rights.
Users may download and print one copy of any publication from the public portal for the purpose of private study or research.
You may not further distribute the material or use it for any profit-making activity or commercial gain
You may freely distribute the URL identifying the publication in the public portal If you believe that this document breaches copyright please contact us providing details, and we will remove access to the work immediately and investigate your claim.
Downloaded from orbit.dtu.dk on: Nov 22, 2021
Wind energy production in cold climate (WECO)
Tammelin, B.; Böhringer, A.; Cavaliere, M.; Holttinen, H.; Morgan, C.; Seifert, H.; Säntti, K.; Vølund, P.
Publication date:2000
Document VersionPublisher's PDF, also known as Version of record
Link back to DTU Orbit
Citation (APA):Tammelin, B., Böhringer, A., Cavaliere, M., Holttinen, H., Morgan, C., Seifert, H., Säntti, K., & Vølund, P. (2000).Wind energy production in cold climate (WECO). Finnish Meteorological Institute.
WIND ENERGY PRODUCTION IN COLD CLIMATE (WECO)
B. Tammelin, FMIM. Cavaliere, ENELH. Holttinen, VTTC. Morgan, GHH. Seifert, DEWIK. Säntti, FMI
FINNISH METEOROLOGICAL INSTITUTE
JOR3-CT95-0014
PUBLISHABLE REPORT
1 January 1996 to 31 December 1998
Research funded in part byTHE EUROPEAN COMMISSION
in the framework of theNon Nuclear Energy programme
JOULE III

2
TABLE OF CONTENTS
1 SUMMARY................................................................................................................ 42 PARTNERSHIP.......................................................................................................... 53 INTRODUCTION...................................................................................................... 54 OBJECTIVES ............................................................................................................. 85 TECHNICAL DESCRIPTION AND RESULTS ........................................................ 8
5.1 Icing map................................................................................................................. 85.2 Aerodynamics and Loads....................................................................................... 10
5.2.1 Icing of the blade............................................................................................ 115.2.2 Aerodynamics................................................................................................ 135.2.3 Loads ............................................................................................................ 20
5.3 Safety .................................................................................................................... 225.4 Anemometers......................................................................................................... 245.5 Ice detectors .......................................................................................................... 265.6 Power production................................................................................................... 26
5.6.1 Power measurements...................................................................................... 265.6.2 Theoretical modelling...................................................................................... 275.6.3 Icing effect on power production in various parts of Europe............................. 29
5.7 Heated blades ........................................................................................................ 315.8 Special needs for WTs operating under icing conditions........................................... 315.9 Information policy of the WECO project................................................................. 32
6 CONCLUSION........................................................................................................ 327 EXPLOITATION PLANS AND ANTICIPATION BENEFITS............................... 348 ACKNOWLEDGEMENTS ...................................................................................... 369 REFERENCES.......................................................................................................... 37
3
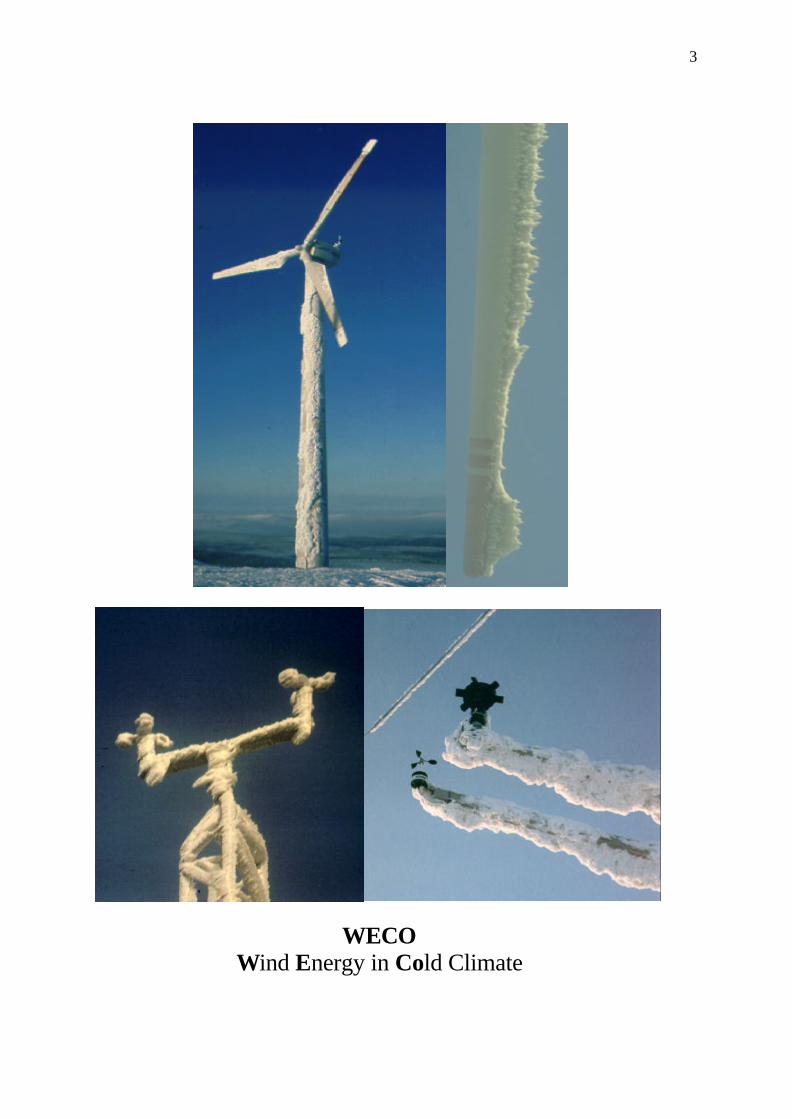
WECOWind Energy in Cold Climate
4
1 SUMMARY
This report introduces main results and recommendations of the research project “Wind EnergyProduction in COld climates” WECO (JOR3-CT95-0014), which was partially supported bythe European Commission DG XII Non Nuclear Energy Programme aiming at the investigationof wind turbines under cold climate operation.
It is shown experimentally and by numerical simulations that icing of rotor blades or othercomponents lead to decreased production due to ice accretion or safety demands. The icingeffect is directly related to the climate of the site of the wind turbine, and varies strongly fromregion to region in Europe. Extreme low air temperature again arises new demands for designparameters. Icing of anemometers and other wind gauges typically lead to wrong estimation ofwind power potential and operational problems of wind turbines.
The icing map over Europe, based on meteorological observations from 120 synoptic stations,show that icing and cold weather conditions occur in large regions in Europe, not only in theNordic countries but also especially at mountainous regions in Northern Europe, Germany,UK, Alps, Spain and central Italy. On the other hand new megawatt turbines are high enoughto encounter in-cloud icing even in lowlands. Following the method used to construct theEuropean wind atlas, icing data is presented to show how it affects on-site wind powerproduction.
Experimental data, wind tunnel simulations and numerical analyses were used to describe theice formation on wind turbine blades, to produce the Cl, Cd values, to calculate the powercurves for iced wind turbines, and to study the loads. Ice on blades usually decreases thepower production. At harsh sites the annual power loss may be up to 20-50 %. The projectalso produced a preliminary method to combine the European Wind Atlas method, iced powercurves and statistics of in-cloud icing to estimate annual or monthly losses due to icing atdesired site.
For environmental safety icing is a significant design parameter. New theoretical study in icethrow from the rotating blades was verified to observations. As preliminary results it isrecommended that for sites with high probability of icing (1) to keep distance 1.5 (hub height +rotor diameter) between the turbines and nearest objects, and (2) to stop the turbines duringthe icing period and wind coming from unfavourable directions.
Conventional and ice-free anemometers were tested at several sites in Europe. It was shownthat at ice en-dangered sites ice-free anemometers have to be used to avoid measurementerrors of wind speed. Due to use of non heated anemometers the wind potential is nowunderestimated at many regions in Europe. Icing of anemometers also lead to false operation ofwind turbines causing losses in power production. Thus it is recommended that all wind turbinesoperating under cold weather conditions ought to be equipped with ice free wind gauges.Turbines sited in mountains and in the far north have to have very strongly heated wind gauges.The intercomparisons and the market survey showed that there are some ice free gaugessuitable for sites with less heavy icing are available today, but there is a need to produceaccurate and reliable anemometers for heavily iced regions.Keywords: Wind turbines, icing, low temperature, load, power production, ice-free anemometers
5
2 PARTNERSHIP
The WECO partners.
CoordinatorFinnish Meteorological Institute, FMI Energy, Vuorikatu 24, 00100 Helsinki, FinlandContact person: Bengt Tammelin
Partners
Deutsches Windenergie-Institut (DEWI), Ebertstr. 96, 26382 Wilhelmshaven, GermanyContact person: Henry Seifert
VTT Energy, P.O.Box 1606, 02044 VTT, FinlandContact person: Hannele Holttinen
Garrad Hassan, UK The Coach House, Folleigh Lane Long Ashton, Bristol BS18 9JBGreat BritainContact person: Colin Morgan
Risö National Laboratory, P.O.Box 49, DK-4000 Roskilde DenmarkContact person: Per Harvoe
Associated contractors:
Energie-Versorgung Schwaben AG (EVS), GermanyContact person: Ralf Neulinger
Technische Universität Braunschwaig (TUB) Schleinitzstr. 20,38106 BraunschweigGermanyContact person: Dietrich Rex
3 INTRODUCTION
Cold climate has not been a factor which has been taken into account in details in the planningand operation of wind turbines. Until the very latest years the wind turbines have been mainlyerected on coastal sites in less hostile environments, where air temperature far below freezingpoint, freezing rain or in-cloud icing forming strong ice cover on the structures or even sea icedo not occur or they have very marginal importance as design parameters.
However, there is a growing and identified interest to erect more wind turbines at sites affectedeven by heavy icing conditions in various parts of Europe, like mountainous regions in NorthernEurope, Germany, UK, Alps and central Italy. It is estimated [13] that about 20 per cent of theinstalled wind power (8000 MW by the year 2010) is going to be realised at sites were icinghas to be taken into account in order to utilise the existing wind energy potential in Europe. TheEU/JOULE3 WECO (Wind Energy Production in COld Climates) project addressed many of
6
the questions connected to the problems expected and produced information andrecommendations to assist in the exploitation of cold climate sites [16], [17].
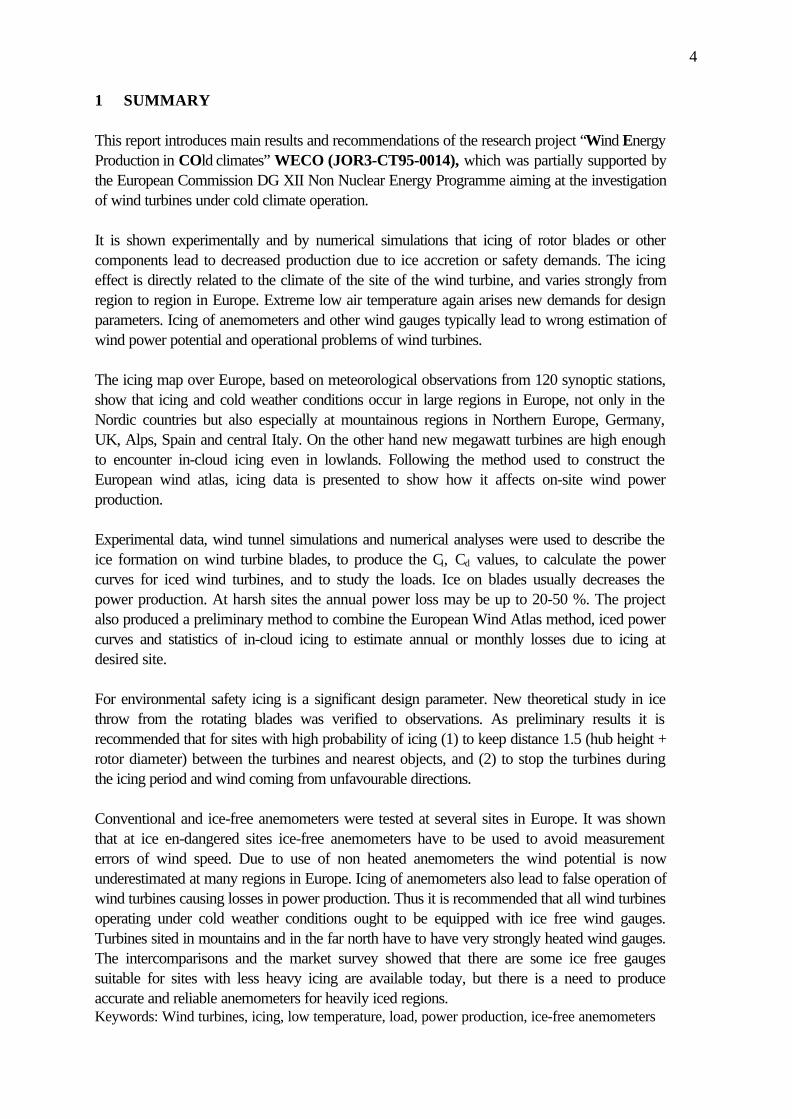
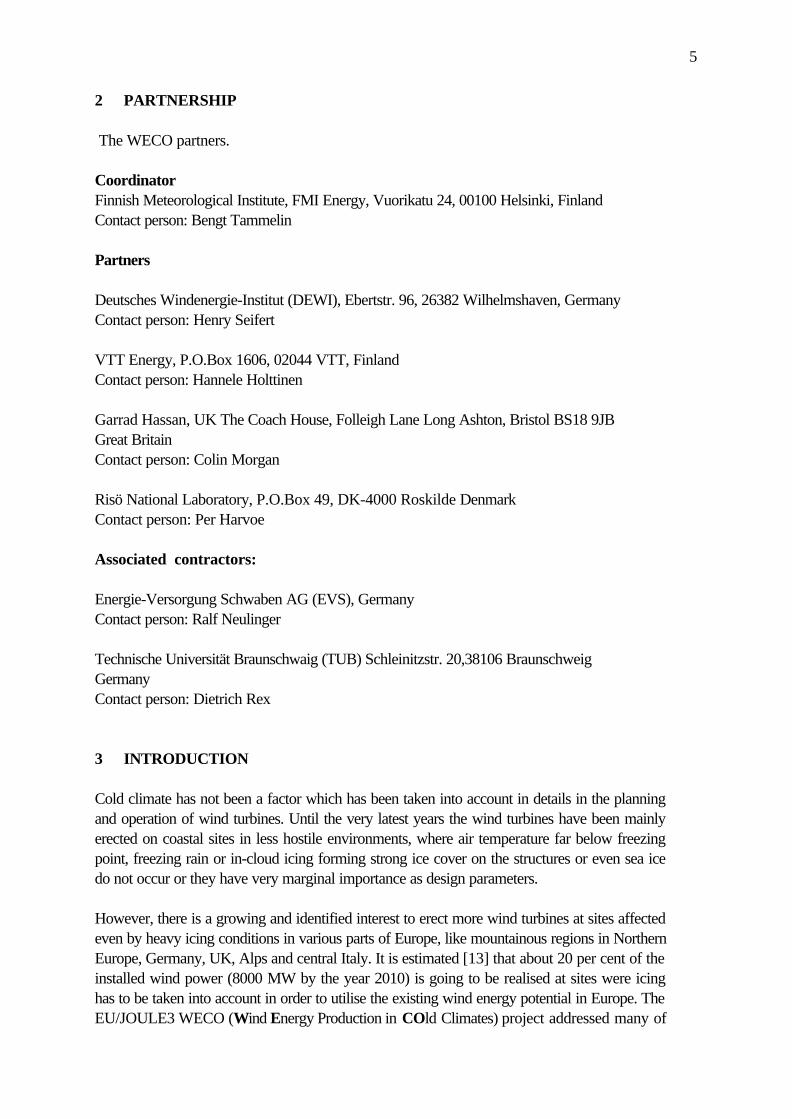
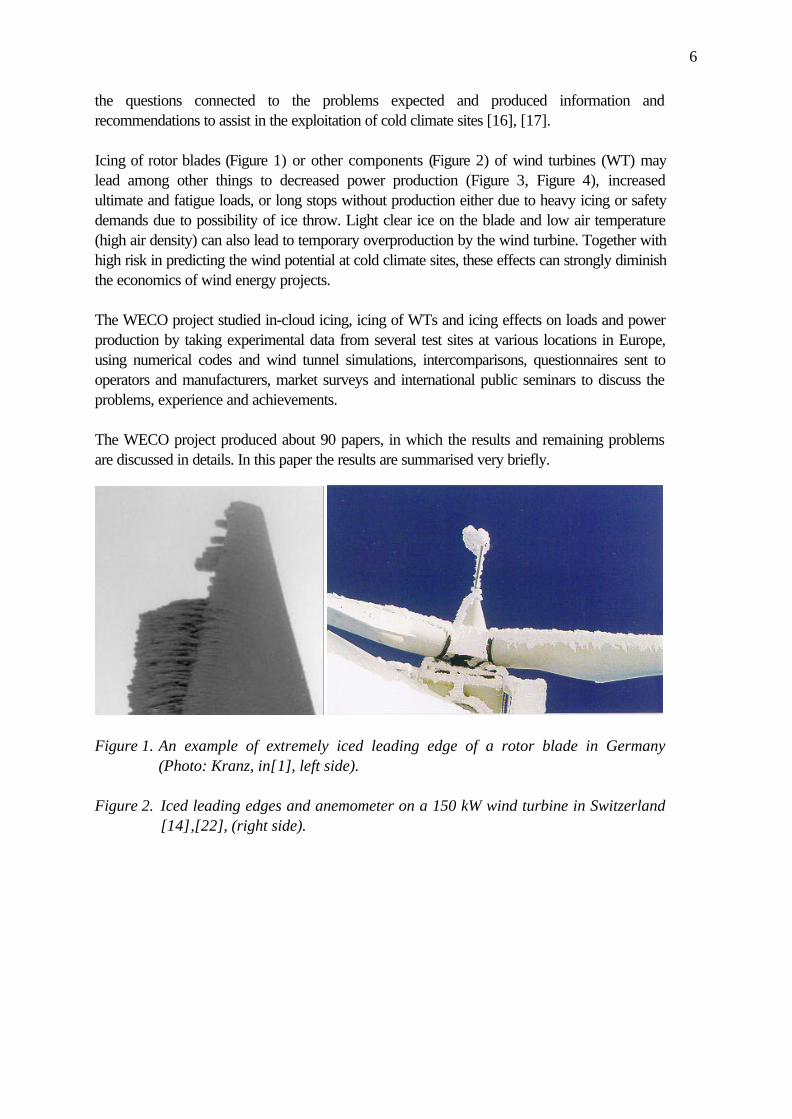
Icing of rotor blades (Figure 1) or other components (Figure 2) of wind turbines (WT) maylead among other things to decreased power production (Figure 3, Figure 4), increasedultimate and fatigue loads, or long stops without production either due to heavy icing or safetydemands due to possibility of ice throw. Light clear ice on the blade and low air temperature(high air density) can also lead to temporary overproduction by the wind turbine. Together withhigh risk in predicting the wind potential at cold climate sites, these effects can strongly diminishthe economics of wind energy projects.
The WECO project studied in-cloud icing, icing of WTs and icing effects on loads and powerproduction by taking experimental data from several test sites at various locations in Europe,using numerical codes and wind tunnel simulations, intercomparisons, questionnaires sent tooperators and manufacturers, market surveys and international public seminars to discuss theproblems, experience and achievements.
The WECO project produced about 90 papers, in which the results and remaining problemsare discussed in details. In this paper the results are summarised very briefly.
Figure 1. An example of extremely iced leading edge of a rotor blade in Germany(Photo: Kranz, in[1], left side).
Figure 2. Iced leading edges and anemometer on a 150 kW wind turbine in Switzerland[14],[22], (right side).
7
0
50
100
150
200
250
300
0 5 10 15 20 25Wind speed (m/s)
Pow
er (
kW)
two-bladed normaltwo-bladed icing
a)
0
50
100
150
200
250
300
0 5 10 15 20 25
Wind speed (m/s)
Pow
er (
kW)
b)Figure 3. Measured power curves during winter time at a) Acqua Spruzza, Italy, where
icing is observed from November to March, a slight icing case shown in thefigures was recorded in November-December, 1997 at Medit two bladedturbines. b) The Pyhätunturi test site in northern Finland during wintermonths 1996 with iced rotor blade [10] for a 220 kW Wind World turbine.
Possible energy loss due to icing
0
5
10
15
20
25
30
35
40
45
50
Nov 96 Dec 96 Jan 97 Feb 97 Mar 97 Apr 97
Ene
rgy
(MW
h)
Three blade 400 kW
Two bladed 250 kW
One bladed 200 kW
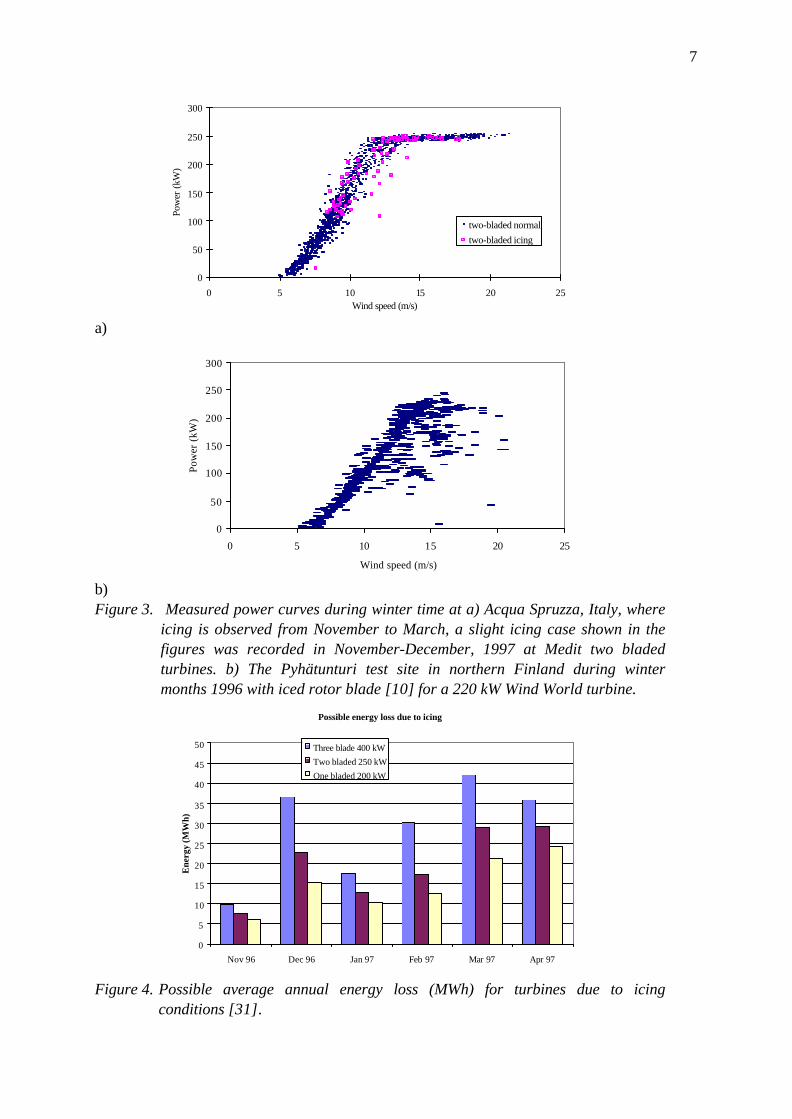
Figure 4. Possible average annual energy loss (MWh) for turbines due to icingconditions [31].

8
4 OBJECTIVES
The main objectives of the WECO project were as briefly described:
• To produce a method for wind energy assessment based on Wind Atlas Method and the”Icing map” data over Europe
• Improvement and verification of models and methods used to estimate loads, reduction ofpower output and lifetime under different types of icing conditions
• To verify and improve prediction of aerodynamics of iced blades using e.g. wind tunnelinvestigation of iced airfoils and their influence on loads and power production.
• Develop guidelines for design of blade heating systems• Give recommendations to increase safety for operation of WT under icing conditions• Testing of ice-free anemometers for improved wind potential prediction and for the use as
control instruments of wind turbines and a market survey in ice-free wind gauges.• Market survey and field test of ice detectors.• Evaluation of experimental data from wind turbines operating under icing conditions from
sites in Finland, Estonia, Germany, UK, Switzerland and Italy.• Evaluation of an inquiry on effect of icing in various parts of Europe.• Transfer of results to industry, operators, certification bodies, and public administration by
seminars, publications and personal contacts.
5 TECHNICAL DESCRIPTION AND RESULTS
WECO was a large multifarious research project covering and investigating various subjectsand thus, only some key results are introduced and highlighted in the following.
5.1 Icing map
To be able to estimate to effect of icing on annual power production and loads, the type,frequency and duration of icing events and corresponding wind speeds are essential parametersto be known.
The meteorological data have been collected from the test stations within the project and fromexisting meteorological databases and have been analysed in order to develop an icing map forEurope. Therefore meteorological data from 120 meteorological official weather stations inEurope in cooperation with the EUMETNET SWS project [15] have been evaluated resultingin the number of icing days, calculated rime accretion at various altitudes [4], [9] and theestimated power loss for typical wind turbines.
Freezing rain for example may lead to increased roughness of the blade (if the event occursduring stand still) and reduced the power production when taken into operation, or even overproduction due to increased chord length of the blade (if icing occurs during operation).Freezing rain is normally recorded at the meteorological stations, and the statistics can thus betaken into account when planning the wind power plant.
However, the most severe icing is caused by in-cloud icing, which is typical for hilly and
9
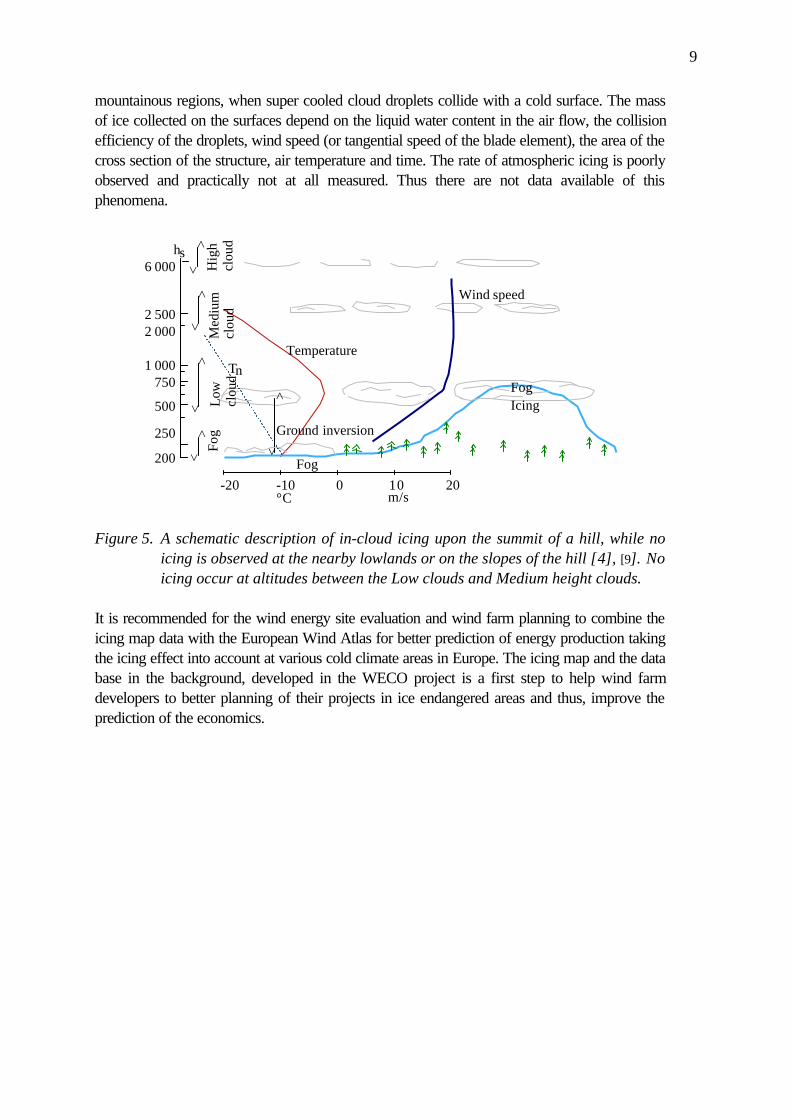
mountainous regions, when super cooled cloud droplets collide with a cold surface. The massof ice collected on the surfaces depend on the liquid water content in the air flow, the collisionefficiency of the droplets, wind speed (or tangential speed of the blade element), the area of thecross section of the structure, air temperature and time. The rate of atmospheric icing is poorlyobserved and practically not at all measured. Thus there are not data available of thisphenomena.
-20 -10 0
200
250
500
7501 000
2 500
hs
°C
TnTemperature
>
>
>
>>
>>
>
6 000
2 000
>
>
Ground inversion
FogIcing
Fog
Hig
h cl
oud
Med
ium
cl
oud
Fog
Low
cl
oud
2010m/s
Wind speed
Figure 5. A schematic description of in-cloud icing upon the summit of a hill, while noicing is observed at the nearby lowlands or on the slopes of the hill [4], [9]. Noicing occur at altitudes between the Low clouds and Medium height clouds.
It is recommended for the wind energy site evaluation and wind farm planning to combine theicing map data with the European Wind Atlas for better prediction of energy production takingthe icing effect into account at various cold climate areas in Europe. The icing map and the database in the background, developed in the WECO project is a first step to help wind farmdevelopers to better planning of their projects in ice endangered areas and thus, improve theprediction of the economics.
10
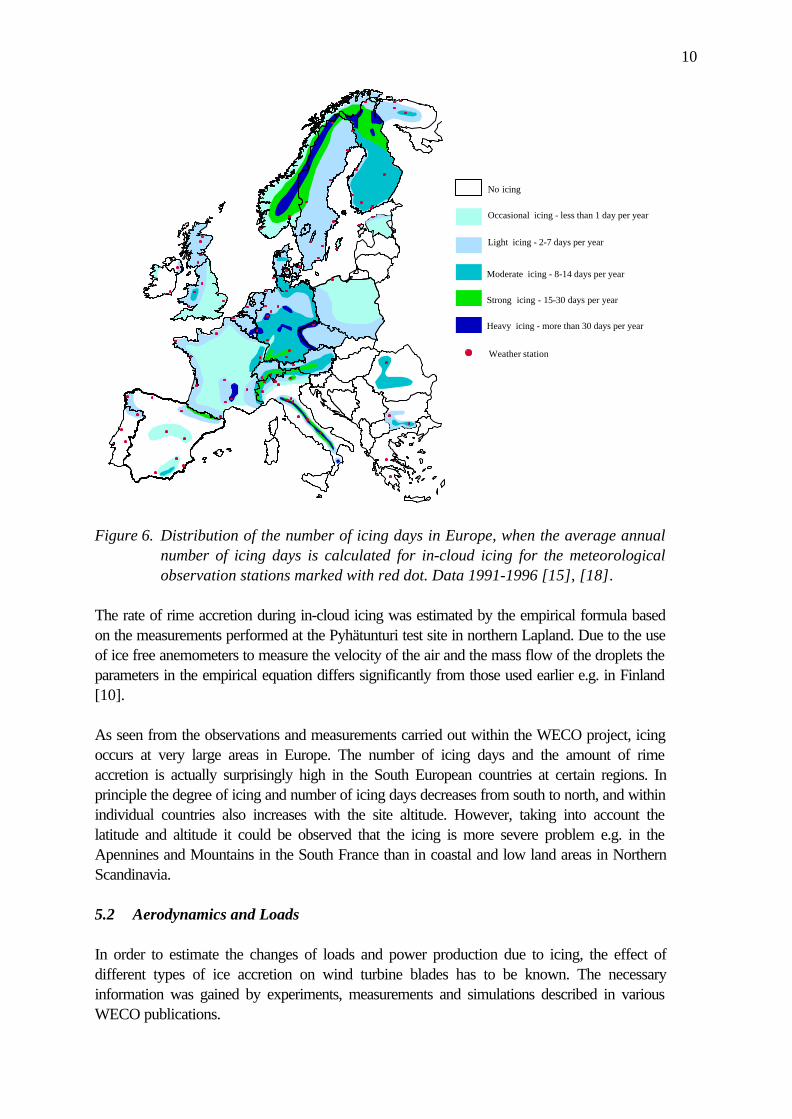
No icing
Occasional icing - less than 1 day per year
Light icing - 2-7 days per year
Moderate icing - 8-14 days per year
Strong icing - 15-30 days per year
Heavy icing - more than 30 days per year
Weather station
Figure 6. Distribution of the number of icing days in Europe, when the average annualnumber of icing days is calculated for in-cloud icing for the meteorologicalobservation stations marked with red dot. Data 1991-1996 [15], [18].
The rate of rime accretion during in-cloud icing was estimated by the empirical formula basedon the measurements performed at the Pyhätunturi test site in northern Lapland. Due to the useof ice free anemometers to measure the velocity of the air and the mass flow of the droplets theparameters in the empirical equation differs significantly from those used earlier e.g. in Finland[10].
As seen from the observations and measurements carried out within the WECO project, icingoccurs at very large areas in Europe. The number of icing days and the amount of rimeaccretion is actually surprisingly high in the South European countries at certain regions. Inprinciple the degree of icing and number of icing days decreases from south to north, and withinindividual countries also increases with the site altitude. However, taking into account thelatitude and altitude it could be observed that the icing is more severe problem e.g. in theApennines and Mountains in the South France than in coastal and low land areas in NorthernScandinavia.
5.2 Aerodynamics and Loads
In order to estimate the changes of loads and power production due to icing, the effect ofdifferent types of ice accretion on wind turbine blades has to be known. The necessaryinformation was gained by experiments, measurements and simulations described in variousWECO publications.
11
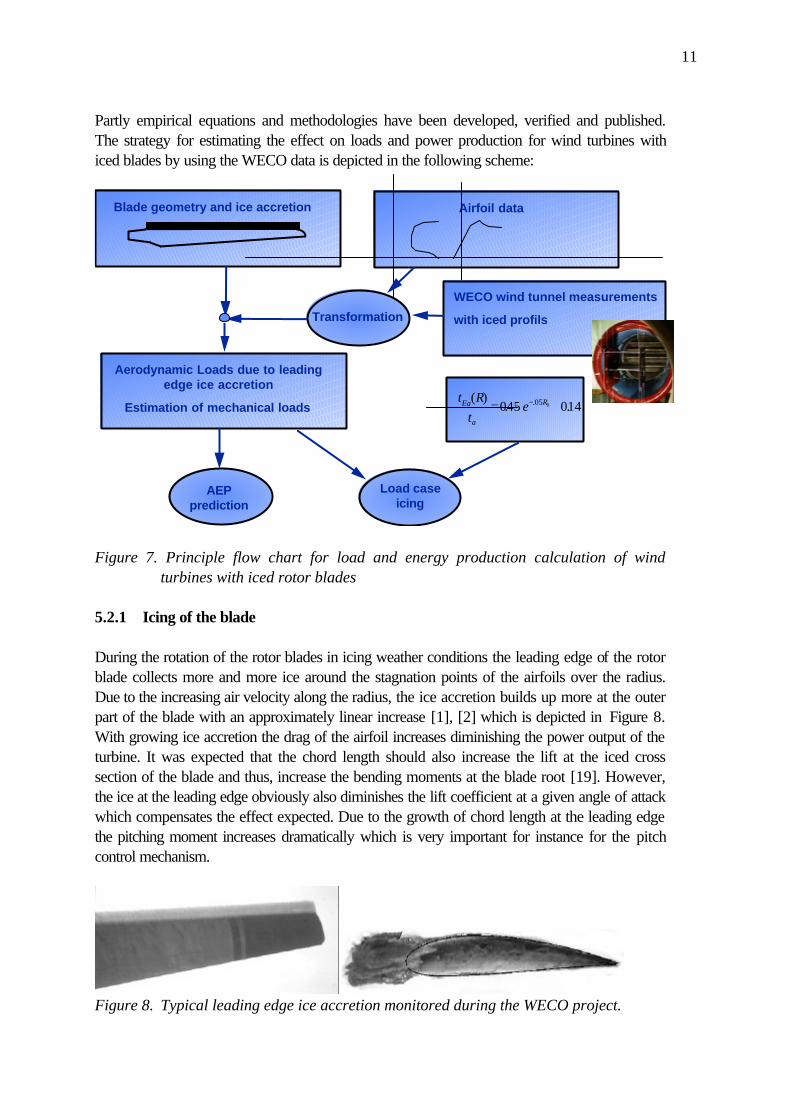
Partly empirical equations and methodologies have been developed, verified and published.The strategy for estimating the effect on loads and power production for wind turbines withiced blades by using the WECO data is depicted in the following scheme:
Blade geometry and ice accretion Airfoil data
Transformation
WECO wind tunnel measurements
with iced profils
Aerodynamic Loads due to leadingedge ice accretion
Estimation of mechanical loads 14t R
teEa
a
R( ). ..= ⋅ +− ⋅045 005 0
Load caseicing
AEPprediction
Figure 7. Principle flow chart for load and energy production calculation of windturbines with iced rotor blades
5.2.1 Icing of the blade
During the rotation of the rotor blades in icing weather conditions the leading edge of the rotorblade collects more and more ice around the stagnation points of the airfoils over the radius.Due to the increasing air velocity along the radius, the ice accretion builds up more at the outerpart of the blade with an approximately linear increase [1], [2] which is depicted in Figure 8.With growing ice accretion the drag of the airfoil increases diminishing the power output of theturbine. It was expected that the chord length should also increase the lift at the iced crosssection of the blade and thus, increase the bending moments at the blade root [19]. However,the ice at the leading edge obviously also diminishes the lift coefficient at a given angle of attackwhich compensates the effect expected. Due to the growth of chord length at the leading edgethe pitching moment increases dramatically which is very important for instance for the pitchcontrol mechanism.
Figure 8. Typical leading edge ice accretion monitored during the WECO project.
12
In order to enable wind turbine designers to predict loads and energy losses for wind turbinesoperating under icing conditions it is necessary to qualitatively and quantitatively know thechanges in the aerodynamic properties brought about by ice accretion on the blade’s leadingedges. Within the WECO - project this problem was investigated for rotor blades in differentstages of icing by:• observations (videos, questionnaires, photos, collection of ice fragments)• wind tunnel tests in low temperature wind tunnel simulating icing conditions [10]• simulation by predicting the ice accretion using computer codes and models.
The assessment of ice accretion on rotor blade's leading edges is also an important input forcomputational ice models. These computer codes model the mechanisms of ice built up duringoperation and are valuable tools for the design of heating and anti-icing systems [5], [10].
Wind tunnel tests have been carried out using "artificial" iced profiles with various types andamount of ice accretion. This information was used as input for computer models for load andpower output prediction of iced rotor blades. Various wind tunnel tests at the TechnicalUniversity of Braunschweig were carried out in order to investigate typically iced airfoils.
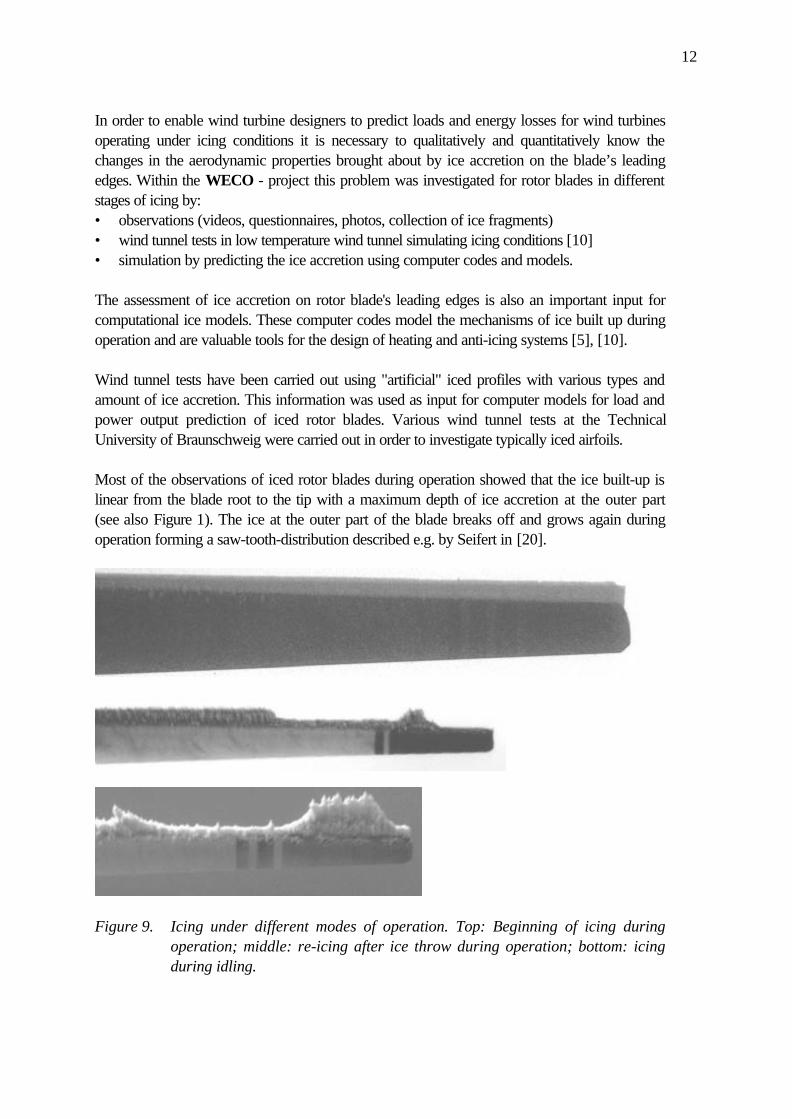
Most of the observations of iced rotor blades during operation showed that the ice built-up islinear from the blade root to the tip with a maximum depth of ice accretion at the outer part(see also Figure 1). The ice at the outer part of the blade breaks off and grows again duringoperation forming a saw-tooth-distribution described e.g. by Seifert in [20].
Figure 9. Icing under different modes of operation. Top: Beginning of icing duringoperation; middle: re-icing after ice throw during operation; bottom: icingduring idling.
13
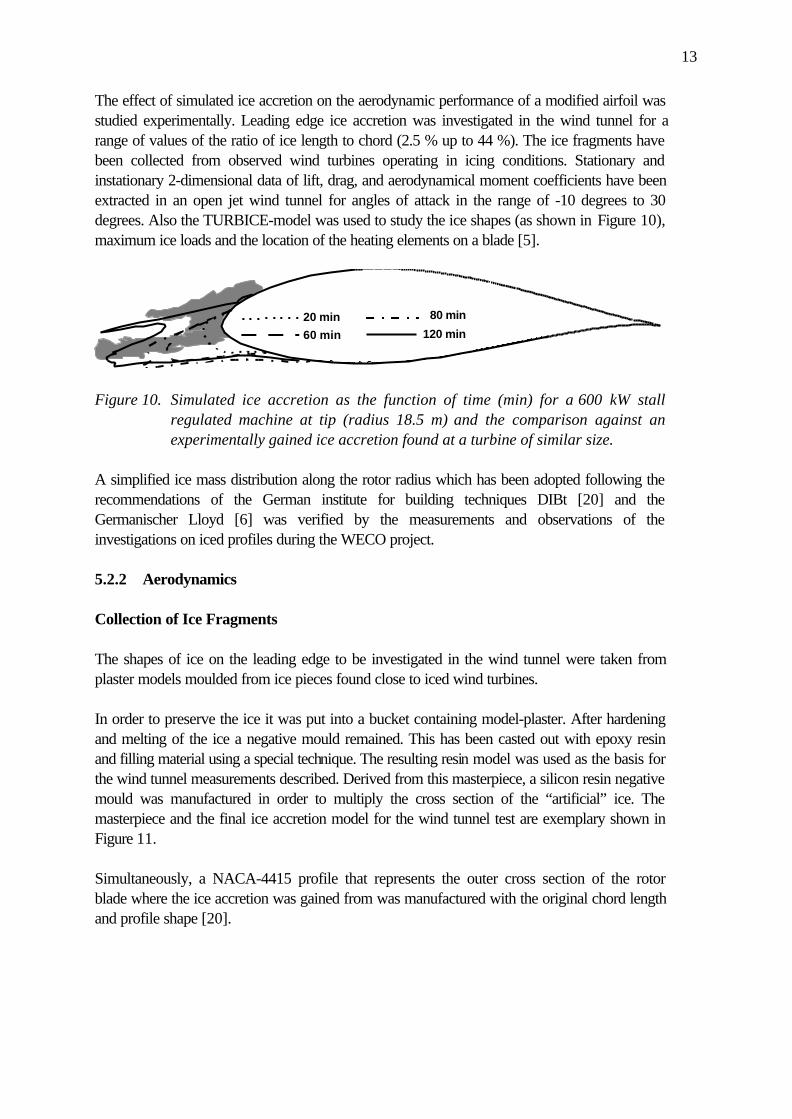
The effect of simulated ice accretion on the aerodynamic performance of a modified airfoil wasstudied experimentally. Leading edge ice accretion was investigated in the wind tunnel for arange of values of the ratio of ice length to chord (2.5 % up to 44 %). The ice fragments havebeen collected from observed wind turbines operating in icing conditions. Stationary andinstationary 2-dimensional data of lift, drag, and aerodynamical moment coefficients have beenextracted in an open jet wind tunnel for angles of attack in the range of -10 degrees to 30degrees. Also the TURBICE-model was used to study the ice shapes (as shown in Figure 10),maximum ice loads and the location of the heating elements on a blade [5].
20 min
60 min
80 min
120 min
Figure 10. Simulated ice accretion as the function of time (min) for a 600 kW stallregulated machine at tip (radius 18.5 m) and the comparison against anexperimentally gained ice accretion found at a turbine of similar size.
A simplified ice mass distribution along the rotor radius which has been adopted following therecommendations of the German institute for building techniques DIBt [20] and theGermanischer Lloyd [6] was verified by the measurements and observations of theinvestigations on iced profiles during the WECO project.
5.2.2 Aerodynamics
Collection of Ice Fragments
The shapes of ice on the leading edge to be investigated in the wind tunnel were taken fromplaster models moulded from ice pieces found close to iced wind turbines.
In order to preserve the ice it was put into a bucket containing model-plaster. After hardeningand melting of the ice a negative mould remained. This has been casted out with epoxy resinand filling material using a special technique. The resulting resin model was used as the basis forthe wind tunnel measurements described. Derived from this masterpiece, a silicon resin negativemould was manufactured in order to multiply the cross section of the “artificial” ice. Themasterpiece and the final ice accretion model for the wind tunnel test are exemplary shown inFigure 11.
Simultaneously, a NACA-4415 profile that represents the outer cross section of the rotorblade where the ice accretion was gained from was manufactured with the original chord lengthand profile shape [20].
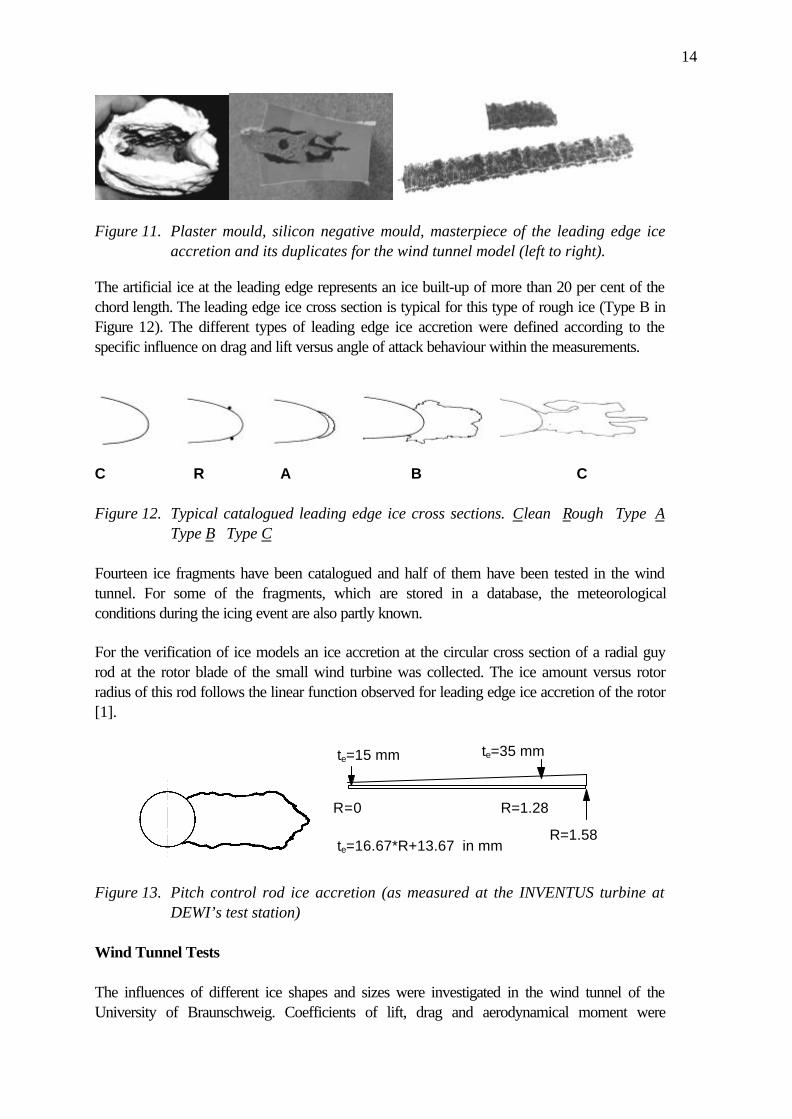
14
Figure 11. Plaster mould, silicon negative mould, masterpiece of the leading edge iceaccretion and its duplicates for the wind tunnel model (left to right).
The artificial ice at the leading edge represents an ice built-up of more than 20 per cent of thechord length. The leading edge ice cross section is typical for this type of rough ice (Type B inFigure 12). The different types of leading edge ice accretion were defined according to thespecific influence on drag and lift versus angle of attack behaviour within the measurements.
C R A B C
Figure 12. Typical catalogued leading edge ice cross sections. Clean Rough Type AType B Type C
Fourteen ice fragments have been catalogued and half of them have been tested in the windtunnel. For some of the fragments, which are stored in a database, the meteorologicalconditions during the icing event are also partly known.
For the verification of ice models an ice accretion at the circular cross section of a radial guyrod at the rotor blade of the small wind turbine was collected. The ice amount versus rotorradius of this rod follows the linear function observed for leading edge ice accretion of the rotor[1].
R=0
R=1.58te=16.67*R+13.67 in mm
te=15 mm te=35 mm
R=1.28
Figure 13. Pitch control rod ice accretion (as measured at the INVENTUS turbine atDEWI’s test station)
Wind Tunnel Tests
The influences of different ice shapes and sizes were investigated in the wind tunnel of theUniversity of Braunschweig. Coefficients of lift, drag and aerodynamical moment were
15
measured at the original clean airfoil and with added leading edge ice models at a Reynold'snumber of 630 000 using direct force measurements in an angle of attack range between -10°to 30° degrees. All coefficients described are defined by the original chord length of the non-iced airfoil, in spite of the larger chord length (larger area) with ice accretion. As a basis airfoilfor the measurements, a NACA4415 was chosen [21]. The blades which have beeninvestigated concerning icing earlier [19], [1] as well as those on a small turbine at the DEWItest station [20] use the same type of airfoil. Using the original cross section from the bladeclose to the tip a rectangular wind tunnel model was manufactured with a chord length of 225mm and a wing span of 500 mm. The ice accretion was modelled by duplicating the fragmentsfound at the original turbines.
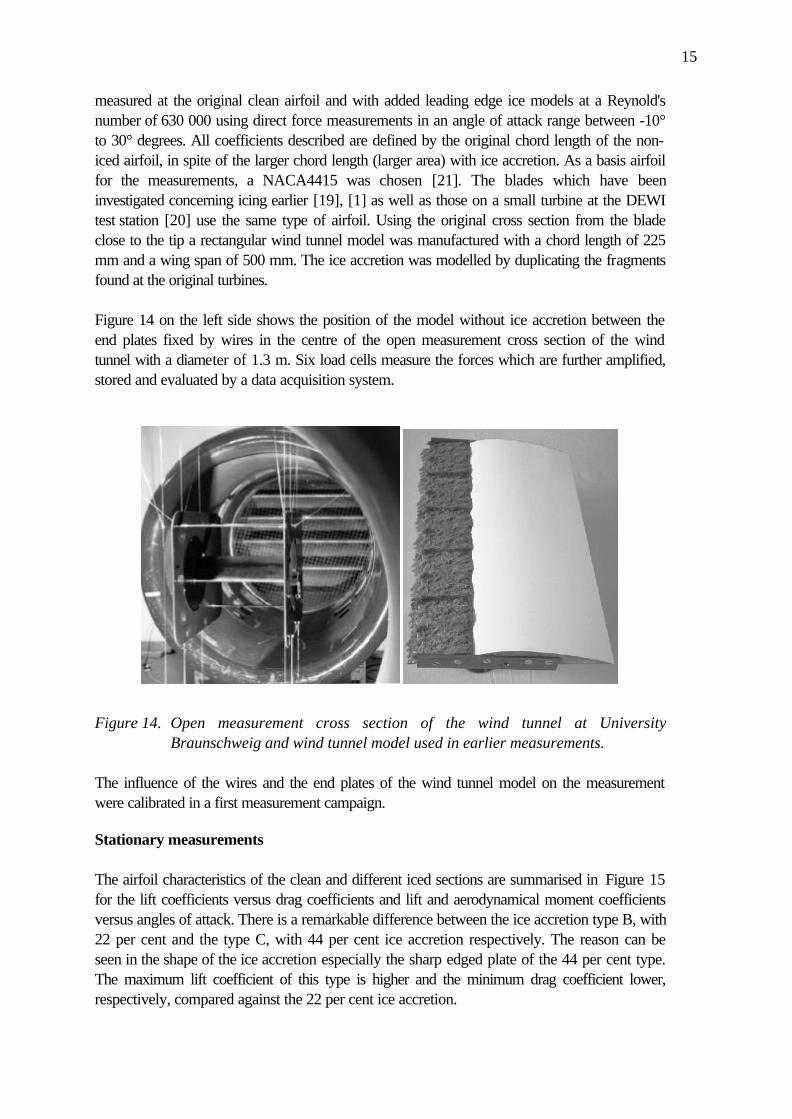
Figure 14 on the left side shows the position of the model without ice accretion between theend plates fixed by wires in the centre of the open measurement cross section of the windtunnel with a diameter of 1.3 m. Six load cells measure the forces which are further amplified,stored and evaluated by a data acquisition system.
Figure 14. Open measurement cross section of the wind tunnel at UniversityBraunschweig and wind tunnel model used in earlier measurements.
The influence of the wires and the end plates of the wind tunnel model on the measurementwere calibrated in a first measurement campaign.
Stationary measurements
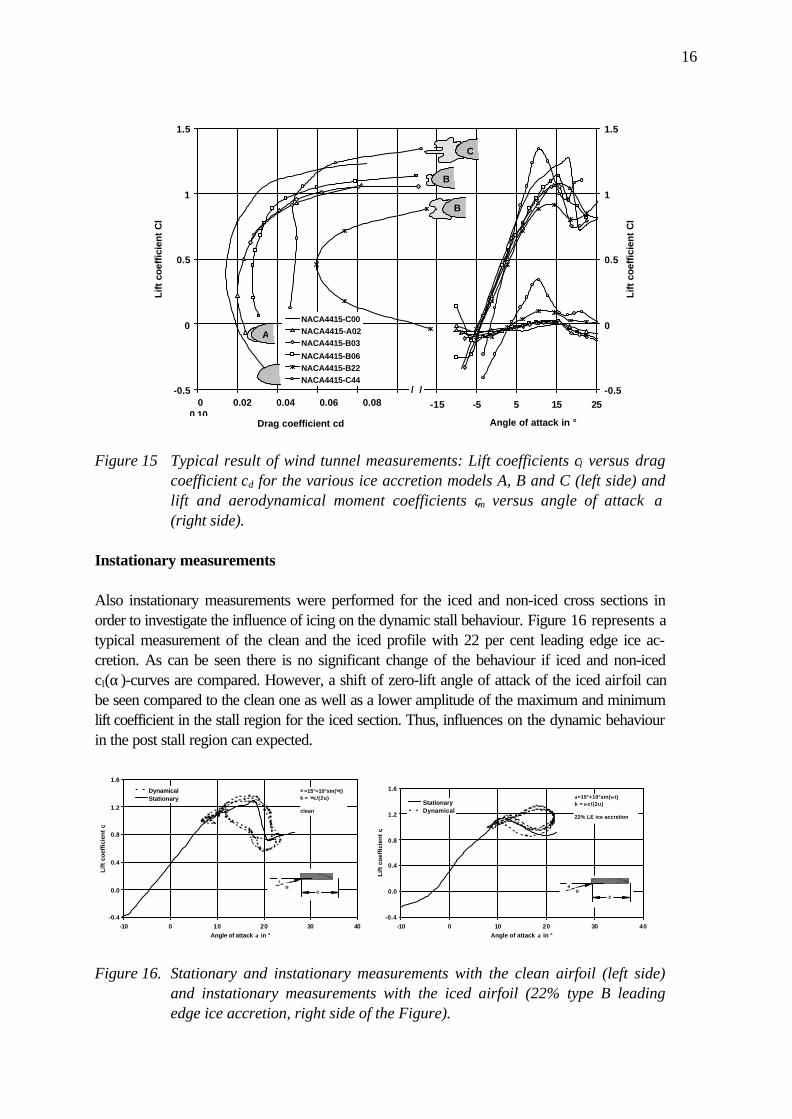
The airfoil characteristics of the clean and different iced sections are summarised in Figure 15for the lift coefficients versus drag coefficients and lift and aerodynamical moment coefficientsversus angles of attack. There is a remarkable difference between the ice accretion type B, with22 per cent and the type C, with 44 per cent ice accretion respectively. The reason can beseen in the shape of the ice accretion especially the sharp edged plate of the 44 per cent type.The maximum lift coefficient of this type is higher and the minimum drag coefficient lower,respectively, compared against the 22 per cent ice accretion.
16
-0.5
0
0.5
1
1.5
-75 -65 -55 -45 -35 -25 -15 -5 5 15 25
Angle of attack in °
Lift
coe
ffic
ient
Cl
-0.5
0
0.5
1
1.5
Drag coefficient cd
Lift
coe
ffic
ient
Cl
NACA4415-C00NACA4415-A02NACA4415-B03
NACA4415-B06NACA4415-B22NACA4415-C44
/ /
C
B
B
A
0 0.02 0.04 0.06 0.08 0.10
Figure 15 Typical result of wind tunnel measurements: Lift coefficients cl versus dragcoefficient cd for the various ice accretion models A, B and C (left side) andlift and aerodynamical moment coefficients cm versus angle of attack α(right side).
Instationary measurements
Also instationary measurements were performed for the iced and non-iced cross sections inorder to investigate the influence of icing on the dynamic stall behaviour. Figure 16 represents atypical measurement of the clean and the iced profile with 22 per cent leading edge ice ac-cretion. As can be seen there is no significant change of the behaviour if iced and non-icedcl(α)-curves are compared. However, a shift of zero-lift angle of attack of the iced airfoil canbe seen compared to the clean one as well as a lower amplitude of the maximum and minimumlift coefficient in the stall region for the iced section. Thus, influences on the dynamic behaviourin the post stall region can expected.
-0.4
0.0
0.4
0.8
1.2
1.6
-10 0 10 20 30 40Angle of attack α in °
Lif
t co
effi
cien
t c l
DynamicalStationary
α=15°+10°sin(ωt)k = ωc/(2u)
clean
α
c u
-0.4
0.0
0.4
0.8
1.2
1.6
-10 0 10 20 30 40Angle of attack α in °
Lif
t co
effi
cien
t c l
StationaryDynamical
α
c u
α=15°+10°sin(ωt)k = ωc/(2u)
22% LE ice accretion
Figure 16. Stationary and instationary measurements with the clean airfoil (left side)and instationary measurements with the iced airfoil (22% type B leadingedge ice accretion, right side of the Figure).

17
Due to the suspension of the wind tunnel model the variation of the angle of attack versus timewas limited to k-values of K = .022. The angle of attack amplitudes are described withequation (1) whereas the k-value is explained in equation (2) with c being the chord length ofthe airfoil and u being the speed of the air inflow.
α ω( ) sin( )t t= °+ °15 10 (1)
kcu
=ω2
≈ 1Hz (2)
Transformation of wind tunnel results to other airfoils
A method for transforming the measured aerodynamic coefficients from the iced NACA4415airfoils to any other airfoils below:
First, the angle of attack ranges have to be defined at both of the airfoils, the new airfoil (indexNP) for which the coefficients with ice accretion are searched and the well known iced anduniced NACA4415 (index NACA). Also the stall behaviour of the particular airfoil has to beknown and influences the transformation and the extrapolation, respectively.
Angle of attack α
Lift
coef
ficie
nt c
l b
ca
Figure 17. Different types of stall and the resulting cl(α) curves
Three basic types of stall are recognised: First, the trailing-edge stall that occurs when the flowbegins to separate at the trailing edge, and with increasing angle-of-attack, the separationgradually progresses towards the leading edge (line a in Figure 17). This is considered as agentle type of stall and more desirable than other types, since the lift decreases gradually fromits maximum value. Secondly, the leading-edge stall which starts as a short bubble formed in thevicinity of the leading edge (line b in Figure 17). When it bursts, a rapid change of flow over theupper surface of the airfoil occurs, resulting in both a sudden drop in lift and an increase in the
18
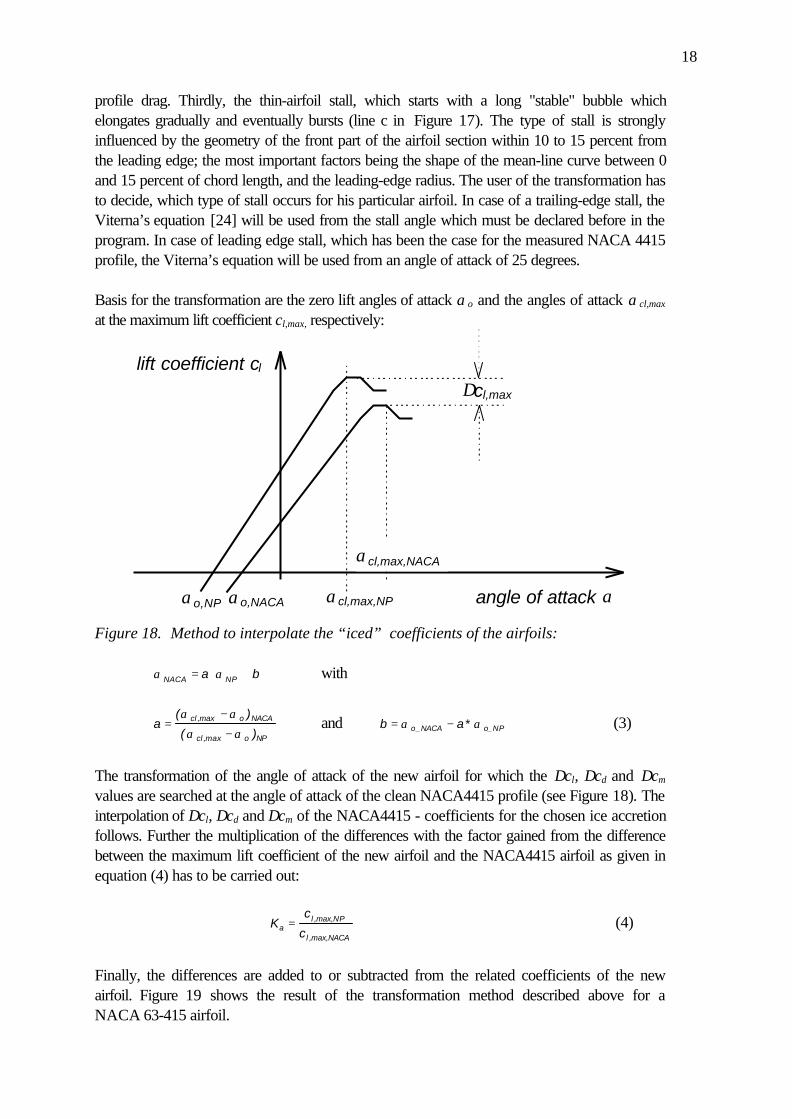
profile drag. Thirdly, the thin-airfoil stall, which starts with a long "stable" bubble whichelongates gradually and eventually bursts (line c in Figure 17). The type of stall is stronglyinfluenced by the geometry of the front part of the airfoil section within 10 to 15 percent fromthe leading edge; the most important factors being the shape of the mean-line curve between 0and 15 percent of chord length, and the leading-edge radius. The user of the transformation hasto decide, which type of stall occurs for his particular airfoil. In case of a trailing-edge stall, theViterna’s equation [24] will be used from the stall angle which must be declared before in theprogram. In case of leading edge stall, which has been the case for the measured NACA 4415profile, the Viterna’s equation will be used from an angle of attack of 25 degrees.
Basis for the transformation are the zero lift angles of attack αo and the angles of attack αcl,max
at the maximum lift coefficient cl,max, respectively:
angle of attack ααcl,max,NPαo,NACAαo,NP
lift coefficient cl
∆cl,max
αcl,max,NACA
Figure 18. Method to interpolate the “iced” coefficients of the airfoils:
α αNACA NPa b= ⋅ + with
a( )
( )cl o NACA
cl o NP
=−
−
α α
α α,max
,max
and b a*o_NACA o_NP= −α α (3)
The transformation of the angle of attack of the new airfoil for which the ∆cl, ∆cd and ∆cm
values are searched at the angle of attack of the clean NACA4415 profile (see Figure 18). Theinterpolation of ∆cl, ∆cd and ∆cm of the NACA4415 - coefficients for the chosen ice accretionfollows. Further the multiplication of the differences with the factor gained from the differencebetween the maximum lift coefficient of the new airfoil and the NACA4415 airfoil as given inequation (4) has to be carried out:
Kc
cal NP
l NACA
= ,max,
,max,
(4)
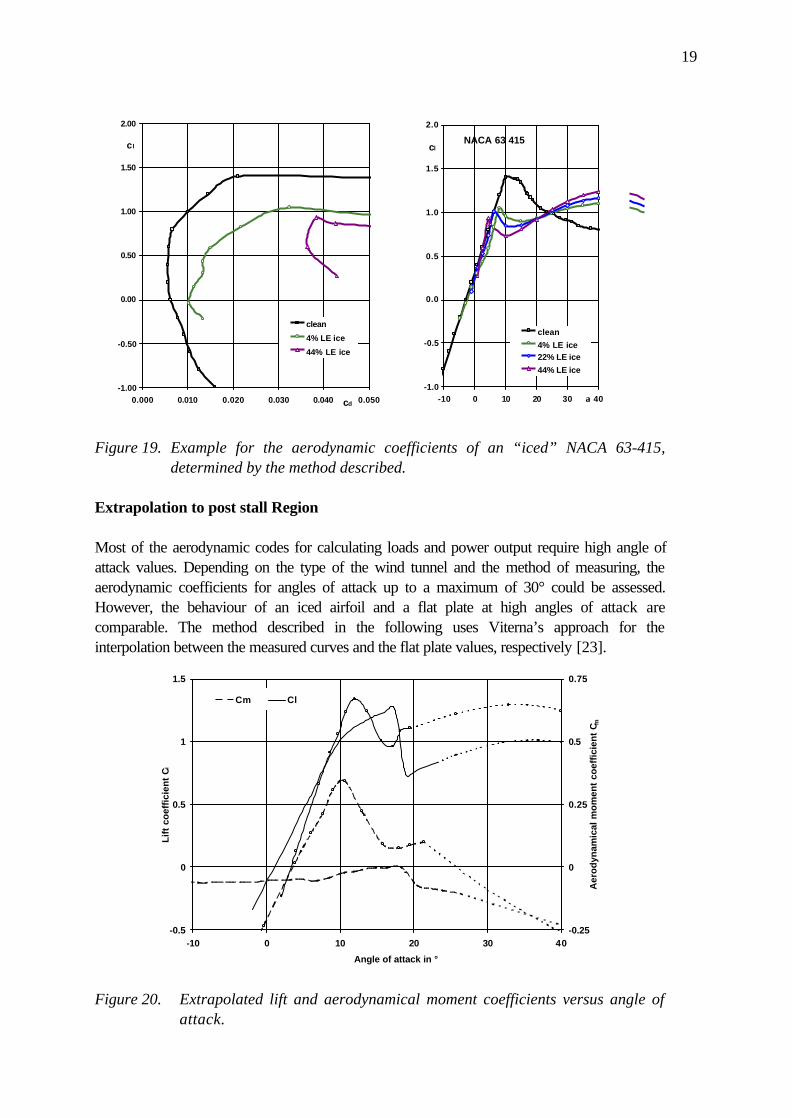
Finally, the differences are added to or subtracted from the related coefficients of the newairfoil. Figure 19 shows the result of the transformation method described above for aNACA 63-415 airfoil.
19
-1.00
-0.50
0.00
0.50
1.00
1.50
2.00
0.000 0.010 0.020 0.030 0.040 0.050cd
c l
clean
4% LE ice
44% LE ice
-1.0
-0.5
0.0
0.5
1.0
1.5
2.0
-10 0 10 20 30 40α
cl
clean
4% LE ice22% LE ice
44% LE ice
NACA 63 415
Figure 19. Example for the aerodynamic coefficients of an “iced” NACA 63-415,determined by the method described.
Extrapolation to post stall Region
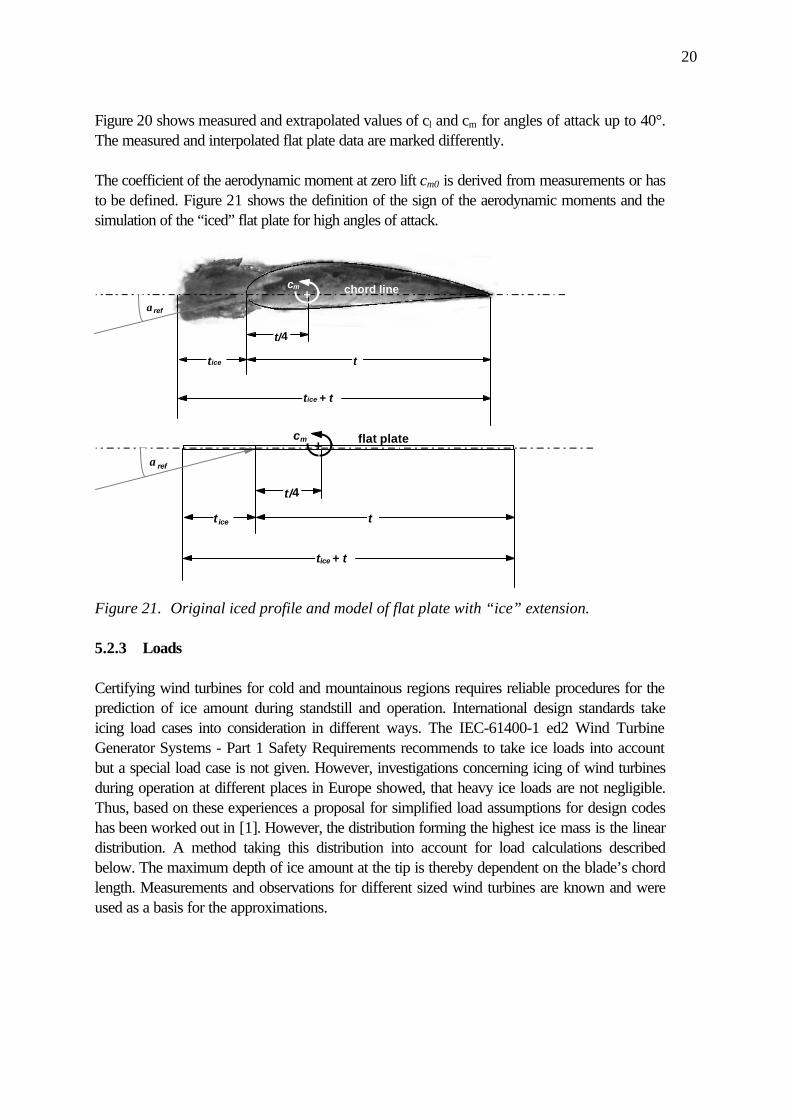
Most of the aerodynamic codes for calculating loads and power output require high angle ofattack values. Depending on the type of the wind tunnel and the method of measuring, theaerodynamic coefficients for angles of attack up to a maximum of 30° could be assessed.However, the behaviour of an iced airfoil and a flat plate at high angles of attack arecomparable. The method described in the following uses Viterna’s approach for theinterpolation between the measured curves and the flat plate values, respectively [23].
-0.25
0
0.25
0.5
0.75
-10 0 10 20 30 40
Angle of attack in °
Aer
od
ynam
ical
mo
men
t co
effi
cien
t C m
-0.5
0
0.5
1
1.5
Lif
t co
effi
cien
t C
l
Cm Cl
Figure 20. Extrapolated lift and aerodynamical moment coefficients versus angle ofattack.
20
Figure 20 shows measured and extrapolated values of cl and cm for angles of attack up to 40°.The measured and interpolated flat plate data are marked differently.
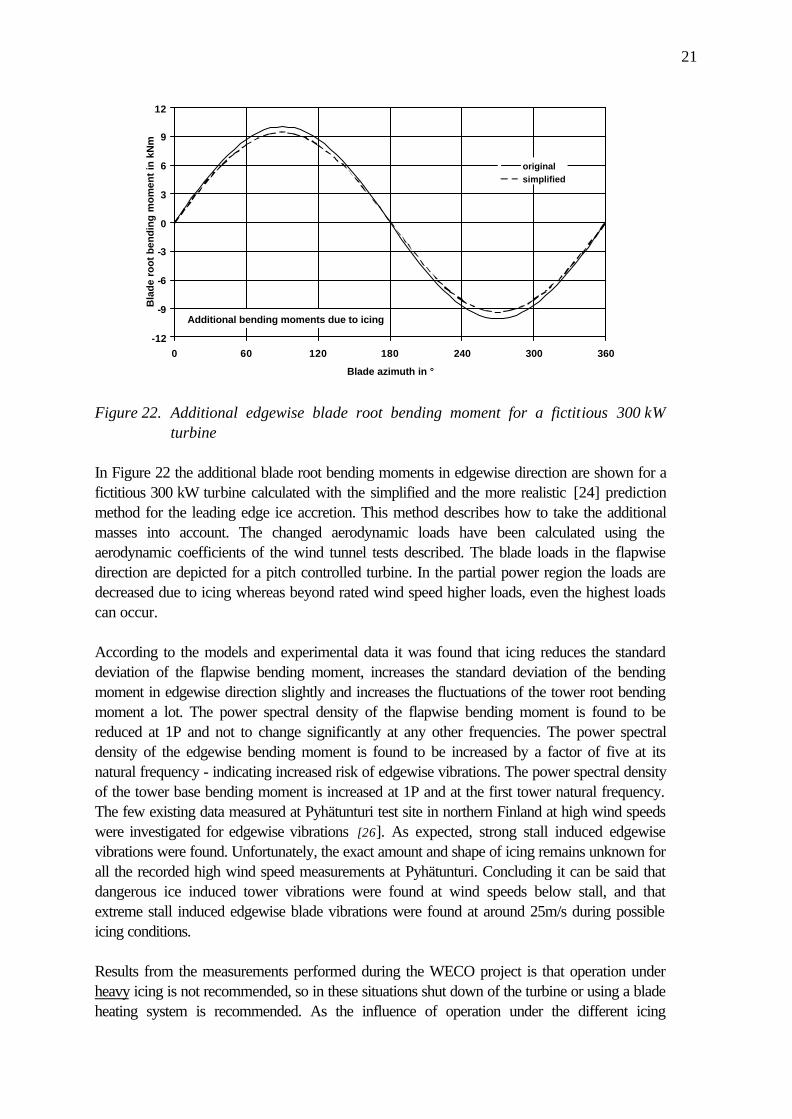
The coefficient of the aerodynamic moment at zero lift cm0 is derived from measurements or hasto be defined. Figure 21 shows the definition of the sign of the aerodynamic moments and thesimulation of the “iced” flat plate for high angles of attack.
t/4
ttice
tice + t
αref
chord linecm+
t/4
tt ice
tice + t
αref
flat platecm+
Figure 21. Original iced profile and model of flat plate with “ice” extension.
5.2.3 Loads
Certifying wind turbines for cold and mountainous regions requires reliable procedures for theprediction of ice amount during standstill and operation. International design standards takeicing load cases into consideration in different ways. The IEC-61400-1 ed2 Wind TurbineGenerator Systems - Part 1 Safety Requirements recommends to take ice loads into accountbut a special load case is not given. However, investigations concerning icing of wind turbinesduring operation at different places in Europe showed, that heavy ice loads are not negligible.Thus, based on these experiences a proposal for simplified load assumptions for design codeshas been worked out in [1]. However, the distribution forming the highest ice mass is the lineardistribution. A method taking this distribution into account for load calculations describedbelow. The maximum depth of ice amount at the tip is thereby dependent on the blade’s chordlength. Measurements and observations for different sized wind turbines are known and wereused as a basis for the approximations.
21
Additional bending moments due to icing
-12
-9
-6
-3
0
3
6
9
12
0 60 120 180 240 300 360
Blade azimuth in °
Bla
de
roo
t b
end
ing
mo
men
t in
kN
m
originalsimplified
Figure 22. Additional edgewise blade root bending moment for a fictitious 300 kWturbine
In Figure 22 the additional blade root bending moments in edgewise direction are shown for afictitious 300 kW turbine calculated with the simplified and the more realistic [24] predictionmethod for the leading edge ice accretion. This method describes how to take the additionalmasses into account. The changed aerodynamic loads have been calculated using theaerodynamic coefficients of the wind tunnel tests described. The blade loads in the flapwisedirection are depicted for a pitch controlled turbine. In the partial power region the loads aredecreased due to icing whereas beyond rated wind speed higher loads, even the highest loadscan occur.
According to the models and experimental data it was found that icing reduces the standarddeviation of the flapwise bending moment, increases the standard deviation of the bendingmoment in edgewise direction slightly and increases the fluctuations of the tower root bendingmoment a lot. The power spectral density of the flapwise bending moment is found to bereduced at 1P and not to change significantly at any other frequencies. The power spectraldensity of the edgewise bending moment is found to be increased by a factor of five at itsnatural frequency - indicating increased risk of edgewise vibrations. The power spectral densityof the tower base bending moment is increased at 1P and at the first tower natural frequency.The few existing data measured at Pyhätunturi test site in northern Finland at high wind speedswere investigated for edgewise vibrations [26]. As expected, strong stall induced edgewisevibrations were found. Unfortunately, the exact amount and shape of icing remains unknown forall the recorded high wind speed measurements at Pyhätunturi. Concluding it can be said thatdangerous ice induced tower vibrations were found at wind speeds below stall, and thatextreme stall induced edgewise blade vibrations were found at around 25m/s during possibleicing conditions.
Results from the measurements performed during the WECO project is that operation underheavy icing is not recommended, so in these situations shut down of the turbine or using a bladeheating system is recommended. As the influence of operation under the different icing

22
conditions on the lifetime of the turbine’s components are not predictable in general termspossible effects of icing on the fatigue loads are tabled below. The experiences drawn from theobservations and different measurements are included in this table which is aimed at thedesigners of wind turbines and certification bodies.
Icing is increasing fatigue loads Icing is decreasing fatigue loads
additional ice masses cause higher deterministicloads
icing might increase the aerodynamic dampingand thus diminishes in some cases the vibrationof components
asymmetric masses cause unbalance shut down of the turbines due to frozenanemometer/rotor and the consequential standstill for longer periods reduces the number ofload cycles
increased excitation of edgewise vibrations hasbeen observed due to icing as well as highertower vibrations.
operating at lower rotor speeds (two speedgenerators or variable speed operation) due toiced blades lead to lower load cycles buteventually higher amplitudes due to higherdeterministic loads
Ice accretion affects the control system.Resulting vibrations have been observed duringthe WECO project.Yaw error due to frozen wind vane of thecontrol system may lead to higher loadamplitudes.Pitch turbines operating under stall conditionsdue to changed aerodynamics.Resonance may occur due to changed naturalfrequencies of components such as rotorblades. Especially for smaller turbines and lightweight rotor blades.
5.3 Safety
Ice throw from the rotating blades is an important problem when the site of the wind energypower plant is planned to be close to public roads, housing, power lines etc. Ice throw hasbeen studied using both theoretical models (Garrad Hassan) and experimental data (thequestionnaire etc.) from various WT sites. This work has progressed as far as possible with thedata available. The preliminary results were reported in Gothenburg 1996. The results are givenin the form the number of ice fragments likely to fall within a 1 m2 patch in the vicinity of a windturbines (Npoint) in any one year as a distance from the wind turbine.
According to the data and models developed and verified within the project it can berecommended for sites with high probability of icing to keep a distance dice between theturbines and nearest objects of about
23
• dice = 1.5·(hub height + diameter),• or it can be recommended to stop the turbine automatically during the icing period and
wind coming from unfavourable directions, if the public safety might be affected by icethrow.
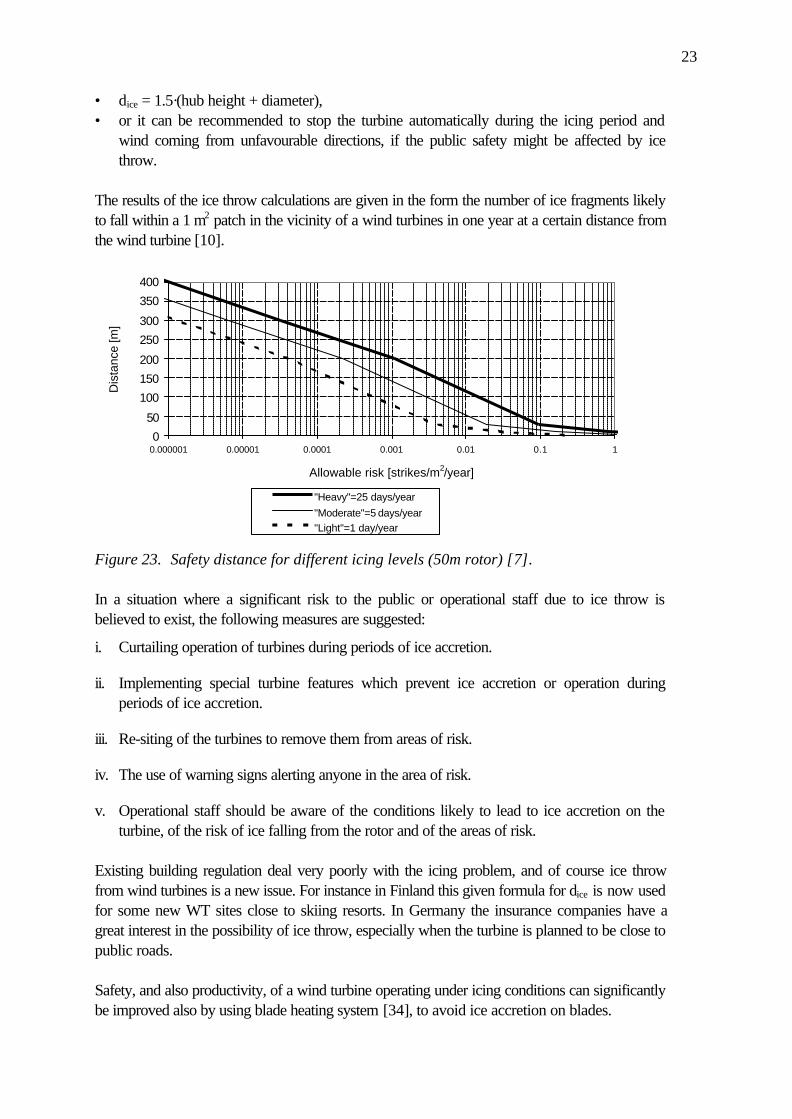
The results of the ice throw calculations are given in the form the number of ice fragments likelyto fall within a 1 m2 patch in the vicinity of a wind turbines in one year at a certain distance fromthe wind turbine [10].
0
50
100
150
200
250
300
350
400
0.000001 0.00001 0.0001 0.001 0.01 0.1 1
Allowable risk [strikes/m2/year]
Dis
tanc
e [m
]
"Heavy"=25 days/year
"Moderate"=5 days/year"Light"=1 day/year
Figure 23. Safety distance for different icing levels (50m rotor) [7].
In a situation where a significant risk to the public or operational staff due to ice throw isbelieved to exist, the following measures are suggested:
i. Curtailing operation of turbines during periods of ice accretion.
ii. Implementing special turbine features which prevent ice accretion or operation duringperiods of ice accretion.
iii. Re-siting of the turbines to remove them from areas of risk.
iv. The use of warning signs alerting anyone in the area of risk.
v. Operational staff should be aware of the conditions likely to lead to ice accretion on theturbine, of the risk of ice falling from the rotor and of the areas of risk.
Existing building regulation deal very poorly with the icing problem, and of course ice throwfrom wind turbines is a new issue. For instance in Finland this given formula for dice is now usedfor some new WT sites close to skiing resorts. In Germany the insurance companies have agreat interest in the possibility of ice throw, especially when the turbine is planned to be close topublic roads.
Safety, and also productivity, of a wind turbine operating under icing conditions can significantlybe improved also by using blade heating system [34], to avoid ice accretion on blades.
24
5.4 Anemometers
Anemometers are a small but essential component for wind power assessment and operation ofwind turbines. It is also the most easily corrected part of the icing problem, if correctlyidentified and taken into account.
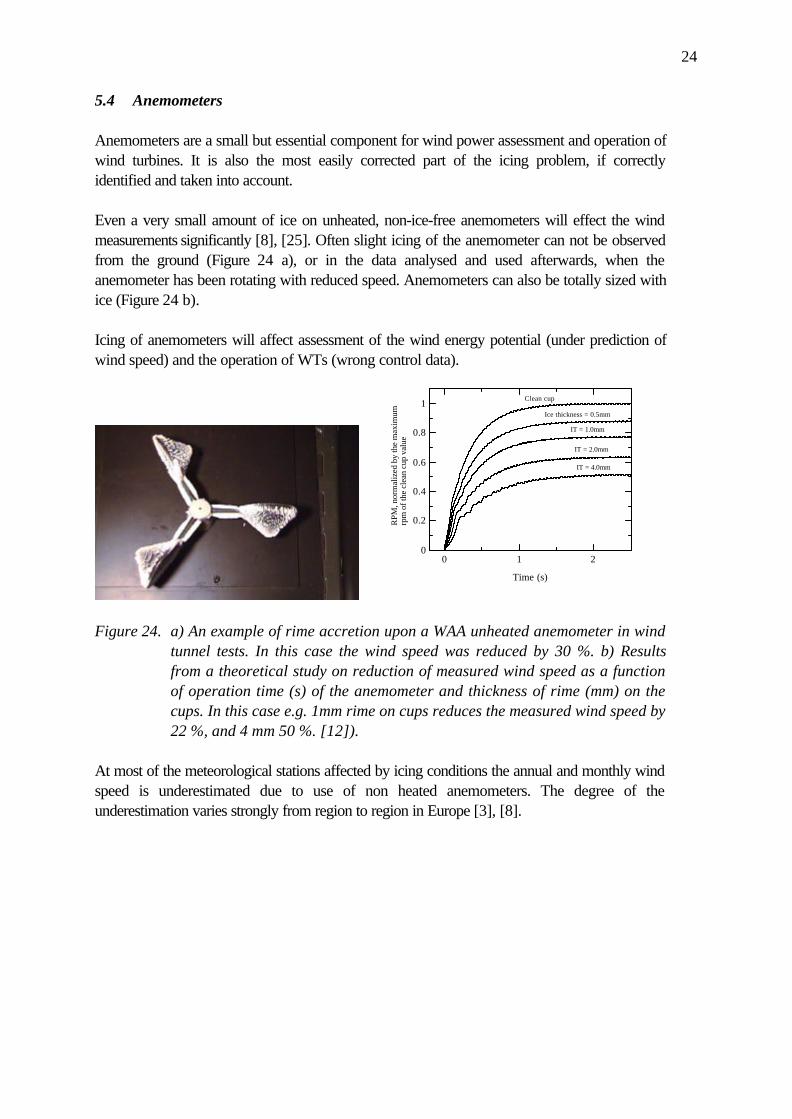
Even a very small amount of ice on unheated, non-ice-free anemometers will effect the windmeasurements significantly [8], [25]. Often slight icing of the anemometer can not be observedfrom the ground (Figure 24 a), or in the data analysed and used afterwards, when theanemometer has been rotating with reduced speed. Anemometers can also be totally sized withice (Figure 24 b).
Icing of anemometers will affect assessment of the wind energy potential (under prediction ofwind speed) and the operation of WTs (wrong control data).
0 1 20
0.2
0.4
0.6
0.8
1
Time (s)
RPM
, nor
mal
ized
by
the
max
imum
rp
m o
f the
cle
an c
up v
alue
Clean cup
Ice thickness = 0.5mm
IT = 1.0mm
IT = 2.0mm
IT = 4.0mm
Figure 24. a) An example of rime accretion upon a WAA unheated anemometer in windtunnel tests. In this case the wind speed was reduced by 30 %. b) Resultsfrom a theoretical study on reduction of measured wind speed as a functionof operation time (s) of the anemometer and thickness of rime (mm) on thecups. In this case e.g. 1mm rime on cups reduces the measured wind speed by22 %, and 4 mm 50 %. [12]).
At most of the meteorological stations affected by icing conditions the annual and monthly windspeed is underestimated due to use of non heated anemometers. The degree of theunderestimation varies strongly from region to region in Europe [3], [8].
25
-15
-10
-5
0
5
10
15
20
0 1 2 3Time (days)
Win
d sp
eed
(m/s
) - T
empe
rat.
(°) heated static anemometer (300 W - variable)
fully heated cup anemometer (84 W)partially heated conventional anemometer (40 W)
ambient temperature
ice detector on/off
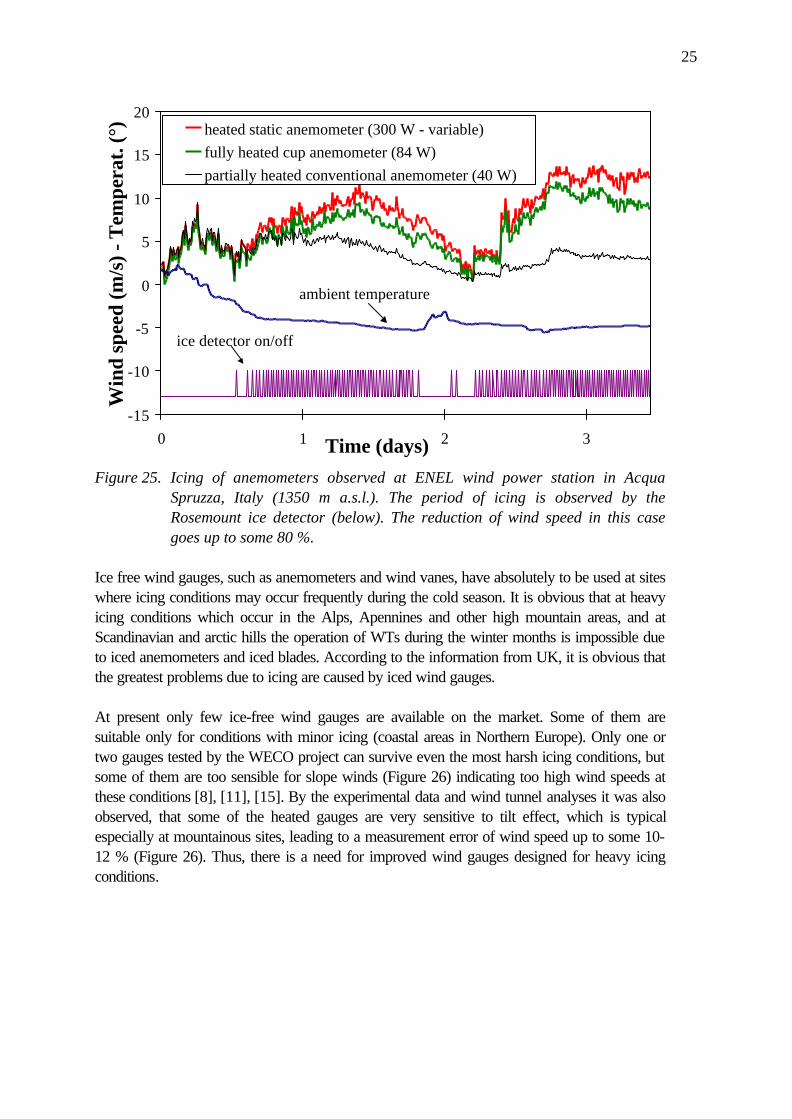
Figure 25. Icing of anemometers observed at ENEL wind power station in AcquaSpruzza, Italy (1350 m a.s.l.). The period of icing is observed by theRosemount ice detector (below). The reduction of wind speed in this casegoes up to some 80 %.
Ice free wind gauges, such as anemometers and wind vanes, have absolutely to be used at siteswhere icing conditions may occur frequently during the cold season. It is obvious that at heavyicing conditions which occur in the Alps, Apennines and other high mountain areas, and atScandinavian and arctic hills the operation of WTs during the winter months is impossible dueto iced anemometers and iced blades. According to the information from UK, it is obvious thatthe greatest problems due to icing are caused by iced wind gauges.
At present only few ice-free wind gauges are available on the market. Some of them aresuitable only for conditions with minor icing (coastal areas in Northern Europe). Only one ortwo gauges tested by the WECO project can survive even the most harsh icing conditions, butsome of them are too sensible for slope winds (Figure 26) indicating too high wind speeds atthese conditions [8], [11], [15]. By the experimental data and wind tunnel analyses it was alsoobserved, that some of the heated gauges are very sensitive to tilt effect, which is typicalespecially at mountainous sites, leading to a measurement error of wind speed up to some 10-12 % (Figure 26). Thus, there is a need for improved wind gauges designed for heavy icingconditions.

26
a)
WAA251
0.80
0.85
0.90
0.95
1.00
1.05
1.10
1.15
1.20
1.25
1.30
-15 -10 -5 0 5 1 0 1 5OFF-AXIS ANGLE
U/U
*CO
S
5 m/s 10 m/s 15 m/s
b)
WS-3
0.80
0.85
0.90
0.95
1.00
1.05
1.10
1.15
1.20
1.25
1.30
-15 -10 -5 0 5 10 15OFF-AXIS ANGLE
U/U
*CO
S
5 m/s 10 m/s 15 m/s
Figure 26. The effect of off-axis angle on measured wind speed presented as the ratio Rθ
= (Vm/V0)*cosθ (Vm is measured wind speed, V0 undisturbed backgroundwind speed, and θ the tilt angle) for three different wind speeds. a) WAA251and b) Hydro-Tech WS-3 [3].
The markets for ice-free anemometers are very large, and not only in Europe, due to the newwind power plants.
5.5 Ice detectors
Ice detecting systems are needed to give information of icing conditions to identify real timeicing of blades during unattended operation. It is also important to know if the blades are stilliced, to be able to re-start the turbine without any danger to the public after the icing period.Ice detecting system can also be used to control the heating system of blades.
Within the WECO project two ice detecting systems have been discussed and studied:- ice detectors- multi - anemometry (one heated, one unheated).
The Finnish Labko ice detectors were used and tested at various WECO test sites.
The experimental data from the test sites proved that ice detecting system is usable at icingsites.
At present there are not too many suitable ice detectors available, as shown by the marketsurvey [15].
5.6 Power production
The effect of icing upon power production is studied by models and by field measurements inorder to improve the methods to estimate the monthly and annual loss of energy production ofwind turbines operating under cold climate conditions.
5.6.1 Power measurements
Windy StandardThe power curve measurements for the NEG-Micon (Nordtank) 600/37 wind turbine at
27
Windy Standard included substantial periods when icing conditions were prevalent as well aslong periods through the summer of 1997 when it was known that no icing was occurring.
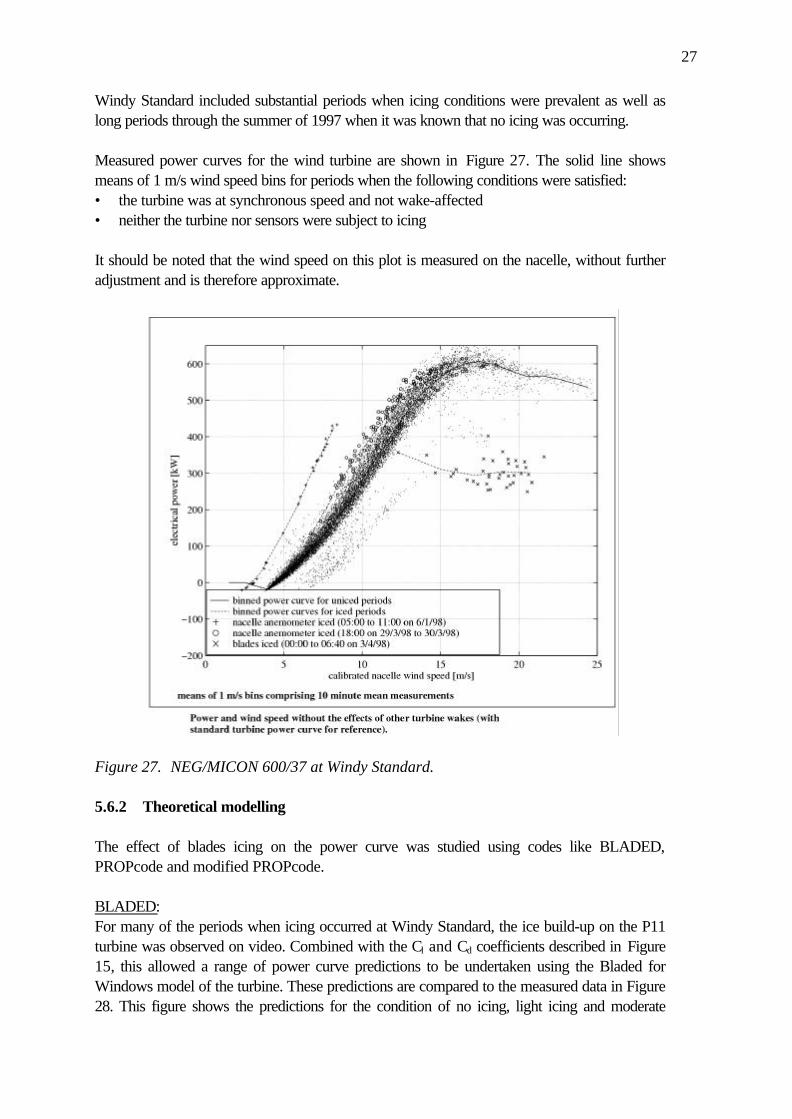
Measured power curves for the wind turbine are shown in Figure 27. The solid line showsmeans of 1 m/s wind speed bins for periods when the following conditions were satisfied:• the turbine was at synchronous speed and not wake-affected• neither the turbine nor sensors were subject to icing
It should be noted that the wind speed on this plot is measured on the nacelle, without furtheradjustment and is therefore approximate.
Figure 27. NEG/MICON 600/37 at Windy Standard.
5.6.2 Theoretical modelling
The effect of blades icing on the power curve was studied using codes like BLADED,PROPcode and modified PROPcode.
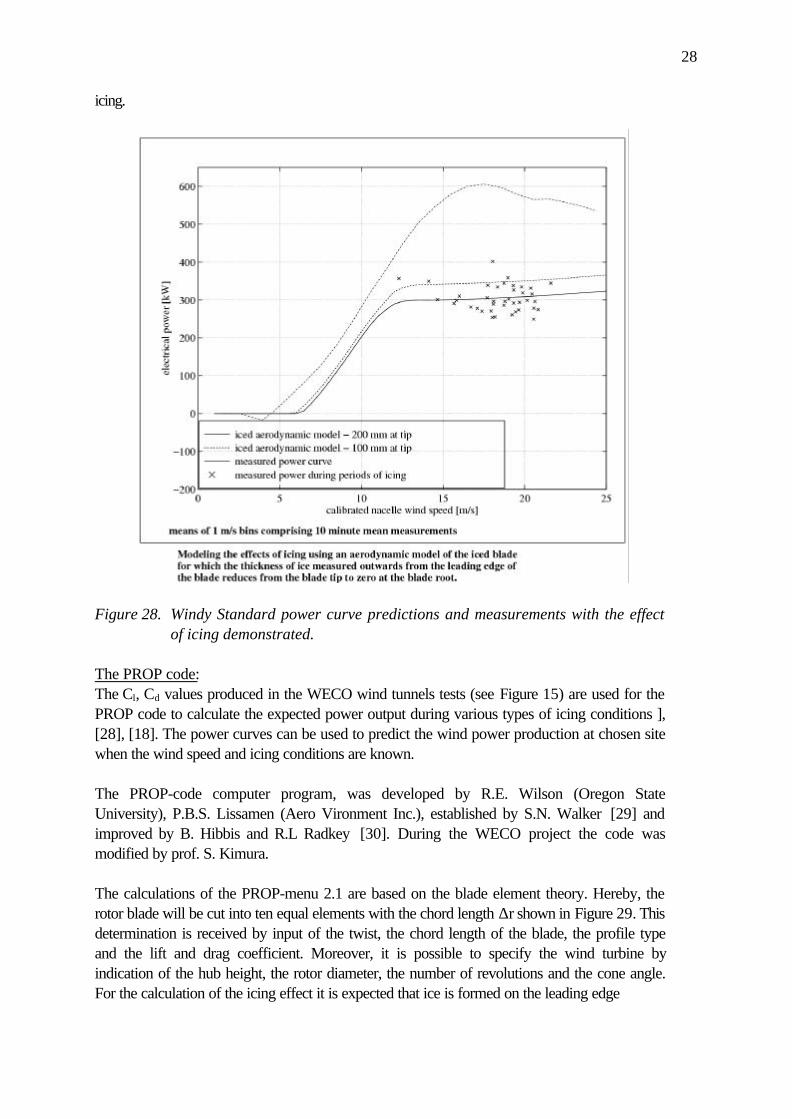
BLADED:For many of the periods when icing occurred at Windy Standard, the ice build-up on the P11turbine was observed on video. Combined with the Cl and Cd coefficients described in Figure15, this allowed a range of power curve predictions to be undertaken using the Bladed forWindows model of the turbine. These predictions are compared to the measured data in Figure28. This figure shows the predictions for the condition of no icing, light icing and moderate
28
icing.
Figure 28. Windy Standard power curve predictions and measurements with the effectof icing demonstrated.
The PROP code:The Cl, Cd values produced in the WECO wind tunnels tests (see Figure 15) are used for thePROP code to calculate the expected power output during various types of icing conditions ],[28], [18]. The power curves can be used to predict the wind power production at chosen sitewhen the wind speed and icing conditions are known.
The PROP-code computer program, was developed by R.E. Wilson (Oregon StateUniversity), P.B.S. Lissamen (Aero Vironment Inc.), established by S.N. Walker [29] andimproved by B. Hibbis and R.L Radkey [30]. During the WECO project the code wasmodified by prof. S. Kimura.
The calculations of the PROP-menu 2.1 are based on the blade element theory. Hereby, therotor blade will be cut into ten equal elements with the chord length ∆r shown in Figure 29. Thisdetermination is received by input of the twist, the chord length of the blade, the profile typeand the lift and drag coefficient. Moreover, it is possible to specify the wind turbine byindication of the hub height, the rotor diameter, the number of revolutions and the cone angle.For the calculation of the icing effect it is expected that ice is formed on the leading edge
29
100%
r1
1 2 3 4 5 6 7 8 9 10
100%
1 r1
1
1 2 3 4 5 6 7 8 9 10
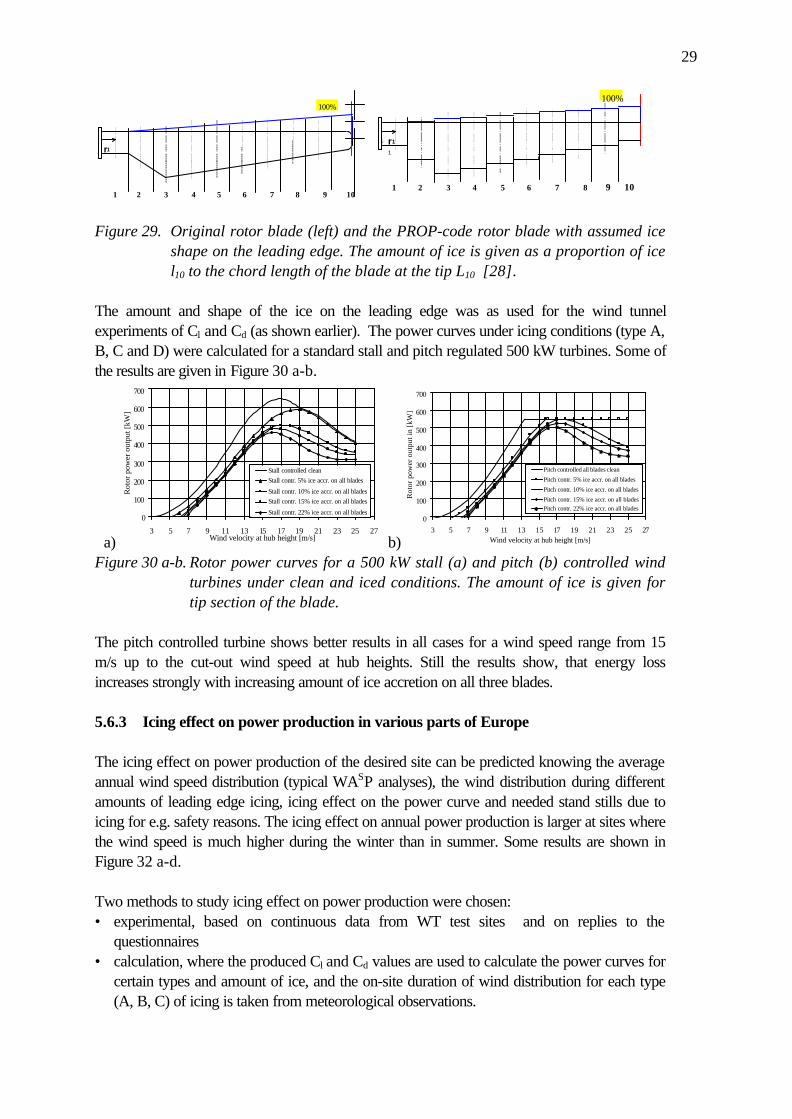
Figure 29. Original rotor blade (left) and the PROP-code rotor blade with assumed iceshape on the leading edge. The amount of ice is given as a proportion of icel10 to the chord length of the blade at the tip L10 [28].
The amount and shape of the ice on the leading edge was as used for the wind tunnelexperiments of Cl and Cd (as shown earlier). The power curves under icing conditions (type A,B, C and D) were calculated for a standard stall and pitch regulated 500 kW turbines. Some ofthe results are given in Figure 30 a-b.
a)
0
100
200
300
400
500
600
700
3 5 7 9 11 13 15 17 19 21 23 25 27Wind velocity at hub height [m/s]
Rot
or p
ower
out
put [
kW]
Stall controlled cleanStall contr. 5% ice accr. on all blades
Stall contr. 10% ice accr. on all bladesStall contr. 15% ice accr. on all blades
Stall contr. 22% ice accr. on all blades
b)
0
100
200
300
400
500
600
700
3 5 7 9 11 13 15 17 19 21 23 25 27Wind velocity at hub height [m/s]
Rot
or p
ower
out
put i
n [k
W]
Pitch controlled all blades clean
Pitch contr. 5% ice accr. on all blades
Pitch contr. 10% ice accr. on all blades
Pitch contr. 15% ice accr. on all blades Pitch contr. 22% ice accr. on all blades
Figure 30 a-b. Rotor power curves for a 500 kW stall (a) and pitch (b) controlled windturbines under clean and iced conditions. The amount of ice is given fortip section of the blade.
The pitch controlled turbine shows better results in all cases for a wind speed range from 15m/s up to the cut-out wind speed at hub heights. Still the results show, that energy lossincreases strongly with increasing amount of ice accretion on all three blades.
5.6.3 Icing effect on power production in various parts of Europe
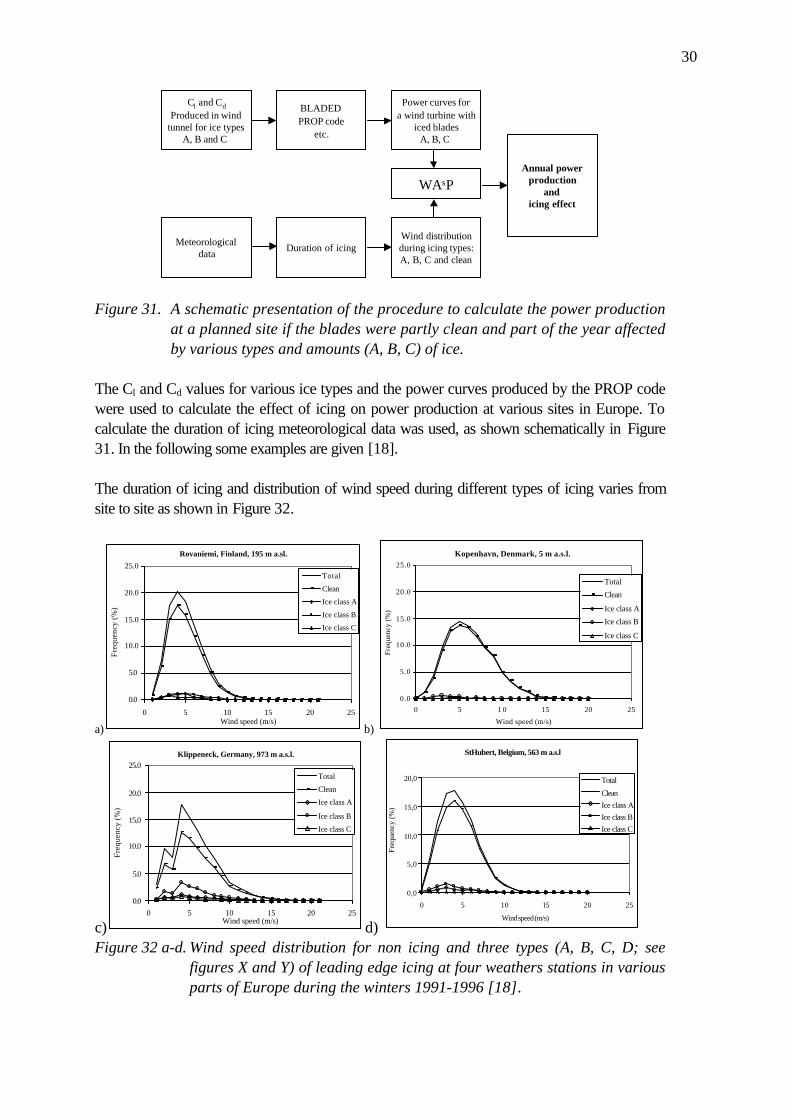
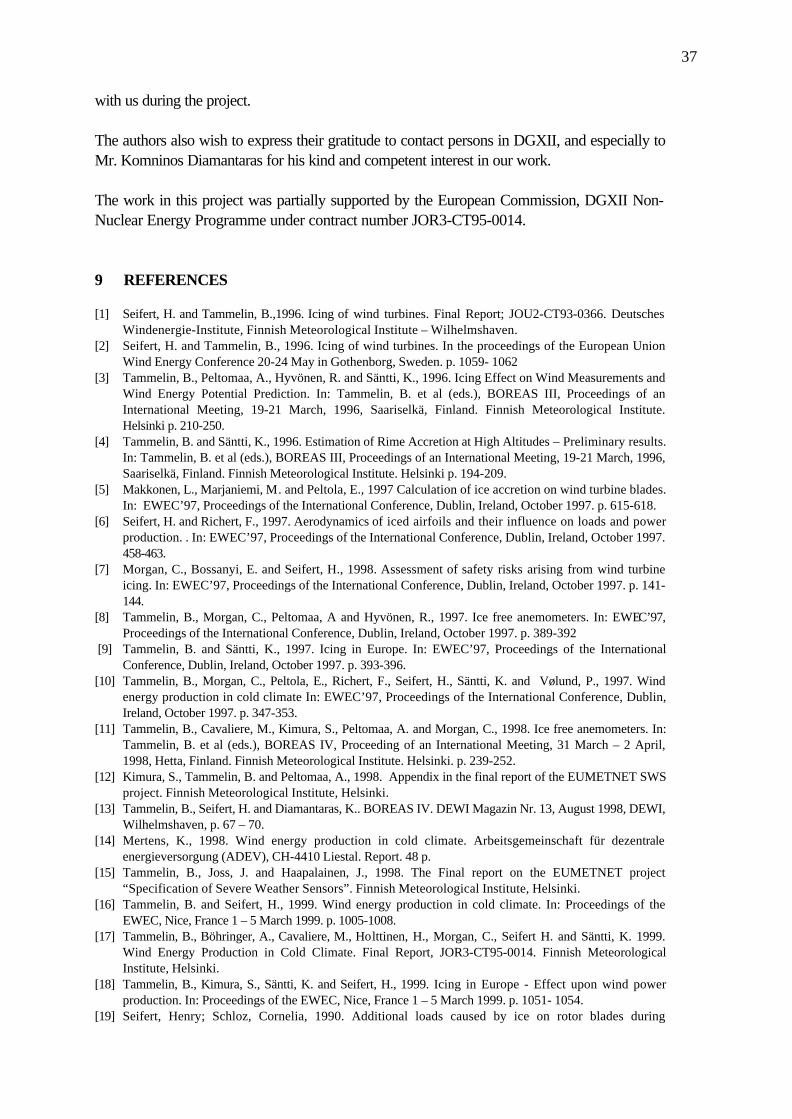
The icing effect on power production of the desired site can be predicted knowing the averageannual wind speed distribution (typical WASP analyses), the wind distribution during differentamounts of leading edge icing, icing effect on the power curve and needed stand stills due toicing for e.g. safety reasons. The icing effect on annual power production is larger at sites wherethe wind speed is much higher during the winter than in summer. Some results are shown inFigure 32 a-d.
Two methods to study icing effect on power production were chosen:• experimental, based on continuous data from WT test sites and on replies to the
questionnaires• calculation, where the produced Cl and Cd values are used to calculate the power curves for
certain types and amount of ice, and the on-site duration of wind distribution for each type(A, B, C) of icing is taken from meteorological observations.
30
Cl and CdProduced in wind
tunnel for ice typesA, B and C
BLADEDPROP code
etc.
Meteorologicaldata
Wind distributionduring icing types:A, B, C and clean
Power curves fora wind turbine with
iced bladesA, B, C
Duration of icing
Annual powerproduction
and icing effect
WAsP
Figure 31. A schematic presentation of the procedure to calculate the power productionat a planned site if the blades were partly clean and part of the year affectedby various types and amounts (A, B, C) of ice.
The Cl and Cd values for various ice types and the power curves produced by the PROP codewere used to calculate the effect of icing on power production at various sites in Europe. Tocalculate the duration of icing meteorological data was used, as shown schematically in Figure31. In the following some examples are given [18].
The duration of icing and distribution of wind speed during different types of icing varies fromsite to site as shown in Figure 32.
a)
Rovaniemi, Finland, 195 m a.sl.
0.0
5.0
10.0
15.0
20.0
25.0
0 5 10 15 20 25Wind speed (m/s)
Freq
uenc
y (%
)
Total
Clean
Ice class A
Ice class B
Ice class C
b)
Kopenhavn, Denmark, 5 m a.s.l.
0.0
5.0
10.0
15.0
20.0
25.0
0 5 1 0 15 20 25
Wind speed (m/s)
Freq
uenc
y (%
)
Total
Clean
Ice class A
Ice class B
Ice class C
c)
Klippeneck, Germany, 973 m a.s.l.
0.0
5.0
10.0
15.0
20.0
25.0
0 5 10 15 20 25Wind speed (m/s)
Freq
uenc
y (%
)
Total
Clean
Ice class A
Ice class B
Ice class C
d)
StHubert, Belgium, 563 m a.s.l
0,0
5,0
10,0
15,0
20,0
0 5 10 15 20 25
Wind speed (m/s)
Freq
uenc
y (%
)
Total
CleanIce class AIce class BIce class C
Figure 32 a-d. Wind speed distribution for non icing and three types (A, B, C, D; seefigures X and Y) of leading edge icing at four weathers stations in variousparts of Europe during the winters 1991-1996 [18].

31
Typically the icing effect at slightly ice affected sites on annual wind power production is about1-10 %, and at harsh areas about 20-50 % [18], [31].
5.7 Heated blades
Heating of the blades is one possibility to avoid the icing incidents. So far the use of anti-icingsystem based to heating has been studied further, as no coating materials which can remain onthe surface of a wind turbine blade for a long time seem to be available. Painted siliconouscover material has good ice repellent properties, but after quite a short period on operatingturbine blade it becomes porous and not ice repellent any more. However, at lower latitudes,where lots of solar energy is available, the effect of icing can be decreased e.g. by using bladespainted black. During the night black blades will be iced to the same degree as blades of othercolours. During the day absorption of solar radiation, and thus the warmth of the blades willmelt the ice, if the amount of ice is small. Heating and black color of the surface to prevent icingis not actually a new idea, and has been used (e.g. for wind measurements) since 1980´s [36].
Theoretical and empirical results show that the actual power demand to keep the blades icefree under operation (ice accreted upon the leading edge) is much less than earlier expected.
Table 1. Blade heating power in different heating system applications.
Application or Reference Heating PowerkW/m(blade length 12 m)
Max. Power (P=220 kW, ∅=25 m)
Relative Heating Power
First theoreticalassumption [33]
1,2 kW/m 43 kW 20 % of nom. Power10–15 % of gross prod.
First application,Pyhätunturi 1993
0,75 kW/m(6 m length, no tip)
13,5 kW 6 % of nom. Power3–4 % of gross prod. Productionlosses at the tip area
Pyhätunturi 1994 0,5 kW/m(7 m length, including tiparea)
10.5 kW 5 % of nom. Power3 % of gross prod.Production losses
Pyhätunturi 1995 0,5 kW/m(7 m length, including tiparea and fish piece)
11 kW 5 % of nom. Power1 - 3 % of gross prod.
Pyhätunturi 1997 0,5 kW/m(9 m length, including tiparea and fish piece,integrated)
14 kW 6 % of nom. Power1 - 3 % of gross prod.
Partly as a result of the WECO project the Kemijoki Arctic Technology (KAT) published acommercial blade heating system, the JE-system [34], [35].
5.8 Special needs for WTs operating under icing conditions
Some special needs for wind turbines designed for cold climate operation were found:
• Heated anemometers for all sites with even only slight icing are necessary• Information system of existing icing events• Heated blades for extreme or frequent icing conditions

32
• Heating systems for control system gear box and hydraulics and possibly other componentswithin the nacelle (f. ex. yaw system).
• Suitable lubricants for main bearings, gearbox, generator bearings. Special oil for hydraulicsystem.
• Cold resistant steel for all structural members with welds (mainly the tower).
5.9 Information policy of the WECO project
The WECO project as whole and each partner separately have been very active to producedeliverables to the use of the industry, manufacturers, utilities, operators, insurance companies,planners, research bodies etc.. The results have been presented e.g. in two internationalconferences the BOREAS III and IV conferences in northern Lapland, in the WOWECO IIworkshop for manufacturers took place in Wilhelmshaven, Germany in June 1997 and atEWEC´97 and at EWEC`99. Up to now the WECO project has produced 91 publishedpapers.
The industry and potential wind turbine operators from different European countries, notparticipating the WECO project, and several authorities have contacted the coordinator andother partners about results and achievements of the project during the project and after itsend. Thus the information from the project to the industry has been good.
6 CONCLUSION
Icing of blades and other structures of wind turbine is a significant problem at icing affectedsites in various parts of Europe. Icing of blades reduces the power production and causessafety problems for the turbines and the public. The severity of the icing problem depends onicing climate, frequency of icing events and on-site weather conditions.
Interest in the icing problems and in methods to solve them and to predict the icing effect onloads, power production etc. has increased significantly during the WECO project. Theincrease of interest is strongly related to the fact that more and more power plants are plannedto be installed in the far north, at inland and mountainous sites in Europe and else where. It isalso predicted that a significant part, 10-20 % of the wind power plants erected to fulfil thedemand of 40000 MW installed wind power in Europe by the year 2010 will be at regionswhere icing has to be taken into account in design of the wind turbines, their components likee.g. wind sensors and production of wind power production.
The WECO project has produced and distributed a lot of new information concerning windenergy production in cold climates and especially under icing conditions:
Very little has been known about icing and especially icing effect on meteorologicalmeasurements and win power production. The European icing map is the first scientific attemptto describe the icing climate in Europe. To produce the Icing map data from about 120synoptic observation stations operated by national weather services was used. It may be said,that the Icing map is not a complete description of icing, but it gives a good basic information

33
on duration of icing events, intensity of rime accretion and variation of in-cloud icing with heightabove the sea level at various parts of Europe.
The ice map combined with the European Wind Atlas is a proper tool for more preciseprediction of annual energy production at cold and ice affected sites in Europe. Thesepreliminary results provide basis for practical recommendations to be given to nationalmeteorological services in order to produce more reliable data on atmospheric icing.
Several WECO test sites (wind power plants) located in various parts of Europe and operatedunder various types of icing condition provided experimental data. Large temperaturedifferences as well as the combination of low temperatures and high wind speed, affecting thepower curves and human risks during the maintenance, were studied identified as targets forfurther investigation.
Reliable wind measurements are essential for the prediction of wind energy potential as well asfor the operation of wind turbines. The WECO project produced new theoretical andexperimental results on icing effect on anemometers and measured wind speed. It is evident thatno-ice-free anemometers can not be used for meteorological measurements and wind powerpurposes at ice affected sites. Thus the markets for reliable ice-free anemometers will be verylarge only in Europe in the next decade. According to the market survey performed it isobvious that at present only a few ice-free anemometers and three component sonicanemometers, but no ice-free vanes are available on the markets. Thus there is a need toimprove the wind gauges for various purposes within the field of wind energy and meteorology.
Ice detectors, or other methods to detect ice, are essential for operating the wind turbinesunder heavy icing and frequent icing conditions as well as for meteorological institutes that try toprovide icing data. Ice detectors available were tested at various WECO sites, and it wasshown that use of ice detector will significantly increase information of icing, and that they areuseful also e.g. for operation of blade heating systems. The market survey proved that thenumber of ice detectors available is very limited and at present the price of ice detectors is stillquite high. Thus it is obvious that also other methods to detect ice have to be investigated.
To study the icing effect of loads and power production the main work has been done inimproving the basic theoretical codes. To produce experimental data proved to be moredifficult than expected, which thus leaves a need for further demonstrations. To study the icingeffect on blades new Cl, Cd values for several iced profiles were produced using wind tunnelsimulations. The PROP code was then improved to calculate the icing effect on powerproduction under various types of icing conditions.
At present the estimated losses in power production at relatively heavily or very heavily ice-affected sites is estimated to be in the range of 20-50 per cent of the annual wind energyproduction. There is a need to improve de-icing and anti-icing systems for various parts of thewind turbines to decrease the losses due to low temperature and icing of various parts of thewind turbines and the control systems.
Codes used for load predictions were improved and analysed. The load predictions wereverified to experimental data obtained during the project. It is shown, that operation under

34
heavy icing conditions is not recommended. It was also shown that icing increases fatigue loadsbecause additional ice masses cause higher deterministic loads, assymmetric masses on bladescause unbalance, edgewise vibrations will be increased and resonance may occur due tochanged natural frequencies of components such as rotor blades. Icing of wind vanes maycause yaw errors and unexpected loads etc.
Ice throw from rotating blades is an important safety problem especially when the site of thewind power plant is planned to be close to public roads, housing, power lines, ship routes etc.Ice throw was studied using both theoretical models and experimental data collected e.g. usinga questionnaire sent to operators in various parts of Europe and making observations at theWECO test sites. According to the results from the studies it was recommended, that for siteswith high probability of icing the distance between the turbine and nearest object ought to be1.5*(hub height + rotor diameter). An hilly and mountainous sites also the effect of slopes hasto be taken into account.
At strongly ice affected sites public safety concerning ice throw and power production can beimproved by using blade heating system to avoid icing of the rotor blades. Blade heating systemhas been studied theoretically and experimentally to optimise the heating demand andaerodynamical properties of the blades. During the WECO project the demand of heatingpower used for a anti-icing system at harsh conditions has been reduced to a fraction fromwhat it was expected to be. As a result a commercial blade heating system is presented.
As a summary it may be noted, that icing may be a severe problem for wind power productionand public safety close to wind turbines operated under icing conditions. Thus as a result fromvarious parts of the WECO project recommendations have been worked out for the planningof wind energy plants at ice affected sites.
The interest in icing effect of wind power production and meteorological measurements, icing ofstructures and in observations/measurements and prediction of atmospheric icing has increasedsignificantly among manufacturers, wind turbine operators, utilities, meteorological services,research units, consultants etc. located in the EU member countries, but also elsewhere, duringthe WECO project. Thus also the use of the results is growing strongly. To transfer informationof the results successfully and without a delay to users and e.g. public authorities, the WECOproject produced 91 published papers.
7 EXPLOITATION PLANS AND ANTICIPATION BENEFITS
Pre-competitive information about operation of wind turbines at ice endangered and lowtemperature sites in Europe has been transferred to various groups in industry, utilities, publicauthorities and developers. The information and the recommendations concerning cold climateoperation of wind turbines given by the WECO project will stimulate the exploitation of windenergy utilisation in many areas of Europe where the potential is proved but the risk of aneconomic project is not yet calculable.
Tools have been developed, verified and partly commercially applied (at DEWI) in the field ofpublic safety, namely prediction tools for ice throw. The service to predict the distance of ice

35
fragments thrown off from operating wind turbines depending on rotor speed wind speed andwind direction is offered to wind farm developers and public administrations.
Methods and codes have been developed to assess the aerodynamic characteristics of variousiced airfoils. The service to estimate aerodynamic loads and power curves of any iced rotorblade is offered to industry. Partly these tools have been verified by experiments (e.g. loads andpower curve at the INVENTUS 6 turbine). The method is used as a commercial tool atDEWI, Risoe, VTT and Garrad Hassan.
The tool to predict the iced airfoil characteristics has been successfully applied for a rotor bladeunder commercial conditions (for the Garrad Hassan rotor blade design) at the end of theWECO project.
The improved blade element theory code “PROP code” together with the method to predictloads and power curves of iced blades is used by DEWI and FMI.
This is all approved by the sound activity list, where these contacts to interested groups aredocumented. In Germany the distance recommendations are more or less fixed by the valuesgiven by WECO recommendations. Also the recommendation that dependent on the winddirection and wind speed at which the wind turbines should be switched off or not at icingconditions is accepted by many public administrations.
The project proved the need for heated anemometers to be used in much wider regions inEurope than earlier expected. As an example the Vaisala Oy, which is one of the mostimportant manufacturer of meteorological instruments, has adopted the results from the WECOproject by releasing a new version of heated cup anemometers WAA25, which was alsopresented for the wind turbine manufacturers in the European Wind Energy Exhibition in Nice1999. Also other companies have started to produce ice-free anemometers. Additionally,following the WECO recommendations, a lot of ice-free instruments are being ordered (marketstimulation). Also the national meteorological services are today more interested in using ice-free anemometers for their meteorological measurements, to improve the quality of observation.
The blade heating system was further developed by Kemijoki Oy. The company presented thecommercial system at the BOREAS IV conference in 1998. The system is today available forBONUS wind turbines. The blade heating system is already used at new wind power plants inFinland and Sweden, and up to now there are proposed power plants using this system at leastin the Nordic countries but also in Austria, France, Germany and Switzerland, and othercountries outside Europe. The blade heating system (JE-system) is today sold by the KemijokiArctic Technology Ltd (KAT).
The market study concerning heated anemometers is available at the FMI.
The Labko ice detector was operated by the WECO partners, and the results achieved wereused by Labko for improvement of the detector. Today the Labko ice detector is available andis an essential part of the KAT JE-system. It has also been presented to the aviation authoritiesto be used at airports, and to Vaisala Oy to be used for the automatic weather observationsystems.

36
The FMI has created a commercial product for the prediction of on-site in-cloud icing, up tonow it has been applied in the of practically new wind power sites in Finland. This is also truefor coastal regions, where icing has not been an essential problem for medium sized windturbines, but will be a problem for large turbines reaching up to 100 m and more. Icepredictions have also been commissioned by other countries like Sweden, Germany, Austria,Chile, Canada, China etc.. However, the lack of sufficient data and the missing permission touse existing data caused problems up to now.
The know-how and results concerning icing, and especially in-cloud icing, produced andpublished by the WECO project were already being used commercially by the FMI for theEUMETNET SWS project, where the European meteorological services achieved newinformation on icing of meteorological sensors. This has led to a new commercial project toproduce new requirements and specification for measurements operated under icing conditions.The information provided by the FMI has already led to changes in specifications of automaticweather stations produced by various manufacturers in different parts of the world.
Certification bodies have been regularly informed about the results in order to modify or verifythe design load assumptions and to improve Standards and recommendations.
A large number of building authorities and public administration have been informed and somewind energy projects could be realised by clearing up concerns due to ice throw. Givenrecommendations by the WECO project, better planning of projects at ice endangered inlandsites helped in exploiting wind energy projects.
All in all the sensitivity of industry concerning cold climate operation has been improved andmore reliable load assumptions and safety in planning of projects at ice endangered sites hasbeen initiated by the WECO project and thus has helped to improve safety and economics ofwind energy and has launched wide planning and building of wind power plants at hostile andextreme climatic areas, where no successful wind projects had been thought practicable, inlarger parts of Europe. At present the European wind energy industry and manufacturers ofanemometers and ice detectors, as well as consultants and research institutes, have an advanceon the strongly expanding worldwide markets on “cold climate wind turbines”.
8 ACKNOWLEDGEMENTS
As the coordinator of the WECO project wishes to express his warm thanks to all partners ofthe project, especially to Dr. Frank Richert, Mr. Esa Peltola and Mr. Per Vølund who allcarried a big responsibility in the project, but were transferred to other duties and companiesduring the project, to the authors of the final report, to Mr. Robert Horbaty from the ENCO(Switzerland) for interesting and fruitful cooperation, to Dr. Tapani Tiusanen, Vaisala Oy andMr. Juhani Mäkinen, Labko Oy for successful testing and improvement in measurements.
The authors of this report wish to express their gratitude to all colleagues at various partnerinstitutes working with the project, and to all our industrial partners, as well as to all thosecontact persons from different parts of Europe and entire world who have been in cooperation
37
with us during the project.
The authors also wish to express their gratitude to contact persons in DGXII, and especially toMr. Komninos Diamantaras for his kind and competent interest in our work.
The work in this project was partially supported by the European Commission, DGXII Non-Nuclear Energy Programme under contract number JOR3-CT95-0014.
9 REFERENCES
[1] Seifert, H. and Tammelin, B.,1996. Icing of wind turbines. Final Report; JOU2-CT93-0366. DeutschesWindenergie-Institute, Finnish Meteorological Institute – Wilhelmshaven.
[2] Seifert, H. and Tammelin, B., 1996. Icing of wind turbines. In the proceedings of the European UnionWind Energy Conference 20-24 May in Gothenborg, Sweden. p. 1059- 1062
[3] Tammelin, B., Peltomaa, A., Hyvönen, R. and Säntti, K., 1996. Icing Effect on Wind Measurements andWind Energy Potential Prediction. In: Tammelin, B. et al (eds.), BOREAS III, Proceedings of anInternational Meeting, 19-21 March, 1996, Saariselkä, Finland. Finnish Meteorological Institute.Helsinki p. 210-250.
[4] Tammelin, B. and Säntti, K., 1996. Estimation of Rime Accretion at High Altitudes – Preliminary results.In: Tammelin, B. et al (eds.), BOREAS III, Proceedings of an International Meeting, 19-21 March, 1996,Saariselkä, Finland. Finnish Meteorological Institute. Helsinki p. 194-209.
[5] Makkonen, L., Marjaniemi, M. and Peltola, E., 1997 Calculation of ice accretion on wind turbine blades.In: EWEC’97, Proceedings of the International Conference, Dublin, Ireland, October 1997. p. 615-618.
[6] Seifert, H. and Richert, F., 1997. Aerodynamics of iced airfoils and their influence on loads and powerproduction. . In: EWEC’97, Proceedings of the International Conference, Dublin, Ireland, October 1997.458-463.
[7] Morgan, C., Bossanyi, E. and Seifert, H., 1998. Assessment of safety risks arising from wind turbineicing. In: EWEC’97, Proceedings of the International Conference, Dublin, Ireland, October 1997. p. 141-144.
[8] Tammelin, B., Morgan, C., Peltomaa, A and Hyvönen, R., 1997. Ice free anemometers. In: EWEC’97,Proceedings of the International Conference, Dublin, Ireland, October 1997. p. 389-392
[9] Tammelin, B. and Säntti, K., 1997. Icing in Europe. In: EWEC’97, Proceedings of the InternationalConference, Dublin, Ireland, October 1997. p. 393-396.
[10] Tammelin, B., Morgan, C., Peltola, E., Richert, F., Seifert, H., Säntti, K. and Vølund, P., 1997. Windenergy production in cold climate In: EWEC’97, Proceedings of the International Conference, Dublin,Ireland, October 1997. p. 347-353.
[11] Tammelin, B., Cavaliere, M., Kimura, S., Peltomaa, A. and Morgan, C., 1998. Ice free anemometers. In:Tammelin, B. et al (eds.), BOREAS IV, Proceeding of an International Meeting, 31 March – 2 April,1998, Hetta, Finland. Finnish Meteorological Institute. Helsinki. p. 239-252.
[12] Kimura, S., Tammelin, B. and Peltomaa, A., 1998. Appendix in the final report of the EUMETNET SWSproject. Finnish Meteorological Institute, Helsinki.
[13] Tammelin, B., Seifert, H. and Diamantaras, K.. BOREAS IV. DEWI Magazin Nr. 13, August 1998, DEWI,Wilhelmshaven, p. 67 – 70.
[14] Mertens, K., 1998. Wind energy production in cold climate. Arbeitsgemeinschaft für dezentraleenergieversorgung (ADEV), CH-4410 Liestal. Report. 48 p.
[15] Tammelin, B., Joss, J. and Haapalainen, J., 1998. The Final report on the EUMETNET project“Specification of Severe Weather Sensors”. Finnish Meteorological Institute, Helsinki.
[16] Tammelin, B. and Seifert, H., 1999. Wind energy production in cold climate. In: Proceedings of theEWEC, Nice, France 1 – 5 March 1999. p. 1005-1008.
[17] Tammelin, B., Böhringer, A., Cavaliere, M., Holttinen, H., Morgan, C., Seifert H. and Säntti, K. 1999.Wind Energy Production in Cold Climate. Final Report, JOR3-CT95-0014. Finnish MeteorologicalInstitute, Helsinki.
[18] Tammelin, B., Kimura, S., Säntti, K. and Seifert, H., 1999. Icing in Europe - Effect upon wind powerproduction. In: Proceedings of the EWEC, Nice, France 1 – 5 March 1999. p. 1051- 1054.
[19] Seifert, Henry; Schloz, Cornelia, 1990. Additional loads caused by ice on rotor blades during

38
operation. - European Community Wind Energy Conference: proceedings of an internationalconference held at Madrid, Spain 10-14, September 1990. - Bedford: Stephens and Ass., 1990, p. 203-207.
[20] Seifert, H., 1996; Rotorblätter, eiskalt erwischt (Glacial Period for Rotor Blades), DEWI-Magazin, No 8, pages 4– 13.
[21] Richert, F. and Seifert, H., 1997. Eis im Kanal. DEWI-Magazine 10, p. 4-13.[22] Horbaty, R. ENCO Langenbruck, Switzerland: Development of Wind Energy in Alpine Regions. In:
Proceedings of the EWEC, Nice, France 1 – 5 March 1999. p. 531-533.[23] Eggelston, D. M.; Stoddard, F. S.: Wind Turbine Engineering Design, New York: Van Nostrand
Reinhold, Library of Congress Catalog Number 86-23331, 1987[24] Hulle, F. J. L., et al., 1996. Verification of Design Loads for Small Wind Turbines, Final report JOULE II
Project CT93-0423, ECN, Petten, Netherlands.[25] Kenyon, P. R., 1994. Anemo metry in New England mountain icing environments. In: Tammelin, B. et al
(eds.), BOREAS II, Proceeding of an International Meeting, 21-25 March 1994, Pyhätunturi. FinnishMeteorological Institute. Helsinki, p. 154-163.
[26] Vølund, P. and Antikainen, P., 1997. Ice-Induced Loads on Wind Turbines. In: EWEC’97, Proceedingsof the International Conference, Dublin, Ireland, October 1997. p. 464-467.
[27] Stuke, M. 1998. Estimation of effect of icing on power production for stall and pitch controlled windturbines – Diploma thesis. Finnish Meteorological Institute, Helsinki, Finland. p.72.
[28] Tammelin, B. Stuke, M., Seifert, H. and Kimura, S., 1999. Icing effect on power production of windturbine. In: Tammelin, B. et al (eds.), BOREAS IV, Proceeding of an International Meeting, 31 March –2 April, Hetta, Finland. Finnish Meteorological Institute, Helsinki.
[29] Walker, S.N., 1976. Performance and optimum design analysis and computation for propeller type windturbines. (Diss.) Oregon State University.
[30] Hibbis, B. and Radkey, R.L., 1983. Calculating rotor performance with the revised PROP computercode. Aero Vironment, Inc., Pasadena, CA.
[31] Botta, G., Cavaliere, M. and Holttinen, H., 1998. Ice accretion at Acqua Spruzza and its effect on windturbine operation and loss of energy production. In: Tammelin, B. et al (eds.), BOREAS IV, Proceedingof an International Meeting, 31 March – 2 April, 1998, Hetta, Finland. Finnish Meteorological Institute,Helsinki. p. 77-86.
[32] Tammelin, B., 1982. Frost formation on anemometers and frost prevention experiments. Technical report No 26.Finnish Meteorological Institute. 34 pp.
[33] Böhmeke, G., 1991. Wind power plants in the weather conditions of Northern Finland. TechnicalResearch Centre of Finland, Research Notes 1354. Espoo, Finland.
[34] Peltola, E., Marjaniemi, M., Kaas, J. and Aarnio, E., 1997. Heating of Wind Turbine Blades - Designand Operational Experience. In: EWEC’97, Proceedings of the International Conference, Dublin,Ireland, October 1997. p. 619-621.
[35] Peltola, E., 1999. Prospects of Arctic wind technology and wind farm development in Finland. In:Proceedings of the EWEC, Nice, France 1 – 5 March 1999. p. 485-487.
[36] Tammelin, B., Roos, I.and Hyvönen, R. 1999. Wind energy production in cold climate. Final report.ERBIC20CT960001. 16 p.
For further information about WECO please see:http://www.fmi.fi/TUT/MET/energia/WECO.html