Embed Size (px)
Citation preview
1
Wind-induced Pressures on Patio Covers
by
Ioannis Zisis1 and Ted Stathopoulos2, F.ASCE
CE Database Keywords: wind tunnel tests, wind loads, low-rise buildings, load distribution
standards and codes.
Abstract
A wind tunnel study has been carried out to assess wind loads on patio covers attached to low-
rise buildings. A 1:100 geometric scale building and patio cover model was constructed and
tested for open exposure conditions. The patio cover model was instrumented with pressure taps
on both top and bottom surfaces, allowing the simultaneous measurement of wind
pressure/suction on each side of the patio cover. The effect of building/patio height was
considered by testing three different model configurations.
Local surface and net wind pressure and force coefficients are presented for each model
configuration. Correlation analysis was carried out to demonstrate how wind flow on top and
bottom of the patio cover affects the total wind load. The findings are also compared to the
limited design guidelines derived by current building codes. Finally, recommendations for design
wind load standards and codes of practice are made.
1 PhD Candidate, Centre for Building Studies, Department of Building, Civil and Environmental Engineering, Concordia Univ., Montreal,
Quebec, Canada H3G 1M8
2 Prof. and Assoc. Dean, Centre for Building Studies, Department of Building, Civil and Environmental Engineering, Concordia Univ., Montreal,
Quebec, Canada H3G 1M8
2
Introduction
Patio covers are widely used in residential construction in North America. These covers are in
most cases attached to low-rise buildings and often provide shelter to their residents. In addition,
they compose an active and eventful part of family’s living space, with a number of activities to
take place under them. Proper design of these elements against wind is important and special
attention should be paid during construction for both safety and economic reasons.
More recently, patio covers have been treated as subsections of canopies and have been
designed as free roofs. In most cases though, patio covers are a completely independent group of
structures, which cannot fall under any of the above categories. Canopies are used as covers and
usually are not surrounded by walls. The specifications, use and geometry of canopy roofs are
indeed significantly different from those of patio covers. Moreover, patio covers are often at a
lower level than the building’s roof, thus they cannot be treated as roof extension or overhangs.
Despite the importance of adequate wind design of patio covers, limited studies have been
carried out and the following question arises: is the design of these structures based on
inadequate wind pressures or are patio covers over-designed because of lack of the appropriate
knowledge? Wind standards and building codes of practice (with some notable exceptions) do
not include any pressure coefficient provisions for the design of patio covers. The only codes that
explicitly refer to patio covers are the International Building Code (IBC 2006) and the
International Residential Code (IRC 2006) but their provisions do not seem to arise from any
detailed study on these structures. The Australian Standard also refers to attached canopies,
awnings and carports, which can be considered similar to patio cover structures. The rest of the
various national building codes refer rather implicitly to canopy roofs or to open buildings.
3
The paper presents the methodology and findings of a set of wind tunnel tests on a building
model with a patio cover attached to it. Both the testing procedure and the data interpretation are
discussed and detailed results are presented. Recommendations for wind load provisions for
design wind load standards and codes of practice are also made.
Patio Covers and Wind Code Provisions
IBC 2006, IRC 2006 and AC340
Both IBC and IRC include appendices where patio cover requirements are presented. Based
on these requirements, patio covers should be used exclusively for recreational, outdoor activities
and not as carports, garages, storage rooms etc. Patio covers should not exceed 12 feet (3.66 m)
in height and they can be either with or without enclosure walls. For the case where enclosure
walls are present, there is a minimum requirement of openings that should be used. These
openings are allowed to be covered with insect screening, translucent or transparent plastic, glass
or any combinations of them. These codes also differentiate the cases of attached from free-
standing patio covers.
Acceptance Criteria AC340 (ICC-ES), as a supplement to the international codes, evaluate the
patio cover design requirements. The AC340 has direct references to the IBC, IRC and ASCE 7-
05. Similarly to the appendices of the IBC and IRC, the AC340 classifies patio covers into three
main groups; free-standing without enclosure walls, attached without enclosure walls and
attached with enclosure walls. Naturally, all types of patio covers should be able to withstand
both vertical and horizontal wind loads. The load combinations should conform to the IBC
section 1609 provisions. In more detail, for attached patio covers without enclosure walls,
AC340 (3.1.5.2) proposes to use the ASCE 7, sections 6.5.12 and 6.5.13 along with figures 6.18
4
A-D and 6-19 A-C for the calculations of the vertical and horizontal wind loads. In addition, the
calculated wind loads should comply with the minimum wind load criteria cited in IBC, section
1609 and IRC, section R301.2.1.
ASCE 7-05
The ASCE 7-05 standard does not have any direct reference to patio covers. As mentioned
previously though, sections 6.5.12 and 6.5.13 present wind load provisions for enclosed, partially
enclosed and open buildings. Suggested values for net pressure coefficients for a number of
different free standing roof configurations are also shown in figures 6-18 A-D (main wind force
resisting system) and 6-19 A-C (components and cladding). These net pressure coefficients
include contributions from both roof surfaces. In the Commentary chapter C6 of ASCE 7-05 it is
explained that Figures 6-18 and 6-19 are mainly based on the Australian Standards. The concept
of the clear and obstructed wind flow is also discussed, with special reference to the latter case
(more than 75 percent of the cross-section is blocked by goods or materials below the roof)
where the uplift load is significantly increased.
Patio covers can be considered as roofs of open buildings but this is a rather generic and
arbitrary definition. Patio covers attached to dwelling units are in the wake of the adjacent
structure and wind loads can be affected from this phenomenon. In some cases, patio covers can
be considered as eaves/canopies and apply the pressure coefficient values associated with them.
However this approach may result in overestimated wind-induced pressures for patio covers.
NBCC 2005
The Canadian building code (NBCC 2005) has no reference to patio covers or canopy roofs.
5
Eurocode 1
Similar to the North American codes, there is no reference on patio covers in Eurocode 1
(prEN 1991-1-4, 2004). The only part that can be used for the design of patio covers is section
7.3 where canopy roofs are presented. Based on the definition included in this section, a canopy
roof is the roof of a structure that has no permanent walls. This could be the case of the patio
cover but as mentioned previously, this does not fully represent reality. It should be noted though
that a very detailed approach is presented for the wind actions calculation on canopy roofs for a
number of cases and parameters. In addition to the net pressure coefficients presented in ASCE 7
provisions, Eurocode suggests overall force coefficients as well. The latter can produce the total
resulting wind forces on the canopy whereas net pressure coefficients evaluate peak local
pressures and are applicable particularly for the design of roofing elements and fixings.
British Code
The British Standards (BS 6399-2, 1997) show several similarities to the Eurocode and
propose local and overall net pressure coefficients for canopies, taking into consideration both
the top and bottom surface of the roof. The values suggested are almost identical to those
presented in Eurocode and the only reference on canopies attached to buildings redirects
designers to an external reference (Cook 1985) without proposing any particular approach for the
calculation of wind actions.
Australian Standard (AS/NZS 1170.2:2002)
The Australian Standard is apparently the only official wind load standard that explicitly
provides net pressure coefficients for attached canopies, awnings and carports. These coefficients
include both the uplift and downlift wind action scenarios for two basic directions, parallel and
perpendicular to the building’s orientation. Moreover the ratio of the patio height to the roof
6
height is taken into consideration along with the size (width) of the patio cover. It appears that
the study of Jancauskas and Holmes (1985) has been the basis for the development of these
provisions in the Australian Standard.
Other Studies
As previously mentioned, the case of a patio cover has barely been studied in detail; therefore
the loads used for wind design are based either on canopy roofs or on open building cases. A
very detailed study dealing with wind force coefficients on canopy roofs was carried out by
Uematsu et al. (2007, 2008a and 2008b). The wind tunnel experiments were conducted for open
terrain exposure and net pressure coefficients were calculated for different canopy roof
configurations.
Wind Tunnel Study
The wind tunnel tests of the present study were conducted in the Building Aerodynamics
Laboratory located in the Engineering Complex at Concordia University. A plexi-glass 1:100
building model was used for the experiments. The model has external dimensions of 15 cm by 10
cm (length – width) and a total height of 9 cm (ridge height). The gabled roof has a slope of 4:12.
The model is equipped with 65 roof pressure taps located both on the top and the bottom of the
roof eave. For the current study only specific roof pressure taps were considered and only for
verification purposes (comparison to previous studies).
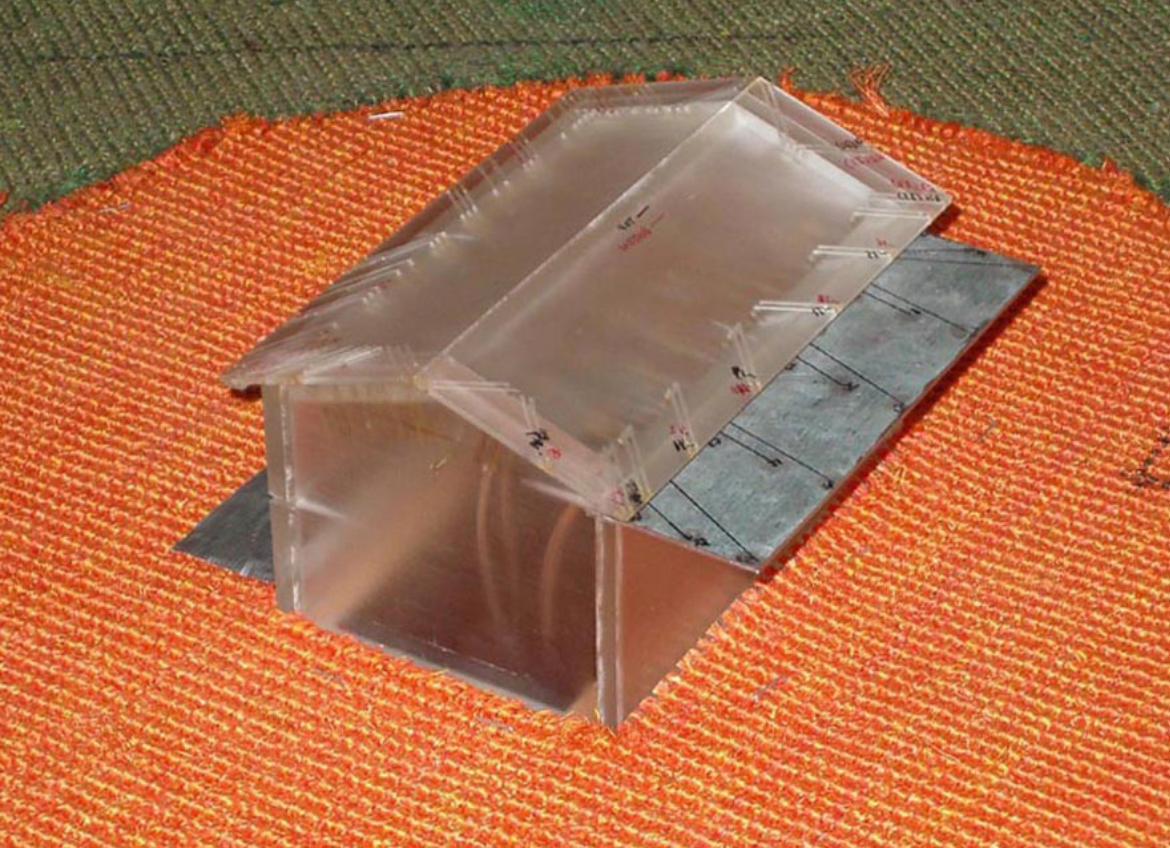
In addition to the building model, a metallic patio cover model of the same geometric scale
(1:100) was constructed and was mounted on the building model creating the final test model.
The patio cover model is 15 cm by 3.65 cm and 0.20 cm thick. In order to consider different
7
building configurations, the patio cover was attached on the building model at two different
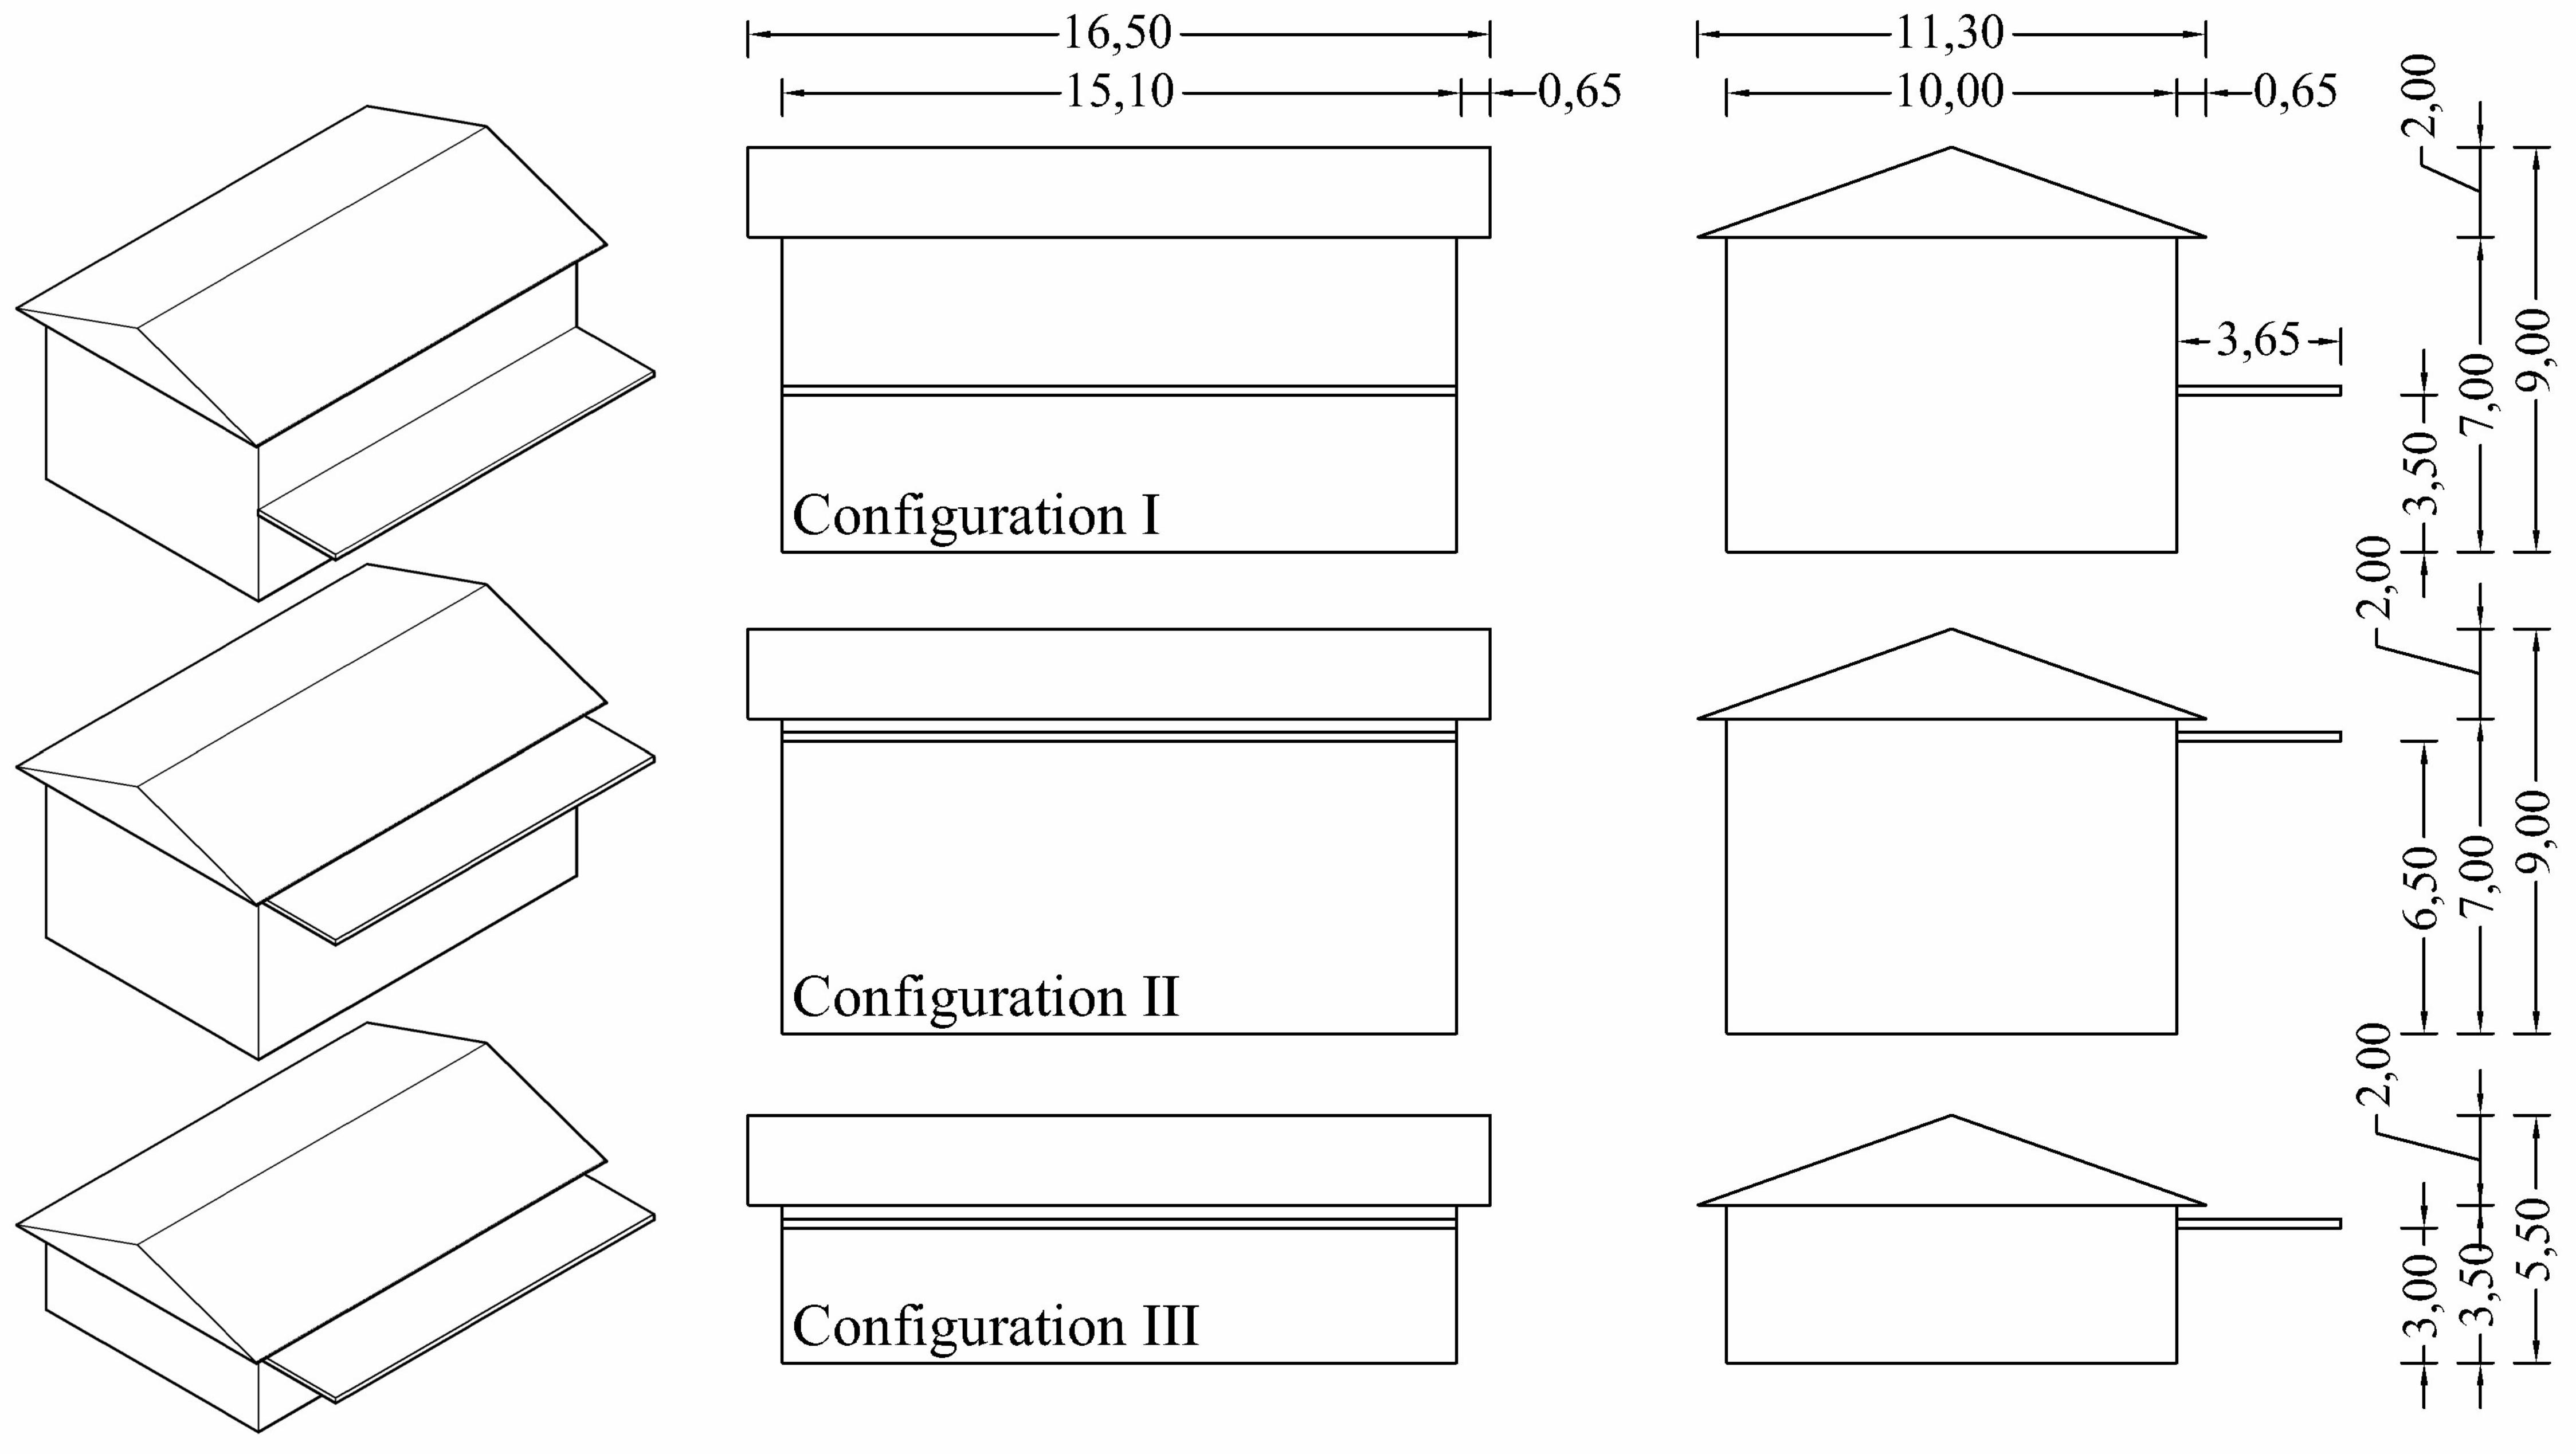
building heights. Three configurations were examined; a two-storey building with the patio cover
at the first floor level, a two-storey building with the patio cover at the roof height and a single-
storey building with patio cover at the eave height (see Fig. 1). The patio model was equipped
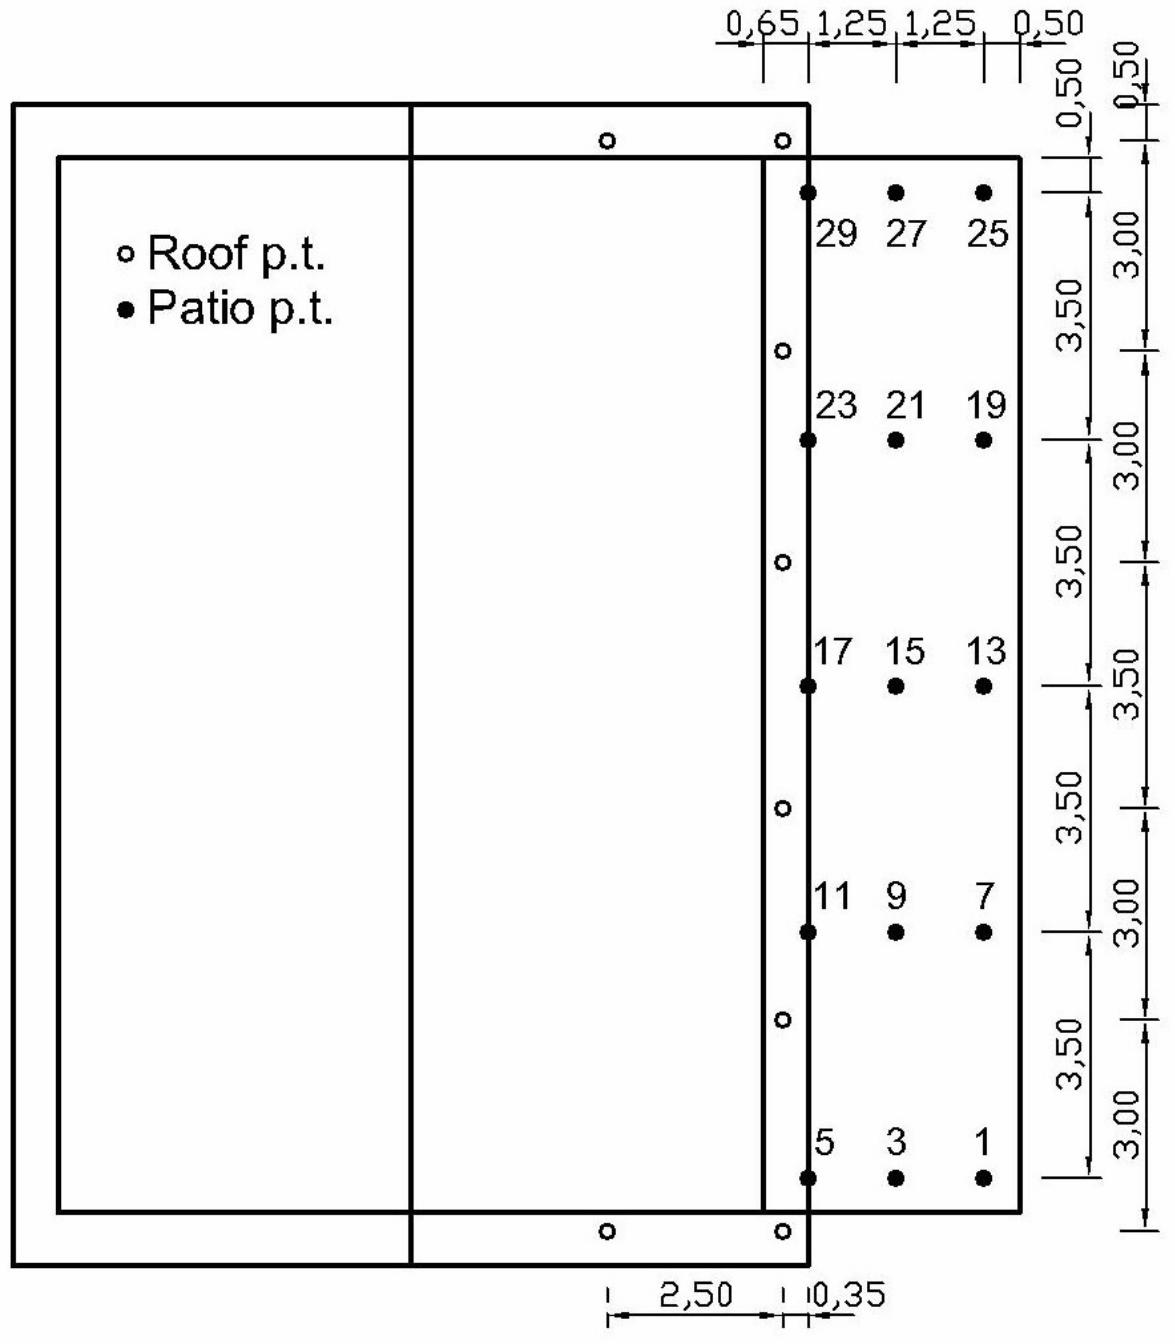
with 30 pressure taps, 15 on the top surface and another 15 on the bottom surface. The building
and patio cover model are shown in Fig. 2 and the pressure tap location in Fig. 3. Odd numbers
are used for the top surface pressure taps (1.3.5 etc) and even numbers for the bottom surface
(2.4.6 etc).
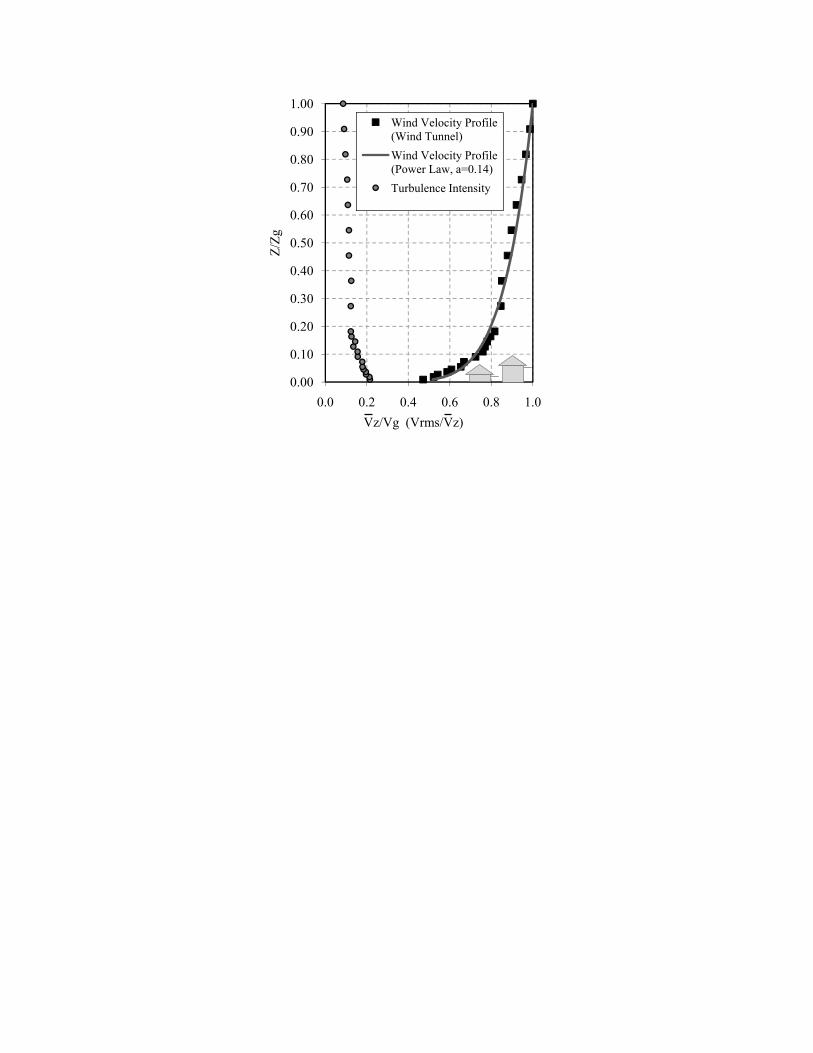
The tests were conducted in open terrain simulation characteristics. The value of the power
law exponent alpha (α) was 0.14 and the corresponding turbulence intensity at the roof height
was approximately 17.5% for the one-storey model and 14% for the two-storey model. These
values satisfy the previously addressed importance of proper simulation of turbulence intensity at
roof height during wind tunnel testing of low-rise buildings (Tieleman 1998) and also justify the
selection of the 1:100 geometric scale.
Using the appropriate terrain roughness simulation, the wind velocity was measured at
different heights at the centre of the wind tunnel test section without the model in place. The
analysis of the measured velocities gave the ratio of the longitudinal wind velocity over the wind
velocity at the gradient height ( z/Vg), which is also compared with the analytical curve obtained
from the power law for α=0.14. This is presented along with the turbulence intensity profile
(Vrms/ z) in Fig. 4.
The instrumentation used for the wind tunnel tests consisted of a hotwire anemometer (wind
velocity and turbulence intensity profiles) and a system of sensitive pressure scanners
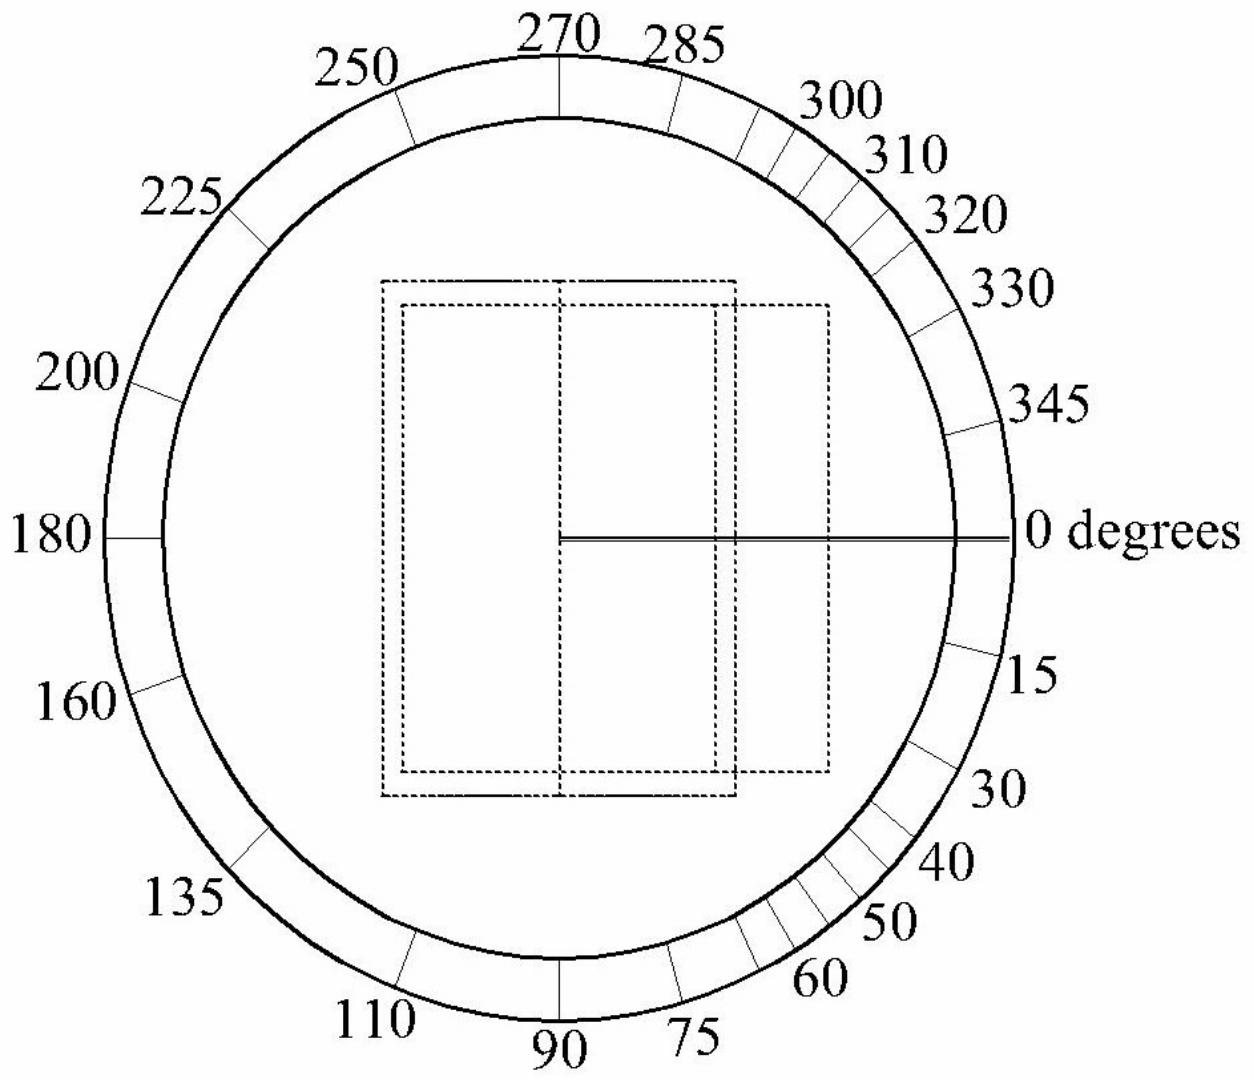
(Scanivalve DSM3000 and ZOC33/64 Px - 2003). A total number of 28 wind attack angles were
8
examined - see Fig. 5. The scanning frequency was 250 Hz and the duration of the record was 36
seconds, values that adequately simulate the dynamic properties of wind-induced pressures to an
equivalent full-scale duration of one hour.
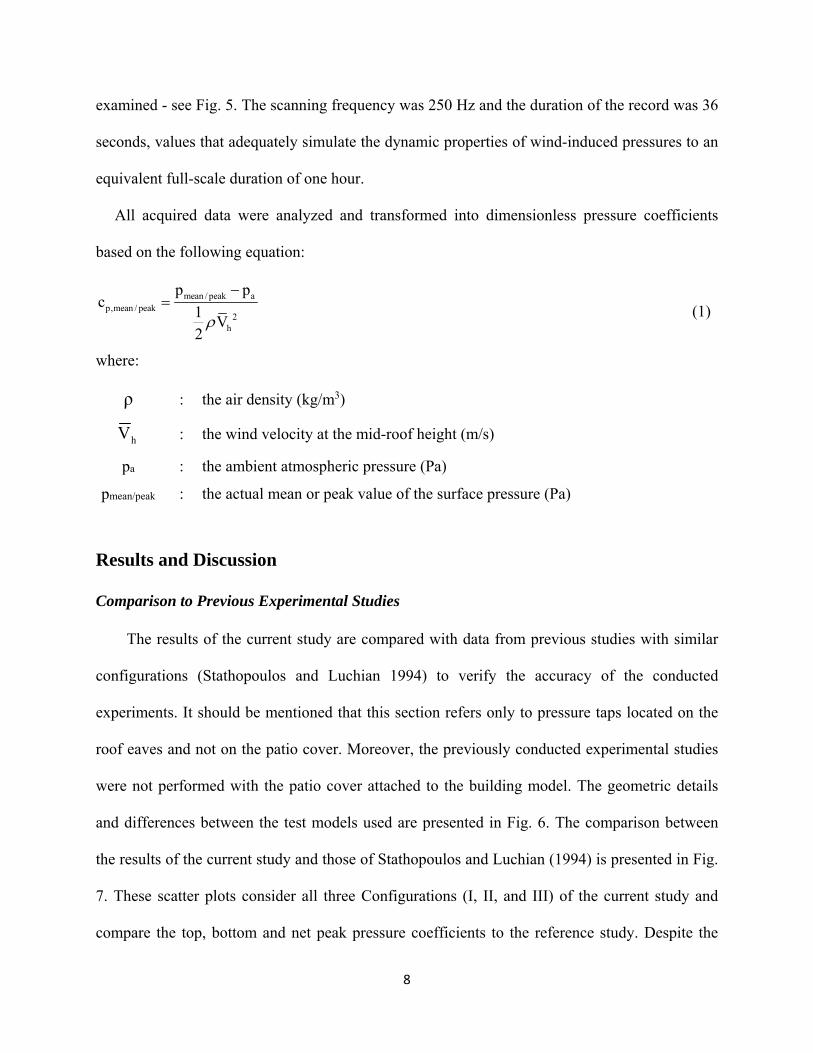
All acquired data were analyzed and transformed into dimensionless pressure coefficients
based on the following equation:
mean / peak ap,mean / peak
2h
p pc
1V
2
(1)
where:
ρ : the air density (kg/m3)
hV : the wind velocity at the mid-roof height (m/s)
pa : the ambient atmospheric pressure (Pa)
pmean/peak
: the actual mean or peak value of the surface pressure (Pa)
Results and Discussion
Comparison to Previous Experimental Studies
The results of the current study are compared with data from previous studies with similar
configurations (Stathopoulos and Luchian 1994) to verify the accuracy of the conducted
experiments. It should be mentioned that this section refers only to pressure taps located on the
roof eaves and not on the patio cover. Moreover, the previously conducted experimental studies
were not performed with the patio cover attached to the building model. The geometric details
and differences between the test models used are presented in Fig. 6. The comparison between
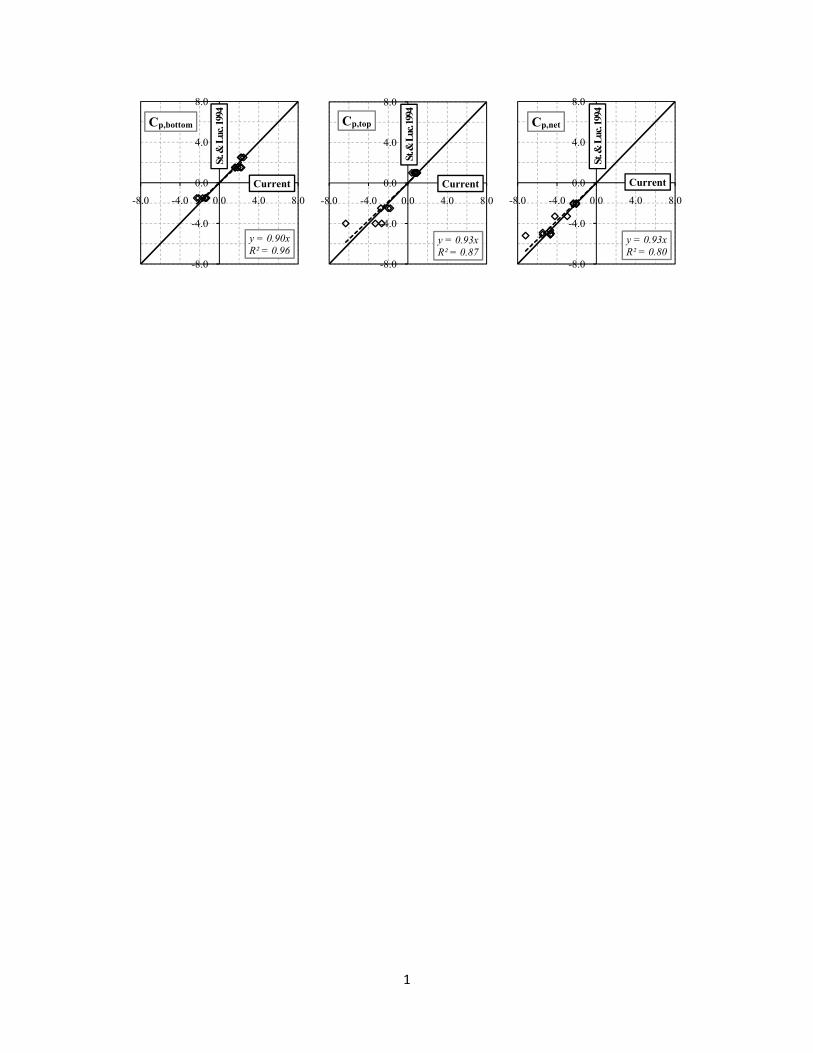
the results of the current study and those of Stathopoulos and Luchian (1994) is presented in Fig.
7. These scatter plots consider all three Configurations (I, II, and III) of the current study and
compare the top, bottom and net peak pressure coefficients to the reference study. Despite the
9
variations on the geometry (eave height and width) and the presence of the patio cover, the
agreement is satisfactory with the overall correlation coefficient exceeding 0.80 and slope
deviation smaller than 3o.
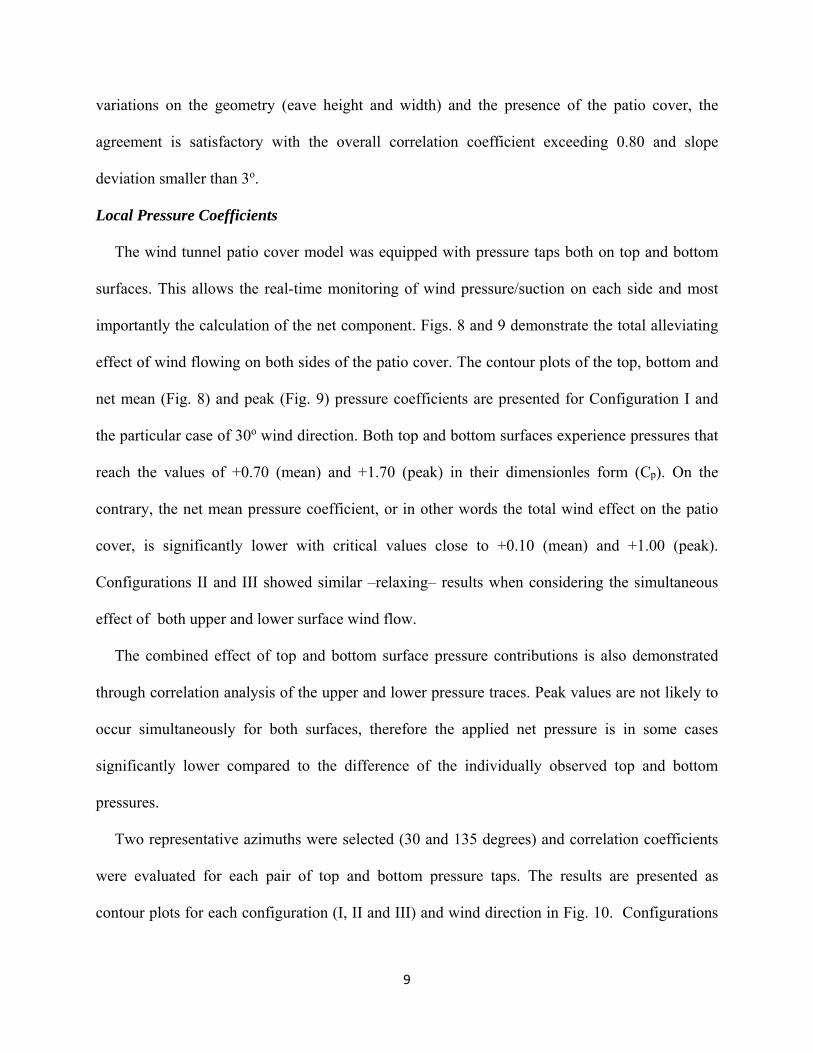
Local Pressure Coefficients
The wind tunnel patio cover model was equipped with pressure taps both on top and bottom
surfaces. This allows the real-time monitoring of wind pressure/suction on each side and most
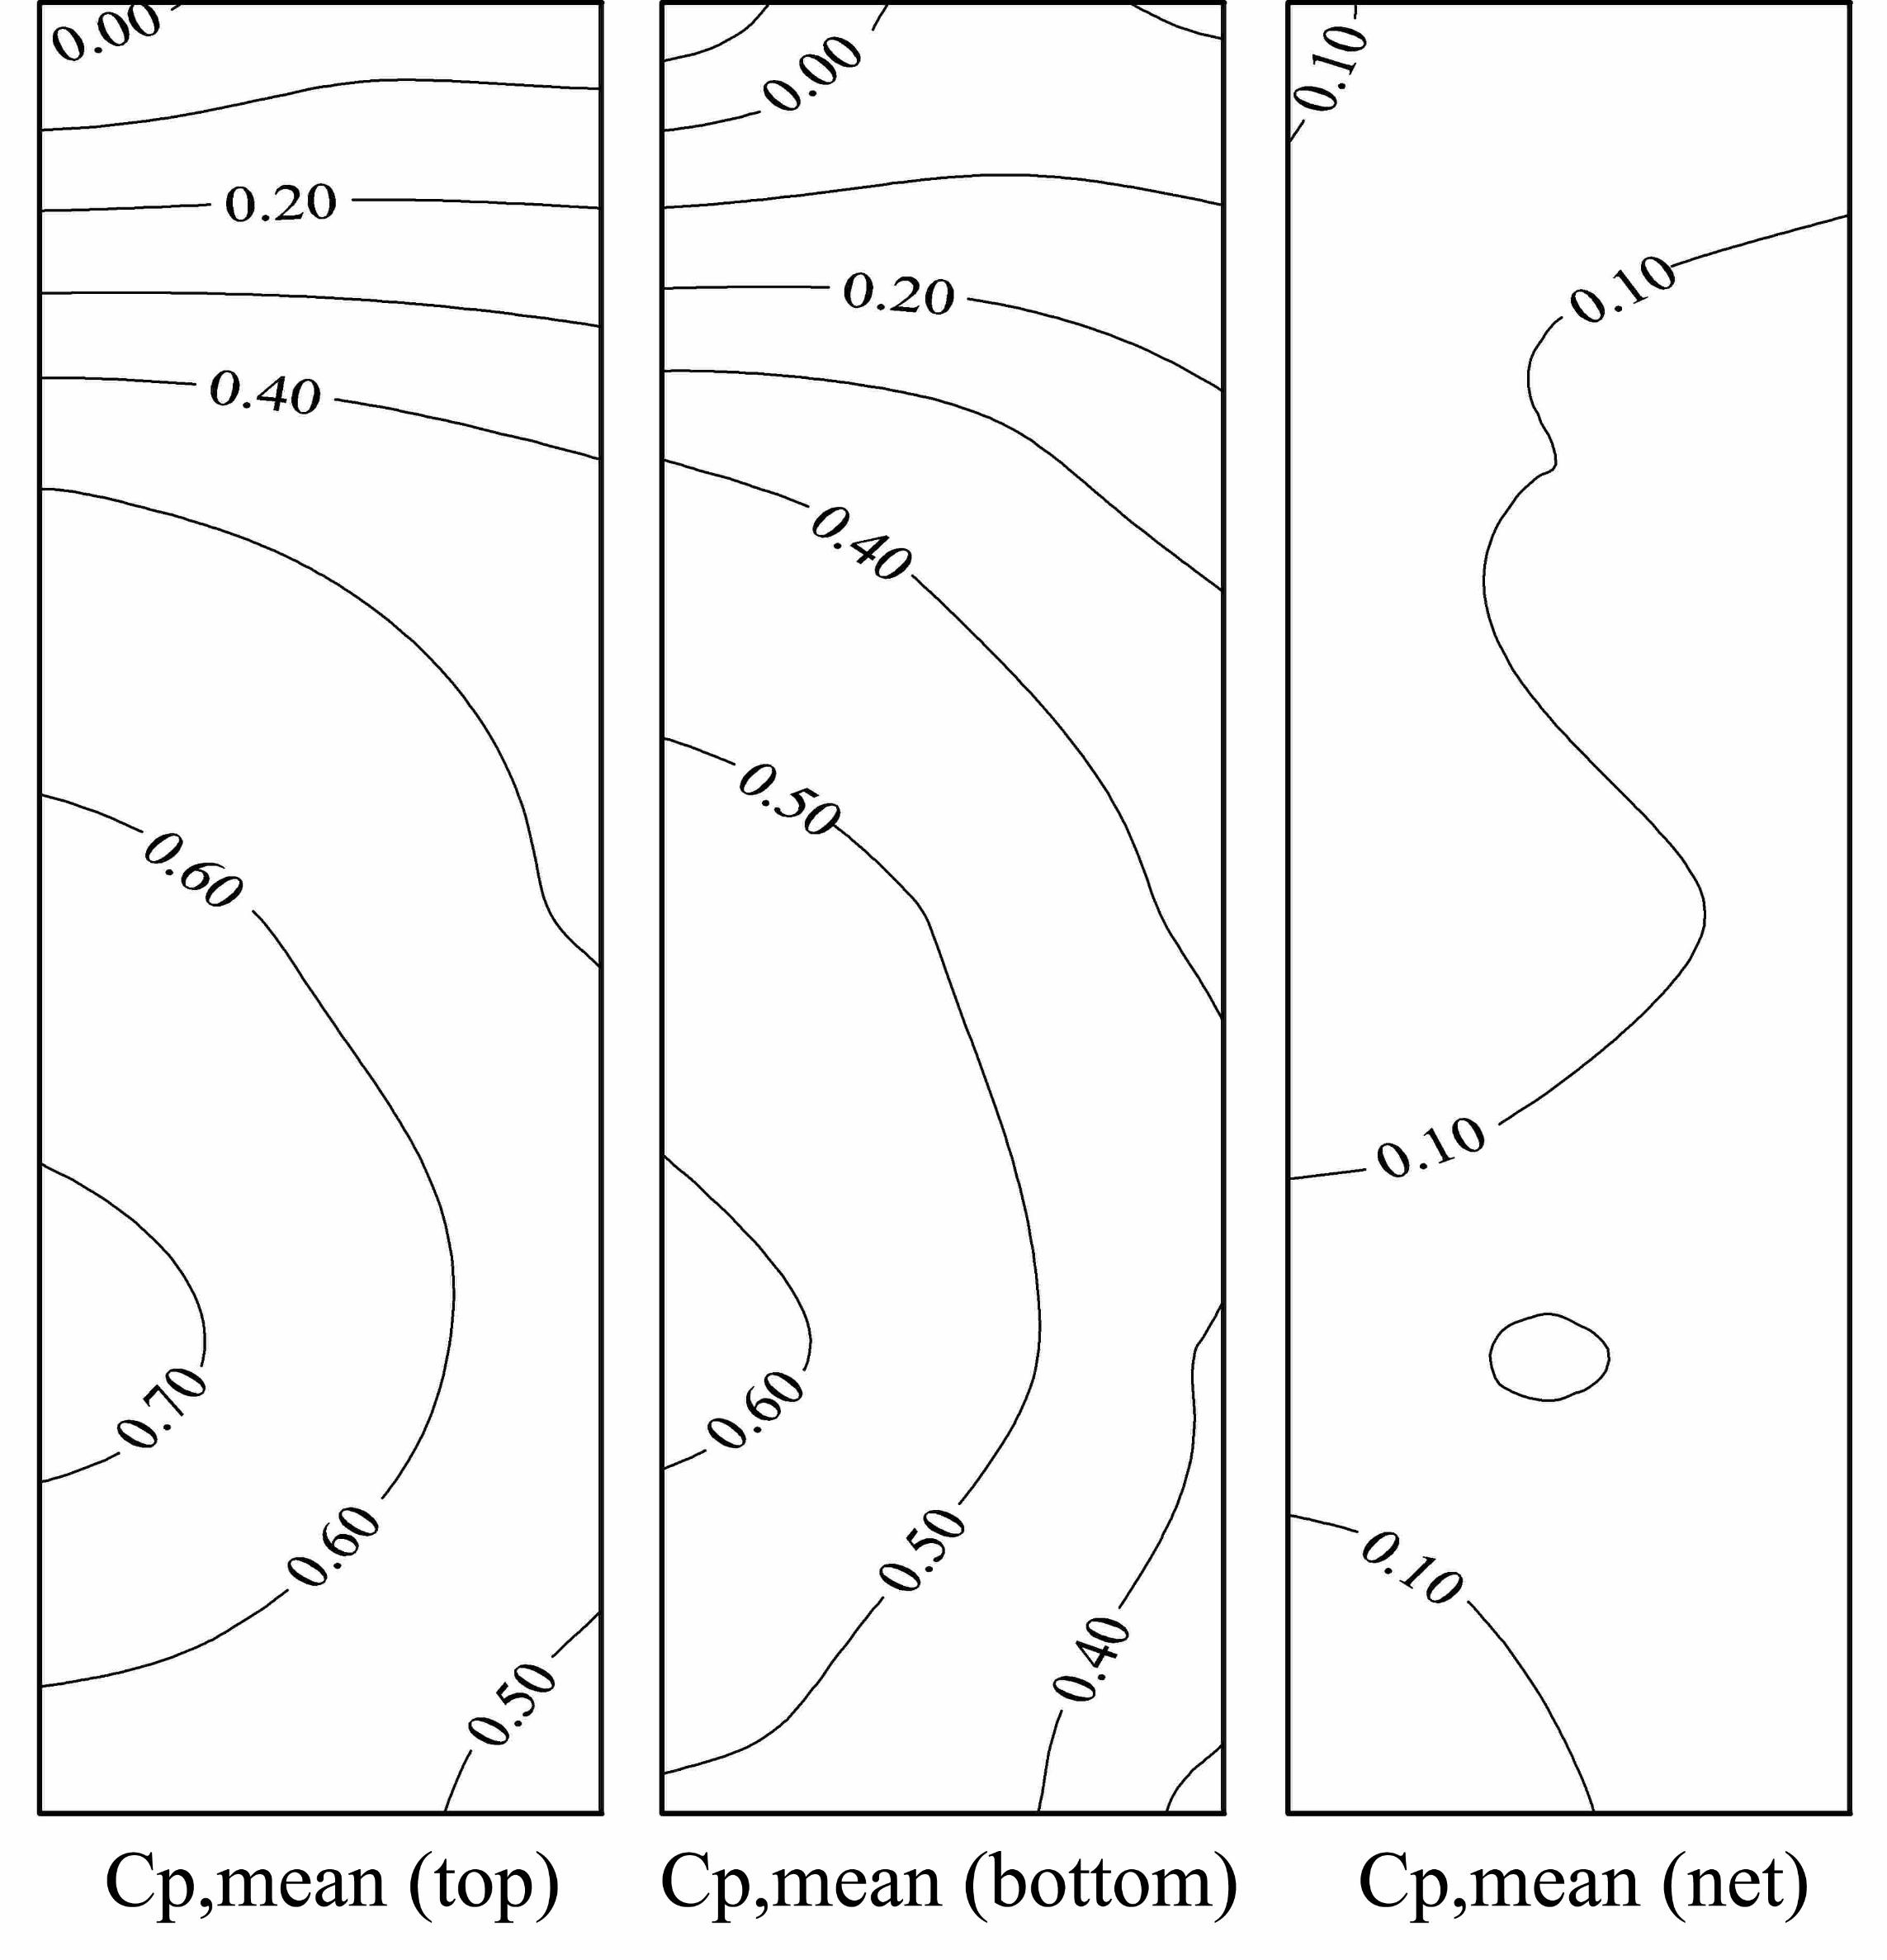
importantly the calculation of the net component. Figs. 8 and 9 demonstrate the total alleviating
effect of wind flowing on both sides of the patio cover. The contour plots of the top, bottom and
net mean (Fig. 8) and peak (Fig. 9) pressure coefficients are presented for Configuration I and
the particular case of 30o wind direction. Both top and bottom surfaces experience pressures that
reach the values of +0.70 (mean) and +1.70 (peak) in their dimensionles form (Cp). On the
contrary, the net mean pressure coefficient, or in other words the total wind effect on the patio
cover, is significantly lower with critical values close to +0.10 (mean) and +1.00 (peak).
Configurations II and III showed similar –relaxing– results when considering the simultaneous
effect of both upper and lower surface wind flow.
The combined effect of top and bottom surface pressure contributions is also demonstrated
through correlation analysis of the upper and lower pressure traces. Peak values are not likely to
occur simultaneously for both surfaces, therefore the applied net pressure is in some cases
significantly lower compared to the difference of the individually observed top and bottom
pressures.
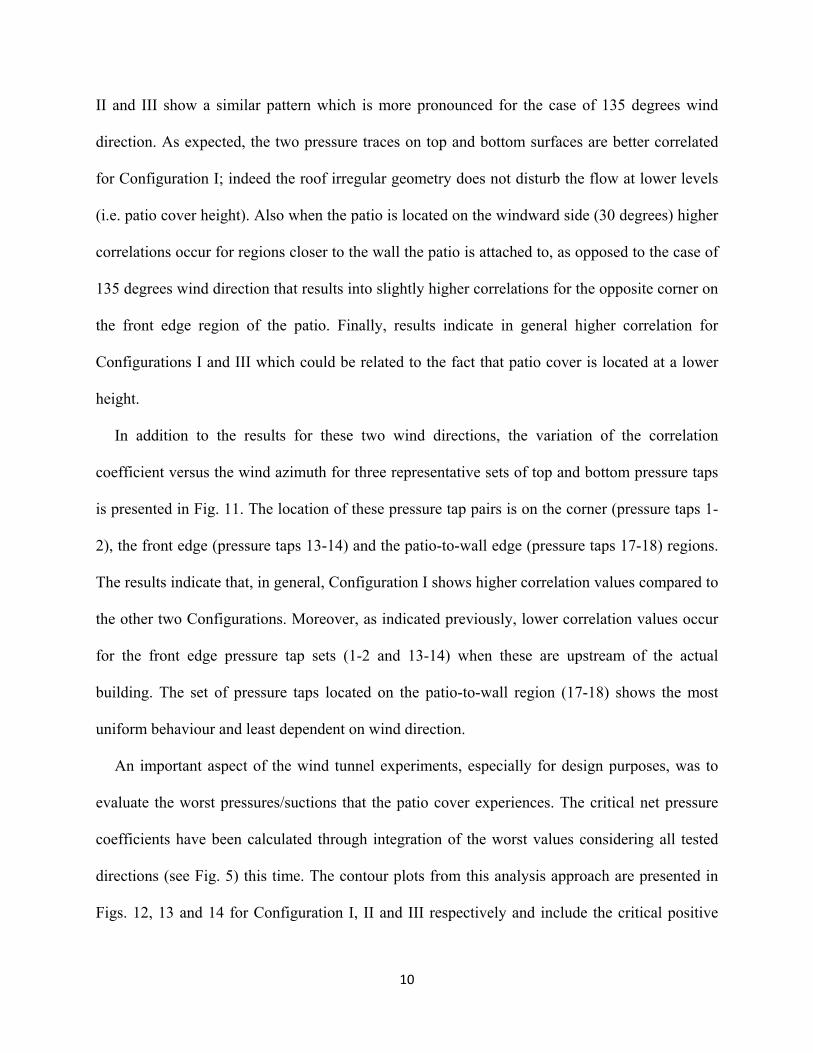
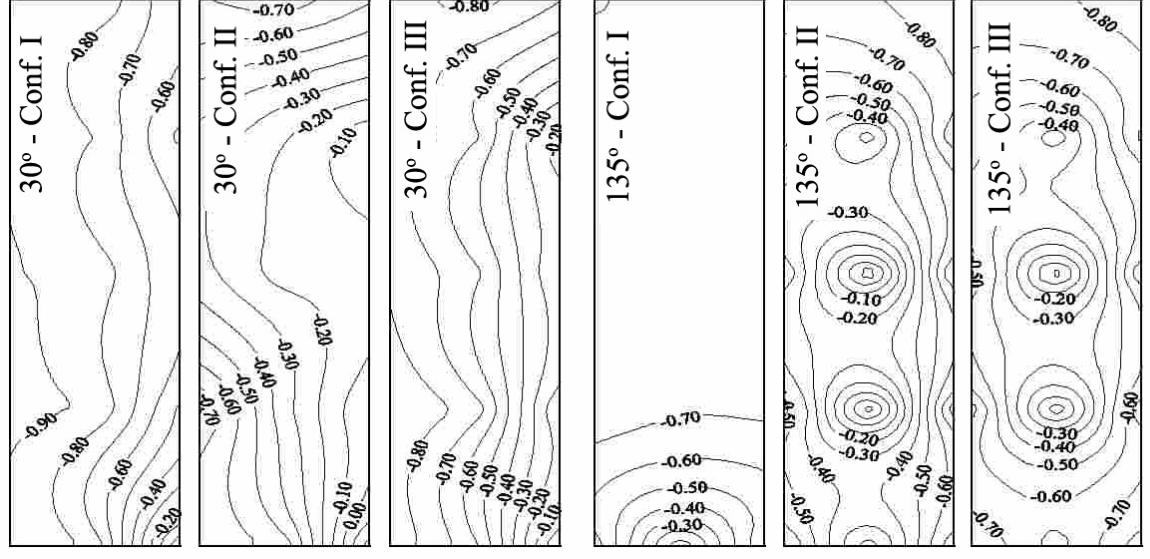
Two representative azimuths were selected (30 and 135 degrees) and correlation coefficients
were evaluated for each pair of top and bottom pressure taps. The results are presented as
contour plots for each configuration (I, II and III) and wind direction in Fig. 10. Configurations
10
II and III show a similar pattern which is more pronounced for the case of 135 degrees wind
direction. As expected, the two pressure traces on top and bottom surfaces are better correlated
for Configuration I; indeed the roof irregular geometry does not disturb the flow at lower levels
(i.e. patio cover height). Also when the patio is located on the windward side (30 degrees) higher
correlations occur for regions closer to the wall the patio is attached to, as opposed to the case of
135 degrees wind direction that results into slightly higher correlations for the opposite corner on
the front edge region of the patio. Finally, results indicate in general higher correlation for
Configurations I and III which could be related to the fact that patio cover is located at a lower
height.
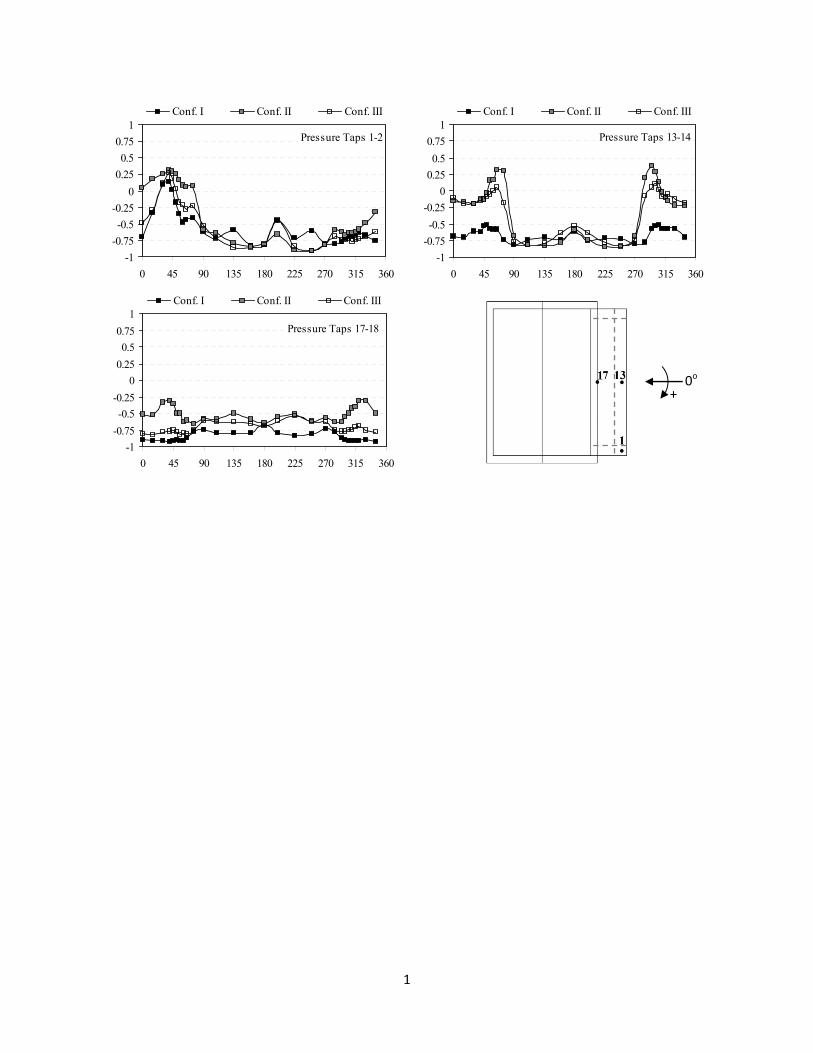
In addition to the results for these two wind directions, the variation of the correlation
coefficient versus the wind azimuth for three representative sets of top and bottom pressure taps
is presented in Fig. 11. The location of these pressure tap pairs is on the corner (pressure taps 1-
2), the front edge (pressure taps 13-14) and the patio-to-wall edge (pressure taps 17-18) regions.
The results indicate that, in general, Configuration I shows higher correlation values compared to
the other two Configurations. Moreover, as indicated previously, lower correlation values occur
for the front edge pressure tap sets (1-2 and 13-14) when these are upstream of the actual
building. The set of pressure taps located on the patio-to-wall region (17-18) shows the most
uniform behaviour and least dependent on wind direction.
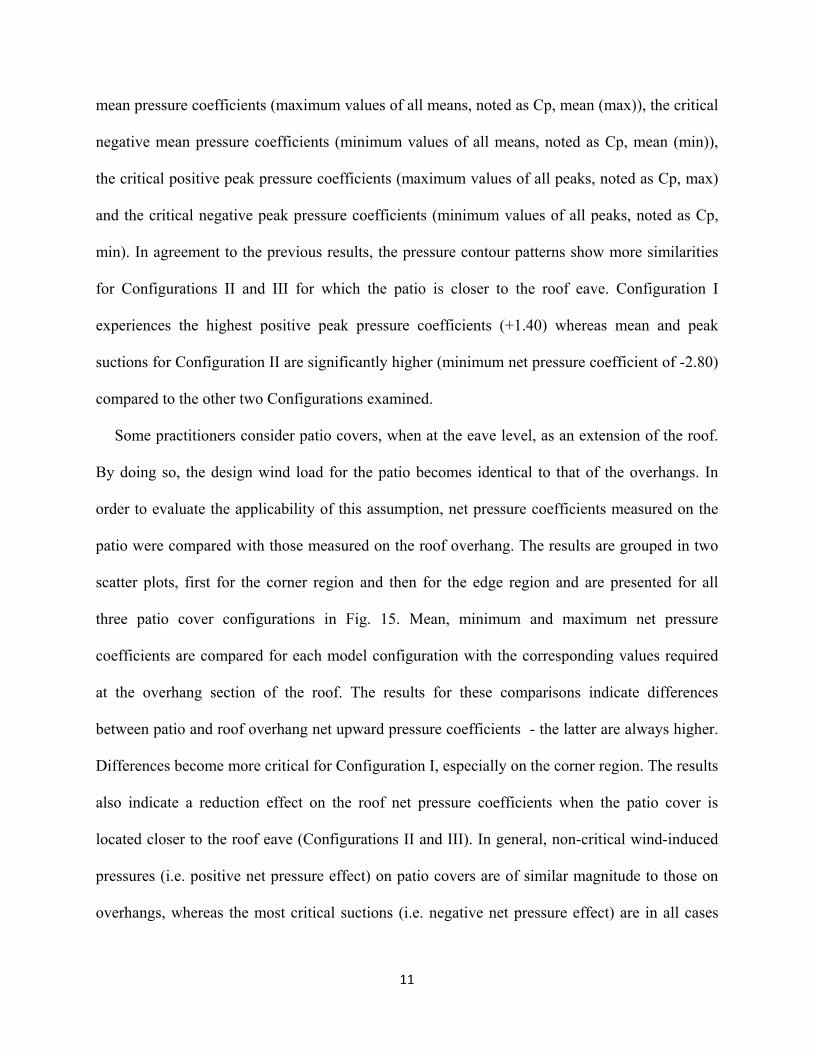
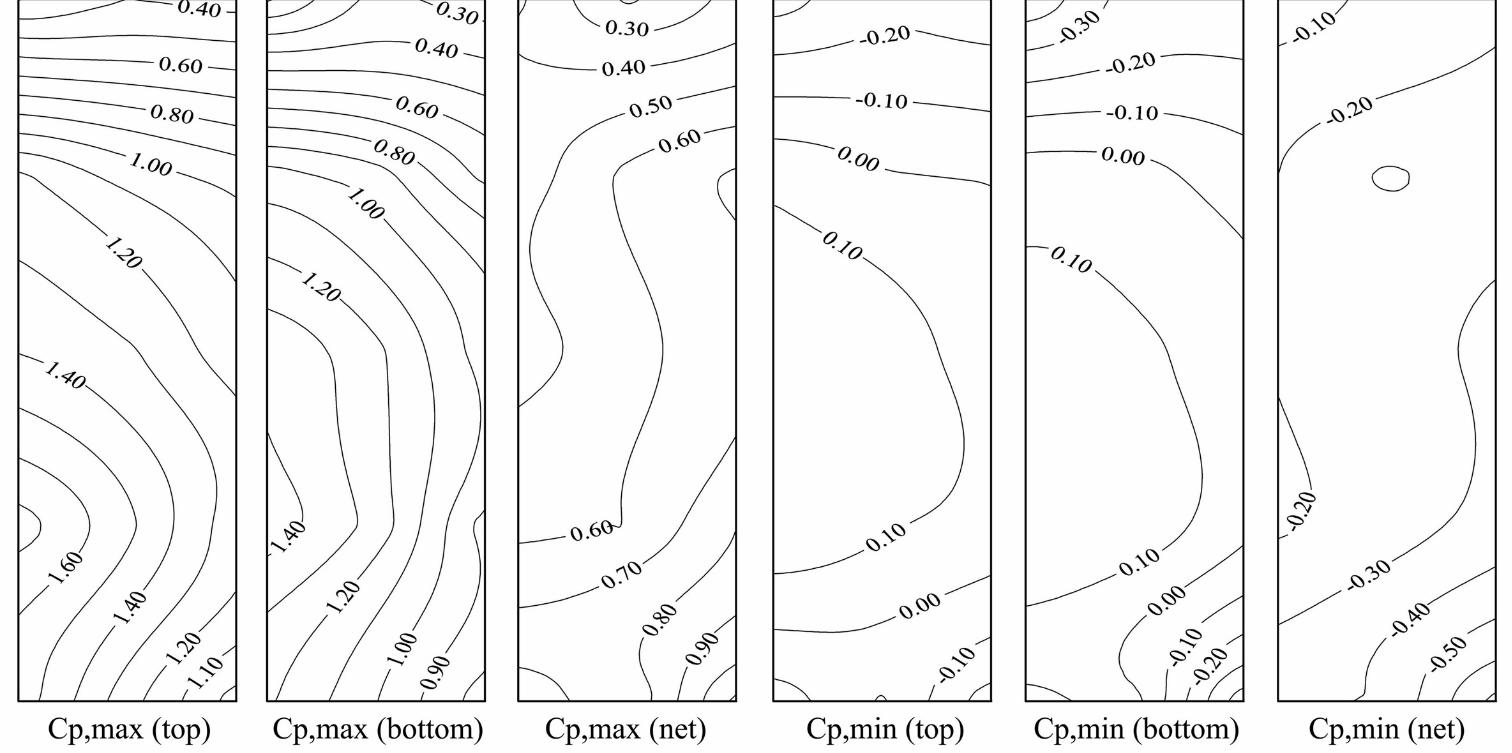
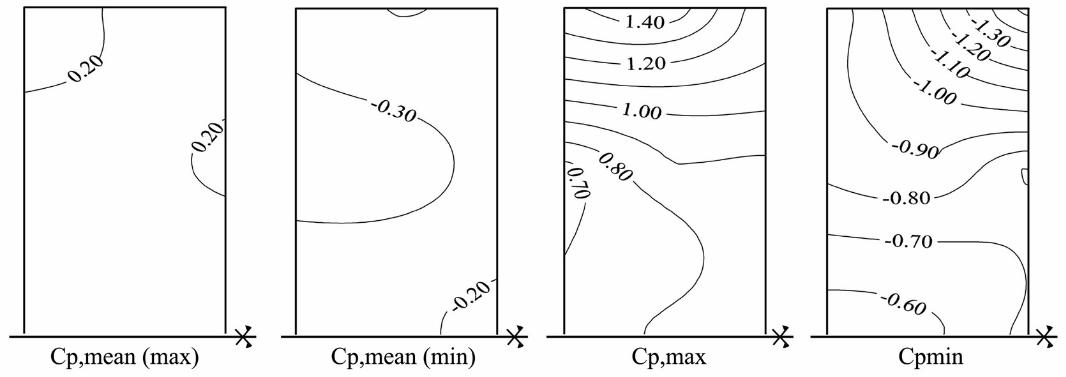
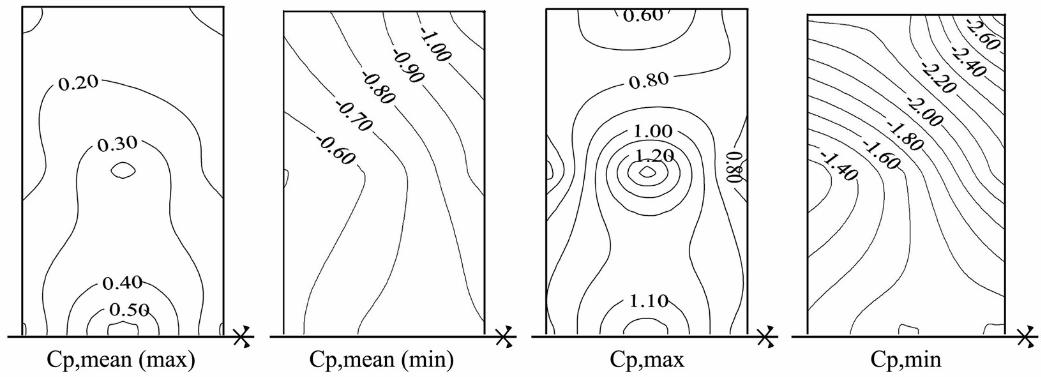
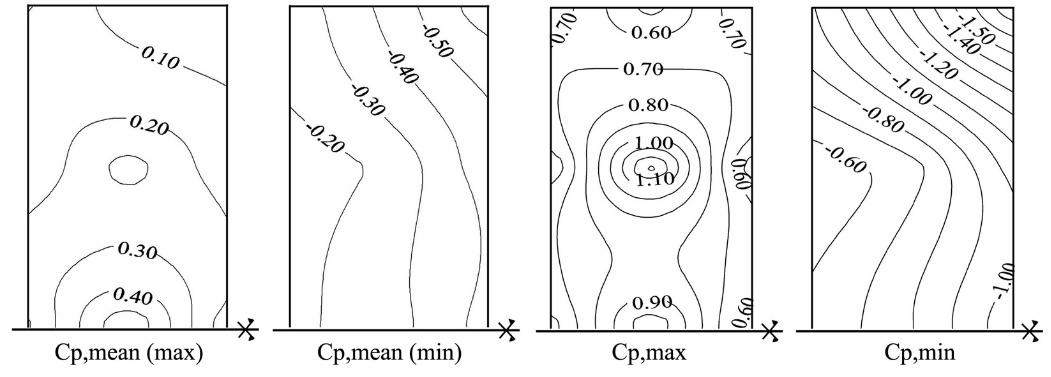
An important aspect of the wind tunnel experiments, especially for design purposes, was to
evaluate the worst pressures/suctions that the patio cover experiences. The critical net pressure
coefficients have been calculated through integration of the worst values considering all tested
directions (see Fig. 5) this time. The contour plots from this analysis approach are presented in
Figs. 12, 13 and 14 for Configuration I, II and III respectively and include the critical positive
11
mean pressure coefficients (maximum values of all means, noted as Cp, mean (max)), the critical
negative mean pressure coefficients (minimum values of all means, noted as Cp, mean (min)),
the critical positive peak pressure coefficients (maximum values of all peaks, noted as Cp, max)
and the critical negative peak pressure coefficients (minimum values of all peaks, noted as Cp,
min). In agreement to the previous results, the pressure contour patterns show more similarities
for Configurations II and III for which the patio is closer to the roof eave. Configuration I
experiences the highest positive peak pressure coefficients (+1.40) whereas mean and peak
suctions for Configuration II are significantly higher (minimum net pressure coefficient of -2.80)
compared to the other two Configurations examined.
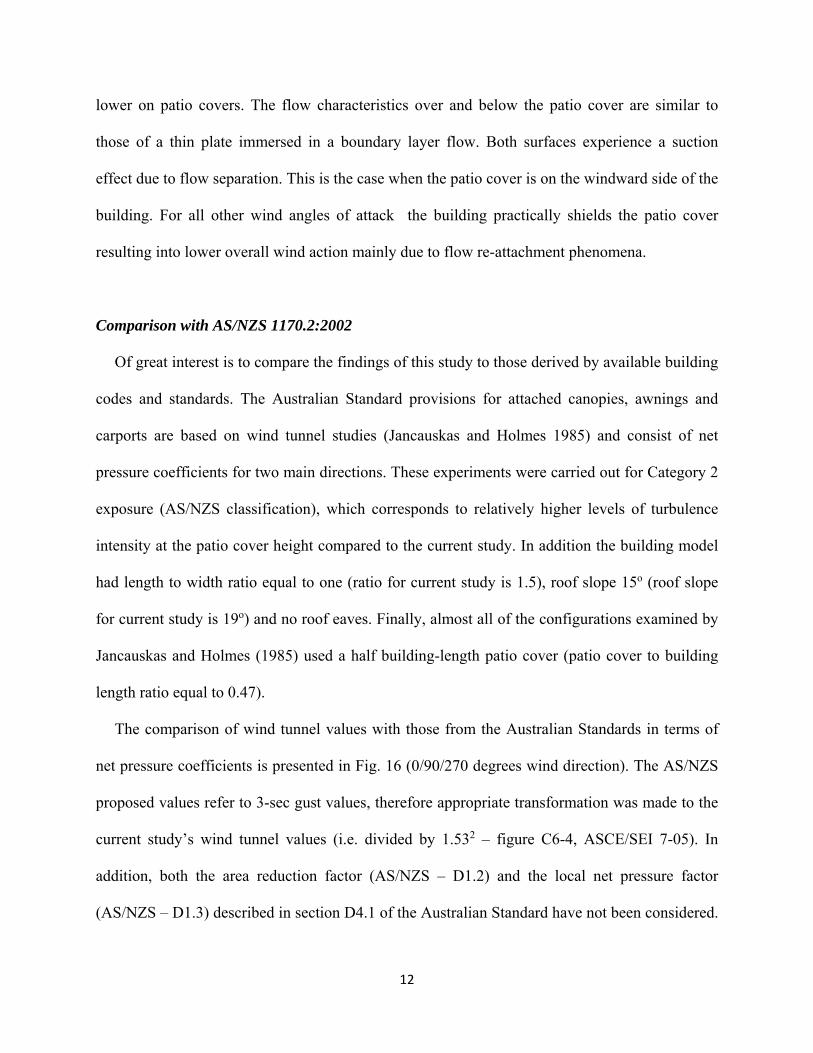
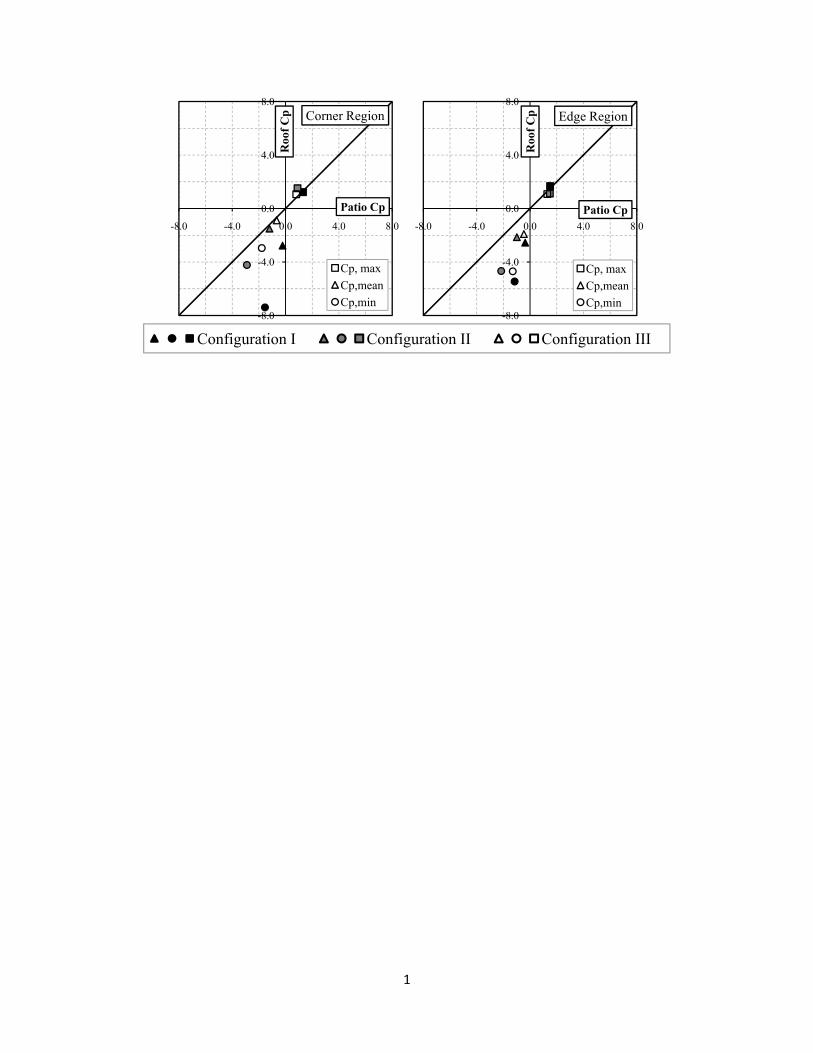
Some practitioners consider patio covers, when at the eave level, as an extension of the roof.
By doing so, the design wind load for the patio becomes identical to that of the overhangs. In
order to evaluate the applicability of this assumption, net pressure coefficients measured on the
patio were compared with those measured on the roof overhang. The results are grouped in two
scatter plots, first for the corner region and then for the edge region and are presented for all
three patio cover configurations in Fig. 15. Mean, minimum and maximum net pressure
coefficients are compared for each model configuration with the corresponding values required
at the overhang section of the roof. The results for these comparisons indicate differences
between patio and roof overhang net upward pressure coefficients - the latter are always higher.
Differences become more critical for Configuration I, especially on the corner region. The results
also indicate a reduction effect on the roof net pressure coefficients when the patio cover is
located closer to the roof eave (Configurations II and III). In general, non-critical wind-induced
pressures (i.e. positive net pressure effect) on patio covers are of similar magnitude to those on
overhangs, whereas the most critical suctions (i.e. negative net pressure effect) are in all cases
12
lower on patio covers. The flow characteristics over and below the patio cover are similar to
those of a thin plate immersed in a boundary layer flow. Both surfaces experience a suction
effect due to flow separation. This is the case when the patio cover is on the windward side of the
building. For all other wind angles of attack the building practically shields the patio cover
resulting into lower overall wind action mainly due to flow re-attachment phenomena.
Comparison with AS/NZS 1170.2:2002
Of great interest is to compare the findings of this study to those derived by available building
codes and standards. The Australian Standard provisions for attached canopies, awnings and
carports are based on wind tunnel studies (Jancauskas and Holmes 1985) and consist of net
pressure coefficients for two main directions. These experiments were carried out for Category 2
exposure (AS/NZS classification), which corresponds to relatively higher levels of turbulence
intensity at the patio cover height compared to the current study. In addition the building model
had length to width ratio equal to one (ratio for current study is 1.5), roof slope 15o (roof slope
for current study is 19o) and no roof eaves. Finally, almost all of the configurations examined by
Jancauskas and Holmes (1985) used a half building-length patio cover (patio cover to building
length ratio equal to 0.47).
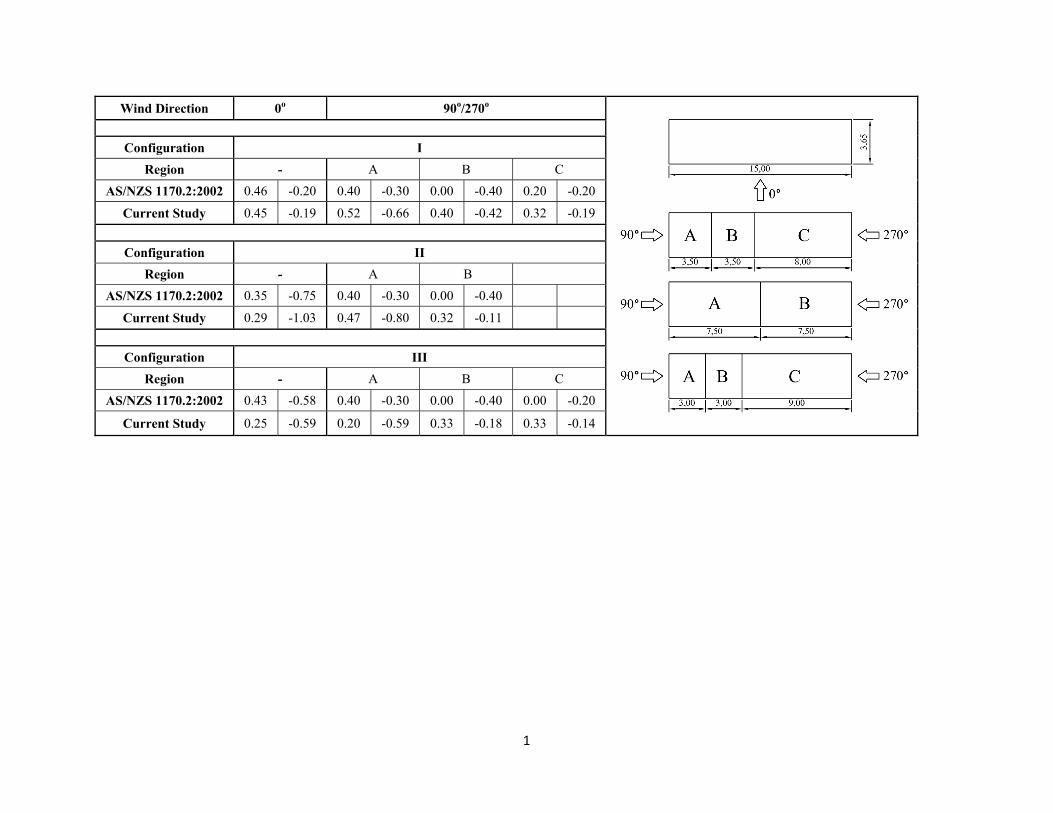
The comparison of wind tunnel values with those from the Australian Standards in terms of
net pressure coefficients is presented in Fig. 16 (0/90/270 degrees wind direction). The AS/NZS
proposed values refer to 3-sec gust values, therefore appropriate transformation was made to the
current study’s wind tunnel values (i.e. divided by 1.532 – figure C6-4, ASCE/SEI 7-05). In
addition, both the area reduction factor (AS/NZS – D1.2) and the local net pressure factor
(AS/NZS – D1.3) described in section D4.1 of the Australian Standard have not been considered.
13
The later may be applicable for areas smaller than 0.25a2, which for the current study and
specific patio cover geometry is equal to 0.13 m2, located on a corner zone 0.73 by 0.73 m. Even
if the intent of the AS/NZS 1170 were to include these factors, their overall effect would be
negligible.
The agreement between the results of the current study for the specific wind directions
mentioned in the Australian standard is in most cases quite good, with some discrepancies
observed mainly for Configuration III and wind direction parallel to the attached wall. However,
it should be mentioned that for these specific wind directions (90/270 degrees) the AS/NZS
considers the patio cover as a free-standing roof. It is also interesting that a net pressure
coefficient equal to 0.00 is designated in AS/NZS for some particular cases corresponding to a
limited number of azimuths. However, the wisdom of specifying a zero value in a standard is at
best questionable given that particular higher values would be dominant in the same areas for,
say, quarterly winds. Unfortunately, the lack of sufficient justification on the derivation of the
net pressure coefficients provided by the AS/NZS standard does not allow for further
comparisons and more detailed discussion.
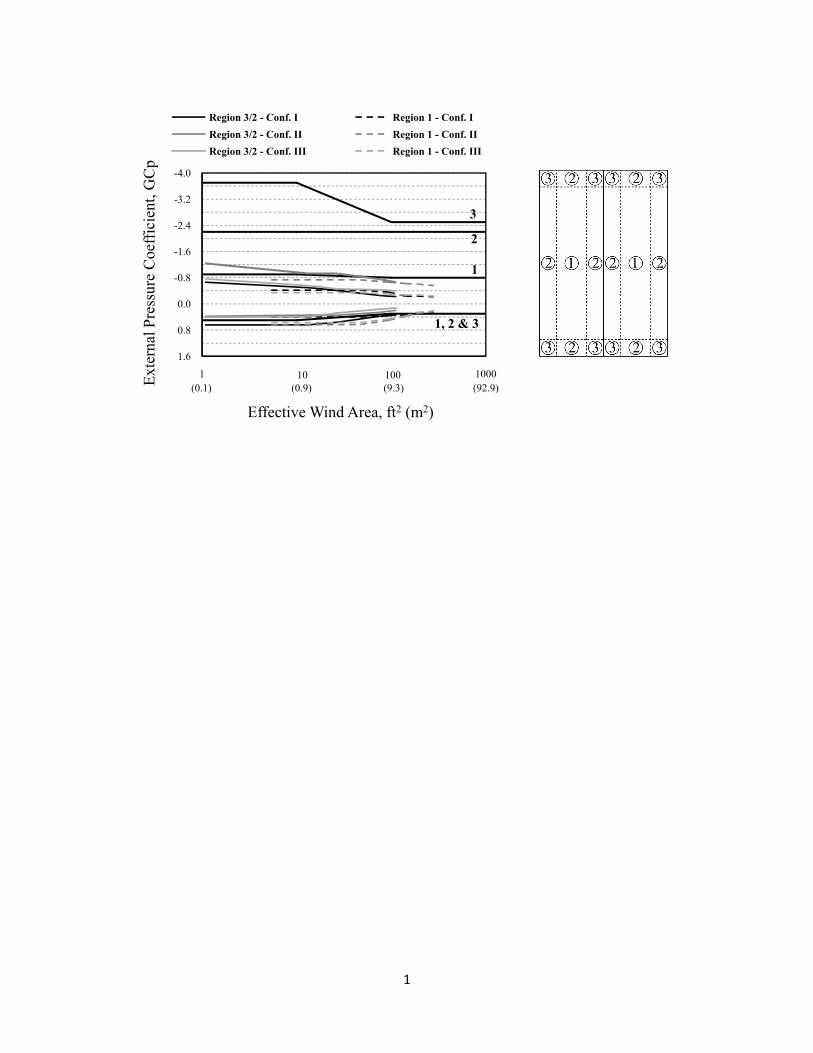
Comparison with ASCE 7-05
ASCE 7-05 provides design pressure coefficients for roof overhangs (Figures 6-11B, C and
D). Occasionally attached patio covers at the eave level are considered as roof extensions;
therefore, values from Figure 6-11C (Gable/Hip Roofs 7o < θ ≤ 27o) of ASCE 7-05 were
compared to those obtained from the current study. Using single or multiple sets of pressure taps
the variations of the maximum and minimum peak net pressure coefficient were derived with
respect to the corresponding effective surface area. The resulting polylines were superimposed as
14
shown in Fig. 17. Similarly to AS/NZS standard, the ASCE 7-05 proposed values consist of
pressure coefficients based on the 3-sec gust wind velocity pressure, therefore appropriate
transformation was made to the wind tunnel pressure coefficient results, as with the comparison
with the AS/NZS standard. The results clearly show that such ASCE 7 values overestimate net
wind suctions (uplift force) but conform to the net wind pressures. For the negative net pressure
coefficients (force upwards) all configurations tested show significantly lower values than those
in ASCE 7-05 for eaves.
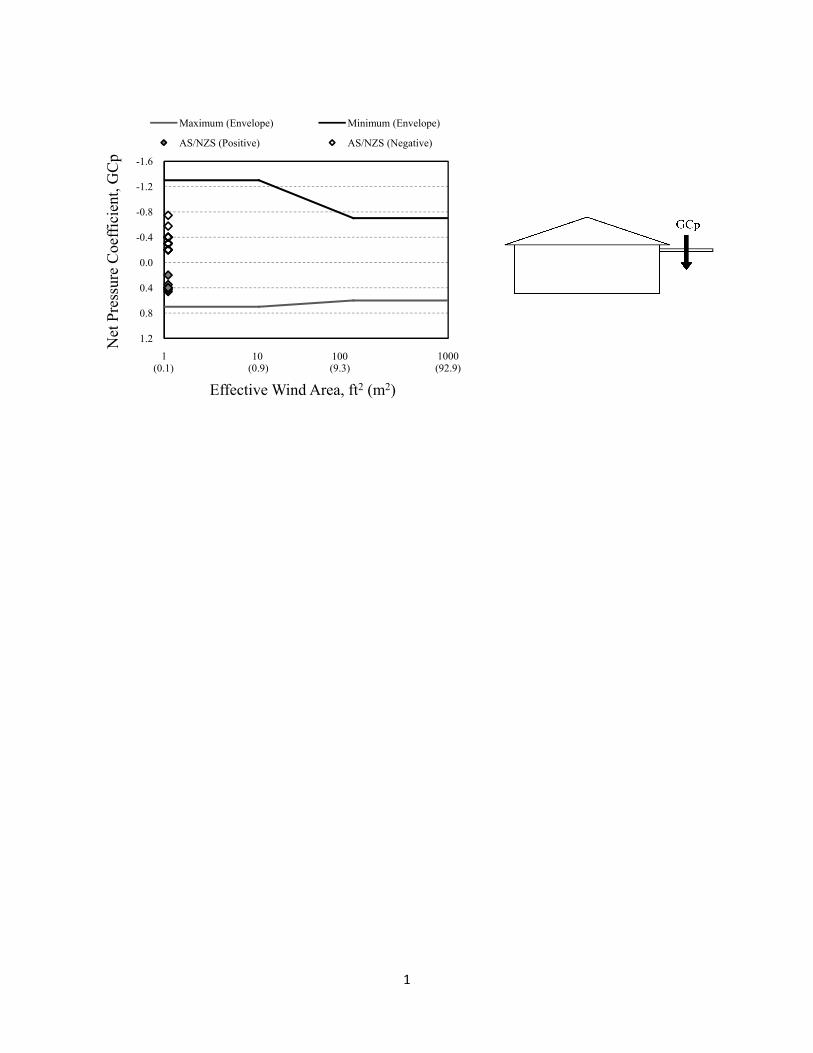
Recommendations
Figure 18 shows proposed design net pressure coefficients GCp for patio covers
recommended for possible inclusion in ASCE 7. Measured values have been enveloped to reflect
the most critical configuration and wind direction by following the same procedure as with the
rest of codified pressure coefficients for roof surfaces of low-rise buildings. In addition a
summary of all AS/NZS suggested values, presented in Fig. 16, have been included in the same
chart. These values have been considered as local pressures (smaller tributary area) and have
been grouped into positive and negative sets. The comparison indicates that all of the AS/NZS
values are located between the recommended by the current study envelope based design values.
The recommended design net pressure coefficients have been deliberately maintained at a
higher level to cover for the limited geometries and configurations examined in the wind tunnel
study. For simplicity purposes, no edge / corner zones have been determined on the patio cover.
Conclusion
15
Wind tunnel experimental findings were presented and compared with previous wind tunnel
studies and two wind standards for the case of an open patio cover attached to a dwelling unit.
Mean and peak local surface wind coefficients were measured for three patio configurations. In
addition to the pressure distribution, the correlation between pressures on the top and bottom
surfaces of the patio cover was evaluated in order to assess the combined effect of wind-induced
forces acting on both sides of such structure.
The patio cover local wind pressure coefficients were found to be lower than those measured
on the roof eaves. This justifies concerns related to the conservative design approach when patio
covers are treated as roof extensions and is also reflected on the overestimated pressure
coefficient values derived by the ASCE standard. In addition, local and overall wind pressure
coefficients compared to the AS/NZS standards show general similarities but also some
differences, as well.
The current study indicates the need to update the available wind standards and include
sufficient information for the adequate design of patio covers attached to low-rise buildings.
Enveloped wind net pressure coefficients for the design of patio covers are proposed for
consideration by the ASCE 7 Wind Load Task Committee.
References
AC340 (2007). “Acceptance Criteria for Patio Covers.” ICC Evaluation Service, INC,
Whittier, CA.
ASCE/SEI 7-05 (2005). “Minimum Design Loads for Building and Other Structures.”
American Society of Civil Engineers, Reston, VA.
16
AS/NZS 1170.2 (2002). “Australian/New Zealand Standards, Structural design actions – Part
2, Wind Actions.” Standards Australia International Ltd (Sydney) – Standards New
Zealand (Wellington).
BS 6399-2 (1997). “Loading for Buildings – Part 2: Code of Practice for Wind Loads.”
British Standard Institute.
Cook, N.J. (1985). The Designer’s Guide to Wind Loading of Building Structures. Part 2:
Static Pressures, Butterworth Scientific, London, U.K.
International Building Code (IBC). (2006). International Code Council, Fall Church, VA.
International Residential Code (IRC). (2006). International Code Council, Fall Church, VA.
Jancauskas, L. and Holmes, J., (1985). “Wind Loads on Attached Canopies”, Proc. of the
National Conference on Wind Engineering, Texas Tech University, Lubbock, TX.
National Building Code of Canada (NBCC). (2005). National Research Council of Canada,
Ottawa, ON.
prEN 1991-1-4 (2004). “Eurocode 1: Actions on Structures – General Actions – Part 1.4:
Wind Actions.” CEN.
Scanivalve Corporation. (2003). DSM 3000 - Digital service module, instruction and service
manual.
Scanivalve Corporation. (2003). ZOC 33/64Px - Electronic pressure scanning module,
instruction and service manual.
Stathopoulos, T. and Luchian, H.D. (1994). "Wind-Induced Forces on Eaves of Low
Buildings." J. Wind Eng. Ind. Aerodyn., Vol. 52, pp. 249-261.
17
Tieleman, H. W., Hajj, M.R, and Reinhold, T.A. (1998). “Wind tunnel simulation
requirements to asses wind loads on low-rise buildings.” J. Wind Eng. Ind. Aerodyn.,
74-76, pp.675-685.
Uematsu, Y., Iizumi, E. and Stathopoulos, T. (2007). “Wind Force Coefficients for
Designing Free-standing Canopy Roofs.” J. Wind Eng. Ind. Aerodyn., Vol. 95, 9-11, pp.
1486-1510.
Uematsu, Y., Stathopoulos, T. and Iizumi, E. (2008a). “Wind Loads on Free-standing
Canopy Roofs: Part 1 Local wind pressures.” J. Wind Eng. Ind. Aerodyn., Vol. 96, 6-7,
pp. 1015-1028.
Uematsu, Y., Stathopoulos, T. and Iizumi, E. (2008b). “Wind Loads on Free-standing
Canopy Roofs: Part 2 Overall Wind Forces.” J. Wind Eng. Ind. Aerodyn., Vol. 96, 6-7,
pp. 1029-1042.
1
Figure Caption List:
Fig. 1. Isometric, front and side views of the building models - Configuration I, II and III.
Fig. 2. Building and patio cover wind tunnel model (Configuration II is shown).
Fig. 3. Pressure tap location and notation on the roof and the patio cover model.
Fig. 4. Wind velocity and turbulence intensity profiles.
Fig. 5. Wind directions tested in the wind tunnel.
Fig. 6. Building model dimension ratios (Current and Stathopoulos and Luchian, 1994).
Fig. 7. Comparison of top, bottom and net eave pressure coefficient results with Stathopoulos and Luchian (1994).
Fig. 8. Top, bottom and net mean pressure coefficient contour plots for 30 degrees wind direction (Configuration I).
Fig. 9. Top, bottom and net peak pressure coefficient contour plots for 30 degrees wind direction (Configuration I).
Fig. 10. Correlation coefficient contour plots for top and bottom pressure signals (30 and 135 degrees wind direction).
Fig. 11. Correlation coefficient variation with the wind direction (pressure taps 1-2, 13-14 and 17-18).
Fig. 12. Critical mean and peak net pressure coefficients (Configuration I).
Fig. 13. Critical mean and peak net pressure coefficients (Configuration II).
Fig. 14. Critical mean and peak net pressure coefficients (Configuration III).
Fig. 15. Roof and patio cover critical net pressure coefficient comparison.
Fig. 16. Comparison of the AS/NZS suggested net pressure coefficients with the wind tunnel results, for 0 and 90/270 degrees wind directions.
Fig. 17. Variation of the peak net pressure coefficient with the area – Configuration I, II and III.
Fig. 18. Proposed net pressure coefficients for design of patio covers.
0.00
0.10
0.20
0.30
0.40
0.50
0.60
0.70
0.80
0.90
1.00
0.0 0.2 0.4 0.6 0.8 1.0
Z/Zg
Vz/Vg (Vrms/Vz)
Wind Velocity Profile (Wind Tunnel)Wind Velocity Profile (Power Law, a=0.14)Turbulence Intensity
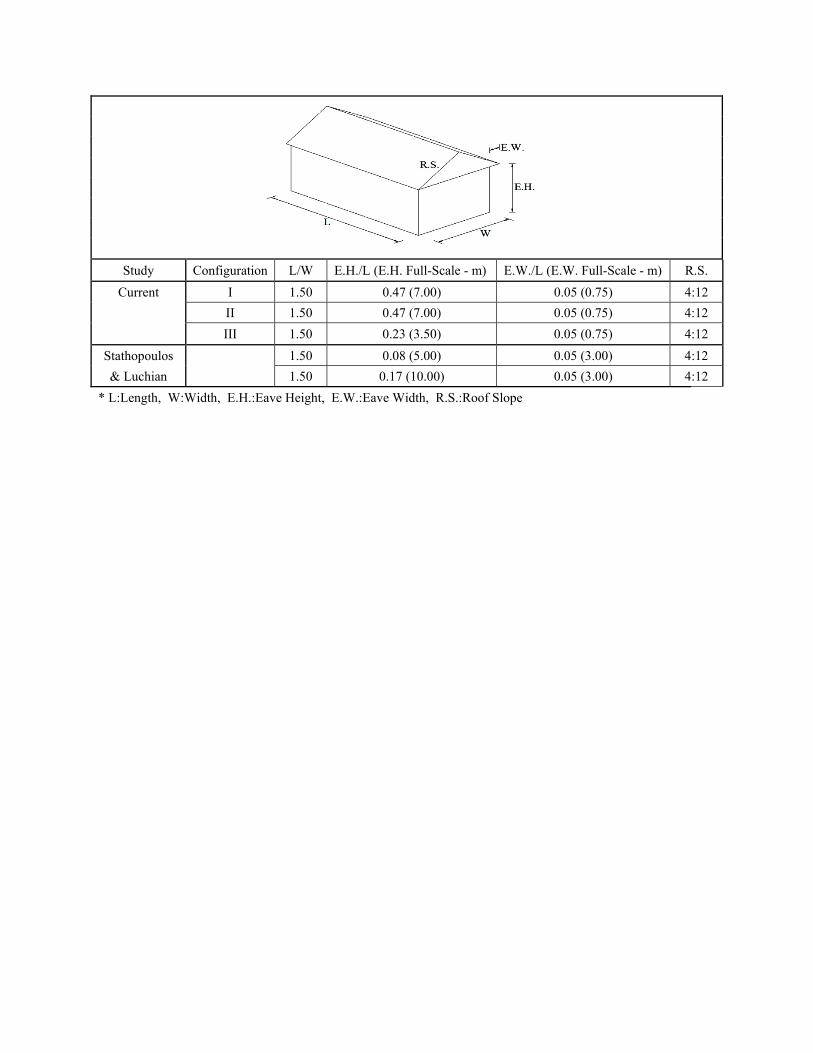
Study Configuration L/W E.H./L (E.H. Full-Scale - m) E.W./L (E.W. Full-Scale - m) R.S. Current I 1.50 0.47 (7.00) 0.05 (0.75) 4:12
II 1.50 0.47 (7.00) 0.05 (0.75) 4:12 III 1.50 0.23 (3.50) 0.05 (0.75) 4:12
Stathopoulos 1.50 0.08 (5.00) 0.05 (3.00) 4:12 & Luchian 1.50 0.17 (10.00) 0.05 (3.00) 4:12
* L:Length, W:Width, E.H.:Eave Height, E.W.:Eave Width, R.S.:Roof Slope
1
y = 0.90xR² = 0.96
-8.0
-4.0
0.0
4.0
8.0
-8.0 -4.0 0.0 4.0 8.0
St. &
Luc
. 199
4
Current
Cp,bottom
y = 0.93xR² = 0.87
-8.0
-4.0
0.0
4.0
8.0
-8.0 -4.0 0.0 4.0 8.0
St. &
Luc
. 199
4
Current
Cp,top
y = 0.93xR² = 0.80
-8.0
-4.0
0.0
4.0
8.0
-8.0 -4.0 0.0 4.0 8.0
St. &
Luc
. 199
4
Current
Cp,net
1
Pressure Taps 1-2
-1-0.75-0.5
-0.250
0.250.5
0.751
0 45 90 135 180 225 270 315 360
Conf. I Conf. II Conf. III
Pressure Taps 13-14
-1-0.75-0.5
-0.250
0.250.5
0.751
0 45 90 135 180 225 270 315 360
Conf. I Conf. II Conf. III
Pressure Taps 17-18
-1-0.75-0.5
-0.250
0.250.5
0.751
0 45 90 135 180 225 270 315 360
Conf. I Conf. II Conf. III
0o
+
1
-8.0
-4.0
0.0
4.0
8.0
-8.0 -4.0 0.0 4.0 8.0
Roo
f Cp
Patio Cp
Corner Region
Cp, maxCp,meanCp,min
-8.0
-4.0
0.0
4.0
8.0
-8.0 -4.0 0.0 4.0 8.0
Roo
f Cp
Patio Cp
Edge Region
Cp, maxCp,meanCp,min
Configuration I Configuration II Configuration III
1
Wind Direction 0o 90o/270o
Configuration I
Region - A B C AS/NZS 1170.2:2002 0.46 -0.20 0.40 -0.30 0.00 -0.40 0.20 -0.20
Current Study 0.45 -0.19 0.52 -0.66 0.40 -0.42 0.32 -0.19
Configuration II Region - A B
AS/NZS 1170.2:2002 0.35 -0.75 0.40 -0.30 0.00 -0.40
Current Study 0.29 -1.03 0.47 -0.80 0.32 -0.11
Configuration III Region - A B C
AS/NZS 1170.2:2002 0.43 -0.58 0.40 -0.30 0.00 -0.40 0.00 -0.20
Current Study 0.25 -0.59 0.20 -0.59 0.33 -0.18 0.33 -0.14
1
-4.0
-3.2
-2.4
-1.6
-0.8
0.0
0.8
1.6
1 1000Exte
rnal
Pre
ssur
e C
oeffi
cien
t, G
Cp
Effective Wind Area, ft2 (m2)
Region 3/2 - Conf. I Region 1 - Conf. IRegion 3/2 - Conf. II Region 1 - Conf. IIRegion 3/2 - Conf. III Region 1 - Conf. III
10 100(0.1) (0.9) (9.3) (92.9)
3
1
2
1, 2 & 3
1
-1.6
-1.2
-0.8
-0.4
0.0
0.4
0.8
1.2
1 1000
Net
Pre
ssur
e C
oeffi
cien
t, G
Cp
Effective Wind Area, ft2 (m2)
Maximum (Envelope) Minimum (Envelope)
AS/NZS (Positive) AS/NZS (Negative)
10 100(0.1) (0.9) (9.3) (92.9)