Embed Size (px)
Citation preview
ww.sciencedirect.com
b i o s y s t em s e n g i n e e r i n g x x x ( 2 0 1 4 ) 1e8
Available online at w
ScienceDirect
journal homepage: www.elsevier .com/ locate/ issn/15375110
Special Issue: Irrigated Agriculture
Research Paper
Wind pumps for irrigating greenhouse crops:Comparison in different socio-economicalframeworks
Rodrigo Dıaz-M�endez a, Adnan Rasheed b, Manuel Peill�on c,Alicia Perdigones a,*, Raul S�anchez a,d, Ana M. Tarquis e,f,Jos�e L. Garcıa-Fern�andez a
a Technical University of Madrid (UPM), Departamento de Ingenierıa Rural, Spainb University of Agriculture, Faisalabad, Pakistanc University of Santiago de Cuba, Faculty of Constructions, Cubad Grupo de Investigaci�on Hidr�aulica del Riego (HIDER-UPM), Spaine Technical University of Madrid (UPM), Departamento de Matem�atica Aplicada a la Ingenierıa Agron�omica, Spainf Centro de Estudios e Investigaci�on para la Gesti�on de Riesgos Agrarios y Medioambientales (CEIGRAM-UPM), Spain
Keywords:
Water pumping
Wind pumps
Photovoltaic installations
Levelised cost of energy
* Corresponding author.E-mail address: [email protected]
Please cite this article in press as: Dıaz-Msocio-economical frameworks, Biosystem
http://dx.doi.org/10.1016/j.biosystemseng.201537-5110/© 2014 IAgrE. Published by Elsevie
A simple methodology was used to compare the economic feasibility of wind pump tech-
nology, solar photovoltaic pumping, diesel generators, and connection to the electrical grid to
provide energy for pumping irrigation water in commercial greenhouses in Spain, Cuba and
Pakistan (countries with different developmental backgrounds). The analysis took into ac-
count wind resources, distance to the grid, water storage tank volume requirements, and
planting dates. Comparisons were made in terms of the levelised cost of energy associated
with each system. For all three countries, if a grid connection was already in place, installing
wind pumpswould be economically unwise.Where no grid connection exists, the distance to
the grid and the wind resource available are key factors to be taken into consideration when
deciding between options: a 10% increase in the average wind speed is equivalent to a 20%
reduction in the distance to the grid in terms of costs return. Finally, thewater elevation has a
major influence on the economic feasibility of wind pump technology, much more than, for
example, on solar photovoltaic pumping technology. The results reveal that, generally, the
critical factors to consider when making energy management decisions differ depending
between countries. In Spain, theproximity of theelectrical gridmakes the connection to it the
best option. In Pakistan, scarce wind resources are a serious limiting factor. Cuba, however,
has good wind resources; water elevation, distance to the grid and water storage needed are
the critical factors when determining the economic feasibility of wind pumping there.
© 2014 IAgrE. Published by Elsevier Ltd. All rights reserved.
s (A. Perdigones).
�endez, R., et al., Wind pus Engineering (2014), http
14.08.013r Ltd. All rights reserved
mps for irrigating greenhouse crops: Comparison in different://dx.doi.org/10.1016/j.biosystemseng.2014.08.013
.
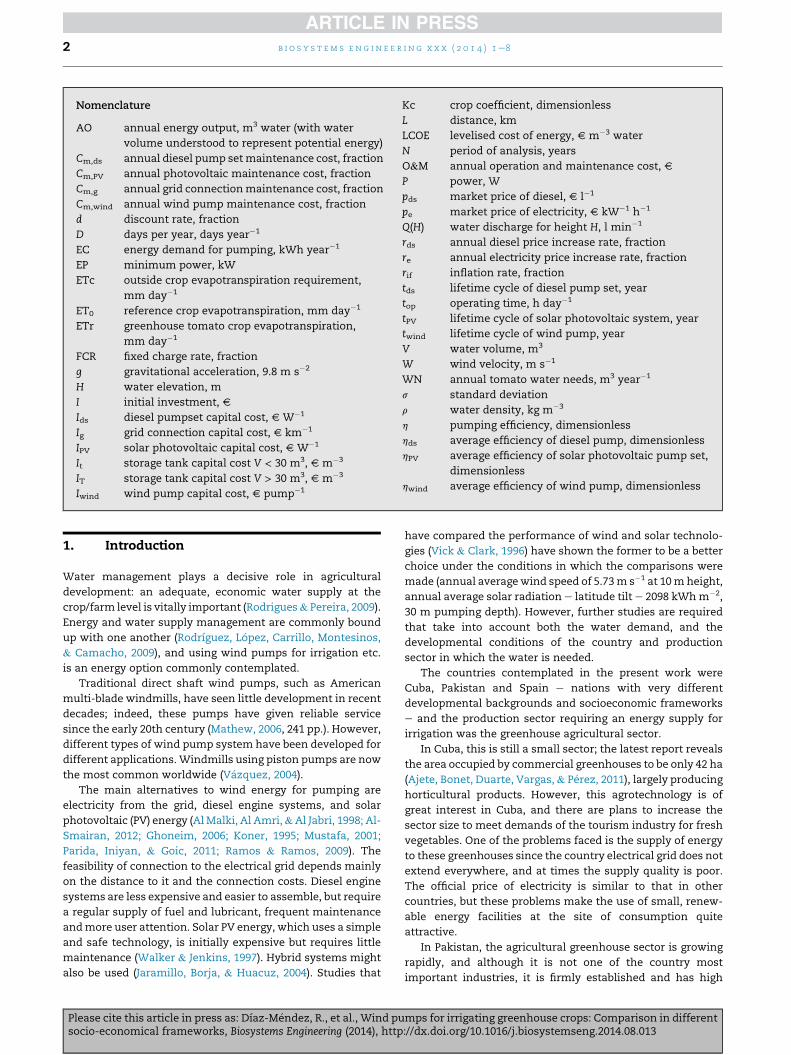
Nomenclature
AO annual energy output, m3 water (with water
volume understood to represent potential energy)
Cm,ds annual diesel pump setmaintenance cost, fraction
Cm,PV annual photovoltaic maintenance cost, fraction
Cm,g annual grid connectionmaintenance cost, fraction
Cm,wind annual wind pump maintenance cost, fraction
d discount rate, fraction
D days per year, days year�1
EC energy demand for pumping, kWh year�1
EP minimum power, kW
ETc outside crop evapotranspiration requirement,
mm day�1
ET0 reference crop evapotranspiration, mm day�1
ETr greenhouse tomato crop evapotranspiration,
mm day�1
FCR fixed charge rate, fraction
g gravitational acceleration, 9.8 m s�2
H water elevation, m
I initial investment, V
Ids diesel pumpset capital cost, V W�1
Ig grid connection capital cost, V km�1
IPV solar photovoltaic capital cost, V W�1
It storage tank capital cost V < 30 m3, V m�3
IT storage tank capital cost V > 30 m3, V m�3
Iwind wind pump capital cost, V pump�1
Kc crop coefficient, dimensionless
L distance, km
LCOE levelised cost of energy, V m�3 water
N period of analysis, years
O&M annual operation and maintenance cost, V
P power, W
pds market price of diesel, V l�1
pe market price of electricity, V kW�1 h�1
Q(H) water discharge for height H, l min�1
rds annual diesel price increase rate, fraction
re annual electricity price increase rate, fraction
rif inflation rate, fraction
tds lifetime cycle of diesel pump set, year
top operating time, h day�1
tPV lifetime cycle of solar photovoltaic system, year
twind lifetime cycle of wind pump, year
V water volume, m3
W wind velocity, m s�1
WN annual tomato water needs, m3 year�1
s standard deviation
r water density, kg m�3
h pumping efficiency, dimensionless
hds average efficiency of diesel pump, dimensionless
hPV average efficiency of solar photovoltaic pump set,
dimensionless
hwind average efficiency of wind pump, dimensionless
b i o s y s t em s e ng i n e e r i n g x x x ( 2 0 1 4 ) 1e82
1. Introduction
Water management plays a decisive role in agricultural
development: an adequate, economic water supply at the
crop/farm level is vitally important (Rodrigues& Pereira, 2009).
Energy and water supply management are commonly bound
up with one another (Rodrıguez, L�opez, Carrillo, Montesinos,
& Camacho, 2009), and using wind pumps for irrigation etc.
is an energy option commonly contemplated.
Traditional direct shaft wind pumps, such as American
multi-blade windmills, have seen little development in recent
decades; indeed, these pumps have given reliable service
since the early 20th century (Mathew, 2006, 241 pp.). However,
different types of wind pump system have been developed for
different applications. Windmills using piston pumps are now
the most common worldwide (V�azquez, 2004).
The main alternatives to wind energy for pumping are
electricity from the grid, diesel engine systems, and solar
photovoltaic (PV) energy (AlMalki, Al Amri,&Al Jabri, 1998; Al-
Smairan, 2012; Ghoneim, 2006; Koner, 1995; Mustafa, 2001;
Parida, Iniyan, & Goic, 2011; Ramos & Ramos, 2009). The
feasibility of connection to the electrical grid depends mainly
on the distance to it and the connection costs. Diesel engine
systems are less expensive and easier to assemble, but require
a regular supply of fuel and lubricant, frequent maintenance
andmore user attention. Solar PV energy, which uses a simple
and safe technology, is initially expensive but requires little
maintenance (Walker & Jenkins, 1997). Hybrid systems might
also be used (Jaramillo, Borja, & Huacuz, 2004). Studies that
Please cite this article in press as: Dıaz-M�endez, R., et al., Winsocio-economical frameworks, Biosystems Engineering (2014),
d puhttp
have compared the performance of wind and solar technolo-
gies (Vick & Clark, 1996) have shown the former to be a better
choice under the conditions in which the comparisons were
made (annual averagewind speed of 5.73m s�1 at 10mheight,
annual average solar radiation e latitude tilt e 2098 kWhm�2,
30 m pumping depth). However, further studies are required
that take into account both the water demand, and the
developmental conditions of the country and production
sector in which the water is needed.
The countries contemplated in the present work were
Cuba, Pakistan and Spain e nations with very different
developmental backgrounds and socioeconomic frameworks
e and the production sector requiring an energy supply for
irrigation was the greenhouse agricultural sector.
In Cuba, this is still a small sector; the latest report reveals
the area occupied by commercial greenhouses to be only 42 ha
(Ajete, Bonet, Duarte, Vargas,& P�erez, 2011), largely producing
horticultural products. However, this agrotechnology is of
great interest in Cuba, and there are plans to increase the
sector size to meet demands of the tourism industry for fresh
vegetables. One of the problems faced is the supply of energy
to these greenhouses since the country electrical grid does not
extend everywhere, and at times the supply quality is poor.
The official price of electricity is similar to that in other
countries, but these problems make the use of small, renew-
able energy facilities at the site of consumption quite
attractive.
In Pakistan, the agricultural greenhouse sector is growing
rapidly, and although it is not one of the country most
important industries, it is firmly established and has high
mps for irrigating greenhouse crops: Comparison in different://dx.doi.org/10.1016/j.biosystemseng.2014.08.013
b i o s y s t em s e n g i n e e r i n g x x x ( 2 0 1 4 ) 1e8 3
growth expectations. The electricity grid iswell developed, but
it does not cover all agricultural land in the country. The en-
ergy market price is low compared to the world average.
In Spain, the greenhouse industry, combined with the
agricultural processing industry, is one of the most important
in the country, and has an exporting tradition. The current
area occupied by greenhouses producing ornamental plants
and vegetables is 60,482 ha (MAGRAMA, 2012, pp. 1e46). The
main production area is in Almerıa, a south-eastern region of
Spain, which has one of the largest concentrations of green-
houses in the world. Energy supply infrastructures are highly
developed and cover virtually all of the country agricultural
land. The market price of electrical energy is, however, high
compared to the world average.
The three countries also have different wind resources.
The Department of Energy of the United States has published
documentation, measurements and wind maps for Cuba and
Pakistan (U.S. Department of Energy, 2012) at a height of 50 m,
and the Spanish Institute for Diversification and Energy Effi-
ciency (IDAE) has published the same for Spain at heights of
30 m and 80 m (IDAE, 2011). Wind speed measurements are
commonly made at different heights above ground level; in-
formation for other heights can be extrapolated from the
available data using logarithmic expressions (IDAE, 2011).
The aim of the present work was to assess the feasibility of
using wind pump technology for irrigation by the greenhouse
sector in these countries and the related critical factors,
within the context of their developmental backgrounds and
their energy supply characteristics.
2. Material and methods
2.1. Processing of wind data
Three representative locations, one in each country, were
selected from the available information on the wind resource
in the three countries (Spain: IDAE, 2011; Cuba and Pakistan:
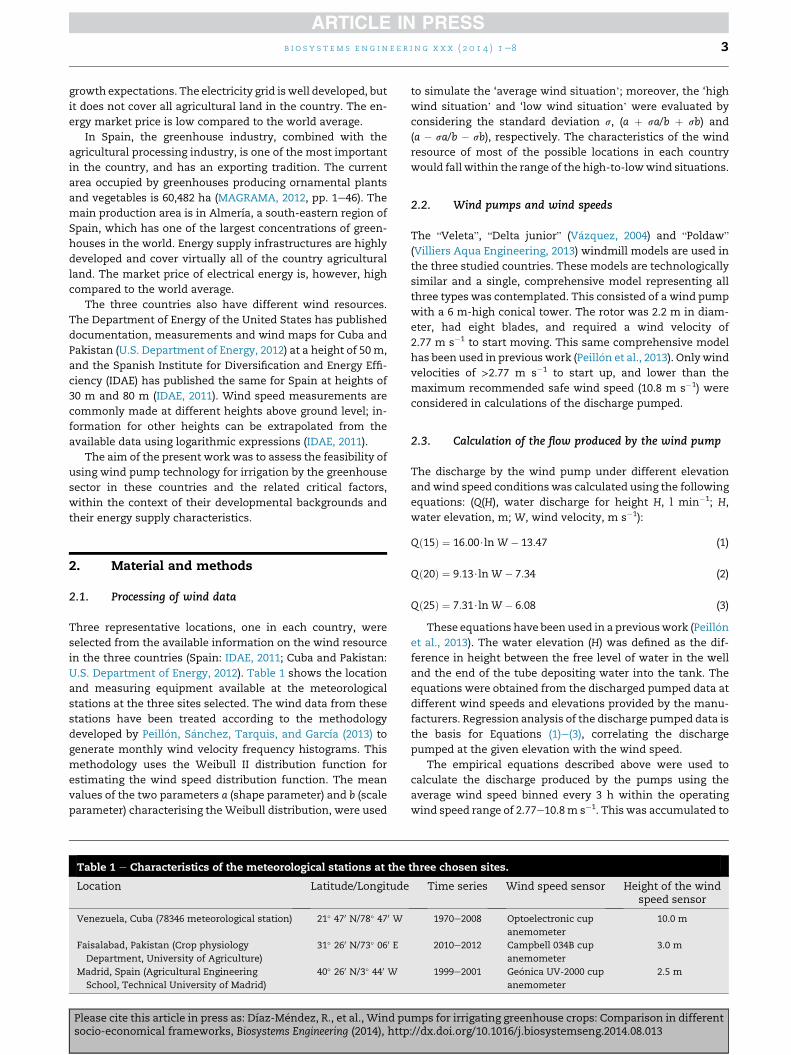
U.S. Department of Energy, 2012). Table 1 shows the location
and measuring equipment available at the meteorological
stations at the three sites selected. The wind data from these
stations have been treated according to the methodology
developed by Peill�on, S�anchez, Tarquis, and Garcıa (2013) to
generate monthly wind velocity frequency histograms. This
methodology uses the Weibull II distribution function for
estimating the wind speed distribution function. The mean
values of the two parameters a (shape parameter) and b (scale
parameter) characterising the Weibull distribution, were used
Table 1 e Characteristics of the meteorological stations at the
Location Latitude/Longitude
Venezuela, Cuba (78346 meteorological station) 21� 470 N/78� 470 W
Faisalabad, Pakistan (Crop physiology
Department, University of Agriculture)
31� 260 N/73� 060 E
Madrid, Spain (Agricultural Engineering
School, Technical University of Madrid)
40� 260 N/3� 440 W
Please cite this article in press as: Dıaz-M�endez, R., et al., Wind pusocio-economical frameworks, Biosystems Engineering (2014), http
to simulate the ‘average wind situation’; moreover, the ‘high
wind situation’ and ‘low wind situation’ were evaluated by
considering the standard deviation s, (a þ sa/b þ sb) and
(a � sa/b � sb), respectively. The characteristics of the wind
resource of most of the possible locations in each country
would fall within the range of the high-to-lowwind situations.
2.2. Wind pumps and wind speeds
The “Veleta”, “Delta junior” (V�azquez, 2004) and “Poldaw”
(Villiers Aqua Engineering, 2013) windmill models are used in
the three studied countries. These models are technologically
similar and a single, comprehensive model representing all
three types was contemplated. This consisted of a wind pump
with a 6 m-high conical tower. The rotor was 2.2 m in diam-
eter, had eight blades, and required a wind velocity of
2.77 m s�1 to start moving. This same comprehensive model
has been used in previouswork (Peill�on et al., 2013). Onlywind
velocities of >2.77 m s�1 to start up, and lower than the
maximum recommended safe wind speed (10.8 m s�1) were
considered in calculations of the discharge pumped.
2.3. Calculation of the flow produced by the wind pump
The discharge by the wind pump under different elevation
and wind speed conditions was calculated using the following
equations: (Q(H), water discharge for height H, l min�1; H,
water elevation, m; W, wind velocity, m s�1):
Qð15Þ ¼ 16:00$ln W � 13:47 (1)
Qð20Þ ¼ 9:13$lnW � 7:34 (2)
Qð25Þ ¼ 7:31$lnW � 6:08 (3)
These equations have been used in a previouswork (Peill�on
et al., 2013). The water elevation (H) was defined as the dif-
ference in height between the free level of water in the well
and the end of the tube depositing water into the tank. The
equations were obtained from the discharged pumped data at
different wind speeds and elevations provided by the manu-
facturers. Regression analysis of the discharge pumped data is
the basis for Equations (1)e(3), correlating the discharge
pumped at the given elevation with the wind speed.
The empirical equations described above were used to
calculate the discharge produced by the pumps using the
average wind speed binned every 3 h within the operating
wind speed range of 2.77e10.8m s�1. This was accumulated to
three chosen sites.
Time series Wind speed sensor Height of the windspeed sensor
1970e2008 Optoelectronic cup
anemometer
10.0 m
2010e2012 Campbell 034B cup
anemometer
3.0 m
1999e2001 Ge�onica UV-2000 cup
anemometer
2.5 m
mps for irrigating greenhouse crops: Comparison in different://dx.doi.org/10.1016/j.biosystemseng.2014.08.013
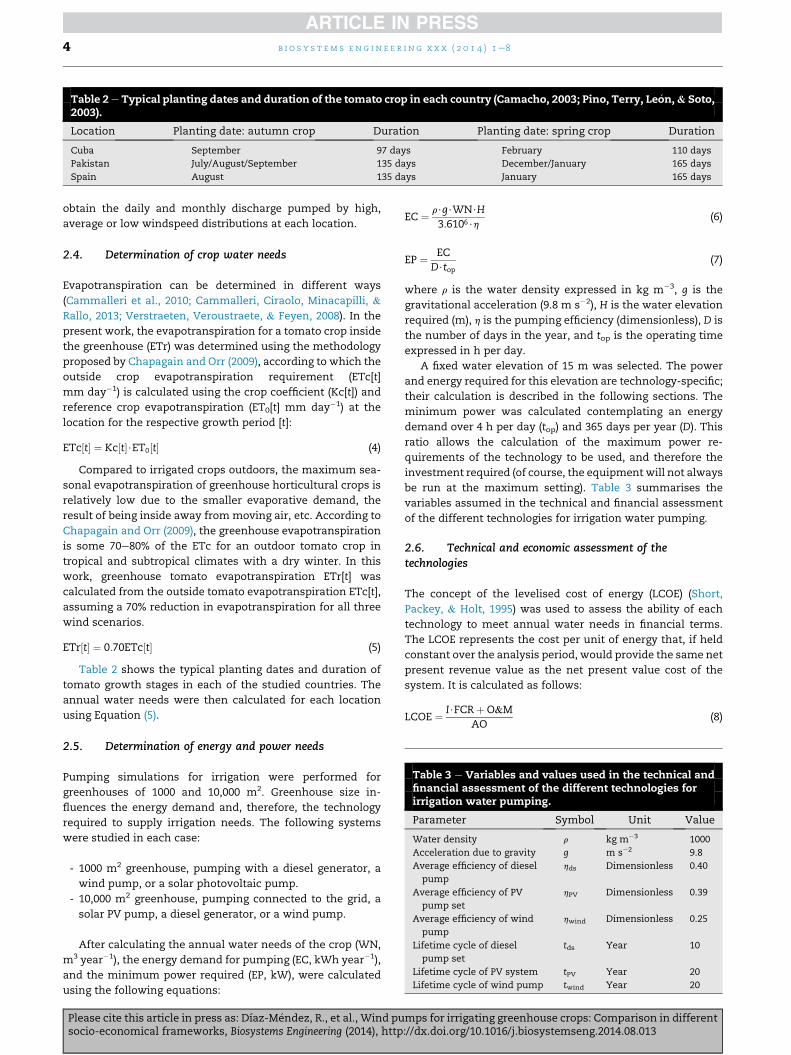
Table 3 e Variables and values used in the technical andfinancial assessment of the different technologies forirrigation water pumping.
Parameter Symbol Unit Value
Water density r kg m�3 1000
Acceleration due to gravity g m s�2 9.8
Average efficiency of diesel
pump
hds Dimensionless 0.40
Average efficiency of PV
pump set
hPV Dimensionless 0.39
Average efficiency of wind
pump
hwind Dimensionless 0.25
Lifetime cycle of diesel
pump set
tds Year 10
Lifetime cycle of PV system tPV Year 20
Lifetime cycle of wind pump twind Year 20
Table 2e Typical planting dates and duration of the tomato crop in each country (Camacho, 2003; Pino, Terry, Le�on,& Soto,2003).
Location Planting date: autumn crop Duration Planting date: spring crop Duration
Cuba September 97 days February 110 days
Pakistan July/August/September 135 days December/January 165 days
Spain August 135 days January 165 days
b i o s y s t em s e ng i n e e r i n g x x x ( 2 0 1 4 ) 1e84
obtain the daily and monthly discharge pumped by high,
average or low windspeed distributions at each location.
2.4. Determination of crop water needs
Evapotranspiration can be determined in different ways
(Cammalleri et al., 2010; Cammalleri, Ciraolo, Minacapilli, &
Rallo, 2013; Verstraeten, Veroustraete, & Feyen, 2008). In the
present work, the evapotranspiration for a tomato crop inside
the greenhouse (ETr) was determined using the methodology
proposed by Chapagain and Orr (2009), according to which the
outside crop evapotranspiration requirement (ETc[t]
mm day�1) is calculated using the crop coefficient (Kc[t]) and
reference crop evapotranspiration (ET0[t] mm day�1) at the
location for the respective growth period [t]:
ETc½t� ¼ Kc½t�$ET0½t� (4)
Compared to irrigated crops outdoors, the maximum sea-
sonal evapotranspiration of greenhouse horticultural crops is
relatively low due to the smaller evaporative demand, the
result of being inside away from moving air, etc. According to
Chapagain and Orr (2009), the greenhouse evapotranspiration
is some 70e80% of the ETc for an outdoor tomato crop in
tropical and subtropical climates with a dry winter. In this
work, greenhouse tomato evapotranspiration ETr[t] was
calculated from the outside tomato evapotranspiration ETc[t],
assuming a 70% reduction in evapotranspiration for all three
wind scenarios.
ETr½t� ¼ 0:70ETc½t� (5)
Table 2 shows the typical planting dates and duration of
tomato growth stages in each of the studied countries. The
annual water needs were then calculated for each location
using Equation (5).
2.5. Determination of energy and power needs
Pumping simulations for irrigation were performed for
greenhouses of 1000 and 10,000 m2. Greenhouse size in-
fluences the energy demand and, therefore, the technology
required to supply irrigation needs. The following systems
were studied in each case:
- 1000 m2 greenhouse, pumping with a diesel generator, a
wind pump, or a solar photovoltaic pump.
- 10,000 m2 greenhouse, pumping connected to the grid, a
solar PV pump, a diesel generator, or a wind pump.
After calculating the annual water needs of the crop (WN,
m3 year�1), the energy demand for pumping (EC, kWh year�1),
and the minimum power required (EP, kW), were calculated
using the following equations:
Please cite this article in press as: Dıaz-M�endez, R., et al., Wind pusocio-economical frameworks, Biosystems Engineering (2014), http
EC ¼ r$g$WN$H3:6106$h
(6)
EP ¼ ECD$top
(7)
where r is the water density expressed in kg m�3, g is the
gravitational acceleration (9.8 m s�2), H is the water elevation
required (m), h is the pumping efficiency (dimensionless), D is
the number of days in the year, and top is the operating time
expressed in h per day.
A fixed water elevation of 15 m was selected. The power
and energy required for this elevation are technology-specific;
their calculation is described in the following sections. The
minimum power was calculated contemplating an energy
demand over 4 h per day (top) and 365 days per year (D). This
ratio allows the calculation of the maximum power re-
quirements of the technology to be used, and therefore the
investment required (of course, the equipment will not always
be run at the maximum setting). Table 3 summarises the
variables assumed in the technical and financial assessment
of the different technologies for irrigation water pumping.
2.6. Technical and economic assessment of thetechnologies
The concept of the levelised cost of energy (LCOE) (Short,
Packey, & Holt, 1995) was used to assess the ability of each
technology to meet annual water needs in financial terms.
The LCOE represents the cost per unit of energy that, if held
constant over the analysis period, would provide the same net
present revenue value as the net present value cost of the
system. It is calculated as follows:
LCOE ¼ I$FCRþO&MAO
(8)
mps for irrigating greenhouse crops: Comparison in different://dx.doi.org/10.1016/j.biosystemseng.2014.08.013
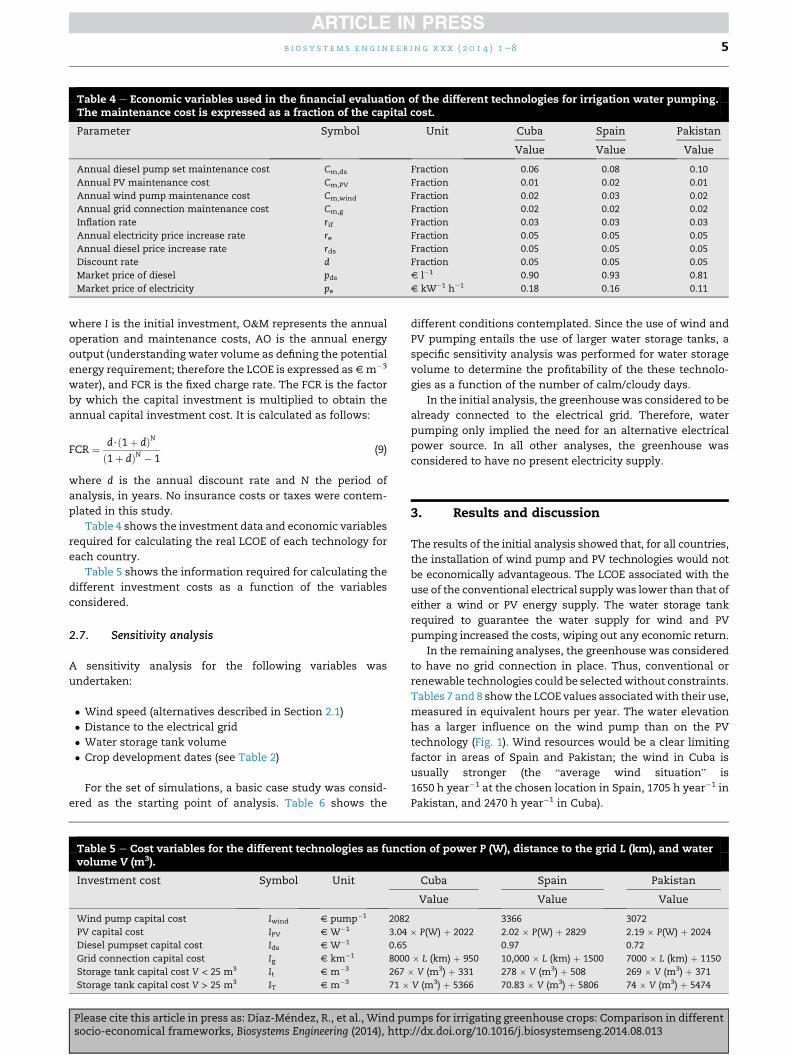
Table 4 e Economic variables used in the financial evaluation of the different technologies for irrigation water pumping.The maintenance cost is expressed as a fraction of the capital cost.
Parameter Symbol Unit Cuba Spain Pakistan
Value Value Value
Annual diesel pump set maintenance cost Cm,ds Fraction 0.06 0.08 0.10
Annual PV maintenance cost Cm,PV Fraction 0.01 0.02 0.01
Annual wind pump maintenance cost Cm,wind Fraction 0.02 0.03 0.02
Annual grid connection maintenance cost Cm,g Fraction 0.02 0.02 0.02
Inflation rate rif Fraction 0.03 0.03 0.03
Annual electricity price increase rate re Fraction 0.05 0.05 0.05
Annual diesel price increase rate rds Fraction 0.05 0.05 0.05
Discount rate d Fraction 0.05 0.05 0.05
Market price of diesel pds V l�1 0.90 0.93 0.81
Market price of electricity pe V kW�1 h�1 0.18 0.16 0.11
b i o s y s t em s e n g i n e e r i n g x x x ( 2 0 1 4 ) 1e8 5
where I is the initial investment, O&M represents the annual
operation and maintenance costs, AO is the annual energy
output (understanding water volume as defining the potential
energy requirement; therefore the LCOE is expressed asVm�3
water), and FCR is the fixed charge rate. The FCR is the factor
by which the capital investment is multiplied to obtain the
annual capital investment cost. It is calculated as follows:
FCR ¼ d$ð1þ dÞNð1þ dÞN � 1
(9)
where d is the annual discount rate and N the period of
analysis, in years. No insurance costs or taxes were contem-
plated in this study.
Table 4 shows the investment data and economic variables
required for calculating the real LCOE of each technology for
each country.
Table 5 shows the information required for calculating the
different investment costs as a function of the variables
considered.
2.7. Sensitivity analysis
A sensitivity analysis for the following variables was
undertaken:
� Wind speed (alternatives described in Section 2.1)
� Distance to the electrical grid
� Water storage tank volume
� Crop development dates (see Table 2)
For the set of simulations, a basic case study was consid-
ered as the starting point of analysis. Table 6 shows the
Table 5 e Cost variables for the different technologies as functvolume V (m3).
Investment cost Symbol Unit
Wind pump capital cost Iwind V pump�1 2082
PV capital cost IPV V W�1 3.04
Diesel pumpset capital cost Ids V W�1 0.65
Grid connection capital cost Ig V km�1 8000
Storage tank capital cost V < 25 m3 It V m�3 267
Storage tank capital cost V > 25 m3 IT V m�3 71 �
Please cite this article in press as: Dıaz-M�endez, R., et al., Wind pusocio-economical frameworks, Biosystems Engineering (2014), http
different conditions contemplated. Since the use of wind and
PV pumping entails the use of larger water storage tanks, a
specific sensitivity analysis was performed for water storage
volume to determine the profitability of the these technolo-
gies as a function of the number of calm/cloudy days.
In the initial analysis, the greenhousewas considered to be
already connected to the electrical grid. Therefore, water
pumping only implied the need for an alternative electrical
power source. In all other analyses, the greenhouse was
considered to have no present electricity supply.
3. Results and discussion
The results of the initial analysis showed that, for all countries,
the installation of wind pump and PV technologies would not
be economically advantageous. The LCOE associated with the
use of the conventional electrical supply was lower than that of
either a wind or PV energy supply. The water storage tank
required to guarantee the water supply for wind and PV
pumping increased the costs, wiping out any economic return.
In the remaining analyses, the greenhouse was considered
to have no grid connection in place. Thus, conventional or
renewable technologies could be selectedwithout constraints.
Tables 7 and 8 show the LCOE values associatedwith their use,
measured in equivalent hours per year. The water elevation
has a larger influence on the wind pump than on the PV
technology (Fig. 1). Wind resources would be a clear limiting
factor in areas of Spain and Pakistan; the wind in Cuba is
usually stronger (the “average wind situation” is
1650 h year�1 at the chosen location in Spain, 1705 h year�1 in
Pakistan, and 2470 h year�1 in Cuba).
ion of power P (W), distance to the grid L (km), and water
Cuba Spain Pakistan
Value Value Value
3366 3072
� P(W) þ 2022 2.02 � P(W) þ 2829 2.19 � P(W) þ 2024
0.97 0.72
� L (km) þ 950 10,000 � L (km) þ 1500 7000 � L (km) þ 1150
� V (m3) þ 331 278 � V (m3) þ 508 269 � V (m3) þ 371
V (m3) þ 5366 70.83 � V (m3) þ 5806 74 � V (m3) þ 5474
mps for irrigating greenhouse crops: Comparison in different://dx.doi.org/10.1016/j.biosystemseng.2014.08.013
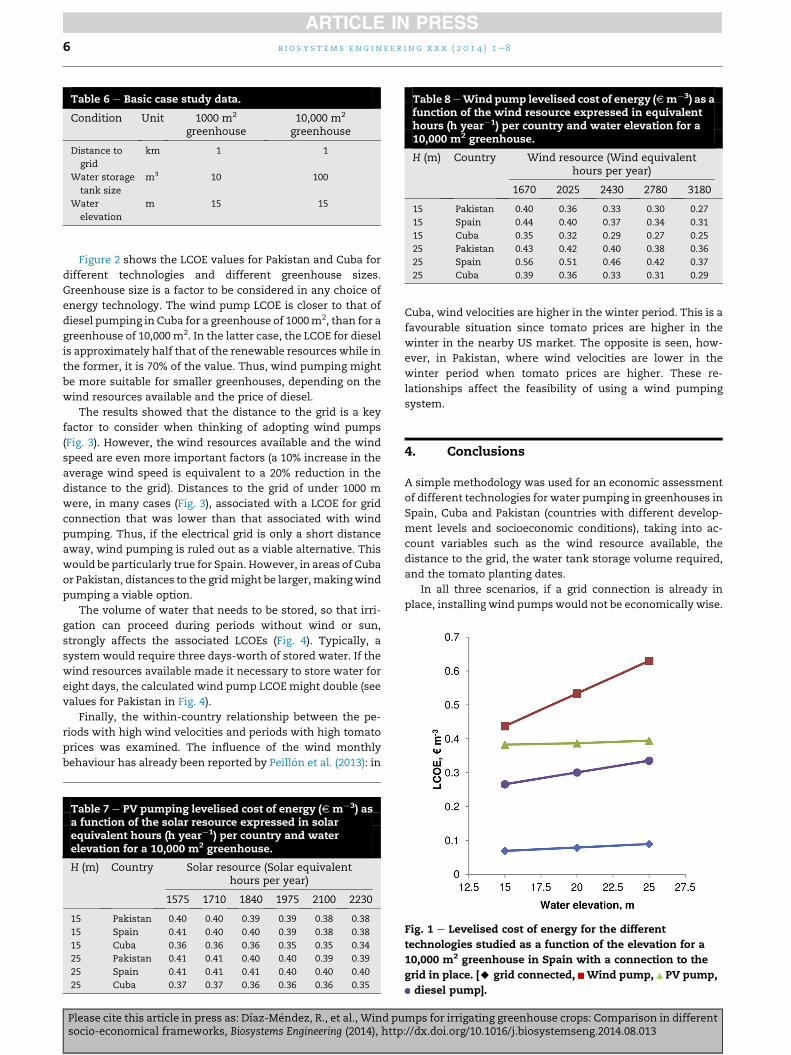
Table 6 e Basic case study data.
Condition Unit 1000 m2
greenhouse10,000 m2
greenhouse
Distance to
grid
km 1 1
Water storage
tank size
m3 10 100
Water
elevation
m 15 15
Table 8eWind pump levelised cost of energy (Vm¡3) as afunction of the wind resource expressed in equivalenthours (h year¡1) per country and water elevation for a10,000 m2 greenhouse.
H (m) Country Wind resource (Wind equivalenthours per year)
1670 2025 2430 2780 3180
15 Pakistan 0.40 0.36 0.33 0.30 0.27
15 Spain 0.44 0.40 0.37 0.34 0.31
15 Cuba 0.35 0.32 0.29 0.27 0.25
25 Pakistan 0.43 0.42 0.40 0.38 0.36
25 Spain 0.56 0.51 0.46 0.42 0.37
25 Cuba 0.39 0.36 0.33 0.31 0.29
b i o s y s t em s e ng i n e e r i n g x x x ( 2 0 1 4 ) 1e86
Figure 2 shows the LCOE values for Pakistan and Cuba for
different technologies and different greenhouse sizes.
Greenhouse size is a factor to be considered in any choice of
energy technology. The wind pump LCOE is closer to that of
diesel pumping in Cuba for a greenhouse of 1000m2, than for a
greenhouse of 10,000 m2. In the latter case, the LCOE for diesel
is approximately half that of the renewable resources while in
the former, it is 70% of the value. Thus, wind pumping might
be more suitable for smaller greenhouses, depending on the
wind resources available and the price of diesel.
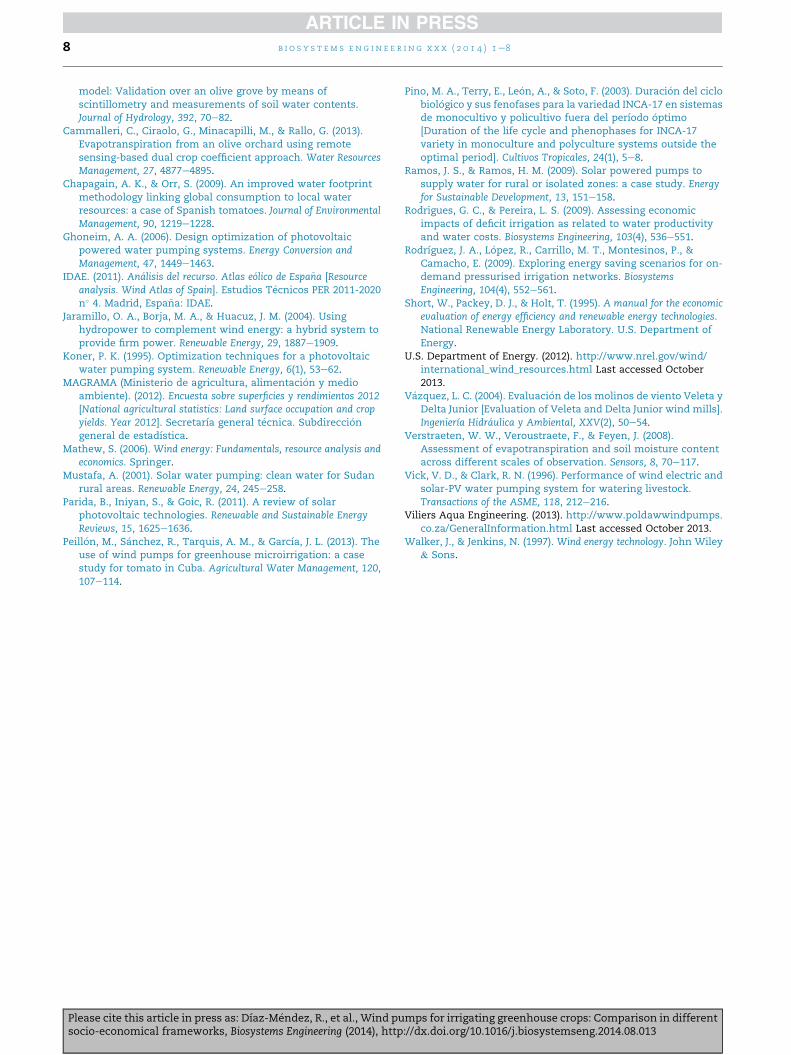
The results showed that the distance to the grid is a key
factor to consider when thinking of adopting wind pumps
(Fig. 3). However, the wind resources available and the wind
speed are even more important factors (a 10% increase in the
average wind speed is equivalent to a 20% reduction in the
distance to the grid). Distances to the grid of under 1000 m
were, in many cases (Fig. 3), associated with a LCOE for grid
connection that was lower than that associated with wind
pumping. Thus, if the electrical grid is only a short distance
away, wind pumping is ruled out as a viable alternative. This
would be particularly true for Spain. However, in areas of Cuba
or Pakistan, distances to the gridmight be larger,makingwind
pumping a viable option.
The volume of water that needs to be stored, so that irri-
gation can proceed during periods without wind or sun,
strongly affects the associated LCOEs (Fig. 4). Typically, a
system would require three days-worth of stored water. If the
wind resources available made it necessary to store water for
eight days, the calculated wind pump LCOE might double (see
values for Pakistan in Fig. 4).
Finally, the within-country relationship between the pe-
riods with high wind velocities and periods with high tomato
prices was examined. The influence of the wind monthly
behaviour has already been reported by Peill�on et al. (2013): in
Table 7 e PV pumping levelised cost of energy (V m¡3) asa function of the solar resource expressed in solarequivalent hours (h year¡1) per country and waterelevation for a 10,000 m2 greenhouse.
H (m) Country Solar resource (Solar equivalenthours per year)
1575 1710 1840 1975 2100 2230
15 Pakistan 0.40 0.40 0.39 0.39 0.38 0.38
15 Spain 0.41 0.40 0.40 0.39 0.38 0.38
15 Cuba 0.36 0.36 0.36 0.35 0.35 0.34
25 Pakistan 0.41 0.41 0.40 0.40 0.39 0.39
25 Spain 0.41 0.41 0.41 0.40 0.40 0.40
25 Cuba 0.37 0.37 0.36 0.36 0.36 0.35
Please cite this article in press as: Dıaz-M�endez, R., et al., Wind pusocio-economical frameworks, Biosystems Engineering (2014), http
Cuba, wind velocities are higher in the winter period. This is a
favourable situation since tomato prices are higher in the
winter in the nearby US market. The opposite is seen, how-
ever, in Pakistan, where wind velocities are lower in the
winter period when tomato prices are higher. These re-
lationships affect the feasibility of using a wind pumping
system.
4. Conclusions
A simple methodology was used for an economic assessment
of different technologies for water pumping in greenhouses in
Spain, Cuba and Pakistan (countries with different develop-
ment levels and socioeconomic conditions), taking into ac-
count variables such as the wind resource available, the
distance to the grid, the water tank storage volume required,
and the tomato planting dates.
In all three scenarios, if a grid connection is already in
place, installing wind pumps would not be economically wise.
Fig. 1 e Levelised cost of energy for the different
technologies studied as a function of the elevation for a
10,000 m2 greenhouse in Spain with a connection to the
grid in place. [A grid connected, Wind pump, PV pump,
diesel pump].
mps for irrigating greenhouse crops: Comparison in different://dx.doi.org/10.1016/j.biosystemseng.2014.08.013
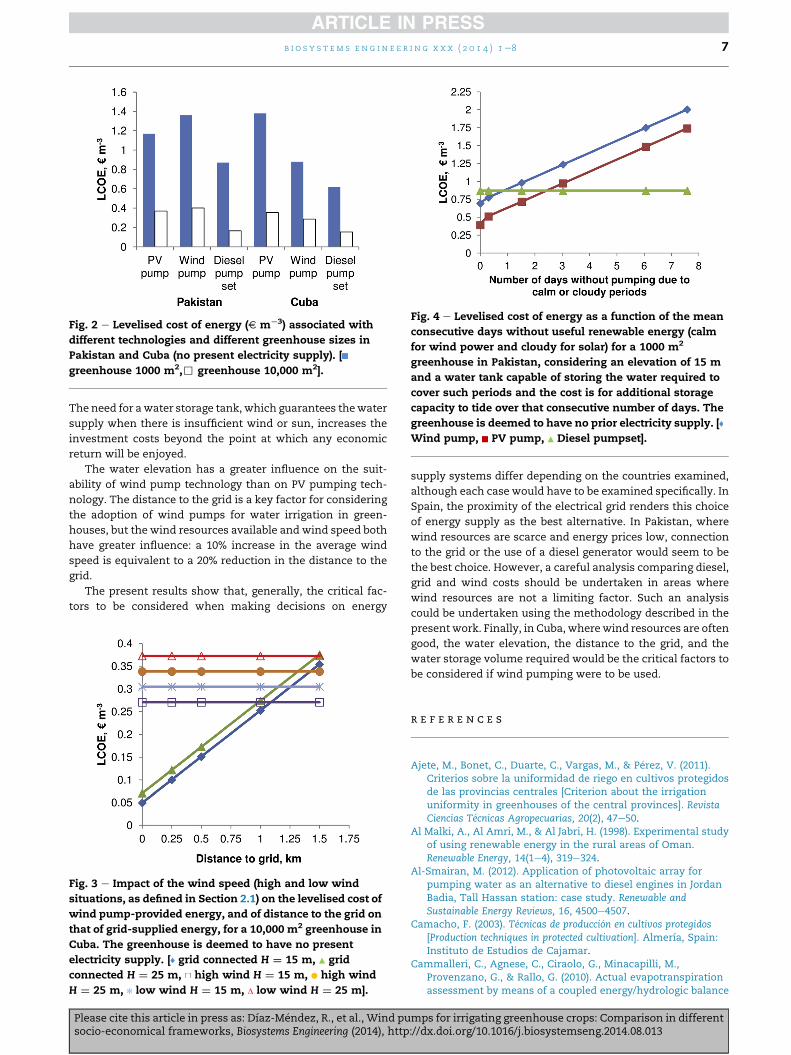
Fig. 2 e Levelised cost of energy (V m¡3) associated with
different technologies and different greenhouse sizes in
Pakistan and Cuba (no present electricity supply). [
greenhouse 1000 m2,, greenhouse 10,000 m2].
Fig. 4 e Levelised cost of energy as a function of the mean
consecutive days without useful renewable energy (calm
for wind power and cloudy for solar) for a 1000 m2
greenhouse in Pakistan, considering an elevation of 15 m
and a water tank capable of storing the water required to
cover such periods and the cost is for additional storage
capacity to tide over that consecutive number of days. The
greenhouse is deemed to have no prior electricity supply. [
Wind pump, PV pump, Diesel pumpset].
b i o s y s t em s e n g i n e e r i n g x x x ( 2 0 1 4 ) 1e8 7
The need for awater storage tank, which guarantees thewater
supply when there is insufficient wind or sun, increases the
investment costs beyond the point at which any economic
return will be enjoyed.
The water elevation has a greater influence on the suit-
ability of wind pump technology than on PV pumping tech-
nology. The distance to the grid is a key factor for considering
the adoption of wind pumps for water irrigation in green-
houses, but the wind resources available and wind speed both
have greater influence: a 10% increase in the average wind
speed is equivalent to a 20% reduction in the distance to the
grid.
The present results show that, generally, the critical fac-
tors to be considered when making decisions on energy
Fig. 3 e Impact of the wind speed (high and low wind
situations, as defined in Section 2.1) on the levelised cost of
wind pump-provided energy, and of distance to the grid on
that of grid-supplied energy, for a 10,000 m2 greenhouse in
Cuba. The greenhouse is deemed to have no present
electricity supply. [ grid connected H ¼ 15 m, grid
connected H ¼ 25 m, high wind H ¼ 15 m, high wind
H ¼ 25 m, low wind H ¼ 15 m, low wind H ¼ 25 m].
Please cite this article in press as: Dıaz-M�endez, R., et al., Wind pusocio-economical frameworks, Biosystems Engineering (2014), http
supply systems differ depending on the countries examined,
although each case would have to be examined specifically. In
Spain, the proximity of the electrical grid renders this choice
of energy supply as the best alternative. In Pakistan, where
wind resources are scarce and energy prices low, connection
to the grid or the use of a diesel generator would seem to be
the best choice. However, a careful analysis comparing diesel,
grid and wind costs should be undertaken in areas where
wind resources are not a limiting factor. Such an analysis
could be undertaken using the methodology described in the
presentwork. Finally, in Cuba, wherewind resources are often
good, the water elevation, the distance to the grid, and the
water storage volume required would be the critical factors to
be considered if wind pumping were to be used.
r e f e r e n c e s
Ajete, M., Bonet, C., Duarte, C., Vargas, M., & P�erez, V. (2011).Criterios sobre la uniformidad de riego en cultivos protegidosde las provincias centrales [Criterion about the irrigationuniformity in greenhouses of the central provinces]. RevistaCiencias T�ecnicas Agropecuarias, 20(2), 47e50.
Al Malki, A., Al Amri, M., & Al Jabri, H. (1998). Experimental studyof using renewable energy in the rural areas of Oman.Renewable Energy, 14(1e4), 319e324.
Al-Smairan, M. (2012). Application of photovoltaic array forpumping water as an alternative to diesel engines in JordanBadia, Tall Hassan station: case study. Renewable andSustainable Energy Reviews, 16, 4500e4507.
Camacho, F. (2003). T�ecnicas de producci�on en cultivos protegidos[Production techniques in protected cultivation]. Almerıa, Spain:Instituto de Estudios de Cajamar.
Cammalleri, C., Agnese, C., Ciraolo, G., Minacapilli, M.,Provenzano, G., & Rallo, G. (2010). Actual evapotranspirationassessment by means of a coupled energy/hydrologic balance
mps for irrigating greenhouse crops: Comparison in different://dx.doi.org/10.1016/j.biosystemseng.2014.08.013
b i o s y s t em s e ng i n e e r i n g x x x ( 2 0 1 4 ) 1e88
model: Validation over an olive grove by means ofscintillometry and measurements of soil water contents.Journal of Hydrology, 392, 70e82.
Cammalleri, C., Ciraolo, G., Minacapilli, M., & Rallo, G. (2013).Evapotranspiration from an olive orchard using remotesensing-based dual crop coefficient approach. Water ResourcesManagement, 27, 4877e4895.
Chapagain, A. K., & Orr, S. (2009). An improved water footprintmethodology linking global consumption to local waterresources: a case of Spanish tomatoes. Journal of EnvironmentalManagement, 90, 1219e1228.
Ghoneim, A. A. (2006). Design optimization of photovoltaicpowered water pumping systems. Energy Conversion andManagement, 47, 1449e1463.
IDAE. (2011). An�alisis del recurso. Atlas e�olico de Espa~na [Resourceanalysis. Wind Atlas of Spain]. Estudios T�ecnicos PER 2011-2020n� 4. Madrid, Espa~na: IDAE.
Jaramillo, O. A., Borja, M. A., & Huacuz, J. M. (2004). Usinghydropower to complement wind energy: a hybrid system toprovide firm power. Renewable Energy, 29, 1887e1909.
Koner, P. K. (1995). Optimization techniques for a photovoltaicwater pumping system. Renewable Energy, 6(1), 53e62.
MAGRAMA (Ministerio de agricultura, alimentaci�on y medioambiente). (2012). Encuesta sobre superficies y rendimientos 2012[National agricultural statistics: Land surface occupation and cropyields. Year 2012]. Secretarıa general t�ecnica. Subdirecci�ongeneral de estadıstica.
Mathew, S. (2006). Wind energy: Fundamentals, resource analysis andeconomics. Springer.
Mustafa, A. (2001). Solar water pumping: clean water for Sudanrural areas. Renewable Energy, 24, 245e258.
Parida, B., Iniyan, S., & Goic, R. (2011). A review of solarphotovoltaic technologies. Renewable and Sustainable EnergyReviews, 15, 1625e1636.
Peill�on, M., S�anchez, R., Tarquis, A. M., & Garcıa, J. L. (2013). Theuse of wind pumps for greenhouse microirrigation: a casestudy for tomato in Cuba. Agricultural Water Management, 120,107e114.
Please cite this article in press as: Dıaz-M�endez, R., et al., Wind pusocio-economical frameworks, Biosystems Engineering (2014), http
Pino, M. A., Terry, E., Le�on, A., & Soto, F. (2003). Duraci�on del ciclobiol�ogico y sus fenofases para la variedad INCA-17 en sistemasde monocultivo y policultivo fuera del perıodo �optimo[Duration of the life cycle and phenophases for INCA-17variety in monoculture and polyculture systems outside theoptimal period]. Cultivos Tropicales, 24(1), 5e8.
Ramos, J. S., & Ramos, H. M. (2009). Solar powered pumps tosupply water for rural or isolated zones: a case study. Energyfor Sustainable Development, 13, 151e158.
Rodrigues, G. C., & Pereira, L. S. (2009). Assessing economicimpacts of deficit irrigation as related to water productivityand water costs. Biosystems Engineering, 103(4), 536e551.
Rodrıguez, J. A., L�opez, R., Carrillo, M. T., Montesinos, P., &Camacho, E. (2009). Exploring energy saving scenarios for on-demand pressurised irrigation networks. BiosystemsEngineering, 104(4), 552e561.
Short, W., Packey, D. J., & Holt, T. (1995). A manual for the economicevaluation of energy efficiency and renewable energy technologies.National Renewable Energy Laboratory. U.S. Department ofEnergy.
U.S. Department of Energy. (2012). http://www.nrel.gov/wind/international_wind_resources.html Last accessed October2013.
V�azquez, L. C. (2004). Evaluaci�on de los molinos de viento Veleta yDelta Junior [Evaluation of Veleta and Delta Junior wind mills].Ingenierıa Hidr�aulica y Ambiental, XXV(2), 50e54.
Verstraeten, W. W., Veroustraete, F., & Feyen, J. (2008).Assessment of evapotranspiration and soil moisture contentacross different scales of observation. Sensors, 8, 70e117.
Vick, V. D., & Clark, R. N. (1996). Performance of wind electric andsolar-PV water pumping system for watering livestock.Transactions of the ASME, 118, 212e216.
Viliers Aqua Engineering. (2013). http://www.poldawwindpumps.co.za/GeneralInformation.html Last accessed October 2013.
Walker, J., & Jenkins, N. (1997). Wind energy technology. John Wiley& Sons.
mps for irrigating greenhouse crops: Comparison in different://dx.doi.org/10.1016/j.biosystemseng.2014.08.013