Embed Size (px)
Citation preview
Manuscript for Revista Mexicana de Astronomıa y Astrofısica (2007)
WIND STRUCTURE OF THE WOLF-RAYET STAR
EZ CMA=HD 50896
Aaron Flores1, Gloria Koenigsberger2, Octavio Cardona3 and Lelio de la
Cruz1
Draft version: May 9, 2011
RESUMEN
Presentamos los resultados del analisis de la lınea the N V 4604 observada en
espectros de la estrella Wolf-Rayet HD 50896 obtenidos en 1991, 1999, 2005
y 2009. Mostramos que la variabilidad de esta lınea es consistente con un
modelo en el que la opacidad del viento sufre cambios cıclicos con un periodo
de 3.76d o bien con un modelo de un viento con estructura cuadrupolar donde
cada sector tiene una opacidad distinta.
ABSTRACT
The Wolf-Rayet star HD 50896 (EZ CMa=WR6) is well-known for the emission-
line profile variability that occurs on a 3.7-day timescale. In particular, the
shape of the N V 4604-21 doublet changes from a P Cygni profile to one
in which no blue-shifted absorption component is present. In this paper we
use spectroscopic observations obtained in 1991, 1999, 2005 and 2009 to glean
physical conditions within the stellar wind that may give rise to these changes.
We find that variations in the opacity at a distance r/Rmax ∼0.3–0.5 of the
stellar surface can produce the observed effects. Here, Rmax is the extent
of the N V line-forming region. The results are consistent either with a sce-
nario in which the opacity of the inner wind region of HD 50896 undergoes
cyclical variations over the 3.76 d period or with a quadrupolar wind distri-
bution in which the sectors having different opacities rotate in and out of our
line-of-sight on this periodic timescale.
Key Words: Stars: Wolf-Rayet stars — Stars: stellar winds — Stars: EZ CMa
= HD 50896
1. INTRODUCTION
Classical Wolf-Rayet (WR) stars (van der Hucht et al. 1981) are the
evolved remnants of massive O-type stars and are believed to be the last sta-
ble evolutionary phase of a star before it explodes as a supernova or, possibly,
a “collapsar” (Crowther 2007). The WR stars are often found in binary sys-
tems in which the companion is also a massive O-type star. Van den Heuvel
(1976) noted that after the more massive star in a massive binary system has
become a supernova, leaving a neutron star or black hole remnant, its compan-
ion should eventually become a WR star. Hence, a number of WR+cc systems
1Universidad Autonoma del Carmen. Facultad de Ingenierıa2Instituto de Ciencias Fısicas, Universidad Nacional Autonoma de Mexico3Instituto Nacional de Astrofısica Optica y Electronica
1
2 FLORES ET AL.
should be observable at any given time. The WN5-type star HD 50896 (EZ
CMa=WR6; van der Hucht et al. 1981) was the first WR star to be proposed
to fit this evolutionary scenario. Firmani et al. (1979, 1980) detected peri-
odic (P=3.76d) emission-line profile variability which, when combined with
the fact that HD 50896 is surrounded by a ring nebula (S308) and that it
lies high above the galactic plane4, led them to conclude that HD 50896 is a
binary system with a low-mass companion. Shortly thereafter, linear polar-
ization (McLean 1980) and photometric (Cherepashchuk 1981) observations
confirmed the P=3.76 day periodicity. Subsequent period determinations by
Lamontange et al. (1986) and Georgiev et al. (1999) are, respectively P=3.766
± 0.001 d and P=3.765 ± 0.001 d.
Two criteria were used by Firmani et al. (1979, 1980) to determine the
original period: a) the shape of the He II 4686 line profiles, particularly the
location of superposed emission-like spikes that were either at line center, or
“blueward”, or “redward” of this location; and b) the strength of the N V 4604-
21 P Cygni absorptions. Georgiev et al. (1999) showed that the variations
in this high ionization N V doublet retained coherence over ∼14 years of
observations, with a period P=3.765 d. However, although the variability in
other lines and in photometric data is always consistent with the 3.76 d period,
it is often not coherent over timescales of several weeks or longer (Drissen et
al. 1989). Hence, the binary nature of HD 50896 has been questioned.
Another problem with the WR+cc scenario for HD 50896 is the absence
of significant X-ray variability. Stevens & Willis (1988) and Skinner et al.
(1998) showed that the observed levels of X-ray emission are far too low to be
attributable to accretion onto a neutron star or black hole. On the other hand,
Skinner et al. (2002) concluded that the presence of a low-mass companion
upon which the WR wind collides would be consistent with the low X-ray
emission levels. Hence, the binary scenario is still a viable one. However,
even under the binary hypothesis, a physical mechanism by which the line-
profile variability occurs is still not identified.
In this investigation we focus on one of the physical mechanisms that may
produce the observed line-profile variations in HD 50896. Specifically, we
will analyze the NV 4604 line profiles in order to determine the type of wind
structure variations that may produce the observed variability. In Section
2 we describe the observations; section 3 contains a description of the N V
variability; section 4 describes the line-fitting technique; section 5 contains a
discussion; and section 6 the conclusions.
2. OBSERVATIONS
The new observations were carried out during three epochs in 1999, 2005
and 2009 (hereafter referred to as OGH I, OGH II and OGH III, respectively),
with the 2.1 m telescope of the Observatorio Astronomico Guillermo Haro
(OGH), using a Boller & Chivens spectrograph, with a 830 grooves mm−1
4Suggesting it is a “runaway” system as a consequence of the supernova “kick”.
HD 50896 WIND STRUCTURE 3
grating in the second order, and a slit aperture of 250 µm. A SCHOT BG18
blocking filter was placed at the slit entrance, thus removing light at λ <
4000 A . For the first and second epochs, we used a CCD with a 1024× 1024
Tek chip and for the third epoch a CCD with 1300 × 1300 BestArray chip.
The reciprocal dispersion for the first and second epochs was 0.31 A/pix,
and the spectral window was λλ4463-4778 A, while for the third epoch, the
corresponding parameters were 0.26 A/pix, and λλ4470-4810 A.
Data reduction was performed using standard procedures in the Image Re-
duction and Analysis Facility (IRAF) version 2.14.1 package5, which included
bias subtraction, flat field correction, cosmic ray deletion, and wavelength
calibration. The wavelength calibration was performed using a He-Ar com-
parison lamp, yielding an uncertainty of 0.34 A in wavelength measurements
for the OGH II and OGH III epochs. For the OGH I epoch, due to a problem
with the comparison lamp spectrum, the wavelength calibration is deficient,
leading to uncertainties twice as large. Individual spectra have S/N∼110 at
the continuum level, with the average spectra per night having S/N∼√
n110,
where n=3,...,35 is the number of spectra averaged. The individual spec-
tra were normalized to the continuum level after interpolating a third-order
Lengendre polynomial function to line-free spectral regions.
One of the noteworthy features of these observations is the fact that each
set was obtained over seven or eight consecutive nights, thus covering two
contiguous 3.76-day cycles. On each night, between 3 and 35 spectra were
obtained within time intervals ranging from one to six hours. The three sets
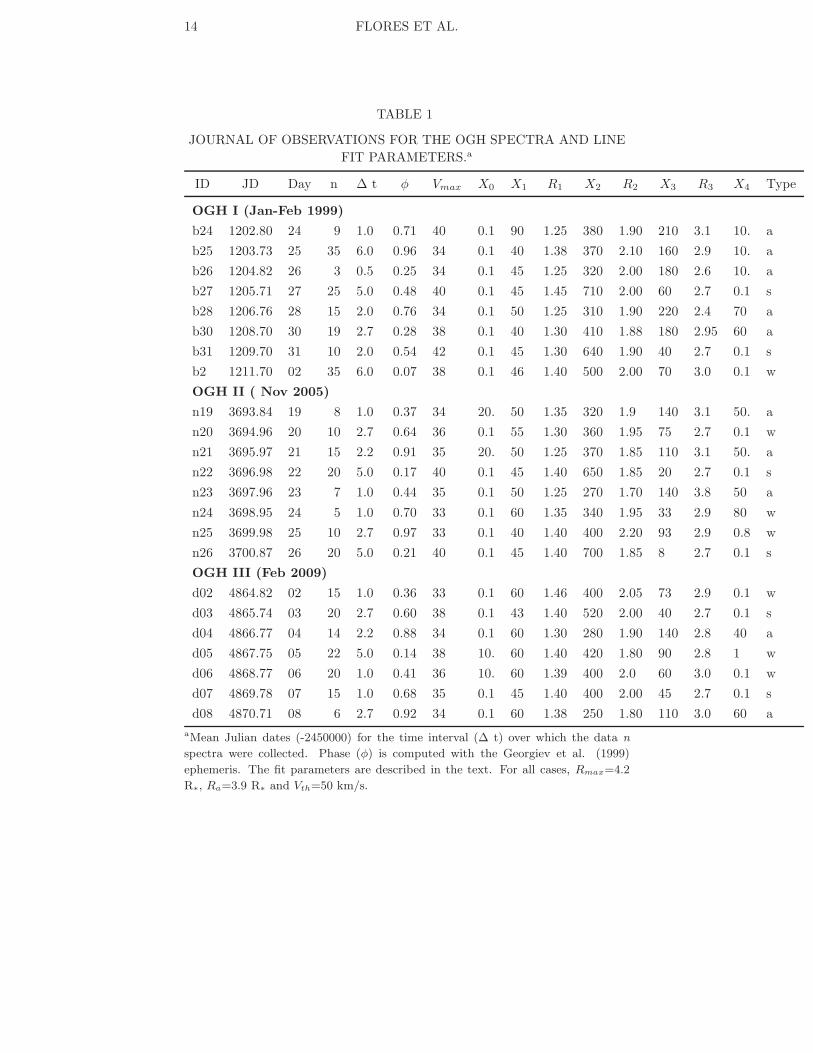
of data are comprised of 151 spectra. Table 1 contains the journal of observa-
tions. Column 1 lists the identification number of the spectrum, column 2 the
mean Julian Date -2445000, column 3 the date of observations, column 4 the
number of spectra obtained over the night, column 5 the timespan (in hours)
over which these spectra were collected and column 6 the phase computed
with P=3.7650 d and T0=2443199.53 from Georgiev et al. (1999).
The above data sets were complemented with a set of nightly average
spectra obtained in the Observatorio Astronomico Nacional San Pedro Martir
(SPM) during 1991 January (Piceno 2003; Vaquez 2003; Morel et al. 1998;
Georgiev et al. 1999). The date of observation, number of spectra averaged,
nightly timespan covered by these spectra are listed in Table 2. The SPM
data set covers 13 consecutive nights. Only one spectrum was obtained on
nights “a” and “d” due to bad weather; the first of these is a useful spectrum
having S/N∼100. On night ‘d’ the spectrum has S/N∼35 and was not used
for the analysis presented in this paper. This set provides spectra for three
consecutive cycles in the 3.76 d period.
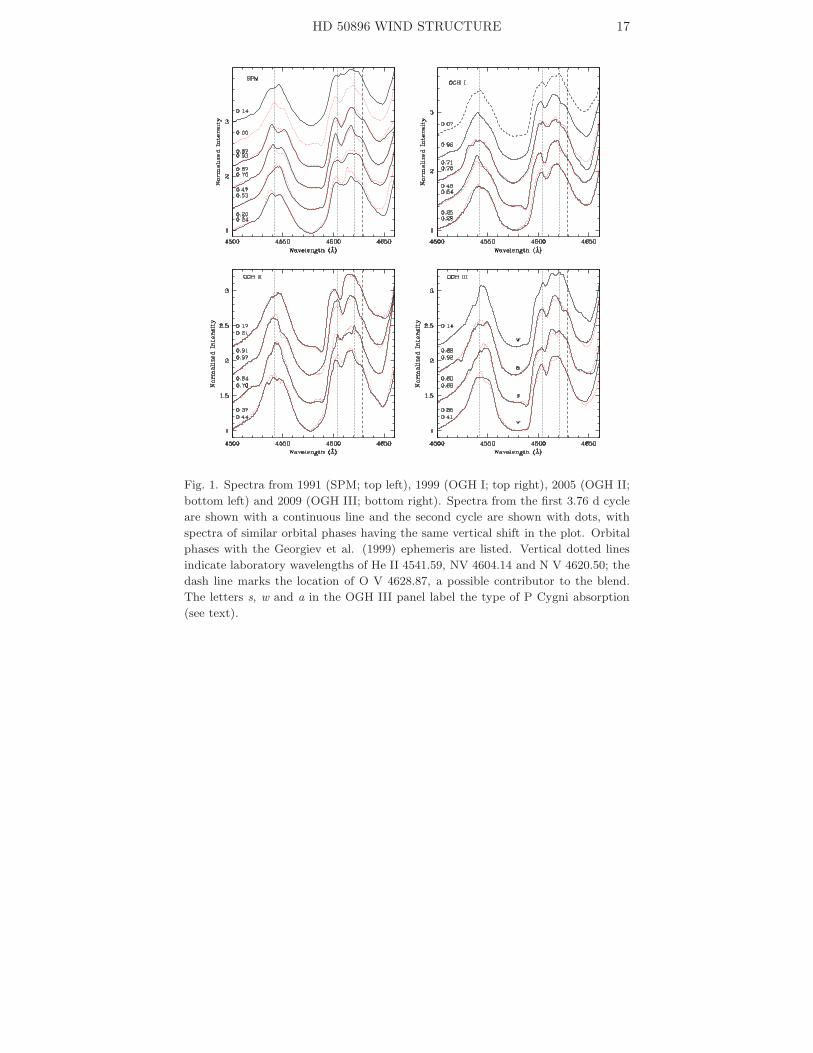
3. N V LINE-PROFILE VARIABILITY
Figure 1 shows the spectral region containing the He II 4542 and the N
V 4604-21 doublet for the four epochs of observations. Spectra are displaced
5IRAF is distributed by the National Optical Astronomy Observatory, which is oper-
ated by the Association of Universities for Research in Astronomy, Inc., under cooperative
agreement with the National Science Foundation.
4 FLORES ET AL.
vertically to allow a clear view of their characteristics at different phases.
Given that the observations of all four epochs were carried out over at least
two 3.765 d cycles, two spectra per epoch at similar phases are generally
available. The spectrum from the second cycle is plotted with dots. Phases
were computed using the Georgiev et al. (1999) ephemeris and are listed.
The variations in the N V 4604-21 doublet can be described primarily in
terms of the occasional presence of a prominent P Cygni absorption compo-
nent that at other times is absent, and an intermediate state in which the
absorption is weak. Although the same type of variability is present in all
epochs, a comparison of the four panels in Figure 1 leads to the conclusion
that a particular profile shape does not always appear in the same 3.76d phase
interval. For example, the P Cygni absorption component is strong at φ ∼0.9–
1.0 in the SPM data, at φ ∼0.5 in the OGH I data; at φ ∼0.2 in the OGH II
data, and φ ∼0.6–0.7 in the OGH III spectra. Hence, the presence of a strong
P Cygni absorption does not correlate with phase for spectra separated in
time by a few years, as are our data. However, on timescalse less than a
couple of weeks, a phase-dependence does exist.
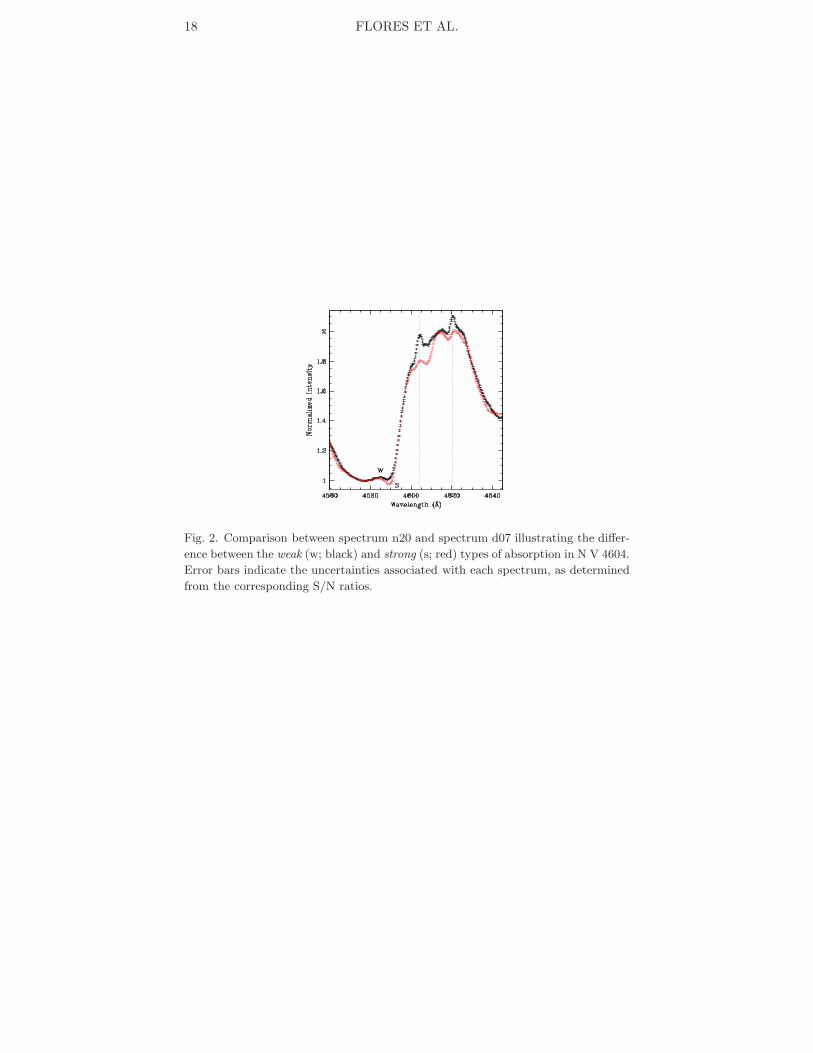
We assign a classification of strong, weak, or absent to the type of line-
profile that is observed. The distinction between the three types of profiles is
most clearly seen at λ 4590 A in Figure 1. The weak profiles have intensities
that are very close to the continuum level, the strong profiles are below the
continuum, and the absent profiles lie significantly above it. The continuum
level lies at intensity level unity, by definition from the spectrum normalization
process. Examples of the strong and the weak type profiles are shown in
Figure 2. In Tables 1 and 2 each spectrum has been characterized with the
letters s, w or a in accordance with this classification. Using this description
for the N V profiles, the day-to-day variability pattern of the four epochs
may be compared. Table 3 illustrates this variability pattern for each epoch
individually (the different rows) and for the entire set by aligning the first
s spectrum of the OGH data sets with the second s of the SPM set in the
same column. Table 3 shows that the four epochs follow the same sequence
that repeats on the 3.76 d period: s → a → w/a → a/w, where a/w and w/a
indicate that either a or w are present in the column.
Figure 1 also shows that part of the variability is due to the appearance
of narrow emission peaks. A clear example of such features at the rest wave-
length of He II 4642, N V 4604 and N V 4621 can be seen in the phase interval
0.64–0.70 of the OGH II spectra (see also Figure 2). Thus, in addition to the
changing P Cyg absorption, the line-profile variability involves the presence
of narrow, superposed emissions. The fact that they are located at the lab-
oratory wavelength indicates that they originate in material that is flowing
perpendicular to our line-of-sight
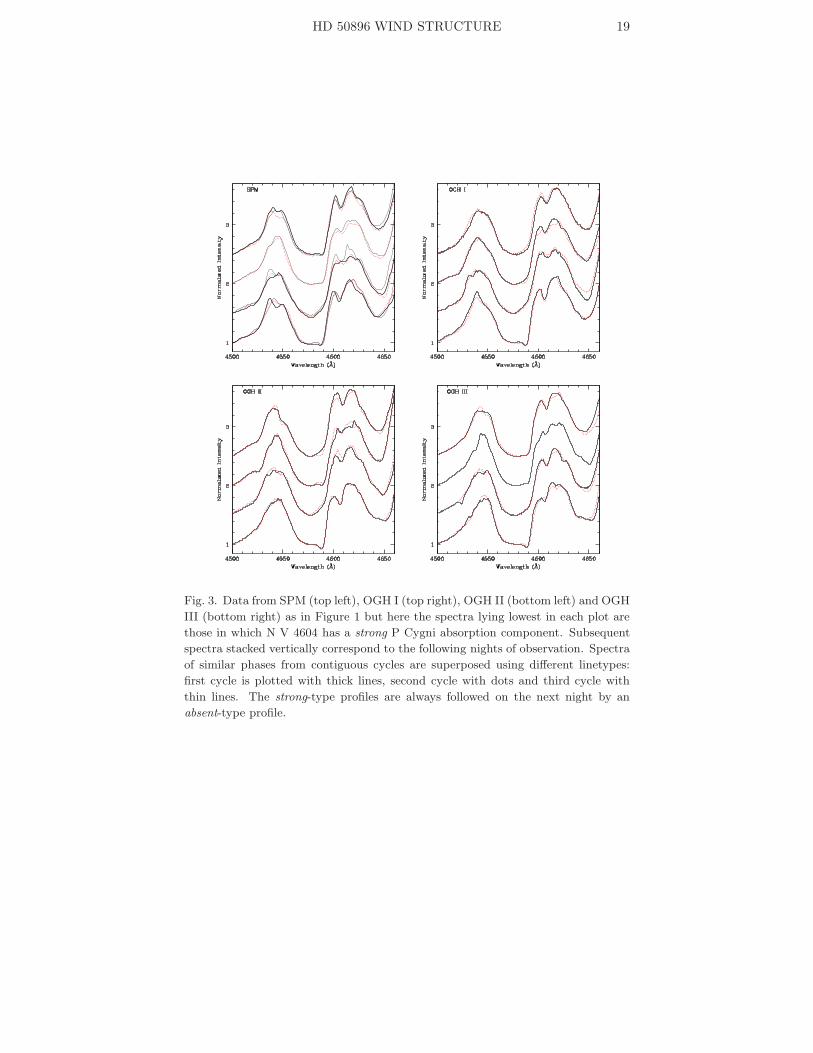
Figure 3 again shows the spectral region containing He II 4542 and the
N V 4604-21 doublet for the four epochs of observations. In this case, the
first spectrum plotted from bottom to top is the first spectrum in the series
having a strong N V 4604 P Cygni absorption component. In the SPM data
HD 50896 WIND STRUCTURE 5
set, we chose spectrum ‘b’ of the series because on night ‘a’ only 1 spectrum
was obtained.6 The second spectrum from bottom up, plotted with a +0.5
shift in the intensity scale, is the one obtained during the following night
of observation; the third and fourth spectra correspond to the subsequent 2
nights, each with a corresponding additional +0.5 shift in the intensity scale.
The fifth spectrum of the series is overlain with the first, this time with a
dotted line instead of a continuous line; similarly, with the following spectra
of the series. This figure confirms the similarity between the four epochs’ N V
line profile variabiity, but it also shows that small changes in the line shapes
are present for spectra of similar phases separated by a single 3.76 d cycle.
The magnitude of these small changes may be evaluated from ratios of the
spectra, and, for example, the changes seen in the OGH II spectra at phases
0.91 and 0.97 at 4585–4610 A region lie in the range ∼5–8 %. Given that
S/N∼110n1/2 in these spectra and that each of the spectra is the average of
n >5 individual exposures, most of these changes are well above what would
be expected from random fluctuations.
4. LINE FITTING PROCEDURE
The periodic line profile variations can be interpreted within three general
scenarios. The first is one in which the intrinsic wind structure of the WR
star changes over the 3.76 d period; in the second scenario, it is anisotropic,
for example, having quadrants with different velocity gradients or ionization
fractions. In the third scenario, the inner portions of the wind have a station-
ary structure, but the outer regions do not, either because of some intrinsic
instability or because of the perturbation from a companion. In this paper we
focus on the first interpretation because it is the one that requires the smallest
number of assumptions.
The line-profiles were modeled using the radiation transfer code described
by Auer & Koenigsberger (1994). This is a simple code which computes
the line profile produced in a wind having either a linear or a β-velocity
law and an opacity distribution with arbitrary characteristics. The algorithm
assumes spherical symmetry and uses the Sobolev approximation only in those
portions of the wind where the approximation is valid. Where the Sobolev
approximation breaks down (i.e., where the wind velocity gradient is small
compared to the local Doppler velocities) it computes the radiative transfer
precisely. A description of the input parameters is given in Table 5. The line
is assumed to arise in a region whose maximum extent is Rmax. In the linear
approximation, Ra is the distance over which the velocity increases; and Ri,
with i=1, 2, ...,n are the radii of regions within the wind having different
opacities. All distances are given in units of the stellar radius, R∗, which is
the hydrostatic radius. The opacity in the different regions is parameterized
with the opacity factor, X , which is a nondimensional parameter that enters
into the line-profile calculation through the optical depth, τ , defined as
6We do note, however, that spectrum ‘a’ has an s-type profile which apparently breaks
the pattern described above.
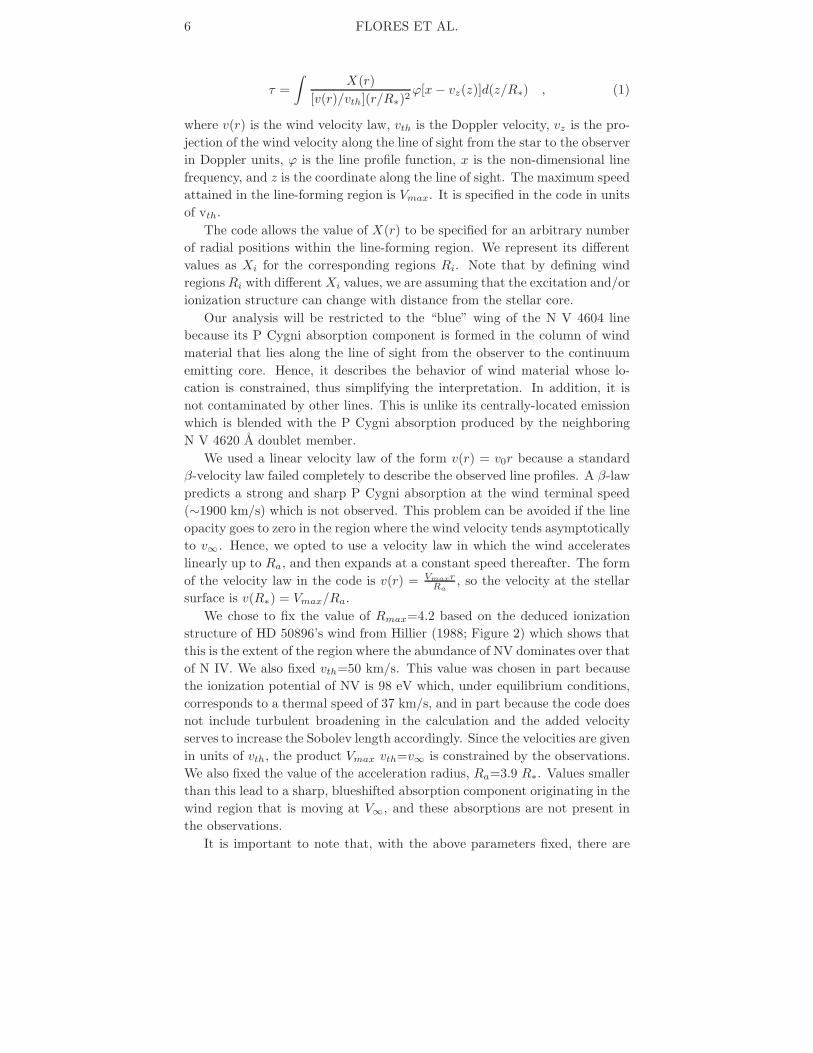
6 FLORES ET AL.
τ =
∫X(r)
[v(r)/vth](r/R∗)2ϕ[x − vz(z)]d(z/R∗) , (1)
where v(r) is the wind velocity law, vth is the Doppler velocity, vz is the pro-
jection of the wind velocity along the line of sight from the star to the observer
in Doppler units, ϕ is the line profile function, x is the non-dimensional line
frequency, and z is the coordinate along the line of sight. The maximum speed
attained in the line-forming region is Vmax. It is specified in the code in units
of vth.
The code allows the value of X(r) to be specified for an arbitrary number
of radial positions within the line-forming region. We represent its different
values as Xi for the corresponding regions Ri. Note that by defining wind
regions Ri with different Xi values, we are assuming that the excitation and/or
ionization structure can change with distance from the stellar core.
Our analysis will be restricted to the “blue” wing of the N V 4604 line
because its P Cygni absorption component is formed in the column of wind
material that lies along the line of sight from the observer to the continuum
emitting core. Hence, it describes the behavior of wind material whose lo-
cation is constrained, thus simplifying the interpretation. In addition, it is
not contaminated by other lines. This is unlike its centrally-located emission
which is blended with the P Cygni absorption produced by the neighboring
N V 4620 A doublet member.
We used a linear velocity law of the form v(r) = v0r because a standard
β-velocity law failed completely to describe the observed line profiles. A β-law
predicts a strong and sharp P Cygni absorption at the wind terminal speed
(∼1900 km/s) which is not observed. This problem can be avoided if the line
opacity goes to zero in the region where the wind velocity tends asymptotically
to v∞. Hence, we opted to use a velocity law in which the wind accelerates
linearly up to Ra, and then expands at a constant speed thereafter. The form
of the velocity law in the code is v(r) = VmaxrRa
, so the velocity at the stellar
surface is v(R∗) = Vmax/Ra.
We chose to fix the value of Rmax=4.2 based on the deduced ionization
structure of HD 50896’s wind from Hillier (1988; Figure 2) which shows that
this is the extent of the region where the abundance of NV dominates over that
of N IV. We also fixed vth=50 km/s. This value was chosen in part because
the ionization potential of NV is 98 eV which, under equilibrium conditions,
corresponds to a thermal speed of 37 km/s, and in part because the code does
not include turbulent broadening in the calculation and the added velocity
serves to increase the Sobolev length accordingly. Since the velocities are given
in units of vth, the product Vmax vth=v∞ is constrained by the observations.
We also fixed the value of the acceleration radius, Ra=3.9 R∗. Values smaller
than this lead to a sharp, blueshifted absorption component originating in the
wind region that is moving at V∞, and these absorptions are not present in
the observations.
It is important to note that, with the above parameters fixed, there are
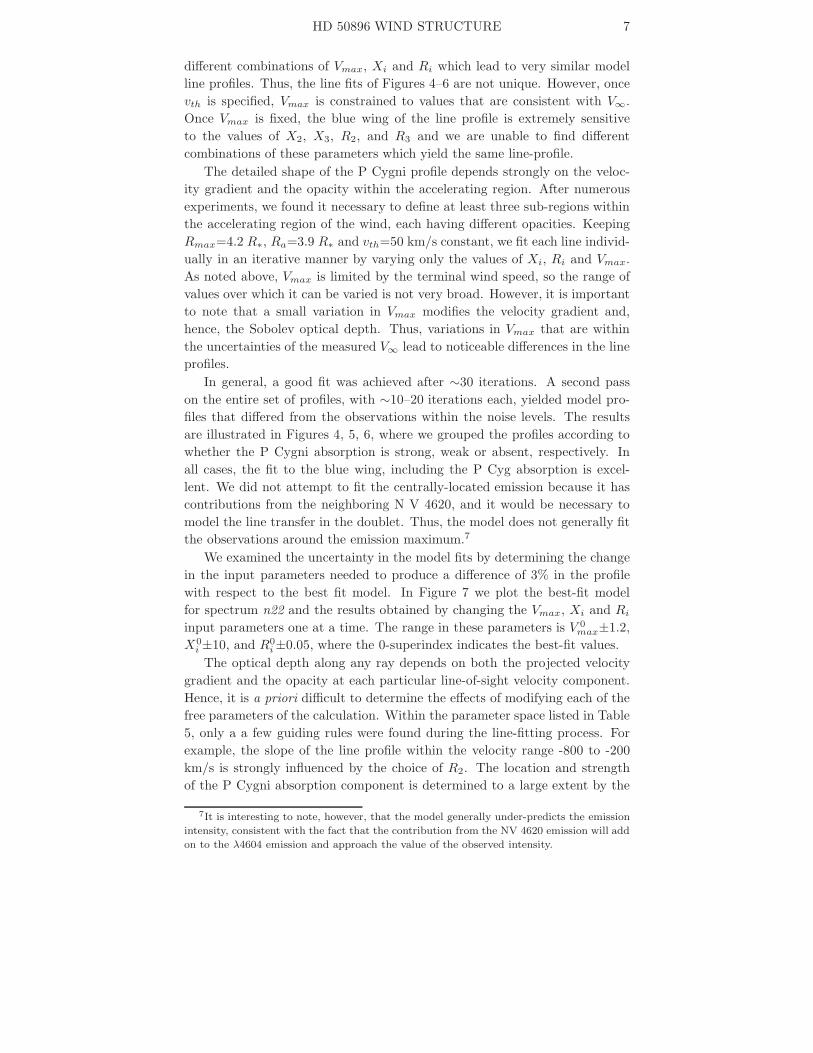
HD 50896 WIND STRUCTURE 7
different combinations of Vmax, Xi and Ri which lead to very similar model
line profiles. Thus, the line fits of Figures 4–6 are not unique. However, once
vth is specified, Vmax is constrained to values that are consistent with V∞.
Once Vmax is fixed, the blue wing of the line profile is extremely sensitive
to the values of X2, X3, R2, and R3 and we are unable to find different
combinations of these parameters which yield the same line-profile.
The detailed shape of the P Cygni profile depends strongly on the veloc-
ity gradient and the opacity within the accelerating region. After numerous
experiments, we found it necessary to define at least three sub-regions within
the accelerating region of the wind, each having different opacities. Keeping
Rmax=4.2 R∗, Ra=3.9 R∗ and vth=50 km/s constant, we fit each line individ-
ually in an iterative manner by varying only the values of Xi, Ri and Vmax.
As noted above, Vmax is limited by the terminal wind speed, so the range of
values over which it can be varied is not very broad. However, it is important
to note that a small variation in Vmax modifies the velocity gradient and,
hence, the Sobolev optical depth. Thus, variations in Vmax that are within
the uncertainties of the measured V∞ lead to noticeable differences in the line
profiles.
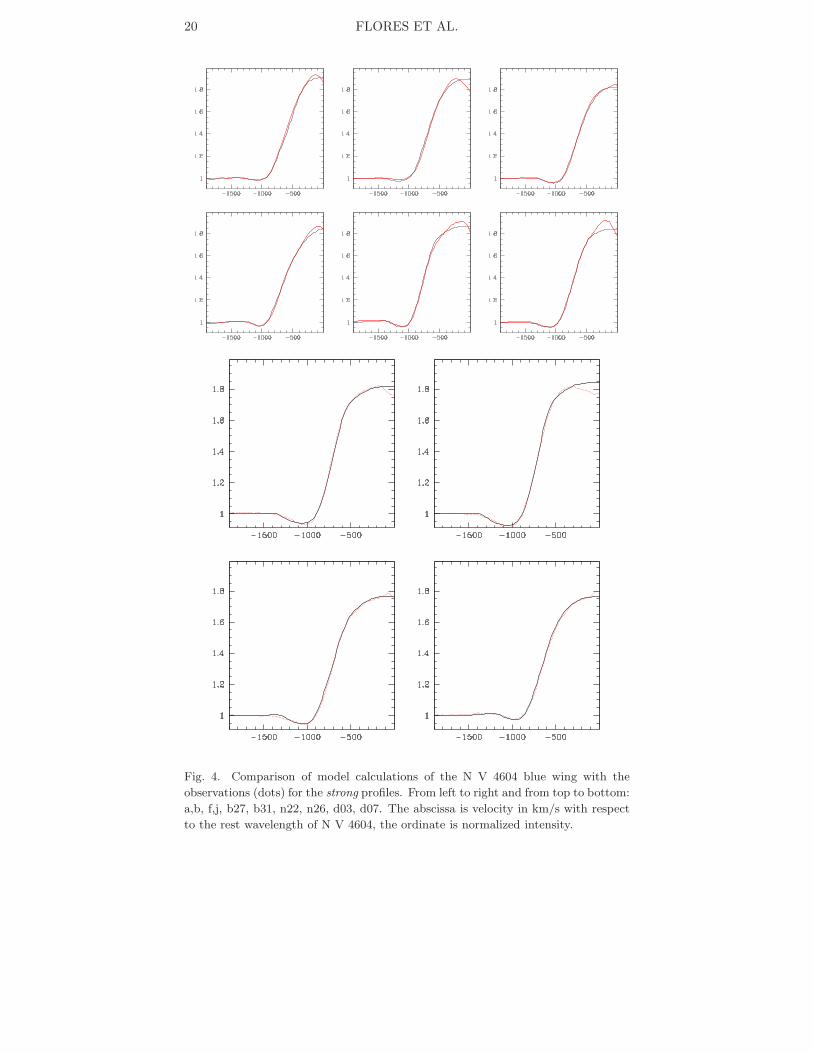
In general, a good fit was achieved after ∼30 iterations. A second pass
on the entire set of profiles, with ∼10–20 iterations each, yielded model pro-
files that differed from the observations within the noise levels. The results
are illustrated in Figures 4, 5, 6, where we grouped the profiles according to
whether the P Cygni absorption is strong, weak or absent, respectively. In
all cases, the fit to the blue wing, including the P Cyg absorption is excel-
lent. We did not attempt to fit the centrally-located emission because it has
contributions from the neighboring N V 4620, and it would be necessary to
model the line transfer in the doublet. Thus, the model does not generally fit
the observations around the emission maximum.7
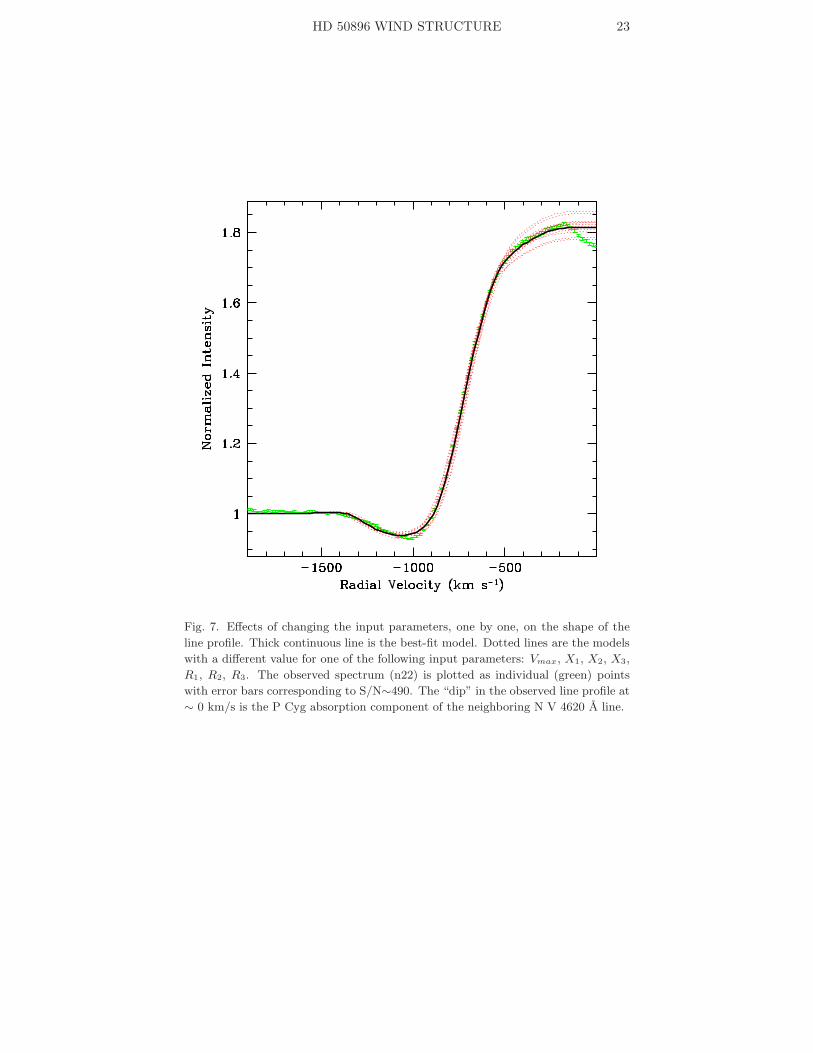
We examined the uncertainty in the model fits by determining the change
in the input parameters needed to produce a difference of 3% in the profile
with respect to the best fit model. In Figure 7 we plot the best-fit model
for spectrum n22 and the results obtained by changing the Vmax, Xi and Ri
input parameters one at a time. The range in these parameters is V 0max±1.2,
X0
i ±10, and R0
i±0.05, where the 0-superindex indicates the best-fit values.
The optical depth along any ray depends on both the projected velocity
gradient and the opacity at each particular line-of-sight velocity component.
Hence, it is a priori difficult to determine the effects of modifying each of the
free parameters of the calculation. Within the parameter space listed in Table
5, only a a few guiding rules were found during the line-fitting process. For
example, the slope of the line profile within the velocity range -800 to -200
km/s is strongly influenced by the choice of R2. The location and strength
of the P Cygni absorption component is determined to a large extent by the
7It is interesting to note, however, that the model generally under-predicts the emission
intensity, consistent with the fact that the contribution from the NV 4620 emission will add
on to the λ4604 emission and approach the value of the observed intensity.
8 FLORES ET AL.
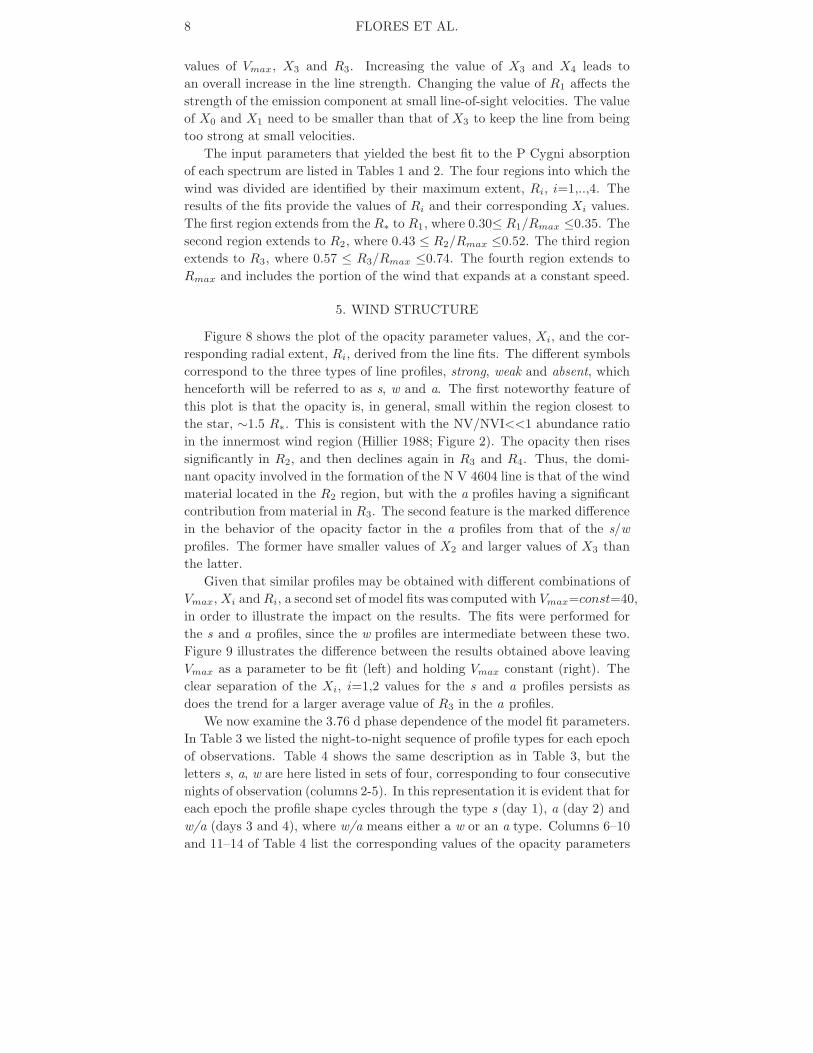
values of Vmax, X3 and R3. Increasing the value of X3 and X4 leads to
an overall increase in the line strength. Changing the value of R1 affects the
strength of the emission component at small line-of-sight velocities. The value
of X0 and X1 need to be smaller than that of X3 to keep the line from being
too strong at small velocities.
The input parameters that yielded the best fit to the P Cygni absorption
of each spectrum are listed in Tables 1 and 2. The four regions into which the
wind was divided are identified by their maximum extent, Ri, i=1,..,4. The
results of the fits provide the values of Ri and their corresponding Xi values.
The first region extends from the R∗ to R1, where 0.30≤ R1/Rmax ≤0.35. The
second region extends to R2, where 0.43 ≤ R2/Rmax ≤0.52. The third region
extends to R3, where 0.57 ≤ R3/Rmax ≤0.74. The fourth region extends to
Rmax and includes the portion of the wind that expands at a constant speed.
5. WIND STRUCTURE
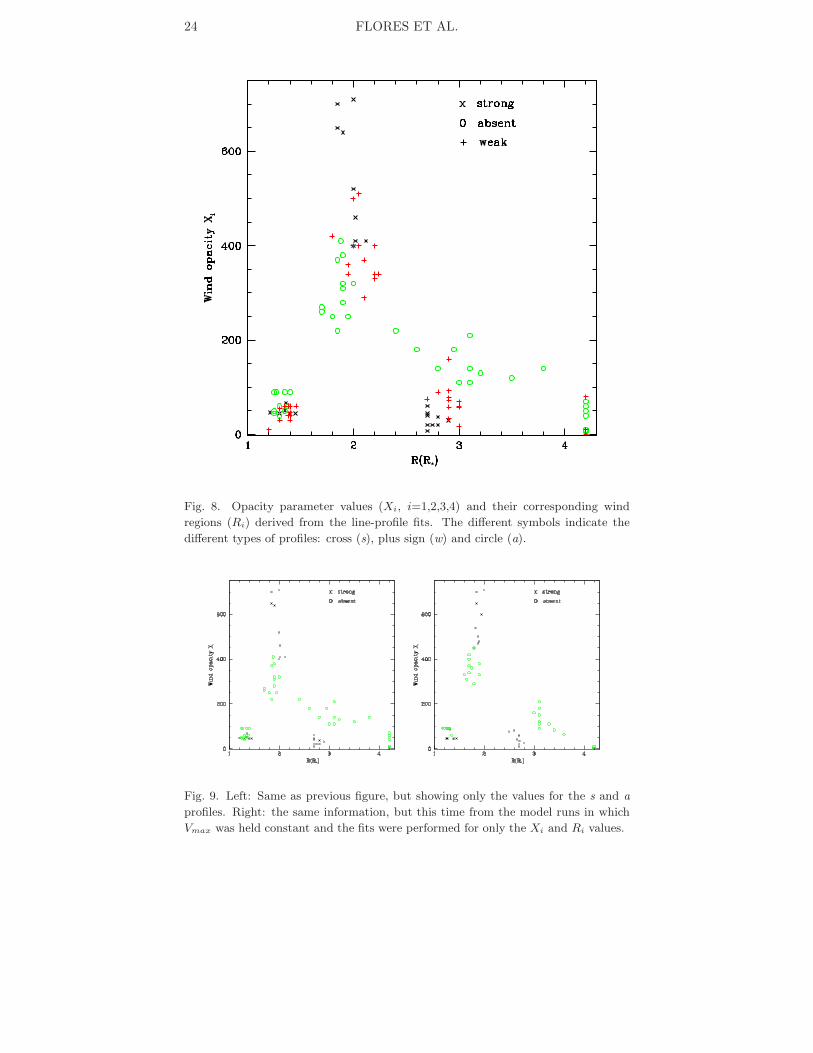
Figure 8 shows the plot of the opacity parameter values, Xi, and the cor-
responding radial extent, Ri, derived from the line fits. The different symbols
correspond to the three types of line profiles, strong, weak and absent, which
henceforth will be referred to as s, w and a. The first noteworthy feature of
this plot is that the opacity is, in general, small within the region closest to
the star, ∼1.5 R∗. This is consistent with the NV/NVI<<1 abundance ratio
in the innermost wind region (Hillier 1988; Figure 2). The opacity then rises
significantly in R2, and then declines again in R3 and R4. Thus, the domi-
nant opacity involved in the formation of the N V 4604 line is that of the wind
material located in the R2 region, but with the a profiles having a significant
contribution from material in R3. The second feature is the marked difference
in the behavior of the opacity factor in the a profiles from that of the s/w
profiles. The former have smaller values of X2 and larger values of X3 than
the latter.
Given that similar profiles may be obtained with different combinations of
Vmax, Xi and Ri, a second set of model fits was computed with Vmax=const=40,
in order to illustrate the impact on the results. The fits were performed for
the s and a profiles, since the w profiles are intermediate between these two.
Figure 9 illustrates the difference between the results obtained above leaving
Vmax as a parameter to be fit (left) and holding Vmax constant (right). The
clear separation of the Xi, i=1,2 values for the s and a profiles persists as
does the trend for a larger average value of R3 in the a profiles.
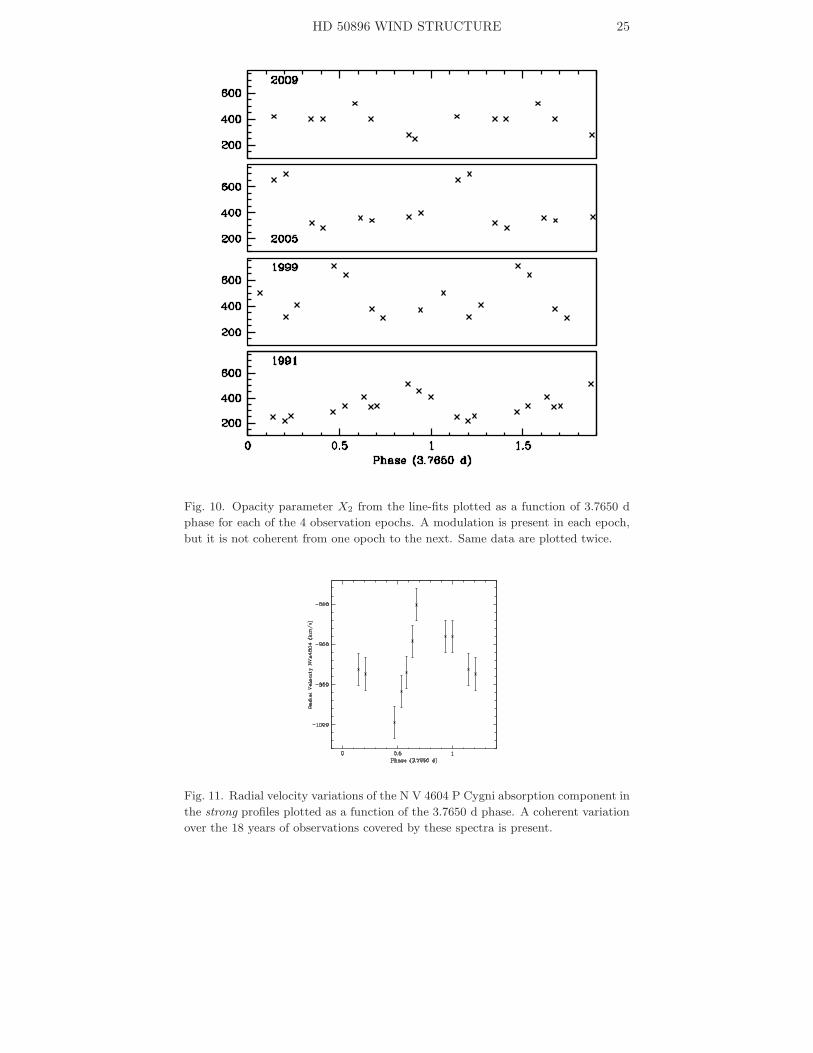
We now examine the 3.76 d phase dependence of the model fit parameters.
In Table 3 we listed the night-to-night sequence of profile types for each epoch
of observations. Table 4 shows the same description as in Table 3, but the
letters s, a, w are here listed in sets of four, corresponding to four consecutive
nights of observation (columns 2-5). In this representation it is evident that for
each epoch the profile shape cycles through the type s (day 1), a (day 2) and
w/a (days 3 and 4), where w/a means either a w or an a type. Columns 6–10
and 11–14 of Table 4 list the corresponding values of the opacity parameters
HD 50896 WIND STRUCTURE 9
X2 and X3, respectively, in the same representation of sets of four nights. For
each epoch, the column corresponding to the s profiles has the largest X2 value
and smallest X3 value. This table clearly shows the 3.76d cyclical pattern for
each epoch, which is also illustrated in Figure 10. Phases were all computed
with the same ephemeris from Georgiev et al. (1999). This figure also shows
that the phases of maximum X2 and the amplitude of the variations differ
from epoch to epoch. There is no significant difference in this figure if we plot
the results obtained from the fits where Vmax was held constant.
Given the above results we are led to conclude that the wind cycles through
different opacity states on the 3.76d period. These different states may be
due to variations in the excitation/ionization structure or in the mass-loss
rate, or a combination of the two. Such variations could be a consequence of
pulsations in the underlying core. Piceno (2003) found periodic variation in
the equivalent width of He II 4541 on timescales of 0.023d, 0.044d and 0.43d
on different nights of observation in the 1991 SPM data set, but not in the
whole set of data, thus leaving an open question on the presence of possible
non-radial pulsations. The precise mechanism by which the pulsations couple
to the wind is still another open question (Townsend 2007).
An intriguing result concerns the radial velocity variations of the P Cygni
absorption component of the s profiles. The centroid of these features was
measured with a Gaussian fit from the location where the absorption meets
the continuum level on the “blue” to the position of the emission component
where the velocity is -500 km/s. In Figure 11 the derived RVs from the nine s-
type profiles obtained over the 18 years of observation are plotted as a function
of the 3.76d phase computed with the Georgiev et al. (1999) ephemeris. The
error bars correspond to the measurement uncertainties, estimated to be ±30
km/s. This figure shows a clear modulation. Thus, although the number of
data points are too few for a strong conclusion to be drawn, this result does
suggest the presence of an underlying “clock” that retains coherence over very
long timescales. It also indicates that it may be necessary to use only the s
profiles to study the source of the “clock”.
6. DISCUSSION AND CONCLUSIONS
In this paper we used the N V 4604 line observed in HD 50896 spectra
obtained over 18 years to explore the possible wind structure variations that
may lead to the observed changes in the shape of this line. We find that the
variability in the P Cygni absorption component can be explained in terms
of changes in the opacity structure of the wind. Specifically, changes in the
relative opacities in regions R2 ∼0.47 Rmax and R3 ∼0.65 Rmax, where Rmax
is the maximum extent of the N V 4604 line-forming region. Both of these
regions lie in the accelerating portion of the wind, according to the linear
velocity law that was used to fit the profiles. The strong P Cygni absorptions
are visible when the opacity in region R2 is larger than in R3. When this ratio
is inverted, the P Cygni absorptions vanish. Evidence of opacity enhancements
10 FLORES ET AL.
have previously been found in other objects, such as the O7.5-star 68 Cyg
(Prinja & Howarth, 1988).
The temporal sequence for the appearance of the profiles is such that a
profile with a strong P Cygni absorption is followed one night later by one in
which the absorption is absent. On the following two nights the profile may
have either a weak or an absent absorption. On only one occasion (epoch
1991) there are strong profiles on two consecutive nights. Since the opacity
depends on the mass-loss rate and on the ionization structure of the wind, its
variation implies changes in these parameters.
The terminal velocity of HD 50896 is estimated at -1900 km/s (Prinja et al.
1990; Howarth & Schmutz 1992). However, St-Louis et al. (1993) report that
the most conspicuous absorption-line variability takes place between about -
1800 and -2800 km/s for the major UV P Cygni lines. This implies that most
of the variability occurs at speeds exceeding the normal maximum outflow
velocity of the wind. The N V 4604 line does not provide information on these
very large speeds, but it does tell us that the instability appears to be present
at lower speeds as well. Given that UV lines arise from atomic transitions
that are more optically thick, they are able to probe lower density regions
of the wind. Such low density regions having high velocities are predicted
to occur as a result of radiative instabilies (Owocki et al. 1988). Thus, the
absent type N V 4604 profiles may occur when the radiative instabilities are
more prevalent. We speculate that the strong type profiles might correspond
to a more stable state of the wind, when fewer shocks are present. St-Louis
et al. (1993) also concluded that the radiative instabilities probably play an
important role in governing the line-profile variations that are observed in the
UV.
One intriguing aspect of these perturbations is that significant changes in
the line-profiles are observed on timescales of ∼1 day and not shorter. St-Louis
et al. (1993) show how the UV P Cygni lines undergo changes on a day-to-day
timescale. This is in contrast with, for example, the opacity enhancements
mentioned above for 68 Cyg, where variations on timescales as short as 1 hr
were observed (Prinja & Howarth 1988). Also relevant to this discussion is the
presence of relatively narrow emission-like features (“sub-peaks”) superposed
on the broad He II emission lines. Variable sub-peak structure in WR stars
is generally associated with the presence of an inhomogeneous stellar wind.
However, Drissen et al. (1989) concluded from their polarimetric data that
the smaller-scale “blob” activity observed in other WRs is quite low in HD
50896. Hence, the variability of HD 50896 seems to originate in what might
be described as organized episodes of unstable and stable states rather than
the random-like inhomogeneities that are present in many other WRs. Also
important to note is that at least one other WN-type star, WR1 (HD 4004)
displays variability that is similar to that of HD 50896 (Flores et al. 2007),
so HD 50896 is not unique (see, also, St-Louis et al. (2009) for a discus-
sion of varibility in several other WR stars). Also, in the WN5 binary V444
Cygni, the N V 4603-21 doublet undergoes phase-dependent variations quali-
HD 50896 WIND STRUCTURE 11
tatively similar to those of HD 50896. Specifically, the P Cygni absorptions are
deepest during one orbital phase interval (primary eclipse), becoming weaker
in the neighborhood of secondary minimum, and disappearing completely at
secondary eclipse (Munch 1950). This suggests that the weak P Cygni absorp-
tions are indicative of a perturbed wind structure8 which, in the case of V444
Cyg, probably results from a combination of irradiation and surface distortion
due to tidal effects. In the case of HD 50896, the profiles with an absent P
Cygni absorption are more prevalent than in V444 Cyg, indicating that the
perturbation causing the absorption to vanish occurs more frequently.
The model we have applied to fit the line profiles is one based on the sim-
plest set of assumptions; that is, we assume that the line profile variability
is caused by variations in the wind properties, specifically, the opacity. Be-
cause we fit only the blue wing of the line profile, our conclusion applies,
strictly speaking, primarily to the column of wind that is projected onto
the continuum-emitting core. Hence, we are unable to distinguish between
a cyclical (in time) variation of the entire wind structure and the variations
that would be caused by different zones of the stellar wind (each with different
properties) entering and leaving our line-of-sight due to stellar rotation.
Matthews et al. (1992) suggested a model consisting of two oppositely-
directed jets, emerging at an angle with respect to the observer’s line-of-sight.
They suggested that as the star rotates, the jets would alternately come into
and out of the line-of-sight thus producing the observed variability. Although
the origin of such jets remains obscure, the general concept of a quadrupolar-
like wind structure may have a physical basis. Koenigsberger et al. (2010)
proposed that the perturbations produced by the tidal forces in the eccentric
binary system HD 5980 could lead to a variable wind structure as the sys-
tem goes from periastron to apastron. Furthermore, since the tidal effects are
stronger in the quadrant facing the companion than in the adjacent quadrants,
the tidal perturbations could, in principle, lead to a quadrupolar-like wind dis-
tribution, independently of the eccentricity of the orbit. Demonstrating that
a quadrupolar wind distribution in a rotating star reproduces the observed
line-profile variations requires the use of a model that allows for departures
from spherical symmetry.
In conclusion, we find that the N V 4604 line-profile variability may be
understood in terms of a variable wind structure which involves changes in the
NV opacity. The mechanism causing this variability remains to be determined.
7. ACKNOWLEDGMENTS
GK acknowledges support from PAPIIT/UNAM grant and computing
support from Ulises Amaya. AF acknowledges the sabbatical stay in the
INAOE and support from CONACYT under the target financied project
121166 ”Spectroscopy Variations of Wolf-Rayet Stars”, and by the UNACAR
grant 1320.
8The absent absorptions are attributed to the physical eclipse by Marchenko et al.
(1997).
12 FLORES ET AL.
REFERENCES
Auer, L.H. & Koenigsberger, G. 1994, ApJ, 436, 859
Cherepashchuk, A. 1981, MNRAS, 194, 755
Crowther, P. 2007, ARA&A, 45, 177
Drissen, L., Robert, C., Lamontagne, R., Moffat, A.F.J., St-Louis, N., van Weeren,
N. & van Genderen, A.M. 1989, ApJ, 343, 426.
Firmani, C., Koenigsberger, G., Bisiacchi, G. F., Ruiz, E., & Solar, A. 1979, Mass
Loss and Evolution of O-Type Stars, 83, 421
Firmani, C., Koenigsberger, G., Bisiacchi, G.F., Moffat, A.F.J. & Isserstedt, J. 1980,
ApJ, 239, 607.
Flores, A., Koenigsberger, G., Cardona, O., & de la Cruz, L. 2007, AJ, 133, 2859
Georgiev, L. N., Koenigsberger, G., Ivanov, M. M., St.-Louis, N., & Cardona, O.
1999, A&A, 347, 583
van den Heuvel E.P.J. 1976, in: Eggleton P. et al. (eds) Structure and Evolution of
Close Binary Systems, IAU Symp. 73, Reidel, Dordrecht, p. 35.
van der Hucht, K.A., Conti, P.S., Lundstrom, I. & Stenholm, B. 1981, SSRv, 28,
227.
Hillier, D.J. 1988, ApJ, 327, 822
Howarth, I.D. & Schmutz, W. 1992, a, 261, 503
Koenigsberger, G., Moreno, E. & Harrington, D. M. 2010, ASPC, 425, 209
Lamontagne, R., Moffat, A. F. J., & Lamarre, A. 1986, AJ, 91, 925
Marchenko, S.V., Moffat, A.F.J., & Koenigsberger, G. 1997, ApJ, 485, 826.
Matthews, J. M., St.-Louis, N., Moffat, A. F. J., Drissen, L., Koenigsberger, G.,
Cardona, O., & Niemela, V. S. 1992, Nonisotropic and Variable Outflows from
Stars, 22, 130
McLean, I. S. 1980, ApJ, 236, L149
Morel, T., et al. 1999, ApJ, 518, 428
Morel, T., St-Louis, N., Moffat, A. F. J., Cardona, O., Koenigsberger, G., & Hill,
G. M. 1998, ApJ, 498, 413
Morel, T., St-Louis, N., & Marchenko, S. V. 1997, ApJ, 482, 470
Morel, T., St-Louis, N., & Marchenko, S. V. 1996, Liege International Astrophysical
Colloquia, 33, 271
Munch, G. 1950, ApJ, 112, 266.
Owocki, S.P., Castor, J.I., Rybicki, G.B. 1988, ApJ, 335, 914.
Piceno, A. 2003, M. Sc. Thesis, Instituto Nacional de Astrofısica, Optica y
Electronica.
Prinja, R.K. & Howarth, I.D., MNRAS, 233, 123
Prinja, R.K., Barlow, M.J., Howarth, I.D. 1990, ApJ, 361, 607
Skinner, S. L., Itoh, M., Nagase, F. 1998, NewA, 3, 37.
Skinner, S. L., Zhekov, S.A., Gudel, M. & Schmutz, W. 2002, ApJ, 579, 764.
Stevens, I.R. & Willis, A.J. 1988, MNRAS,234, 783
St-Louis, N. et al. 1993, ApJ, 267, 447.
St-Louis, N., Chene, A.-N., Schnurr, O., & Nicol, M.-H. 2009, ApJ, 698, 1951
Townsend, R. 2007, Unsolved Problems in Stellar Physics: A Conference in Honor
of Douglas Gough, 948, 345
Vazquez, G.. 2003, M.Sc. Thesis, Instituto Nacional de Astrofısica, Optica y
Electronica.
HD 50896 WIND STRUCTURE 13
A. Flores and Lelio de la Cruz: Universidad Autonoma del Carmen. Facultad
de Ingenierıa. Calle 56 No 4. Cd del Carmen, Campeche., Mexico. e-mail:
[email protected], ([email protected]).
G. Koenigsberger: Instituto de Ciencias Fısicas, Universidad Nacional
Autonoma de Mexico, Ave. Universidad S/N, Col. Chamilpa, Cuernavaca,
62210, Mexico ([email protected]).
O. Cardona: Instituto Nacional de Astrofısica Optica y Electronica,
Luis Enrique Erro No 1 Tonantzintla, Puebla, Mexico. e-mail: ocar-
14 FLORES ET AL.
TABLE 1
JOURNAL OF OBSERVATIONS FOR THE OGH SPECTRA AND LINE
FIT PARAMETERS.a
ID JD Day n ∆ t φ Vmax X0 X1 R1 X2 R2 X3 R3 X4 Type
OGH I (Jan-Feb 1999)
b24 1202.80 24 9 1.0 0.71 40 0.1 90 1.25 380 1.90 210 3.1 10. a
b25 1203.73 25 35 6.0 0.96 34 0.1 40 1.38 370 2.10 160 2.9 10. a
b26 1204.82 26 3 0.5 0.25 34 0.1 45 1.25 320 2.00 180 2.6 10. a
b27 1205.71 27 25 5.0 0.48 40 0.1 45 1.45 710 2.00 60 2.7 0.1 s
b28 1206.76 28 15 2.0 0.76 34 0.1 50 1.25 310 1.90 220 2.4 70 a
b30 1208.70 30 19 2.7 0.28 38 0.1 40 1.30 410 1.88 180 2.95 60 a
b31 1209.70 31 10 2.0 0.54 42 0.1 45 1.30 640 1.90 40 2.7 0.1 s
b2 1211.70 02 35 6.0 0.07 38 0.1 46 1.40 500 2.00 70 3.0 0.1 w
OGH II ( Nov 2005)
n19 3693.84 19 8 1.0 0.37 34 20. 50 1.35 320 1.9 140 3.1 50. a
n20 3694.96 20 10 2.7 0.64 36 0.1 55 1.30 360 1.95 75 2.7 0.1 w
n21 3695.97 21 15 2.2 0.91 35 20. 50 1.25 370 1.85 110 3.1 50. a
n22 3696.98 22 20 5.0 0.17 40 0.1 45 1.40 650 1.85 20 2.7 0.1 s
n23 3697.96 23 7 1.0 0.44 35 0.1 50 1.25 270 1.70 140 3.8 50 a
n24 3698.95 24 5 1.0 0.70 33 0.1 60 1.35 340 1.95 33 2.9 80 w
n25 3699.98 25 10 2.7 0.97 33 0.1 40 1.40 400 2.20 93 2.9 0.8 w
n26 3700.87 26 20 5.0 0.21 40 0.1 45 1.40 700 1.85 8 2.7 0.1 s
OGH III (Feb 2009)
d02 4864.82 02 15 1.0 0.36 33 0.1 60 1.46 400 2.05 73 2.9 0.1 w
d03 4865.74 03 20 2.7 0.60 38 0.1 43 1.40 520 2.00 40 2.7 0.1 s
d04 4866.77 04 14 2.2 0.88 34 0.1 60 1.30 280 1.90 140 2.8 40 a
d05 4867.75 05 22 5.0 0.14 38 10. 60 1.40 420 1.80 90 2.8 1 w
d06 4868.77 06 20 1.0 0.41 36 10. 60 1.39 400 2.0 60 3.0 0.1 w
d07 4869.78 07 15 1.0 0.68 35 0.1 45 1.40 400 2.00 45 2.7 0.1 s
d08 4870.71 08 6 2.7 0.92 34 0.1 60 1.38 250 1.80 110 3.0 60 a
aMean Julian dates (-2450000) for the time interval (∆ t) over which the data n
spectra were collected. Phase (φ) is computed with the Georgiev et al. (1999)
ephemeris. The fit parameters are described in the text. For all cases, Rmax=4.2
R∗, Ra=3.9 R∗ and Vth=50 km/s.
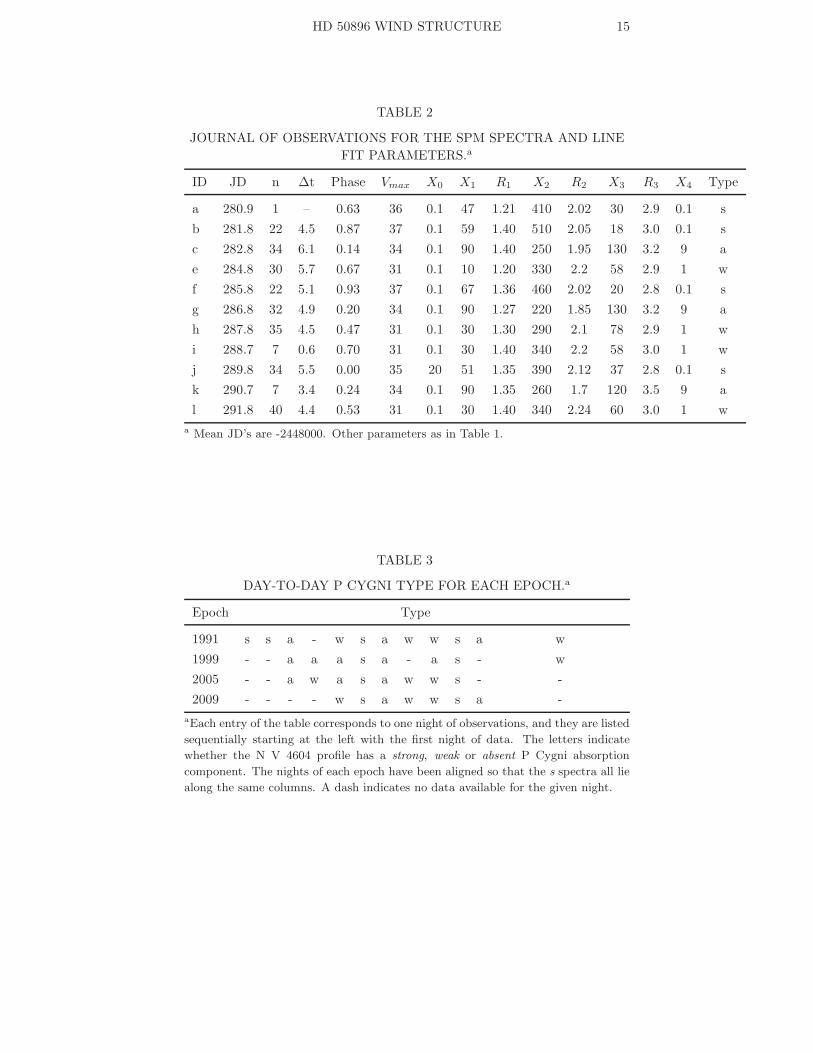
HD 50896 WIND STRUCTURE 15
TABLE 2
JOURNAL OF OBSERVATIONS FOR THE SPM SPECTRA AND LINE
FIT PARAMETERS.a
ID JD n ∆t Phase Vmax X0 X1 R1 X2 R2 X3 R3 X4 Type
a 280.9 1 – 0.63 36 0.1 47 1.21 410 2.02 30 2.9 0.1 s
b 281.8 22 4.5 0.87 37 0.1 59 1.40 510 2.05 18 3.0 0.1 s
c 282.8 34 6.1 0.14 34 0.1 90 1.40 250 1.95 130 3.2 9 a
e 284.8 30 5.7 0.67 31 0.1 10 1.20 330 2.2 58 2.9 1 w
f 285.8 22 5.1 0.93 37 0.1 67 1.36 460 2.02 20 2.8 0.1 s
g 286.8 32 4.9 0.20 34 0.1 90 1.27 220 1.85 130 3.2 9 a
h 287.8 35 4.5 0.47 31 0.1 30 1.30 290 2.1 78 2.9 1 w
i 288.7 7 0.6 0.70 31 0.1 30 1.40 340 2.2 58 3.0 1 w
j 289.8 34 5.5 0.00 35 20 51 1.35 390 2.12 37 2.8 0.1 s
k 290.7 7 3.4 0.24 34 0.1 90 1.35 260 1.7 120 3.5 9 a
l 291.8 40 4.4 0.53 31 0.1 30 1.40 340 2.24 60 3.0 1 w
a Mean JD’s are -2448000. Other parameters as in Table 1.
TABLE 3
DAY-TO-DAY P CYGNI TYPE FOR EACH EPOCH.a
Epoch Type
1991 s s a - w s a w w s a w
1999 - - a a a s a - a s - w
2005 - - a w a s a w w s - -
2009 - - - - w s a w w s a -
aEach entry of the table corresponds to one night of observations, and they are listed
sequentially starting at the left with the first night of data. The letters indicate
whether the N V 4604 profile has a strong, weak or absent P Cygni absorption
component. The nights of each epoch have been aligned so that the s spectra all lie
along the same columns. A dash indicates no data available for the given night.
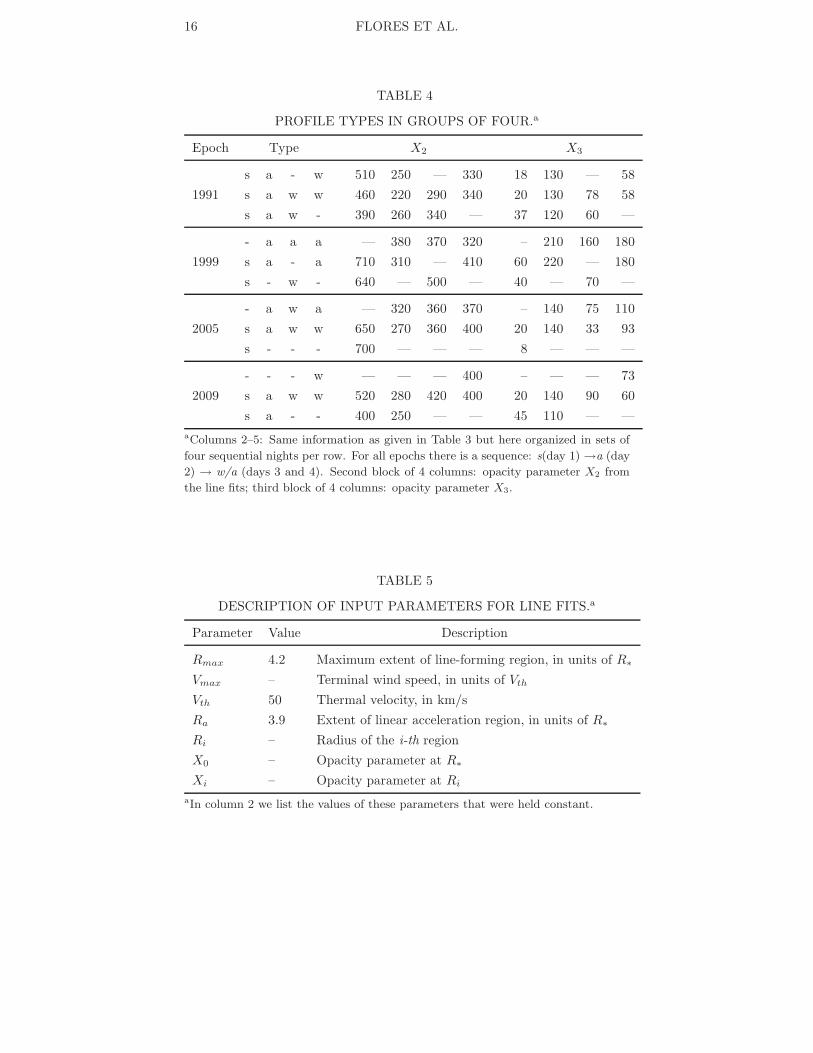
16 FLORES ET AL.
TABLE 4
PROFILE TYPES IN GROUPS OF FOUR.a
Epoch Type X2 X3
s a - w 510 250 — 330 18 130 — 58
1991 s a w w 460 220 290 340 20 130 78 58
s a w - 390 260 340 — 37 120 60 —
- a a a — 380 370 320 – 210 160 180
1999 s a - a 710 310 — 410 60 220 — 180
s - w - 640 — 500 — 40 — 70 —
- a w a — 320 360 370 – 140 75 110
2005 s a w w 650 270 360 400 20 140 33 93
s - - - 700 — — — 8 — — —
- - - w — — — 400 – — — 73
2009 s a w w 520 280 420 400 20 140 90 60
s a - - 400 250 — — 45 110 — —
aColumns 2–5: Same information as given in Table 3 but here organized in sets of
four sequential nights per row. For all epochs there is a sequence: s(day 1) →a (day
2) → w/a (days 3 and 4). Second block of 4 columns: opacity parameter X2 from
the line fits; third block of 4 columns: opacity parameter X3.
TABLE 5
DESCRIPTION OF INPUT PARAMETERS FOR LINE FITS.a
Parameter Value Description
Rmax 4.2 Maximum extent of line-forming region, in units of R∗
Vmax – Terminal wind speed, in units of Vth
Vth 50 Thermal velocity, in km/s
Ra 3.9 Extent of linear acceleration region, in units of R∗
Ri – Radius of the i-th region
X0 – Opacity parameter at R∗
Xi – Opacity parameter at Ri
aIn column 2 we list the values of these parameters that were held constant.
HD 50896 WIND STRUCTURE 17
Fig. 1. Spectra from 1991 (SPM; top left), 1999 (OGH I; top right), 2005 (OGH II;
bottom left) and 2009 (OGH III; bottom right). Spectra from the first 3.76 d cycle
are shown with a continuous line and the second cycle are shown with dots, with
spectra of similar orbital phases having the same vertical shift in the plot. Orbital
phases with the Georgiev et al. (1999) ephemeris are listed. Vertical dotted lines
indicate laboratory wavelengths of He II 4541.59, NV 4604.14 and N V 4620.50; the
dash line marks the location of O V 4628.87, a possible contributor to the blend.
The letters s, w and a in the OGH III panel label the type of P Cygni absorption
(see text).
18 FLORES ET AL.
Fig. 2. Comparison between spectrum n20 and spectrum d07 illustrating the differ-
ence between the weak (w; black) and strong (s; red) types of absorption in N V 4604.
Error bars indicate the uncertainties associated with each spectrum, as determined
from the corresponding S/N ratios.
HD 50896 WIND STRUCTURE 19
Fig. 3. Data from SPM (top left), OGH I (top right), OGH II (bottom left) and OGH
III (bottom right) as in Figure 1 but here the spectra lying lowest in each plot are
those in which N V 4604 has a strong P Cygni absorption component. Subsequent
spectra stacked vertically correspond to the following nights of observation. Spectra
of similar phases from contiguous cycles are superposed using different linetypes:
first cycle is plotted with thick lines, second cycle with dots and third cycle with
thin lines. The strong-type profiles are always followed on the next night by an
absent-type profile.
20 FLORES ET AL.
Fig. 4. Comparison of model calculations of the N V 4604 blue wing with the
observations (dots) for the strong profiles. From left to right and from top to bottom:
a,b, f,j, b27, b31, n22, n26, d03, d07. The abscissa is velocity in km/s with respect
to the rest wavelength of N V 4604, the ordinate is normalized intensity.
HD 50896 WIND STRUCTURE 21
Fig. 5. Same as previous figure for the weak profiles. From left to right and top to
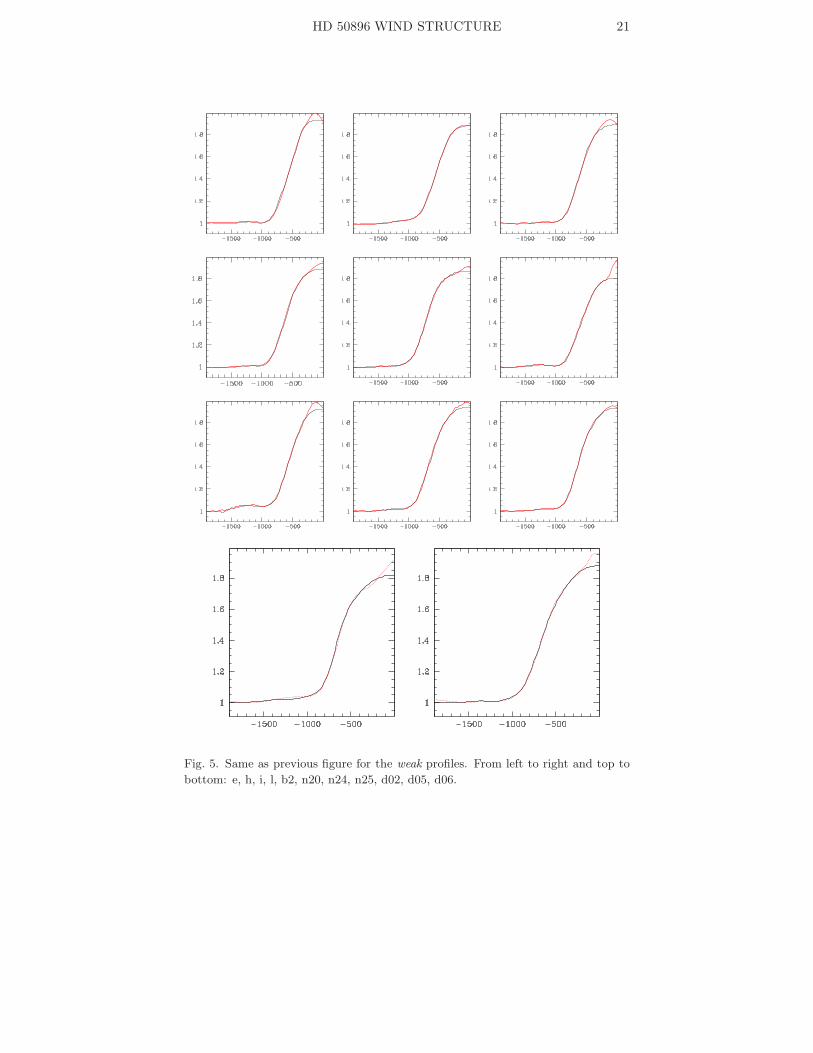
bottom: e, h, i, l, b2, n20, n24, n25, d02, d05, d06.
22 FLORES ET AL.
Fig. 6. Same as the previous figure for the absent profiles. From left to right and
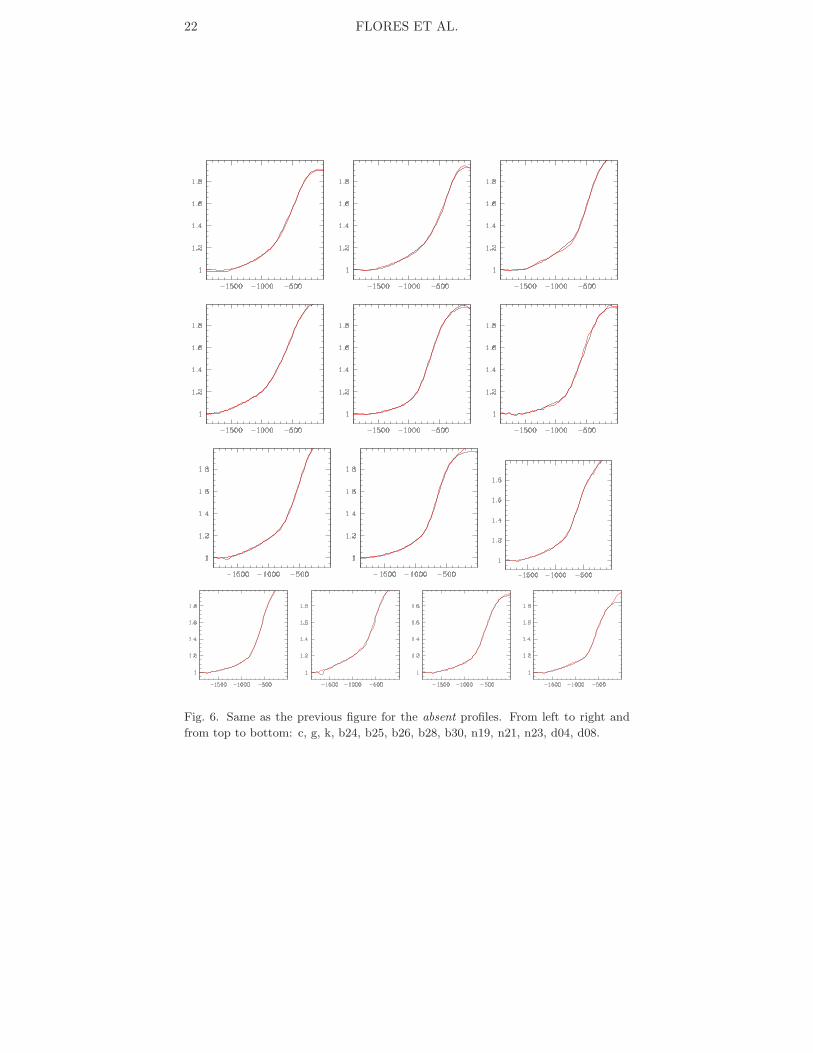
from top to bottom: c, g, k, b24, b25, b26, b28, b30, n19, n21, n23, d04, d08.
HD 50896 WIND STRUCTURE 23
Fig. 7. Effects of changing the input parameters, one by one, on the shape of the
line profile. Thick continuous line is the best-fit model. Dotted lines are the models
with a different value for one of the following input parameters: Vmax, X1, X2, X3,
R1, R2, R3. The observed spectrum (n22) is plotted as individual (green) points
with error bars corresponding to S/N∼490. The “dip” in the observed line profile at
∼ 0 km/s is the P Cyg absorption component of the neighboring N V 4620 A line.
24 FLORES ET AL.
Fig. 8. Opacity parameter values (Xi, i=1,2,3,4) and their corresponding wind
regions (Ri) derived from the line-profile fits. The different symbols indicate the
different types of profiles: cross (s), plus sign (w) and circle (a).
Fig. 9. Left: Same as previous figure, but showing only the values for the s and a
profiles. Right: the same information, but this time from the model runs in which
Vmax was held constant and the fits were performed for only the Xi and Ri values.
HD 50896 WIND STRUCTURE 25
Fig. 10. Opacity parameter X2 from the line-fits plotted as a function of 3.7650 d
phase for each of the 4 observation epochs. A modulation is present in each epoch,
but it is not coherent from one opoch to the next. Same data are plotted twice.
Fig. 11. Radial velocity variations of the N V 4604 P Cygni absorption component in
the strong profiles plotted as a function of the 3.7650 d phase. A coherent variation
over the 18 years of observations covered by these spectra is present.


![arXiv:1708.08149v1 [astro-ph.GA] 27 Aug 2017arXiv:1708.08149v1 [astro-ph.GA] 27 Aug 2017 Molecular and Atomic Clouds toward NGC 2359: Evidence for Isolated Wolf-Rayet Star Formation](https://img.pdfslide.net/doc/110x75/5f3cf5858de9141c275cef12/arxiv170808149v1-astro-phga-27-aug-2017-arxiv170808149v1-astro-phga-27.jpg)


![12 1 2 3 arXiv:1701.07815v1 [astro-ph.SR] 26 Jan 2017 · arXiv:1701.07815v1 [astro-ph.SR] 26 Jan 2017 AModernSearch for Wolf-Rayet Stars in theMagellanic Clouds. ... 11 Jan 2016)](https://img.pdfslide.net/doc/110x75/60a19e99a2f781452b36e12d/12-1-2-3-arxiv170107815v1-astro-phsr-26-jan-2017-arxiv170107815v1-astro-phsr.jpg)