Embed Size (px)
Citation preview
Winding Function Modeling of Synchronous Reluctance
Machines
Seyede Sara Maroufian
A Thesis
In the Department
of
Electrical and Computer Engineering
Presented in Partial Fulfillment of the Requirements
For the Degree of
Doctor of Philosophy (Electrical and Computer Engineering) at
Concordia University
Montreal, Quebec, Canada
August 2018
© Seyede Sara Maroufian, 2018
CONCORDIA UNIVERSITY
SCHOOL OF GRADUATE STUDIES
This is to certify that the thesis prepared
By: Seyede Sara Maroufian
Entitled: Winding Function Modeling of Synchronous Reluctance Machines
and submitted in partial fulfillment of the requirements for the degree of
Doctor of Philosophy (Electrical and Computer Engineering)
complies with the regulations of the University and meets the accepted standards with respect to
originality and quality.
Signed by the final examining committee:
______________________________________________________Chair
Dr. Luis Amador
______________________________________________________External Examiner
Dr. Joseph O. Ojo
______________________________________________________External to program
Dr. Marius Paraschivoiu
______________________________________________________Examiner
Dr. Chunyan Lai
______________________________________________________Examiner
Dr. Luiz. A.C. Lopes
______________________________________________________Thesis Supervisor
Dr. Pragasen Pillay
Approved by: ___________________________________________________
Dr. William E. Lynch, Chair of Department
October 01, 2018
Date of defense ___________________________________________
Dr. Amir Asif, Dean, Gina Cody School of Engineering and Computer Science
III
ABSTRACT
Winding Function Modeling of Synchronous Reluctance Machines
Seyede Sara Maroufian, Ph.D.
Concordia University, 2018
The current electric vehicle market, as well as many other industrial applications, is heavily
focused on the application of permanent magnet (PM) machines and induction machines (IM).
However the limitations of these two types of electric machines reveal the necessity for further
research in the field of electrical machines to substitute the existing types with less expensive,
and more fault tolerant machines. The synchronous reluctance machine (SynRM) is a singly
excited machine with great potential to replace permanent magnet machines and induction
machines in traction, as well as many other industrial applications. The rotor structure is simple
and only made of steel laminations, which makes the manufacturing procedure less expensive
compared to PM machines and IMs. Moreover the absence of rotor windings and a rotor cage
eliminates the rotor copper loss, thus enhancing the efficiency compared to IMs. However, the
use of the SynRM has not yet reached the same maturity level of its counterparts and still faces
problems like low power density, poor power factor, and limited torque-speed envelope,
representing a fertile terrain for research.
The aim of this research is to develop an analytical approach based on the winding function
method for modeling, analysis, and design of SynRMs and PM assisted SynRMs. The proposed
analytical approach is based on the winding configuration of the machine, and the magnetic
characteristics of the rotor topology. It provides insight of the machine’s characteristics, and
can be used to apply design modifications on existing SynRMs to improve the performance of
future designs. The analytical model is later modified for designing a PM assisted SynRM
using AlNiCo magnets, with the aim to improve the power factor and torque density of the
regular SynRM.
The self-excitation phenomenon in synchronous reluctance generators (SynRGs) is also
investigated and the requirements for the assurance of self-excitation are identified. Therefore

IV
in traction applications, and electric vehicles with vehicle to grid (V2G) capability, the
possibility of utilizing the onboard SynRM as a power generation unit for emergency situations
can be considered. The stand-alone SynRG can also be used as a fault tolerant power generation
unit to supply electric power in remote areas.

V
Acknowledgement
My sincere appreciation goes to my supervisor, Prof. Pillay for his help, support, and
guidance through the past 4 years. He has been more than just a supervisor, he has been my
mentor. He gave me the opportunity to pursue my dreams 4 years ago for which I will forever
be grateful.
I appreciate the valuable comments and suggestions from the committee members, specially
Prof. Ojo, and Dr. Lai, who have helped to improve this thesis.
I would like to thank my friends and colleagues in PEER Group; Amit, Rajendra, and Chirag
for helping me during the experiments; Amir, Gabriel, and again Amit for their valuable
friendships; and all the members of the PEER Group for being part of the new family I found
in Canada.
I am thankful to NSERC-Canada, Hydro-Québec, ENCS and School of Graduate Studies,
Concordia University, for their financial support.
Finally I would like to thank my family, for their support, help, and trust in my decisions. My
father has been always my greatest support, and my mother has been my role model as a woman.
I would also like to thank my little brother, Arash, for being the “Best Brother” one could ever ask
for.

VI
To my little brother, Arash
VII
Table of Contents
List of Figures ..................................................................................................................... XI
List of Tables ................................................................................................................... XVI
List of Abbreviations ...................................................................................................... XVII
List of Symbols .............................................................................................................. XVIII
Chapter 1 Introduction ......................................................................................................... 1
1. 1. Potential Applications of Synchronous Reluctance Machines ............................... 1
1. 2. Synchronous Reluctance Machines ........................................................................ 3
1.2.1. Design Variations and Operational Principles .................................................... 3
1. 3. Design Approaches ................................................................................................. 8
1.3.1. Stator Design ....................................................................................................... 8
1.3.2. Rotor Design ....................................................................................................... 8
1.3.3. Problem Statement and Methodology ............................................................... 13
1. 4. Generator Operation of Synchronous Reluctance Machines ................................ 14
1.4.1. Synchronous Reluctance Generators ................................................................ 14
1.4.2. Problem Statement and Methodology ............................................................... 15
1. 5. Objectives ............................................................................................................. 15
1. 6. Contributions ........................................................................................................ 16
1. 7. Organization of this Thesis ................................................................................... 17
Chapter 2 Analytical Modeling of Synchronous Reluctance Machines ............................ 19
2.1. Introduction .............................................................................................................. 19
2.2. Literature Review of the Available Analytical Methods ......................................... 20
2.3. Winding Function Method ....................................................................................... 23
2.3.1. Basic Formulation ............................................................................................. 23
2.3.2. Winding Function of the SynRM ...................................................................... 27
VIII
2.3.3. Air Gap Function of the SynRM ....................................................................... 28
2.3.4. Electromagnetic Torque Calculation ................................................................ 34
2.3.5. Design Variation of the Synchronous Reluctance Machine ............................. 39
2.4. Results and Validation ............................................................................................. 42
2.4.1. Experimental Procedure .................................................................................... 43
2.4.2. FEA Simulation ................................................................................................ 44
2.4.3. Torque-Angle Curves of the Synchronous Reluctance Machine ...................... 45
2.5. Segmented-Pole Synchronous Reluctance Machine Modeling ............................... 47
2.5.1. The Cold Rolled Grain Oriented Steel and Segmented-Pole SynRM .............. 48
2.5.2. The Analytical Model of the Segmented-Pole SynRM .................................... 49
2.5.3. The FEA Model ................................................................................................ 52
2.5.4. Results and Comparison ................................................................................... 53
2.5.5. Modified Design of the Segmented-Pole SynRM ............................................ 56
2.6. Summary of the Chapter .......................................................................................... 59
Chapter 3 Design of a Permanent Magnet Assisted Synchronous Reluctance Machine... 61
3.1. Literature Survey on Permanent Magnet Assisted Synchronous Reluctance Machines
61
3.1.1. Basic Operation ................................................................................................. 61
3.1.2. Design Variations of the Permanent Magnet Assisted SynRM ........................ 62
3.2. The Analytical Model of the Permanent Magnet Assisted SynRM ......................... 65
3.2.1. Rotor Topology ................................................................................................. 66
3.2.2. Permanent Magnet Materials ............................................................................ 67
3.2.3. The Analytical Modeling Procedure of the Permanent Magnet Assisted SynRM
70
3.3. Finite Element Analysis Results and Comparison ................................................... 76
3.3.1. Finite Element Model and Magneto Static Analysis ........................................ 76
IX
3.3.2. The Effect of Magnet Thickness on the Performance of the PM Assisted SynRM
79
3.3.3. Torque-Speed Envelopes, Efficiency Map, and Saliency Ratio Comparison .. 87
3.4. Final Design of the Permanent Magnet Assisted Synchronous Reluctance Machine
90
3.5. The Prototyped PM Assisted SynRM ...................................................................... 91
3.5.1. Static Torque Measurement .............................................................................. 91
3.5.2. d-axis and q-axis Inductance Measurement ...................................................... 93
3.5.3. Dynamic Torque and Power Factor Measurements .......................................... 94
3.6. Summary of the Chapter .......................................................................................... 95
Chapter 4 Stand-Alone Operation of the Synchronous Reluctance Generator ................. 96
4.1. Introduction .............................................................................................................. 96
4.2. Stand-Alone Operation of the Synchronous Reluctance Generator ......................... 98
4.2.1 The Synchronous Reluctance Machine ............................................................. 98
4.3. Self-Excitation Criteria of the Stand-Alone Synchronous Reluctance Generator . 100
4.3.1. The Minimum Residual Flux Requirement .................................................... 101
4.3.2. The Maximum Acceptable Acceleration ........................................................ 107
4.4. Experimental Setup and Result .............................................................................. 112
4.4.1. Experimental Setup ......................................................................................... 113
4.4.2. Experimental Results ...................................................................................... 114
4.4.3. Experimental Study of the Residual Flux and Acceleration Value on the Self-
Excitation Procedure of the SynRG .............................................................................. 116
4.5. Summary of the Chapter ........................................................................................ 121
Chapter 5 Conclusion and Future Work .......................................................................... 123
5.1. Conclusion .............................................................................................................. 123
5.2. Future Work ........................................................................................................... 125

X
References ......................................................................................................................... 126
XI
List of Figures
Fig. 1-1 Rotor design variations of the SynRM; (a) Salient pole rotor; (b) Axially laminated
rotor; (c) Transversally laminated rotor; (d) A schematic lamination of a transversally
laminated rotor .......................................................................................................................... 5
Fig. 1-2 Vector diagram of the SynRM ................................................................................... 6
Fig. 1-3 Single phase equivalent circuit of the SynRM ........................................................... 7
Fig. 1-4 Geometrical parameters of the rotor of a SynRM .................................................... 10
Fig. 2-1. Electrical machine schematic .................................................................................. 23
Fig. 2-2. Per pole winding configuration of the SynRM ....................................................... 27
Fig. 2-3 Winding function of the SynRM .............................................................................. 28
Fig. 2-4 Air gap MMF of the SynRM .................................................................................... 28
Fig. 2-5 ALA rotor and geometrical parameters [27] ............................................................ 29
Fig. 2-6 (a) Rotor and stator laminations of the SynRM, (b) simplified model of the rotor . 30
Fig. 2-7 Modeling the effect of the flux barrier on the air gap magnetic flux ....................... 31
Fig. 2-8 (a) The extra equivalent air gap length of individual flux barriers; (b) the overall air
gap function of the SynRM (c) air gap magnetic flux obtained from FEA and the analytical
model for the three cases of the SynRM rotor, a rotor with three flux barriers, and a solid rotor
................................................................................................................................................. 34
Fig. 2-9 (a) Self-inductance of the machine’s phase, (b). Mutual inductance between two
phases ...................................................................................................................................... 35
Fig. 2-10 Magnetic flux density components in the air gap, (a). Radial component, and (b).
Tangential component ............................................................................................................. 37
Fig. 2-11 Electromagnetic torque calculated by the analytical model compared with FEA . 39
Fig. 2-12 The air gap function of the design variations of the SynRM with different pole arc
to pole pitch ratios; (b) The electromagnetic torque waveform of the design variations with
different pole arc to pole pitch ratios ...................................................................................... 40
Fig. 2-13 The air gap function of the design variations of the SynRM with different flux barrier
widths; (b) The electromagnetic torque waveform comparison ............................................. 41
Fig. 2-14 Torque waveform comparison of FEA and analytical model for a SynRM with 15
winding turns per slot.............................................................................................................. 42
XII
Fig. 2-15 (a) Schematic demonstration of the phase winding connection and the rotor of the
SynRM, (b) Experimental setup ............................................................................................. 43
Fig. 2-16 Magnetic vector potential at 14 A and 37.5 mechanical degrees ........................... 44
Fig. 2-17 FEA, analytical model, and experimental results, (a). 18 A and 10 A, (b). 16 A and
8 A, (c). 14 A and 6 A, (d). 12 A and 4 A .............................................................................. 45
Fig. 2-18 Torque comparison of the three methods, at (a) 20 degrees; (b) 50 degrees; (c) 70
degrees .................................................................................................................................... 46
Fig. 2-19 Relative permeability of CRGO and CRNGO steels ............................................. 48
Fig. 2-20 (a) Stator and rotor laminations of the segmented-pole SynRM; (b) The simulation
model of the segmented-pole SynRM ..................................................................................... 49
Fig. 2-21 The air gap function of the conventional SynRM, and the segmented-pole SynRM
with CRGO steel ..................................................................................................................... 51
Fig. 2-22 (a) The FEA model of the segmented-pole SynRM implemented in MagNet FEA
software; (b) The BH curve of the CRGO steel when the field is parallel to the rolling direction
of the steel (soft axis) and when the field is perpendicular to the rolling direction ................ 52
Fig. 2-23 Torque waveform comparison of the SynRM and the segmented-pole SynRM for
12 A line rms current and load angle of 23 degrees; (a) FEA simulation results; (b) analytical
model results ........................................................................................................................... 53
Fig. 2-24 (a) The torque-angle curves of the regular SynRM and the segmented-pole SynRM
obtained from measurement; (b) FEA, analytical model, and measurement results comparison
................................................................................................................................................. 54
Fig. 2-25 Magnetic flux density distribution (a) segmented-pole SynRM; (b) regular SynRM
................................................................................................................................................. 55
Fig. 2-26 d-axis and q-axis inductances of the regular SynRM and the segmented-pole SynRM
obtained from measurements .................................................................................................. 57
Fig. 2-27 Torque-angle curve of the original SynRM and the original segmented-pole SynRM
................................................................................................................................................. 57
Fig. 2-28 Torque-angle curve of the modified SynRM and the modified segmented-pole
SynRM .................................................................................................................................... 58
Fig. 3-1 PM assisted SynRM with PMs along the q-axis [63]............................................... 62
Fig. 3-2 (a) Vector diagram of the SynRM, (b) Vector diagram of the PM assisted SynRM 63

XIII
Fig. 3-3 (a) IPM with rare-earth magnets, (b) PM assisted SynRM with ferrite magnets [68]
................................................................................................................................................. 64
Fig. 3-4 The proposed schematic topology of the PM assisted SynRM, arrows show the magnet
flux direction ........................................................................................................................... 66
Fig. 3-5 (a) Torque components in PM assisted SynRMs, (a). High PM torque component, (b).
High reluctance torque component ......................................................................................... 67
Fig. 3-6 (a) BH curve of some of the PM materials; (b) BH curve of AlNiCo 9 with different
Pc lines indicating different operating points ......................................................................... 70
Fig. 3-7 The equivalent circuits of a permanent magnet ....................................................... 71
Fig. 3-8 Design variations of the PM assisted SynRM, (a) Magnet length = 36 mm (b) Magnet
length = 20 mm, (c) Magnet length = 23 mm ......................................................................... 72
Fig. 3-9 (a) Air gap function used to model the effect of permanent magnets on the air gap
magnetic flux density; (b) Air gap magnetic flux density for the three magnet lengths shown
in Fig. 3-8 ................................................................................................................................ 73
Fig. 3-10 Torque waveform comparison of Design a, Design b, and Design c ..................... 74
Fig. 3-11 Results of the analytical model for Design a, b, and c (a) PM torque component, (b)
the overall torque .................................................................................................................... 75
Fig. 3-12 The FEA model of Design b .................................................................................. 76
Fig. 3-13 Air gap flux density distribution of the three design variations with different magnet
lengths obtained from FEA; (b) the air gap magnetic flux density comparison of Design b
obtained from FEA and the analytical model ......................................................................... 77
Fig. 3-14 ; (a) Design a; (b) Design b; (c) Design c .............................................................. 79
Fig. 3-15 Torque-angle curves of the PM assisted SynRM design variations for different
magnet thicknesses; (a) Design a; (b) Design b; (c) Design c ................................................ 81
Fig. 3-16 Magnetic flux density distribution in full-load condition ...................................... 82
Fig. 3-17 Magnetic flux density and magnetic field intensity along the magnet length; (a)
Design a no-load; (b) Design a full-load; (c) Design b no-load; (d) Design b full-load; (e)
Design c no-load; (f) Design c full-load ................................................................................. 83
Fig. 3-18 The operating point of the permanent magnet in full-load condition; (a) Design b;
(b) Design c ............................................................................................................................. 85

XIV
Fig. 3-19 (a) Torque waveform of three design variations using AlNiCo 9 (b) Torque
waveform comparison of the SynRM, design b with AlNiCo 9, and design b with N 48 ...... 86
Fig. 3-20 Torque-speed curves of the PM assisted SynRM and SynRM; (a) 400 V DC bus
voltage; (b) 350 V DC bus voltage ......................................................................................... 87
Fig. 3-21 Efficiency map; (a) The PM assisted SynRM (Design b); (b) SynRM .................. 88
Fig. 3-22 (a) d-axis and q-axis inductances of the PM assisted SynRM and SynRM; (b)
Saliency ratio of the PM assisted SynRM and SynRM .......................................................... 89
Fig. 3-23 (a) rotor lamination of the PM assisted SynRM; (b) Final rotor assembly of the PM
assisted SynRM ....................................................................................................................... 91
Fig. 3-24 Torque-angle curves of the SynRM and the PM assisted SynRM; (a) 16 A; (b) 12
A; (c) 8 A ................................................................................................................................ 92
Fig. 3-25 Phase voltage and current curves of the PM assisted SynRM for inductance
measurement ........................................................................................................................... 93
Fig. 3-26 (a) d-axis and q-axis inductrance of the SynRM and the PM assisted SynRM; (b)
Saliency ratio of the SynRM and the PM assisted SynRM .................................................... 94
Fig. 3-27 The back-EMF voltage of the PM assisted SynRM at 850 rpm............................. 95
Fig. 4-1(a) Rotor of the SynRM used in the experiments; (b) d-axis and q-axis inductances of
the SynRM; (c) d and q-axis equivalent circuits ..................................................................... 99
Fig. 4-2 The schematic structure of the stand-alone SynRG ............................................... 100
Fig. 4-3 (a) Possible operating speeds and solutions of the polynomial (10); (b) The operating
points for three different values of the capacitor bank (curve 2 from (a)) ............................ 103
Fig. 4-4 (a) The BH loop of M45 G29 using the Energetic Model; (b) BH loops of M45 G29
obtained from the measurement ............................................................................................ 107
Fig. 4-5 Phasor diagram of the SynRM in motoring and generating modes ....................... 109
Fig. 4-6 The q-axis and d-axis flux linkages of the SynRG during the self-excitation process;
(a) q-axis flux linkage, acceleration=13 rad/s2; (b) q-axis flux linkage, acceleration=4 rad/s2
(mechanical acceleration), (c) d-axis flux linkage, acceleration=13 rad/s2 (mechanical
acceleration), (d) d-axis flux linkage, acceleration=4 rad/s2 (mechanical acceleration) ....... 110
Fig. 4-7 The effect of mechanical acceleration on the overshoot value of the phase voltage; (a)
6.5 rad/s2; (b) 5 rad/s2............................................................................................................ 111
XV
Fig. 4-8 (a) Effect of the phase winding resistance on the q-axis flux linkage waveform upon
the self-excitation; (b) d-axis flux linkage for phase winding resistance of 1.4 ohms; (c) d-axis
flux linkage for phase winding resistance of 1.5 ohms ......................................................... 112
Fig. 4-9 Experimental setup of the SynRG .......................................................................... 114
Fig. 4-10 Comparison of the phase voltage (a). Experimental result (b). Simulation using the
dq model (c) q-axis flux linkage of the machine .................................................................. 115
Fig. 4-11 Comparison of the line current; (a) Experimental result; (b) Simulation result ... 116
Fig. 4-12 SynRG test results summary ................................................................................ 118
Fig. 4-13 Effect of the residual flux on the self-excitation; (a) Successful self-excitation after
pre-magnetizing with 7 A; (b) Voltage collapse after pre-magnetizing with 4 A ................ 119
Fig. 4-14 Self-excitation after pre-magnetizing with 7 A; (a) Successful voltage build-up
(acceleration=4 rad/s2); (b) Voltage collapse due to fast acceleration (acceleration=5.8 rad/s2)
............................................................................................................................................... 120
XVI
List of Tables
Table. 2-1. Machine parameters............................................................................................. 27
Table. 3-1 Various AlNiCo magnets ..................................................................................... 68
Table. 3-2 The operating point of the permanent magnet for different magnet thicknesses . 80
Table. 3-3 Design variation comparison of the PM assisted SynRM .................................... 86
Table. 3-4 Performance comparison of the SynRM and the PM assisted SynRM in loaded
condition ................................................................................................................................. 94
Table. 4-1 Machine's parameters ........................................................................................... 99

XVII
List of Abbreviations
ALA Axially laminated anisotropic
CRGO Cold rolled grain oriented
CRNGO Cold rolled non grain oriented
EMF Electromotive force
ESS Energy storage system
EV Electric vehicle
FEA Finite element analysis
HEV Hybrid electric vehicle
ICE Internal combustion engine
IPM Interior permanent magnet machine
MEC Magnetic equivalent model
MMF Magneto motive force
PHEV Plug-in hybrid electric vehicle
PM Permanent magnet
PMSM Permanent magnet synchronous
machine
PWM Pulse width modulation
SynRG Synchronous reluctance generator
SynRM Synchronous reluctance machine
TLA Transversally laminated anisotropic
V2G Vehicle to grid

XVIII
List of Symbols
𝐴𝑔 Air gap area
𝐴𝑚 Permanent magnet surface area
𝐵𝑚 Magnetic flux density of the permanent magnet at the operating point
𝐵𝑟 Remnant magnet flux density of the magnet
𝐵𝑟𝑎𝑑 Radial component of the magnetic flux density in the air gap
𝐵𝑡𝑎𝑛 Tangential component of the magnetic flux density in the air gap
𝐶∅ Flux concentration factor
𝐻𝑅 Reversible field
𝐻𝑑 Demagnetization field
𝐻𝑙 Irreversible field
𝐻𝑚 Magnetic field intensity of the permanent magnet at the operating point
𝐼𝑠 Current vector
𝐾𝑐 Carter’s coefficient
𝐿𝑑 d-axis inductance
𝐿𝑚 Magnetizing inductance
𝐿𝑞 q-axis inductance
𝑁𝑑 Demagnetization factor
𝑃𝑐 Permeance coefficient
𝑅𝑐 Core loss resistance
𝑅𝑠 Phase winding resistance
𝑖𝑑 d-axis current
𝑖𝑞 q-axis current
𝑙𝑓𝑏 Equivalent air gap length of the flux barrier
𝑙𝑔 Air gap thickness
𝑙𝑠𝑡𝑎𝑐𝑘 Stack length of the machine
𝑣𝑑 d-axis voltage
𝑣𝑞 q-axis voltage
𝕋 Maxwell stress tensor
𝜆𝑑 d-axis flux linkage
𝜆𝑝𝑚 Flux linkage due to the permanent magnet
𝜆𝑞 q-axis flux linkage
𝜇0 Magnetic permeability of the free space
𝜇𝑅 Relative magnetic permeability
𝜔𝑟 Rotor speed (rad/s)
XIX
ℱ Magneto motive force (MMF)
ℛ Reluctance
𝐶 Capacitance
𝐷 Outer diameter of the rotor
𝐻 Magnetic field intensity
𝐽 Current density
𝐾 Torque constant
𝑀 Total magnetization
𝑁(𝜃) Winding function
𝑇 Electromagnetic torque
𝑉 Phase voltage
𝑔 Air gap function
𝑚 Relative magnetization
𝑃 Number of poles
𝜃 Rotor angle
𝜉 Saliency ratio
𝜑 Magnetic flux
𝜔 Electrical speed and speed of the frame (rad/s)
𝜗 Power factor angle
1
Chapter 1 Introduction
1. 1. Potential Applications of Synchronous Reluctance Machines
With recent developments in power electronics and electrical machine design, the
application of pure electric vehicles and hybrid electric vehicles, to replace the conventional
ones, has become more economically feasible. This has led to the design and manufacturing of
varieties of electric vehicles (EVs) which are usually categorized into three main groups. The
first group is the purely electric vehicle without the internal combustion engine (ICE) [1]. The
abbreviation, EV is sometimes used interchangeably for electric vehicles of this category. The
second group is the combined system of an EV and a conventional ICE, named as Hybrid
Electric Vehicle (HEV). The third group is a variation of HEV in which the possibility of
charging the energy storage system (ESS) through the utility grid is provided [2]. This group
is the Plug-in Hybrid Electric Vehicle (PHEV).
The ESS of a HEV, which is usually a battery pack is exclusively charged through the
regenerative braking procedure, or using a small on-board electric generator driven by the ICE,
while the main source of recharging the batteries in EVs and PHEVs is the on board battery
charger through which the vehicle is plugged to the electrical grid. The on board battery charger
can be designed to provide electric power flow in both directions, thus enabling the possibility
to send the power back to the grid. Such EVs or PHEVs is said to have the vehicle to grid
capability (V2G) [1, 3] and can operate as a distributed power generation system to provide
the peak power demand of the utility grid or to operate as a stand-alone electric power
generation unit for emergency situations [1, 4]. In the generation mode, current research is
focusing on utilizing the stored energy in the batteries. However in a PHEV the option to use
the on board electric machine operating as the generator, driven by the ICE as the prime mover,
also exists. Therefore the choice of the electric machine for a PHEV must consider this
possibility, as well.
Different types of electrical machines can be used as the electric propulsion motor of the
EV. Currently permanent magnet machines (PM machines) are the most popular type of
electrical machines used in the EV industry. However the cost and limitations of PM machines
create a motivation to find an alternative electric machine which has the capability to overcome
2
those limitations and provide the same performance. The synchronous reluctance machine
(SynRM) possess unique characteristics which makes it an interesting choice for EVs. The
absence of PMs in the SynRM makes the manufacturing and maintenance cost comparatively
low. It also provides a fault tolerant machine which is capable of operation at high speed and
at high temperature [5].
The SynRM is considered as a potential candidate to replace PM machines, and induction
machines in the current market of EVs. In principle, the SynRM operates in the same manner
as the traditional salient pole synchronous machine except that the rotor of a SynRM has no
excitation winding, and operates based on the inductance ratio of the d-axis, and q-axis, named
as the saliency ratio [6]. A higher saliency ratio results in higher torque density, higher power
factor, and an improved performance. Therefore, enhancing this ratio has been the motivation
of several research works [7, 8, 9].
The absence of rotor windings also provides other benefits to this type of electric machine,
which is lower copper loss and the possibility to operate at higher temperatures compared to
IMs and PM machines. The SynRM also shares many of the advantages of the switched
reluctance machine (SRM) [10, 11]; however since it uses a distributed three phase winding
identical to the induction machine’s stator winding, its operation is smoother and quieter than
the SRM.
In this research the electrical machine as the main component which distinguishes an EV
from a conventional vehicle, is studied. The design of the electric machine used in the electrical
propulsion system, affects the performance of the vehicle significantly. Therefore it is important
to enhance the machine’s performance by choosing proper design parameters. Analytical design
methods which can provide an insight to the magnetic and electric characteristics of electrical
machines are powerful tools to achieve the desired output parameters, required by the
application. An analytical method, based on the electromagnetic equations for SynRMs is
proposed in this thesis. The analytical approach creates an opportunity to characterize and
analyze the existing SynRMs, and has the capability to be transformed into a design method
through which the choice of design parameters can be done for the specific requirements of EV
as well as other application. The generator application of the SynRM is also studied and its
criteria are identified. The importance of this study is to identify the possibility of V2G
3
operation for a PHEV, which utilizes the SynRM in its propulsion system. Such a vehicle can
also be used to supply emergency power, when needed. Thus the electric power generation
capability of the electric machine is of great importance.
Despite numerous merits to this date, SynRMs are not commercialized at the same level of
induction machines, and their applications are limited to small fans and pumps [12]. However
the advantages of the SynRM such as low copper loss and low manufacturing cost reveals the
SynRM’s potential to substitute the induction machine in many applications. This chapter
briefly introduces SynRMs, design variations, operational principles, and possible
applications.
1. 2. Synchronous Reluctance Machines
The SynRM is a salient pole machine with usually a three phase winding placed in the
stator slots [10, 13, 14]. The rotor is made of steel laminations and is free of permanent magnets
or windings. The electromechanical energy conversion in SynRMs relies on the reluctance
variation in the rotor topology [7]. It is an alternative AC drive which can replace permanent
magnet (PM) machines and induction machines [7, 6] in many applications such as EVs due
to its simple, robust, and low-cost manufacturing. The simple structure of the rotor reduces the
cost of manufacturing in comparison with PM machines and induction machines [6]. Moreover
the absence of rotor windings and the rotor cage eliminates the rotor conduction loss, thus
enhancing the efficiency compared to induction machines [15]. The SynRM has a fast dynamic
response [6, 16], is fault tolerant [17, 18], and is capable of operating at higher speeds than
various types of PM machines such as surface mounted PM machines [19]. These advantages
make it a suitable choice for many applications like power generation from renewable energy
resources, traction and EVs [6, 9].
1.2.1. Design Variations and Operational Principles
The torque production of the SynRM depends on the reluctance variation in the rotor
topology. The reluctance variation results in the rotor tendency to align itself with the magnetic
field produced by the current flowing in the stator winding which is usually a distributed three
phase winding, producing a sinusoidal magneto motive force (MMF). To achieve the desired
reluctance variation, the rotor design can be done in three different manners [10, 11]:
4
Salient pole rotor
Transversally laminated anisotropic rotors (TLA)
Axially laminated anisotropic rotors (ALA)
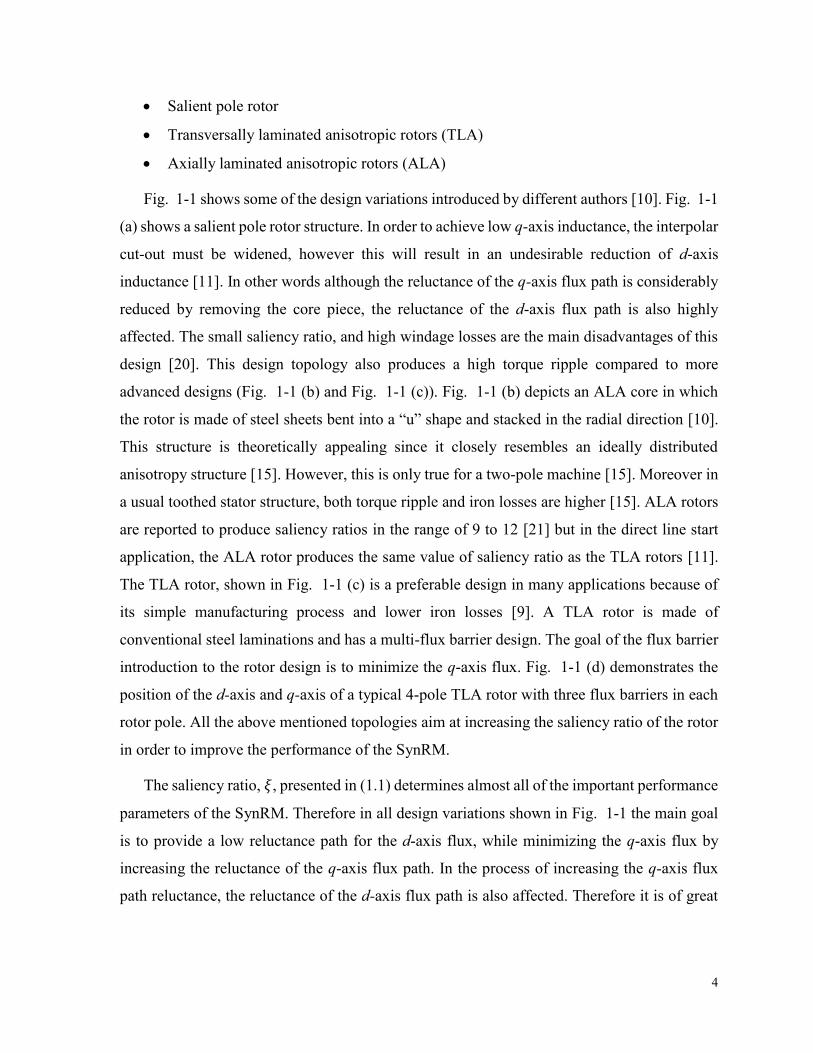
Fig. 1-1 shows some of the design variations introduced by different authors [10]. Fig. 1-1
(a) shows a salient pole rotor structure. In order to achieve low q-axis inductance, the interpolar
cut-out must be widened, however this will result in an undesirable reduction of d-axis
inductance [11]. In other words although the reluctance of the q-axis flux path is considerably
reduced by removing the core piece, the reluctance of the d-axis flux path is also highly
affected. The small saliency ratio, and high windage losses are the main disadvantages of this
design [20]. This design topology also produces a high torque ripple compared to more
advanced designs (Fig. 1-1 (b) and Fig. 1-1 (c)). Fig. 1-1 (b) depicts an ALA core in which
the rotor is made of steel sheets bent into a “u” shape and stacked in the radial direction [10].
This structure is theoretically appealing since it closely resembles an ideally distributed
anisotropy structure [15]. However, this is only true for a two-pole machine [15]. Moreover in
a usual toothed stator structure, both torque ripple and iron losses are higher [15]. ALA rotors
are reported to produce saliency ratios in the range of 9 to 12 [21] but in the direct line start
application, the ALA rotor produces the same value of saliency ratio as the TLA rotors [11].
The TLA rotor, shown in Fig. 1-1 (c) is a preferable design in many applications because of
its simple manufacturing process and lower iron losses [9]. A TLA rotor is made of
conventional steel laminations and has a multi-flux barrier design. The goal of the flux barrier
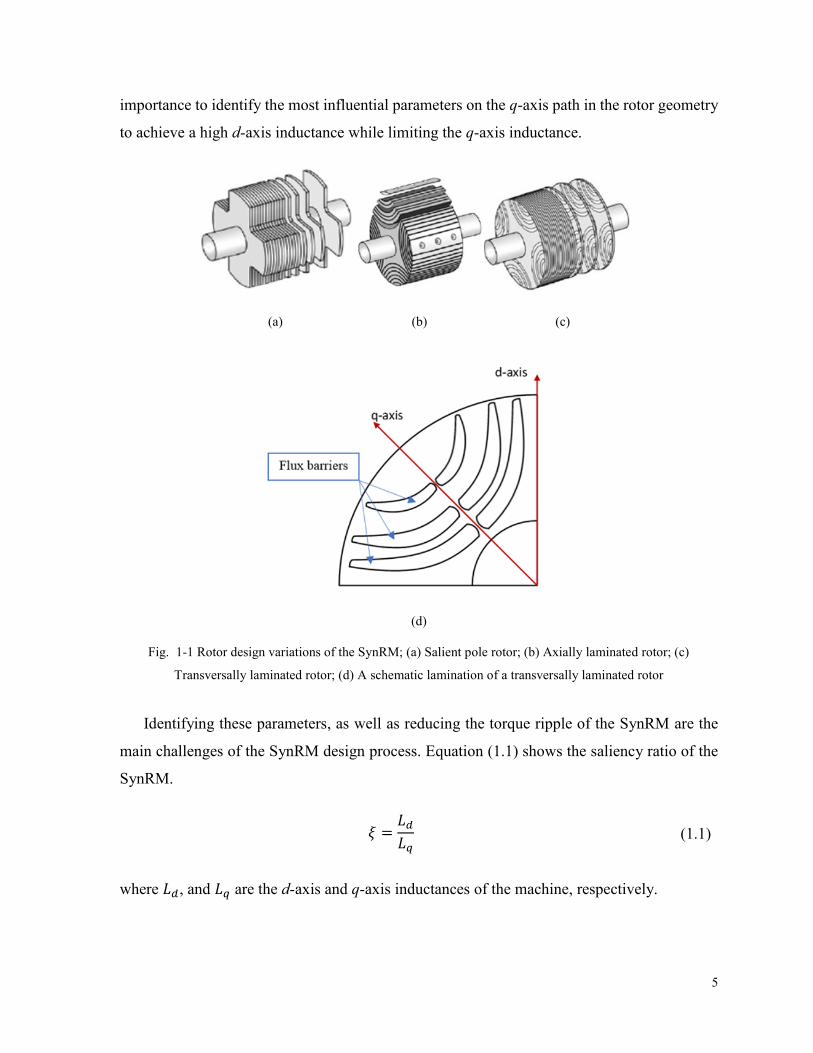
introduction to the rotor design is to minimize the q-axis flux. Fig. 1-1 (d) demonstrates the
position of the d-axis and q-axis of a typical 4-pole TLA rotor with three flux barriers in each
rotor pole. All the above mentioned topologies aim at increasing the saliency ratio of the rotor
in order to improve the performance of the SynRM.
The saliency ratio, 𝜉, presented in (1.1) determines almost all of the important performance
parameters of the SynRM. Therefore in all design variations shown in Fig. 1-1 the main goal
is to provide a low reluctance path for the d-axis flux, while minimizing the q-axis flux by
increasing the reluctance of the q-axis flux path. In the process of increasing the q-axis flux
path reluctance, the reluctance of the d-axis flux path is also affected. Therefore it is of great
5
importance to identify the most influential parameters on the q-axis path in the rotor geometry
to achieve a high d-axis inductance while limiting the q-axis inductance.
(a) (b) (c)
(d)
Fig. 1-1 Rotor design variations of the SynRM; (a) Salient pole rotor; (b) Axially laminated rotor; (c)
Transversally laminated rotor; (d) A schematic lamination of a transversally laminated rotor
Identifying these parameters, as well as reducing the torque ripple of the SynRM are the
main challenges of the SynRM design process. Equation (1.1) shows the saliency ratio of the
SynRM.
𝜉 =𝐿𝑑𝐿𝑞
(1.1)
where 𝐿𝑑, and 𝐿𝑞 are the d-axis and q-axis inductances of the machine, respectively.

6
The dq model is generally used as a powerful and yet simple tool for modeling and analysis
of various types of electric machines. This model has been used for SynRMs throughout the
literature [10, 7, 11, 20, 22]. Equation (1.2) and equation (1.3) show the d-axis voltage 𝑣𝑑, the
q-axis voltage 𝑣𝑞 of the SynRM as a function of the machine’s parameters and currents. The
electromagnetic torque 𝑇 is presented in equation (1.4) [10]:
𝑣𝑑 = 𝑅𝑠𝑖𝑑 +𝑑𝜆𝑑𝑑𝑡
−𝑃
2𝜔𝑟𝜆𝑞 (1.2)
𝑣𝑞 = 𝑅𝑠𝑖𝑞 +𝑑𝜆𝑞
𝑑𝑡+𝑃
2𝜔𝑟𝜆𝑑 (1.3)
𝑇 =3
2
𝑃
2(𝐿𝑑 − 𝐿𝑞)𝑖𝑑𝑖𝑞 (1.4)
where 𝑅𝑠, 𝑖𝑑, 𝑖𝑞, 𝜆𝑑, 𝜆𝑞, 𝜔𝑟, and 𝑃 are stator winding resistance, d-axis current, q-axis current,
d-axis flux linkage, q-axis flux linkage, rotor speed (mechanical), and number of poles,
respectively.
The vector diagram of the synchronous reluctance motor is shown in Fig. 1-2.
Fig. 1-2 Vector diagram of the SynRM
The absence of field excitation in SynRMs results in the necessity of providing the required
magnetizing current (d-axis current) from the supply. Thus as is shown in Fig. 1-2 the angle
between the current phasor (Is) and the phase voltage (V), 𝜗 is large. Therefore the power factor
7
of the SynRM is relatively poor when compared to PM machines. In this diagram 𝜆 is the flux
linkage of the machine and consists of the two components of d-axis and q-axis (𝜆𝑑 , 𝜆𝑞).
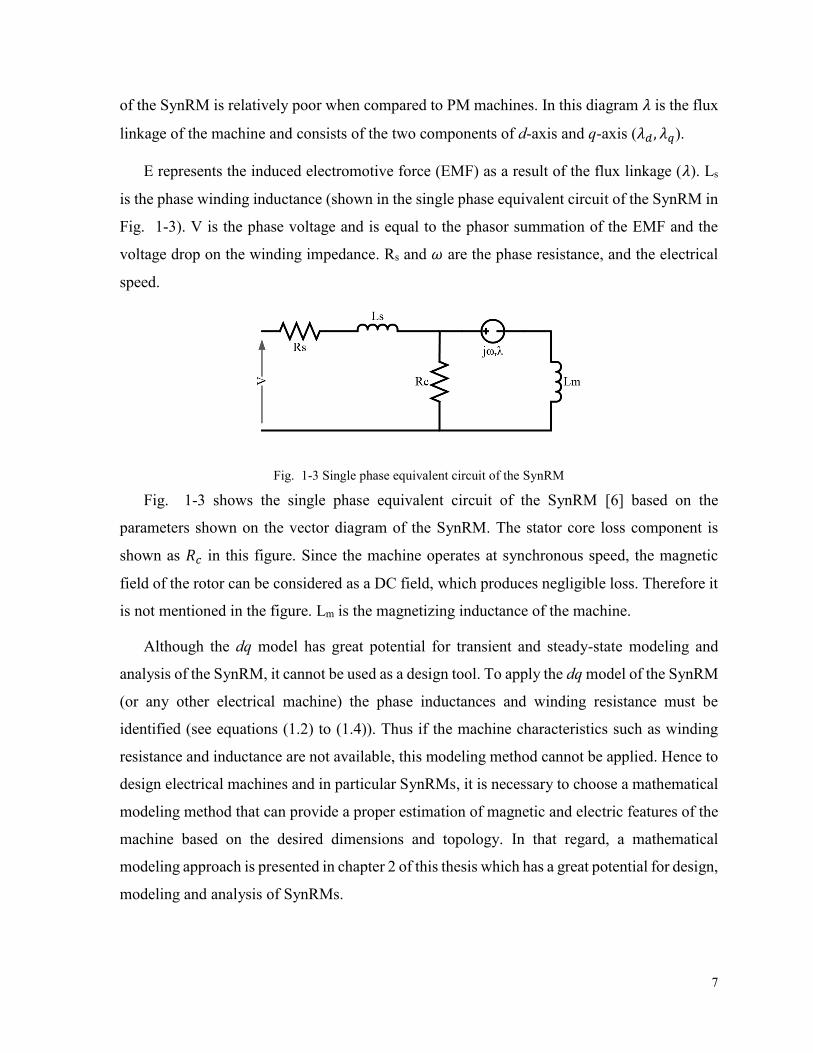
E represents the induced electromotive force (EMF) as a result of the flux linkage (𝜆). Ls
is the phase winding inductance (shown in the single phase equivalent circuit of the SynRM in
Fig. 1-3). V is the phase voltage and is equal to the phasor summation of the EMF and the
voltage drop on the winding impedance. Rs and 𝜔 are the phase resistance, and the electrical
speed.
Fig. 1-3 Single phase equivalent circuit of the SynRM
Fig. 1-3 shows the single phase equivalent circuit of the SynRM [6] based on the
parameters shown on the vector diagram of the SynRM. The stator core loss component is
shown as 𝑅𝑐 in this figure. Since the machine operates at synchronous speed, the magnetic
field of the rotor can be considered as a DC field, which produces negligible loss. Therefore it
is not mentioned in the figure. Lm is the magnetizing inductance of the machine.
Although the dq model has great potential for transient and steady-state modeling and
analysis of the SynRM, it cannot be used as a design tool. To apply the dq model of the SynRM
(or any other electrical machine) the phase inductances and winding resistance must be
identified (see equations (1.2) to (1.4)). Thus if the machine characteristics such as winding
resistance and inductance are not available, this modeling method cannot be applied. Hence to
design electrical machines and in particular SynRMs, it is necessary to choose a mathematical
modeling method that can provide a proper estimation of magnetic and electric features of the
machine based on the desired dimensions and topology. In that regard, a mathematical
modeling approach is presented in chapter 2 of this thesis which has a great potential for design,
modeling and analysis of SynRMs.
8
1. 3. Design Approaches
The Rotor design is the main challenge of the SynRM design procedure, while the stator
design is relatively straightforward. To achieve high saliency ratio values while maintaining a
smooth torque waveform, the flux barriers design must be done carefully. The choice of the
number of the flux barriers, their shape, and span affects the performance and torque
production capability of the SynRM significantly. A literature review on the available design
approaches is provided in this section.
1.3.1. Stator Design
The stator of a SynRM is usually similar to the stator of an IM or permanent magnet
synchronous machines (PMSM), with a distributed winding to eliminate or mitigate the space
harmonics. Although the stator is usually similar to the stator of an induction machine, the joint
design of stator and rotor must also be considered since the relationship between the number
of stator slots and the number of rotor flux barriers (in a TLA rotor) affects the torque
waveform of the machine. To choose the number of stator slots according to the number of
rotor flux barriers in a TLA rotor, guidelines are provided in the literature [22]. However since
the main goal of the stator design in a SynRM is to provide a smooth air gap MMF, the choice
of the number of stator slots is done in a manner to generate a proper sinusoidal MMF. Hence
the number of the rotor flux barriers is chosen accordingly.
1.3.2. Rotor Design
As stated earlier in this section, the rotor design is the most challenging part of the SynRM
design. Over the past four decades several methods are addressed in the literature for design
modification, and performance improvement of SynRMs. These methods can be categorized
into two main groups:
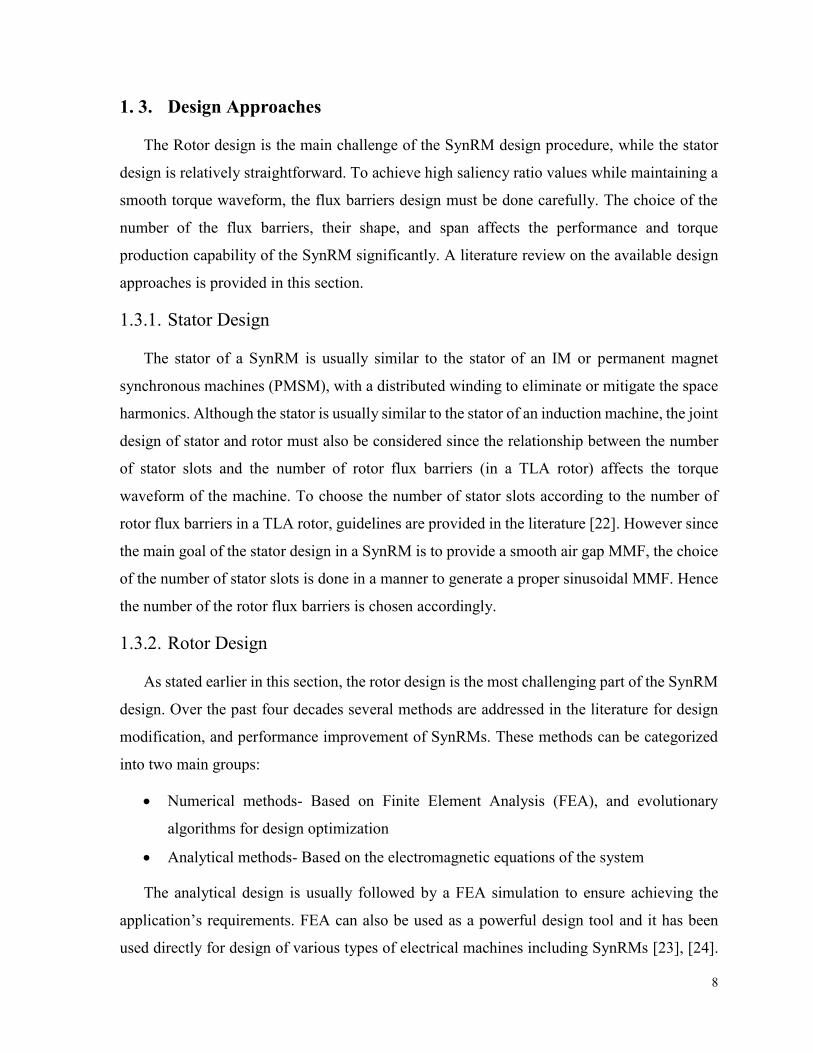
Numerical methods- Based on Finite Element Analysis (FEA), and evolutionary
algorithms for design optimization
Analytical methods- Based on the electromagnetic equations of the system
The analytical design is usually followed by a FEA simulation to ensure achieving the
application’s requirements. FEA can also be used as a powerful design tool and it has been
used directly for design of various types of electrical machines including SynRMs [23], [24].
9
Although FEA software is capable of providing accurate results when compared to
measurement results, initiating a design approach based on a FEA simulation might not always
result in the best outcome. Electrical machines in general, and the SynRMs in particular
possess numerous geometric, magnetic, electric, and thermal features. For example the torque,
𝑇 produced by any electrical machine is directly proportional to its stack length, 𝑙𝑠𝑡𝑎𝑐𝑘, times
the rotor outer diameter, 𝐷 squared as shown:
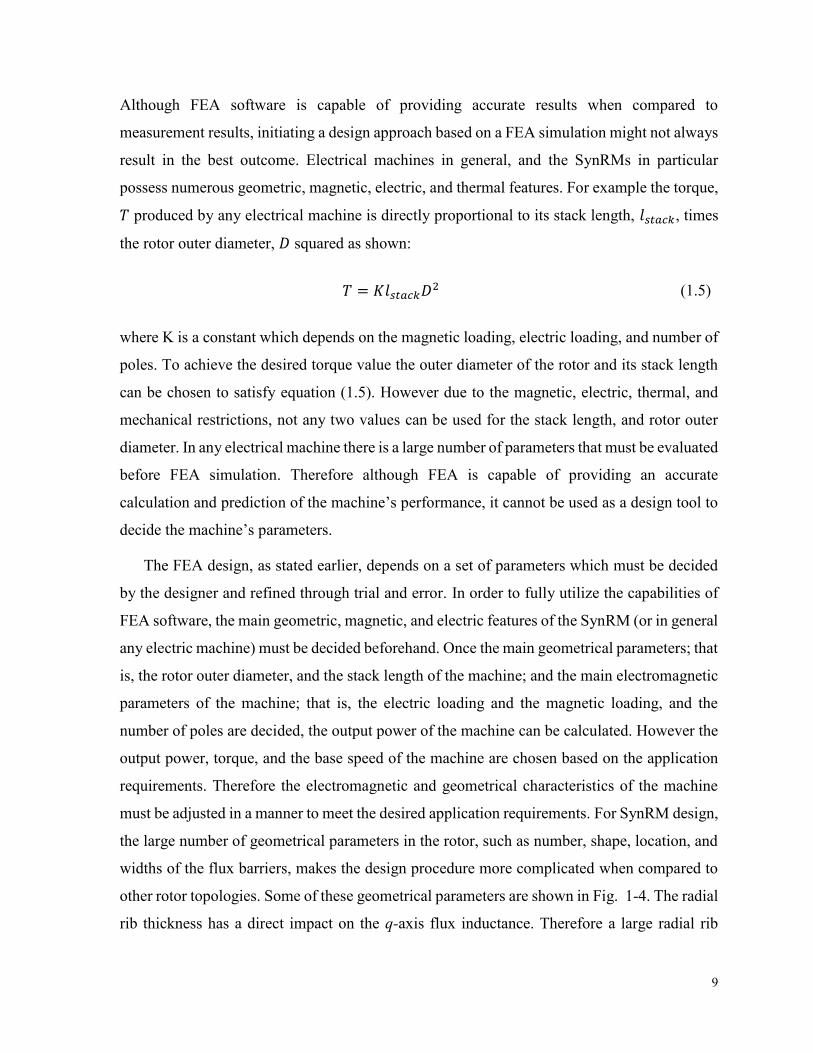
𝑇 = 𝐾𝑙𝑠𝑡𝑎𝑐𝑘𝐷2 (1.5)
where K is a constant which depends on the magnetic loading, electric loading, and number of
poles. To achieve the desired torque value the outer diameter of the rotor and its stack length
can be chosen to satisfy equation (1.5). However due to the magnetic, electric, thermal, and
mechanical restrictions, not any two values can be used for the stack length, and rotor outer
diameter. In any electrical machine there is a large number of parameters that must be evaluated
before FEA simulation. Therefore although FEA is capable of providing an accurate
calculation and prediction of the machine’s performance, it cannot be used as a design tool to
decide the machine’s parameters.
The FEA design, as stated earlier, depends on a set of parameters which must be decided
by the designer and refined through trial and error. In order to fully utilize the capabilities of
FEA software, the main geometric, magnetic, and electric features of the SynRM (or in general
any electric machine) must be decided beforehand. Once the main geometrical parameters; that
is, the rotor outer diameter, and the stack length of the machine; and the main electromagnetic
parameters of the machine; that is, the electric loading and the magnetic loading, and the
number of poles are decided, the output power of the machine can be calculated. However the
output power, torque, and the base speed of the machine are chosen based on the application
requirements. Therefore the electromagnetic and geometrical characteristics of the machine
must be adjusted in a manner to meet the desired application requirements. For SynRM design,
the large number of geometrical parameters in the rotor, such as number, shape, location, and
widths of the flux barriers, makes the design procedure more complicated when compared to
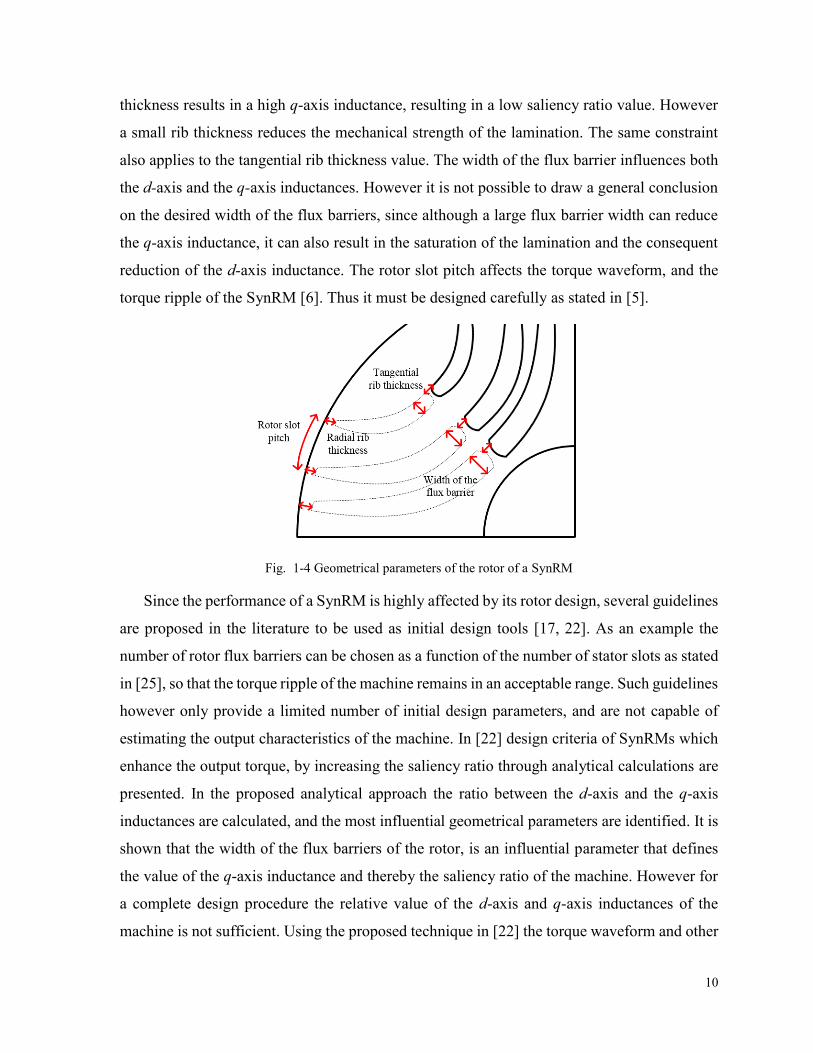
other rotor topologies. Some of these geometrical parameters are shown in Fig. 1-4. The radial
rib thickness has a direct impact on the q-axis flux inductance. Therefore a large radial rib
10
thickness results in a high q-axis inductance, resulting in a low saliency ratio value. However
a small rib thickness reduces the mechanical strength of the lamination. The same constraint
also applies to the tangential rib thickness value. The width of the flux barrier influences both
the d-axis and the q-axis inductances. However it is not possible to draw a general conclusion
on the desired width of the flux barriers, since although a large flux barrier width can reduce
the q-axis inductance, it can also result in the saturation of the lamination and the consequent
reduction of the d-axis inductance. The rotor slot pitch affects the torque waveform, and the
torque ripple of the SynRM [6]. Thus it must be designed carefully as stated in [5].
Fig. 1-4 Geometrical parameters of the rotor of a SynRM
Since the performance of a SynRM is highly affected by its rotor design, several guidelines
are proposed in the literature to be used as initial design tools [17, 22]. As an example the
number of rotor flux barriers can be chosen as a function of the number of stator slots as stated
in [25], so that the torque ripple of the machine remains in an acceptable range. Such guidelines
however only provide a limited number of initial design parameters, and are not capable of
estimating the output characteristics of the machine. In [22] design criteria of SynRMs which
enhance the output torque, by increasing the saliency ratio through analytical calculations are
presented. In the proposed analytical approach the ratio between the d-axis and the q-axis
inductances are calculated, and the most influential geometrical parameters are identified. It is
shown that the width of the flux barriers of the rotor, is an influential parameter that defines
the value of the q-axis inductance and thereby the saliency ratio of the machine. However for
a complete design procedure the relative value of the d-axis and q-axis inductances of the
machine is not sufficient. Using the proposed technique in [22] the torque waveform and other
11
characteristics of the machine cannot be calculated. That reveals the necessity of having an
analytical design, and modeling method which can provide initial insight into the electrical
machine. The modeling method must be capable of taking the effect of most of the geometric,
electric, and magnetic parameters into account. Various analytical models are proposed in the
literature which are used for design modification or characterization of electrical machines
[26]. Analytical approaches are relatively fast and easy to implement. They can be used both
as a design tool and as a modeling method. In a proper analytical model, the model accuracy
is adjustable according to the application requirements and the available modeling resources
and software. Some of these methods which are proposed and used for SynRMs are briefly
discussed here.
An analytical model which can determine the proper position for the flux barriers of a TLA
SynRM is proposed in [27]. The aim of the proposed model is to minimize the torque ripple of
the machine. The model is developed initially for a SynRM with one flux barrier and then
extended to practical rotor topologies with more than one flux barrier. The proposed model in
[27] is initially introduced in [17] and is developed to compensate the torque harmonics in
SynRMs. In this modeling approach the electric loading of the stator winding is expressed
using the Fourier series. Based on the obtained electric loading, the stator magnetic potential
along the stator periphery is calculated. Finally the magnetic flux density in the air gap is
calculated using the magnetic potential values of the stator and rotor. The magnetic flux density
value in the air gap is later used to calculate the electromagnetic torque based on the Lorentz
force equation. However the procedure to obtain the magnetic vector potential values in the
rotor is not simple, and not discussed in the paper in detail. Moreover in order to calculate the
magnetic potential value in each rotor section, the rotor geometry and dimensions, and the
electric loading produced by the stator winding must be available. Therefore since these
parameters are not available in initial design steps, the application of this method is difficult
and requires several steps of calculations to achieve a proper design topology. A similar
approach is used in [28]. Using FEA the analytical model is verified and optimized. In [13],
the inductances and the torque of an axially laminated SynRM are calculated using winding
function theory. In this model an air gap function which is defined based on the rotor topology,
and a winding function which is defined according to the winding distribution of the machine
are used to calculate the inductances of the phases and eventually the electromagnetic torque
12
of the machine. However in the proposed method, the equation which is used to estimate the
effect of the flux barriers is only applicable to ALA rotors and cannot be used for TLA rotor
designs. A semi numerical method is presented in [29]. In this model the Maxwell Stress
Tensor is used to calculate the harmonic torque components in a fractional slot concentrated
winding SynRM. A multiple coupled circuit model of SynRMs is presented in [30]. The
proposed method is derived based on the magnetic circuit (MEC) model. Although the
accuracy of the results obtained from the MEC modeling approach is relatively higher than
other modeling methods, it is time consuming to implement the model, and once the model is
completed, it is not easy to vary the design parameters. Therefore this analytical approach is
more suitable for modeling and analysis of an existing machine, and cannot be used as a
flexible design tool.
The design procedure of the rotor structure can be started by defining a basic rotor structure
as shown in [31]. In this approach the number of flux barriers, eventual cutoffs, etc. are initially
chosen. Then barrier widths, rib widths, and their placement are optimized numerically. The
advantage of this procedure is that the magnetic cross saturation and other complex phenomena
are taken into account in the numeric optimization process using finite element software [15].
On the other hand the results may depend on the preliminary choices of the initial rotor
structure. Thus the initially chosen number of flux barriers can significantly affect the
performance, torque ripple, and torque density.
Another approach is based on the generalized lumped-parameter modeling of the rotor
magnetic circuit [15, 22]. In this model a purely sinusoidal MMF is considered, thus only a
rough approximation of the real system is obtained. Moreover only the d-axis saturation is
taken into account [15] and the cross saturation effect is neglected. In this method, in order to
minimize the q–axis flowthrough flux, the permeance of the various flux barriers are
considered to be related to each other. It has been shown that for four-pole machines, this
minimum-inductance distribution of permeance practically coincides with a constant-
permeance distribution [15]. [32] uses FEA to study the effect of several combined
configurations of star-delta connected winding on the output torque and efficiency of SynRMs
through FEA simulations and experiments.
13
1.3.3. Problem Statement and Methodology
The complicated rotor topology of the TLA SynRM reveals the necessity of using an
analytical design method prior to FEA simulation. However the analytical modeling method
must have some level of flexibility for design parameter variations. In that regard, methods
such as Magnetic Equivalent Circuit (MEC) which are developed based on a discretization of
the machine’s topology are not suitable for SynRMs because the variation of the parameters in
MEC modeling is not easy to perform. Some of the methods mentioned earlier [17], also
require design parameters to begin with the initial calculations.
To overcome the design challenges and obtain a SynRM which is capable of providing the
application requirements, a proper understanding of the machine’s features and characteristics
is a necessity. It is also important to improve the machine’s saliency ratio in order to increase
the output torque, enhance the power factor, and improve the efficiency of the SynRM.
Performance improvement can also be achieved using design variations of the SynRM with
permanent magnet materials, called permanent magnet assisted SynRMs (PM assisted
SynRMs). Analytical modeling and design approaches can also be useful to better understand
the characteristics of such design variations of SynRM. Although several topologies of PM
assisted SynRM are presented in the literature, the absence of proper analytical design
approaches and the possibility of design improvement reveals the necessity of further research
and study in this field.
While the performance of a PM assisted SynRM can be improved through d-axis flux
enhancement, the existing design topologies in the literature usually operate based on limiting
the q-axis flux using permanent magnet materials. In this research the possibility of
performance improvement in PM assisted SynRMs, using a different topology is investigated.
The proposed topology provides a PM assisted SynRM with a relatively high saliency ratio,
and benefits from the additional permanent magnets to obtain a higher power factor. In this
design configuration, the permanent magnets are placed in a manner to enhance the d-axis flux
of the machine.
The proposed analytical model of the SynRM is presented in Chapter 2 of this thesis. Later
in Chapter 3 a modified version of the analytical model is used to design a PM assisted SynRM.
14
1. 4. Generator Operation of Synchronous Reluctance Machines
1.4.1. Synchronous Reluctance Generators
Generator operation of the SynRM as a robust [33], simple, and comparatively less
expensive generator dates back to 1990s. Since then, different aspects of the generator operation
of the SynRM have been discussed in the literature, like performance [34, 35, 36], operating
limits [37, 38] and control strategies [39, 40, 41, 42]. The absence of field excitation as in
conventional synchronous machines or permanent magnet machines results in operational
challenges for electric power generation of the SynRM. In that regard, the SynRM can be
operated as a stand-alone power generation unit, or as a grid-connected generator. In grid-
connected mode the required magnetizing current is provided by the grid, while the SynRG
supplies active power to the grid. In stand-alone operation the required magnetizing current (the
required reactive power of the SynRG) is provided by a properly sized capacitor bank. This
capacitor bank can also be sized in a manner to provide the reactive power demand of the load.
The start-up procedure of the SynRG as a stand-alone power generation unit requires careful
consideration of the SynRM’s characteristics and maintaining certain initial conditions in the
system. In that regard, the generator operation of the SynRM as a stand-alone unit is similar to
that of a stand-alone induction generator [43].
Although various aspects of the SynRG operation are addressed in several research works,
the start-up procedure of the stand-alone SynRG and the required criteria to ensure a successful
voltage build-up are not discussed to this date. The build-up procedure of the terminal voltage
in SynRMs and induction machines in stand-alone generator operation is called self-excitation,
and it depends on the nonlinear characteristic of the ferromagnetic core material [39], presence
of the initial condition (capacitor initial voltage or residual flux in the core) in the system [43],
a properly sized capacitor bank, and maintaining a minimum speed. The self-excitation
phenomenon in stand-alone induction generators is discussed in [44, 45, 46]. However this
phenomenon in SynRMs has not been fully investigated. Most of the available research on
SynRGs as presented earlier, focus on the output characteristics of the SynRG. As an example
in [47] it is shown that the steady-state performance of the SynRG is significantly affected by
the air gap flux linkage and core saturation. Control strategies of the SynRG such as operation
of the SynRG in an extended speed range while decreasing the conduction loss are discussed in

15
[34]. [42] presents voltage control for a super high-speed SynRG system with a pulse width
modulation (PWM) voltage source converter. Studies of SynRG performance at different
loading conditions, obtaining the efficiency and power factor of the machine, and identifying
the maximum power-conversion capability of the SynRG are presented in [48]. However none
of these research works consider the criteria for self-excitation of the SynRM in stand-alone
operation.
1.4.2. Problem Statement and Methodology
Although numerous studies present the stand-alone operation of the SynRG in steady state
condition, the build-up procedure of the terminal voltage has been neglected. The self-
excitation phenomenon in induction generators are discussed in [44], [43]. However the self-
excitation of the SynRG is not presented in any research work. The start-up procedure of a
SynRM in stand-alone generation mode, requires maintaining certain criteria. A section of this
thesis is dedicated to the self-excitation in SynRGs and the required criteria to ensure a
successful voltage build-up. The dq model of the SynRG is used in simulations and the
modeling results are validated by numerous experiments performed on a stand-alone SynRM
connected in parallel to a capacitor bank. This study is presented in detail in chapter 4 of the
thesis.
1. 5. Objectives
The main objective of this research work is to generate analytical models for the design,
analysis and characterization of SynRMs and permanent magnet assisted SynRMs. The
proposed analytical model is developed in a manner to take the main geometric, and
electromagnetic properties of the machine into account while maintaining a flexible analysis
platform which enables it to be used as a design tool. Therefore the design parameters can be
varied with minimum effort and their impact on the output performance of the machine can be
studied. This flexibility enables the designer to achieve the desired performance of the specific
application in a relatively short time with a proper accuracy.
The proposed analytical model is initially used to characterize a previously prototyped
SynRM. The model is validated using experimental results and FEA simulation results. Later
the model is modified for PM assisted SynRMs. Using the modified analytical model, a PM
assisted SynRM rotor is designed, based on the stator dimensions of the existing SynRM.

16
Therefore the rotor outer diameter and stack length are similar to the rotor of the SynRM. The
design objective is to obtain a PM assisted SynRM with improved torque density and power
factor when compared to the existing SynRM. The permanent magnet material used in the PM
assisted SynRM is AlNiCo 9 magnet which results in low manufacturing cost (compared to
rare-earth magnets). However the magnetic features of AlNiCo magnets (low coercivity) has
to be considered in the design procedure to avoid unwanted demagnetization of the permanent
magnets. The analytical model is also modified for analysis and characterization of another
design topology of the SynRM using Cold Rolled Grain Oriented (CRGO) steel in which the
superior magnetic characteristics of the CRGO steel is used for saliency ratio improvement of
the SynRM.
The study of the generator operation of the stand-alone SynRM and the required criteria to
ensure a successful voltage build-up is another part of this research work. The objective of this
study is to identify the self-excitation criteria of the stand-alone SynRG. Using the dq model
of the SynRG, the minimum residual magnetism, and the maximum start-up acceleration to
ensure a successful self-excitation are calculated based on the machine’s characteristics and
the size of the capacitor bank. Later the obtained criteria are verified by experimental results.
1. 6. Contributions
The research contributions of the work can be summarized as:
Developing an analytical model for design, analysis, and characterization of SynRMs
and PM assisted SynRMs.
Designing and prototyping a PM assisted SynRM rotor using low cost AlNiCo magnets
based on the stator dimensions of the previously prototyped SynRM.
Self-excitation criteria of the stand-alone SynRG.
Journal papers:
S. Maroufian, and P. Pillay, “Self-Excitation Criteria of the Synchronous Reluctance
Generator in Stand-Alone Mode of Operation,” IEEE transaction on Industry
Applications, Year: 2018, Volume: 54, Issue: 2, Pages: 1245-1253
17
S. Maroufian, and P. Pillay, “Torque Characterization of a Synchronous Reluctance
Machine Using an Analytical Mode,” IEEE Transaction on Transportation
Electrification, Year: 2018, Volume: 4, Issue: 2, Pages: 506-516
Conference papers:
S. Maroufian, and P. Pillay, "Analytical Modeling of a Segmented-Pole Synchronous
Reluctance Machine with CRGO Laminations" in IEEE Energy Conversion Congress
and Exposition (ECCE 2018), Portland, Oregon
S. Maroufian and P. Pillay, PM Assisted Synchronous Reluctance Machine Design
Using AlNiCo Magnets” , in IEEE International Electric Machines and Drives
Conference (IEMDC 2017), Miami, FL, USA
S. Maroufian and P. Pillay, "Self-Excitation Criteria of the Synchronous Reluctance
Generator in Stand-Alone Mode of Operation," in IEEE International Conference On
Power Electronics, Drives And Energy Systems (PEDES 2016), Trivandrum, India
S. Maroufian, and P. Pillay, "Torque Characterization of a Synchronous Reluctance
Machine Using an Analytical Model," in IEEE International Conference On Power
Electronics, Drives And Energy Systems (PEDES 2016), Trivandrum, India
1. 7. Organization of this Thesis
Chapter 2 presents the analytical modeling and design approach which is used for analysis
of a previously designed and prototyped SynRM. The results of the analytical model are
compared with the results obtained from FEA and measurements.
Chapter 3 starts with introducing the PM assisted SynRM. In this chapter the analytical
model presented in chapter 2 for analysis and modeling of the SynRM is modified and used to
obtain initial design parameters of the PM assisted SynRM. The PM assisted SynRM designed
in this chapter benefits from low cost AlNiCo magnets.

18
Chapter 4 presents the stand-alone operation of the synchronous reluctance generator
(SynRG) using a properly sized capacitor bank.
Chapter 5 provides the conclusion and the possible future work of the thesis.
19
Chapter 2 Analytical Modeling of Synchronous
Reluctance Machines
2.1. Introduction
The large number of geometrical parameters in the rotor of the SynRM results in design
complexities. The width, and the number of the flux barriers in a TLA, as well as their
respective shapes, can vary over a wide range resulting in considerable differences in the output
torque and performance of the machine. Thus to obtain the desired output characteristics
regarding the application requirements, the design parameters must be chosen carefully, and
precisely. To overcome the design challenges of SynRMs, several guidelines are suggested in
the literature. These guidelines such as the choice of the number of the flux barriers to minimize
the torque ripple production presented in [25], can be used as initial design estimations.
However such estimations can only provide a limited number of design parameters, and will
not provide the output characteristics of the machine.
In order to provide a reliable approach to design the SynRM regarding the application
requirements, the machine’s characteristics must be assessed as a function of different design
parameters. Thus a mathematical model for design and analysis of the SynRM is a convenient
tool to guide the design procedure. This approach expends less resources during the design
phase, while increasing the chances of successful prototyping. In the literature, several methods
are described to model the behavior of electric machines, each presenting positive aspects and
drawbacks. Basically, the modeling methodologies can be divided into two main categories:
Analytical methods, which are based on abstractions of the machines elements, and numerical
methods, which describe the behavior of the fields inside of the machine. The following section
presents the most common design methods for electric machines briefly. The modeling
approach which is used for analysis and characterization of a previously prototyped SynRM is
presented in details. The model is verified using FEA and measurements and the results are
presented in this chapter. Later in Chapter 3 the proposed model is modified in a manner to be
used for designing a PM assisted SynRM.
20
2.2. Literature Review of the Available Analytical Methods
Three of the main analytical approaches for modeling and analysis of electrical machines
are:
Lumped parameters method
Magnetic Equivalent Circuit (MEC) method
Winding function method
Electrical equivalent circuit models are derived using classical field analysis [49] and are
widely used to describe the behavior of synchronous machines and induction machines. This
simple model has the capability to calculate the per phase voltage, current, output power,
torque average value and losses of the machine. The equivalent circuit models of electrical
machines are useful tools to obtain an estimation of the machine’s behavior in steady-state
condition. The dq model of electrical machines is also considered a lumped parameter model
and as discussed in the previous chapter is widely used for the analysis of SynRMs. The dq
model is used for modeling generator operation of the SynRM in this thesis (Chapter 4).
In the MEC model, the machine’s structure is divided into several elements [50, 51]. The
elements are characterized by their reluctance which is a function of the material properties
and the machine’s geometry. Solving the obtained equivalent circuit, the magnetic potential
values of the nodes connecting the elements at different magnetic potential levels, are obtained.
The electromagnetic torque is then calculated using the Maxwell Stress Tensor or other
methods. The main advantage of the MEC is the trade-off between the desired accuracy and
the complexity of the model. However, the inflexibility of the method brings challenges to the
use of MEC as a design tool, since applying design variations in the model is relatively difficult
once the model is generated.
The winding function method is a mathematical approach for modeling electrical machines
based on the estimation of the winding inductance. This model is used in this thesis for
modeling and characterization of a prototyped SynRM and later expanded to a design tool for
designing a PM assisted SynRM. The analytical design is followed by a FEA simulation prior
to prototyping.
21
FEA is a numerical approach to describe the behavior of the magnetic fields inside the
machine. This method is usually used in the analysis of electrical machines due to its capability
in providing accurate results. This method can be used as a design tool for electric machines,
however the FEA design depends on a set of parameters which must be estimated by the
designer and refined through trial and error, rendering the process, time consuming.
To design SynRMs, both analytical and numerical methods have been applied in the
literature. [22] presents a design criteria of SynRMs to enhance the output torque by increasing
the saliency ratio through analytical calculations. However the proposed analytical approach
only provides the ratio between the two main inductances of the machine, that is the d-axis and
the q-axis inductances. Thus the torque waveform and other characteristics of the machine
cannot be calculated. In [13] the inductances and the torque of an ALA SynRM are calculated
using winding function theory. The referred paper presents an air gap function. However the
proposed equation to estimate the effect of the flux barriers is only applicable to ALA rotors.
In [29], a semi numerical method based on Maxwell Stress Tensor is presented to calculate the
harmonic torque components in a fractional slot concentrated winding SynRM. In [30], a
multiple coupled circuit modeling of SynRMs is presented. The proposed method is derived
based on the magnetic circuit model. In [52] the MEC modeling method is used to calculate
the open circuit characteristic of a PM assisted SynRM; that is the back-EMF. Later based on
the derived model, the torque pulsation of the machine is estimated and compared with FEA
simulation result. Using this model the air gap flux density and its radial and tangential
components are calculated. However as mentioned earlier the main challenge of the MEC
modeling method is its complexity and lack of flexibility for design variations. Thus for each
new design topology that the designer aims for, a new magnetic circuit must be developed,
which is time consuming. Therefore although this method provides an accurate result as shown
in [52], it cannot be considered as a flexible design tool.
In this research, the winding function method [53] is applied to model the behavior of the
SynRM. This method which has been used by many researchers [54], [55], [13], [56] relies on
the MMF calculation based on the winding configuration, and the definition of an air gap
function based on the machine’s geometry. The winding function permits the parameters to be
changed easily, which is an important characteristic for an analytical method to be used as a
design tool. The main contribution in application of the winding function for design and

22
characterization of SynRMs is proposing a mathematical approach to include the effect of the
flux barriers in the air gap function determination of the TLA SynRM. The obtained results of
the winding function model are also extended from inductance calculation to torque-angle
curves and torque waveform estimations of the SynRM using the coenergy method and the
Maxwell stress tensor method, respectively.
All the available modeling approaches based on the winding function method presented by
various authors [54], [55], are mainly limited to the calculation of the inductances and
analyzing the inductance curve for fault detection or parameter estimation [14, 57]. For
example [54] uses the inductances calculated using the winding function method for analysis
of the air gap eccentricity in a salient pole synchronous machine. By comparing the shape of
the inductance curves for healthy and unhealthy machines and analyzing the spatial harmonics,
the faulty condition is detected. [55] uses the winding function approach to obtain a generalized
closed-form equation for the inductances of surface mounted PM machines and induction
machines. The same approach is followed in [13] for inductance estimation of axially
laminated synchronous reluctance machines. However the model is not far extended beyond
inductance calculation. In this thesis the winding function method is established based on the
topology of a previously prototyped transversally laminated synchronous reluctance machine.
Initially the model is used to calculate the inductance matrix of the machine, and later extended
for characterization and torque waveform calculation.
The analytical model presented in this research can be used for both characterization, and
design of TLA SynRMs. Using the proposed approach as a characterization method provides
an opportunity to obtain an estimation of the machine’s performance without having to do the
time consuming procedure of measurement. The capability of the model as a design tool helps
to improve the design prior to FEA simulation, and prototyping. Therefore the effect of various
design parameters on the performance of the SynRM can be examined. The winding function
method is initially presented in the following section, then followed by the application of the
model on a previously designed and prototyped SynRM. The results are then compared with
the FEA and measurement results. The comparison shows an acceptable agreement thus
proving the validity of the method.
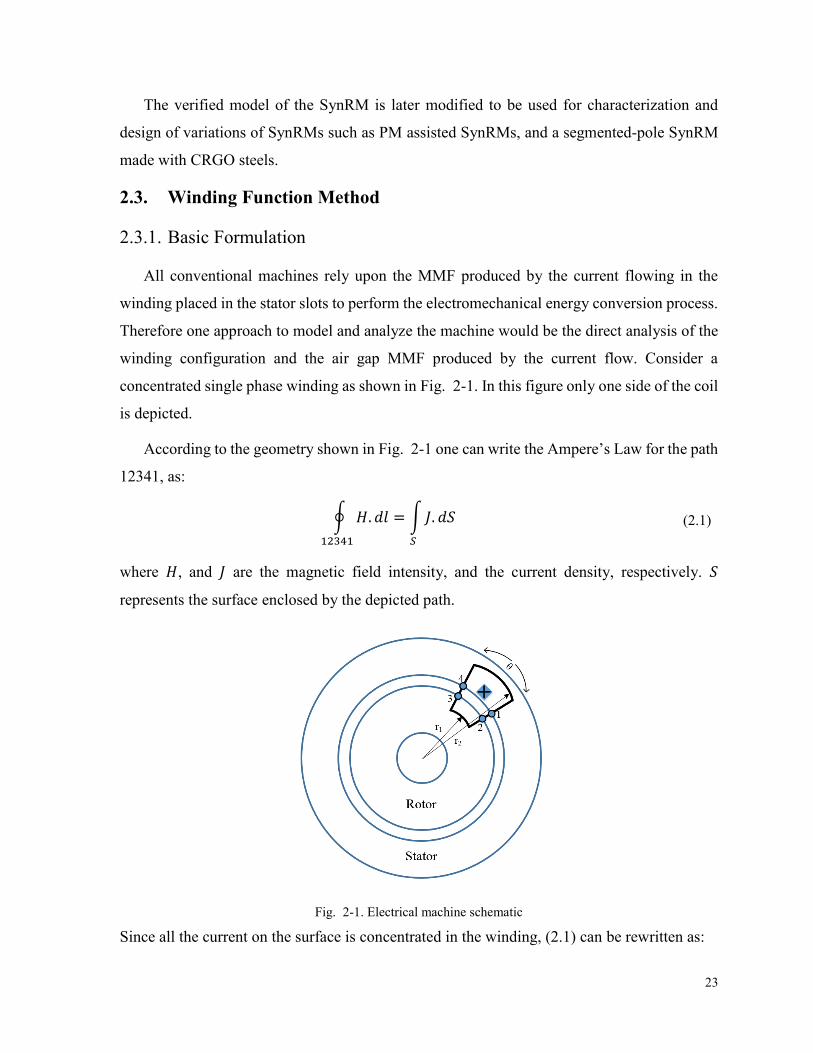
23
The verified model of the SynRM is later modified to be used for characterization and
design of variations of SynRMs such as PM assisted SynRMs, and a segmented-pole SynRM
made with CRGO steels.
2.3. Winding Function Method
2.3.1. Basic Formulation
All conventional machines rely upon the MMF produced by the current flowing in the
winding placed in the stator slots to perform the electromechanical energy conversion process.
Therefore one approach to model and analyze the machine would be the direct analysis of the
winding configuration and the air gap MMF produced by the current flow. Consider a
concentrated single phase winding as shown in Fig. 2-1. In this figure only one side of the coil
is depicted.
According to the geometry shown in Fig. 2-1 one can write the Ampere’s Law for the path
12341, as:
∮ 𝐻. 𝑑𝑙 = ∫ 𝐽. 𝑑𝑆
𝑆
12341
(2.1)
where 𝐻, and 𝐽 are the magnetic field intensity, and the current density, respectively. 𝑆
represents the surface enclosed by the depicted path.
Fig. 2-1. Electrical machine schematic
Since all the current on the surface is concentrated in the winding, (2.1) can be rewritten as:
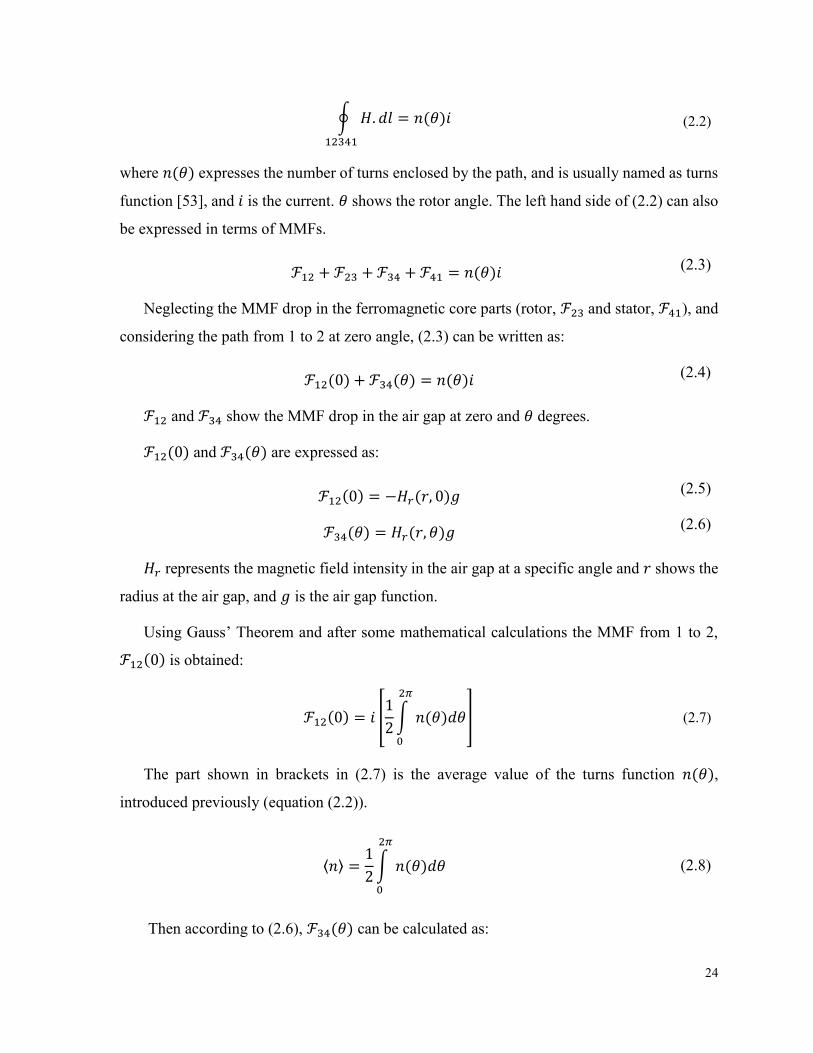
24
∮ 𝐻. 𝑑𝑙 = 𝑛(𝜃)𝑖
12341
(2.2)
where 𝑛(𝜃) expresses the number of turns enclosed by the path, and is usually named as turns
function [53], and 𝑖 is the current. 𝜃 shows the rotor angle. The left hand side of (2.2) can also
be expressed in terms of MMFs.
ℱ12 + ℱ23 +ℱ34 + ℱ41 = 𝑛(𝜃)𝑖 (2.3)
Neglecting the MMF drop in the ferromagnetic core parts (rotor, ℱ23 and stator, ℱ41), and
considering the path from 1 to 2 at zero angle, (2.3) can be written as:
ℱ12(0) + ℱ34(𝜃) = 𝑛(𝜃)𝑖 (2.4)
ℱ12 and ℱ34 show the MMF drop in the air gap at zero and 𝜃 degrees.
ℱ12(0) and ℱ34(𝜃) are expressed as:
ℱ12(0) = −𝐻𝑟(𝑟, 0)𝑔 (2.5)
ℱ34(𝜃) = 𝐻𝑟(𝑟, 𝜃)𝑔 (2.6)
𝐻𝑟 represents the magnetic field intensity in the air gap at a specific angle and 𝑟 shows the
radius at the air gap, and 𝑔 is the air gap function.
Using Gauss’ Theorem and after some mathematical calculations the MMF from 1 to 2,
ℱ12(0) is obtained:
ℱ12(0) = 𝑖 [1
2∫ 𝑛(𝜃)𝑑𝜃
2𝜋
0
] (2.7)
The part shown in brackets in (2.7) is the average value of the turns function 𝑛(𝜃),
introduced previously (equation (2.2)).
⟨𝑛⟩ =1
2∫ 𝑛(𝜃)𝑑𝜃
2𝜋
0
(2.8)
Then according to (2.6), ℱ34(𝜃) can be calculated as:
25
ℱ34(𝜃) = (𝑛(𝜃) − ⟨𝑛⟩)𝑖 (2.9)
The term shown on the right hand side of (2.9) (𝑛(𝜃) − ⟨𝑛⟩), is the turns function without
its average value, and is usually referred to as the Winding Function, and is defined in (2.10):
𝑁(𝜃) = 𝑛(𝜃) − ⟨𝑛⟩ (2.10)
Therefore the MMF at any point along the air gap can be written as the winding function
times the current.
ℱ(𝜃) = 𝑁(𝜃)𝑖 (2.11)
Once the winding function of the machine is identified, the mutual and phase inductances
can be calculated in the following manner.
The magnetic flux in the air gap is related to the air gap MMF according to (2.12).
𝜑 = ℱ/ℛ (2.12)
where 𝜑, and ℛ are the air gap flux and the magnetic reluctance of the air gap. (2.12) can
be written for a differential element with the length 𝑔, and the cross sectional area of (𝑟𝑑𝜃).
𝑑𝜑 = ℱ𝐴(𝜃)𝜇0𝑟𝑙𝑠𝑡𝑎𝑐𝑘𝑑𝜃
𝑔
(2.13)
where ℱ𝐴 is the MMF due to the phase A winding, and 𝜇0 is the permeability of the free space.
𝑙𝑠𝑡𝑎𝑐𝑘, 𝑟, and 𝑔 are the stack length, radius at the air gap, and the air gap function, respectively.
After some mathematical calculations, the flux linkage of winding B due to the current in
phase A is obtained using (2.14):
𝜆𝐴𝐵 =𝜇0𝑟𝑙𝑠𝑡𝑎𝑐𝑘
𝑔∫ 𝑛𝐵(𝜃)
2𝜋
0
ℱ𝐴(𝜃)𝑑𝜃 (2.14)
Where 𝑛𝐵(𝜃) is the winding turns of the winding B, and is defined as:
𝑛𝐵(𝜃) = 𝑁𝐵(𝜃)+ < 𝑛𝐵 > (2.15)
Where 𝑁𝐵(𝜃) is the winding function of the phase B.
26
The mutual inductance between phase A and phase B can be defined as the flux linkage of
winding B divided by the current in the winding A. Therefore the mutual inductance between
phase A and phase B can be expressed as:
𝐿𝐵𝐴 =𝜇0𝑟𝑙𝑠𝑡𝑎𝑐𝑘
𝑔∫ 𝑁𝐵(𝜃)
2𝜋
0
𝑁𝐴(𝜃)𝑑𝜃 +𝜇0𝑟𝑙𝑠𝑡𝑎𝑐𝑘
𝑔∫ < 𝑛𝐵 >
2𝜋
0
𝑁𝐴(𝜃)𝑑𝜃 (2.16)
The winding function for any winding is a symmetrical function with zero average value.
Thus the second term in the right hand side part of (2.16) is equal to zero. Therefore the mutual
inductance between phase A and phase B can be written as:
𝐿𝐵𝐴 =𝜇0𝑟𝑙𝑠𝑡𝑎𝑐𝑘
𝑔∫ 𝑁𝐵(𝜃)
2𝜋
0
𝑁𝐴(𝜃)𝑑𝜃 (2.17)
where 𝑁𝐵(𝜃), and 𝑁𝐴(𝜃) are the winding functions of phase B and phase A.
Using the same approach the self-inductance of the phases are also obtainable. Hence the
self-inductance of phase A is expressed as:
𝐿𝐴𝐴 =𝜇0𝑟𝑙𝑠𝑡𝑎𝑐𝑘
𝑔∫ 𝑁𝐴(𝜃)
2𝜋
0
𝑁𝐴(𝜃)𝑑𝜃 (2.18)
Once the inductances of the machine are obtained, the electromagnetic torque, 𝑇 can be
calculated using the coenergy method:
𝑇 =1
2[𝐼]𝑇 [
𝜕𝐿(𝜃)
𝜕𝜃] [𝐼] (2.19)
where [𝐼] is the current vector, which for a three phase machine consists of the currents of
the three phases, and 𝜕𝐿/𝜕𝜃 is the derivative of the inductance matrix according to the rotor
angle, 𝜃. Therefore the electromagnetic torque at each rotor angle is calculated for different
current magnitudes.
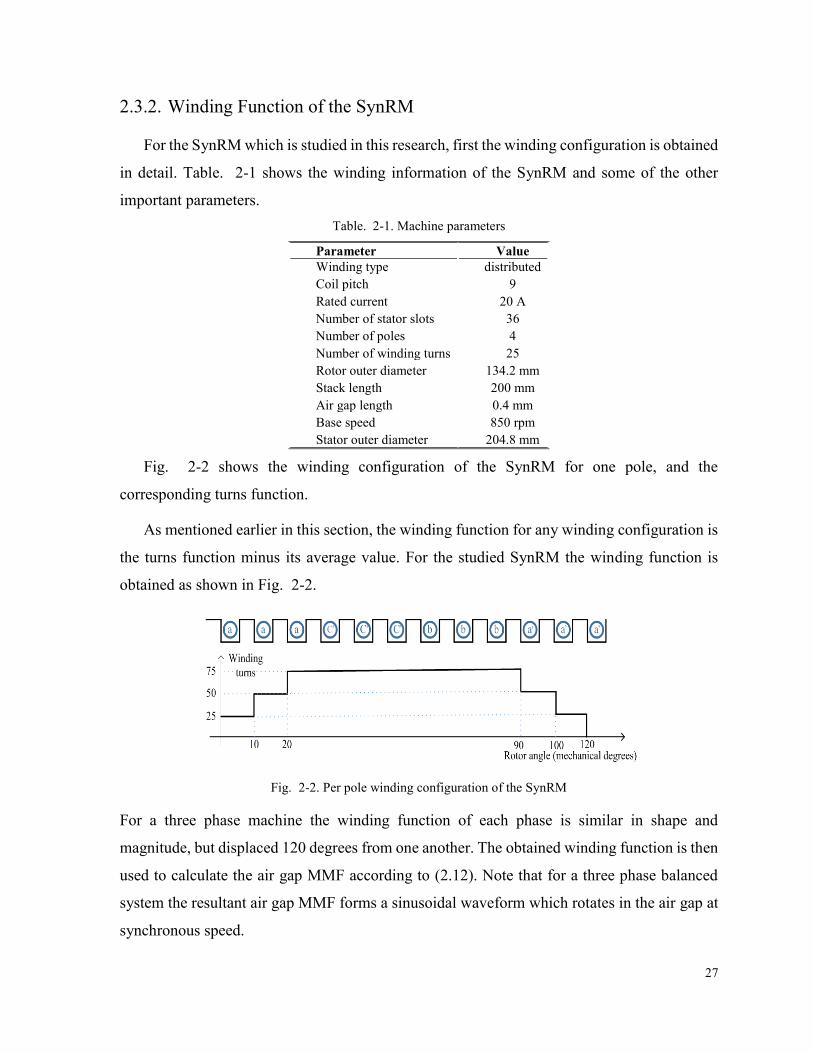
27
2.3.2. Winding Function of the SynRM
For the SynRM which is studied in this research, first the winding configuration is obtained
in detail. Table. 2-1 shows the winding information of the SynRM and some of the other
important parameters.
Table. 2-1. Machine parameters
Parameter Value
Winding type distributed
Coil pitch 9
Rated current 20 A
Number of stator slots 36
Number of poles 4
Number of winding turns 25
Rotor outer diameter 134.2 mm
Stack length 200 mm
Air gap length 0.4 mm
Base speed 850 rpm
Stator outer diameter 204.8 mm
Fig. 2-2 shows the winding configuration of the SynRM for one pole, and the
corresponding turns function.
As mentioned earlier in this section, the winding function for any winding configuration is
the turns function minus its average value. For the studied SynRM the winding function is
obtained as shown in Fig. 2-2.
Fig. 2-2. Per pole winding configuration of the SynRM
For a three phase machine the winding function of each phase is similar in shape and
magnitude, but displaced 120 degrees from one another. The obtained winding function is then
used to calculate the air gap MMF according to (2.12). Note that for a three phase balanced
system the resultant air gap MMF forms a sinusoidal waveform which rotates in the air gap at
synchronous speed.
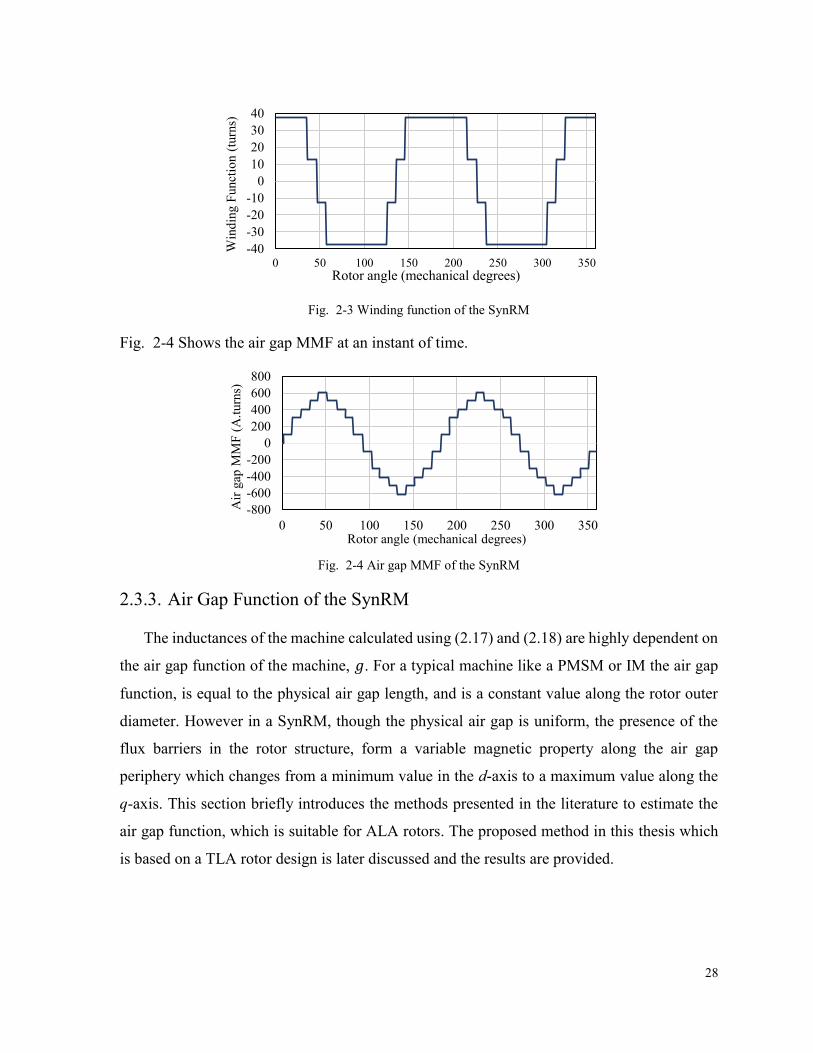
28
Fig. 2-3 Winding function of the SynRM
Fig. 2-4 Shows the air gap MMF at an instant of time.
Fig. 2-4 Air gap MMF of the SynRM
2.3.3. Air Gap Function of the SynRM
The inductances of the machine calculated using (2.17) and (2.18) are highly dependent on
the air gap function of the machine, 𝑔. For a typical machine like a PMSM or IM the air gap
function, is equal to the physical air gap length, and is a constant value along the rotor outer
diameter. However in a SynRM, though the physical air gap is uniform, the presence of the
flux barriers in the rotor structure, form a variable magnetic property along the air gap
periphery which changes from a minimum value in the d-axis to a maximum value along the
q-axis. This section briefly introduces the methods presented in the literature to estimate the
air gap function, which is suitable for ALA rotors. The proposed method in this thesis which
is based on a TLA rotor design is later discussed and the results are provided.
-40
-30
-20
-10
0
10
20
30
40
0 50 100 150 200 250 300 350
Win
din
g F
unct
ion (
turn
s)
Rotor angle (mechanical degrees)
-800
-600
-400
-200
0
200
400
600
800
0 50 100 150 200 250 300 350
Air
gap
MM
F (
A.t
urn
s)
Rotor angle (mechanical degrees)
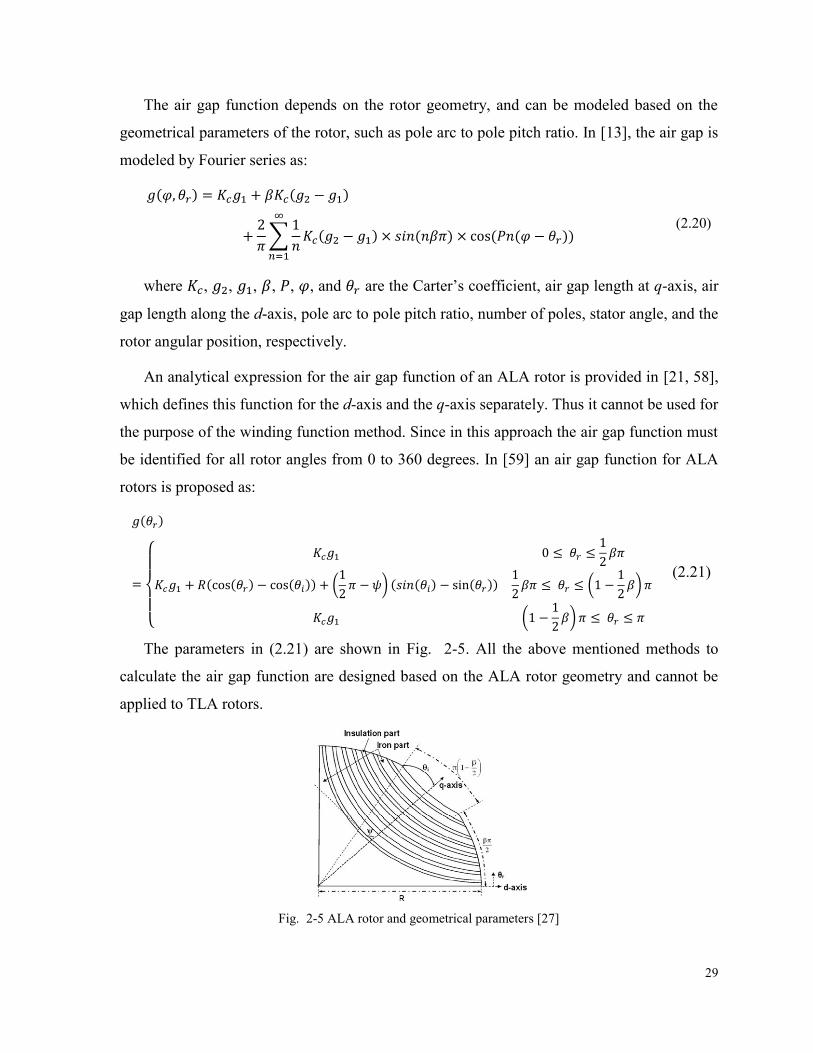
29
The air gap function depends on the rotor geometry, and can be modeled based on the
geometrical parameters of the rotor, such as pole arc to pole pitch ratio. In [13], the air gap is
modeled by Fourier series as:
𝑔(𝜑, 𝜃𝑟) = 𝐾𝑐𝑔1 + 𝛽𝐾𝑐(𝑔2 − 𝑔1)
+2
𝜋∑
1
𝑛𝐾𝑐(𝑔2 − 𝑔1) × 𝑠𝑖𝑛(𝑛𝛽𝜋) × cos(𝑃𝑛(𝜑 − 𝜃𝑟))
∞
𝑛=1
(2.20)
where 𝐾𝑐, 𝑔2, 𝑔1, 𝛽, 𝑃, 𝜑, and 𝜃𝑟 are the Carter’s coefficient, air gap length at q-axis, air
gap length along the d-axis, pole arc to pole pitch ratio, number of poles, stator angle, and the
rotor angular position, respectively.
An analytical expression for the air gap function of an ALA rotor is provided in [21, 58],
which defines this function for the d-axis and the q-axis separately. Thus it cannot be used for
the purpose of the winding function method. Since in this approach the air gap function must
be identified for all rotor angles from 0 to 360 degrees. In [59] an air gap function for ALA
rotors is proposed as:
𝑔(𝜃𝑟)
=
{
𝐾𝑐𝑔1 0 ≤ 𝜃𝑟 ≤
1
2𝛽𝜋
𝐾𝑐𝑔1 + 𝑅(cos(𝜃𝑟) − cos(𝜃𝑖)) + (1
2𝜋 − 𝜓) (𝑠𝑖𝑛(𝜃𝑖) − sin(𝜃𝑟))
1
2𝛽𝜋 ≤ 𝜃𝑟 ≤ (1 −
1
2𝛽)𝜋
𝐾𝑐𝑔1 (1 −1
2𝛽)𝜋 ≤ 𝜃𝑟 ≤ 𝜋
(2.21)
The parameters in (2.21) are shown in Fig. 2-5. All the above mentioned methods to
calculate the air gap function are designed based on the ALA rotor geometry and cannot be
applied to TLA rotors.
Fig. 2-5 ALA rotor and geometrical parameters [27]

30
To identify the effect of the rotor flux barriers on the air gap function of a TLA rotor, a
mathematical procedure is proposed in this thesis. In this method the impact of individual flux
barriers on the air gap function of the SynRM is modeled as an additional air gap length. The
following presents the analytical approach to obtain the air gap function of the 7.5 hp SynRM
presented earlier in this chapter. The results obtained from this modeling method can be used
for design modifications of the SynRM. The proposed analytical model can also be modified
for design and analysis of other variations of SynRMs, such as permanent magnet assisted
SynRMs, and segmented pole SynRMs made of CRGO steel laminations [60].
The modeling process begins with estimating the shape of the flux barriers. The analyzed
SynRM has semi-circular flux barriers, however for ease of modeling the flux barriers are
assumed to be completely circular with a constant width. Fig. 2-6 (a) and Fig. 2-6 (b) show
the rotor structure of the SynRM and the estimated flux barrier shapes, respectively.
(a) (b)
Fig. 2-6 (a) Rotor and stator laminations of the SynRM, (b) simplified model of the rotor
The effect of each flux barrier on the air gap flux is considered independently from other
flux barriers. The rotor part is divided into four sections, each section encompassing one of the
four flux barriers. The first three sections each cover 10 degrees of the half rotor pole, while
the fourth section which includes the smallest flux barrier on the top covers 15 degrees of the
half rotor pole. The flux barrier in each section increases the reluctance of the flux path when
compared to the same section with no flux barrier. Thus with a constant air gap MMF produced
by the stator winding, the air gap flux reduces in the presence of the flux barriers. The
reluctance of each pole section ℛ, can be calculated using (2.22):
ℛ =𝑙
𝜇𝐴 (2.22)
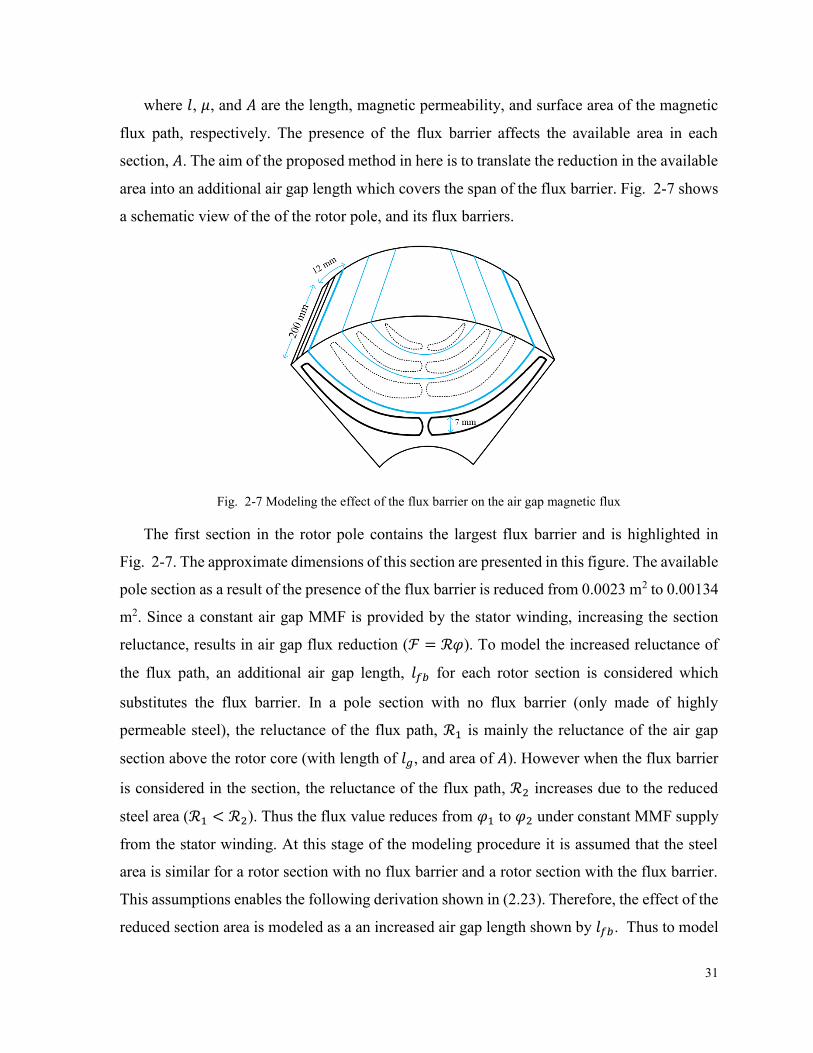
31
where 𝑙, 𝜇, and 𝐴 are the length, magnetic permeability, and surface area of the magnetic
flux path, respectively. The presence of the flux barrier affects the available area in each
section, 𝐴. The aim of the proposed method in here is to translate the reduction in the available
area into an additional air gap length which covers the span of the flux barrier. Fig. 2-7 shows
a schematic view of the of the rotor pole, and its flux barriers.
Fig. 2-7 Modeling the effect of the flux barrier on the air gap magnetic flux
The first section in the rotor pole contains the largest flux barrier and is highlighted in
Fig. 2-7. The approximate dimensions of this section are presented in this figure. The available
pole section as a result of the presence of the flux barrier is reduced from 0.0023 m2 to 0.00134
m2. Since a constant air gap MMF is provided by the stator winding, increasing the section
reluctance, results in air gap flux reduction (ℱ = ℛ𝜑). To model the increased reluctance of
the flux path, an additional air gap length, 𝑙𝑓𝑏 for each rotor section is considered which
substitutes the flux barrier. In a pole section with no flux barrier (only made of highly
permeable steel), the reluctance of the flux path, ℛ1 is mainly the reluctance of the air gap
section above the rotor core (with length of 𝑙𝑔, and area of 𝐴). However when the flux barrier
is considered in the section, the reluctance of the flux path, ℛ2 increases due to the reduced
steel area (ℛ1 < ℛ2). Thus the flux value reduces from 𝜑1 to 𝜑2 under constant MMF supply
from the stator winding. At this stage of the modeling procedure it is assumed that the steel
area is similar for a rotor section with no flux barrier and a rotor section with the flux barrier.
This assumptions enables the following derivation shown in (2.23). Therefore, the effect of the
reduced section area is modeled as a an increased air gap length shown by 𝑙𝑓𝑏. Thus to model
32
the increased reluctance, an additional air gap length, 𝑙𝑓𝑏 is considered which accounts for the
effect of the flux barrier and is obtained using the following derivation:
ℱ1 = ℱ2 → ℛ2𝜑2 = ℛ1𝜑1 → (𝑙𝑓𝑏
𝜇0𝐴 +
𝑙𝑔
𝜇0𝐴 )𝜑2 =
𝑙𝑔
𝜇0𝐴 𝜑1
→ (𝑙𝑓𝑏1 + 𝑙𝑔)𝜑2 = 𝑙𝑔𝜑1
→ 𝑙𝑓𝑏1 = ((𝜑1𝜑2) − 1)𝑙𝑔
(2.23)
where 𝑙𝑓𝑏, 𝜑1, 𝜑2, and 𝑙𝑔 are the equivalent air gap length representing the first flux barrier,
air gap flux per pole of the section without the flux barrier, air gap flux per pole of the section
when the flux barrier is present in the section, and the air gap length, respectively. Considering
the machine’s geometry, and according to the dimensions provided in Fig. 2-7 the additional
air gap length as a result of the biggest flux barrier, shown in Fig. 2-7, is 0.7 mm. To obtain
the value of the 𝑙𝑓𝑏1 from (2.23), knowing the values of the magnetic flux 𝜑1, and 𝜑2 is not
necessary (The flux values are not available at this stage of modeling). Assuming a similar air
gap MMF value produced by the stator winding in the two cases of with and without flux barrier
in the section, and considering a constant relative magnetic permeability for the steel, 𝜇𝑅 in the
two cases, one can write:
(ℛ𝑖𝑟𝑜𝑛1 + 𝑅𝑎𝑔1)𝜑1 = (ℛ𝑖𝑟𝑜𝑛2 + 𝑅𝑎𝑔2)𝜑2 → (𝑙𝑖𝑟𝑜𝑛𝜇0𝜇𝑅𝐴1
+𝑙𝑔
𝜇0𝐴1)𝜑1
= (𝑙𝑖𝑟𝑜𝑛𝜇0𝜇𝑅𝐴2
+𝑙𝑔
𝜇0𝐴2)𝜑2 →
𝜑1𝜑2
=𝜇𝑅𝐴1(𝜇𝑅𝑙𝑔 + 𝑙𝑖𝑟𝑜𝑛)
𝜇𝑅𝐴2(𝜇𝑅𝑙𝑔 + 𝑙𝑖𝑟𝑜𝑛) →
𝜑1𝜑2
=𝐴1𝐴2
(2.24)
where ℛ𝑖𝑟𝑜𝑛1, ℛ𝑖𝑟𝑜𝑛2, 𝑅𝑎𝑔1, 𝑅𝑎𝑔2, 𝑙𝑔, 𝐴1, 𝐴2, and 𝑙𝑖𝑟𝑜𝑛 are the reluctance of the rotor section
without the flux barrier, the reluctance of the section in the presence of the flux barrier, the
reluctance of the air gap above the section without the flux barrier, the reluctance of the air gap
above the section with the flux barrier, the length of the air gap, the area of the section without
the flux barrier, the area of the section with the flux barrier (𝐴2 < 𝐴1), and the length of the flux
path in the rotor which is equal to the equivalent length of the section, and similar for the two
cases (with and without the flux barrier in the section). The air gap section area is considered
according to the steel area for each case. Therefore the ratio between the magnetic flux values
in (2.23) can be replaced by the final equation obtained from (2.24). This equation shows how
33
the variation in the section area due to the flux barrier affects the amount of magnetic flux that
passes through under constant supply MMF condition.
The effect of other flux barriers on the air gap flux is also calculated in the same manner
and then added to obtain the equivalent air gap length at each point along the pole. This method
is easy to apply and it considers the main characteristics of the flux barriers; that is the covering
span, and the width. Fig. 2-8 (a) shows the individual equivalent air gap lengths for each of
the flux barriers and their overall effect.
The overall air gap function is estimated based on the obtained individual air gap lengths of
each rotor section. A straight line connecting the start point of each flux barrier to the start
point of the next one is used to model the transition between two adjacent flux barriers as
shown in Fig. 2-8 (b). Eventually the effect of the physical air gap is added to the final function,
which creates a shift in the final air gap function. Fig. 2-8 (b) shows the calculated air gap
function using the simplified flux barrier structure.
To examine the accuracy of the proposed air gap function for the SynRM, the air gap flux
of the SynRM is calculated using the analytical model and compared with the air gap flux
obtained from FEA simulation. The same calculations are also performed for two other design
variations; a rotor with no flux barriers, and a rotor with three flux barriers (without the smallest
flux barrier). Fig. 2-8 (c) compares the air gap magnetic flux curves under DC excitation,
obtained from the analytical model with the curves obtained from FEA for three different
cases; the SynRM with all four flux barriers (the base SynRM), a SynRM rotor without the
smallest flux barrier on the top, and a rotor topology with no flux barriers (solid rotor).
Although there is a small deviation between the curves obtained from the analytical model,
and the corresponding curves obtained from FEA simulation, the two modeling methods depict
the effect of the flux barriers on the air gap flux distribution of the machine. It is observed from
FEA simulation that the presence of the flux barriers alters the uniform distribution of the
magnetic flux in the air gap (under DC excitation) from a case with no flux barriers (solid
rotor) to the cases where the flux barriers are present in the rotor. The minimum value of the
air gap magnetic flux is also affected by the number of the flux barriers as shown for the base
SynRM, and a SynRM with three flux barriers.
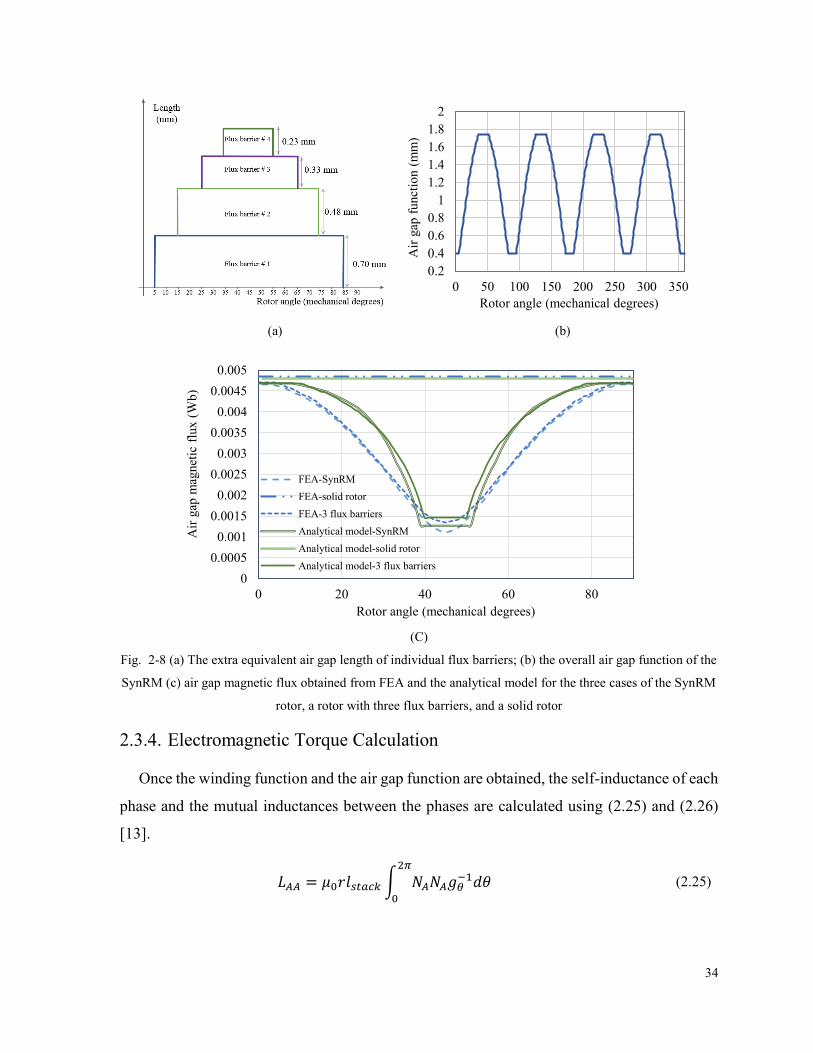
34
(a) (b)
(C)
Fig. 2-8 (a) The extra equivalent air gap length of individual flux barriers; (b) the overall air gap function of the
SynRM (c) air gap magnetic flux obtained from FEA and the analytical model for the three cases of the SynRM
rotor, a rotor with three flux barriers, and a solid rotor
2.3.4. Electromagnetic Torque Calculation
Once the winding function and the air gap function are obtained, the self-inductance of each
phase and the mutual inductances between the phases are calculated using (2.25) and (2.26)
[13].
𝐿𝐴𝐴 = 𝜇0𝑟𝑙𝑠𝑡𝑎𝑐𝑘∫ 𝑁𝐴𝑁𝐴𝑔𝜃−1𝑑𝜃
2𝜋
0
(2.25)
0.2
0.4
0.6
0.8
1
1.2
1.4
1.6
1.8
2
0 50 100 150 200 250 300 350
Air
gap
funct
ion (
mm
)
Rotor angle (mechanical degrees)
0
0.0005
0.001
0.0015
0.002
0.0025
0.003
0.0035
0.004
0.0045
0.005
0 20 40 60 80
Air
gap
mag
net
ic f
lux (
Wb
)
Rotor angle (mechanical degrees)
FEA-SynRM
FEA-solid rotor
FEA-3 flux barriers
Analytical model-SynRM
Analytical model-solid rotor
Analytical model-3 flux barriers
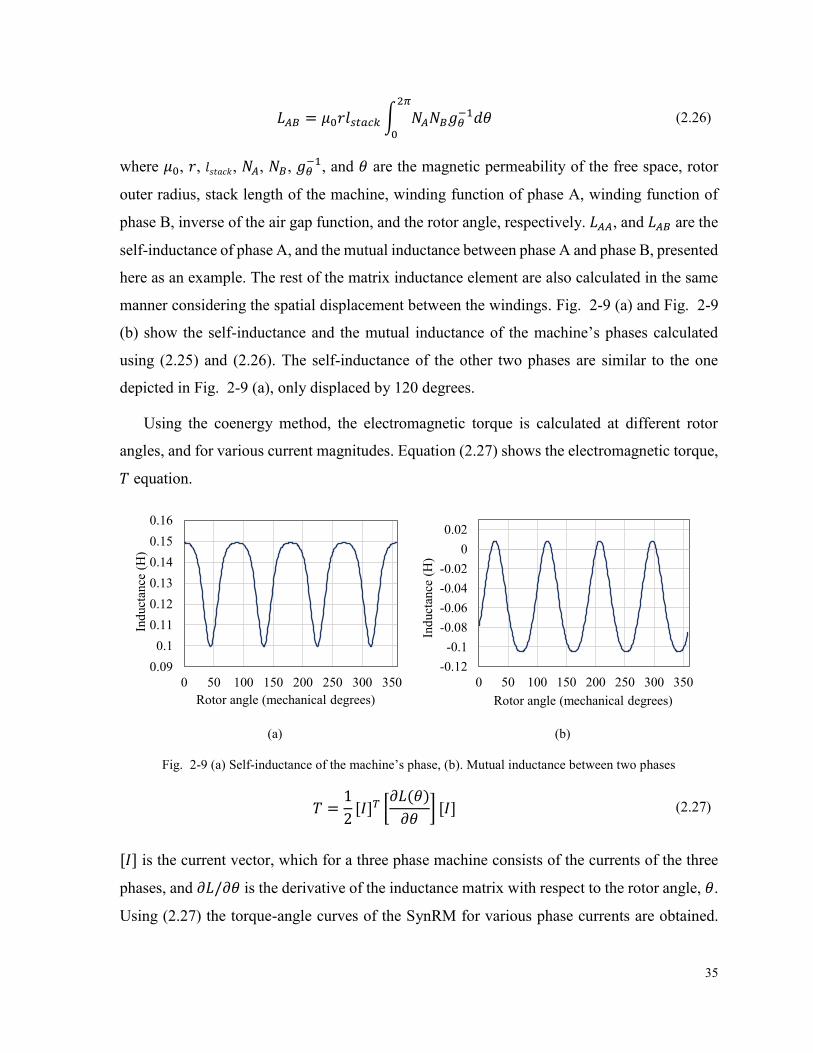
35
𝐿𝐴𝐵 = 𝜇0𝑟𝑙𝑠𝑡𝑎𝑐𝑘∫ 𝑁𝐴𝑁𝐵𝑔𝜃−1𝑑𝜃
2𝜋
0
(2.26)
where 𝜇0, 𝑟, 𝑙𝑠𝑡𝑎𝑐𝑘, 𝑁𝐴, 𝑁𝐵, 𝑔𝜃−1, and 𝜃 are the magnetic permeability of the free space, rotor
outer radius, stack length of the machine, winding function of phase A, winding function of
phase B, inverse of the air gap function, and the rotor angle, respectively. 𝐿𝐴𝐴, and 𝐿𝐴𝐵 are the
self-inductance of phase A, and the mutual inductance between phase A and phase B, presented
here as an example. The rest of the matrix inductance element are also calculated in the same
manner considering the spatial displacement between the windings. Fig. 2-9 (a) and Fig. 2-9
(b) show the self-inductance and the mutual inductance of the machine’s phases calculated
using (2.25) and (2.26). The self-inductance of the other two phases are similar to the one
depicted in Fig. 2-9 (a), only displaced by 120 degrees.
Using the coenergy method, the electromagnetic torque is calculated at different rotor
angles, and for various current magnitudes. Equation (2.27) shows the electromagnetic torque,
𝑇 equation.
(a) (b)
Fig. 2-9 (a) Self-inductance of the machine’s phase, (b). Mutual inductance between two phases
𝑇 =1
2[𝐼]𝑇 [
𝜕𝐿(𝜃)
𝜕𝜃] [𝐼] (2.27)
[𝐼] is the current vector, which for a three phase machine consists of the currents of the three
phases, and 𝜕𝐿/𝜕𝜃 is the derivative of the inductance matrix with respect to the rotor angle, 𝜃.
Using (2.27) the torque-angle curves of the SynRM for various phase currents are obtained.
0.09
0.1
0.11
0.12
0.13
0.14
0.15
0.16
0 50 100 150 200 250 300 350
Ind
uct
ance
(H
)
Rotor angle (mechanical degrees)
-0.12
-0.1
-0.08
-0.06
-0.04
-0.02
0
0.02
0 50 100 150 200 250 300 350
Ind
uct
ance
(H
)
Rotor angle (mechanical degrees)
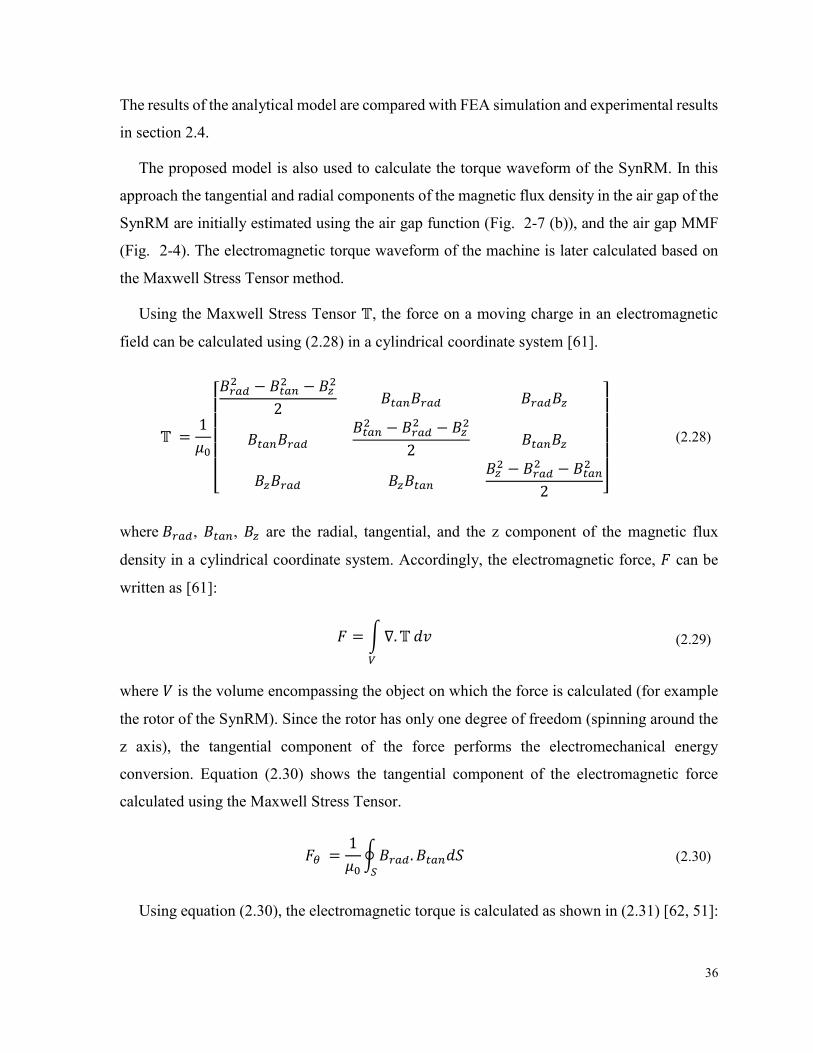
36
The results of the analytical model are compared with FEA simulation and experimental results
in section 2.4.
The proposed model is also used to calculate the torque waveform of the SynRM. In this
approach the tangential and radial components of the magnetic flux density in the air gap of the
SynRM are initially estimated using the air gap function (Fig. 2-7 (b)), and the air gap MMF
(Fig. 2-4). The electromagnetic torque waveform of the machine is later calculated based on
the Maxwell Stress Tensor method.
Using the Maxwell Stress Tensor 𝕋, the force on a moving charge in an electromagnetic
field can be calculated using (2.28) in a cylindrical coordinate system [61].
𝕋 =1
𝜇0
[ 𝐵𝑟𝑎𝑑2 − 𝐵𝑡𝑎𝑛
2 − 𝐵𝑧2
2𝐵𝑡𝑎𝑛𝐵𝑟𝑎𝑑 𝐵𝑟𝑎𝑑𝐵𝑧
𝐵𝑡𝑎𝑛𝐵𝑟𝑎𝑑𝐵𝑡𝑎𝑛2 − 𝐵𝑟𝑎𝑑
2 − 𝐵𝑧2
2𝐵𝑡𝑎𝑛𝐵𝑧
𝐵𝑧𝐵𝑟𝑎𝑑 𝐵𝑧𝐵𝑡𝑎𝑛𝐵𝑧2 − 𝐵𝑟𝑎𝑑
2 − 𝐵𝑡𝑎𝑛2
2 ]
(2.28)
where 𝐵𝑟𝑎𝑑, 𝐵𝑡𝑎𝑛, 𝐵𝑧 are the radial, tangential, and the z component of the magnetic flux
density in a cylindrical coordinate system. Accordingly, the electromagnetic force, 𝐹 can be
written as [61]:
𝐹 = ∫∇.𝕋 𝑑𝑣
𝑉
(2.29)
where 𝑉 is the volume encompassing the object on which the force is calculated (for example
the rotor of the SynRM). Since the rotor has only one degree of freedom (spinning around the
z axis), the tangential component of the force performs the electromechanical energy
conversion. Equation (2.30) shows the tangential component of the electromagnetic force
calculated using the Maxwell Stress Tensor.
𝐹𝜃 =1
𝜇0∮𝐵𝑟𝑎𝑑. 𝐵𝑡𝑎𝑛𝑑𝑆
𝑆
(2.30)
Using equation (2.30), the electromagnetic torque is calculated as shown in (2.31) [62, 51]:
37
𝑇 =1
𝜇0∮𝑟. 𝐵𝑟𝑎𝑑. 𝐵𝑡𝑎𝑛𝑑𝑆
𝑆
(2.31)
where 𝑆, and 𝑟 are the surface of integration which in this case is a cylinder enclosing the rotor,
located in the air gap of the machine, and the rotor outer radius, respectively. Equation (2.31)
can be rewritten as [29]:
𝑇 =𝑟2
𝜇0∫ ∫ 𝐵𝑟𝑎𝑑. 𝐵𝑡𝑎𝑛𝑑𝜃𝑑𝑙
𝑙𝑠𝑡𝑎𝑐𝑘
0
2𝜋
0
(2.32)
where 𝜃, and 𝑙𝑠𝑡𝑎𝑐𝑘 are the rotor angle, and the stack length, respectively.
(a) (b)
Fig. 2-10 Magnetic flux density components in the air gap, (a). Radial component, and (b). Tangential
component
To obtain the radial and tangential components of the air gap magnetic flux density, the air
gap function and the air gap MMF equations are used. The radial component of the magnetic
flux in the air gap, 𝜑𝑟𝑎𝑑 is calculated for 360 points located in the air gap of the machine
enclosing the rotor (the air gap function and the winding function are also calculated with one
degree resolution). The tangential component of the air gap flux, 𝜑𝑡𝑎𝑛 is also calculated using
the air gap MMF and the reluctance of the tangential flux path, ℛ𝑎𝑔𝑡𝑎𝑛. The two components
are shown in equation (2.33):
-2
-1.5
-1
-0.5
0
0.5
1
1.5
2
0 60 120 180 240 300 360
Mag
net
ic f
lux d
ensi
ty (
T)
Rotor angle (mechanical degrees)
-0.06-0.05-0.04-0.03-0.02-0.01
00.010.020.030.040.050.06
0 60 120 180 240 300 360
Mag
net
ic f
lux d
ensi
ty (
T)
Rotor angle (mechanical degrees)
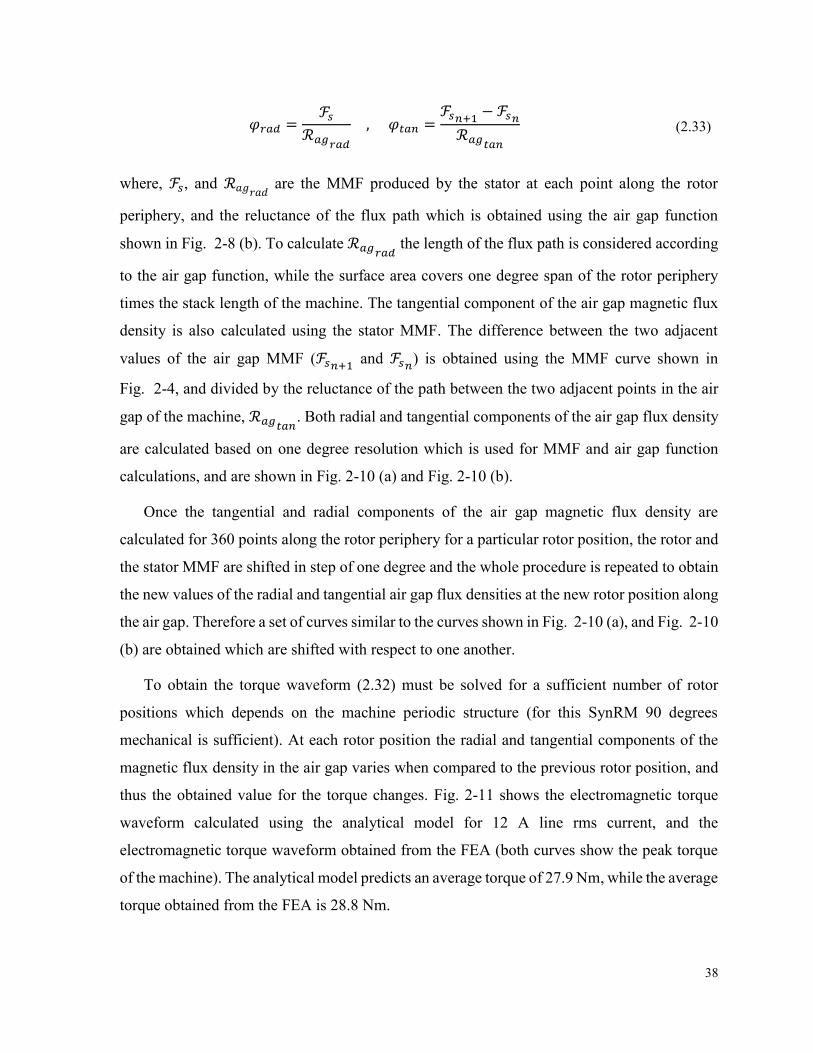
38
𝜑𝑟𝑎𝑑 =ℱ𝑠
ℛ𝑎𝑔𝑟𝑎𝑑 , 𝜑𝑡𝑎𝑛 =
ℱ𝑠𝑛+1 −ℱ𝑠𝑛ℛ𝑎𝑔𝑡𝑎𝑛
(2.33)
where, ℱ𝑠, and ℛ𝑎𝑔𝑟𝑎𝑑 are the MMF produced by the stator at each point along the rotor
periphery, and the reluctance of the flux path which is obtained using the air gap function
shown in Fig. 2-8 (b). To calculate ℛ𝑎𝑔𝑟𝑎𝑑 the length of the flux path is considered according
to the air gap function, while the surface area covers one degree span of the rotor periphery
times the stack length of the machine. The tangential component of the air gap magnetic flux
density is also calculated using the stator MMF. The difference between the two adjacent
values of the air gap MMF (ℱ𝑠𝑛+1 and ℱ𝑠𝑛) is obtained using the MMF curve shown in
Fig. 2-4, and divided by the reluctance of the path between the two adjacent points in the air
gap of the machine, ℛ𝑎𝑔𝑡𝑎𝑛. Both radial and tangential components of the air gap flux density
are calculated based on one degree resolution which is used for MMF and air gap function
calculations, and are shown in Fig. 2-10 (a) and Fig. 2-10 (b).
Once the tangential and radial components of the air gap magnetic flux density are
calculated for 360 points along the rotor periphery for a particular rotor position, the rotor and
the stator MMF are shifted in step of one degree and the whole procedure is repeated to obtain
the new values of the radial and tangential air gap flux densities at the new rotor position along
the air gap. Therefore a set of curves similar to the curves shown in Fig. 2-10 (a), and Fig. 2-10
(b) are obtained which are shifted with respect to one another.
To obtain the torque waveform (2.32) must be solved for a sufficient number of rotor
positions which depends on the machine periodic structure (for this SynRM 90 degrees
mechanical is sufficient). At each rotor position the radial and tangential components of the
magnetic flux density in the air gap varies when compared to the previous rotor position, and
thus the obtained value for the torque changes. Fig. 2-11 shows the electromagnetic torque
waveform calculated using the analytical model for 12 A line rms current, and the
electromagnetic torque waveform obtained from the FEA (both curves show the peak torque
of the machine). The analytical model predicts an average torque of 27.9 Nm, while the average
torque obtained from the FEA is 28.8 Nm.
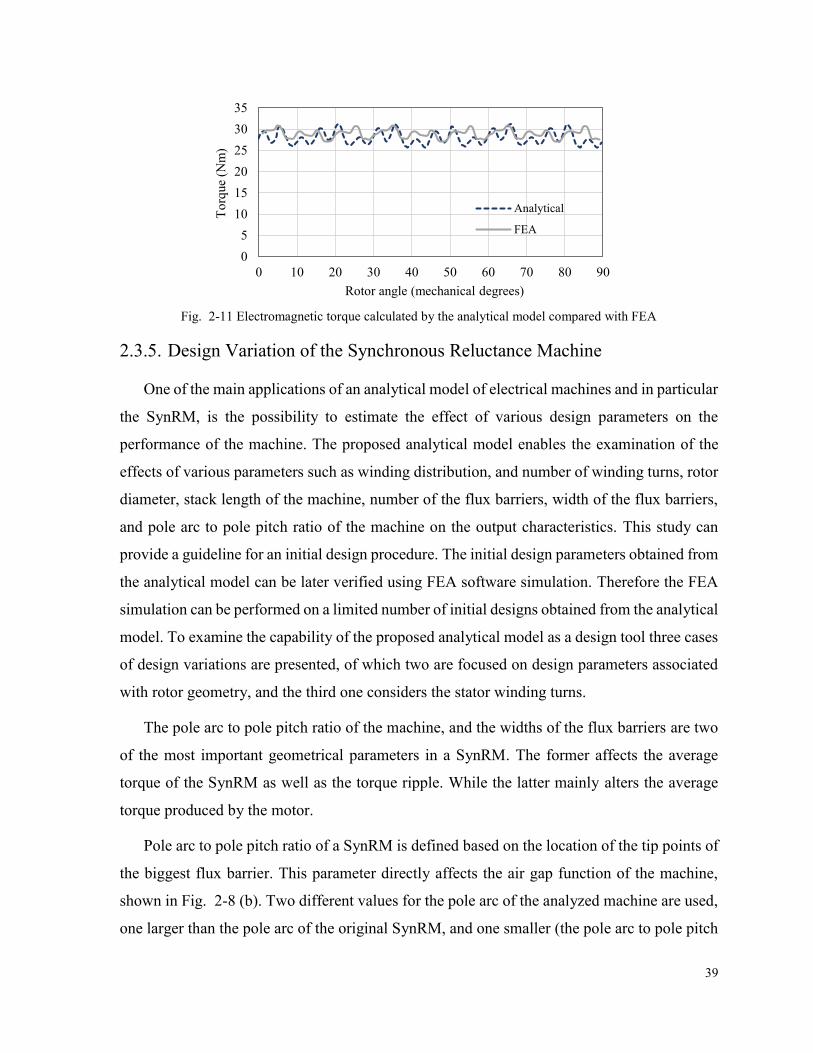
39
Fig. 2-11 Electromagnetic torque calculated by the analytical model compared with FEA
2.3.5. Design Variation of the Synchronous Reluctance Machine
One of the main applications of an analytical model of electrical machines and in particular
the SynRM, is the possibility to estimate the effect of various design parameters on the
performance of the machine. The proposed analytical model enables the examination of the
effects of various parameters such as winding distribution, and number of winding turns, rotor
diameter, stack length of the machine, number of the flux barriers, width of the flux barriers,
and pole arc to pole pitch ratio of the machine on the output characteristics. This study can
provide a guideline for an initial design procedure. The initial design parameters obtained from
the analytical model can be later verified using FEA software simulation. Therefore the FEA
simulation can be performed on a limited number of initial designs obtained from the analytical
model. To examine the capability of the proposed analytical model as a design tool three cases
of design variations are presented, of which two are focused on design parameters associated
with rotor geometry, and the third one considers the stator winding turns.
The pole arc to pole pitch ratio of the machine, and the widths of the flux barriers are two
of the most important geometrical parameters in a SynRM. The former affects the average
torque of the SynRM as well as the torque ripple. While the latter mainly alters the average
torque produced by the motor.
Pole arc to pole pitch ratio of a SynRM is defined based on the location of the tip points of
the biggest flux barrier. This parameter directly affects the air gap function of the machine,
shown in Fig. 2-8 (b). Two different values for the pole arc of the analyzed machine are used,
one larger than the pole arc of the original SynRM, and one smaller (the pole arc to pole pitch
0
5
10
15
20
25
30
35
0 10 20 30 40 50 60 70 80 90
To
rque
(Nm
)
Rotor angle (mechanical degrees)
Analytical
FEA
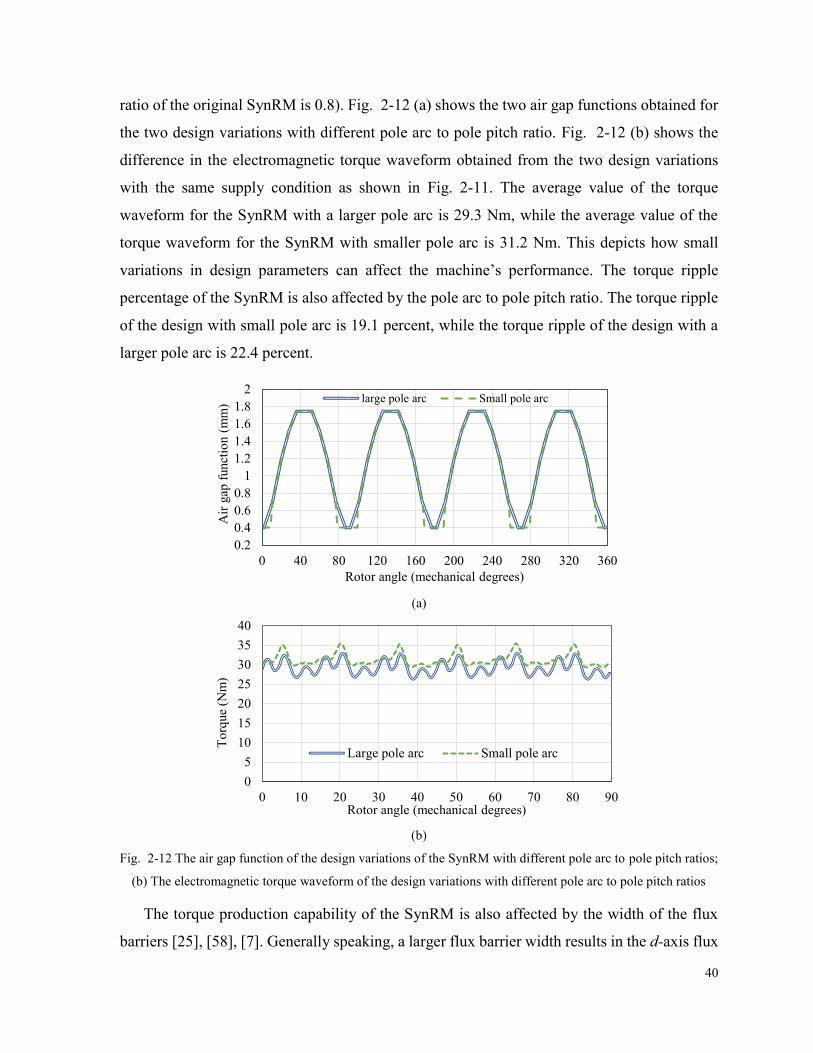
40
ratio of the original SynRM is 0.8). Fig. 2-12 (a) shows the two air gap functions obtained for
the two design variations with different pole arc to pole pitch ratio. Fig. 2-12 (b) shows the
difference in the electromagnetic torque waveform obtained from the two design variations
with the same supply condition as shown in Fig. 2-11. The average value of the torque
waveform for the SynRM with a larger pole arc is 29.3 Nm, while the average value of the
torque waveform for the SynRM with smaller pole arc is 31.2 Nm. This depicts how small
variations in design parameters can affect the machine’s performance. The torque ripple
percentage of the SynRM is also affected by the pole arc to pole pitch ratio. The torque ripple
of the design with small pole arc is 19.1 percent, while the torque ripple of the design with a
larger pole arc is 22.4 percent.
(a)
(b)
Fig. 2-12 The air gap function of the design variations of the SynRM with different pole arc to pole pitch ratios;
(b) The electromagnetic torque waveform of the design variations with different pole arc to pole pitch ratios
The torque production capability of the SynRM is also affected by the width of the flux
barriers [25], [58], [7]. Generally speaking, a larger flux barrier width results in the d-axis flux
0.2
0.4
0.6
0.8
1
1.2
1.4
1.6
1.8
2
0 40 80 120 160 200 240 280 320 360
Air
gap
funct
ion (
mm
)
Rotor angle (mechanical degrees)
large pole arc Small pole arc
0
5
10
15
20
25
30
35
40
0 10 20 30 40 50 60 70 80 90
To
rque
(Nm
)
Rotor angle (mechanical degrees)
Large pole arc Small pole arc
41
reduction due to the smaller available area, as well as the saturation of the steel core. For this
study an additional width of 1 mm is added to each flux barrier of the SynRM. The air gap
function of the machine shown in Fig. 2-8 (b) is modified to account for the effect of the larger
flux barrier width. The air gap function of this design variation is shown in Fig. 2-13 (a), and
compared with the air gap function of the base SynRM. Fig. 2-13 (b) compares the torque
waveforms obtained from the analytical model. The average value of the torque waveform is
27.03 Nm which is 0.9 Nm less than the average torque obtained from the base SynRM (shown
in Fig. 2-8).
(a)
(b)
Fig. 2-13 The air gap function of the design variations of the SynRM with different flux barrier widths; (b) The
electromagnetic torque waveform comparison
The effect of stator parameters such as winding configuration is also examined using the
proposed analytical model. Here the effect of the number of the winding turns on the torque
production capability of the SynRM is examined using the proposed analytical model, and the
0.2
0.6
1
1.4
1.8
2.2
0 40 80 120 160 200 240 280 320 360
Air
gap
funct
ion (
mm
)
Rotor angle (mechanical degrees)
SynRM with larger flux barrier width Original SynRM
0
5
10
15
20
25
30
35
0 10 20 30 40 50 60 70 80 90
Torq
ue
(Nm
)
Rotor angle (mechanical degrees)
SynRM with larger flux barrier width
Original SynRM
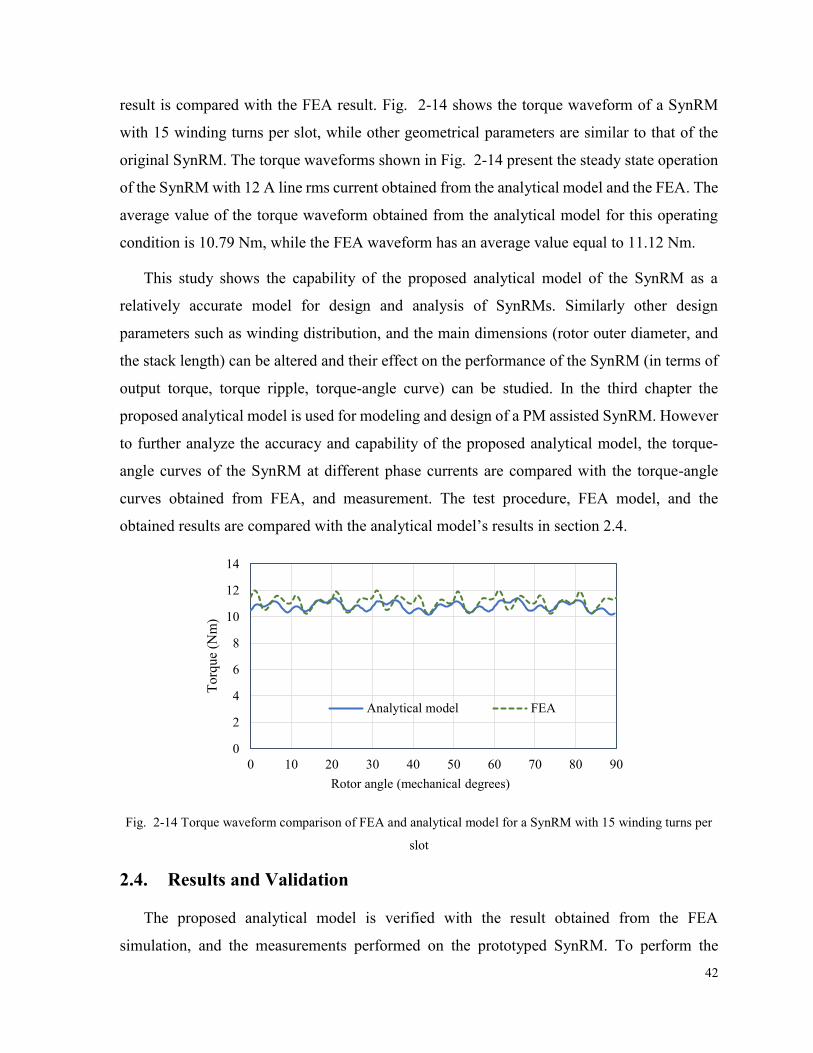
42
result is compared with the FEA result. Fig. 2-14 shows the torque waveform of a SynRM
with 15 winding turns per slot, while other geometrical parameters are similar to that of the
original SynRM. The torque waveforms shown in Fig. 2-14 present the steady state operation
of the SynRM with 12 A line rms current obtained from the analytical model and the FEA. The
average value of the torque waveform obtained from the analytical model for this operating
condition is 10.79 Nm, while the FEA waveform has an average value equal to 11.12 Nm.
This study shows the capability of the proposed analytical model of the SynRM as a
relatively accurate model for design and analysis of SynRMs. Similarly other design
parameters such as winding distribution, and the main dimensions (rotor outer diameter, and
the stack length) can be altered and their effect on the performance of the SynRM (in terms of
output torque, torque ripple, torque-angle curve) can be studied. In the third chapter the
proposed analytical model is used for modeling and design of a PM assisted SynRM. However
to further analyze the accuracy and capability of the proposed analytical model, the torque-
angle curves of the SynRM at different phase currents are compared with the torque-angle
curves obtained from FEA, and measurement. The test procedure, FEA model, and the
obtained results are compared with the analytical model’s results in section 2.4.
Fig. 2-14 Torque waveform comparison of FEA and analytical model for a SynRM with 15 winding turns per
slot
2.4. Results and Validation
The proposed analytical model is verified with the result obtained from the FEA
simulation, and the measurements performed on the prototyped SynRM. To perform the
0
2
4
6
8
10
12
14
0 10 20 30 40 50 60 70 80 90
Torq
ue
(Nm
)
Rotor angle (mechanical degrees)
Analytical model FEA
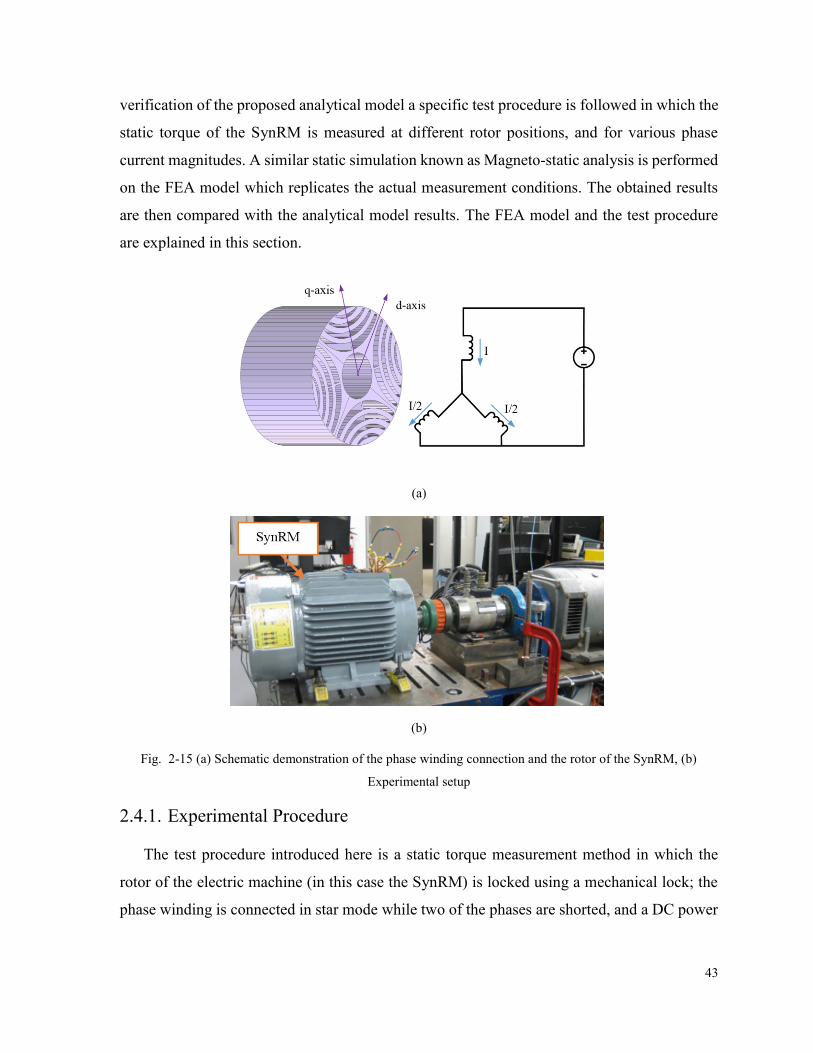
43
verification of the proposed analytical model a specific test procedure is followed in which the
static torque of the SynRM is measured at different rotor positions, and for various phase
current magnitudes. A similar static simulation known as Magneto-static analysis is performed
on the FEA model which replicates the actual measurement conditions. The obtained results
are then compared with the analytical model results. The FEA model and the test procedure
are explained in this section.
(a)
(b)
Fig. 2-15 (a) Schematic demonstration of the phase winding connection and the rotor of the SynRM, (b)
Experimental setup
2.4.1. Experimental Procedure
The test procedure introduced here is a static torque measurement method in which the
rotor of the electric machine (in this case the SynRM) is locked using a mechanical lock; the
phase winding is connected in star mode while two of the phases are shorted, and a DC power
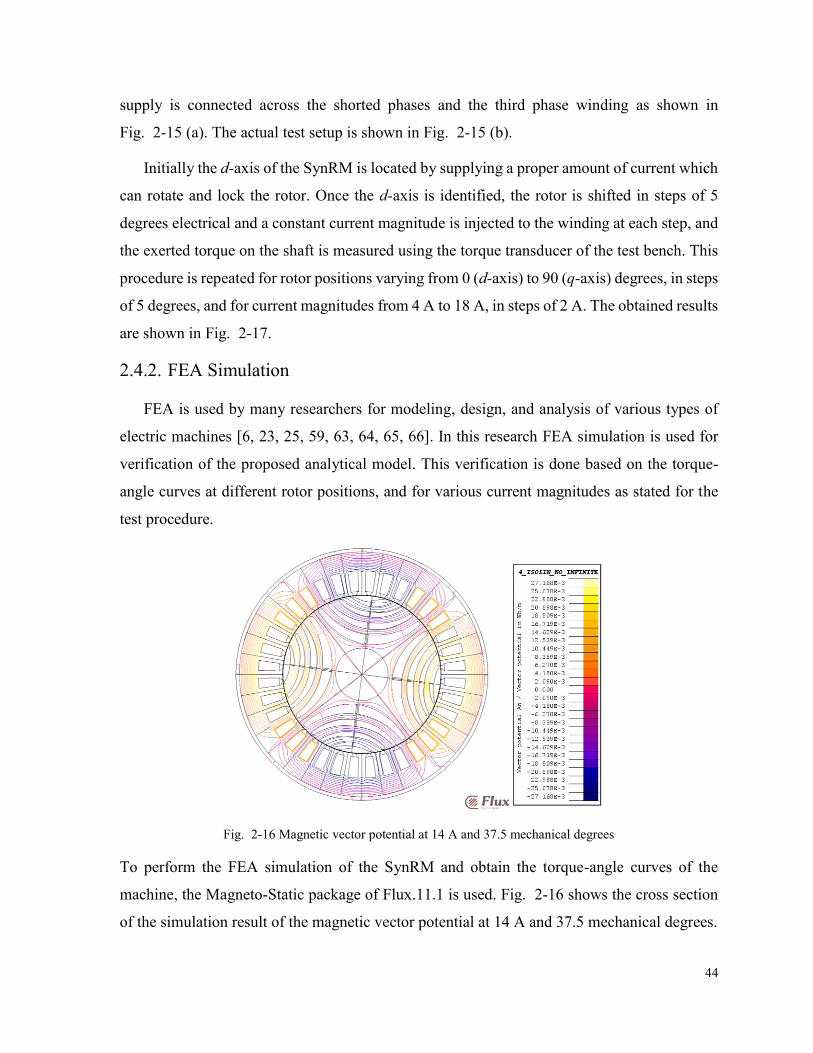
44
supply is connected across the shorted phases and the third phase winding as shown in
Fig. 2-15 (a). The actual test setup is shown in Fig. 2-15 (b).
Initially the d-axis of the SynRM is located by supplying a proper amount of current which
can rotate and lock the rotor. Once the d-axis is identified, the rotor is shifted in steps of 5
degrees electrical and a constant current magnitude is injected to the winding at each step, and
the exerted torque on the shaft is measured using the torque transducer of the test bench. This
procedure is repeated for rotor positions varying from 0 (d-axis) to 90 (q-axis) degrees, in steps
of 5 degrees, and for current magnitudes from 4 A to 18 A, in steps of 2 A. The obtained results
are shown in Fig. 2-17.
2.4.2. FEA Simulation
FEA is used by many researchers for modeling, design, and analysis of various types of
electric machines [6, 23, 25, 59, 63, 64, 65, 66]. In this research FEA simulation is used for
verification of the proposed analytical model. This verification is done based on the torque-
angle curves at different rotor positions, and for various current magnitudes as stated for the
test procedure.
Fig. 2-16 Magnetic vector potential at 14 A and 37.5 mechanical degrees
To perform the FEA simulation of the SynRM and obtain the torque-angle curves of the
machine, the Magneto-Static package of Flux.11.1 is used. Fig. 2-16 shows the cross section
of the simulation result of the magnetic vector potential at 14 A and 37.5 mechanical degrees.
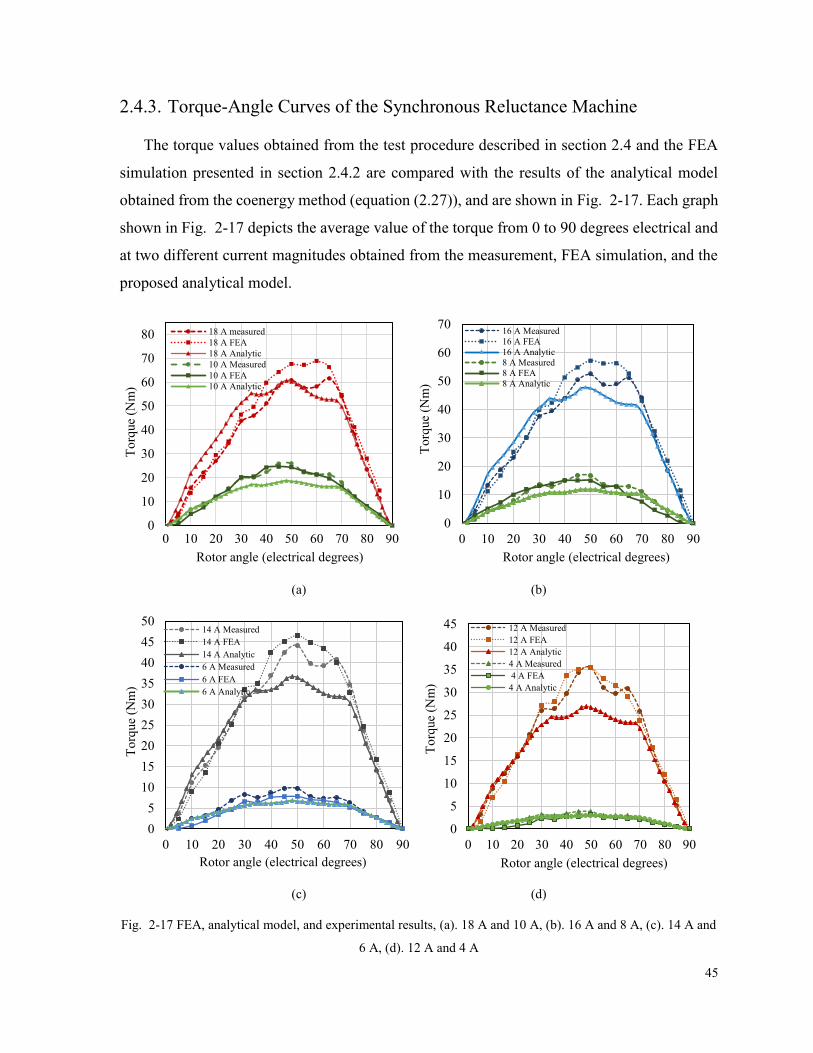
45
2.4.3. Torque-Angle Curves of the Synchronous Reluctance Machine
The torque values obtained from the test procedure described in section 2.4 and the FEA
simulation presented in section 2.4.2 are compared with the results of the analytical model
obtained from the coenergy method (equation (2.27)), and are shown in Fig. 2-17. Each graph
shown in Fig. 2-17 depicts the average value of the torque from 0 to 90 degrees electrical and
at two different current magnitudes obtained from the measurement, FEA simulation, and the
proposed analytical model.
(a) (b)
(c) (d)
Fig. 2-17 FEA, analytical model, and experimental results, (a). 18 A and 10 A, (b). 16 A and 8 A, (c). 14 A and
6 A, (d). 12 A and 4 A
0
10
20
30
40
50
60
70
80
0 10 20 30 40 50 60 70 80 90
To
rque
(Nm
)
Rotor angle (electrical degrees)
18 A measured
18 A FEA
18 A Analytic
10 A Measured
10 A FEA
10 A Analytic
0
10
20
30
40
50
60
70
0 10 20 30 40 50 60 70 80 90
To
rque
(Nm
)
Rotor angle (electrical degrees)
16 A Measured16 A FEA
16 A Analytic8 A Measured
8 A FEA8 A Analytic
0
5
10
15
20
25
30
35
40
45
50
0 10 20 30 40 50 60 70 80 90
To
rque
(Nm
)
Rotor angle (electrical degrees)
14 A Measured
14 A FEA
14 A Analytic
6 A Measured
6 A FEA
6 A Analytic
0
5
10
15
20
25
30
35
40
45
0 10 20 30 40 50 60 70 80 90
To
rque
(Nm
)
Rotor angle (electrical degrees)
12 A Measured
12 A FEA
12 A Analytic
4 A Measured
4 A FEA
4 A Analytic
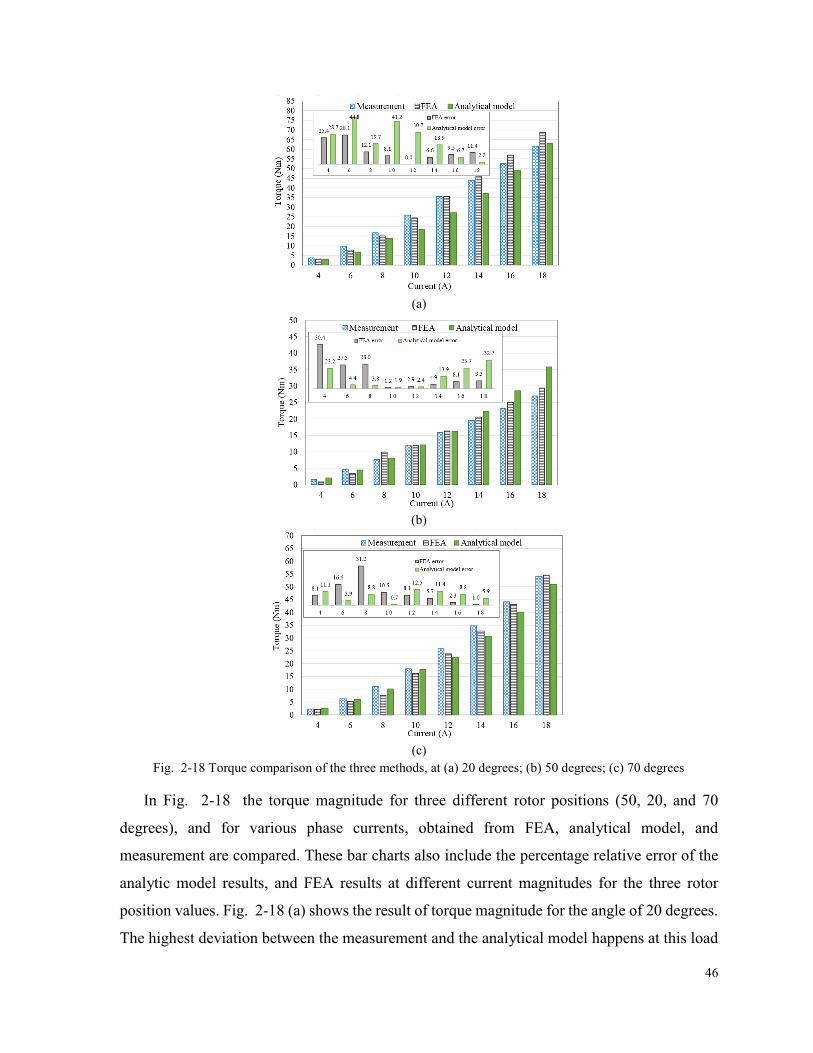
46
(a)
(b)
(c)
Fig. 2-18 Torque comparison of the three methods, at (a) 20 degrees; (b) 50 degrees; (c) 70 degrees
In Fig. 2-18 the torque magnitude for three different rotor positions (50, 20, and 70
degrees), and for various phase currents, obtained from FEA, analytical model, and
measurement are compared. These bar charts also include the percentage relative error of the
analytic model results, and FEA results at different current magnitudes for the three rotor
position values. Fig. 2-18 (a) shows the result of torque magnitude for the angle of 20 degrees.
The highest deviation between the measurement and the analytical model happens at this load
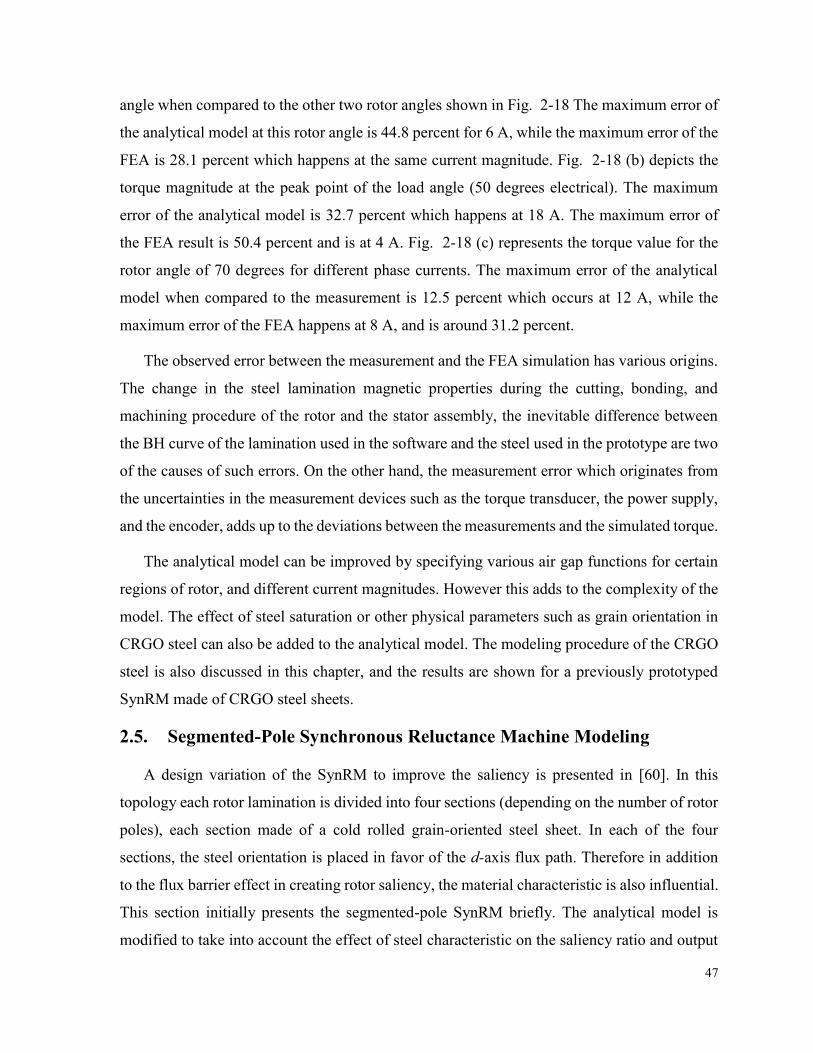
47
angle when compared to the other two rotor angles shown in Fig. 2-18 The maximum error of
the analytical model at this rotor angle is 44.8 percent for 6 A, while the maximum error of the
FEA is 28.1 percent which happens at the same current magnitude. Fig. 2-18 (b) depicts the
torque magnitude at the peak point of the load angle (50 degrees electrical). The maximum
error of the analytical model is 32.7 percent which happens at 18 A. The maximum error of
the FEA result is 50.4 percent and is at 4 A. Fig. 2-18 (c) represents the torque value for the
rotor angle of 70 degrees for different phase currents. The maximum error of the analytical
model when compared to the measurement is 12.5 percent which occurs at 12 A, while the
maximum error of the FEA happens at 8 A, and is around 31.2 percent.
The observed error between the measurement and the FEA simulation has various origins.
The change in the steel lamination magnetic properties during the cutting, bonding, and
machining procedure of the rotor and the stator assembly, the inevitable difference between
the BH curve of the lamination used in the software and the steel used in the prototype are two
of the causes of such errors. On the other hand, the measurement error which originates from
the uncertainties in the measurement devices such as the torque transducer, the power supply,
and the encoder, adds up to the deviations between the measurements and the simulated torque.
The analytical model can be improved by specifying various air gap functions for certain
regions of rotor, and different current magnitudes. However this adds to the complexity of the
model. The effect of steel saturation or other physical parameters such as grain orientation in
CRGO steel can also be added to the analytical model. The modeling procedure of the CRGO
steel is also discussed in this chapter, and the results are shown for a previously prototyped
SynRM made of CRGO steel sheets.
2.5. Segmented-Pole Synchronous Reluctance Machine Modeling
A design variation of the SynRM to improve the saliency is presented in [60]. In this
topology each rotor lamination is divided into four sections (depending on the number of rotor
poles), each section made of a cold rolled grain-oriented steel sheet. In each of the four
sections, the steel orientation is placed in favor of the d-axis flux path. Therefore in addition
to the flux barrier effect in creating rotor saliency, the material characteristic is also influential.
This section initially presents the segmented-pole SynRM briefly. The analytical model is
modified to take into account the effect of steel characteristic on the saliency ratio and output
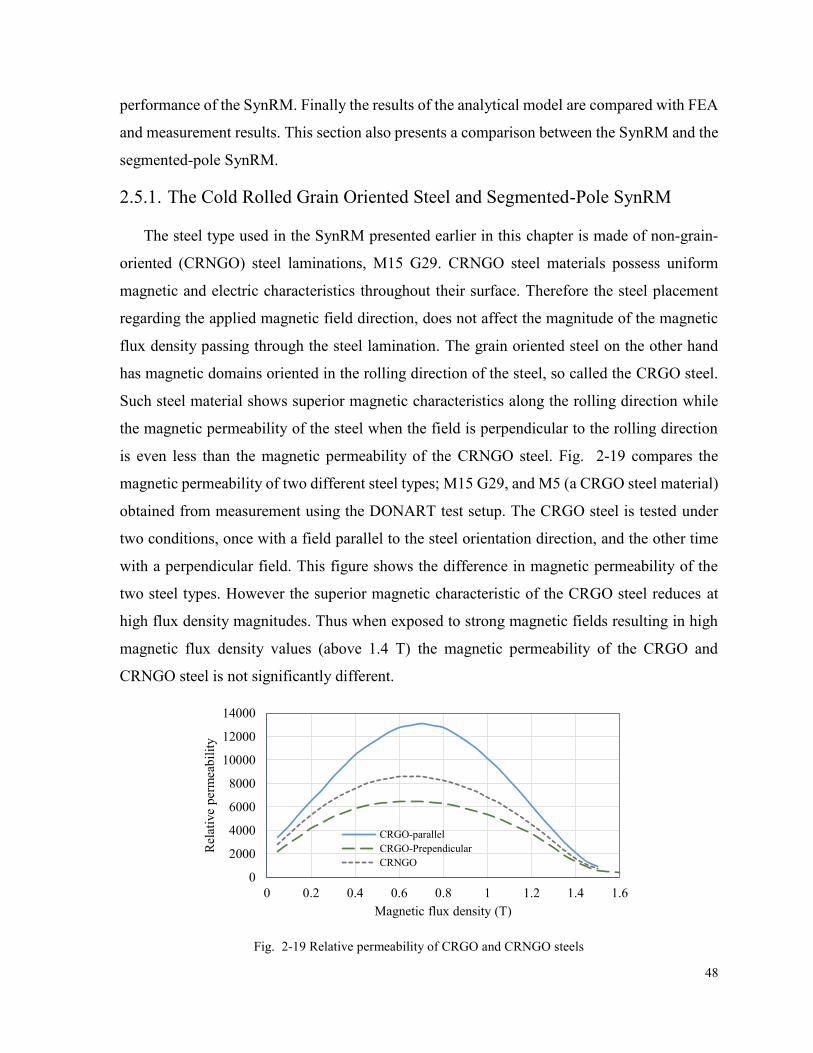
48
performance of the SynRM. Finally the results of the analytical model are compared with FEA
and measurement results. This section also presents a comparison between the SynRM and the
segmented-pole SynRM.
2.5.1. The Cold Rolled Grain Oriented Steel and Segmented-Pole SynRM
The steel type used in the SynRM presented earlier in this chapter is made of non-grain-
oriented (CRNGO) steel laminations, M15 G29. CRNGO steel materials possess uniform
magnetic and electric characteristics throughout their surface. Therefore the steel placement
regarding the applied magnetic field direction, does not affect the magnitude of the magnetic
flux density passing through the steel lamination. The grain oriented steel on the other hand
has magnetic domains oriented in the rolling direction of the steel, so called the CRGO steel.
Such steel material shows superior magnetic characteristics along the rolling direction while
the magnetic permeability of the steel when the field is perpendicular to the rolling direction
is even less than the magnetic permeability of the CRNGO steel. Fig. 2-19 compares the
magnetic permeability of two different steel types; M15 G29, and M5 (a CRGO steel material)
obtained from measurement using the DONART test setup. The CRGO steel is tested under
two conditions, once with a field parallel to the steel orientation direction, and the other time
with a perpendicular field. This figure shows the difference in magnetic permeability of the
two steel types. However the superior magnetic characteristic of the CRGO steel reduces at
high flux density magnitudes. Thus when exposed to strong magnetic fields resulting in high
magnetic flux density values (above 1.4 T) the magnetic permeability of the CRGO and
CRNGO steel is not significantly different.
Fig. 2-19 Relative permeability of CRGO and CRNGO steels
0
2000
4000
6000
8000
10000
12000
14000
0 0.2 0.4 0.6 0.8 1 1.2 1.4 1.6
Rel
ativ
e p
erm
eab
ilit
y
Magnetic flux density (T)
CRGO-parallel
CRGO-Prependicular
CRNGO

49
Using the CRGO steel with the magnetic permeability presented in Fig. 2-19 a segmented-
pole SynRM is designed and prototyped [67]. Each rotor lamination is made of four separate
pieces of CRGO steel with the rolling direction of each parallel to the d-axis flux path of the
rotor. The rotor dimensions are the same as the rotor of the SynRM introduced earlier in this
chapter (Table. 2-1). Therefore the segmented-pole SynRM and the regular SynRM share the
same stator. Fig. 2-20 (a) shows the rotor and stator laminations of the segmented-pole
SynRM. Fig. 2-20 (b) shows the simulation model of the segmented-pole SynRM. In this
figure green arrows show the rolling direction of each rotor section, while the red arrows
present the path with lower permeability (the perpendicular path). In the following section the
analytical model which was presented earlier in this chapter is modified to account for the
effect of CRGO steel on the output characteristics of the segmented-pole SynRM.
(a) (b)
Fig. 2-20 (a) Stator and rotor laminations of the segmented-pole SynRM; (b) The simulation model of the
segmented-pole SynRM
2.5.2. The Analytical Model of the Segmented-Pole SynRM
The analytical model which was presented in this chapter is also used for modeling the
segmented-pole SynRM. The model is modified to incorporate the effect of steel permeability
in the performance of the segmented-pole SynRM.
In the magnetic circuit of the SynRM with constant MMF produced by the stator winding,
the increased reluctance of the flux path due to the presence of the flux barrier, results in
magnetic flux reduction. In a SynRM the flux barrier reduces the available area for the
magnetic flux, thus resulting in a higher reluctance of the flux path. Earlier in this chapter
equations (2.23) and (2.24) are presented for air gap function calculation. However in (2.24)
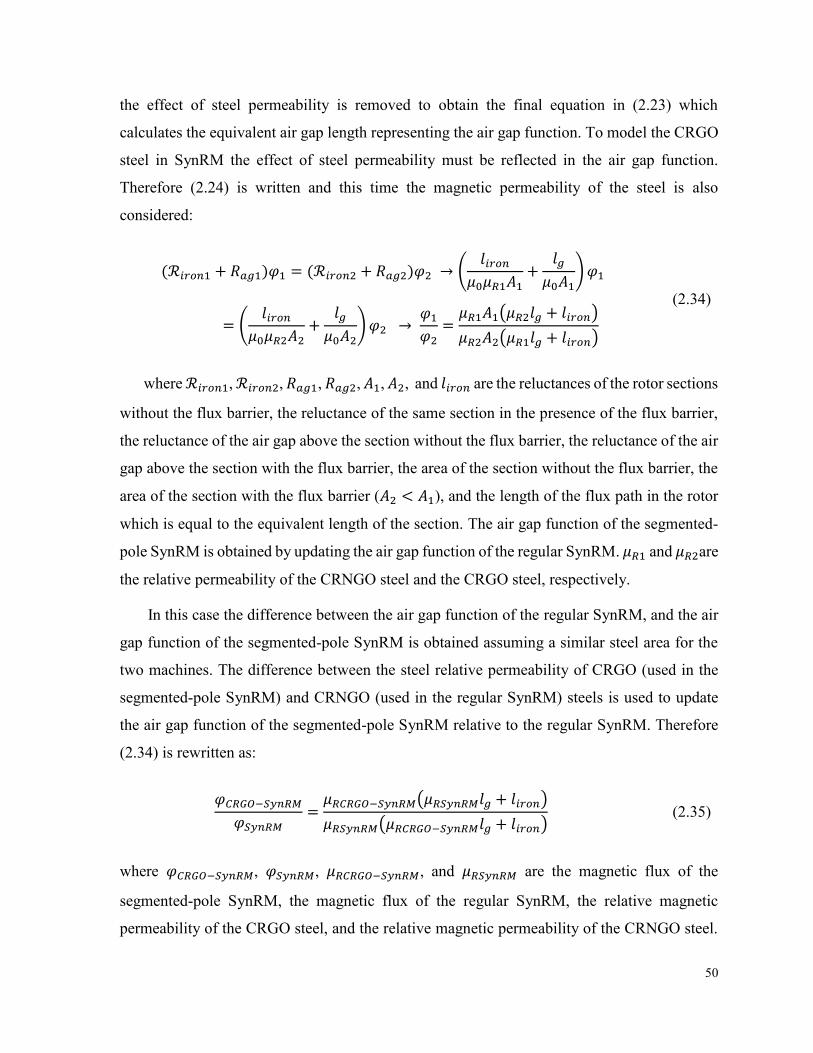
50
the effect of steel permeability is removed to obtain the final equation in (2.23) which
calculates the equivalent air gap length representing the air gap function. To model the CRGO
steel in SynRM the effect of steel permeability must be reflected in the air gap function.
Therefore (2.24) is written and this time the magnetic permeability of the steel is also
considered:
(ℛ𝑖𝑟𝑜𝑛1 + 𝑅𝑎𝑔1)𝜑1 = (ℛ𝑖𝑟𝑜𝑛2 + 𝑅𝑎𝑔2)𝜑2 → (𝑙𝑖𝑟𝑜𝑛
𝜇0𝜇𝑅1𝐴1+
𝑙𝑔
𝜇0𝐴1)𝜑1
= (𝑙𝑖𝑟𝑜𝑛
𝜇0𝜇𝑅2𝐴2+
𝑙𝑔
𝜇0𝐴2)𝜑2 →
𝜑1𝜑2
=𝜇𝑅1𝐴1(𝜇𝑅2𝑙𝑔 + 𝑙𝑖𝑟𝑜𝑛)
𝜇𝑅2𝐴2(𝜇𝑅1𝑙𝑔 + 𝑙𝑖𝑟𝑜𝑛)
(2.34)
where ℛ𝑖𝑟𝑜𝑛1, ℛ𝑖𝑟𝑜𝑛2, 𝑅𝑎𝑔1, 𝑅𝑎𝑔2, 𝐴1, 𝐴2, and 𝑙𝑖𝑟𝑜𝑛 are the reluctances of the rotor sections
without the flux barrier, the reluctance of the same section in the presence of the flux barrier,
the reluctance of the air gap above the section without the flux barrier, the reluctance of the air
gap above the section with the flux barrier, the area of the section without the flux barrier, the
area of the section with the flux barrier (𝐴2 < 𝐴1), and the length of the flux path in the rotor
which is equal to the equivalent length of the section. The air gap function of the segmented-
pole SynRM is obtained by updating the air gap function of the regular SynRM. 𝜇𝑅1 and 𝜇𝑅2are
the relative permeability of the CRNGO steel and the CRGO steel, respectively.
In this case the difference between the air gap function of the regular SynRM, and the air
gap function of the segmented-pole SynRM is obtained assuming a similar steel area for the
two machines. The difference between the steel relative permeability of CRGO (used in the
segmented-pole SynRM) and CRNGO (used in the regular SynRM) steels is used to update
the air gap function of the segmented-pole SynRM relative to the regular SynRM. Therefore
(2.34) is rewritten as:
𝜑𝐶𝑅𝐺𝑂−𝑆𝑦𝑛𝑅𝑀
𝜑𝑆𝑦𝑛𝑅𝑀=𝜇𝑅𝐶𝑅𝐺𝑂−𝑆𝑦𝑛𝑅𝑀(𝜇𝑅𝑆𝑦𝑛𝑅𝑀𝑙𝑔 + 𝑙𝑖𝑟𝑜𝑛)
𝜇𝑅𝑆𝑦𝑛𝑅𝑀(𝜇𝑅𝐶𝑅𝐺𝑂−𝑆𝑦𝑛𝑅𝑀𝑙𝑔 + 𝑙𝑖𝑟𝑜𝑛) (2.35)
where 𝜑𝐶𝑅𝐺𝑂−𝑆𝑦𝑛𝑅𝑀, 𝜑𝑆𝑦𝑛𝑅𝑀, 𝜇𝑅𝐶𝑅𝐺𝑂−𝑆𝑦𝑛𝑅𝑀, and 𝜇𝑅𝑆𝑦𝑛𝑅𝑀 are the magnetic flux of the
segmented-pole SynRM, the magnetic flux of the regular SynRM, the relative magnetic
permeability of the CRGO steel, and the relative magnetic permeability of the CRNGO steel.
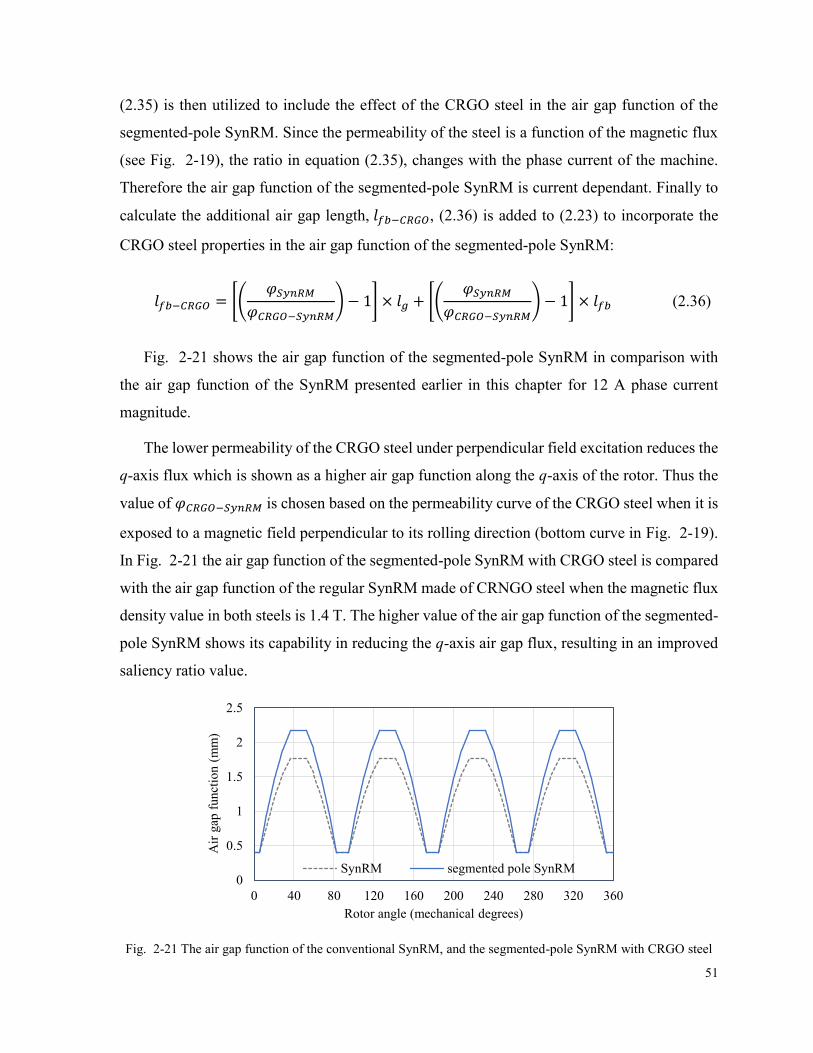
51
(2.35) is then utilized to include the effect of the CRGO steel in the air gap function of the
segmented-pole SynRM. Since the permeability of the steel is a function of the magnetic flux
(see Fig. 2-19), the ratio in equation (2.35), changes with the phase current of the machine.
Therefore the air gap function of the segmented-pole SynRM is current dependant. Finally to
calculate the additional air gap length, 𝑙𝑓𝑏−𝐶𝑅𝐺𝑂, (2.36) is added to (2.23) to incorporate the
CRGO steel properties in the air gap function of the segmented-pole SynRM:
𝑙𝑓𝑏−𝐶𝑅𝐺𝑂 = [(𝜑𝑆𝑦𝑛𝑅𝑀
𝜑𝐶𝑅𝐺𝑂−𝑆𝑦𝑛𝑅𝑀) − 1] × 𝑙𝑔 + [(
𝜑𝑆𝑦𝑛𝑅𝑀
𝜑𝐶𝑅𝐺𝑂−𝑆𝑦𝑛𝑅𝑀) − 1] × 𝑙𝑓𝑏 (2.36)
Fig. 2-21 shows the air gap function of the segmented-pole SynRM in comparison with
the air gap function of the SynRM presented earlier in this chapter for 12 A phase current
magnitude.
The lower permeability of the CRGO steel under perpendicular field excitation reduces the
q-axis flux which is shown as a higher air gap function along the q-axis of the rotor. Thus the
value of 𝜑𝐶𝑅𝐺𝑂−𝑆𝑦𝑛𝑅𝑀 is chosen based on the permeability curve of the CRGO steel when it is
exposed to a magnetic field perpendicular to its rolling direction (bottom curve in Fig. 2-19).
In Fig. 2-21 the air gap function of the segmented-pole SynRM with CRGO steel is compared
with the air gap function of the regular SynRM made of CRNGO steel when the magnetic flux
density value in both steels is 1.4 T. The higher value of the air gap function of the segmented-
pole SynRM shows its capability in reducing the q-axis air gap flux, resulting in an improved
saliency ratio value.
Fig. 2-21 The air gap function of the conventional SynRM, and the segmented-pole SynRM with CRGO steel
0
0.5
1
1.5
2
2.5
0 40 80 120 160 200 240 280 320 360
Air
gap
funct
ion (
mm
)
Rotor angle (mechanical degrees)
SynRM segmented pole SynRM
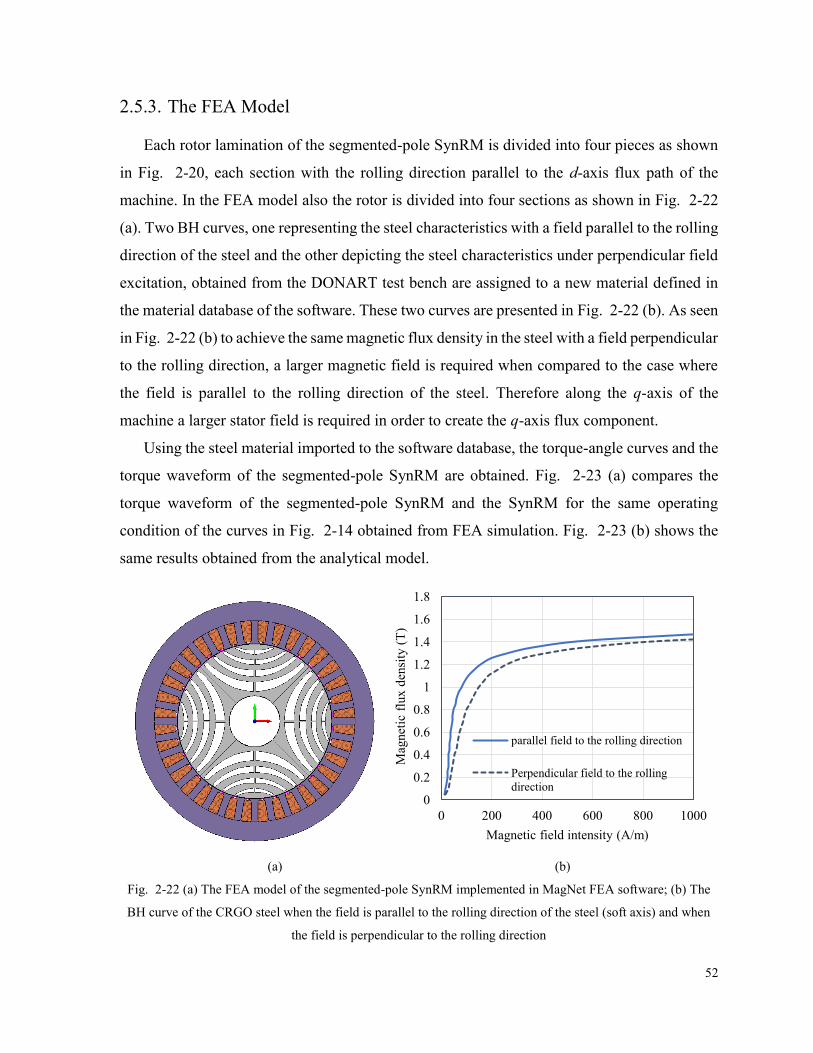
52
2.5.3. The FEA Model
Each rotor lamination of the segmented-pole SynRM is divided into four pieces as shown
in Fig. 2-20, each section with the rolling direction parallel to the d-axis flux path of the
machine. In the FEA model also the rotor is divided into four sections as shown in Fig. 2-22
(a). Two BH curves, one representing the steel characteristics with a field parallel to the rolling
direction of the steel and the other depicting the steel characteristics under perpendicular field
excitation, obtained from the DONART test bench are assigned to a new material defined in
the material database of the software. These two curves are presented in Fig. 2-22 (b). As seen
in Fig. 2-22 (b) to achieve the same magnetic flux density in the steel with a field perpendicular
to the rolling direction, a larger magnetic field is required when compared to the case where
the field is parallel to the rolling direction of the steel. Therefore along the q-axis of the
machine a larger stator field is required in order to create the q-axis flux component.
Using the steel material imported to the software database, the torque-angle curves and the
torque waveform of the segmented-pole SynRM are obtained. Fig. 2-23 (a) compares the
torque waveform of the segmented-pole SynRM and the SynRM for the same operating
condition of the curves in Fig. 2-14 obtained from FEA simulation. Fig. 2-23 (b) shows the
same results obtained from the analytical model.
(a) (b)
Fig. 2-22 (a) The FEA model of the segmented-pole SynRM implemented in MagNet FEA software; (b) The
BH curve of the CRGO steel when the field is parallel to the rolling direction of the steel (soft axis) and when
the field is perpendicular to the rolling direction
0
0.2
0.4
0.6
0.8
1
1.2
1.4
1.6
1.8
0 200 400 600 800 1000
Mag
net
ic f
lux d
ensi
ty (
T)
Magnetic field intensity (A/m)
parallel field to the rolling direction
Perpendicular field to the rolling
direction
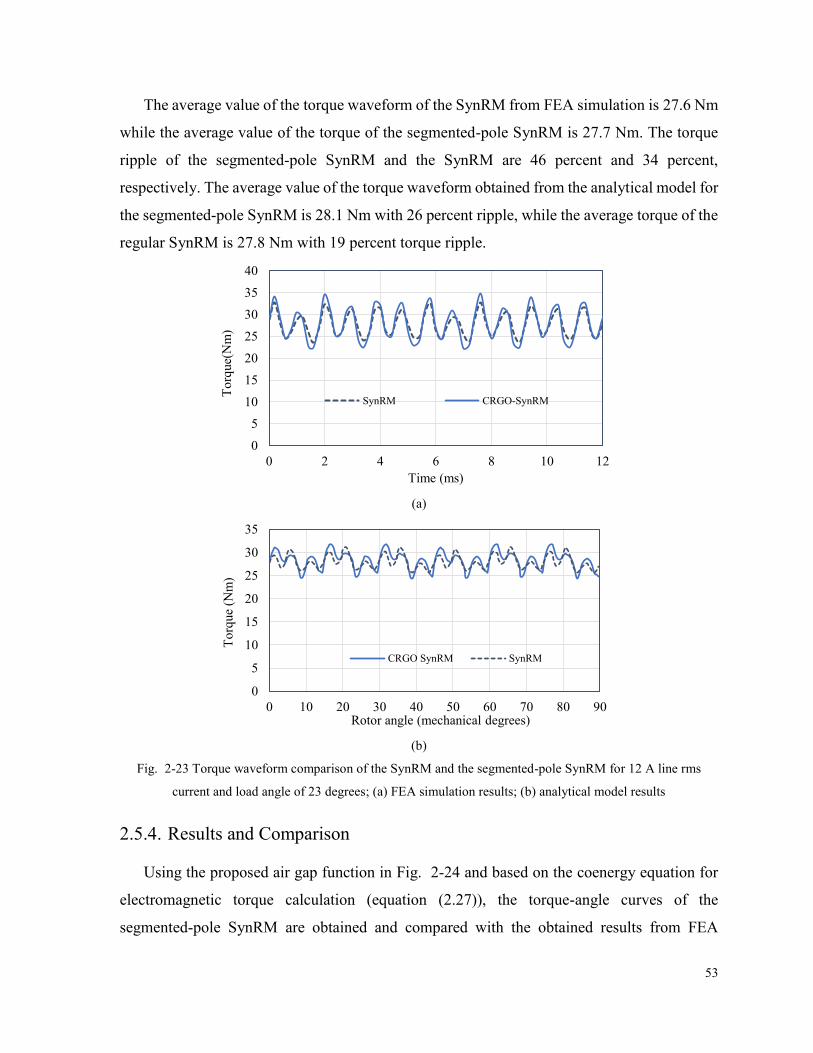
53
The average value of the torque waveform of the SynRM from FEA simulation is 27.6 Nm
while the average value of the torque of the segmented-pole SynRM is 27.7 Nm. The torque
ripple of the segmented-pole SynRM and the SynRM are 46 percent and 34 percent,
respectively. The average value of the torque waveform obtained from the analytical model for
the segmented-pole SynRM is 28.1 Nm with 26 percent ripple, while the average torque of the
regular SynRM is 27.8 Nm with 19 percent torque ripple.
(a)
(b)
Fig. 2-23 Torque waveform comparison of the SynRM and the segmented-pole SynRM for 12 A line rms
current and load angle of 23 degrees; (a) FEA simulation results; (b) analytical model results
2.5.4. Results and Comparison
Using the proposed air gap function in Fig. 2-24 and based on the coenergy equation for
electromagnetic torque calculation (equation (2.27)), the torque-angle curves of the
segmented-pole SynRM are obtained and compared with the obtained results from FEA
0
5
10
15
20
25
30
35
40
0 2 4 6 8 10 12
To
rque(
Nm
)
Time (ms)
SynRM CRGO-SynRM
0
5
10
15
20
25
30
35
0 10 20 30 40 50 60 70 80 90
To
rque
(Nm
)
Rotor angle (mechanical degrees)
CRGO SynRM SynRM
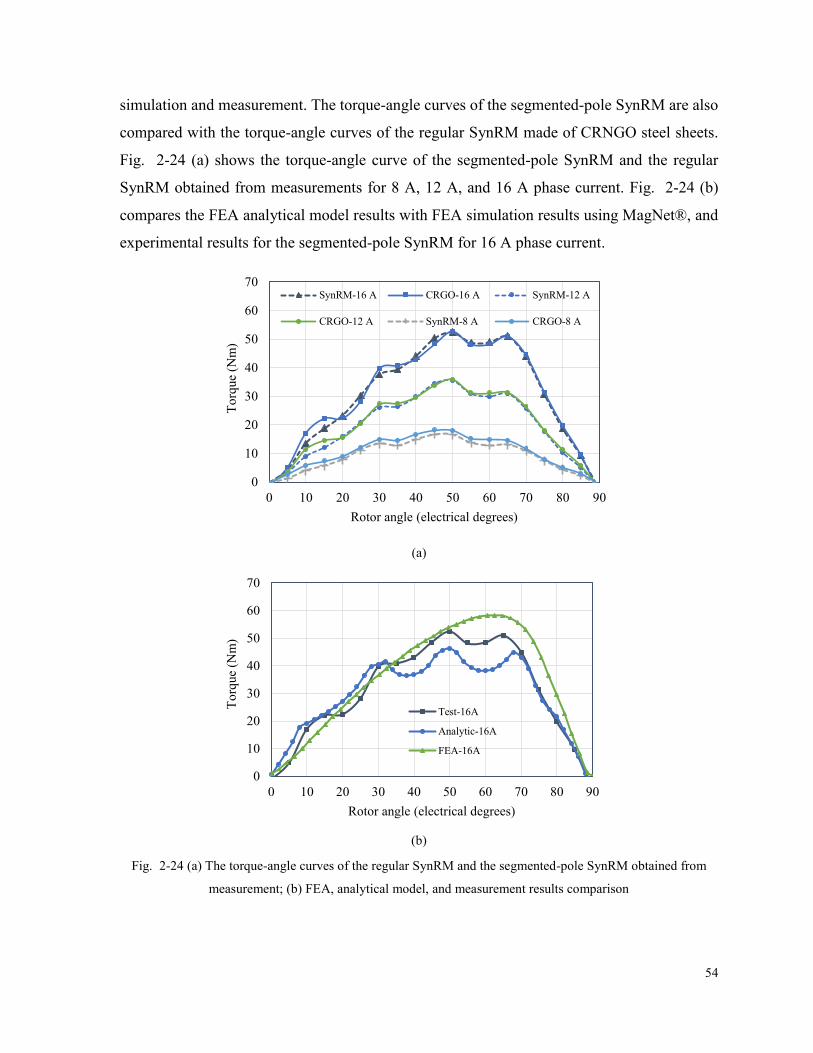
54
simulation and measurement. The torque-angle curves of the segmented-pole SynRM are also
compared with the torque-angle curves of the regular SynRM made of CRNGO steel sheets.
Fig. 2-24 (a) shows the torque-angle curve of the segmented-pole SynRM and the regular
SynRM obtained from measurements for 8 A, 12 A, and 16 A phase current. Fig. 2-24 (b)
compares the FEA analytical model results with FEA simulation results using MagNet®, and
experimental results for the segmented-pole SynRM for 16 A phase current.
(a)
(b)
Fig. 2-24 (a) The torque-angle curves of the regular SynRM and the segmented-pole SynRM obtained from
measurement; (b) FEA, analytical model, and measurement results comparison
0
10
20
30
40
50
60
70
0 10 20 30 40 50 60 70 80 90
To
rque
(Nm
)
Rotor angle (electrical degrees)
SynRM-16 A CRGO-16 A SynRM-12 A
CRGO-12 A SynRM-8 A CRGO-8 A
0
10
20
30
40
50
60
70
0 10 20 30 40 50 60 70 80 90
To
rque
(Nm
)
Rotor angle (electrical degrees)
Test-16A
Analytic-16A
FEA-16A
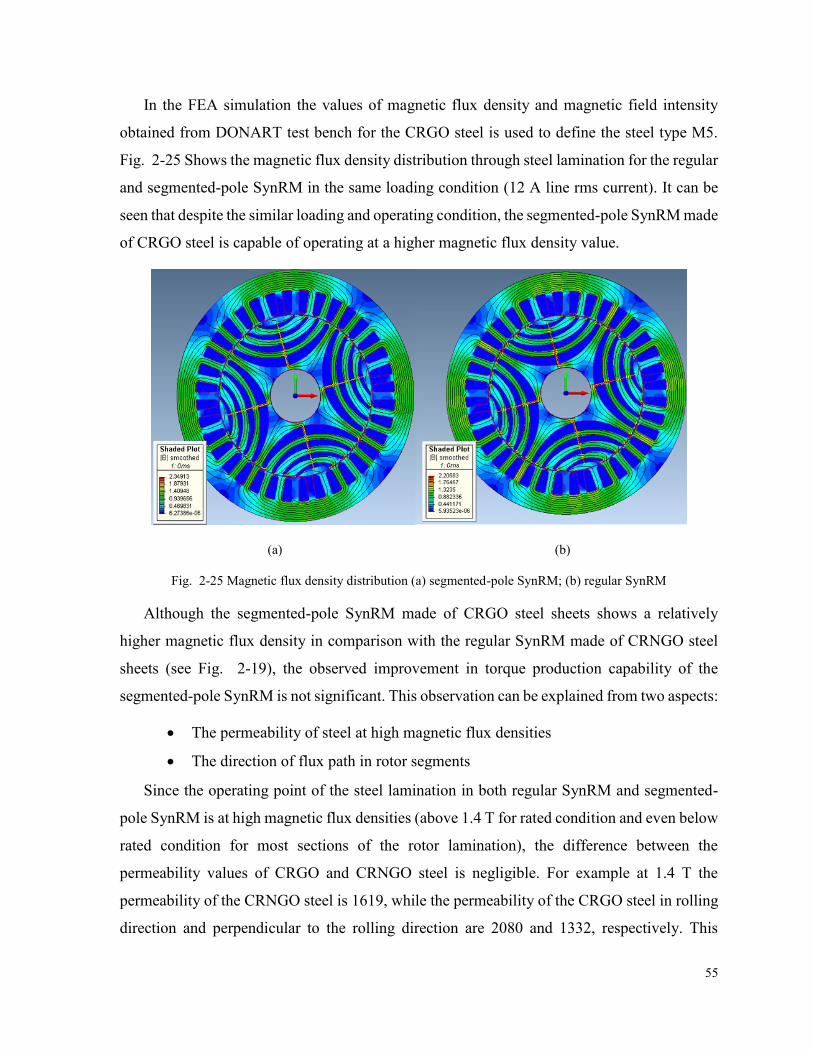
55
In the FEA simulation the values of magnetic flux density and magnetic field intensity
obtained from DONART test bench for the CRGO steel is used to define the steel type M5.
Fig. 2-25 Shows the magnetic flux density distribution through steel lamination for the regular
and segmented-pole SynRM in the same loading condition (12 A line rms current). It can be
seen that despite the similar loading and operating condition, the segmented-pole SynRM made
of CRGO steel is capable of operating at a higher magnetic flux density value.
(a) (b)
Fig. 2-25 Magnetic flux density distribution (a) segmented-pole SynRM; (b) regular SynRM
Although the segmented-pole SynRM made of CRGO steel sheets shows a relatively
higher magnetic flux density in comparison with the regular SynRM made of CRNGO steel
sheets (see Fig. 2-19), the observed improvement in torque production capability of the
segmented-pole SynRM is not significant. This observation can be explained from two aspects:
The permeability of steel at high magnetic flux densities
The direction of flux path in rotor segments
Since the operating point of the steel lamination in both regular SynRM and segmented-
pole SynRM is at high magnetic flux densities (above 1.4 T for rated condition and even below
rated condition for most sections of the rotor lamination), the difference between the
permeability values of CRGO and CRNGO steel is negligible. For example at 1.4 T the
permeability of the CRNGO steel is 1619, while the permeability of the CRGO steel in rolling
direction and perpendicular to the rolling direction are 2080 and 1332, respectively. This
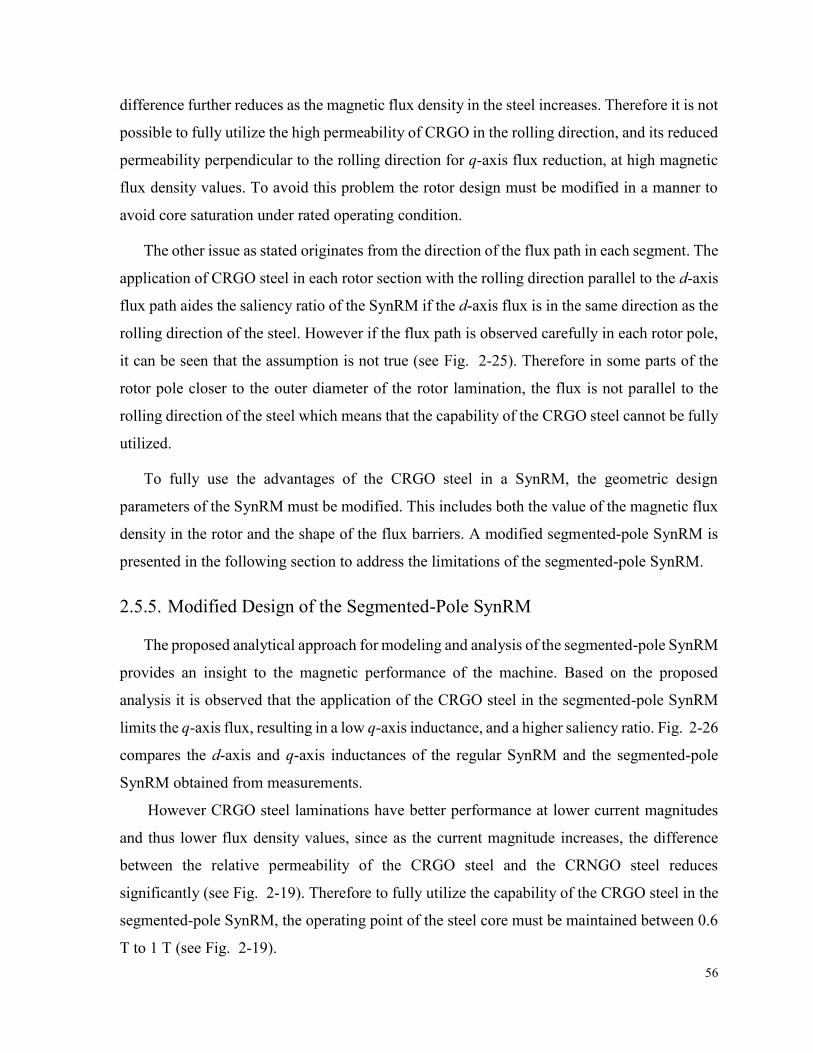
56
difference further reduces as the magnetic flux density in the steel increases. Therefore it is not
possible to fully utilize the high permeability of CRGO in the rolling direction, and its reduced
permeability perpendicular to the rolling direction for q-axis flux reduction, at high magnetic
flux density values. To avoid this problem the rotor design must be modified in a manner to
avoid core saturation under rated operating condition.
The other issue as stated originates from the direction of the flux path in each segment. The
application of CRGO steel in each rotor section with the rolling direction parallel to the d-axis
flux path aides the saliency ratio of the SynRM if the d-axis flux is in the same direction as the
rolling direction of the steel. However if the flux path is observed carefully in each rotor pole,
it can be seen that the assumption is not true (see Fig. 2-25). Therefore in some parts of the
rotor pole closer to the outer diameter of the rotor lamination, the flux is not parallel to the
rolling direction of the steel which means that the capability of the CRGO steel cannot be fully
utilized.
To fully use the advantages of the CRGO steel in a SynRM, the geometric design
parameters of the SynRM must be modified. This includes both the value of the magnetic flux
density in the rotor and the shape of the flux barriers. A modified segmented-pole SynRM is
presented in the following section to address the limitations of the segmented-pole SynRM.
2.5.5. Modified Design of the Segmented-Pole SynRM
The proposed analytical approach for modeling and analysis of the segmented-pole SynRM
provides an insight to the magnetic performance of the machine. Based on the proposed
analysis it is observed that the application of the CRGO steel in the segmented-pole SynRM
limits the q-axis flux, resulting in a low q-axis inductance, and a higher saliency ratio. Fig. 2-26
compares the d-axis and q-axis inductances of the regular SynRM and the segmented-pole
SynRM obtained from measurements.
However CRGO steel laminations have better performance at lower current magnitudes
and thus lower flux density values, since as the current magnitude increases, the difference
between the relative permeability of the CRGO steel and the CRNGO steel reduces
significantly (see Fig. 2-19). Therefore to fully utilize the capability of the CRGO steel in the
segmented-pole SynRM, the operating point of the steel core must be maintained between 0.6
T to 1 T (see Fig. 2-19).
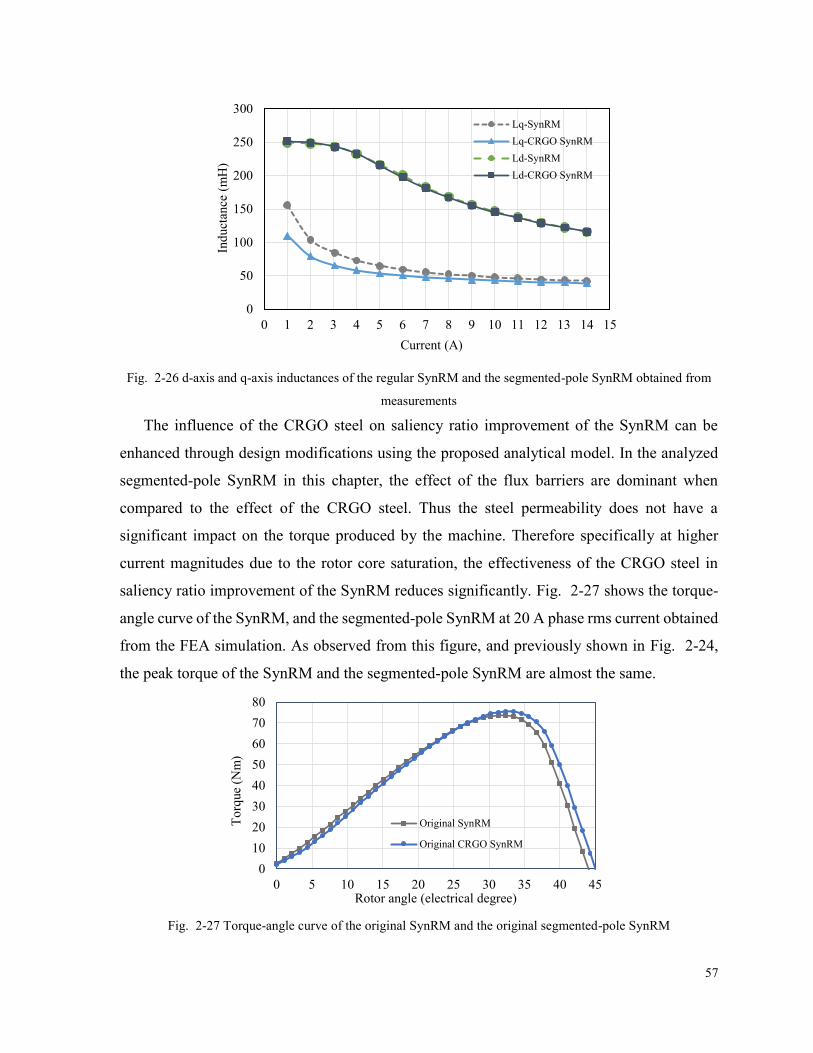
57
Fig. 2-26 d-axis and q-axis inductances of the regular SynRM and the segmented-pole SynRM obtained from
measurements
The influence of the CRGO steel on saliency ratio improvement of the SynRM can be
enhanced through design modifications using the proposed analytical model. In the analyzed
segmented-pole SynRM in this chapter, the effect of the flux barriers are dominant when
compared to the effect of the CRGO steel. Thus the steel permeability does not have a
significant impact on the torque produced by the machine. Therefore specifically at higher
current magnitudes due to the rotor core saturation, the effectiveness of the CRGO steel in
saliency ratio improvement of the SynRM reduces significantly. Fig. 2-27 shows the torque-
angle curve of the SynRM, and the segmented-pole SynRM at 20 A phase rms current obtained
from the FEA simulation. As observed from this figure, and previously shown in Fig. 2-24,
the peak torque of the SynRM and the segmented-pole SynRM are almost the same.
Fig. 2-27 Torque-angle curve of the original SynRM and the original segmented-pole SynRM
0
50
100
150
200
250
300
0 1 2 3 4 5 6 7 8 9 10 11 12 13 14 15
Ind
uct
ance
(m
H)
Current (A)
Lq-SynRM
Lq-CRGO SynRM
Ld-SynRM
Ld-CRGO SynRM
0
10
20
30
40
50
60
70
80
0 5 10 15 20 25 30 35 40 45
To
rque
(Nm
)
Rotor angle (electrical degree)
Original SynRM
Original CRGO SynRM
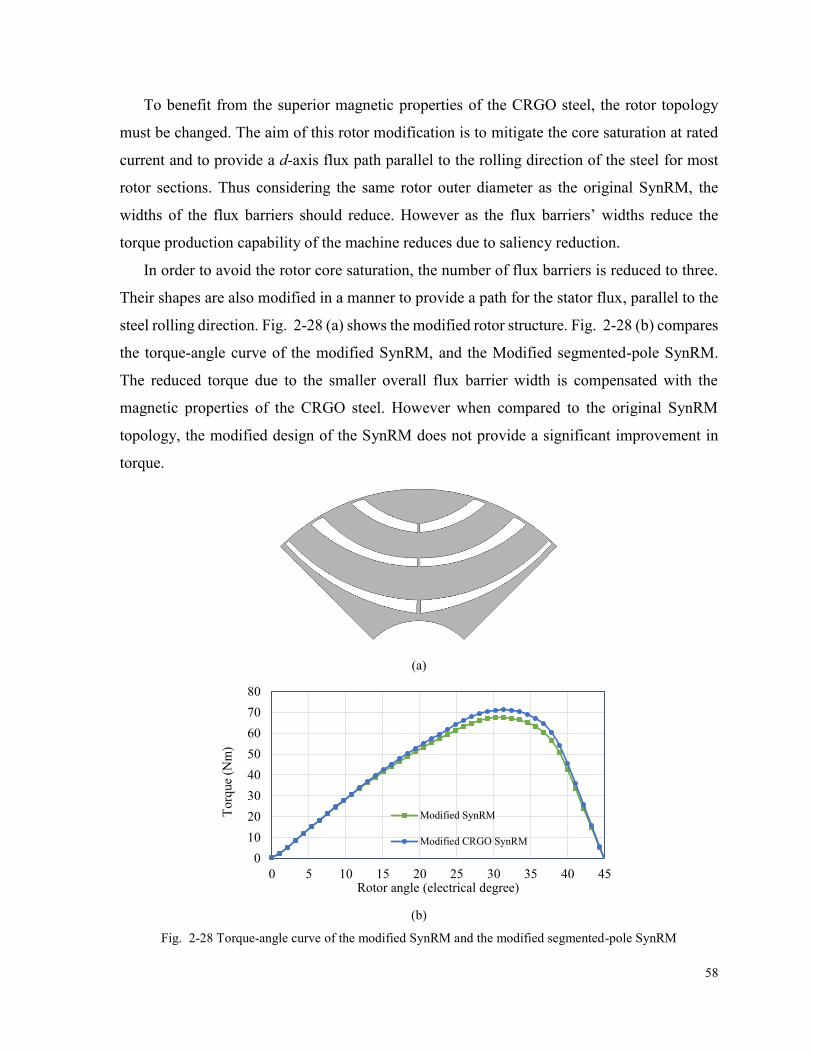
58
To benefit from the superior magnetic properties of the CRGO steel, the rotor topology
must be changed. The aim of this rotor modification is to mitigate the core saturation at rated
current and to provide a d-axis flux path parallel to the rolling direction of the steel for most
rotor sections. Thus considering the same rotor outer diameter as the original SynRM, the
widths of the flux barriers should reduce. However as the flux barriers’ widths reduce the
torque production capability of the machine reduces due to saliency reduction.
In order to avoid the rotor core saturation, the number of flux barriers is reduced to three.
Their shapes are also modified in a manner to provide a path for the stator flux, parallel to the
steel rolling direction. Fig. 2-28 (a) shows the modified rotor structure. Fig. 2-28 (b) compares
the torque-angle curve of the modified SynRM, and the Modified segmented-pole SynRM.
The reduced torque due to the smaller overall flux barrier width is compensated with the
magnetic properties of the CRGO steel. However when compared to the original SynRM
topology, the modified design of the SynRM does not provide a significant improvement in
torque.
(a)
(b)
Fig. 2-28 Torque-angle curve of the modified SynRM and the modified segmented-pole SynRM
0
10
20
30
40
50
60
70
80
0 5 10 15 20 25 30 35 40 45
To
rque
(Nm
)
Rotor angle (electrical degree)
Modified SynRM
Modified CRGO SynRM
59
Although the effectiveness of the CRGO steel on the torque production capability of the
modified segmented-pole SynRM is evident, the peak torque of the modified SynRM (with
CRGO steel and with CRNGO steel) is less than the original segmented-pole SynRM. This is
due to dominant impact of the flux barriers in comparison with the steel permeability.
Therefore the effectiveness of the CRGO property comes at the cost of peak torque reduction.
2.6. Summary of the Chapter
In this chapter an analytical method based on the parameters of a previously designed and
prototyped SynRM was developed. This analytical method usually known as the winding
function method, has been used for analysis, and design of various types of electrical machines.
However due to the complexity of the magnetic properties of the SynRM rotor, this model has
not been used for design and analysis of this type of electrical machine. In this chapter a
mathematical method to model the effect of the flux barriers in a TLA SynRM rotor was
proposed. Using this mathematical approach, the main features of the flux barriers; that is, their
widths, and their coverage span can be modeled. Once the air gap function of the machine
based on the flux barriers’ structures, and the winding function of the machine based on the
winding distribution are obtained, the inductances of the machine’s phases can be calculated.
Using the mutual and self-inductances of the phases, the electromagnetic torque of the machine
is calculated from the coenergy torque equation.
Using the proposed analytical model, the torque-angle curves of the SynRM, for various
phase currents were calculated and compared with the results obtained from FEA, and
measurement. The acceptable agreement of the results of the analytical model with the results
of measurements, reveals the capability of the analytical model as a modeling and design tool.
This model was also extended for analysis of a segmented-pole SynRM made with CRGO
steel. The special magnetic features of the CRGO steel as discussed in the final section of this
chapter, is incorporated in the analytical model, which results in a slight variation in the air
gap function of the segmented-pole SynRM compared to the SynRM. The results of the
analytical model for the segmented-pole SynRM was also compared with measurement and
FEA results. It was observed that despite the superior magnetic properties of the CRGO steel,
the improvement in the performance of the segmented-pole SynRM is not significant. This can

60
be explained by considering the flux paths in each rotor pole, and the magnetic permeability
of the CRGO steel at high magnetic flux values.
The proposed analytical model which is solved in MATLAB, can be modified into a
general design tool for initial sizing and performance estimation of various types of SynRMs.
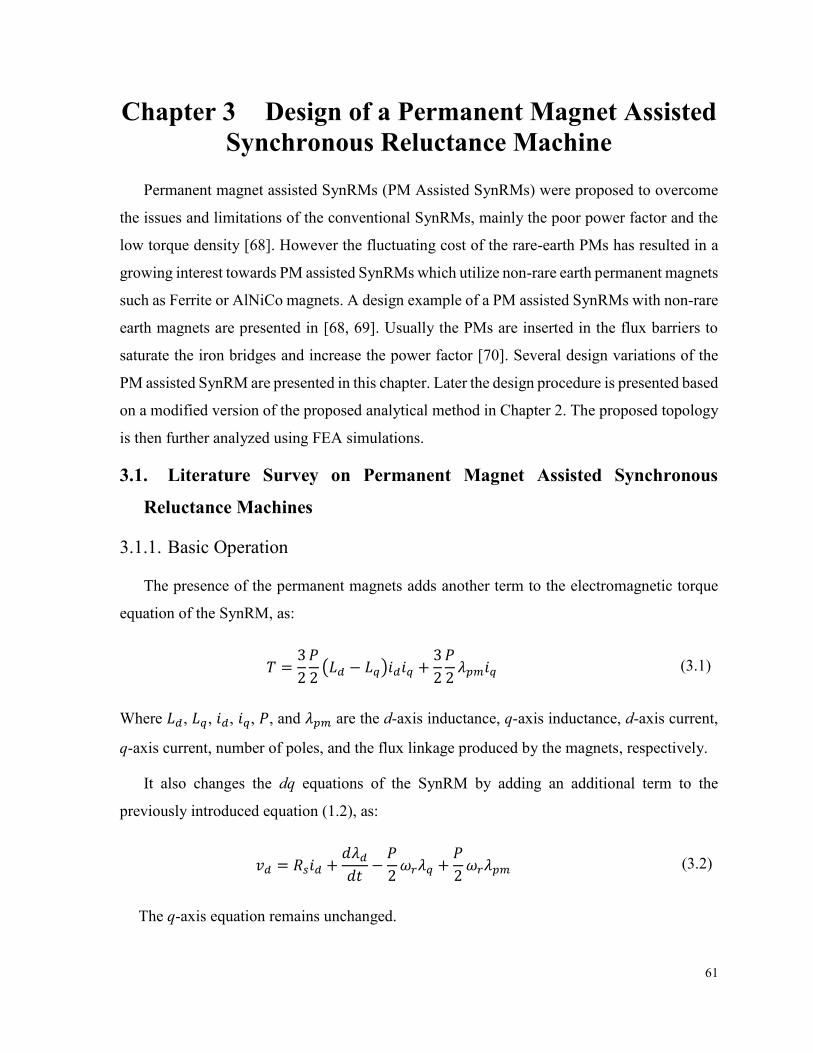
61
Chapter 3 Design of a Permanent Magnet Assisted
Synchronous Reluctance Machine
Permanent magnet assisted SynRMs (PM Assisted SynRMs) were proposed to overcome
the issues and limitations of the conventional SynRMs, mainly the poor power factor and the
low torque density [68]. However the fluctuating cost of the rare-earth PMs has resulted in a
growing interest towards PM assisted SynRMs which utilize non-rare earth permanent magnets
such as Ferrite or AlNiCo magnets. A design example of a PM assisted SynRMs with non-rare
earth magnets are presented in [68, 69]. Usually the PMs are inserted in the flux barriers to
saturate the iron bridges and increase the power factor [70]. Several design variations of the
PM assisted SynRM are presented in this chapter. Later the design procedure is presented based
on a modified version of the proposed analytical method in Chapter 2. The proposed topology
is then further analyzed using FEA simulations.
3.1. Literature Survey on Permanent Magnet Assisted Synchronous
Reluctance Machines
3.1.1. Basic Operation
The presence of the permanent magnets adds another term to the electromagnetic torque
equation of the SynRM, as:
𝑇 =3
2
𝑃
2(𝐿𝑑 − 𝐿𝑞)𝑖𝑑𝑖𝑞 +
3
2
𝑃
2𝜆𝑝𝑚𝑖𝑞 (3.1)
Where 𝐿𝑑, 𝐿𝑞, 𝑖𝑑, 𝑖𝑞, 𝑃, and 𝜆𝑝𝑚 are the d-axis inductance, q-axis inductance, d-axis current,
q-axis current, number of poles, and the flux linkage produced by the magnets, respectively.
It also changes the dq equations of the SynRM by adding an additional term to the
previously introduced equation (1.2), as:
𝑣𝑑 = 𝑅𝑠𝑖𝑑 +𝑑𝜆𝑑𝑑𝑡
−𝑃
2𝜔𝑟𝜆𝑞 +
𝑃
2𝜔𝑟𝜆𝑝𝑚 (3.2)
The q-axis equation remains unchanged.
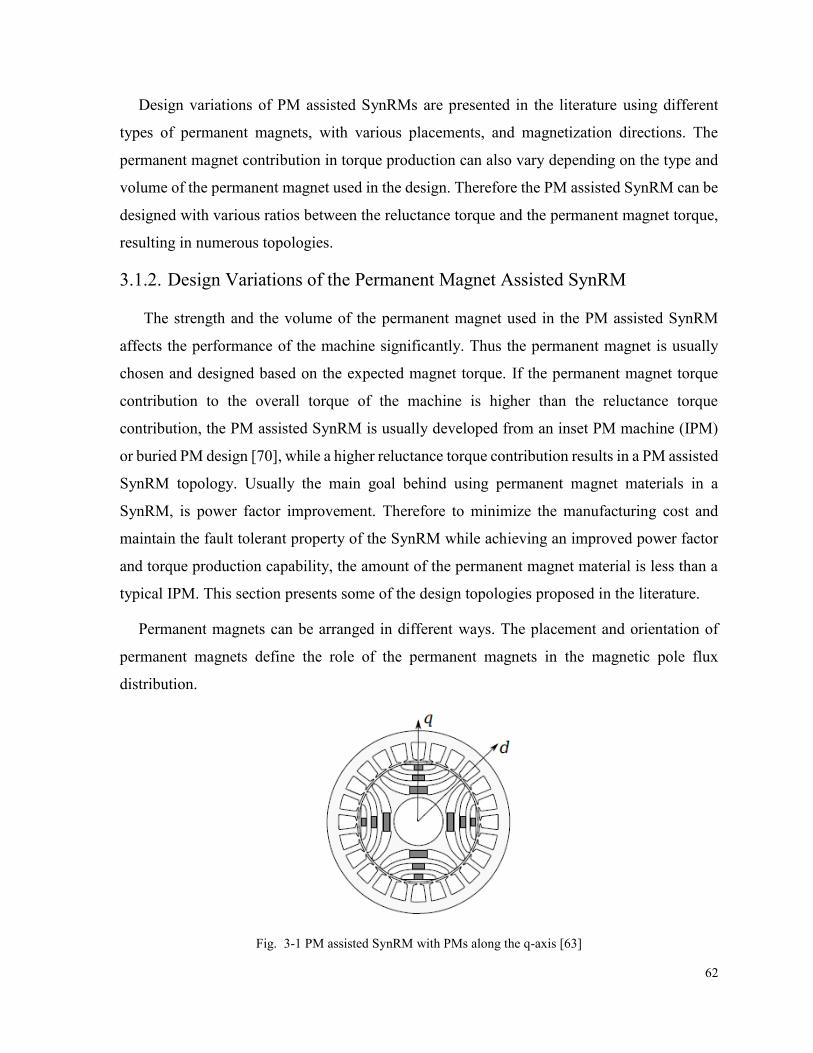
62
Design variations of PM assisted SynRMs are presented in the literature using different
types of permanent magnets, with various placements, and magnetization directions. The
permanent magnet contribution in torque production can also vary depending on the type and
volume of the permanent magnet used in the design. Therefore the PM assisted SynRM can be
designed with various ratios between the reluctance torque and the permanent magnet torque,
resulting in numerous topologies.
3.1.2. Design Variations of the Permanent Magnet Assisted SynRM
The strength and the volume of the permanent magnet used in the PM assisted SynRM
affects the performance of the machine significantly. Thus the permanent magnet is usually
chosen and designed based on the expected magnet torque. If the permanent magnet torque
contribution to the overall torque of the machine is higher than the reluctance torque
contribution, the PM assisted SynRM is usually developed from an inset PM machine (IPM)
or buried PM design [70], while a higher reluctance torque contribution results in a PM assisted
SynRM topology. Usually the main goal behind using permanent magnet materials in a
SynRM, is power factor improvement. Therefore to minimize the manufacturing cost and
maintain the fault tolerant property of the SynRM while achieving an improved power factor
and torque production capability, the amount of the permanent magnet material is less than a
typical IPM. This section presents some of the design topologies proposed in the literature.
Permanent magnets can be arranged in different ways. The placement and orientation of
permanent magnets define the role of the permanent magnets in the magnetic pole flux
distribution.
Fig. 3-1 PM assisted SynRM with PMs along the q-axis [63]
63
Usually permanent magnets are placed in V-shape configurations or along the q-axis of the
SynRM. The former provides the d-axis flux while the latter opposes the q-axis flux of the
stator winding with the aim of improving the saliency ratio, and the power factor of the SynRM
[17]. Fig. 3-1 shows a schematic of a PM assisted SynRM, in which the magnets are placed in
the q-axis with the aim of q-axis flux reduction [63].
Fig. 3-2 (a) and Fig. 3-2 (b) compare the vector diagram of a PM assisted SynRM, shown
in Fig. 3-1 and a typical SynRM. It is clear from the two vector diagrams that the presence of
the permanent magnets reduces the angle between the phase current and the phase voltage,
thus increasing the power factor of the PM assisted SynRM, in comparison with the
conventional SynRM.
(a) (b)
Fig. 3-2 (a) Vector diagram of the SynRM, (b) Vector diagram of the PM assisted SynRM
The vector diagram depicted in Fig. 3-3 (b) represents a PM assisted SynRM in which the
PMs are added along the q-axis of the machine, as shown in Fig. 3-1. The produced flux by
the magnets compensates the flux linkage of the q-axis, 𝐿𝑞𝑖𝑞. The magnet’s volume affects the
amount of flux compensation and must be chosen carefully.
Another variation of PM assisted SynRMs with Ferrite magnets are presented in [68] and
shown in Fig. 3-3. Design optimization is performed on a benchmark interior permanent
magnet machine (IPM), with rare-earth magnets, to achieve the same performance at lower
cost.
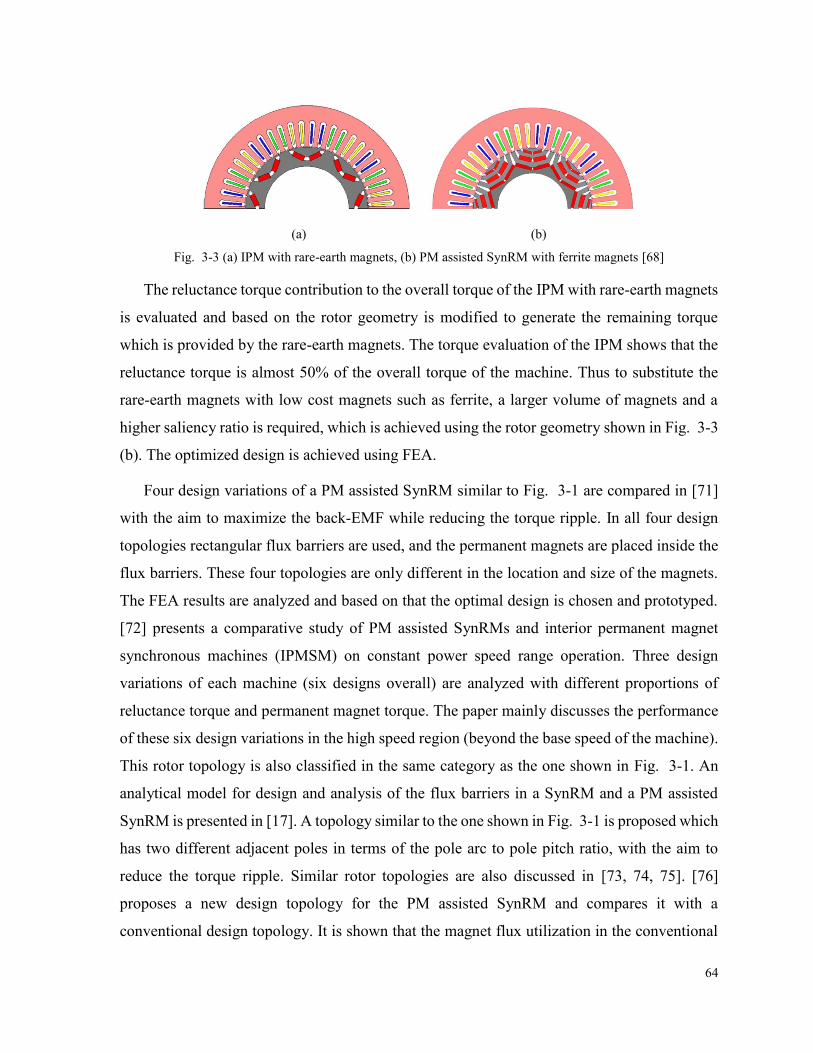
64
(a) (b)
Fig. 3-3 (a) IPM with rare-earth magnets, (b) PM assisted SynRM with ferrite magnets [68]
The reluctance torque contribution to the overall torque of the IPM with rare-earth magnets
is evaluated and based on the rotor geometry is modified to generate the remaining torque
which is provided by the rare-earth magnets. The torque evaluation of the IPM shows that the
reluctance torque is almost 50% of the overall torque of the machine. Thus to substitute the
rare-earth magnets with low cost magnets such as ferrite, a larger volume of magnets and a
higher saliency ratio is required, which is achieved using the rotor geometry shown in Fig. 3-3
(b). The optimized design is achieved using FEA.
Four design variations of a PM assisted SynRM similar to Fig. 3-1 are compared in [71]
with the aim to maximize the back-EMF while reducing the torque ripple. In all four design
topologies rectangular flux barriers are used, and the permanent magnets are placed inside the
flux barriers. These four topologies are only different in the location and size of the magnets.
The FEA results are analyzed and based on that the optimal design is chosen and prototyped.
[72] presents a comparative study of PM assisted SynRMs and interior permanent magnet
synchronous machines (IPMSM) on constant power speed range operation. Three design
variations of each machine (six designs overall) are analyzed with different proportions of
reluctance torque and permanent magnet torque. The paper mainly discusses the performance
of these six design variations in the high speed region (beyond the base speed of the machine).
This rotor topology is also classified in the same category as the one shown in Fig. 3-1. An
analytical model for design and analysis of the flux barriers in a SynRM and a PM assisted
SynRM is presented in [17]. A topology similar to the one shown in Fig. 3-1 is proposed which
has two different adjacent poles in terms of the pole arc to pole pitch ratio, with the aim to
reduce the torque ripple. Similar rotor topologies are also discussed in [73, 74, 75]. [76]
proposes a new design topology for the PM assisted SynRM and compares it with a
conventional design topology. It is shown that the magnet flux utilization in the conventional
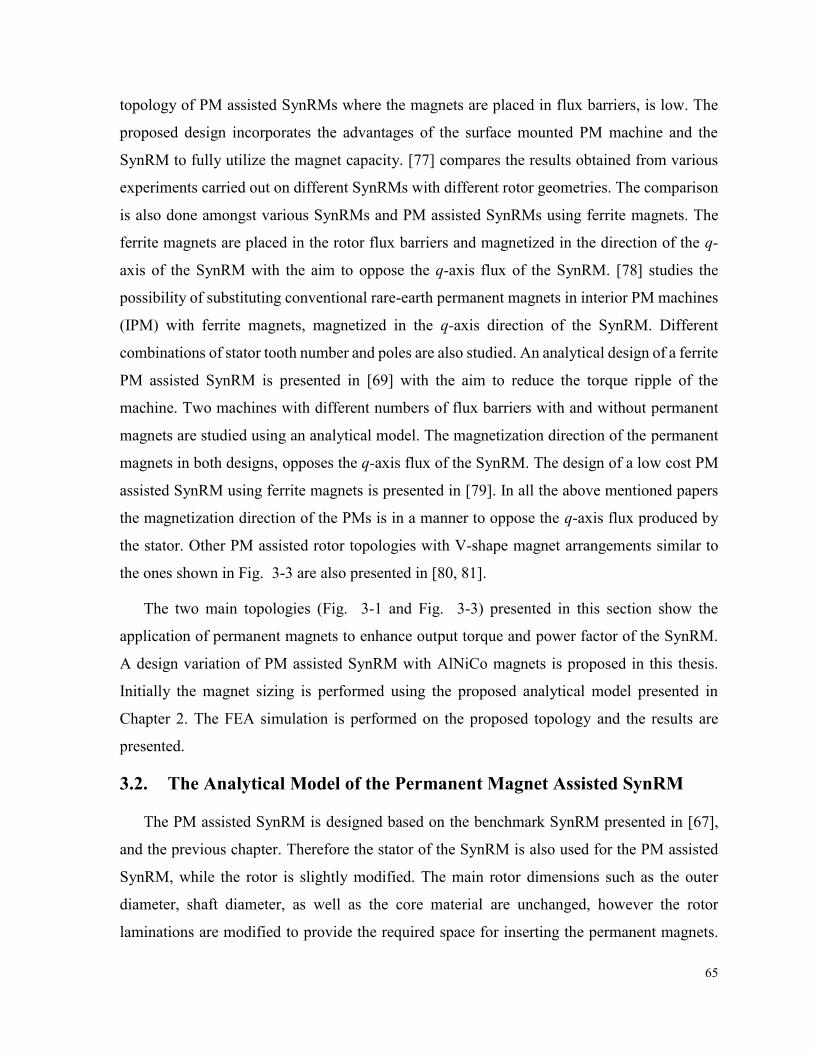
65
topology of PM assisted SynRMs where the magnets are placed in flux barriers, is low. The
proposed design incorporates the advantages of the surface mounted PM machine and the
SynRM to fully utilize the magnet capacity. [77] compares the results obtained from various
experiments carried out on different SynRMs with different rotor geometries. The comparison
is also done amongst various SynRMs and PM assisted SynRMs using ferrite magnets. The
ferrite magnets are placed in the rotor flux barriers and magnetized in the direction of the q-
axis of the SynRM with the aim to oppose the q-axis flux of the SynRM. [78] studies the
possibility of substituting conventional rare-earth permanent magnets in interior PM machines
(IPM) with ferrite magnets, magnetized in the q-axis direction of the SynRM. Different
combinations of stator tooth number and poles are also studied. An analytical design of a ferrite
PM assisted SynRM is presented in [69] with the aim to reduce the torque ripple of the
machine. Two machines with different numbers of flux barriers with and without permanent
magnets are studied using an analytical model. The magnetization direction of the permanent
magnets in both designs, opposes the q-axis flux of the SynRM. The design of a low cost PM
assisted SynRM using ferrite magnets is presented in [79]. In all the above mentioned papers
the magnetization direction of the PMs is in a manner to oppose the q-axis flux produced by
the stator. Other PM assisted rotor topologies with V-shape magnet arrangements similar to
the ones shown in Fig. 3-3 are also presented in [80, 81].
The two main topologies (Fig. 3-1 and Fig. 3-3) presented in this section show the
application of permanent magnets to enhance output torque and power factor of the SynRM.
A design variation of PM assisted SynRM with AlNiCo magnets is proposed in this thesis.
Initially the magnet sizing is performed using the proposed analytical model presented in
Chapter 2. The FEA simulation is performed on the proposed topology and the results are
presented.
3.2. The Analytical Model of the Permanent Magnet Assisted SynRM
The PM assisted SynRM is designed based on the benchmark SynRM presented in [67],
and the previous chapter. Therefore the stator of the SynRM is also used for the PM assisted
SynRM, while the rotor is slightly modified. The main rotor dimensions such as the outer
diameter, shaft diameter, as well as the core material are unchanged, however the rotor
laminations are modified to provide the required space for inserting the permanent magnets.

66
The machine’s performance is highly dependent on the type and volume of the permanent
magnet used. However to minimize the manufacturing cost in the designed PM assisted
SynRM, low cost permanent magnets are used. In this section the proposed rotor topology is
presented first, then different permanent magnet material characteristics are introduced, and
based on that the magnet type is chosen. Magnet sizing is done using the modified analytical
model which is originally developed for modeling and characterization of the base SynRM and
presented in Chapter 2.
3.2.1. Rotor Topology
In a PM assisted SynRM permanent magnet materials are inserted in the rotor flux barriers
to enhance the performance of the machine. The output characteristic improvement depends on
the type and volume of the magnets and can vary depending on the application requirements.
The magnetization direction of the PMs and their placement can be done in several ways as
shown in the previous section.
A design variation of PM assisted SynRMs is proposed here. The rotor magnets are placed
radially with magnetization direction along the d-axis flux of the SynRM (shown in Fig. 3-4).
Therefore the flux produced by the magnets contributes to the SynRM d-axis flux. The magnetic
field generated by the magnets also suppresses the q-axis flux, which in turn contributes to
saliency ratio improvement. Fig. 3-4 shows the schematic structure of the rotor of the PM
assisted SynRM. In this figure only the possible magnet location is shown. Magnet dimensions
and the final placement along the q-axis of the machine is decided based on the analytical design
procedure which is presented in this section.
Fig. 3-4 The proposed schematic topology of the PM assisted SynRM, arrows show the magnet flux direction
The type and the magnet dimensions determine the magnitude of the PM torque, and thus
the shape of the torque-angle curve of the PM assisted SynRM. The design goal is to obtain a
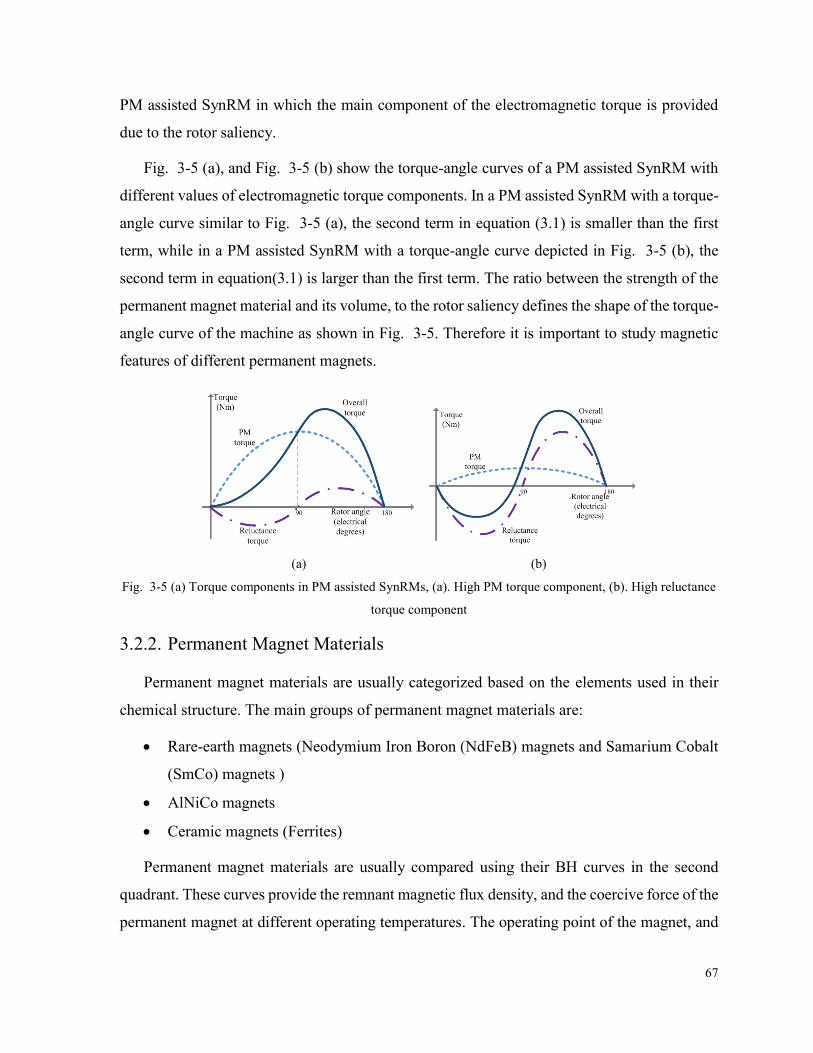
67
PM assisted SynRM in which the main component of the electromagnetic torque is provided
due to the rotor saliency.
Fig. 3-5 (a), and Fig. 3-5 (b) show the torque-angle curves of a PM assisted SynRM with
different values of electromagnetic torque components. In a PM assisted SynRM with a torque-
angle curve similar to Fig. 3-5 (a), the second term in equation (3.1) is smaller than the first
term, while in a PM assisted SynRM with a torque-angle curve depicted in Fig. 3-5 (b), the
second term in equation(3.1) is larger than the first term. The ratio between the strength of the
permanent magnet material and its volume, to the rotor saliency defines the shape of the torque-
angle curve of the machine as shown in Fig. 3-5. Therefore it is important to study magnetic
features of different permanent magnets.
(a) (b)
Fig. 3-5 (a) Torque components in PM assisted SynRMs, (a). High PM torque component, (b). High reluctance
torque component
3.2.2. Permanent Magnet Materials
Permanent magnet materials are usually categorized based on the elements used in their
chemical structure. The main groups of permanent magnet materials are:
Rare-earth magnets (Neodymium Iron Boron (NdFeB) magnets and Samarium Cobalt
(SmCo) magnets )
AlNiCo magnets
Ceramic magnets (Ferrites)
Permanent magnet materials are usually compared using their BH curves in the second
quadrant. These curves provide the remnant magnetic flux density, and the coercive force of the
permanent magnet at different operating temperatures. The operating point of the magnet, and
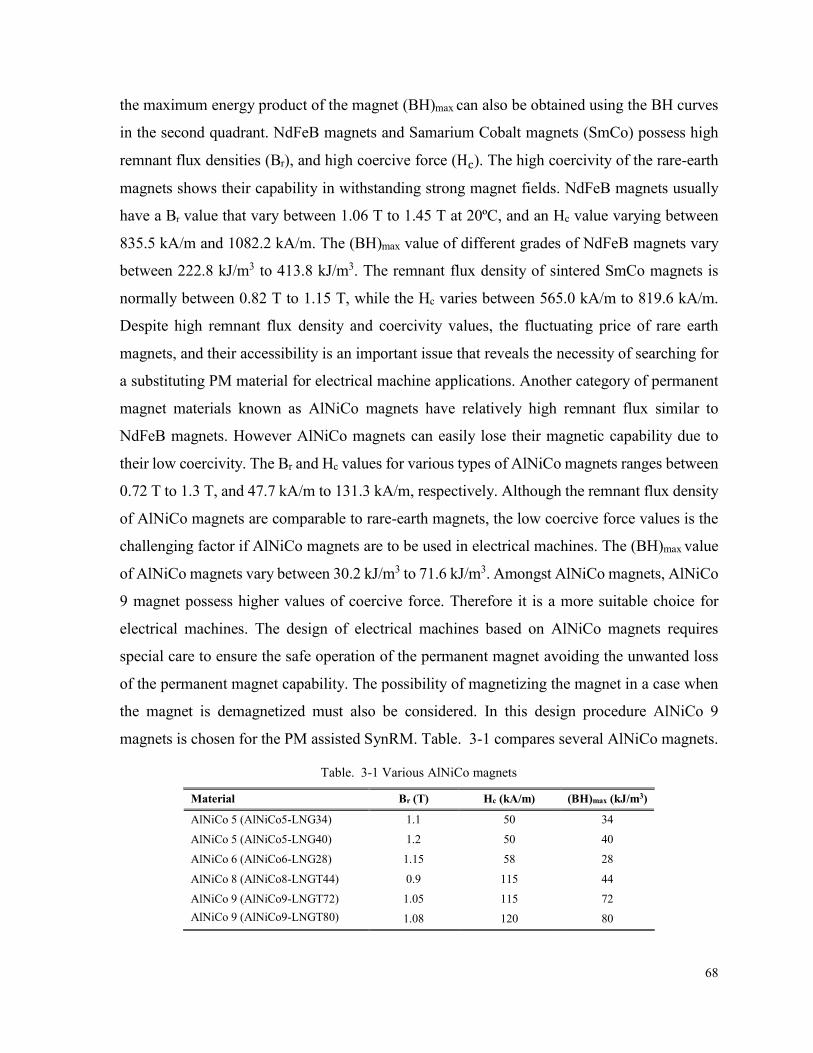
68
the maximum energy product of the magnet (BH)max can also be obtained using the BH curves
in the second quadrant. NdFeB magnets and Samarium Cobalt magnets (SmCo) possess high
remnant flux densities (Br), and high coercive force (Hc). The high coercivity of the rare-earth
magnets shows their capability in withstanding strong magnet fields. NdFeB magnets usually
have a Br value that vary between 1.06 T to 1.45 T at 20ºC, and an Hc value varying between
835.5 kA/m and 1082.2 kA/m. The (BH)max value of different grades of NdFeB magnets vary
between 222.8 kJ/m3 to 413.8 kJ/m3. The remnant flux density of sintered SmCo magnets is
normally between 0.82 T to 1.15 T, while the Hc varies between 565.0 kA/m to 819.6 kA/m.
Despite high remnant flux density and coercivity values, the fluctuating price of rare earth
magnets, and their accessibility is an important issue that reveals the necessity of searching for
a substituting PM material for electrical machine applications. Another category of permanent
magnet materials known as AlNiCo magnets have relatively high remnant flux similar to
NdFeB magnets. However AlNiCo magnets can easily lose their magnetic capability due to
their low coercivity. The Br and Hc values for various types of AlNiCo magnets ranges between
0.72 T to 1.3 T, and 47.7 kA/m to 131.3 kA/m, respectively. Although the remnant flux density
of AlNiCo magnets are comparable to rare-earth magnets, the low coercive force values is the
challenging factor if AlNiCo magnets are to be used in electrical machines. The (BH)max value
of AlNiCo magnets vary between 30.2 kJ/m3 to 71.6 kJ/m3. Amongst AlNiCo magnets, AlNiCo
9 magnet possess higher values of coercive force. Therefore it is a more suitable choice for
electrical machines. The design of electrical machines based on AlNiCo magnets requires
special care to ensure the safe operation of the permanent magnet avoiding the unwanted loss
of the permanent magnet capability. The possibility of magnetizing the magnet in a case when
the magnet is demagnetized must also be considered. In this design procedure AlNiCo 9
magnets is chosen for the PM assisted SynRM. Table. 3-1 compares several AlNiCo magnets.
Table. 3-1 Various AlNiCo magnets
Material Br (T) Hc (kA/m) (BH)max (kJ/m3)
AlNiCo 5 (AlNiCo5-LNG34) 1.1 50 34
AlNiCo 5 (AlNiCo5-LNG40) 1.2 50 40
AlNiCo 6 (AlNiCo6-LNG28) 1.15 58 28
AlNiCo 8 (AlNiCo8-LNGT44) 0.9 115 44
AlNiCo 9 (AlNiCo9-LNGT72) 1.05 115 72
AlNiCo 9 (AlNiCo9-LNGT80) 1.08 120 80
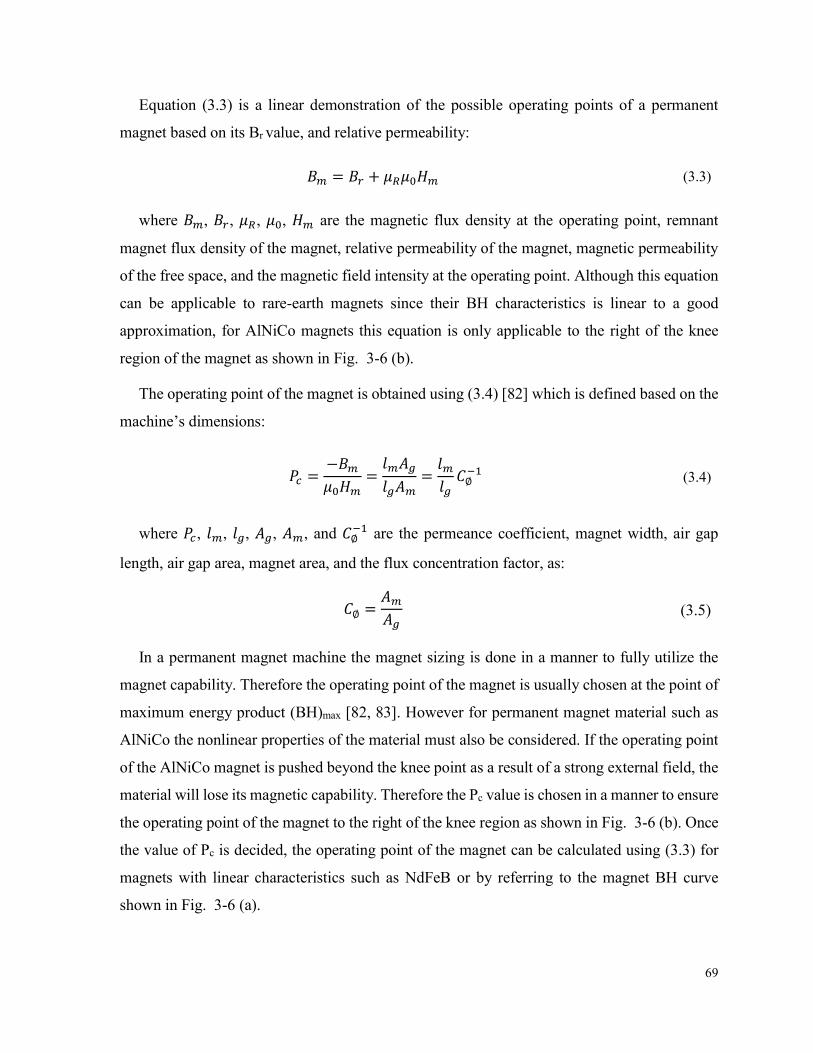
69
Equation (3.3) is a linear demonstration of the possible operating points of a permanent
magnet based on its Br value, and relative permeability:
𝐵𝑚 = 𝐵𝑟 + 𝜇𝑅𝜇0𝐻𝑚 (3.3)
where 𝐵𝑚, 𝐵𝑟, 𝜇𝑅, 𝜇0, 𝐻𝑚 are the magnetic flux density at the operating point, remnant
magnet flux density of the magnet, relative permeability of the magnet, magnetic permeability
of the free space, and the magnetic field intensity at the operating point. Although this equation
can be applicable to rare-earth magnets since their BH characteristics is linear to a good
approximation, for AlNiCo magnets this equation is only applicable to the right of the knee
region of the magnet as shown in Fig. 3-6 (b).
The operating point of the magnet is obtained using (3.4) [82] which is defined based on the
machine’s dimensions:
𝑃𝑐 =−𝐵𝑚𝜇0𝐻𝑚
=𝑙𝑚𝐴𝑔
𝑙𝑔𝐴𝑚=𝑙𝑚𝑙𝑔𝐶∅−1 (3.4)
where 𝑃𝑐, 𝑙𝑚, 𝑙𝑔, 𝐴𝑔, 𝐴𝑚, and 𝐶∅−1 are the permeance coefficient, magnet width, air gap
length, air gap area, magnet area, and the flux concentration factor, as:
𝐶∅ =
𝐴𝑚𝐴𝑔
(3.5)
In a permanent magnet machine the magnet sizing is done in a manner to fully utilize the
magnet capability. Therefore the operating point of the magnet is usually chosen at the point of
maximum energy product (BH)max [82, 83]. However for permanent magnet material such as
AlNiCo the nonlinear properties of the material must also be considered. If the operating point
of the AlNiCo magnet is pushed beyond the knee point as a result of a strong external field, the
material will lose its magnetic capability. Therefore the Pc value is chosen in a manner to ensure
the operating point of the magnet to the right of the knee region as shown in Fig. 3-6 (b). Once
the value of Pc is decided, the operating point of the magnet can be calculated using (3.3) for
magnets with linear characteristics such as NdFeB or by referring to the magnet BH curve
shown in Fig. 3-6 (a).
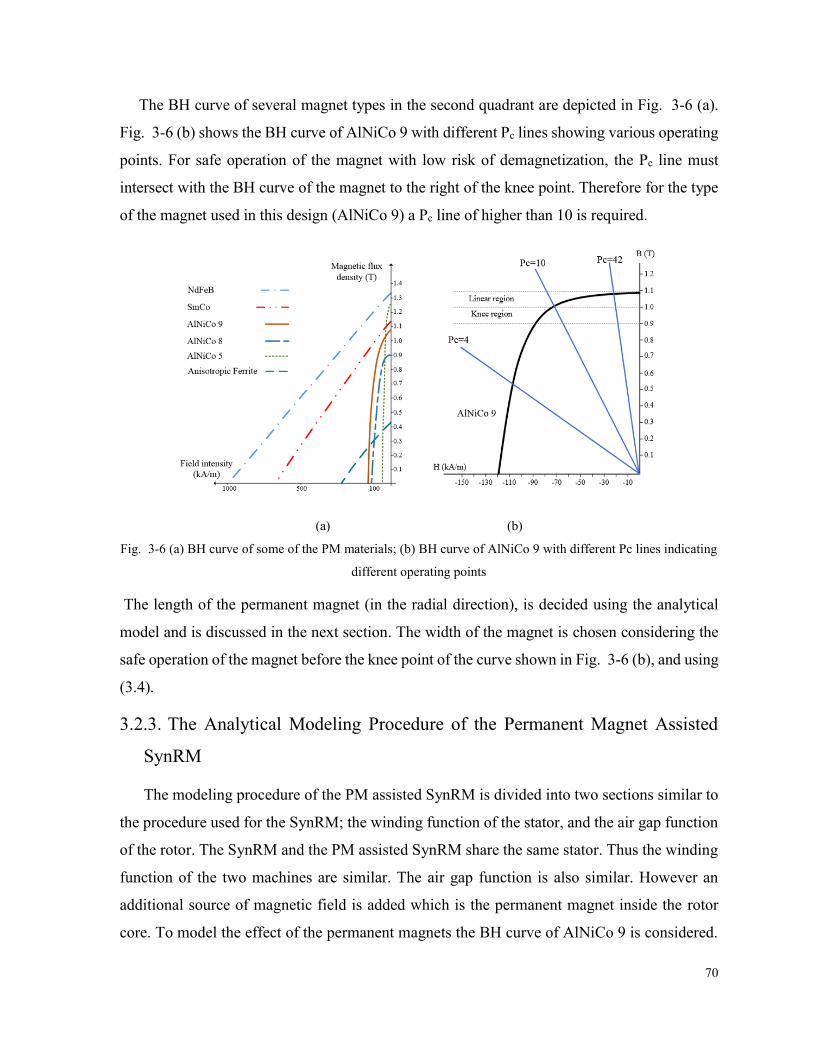
70
The BH curve of several magnet types in the second quadrant are depicted in Fig. 3-6 (a).
Fig. 3-6 (b) shows the BH curve of AlNiCo 9 with different Pc lines showing various operating
points. For safe operation of the magnet with low risk of demagnetization, the Pc line must
intersect with the BH curve of the magnet to the right of the knee point. Therefore for the type
of the magnet used in this design (AlNiCo 9) a Pc line of higher than 10 is required.
(a) (b)
Fig. 3-6 (a) BH curve of some of the PM materials; (b) BH curve of AlNiCo 9 with different Pc lines indicating
different operating points
The length of the permanent magnet (in the radial direction), is decided using the analytical
model and is discussed in the next section. The width of the magnet is chosen considering the
safe operation of the magnet before the knee point of the curve shown in Fig. 3-6 (b), and using
(3.4).
3.2.3. The Analytical Modeling Procedure of the Permanent Magnet Assisted
SynRM
The modeling procedure of the PM assisted SynRM is divided into two sections similar to
the procedure used for the SynRM; the winding function of the stator, and the air gap function
of the rotor. The SynRM and the PM assisted SynRM share the same stator. Thus the winding
function of the two machines are similar. The air gap function is also similar. However an
additional source of magnetic field is added which is the permanent magnet inside the rotor
core. To model the effect of the permanent magnets the BH curve of AlNiCo 9 is considered.
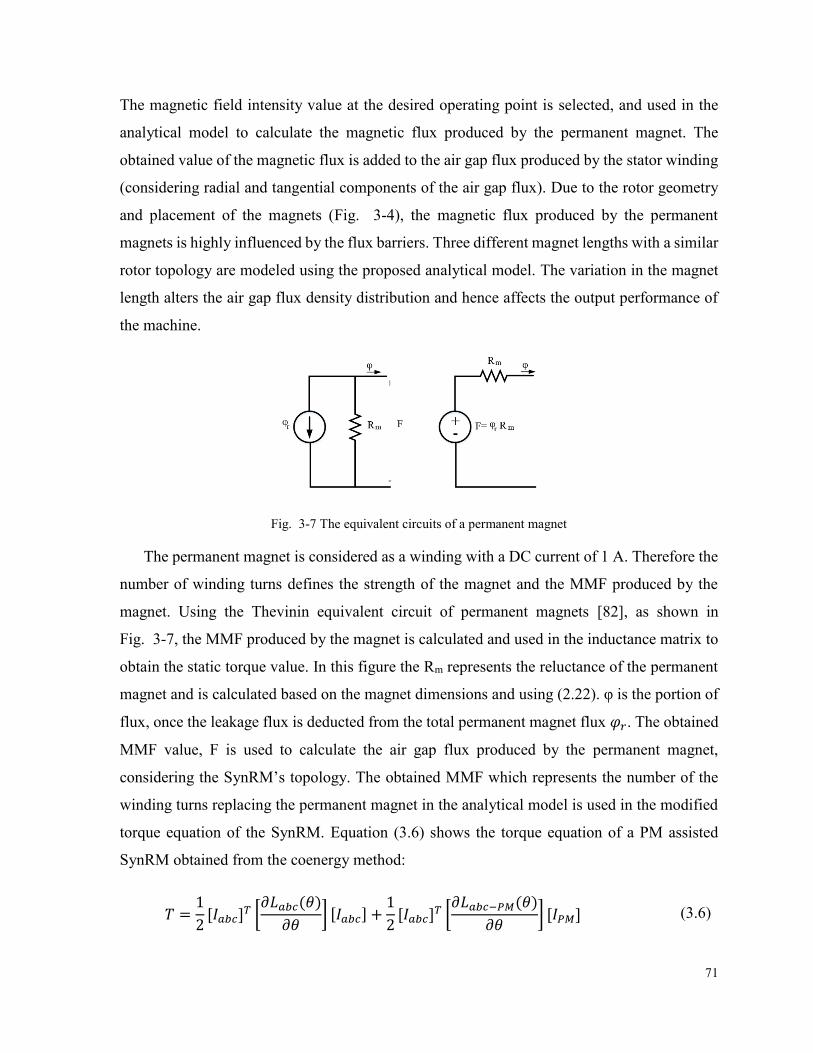
71
The magnetic field intensity value at the desired operating point is selected, and used in the
analytical model to calculate the magnetic flux produced by the permanent magnet. The
obtained value of the magnetic flux is added to the air gap flux produced by the stator winding
(considering radial and tangential components of the air gap flux). Due to the rotor geometry
and placement of the magnets (Fig. 3-4), the magnetic flux produced by the permanent
magnets is highly influenced by the flux barriers. Three different magnet lengths with a similar
rotor topology are modeled using the proposed analytical model. The variation in the magnet
length alters the air gap flux density distribution and hence affects the output performance of
the machine.
Fig. 3-7 The equivalent circuits of a permanent magnet
The permanent magnet is considered as a winding with a DC current of 1 A. Therefore the
number of winding turns defines the strength of the magnet and the MMF produced by the
magnet. Using the Thevinin equivalent circuit of permanent magnets [82], as shown in
Fig. 3-7, the MMF produced by the magnet is calculated and used in the inductance matrix to
obtain the static torque value. In this figure the Rm represents the reluctance of the permanent
magnet and is calculated based on the magnet dimensions and using (2.22). φ is the portion of
flux, once the leakage flux is deducted from the total permanent magnet flux 𝜑𝑟. The obtained
MMF value, F is used to calculate the air gap flux produced by the permanent magnet,
considering the SynRM’s topology. The obtained MMF which represents the number of the
winding turns replacing the permanent magnet in the analytical model is used in the modified
torque equation of the SynRM. Equation (3.6) shows the torque equation of a PM assisted
SynRM obtained from the coenergy method:
𝑇 =1
2[𝐼𝑎𝑏𝑐]
𝑇 [𝜕𝐿𝑎𝑏𝑐(𝜃)
𝜕𝜃] [𝐼𝑎𝑏𝑐] +
1
2[𝐼𝑎𝑏𝑐]
𝑇 [𝜕𝐿𝑎𝑏𝑐−𝑃𝑀(𝜃)
𝜕𝜃] [𝐼𝑃𝑀] (3.6)
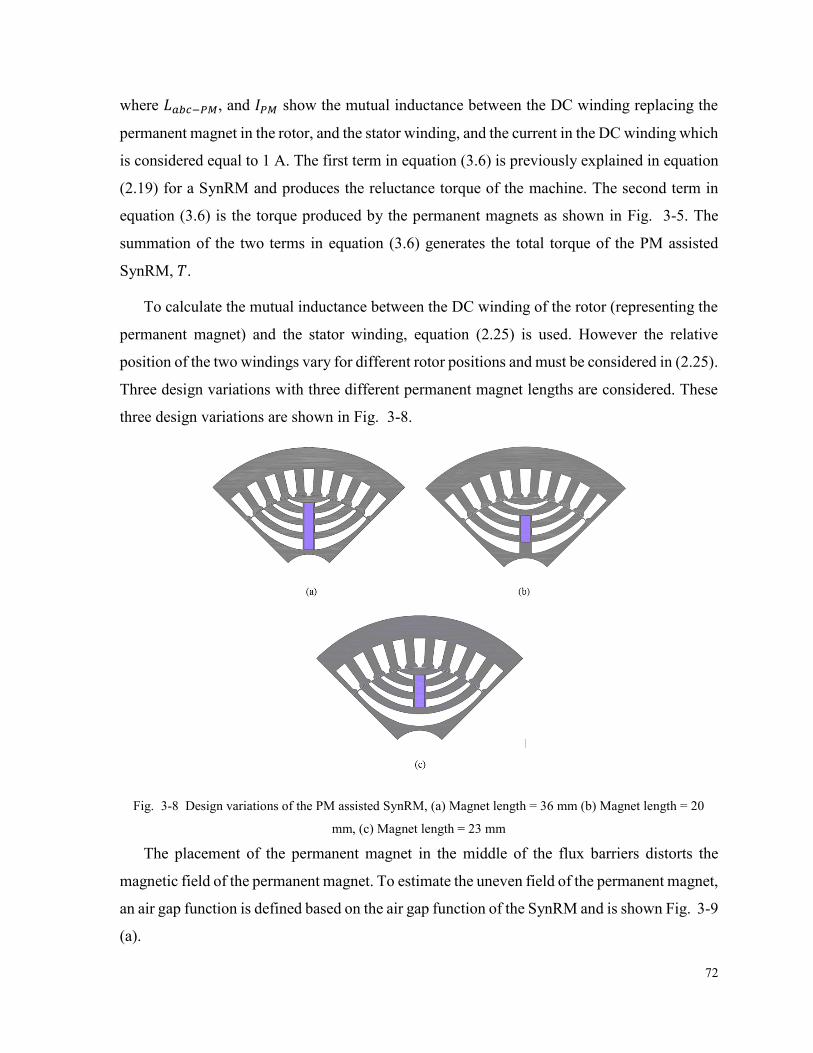
72
where 𝐿𝑎𝑏𝑐−𝑃𝑀, and 𝐼𝑃𝑀 show the mutual inductance between the DC winding replacing the
permanent magnet in the rotor, and the stator winding, and the current in the DC winding which
is considered equal to 1 A. The first term in equation (3.6) is previously explained in equation
(2.19) for a SynRM and produces the reluctance torque of the machine. The second term in
equation (3.6) is the torque produced by the permanent magnets as shown in Fig. 3-5. The
summation of the two terms in equation (3.6) generates the total torque of the PM assisted
SynRM, 𝑇.
To calculate the mutual inductance between the DC winding of the rotor (representing the
permanent magnet) and the stator winding, equation (2.25) is used. However the relative
position of the two windings vary for different rotor positions and must be considered in (2.25).
Three design variations with three different permanent magnet lengths are considered. These
three design variations are shown in Fig. 3-8.
Fig. 3-8 Design variations of the PM assisted SynRM, (a) Magnet length = 36 mm (b) Magnet length = 20
mm, (c) Magnet length = 23 mm
The placement of the permanent magnet in the middle of the flux barriers distorts the
magnetic field of the permanent magnet. To estimate the uneven field of the permanent magnet,
an air gap function is defined based on the air gap function of the SynRM and is shown Fig. 3-9
(a).
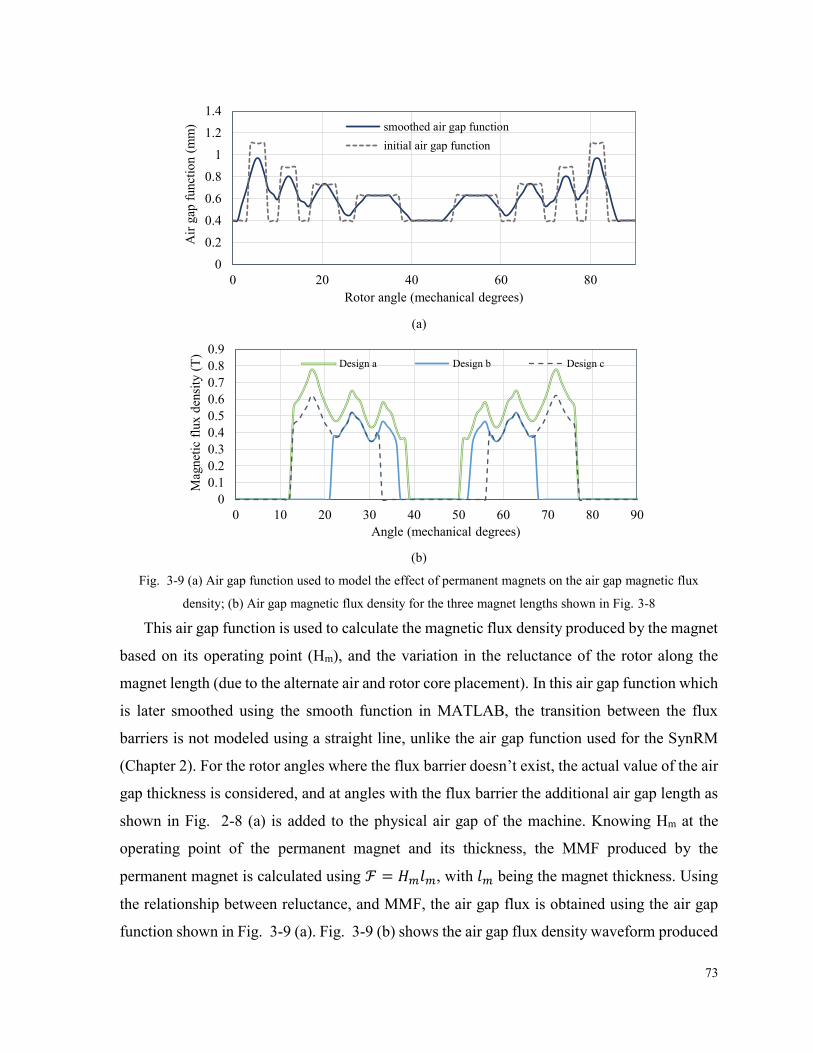
73
(a)
(b)
Fig. 3-9 (a) Air gap function used to model the effect of permanent magnets on the air gap magnetic flux
density; (b) Air gap magnetic flux density for the three magnet lengths shown in Fig. 3-8
This air gap function is used to calculate the magnetic flux density produced by the magnet
based on its operating point (Hm), and the variation in the reluctance of the rotor along the
magnet length (due to the alternate air and rotor core placement). In this air gap function which
is later smoothed using the smooth function in MATLAB, the transition between the flux
barriers is not modeled using a straight line, unlike the air gap function used for the SynRM
(Chapter 2). For the rotor angles where the flux barrier doesn’t exist, the actual value of the air
gap thickness is considered, and at angles with the flux barrier the additional air gap length as
shown in Fig. 2-8 (a) is added to the physical air gap of the machine. Knowing Hm at the
operating point of the permanent magnet and its thickness, the MMF produced by the
permanent magnet is calculated using ℱ = 𝐻𝑚𝑙𝑚, with 𝑙𝑚 being the magnet thickness. Using
the relationship between reluctance, and MMF, the air gap flux is obtained using the air gap
function shown in Fig. 3-9 (a). Fig. 3-9 (b) shows the air gap flux density waveform produced
0
0.2
0.4
0.6
0.8
1
1.2
1.4
0 20 40 60 80
Air
gap
funct
ion (
mm
)
Rotor angle (mechanical degrees)
smoothed air gap function
initial air gap function
0
0.1
0.2
0.3
0.4
0.5
0.6
0.7
0.8
0.9
0 10 20 30 40 50 60 70 80 90
Mag
net
ic f
lux d
ensi
ty (
T)
Angle (mechanical degrees)
Design a Design b Design c
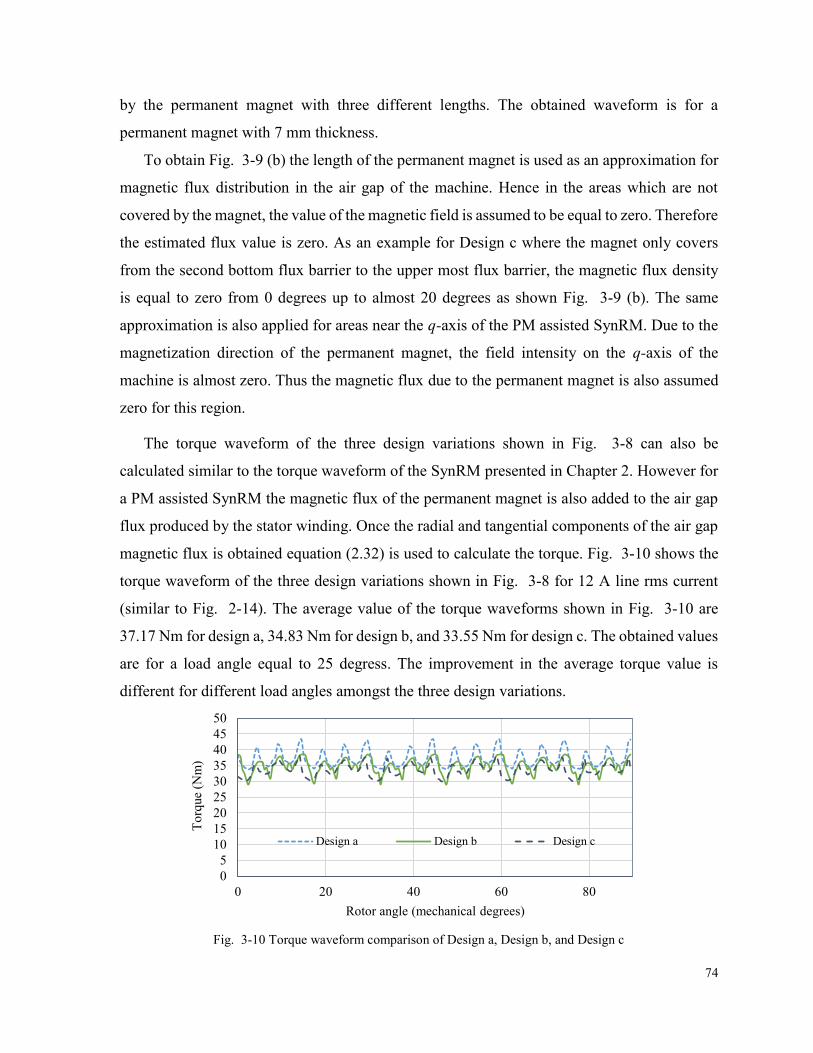
74
by the permanent magnet with three different lengths. The obtained waveform is for a
permanent magnet with 7 mm thickness.
To obtain Fig. 3-9 (b) the length of the permanent magnet is used as an approximation for
magnetic flux distribution in the air gap of the machine. Hence in the areas which are not
covered by the magnet, the value of the magnetic field is assumed to be equal to zero. Therefore
the estimated flux value is zero. As an example for Design c where the magnet only covers
from the second bottom flux barrier to the upper most flux barrier, the magnetic flux density
is equal to zero from 0 degrees up to almost 20 degrees as shown Fig. 3-9 (b). The same
approximation is also applied for areas near the q-axis of the PM assisted SynRM. Due to the
magnetization direction of the permanent magnet, the field intensity on the q-axis of the
machine is almost zero. Thus the magnetic flux due to the permanent magnet is also assumed
zero for this region.
The torque waveform of the three design variations shown in Fig. 3-8 can also be
calculated similar to the torque waveform of the SynRM presented in Chapter 2. However for
a PM assisted SynRM the magnetic flux of the permanent magnet is also added to the air gap
flux produced by the stator winding. Once the radial and tangential components of the air gap
magnetic flux is obtained equation (2.32) is used to calculate the torque. Fig. 3-10 shows the
torque waveform of the three design variations shown in Fig. 3-8 for 12 A line rms current
(similar to Fig. 2-14). The average value of the torque waveforms shown in Fig. 3-10 are
37.17 Nm for design a, 34.83 Nm for design b, and 33.55 Nm for design c. The obtained values
are for a load angle equal to 25 degress. The improvement in the average torque value is
different for different load angles amongst the three design variations.
Fig. 3-10 Torque waveform comparison of Design a, Design b, and Design c
0
5
10
15
20
25
30
35
40
45
50
0 20 40 60 80
To
rque
(Nm
)
Rotor angle (mechanical degrees)
Design a Design b Design c
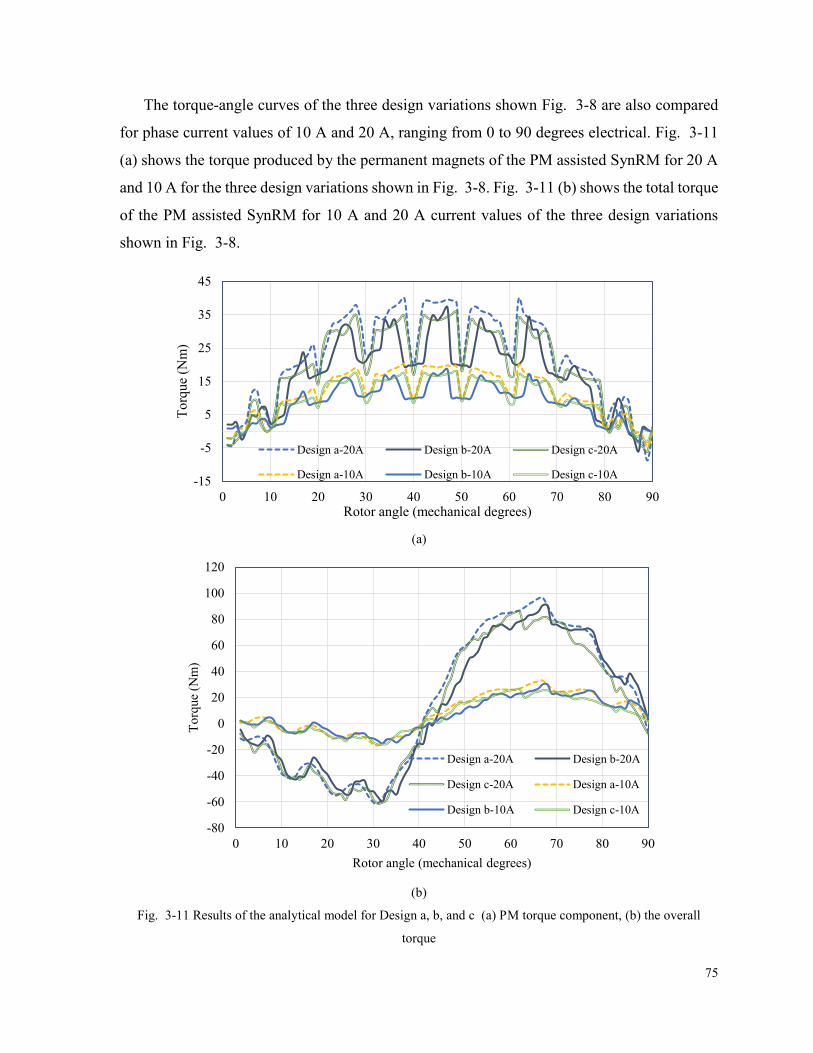
75
The torque-angle curves of the three design variations shown Fig. 3-8 are also compared
for phase current values of 10 A and 20 A, ranging from 0 to 90 degrees electrical. Fig. 3-11
(a) shows the torque produced by the permanent magnets of the PM assisted SynRM for 20 A
and 10 A for the three design variations shown in Fig. 3-8. Fig. 3-11 (b) shows the total torque
of the PM assisted SynRM for 10 A and 20 A current values of the three design variations
shown in Fig. 3-8.
(a)
(b)
Fig. 3-11 Results of the analytical model for Design a, b, and c (a) PM torque component, (b) the overall
torque
-15
-5
5
15
25
35
45
0 10 20 30 40 50 60 70 80 90
Torq
ue
(Nm
)
Rotor angle (mechanical degrees)
Design a-20A Design b-20A Design c-20A
Design a-10A Design b-10A Design c-10A
-80
-60
-40
-20
0
20
40
60
80
100
120
0 10 20 30 40 50 60 70 80 90
To
rque
(Nm
)
Rotor angle (mechanical degrees)
Design a-20A Design b-20A
Design c-20A Design a-10A
Design b-10A Design c-10A
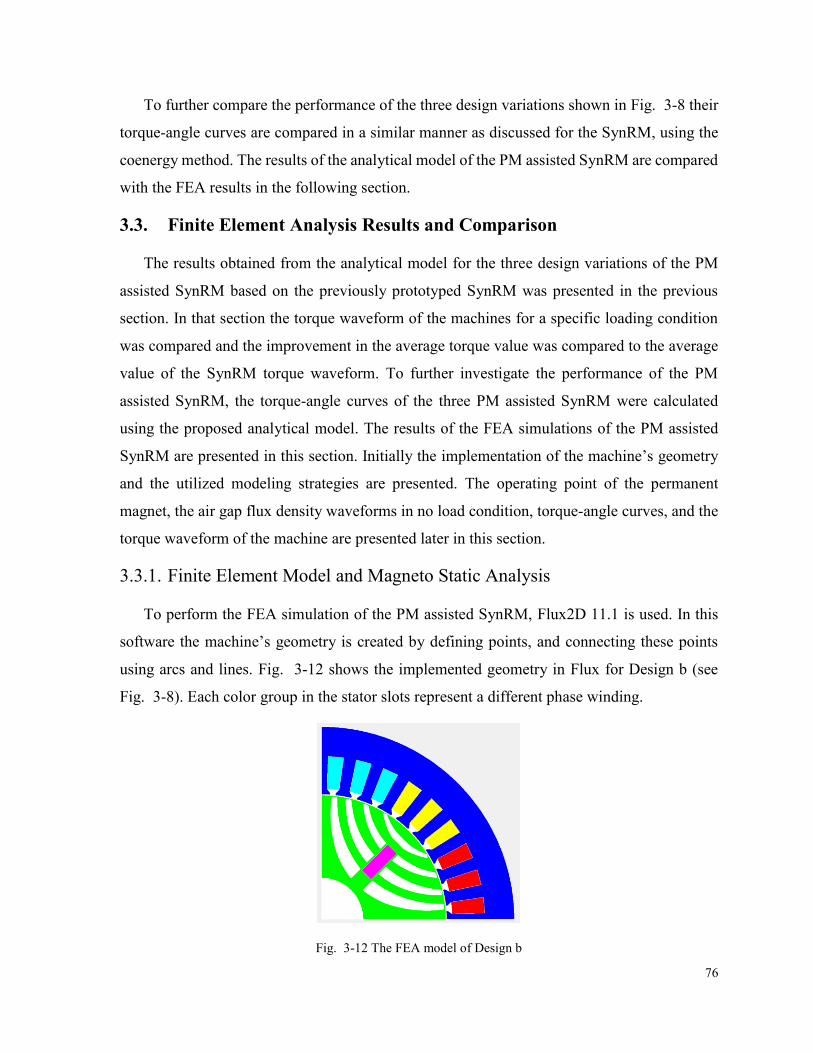
76
To further compare the performance of the three design variations shown in Fig. 3-8 their
torque-angle curves are compared in a similar manner as discussed for the SynRM, using the
coenergy method. The results of the analytical model of the PM assisted SynRM are compared
with the FEA results in the following section.
3.3. Finite Element Analysis Results and Comparison
The results obtained from the analytical model for the three design variations of the PM
assisted SynRM based on the previously prototyped SynRM was presented in the previous
section. In that section the torque waveform of the machines for a specific loading condition
was compared and the improvement in the average torque value was compared to the average
value of the SynRM torque waveform. To further investigate the performance of the PM
assisted SynRM, the torque-angle curves of the three PM assisted SynRM were calculated
using the proposed analytical model. The results of the FEA simulations of the PM assisted
SynRM are presented in this section. Initially the implementation of the machine’s geometry
and the utilized modeling strategies are presented. The operating point of the permanent
magnet, the air gap flux density waveforms in no load condition, torque-angle curves, and the
torque waveform of the machine are presented later in this section.
3.3.1. Finite Element Model and Magneto Static Analysis
To perform the FEA simulation of the PM assisted SynRM, Flux2D 11.1 is used. In this
software the machine’s geometry is created by defining points, and connecting these points
using arcs and lines. Fig. 3-12 shows the implemented geometry in Flux for Design b (see
Fig. 3-8). Each color group in the stator slots represent a different phase winding.
Fig. 3-12 The FEA model of Design b
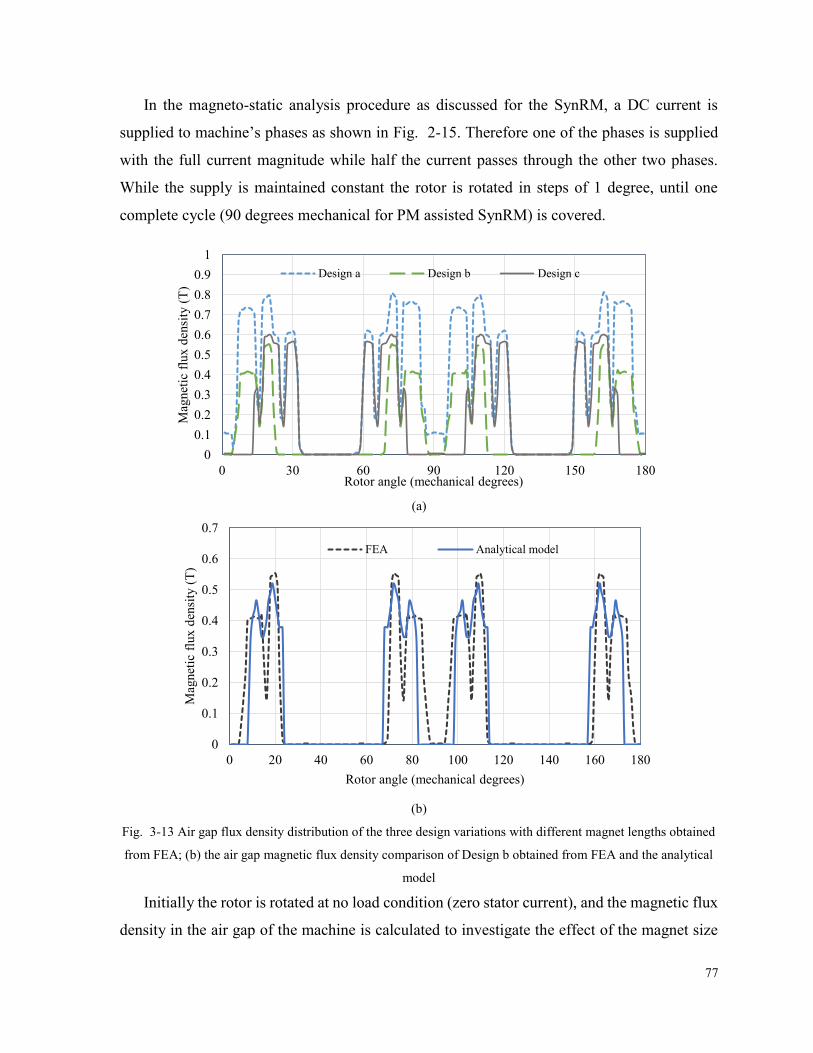
77
In the magneto-static analysis procedure as discussed for the SynRM, a DC current is
supplied to machine’s phases as shown in Fig. 2-15. Therefore one of the phases is supplied
with the full current magnitude while half the current passes through the other two phases.
While the supply is maintained constant the rotor is rotated in steps of 1 degree, until one
complete cycle (90 degrees mechanical for PM assisted SynRM) is covered.
(a)
(b)
Fig. 3-13 Air gap flux density distribution of the three design variations with different magnet lengths obtained
from FEA; (b) the air gap magnetic flux density comparison of Design b obtained from FEA and the analytical
model
Initially the rotor is rotated at no load condition (zero stator current), and the magnetic flux
density in the air gap of the machine is calculated to investigate the effect of the magnet size
0
0.1
0.2
0.3
0.4
0.5
0.6
0.7
0.8
0.9
1
0 30 60 90 120 150 180
Mag
net
ic f
lux d
ensi
ty (
T)
Rotor angle (mechanical degrees)
Design a Design b Design c
0
0.1
0.2
0.3
0.4
0.5
0.6
0.7
0 20 40 60 80 100 120 140 160 180
Mag
net
ic f
lux d
ensi
ty (
T)
Rotor angle (mechanical degrees)
FEA Analytical model
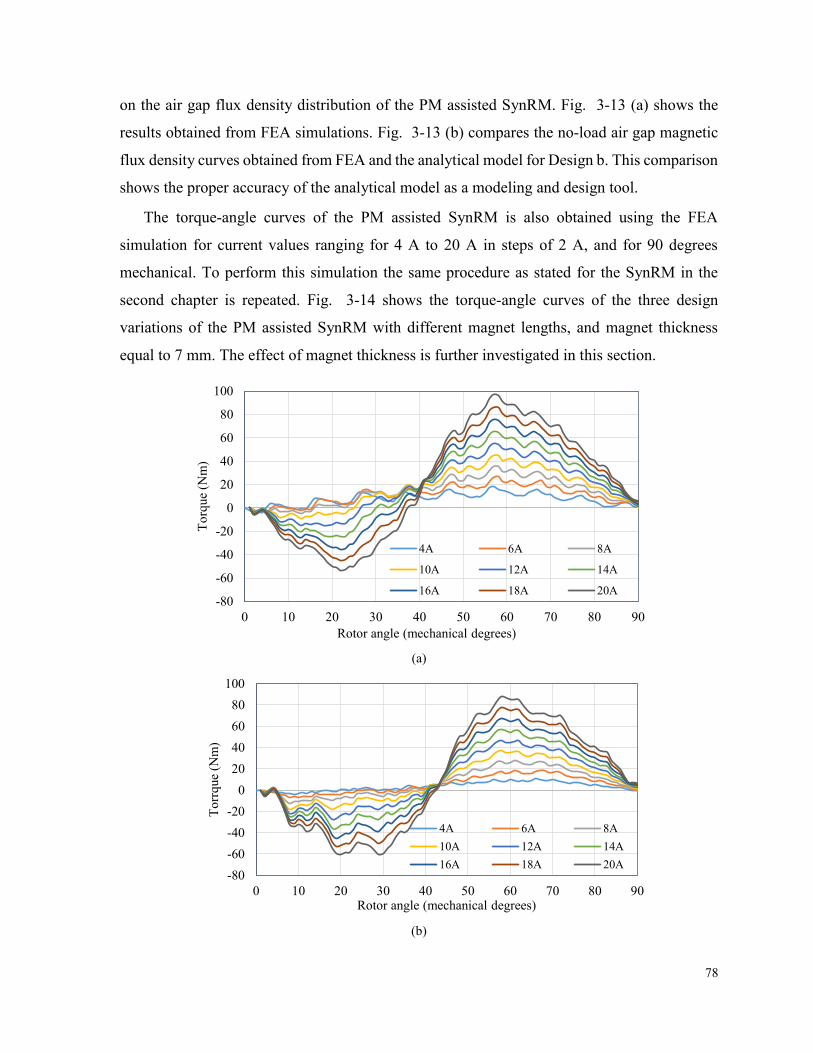
78
on the air gap flux density distribution of the PM assisted SynRM. Fig. 3-13 (a) shows the
results obtained from FEA simulations. Fig. 3-13 (b) compares the no-load air gap magnetic
flux density curves obtained from FEA and the analytical model for Design b. This comparison
shows the proper accuracy of the analytical model as a modeling and design tool.
The torque-angle curves of the PM assisted SynRM is also obtained using the FEA
simulation for current values ranging for 4 A to 20 A in steps of 2 A, and for 90 degrees
mechanical. To perform this simulation the same procedure as stated for the SynRM in the
second chapter is repeated. Fig. 3-14 shows the torque-angle curves of the three design
variations of the PM assisted SynRM with different magnet lengths, and magnet thickness
equal to 7 mm. The effect of magnet thickness is further investigated in this section.
(a)
(b)
-80
-60
-40
-20
0
20
40
60
80
100
0 10 20 30 40 50 60 70 80 90
To
rque
(Nm
)
Rotor angle (mechanical degrees)
4A 6A 8A
10A 12A 14A
16A 18A 20A
-80
-60
-40
-20
0
20
40
60
80
100
0 10 20 30 40 50 60 70 80 90
To
rrq
ue
(Nm
)
Rotor angle (mechanical degrees)
4A 6A 8A
10A 12A 14A
16A 18A 20A
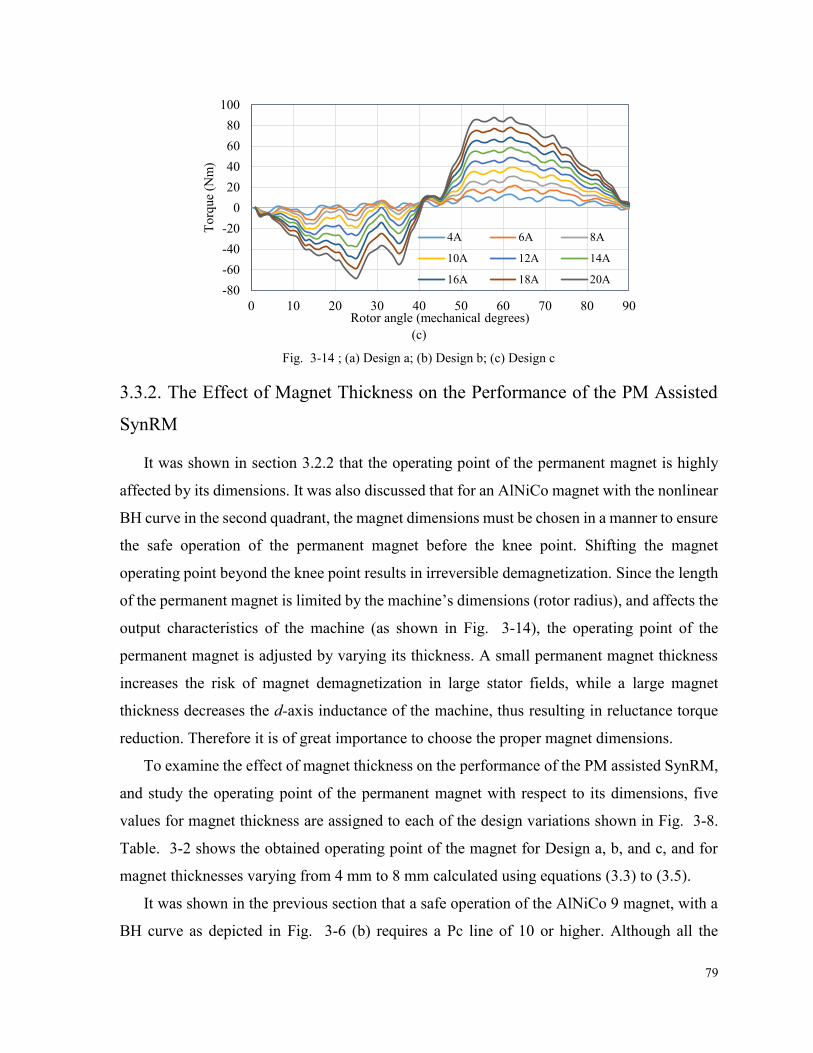
79
(c)
Fig. 3-14 ; (a) Design a; (b) Design b; (c) Design c
3.3.2. The Effect of Magnet Thickness on the Performance of the PM Assisted
SynRM
It was shown in section 3.2.2 that the operating point of the permanent magnet is highly
affected by its dimensions. It was also discussed that for an AlNiCo magnet with the nonlinear
BH curve in the second quadrant, the magnet dimensions must be chosen in a manner to ensure
the safe operation of the permanent magnet before the knee point. Shifting the magnet
operating point beyond the knee point results in irreversible demagnetization. Since the length
of the permanent magnet is limited by the machine’s dimensions (rotor radius), and affects the
output characteristics of the machine (as shown in Fig. 3-14), the operating point of the
permanent magnet is adjusted by varying its thickness. A small permanent magnet thickness
increases the risk of magnet demagnetization in large stator fields, while a large magnet
thickness decreases the d-axis inductance of the machine, thus resulting in reluctance torque
reduction. Therefore it is of great importance to choose the proper magnet dimensions.
To examine the effect of magnet thickness on the performance of the PM assisted SynRM,
and study the operating point of the permanent magnet with respect to its dimensions, five
values for magnet thickness are assigned to each of the design variations shown in Fig. 3-8.
Table. 3-2 shows the obtained operating point of the magnet for Design a, b, and c, and for
magnet thicknesses varying from 4 mm to 8 mm calculated using equations (3.3) to (3.5).
It was shown in the previous section that a safe operation of the AlNiCo 9 magnet, with a
BH curve as depicted in Fig. 3-6 (b) requires a Pc line of 10 or higher. Although all the
-80
-60
-40
-20
0
20
40
60
80
100
0 10 20 30 40 50 60 70 80 90
To
rque
(Nm
)
Rotor angle (mechanical degrees)
4A 6A 8A
10A 12A 14A
16A 18A 20A
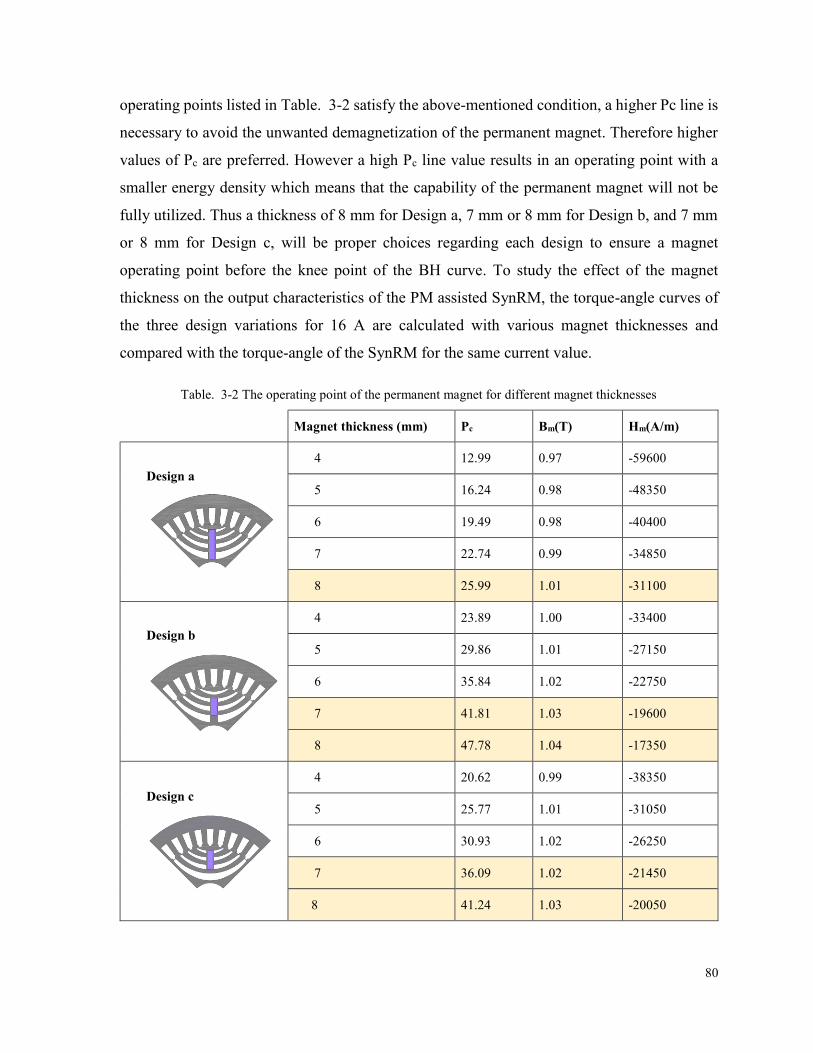
80
operating points listed in Table. 3-2 satisfy the above-mentioned condition, a higher Pc line is
necessary to avoid the unwanted demagnetization of the permanent magnet. Therefore higher
values of Pc are preferred. However a high Pc line value results in an operating point with a
smaller energy density which means that the capability of the permanent magnet will not be
fully utilized. Thus a thickness of 8 mm for Design a, 7 mm or 8 mm for Design b, and 7 mm
or 8 mm for Design c, will be proper choices regarding each design to ensure a magnet
operating point before the knee point of the BH curve. To study the effect of the magnet
thickness on the output characteristics of the PM assisted SynRM, the torque-angle curves of
the three design variations for 16 A are calculated with various magnet thicknesses and
compared with the torque-angle of the SynRM for the same current value.
Table. 3-2 The operating point of the permanent magnet for different magnet thicknesses
Magnet thickness (mm) Pc Bm(T) Hm(A/m)
Design a
4 12.99 0.97 -59600
5 16.24 0.98 -48350
6 19.49 0.98 -40400
7 22.74 0.99 -34850
8 25.99 1.01 -31100
Design b
4 23.89 1.00 -33400
5 29.86 1.01 -27150
6 35.84 1.02 -22750
7 41.81 1.03 -19600
8 47.78 1.04 -17350
Design c
4 20.62 0.99 -38350
5 25.77 1.01 -31050
6 30.93 1.02 -26250
7 36.09 1.02 -21450
8 41.24 1.03 -20050
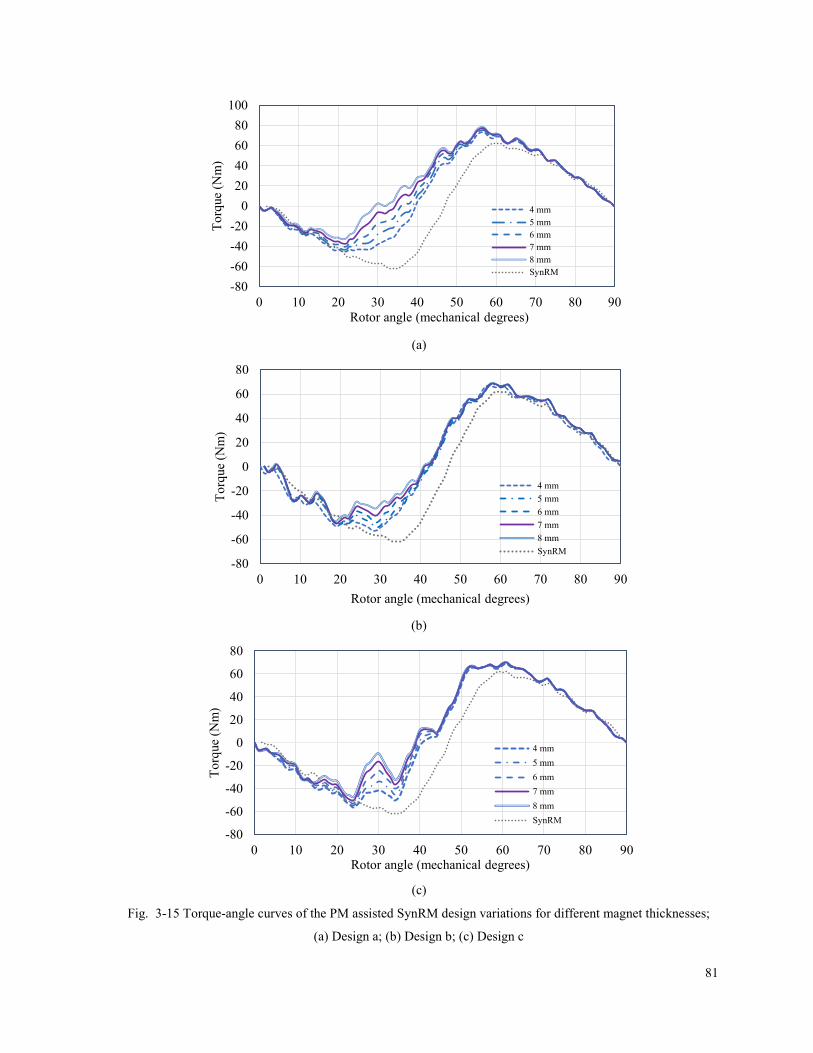
81
(a)
(b)
(c)
Fig. 3-15 Torque-angle curves of the PM assisted SynRM design variations for different magnet thicknesses;
(a) Design a; (b) Design b; (c) Design c
-80
-60
-40
-20
0
20
40
60
80
100
0 10 20 30 40 50 60 70 80 90
To
rque
(Nm
)
Rotor angle (mechanical degrees)
4 mm
5 mm
6 mm
7 mm
8 mm
SynRM
-80
-60
-40
-20
0
20
40
60
80
0 10 20 30 40 50 60 70 80 90
To
rque
(Nm
)
Rotor angle (mechanical degrees)
4 mm
5 mm
6 mm
7 mm
8 mm
SynRM
-80
-60
-40
-20
0
20
40
60
80
0 10 20 30 40 50 60 70 80 90
To
rque
(Nm
)
Rotor angle (mechanical degrees)
4 mm
5 mm
6 mm
7 mm
8 mm
SynRM
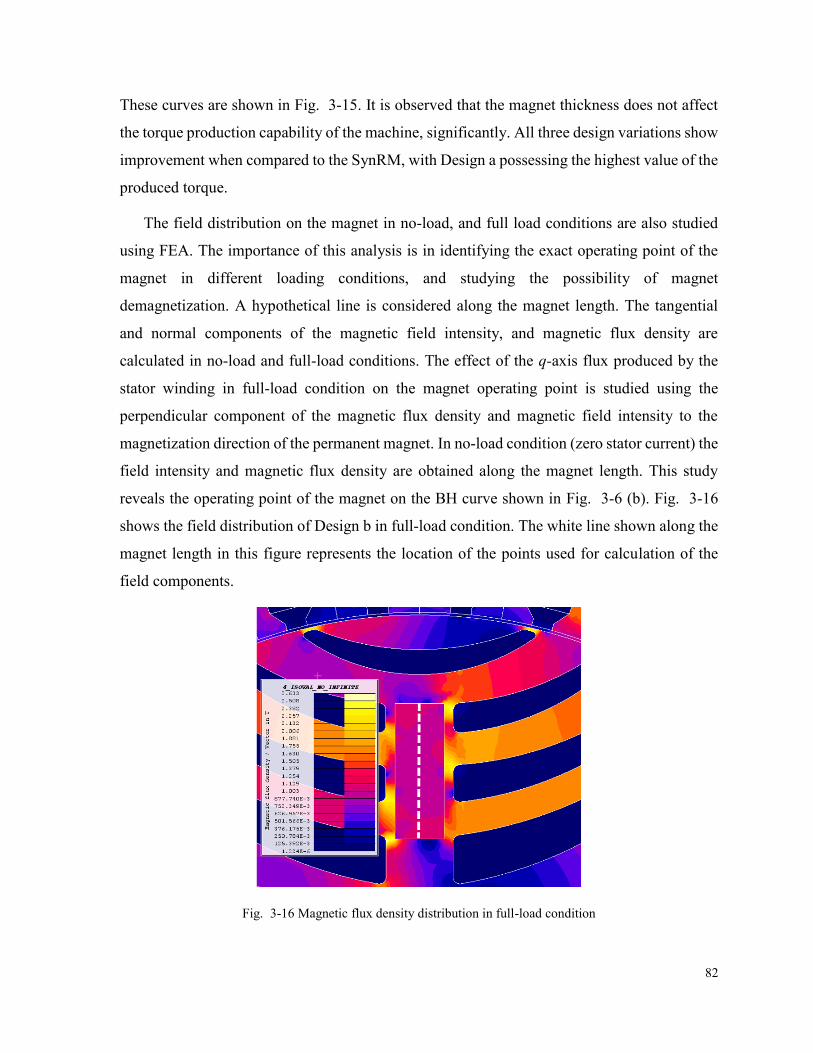
82
These curves are shown in Fig. 3-15. It is observed that the magnet thickness does not affect
the torque production capability of the machine, significantly. All three design variations show
improvement when compared to the SynRM, with Design a possessing the highest value of the
produced torque.
The field distribution on the magnet in no-load, and full load conditions are also studied
using FEA. The importance of this analysis is in identifying the exact operating point of the
magnet in different loading conditions, and studying the possibility of magnet
demagnetization. A hypothetical line is considered along the magnet length. The tangential
and normal components of the magnetic field intensity, and magnetic flux density are
calculated in no-load and full-load conditions. The effect of the q-axis flux produced by the
stator winding in full-load condition on the magnet operating point is studied using the
perpendicular component of the magnetic flux density and magnetic field intensity to the
magnetization direction of the permanent magnet. In no-load condition (zero stator current) the
field intensity and magnetic flux density are obtained along the magnet length. This study
reveals the operating point of the magnet on the BH curve shown in Fig. 3-6 (b). Fig. 3-16
shows the field distribution of Design b in full-load condition. The white line shown along the
magnet length in this figure represents the location of the points used for calculation of the
field components.
Fig. 3-16 Magnetic flux density distribution in full-load condition
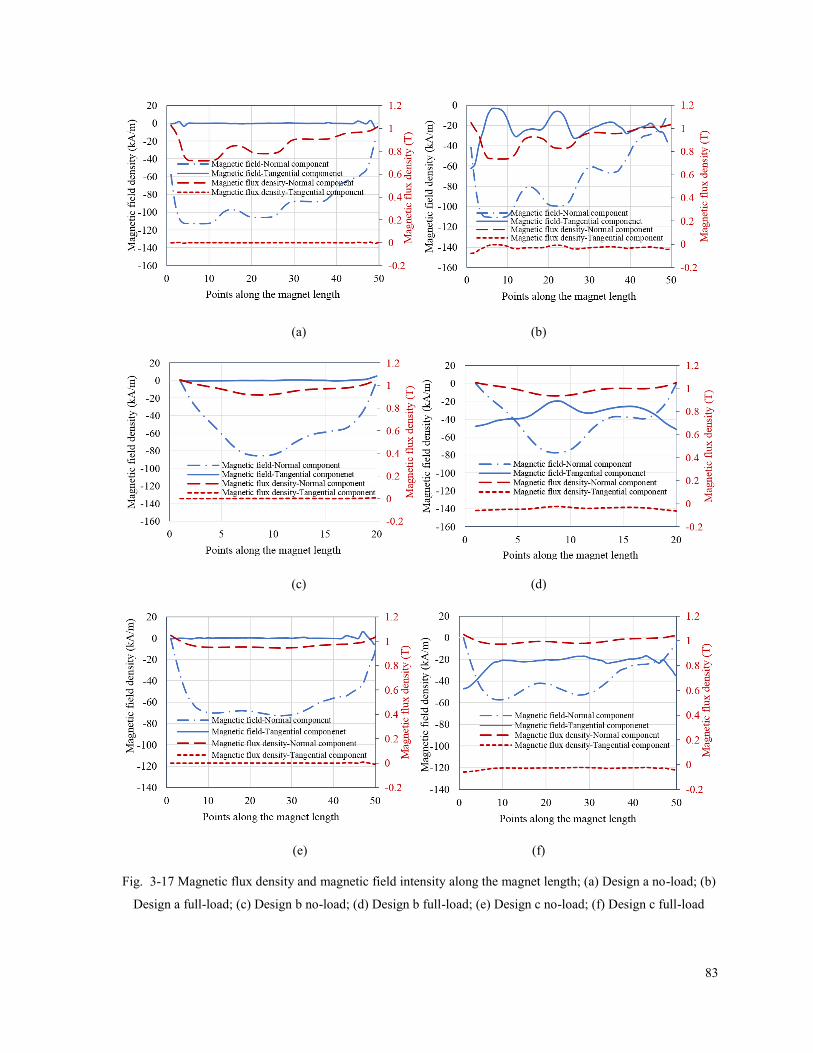
83
(a) (b)
(c) (d)
(e) (f)
Fig. 3-17 Magnetic flux density and magnetic field intensity along the magnet length; (a) Design a no-load; (b)
Design a full-load; (c) Design b no-load; (d) Design b full-load; (e) Design c no-load; (f) Design c full-load
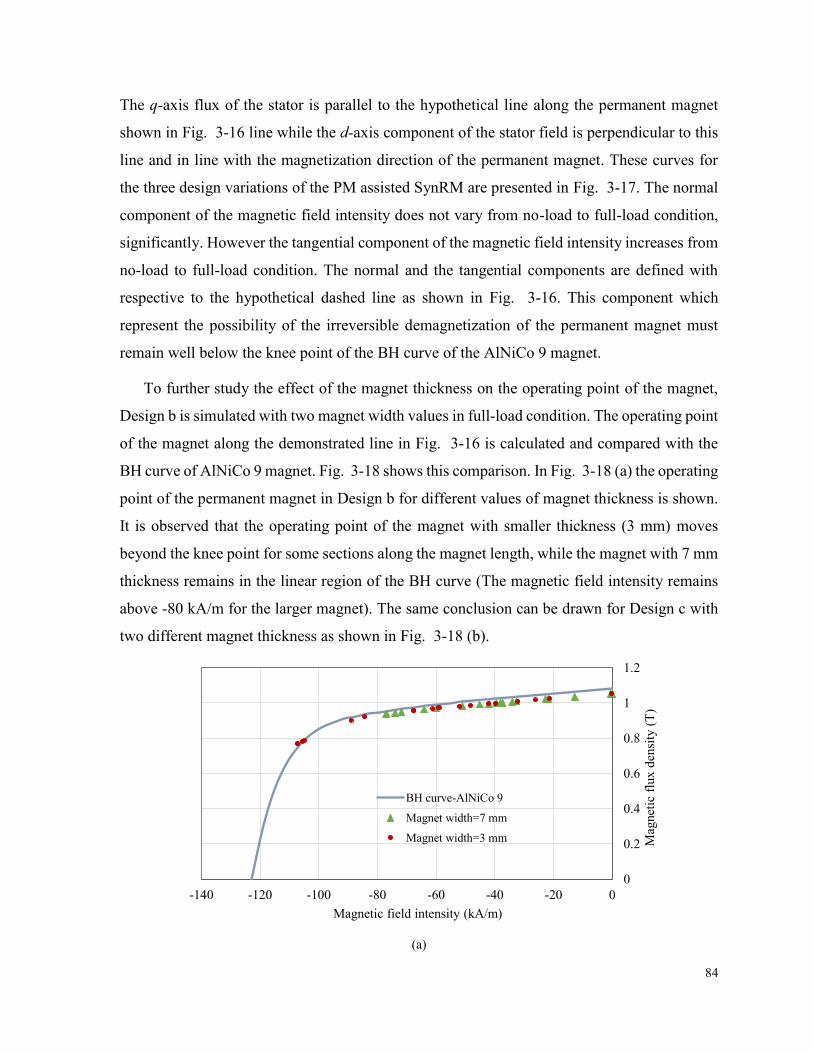
84
The q-axis flux of the stator is parallel to the hypothetical line along the permanent magnet
shown in Fig. 3-16 line while the d-axis component of the stator field is perpendicular to this
line and in line with the magnetization direction of the permanent magnet. These curves for
the three design variations of the PM assisted SynRM are presented in Fig. 3-17. The normal
component of the magnetic field intensity does not vary from no-load to full-load condition,
significantly. However the tangential component of the magnetic field intensity increases from
no-load to full-load condition. The normal and the tangential components are defined with
respective to the hypothetical dashed line as shown in Fig. 3-16. This component which
represent the possibility of the irreversible demagnetization of the permanent magnet must
remain well below the knee point of the BH curve of the AlNiCo 9 magnet.
To further study the effect of the magnet thickness on the operating point of the magnet,
Design b is simulated with two magnet width values in full-load condition. The operating point
of the magnet along the demonstrated line in Fig. 3-16 is calculated and compared with the
BH curve of AlNiCo 9 magnet. Fig. 3-18 shows this comparison. In Fig. 3-18 (a) the operating
point of the permanent magnet in Design b for different values of magnet thickness is shown.
It is observed that the operating point of the magnet with smaller thickness (3 mm) moves
beyond the knee point for some sections along the magnet length, while the magnet with 7 mm
thickness remains in the linear region of the BH curve (The magnetic field intensity remains
above -80 kA/m for the larger magnet). The same conclusion can be drawn for Design c with
two different magnet thickness as shown in Fig. 3-18 (b).
(a)
0
0.2
0.4
0.6
0.8
1
1.2
-140 -120 -100 -80 -60 -40 -20 0
Mag
net
ic f
lux d
ensi
ty (
T)
Magnetic field intensity (kA/m)
BH curve-AlNiCo 9
Magnet width=7 mm
Magnet width=3 mm
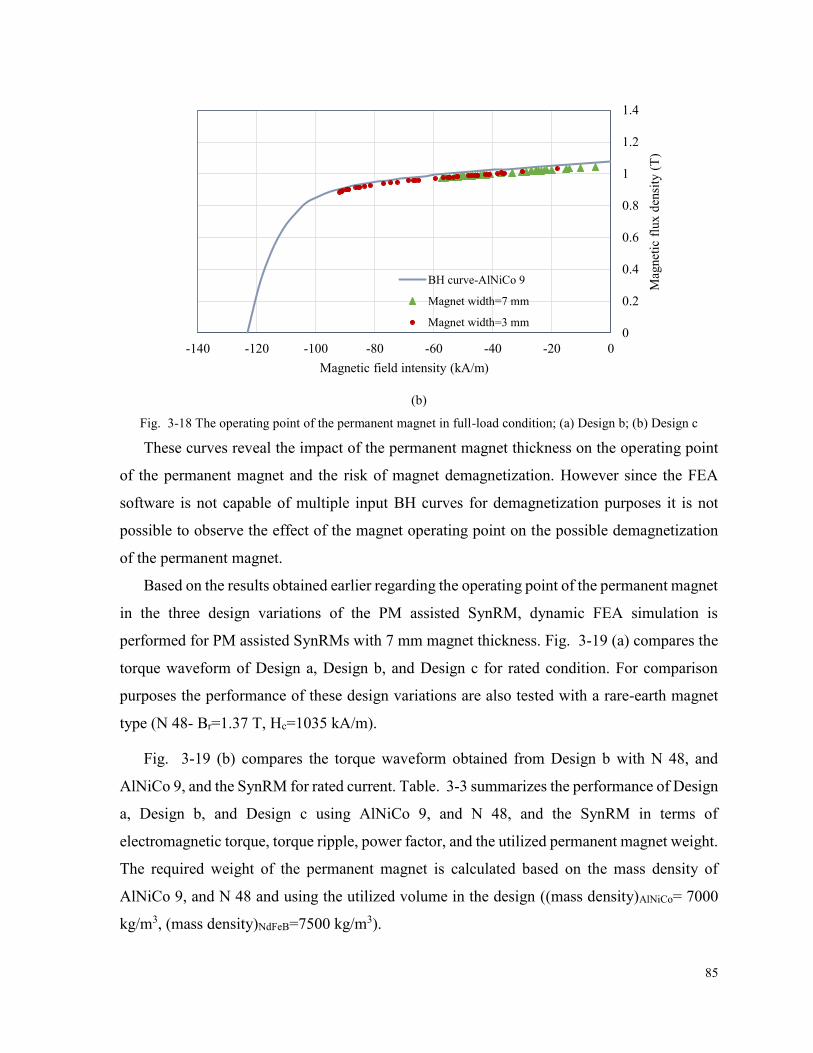
85
(b)
Fig. 3-18 The operating point of the permanent magnet in full-load condition; (a) Design b; (b) Design c
These curves reveal the impact of the permanent magnet thickness on the operating point
of the permanent magnet and the risk of magnet demagnetization. However since the FEA
software is not capable of multiple input BH curves for demagnetization purposes it is not
possible to observe the effect of the magnet operating point on the possible demagnetization
of the permanent magnet.
Based on the results obtained earlier regarding the operating point of the permanent magnet
in the three design variations of the PM assisted SynRM, dynamic FEA simulation is
performed for PM assisted SynRMs with 7 mm magnet thickness. Fig. 3-19 (a) compares the
torque waveform of Design a, Design b, and Design c for rated condition. For comparison
purposes the performance of these design variations are also tested with a rare-earth magnet
type (N 48- Br=1.37 T, Hc=1035 kA/m).
Fig. 3-19 (b) compares the torque waveform obtained from Design b with N 48, and
AlNiCo 9, and the SynRM for rated current. Table. 3-3 summarizes the performance of Design
a, Design b, and Design c using AlNiCo 9, and N 48, and the SynRM in terms of
electromagnetic torque, torque ripple, power factor, and the utilized permanent magnet weight.
The required weight of the permanent magnet is calculated based on the mass density of
AlNiCo 9, and N 48 and using the utilized volume in the design ((mass density)AlNiCo= 7000
kg/m3, (mass density)NdFeB=7500 kg/m3).
0
0.2
0.4
0.6
0.8
1
1.2
1.4
-140 -120 -100 -80 -60 -40 -20 0
Mag
net
ic f
lux d
ensi
ty (
T)
Magnetic field intensity (kA/m)
BH curve-AlNiCo 9
Magnet width=7 mm
Magnet width=3 mm
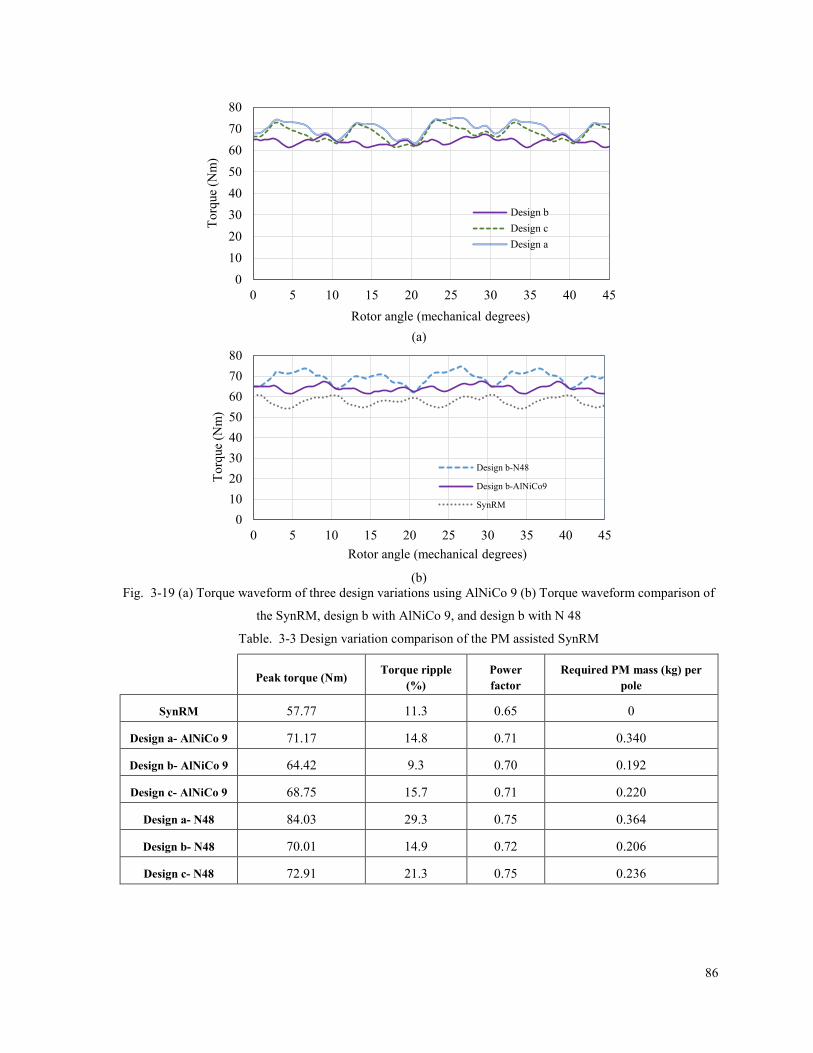
86
(a)
(b)
Fig. 3-19 (a) Torque waveform of three design variations using AlNiCo 9 (b) Torque waveform comparison of
the SynRM, design b with AlNiCo 9, and design b with N 48
Table. 3-3 Design variation comparison of the PM assisted SynRM
Peak torque (Nm) Torque ripple
(%)
Power
factor
Required PM mass (kg) per
pole
SynRM 57.77 11.3 0.65 0
Design a- AlNiCo 9 71.17 14.8 0.71 0.340
Design b- AlNiCo 9 64.42 9.3 0.70 0.192
Design c- AlNiCo 9 68.75 15.7 0.71 0.220
Design a- N48 84.03 29.3 0.75 0.364
Design b- N48 70.01 14.9 0.72 0.206
Design c- N48 72.91 21.3 0.75 0.236
0
10
20
30
40
50
60
70
80
0 5 10 15 20 25 30 35 40 45
To
rque
(Nm
)
Rotor angle (mechanical degrees)
Design b
Design c
Design a
0
10
20
30
40
50
60
70
80
0 5 10 15 20 25 30 35 40 45
To
rque
(Nm
)
Rotor angle (mechanical degrees)
Design b-N48
Design b-AlNiCo9
SynRM
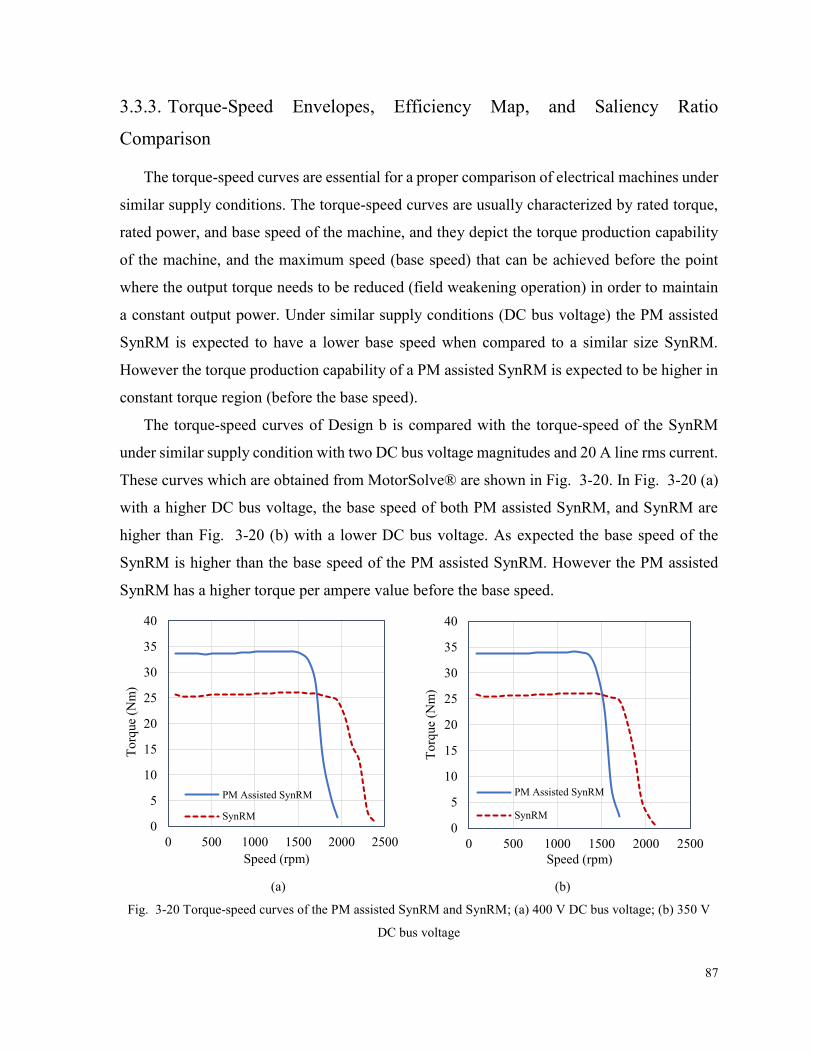
87
3.3.3. Torque-Speed Envelopes, Efficiency Map, and Saliency Ratio
Comparison
The torque-speed curves are essential for a proper comparison of electrical machines under
similar supply conditions. The torque-speed curves are usually characterized by rated torque,
rated power, and base speed of the machine, and they depict the torque production capability
of the machine, and the maximum speed (base speed) that can be achieved before the point
where the output torque needs to be reduced (field weakening operation) in order to maintain
a constant output power. Under similar supply conditions (DC bus voltage) the PM assisted
SynRM is expected to have a lower base speed when compared to a similar size SynRM.
However the torque production capability of a PM assisted SynRM is expected to be higher in
constant torque region (before the base speed).
The torque-speed curves of Design b is compared with the torque-speed of the SynRM
under similar supply condition with two DC bus voltage magnitudes and 20 A line rms current.
These curves which are obtained from MotorSolve® are shown in Fig. 3-20. In Fig. 3-20 (a)
with a higher DC bus voltage, the base speed of both PM assisted SynRM, and SynRM are
higher than Fig. 3-20 (b) with a lower DC bus voltage. As expected the base speed of the
SynRM is higher than the base speed of the PM assisted SynRM. However the PM assisted
SynRM has a higher torque per ampere value before the base speed.
(a) (b)
Fig. 3-20 Torque-speed curves of the PM assisted SynRM and SynRM; (a) 400 V DC bus voltage; (b) 350 V
DC bus voltage
0
5
10
15
20
25
30
35
40
0 500 1000 1500 2000 2500
To
rque
(Nm
)
Speed (rpm)
PM Assisted SynRM
SynRM0
5
10
15
20
25
30
35
40
0 500 1000 1500 2000 2500
To
rque
(Nm
)
Speed (rpm)
PM Assisted SynRM
SynRM
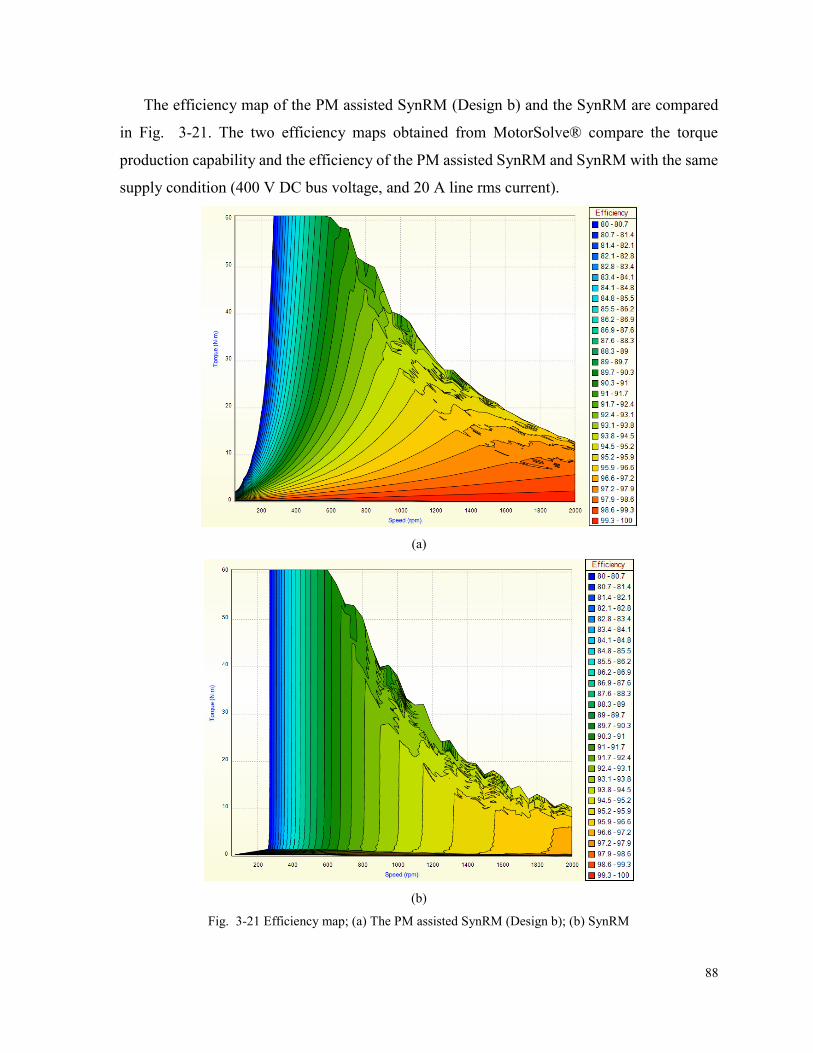
88
The efficiency map of the PM assisted SynRM (Design b) and the SynRM are compared
in Fig. 3-21. The two efficiency maps obtained from MotorSolve® compare the torque
production capability and the efficiency of the PM assisted SynRM and SynRM with the same
supply condition (400 V DC bus voltage, and 20 A line rms current).
(a)
(b)
Fig. 3-21 Efficiency map; (a) The PM assisted SynRM (Design b); (b) SynRM
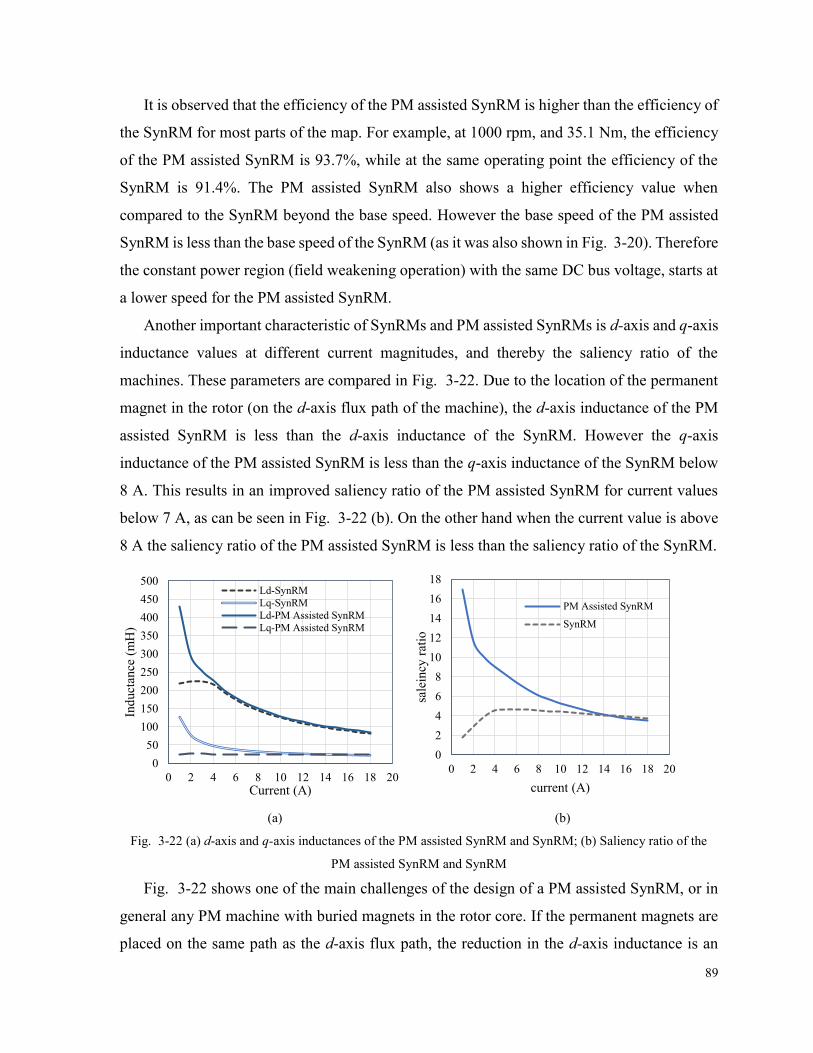
89
It is observed that the efficiency of the PM assisted SynRM is higher than the efficiency of
the SynRM for most parts of the map. For example, at 1000 rpm, and 35.1 Nm, the efficiency
of the PM assisted SynRM is 93.7%, while at the same operating point the efficiency of the
SynRM is 91.4%. The PM assisted SynRM also shows a higher efficiency value when
compared to the SynRM beyond the base speed. However the base speed of the PM assisted
SynRM is less than the base speed of the SynRM (as it was also shown in Fig. 3-20). Therefore
the constant power region (field weakening operation) with the same DC bus voltage, starts at
a lower speed for the PM assisted SynRM.
Another important characteristic of SynRMs and PM assisted SynRMs is d-axis and q-axis
inductance values at different current magnitudes, and thereby the saliency ratio of the
machines. These parameters are compared in Fig. 3-22. Due to the location of the permanent
magnet in the rotor (on the d-axis flux path of the machine), the d-axis inductance of the PM
assisted SynRM is less than the d-axis inductance of the SynRM. However the q-axis
inductance of the PM assisted SynRM is less than the q-axis inductance of the SynRM below
8 A. This results in an improved saliency ratio of the PM assisted SynRM for current values
below 7 A, as can be seen in Fig. 3-22 (b). On the other hand when the current value is above
8 A the saliency ratio of the PM assisted SynRM is less than the saliency ratio of the SynRM.
(a) (b)
Fig. 3-22 (a) d-axis and q-axis inductances of the PM assisted SynRM and SynRM; (b) Saliency ratio of the
PM assisted SynRM and SynRM
Fig. 3-22 shows one of the main challenges of the design of a PM assisted SynRM, or in
general any PM machine with buried magnets in the rotor core. If the permanent magnets are
placed on the same path as the d-axis flux path, the reduction in the d-axis inductance is an
0
50
100
150
200
250
300
350
400
450
500
0 2 4 6 8 10 12 14 16 18 20
Ind
uct
ance
(m
H)
Current (A)
Ld-SynRM
Lq-SynRM
Ld-PM Assisted SynRM
Lq-PM Assisted SynRM
0
2
4
6
8
10
12
14
16
18
0 2 4 6 8 10 12 14 16 18 20
sale
incy
rat
io
current (A)
PM Assisted SynRM
SynRM
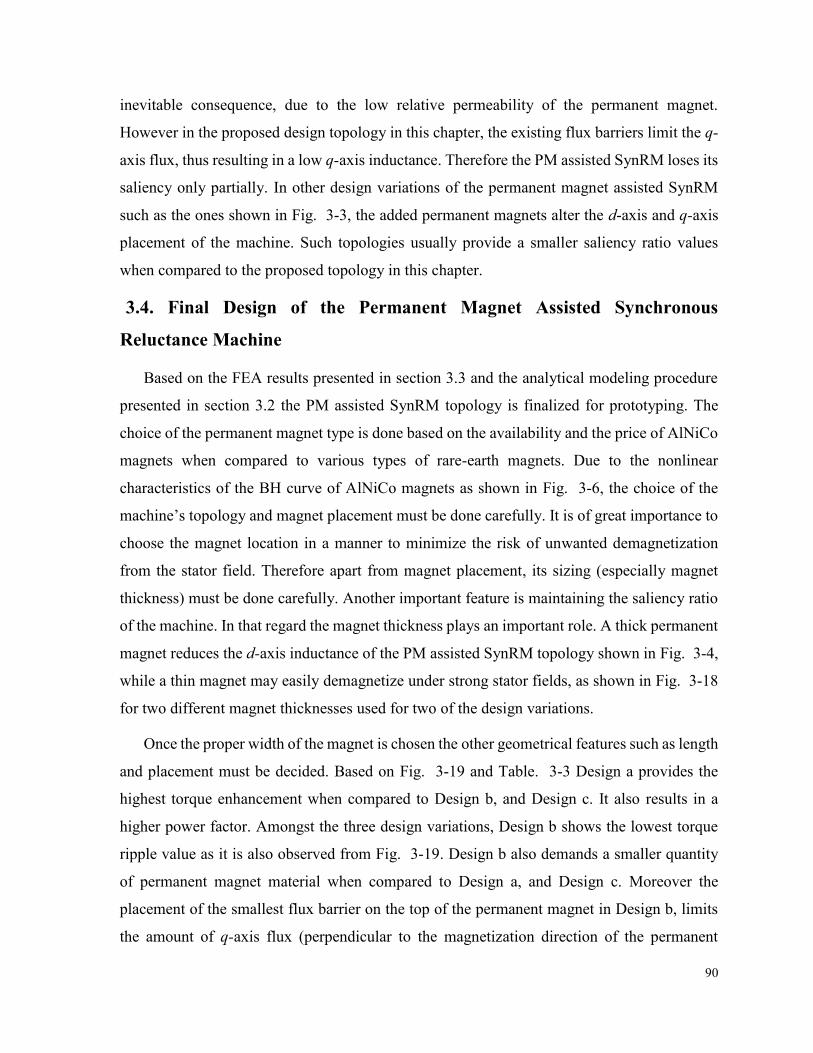
90
inevitable consequence, due to the low relative permeability of the permanent magnet.
However in the proposed design topology in this chapter, the existing flux barriers limit the q-
axis flux, thus resulting in a low q-axis inductance. Therefore the PM assisted SynRM loses its
saliency only partially. In other design variations of the permanent magnet assisted SynRM
such as the ones shown in Fig. 3-3, the added permanent magnets alter the d-axis and q-axis
placement of the machine. Such topologies usually provide a smaller saliency ratio values
when compared to the proposed topology in this chapter.
3.4. Final Design of the Permanent Magnet Assisted Synchronous
Reluctance Machine
Based on the FEA results presented in section 3.3 and the analytical modeling procedure
presented in section 3.2 the PM assisted SynRM topology is finalized for prototyping. The
choice of the permanent magnet type is done based on the availability and the price of AlNiCo
magnets when compared to various types of rare-earth magnets. Due to the nonlinear
characteristics of the BH curve of AlNiCo magnets as shown in Fig. 3-6, the choice of the
machine’s topology and magnet placement must be done carefully. It is of great importance to
choose the magnet location in a manner to minimize the risk of unwanted demagnetization
from the stator field. Therefore apart from magnet placement, its sizing (especially magnet
thickness) must be done carefully. Another important feature is maintaining the saliency ratio
of the machine. In that regard the magnet thickness plays an important role. A thick permanent
magnet reduces the d-axis inductance of the PM assisted SynRM topology shown in Fig. 3-4,
while a thin magnet may easily demagnetize under strong stator fields, as shown in Fig. 3-18
for two different magnet thicknesses used for two of the design variations.
Once the proper width of the magnet is chosen the other geometrical features such as length
and placement must be decided. Based on Fig. 3-19 and Table. 3-3 Design a provides the
highest torque enhancement when compared to Design b, and Design c. It also results in a
higher power factor. Amongst the three design variations, Design b shows the lowest torque
ripple value as it is also observed from Fig. 3-19. Design b also demands a smaller quantity
of permanent magnet material when compared to Design a, and Design c. Moreover the
placement of the smallest flux barrier on the top of the permanent magnet in Design b, limits
the amount of q-axis flux (perpendicular to the magnetization direction of the permanent
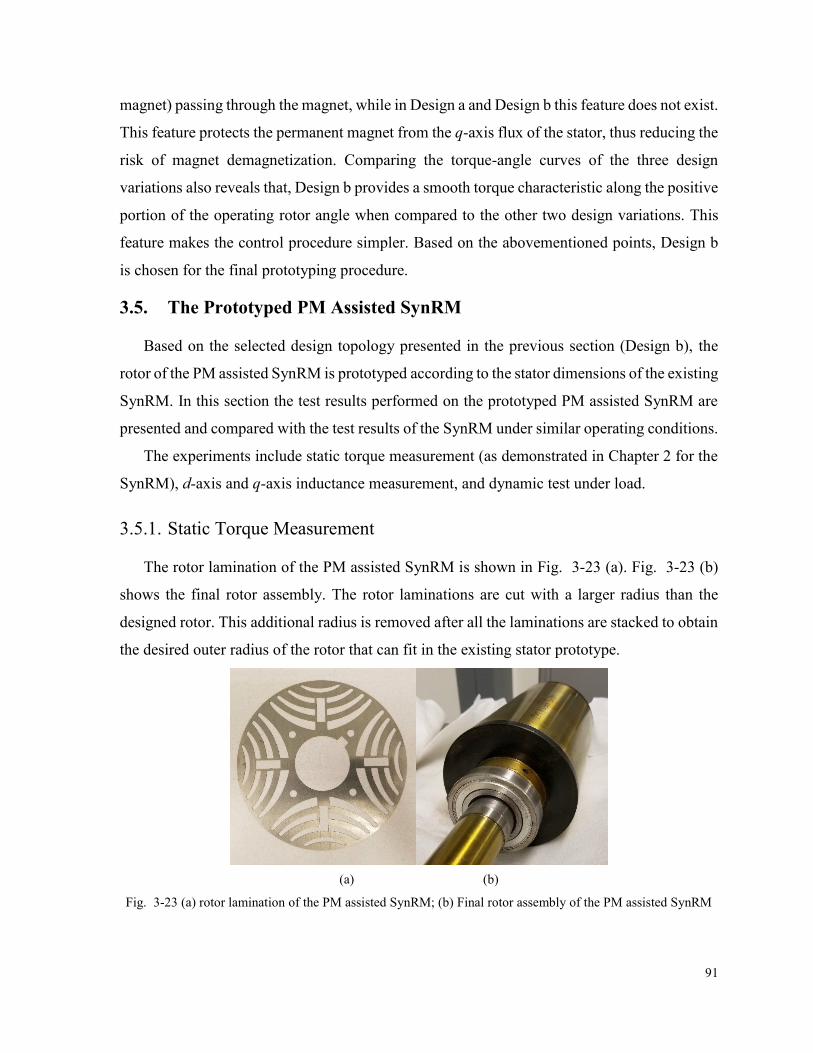
91
magnet) passing through the magnet, while in Design a and Design b this feature does not exist.
This feature protects the permanent magnet from the q-axis flux of the stator, thus reducing the
risk of magnet demagnetization. Comparing the torque-angle curves of the three design
variations also reveals that, Design b provides a smooth torque characteristic along the positive
portion of the operating rotor angle when compared to the other two design variations. This
feature makes the control procedure simpler. Based on the abovementioned points, Design b
is chosen for the final prototyping procedure.
3.5. The Prototyped PM Assisted SynRM
Based on the selected design topology presented in the previous section (Design b), the
rotor of the PM assisted SynRM is prototyped according to the stator dimensions of the existing
SynRM. In this section the test results performed on the prototyped PM assisted SynRM are
presented and compared with the test results of the SynRM under similar operating conditions.
The experiments include static torque measurement (as demonstrated in Chapter 2 for the
SynRM), d-axis and q-axis inductance measurement, and dynamic test under load.
3.5.1. Static Torque Measurement
The rotor lamination of the PM assisted SynRM is shown in Fig. 3-23 (a). Fig. 3-23 (b)
shows the final rotor assembly. The rotor laminations are cut with a larger radius than the
designed rotor. This additional radius is removed after all the laminations are stacked to obtain
the desired outer radius of the rotor that can fit in the existing stator prototype.
(a) (b)
Fig. 3-23 (a) rotor lamination of the PM assisted SynRM; (b) Final rotor assembly of the PM assisted SynRM
92
The final prototype is placed inside the stator and held in place using the ball-bearings on
the two ends of the rotor shaft (as shown in Fig. 3-23 (b)).
The static test procedure is explained in Chapter 2 for the SynRM. The rotor position is
determined using the encoder, while the torque exerted on the shaft is measured using the
torque transducer. The static torque produced by the PM assisted SynRM is measured for three
current magnitudes: 8 A, 12 A, and 16 A. For each current magnitude the rotor angle is varied
from 0 degrees to 100 degrees electrical. Fig. 3-24 compares the torque–angle curves of the
SynRM and the PM assisted SynRM for these three current magnitudes when the permanent
magnets are 50 percent magnetized.
(a) (b)
(c)
Fig. 3-24 Torque-angle curves of the SynRM and the PM assisted SynRM; (a) 16 A; (b) 12 A; (c) 8 A
The peak torque of the PM assisted SynRM for 16 A is 55 Nm while the peak torque of the
SynRM is 52 Nm. The largest improvement in the output torque of the PM assisted SynRM
when compared to the SynRM takes place at the lower current magnitude (8 A). When the
0
10
20
30
40
50
60
0 20 40 60 80 100
To
rque
(Nm
)
Rotor angle (electrical degrees)
PM assisted SynRM-16 A
SynRM-16 A
0
5
10
15
20
25
30
35
40
45
0 20 40 60 80 100
To
rque
(Nm
)
Rotor angle (electrical degrees)
PM assisted SynRM-12A
SynRM-12 A
0
5
10
15
20
25
0 20 40 60 80 100
To
rque
(Nm
)
Rotor angle (electrical degrees)
PM assisted SynRM-8 A
SynRM-8 A

93
machine is supplied with 8 A the peak torque of the PM assisted SynRM is 22 Nm which is 29
percent higher than the torque produced by the SynRM at the same phase current (17 Nm). The
effect of permanent magnets is also observed in Fig. 3-24. The torque-angle curve of the
SynRM reaches its zero value at 90 degrees electrical. However the PM assisted SynRM
provides 14.5 Nm torque at 90 degrees which originates from the permanent magnets.
3.5.2. d-axis and q-axis Inductance Measurement
The d-axis and q-axis inductances of the PM assisted SynRM and the SynRM are measured
using the DC test. In this test a DC current with the desired magnitude is supplied through the
phase winding of the machine while the rotor is locked at d-axis or q-axis (for d-axis or q-axis
inductance measurement). The voltage and current curves of the winding are captured as the
supply voltage is switched to zero. The voltage and current curves of the PM assisted SynRM
are shown in Fig. 3-25. In this figure the supply current is set to 16 A and then switched off.
Fig. 3-25 Phase voltage and current curves of the PM assisted SynRM for inductance measurement
Using equation (3.7) the flux linkage, 𝜆 is calculated based on the voltage and current curves.
𝜆 = −∫ (𝑣 − 𝑅𝑖)𝑑𝜁𝑡
0
(3.7)
where 𝑣, 𝑅, 𝑖, and 𝜁is the voltage, resistance, current, and the dummy variable of integration.
𝑡 shows the time period of integration. Using the demonstrated approach, the d-axis and q-axis
inductances of the PM assisted SynRM and the SynRM are obtained. Fig. 3-26 compares the
d-axis and q-axis inductances of the two machines.
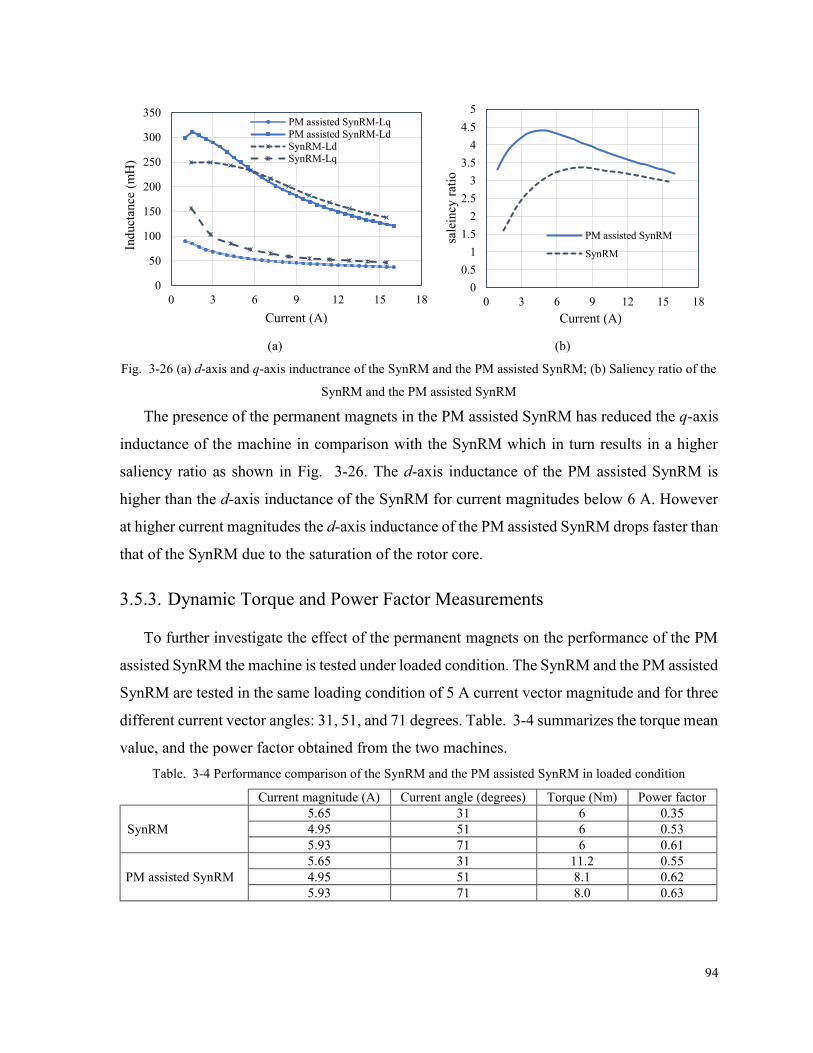
94
(a) (b)
Fig. 3-26 (a) d-axis and q-axis inductrance of the SynRM and the PM assisted SynRM; (b) Saliency ratio of the
SynRM and the PM assisted SynRM
The presence of the permanent magnets in the PM assisted SynRM has reduced the q-axis
inductance of the machine in comparison with the SynRM which in turn results in a higher
saliency ratio as shown in Fig. 3-26. The d-axis inductance of the PM assisted SynRM is
higher than the d-axis inductance of the SynRM for current magnitudes below 6 A. However
at higher current magnitudes the d-axis inductance of the PM assisted SynRM drops faster than
that of the SynRM due to the saturation of the rotor core.
3.5.3. Dynamic Torque and Power Factor Measurements
To further investigate the effect of the permanent magnets on the performance of the PM
assisted SynRM the machine is tested under loaded condition. The SynRM and the PM assisted
SynRM are tested in the same loading condition of 5 A current vector magnitude and for three
different current vector angles: 31, 51, and 71 degrees. Table. 3-4 summarizes the torque mean
value, and the power factor obtained from the two machines.
Table. 3-4 Performance comparison of the SynRM and the PM assisted SynRM in loaded condition
Current magnitude (A) Current angle (degrees) Torque (Nm) Power factor
SynRM
5.65 31 6 0.35
4.95 51 6 0.53
5.93 71 6 0.61
PM assisted SynRM
5.65 31 11.2 0.55
4.95 51 8.1 0.62
5.93 71 8.0 0.63
0
50
100
150
200
250
300
350
0 3 6 9 12 15 18
Ind
uct
ance
(m
H)
Current (A)
PM assisted SynRM-Lq
PM assisted SynRM-Ld
SynRM-Ld
SynRM-Lq
0
0.5
1
1.5
2
2.5
3
3.5
4
4.5
5
0 3 6 9 12 15 18
sale
incy
rat
io
Current (A)
PM assisted SynRM
SynRM
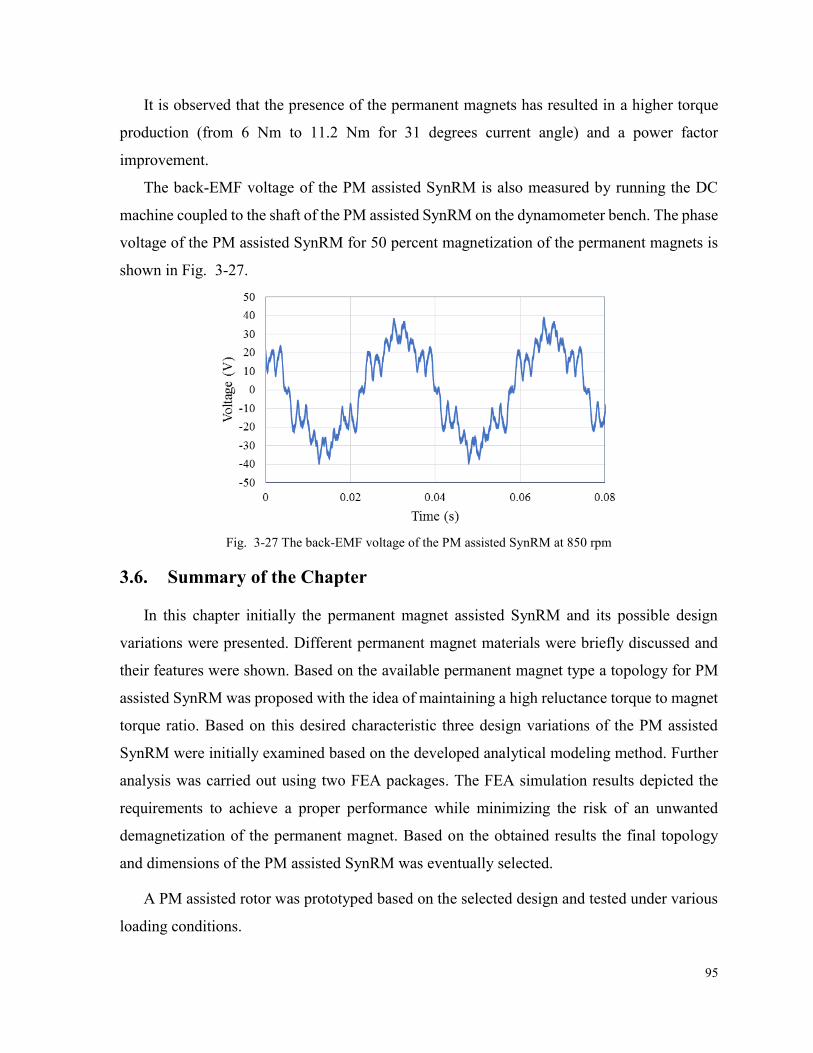
95
It is observed that the presence of the permanent magnets has resulted in a higher torque
production (from 6 Nm to 11.2 Nm for 31 degrees current angle) and a power factor
improvement.
The back-EMF voltage of the PM assisted SynRM is also measured by running the DC
machine coupled to the shaft of the PM assisted SynRM on the dynamometer bench. The phase
voltage of the PM assisted SynRM for 50 percent magnetization of the permanent magnets is
shown in Fig. 3-27.
Fig. 3-27 The back-EMF voltage of the PM assisted SynRM at 850 rpm
3.6. Summary of the Chapter
In this chapter initially the permanent magnet assisted SynRM and its possible design
variations were presented. Different permanent magnet materials were briefly discussed and
their features were shown. Based on the available permanent magnet type a topology for PM
assisted SynRM was proposed with the idea of maintaining a high reluctance torque to magnet
torque ratio. Based on this desired characteristic three design variations of the PM assisted
SynRM were initially examined based on the developed analytical modeling method. Further
analysis was carried out using two FEA packages. The FEA simulation results depicted the
requirements to achieve a proper performance while minimizing the risk of an unwanted
demagnetization of the permanent magnet. Based on the obtained results the final topology
and dimensions of the PM assisted SynRM was eventually selected.
A PM assisted rotor was prototyped based on the selected design and tested under various
loading conditions.
96
Chapter 4 Stand-Alone Operation of the
Synchronous Reluctance Generator
4.1. Introduction
SynRM as a robust [33], simple, and comparatively less expensive generator initially gained
interests in 1990s. Through the past three decades, different aspects of the generator operation
of the SynRM have been discussed in various research works. As an example the performance
and output characteristics of synchronous reluctance generators (SynRGs) are discussed in [34,
35, 36]; the operating limits of the SynRG are presented in [37, 38]; and control strategies of
the SynRG are explained in [39, 40, 41, 42]. [84] studies the transient, dynamic, and steady state
performance of self-excited reluctance generator through computer simulations, and the effect
of load resistance on the voltage collapse are shown. Due to the absence of field excitation (such
as permanent magnets or field winding similar to a wound field synchronous machine) in
SynRMs, the generator operation is more challenging when compared to a typical permanent
magnet synchronous machine (PMSM). Therefore in some studies the absence of field
excitation on the rotor is compensated by adding a DC winding to the stator [85]. This DC
winding enables the machine to operate either in the synchronous, sub synchronous or super
synchronous modes, at a relatively high manufacturing and operation cost. A stand-alone
SynRG is not capable of producing the required electromotive force to supply the load, unless
it is connected to a properly sized capacitor bank. Although the capacitor bank is necessary for
stand-alone generator operation of the SynRG, it is not adequate. The generator operation of
SynRM requires maintaining certain criteria [86], somehow the same as induction generators
[43, 44]. Despite the importance of the start-up procedure in SynRG only a few number of
studies have focused on the requirements which assure the build-up procedure of the terminal
voltage of the SynRG.
The build-up procedure of the terminal voltage in stand-alone SynRGs and induction
machines is usually referred to as self-excitation and it depends on the nonlinear characteristic
of the ferromagnetic core material [39], presence of a sufficient initial condition in the system
[43], a properly sized capacitor bank, and maintaining a minimum speed. The required initial
condition can either be an initial voltage on the capacitor bank or a residual magnetism in the
97
machine’s core. The studies of self-excitation phenomenon in induction generators can be found
in [44, 45, 46]. However fewer studies of this phenomenon in SynRMs are performed. Most of
the available research focus on the output characteristics of the SynRG as mentioned earlier. In
[47] the steady-state performance of the SynRG is studied and it is shown that the air gap flux
linkage and core saturation affect the generator performance significantly. Control strategies of
the SynRG such as extended speed range operation while decreasing the conduction loss are
discussed in [34]. Voltage control for a super high-speed SynRG system with a pulse width
modulation (PWM) voltage source converter is presented in [42]. Testing the SynRG at
different loading conditions, obtaining the efficiency and power factor of the machine, and
identifying the maximum power-conversion capability of the SynRG are covered in [48].
However none of the mentioned studies, investigate the criteria for self-excitation of the SynRG
in stand-alone operation. Although it is observed in experiments that the occurrence of self-
excitation requires certain criteria to be met [86, 87].
To ensure the occurrence of self-excitation, pre-charging of the capacitors is suggested
generally as a method for providing the required initial condition [43, 88] and the core
characteristic analysis is usually neglected in the available literature. The main reason for this
choice (pre-charging the capacitors) is that the presence of the residual flux is considered to be
unreliable and difficult to investigate. However it is shown in this chapter that the residual flux
as an initial condition can be reliable, if certain criteria are met. Besides once the magnetic core
is magnetized, the obtained residual flux will remain, unless the core is demagnetized by some
external source (due to a fault for instance).
The required criteria to ensure a successful self-excitation in a stand-alone SynRG are
investigated in this chapter. It is shown in section 5.2 that despite the mathematical prediction,
only the presence of the initial condition in the system does not always result in the successful
voltage build-up process. In other words the initial condition of the system must be above a
certain value which is shown in this chapter. This initial value must be provided prior to the
start-up of the SynRG and can be either a voltage in the capacitor bank or a residual magnetism
in the core. This study considers the minimum required residual magnetism. To obtain the
minimum residual flux, the machine’s characteristics, ferromagnetic core material of the
machine, and the size of the capacitor bank must be identified. It is also observed in simulations
that the start-up acceleration of the SynRG to achieve the nominal speed required for self-
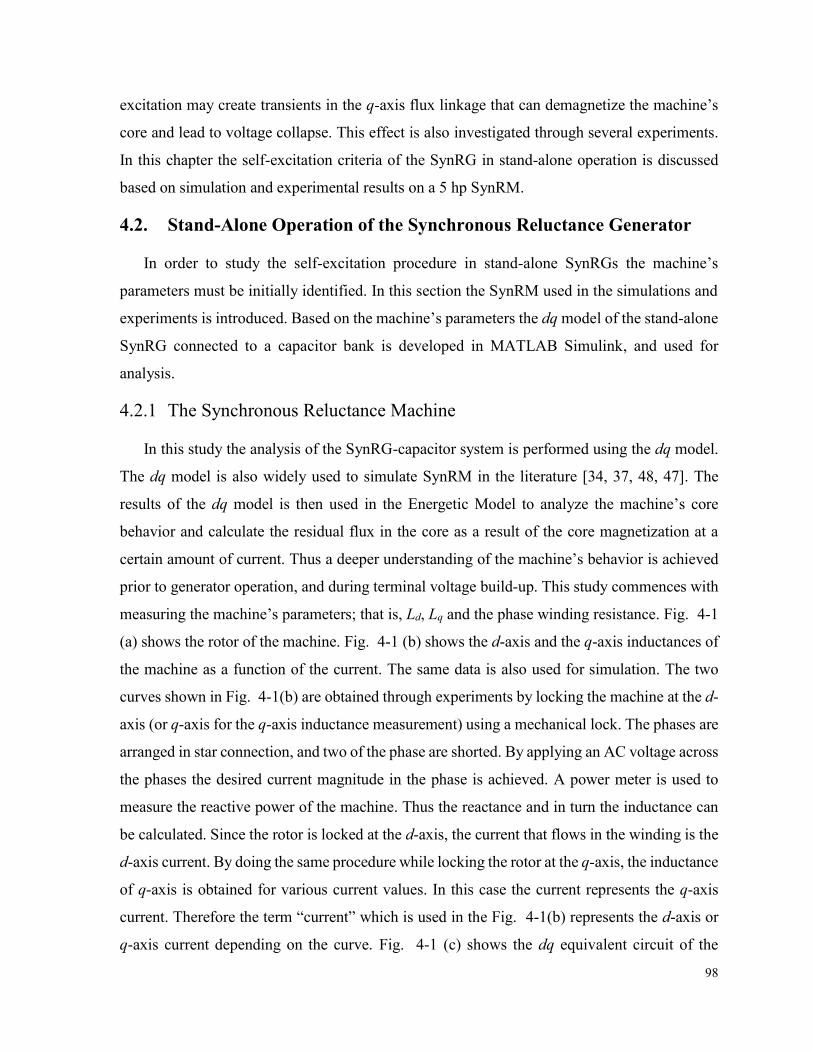
98
excitation may create transients in the q-axis flux linkage that can demagnetize the machine’s
core and lead to voltage collapse. This effect is also investigated through several experiments.
In this chapter the self-excitation criteria of the SynRG in stand-alone operation is discussed
based on simulation and experimental results on a 5 hp SynRM.
4.2. Stand-Alone Operation of the Synchronous Reluctance Generator
In order to study the self-excitation procedure in stand-alone SynRGs the machine’s
parameters must be initially identified. In this section the SynRM used in the simulations and
experiments is introduced. Based on the machine’s parameters the dq model of the stand-alone
SynRG connected to a capacitor bank is developed in MATLAB Simulink, and used for
analysis.
4.2.1 The Synchronous Reluctance Machine
In this study the analysis of the SynRG-capacitor system is performed using the dq model.
The dq model is also widely used to simulate SynRM in the literature [34, 37, 48, 47]. The
results of the dq model is then used in the Energetic Model to analyze the machine’s core
behavior and calculate the residual flux in the core as a result of the core magnetization at a
certain amount of current. Thus a deeper understanding of the machine’s behavior is achieved
prior to generator operation, and during terminal voltage build-up. This study commences with
measuring the machine’s parameters; that is, Ld, Lq and the phase winding resistance. Fig. 4-1
(a) shows the rotor of the machine. Fig. 4-1 (b) shows the d-axis and the q-axis inductances of
the machine as a function of the current. The same data is also used for simulation. The two
curves shown in Fig. 4-1(b) are obtained through experiments by locking the machine at the d-
axis (or q-axis for the q-axis inductance measurement) using a mechanical lock. The phases are
arranged in star connection, and two of the phase are shorted. By applying an AC voltage across
the phases the desired current magnitude in the phase is achieved. A power meter is used to
measure the reactive power of the machine. Thus the reactance and in turn the inductance can
be calculated. Since the rotor is locked at the d-axis, the current that flows in the winding is the
d-axis current. By doing the same procedure while locking the rotor at the q-axis, the inductance
of q-axis is obtained for various current values. In this case the current represents the q-axis
current. Therefore the term “current” which is used in the Fig. 4-1(b) represents the d-axis or
q-axis current depending on the curve. Fig. 4-1 (c) shows the dq equivalent circuit of the
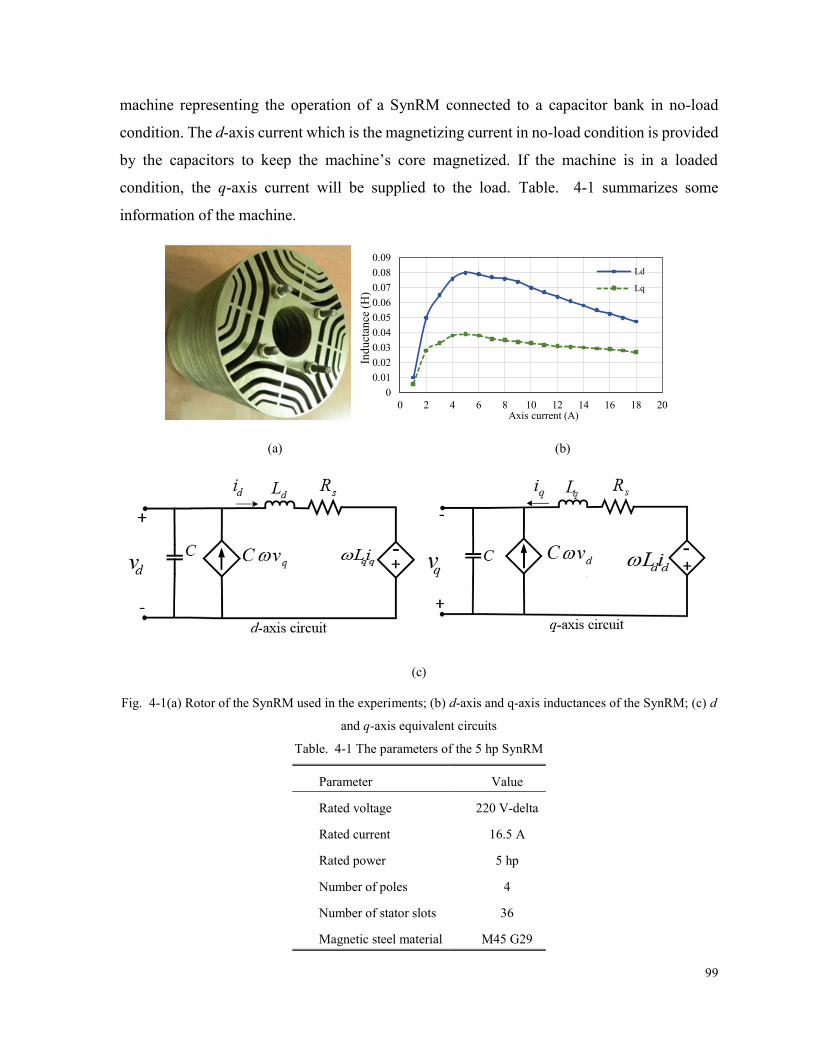
99
machine representing the operation of a SynRM connected to a capacitor bank in no-load
condition. The d-axis current which is the magnetizing current in no-load condition is provided
by the capacitors to keep the machine’s core magnetized. If the machine is in a loaded
condition, the q-axis current will be supplied to the load. Table. 4-1 summarizes some
information of the machine.
(a) (b)
(c)
Fig. 4-1(a) Rotor of the SynRM used in the experiments; (b) d-axis and q-axis inductances of the SynRM; (c) d
and q-axis equivalent circuits
Table. 4-1 The parameters of the 5 hp SynRM
Parameter Value
Rated voltage 220 V-delta
Rated current 16.5 A
Rated power 5 hp
Number of poles 4
Number of stator slots 36
Magnetic steel material M45 G29
0
0.01
0.02
0.03
0.04
0.05
0.06
0.07
0.08
0.09
0 2 4 6 8 10 12 14 16 18 20
Ind
uct
ance
(H
)
Axis current (A)
Ld
Lq
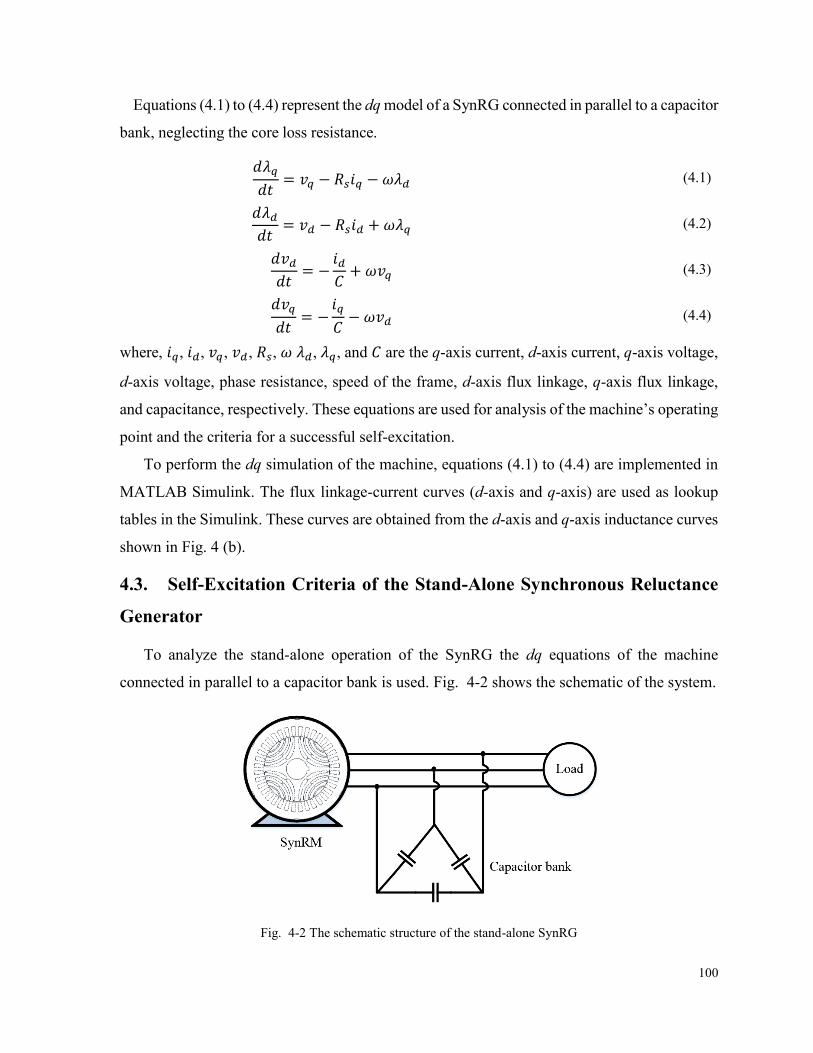
100
Equations (4.1) to (4.4) represent the dq model of a SynRG connected in parallel to a capacitor
bank, neglecting the core loss resistance.
𝑑𝜆𝑞
𝑑𝑡= 𝑣𝑞 − 𝑅𝑠𝑖𝑞 − 𝜔𝜆𝑑 (4.1)
𝑑𝜆𝑑𝑑𝑡
= 𝑣𝑑 − 𝑅𝑠𝑖𝑑 + 𝜔𝜆𝑞 (4.2)
𝑑𝑣𝑑𝑑𝑡
= −𝑖𝑑𝐶+ 𝜔𝑣𝑞 (4.3)
𝑑𝑣𝑞
𝑑𝑡= −
𝑖𝑞
𝐶− 𝜔𝑣𝑑 (4.4)
where, 𝑖𝑞, 𝑖𝑑, 𝑣𝑞, 𝑣𝑑, 𝑅𝑠, 𝜔 𝜆𝑑, 𝜆𝑞, and 𝐶 are the q-axis current, d-axis current, q-axis voltage,
d-axis voltage, phase resistance, speed of the frame, d-axis flux linkage, q-axis flux linkage,
and capacitance, respectively. These equations are used for analysis of the machine’s operating
point and the criteria for a successful self-excitation.
To perform the dq simulation of the machine, equations (4.1) to (4.4) are implemented in
MATLAB Simulink. The flux linkage-current curves (d-axis and q-axis) are used as lookup
tables in the Simulink. These curves are obtained from the d-axis and q-axis inductance curves
shown in Fig. 4 (b).
4.3. Self-Excitation Criteria of the Stand-Alone Synchronous Reluctance
Generator
To analyze the stand-alone operation of the SynRG the dq equations of the machine
connected in parallel to a capacitor bank is used. Fig. 4-2 shows the schematic of the system.
Fig. 4-2 The schematic structure of the stand-alone SynRG
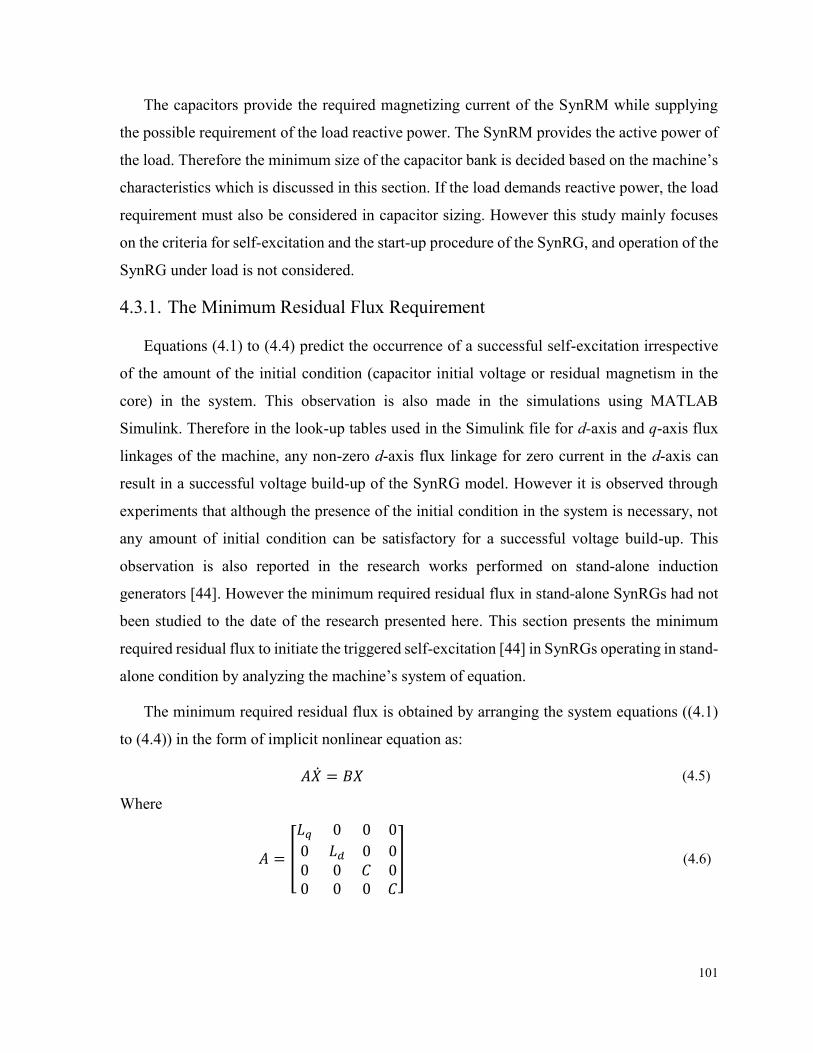
101
The capacitors provide the required magnetizing current of the SynRM while supplying
the possible requirement of the load reactive power. The SynRM provides the active power of
the load. Therefore the minimum size of the capacitor bank is decided based on the machine’s
characteristics which is discussed in this section. If the load demands reactive power, the load
requirement must also be considered in capacitor sizing. However this study mainly focuses
on the criteria for self-excitation and the start-up procedure of the SynRG, and operation of the
SynRG under load is not considered.
4.3.1. The Minimum Residual Flux Requirement
Equations (4.1) to (4.4) predict the occurrence of a successful self-excitation irrespective
of the amount of the initial condition (capacitor initial voltage or residual magnetism in the
core) in the system. This observation is also made in the simulations using MATLAB
Simulink. Therefore in the look-up tables used in the Simulink file for d-axis and q-axis flux
linkages of the machine, any non-zero d-axis flux linkage for zero current in the d-axis can
result in a successful voltage build-up of the SynRG model. However it is observed through
experiments that although the presence of the initial condition in the system is necessary, not
any amount of initial condition can be satisfactory for a successful voltage build-up. This
observation is also reported in the research works performed on stand-alone induction
generators [44]. However the minimum required residual flux in stand-alone SynRGs had not
been studied to the date of the research presented here. This section presents the minimum
required residual flux to initiate the triggered self-excitation [44] in SynRGs operating in stand-
alone condition by analyzing the machine’s system of equation.
The minimum required residual flux is obtained by arranging the system equations ((4.1)
to (4.4)) in the form of implicit nonlinear equation as:
𝐴�̇� = 𝐵𝑋 (4.5)
Where
𝐴 = [
𝐿𝑞 0 0 0
0 𝐿𝑑 0 00 0 𝐶 00 0 0 𝐶
] (4.6)
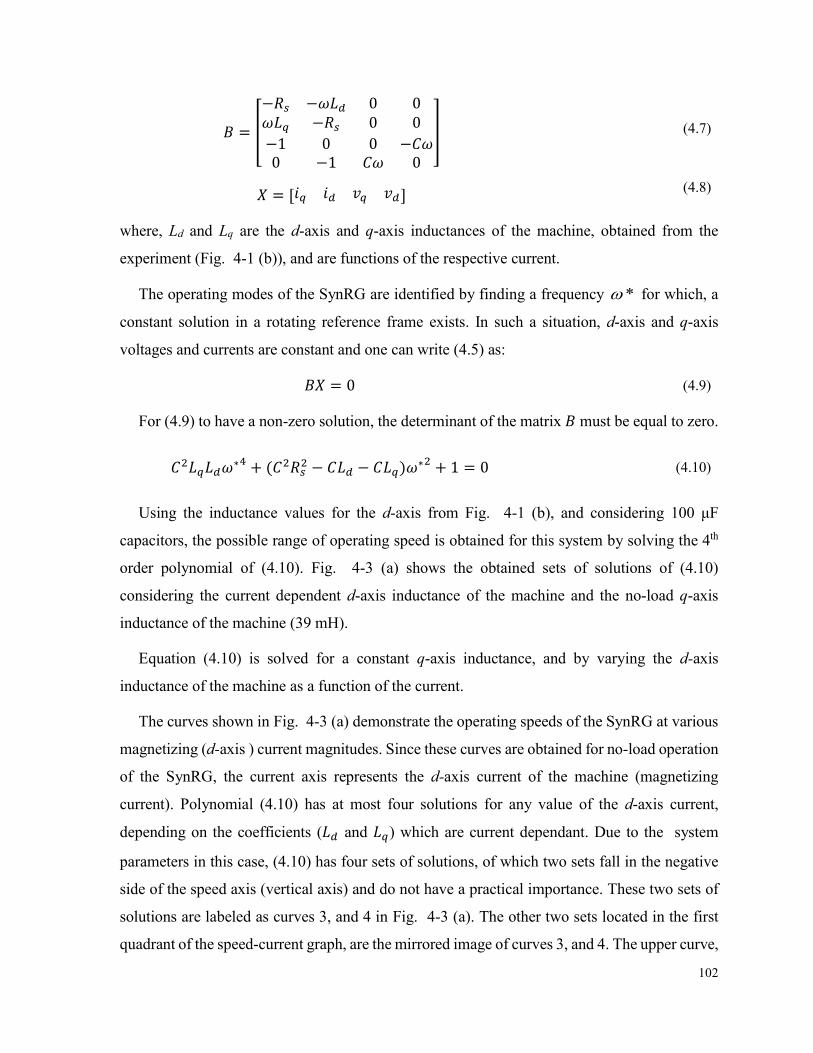
102
𝐵 = [
−𝑅𝑠 −𝜔𝐿𝑑 0 0𝜔𝐿𝑞 −𝑅𝑠 0 0
−1 0 0 −𝐶𝜔0 −1 𝐶𝜔 0
] (4.7)
𝑋 = [𝑖𝑞 𝑖𝑑 𝑣𝑞 𝑣𝑑] (4.8)
where, Ld and Lq are the d-axis and q-axis inductances of the machine, obtained from the
experiment (Fig. 4-1 (b)), and are functions of the respective current.
The operating modes of the SynRG are identified by finding a frequency * for which, a
constant solution in a rotating reference frame exists. In such a situation, d-axis and q-axis
voltages and currents are constant and one can write (4.5) as:
𝐵𝑋 = 0 (4.9)
For (4.9) to have a non-zero solution, the determinant of the matrix 𝐵 must be equal to zero.
𝐶2𝐿𝑞𝐿𝑑𝜔∗4 + (𝐶2𝑅𝑠
2 − 𝐶𝐿𝑑 − 𝐶𝐿𝑞)𝜔∗2 + 1 = 0 (4.10)
Using the inductance values for the d-axis from Fig. 4-1 (b), and considering 100 μF
capacitors, the possible range of operating speed is obtained for this system by solving the 4th
order polynomial of (4.10). Fig. 4-3 (a) shows the obtained sets of solutions of (4.10)
considering the current dependent d-axis inductance of the machine and the no-load q-axis
inductance of the machine (39 mH).
Equation (4.10) is solved for a constant q-axis inductance, and by varying the d-axis
inductance of the machine as a function of the current.
The curves shown in Fig. 4-3 (a) demonstrate the operating speeds of the SynRG at various
magnetizing (d-axis ) current magnitudes. Since these curves are obtained for no-load operation
of the SynRG, the current axis represents the d-axis current of the machine (magnetizing
current). Polynomial (4.10) has at most four solutions for any value of the d-axis current,
depending on the coefficients (𝐿𝑑 and 𝐿𝑞) which are current dependant. Due to the system
parameters in this case, (4.10) has four sets of solutions, of which two sets fall in the negative
side of the speed axis (vertical axis) and do not have a practical importance. These two sets of
solutions are labeled as curves 3, and 4 in Fig. 4-3 (a). The other two sets located in the first
quadrant of the speed-current graph, are the mirrored image of curves 3, and 4. The upper curve,
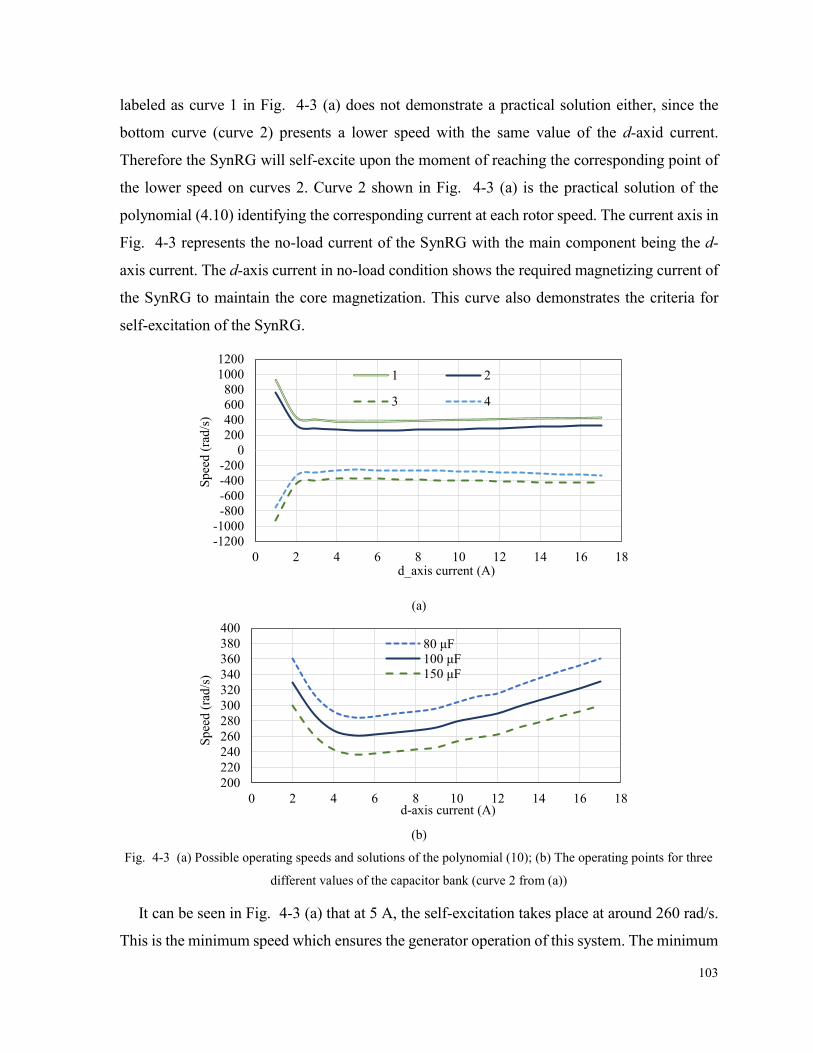
103
labeled as curve 1 in Fig. 4-3 (a) does not demonstrate a practical solution either, since the
bottom curve (curve 2) presents a lower speed with the same value of the d-axid current.
Therefore the SynRG will self-excite upon the moment of reaching the corresponding point of
the lower speed on curves 2. Curve 2 shown in Fig. 4-3 (a) is the practical solution of the
polynomial (4.10) identifying the corresponding current at each rotor speed. The current axis in
Fig. 4-3 represents the no-load current of the SynRG with the main component being the d-
axis current. The d-axis current in no-load condition shows the required magnetizing current of
the SynRG to maintain the core magnetization. This curve also demonstrates the criteria for
self-excitation of the SynRG.
(a)
(b)
Fig. 4-3 (a) Possible operating speeds and solutions of the polynomial (10); (b) The operating points for three
different values of the capacitor bank (curve 2 from (a))
It can be seen in Fig. 4-3 (a) that at 5 A, the self-excitation takes place at around 260 rad/s.
This is the minimum speed which ensures the generator operation of this system. The minimum
-1200
-1000
-800
-600
-400
-200
0
200
400
600
800
1000
1200
0 2 4 6 8 10 12 14 16 18
Sp
eed
(ra
d/s
)
d_axis current (A)
1 2
3 4
200
220
240
260
280
300
320
340
360
380
400
0 2 4 6 8 10 12 14 16 18
Sp
eed
(ra
d/s
)
d-axis current (A)
80 μF100 μF150 μF
104
speed and the shape of the solution curves are defined by the system parameters such as the
machine’s characteristics and the size of the capacitor bank. Increasing the speed after this point
(5 A), will result in a linear increase in the d-axis current. Curve 2 also shows that for d- axis
currents below 5 A, the required speed to achieve self-excitation is much higher than the speed
for above 5 A, and it also grows rapidly, making the operation for such d-axis currents
impractical. Therefore the required magnetizing current and the imposed speed to the shaft by
the prime mover defines the operational limit of the generator in no-load condition.
This curve can also be used to estimate the minimum required residual flux to ensure the
self-excitation. Pre-magnetizing the core by 5 A or higher, results in a remaining magnetism
value in the material which will be sufficient to trigger the self-excitation as the rotor speed
reaches 260 rad/s. In other words, the initial magnetism generated by magnetizing the core with
5 A or more, produces enough magnetizing current when the rotor speed reaches 260 rad/s, thus
triggering the self-excitation. If less than 5 A is used for magnetizing the machine’s core, the
theoretical speed to achieve self-excitation increases infinitely as the utilized magnetizing
current reduces, making the practical procedure impossible. Therefore the minimum required
magnetizing current to ensure the occurrence of the self-excitation, obtained from the analytical
model of the SynRG used in this study is 5 A. The shape of the curve is only dependent on the
machine’s inductance characteristic. Thus the value of the capacitor bank connected to the phase
windings only affects the value of the speed, and shifts the curves up or down as shown in
Fig. 4-3 (b) for three different values of the capacitor bank. This figure shows three different
curves which belong to three different capacitor bank values. These curves are the
corresponding curves for curve 2 in Fig. 4-3 (a). It can be seen in Fig. 4-3 (b) that a bigger
capacitor bank results in self-excitation at a lower speed value, while a smaller capacitor bank
demands a higher speed to achieve voltage build-up. However the minimum required
magnetizing current remains the same for all the cases of capacitor bank size. The choice of the
capacitor bank size in the dq simulation and the experiment is done based on the base speed of
the machine. Later the magnetic core analysis is performed based on the obtained value, to
calculate the residual flux in the machine’s core.
The Energetic Model is used to obtain an estimation of the behavior of the core material.
This model provides a proper estimation of the magnetic steel performance under various

105
excitation conditions. In the Energetic Model, the magnetic field intensity H(t) is calculated
using the relative magnetization [89, 90], as:
lRd HmmHmHtH ]sgn[]sgn[)( 0 (4.11)
where m is the relative magnetization. The first term in (4.11) represents the linear behavior of
the material with Hd being the demagnetization field, and is defined as:
MNH dd (4.12)
where Nd is the demagnetization factor, and M is the total magnetization.
The nonlinear characteristics of the material such as saturation are presented using the second
term in (4.11). In (4.11) HR is the reversible field, and is defined as [89]:
]1])1()1[[( 2)1()1(
g
mm
R mmhH (4.13)
where h is a characteristic of the saturation field, and g defines the anisotropy.
The last term in (4.11) shows the hysteresis effects of the material such as remanence,
coactivity, and static losses [90]. Hl is the irreversible field, and defined as [89, 90]:
))exp(1)(( 0
0
mmq
HCM
kH rr
s
l
(4.14)
where k is related to hysteresis losses, and q is the ratio between the magnetic domain width
and magnetic domain wall thickness [90]. µ0, Ms, and m0 are the relative permeability of the
free space, saturation magnetization, and the initial state of the m. Cr is a factor which shows
the dependency of the losses on the velocity of the displacement of the domain wall. defines
the effect of the total magnetic state at the point of magnetization reversal.
Using the Energetic Model a BH loop corresponding to a specific level of field excitation
is obtained which can predict the behavior of the core material. Therefore it enables us to
estimate the remaining magnetism or the residual magnetic flux density in the core material as
a result of a previous excitation with a given current magnitude. Fig. 4-4 (a) shows the
estimated BH loop of the core material (M45 G29) using the Energetic Model for the maximum
flux density of 1.22 T. It can be seen that a residual magnetism value of 0.9 T remains in the
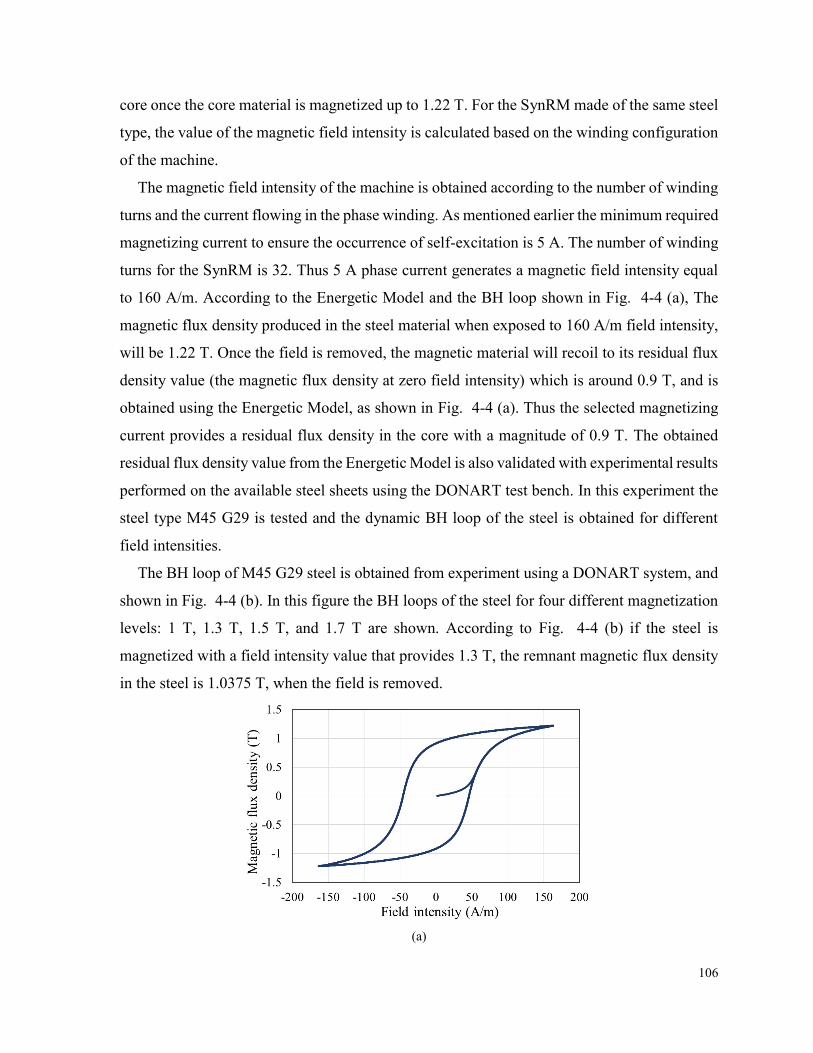
106
core once the core material is magnetized up to 1.22 T. For the SynRM made of the same steel
type, the value of the magnetic field intensity is calculated based on the winding configuration
of the machine.
The magnetic field intensity of the machine is obtained according to the number of winding
turns and the current flowing in the phase winding. As mentioned earlier the minimum required
magnetizing current to ensure the occurrence of self-excitation is 5 A. The number of winding
turns for the SynRM is 32. Thus 5 A phase current generates a magnetic field intensity equal
to 160 A/m. According to the Energetic Model and the BH loop shown in Fig. 4-4 (a), The
magnetic flux density produced in the steel material when exposed to 160 A/m field intensity,
will be 1.22 T. Once the field is removed, the magnetic material will recoil to its residual flux
density value (the magnetic flux density at zero field intensity) which is around 0.9 T, and is
obtained using the Energetic Model, as shown in Fig. 4-4 (a). Thus the selected magnetizing
current provides a residual flux density in the core with a magnitude of 0.9 T. The obtained
residual flux density value from the Energetic Model is also validated with experimental results
performed on the available steel sheets using the DONART test bench. In this experiment the
steel type M45 G29 is tested and the dynamic BH loop of the steel is obtained for different
field intensities.
The BH loop of M45 G29 steel is obtained from experiment using a DONART system, and
shown in Fig. 4-4 (b). In this figure the BH loops of the steel for four different magnetization
levels: 1 T, 1.3 T, 1.5 T, and 1.7 T are shown. According to Fig. 4-4 (b) if the steel is
magnetized with a field intensity value that provides 1.3 T, the remnant magnetic flux density
in the steel is 1.0375 T, when the field is removed.
(a)
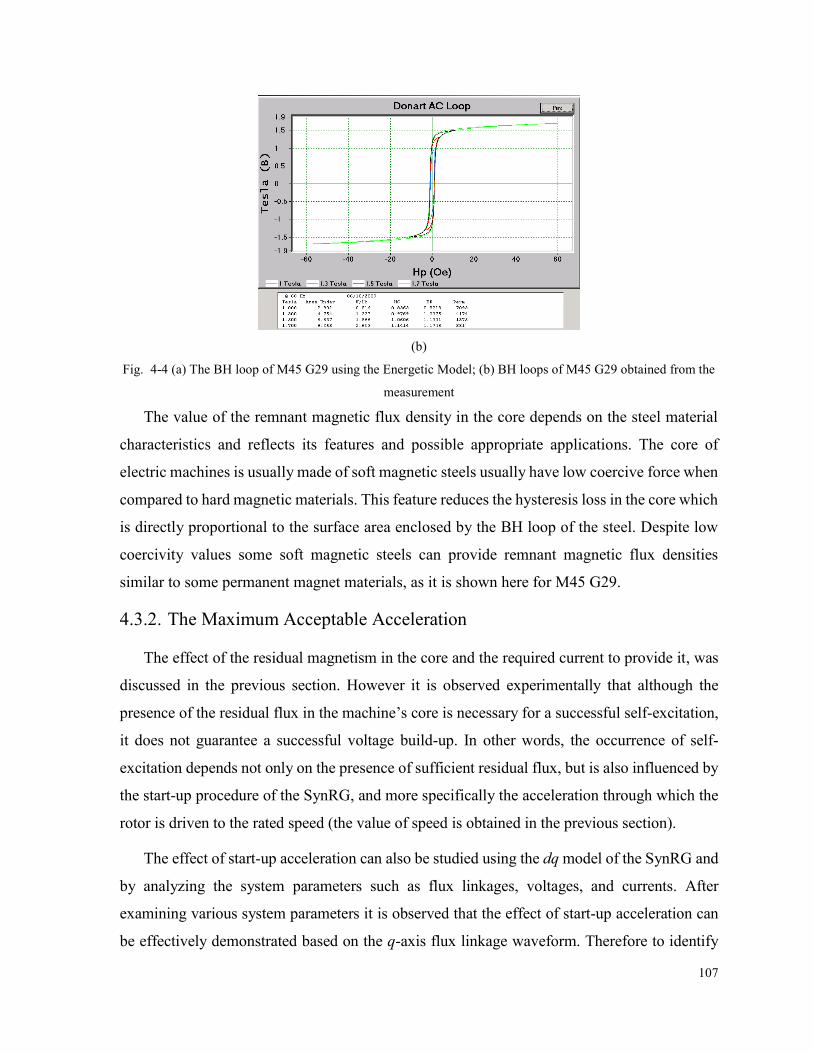
107
(b)
Fig. 4-4 (a) The BH loop of M45 G29 using the Energetic Model; (b) BH loops of M45 G29 obtained from the
measurement
The value of the remnant magnetic flux density in the core depends on the steel material
characteristics and reflects its features and possible appropriate applications. The core of
electric machines is usually made of soft magnetic steels usually have low coercive force when
compared to hard magnetic materials. This feature reduces the hysteresis loss in the core which
is directly proportional to the surface area enclosed by the BH loop of the steel. Despite low
coercivity values some soft magnetic steels can provide remnant magnetic flux densities
similar to some permanent magnet materials, as it is shown here for M45 G29.
4.3.2. The Maximum Acceptable Acceleration
The effect of the residual magnetism in the core and the required current to provide it, was
discussed in the previous section. However it is observed experimentally that although the
presence of the residual flux in the machine’s core is necessary for a successful self-excitation,
it does not guarantee a successful voltage build-up. In other words, the occurrence of self-
excitation depends not only on the presence of sufficient residual flux, but is also influenced by
the start-up procedure of the SynRG, and more specifically the acceleration through which the
rotor is driven to the rated speed (the value of speed is obtained in the previous section).
The effect of start-up acceleration can also be studied using the dq model of the SynRG and
by analyzing the system parameters such as flux linkages, voltages, and currents. After
examining various system parameters it is observed that the effect of start-up acceleration can
be effectively demonstrated based on the q-axis flux linkage waveform. Therefore to identify
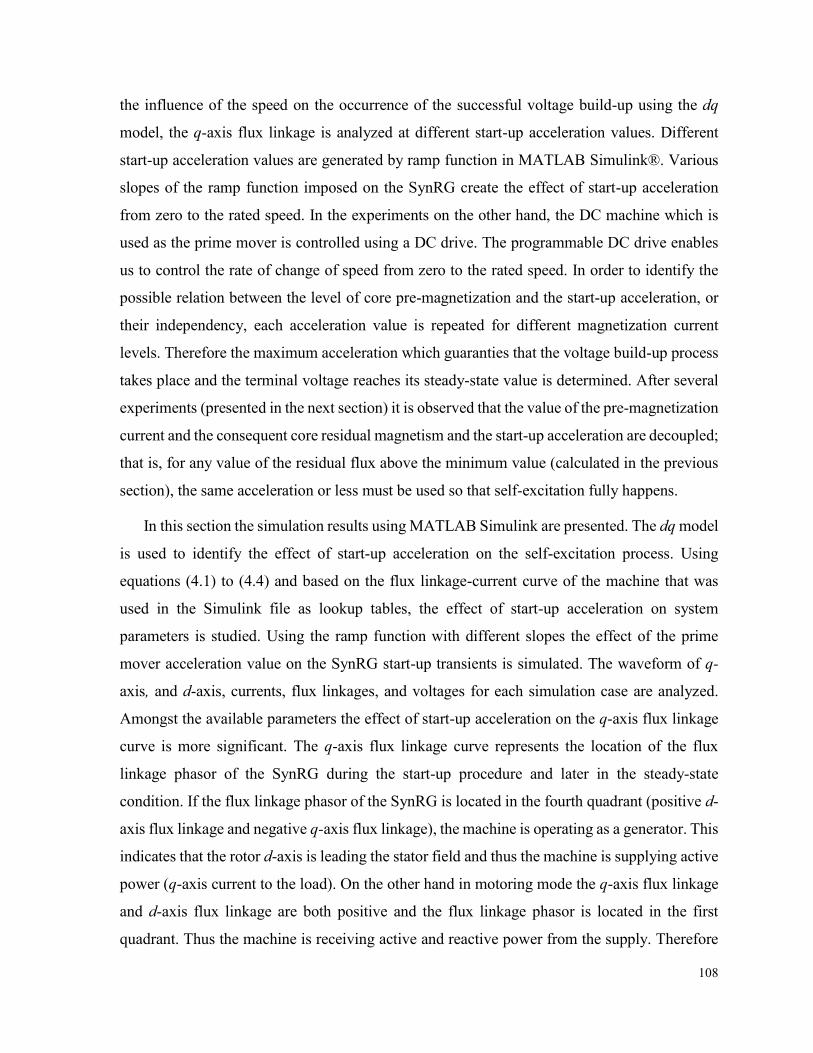
108
the influence of the speed on the occurrence of the successful voltage build-up using the dq
model, the q-axis flux linkage is analyzed at different start-up acceleration values. Different
start-up acceleration values are generated by ramp function in MATLAB Simulink®. Various
slopes of the ramp function imposed on the SynRG create the effect of start-up acceleration
from zero to the rated speed. In the experiments on the other hand, the DC machine which is
used as the prime mover is controlled using a DC drive. The programmable DC drive enables
us to control the rate of change of speed from zero to the rated speed. In order to identify the
possible relation between the level of core pre-magnetization and the start-up acceleration, or
their independency, each acceleration value is repeated for different magnetization current
levels. Therefore the maximum acceleration which guaranties that the voltage build-up process
takes place and the terminal voltage reaches its steady-state value is determined. After several
experiments (presented in the next section) it is observed that the value of the pre-magnetization
current and the consequent core residual magnetism and the start-up acceleration are decoupled;
that is, for any value of the residual flux above the minimum value (calculated in the previous
section), the same acceleration or less must be used so that self-excitation fully happens.
In this section the simulation results using MATLAB Simulink are presented. The dq model
is used to identify the effect of start-up acceleration on the self-excitation process. Using
equations (4.1) to (4.4) and based on the flux linkage-current curve of the machine that was
used in the Simulink file as lookup tables, the effect of start-up acceleration on system
parameters is studied. Using the ramp function with different slopes the effect of the prime
mover acceleration value on the SynRG start-up transients is simulated. The waveform of q-
axis, and d-axis, currents, flux linkages, and voltages for each simulation case are analyzed.
Amongst the available parameters the effect of start-up acceleration on the q-axis flux linkage
curve is more significant. The q-axis flux linkage curve represents the location of the flux
linkage phasor of the SynRG during the start-up procedure and later in the steady-state
condition. If the flux linkage phasor of the SynRG is located in the fourth quadrant (positive d-
axis flux linkage and negative q-axis flux linkage), the machine is operating as a generator. This
indicates that the rotor d-axis is leading the stator field and thus the machine is supplying active
power (q-axis current to the load). On the other hand in motoring mode the q-axis flux linkage
and d-axis flux linkage are both positive and the flux linkage phasor is located in the first
quadrant. Thus the machine is receiving active and reactive power from the supply. Therefore
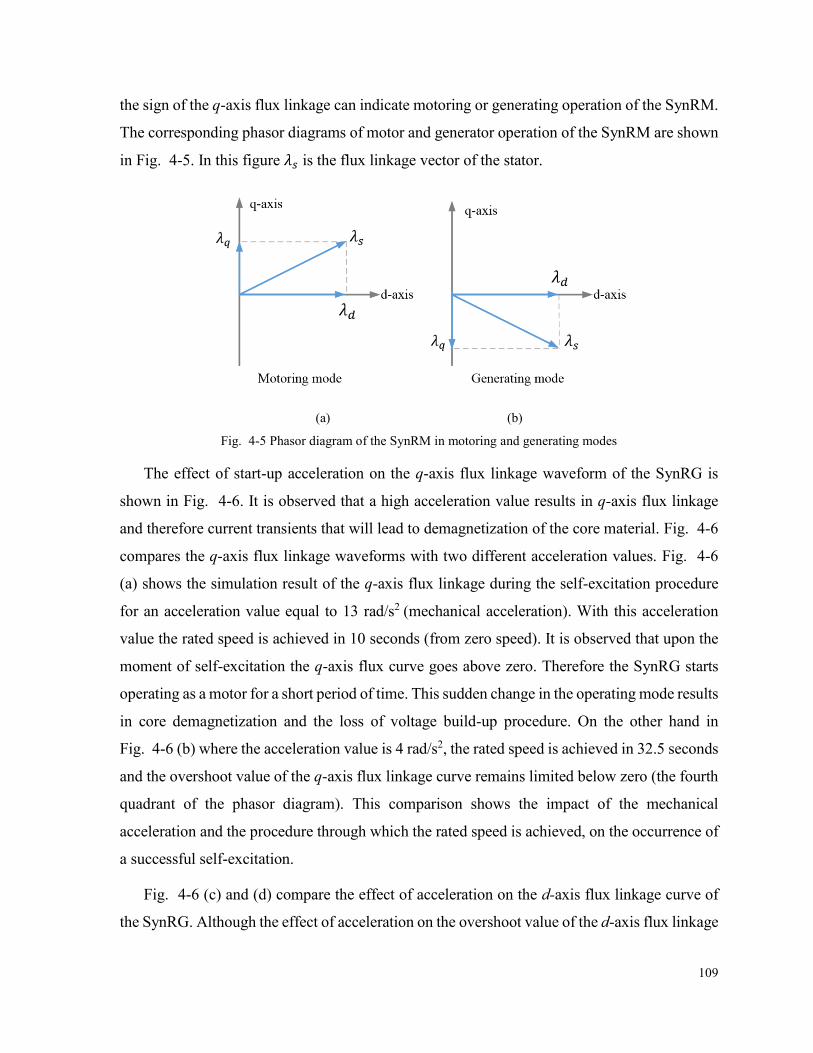
109
the sign of the q-axis flux linkage can indicate motoring or generating operation of the SynRM.
The corresponding phasor diagrams of motor and generator operation of the SynRM are shown
in Fig. 4-5. In this figure 𝜆𝑠 is the flux linkage vector of the stator.
(a) (b)
Fig. 4-5 Phasor diagram of the SynRM in motoring and generating modes
The effect of start-up acceleration on the q-axis flux linkage waveform of the SynRG is
shown in Fig. 4-6. It is observed that a high acceleration value results in q-axis flux linkage
and therefore current transients that will lead to demagnetization of the core material. Fig. 4-6
compares the q-axis flux linkage waveforms with two different acceleration values. Fig. 4-6
(a) shows the simulation result of the q-axis flux linkage during the self-excitation procedure
for an acceleration value equal to 13 rad/s2 (mechanical acceleration). With this acceleration
value the rated speed is achieved in 10 seconds (from zero speed). It is observed that upon the
moment of self-excitation the q-axis flux curve goes above zero. Therefore the SynRG starts
operating as a motor for a short period of time. This sudden change in the operating mode results
in core demagnetization and the loss of voltage build-up procedure. On the other hand in
Fig. 4-6 (b) where the acceleration value is 4 rad/s2, the rated speed is achieved in 32.5 seconds
and the overshoot value of the q-axis flux linkage curve remains limited below zero (the fourth
quadrant of the phasor diagram). This comparison shows the impact of the mechanical
acceleration and the procedure through which the rated speed is achieved, on the occurrence of
a successful self-excitation.
Fig. 4-6 (c) and (d) compare the effect of acceleration on the d-axis flux linkage curve of
the SynRG. Although the effect of acceleration on the overshoot value of the d-axis flux linkage
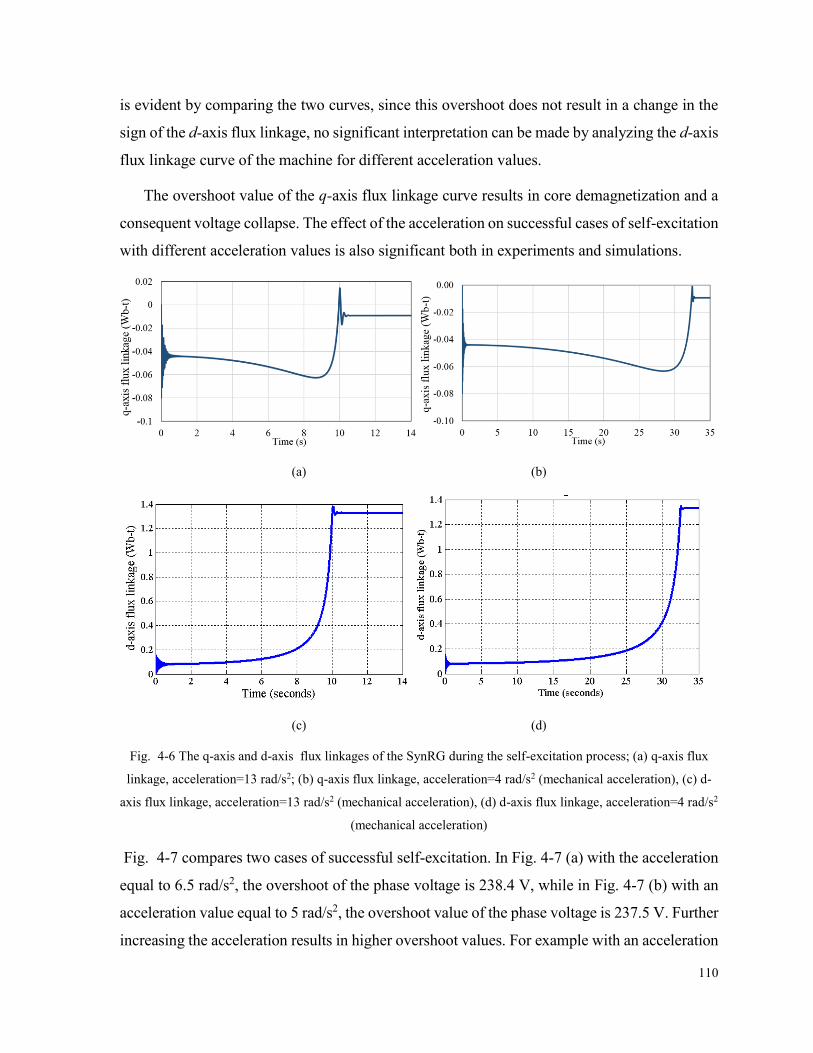
110
is evident by comparing the two curves, since this overshoot does not result in a change in the
sign of the d-axis flux linkage, no significant interpretation can be made by analyzing the d-axis
flux linkage curve of the machine for different acceleration values.
The overshoot value of the q-axis flux linkage curve results in core demagnetization and a
consequent voltage collapse. The effect of the acceleration on successful cases of self-excitation
with different acceleration values is also significant both in experiments and simulations.
(a) (b)
(c) (d)
Fig. 4-6 The q-axis and d-axis flux linkages of the SynRG during the self-excitation process; (a) q-axis flux
linkage, acceleration=13 rad/s2; (b) q-axis flux linkage, acceleration=4 rad/s2 (mechanical acceleration), (c) d-
axis flux linkage, acceleration=13 rad/s2 (mechanical acceleration), (d) d-axis flux linkage, acceleration=4 rad/s2
(mechanical acceleration)
Fig. 4-7 compares two cases of successful self-excitation. In Fig. 4-7 (a) with the acceleration
equal to 6.5 rad/s2, the overshoot of the phase voltage is 238.4 V, while in Fig. 4-7 (b) with an
acceleration value equal to 5 rad/s2, the overshoot value of the phase voltage is 237.5 V. Further
increasing the acceleration results in higher overshoot values. For example with an acceleration
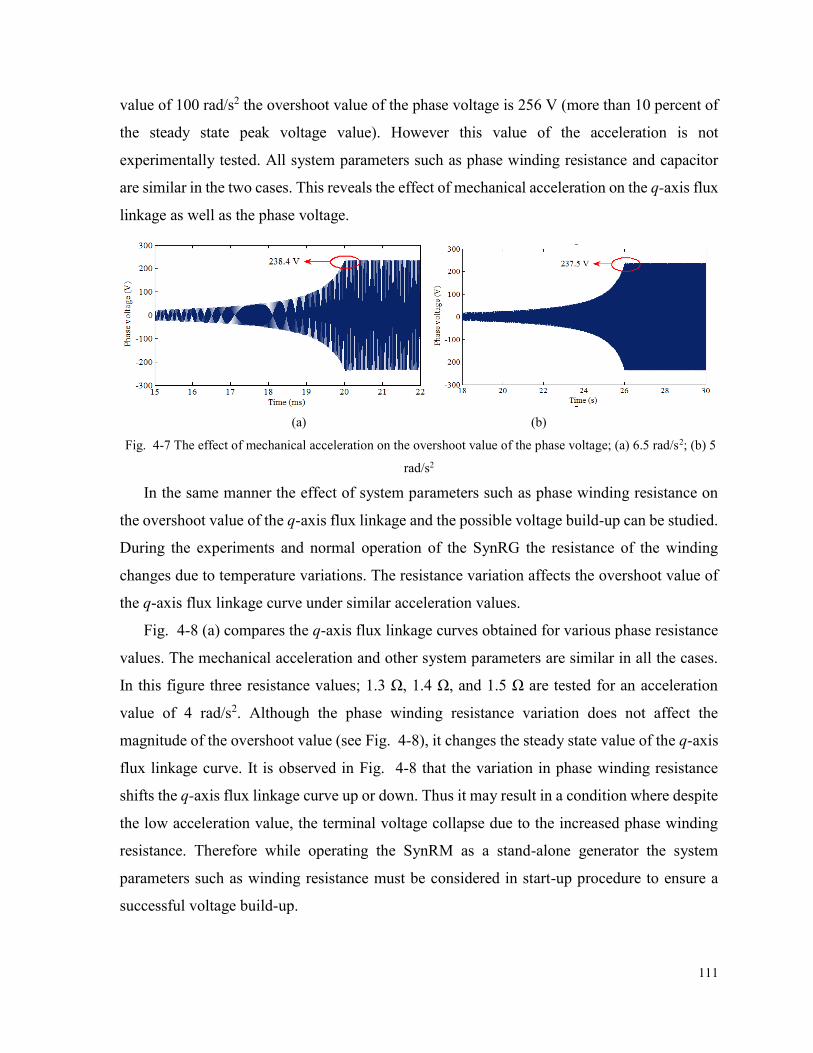
111
value of 100 rad/s2 the overshoot value of the phase voltage is 256 V (more than 10 percent of
the steady state peak voltage value). However this value of the acceleration is not
experimentally tested. All system parameters such as phase winding resistance and capacitor
are similar in the two cases. This reveals the effect of mechanical acceleration on the q-axis flux
linkage as well as the phase voltage.
(a) (b)
Fig. 4-7 The effect of mechanical acceleration on the overshoot value of the phase voltage; (a) 6.5 rad/s2; (b) 5
rad/s2
In the same manner the effect of system parameters such as phase winding resistance on
the overshoot value of the q-axis flux linkage and the possible voltage build-up can be studied.
During the experiments and normal operation of the SynRG the resistance of the winding
changes due to temperature variations. The resistance variation affects the overshoot value of
the q-axis flux linkage curve under similar acceleration values.
Fig. 4-8 (a) compares the q-axis flux linkage curves obtained for various phase resistance
values. The mechanical acceleration and other system parameters are similar in all the cases.
In this figure three resistance values; 1.3 Ω, 1.4 Ω, and 1.5 Ω are tested for an acceleration
value of 4 rad/s2. Although the phase winding resistance variation does not affect the
magnitude of the overshoot value (see Fig. 4-8), it changes the steady state value of the q-axis
flux linkage curve. It is observed in Fig. 4-8 that the variation in phase winding resistance
shifts the q-axis flux linkage curve up or down. Thus it may result in a condition where despite
the low acceleration value, the terminal voltage collapse due to the increased phase winding
resistance. Therefore while operating the SynRM as a stand-alone generator the system
parameters such as winding resistance must be considered in start-up procedure to ensure a
successful voltage build-up.
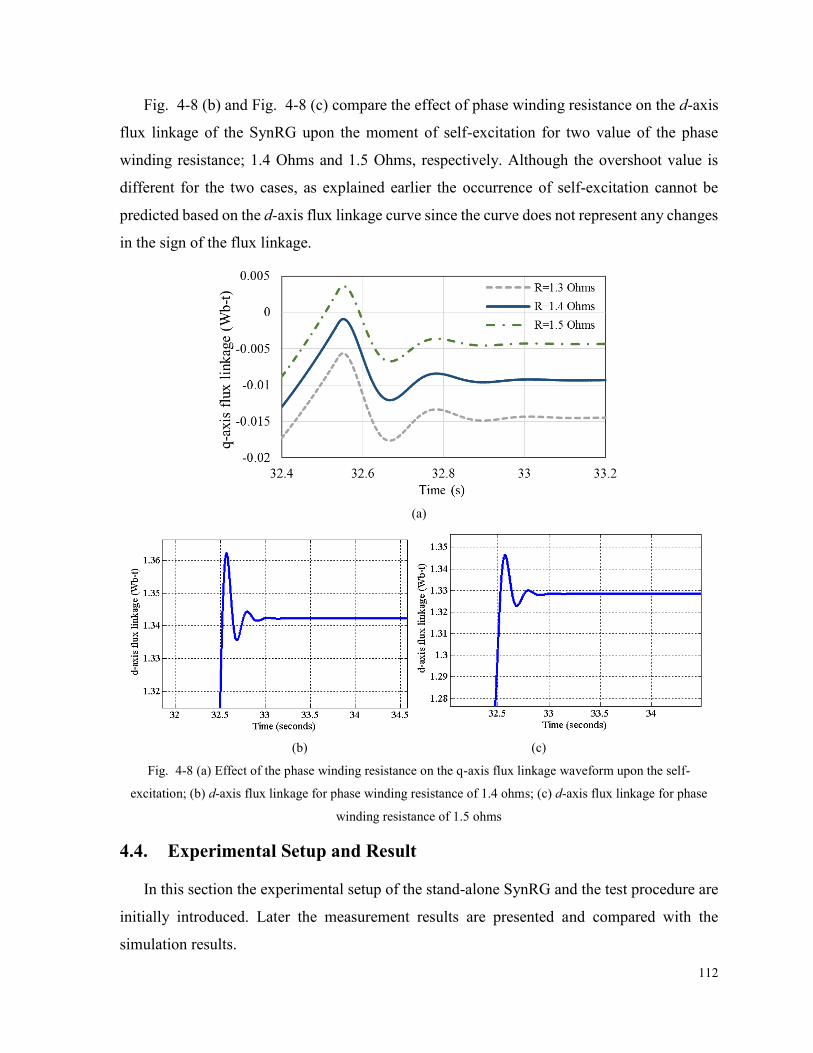
112
Fig. 4-8 (b) and Fig. 4-8 (c) compare the effect of phase winding resistance on the d-axis
flux linkage of the SynRG upon the moment of self-excitation for two value of the phase
winding resistance; 1.4 Ohms and 1.5 Ohms, respectively. Although the overshoot value is
different for the two cases, as explained earlier the occurrence of self-excitation cannot be
predicted based on the d-axis flux linkage curve since the curve does not represent any changes
in the sign of the flux linkage.
(a)
(b) (c)
Fig. 4-8 (a) Effect of the phase winding resistance on the q-axis flux linkage waveform upon the self-
excitation; (b) d-axis flux linkage for phase winding resistance of 1.4 ohms; (c) d-axis flux linkage for phase
winding resistance of 1.5 ohms
4.4. Experimental Setup and Result
In this section the experimental setup of the stand-alone SynRG and the test procedure are
initially introduced. Later the measurement results are presented and compared with the
simulation results.

113
4.4.1. Experimental Setup
To verify the obtained results from dq simulations and mathematical analysis, a 5 hp
SynRM, introduced in section 5.3 is connected to a 100 µF capacitor bank and operated as a
stand-alone generator. The size of the capacitor bank is chosen based on the magnetization curve
of the machine, rated speed, and the rated output voltage of the machine, and is explained in
section 5.3. Fig. 4-9 shows the experimental setup including the SynRM, the DC motor (as the
prime mover), the capacitor bank, and the measurement instruments. A programmable DC drive
is used to control the acceleration of the DC motor (the prime mover) and thus the start-up
process of the SynRG with different acceleration values. The speed of the DC machine and
therefore the SynRG rotor speed is increased using a ramp function with the specified slope
representing various acceleration values used in the simulation.
Initially the core of the SynRM is magnetized by connecting a DC supply to the machine’s
phase winding. At this stage the capacitors are disconnected to ensure that the initial capacitor
voltage remains zero. Therefore the self-excitation is only studied based on the residual
magnetism in the ferromagnetic core. The required time for applying the DC current and
magnetizing the core depends on the time constant of the inductive-resistive circuit of the
machine. Thus considering the d-axis inductance of the machine and the phase winding
resistance this time constant will not be greater than 0.08 seconds. Once the core is magnetized,
the DC supply is disconnected. At this stage the magnetic material follows its BH loop on the
recoil line until it reaches its residual flux value shown in Fig. 4-4. Then the machine is
connected to the capacitor bank and rotated using the prime mover as shown in Fig. 4-9. The
test procedure is carried out for several values of the magnetizing current, ranging from 1 A to
10 A, and several acceleration values, ranging from 1.5 to 8 rad/s2 (mechanical accelerations).
After each experiment the machine is discharged using the resistor bank connected to the
system. To perform this task after a successful self-excitation, the machine is stopped while
connected to the resistor bank (as load). Therefore the current drawn by the load consumes the
core magnetization and the voltage on the capacitors insuring a zero state condition for the
future tests.
During the pre-magnetizing process using the DC supply, the rotor aligns with the
produced static magnetic field, and is magnetized in the direction of the d-axis flux. During
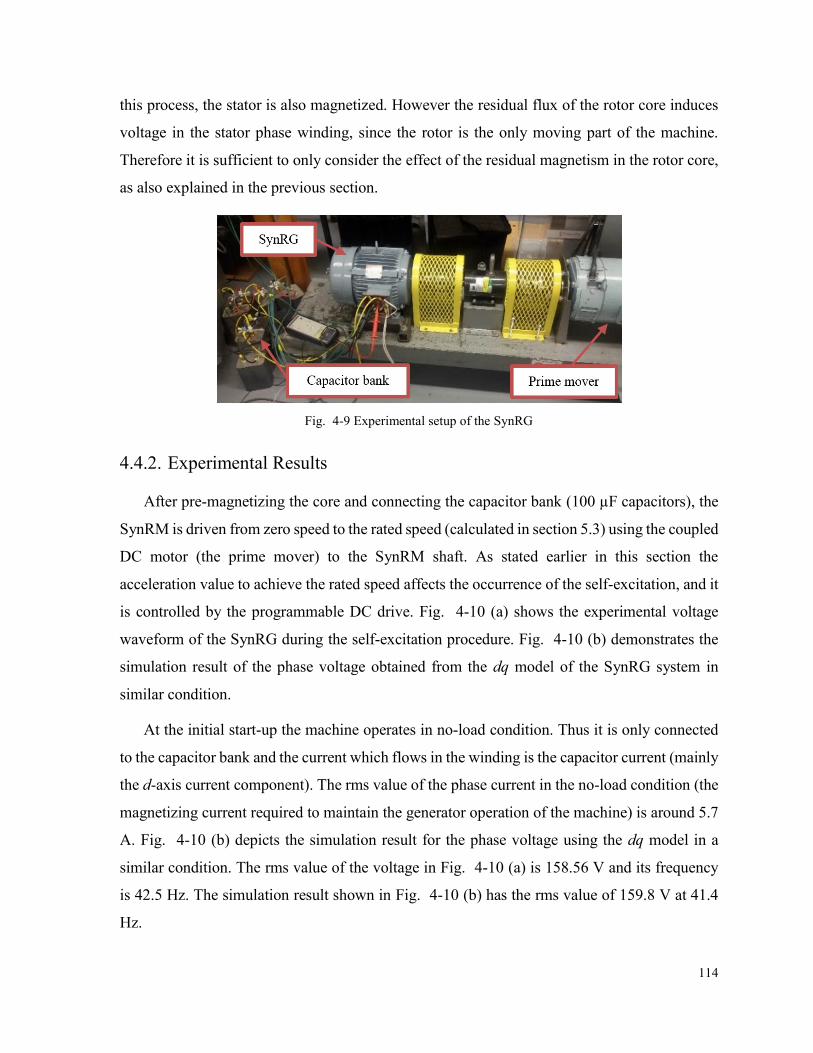
114
this process, the stator is also magnetized. However the residual flux of the rotor core induces
voltage in the stator phase winding, since the rotor is the only moving part of the machine.
Therefore it is sufficient to only consider the effect of the residual magnetism in the rotor core,
as also explained in the previous section.
Fig. 4-9 Experimental setup of the SynRG
4.4.2. Experimental Results
After pre-magnetizing the core and connecting the capacitor bank (100 µF capacitors), the
SynRM is driven from zero speed to the rated speed (calculated in section 5.3) using the coupled
DC motor (the prime mover) to the SynRM shaft. As stated earlier in this section the
acceleration value to achieve the rated speed affects the occurrence of the self-excitation, and it
is controlled by the programmable DC drive. Fig. 4-10 (a) shows the experimental voltage
waveform of the SynRG during the self-excitation procedure. Fig. 4-10 (b) demonstrates the
simulation result of the phase voltage obtained from the dq model of the SynRG system in
similar condition.
At the initial start-up the machine operates in no-load condition. Thus it is only connected
to the capacitor bank and the current which flows in the winding is the capacitor current (mainly
the d-axis current component). The rms value of the phase current in the no-load condition (the
magnetizing current required to maintain the generator operation of the machine) is around 5.7
A. Fig. 4-10 (b) depicts the simulation result for the phase voltage using the dq model in a
similar condition. The rms value of the voltage in Fig. 4-10 (a) is 158.56 V and its frequency
is 42.5 Hz. The simulation result shown in Fig. 4-10 (b) has the rms value of 159.8 V at 41.4
Hz.
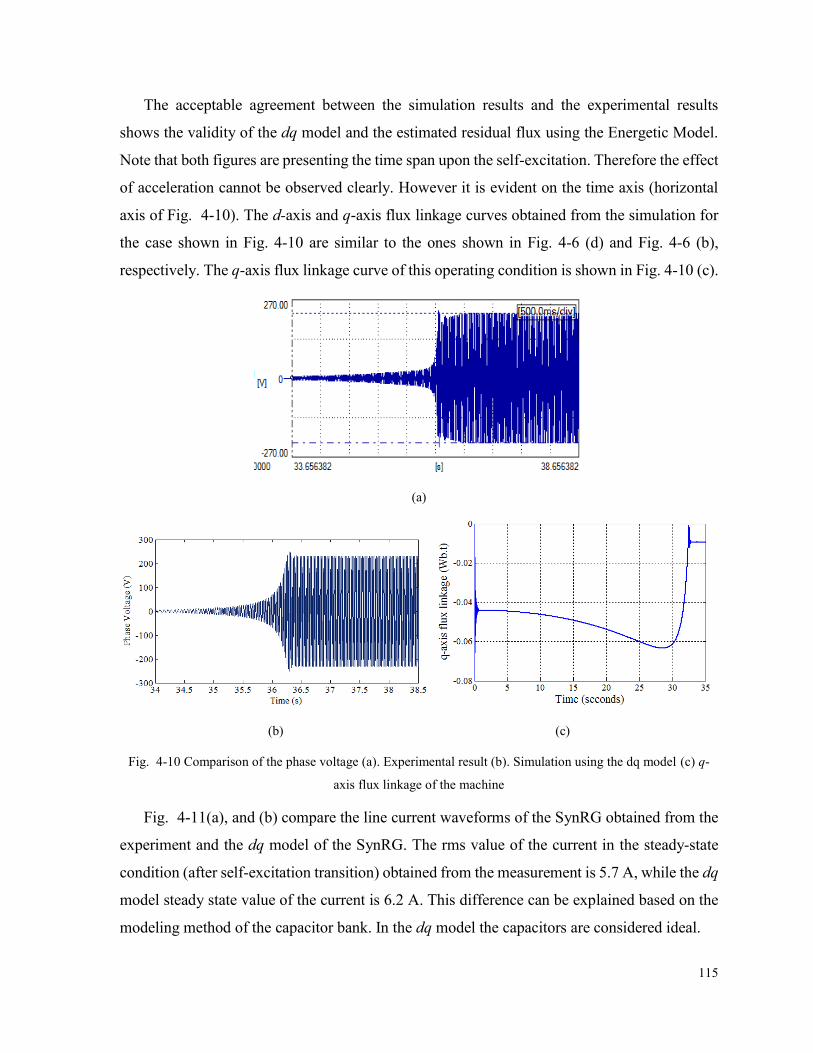
115
The acceptable agreement between the simulation results and the experimental results
shows the validity of the dq model and the estimated residual flux using the Energetic Model.
Note that both figures are presenting the time span upon the self-excitation. Therefore the effect
of acceleration cannot be observed clearly. However it is evident on the time axis (horizontal
axis of Fig. 4-10). The d-axis and q-axis flux linkage curves obtained from the simulation for
the case shown in Fig. 4-10 are similar to the ones shown in Fig. 4-6 (d) and Fig. 4-6 (b),
respectively. The q-axis flux linkage curve of this operating condition is shown in Fig. 4-10 (c).
(a)
(b) (c)
Fig. 4-10 Comparison of the phase voltage (a). Experimental result (b). Simulation using the dq model (c) q-
axis flux linkage of the machine
Fig. 4-11(a), and (b) compare the line current waveforms of the SynRG obtained from the
experiment and the dq model of the SynRG. The rms value of the current in the steady-state
condition (after self-excitation transition) obtained from the measurement is 5.7 A, while the dq
model steady state value of the current is 6.2 A. This difference can be explained based on the
modeling method of the capacitor bank. In the dq model the capacitors are considered ideal.
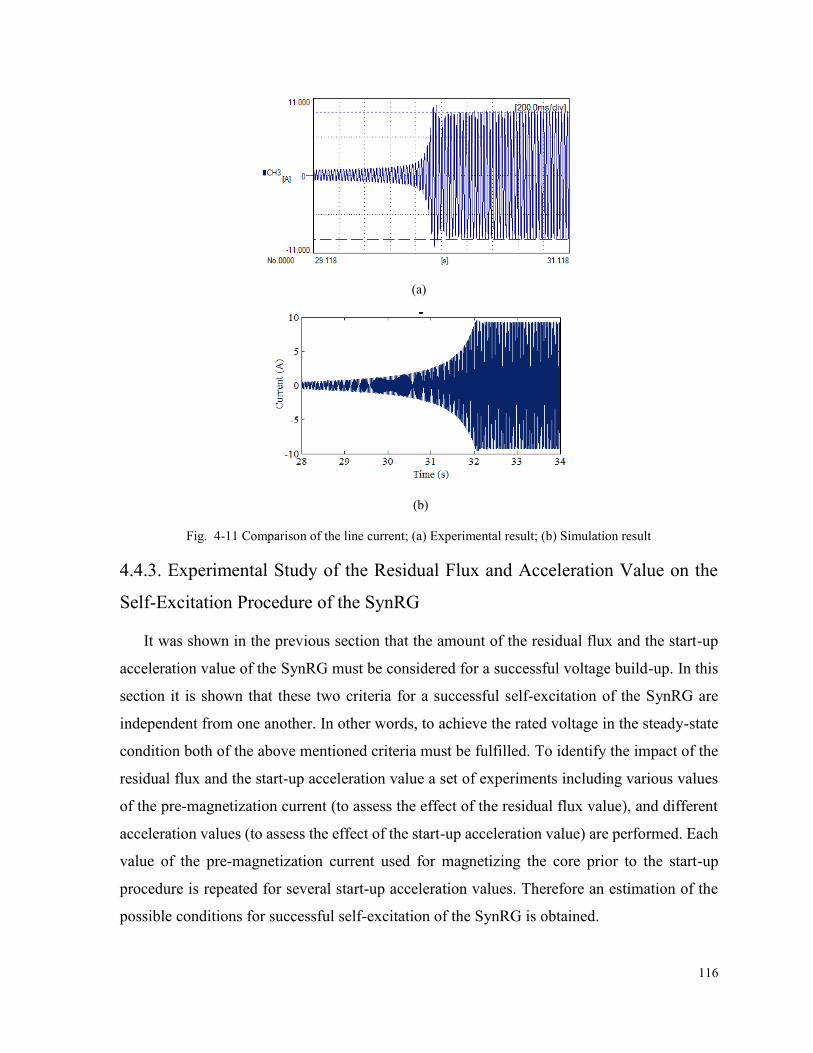
116
(a)
(b)
Fig. 4-11 Comparison of the line current; (a) Experimental result; (b) Simulation result
4.4.3. Experimental Study of the Residual Flux and Acceleration Value on the
Self-Excitation Procedure of the SynRG
It was shown in the previous section that the amount of the residual flux and the start-up
acceleration value of the SynRG must be considered for a successful voltage build-up. In this
section it is shown that these two criteria for a successful self-excitation of the SynRG are
independent from one another. In other words, to achieve the rated voltage in the steady-state
condition both of the above mentioned criteria must be fulfilled. To identify the impact of the
residual flux and the start-up acceleration value a set of experiments including various values
of the pre-magnetization current (to assess the effect of the residual flux value), and different
acceleration values (to assess the effect of the start-up acceleration value) are performed. Each
value of the pre-magnetization current used for magnetizing the core prior to the start-up
procedure is repeated for several start-up acceleration values. Therefore an estimation of the
possible conditions for successful self-excitation of the SynRG is obtained.
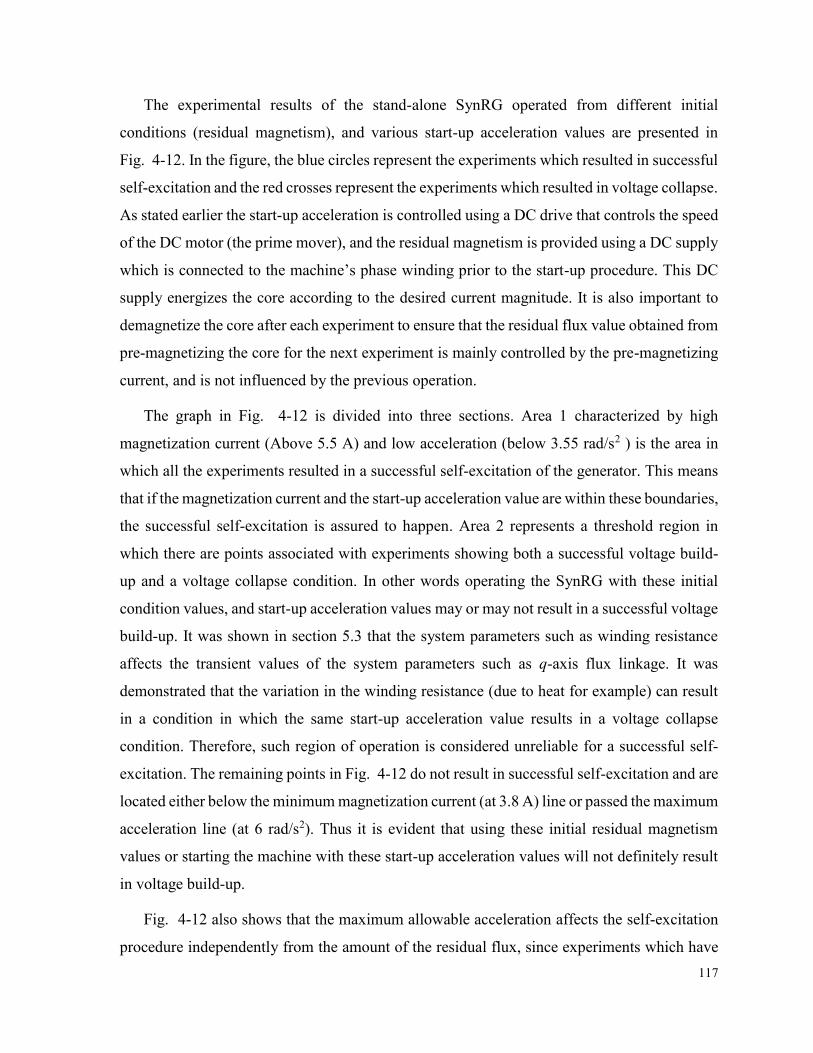
117
The experimental results of the stand-alone SynRG operated from different initial
conditions (residual magnetism), and various start-up acceleration values are presented in
Fig. 4-12. In the figure, the blue circles represent the experiments which resulted in successful
self-excitation and the red crosses represent the experiments which resulted in voltage collapse.
As stated earlier the start-up acceleration is controlled using a DC drive that controls the speed
of the DC motor (the prime mover), and the residual magnetism is provided using a DC supply
which is connected to the machine’s phase winding prior to the start-up procedure. This DC
supply energizes the core according to the desired current magnitude. It is also important to
demagnetize the core after each experiment to ensure that the residual flux value obtained from
pre-magnetizing the core for the next experiment is mainly controlled by the pre-magnetizing
current, and is not influenced by the previous operation.
The graph in Fig. 4-12 is divided into three sections. Area 1 characterized by high
magnetization current (Above 5.5 A) and low acceleration (below 3.55 rad/s2 ) is the area in
which all the experiments resulted in a successful self-excitation of the generator. This means
that if the magnetization current and the start-up acceleration value are within these boundaries,
the successful self-excitation is assured to happen. Area 2 represents a threshold region in
which there are points associated with experiments showing both a successful voltage build-
up and a voltage collapse condition. In other words operating the SynRG with these initial
condition values, and start-up acceleration values may or may not result in a successful voltage
build-up. It was shown in section 5.3 that the system parameters such as winding resistance
affects the transient values of the system parameters such as q-axis flux linkage. It was
demonstrated that the variation in the winding resistance (due to heat for example) can result
in a condition in which the same start-up acceleration value results in a voltage collapse
condition. Therefore, such region of operation is considered unreliable for a successful self-
excitation. The remaining points in Fig. 4-12 do not result in successful self-excitation and are
located either below the minimum magnetization current (at 3.8 A) line or passed the maximum
acceleration line (at 6 rad/s2). Thus it is evident that using these initial residual magnetism
values or starting the machine with these start-up acceleration values will not definitely result
in voltage build-up.
Fig. 4-12 also shows that the maximum allowable acceleration affects the self-excitation
procedure independently from the amount of the residual flux, since experiments which have
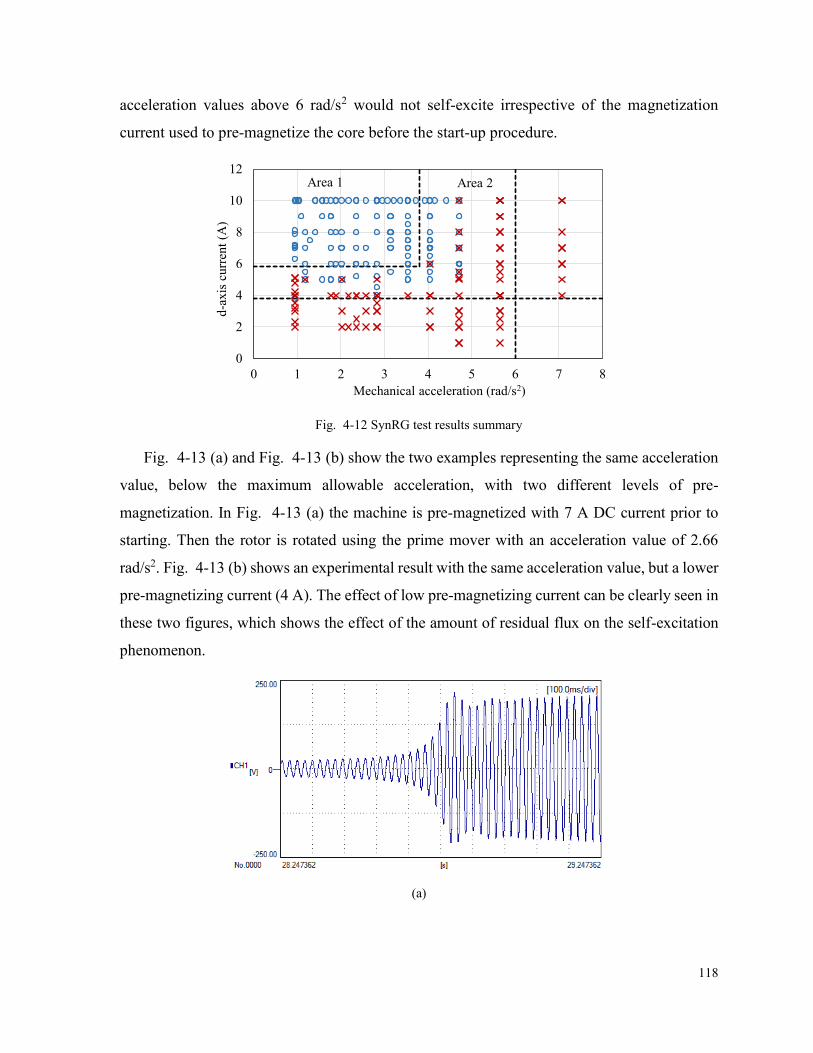
118
acceleration values above 6 rad/s2 would not self-excite irrespective of the magnetization
current used to pre-magnetize the core before the start-up procedure.
Fig. 4-12 SynRG test results summary
Fig. 4-13 (a) and Fig. 4-13 (b) show the two examples representing the same acceleration
value, below the maximum allowable acceleration, with two different levels of pre-
magnetization. In Fig. 4-13 (a) the machine is pre-magnetized with 7 A DC current prior to
starting. Then the rotor is rotated using the prime mover with an acceleration value of 2.66
rad/s2. Fig. 4-13 (b) shows an experimental result with the same acceleration value, but a lower
pre-magnetizing current (4 A). The effect of low pre-magnetizing current can be clearly seen in
these two figures, which shows the effect of the amount of residual flux on the self-excitation
phenomenon.
(a)
0
2
4
6
8
10
12
0 1 2 3 4 5 6 7 8
d-a
xis
curr
ent
(A)
Mechanical acceleration (rad/s2)
Area 1 Area 2
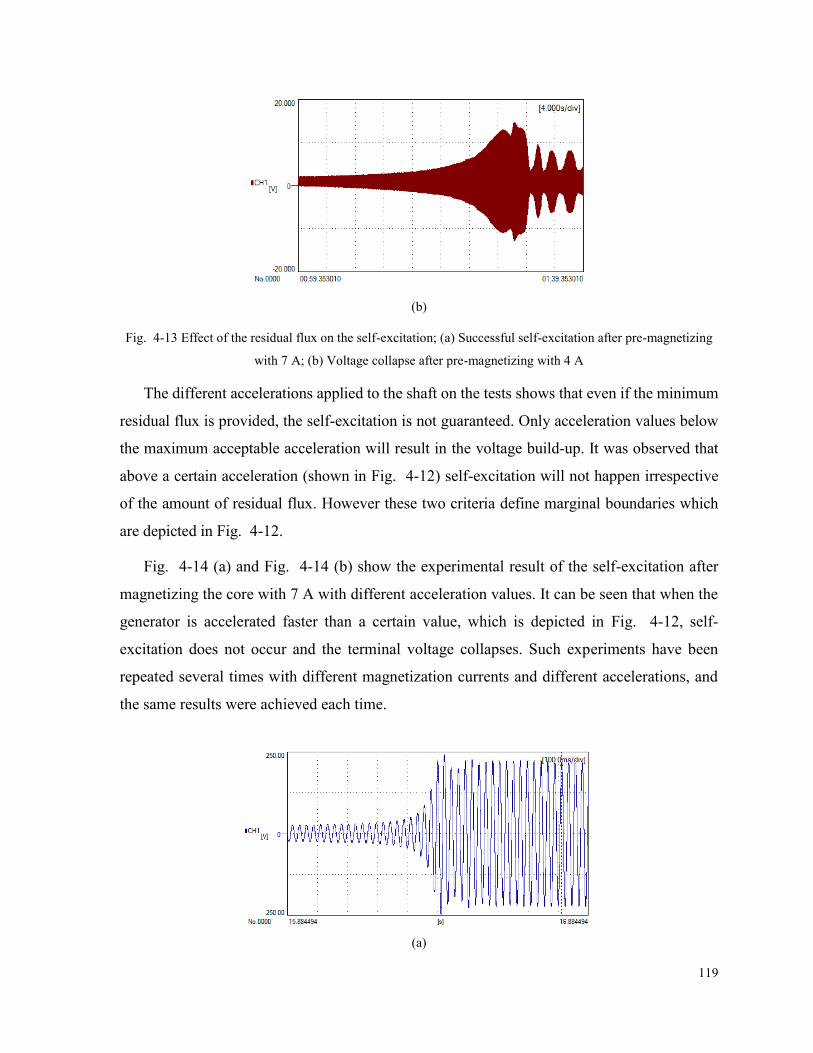
119
(b)
Fig. 4-13 Effect of the residual flux on the self-excitation; (a) Successful self-excitation after pre-magnetizing
with 7 A; (b) Voltage collapse after pre-magnetizing with 4 A
The different accelerations applied to the shaft on the tests shows that even if the minimum
residual flux is provided, the self-excitation is not guaranteed. Only acceleration values below
the maximum acceptable acceleration will result in the voltage build-up. It was observed that
above a certain acceleration (shown in Fig. 4-12) self-excitation will not happen irrespective
of the amount of residual flux. However these two criteria define marginal boundaries which
are depicted in Fig. 4-12.
Fig. 4-14 (a) and Fig. 4-14 (b) show the experimental result of the self-excitation after
magnetizing the core with 7 A with different acceleration values. It can be seen that when the
generator is accelerated faster than a certain value, which is depicted in Fig. 4-12, self-
excitation does not occur and the terminal voltage collapses. Such experiments have been
repeated several times with different magnetization currents and different accelerations, and
the same results were achieved each time.
(a)
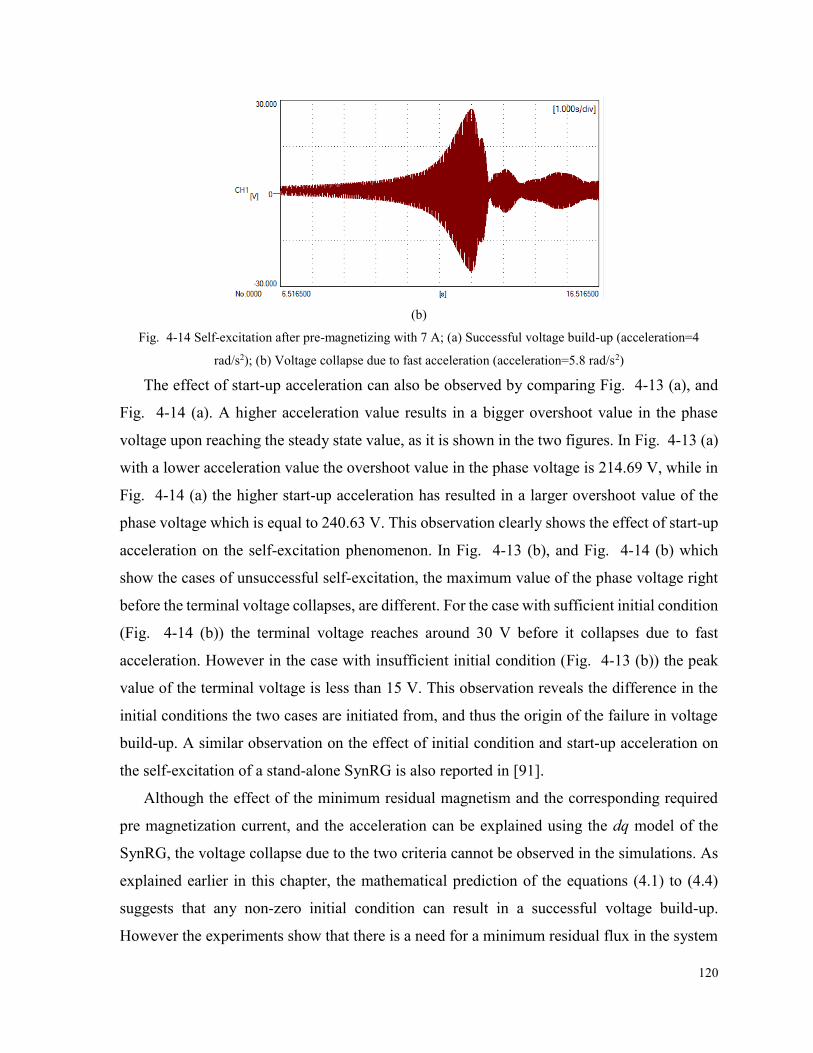
120
(b)
Fig. 4-14 Self-excitation after pre-magnetizing with 7 A; (a) Successful voltage build-up (acceleration=4
rad/s2); (b) Voltage collapse due to fast acceleration (acceleration=5.8 rad/s2)
The effect of start-up acceleration can also be observed by comparing Fig. 4-13 (a), and
Fig. 4-14 (a). A higher acceleration value results in a bigger overshoot value in the phase
voltage upon reaching the steady state value, as it is shown in the two figures. In Fig. 4-13 (a)
with a lower acceleration value the overshoot value in the phase voltage is 214.69 V, while in
Fig. 4-14 (a) the higher start-up acceleration has resulted in a larger overshoot value of the
phase voltage which is equal to 240.63 V. This observation clearly shows the effect of start-up
acceleration on the self-excitation phenomenon. In Fig. 4-13 (b), and Fig. 4-14 (b) which
show the cases of unsuccessful self-excitation, the maximum value of the phase voltage right
before the terminal voltage collapses, are different. For the case with sufficient initial condition
(Fig. 4-14 (b)) the terminal voltage reaches around 30 V before it collapses due to fast
acceleration. However in the case with insufficient initial condition (Fig. 4-13 (b)) the peak
value of the terminal voltage is less than 15 V. This observation reveals the difference in the
initial conditions the two cases are initiated from, and thus the origin of the failure in voltage
build-up. A similar observation on the effect of initial condition and start-up acceleration on
the self-excitation of a stand-alone SynRG is also reported in [91].
Although the effect of the minimum residual magnetism and the corresponding required
pre magnetization current, and the acceleration can be explained using the dq model of the
SynRG, the voltage collapse due to the two criteria cannot be observed in the simulations. As
explained earlier in this chapter, the mathematical prediction of the equations (4.1) to (4.4)
suggests that any non-zero initial condition can result in a successful voltage build-up.
However the experiments show that there is a need for a minimum residual flux in the system
121
(as explained in this chapter). This minimum residual magnetism is obtained by analyzing the
behavior of the system as shown in section 4.3.1. The effect of start-up acceleration on the
voltage build-up process can be studied by analyzing the q-axis flux linkage of the machine as
shown in section 4.3.2. However the voltage collapse due to high acceleration cannot be
observed in the current dq model that is developed for the SynRG, since the lookup tables used
for the d-axis and q-axis flux linkage curves do not include the conditions through which the
machine is demagnetized due to high acceleration values. Although it is possible to analyze
the q-axis flux linkage curve of the machine for various start-up acceleration values as
demonstrated in section 4.3.2, and conclude the occurrence of the self-excitation accordingly.
The effect of the required minimum residual flux and hence the required pre-magnetization
current to obtain that, can also be studied by analyzing the system characteristics through the
nonlinear system of equations as shown in section 4.3.1. However as discussed in the chapter
since the mathematical analysis of the system predicts the occurrence of the self-excitation
irrespective of the value of the initial condition in the system, the dq simulation cannot be
directly used to conclude the successful voltage build-up. Therefore as demonstrated earlier in
this chapter, the analysis of the system of equation of the SynRG is required to identify the
minimum required residual flux and the required pre-magnetization current to achieve that.
4.5. Summary of the Chapter
In this chapter the stand-alone SynRG was presented and the criteria to ensure a successful
self-excitation was identified. It was observed in the simulations that the voltage build-up
procedure in SynRGs depends on maintaining a minimum required residual flux in the
ferromagnetic core material prior to the start-up procedure. The required magnetizing current
to provide the minimum required residual flux, was obtained using the dq model, the Energetic
Model, and the machine’s geometry and parameters. This observation was validated using
several experiments performed on a stand-alone SynRG with different magnetization levels.
The effect of start-up acceleration on the q-axis flux linkage was also studied. It was shown
that high acceleration values can create transients in the q-axis flux linkage waveform that
leads to core demagnetization. Hence the maximum acceptable acceleration that creates
acceptable transients was determined using simulations, and later verified by experiments. This
value depends on the machine’s characteristics, and must be identified using the dq model.
122
Above this maximum acceleration, the voltage build-up procedure will not take place fully and
the terminal voltage will collapse after a few cycles. It was also shown that the phase winding
resistance has a significant impact on the voltage build-up procedure. Therefore a successful
self-excitation does not only depend on the presence of a minimum residual flux in the core,
but also depends on the acceleration value through which the rated speed is achieved. The
repeatability of the results for different magnetization currents and different acceleration shows
the accuracy of the estimated value for the residual flux.
For a successful operation and start-up of the stand-alone SynRG the system parameters
including the machine’s characteristics (d and q axis inductances and phase winding
resistance), the size of the capacitor bank, the rated speed of the machine, and type of the load
(resistive, inductive, or capacitive) must be initially determined. Based on the machine’s
characteristics (d-axis and q-axis inductances) the minimum pre-magnetizing current, and the
operational speed (which also depends on the size of the capacitor bank) must be identified.
The system must be also simulated using the dq model and the q-axis flux linkage waveform
should be analyzed to obtain the maximum acceptable start-up acceleration. Through this
procedure the variation of system parameters, such as winding resistance as shown in this
chapter, must also be considered for a successful voltage build-up procedure.
123
Chapter 5 Conclusion and Future Work
5.1. Conclusion
In this thesis an analytical model for analysis, modeling, and design of SynRMs and PM
assisted SynRMs was presented. The proposed model incorporates the effect of the flux
barriers of the rotor of the SynRM in an air gap function. Based on the stator winding
configuration, the winding function of the machine is obtained. Using the air gap function and
the winding function, phase inductances of the machine are calculated and the electromagnetic
torque of the machine is estimated using the coenergy method. The model was further
expanded for modeling and characterization of a segmented-pole SynRM made of CRGO steel
laminations. It was shown that the proposed method for incorporating the effect of the flux
barriers of the SynRM, has the capability to include the main design parameters of the SynRM
in the analytical model. Therefore geometrical features such as size and location of the rotor
flux barriers, electric features such as winding configuration and winding turns, and magnetic
features such steel permeability can be modeled using the proposed modeling approach. The
model capability in SynRM characterization was tested using measurements and FEA
simulations performed on a 7.5 hp SynRM. Although an acceptable agreement was observed
between the results of the analytical model, and measurement results, some deviations were
also noticed as presented in Chapter 2 since the proposed analytical model does not include
the effect of steel saturation. Although incorporating the effect of saturation is possible as it
was shown for the CRGO steel permeability, it adds up to the complexity of the analytical
model. Therefore since the simplicity of the model is one of the main goals of this analytic
approach, steel saturation was not considered.
Based on the proposed analytical model a segmented-pole SynRM made of CRGO steel
laminations was also studied. It was observed from experiments, FEA simulation, and the
analytical model that despite theoretical expectation, the application of CRGO steel does not
have a significant impact on saliency ratio improvement of the SynRM. The proposed design
topology is highly saturated due to the large flux barriers’ widths, and the shape of the flux
barriers do not allow for full utilization of the CRGO steel properties. Therefore a modified
design was presented for a better utilization of the CRGO steel lamination. However since the
effect of steel permeability compared to the effect of flux barriers on creating rotor saliency is

124
small, the obtained gain despite using a CRGO steel even in the modified segmented-pole
SynRM is not significant.
The proposed analytical method was also used to design a PM assisted SynRM. In the
proposed design topology the utilized permanent magnets are placed inside the rotor core in a
manner to contribute to the d-axis flux of the machine. Instead of using rare-earth permanent
magnet materials, AlNiCo magnets were used in order to reduce the manufacturing cost and
also study the effectiveness of non-rare-earth permanent magnet materials on performance
improvement of SynRMs. For a better comparison the finalized topology was also simulated
considering N48 permanent magnet material (rare-earth magnet). The comparison revealed a
slight improvement in the output torque and power factor of the PM assisted SynRM made of
the rare-earth permanent magnet material when compared to the PM assisted SynRM made of
AlNiCo 9 magnets. The final PM assisted SynRM was further characterized and compared
with the SynRM based on torque-speed envelopes and efficiency map analysis. For the same
DC bus voltage the base speed of the PM assisted SynRM is lower than the base speed of the
SynRM with the same size. This is due to the induced back-EMF from the permanent magnets
of the rotor. However the generated electromagnetic torque of the PM assisted SynRM is
higher than the SynRM torque. The PM assisted SynRM also has a higher efficiency when
compared to the SynRM as shown in Chapter 3.
In Chapter 4 the generator operation of the stand-alone SynRM was studied. It was shown
that for a successful operation of the SynRG as a stand-alone power generation unit, certain
criteria must be met. These criteria were identified using the dq model of the SynRG connected
to a capacitor bank. It was observed that a minimum initial condition must be present in the
system prior to the start-up procedure, and the start-up of the SynRG must be performed with
an acceleration value below a maximum value. The minimum residual flux is a function of
machine’s geometry and magnetic characteristics that can be obtained by d-axis and q-axis
inductance measurement. The maximum allowable start-up acceleration which is applied to
the SynRG using the prime mover depends on machine’s parameters such as d-axis inductance,
q-axis inductance, phase winding resistance and the size of the capacitor bank. It was observed
that for a successful self-excitation both of the abovementioned criteria must be fulfilled.
125
5.2. Future Work
This research work can be further extended to:
The proposed analytical model in Chapter 2 can be extended to include more complicated
features of the SynRM such as core saturation.
The proposed analytical model has the capacity to incorporate various geometrical
features such as slot effect, and various faulty conditions such as eccentricity, and
winding faults. Such features can be included either in the winding function and the air
gap function of the machine. Therefore the proposed analytical model can be used for
modeling and analysis of the machine under faulty conditions.
The analytical model can be modified as a general design tool in order to obtain the main
design parameters of a SynRM based on the application requirement. To do so the torque
equation of the SynRM which is dependent on the machine’s dimensions, electric
loading, and magnetic loading (as shown in Chapter 1) can be embedded in the analytical
model. Therefore based on the application requirements the main dimensions of the
machine can be estimated. Based on the obtained rotor outer diameter the number, shape,
and sizes of the flux barriers can be determined in order to provide the required saliency
ratio.
The generator operation of the SynRG as an autonomous stand-alone power generation
unit can be studied. In such system the SynRG is connected to a battery through a
bidirectional power converter. The battery can supply the excess load if needed. It can
also be used to provide the required initial condition if the SynRG is demagnetized due
to a fault (as discussed in Chapter 5).
The effect of start-up acceleration on the voltage collapse cases can be implemented in
the MATLAB Simulink by incorporating the rate of the change of the q-axis flux linkage
in the Simulink model. Therefore the occurrence of self-excitation can be predicted by
studying the q-axis flux linkage curve of the SynRM.
126
References
[1] B. Kramer, S. Chakrabotry and B. Kroposki, "A Review of Plug-in Vehicles and Vehicle-to-Grid
Capability," in Industrial Electronics, 2008. IECON 2008. 34th Annual Conference of IEEE, Orlando, FL,
2008.
[2] R. G. Gago, S. F. Pinto and J. F. Silva, "G2V and V2G Electric Vehicle Charger for Smart Grids," in IEEE
International Smart Cities Conference (ISC2), Trento, Italy, 2016.
[3] X. Zhang, Q. Wang and G. Xu, "A review of Plug-in Electric Vehicles as Distributed Energy Storages in
Smart Grid," in 5th IEEE OES Innovative Smart Grid Technologies Europe, Istanbul, 2014.
[4] F. Laureri, L. Puliga, M. Robba, F. Defino and G. Odena Bulto, "An Optimization Model for the Integration
of Electric Vehicles and Smart Grids: Problem Definition and Experimental Validation," in IEEE
International Smart Cities Conference (ISC2), Trento, Italy, 2016.
[5] S. Taghavi, Design of Synchronous Reluctance Machines for Automotive Applications, Montreal, QC,
Canada: A Thesis in the Department of Electrical and Computer Engineering, Concordia University,
Montreal, Canada, 2015.
[6] S. Taghavi and P. Pillay, "A Sizing Methodology of the Synchronous Reluctance Motor for Traction
Applications," IEEE Journal of Emerging and Selected Topics in Power Electronics, vol. 2, no. 2, pp. 329-
340, June 2014.
[7] A. Vagati, "The Synchronous Reluctance Solution: A New Alternative in AC Drives," in Industrial
Electronics, Control and Instrumentation, 1994. IECON '94., 20th International Conference on, Bologna,
5-9 Sep 1994.
[8] A. Alolah, "Steady-State Operating Limits of Three Phase Self-Excited Reluctance Generator," Generation,
Transmission and Distribution, IEE Proceedings C, vol. 139, no. 3, pp. 261-268, May 1992.
[9] S. Taghavi and P. Pillay, "A Comparative Study of Synchronous Reluctance Machine Performance with
Different Pole Numbers for Automotive Applications," in Industrial Electronics Society, IECON 2014 -
40th Annual Conference of the IEEE, Dallas, TX, 2014.
[10] T. Matsuo and T. A. Lipo, "Rotor Design Optimization of Synchronous Reluctance Machine," IEEE
Transactions on Energy Conversion, vol. 9, no. 2, pp. 359-365, June 1994.
[11] D. Staton, T. Miller and S. Wood, "Maximising the saliency Ratio of the Synchronous Reluctance Motor,"
Electric Power Applications, IEE Proceedings B, vol. 140, no. 4, pp. 249-259, July 1993.
[12] ABB, ABB, 2016. [Online]. Available: http://new.abb.com/motors-generators/iec-low-voltage-
motors/frequency-controlled-motors/synchronous-reluctance-motor-drive-packages/synrm-verified-
package-efficiency. [Accessed 2017].
[13] E. Obe, "Calculation of inductances and torque of an axially laminated synchronous reluctance motor," IET
Electric Power Application, vol. 4, no. 9, pp. 783-792, December 2009.
[14] A. Ogunjuyigbe, A. Jimoh, D. Nicolae and E. Obe, "Analysis of synchronous reluctance machine with
magnetically coupled three-phase windings and reactive power compensation," IET Electric Power
Applications, vol. 4, no. 4, pp. 291-303, 2009.
[15] A. Vagati, A. Canova, M. Pastorelli, M. Chiampi and M. Repetto, "Design Refinement of Synchronous
Reluctance Motors Through Finite-Element Analysis," IEEE Transaction on Industry Applications, vol. 36,
no. 4, pp. 1094-1102, July/August 2000.
127
[16] N. Bedetti, S. Calligaro and R. Petrella, "Stand-Still Self-Identification of Flux Characteristics for
Synchronous Reluctance Machines Using Novel Saturation Approximating Function and Multiple Linear
Regression," IEEE Trans. on Industry Applications, vol. 52, no. 4, pp. 3083-3092, 2016.
[17] N. Bianchi, S. Bolognani and D. Bon, "Rotor flux barrier design for torque ripple reduction in synchronous
reluctance and PM-assisted synchronous reluctance motors," IEEE Trans. on industry applications, vol. 45,
no. 3, pp. 921-928, 2009.
[18] Z. Azar and Z. Q. Zhu, "Performance Analysis of Synchronous Reluctance Machines Having
Nonoverlapping Concentrated Winding and Sinusoidal Bipolar with DC Bias Excitation," IEEE Trans. on
Industry Applications, vol. 50, no. 5, pp. 3346-3356, 2014.
[19] M. Palmieri, M. Perta and F. Cupertino, "Design of a 50.000 r/min Synchronous Reluctance Machine for
an Aeronautic Diesel Engine Compressor," IEEE Trans. on Industry Apllications, vol. 52, no. 5, pp. 3831-
3838, 2016.
[20] H. Kiriyama, S. Kawano, Y. Honda and T. Higaki, "High Performance Synchronous Reluctance Motor with
Multi-flux Barrier for the appliance industry," in Industry Applications Conference, 1998. Thirty-Third IAS
Annual Meeting. The 1998 IEEE , St. Louis, MO, Oct. 1998.
[21] I. Boldea, Z. Fu and S. Nasar, "Performance Evaluation of Axially-Laminated Anisotropic (ALA) Rotor
Reluctance Synchronous Motors," in Industry Applications Society Annual Meeting, 1992., Conference
Record of the 1992 IEEE, Houston, TX, Oct. 1992.
[22] A. Vagati, G. Franceschini, I. Marongiu and G. Troglia, "Design Criteria of High Performance Synchronous
Reluctance Motors," in Industry Applications Society Annual Meeting, 1992., Conference Record of the
1992 IEEE, Houston, TX, Oct. 1992.
[23] M. Ibrahim, L. Masisi and P. Pillay, "Design of Variable-Flux Permanent-Magnet Machines Using Alnico
Magnets," IEEE Transactions on Industry Applications, vol. 51, no. 6, pp. 4482-4491, 2015.
[24] Y. Wang, N. Bianchi, S. Bolonami and L. Alberti, "Synchronous Motors for Traction Applications," in
Electrical and Electronic Technologies for Automotive, 2017 International Conference of, Torino, Italy,
2017.
[25] A. Vagati, A. Canova, M. Chiampi, M. Pastorelli and M. Repetto, "Desing refinement of synchronous
reluctance motors through finite-element analysis," IEEE Trans. on Industry Applications, vol. 36, no. 4,
pp. 1094-1102, 2000.
[26] S. Maroufian and P. Pillay, "Torque characterization of a synchronous reluctance machine using an
analytical model," in Power Electronics, Drives and Energy Systems (PEDES), 2016 IEEE International
Conference on, Trivandrum, India, 2016.
[27] G. Bacco and N. Bianchi, "Choice of Flux-barriers Position in Synchronous Reluctance Machines," in
Energy Conversion Congress and Exposition (ECCE), 2017 IEEE, Cincinnati, OH, USA, 2017.
[28] M. Degano, H. Mahmoud, N. Bianchi and C. Gerada, "Synchronous reluctance machine analytical model
optimization and validation through finite element analysis," in Electrical Machines (ICEM), 2016 XXII
International Conference on, Lausanne, Switzerland, 2016.
[29] C. M. Spargo, B. C. Mecrow and J. D. Widmer, "A Seminumerical Finite-Element Postprocessing Torque
Ripple Analysis Technique for Synchronous Electric Machines Utilizing the Air-Gap Maxwell Stress
Tensor," IEEE Trans. on Magnetics, vol. 50, no. 5, p. 7026909, 2014.
[30] X. Luo, A. El-Antably and T. A. Lipo, "Multiple coupled circuit modeling of synchronous reluctance
machines," in Industry Applications Society Annual Meeting, Denver, CO, 1994.
[31] M. Kamper, "Effect of rotor dimensions and cross magnetisation on Ld and Lq inductances of reluctance
synchronous machine with cageless flux barrier rotor," Electric Power Applications, IEE Proceedings, vol.
141, no. 4, pp. 213-220, Jul 1994.
128
[32] M. N. Fathy Ibrahim, A. S. Abdel-khalik, E. E. M. Rashad and P. Sergeant, "An Improved Torque Density
Synchronous Reluctance Machine with a Combined Star-Delta Winding Layout," IEEE Transactions on
Energy Conversion, vol. 33, no. 3, pp. 1015-1024, 2018.
[33] Z. Yang and F. Tadashi, "Direct Output Power Control for PWM Converter-Based Super-High-Speed
Reluctance Generator," IEEE Trans. on Industry Application, vol. 28, no. 1, pp. 57-63, 1992.
[34] R. Moncada, B. Pavez, J. Tapia and J. Pyrhonen, "Operation Analysis of Synchronous Reluctance Machine
in Electric Power Generation," in International conference on electrical machines (ICEM), Berlin,
Germany, 2014.
[35] W. s. Abu-Elhaija and A. Muetze, "self-Excitation and stability at speed transients of Self-Excited Single-
Phase Reluctance Generators," IEEE Trnas. on Sustainable Energy, vol. 4, no. 1, pp. 136-144, 2013.
[36] Y. Rahim, J. Fletcher and N. Hassanian, "Performance Analysis of Salient-Pole Self-Excited Reluctance
Generators Using a Simplified Model," IET Renewable Power Generation, vol. 4, no. 3, pp. 253-260, 2010.
[37] A. Alolah, "Steady-state operating limits of three phase self-excited reluctance generator," IEE proceeding
C generation and transmission, vol. 139, no. 3, pp. 261-268, 1992.
[38] S. Guha and N. C. Kar, "Saturation Modeling and Stability Analysis of Synchrnous Reluctance Generator,"
IEEE Trans. on Energy conversion, vol. 23, no. 3, pp. 814-823, 2008.
[39] N. Eldeen, A. M. Hassanian, A. Y. M. Abbas and A. S. G. Hussien, "Performance Analysis of Isolated Self-
Excited Reluctance Generators. Connected to Diode Bridge Rectifier," SUST journal of engineering and
computer science (JESC), vol. 16, no. 3, pp. 1-18, 2015.
[40] M. Anajjar and D. Gerling, "Synchronous Reluctance Generator with FPGA Control of Three-Level
Neutral-Point-Clamped Converter for Wind Power Application," in Power Electronics and Motion Control
Conference (PEMC), 2016 IEEE International, Varna, Bulgaria, 2016.
[41] A. E. Hoffer, R. H. Moncada, B. J. Pavez, J. A. Tapia and L. Laurila, "A High Efficiency control Strategy
for Synchronous Reluctance Generator Including Saturation," in XXII International Conference on
Electrical Machines (ICEM), Lausanne, Switzerland, 2016.
[42] T. Fukao, Z. Yang and M. Matsui, "Voltage Control of Super High-Speed Reluctance Generator System
with a PWM Voltage Source Converter," IEEE Trans. on Industry Applications, vol. 28, no. 4, pp. 880-
886, 1992.
[43] M. Bodson and O. Kiselychnyk, "Analysis of triggered self-excitation in induction generators and
experimental validation," IEEE transactions on energy conversion , vol. 27, no. 2, pp. 238-249, 2012.
[44] M. Bodson and O. Kiselychnyc, "On the triggering of self-excitation in induction generators," in
International symposium of power electronics, electrical drives automation and motion (SPEEDAM), Pisa,
Italy, 2010.
[45] Y. Rahim, A. Mohamadien and A. Al Khalaf, "Comparison between the Steady-State performance of Self-
Excited Reluctance and Inducion Generators," IEEE Trans. on Energy Conversion, vol. 5, no. 3, pp. 519-
525, 1990.
[46] Y. Tan, K. M. Muttaqi, L. Meegahapola and P. Ciufo, "Deadband Control of Doubly-Fed Induction
Generator Around Synchrnous Speed," IEEE Trans. on energy Conversion, vol. 31, no. 4, pp. 1610-1621,
2016.
[47] O. Ojo and W. Zhiqing, "Synchronous operation of a dual-winding reluctance generator," IEEE transactions
on energy conversion, vol. 12, no. 4, pp. 357-362, 1997.
[48] I. Boldea, Z. Fu and S. Nasar, "High performance synchronous reluctance generator," IEE proceeding B
electric power applications, vol. 140, no. 2, pp. 124-130, 1993.
129
[49] M. E. Baran and A. J. Goetze, "Equivalent Circuits of AC Machines Based on Field Analyis," IEEE Trans.
on Power Systems, vol. 9, no. 2, pp. 565-572, 1994.
[50] V. Ostovic, Dynamics of Saturated Electric Machines, New York: Springer-Verlag Inc., 1989.
[51] M. Amrhein and P. T. Krein, "Force Calculation in 3-D Magnetic Equivalent Circuit Networks with a
Maxwell Stress Tensor," IEEE Trans. on Energy Conversion, vol. 24, no. 3, pp. 587-593, 2009.
[52] A. J. Pina, Y. Alsmadi and L. Xu, "Analytical Model for the Minimization of Torque Ripple in Permanent
Magnets Assisted Synchronous Reluctance Motors Through Asymmetric Rotor Poles," in Energy
Conversion Congress and Exposition (ECCE), Montreal, QC, Canada, 2015.
[53] T. Lipo, Analysis of Synchrnous Machines, Second edition, Boca Raton, FL: CRC Press, Taylor and Francis
Group, 2012.
[54] N. A. Al Nuaim and H. Toliyat, "A Method for Dynamic Simulation and Detection of Dynamic Air gap
Eccentrcicity in Synchronous Machines," in IEEE International Electric Machines and Drives, Milwaukee,
WI, USA, 1997.
[55] R. Qu and T. Lipo, "General Closed-Form Analytical Expressions for Air gap Inductances for surface-
mounted Permanent Magnet and Induction Machines," in IEEE International Electric Machines and Drives
Conference, Madison, WI, USA, 2003.
[56] O. Ojo, A. Ginart, O. Omozusi and A. Jimoh, "Modeling and Analysis of a Single-Phase Synchronous
Reluctance Machine Including Saturation Effect," in IEEE Industry Application Society Annual Meeting,
New Orleans, Louisiana, USA, 1997.
[57] I. Sadeghi, H. Ehya and J. Faiz, "Analytic method for eccentricity fault diagnosis in salient-pole
synchronous generators," in International Conference on Optimization of Electrical and Electronic
Equipment (OPTIM) & 2017 Intl Aegean Conference on Electrical Machines and Power Electronics
(ACEMP), Brasov, Romania, 2017.
[58] I. Boldea, Reluctance Synchronous Machines and Drives, Oxford: Clarendon press, 1996.
[59] N. Bianchi and B. Chalmers, "Axially Laminated Reluctance Motor: Analytical and Finite-Element
Methods for Magnetic Analysis," IEEE Trans. on Magnetics, vol. 38, no. 1, pp. 239-245, 2002.
[60] S. Taghavi and P. Pillay, "A Novel Grain-Oriented Lamination Rotor Core Assembly for a Synchronous
Reluctance Traction Motor With a Reduced Torque Ripple Algorithm," IEEE Trans. on Industry
Applications, vol. 52, no. 5, pp. 3729-3738, 2016.
[61] K. J. Meessen, J. J. H. Paulides and E. A. Lomonova, "Force Calculation in 3-D Cylindrical Structures
Using Fourier Analysis and the Maxwell Stress Tensor," IEEE Trans. on Magnetics, vol. 49, no. 1, pp. 536-
545, 2013.
[62] H. VuXuan, D. Lahaye, S. Ani, H. Polinder and J. Ferreira, "Effect of Design Parameters on
Electromagnetic Torque of PM Machines with Concentrated Windings Using Nonlinear Dynamic FEM,"
in IEEE International Electric Machines and Drives Conference (IEMDC), Niagra Falls, ON, 2011.
[63] N. Bianchi, E. Fornasiero and W. Soong, "Optimal Selection of PM Flux Linkage in a PM Assisted
Synchronous Reluctance Machine," in Electrical Machines (ICEM), Berlin, Germany, 2014.
[64] J. Kitao, Y. Takahashi, K. Fujiwara, A. Ahgon, t. Matsuo and A. Daikoku, "Input and Output Power in
Finite-Element Analysis of Electric Machines Taking Account of Hysteretic Property," IEEE Trans. on
Magnetics, vol. PP, no. 99, pp. 1-4, 2017.
[65] A. Takbash, M. Ibrahim and P. Pillay, "Torque ripple reduction of a variable flux motor," in Energy
Conversion Congress and Exposition (ECCE), 2016 IEEE, Milwaukee, WI, USA, 2016.
130
[66] S. Mishara, T. A. Lipo and S. V. Pamidi, "Design and analysis of a novel brushlesshigh temperature
superconducting synchronous machine," in Electric Machines and Drives Conference (IEMDC), 2017 IEEE
International, Miami, FL, USA, 2017.
[67] S. Taghavi and P. Pillay, "A Novel Grain-Oriented Lamination Rotor Core Assembly for a Synchronous
Reluctance Traction Motor with a Reduced Torque Ripple Algorithm," IEEE Trans. on Industry
Applications, vol. 52, no. 5, pp. 3729-3738, 2016.
[68] H. Cai, B. Guan and L. Xu, "Low-Cost Ferrite PM-Assisted Synchronous Reluctance Machine foe Electric
Vehicles," IEEE Trans. on Industrial Electronics, vol. 61, no. 10, pp. 5741-5748, 2014.
[69] M. Barcaro, T. Pradella and I. Furlan, "Low-Torque Ripple Design of a Ferrite-Assisted Synchronous
Reluctance Motor," IET Electric Power Applications, vol. 10, no. 5, pp. 319-329, 2015.
[70] N. Bianchi, S. Bolognani, D. Bon and M. Dai Pre, "Torque Harmonic Compensation in a Synchronous
Reluctance Motor," IEEE Trans. on Energy Conversion, vol. 23, no. 2, pp. 466-473, 2008.
[71] H. Cong Liu, I.-G. Kim, Y. Jun Oh, J. Lee and S.-C. Go, "Design of Permanent Magnet-Assisted
Synchronous Reluctance Motor for Maximized Back-EMF and Torque Ripple Reduction," IEEE Trans. on
Magnetics, vol. 53, no. 6, pp. 1-4, 2017.
[72] T. A. Huynh and M.-F. Hsieh, "Comparative Study of PM-Assisted SynRM and IPMSM on Constant Power
Speed Range for EV Applications," IEEE Transaction on Magnetics, vol. 53, no. 11, pp. 1-6, 2017.
[73] Y. Wang, G. Bacco and N. Bianchi, "Geometry Analysis and Optimization of PM-Assisted Reluctance
Motors," IEEE Transaction on Industry Applications, vol. 53, no. 5, pp. 4338-4347, 2017.
[74] P. Guglielmi, G. Giraudi, G. Pellegrino and A. Vagati, "P.M. Assisted Synchronous Reluctance Drive for
Minimal Hybrid Application," in Conference Record of the 2004 IEEE Industry Applications Conference,
2004. 39th IAS Annual Meeting., Seattle, WA, USA, 2004.
[75] M. Gamba, G. Pellegrino and A. Vagati, "A New PM-Assisted Synchronous Reluctance machine with a
nonconventional fractional slot per pole combination," in Optimization of Electrical and Electronic
Equipment (OPTIM), 2014 International Conference on, Bran, Romania, 2014.
[76] W. Zhao, F. Xing, X. Wang, T. A. Lipo and B.-i. Kwon, "Design and Analysis of a Novel PM-Assisted
Synchronous Reluctance Machine with Axially Integrated Magnets by the Finite-Element Method," IEEE
Trans. on Magnetics, vol. 53, no. 6, 2017.
[77] N. Bianchi, E. Fornasiero, M. Ferrari and M. Castiello, "Experimental Comparison of PM-Assisted
Synchronous Reluctance Motors," IEEE Trans. on Industry Applications, vol. 52, no. 1, pp. 163-171, 2016.
[78] M. Barcaro and N. Bianchi, "Interior PM Machines using Ferrite to Substitute Rare–Earth Surface PM
Machines," in International conference on Electrical Machines (ICEM), Marseille, France, 2012.
[79] R. Lohninger, H. Grabner, G. Weidenholzer, S. Silber and W. Amrhein, "Modeling, simulation, and Design
of a Permanent Magnet Assisted Synchronous Reluctance Machine," IEEE Transaction on Industry
Applications, vol. 51, no. 1, pp. 196-203, 2015.
[80] J. Baek, S. S. Reddy Bonthu, S. Kwak and S. Choi, "Optimal design of five-phase permanent magnet
assisted synchronous reluctance motor for low output torque ripple," in Energy Conversion Congress and
Exposition (ECCE), 2014 IEEE, Pittsburgh, PA, USA, 2014.
[81] M. T. Bin Tarek and S. Choi, "Design and rotor shape modification of a multiphase high speed permanent
magnet assisted synchronous reluctance motor for stress reduction," in Energy Conversion Congress and
Exposition (ECCE), 2017 IEEE, Cincinnati, OH, USA, 2017.
[82] D. C. Hanselman, Brushless Permanent-Magnet Motor Design, Orono, Maine: McGraw-Hill, Inc., 1994.
[83] T. J. E. Miller, Brushless Permanent Magnet and Reluctance Motor Drives, New York: Clarendon Press
OXFORD, 1989.
131
[84] O. Ojo, "Limit-Cycle and Small Signal Dynamics of Self-Excited Snchronous Reluctance Generator," in
26th southeastern Symposium of System Theory, Athens, Ohio, USA, 1994.
[85] O. Ojo, G. Dong and M. Osaretin Omoigui, "Analysis of a Synchronous Reluctance Machine with an
Auxiliary Single-Phase Winding," IEEE Transaction of Industry Applications, vol. 39, no. 5, pp. 1307-
1313, 2003.
[86] S. Maroufian and P. Pillay, "Self-excitation criteria of the synchronous reluctance generator in stand-alone
mode of operation," in IEEE International Conference on Power Electronics, Drives and Energy Systems
(PEDES), Trivandrum, India, 2016.
[87] S. S. Maroufian and P. Pillay, "Self-Excitation Criteria of the Synchronous Reluctance Generator in Stand-
Alone Mode of Operation," IEEE Transactions on Industry Applications, vol. 54, no. 2, pp. 1245-1253,
2018.
[88] M. Bodson and O. Kiselynchynk, "On the Capacitor Voltage Needed to Trigger Self-Excitation in Induction
Generators," in 19th Mediterranean Conference on control and Automation, Pisa, Italy, 2011.
[89] Y. Zhang, P. Pillay, M. Ibrahim and M. C. Cheng, "Magnetic characteristic and core losses in machine
laminations: high frequency loss prediction from low frequency measurements," IEEE transactions on
industry applications, vol. 48, no. 2, pp. 623-629, 2011.
[90] H. Hauser, Y. Melikhov and D. C. Jiles, "Examination of the equivalence of ferromagnetic hysteresis
models describing the dependence of magnetization on magnetic field and stress," IEEE Transaction on
Magnetics, vol. 45, no. 2, pp. 1940-1949, 2009.
[91] Y. Wang and N. Bianchi, "Investigation of Self-Excited Synchronous Reluctance Generators," IEEE
Transaction on Industry Applications, vol. 54, no. 2, pp. 1360-1369, 2017.


![Three Phase Synchronous Generators · · 2016-01-27Nominal output [kVA] INDUSTRIAL ... • Wide range of sensors to monitor the temperature of the stator winding and the ... 400](https://img.pdfslide.net/doc/110x75/5ac10ee57f8b9ad73f8c7e84/three-phase-synchronous-generators-output-kva-industrial-wide-range-of.jpg)