Embed Size (px)
Citation preview
“Wire Bonding Integrity Assessment for Combined Extreme Environments”
Maria Mirgkizoudi¹, Changqing Liu¹, Paul Conway¹, Steve Riches²¹Wolfson School of Mechanical and Manufacturing Engineering, Loughborough University,
Loughborough, LE11 3TU, UK²GE Aviation Systems - Newmarket, 351 Exning Road, Newmarket, Suffolk, CB8 0AU, UK
IeMRC Annual Conference 2012
OutlineIeMRC Annual Conference 2012
Background Problem Identification Research Focus Experimental Details Experimental Approach Test Samples & Wire
Bonding Wire Bonding
Characteristics Experimental Design
Results Discussion Conclusions Acknowledgements
Background
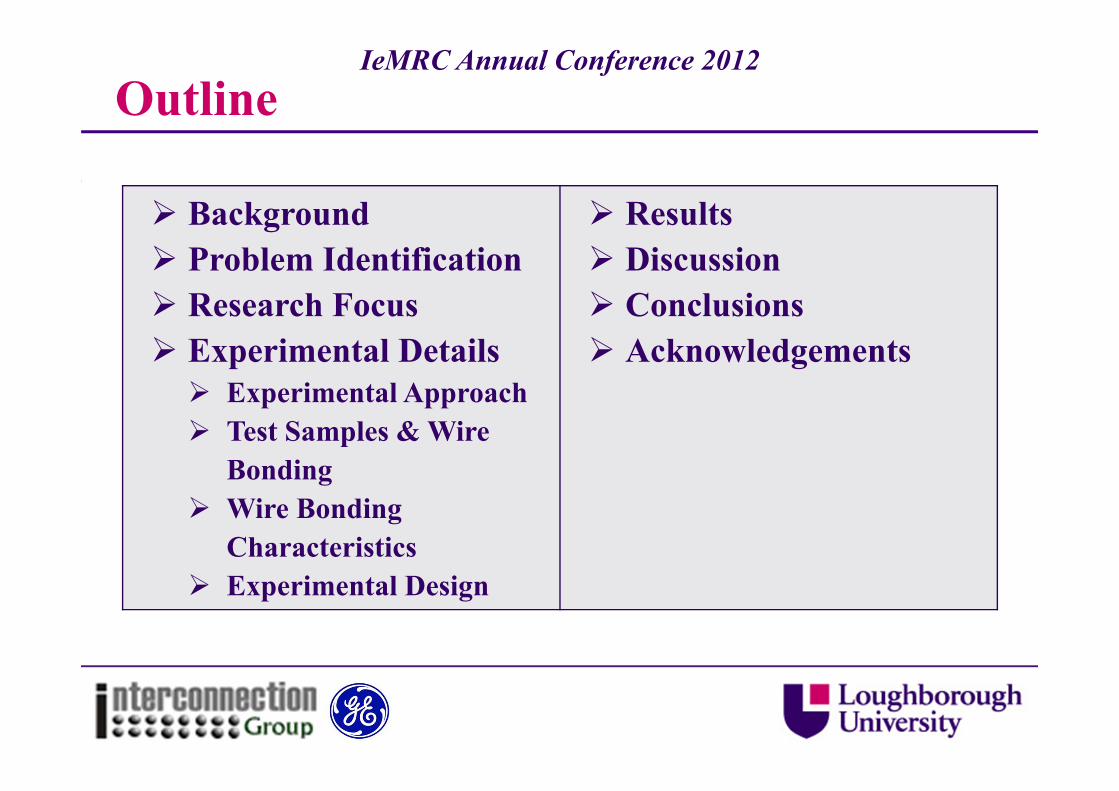
40 years of reliability background.
Harsh environment applicationsraise concerns about reliabilityunder combined extreme loadings.
New industry requirements
Wire bonding:
IeMRC Annual Conference 2012
Problem Identification
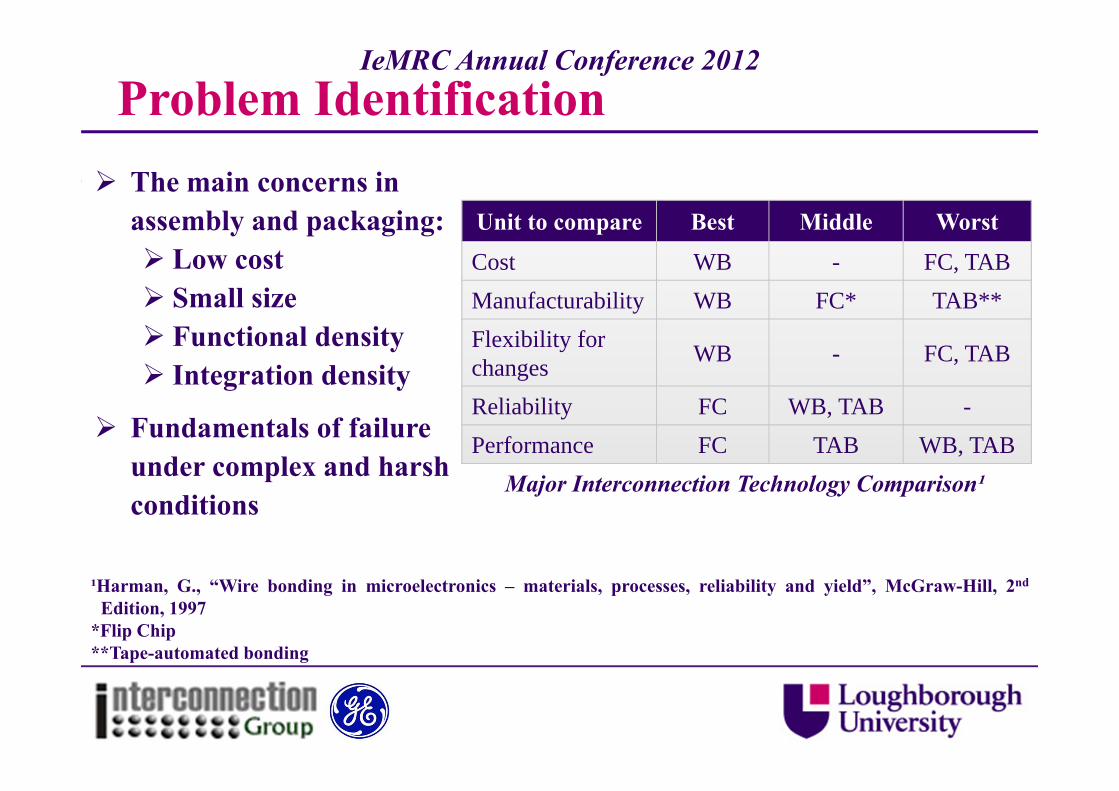
Unit to compare Best Middle Worst
Cost WB - FC, TABManufacturability WB FC* TAB**Flexibility for changes WB - FC, TAB
Reliability FC WB, TAB -Performance FC TAB WB, TAB
¹Harman, G., “Wire bonding in microelectronics – materials, processes, reliability and yield”, McGraw-Hill, 2nd
Edition, 1997*Flip Chip**Tape-automated bonding
The main concerns in assembly and packaging: Low cost Small size Functional density Integration density
Fundamentals of failure under complex and harsh conditions
Major Interconnection Technology Comparison¹
IeMRC Annual Conference 2012
aResearch Focus
The effects of combined thermal and vibrationloadings on wire bonding performance - the rational: Temperature and vibration are prime causes of failure
within electronic circuits. Research on behaviour of wire bonded devices limited
only in normal operation conditions. Knowledge gap in testing and qualification of electronics
under combined harsh conditions.Wire bonding performance under those combined
conditions has not been fully characterised.
IeMRC Annual Conference 2012
Experimental Approach Investigation of:
1. Bond strength & mechanical integrity2. Electrical resistivity changes3. Microstructural defects induced4. Wire orientation role on wire degradation5. How loop geometry is affected by the conditions applied
Analysis methods:1. Wire pull & ball shear testing2. Electrical resistance measurements3. Metallographic observation
IeMRC Annual Conference 2012
Test Samples & Wire BondingIeMRC Annual Conference 2012
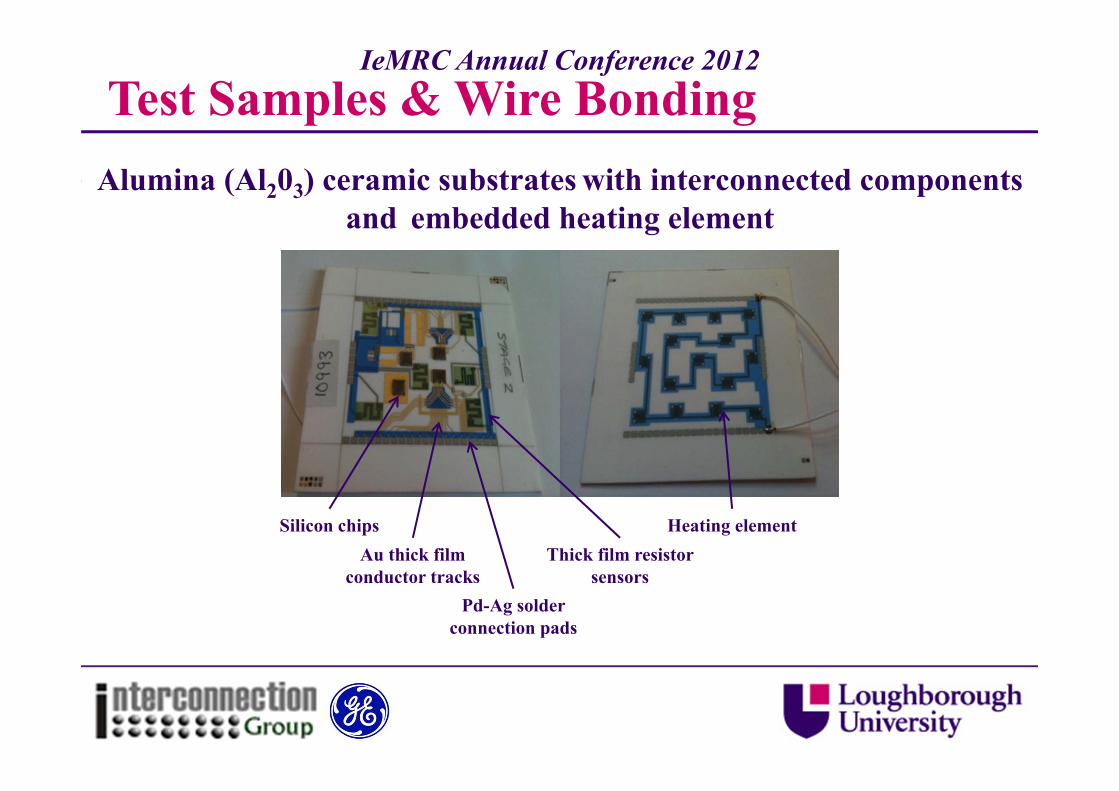
Thick film resistor sensors
Pd-Ag solder connection pads
Au thick film conductor tracks
Heating elementSilicon chips
Alumina (Al203) ceramic substrates with interconnected components and embedded heating element
Test Samples & Wire BondingIeMRC Annual Conference 2012
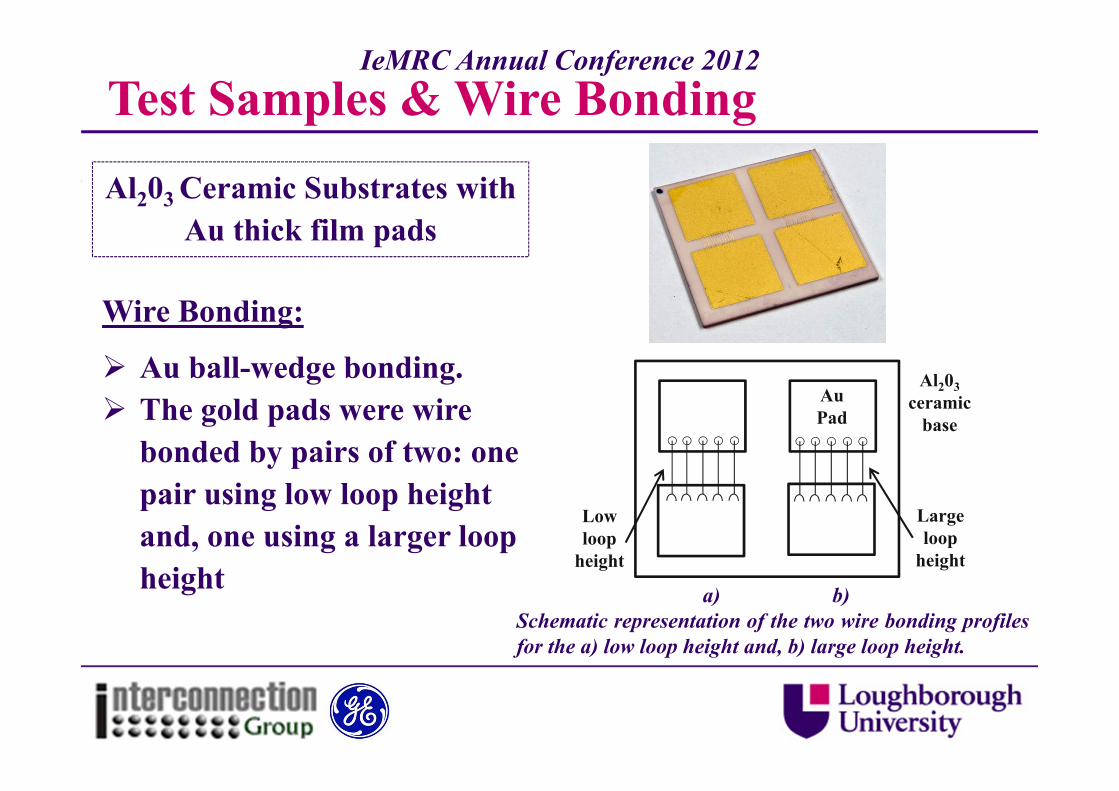
Al203 Ceramic Substrates with Au thick film pads
Wire Bonding:
Au ball-wedge bonding. The gold pads were wire
bonded by pairs of two: one pair using low loop height and, one using a larger loop height a) b)
Schematic representation of the two wire bonding profilesfor the a) low loop height and, b) large loop height.
Lowloop
height
Au Pad
Al203 ceramic
base
Large loop
height
Test Samples & Wire BondingIeMRC Annual Conference 2012
Largeloopheight
Largeloopheight
Lowloop
height
Lowloopheight
Autrack
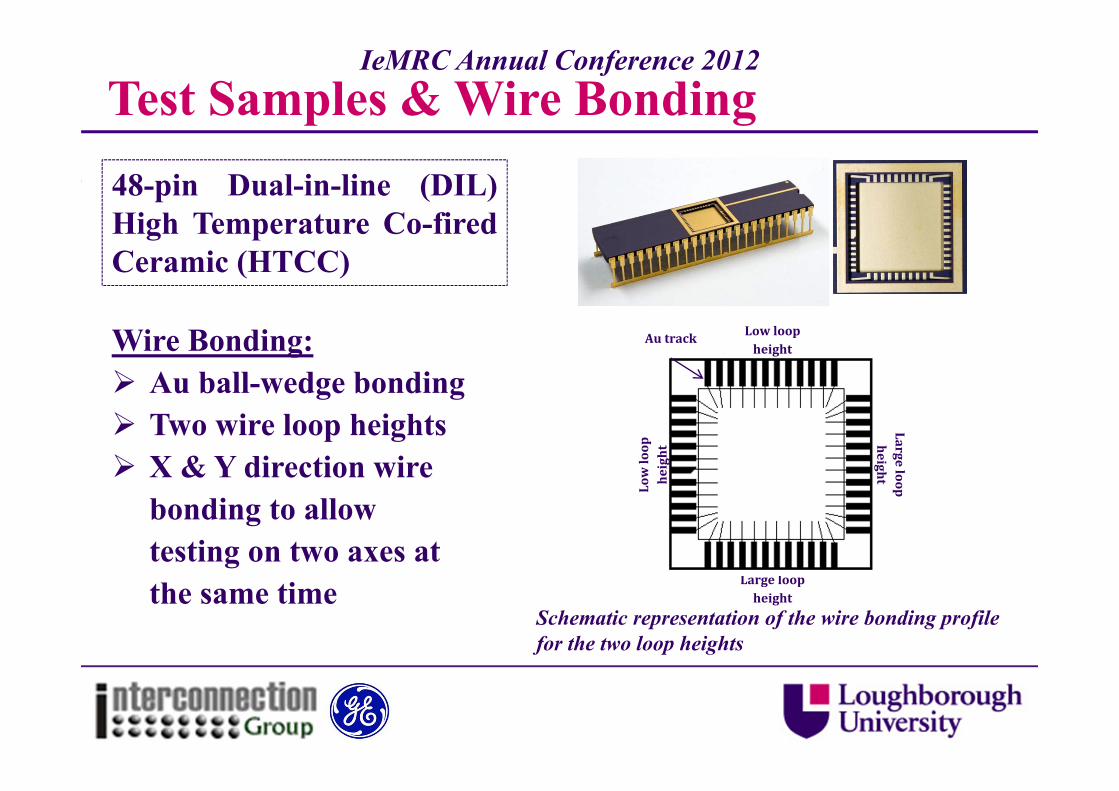
Schematic representation of the wire bonding profile for the two loop heights
48-pin Dual-in-line (DIL)High Temperature Co-firedCeramic (HTCC)
Wire Bonding: Au ball-wedge bonding Two wire loop heights X & Y direction wire
bonding to allow testing on two axes at the same time
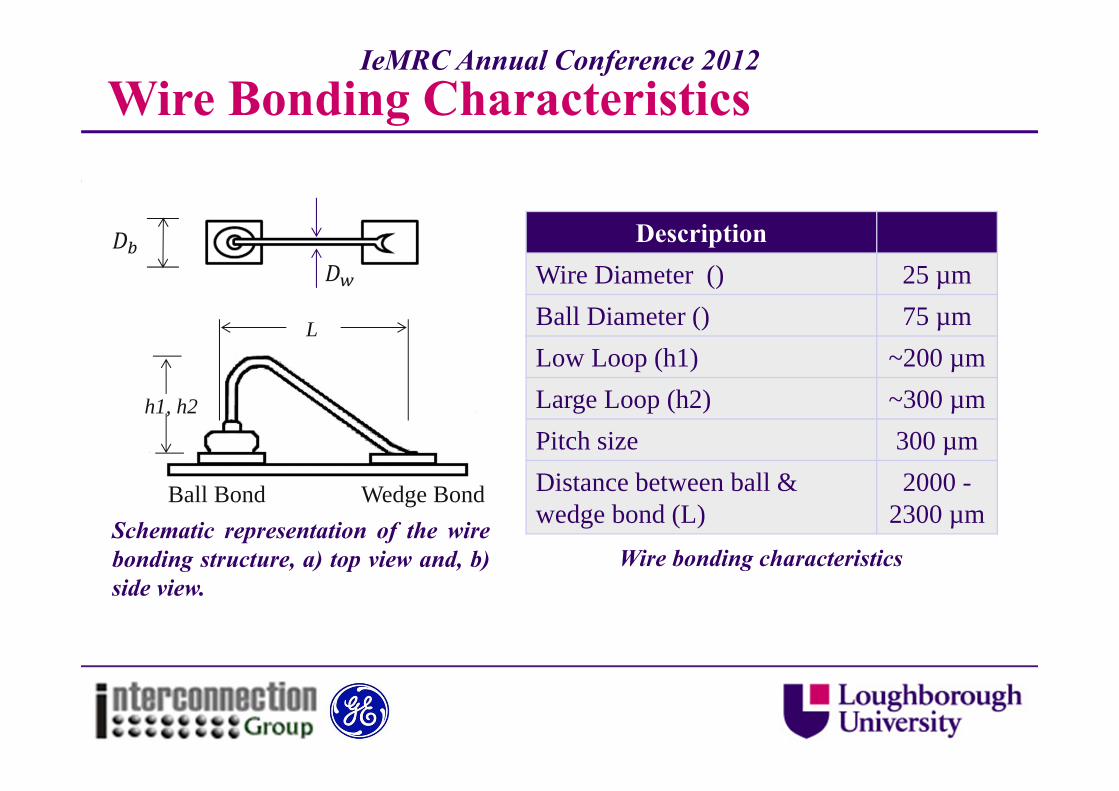
Wire Bonding Characteristics
h1, h2
L
Ball Bond Wedge Bond
DescriptionWire Diameter () 25 µmBall Diameter () 75 µmLow Loop (h1) ~200 µmLarge Loop (h2) ~300 µmPitch size 300 µmDistance between ball & wedge bond (L)
2000 -2300 µmSchematic representation of the wire
bonding structure, a) top view and, b)side view.
Wire bonding characteristics
IeMRC Annual Conference 2012
Experimental DesignIeMRC Annual Conference 2012
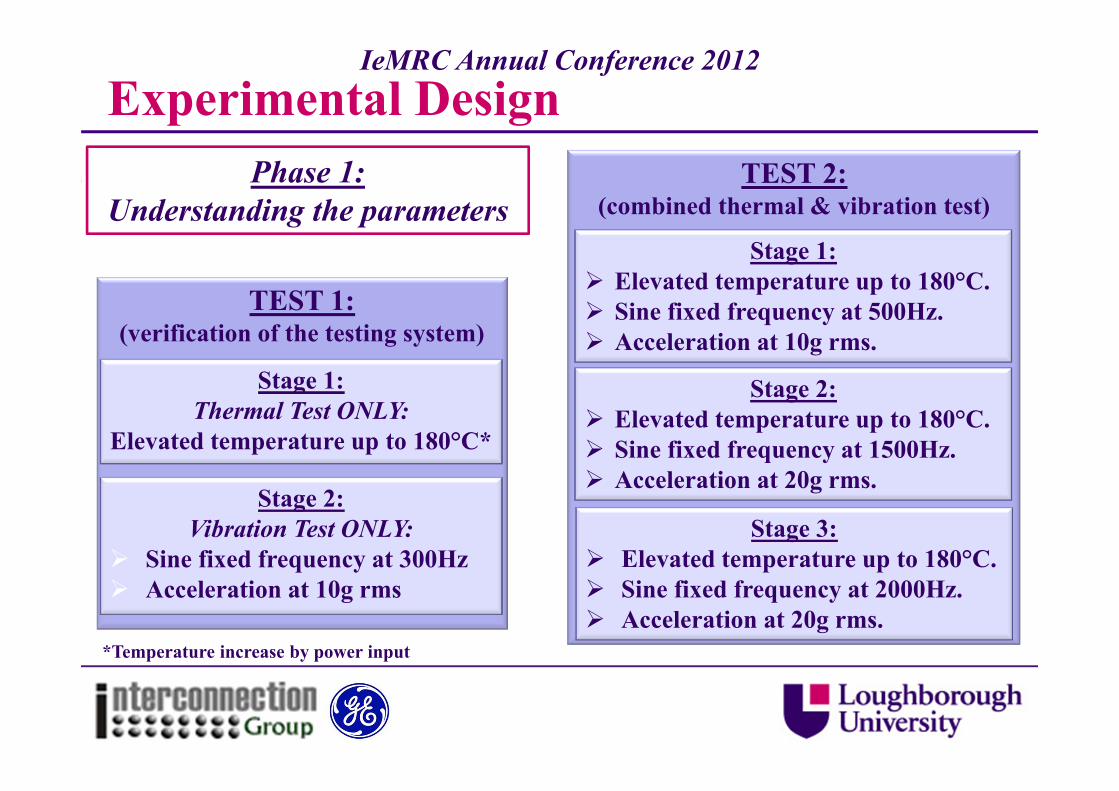
TEST 1:(verification of the testing system)
*Temperature increase by power input
Stage 1:Thermal Test ONLY:
Elevated temperature up to 180°C*
Stage 2:Vibration Test ONLY:
Sine fixed frequency at 300Hz Acceleration at 10g rms
TEST 2:(combined thermal & vibration test)
Stage 1: Elevated temperature up to 180°C. Sine fixed frequency at 500Hz. Acceleration at 10g rms.
Stage 2: Elevated temperature up to 180°C. Sine fixed frequency at 1500Hz. Acceleration at 20g rms.
Stage 3: Elevated temperature up to 180°C. Sine fixed frequency at 2000Hz. Acceleration at 20g rms.
Phase 1: Understanding the parameters
Experimental DesignProcess Parameter Level
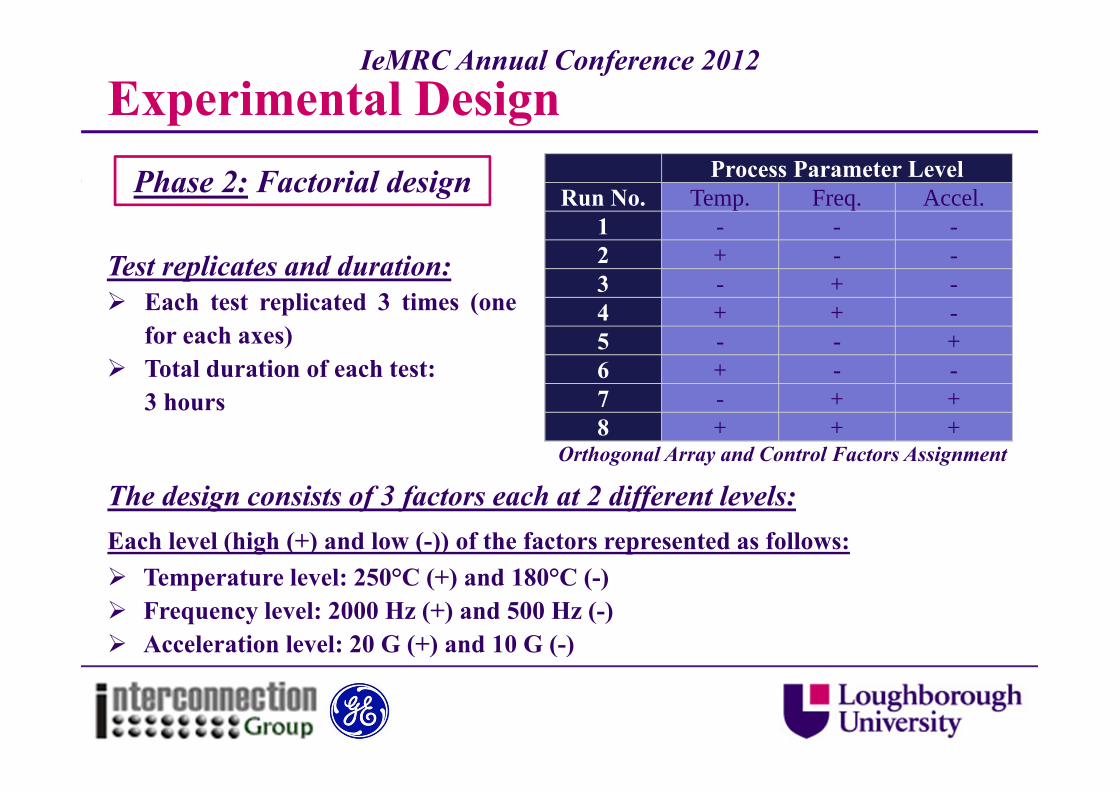
Run No. Temp. Freq. Accel.1 - - -2 + - -3 - + -4 + + -5 - - +6 + - -7 - + +8 + + +
Orthogonal Array and Control Factors Assignment
The design consists of 3 factors each at 2 different levels:Each level (high (+) and low (-)) of the factors represented as follows: Temperature level: 250°C (+) and 180°C (-) Frequency level: 2000 Hz (+) and 500 Hz (-) Acceleration level: 20 G (+) and 10 G (-)
Test replicates and duration: Each test replicated 3 times (one
for each axes) Total duration of each test:
3 hours
IeMRC Annual Conference 2012
Phase 2: Factorial design
Experimental DesignIeMRC Annual Conference 2012
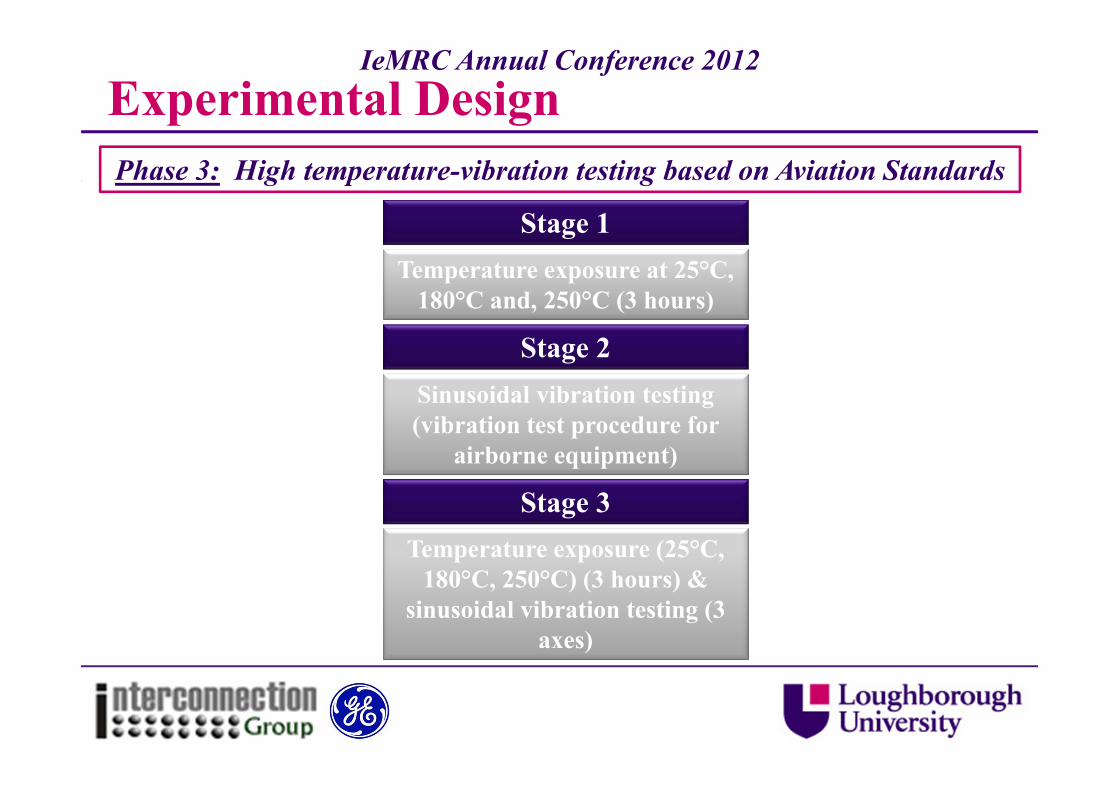
Phase 3: High temperature-vibration testing based on Aviation Standards
Stage 1
Stage 2
Stage 3
Temperature exposure at 25°C, 180°C and, 250°C (3 hours)
Sinusoidal vibration testing (vibration test procedure for
airborne equipment)
Temperature exposure (25°C, 180°C, 250°C) (3 hours) &
sinusoidal vibration testing (3 axes)
Electrical Characterization
1010.5
1111.5
1212.5
1313.5
1414.5
1515.5
1616.5
1717.5
1818.5
1919.5
20
0 1 2 3 4 5 6 7 8 9 10 11 12 13 14 15 16 17 18 19 20 21 22 23 24
Res
ista
nce
(mΩ
)
Sample No.
Before Testing After testing
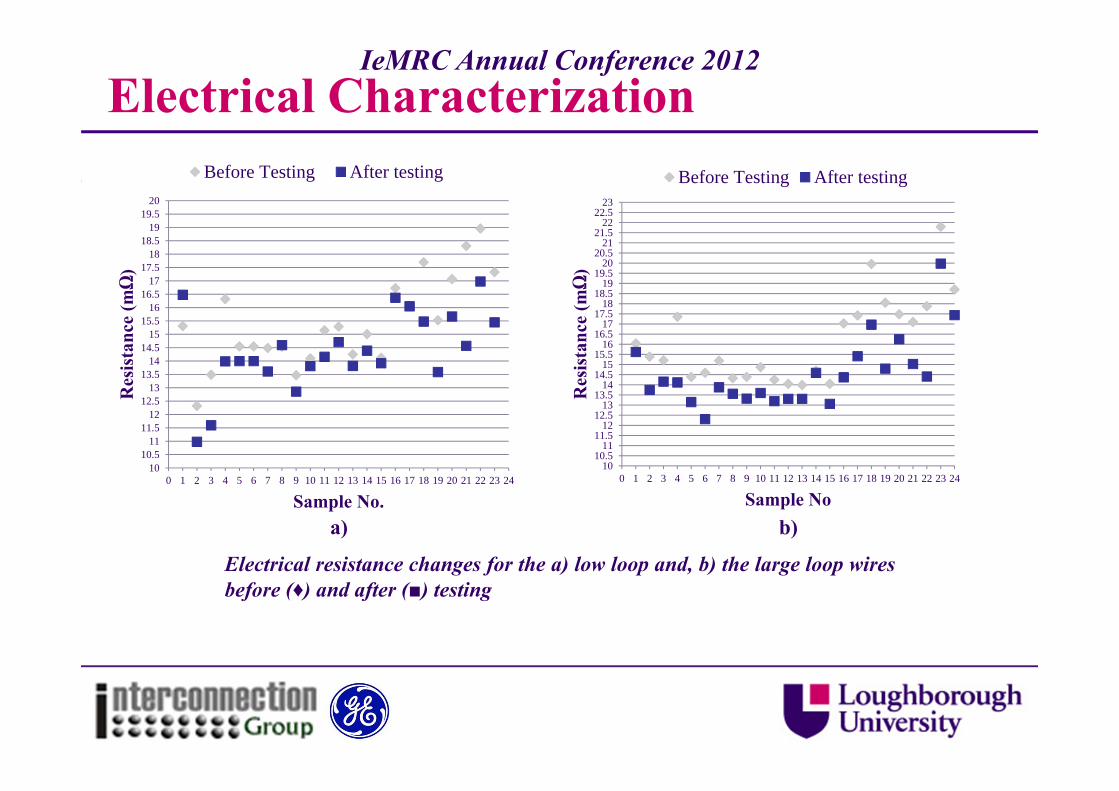
Electrical resistance changes for the a) low loop and, b) the large loop wiresbefore (♦) and after () testing
1010.5
1111.5
1212.5
1313.5
1414.5
1515.5
1616.5
1717.5
1818.5
1919.5
2020.5
2121.5
2222.5
23
0 1 2 3 4 5 6 7 8 9 10 11 12 13 14 15 16 17 18 19 20 21 22 23 24
Res
ista
nce
(mΩ
)
Sample No
Before Testing After testing
a) b)
IeMRC Annual Conference 2012
Bond Strength
Wire Orientation on the Vibration
System
Ball Bond Shear
Failure Load, grms
120°C500Hz10grms
250°C 500Hz10grms
120°C2000Hz10grms
250°C2000Hz10grms
120°C500Hz20grms
250°C500Hz20grms
120°C2000Hz20grms
250°C2000Hz20grms
YMean 48.73 32.03 49.61 42.50 49.25 37.28 50.46 50.85
SD 8.63 3.00 10.92 9.87 12.50 15.82 8.32 16.78
XMean 50.26 30.13 56.92 44.29 47.07 28.72 51.06 44.48
SD 8.08 3.07 2.54 13.74 12.45 6.13 8.78 15.78
ZMean 43.61 41.92 54.55 40.49 58.16 32.97 53.39 44.53
SD 11.35 9.36 4.66 10.80 2.34 9.38 4.06 14.36
All bondsMean 47.38 34.98 53.73 42.35 51.76 32.99 51.70 46.54
SD 9.62 7.96 7.30 11.17 10.84 11.20 7.06 15.25
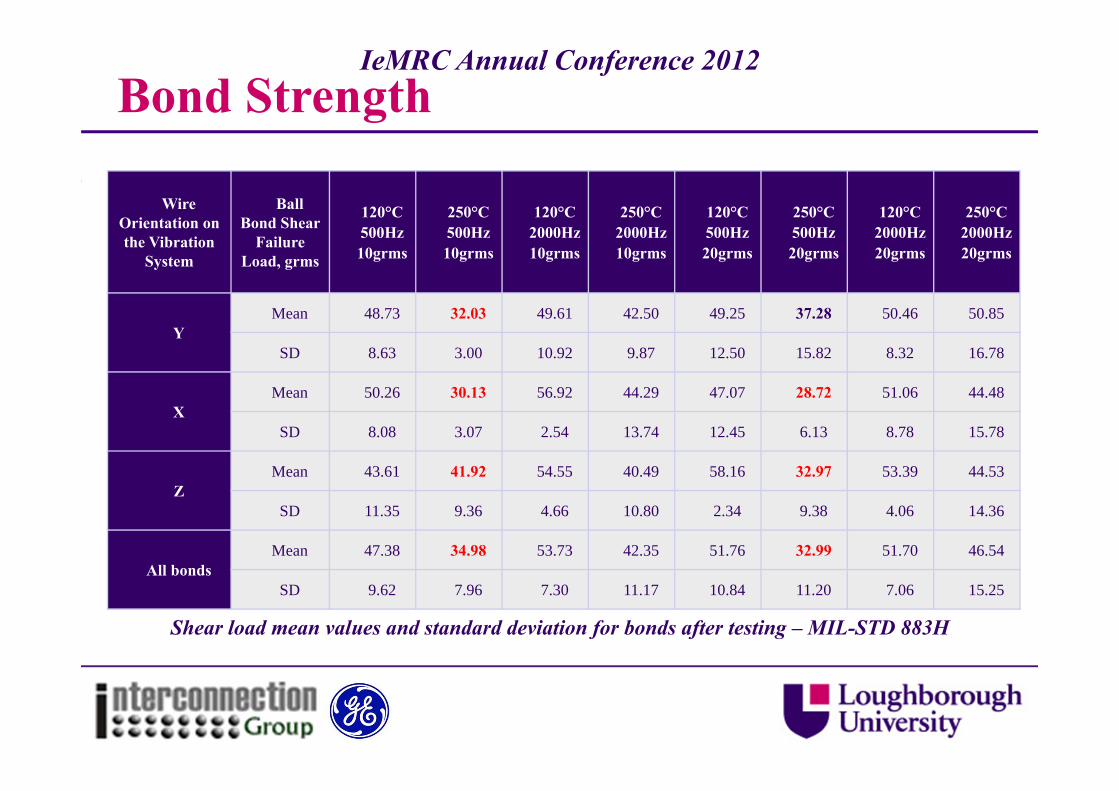
Shear load mean values and standard deviation for bonds after testing – MIL-STD 883H
IeMRC Annual Conference 2012
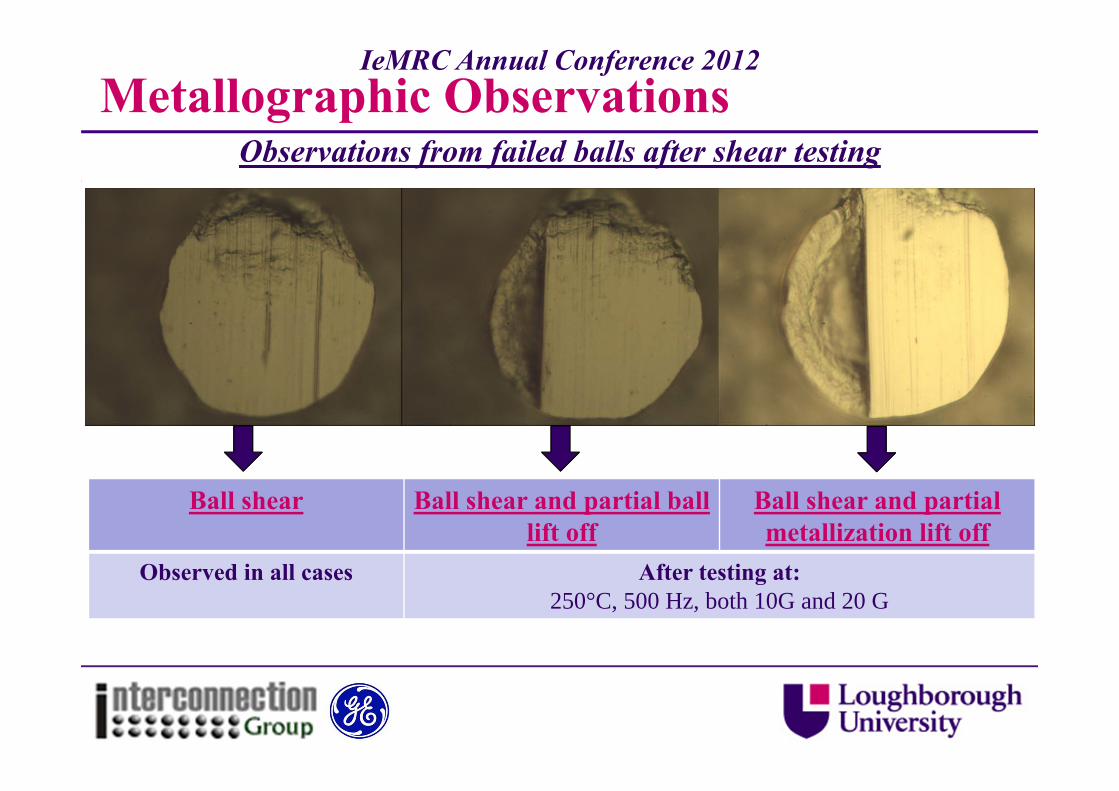
Metallographic ObservationsObservations from failed balls after shear testing
IeMRC Annual Conference 2012
Ball shear Ball shear and partial ball lift off
Ball shear and partial metallization lift off
Observed in all cases After testing at:250°C, 500 Hz, both 10G and 20 G
Metallographic ObservationsIeMRC Annual Conference 2012
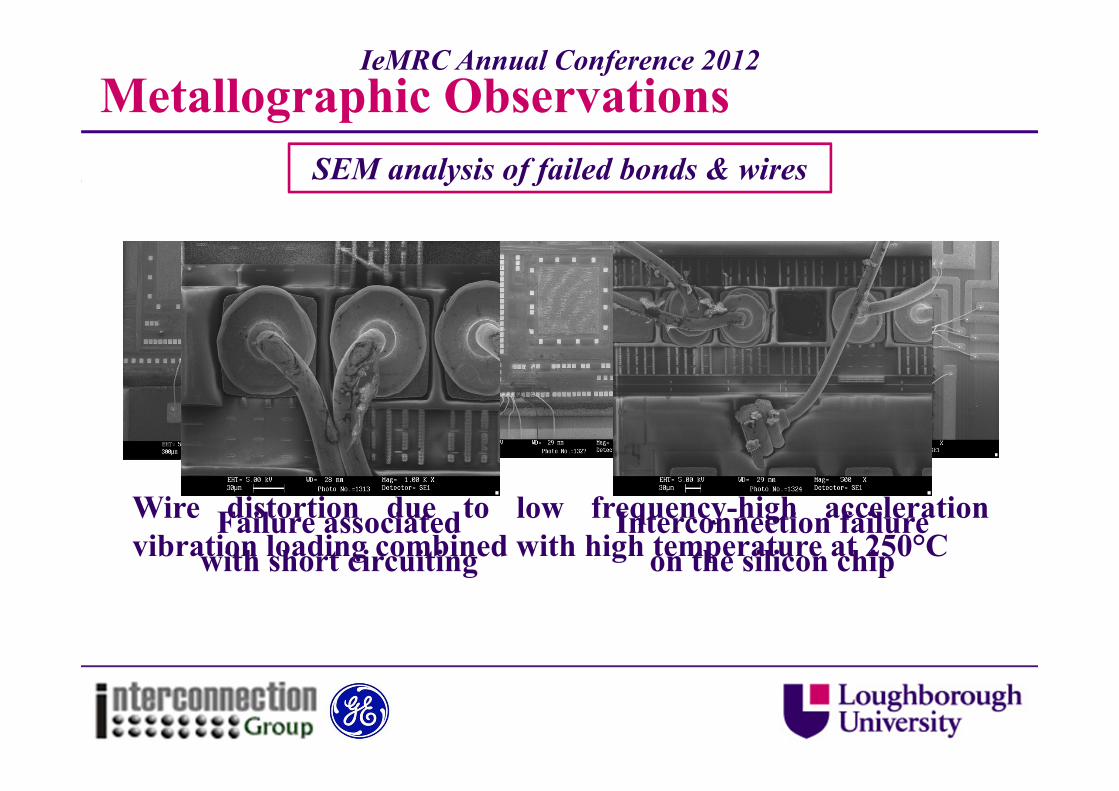
Failure associatedwith short circuiting
Interconnection failureon the silicon chip
SEM analysis of failed bonds & wires
Wire distortion due to low frequency-high accelerationvibration loading combined with high temperature at 250°C
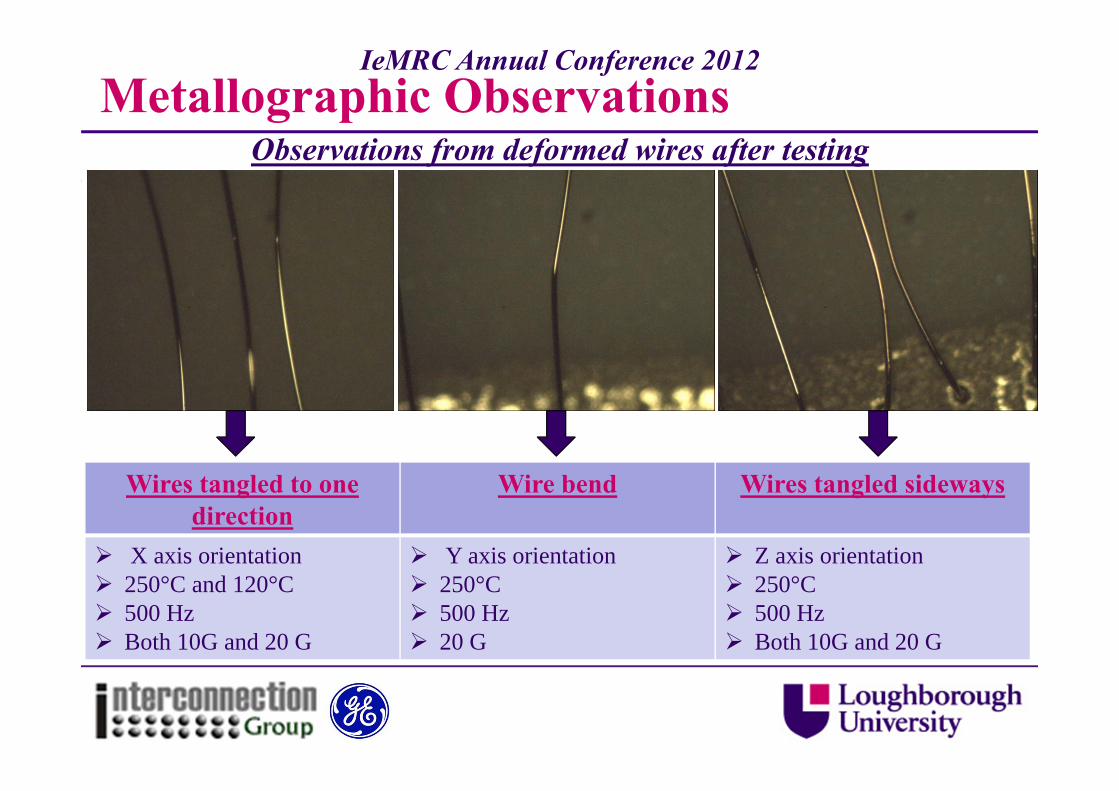
Metallographic ObservationsObservations from deformed wires after testing
IeMRC Annual Conference 2012
Wires tangled to one direction
Wire bend Wires tangled sideways
X axis orientation 250°C and 120°C 500 Hz Both 10G and 20 G
Y axis orientation 250°C 500 Hz 20 G
Z axis orientation 250°C 500 Hz Both 10G and 20 G
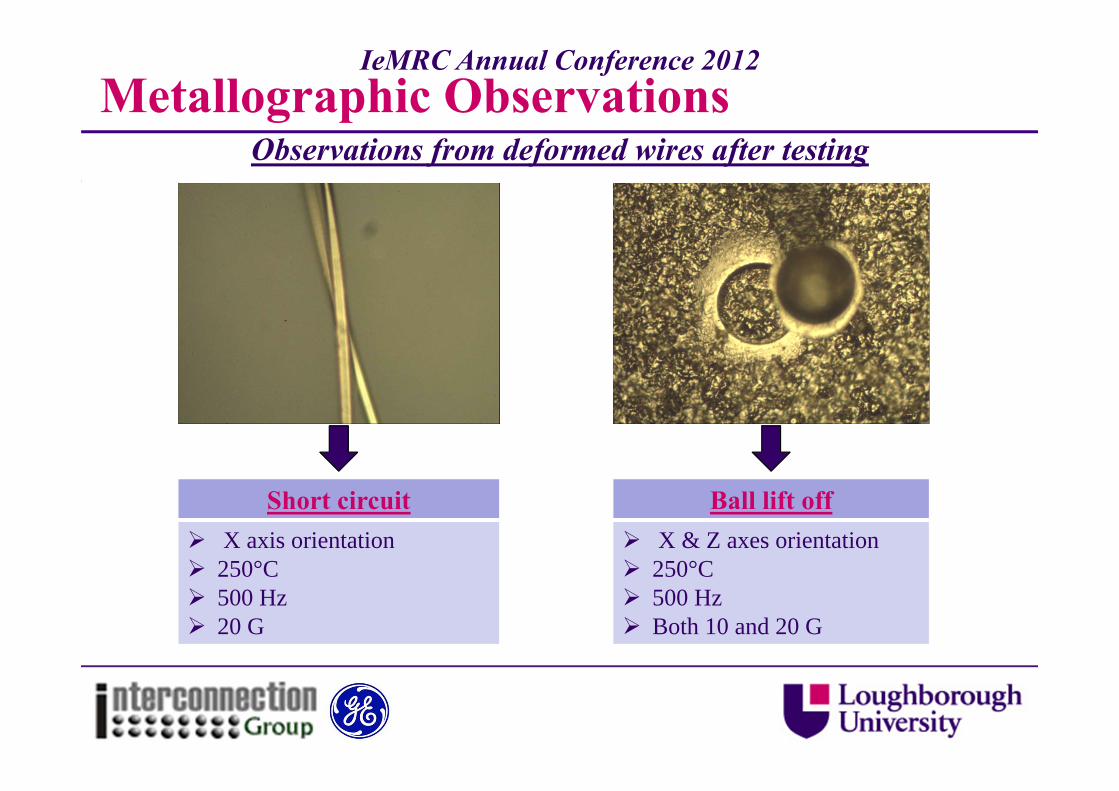
Metallographic ObservationsObservations from deformed wires after testing
IeMRC Annual Conference 2012
Short circuit X axis orientation 250°C 500 Hz 20 G
Ball lift off X & Z axes orientation 250°C 500 Hz Both 10 and 20 G
ConclusionsThe findings of this study on Au ball bonded devices include:
An appreciable decrease in the electrical resistance after testingwhich could be attributed to annealing of the wire.
The shear force to failure of the ball bonds is reduced aftertesting particularly at higher temperature and low frequencyvibration.
Distortion of the larger wire loops is more severe when testing atlow frequencies.
The effect of wire orientation in respect to the direction of thevibration should be considered when vibration is involved in thetesting regime.
IeMRC Annual Conference 2012
Conclusions Further tests are planned to extend the vibration/temperature
regime and also to examine the effect on wire bond pullstrengths, where annealing of the wire above the ball bondmay result in changes in performance under combinedvibration/temperature conditions.
On real devices, the combined vibration/temperature exposureneeds to be extended to generate end of life failure modes,where changes in electrical characteristics can be measuredand failure analysis undertaken.
IeMRC Annual Conference 2012
Acknowledgements
GE Aviation Systems (Newmarket, UK) for providingthe testing samples and valuable technical guidance.
Inseto Limited (Andover, UK) for technical supportand guidance through the wire bonding process.
MTC (Ansty Park, Coventry, UK) for providing thefacilities and assistance for the shear & pull testing.
IeMRC Annual Conference 2012
Thank youAny Questions?
IeMRC Annual Conference 2012