Embed Size (px)
Citation preview
This sample shows the integration of WISC-IV and WIAT-II for customers with the WIAT-II
Scoring Assistant.
Please contact Customer Care if you would like to order the WIAT-II Scoring Assistant.
Copyright © 2003 by The Psychological Corporation, a Harcourt Assessment Company. All rights reserved. Printed in the United States of America.
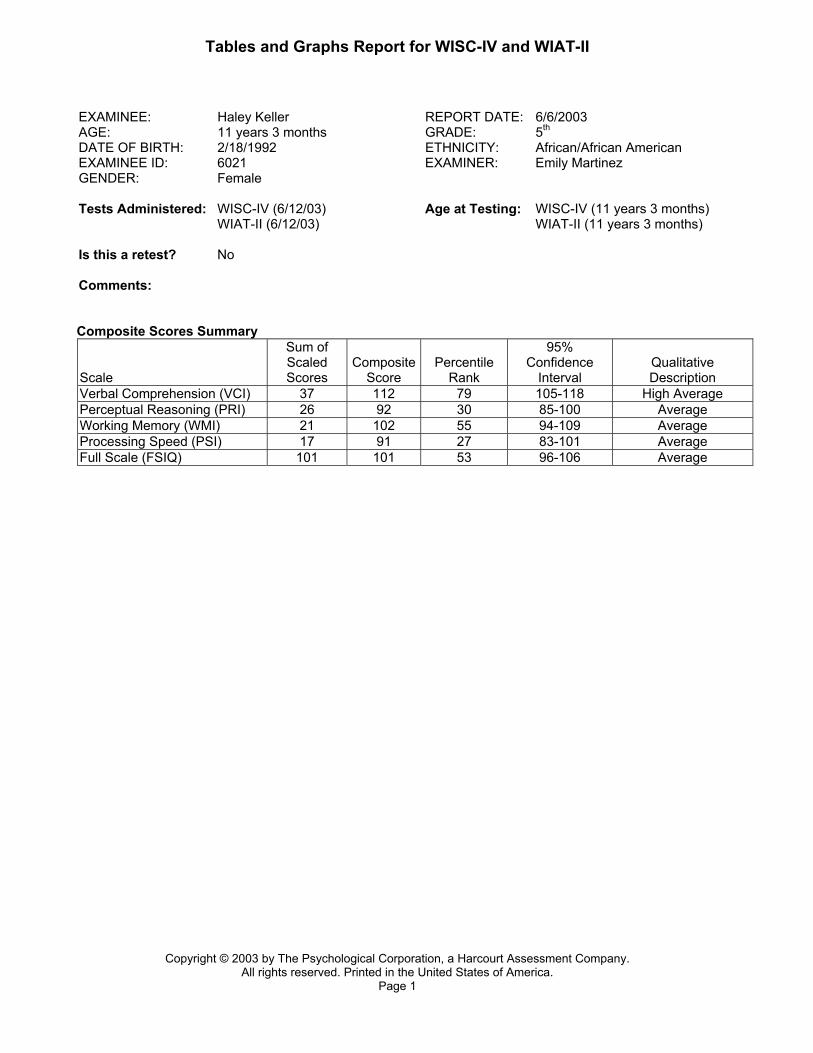
Tables and Graphs Report for WISC-IV and WIAT-II EXAMINEE: Haley Keller REPORT DATE: 6/6/2003 AGE: 11 years 3 months GRADE: 5th DATE OF BIRTH: 2/18/1992 ETHNICITY: African/African American EXAMINEE ID: 6021 EXAMINER: Emily Martinez GENDER: Female Tests Administered: WISC-IV (6/12/03)
WIAT-II (6/12/03) Age at Testing: WISC-IV (11 years 3 months)
WIAT-II (11 years 3 months) Is this a retest? No Comments:
Composite Scores Summary Scale
Sum of Scaled Scores
Composite
Score
Percentile
Rank
95% Confidence
Interval
Qualitative Description
Verbal Comprehension (VCI) 37 112 79 105-118 High Average Perceptual Reasoning (PRI) 26 92 30 85-100 Average Working Memory (WMI) 21 102 55 94-109 Average Processing Speed (PSI) 17 91 27 83-101 Average Full Scale (FSIQ) 101 101 53 96-106 Average
Copyright © 2003 by The Psychological Corporation, a Harcourt Assessment Company. All rights reserved. Printed in the United States of America.
Page 1
Tables and Graphs Report for WISC-IV and WIAT-II
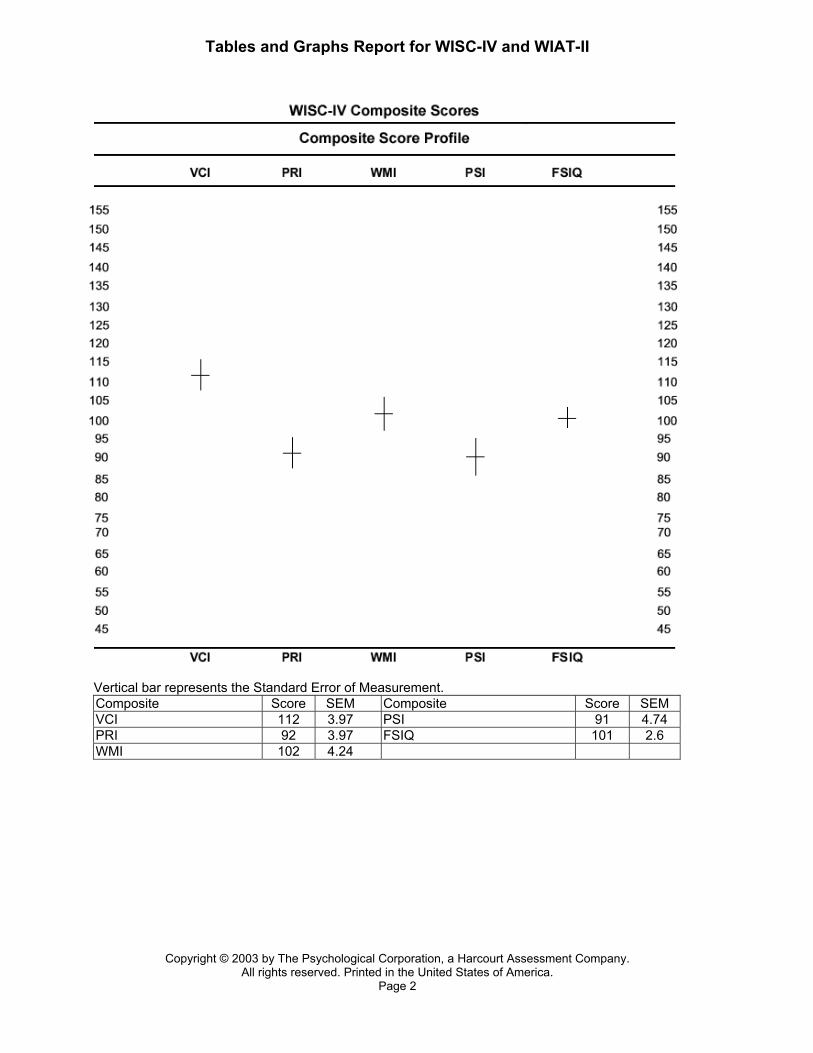
Vertical bar represents the Standard Error of Measurement. Composite Score SEM Composite Score SEM VCI 112 3.97 PSI 91 4.74 PRI 92 3.97 FSIQ 101 2.6 WMI 102 4.24
Copyright © 2003 by The Psychological Corporation, a Harcourt Assessment Company. All rights reserved. Printed in the United States of America.
Page 2
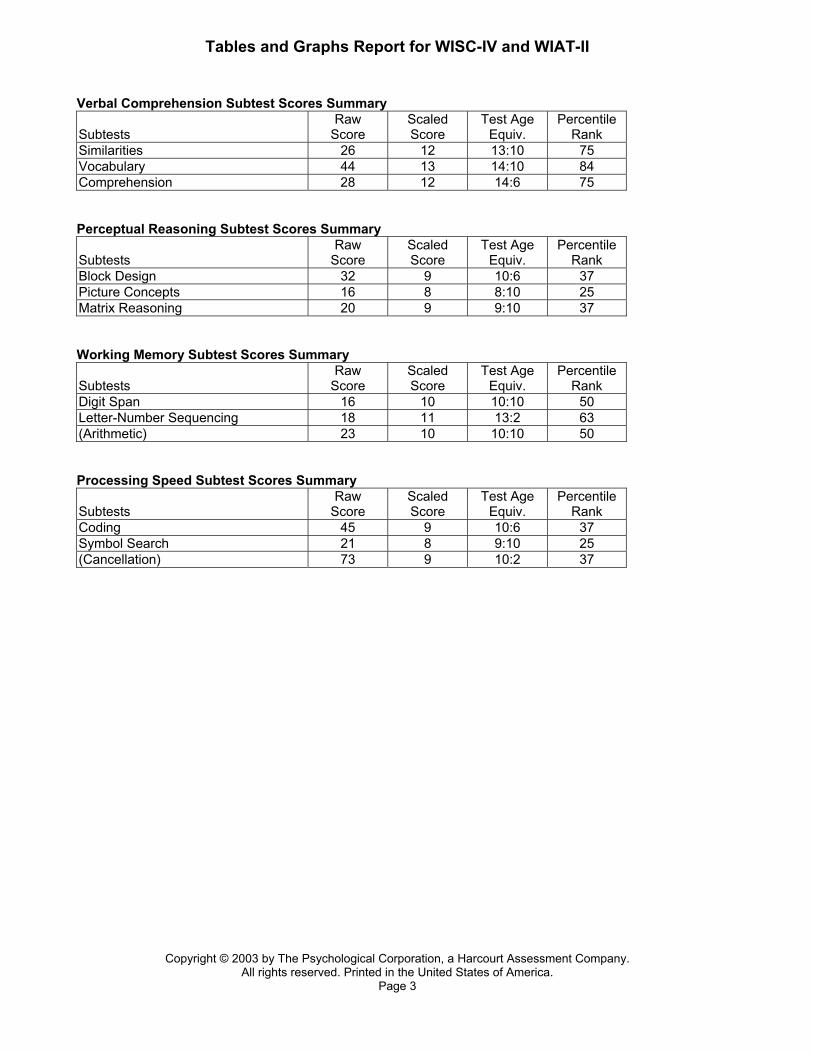
Tables and Graphs Report for WISC-IV and WIAT-II Verbal Comprehension Subtest Scores Summary Subtests
Raw Score
Scaled Score
Test Age Equiv.
Percentile Rank
Similarities 26 12 13:10 75 Vocabulary 44 13 14:10 84 Comprehension 28 12 14:6 75 Perceptual Reasoning Subtest Scores Summary Subtests
Raw Score
Scaled Score
Test Age Equiv.
Percentile Rank
Block Design 32 9 10:6 37 Picture Concepts 16 8 8:10 25 Matrix Reasoning 20 9 9:10 37 Working Memory Subtest Scores Summary Subtests
Raw Score
Scaled Score
Test Age Equiv.
Percentile Rank
Digit Span 16 10 10:10 50 Letter-Number Sequencing 18 11 13:2 63 (Arithmetic) 23 10 10:10 50 Processing Speed Subtest Scores Summary Subtests
Raw Score
Scaled Score
Test Age Equiv.
Percentile Rank
Coding 45 9 10:6 37 Symbol Search 21 8 9:10 25 (Cancellation) 73 9 10:2 37
Copyright © 2003 by The Psychological Corporation, a Harcourt Assessment Company. All rights reserved. Printed in the United States of America.
Page 3
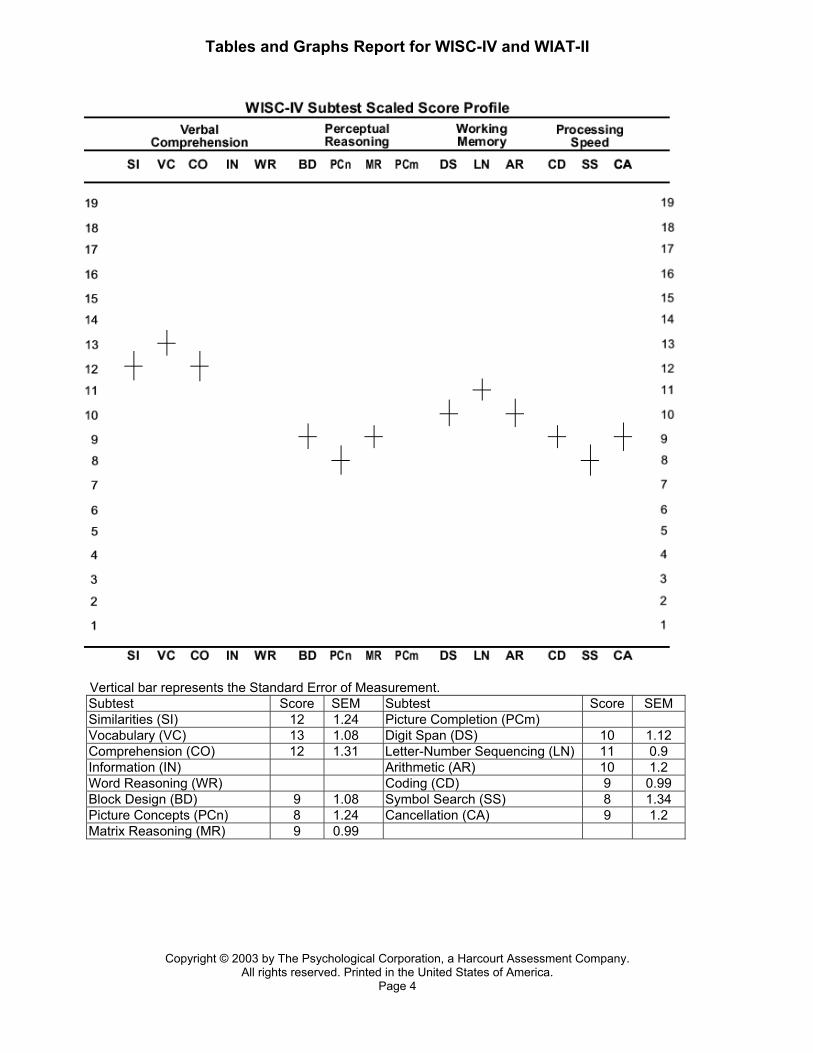
Tables and Graphs Report for WISC-IV and WIAT-II
Vertical bar represents the Standard Error of Measurement. Subtest Score SEM Subtest Score SEM Similarities (SI) 12 1.24 Picture Completion (PCm) Vocabulary (VC) 13 1.08 Digit Span (DS) 10 1.12 Comprehension (CO) 12 1.31 Letter-Number Sequencing (LN) 11 0.9 Information (IN) Arithmetic (AR) 10 1.2 Word Reasoning (WR) Coding (CD) 9 0.99 Block Design (BD) 9 1.08 Symbol Search (SS) 8 1.34 Picture Concepts (PCn) 8 1.24 Cancellation (CA) 9 1.2 Matrix Reasoning (MR) 9 0.99
Copyright © 2003 by The Psychological Corporation, a Harcourt Assessment Company. All rights reserved. Printed in the United States of America.
Page 4
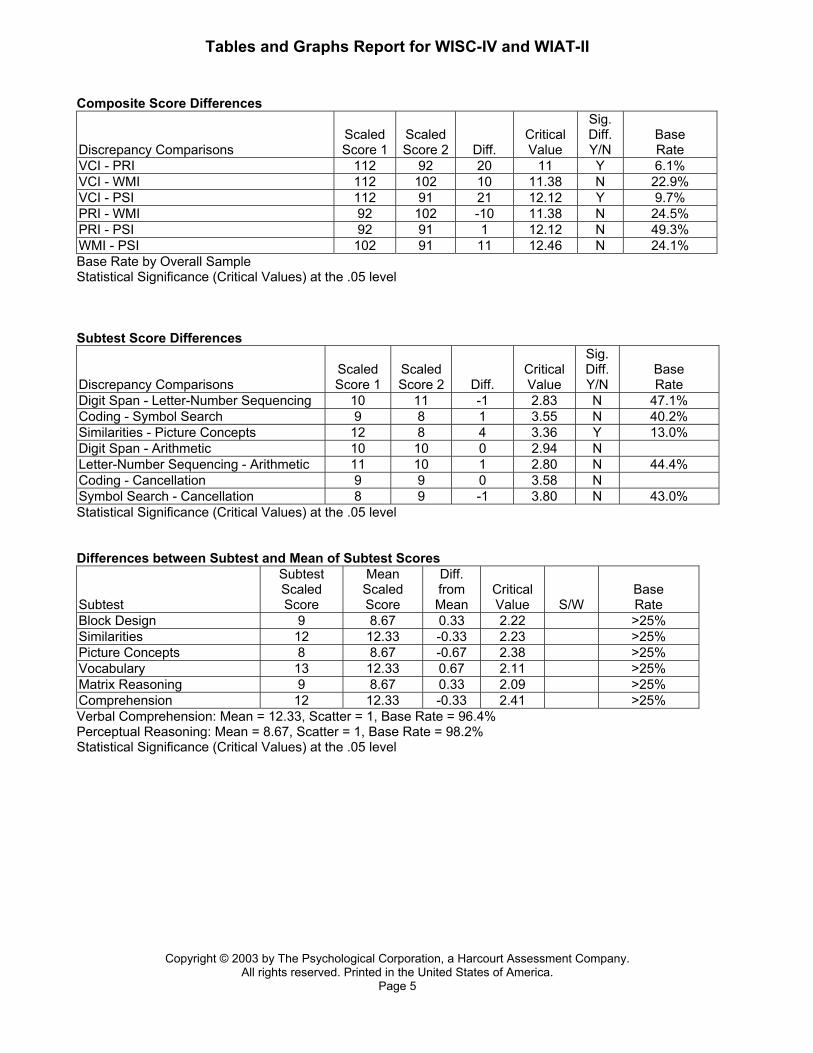
Tables and Graphs Report for WISC-IV and WIAT-II Composite Score Differences Discrepancy Comparisons
Scaled Score 1
Scaled Score 2
Diff.
Critical Value
Sig. Diff. Y/N
Base Rate
VCI - PRI 112 92 20 11 Y 6.1% VCI - WMI 112 102 10 11.38 N 22.9% VCI - PSI 112 91 21 12.12 Y 9.7% PRI - WMI 92 102 -10 11.38 N 24.5% PRI - PSI 92 91 1 12.12 N 49.3% WMI - PSI 102 91 11 12.46 N 24.1% Base Rate by Overall Sample Statistical Significance (Critical Values) at the .05 level Subtest Score Differences Discrepancy Comparisons
Scaled Score 1
Scaled Score 2
Diff.
Critical Value
Sig. Diff. Y/N
Base Rate
Digit Span - Letter-Number Sequencing 10 11 -1 2.83 N 47.1% Coding - Symbol Search 9 8 1 3.55 N 40.2% Similarities - Picture Concepts 12 8 4 3.36 Y 13.0% Digit Span - Arithmetic 10 10 0 2.94 N Letter-Number Sequencing - Arithmetic 11 10 1 2.80 N 44.4% Coding - Cancellation 9 9 0 3.58 N Symbol Search - Cancellation 8 9 -1 3.80 N 43.0% Statistical Significance (Critical Values) at the .05 level Differences between Subtest and Mean of Subtest Scores Subtest
Subtest Scaled Score
Mean Scaled Score
Diff. from Mean
Critical Value
S/W
Base Rate
Block Design 9 8.67 0.33 2.22 >25% Similarities 12 12.33 -0.33 2.23 >25% Picture Concepts 8 8.67 -0.67 2.38 >25% Vocabulary 13 12.33 0.67 2.11 >25% Matrix Reasoning 9 8.67 0.33 2.09 >25% Comprehension 12 12.33 -0.33 2.41 >25% Verbal Comprehension: Mean = 12.33, Scatter = 1, Base Rate = 96.4% Perceptual Reasoning: Mean = 8.67, Scatter = 1, Base Rate = 98.2% Statistical Significance (Critical Values) at the .05 level
Copyright © 2003 by The Psychological Corporation, a Harcourt Assessment Company. All rights reserved. Printed in the United States of America.
Page 5
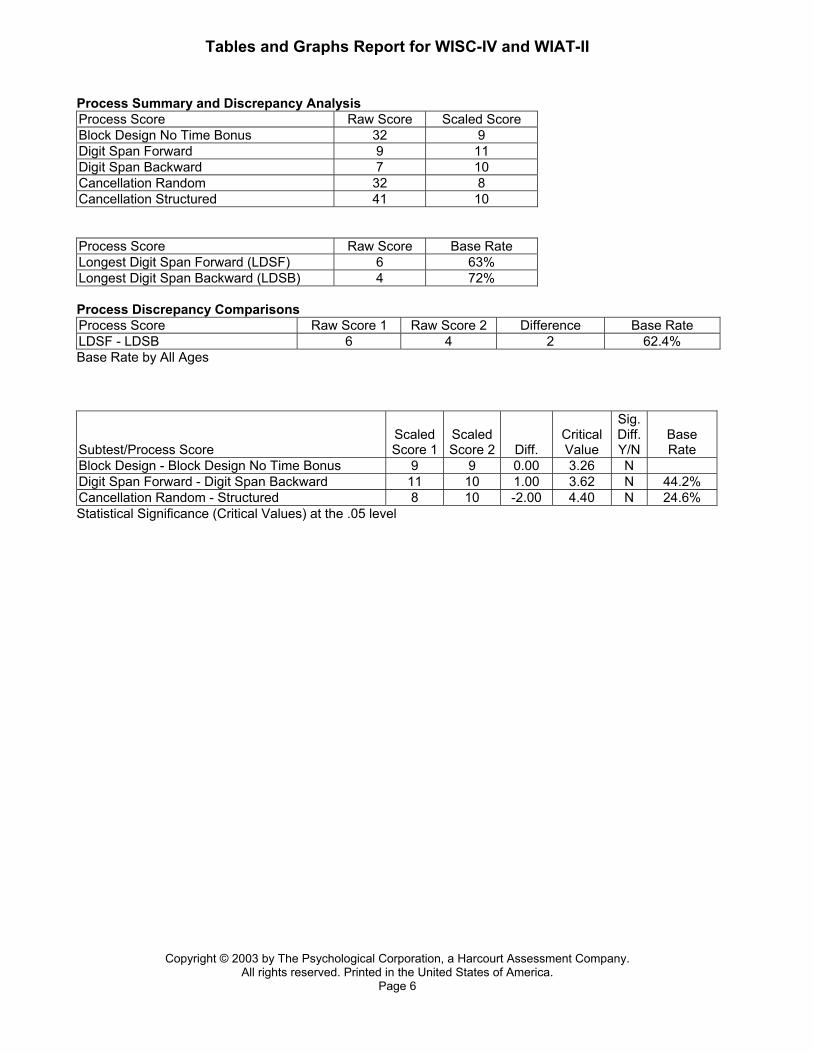
Tables and Graphs Report for WISC-IV and WIAT-II Process Summary and Discrepancy Analysis Process Score Raw Score Scaled Score Block Design No Time Bonus 32 9 Digit Span Forward 9 11 Digit Span Backward 7 10 Cancellation Random 32 8 Cancellation Structured 41 10 Process Score Raw Score Base Rate Longest Digit Span Forward (LDSF) 6 63% Longest Digit Span Backward (LDSB) 4 72% Process Discrepancy Comparisons Process Score Raw Score 1 Raw Score 2 Difference Base Rate LDSF - LDSB 6 4 2 62.4% Base Rate by All Ages Subtest/Process Score
Scaled Score 1
Scaled Score 2
Diff.
Critical Value
Sig. Diff. Y/N
Base Rate
Block Design - Block Design No Time Bonus 9 9 0.00 3.26 N Digit Span Forward - Digit Span Backward 11 10 1.00 3.62 N 44.2% Cancellation Random - Structured 8 10 -2.00 4.40 N 24.6% Statistical Significance (Critical Values) at the .05 level
Copyright © 2003 by The Psychological Corporation, a Harcourt Assessment Company. All rights reserved. Printed in the United States of America.
Page 6
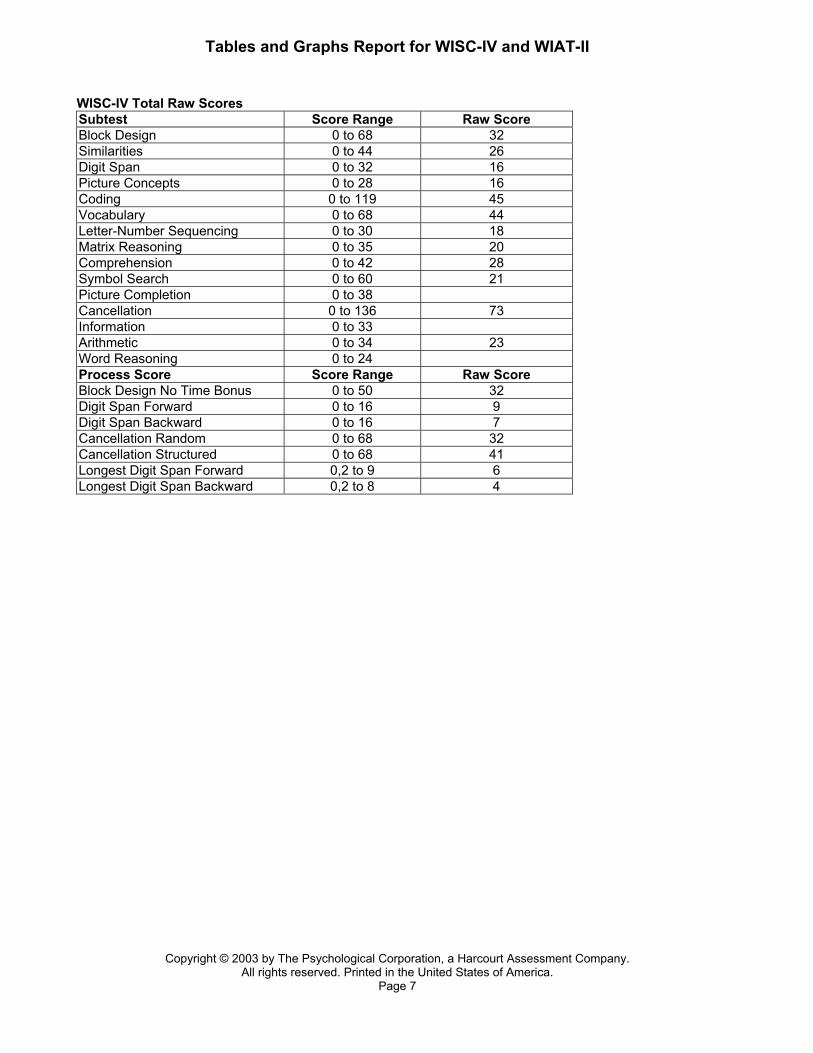
Tables and Graphs Report for WISC-IV and WIAT-II WISC-IV Total Raw Scores Subtest Score Range Raw Score Block Design 0 to 68 32 Similarities 0 to 44 26 Digit Span 0 to 32 16 Picture Concepts 0 to 28 16 Coding 0 to 119 45 Vocabulary 0 to 68 44 Letter-Number Sequencing 0 to 30 18 Matrix Reasoning 0 to 35 20 Comprehension 0 to 42 28 Symbol Search 0 to 60 21 Picture Completion 0 to 38 Cancellation 0 to 136 73 Information 0 to 33 Arithmetic 0 to 34 23 Word Reasoning 0 to 24 Process Score Score Range Raw Score Block Design No Time Bonus 0 to 50 32 Digit Span Forward 0 to 16 9 Digit Span Backward 0 to 16 7 Cancellation Random 0 to 68 32 Cancellation Structured 0 to 68 41 Longest Digit Span Forward 0,2 to 9 6 Longest Digit Span Backward 0,2 to 8 4
Copyright © 2003 by The Psychological Corporation, a Harcourt Assessment Company. All rights reserved. Printed in the United States of America.
Page 7
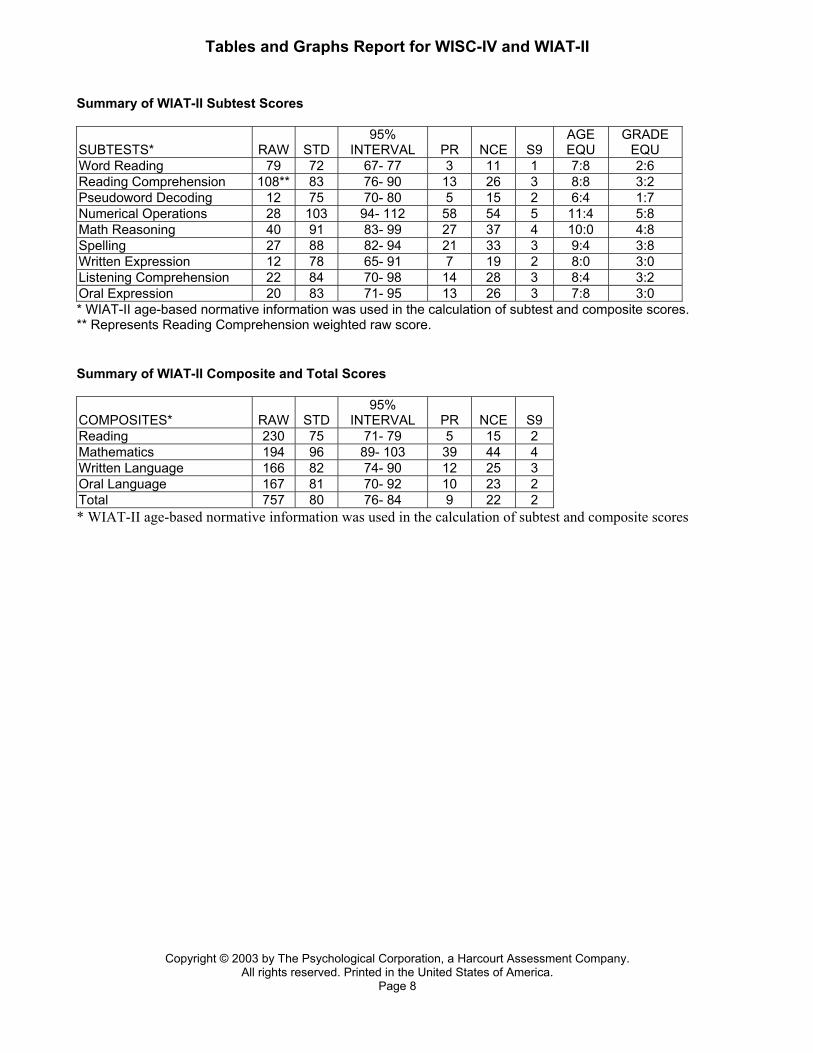
Tables and Graphs Report for WISC-IV and WIAT-II Summary of WIAT-II Subtest Scores SUBTESTS*
RAW
STD
95% INTERVAL
PR
NCE
S9
AGE EQU
GRADE EQU
Word Reading 79 72 67- 77 3 11 1 7:8 2:6 Reading Comprehension 108** 83 76- 90 13 26 3 8:8 3:2 Pseudoword Decoding 12 75 70- 80 5 15 2 6:4 1:7 Numerical Operations 28 103 94- 112 58 54 5 11:4 5:8 Math Reasoning 40 91 83- 99 27 37 4 10:0 4:8 Spelling 27 88 82- 94 21 33 3 9:4 3:8 Written Expression 12 78 65- 91 7 19 2 8:0 3:0 Listening Comprehension 22 84 70- 98 14 28 3 8:4 3:2 Oral Expression 20 83 71- 95 13 26 3 7:8 3:0 * WIAT-II age-based normative information was used in the calculation of subtest and composite scores. ** Represents Reading Comprehension weighted raw score. Summary of WIAT-II Composite and Total Scores COMPOSITES*
RAW
STD
95% INTERVAL
PR
NCE
S9
Reading 230 75 71- 79 5 15 2 Mathematics 194 96 89- 103 39 44 4 Written Language 166 82 74- 90 12 25 3 Oral Language 167 81 70- 92 10 23 2 Total 757 80 76- 84 9 22 2 * WIAT-II age-based normative information was used in the calculation of subtest and composite scores
Copyright © 2003 by The Psychological Corporation, a Harcourt Assessment Company. All rights reserved. Printed in the United States of America.
Page 8
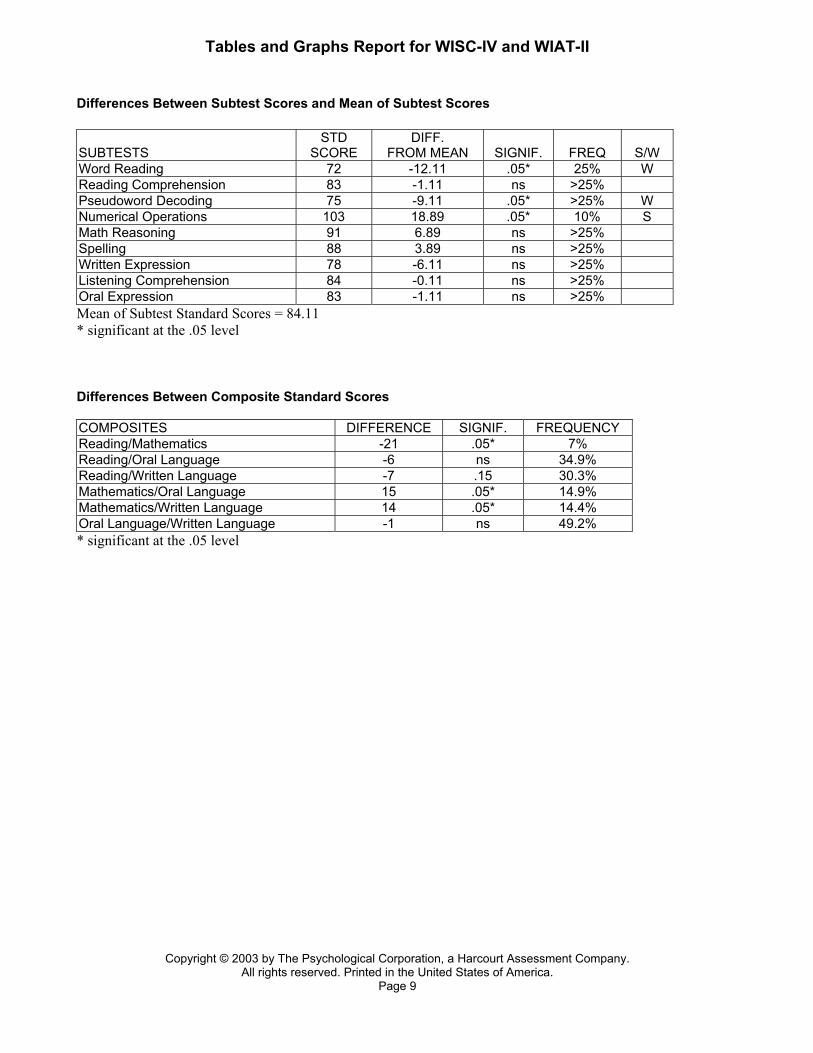
Tables and Graphs Report for WISC-IV and WIAT-II Differences Between Subtest Scores and Mean of Subtest Scores SUBTESTS
STD SCORE
DIFF. FROM MEAN
SIGNIF.
FREQ
S/W
Word Reading 72 -12.11 .05* 25% W Reading Comprehension 83 -1.11 ns >25% Pseudoword Decoding 75 -9.11 .05* >25% W Numerical Operations 103 18.89 .05* 10% S Math Reasoning 91 6.89 ns >25% Spelling 88 3.89 ns >25% Written Expression 78 -6.11 ns >25% Listening Comprehension 84 -0.11 ns >25% Oral Expression 83 -1.11 ns >25% Mean of Subtest Standard Scores = 84.11 * significant at the .05 level Differences Between Composite Standard Scores COMPOSITES DIFFERENCE SIGNIF. FREQUENCY Reading/Mathematics -21 .05* 7% Reading/Oral Language -6 ns 34.9% Reading/Written Language -7 .15 30.3% Mathematics/Oral Language 15 .05* 14.9% Mathematics/Written Language 14 .05* 14.4% Oral Language/Written Language -1 ns 49.2% * significant at the .05 level
Copyright © 2003 by The Psychological Corporation, a Harcourt Assessment Company. All rights reserved. Printed in the United States of America.
Page 9
Tables and Graphs Report for WISC-IV and WIAT-II
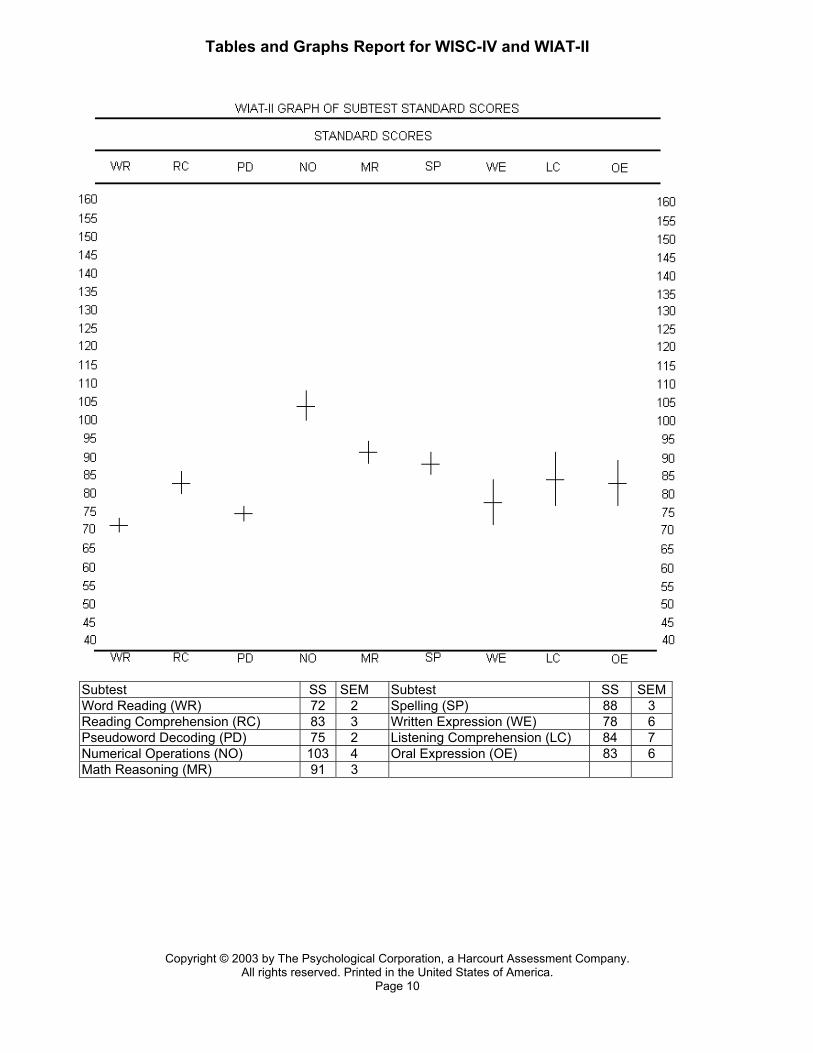
Subtest SS SEM Subtest SS SEMWord Reading (WR) 72 2 Spelling (SP) 88 3 Reading Comprehension (RC) 83 3 Written Expression (WE) 78 6 Pseudoword Decoding (PD) 75 2 Listening Comprehension (LC) 84 7 Numerical Operations (NO) 103 4 Oral Expression (OE) 83 6 Math Reasoning (MR) 91 3
Copyright © 2003 by The Psychological Corporation, a Harcourt Assessment Company. All rights reserved. Printed in the United States of America.
Page 10
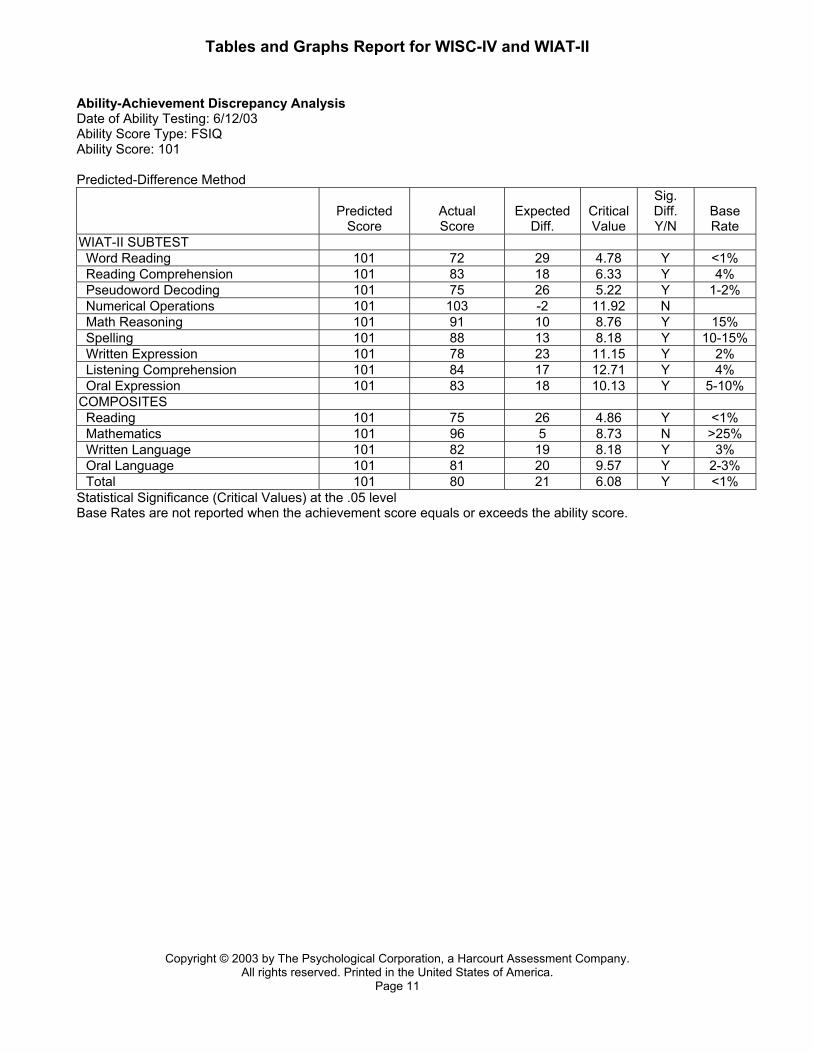
Tables and Graphs Report for WISC-IV and WIAT-II Ability-Achievement Discrepancy Analysis Date of Ability Testing: 6/12/03 Ability Score Type: FSIQ Ability Score: 101 Predicted-Difference Method
Predicted Score
Actual Score
Expected
Diff.
Critical Value
Sig. Diff. Y/N
Base Rate
WIAT-II SUBTEST Word Reading 101 72 29 4.78 Y <1% Reading Comprehension 101 83 18 6.33 Y 4% Pseudoword Decoding 101 75 26 5.22 Y 1-2% Numerical Operations 101 103 -2 11.92 N Math Reasoning 101 91 10 8.76 Y 15% Spelling 101 88 13 8.18 Y 10-15% Written Expression 101 78 23 11.15 Y 2% Listening Comprehension 101 84 17 12.71 Y 4% Oral Expression 101 83 18 10.13 Y 5-10% COMPOSITES Reading 101 75 26 4.86 Y <1% Mathematics 101 96 5 8.73 N >25% Written Language 101 82 19 8.18 Y 3% Oral Language 101 81 20 9.57 Y 2-3% Total 101 80 21 6.08 Y <1% Statistical Significance (Critical Values) at the .05 level Base Rates are not reported when the achievement score equals or exceeds the ability score.
Copyright © 2003 by The Psychological Corporation, a Harcourt Assessment Company. All rights reserved. Printed in the United States of America.
Page 11