Embed Size (px)
Citation preview

WISC-V UK Interpretive Considerations for Peter Perason (10/07/2019) Interpretive considerations provide additional information to assist you, the examiner, in interpretingPeter's performance. This section should not be provided to the parent or recipient of the report. Please review these interpretive considerations before reading the report, as they may suggest that youmake changes to the report settings in Q-global. If you make changes to the report settings, you canre-run the report without being charged. This file contains two full reports: first, the interpretive report, and second, the parent report. Be sure toseparate these reports before providing them to the appropriate recipients. Demographics Considerations The primary language field in the Demographics tab was not filled in. Please return to theDemographics tab and specify the examinee's primary language. The examinee's current grade in the Demographics tab was not specified. Unless the examinee is nolonger in school, this tab must be completed in order to accurately represent his school performance inthe report. Please return to the Demographics tab and specify the examinee's current grade. Recommendation Considerations Items listed in the 'Recommendations' section at the end of the report are meant to be an aid to you as aclinician, not a substitute for individualised recommendations that should be provided by a professionalwho is familiar with the examinee. Please read through the automatically generated recommendationscarefully and edit them according to the examinee's individual strengths and needs. The recommendation section entitled 'Recommendations for Verbal Comprehension Skills' wasincluded in the report because the examinee's VCI was a clear area of strength relative to others his ageand a personal strength relative to his overall cognitive ability. The recommendation section entitled 'Recommendations for Working Memory Skills' was included inthe report because the examinee's WMI was a clear area of weakness relative to others his age and apersonal weakness relative to his overall cognitive ability level. End of Interpretive Considerations
Copyright © 2015 by NCS Pearson, Inc. Adapted by permission. European adaptation copyright © 2016 Pearson Education Ltd. or itsaffiliate(s). All rights reserved.
Pearson, the PSI logo, PsychCorp, Wechsler, Wechsler Intelligence Scale for Children, and WISC are trademarks in the U.S. and/orother countries of Pearson Education, Inc., or its affiliate(s).
[ 1.3 / RE1 / QG1 ]
WISC®-VUK Wechsler Intelligence Scale for Children®-Fifth Edition: United Kingdom Interpretive Report
Comments:
Examinee Name Peter Perason Date of Report 10/07/2019
Examinee ID 123567 School Year
Date of Birth 23/02/2011 Primary Language
Gender Male Handedness
Race/Ethnicity Examiner Name E L
Date of Testing 10/07/2019 Age at Testing 8 years 4 months Retest? Yes
Copyright © 2015 by NCS Pearson, Inc. Adapted by permission. European adaptation copyright © 2016 Pearson Education Ltd. or itsaffiliate(s). All rights reserved.
Pearson, the PSI logo, PsychCorp, Wechsler, Wechsler Intelligence Scale for Children, and WISC are trademarks in the U.S. and/orother countries of Pearson Education, Inc., or its affiliate(s).
This report contains copyrighted material and trade secrets. The qualified licensee may excerpt portions of this output report, limited to theminimum text necessary to accurately describe their significant core conclusions, for incorporation into a written evaluation of the examinee, inaccordance with their profession's citation standards, if any. No adaptations, translations, modifications, or special versions may be made ofthis report without prior written permission from Pearson.
[ 1.3 / RE1 / QG1 ]
ABOUT WISC-V UK SCORES Peter was administered 16 subtests from the Wechsler Intelligence Scale for Children - Fifth UKEdition (WISC-VUK). The WISC-V is an individually administered, comprehensive clinical instrumentfor assessing the intelligence of children aged 6:0-16:11. The primary and secondary subtests are on ascaled score metric with a mean of 10 and a standard deviation (SD) of 3. These subtest scores rangefrom 1 to 19, with scores between 8 and 12 typically considered average. The primary subtest scorescontribute to the primary index scores, which represent intellectual functioning in five cognitive areas:Verbal Comprehension Index (VCI), Visual Spatial Index (VSI), Fluid Reasoning Index (FRI), WorkingMemory Index (WMI), and the Processing Speed Index (PSI). This assessment also produces a FullScale IQ (FSIQ) composite score that represents general intellectual ability. The primary index scoresand the FSIQ are on a standard score metric with a mean of 100 and an SD of 15. The primary indexscores range from 45 to 155; the FSIQ ranges from 40 to 160. For both the primary index scores and theFSIQ, scores ranging from 90 to 109 are typically considered average. Ancillary index scores are also provided. The ancillary index scores represent cognitive abilities usingdifferent primary and secondary subtest groupings than do the primary index scores. The ancillary indexscores are also on a standard score metric with a mean of 100 and an SD of 15. The QuantitativeReasoning Index (QRI) and Auditory Working Memory Index (AWMI) scores have a range of 45-155.The remaining three ancillary index scores have a range of 40-160: Nonverbal Index (NVI), GeneralAbility Index (GAI), and the Cognitive Proficiency Index (CPI). Scores ranging from 90 to 109 aretypically considered average. A percentile rank (PR) is provided for each reported composite and subtest score to show Peter'sstanding relative to other same-age children in the WISC-V normative sample. If the percentile rank forhis Verbal Comprehension Index score is 99, for example, it means that he performed as well as orbetter than approximately 99% of children his age. This appears in the report as PR = 99. The scores obtained on the WISC-V reflect Peter's true abilities combined with some degree ofmeasurement error. His true score is more accurately represented by a confidence interval (CI), which isa range of scores within which his true score is likely to fall. Composite scores are reported with 95%confidence intervals to ensure greater accuracy when interpreting test scores. For each composite scorereported for Peter, there is a 95% certainty that his true score falls within the listed range. It is common for children to exhibit score differences across areas of performance. Comparing the scoredifferences in relation to three separate benchmarks may yield a richer portrait of a child's strengths andweaknesses. The three types of score difference comparisons presented in this report use interpretivestatements that describe what can be generically understood as strengths or weaknesses. Because manyscore comparisons are possible within the WISC-V, attention to exactly what the scores are compared tois necessary to understand Peter's performance. The first type of comparison may be used to detect anormative strength or weakness, which occurs if a composite or subtest score differs from what istypical in the normative sample. For the purposes of this report, scores that fall above or below theAverage qualitative descriptor range suggest either a normative strength or a normative weakness. Thereport will include phrases such as 'very high for his age' or 'lower than most children his age' when thisoccurs. The second type of comparison may be used to examine score differences from an intrapersonalperspective. For this comparison, a score is described as a strength or weakness if a primary index or
WISC®-VUK Interpretive Report ID: 12356710/07/2019, Page 2 Peter Perason
subtest score differs from an indicator of overall performance (i.e., the mean of the primary index scores,the mean of the FSIQ subtest scores, the mean of the primary subtest scores, or the mean of the FSIQsubtest scores). Statistically significant differences are described with phrases such as 'personal strength'or 'personal weakness' or as one of the child's 'strongest or weakest areas of performance'. The third typeof comparison may be used to examine scores for a relative strength or weakness, which occurs if acomposite or subtest score differs in relation to another score of the same type (e.g., scaled, standard).When a scaled or standard score is compared with another scaled or standard score, the phrases 'relativestrength' and 'relative weakness' are used to describe statistically significant differences when comparingperformance on one score in relation to another. If the difference between two scores is statistically significant, it is listed in the report with a base rateto aid in interpretation. The statistical significance and base rate results provide different information. Astatistically significant difference suggests that the result is reliable and would likely be observed againif the assessment were repeated (i.e., the difference is not due to measurement error). The base rate (BR)provides a basis for estimating how common or rare a particular score difference was among otherchildren of similar ability in the WISC-V normative sample. For example, a base rate of <=2% isreported if the score for the the Verbal Comprehension Index is 28.80 points higher than the meanprimary index score (MIS). This appears on the report as VCI > MIS, BR = <=2%. This means that<=2% of children of similar ability level in the WISC-V normative sample obtained a difference of thismagnitude or greater between those two scores. In many cases, a statistically significant difference maybe accompanied by a base rate of greater than 15%, which indicates that the difference, while reliableand not due to measurement error, is relatively common among children. This result does not necessarilyreduce the importance of the difference, but does indicate a difference that large or larger is relativelycommon. It is possible for intellectual abilities to change over the course of childhood. Additionally, a child'sscores on the WISC-V can be influenced by motivation, attention, interests, and opportunities forlearning. All scores may be slightly higher or lower if Peter were tested again on a different day. It istherefore important to view these test scores as a snapshot of Peter's current level of intellectualfunctioning. When these scores are used as part of a comprehensive evaluation, they contribute to anunderstanding of his current strengths and any needs that can be addressed. INTERPRETATION OF WISC-V UK RESULTS FSIQ The FSIQ is derived from seven subtests and summarises ability across a diverse set of cognitivefunctions. This score is typically considered the most representative indicator of general intellectualfunctioning. Subtests are drawn from five areas of cognitive ability: verbal comprehension, visualspatial, fluid reasoning, working memory, and processing speed. Peter's FSIQ score is in the Averagerange when compared to other children his age (FSIQ = 107, PR = 68, CI = 101-112). Although theWISC-V measures various aspects of ability, a child's scores on this test can also be influenced by manyfactors that are not captured in this report. When interpreting this report, consider additional sources ofinformation that may not be reflected in the scores on this assessment. While the FSIQ provides a broadrepresentation of cognitive ability, describing Peter's domain-specific performance allows for a morethorough understanding of his functioning in distinct areas. Some children perform at approximately the
WISC®-VUK Interpretive Report ID: 12356710/07/2019, Page 3 Peter Perason
same level in all of these areas, but many others display areas of cognitive strengths and weaknesses. Verbal Comprehension The Verbal Comprehension Index (VCI) measured Peter's ability to access and apply acquired wordknowledge. Specifically, this score reflects his ability to verbalise meaningful concepts, think aboutverbal information, and express himself using words. Overall, Peter's performance on the VCI wasextremely strong for his age and emerged as a relative strength for Peter (VCI = 133, PR = 99,Extremely High range, CI = 122-138; VCI > MIS, BR = <=2%). High scores in this area indicate awell-developed verbal reasoning system with strong word knowledge acquisition, effective informationretrieval, good ability to reason and solve verbal problems, and effective communication of knowledge.Additionally, his performance on verbal comprehension tasks was particularly strong when compared tohis performance on tasks that involved processing and evaluating visual spatial information and usinglogic to solve problems (VCI > VSI, BR = 1.2%; VCI > FRI, BR = 1.1%). Peter's relative strength onlanguage-based subtests suggests that he may understand information more easily when it is presented ina verbal, rather than visual, format. His performance indicates a relative strength in using verbal stimuliin problem solving compared to visual spatial problem solving. His pattern of performance also impliesa strength in crystallised abilities relative to fluid reasoning abilities. Moreover, his performance onverbal comprehension tasks was stronger than his performance on tasks requiring him to mentallymanipulate information and work quickly and efficiently (VCI > WMI, BR = 0.4%; VCI > PSI, BR =4.5%). Although his working memory capacity is a personal weakness, it does not appear to beinterfering with his verbal comprehension. Peter's verbal comprehension ability is the strongest of hisskill set. With regard to individual subtests within the VCI, Similarities (SI) required Peter to describe asimilarity between two words that represent a common object or concept and Vocabulary (VC) requiredhim to name depicted objects and/or define words that were read aloud. He performed comparablyacross both subtests, suggesting that his abstract reasoning skills and word knowledge are similarlydeveloped at this time (SI = 16; VC = 16). His score on Vocabulary was extremely strong, suggestingthat he has a very strong ability to learn new words and clearly explain that knowledge. This was one ofhis strongest areas of performance when compared to his overall ability (VC = 16; VC > MSS-P, BR =<=2%). This represents a strength that can be built upon in his future development. Additionally, hisperformance on Similarities was exceptional for his age and was one of his highest scores (SI = 16; SI >MSS-P, BR = <=2%). This suggests that his verbal concept formation and abstract reasoning skills areareas of strength when compared to his overall level of ability. This represents a strength that can bebuilt upon in his future development. In addition to the two subtests that contribute to the VCI, two otherverbal comprehension subtests were administered to gain a more detailed understanding of Peter's verbalcomprehension abilities. For Information (IN), he answered questions about a broad range ofgeneral-knowledge topics. His performance was extremely strong for his age, suggesting exceptionalability to acquire, remember, and retrieve knowledge about the world around him (IN = 16). OnComprehension (CO), a subtest requiring him to answer questions based on his understanding of generalprinciples and social situations, Peter's performance was extremely strong for his age. This suggestsexceptional understanding of practical knowledge and ability to verbalise meaningful concepts (CO =16).
WISC®-VUK Interpretive Report ID: 12356710/07/2019, Page 4 Peter Perason
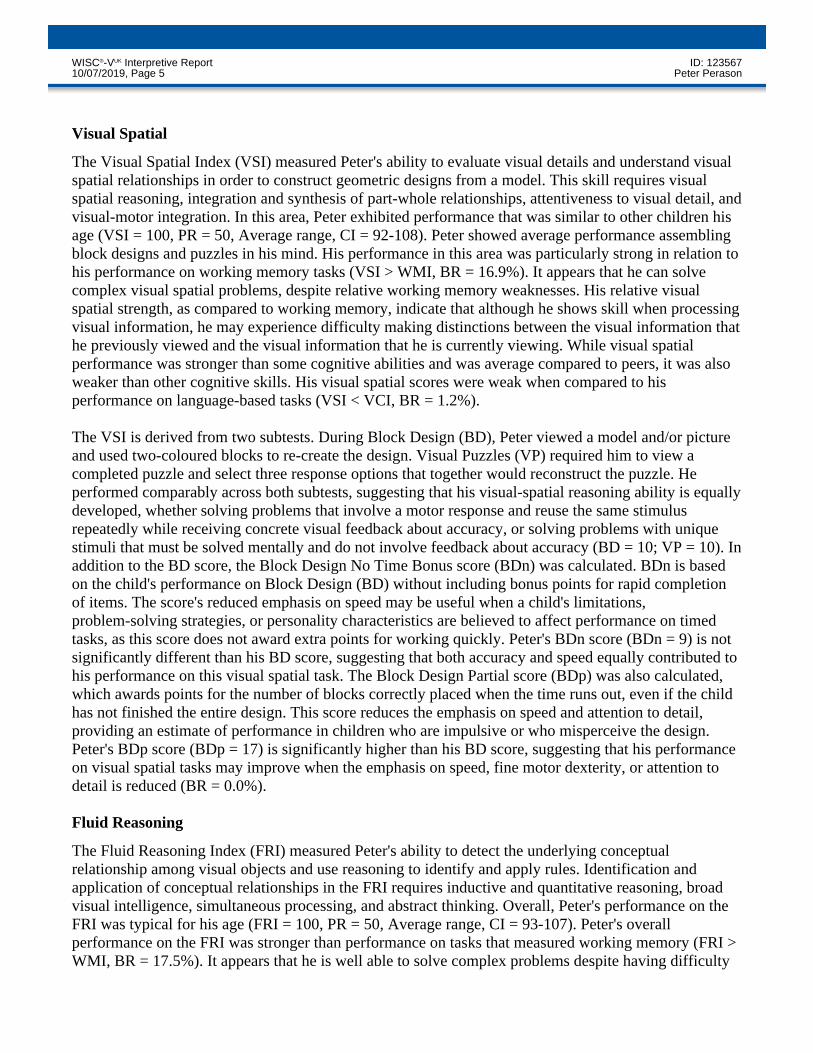
Visual Spatial The Visual Spatial Index (VSI) measured Peter's ability to evaluate visual details and understand visualspatial relationships in order to construct geometric designs from a model. This skill requires visualspatial reasoning, integration and synthesis of part-whole relationships, attentiveness to visual detail, andvisual-motor integration. In this area, Peter exhibited performance that was similar to other children hisage (VSI = 100, PR = 50, Average range, CI = 92-108). Peter showed average performance assemblingblock designs and puzzles in his mind. His performance in this area was particularly strong in relation tohis performance on working memory tasks (VSI > WMI, BR = 16.9%). It appears that he can solvecomplex visual spatial problems, despite relative working memory weaknesses. His relative visualspatial strength, as compared to working memory, indicate that although he shows skill when processingvisual information, he may experience difficulty making distinctions between the visual information thathe previously viewed and the visual information that he is currently viewing. While visual spatialperformance was stronger than some cognitive abilities and was average compared to peers, it was alsoweaker than other cognitive skills. His visual spatial scores were weak when compared to hisperformance on language-based tasks (VSI < VCI, BR = 1.2%). The VSI is derived from two subtests. During Block Design (BD), Peter viewed a model and/or pictureand used two-coloured blocks to re-create the design. Visual Puzzles (VP) required him to view acompleted puzzle and select three response options that together would reconstruct the puzzle. Heperformed comparably across both subtests, suggesting that his visual-spatial reasoning ability is equallydeveloped, whether solving problems that involve a motor response and reuse the same stimulusrepeatedly while receiving concrete visual feedback about accuracy, or solving problems with uniquestimuli that must be solved mentally and do not involve feedback about accuracy (BD = 10; VP = 10). Inaddition to the BD score, the Block Design No Time Bonus score (BDn) was calculated. BDn is basedon the child's performance on Block Design (BD) without including bonus points for rapid completionof items. The score's reduced emphasis on speed may be useful when a child's limitations,problem-solving strategies, or personality characteristics are believed to affect performance on timedtasks, as this score does not award extra points for working quickly. Peter's BDn score (BDn = 9) is notsignificantly different than his BD score, suggesting that both accuracy and speed equally contributed tohis performance on this visual spatial task. The Block Design Partial score (BDp) was also calculated,which awards points for the number of blocks correctly placed when the time runs out, even if the childhas not finished the entire design. This score reduces the emphasis on speed and attention to detail,providing an estimate of performance in children who are impulsive or who misperceive the design.Peter's BDp score (BDp = 17) is significantly higher than his BD score, suggesting that his performanceon visual spatial tasks may improve when the emphasis on speed, fine motor dexterity, or attention todetail is reduced (BR = 0.0%). Fluid Reasoning The Fluid Reasoning Index (FRI) measured Peter's ability to detect the underlying conceptualrelationship among visual objects and use reasoning to identify and apply rules. Identification andapplication of conceptual relationships in the FRI requires inductive and quantitative reasoning, broadvisual intelligence, simultaneous processing, and abstract thinking. Overall, Peter's performance on theFRI was typical for his age (FRI = 100, PR = 50, Average range, CI = 93-107). Peter's overallperformance on the FRI was stronger than performance on tasks that measured working memory (FRI >WMI, BR = 17.5%). It appears that he is well able to solve complex problems despite having difficulty
WISC®-VUK Interpretive Report ID: 12356710/07/2019, Page 5 Peter Perason
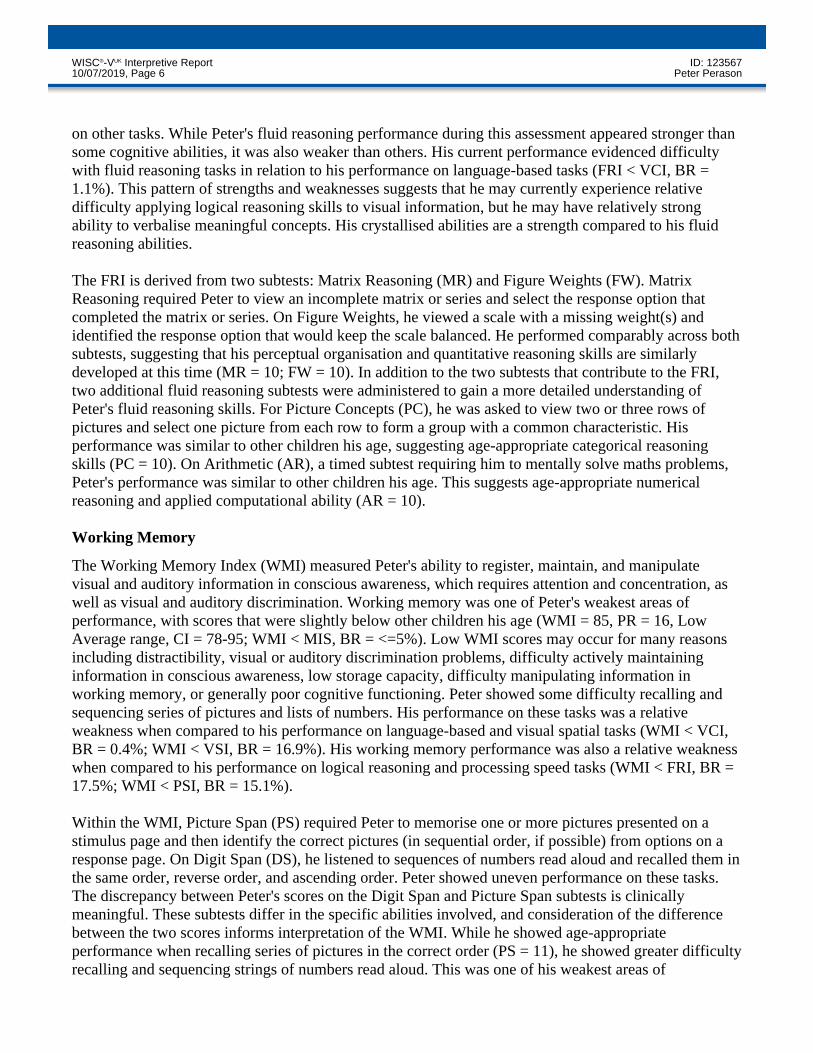
on other tasks. While Peter's fluid reasoning performance during this assessment appeared stronger thansome cognitive abilities, it was also weaker than others. His current performance evidenced difficultywith fluid reasoning tasks in relation to his performance on language-based tasks (FRI < VCI, BR =1.1%). This pattern of strengths and weaknesses suggests that he may currently experience relativedifficulty applying logical reasoning skills to visual information, but he may have relatively strongability to verbalise meaningful concepts. His crystallised abilities are a strength compared to his fluidreasoning abilities. The FRI is derived from two subtests: Matrix Reasoning (MR) and Figure Weights (FW). MatrixReasoning required Peter to view an incomplete matrix or series and select the response option thatcompleted the matrix or series. On Figure Weights, he viewed a scale with a missing weight(s) andidentified the response option that would keep the scale balanced. He performed comparably across bothsubtests, suggesting that his perceptual organisation and quantitative reasoning skills are similarlydeveloped at this time (MR = 10; FW = 10). In addition to the two subtests that contribute to the FRI,two additional fluid reasoning subtests were administered to gain a more detailed understanding ofPeter's fluid reasoning skills. For Picture Concepts (PC), he was asked to view two or three rows ofpictures and select one picture from each row to form a group with a common characteristic. Hisperformance was similar to other children his age, suggesting age-appropriate categorical reasoningskills (PC = 10). On Arithmetic (AR), a timed subtest requiring him to mentally solve maths problems,Peter's performance was similar to other children his age. This suggests age-appropriate numericalreasoning and applied computational ability (AR = 10). Working Memory The Working Memory Index (WMI) measured Peter's ability to register, maintain, and manipulatevisual and auditory information in conscious awareness, which requires attention and concentration, aswell as visual and auditory discrimination. Working memory was one of Peter's weakest areas ofperformance, with scores that were slightly below other children his age (WMI = 85, PR = 16, LowAverage range, CI = 78-95; WMI < MIS, BR = <=5%). Low WMI scores may occur for many reasonsincluding distractibility, visual or auditory discrimination problems, difficulty actively maintaininginformation in conscious awareness, low storage capacity, difficulty manipulating information inworking memory, or generally poor cognitive functioning. Peter showed some difficulty recalling andsequencing series of pictures and lists of numbers. His performance on these tasks was a relativeweakness when compared to his performance on language-based and visual spatial tasks (WMI < VCI,BR = 0.4%; WMI < VSI, BR = 16.9%). His working memory performance was also a relative weaknesswhen compared to his performance on logical reasoning and processing speed tasks (WMI < FRI, BR =17.5%; WMI < PSI, BR = 15.1%). Within the WMI, Picture Span (PS) required Peter to memorise one or more pictures presented on astimulus page and then identify the correct pictures (in sequential order, if possible) from options on aresponse page. On Digit Span (DS), he listened to sequences of numbers read aloud and recalled them inthe same order, reverse order, and ascending order. Peter showed uneven performance on these tasks.The discrepancy between Peter's scores on the Digit Span and Picture Span subtests is clinicallymeaningful. These subtests differ in the specific abilities involved, and consideration of the differencebetween the two scores informs interpretation of the WMI. While he showed age-appropriateperformance when recalling series of pictures in the correct order (PS = 11), he showed greater difficultyrecalling and sequencing strings of numbers read aloud. This was one of his weakest areas of
WISC®-VUK Interpretive Report ID: 12356710/07/2019, Page 6 Peter Perason
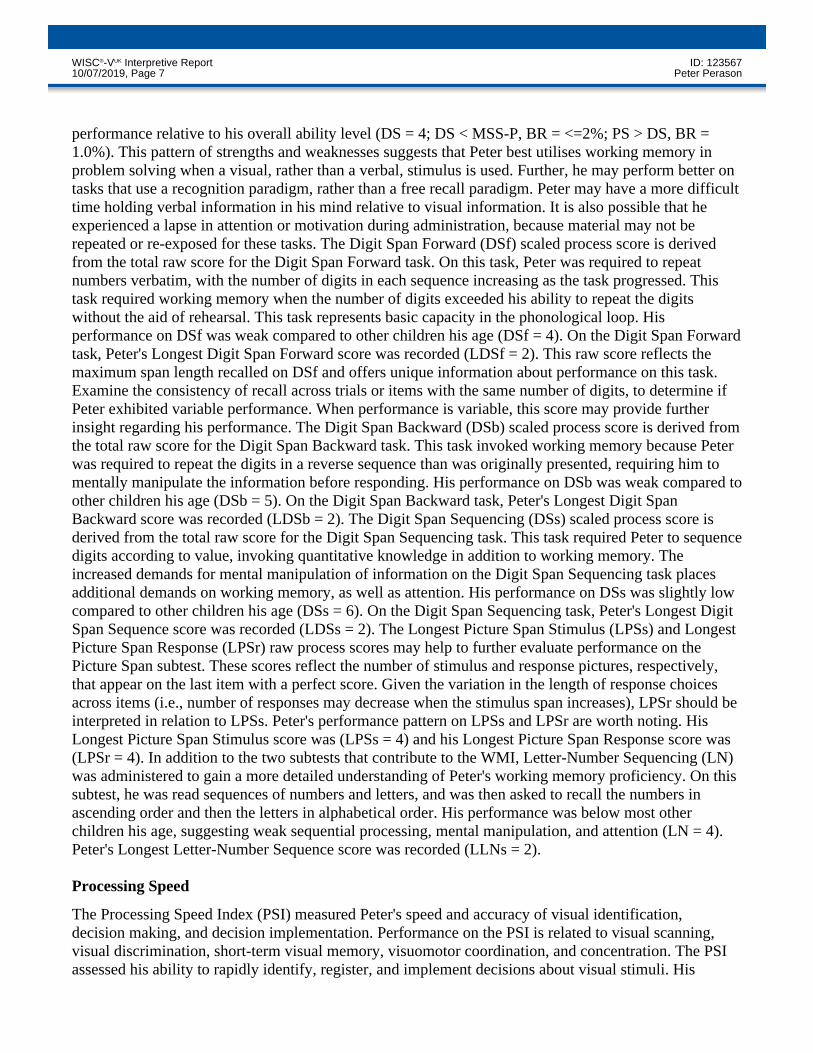
performance relative to his overall ability level (DS = 4; DS < MSS-P, BR = <=2%; PS > DS, BR =1.0%). This pattern of strengths and weaknesses suggests that Peter best utilises working memory inproblem solving when a visual, rather than a verbal, stimulus is used. Further, he may perform better ontasks that use a recognition paradigm, rather than a free recall paradigm. Peter may have a more difficulttime holding verbal information in his mind relative to visual information. It is also possible that heexperienced a lapse in attention or motivation during administration, because material may not berepeated or re-exposed for these tasks. The Digit Span Forward (DSf) scaled process score is derivedfrom the total raw score for the Digit Span Forward task. On this task, Peter was required to repeatnumbers verbatim, with the number of digits in each sequence increasing as the task progressed. Thistask required working memory when the number of digits exceeded his ability to repeat the digitswithout the aid of rehearsal. This task represents basic capacity in the phonological loop. Hisperformance on DSf was weak compared to other children his age (DSf = 4). On the Digit Span Forwardtask, Peter's Longest Digit Span Forward score was recorded (LDSf = 2). This raw score reflects themaximum span length recalled on DSf and offers unique information about performance on this task.Examine the consistency of recall across trials or items with the same number of digits, to determine ifPeter exhibited variable performance. When performance is variable, this score may provide furtherinsight regarding his performance. The Digit Span Backward (DSb) scaled process score is derived fromthe total raw score for the Digit Span Backward task. This task invoked working memory because Peterwas required to repeat the digits in a reverse sequence than was originally presented, requiring him tomentally manipulate the information before responding. His performance on DSb was weak compared toother children his age (DSb = 5). On the Digit Span Backward task, Peter's Longest Digit SpanBackward score was recorded (LDSb = 2). The Digit Span Sequencing (DSs) scaled process score isderived from the total raw score for the Digit Span Sequencing task. This task required Peter to sequencedigits according to value, invoking quantitative knowledge in addition to working memory. Theincreased demands for mental manipulation of information on the Digit Span Sequencing task placesadditional demands on working memory, as well as attention. His performance on DSs was slightly lowcompared to other children his age (DSs = 6). On the Digit Span Sequencing task, Peter's Longest DigitSpan Sequence score was recorded (LDSs = 2). The Longest Picture Span Stimulus (LPSs) and LongestPicture Span Response (LPSr) raw process scores may help to further evaluate performance on thePicture Span subtest. These scores reflect the number of stimulus and response pictures, respectively,that appear on the last item with a perfect score. Given the variation in the length of response choicesacross items (i.e., number of responses may decrease when the stimulus span increases), LPSr should beinterpreted in relation to LPSs. Peter's performance pattern on LPSs and LPSr are worth noting. HisLongest Picture Span Stimulus score was (LPSs = 4) and his Longest Picture Span Response score was(LPSr = 4). In addition to the two subtests that contribute to the WMI, Letter-Number Sequencing (LN)was administered to gain a more detailed understanding of Peter's working memory proficiency. On thissubtest, he was read sequences of numbers and letters, and was then asked to recall the numbers inascending order and then the letters in alphabetical order. His performance was below most otherchildren his age, suggesting weak sequential processing, mental manipulation, and attention (LN = 4).Peter's Longest Letter-Number Sequence score was recorded (LLNs = 2). Processing Speed The Processing Speed Index (PSI) measured Peter's speed and accuracy of visual identification,decision making, and decision implementation. Performance on the PSI is related to visual scanning,visual discrimination, short-term visual memory, visuomotor coordination, and concentration. The PSIassessed his ability to rapidly identify, register, and implement decisions about visual stimuli. His
WISC®-VUK Interpretive Report ID: 12356710/07/2019, Page 7 Peter Perason
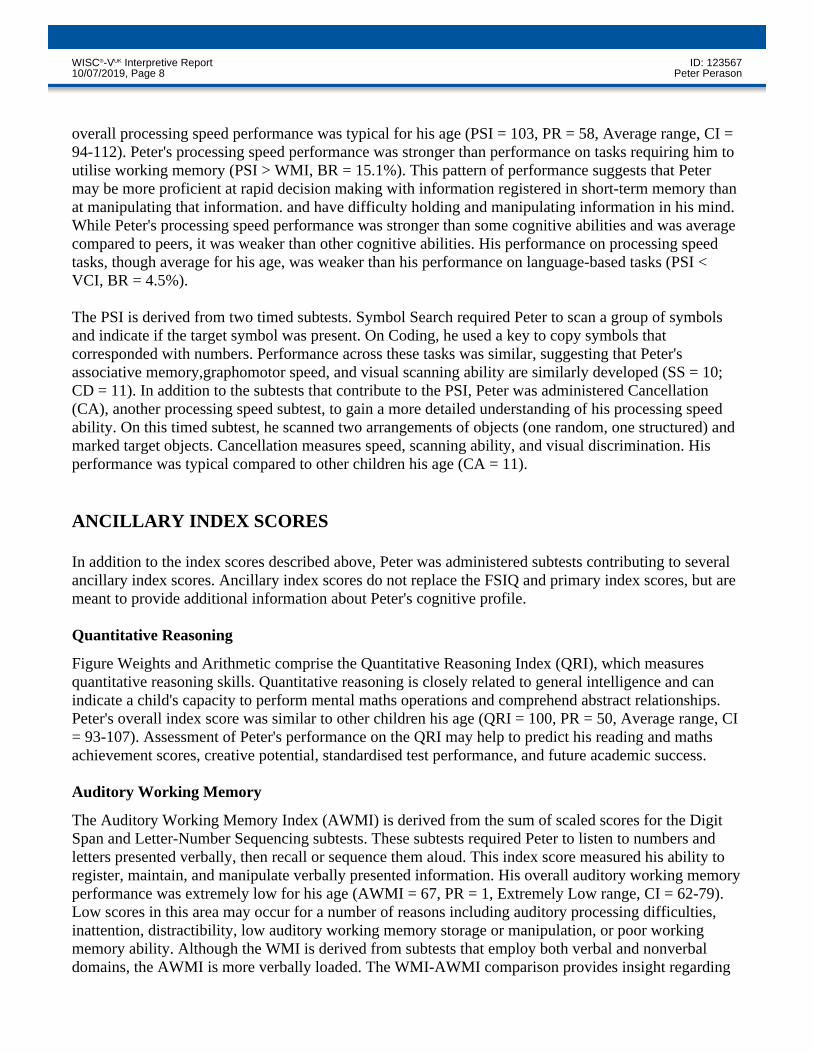
overall processing speed performance was typical for his age (PSI = 103, PR = 58, Average range, CI =94-112). Peter's processing speed performance was stronger than performance on tasks requiring him toutilise working memory (PSI > WMI, BR = 15.1%). This pattern of performance suggests that Petermay be more proficient at rapid decision making with information registered in short-term memory thanat manipulating that information. and have difficulty holding and manipulating information in his mind.While Peter's processing speed performance was stronger than some cognitive abilities and was averagecompared to peers, it was weaker than other cognitive abilities. His performance on processing speedtasks, though average for his age, was weaker than his performance on language-based tasks (PSI <VCI, BR = 4.5%). The PSI is derived from two timed subtests. Symbol Search required Peter to scan a group of symbolsand indicate if the target symbol was present. On Coding, he used a key to copy symbols thatcorresponded with numbers. Performance across these tasks was similar, suggesting that Peter'sassociative memory,graphomotor speed, and visual scanning ability are similarly developed (SS = 10;CD = 11). In addition to the subtests that contribute to the PSI, Peter was administered Cancellation(CA), another processing speed subtest, to gain a more detailed understanding of his processing speedability. On this timed subtest, he scanned two arrangements of objects (one random, one structured) andmarked target objects. Cancellation measures speed, scanning ability, and visual discrimination. Hisperformance was typical compared to other children his age (CA = 11). ANCILLARY INDEX SCORES In addition to the index scores described above, Peter was administered subtests contributing to severalancillary index scores. Ancillary index scores do not replace the FSIQ and primary index scores, but aremeant to provide additional information about Peter's cognitive profile. Quantitative Reasoning Figure Weights and Arithmetic comprise the Quantitative Reasoning Index (QRI), which measuresquantitative reasoning skills. Quantitative reasoning is closely related to general intelligence and canindicate a child's capacity to perform mental maths operations and comprehend abstract relationships.Peter's overall index score was similar to other children his age (QRI = 100, PR = 50, Average range, CI= 93-107). Assessment of Peter's performance on the QRI may help to predict his reading and mathsachievement scores, creative potential, standardised test performance, and future academic success. Auditory Working Memory The Auditory Working Memory Index (AWMI) is derived from the sum of scaled scores for the DigitSpan and Letter-Number Sequencing subtests. These subtests required Peter to listen to numbers andletters presented verbally, then recall or sequence them aloud. This index score measured his ability toregister, maintain, and manipulate verbally presented information. His overall auditory working memoryperformance was extremely low for his age (AWMI = 67, PR = 1, Extremely Low range, CI = 62-79).Low scores in this area may occur for a number of reasons including auditory processing difficulties,inattention, distractibility, low auditory working memory storage or manipulation, or poor workingmemory ability. Although the WMI is derived from subtests that employ both verbal and nonverbaldomains, the AWMI is more verbally loaded. The WMI-AWMI comparison provides insight regarding
WISC®-VUK Interpretive Report ID: 12356710/07/2019, Page 8 Peter Perason
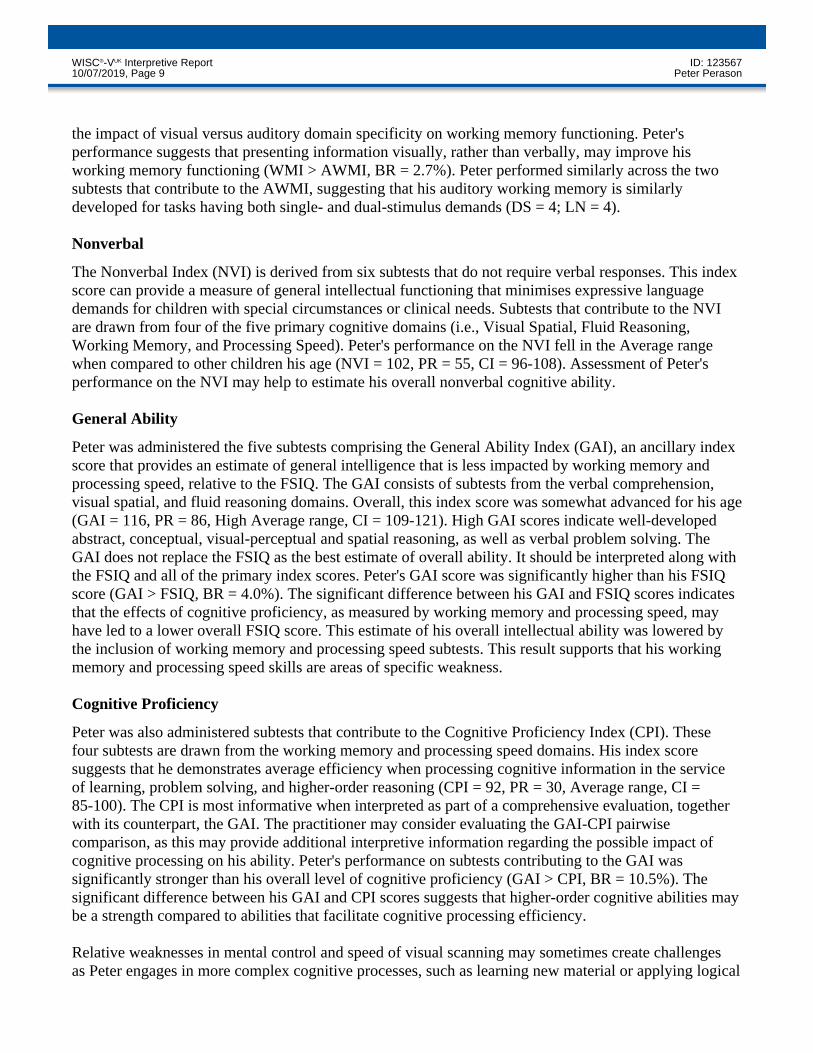
the impact of visual versus auditory domain specificity on working memory functioning. Peter'sperformance suggests that presenting information visually, rather than verbally, may improve hisworking memory functioning (WMI > AWMI, BR = 2.7%). Peter performed similarly across the twosubtests that contribute to the AWMI, suggesting that his auditory working memory is similarlydeveloped for tasks having both single- and dual-stimulus demands (DS = 4; LN = 4). Nonverbal The Nonverbal Index (NVI) is derived from six subtests that do not require verbal responses. This indexscore can provide a measure of general intellectual functioning that minimises expressive languagedemands for children with special circumstances or clinical needs. Subtests that contribute to the NVIare drawn from four of the five primary cognitive domains (i.e., Visual Spatial, Fluid Reasoning,Working Memory, and Processing Speed). Peter's performance on the NVI fell in the Average rangewhen compared to other children his age (NVI = 102, PR = 55, CI = 96-108). Assessment of Peter'sperformance on the NVI may help to estimate his overall nonverbal cognitive ability. General Ability Peter was administered the five subtests comprising the General Ability Index (GAI), an ancillary indexscore that provides an estimate of general intelligence that is less impacted by working memory andprocessing speed, relative to the FSIQ. The GAI consists of subtests from the verbal comprehension,visual spatial, and fluid reasoning domains. Overall, this index score was somewhat advanced for his age(GAI = 116, PR = 86, High Average range, CI = 109-121). High GAI scores indicate well-developedabstract, conceptual, visual-perceptual and spatial reasoning, as well as verbal problem solving. TheGAI does not replace the FSIQ as the best estimate of overall ability. It should be interpreted along withthe FSIQ and all of the primary index scores. Peter's GAI score was significantly higher than his FSIQscore (GAI > FSIQ, BR = 4.0%). The significant difference between his GAI and FSIQ scores indicatesthat the effects of cognitive proficiency, as measured by working memory and processing speed, mayhave led to a lower overall FSIQ score. This estimate of his overall intellectual ability was lowered bythe inclusion of working memory and processing speed subtests. This result supports that his workingmemory and processing speed skills are areas of specific weakness. Cognitive Proficiency Peter was also administered subtests that contribute to the Cognitive Proficiency Index (CPI). Thesefour subtests are drawn from the working memory and processing speed domains. His index scoresuggests that he demonstrates average efficiency when processing cognitive information in the serviceof learning, problem solving, and higher-order reasoning (CPI = 92, PR = 30, Average range, CI =85-100). The CPI is most informative when interpreted as part of a comprehensive evaluation, togetherwith its counterpart, the GAI. The practitioner may consider evaluating the GAI-CPI pairwisecomparison, as this may provide additional interpretive information regarding the possible impact ofcognitive processing on his ability. Peter's performance on subtests contributing to the GAI wassignificantly stronger than his overall level of cognitive proficiency (GAI > CPI, BR = 10.5%). Thesignificant difference between his GAI and CPI scores suggests that higher-order cognitive abilities maybe a strength compared to abilities that facilitate cognitive processing efficiency. Relative weaknesses in mental control and speed of visual scanning may sometimes create challengesas Peter engages in more complex cognitive processes, such as learning new material or applying logical
WISC®-VUK Interpretive Report ID: 12356710/07/2019, Page 9 Peter Perason
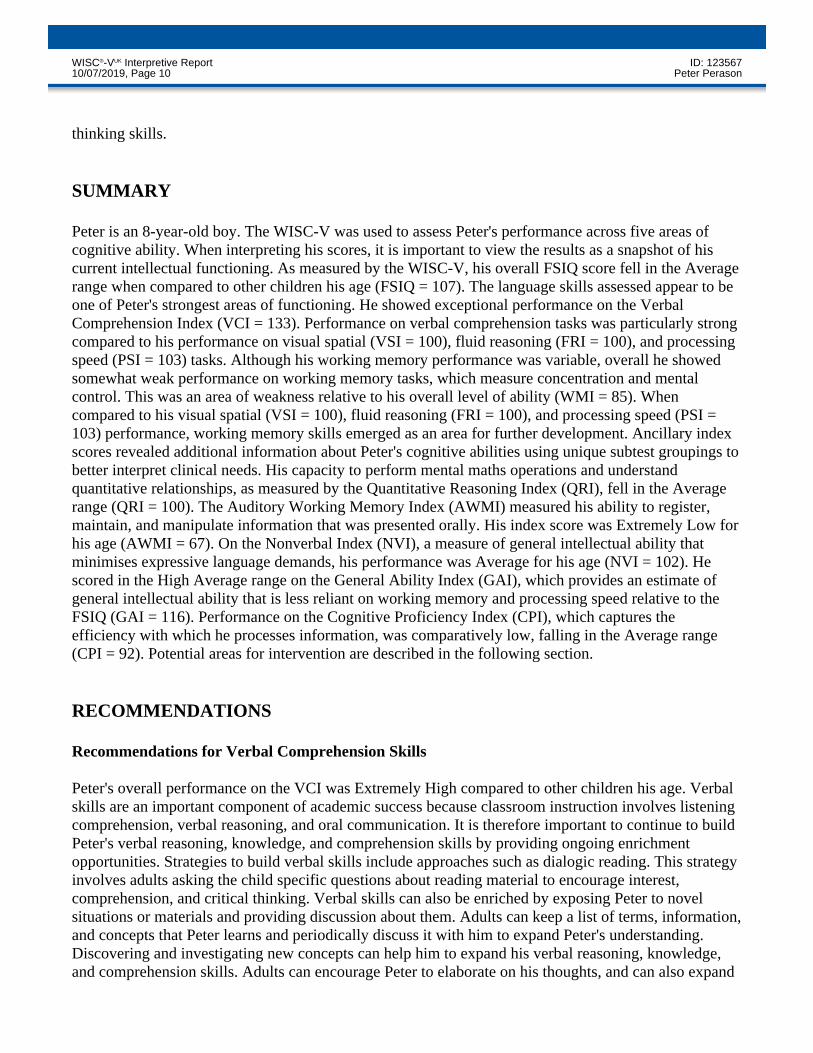
thinking skills. SUMMARY Peter is an 8-year-old boy. The WISC-V was used to assess Peter's performance across five areas ofcognitive ability. When interpreting his scores, it is important to view the results as a snapshot of hiscurrent intellectual functioning. As measured by the WISC-V, his overall FSIQ score fell in the Averagerange when compared to other children his age (FSIQ = 107). The language skills assessed appear to beone of Peter's strongest areas of functioning. He showed exceptional performance on the VerbalComprehension Index (VCI = 133). Performance on verbal comprehension tasks was particularly strongcompared to his performance on visual spatial (VSI = 100), fluid reasoning (FRI = 100), and processingspeed (PSI = 103) tasks. Although his working memory performance was variable, overall he showedsomewhat weak performance on working memory tasks, which measure concentration and mentalcontrol. This was an area of weakness relative to his overall level of ability (WMI = 85). Whencompared to his visual spatial (VSI = 100), fluid reasoning (FRI = 100), and processing speed (PSI =103) performance, working memory skills emerged as an area for further development. Ancillary indexscores revealed additional information about Peter's cognitive abilities using unique subtest groupings tobetter interpret clinical needs. His capacity to perform mental maths operations and understandquantitative relationships, as measured by the Quantitative Reasoning Index (QRI), fell in the Averagerange (QRI = 100). The Auditory Working Memory Index (AWMI) measured his ability to register,maintain, and manipulate information that was presented orally. His index score was Extremely Low forhis age (AWMI = 67). On the Nonverbal Index (NVI), a measure of general intellectual ability thatminimises expressive language demands, his performance was Average for his age (NVI = 102). Hescored in the High Average range on the General Ability Index (GAI), which provides an estimate ofgeneral intellectual ability that is less reliant on working memory and processing speed relative to theFSIQ (GAI = 116). Performance on the Cognitive Proficiency Index (CPI), which captures theefficiency with which he processes information, was comparatively low, falling in the Average range(CPI = 92). Potential areas for intervention are described in the following section. RECOMMENDATIONS Recommendations for Verbal Comprehension Skills Peter's overall performance on the VCI was Extremely High compared to other children his age. Verbalskills are an important component of academic success because classroom instruction involves listeningcomprehension, verbal reasoning, and oral communication. It is therefore important to continue to buildPeter's verbal reasoning, knowledge, and comprehension skills by providing ongoing enrichmentopportunities. Strategies to build verbal skills include approaches such as dialogic reading. This strategyinvolves adults asking the child specific questions about reading material to encourage interest,comprehension, and critical thinking. Verbal skills can also be enriched by exposing Peter to novelsituations or materials and providing discussion about them. Adults can keep a list of terms, information,and concepts that Peter learns and periodically discuss it with him to expand Peter's understanding.Discovering and investigating new concepts can help him to expand his verbal reasoning, knowledge,and comprehension skills. Adults can encourage Peter to elaborate on his thoughts, and can also expand
WISC®-VUK Interpretive Report ID: 12356710/07/2019, Page 10 Peter Perason
on his contributions to the conversation. Peter's verbal comprehension performance was stronger than his fluid reasoning performance. Thissuggests that explaining concepts aloud may assist him in applying logical thinking to visualinformation. It may be beneficial for Peter to talk himself through visually-presented problems ifattempting to solve them in his head. For example, when Peter must choose the missing piece in a visualpattern, it may be helpful if he says aloud, 'Red goes with blue up here, so red goes with blue downhere.' Recommendations for Working Memory Skills Peter's overall performance on the WMI was Low Average compared to other children his age. Withworking memory skills lower than many children his age, he may have difficulty concentrating andattending to information that is presented to him. This may impact his school performance. Relativelyweak working memory skills can lead to reading comprehension problems as text becomes morecomplex in future school years. Several recommendations are made based upon his performance pattern.Digital interventions may be helpful in building his capacity to exert mental control, ignore distractions,and manipulate information in his mind. Other strategies that may be useful in increasing workingmemory include teaching Peter to chunk information and connect new information to concepts that healready knows. As part of a comprehensive intervention plan, literacy goals such as identifying the mainidea of stories can be identified. It is important to reinforce Peter's progress during these interventions.Goals should be small and measurable, and should steadily increase in complexity as his skills growstronger. Thank you for the opportunity to assess Peter. Please contact me with any questions you have aboutthese results. This report is only valid if signed by a qualified professional:
E L Date
WISC®-VUK Interpretive Report ID: 12356710/07/2019, Page 11 Peter Perason
PRIMARY SUMMARY
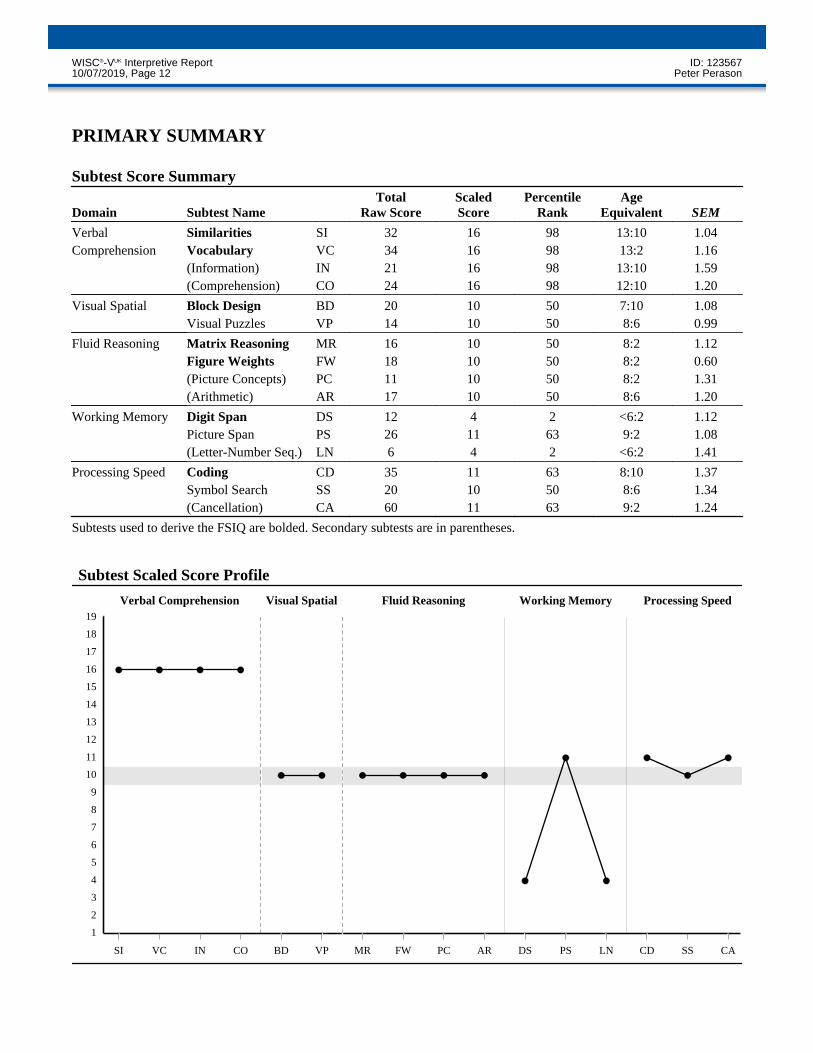
Subtests used to derive the FSIQ are bolded. Secondary subtests are in parentheses.
Subtest Score Summary
Domain Subtest NameTotal
Raw ScoreScaledScore
PercentileRank
AgeEquivalent SEM
Verbal Similarities SI 32 16 98 13:10 1.04Comprehension Vocabulary VC 34 16 98 13:2 1.16
(Information) IN 21 16 98 13:10 1.59(Comprehension) CO 24 16 98 12:10 1.20
Visual Spatial Block Design BD 20 10 50 7:10 1.08Visual Puzzles VP 14 10 50 8:6 0.99
Fluid Reasoning Matrix Reasoning MR 16 10 50 8:2 1.12Figure Weights FW 18 10 50 8:2 0.60(Picture Concepts) PC 11 10 50 8:2 1.31(Arithmetic) AR 17 10 50 8:6 1.20
Working Memory Digit Span DS 12 4 2 <6:2 1.12Picture Span PS 26 11 63 9:2 1.08(Letter-Number Seq.) LN 6 4 2 <6:2 1.41
Processing Speed Coding CD 35 11 63 8:10 1.37Symbol Search SS 20 10 50 8:6 1.34(Cancellation) CA 60 11 63 9:2 1.24
5
4
3
2
1
7
6
8
11
10
9
19
18
17
16
15
14
13
12
IN
Verbal Comprehension Visual Spatial Fluid Reasoning Working Memory Processing Speed
SI VC CO BD VP MR FW PC AR DS PS LN CD SS CA
Subtest Scaled Score Profile
WISC®-VUK Interpretive Report ID: 12356710/07/2019, Page 12 Peter Perason
PRIMARY SUMMARY (CONTINUED)
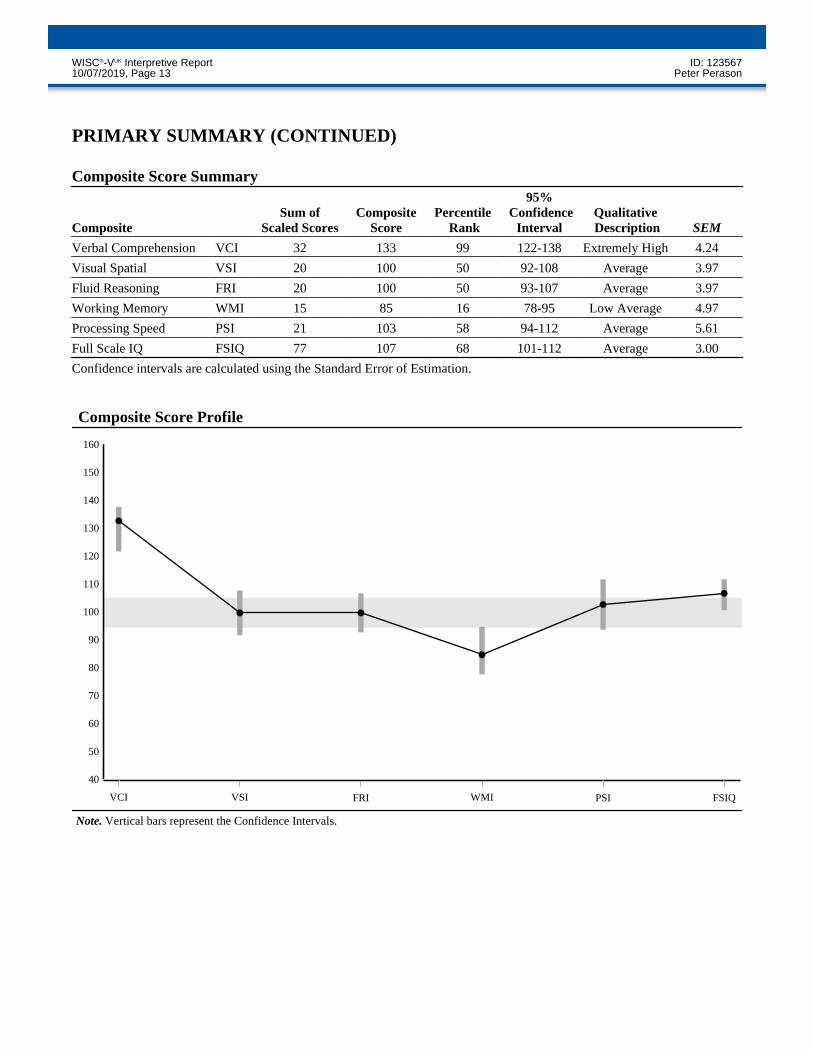
Confidence intervals are calculated using the Standard Error of Estimation.
Composite Score Summary
CompositeSum of
Scaled ScoresComposite
ScorePercentile
Rank
95%Confidence
IntervalQualitativeDescription SEM
Verbal Comprehension VCI 32 133 99 122-138 Extremely High 4.24
Visual Spatial VSI 20 100 50 92-108 Average 3.97
Fluid Reasoning FRI 20 100 50 93-107 Average 3.97
Working Memory WMI 15 85 16 78-95 Low Average 4.97
Processing Speed PSI 21 103 58 94-112 Average 5.61
Full Scale IQ FSIQ 77 107 68 101-112 Average 3.00
80
70
60
FRI
50
40
100
VSI WMI PSI FSIQVCI
90
110
140
130
120
Composite Score Profile
160
150
Note. Vertical bars represent the Confidence Intervals.
WISC®-VUK Interpretive Report ID: 12356710/07/2019, Page 13 Peter Perason
PRIMARY ANALYSIS
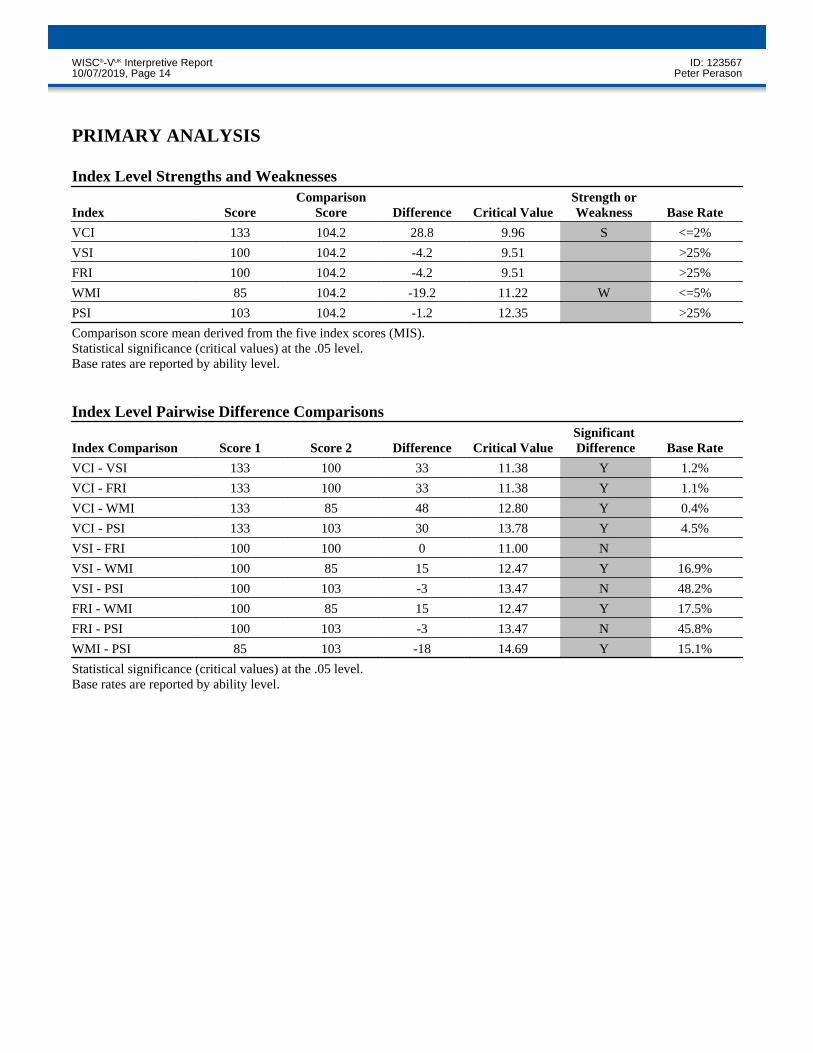
Comparison score mean derived from the five index scores (MIS).Statistical significance (critical values) at the .05 level.Base rates are reported by ability level.
Statistical significance (critical values) at the .05 level.Base rates are reported by ability level.
Index Level Strengths and Weaknesses
Index ScoreComparison
Score Difference Critical ValueStrength orWeakness Base Rate
VCI 133 104.2 28.8 9.96 S <=2%
VSI 100 104.2 -4.2 9.51 >25%
FRI 100 104.2 -4.2 9.51 >25%
WMI 85 104.2 -19.2 11.22 W <=5%
PSI 103 104.2 -1.2 12.35 >25%
Index Level Pairwise Difference Comparisons
Index Comparison Score 1 Score 2 Difference Critical ValueSignificantDifference Base Rate
VCI - VSI 133 100 33 11.38 Y 1.2%
VCI - FRI 133 100 33 11.38 Y 1.1%
VCI - WMI 133 85 48 12.80 Y 0.4%
VCI - PSI 133 103 30 13.78 Y 4.5%
VSI - FRI 100 100 0 11.00 N
VSI - WMI 100 85 15 12.47 Y 16.9%
VSI - PSI 100 103 -3 13.47 N 48.2%
FRI - WMI 100 85 15 12.47 Y 17.5%
FRI - PSI 100 103 -3 13.47 N 45.8%
WMI - PSI 85 103 -18 14.69 Y 15.1%
WISC®-VUK Interpretive Report ID: 12356710/07/2019, Page 14 Peter Perason
PRIMARY ANALYSIS (CONTINUED)
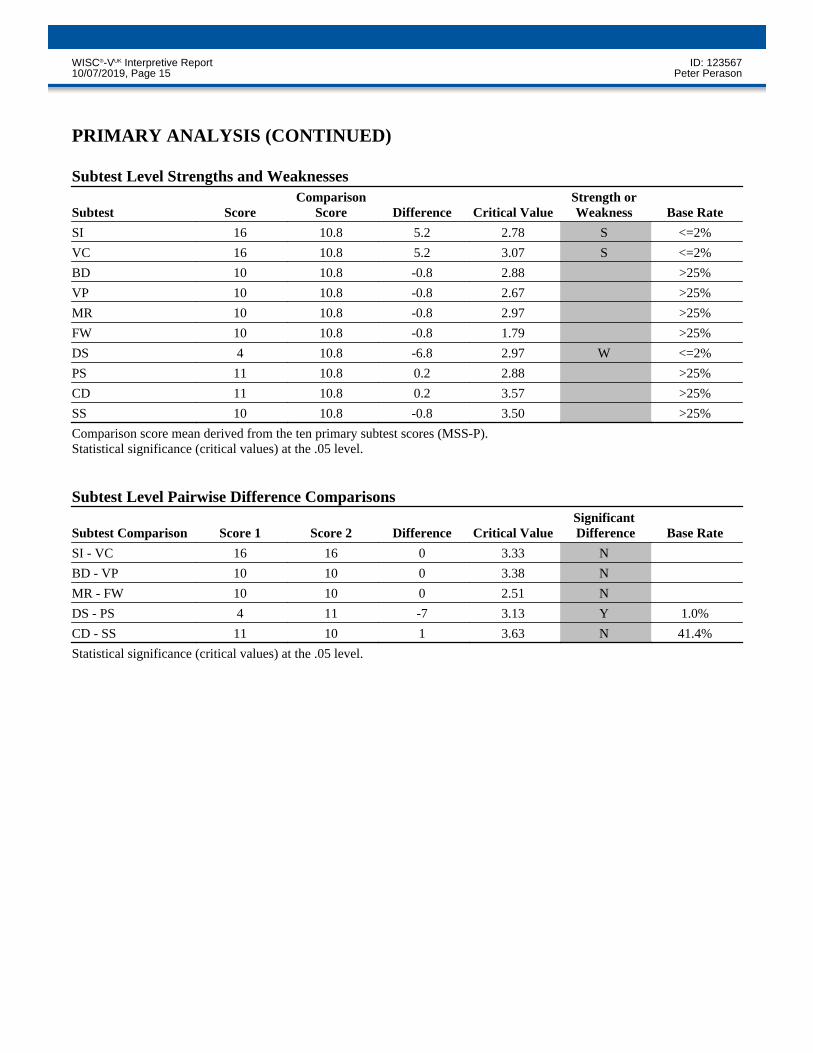
Comparison score mean derived from the ten primary subtest scores (MSS-P).Statistical significance (critical values) at the .05 level.
Statistical significance (critical values) at the .05 level.
Subtest Level Strengths and Weaknesses
Subtest ScoreComparison
Score Difference Critical ValueStrength orWeakness Base Rate
SI 16 10.8 5.2 2.78 S <=2%
VC 16 10.8 5.2 3.07 S <=2%
BD 10 10.8 -0.8 2.88 >25%
VP 10 10.8 -0.8 2.67 >25%
MR 10 10.8 -0.8 2.97 >25%
FW 10 10.8 -0.8 1.79 >25%
DS 4 10.8 -6.8 2.97 W <=2%
PS 11 10.8 0.2 2.88 >25%
CD 11 10.8 0.2 3.57 >25%
SS 10 10.8 -0.8 3.50 >25%
Subtest Level Pairwise Difference Comparisons
Subtest Comparison Score 1 Score 2 Difference Critical ValueSignificantDifference Base Rate
SI - VC 16 16 0 3.33 N
BD - VP 10 10 0 3.38 N
MR - FW 10 10 0 2.51 N
DS - PS 4 11 -7 3.13 Y 1.0%
CD - SS 11 10 1 3.63 N 41.4%
WISC®-VUK Interpretive Report ID: 12356710/07/2019, Page 15 Peter Perason
ANCILLARY SUMMARY
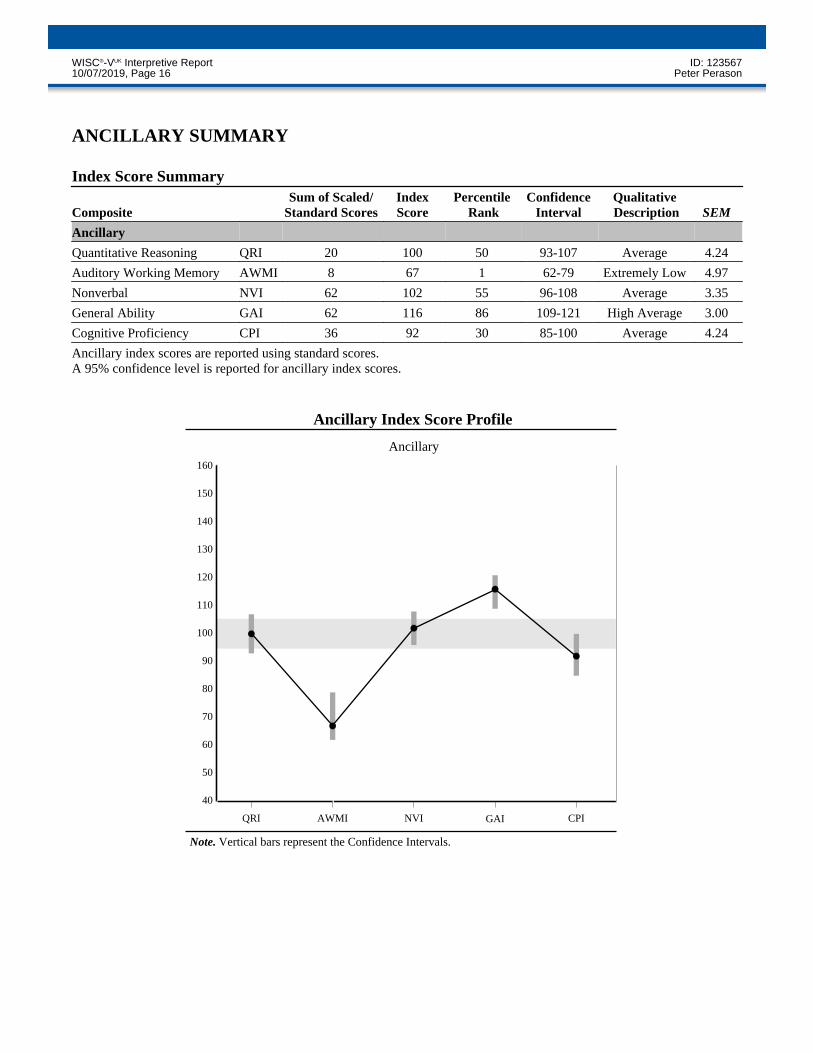
Ancillary index scores are reported using standard scores.A 95% confidence level is reported for ancillary index scores.
Index Score Summary
CompositeSum of Scaled/
Standard ScoresIndexScore
PercentileRank
ConfidenceInterval
QualitativeDescription SEM
Ancillary
Quantitative Reasoning QRI 20 100 50 93-107 Average 4.24
Auditory Working Memory AWMI 8 67 1 62-79 Extremely Low 4.97
Nonverbal NVI 62 102 55 96-108 Average 3.35
General Ability GAI 62 116 86 109-121 High Average 3.00
Cognitive Proficiency CPI 36 92 30 85-100 Average 4.24
80
70
60
GAI
50
40
100
NVI CPIQRI
90
110
140
130
120
Ancillary Index Score Profile
160
150
Note. Vertical bars represent the Confidence Intervals.
Ancillary
AWMI
WISC®-VUK Interpretive Report ID: 12356710/07/2019, Page 16 Peter Perason
ANCILLARY ANALYSIS
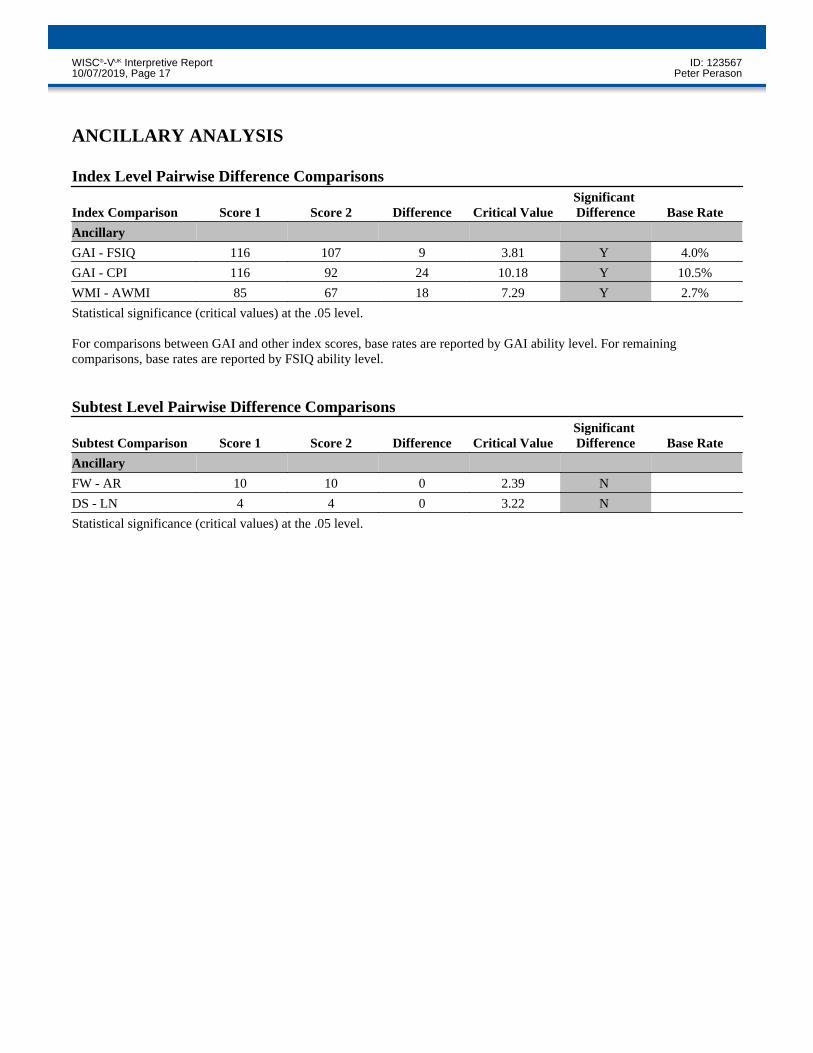
Statistical significance (critical values) at the .05 level. For comparisons between GAI and other index scores, base rates are reported by GAI ability level. For remainingcomparisons, base rates are reported by FSIQ ability level.
Statistical significance (critical values) at the .05 level.
Index Level Pairwise Difference Comparisons
Index Comparison Score 1 Score 2 Difference Critical ValueSignificantDifference Base Rate
Ancillary
GAI - FSIQ 116 107 9 3.81 Y 4.0%
GAI - CPI 116 92 24 10.18 Y 10.5%
WMI - AWMI 85 67 18 7.29 Y 2.7%
Subtest Level Pairwise Difference Comparisons
Subtest Comparison Score 1 Score 2 Difference Critical ValueSignificantDifference Base Rate
Ancillary
FW - AR 10 10 0 2.39 N
DS - LN 4 4 0 3.22 N
WISC®-VUK Interpretive Report ID: 12356710/07/2019, Page 17 Peter Perason
PROCESS ANALYSIS
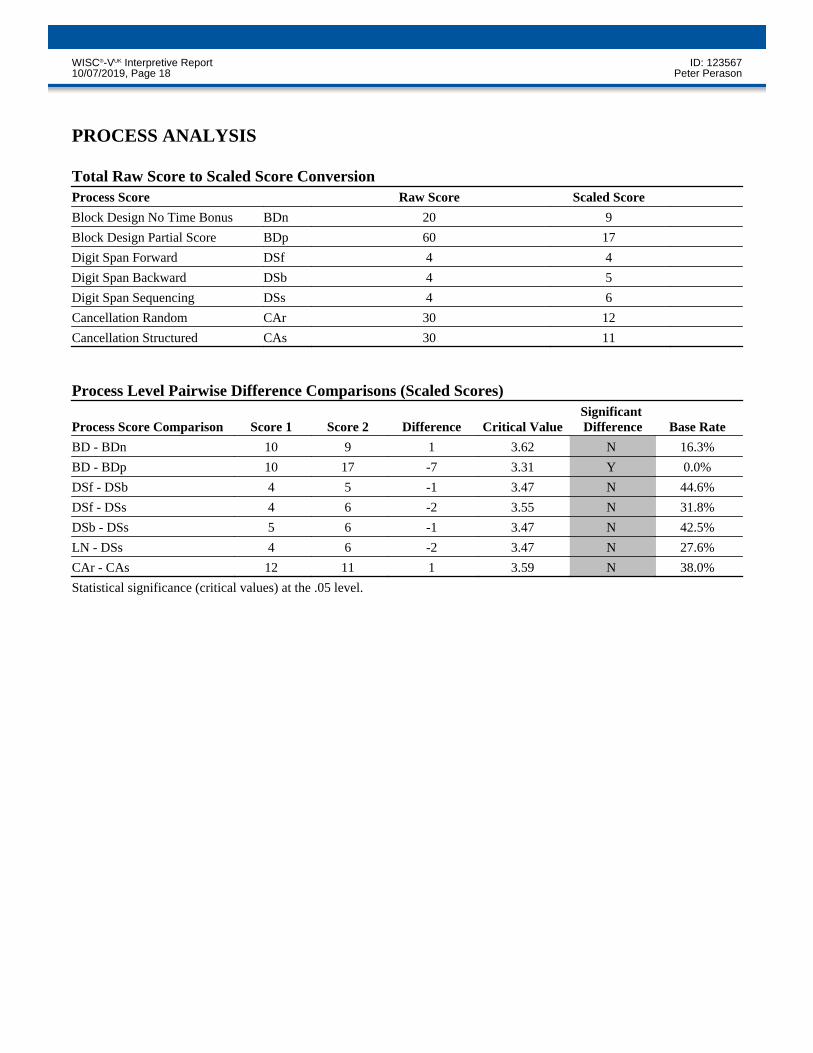
Statistical significance (critical values) at the .05 level.
Total Raw Score to Scaled Score ConversionProcess Score Raw Score Scaled Score
Block Design No Time Bonus BDn 20 9
Block Design Partial Score BDp 60 17
Digit Span Forward DSf 4 4
Digit Span Backward DSb 4 5
Digit Span Sequencing DSs 4 6
Cancellation Random CAr 30 12
Cancellation Structured CAs 30 11
Process Level Pairwise Difference Comparisons (Scaled Scores)
Process Score Comparison Score 1 Score 2 Difference Critical ValueSignificantDifference Base Rate
BD - BDn 10 9 1 3.62 N 16.3%
BD - BDp 10 17 -7 3.31 Y 0.0%
DSf - DSb 4 5 -1 3.47 N 44.6%
DSf - DSs 4 6 -2 3.55 N 31.8%
DSb - DSs 5 6 -1 3.47 N 42.5%
LN - DSs 4 6 -2 3.47 N 27.6%
CAr - CAs 12 11 1 3.59 N 38.0%
WISC®-VUK Interpretive Report ID: 12356710/07/2019, Page 18 Peter Perason
PROCESS ANALYSIS (CONTINUED)
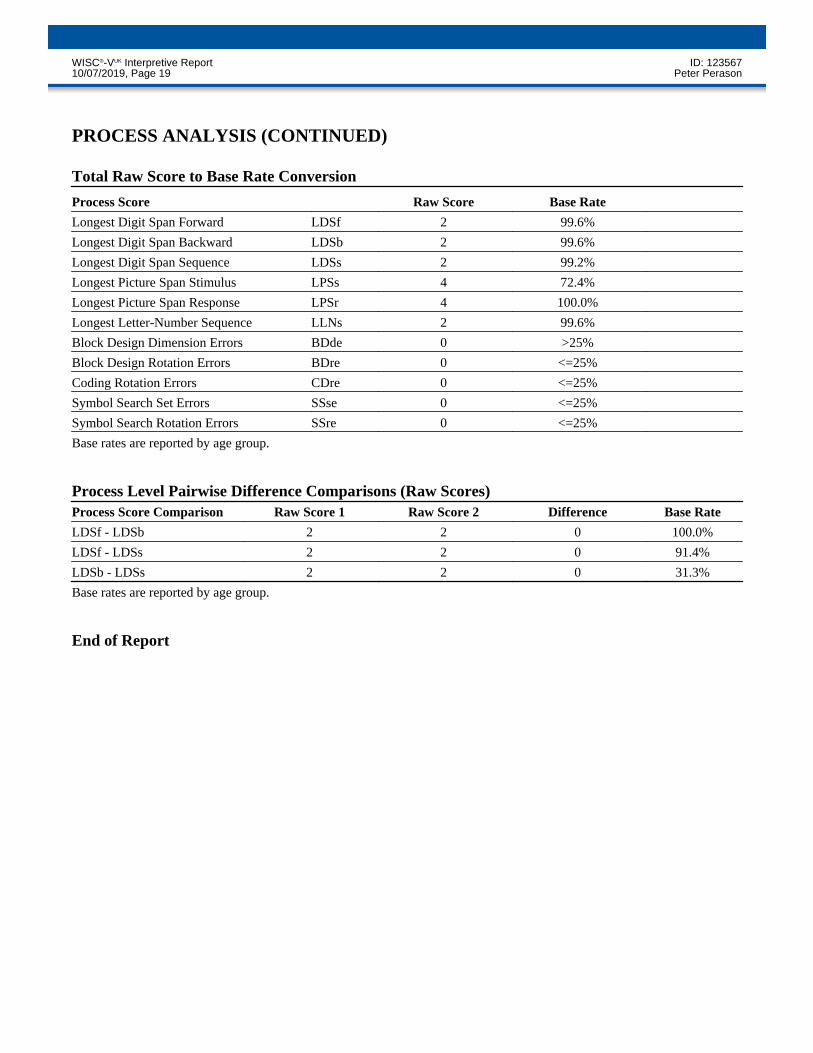
Base rates are reported by age group.
Base rates are reported by age group. End of Report
Total Raw Score to Base Rate Conversion
Process Score Raw Score Base Rate
Longest Digit Span Forward LDSf 2 99.6%
Longest Digit Span Backward LDSb 2 99.6%
Longest Digit Span Sequence LDSs 2 99.2%
Longest Picture Span Stimulus LPSs 4 72.4%
Longest Picture Span Response LPSr 4 100.0%
Longest Letter-Number Sequence LLNs 2 99.6%
Block Design Dimension Errors BDde 0 >25%
Block Design Rotation Errors BDre 0 <=25%
Coding Rotation Errors CDre 0 <=25%
Symbol Search Set Errors SSse 0 <=25%
Symbol Search Rotation Errors SSre 0 <=25%
Process Level Pairwise Difference Comparisons (Raw Scores)Process Score Comparison Raw Score 1 Raw Score 2 Difference Base Rate
LDSf - LDSb 2 2 0 100.0%
LDSf - LDSs 2 2 0 91.4%
LDSb - LDSs 2 2 0 31.3%
WISC®-VUK Interpretive Report ID: 12356710/07/2019, Page 19 Peter Perason
WISC®-VUK Wechsler Intelligence Scale for Children®-Fifth Edition: United Kingdom Parent Summary Report
Examinee Name Peter Perason Date of Report 10/07/2019
Examinee ID 123567 School Year
Date of Birth 23/02/2011 Primary Language
Gender Male Handedness
Race/Ethnicity Examiner Name E L
Date of Testing 10/07/2019 Age at Testing 8 years 4 months Retest? Yes
Copyright © 2015 by NCS Pearson, Inc. Adapted by permission. European adaptation copyright © 2016 Pearson Education Ltd. or itsaffiliate(s). All rights reserved.
Pearson, the PSI logo, PsychCorp, Wechsler, Wechsler Intelligence Scale for Children, and WISC are trademarks in the U.S. and/orother countries of Pearson Education, Inc., or its affiliate(s).
This report contains copyrighted material and trade secrets. The qualified licensee may excerpt portions of this output report, limited to theminimum text necessary to accurately describe their significant core conclusions, for incorporation into a written evaluation of the examinee, inaccordance with their profession's citation standards, if any. No adaptations, translations, modifications, or special versions may be made ofthis report without prior written permission from Pearson.
[ 1.3 / RE1 / QG1 ]
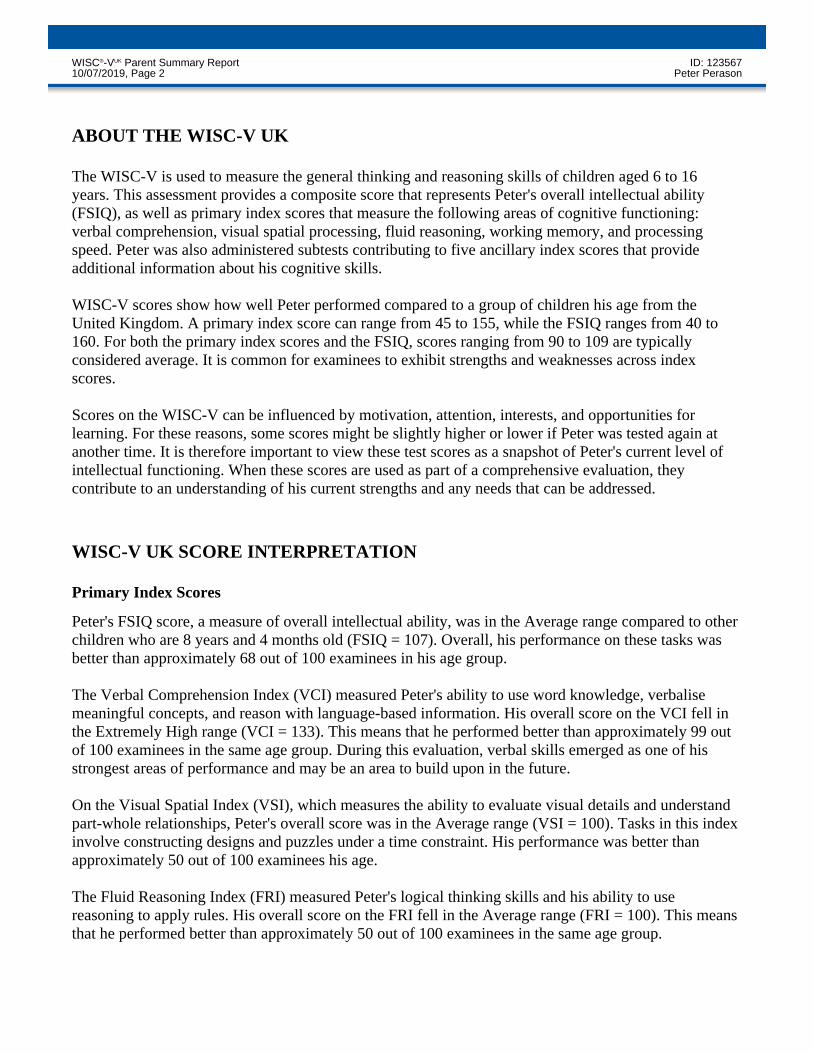
ABOUT THE WISC-V UK The WISC-V is used to measure the general thinking and reasoning skills of children aged 6 to 16years. This assessment provides a composite score that represents Peter's overall intellectual ability(FSIQ), as well as primary index scores that measure the following areas of cognitive functioning:verbal comprehension, visual spatial processing, fluid reasoning, working memory, and processingspeed. Peter was also administered subtests contributing to five ancillary index scores that provideadditional information about his cognitive skills. WISC-V scores show how well Peter performed compared to a group of children his age from theUnited Kingdom. A primary index score can range from 45 to 155, while the FSIQ ranges from 40 to160. For both the primary index scores and the FSIQ, scores ranging from 90 to 109 are typicallyconsidered average. It is common for examinees to exhibit strengths and weaknesses across indexscores. Scores on the WISC-V can be influenced by motivation, attention, interests, and opportunities forlearning. For these reasons, some scores might be slightly higher or lower if Peter was tested again atanother time. It is therefore important to view these test scores as a snapshot of Peter's current level ofintellectual functioning. When these scores are used as part of a comprehensive evaluation, theycontribute to an understanding of his current strengths and any needs that can be addressed.
WISC-V UK SCORE INTERPRETATION
Primary Index Scores
Peter's FSIQ score, a measure of overall intellectual ability, was in the Average range compared to otherchildren who are 8 years and 4 months old (FSIQ = 107). Overall, his performance on these tasks wasbetter than approximately 68 out of 100 examinees in his age group.
The Verbal Comprehension Index (VCI) measured Peter's ability to use word knowledge, verbalisemeaningful concepts, and reason with language-based information. His overall score on the VCI fell inthe Extremely High range (VCI = 133). This means that he performed better than approximately 99 outof 100 examinees in the same age group. During this evaluation, verbal skills emerged as one of hisstrongest areas of performance and may be an area to build upon in the future.
On the Visual Spatial Index (VSI), which measures the ability to evaluate visual details and understandpart-whole relationships, Peter's overall score was in the Average range (VSI = 100). Tasks in this indexinvolve constructing designs and puzzles under a time constraint. His performance was better thanapproximately 50 out of 100 examinees his age.
The Fluid Reasoning Index (FRI) measured Peter's logical thinking skills and his ability to usereasoning to apply rules. His overall score on the FRI fell in the Average range (FRI = 100). This meansthat he performed better than approximately 50 out of 100 examinees in the same age group.
WISC®-VUK Parent Summary Report ID: 12356710/07/2019, Page 2 Peter Perason
Ancillary Index Scores
Thank you for the opportunity to assess Peter. Please contact me with any questions you have aboutthese results. This report is only valid if signed by a qualified professional:
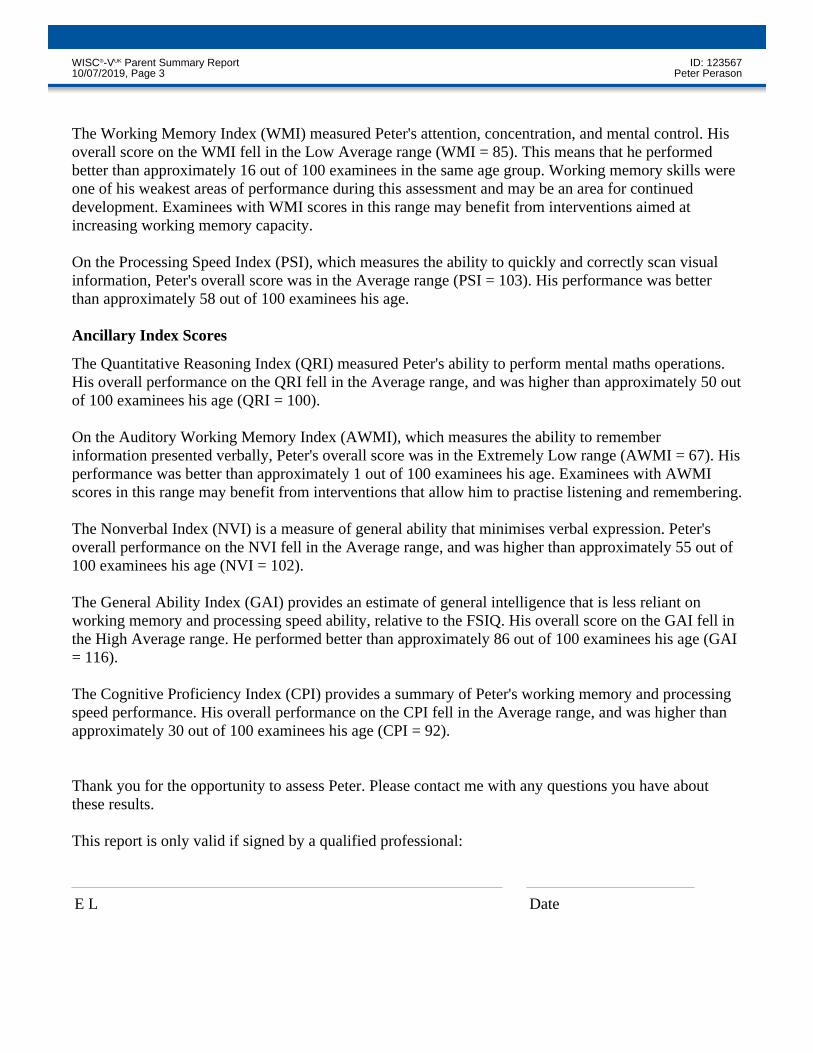
The Working Memory Index (WMI) measured Peter's attention, concentration, and mental control. Hisoverall score on the WMI fell in the Low Average range (WMI = 85). This means that he performedbetter than approximately 16 out of 100 examinees in the same age group. Working memory skills wereone of his weakest areas of performance during this assessment and may be an area for continueddevelopment. Examinees with WMI scores in this range may benefit from interventions aimed atincreasing working memory capacity.
On the Processing Speed Index (PSI), which measures the ability to quickly and correctly scan visualinformation, Peter's overall score was in the Average range (PSI = 103). His performance was betterthan approximately 58 out of 100 examinees his age.
The Quantitative Reasoning Index (QRI) measured Peter's ability to perform mental maths operations.His overall performance on the QRI fell in the Average range, and was higher than approximately 50 outof 100 examinees his age (QRI = 100).
On the Auditory Working Memory Index (AWMI), which measures the ability to rememberinformation presented verbally, Peter's overall score was in the Extremely Low range (AWMI = 67). Hisperformance was better than approximately 1 out of 100 examinees his age. Examinees with AWMIscores in this range may benefit from interventions that allow him to practise listening and remembering.
The Nonverbal Index (NVI) is a measure of general ability that minimises verbal expression. Peter'soverall performance on the NVI fell in the Average range, and was higher than approximately 55 out of100 examinees his age (NVI = 102).
The General Ability Index (GAI) provides an estimate of general intelligence that is less reliant onworking memory and processing speed ability, relative to the FSIQ. His overall score on the GAI fell inthe High Average range. He performed better than approximately 86 out of 100 examinees his age (GAI= 116).
The Cognitive Proficiency Index (CPI) provides a summary of Peter's working memory and processingspeed performance. His overall performance on the CPI fell in the Average range, and was higher thanapproximately 30 out of 100 examinees his age (CPI = 92).
E L Date
WISC®-VUK Parent Summary Report ID: 12356710/07/2019, Page 3 Peter Perason
WISC-V UK TEST SCORES
Score Summary
Composite Score Percentile Rank Qualitative Description
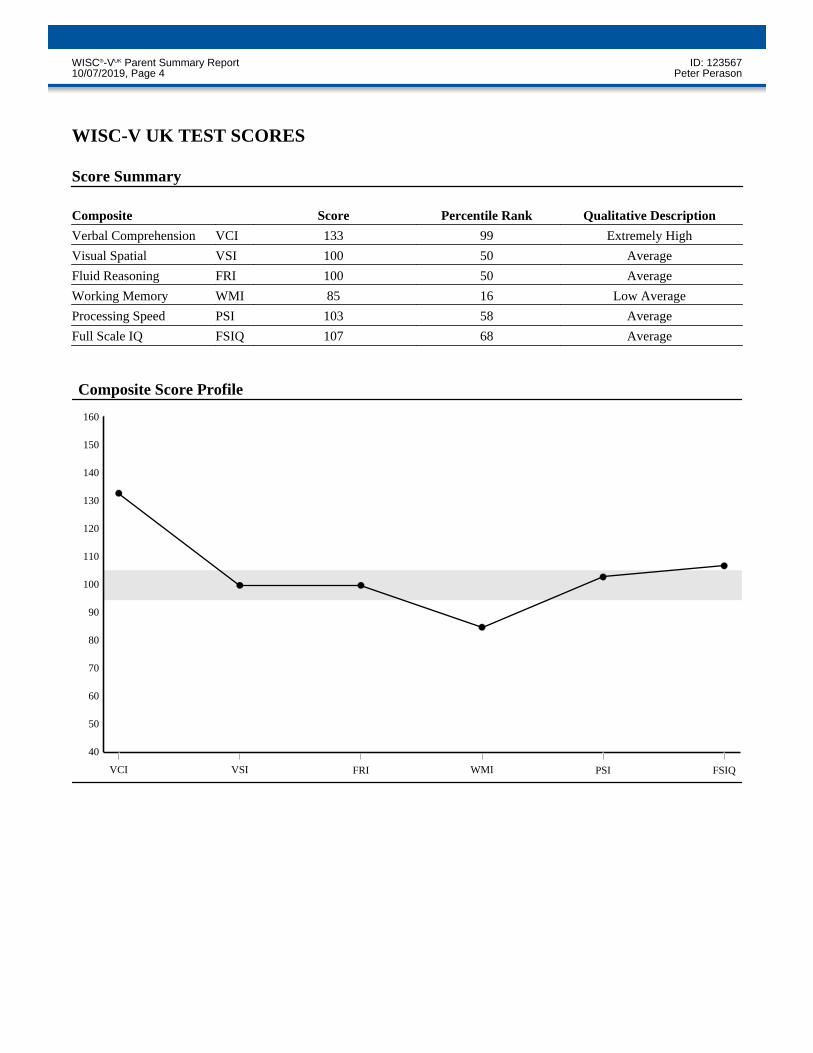
Verbal Comprehension VCI 133 99 Extremely High
Visual Spatial VSI 100 50 Average
Fluid Reasoning FRI 100 50 Average
Working Memory WMI 85 16 Low Average
Processing Speed PSI 103 58 Average
Full Scale IQ FSIQ 107 68 Average
80
70
60
FRI
50
40
100
VSI WMI PSI FSIQVCI
90
110
140
130
120
Composite Score Profile
160
150
WISC®-VUK Parent Summary Report ID: 12356710/07/2019, Page 4 Peter Perason
Ancillary Score Summary
Composite Score Percentile Rank Qualitative Description
Ancillary
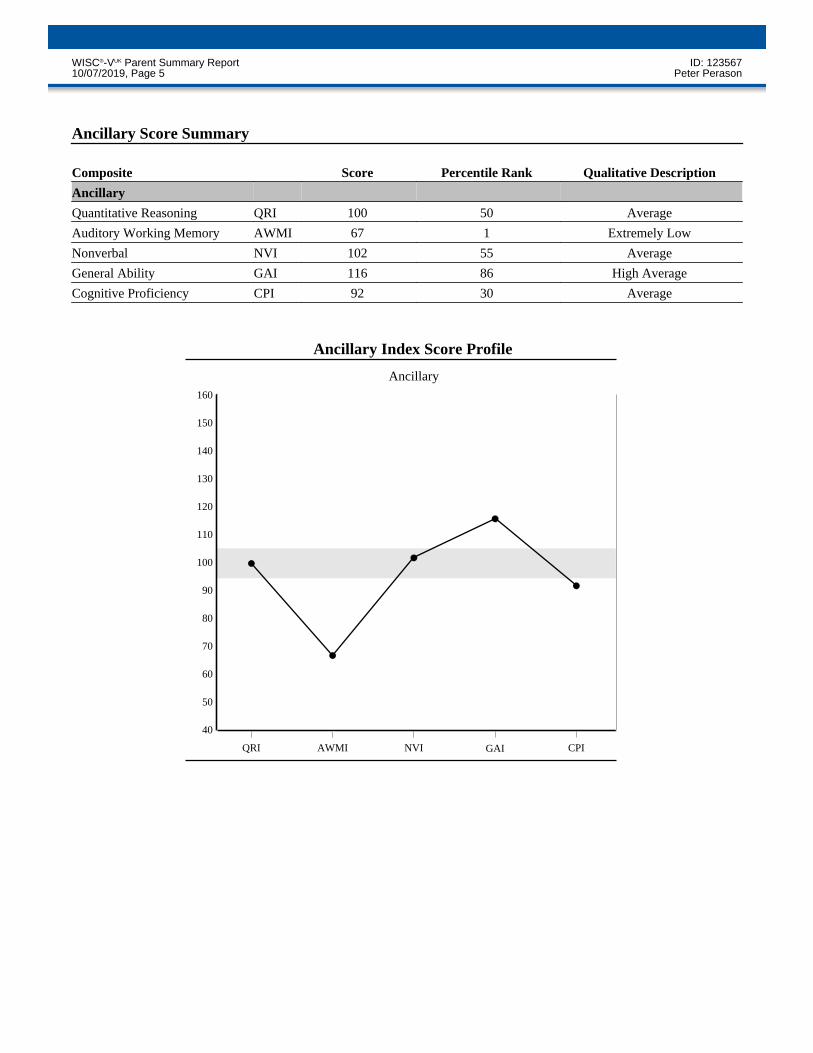
Quantitative Reasoning QRI 100 50 Average
Auditory Working Memory AWMI 67 1 Extremely Low
Nonverbal NVI 102 55 Average
General Ability GAI 116 86 High Average
Cognitive Proficiency CPI 92 30 Average
80
70
60
GAI
50
40
100
NVI CPIQRI
90
110
140
130
120
Ancillary Index Score Profile
160
150
Ancillary
AWMI
WISC®-VUK Parent Summary Report ID: 12356710/07/2019, Page 5 Peter Perason