Embed Size (px)
DESCRIPTION
Women in Astronomy II: Ten Years After. Report and Discussion by UC Berkeley Attendees November 19, 2003. Ximena Cid Amanda Heiderman Jennifer Hoffman Liliana Lopez Loraine Lundquist. Brenda Matthews Ruth Murray Alice Shapley Cassandra VanOutryve. * Thanks to Luisa Rebull, Caltech. - PowerPoint PPT Presentation
Citation preview
Women in Astronomy II:Ten Years After
Report and Discussion by UC Berkeley Attendees
November 19, 2003
Ximena Cid
Amanda Heiderman
Jennifer Hoffman
Liliana Lopez
Loraine Lundquist
Brenda Matthews
Ruth Murray
Alice Shapley
Cassandra VanOutryve
* Thanks to Luisa Rebull, Caltech
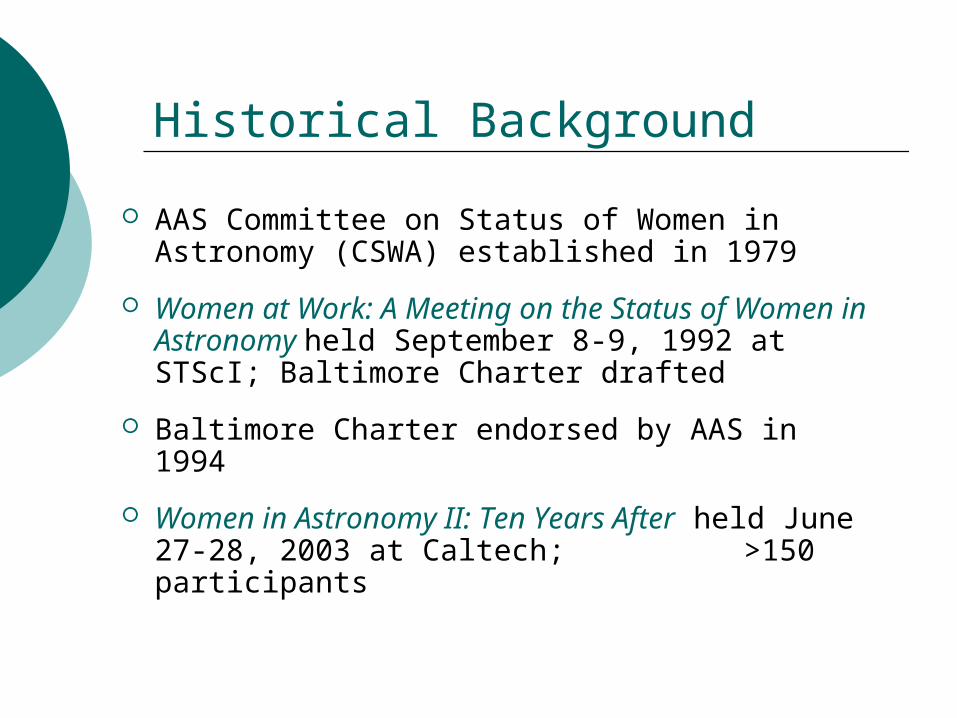
Historical Background
AAS Committee on Status of Women in Astronomy (CSWA) established in 1979
Women at Work: A Meeting on the Status of Women in Astronomy held September 8-9, 1992 at STScI; Baltimore Charter drafted
Baltimore Charter endorsed by AAS in 1994
Women in Astronomy II: Ten Years After held June 27-28, 2003 at Caltech; >150 participants
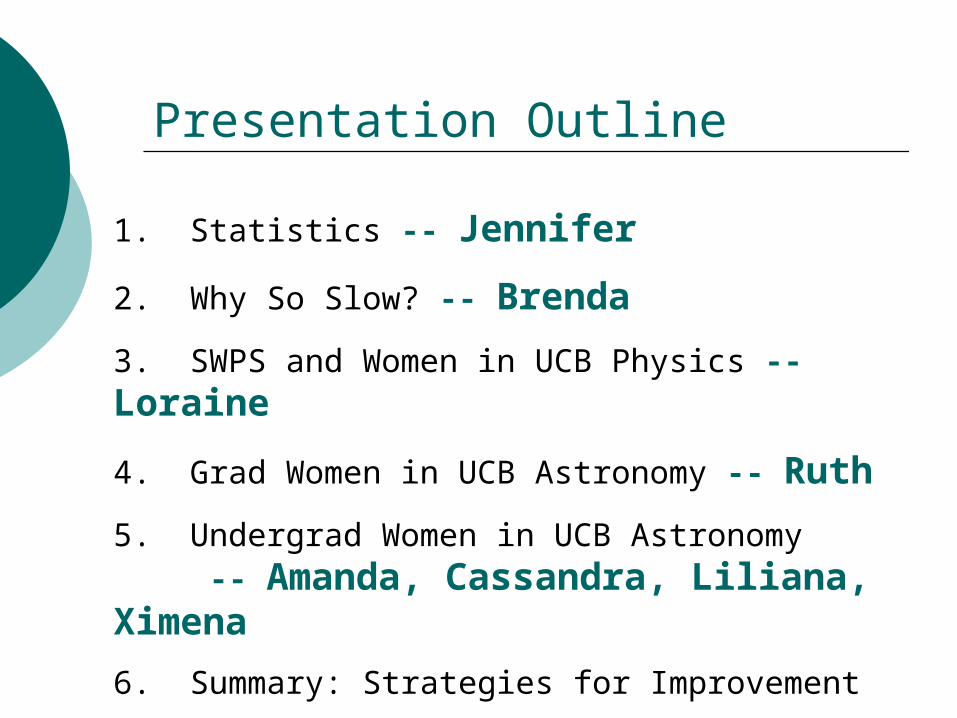
1. Statistics -- Jennifer
2. Why So Slow? -- Brenda
3. SWPS and Women in UCB Physics -- Loraine
4. Grad Women in UCB Astronomy -- Ruth
5. Undergrad Women in UCB Astronomy -- Amanda, Cassandra, Liliana, Ximena
6. Summary: Strategies for Improvement
Presentation Outline
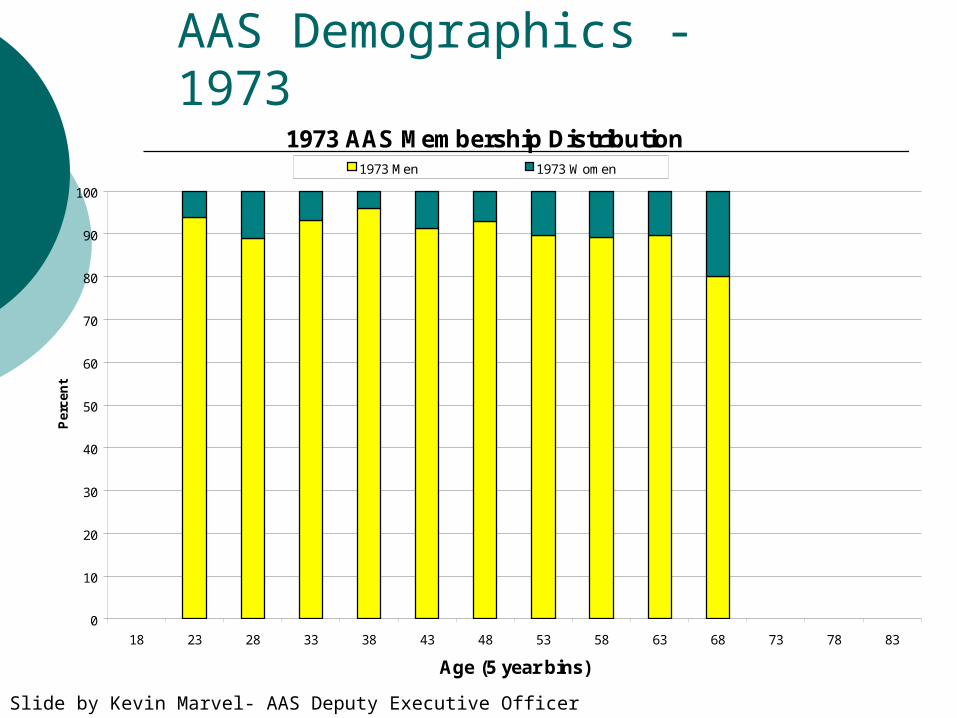
AAS Demographics - 19731973 AAS Membership Distribution
0
10
20
30
40
50
60
70
80
90
100
18 23 28 33 38 43 48 53 58 63 68 73 78 83
Age (5 year bins)
Per
cen
t
1973 Men 1973 Women
Slide by Kevin Marvel- AAS Deputy Executive Officer
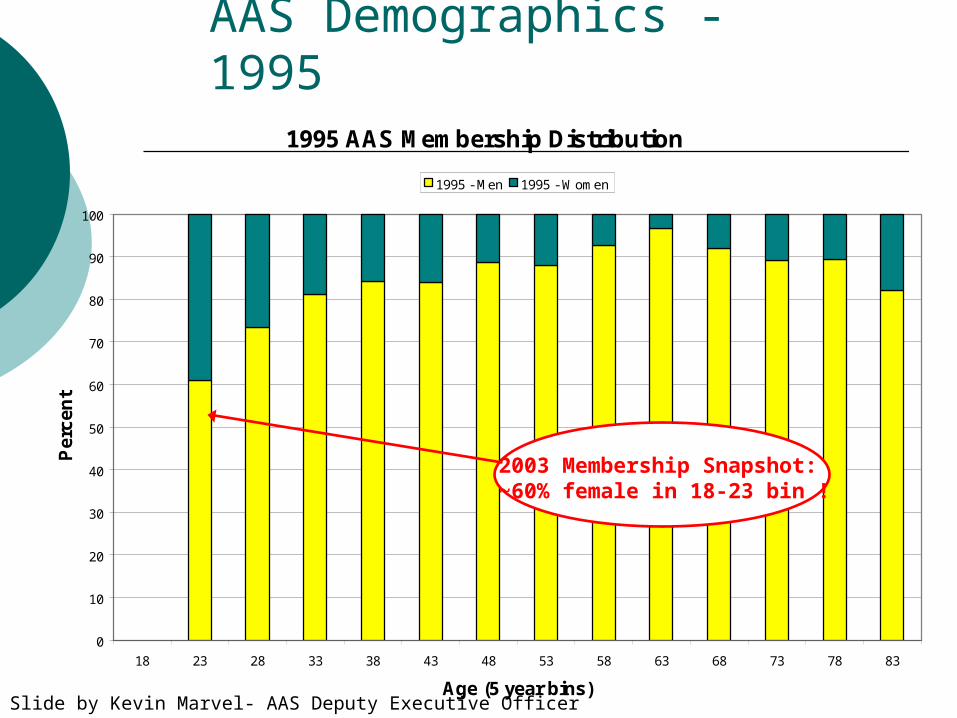
AAS Demographics - 19951995 AAS Membership Distribution
0
10
20
30
40
50
60
70
80
90
100
18 23 28 33 38 43 48 53 58 63 68 73 78 83
Age (5 year bins)
Per
cen
t
1995 - Men 1995 - Women
Slide by Kevin Marvel- AAS Deputy Executive Officer
2003 Membership Snapshot:~60% female in 18-23 bin !
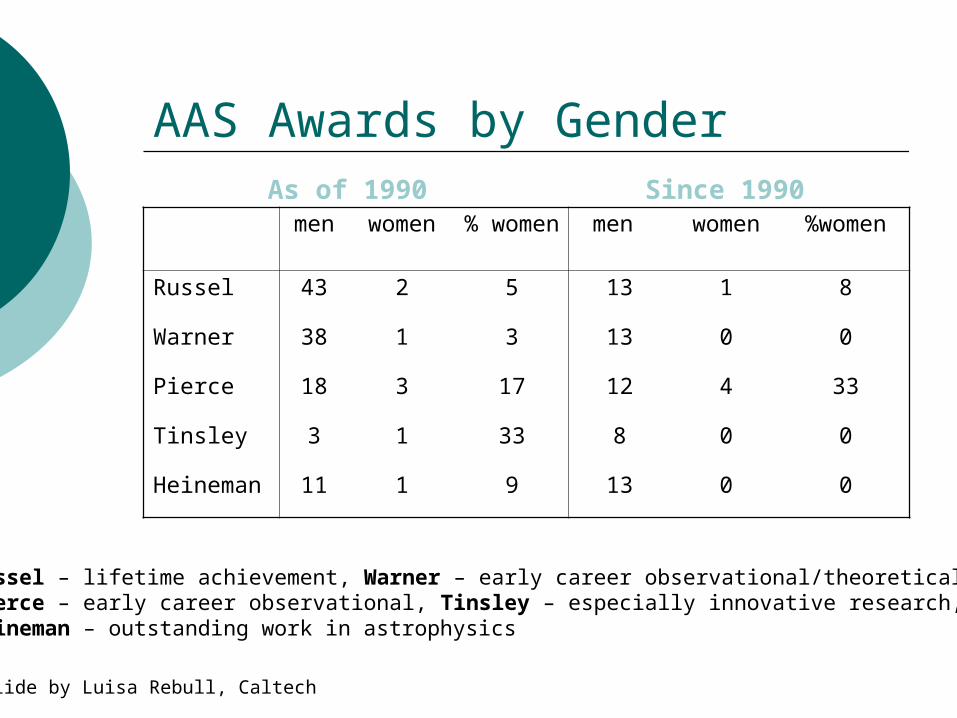
men women % women
men women %women
Russel 43 2 5 13 1 8
Warner 38 1 3 13 0 0
Pierce 18 3 17 12 4 33
Tinsley 3 1 33 8 0 0
Heineman 11 1 9 13 0 0
As of 1990 Since 1990
Russel – lifetime achievement, Warner – early career observational/theoretical, Pierce – early career observational, Tinsley – especially innovative research, Heineman – outstanding work in astrophysics
AAS Awards by Gender
Slide by Luisa Rebull, Caltech
1966 1971 1976 1981 1986 1991 1996 20010%
5%
10%
15%
20%
25%
30%
35%
40%
1966 1971 1976 1981 1986 1991 1996 20010%
5%
10%
15%
20%
25%
30%
35%
40%
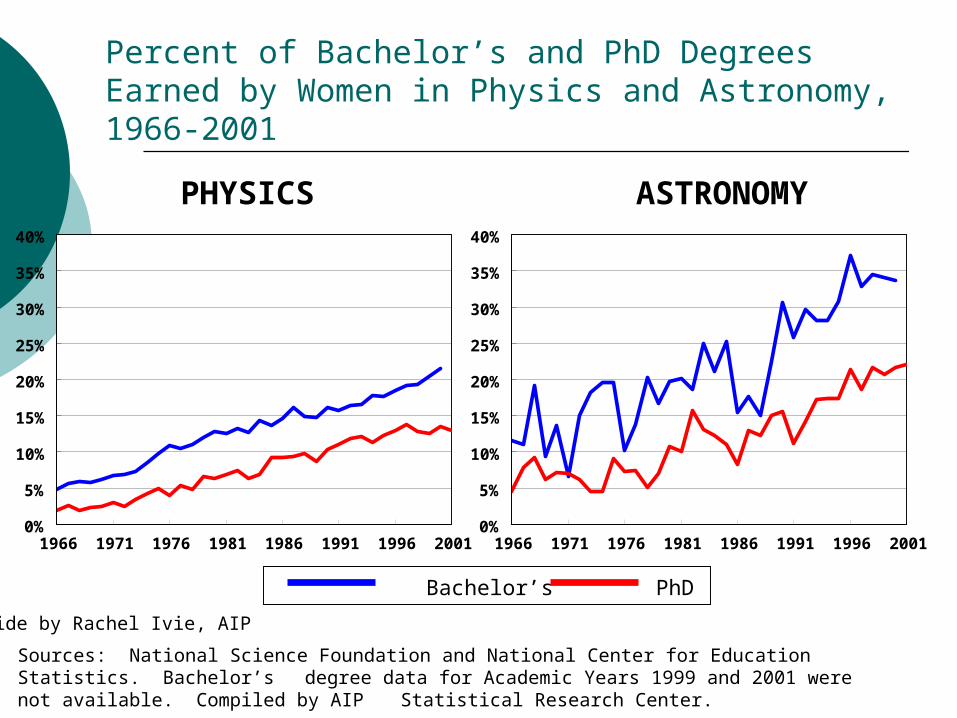
PHYSICS ASTRONOMY
Bachelor’s PhD
Sources: National Science Foundation and National Center for Education Statistics. Bachelor’s degree data for Academic Years 1999 and 2001 were not available. Compiled by AIP Statistical Research Center.
Percent of Bachelor’s and PhD Degrees Earned by Women in Physics and Astronomy, 1966-2001
Slide by Rachel Ivie, AIP
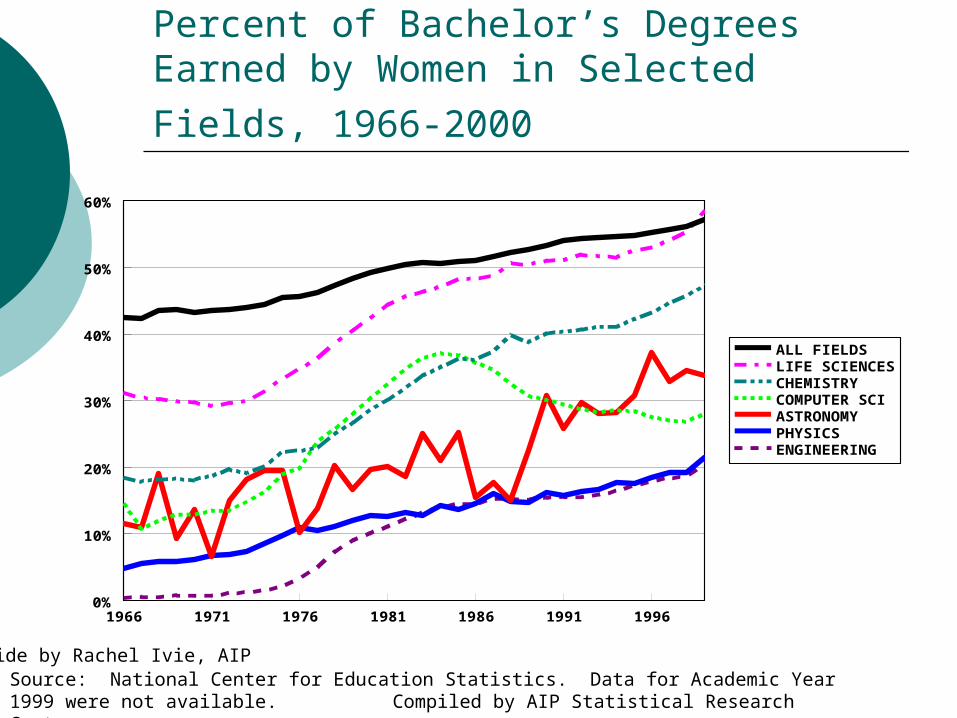
Source: National Center for Education Statistics. Data for Academic Year 1999 were not available. Compiled by AIP Statistical Research Center.
1966 1971 1976 1981 1986 1991 19960%
10%
20%
30%
40%
50%
60%
ALL FIELDSLIFE SCIENCESCHEMISTRYCOMPUTER SCIASTRONOMYPHYSICSENGINEERING
Percent of Bachelor’s Degrees Earned by
Women in Selected Fields, 1966-2000
Slide by Rachel Ivie, AIP
1958 1963 1968 1973 1978 1983 1988 1993 19980%
5%
10%
15%
20%
25%
30%
35%
40%
45%
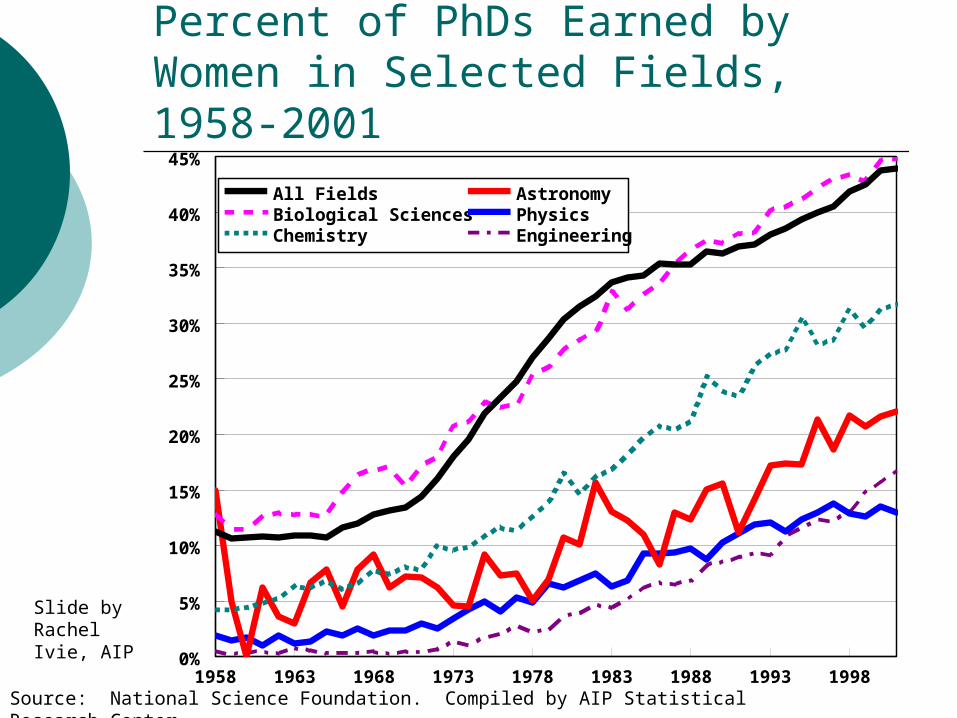
All FieldsBiological SciencesChemistry
AstronomyPhysicsEngineering
Source: National Science Foundation. Compiled by AIP Statistical Research Center.
Percent of PhDs Earned by Women in Selected Fields, 1958-2001
Slide by Rachel Ivie, AIP
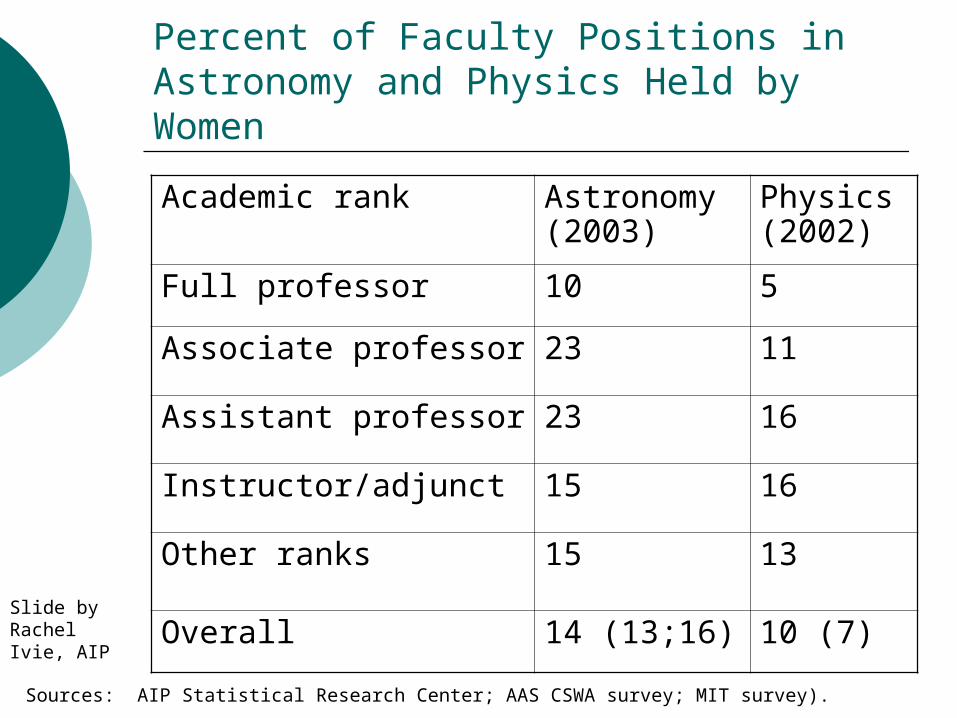
Sources: AIP Statistical Research Center; AAS CSWA survey; MIT survey).
Percent of Faculty Positions in Astronomy and Physics Held by Women
Academic rank Astronomy (2003)
Physics (2002)
Full professor 10 5
Associate professor 23 11
Assistant professor 23 16
Instructor/adjunct 15 16
Other ranks 15 13
Overall 14 (13;16) 10 (7)Slide by Rachel Ivie, AIP
Mean Years since PhD (2002)
% PhDs to Women at that time (year)
% Women Faculty, 2002AIP (CSWA)
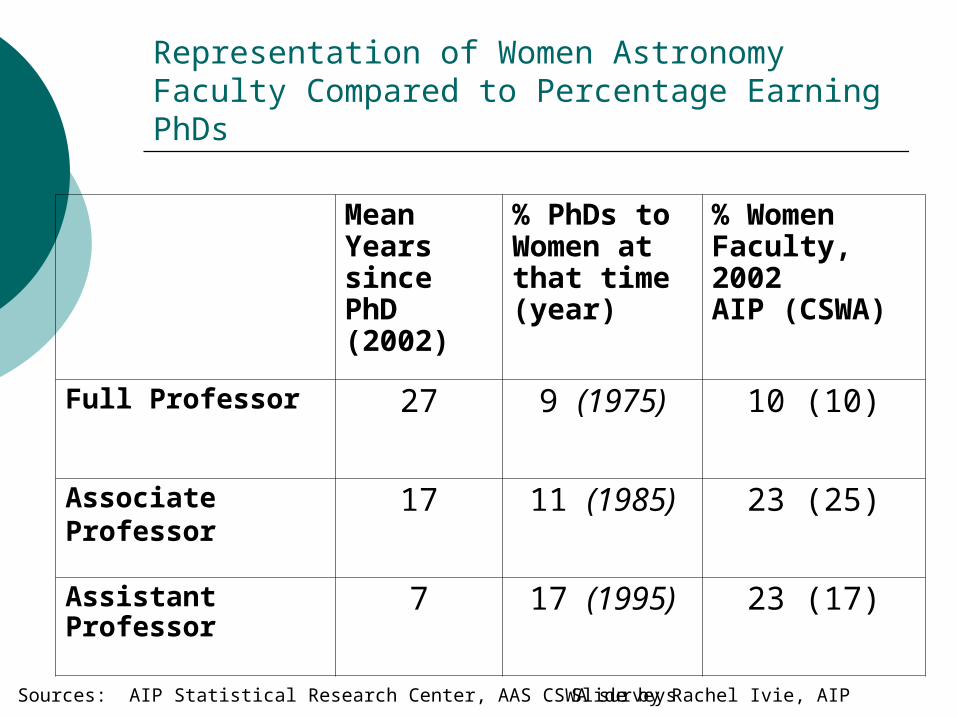
Full Professor 27 9 (1975) 10 (10)
Associate Professor
17 11 (1985) 23 (25)
Assistant Professor
7 17 (1995) 23 (17)
Sources: AIP Statistical Research Center, AAS CSWA surveys
Representation of Women Astronomy Faculty Compared to Percentage Earning PhDs
Slide by Rachel Ivie, AIP
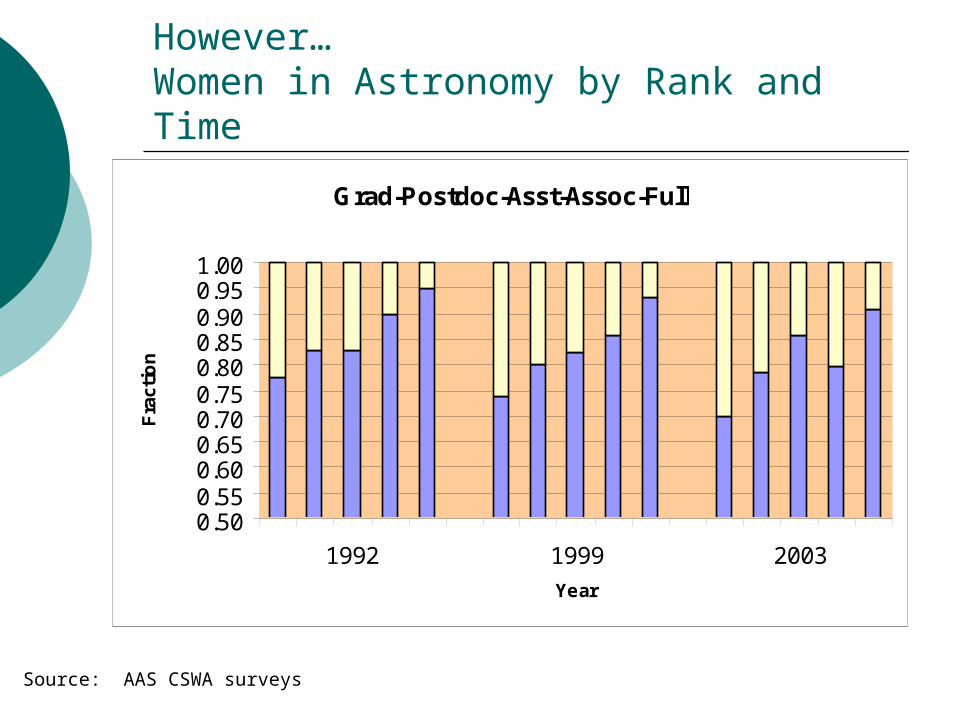
Grad-Postdoc-Asst-Assoc-Full
0.500.550.600.650.700.750.800.850.900.951.00
1992 1999 2003
Year
Fra
ctio
n
Source: AAS CSWA surveys
However… Women in Astronomy by Rank and Time
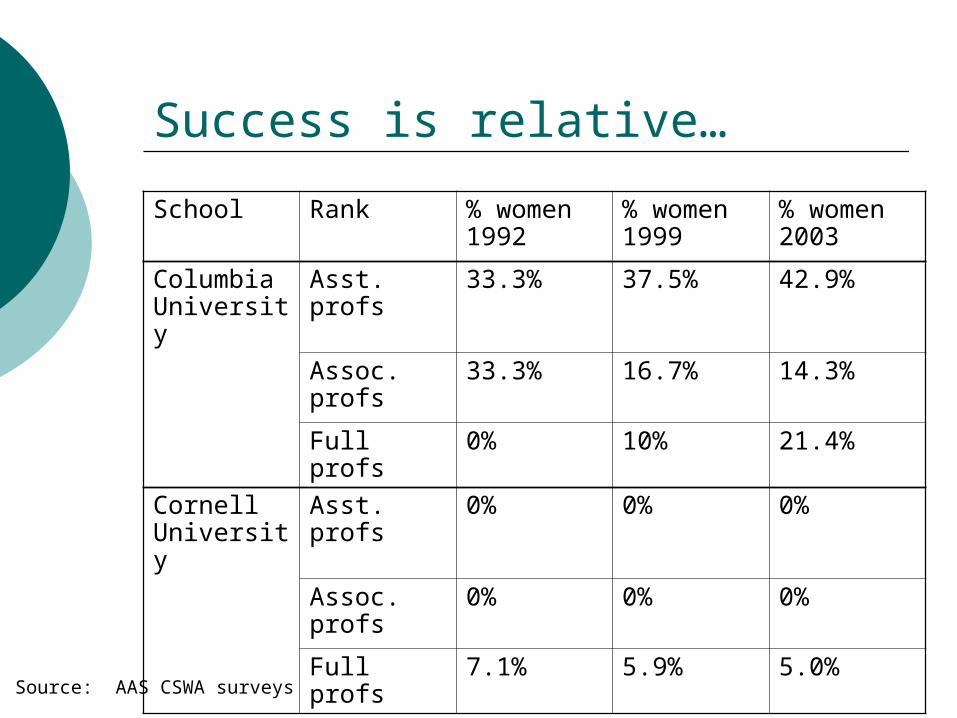
Success is relative…
School Rank % women 1992
% women 1999
% women 2003
Columbia University
Asst. profs 33.3% 37.5% 42.9%
Assoc. profs
33.3% 16.7% 14.3%
Full profs 0% 10% 21.4%
Cornell University
Asst. profs 0% 0% 0%
Assoc. profs
0% 0% 0%
Full profs 7.1% 5.9% 5.0%
Source: AAS CSWA surveys
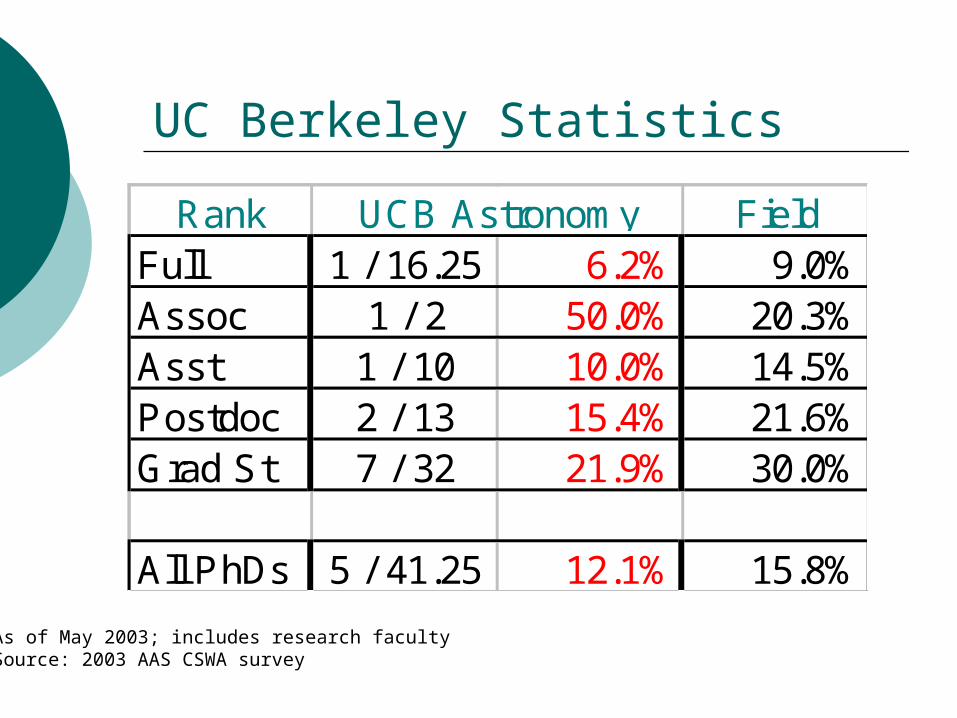
As of May 2003; includes research facultySource: 2003 AAS CSWA survey
UC Berkeley Statistics
Rank FieldFull 1 / 16.25 6.2% 9.0%Assoc 1 / 2 50.0% 20.3%Asst 1 / 10 10.0% 14.5%Postdoc 2 / 13 15.4% 21.6%Grad St 7 / 32 21.9% 30.0%
All PhDs 5 / 41.25 12.1% 15.8%
UCB Astronomy
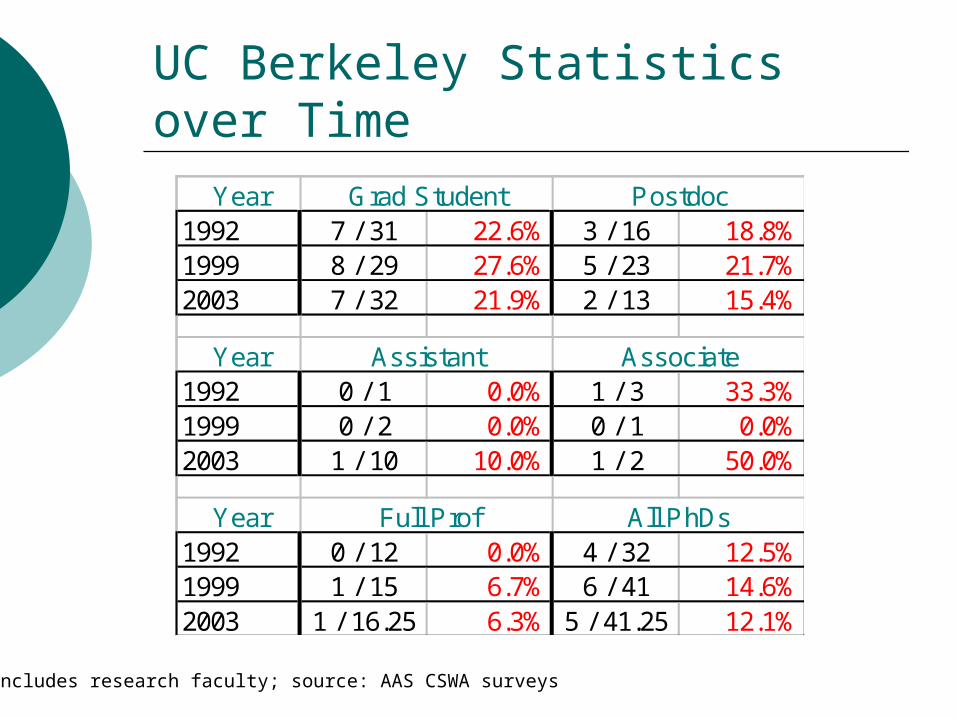
UC Berkeley Statistics over Time
Includes research faculty; source: AAS CSWA surveys
Year1992 7 / 31 22.6% 3 / 16 18.8%1999 8 / 29 27.6% 5 / 23 21.7%2003 7 / 32 21.9% 2 / 13 15.4%
Year1992 0 / 1 0.0% 1 / 3 33.3%1999 0 / 2 0.0% 0 / 1 0.0%2003 1 / 10 10.0% 1 / 2 50.0%
Year1992 0 / 12 0.0% 4 / 32 12.5%1999 1 / 15 6.7% 6 / 41 14.6%2003 1 / 16.25 6.3% 5 / 41.25 12.1%
Full Prof All PhDs
AssociateAssistant
Grad Student Postdoc
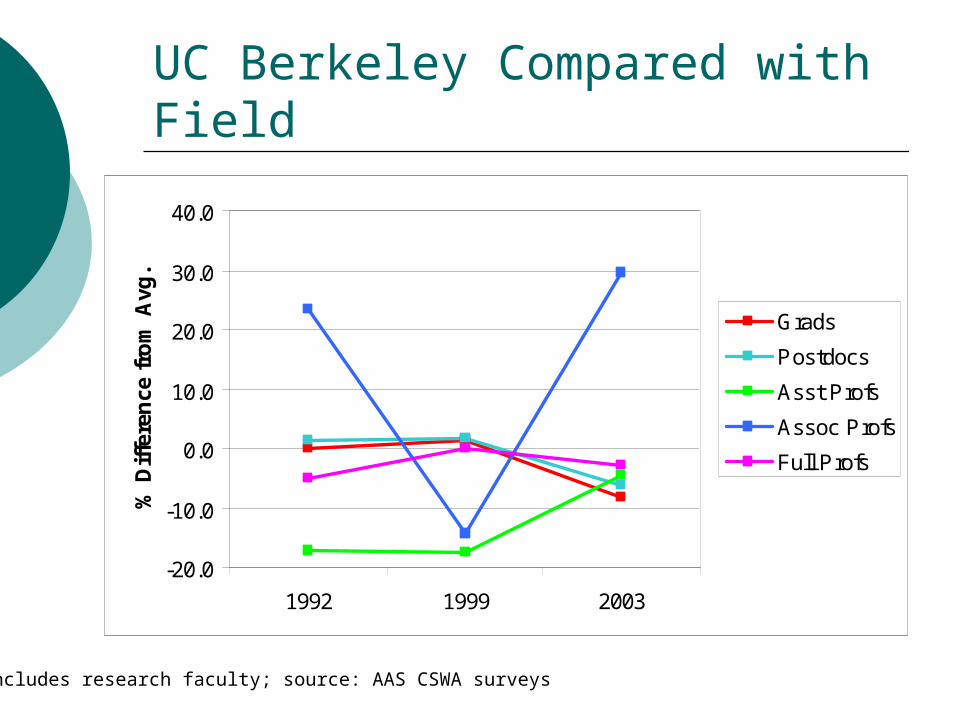
UC Berkeley Compared with Field
Includes research faculty; source: AAS CSWA surveys
-20.0
-10.0
0.0
10.0
20.0
30.0
40.0
1992 1999 2003
% D
iffe
ren
ce f
rom
Avg
.
Grads
Postdocs
Asst Profs
Assoc Profs
Full Profs
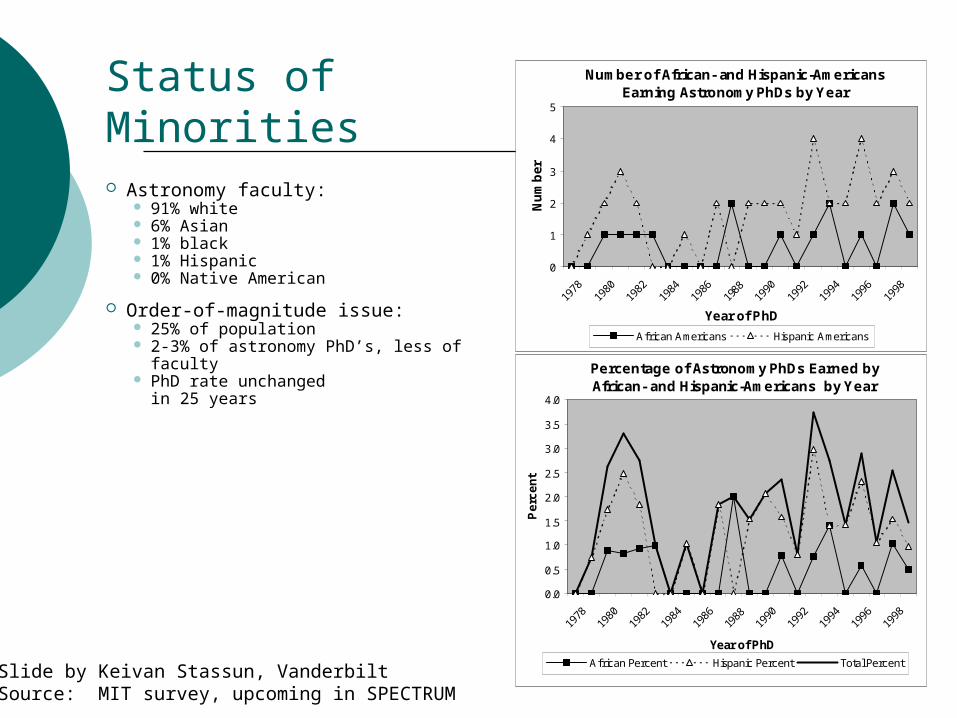
Status of Minorities
Astronomy faculty: 91% white 6% Asian 1% black 1% Hispanic 0% Native American
Order-of-magnitude issue: 25% of population 2-3% of astronomy PhD’s, less of faculty PhD rate unchanged
in 25 years
Number of African- and Hispanic-Americans Earning Astronomy PhDs by Year
0
1
2
3
4
5
1998
1996
1994
1992
1990
1988
1986
1984
1982
1980
1978
Year of PhD
Nu
mb
er
African Americans Hispanic Americans
Percentage of Astronomy PhDs Earned by African- and Hispanic-Americans by Year
0.0
0.5
1.0
1.5
2.0
2.5
3.0
3.5
4.0
1998
1996
1994
1992
1990
1988
1986
1984
1982
1980
1978
Year of PhD
Pe
rce
nt
African Percent Hispanic Percent Total PercentSlide by Keivan Stassun, VanderbiltSource: MIT survey, upcoming in SPECTRUM
Summary of Statistics
The number of women entering astronomy is increasing (women are now >50% of youngest AAS members, 34% of bachelors).
The overall percentage of women in astronomy is also increasing, but less quickly (women are now 22% of PhDs,14% of faculty).
Percentages are still low compared with most other sciences; the “PhD gap” is not closing.
Women are underrepresented among AAS award recipients.
Summary of Statistics, cont.
The “leaky pipeline” may be less of a concern than once thought (but note limitations of study).
At UCB, percentages are near average and holding; no trend towards increased representation.
Minorities are severely underrepresented in astronomy: 25% of population, 1-2% of astronomy faculty.
More detailed studies are needed, especially tracking of specific cohorts.
Highlights and Recurring Themes
This conference had lots of people who weren’t astronomers sharing knowledge, experience from other fields.
Several phrases or themes kept reappearing…
Highlights and Recurring Themes Women are rarely found in the pool of tenured
faculty in the sciences, due to both ‘chance’ and ‘choice’ (1)
requires a ‘perfect trajectory’
any serious event (illness for yourself or in the family, baby, etc) can throw you off
Reality is that the consequences of “real life situations” fall disproportionately on women
Academic life does not mesh well with family life; both academia and parenthood are ‘all-consuming.’
Active discouragement of people who want to teach; people who want to teach tend to leave. (People who want to “make a difference” tend to want to teach…)
Highlights and Recurring Themes Women are rarely found in the pool of tenured faculty
in the sciences, due to both ‘chance’ and ‘choice’ (2)
Culture of academia is “broken” and unappealing – for everyone, not just women
Why would anyone be a professor? In chemistry, women who get their PhD’s from “top tier”
schools rarely return to academia.
Given all of this, women tend to have more openness to other options; when chances come along, women will take the plunge and try something different
Serendipity rather than by design.
Highlights and Recurring Themes
To find out how the system does/doesn’t work
Ask people who have left the system too
Everyone has biases, preconceptions, ‘schemas,’ many of which they don’t recognise themselves
People can be evaluated differently for the same qualifications/behaviour/position
Similar biases shown by men and women
Highlights and Recurring Themes Gender schemas (preconceptions) affect everyone,
everywhere.
Studies suggest that we can’t adequately assess something as quantitative as heights of people – how will we ever assess CVs? (Steinpreis et al 1999: psych profs prefer Brian’s application to Karen’s 2:1 even though they were identical!)
There is bias in EVERYTHING we do, from hiring process to interactions in meetings.
Bottom line: women tend to benefit less from their qualifications than men (everywhere).
Accumulations of little inequities – adds up!
Mountains are molehills (piled high)
Computer model of promotion practices (Martell et al. 1996)
Organization with 8-level hierarchy staffed at bottom level with equal numbers of men & women
Model assumed promotion over time with tiny bias favoring men (bias of 1% in the inherent variability of promotion)
After many promotion series, highest level was 65% male
Small Effects Have Measurable Consequences!
It is unfair to neglect even minor instances of group-based bias, because the results can be large disparities in salary, promotion & prestige.
Highlights and Recurring Themes
What to do about gender schemas
Educate ourselves and our colleagues. Helps to have more women in the pipeline, but not a solution in and of itself. Takes effort just to keep from losing ground.
Women (on average) believe science is a meritocracy, more than men. Work to set up clear, open procedures that make it a meritocracy.
Highlights and Recurring Themes
Science is an ‘anomic’ profession.
“Anomie” is a social situation in which rules for behavior are unclear, arcane, shifting, missing, and/or conflicting, with shifting boundaries.
You can never give enough. (Parenthood is also like this.)
This sort of situation statistically tends to benefit men over women.
What to do about ‘anomie’. Clear and well-defined criteria for hiring, promotion
(and everything else, like computer upgrades). Standardize processes, make them open and
transparent.
Highlights and Recurring Themes The current system works for some people
Easier for some people to advance than others People who stay are ones who adapted/fitted well with the
current system Doesn’t mean that if the system doesn’t work for someone
that they are the problem
Better if it worked for more people Larger pool of people coming into the system Larger variety of insights/talents better research
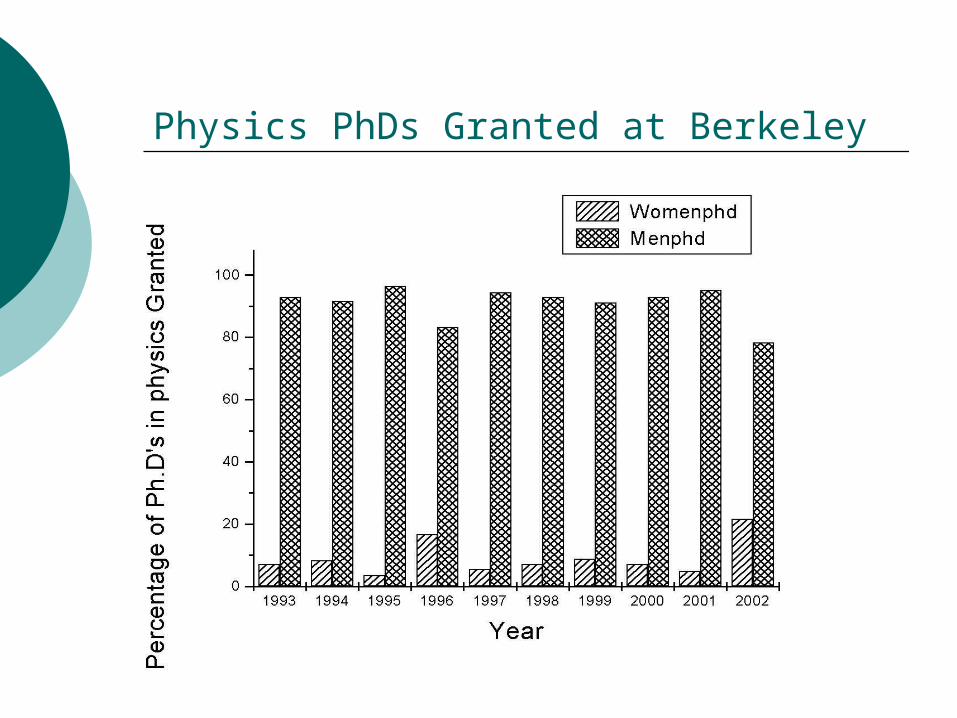
Physics PhDs Granted at Berkeley
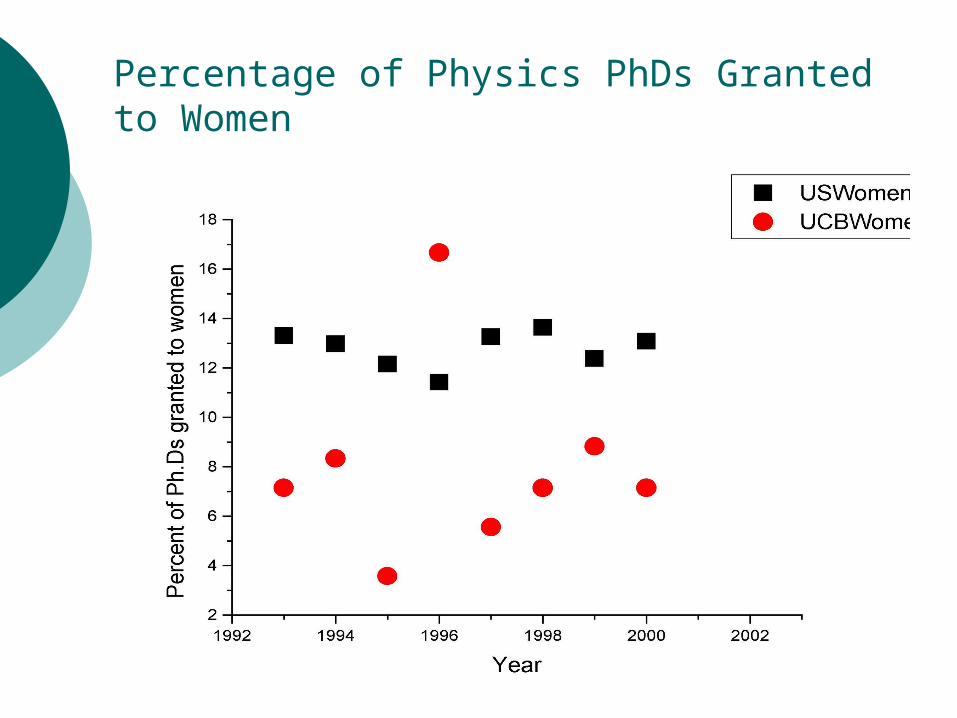
Percentage of Physics PhDs Granted to Women
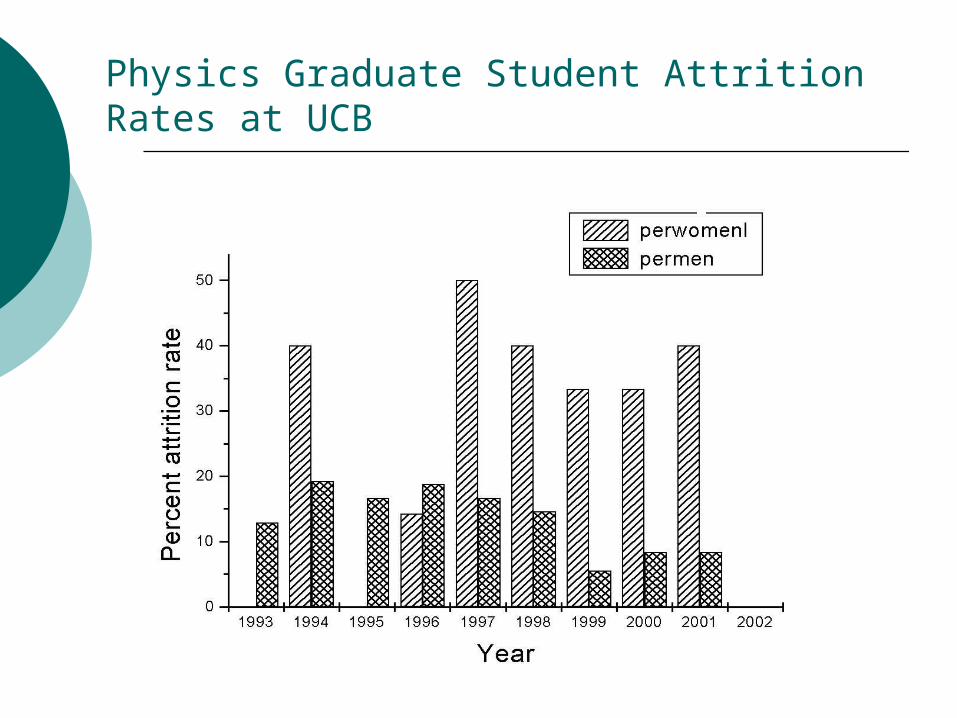
Physics Graduate Student Attrition Rates at UCB
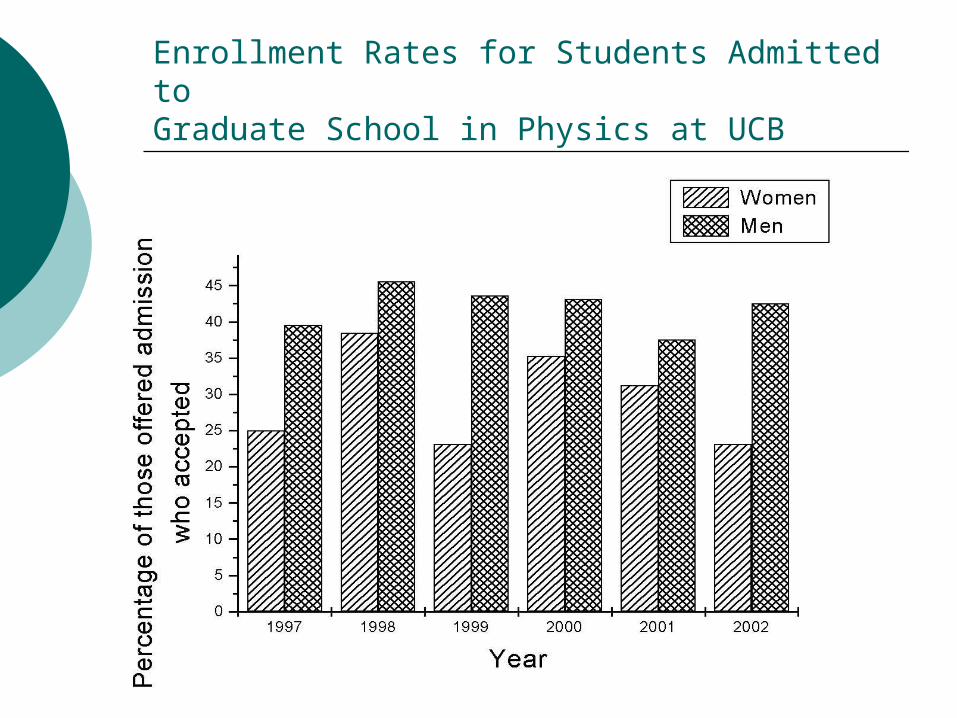
Enrollment Rates for Students Admitted toGraduate School in Physics at UCB
0
5
10
15
20
25
30
35
40
45
50
1984
1985
1986
1987
1988
1989
1990
1991
1992
1993
1994
1995
1996
1997
1998
1999
2000
2001
Year
Per
cen
t W
om
en
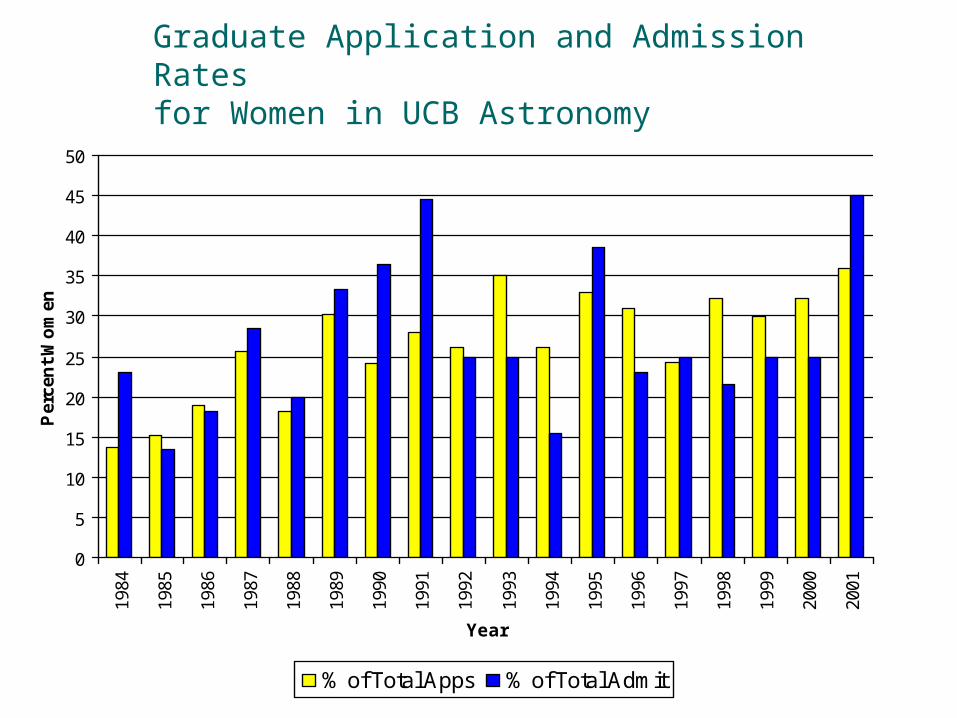
% of Total Apps % of Total Admit
Graduate Application and Admission Rates for Women in UCB Astronomy
0
10
20
30
40
50
60
70
1984
1985
1986
1987
1988
1989
1990
1991
1992
1993
1994
1995
1996
1997
1998
1999
2000
2001
Year
Per
cen
t W
om
en
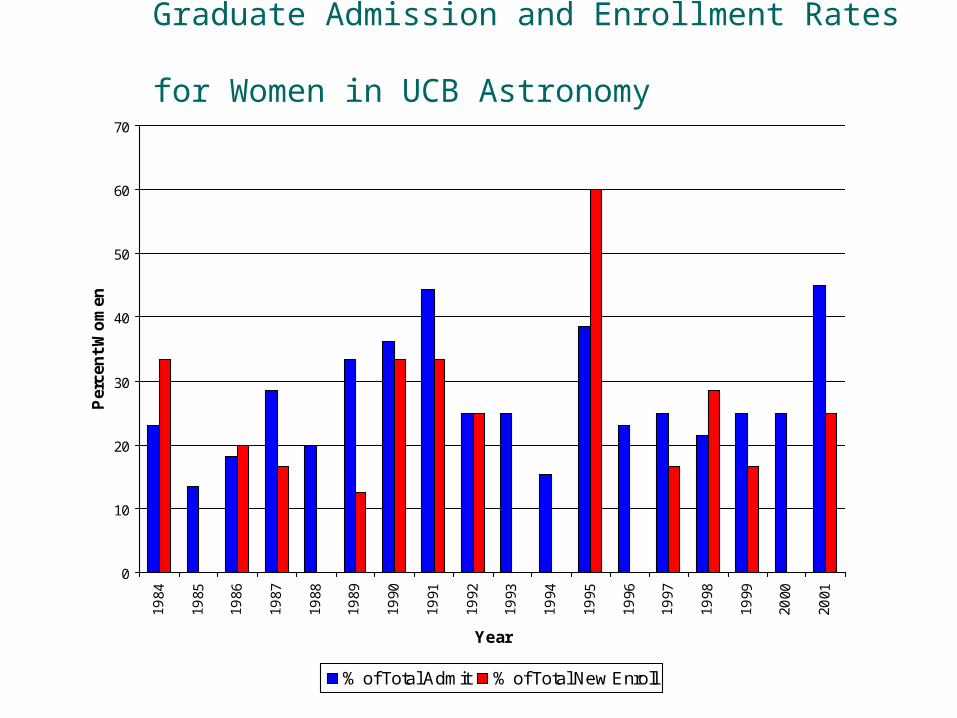
% of Total Admit % of Total New Enroll
Graduate Admission and Enrollment Rates for Women in UCB Astronomy
0
10
20
30
40
50
60
7019
84
1985
1986
1987
1988
1989
1990
1991
1992
1993
1994
1995
1996
1997
1998
1999
2000
2001
Year
Per
cen
t W
om
en
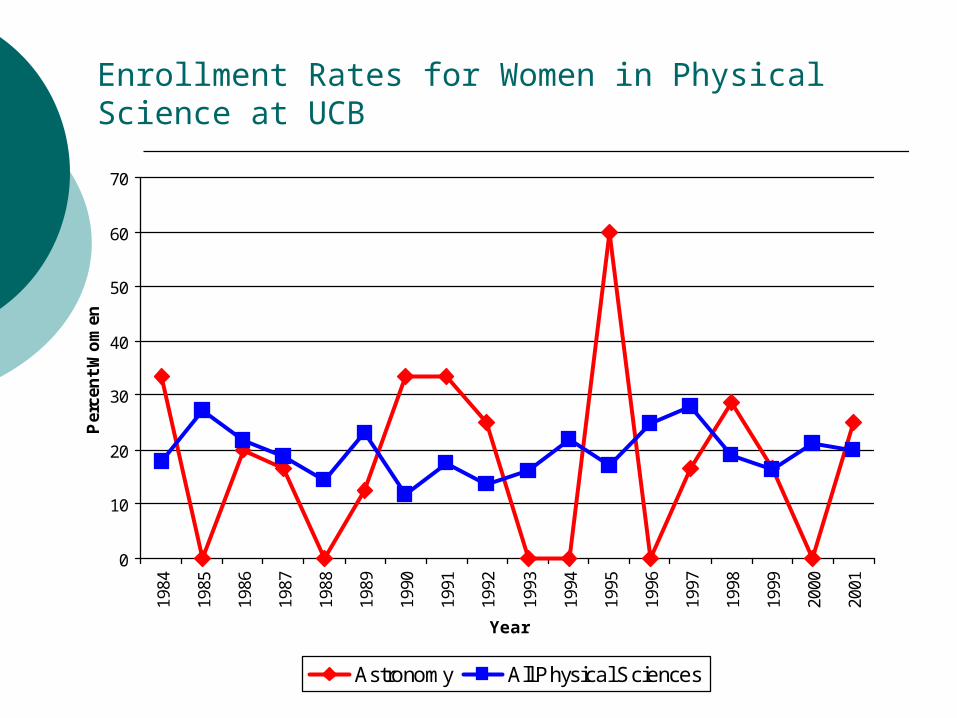
Astronomy All Physical Sciences
Enrollment Rates for Women in Physical Science at UCB
The grad students are generally happy
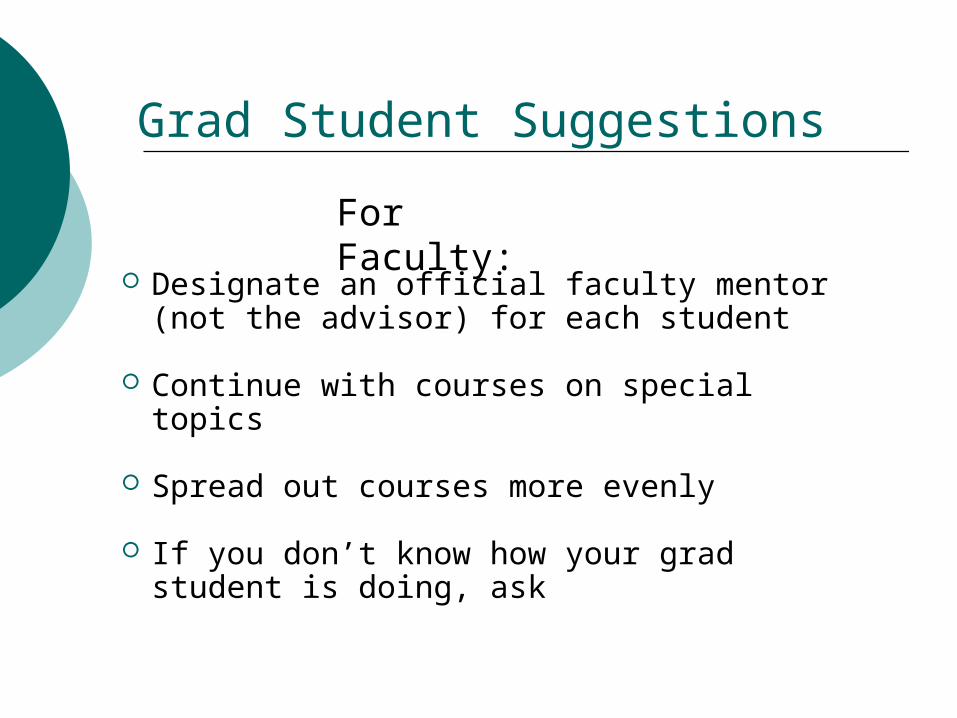
Grad Student Suggestions
Designate an official faculty mentor (not the advisor) for each student
Continue with courses on special topics
Spread out courses more evenly
If you don’t know how your grad student is doing, ask
For Faculty:
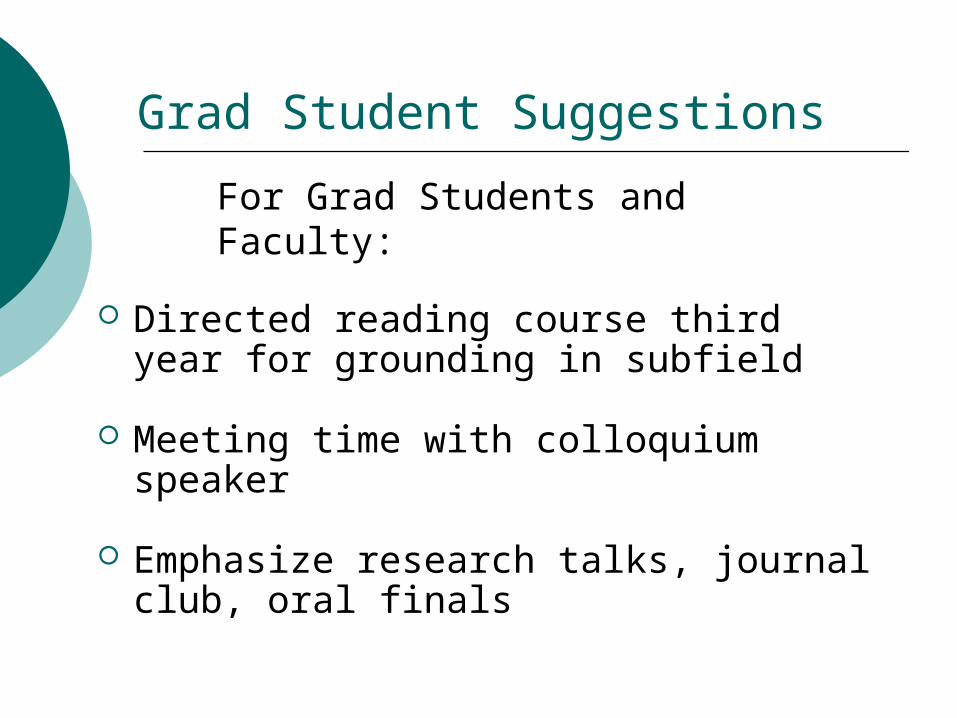
Grad Student Suggestions
Directed reading course third year for grounding in subfield
Meeting time with colloquium speaker
Emphasize research talks, journal club, oral finals
For Grad Students and Faculty:
Women in Astronomy: Women in Astronomy: An Undergraduate An Undergraduate
PerspectivePerspective
Presented By: Presented By:
Liliana Lopez * Amanda Heiderman Liliana Lopez * Amanda Heiderman Ximena Cid * Cassy VanOutryveXimena Cid * Cassy VanOutryve
OutlineOutlineEnvironmentEnvironment TALC & UG AstrolabTALC & UG Astrolab Student - Student Interactions Student - Student Interactions Prof/GSI - Student InteractionsProf/GSI - Student Interactions A minority perspectiveA minority perspective
SuggestionsSuggestions Importance of MentorshipImportance of Mentorship Availability of InformationAvailability of Information
Concluding RemarksConcluding Remarks
Environment Environment
Hospitable DepartmentHospitable Department Undergraduate statisticsUndergraduate statistics
20 out of 51 are female (39%)20 out of 51 are female (39%) Undergraduates are comfortable Undergraduates are comfortable
regardless of genderregardless of gender TALCTALC UG AstrolabUG Astrolab
EnvironmentEnvironment
Student-Student InteractionsStudent-Student Interactions
Equality Equality Community Community SupportSupport
EnvironmentEnvironment
Professor/GSI – Student InteractionsProfessor/GSI – Student Interactions
ApproachableApproachable FriendlyFriendly InteractiveInteractive
EnvironmentEnvironment
Lack of a minority presence in higher Lack of a minority presence in higher positionspositions
Why it is importantWhy it is important
SuggestionsSuggestions
Importance of MentorshipImportance of Mentorship
What is a Mentor? What is a Mentor? Someone who helps the mentee realize their Someone who helps the mentee realize their
potentialpotential What can Mentors provide?What can Mentors provide?
AdviceAdvice EncouragementEncouragement
SuggestionsSuggestions
Availability of InformationAvailability of Information Introduction to Astronomy DepartmentIntroduction to Astronomy Department Update WebsiteUpdate Website Information for double majorsInformation for double majors
ConclusionConclusion
In short, our overall experience in the In short, our overall experience in the department has been positive, but department has been positive, but the suggestions we have presented the suggestions we have presented can continue to enhance the can continue to enhance the education of both female and male education of both female and male undergraduates. undergraduates.
Strategies for Improvement:What Can We Do?
Nominate women and minorities for AAS and other awards, and for faculty job searches.
Respond to surveys; encourage AAS and other organizations to sponsor more studies.
Keep up with current statistics.
Participate in outreach projects.
Be aware of personal gender biases.
Keep in touch with your graduate students.
Individuals:
Strategies for Improvement:What Can We Do?
Regularly compile statistics on admission, attrition, graduation, fellowship and hiring pools; track graduates and others who leave the department.
Respond to surveys; encourage AAS and other organizations to sponsor more studies.
Order relevant books, studies for library.
Endorse the Baltimore Charter.
Department, general:
Strategies for Improvement:What Can We Do?
Make relevant statistics available to students. Designate faculty mentors. Continue with courses on special topics. Spread out courses more evenly. Establish a third-year directed reading course. Set up meetings with colloquium speakers. Emphasize research talks, journal club, oral finals.
Department, for grad students:
Strategies for Improvement:What Can We Do?
Make relevant statistics available to students.
Institute yearly orientation for majors and prospective majors.
Update website regularly.
Make undergrads aware of outreach opportunities (A100; another class?).
Department, for undergrads: