Embed Size (px)
Citation preview
Wood drying studies using white light speckle photography L. B e n c k e r t
Division of Experimental Mechanics, University of Technology, S-95187 Lule&, Sweden
White light speckle photography is a powerful tool for measuring displacement fields in the sub-millimetre range. Here it has been utilised to study deformation and crack development in a block of wood during drying. The use of a series of single exposures made it possible to monitor the changes of the wood's surface with time. By combining two of the negatives the displacements over a given time interval were obtained for, at least in principle, all points on the surface.
Keywords: Speckle photography, in-plane deformation, wood drying
I n t roduc t ion
Laser Light Speckle Photography (LLSP) and White Light Speckle Photography (WLSP) are versatile tools for the measurement of in-plane surface deformations (Archbold et al, 1970; Archbold and Ennos, 1972, 1975: Burch and Forno, 1975: Forno, 1975; Chiang and Asundi, 1979; Jonsson and Benckert, 1986; Huntley and Field, 1986: Benckert et al , 1987). Both LLSP and WLSP are whole-field methods that simultaneously record information about the in-plane displacement of all points on a surface, which is difficult to obtain by other means. A new application of WLSP is the study of the t ime-dependent deformations of wood caused by drying.
The principle for measurement with LLSP is based on the fact that the speckle pattern which forms on a surface illuminated by laser light seems to be attached to the sur- face and thus follows any displacement. By making a double-exposed negative of the surface, one exposure before and one after the displacement, two speckle patterns will be recorded. The displacement of a point on the surface is obtained from the displacement of the corresponding speckle on the negative. A narrow laser beam passing through the negative gives rise to inter- ference fringes inside a diffraction halo, which can be seen on a screen behind the negative. The direction of and distance between the fringes gives the displace- ment of the corresponding speckles, apart from a 180 ° ambiguity in the direction of the displacement. For a dis- placement to be measurable, an adequate number of fringes must appear on the screen. The minimum number is three while the maximum number is set by the fact that when the distance between the interference fringes approaches the size of the laser speckles in the diffraction halo, the former becomes difficult to ob- serve. In practice the ratio of the maximum displace- ment to the minimum displacement turns out to be about 10: 1.
In WLSP, the laser speckles are substituted by a pattern put directly onto the surface, for instance by printing or painting. White light is used for illumination. Analysis is made in the same way as for LLSP.
In most cases, LLSP will give results of higher ac- curacy than WLSP and is therefore the better choice. However, in the case of the drying of wood, WLSP is preferred since the microstructure of the wooden sur- face changes with time. The laser speckle patterns will become de-correlated resulting in interference fringes with zero or low visibility.
As explained above, WLSP usually involves making a double-exposure negative. When applied to wood this scheme was found less satisfactory because tile duration between exposures is of tile order of days or weeks, and because the magnitude of the deformation could be too large to be covered in one step. Therefore we have made several single exposures during the drying period, and by combining negatives from different times it was also possible to obtain information on the t ime-dependence of the drying process. This procedure also made it possible to introduce a suitable reference translation between the two images at the analysis stage by simply translating the negatives relative to one another. Thereby the sensitivity to small deformations was in- creased and the 180 ° ambiguity in the direction of the displacement was resolved (Benckert et al, 1987: Benckert, 1991). Another method to obtain the time dependence is to use two cameras and make a series of double-exposures in such a manner that Exposure 2 of Camera 1 coincides with Exposure 1 of Camera 2 and vice versa (Abdelmoulah et al. 1990). This procedure has, however, the disadvantage that the development of the deformation with time must be approximately known in advance so that a suitable deformation occurs between the two exposures, resulting in good inter- ference patterns.
E x p e r i m e n t a l
The measurements presented here were made on a piece of raw pine with dimensions 285x 175x60 mm and cut with the centre of the heartwood on one side and the rim of the heartwood just reaching the middle of the other side. The cross-cut wood was sealed with silicon to
24 Measurement Vo110 No 1, Jan-Mar 1992
Front view TOD view
Wooden block Semirefleeting Camera
Optical axis
Reference surface White light source
Fig I Evperimental set-up. W/rite light is directed onto the object, which is painted with retroflective paint, via a semi-reflecting mirror. The reflected light is recorded by the camera. This arrangement is necessa O, because the glass beads in the retroreflective paint reflect light in a very narrow cone around the direction of the incident light. It is also shown how an out-of-plane motion for a point off the optical axis of the camera will be recorded as an apparent in-plane motion
prevent the dissipation of moisture. All moisture con- sequently had to dissipate through the lateral surface of the piece of wood, thus resembling the drying of a full- length batten. The piece of pine was put in the set-up of Fig 1 with two supports under the short side and one on the heartwood side and with the sapwood towards the camera. It was allowed to dry at room temperature with natural convection only. A piece of wood cut in this manner is prone to crack formation because of the gradient in the moisture content which will occur during drying.
The surface facing the camera was painted with rctro- reflective paint containing glass beads of about 0.05 mm diameter, which then constituted the required pattern (Chiang and Asundi, 1979). The camera was working at a demagnification of I : 10.9, which means that the image size of the glass beads was of the order of (l.005 mm. To resolve the individual images a high quality lens and a film material with high resolving power is required. We employed a 35 mm Nikon camera with a Micronikkor lens (focal length = 55 ram) and Agfa 10E75 holo- graphic film.
The holder had a reference surface which was kept stationary. A series of 25 single exposures with a time interval of about 24 hours was made during the drying process. Two of the negatives were then combined in a holder where they could be translated relative to one
Benckert
another. The negatives were put in close contact, the two emulsions being separated by one emulsion substrate only.
A n a l y s i s
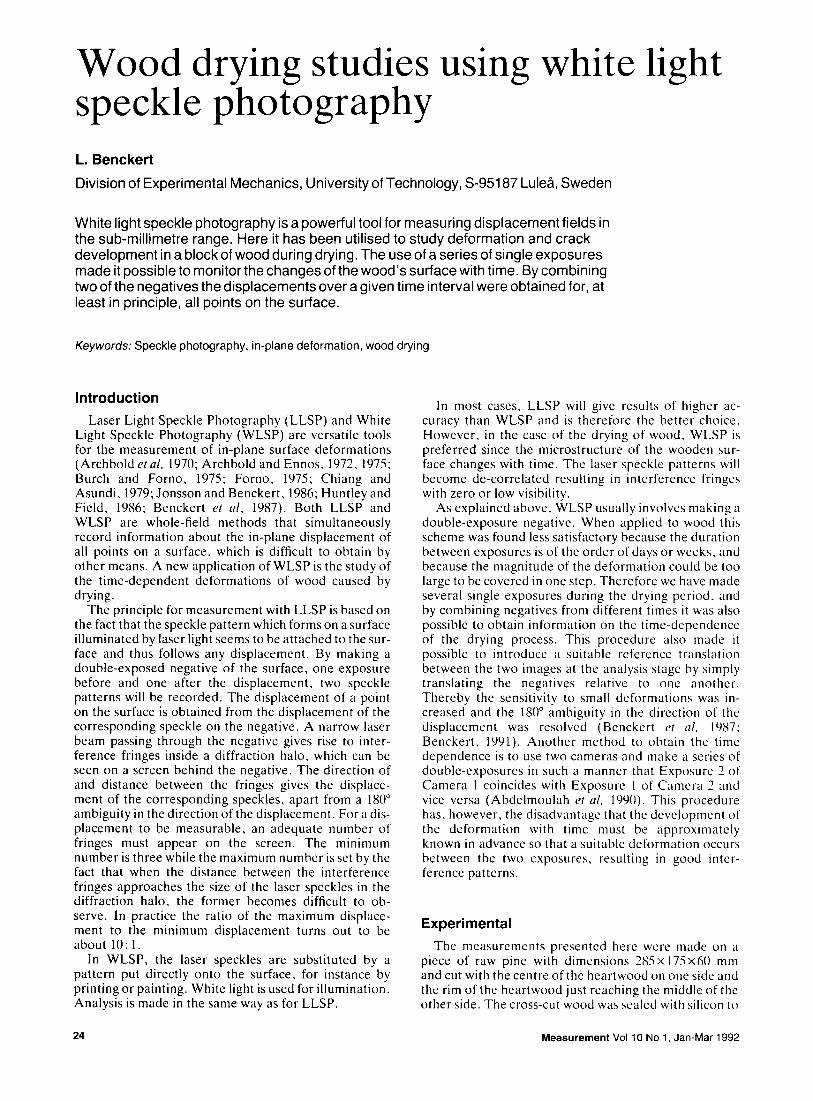
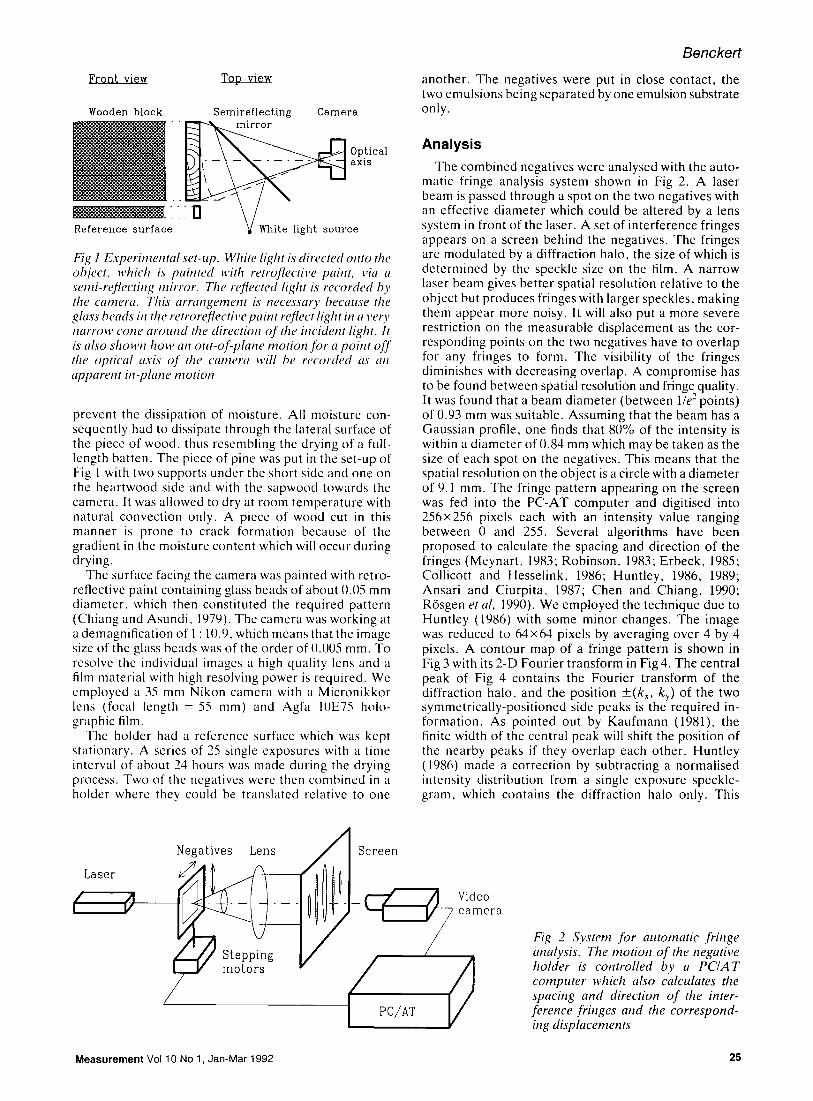
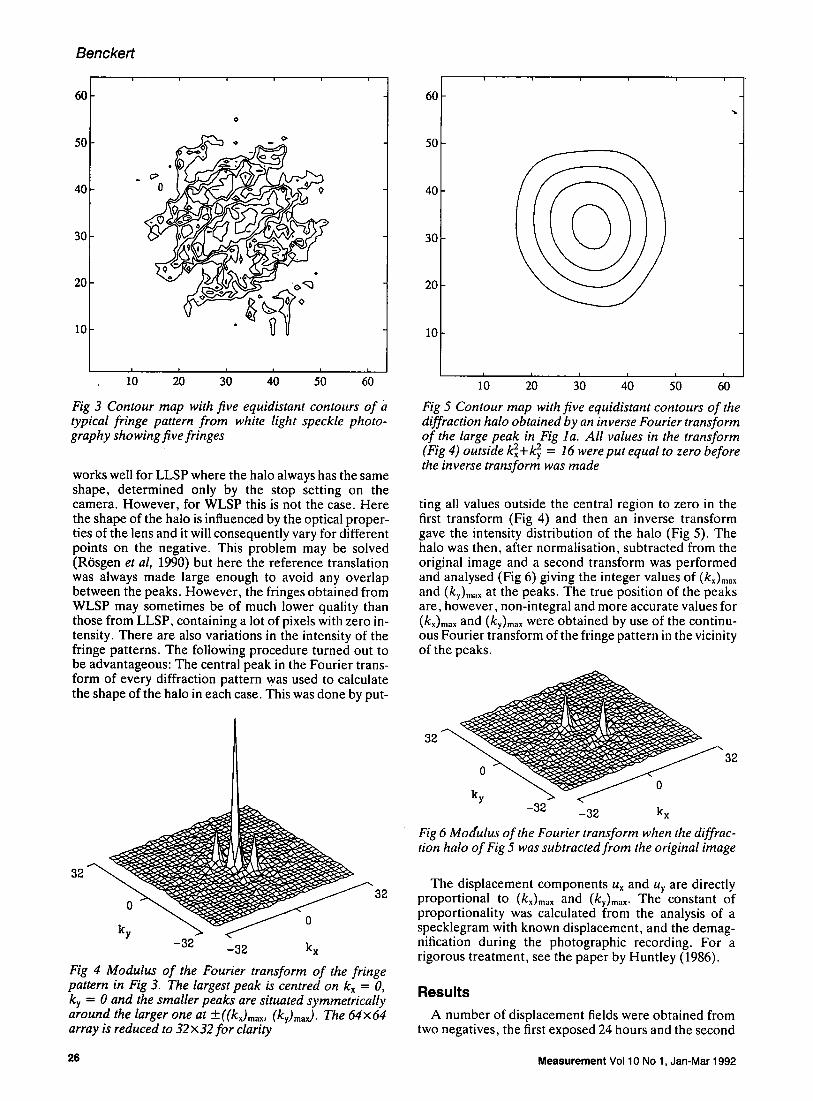
The combined negatives were analysed with the auto- matic fringe analysis system shown in Fig 2. A laser beam is passed through a spot on the two negatives with an effective diameter which could be altered by a lens system in front of the laser. A set of interference fringes appears on a screen behind the negatives. The fringes are modulated by a diffraction halo, the size of which is determined by the speckle size on the film. A narrow laser beam gives better spatial resolution relative to the object but produces fringes with larger speckles, making them appear more noisy. It will also put a more severe restriction on the measurable displacement as the cor- responding points on the two negatives have to overlap for any fringes to form. The visibility of the fringes diminishes with decreasing overlap. A compromise has to be found between spatial resolution and fringequality. It was found that a beam diameter (between l/e- points) of 0.93 mm was suitable. Assuming that the beam has a Gaussian profile, one finds that 80% of the intensity is within a diameter of 0.84 mm which may be taken as the size of each spot on the negatives. This means that the spatial resolution on the object is a circle with a diameter of 9.1 ram. The fringe pattern appearing on the screen was fed into the PC-AT computer and digitised into 256x256 pixels each with an intensity value ranging between 0 and 255. Several algorithms have been proposed to calculate the spacing and direction of the fringes (Meynart , 1983; Robinson, 1983; Erbeck, 1985; Collicott and Hesselink, 1986; Huntley, 1986, 1989; Ansari and Ciurpita, 1987; Chen and Chiang, 1990; R6sgen et al, 1990). We employed the technique due to Huntley (1986) with some minor changes. The image was reduced to 64x64 pixels by averaging over 4 by 4 pixels. A contour map of a fringe pattern is shown in Fig 3 with its 2-D Fourier transform in Fig 4. The central peak of Fig 4 contains the Fourier transform of the diffraction halo, and the position +(kx, ky) of the two symmetrically-positioned side peaks is the required in- formation. As pointed out by Kaufmann (1981), the finite width of the central peak will shift the position of the nearby peaks if they overlap each other. Huntley (1986) made a correction by subtracting a normalised intensity distribution from a single exposure speckle- gram, which contains the diffraction halo only. This
PC/AT
Fig 2 System for automatic fringe analysis. The motion of the negative holder is controlled by a PC/AT computer which also calculates the spacing and direction of the inter- ference fringes and the correspond- ing displacements
Measurement Vol 10 No 1, Jan-Mar 1992 25
Benckert
60
50
40
30
20
10
O
¢>
' ' 3 " 0 ' ' ' 10 20 40 50 60
Fig 3 Contour map with five equidistant contours of a typical fringe pattern from white light speckle photo- graphy sho wing five fringes
works well for LLSP where the halo always has the same shape, determined only by the stop setting on the camera. However, for WLSP this is not the case. Here the shape of the halo is influenced by the optical proper- ties of the lens and it will consequently vary for different points on the negative. This problem may be solved (R6sgen et al, 1990) but here the reference translation was always made large enough to avoid any overlap between the peaks. However, the fringes obtained from WLSP may sometimes be of much lower quality than those from LLSP, containing a lot of pixels with zero in- tensity. There are also variations in the intensity of the fringe patterns. The following procedure turned out to be advantageous: The central peak in the Fourier trans- form of every diffraction pattern was used to calculate the shape of the halo in each case. This was done by put-
A 32 "~~0 ~ " 3 2
0 ky
-32 -32 kx
Fig 4 Modulus of the Fourier transform of the fringe pattern in Fig 3. The largest peak is centred on kx = O, ky = 0 and the smaller peaks are situated symmetrically around the larger one at +((kx)m~x, (ky)ma~). The 64x64 array is reduced to 32x32 for clarity
60
50
40
30
20
10
I
( / I I I I I I
10 20 30 40 50 60
Fig 5 Contour map with five equidistant contours of the diffraction halo obtained by an inverse Fourier transform of the large peak in Fig la. All values in the transform (Fig 4) outside ~ + ~ = 16 were put equal to zero before the inverse transform was made
ting all values outside the central region to zero in the first transform (Fig 4) and then an inverse transform gave the intensity distribution of the halo (Fig 5). The halo was then, after normalisation, subtracted from the original image and a second transform was performed and analysed (Fig 6) giving the integer values of (kx)max and (ky)max at the peaks. The true position of the peaks are, however, non-integral and more accurate values for (kx)ma x and (ky)max w e r e obtained by use of the continu- ous Fourier transform of the fringe pattern in the vicinity of the peaks.
32 ~ " 3 2 0 ky -32 -32 kx
Fig 6 Modulus of the Fourier transform when the diffrac- tion halo of Fig 5 was subtracted from the original image
The displacement components Ux and uy are directly proportional to (kx)max and (ky)max. The constant of proportionality was calculated from the analysis of a specklegram with known displacement, and the demag- nification during the photographic recording. For a rigorous treatment, see the paper by Huntley (1986).
R e s u l t s
A number of displacement fields were obtained from two negatives, the first exposed 24 hours and the second
26 Measurement Vo110 No 1, Jan-Mar 1992
t
f
\ 1 1 1
k i l t
1 t t t I /
~ t t l l
1 m m
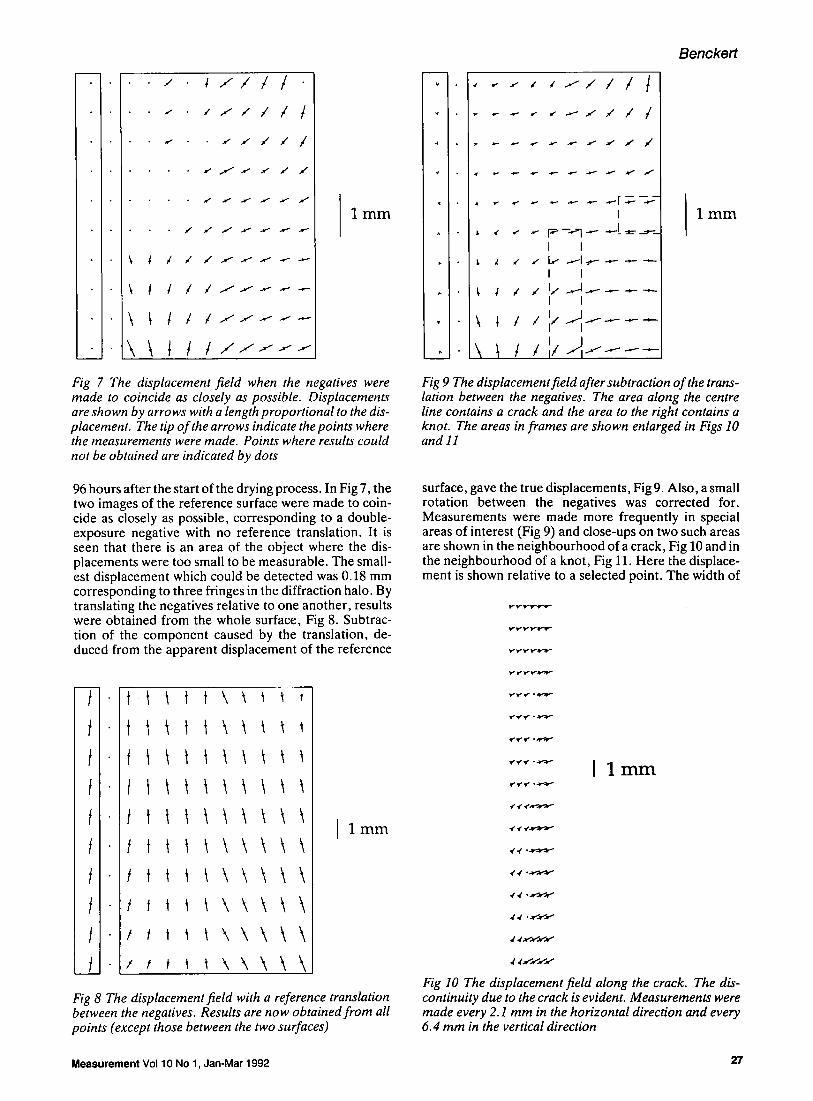
Fig 7 The displacement field when the negatives were made to coincide as closely as possible. Displacements are shown by arrows with a length proportional to the dis- placement. The tip of the arrows indicate the points where the measurements were made. Points where results could not be obtained are indicated by dots
96 hours after the start of the drying process. In Fig 7, the two images of the reference surface were made to coin- cide as closely as possible, corresponding to a double- exposure negative with no reference translation. It is seen that there is an area of the object where the dis- placements were too small to be measurable. The small- est displacement which could be detected was 0.18 mm corresponding to three fringes in the diffraction halo. By translating the negatives relative to one another, results were obtained from the whole surface, Fig 8. Subtrac- tion of the component caused by the translation, de- duced from the apparent displacement of the reference
f - t t t f \ t ~ ~ t
fttttktt
t t t t t t t t t t / t i l t \ \ \ \ \
/ / t i t \ \ \ \ \ t t t t t \ \ \ \ \ / t t t t \ \ \ \ \
I t t t t \ \ \ \ \
I l m m
Fig 8 The displacement field with a reference translation between the negatives. Results are now obtained from all points (except those between the two surfaces)
~. i t ,
- t
A
) .
k
\
\
- ' , l i t ~ l [
• .." ." ." ..." t t I /
[ __ m m
I • ' ." "," ~ - - ~ 3 - ' - - ~ 1 _ ~ _ _ _ , . _ _
I I
I I
I I
I ~ 1 . ~ . . , . _ 1 I / i / - ' - - ' -
B e n c k e r t
1 rnrn
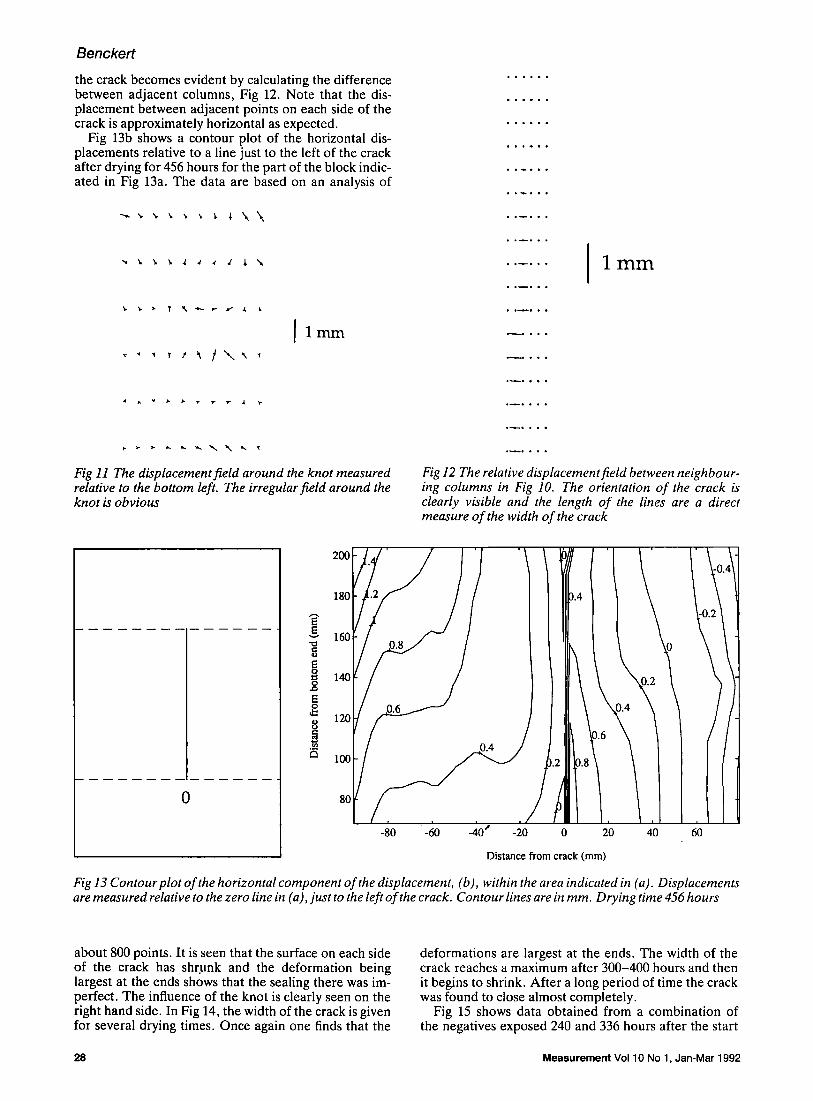
Fig 9 The displacement field after subtraction of the trans- lation between the negatives. The area along the centre line contains a crack and the area to the right contains a knot. The areas in frames are shown enlarged in Figs 10 and 11
surface, gave the true displacements, Fig 9. Also, a small rotation between the negatives was corrected for. Measurements were made more frequently in special areas of interest (Fig 9) and close-ups on two such areas are shown in the neighbourhood of a crack, Fig 10 and in the neighbourhood of a knot, Fig 11. Here the displace- ment is shown relative to a selected point. The width of
I l m m V " ~¢ Y " • - ! v ' ~ , "
4 ' 4 ' • , , l " ~ ' ~ "
Fig 10 The displacement field along the crack. The dis- continuity due to the crack is evident. Measurements were made every 2.1 mm in the horizontal direction and every 6.4 mm in the vertical direction
Measurement Vo110 No 1, Jan-Mar 1992 27
Benckert
the crack becomes evident by calculating the difference between adjacent columns, Fig 12. Note that the dis- placement between adjacent points on each side of the crack is approximately horizontal as expected.
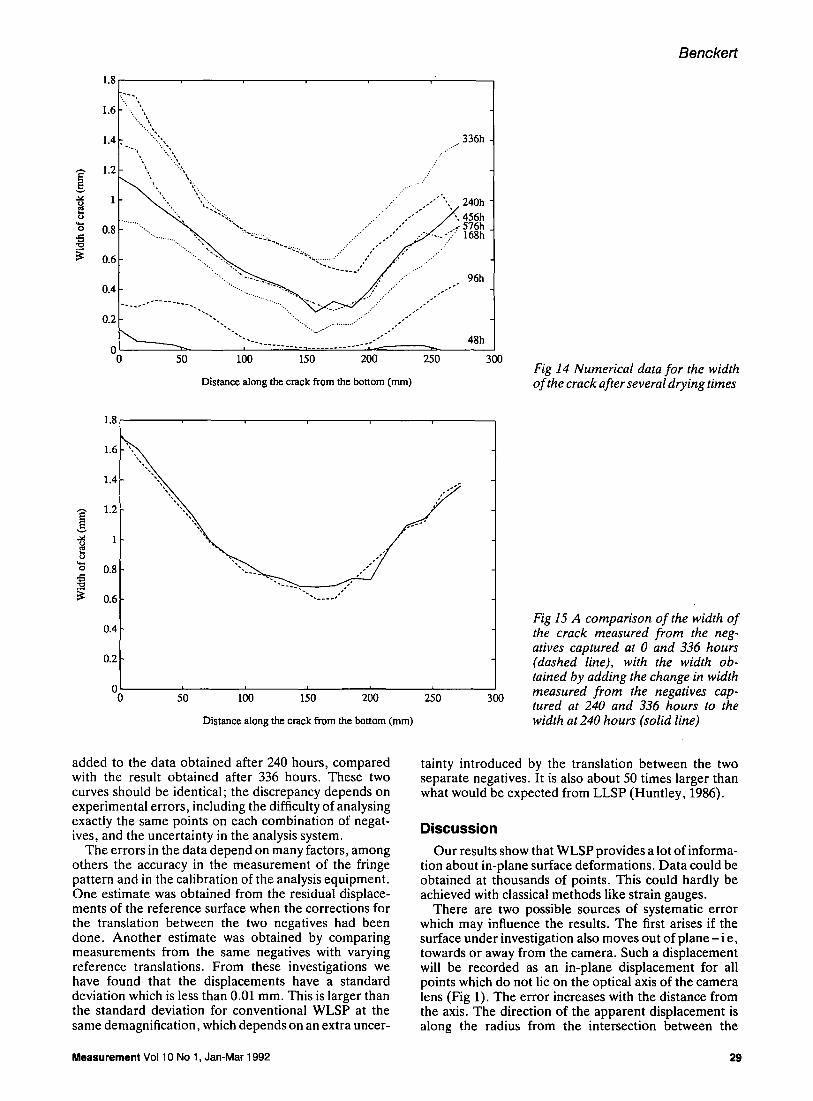
Fig 13b shows a contour plot of the horizontal dis- placements relative to a line just to the left of the crack after drying for 456 hours for the part of the block indic- ated in Fig 13a. The data are based on an analysis of
Q U I ~ O @
Q O Q O O O
0 O O Q Q O
0 0 0 O I O
I O ~ Q O I
J ~ D
. - - °
Q ~ O 1 rnrn
f lmm O ~ U
0
0
Fig 11 The displacement field around the knot measured relative to the bottom left. The irregular field around the knot is obvious
Fig 12 The relative displacement field between neighbour- ing columns in Fig 10. The orientation of the crack is clearly visible and the length of the lines are a direct measure of the width of the crack
0
180
11;r/ 120 0.6
-80 --60 -40" -20
/ r 1
1.4
2 0
/ , 0 20 40 60
Distance from crack (mm)
Fig 13 Contour plot of the horizontal component of the displacement, (b), within the area indicated in (a). Displacements are measured relative to the zero line in (a), just to the left of the crack. Contour lines are in mm. Drying time 456 hours
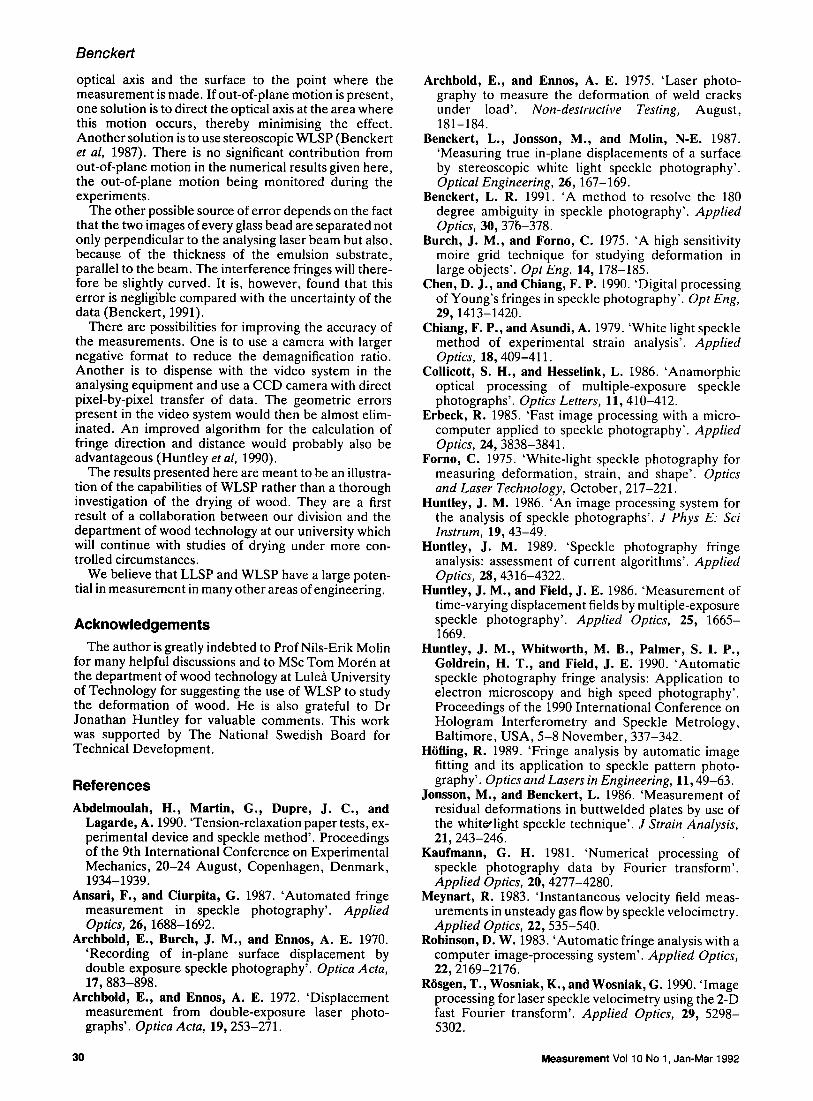
about 800 points. It is seen that the surface on each side of the crack has shrunk and the deformation being largest at the ends shows that the sealing there was im- perfect. The influence of the knot is clearly seen on the right hand side. In Fig 14, the width of the crack is given for several drying times. Once again one finds that the
deformations are largest at the ends. The width of the crack reaches a maximum after 300-400 hours and then it begins to shrink. After a long period of time the crack was found to close almost completely.
Fig 15 shows data obtained from a combination of the negatives exposed 240 and 336 hours after the start
28 Measurement Vo110 No 1, Jan-Mar 1992
ll.iIi~ !i. 1.6 '"... ",,
0 50
336h
240h 456h 576h 168h
96h
. . . . . -" 48h 1 . . . . . . . . . . 1 . . . . . . . . . . . - ' ' 1 [
100 150 200 250 300
Distance along the crack from the bottom (mm)
1 . 8 , i i i i
1.6
1.4
0.8 "',, . . . . I"
0.6
0.4
0.2
0 0
I I I I
5 100 150 200 250 300
Distance along the crackffomthe bottom(mm)
Bencke~
Fig 14 Numerical data for the width of the crack after several drying times
Fig 15 A comparison of the width of the crack measured from the neg- atives captured at 0 and 336 hours (dashed line), with the width ob- tained by adding the change in width measured from the negatives cap- tured at 240 and 336 hours to the width at 240 hours (solid line)
added to the data obtained after 240 hours, compared with the result obtained after 336 hours. These two curves should be identical; the discrepancy depends on experimental errors, including the difficulty of analysing exactly the same points on each combination of negat- ives, and the uncertainty in the analysis system.
The errors in the data depend on many factors, among others the accuracy in the measurement of the fringe pattern and in the calibration of the analysis equipment. One estimate was obtained from the residual displace- ments of the reference surface when the corrections for the translation between the two negatives had been done. Another estimate was obtained by comparing measurements from the same negatives with varying reference translations. From these investigations we have found that the displacements have a standard deviation which is less than 0.01 mm. This is larger than the standard deviation for conventional WLSP at the same demagnification, which depends on an extra uncer-
tainty introduced by the translation between the two separate negatives. It is also about 50 times larger than what would be expected from LLSP (Huntley, 1986).
D i s c u s s i o n
Our results show that WLSP provides a lot of informa- tion about in-plane surface deformations. Data could be obtained at thousands of points. This could hardly be achieved with classical methods like strain gauges.
There are two possible sources of systematic error which may influence the results. The first arises if the surface under investigation also moves out of p l ane - i e, towards or away from the camera. Such a displacement will be recorded as an in-plane displacement for all points which do not lie on the optical axis of the camera lens (Fig 1). The error increases with the distance from the axis. The direction of the apparent displacement is along the radius from the intersection between the
Measurement Vo110 No 1 JanMar 1992 29
Benckert
optical axis and the surface to the point where the measurement is made. If out-of-plane motion is present, one solution is to direct the optical axis at the area where this motion occurs, thereby minimising the effect. Another solution is to use stereoscopic WLSP (Benckert et al, 1987). There is no significant contribution from out-of-plane motion in the numerical results given here, the out-of-plane motion being monitored during the experiments.
The other possible source of error depends on the fact that the two images of every glass bead are separated not only perpendicular to the analysing laser beam but also, because of the thickness of the emulsion substrate, parallel to the beam. The interference fringes will there- fore be slightly curved. It is, however, found that this error is negligible compared with the uncertainty of the data (Benckert, 1991).
There are possibilities for improving the accuracy of the measurements. One is to use a camera with larger negative format to reduce the demagnification ratio. Another is to dispense with the video system in the analysing equipment and use a CCD camera with direct pixel-by-pixel transfer of data. The geometric errors present in the video system would then be almost elim- inated. An improved algorithm for the calculation of fringe direction and distance would probably also be advantageous (Huntley et al, 1990).
The results presented here are meant to be an illustra- tion of the capabilities of WLSP rather than a thorough investigation of the drying of wood. They are a first result of a collaboration between our division and the department of wood technology at our university which will continue with studies of drying under more con- trolled circumstances.
We believe that LLSP and WLSP have a large poten- tial in measurement in many other areas of engineering.
Acknowledgements
The author is greatly indebted to Prof Nils-Erik Molin for many helpful discussions and to MSc Tom Mor6n at the department of wood technology at Luleh University of Technology for suggesting the use of WLSP to study the deformation of wood. He is also grateful to Dr Jonathan Huntley for valuable comments. This work was supported by The National Swedish Board for Technical Development.
References
Abdelmoulah, H., Martin, G., Dupre, J. C., and Lagarde, A. 1990. 'Tension-relaxation paper tests, ex- perimental device and speckle method'. Proceedings of the 9th International Conference on Experimental Mechanics, 20-24 August, Copenhagen, Denmark, 1934-1939.
Ansari, F., and Ciurpita, G. 1987. 'Automated fringe measurement in speckle photography'. Applied Optics, 26, 1688-1692.
Archbold, E., Burch, J. M., and Ennos, A. E. 1970. 'Recording of in-plane surface displacement by double exposure speckle photography'. Optica Acta, 17, 883-898.
Archbold, E., and Ennos, A. E. 1972. 'Displacement measurement from double-exposure laser photo- graphs'. Optica Acta, 19, 253-271.
Archbold, E., and Ennos, A. E. 1975. 'Laser photo- graphy to measure the deformation of weld cracks under load'. Non-destructive Testing, August, 181-184.
Benckert, L., Jonsson, M., and Molin, N-E. 1987. 'Measuring true in-plane displacements of a surface by stereoscopic white light speckle photography'. Optical Engineering, 26, 167-169.
Benckert, L. R. 1991. 'A method to resolve the 180 degree ambiguity in speckle photography'. Applied Optics, 30, 3715-378.
Burch, J. M., and Forno, C. 1975. 'A high sensitivity moire grid technique for studying deformation in large objects'. Opt Eng. 14, 178-185.
Chert, D. J., and Chiang, F. P. 1990. 'Digital processing of Young's fringes in speckle photography'. Opt Eng, 29, 1413-1420.
Chiang, F. P., and Asundi, A. 1979. 'White light speckle method of experimental strain analysis'. Applied Optics, 18,409-411.
Collieott, S. H., and Hesselink, L. 1986. 'Anamorphic optical processing of multiple-exposure speckle photographs'. Optics Letters, 11,410-412.
Erbeck, R. 1985. 'Fast image processing with a micro- computer applied to speckle photography'. Applied Optics, 24, 3838-3841.
Forno, C. 1975. 'White-light speckle photography for measuring deformation, strain, and shape'. Optics and Laser Technology, October, 217-221.
Huntley, J. M. 1986. 'An image processing system for the analysis of speckle photographs'. J Phys E: Sci Instrum, 19, 43-49.
Huntley, J. M. 1989. 'Speckle photography fringe analysis: assessment of current algorithms'. Applied Optics, 28, 4316-4322.
Huntley, J. M., and Field, J. E. 1986. 'Measurement of time-varying displacement fields by multiple-exposure speckle photography'. Applied Optics, 25, 1665- 1669.
Huntley, J. M., Whitworth, M. B., Palmer, S. I. P., Goldrein, H. T., and Field, J. E. 1990. 'Automatic speckle photography fringe analysis: Application to electron microscopy and high speed photography'. Proceedings of the 1990 International Conference on Hologram Interferometry and Speckle Metrology, Baltimore, USA, 5-8 November, 337-342.
H6fling, R. 1989. 'Fringe analysis by automatic image fitting and its application to speckle pattern photo- graphy'. Optics and Lasers in Engineering, 11, 49-63.
Jonsson, M., and Benckert, L. 1986. 'Measurement of residual deformations in buttwelded plates by use of the white, light speckle technique'. J Strain Analysis, 21,243-246.
Kaufmann, G. H. 1981. 'Numerical processing of speckle photography data by Fourier transform'. Applied Optics, 20, 4277-4280.
Meynart, R. 1983. 'Instantaneous velocity field meas- urements in unsteady gas flow by speckle velocimetry. Applied Optics, 22, 535-540.
Robinson, D. W. 1983. 'Automatic fringe analysis with a computer image-processing system'. Applied Optics, 22, 2169-2176.
R6sgen, T., Wosniak, K., and Wosniak, G. 1990. 'Image processing for laser speckle velocimetry using the 2-D fast Fourier transform'. Applied Optics, 29, 5298- 5302.
30 Measurement Vo110 No 1. Jan-Mar 1992