Embed Size (px)
Citation preview
2 0 1 8 A N N U A L R E P O R T
Together.
Woolworths Group LimitedABN 88 000 014 675
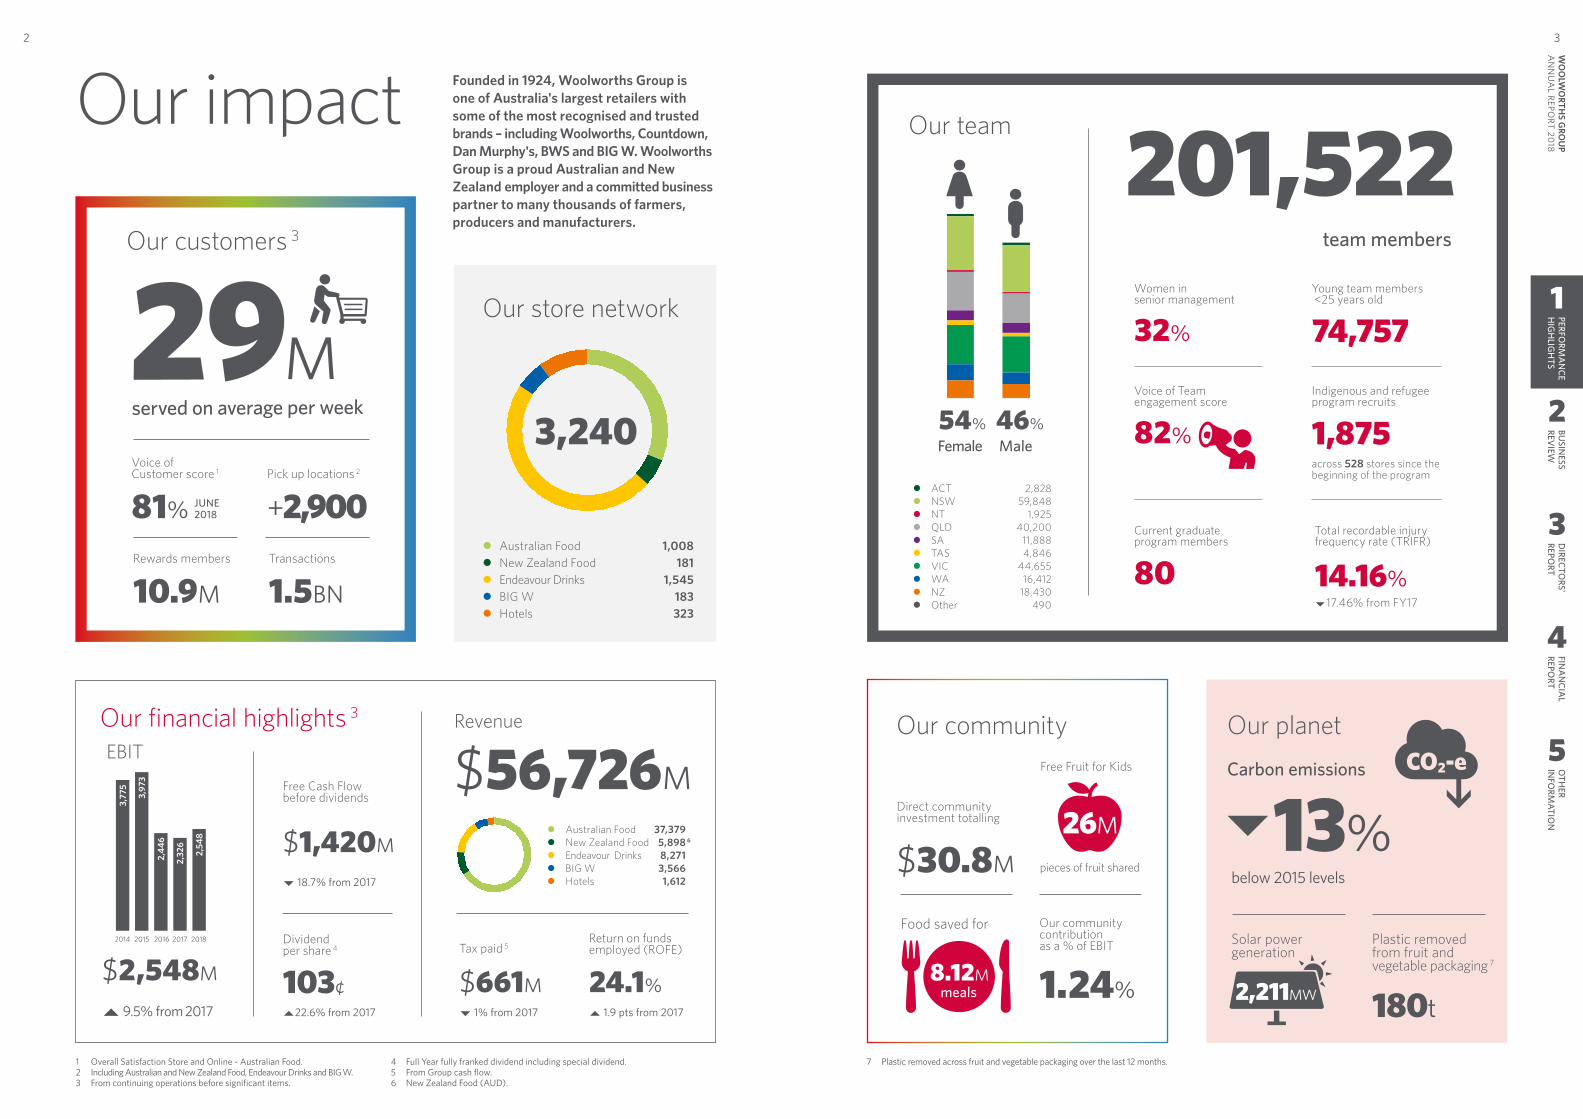
Our customers
29Mserved on average per week
Page 2
Our impactWoolworths Group is a diverse group of Australian and New Zealand retail businesses that impact a number of sectors across society.
CONTENTSSECTION 1PERFORMANCE HIGHLIGHTS
Our impact 2Chairman's Report 4Chief Executive Officer's Report 5Woolworths Group Purpose 7Our key priorities 8Group Sustainability 11Group Financial Performance 14
SECTION 2BUSINESS REVIEW
Australian Food 16Endeavour Drinks 18New Zealand Food 20Portfolio Business — BIG W 22Portfolio Business — Hotels 23Discontinued Operations 24Overheads, balance sheet and cash flow 25Capital management 26New store rollout plans 26Non-IFRS financialinformation and glossary 27Our Material Risks 29
SECTION 3DIRECTORS’ REPORT
Governance 32Board Skills and Experience 33Board of Directors 34Group Executive Committee 36Directors’ Statutory Report 38Remuneration Report 40
SECTION 4FINANCIAL REPORT
Auditor's Independence Declaration 60Financial Report 61Directors’ Declaration 117Independent Auditor’s Report 118
SECTION 5OTHER INFORMATION
Five year summary 122Shareholder information & Corporate Governance Statement 126Company directory 128
Page 8
Our key prioritiesAcross the year, Woolworths Group delivered a number of achievements across our six strategic priorities, including the continuing transformation of our Australian and New Zealand Food businesses, and the improvement in customer satisfaction scores across the Group.
2018Annual Report
Together we are: Listening to our customers. Connecting personalised and convenient shopping
experiences. Transforming of our Australian and New Zealand Food businesses. Evolving our Endeavour drinks business. Unlocking Value in our portfolio. Creating
BETTER and SIMPLER end to end processes for customer and stores.
We create better experiences together.
Together we are Listening to our customers. Connecting personalised and convenient shopping experiences. Transforming our Australian and New Zealand Food businesses.
Evolving our Endeavour Drinks business. Unlocking value in our Portfolio. Improving end-to-end processes to be better for customers and simpler and safer for stores.
Creating better experiences together.
Page 16
Group business updateThere were a number of business highlights during the year, including the opening of Pitt Street Metro on 20 June. Read more about Pitt Street Metro on page 17.
Pages 4–6
Chairman and Chief Executive Officer ReportsChairman, Gordon Cairns, and CEO, Brad Banducci, reflect on the achievements of the year, opportunities to improve and the focus areas for the year ahead.
Page 11
Group SustainabilityThroughout the year, our team has made significant progress towards the achievement of our 2020 Strategy commitments, including the important steps to move towards a circular economy.
Our impact
Our store network
Our customers 3
Our financial highlights 3
EBIT
29Mserved on average per week
Australian Food 1,008New Zealand Food 181Endeavour Drinks 1,545BIG W 183Hotels 323
3,240
$2,548M
$56,726M
Voice of Customer score 1
81% JUNE2018
Pick up locations 2
+2,900Rewards members
10.9M
Tax paid 5
$661M 1% from 2017
Free Cash Flow before dividends
$1,420M
18.7% from 2017
Transactions
1.5BN
Return on funds employed (ROFE)
24.1% 1.9 pts from 2017
Dividend per share 4
103¢22.6% from 2017 9.5% from 2017
Our community Our planetRevenue
Carbon emissions
Direct community investment totalling
$30.8M
Our community contribution as a % of EBIT
1.24%8.12M
meals
Food saved for
Free Fruit for Kids
26M 13%below 2015 levels
Solar power generation
Plastic removed from fruit and vegetable packaging 7
180t2,211MW
1 Overall Satisfaction Store and Online - Australian Food.2 Including Australian and New Zealand Food, Endeavour Drinks and BIG W.3 From continuing operations before significant items.
4 Full Year fully franked dividend including special dividend.5 From Group cash flow.6 New Zealand Food (AUD).
7 Plastic removed across fruit and vegetable packaging over the last 12 months.
Founded in 1924, Woolworths Group is one of Australia's largest retailers with some of the most recognised and trusted brands – including Woolworths, Countdown, Dan Murphy's, BWS and BIG W. Woolworths Group is a proud Australian and New Zealand employer and a committed business partner to many thousands of farmers, producers and manufacturers.
Australian Food 37,379New Zealand Food 5,898Endeavour Drinks 8,271BIG W 3,566Hotels 1,612
ACT 2,828NSW 59,848NT 1,925QLD 40,200SA 11,888TAS 4,846VIC 44,655WA 16,412NZ 18,430Other 490
Our team
201,522
Female Male
team members
Current graduate program members
80
Women in senior management
32%
Voice of Team engagement score
82%
Young team members <25 years old
74,757Indigenous and refugee program recruits
1,875across 528 stores since the beginning of the program
Total recordable injury frequency rate (TRIFR)
14.16%17.46% from FY17
54% 46%
3,77
5
3,97
3
2,44
6
2,32
6
2,54
8
2014 2015 2016 2017 2018
pieces of fruit shared
6
2
3
4
5
BUSIN
ESS REV
IEWD
IRECTORS'
REPORT
FINA
NCIA
L REPO
RTO
THER
INFO
RMATIO
N3
WO
OLW
ORTH
S GRO
UP
AN
NU
AL REPO
RT 2018
2PERFO
RMA
NCE
HIG
HLIG
HTS
1
Chairman's Report
Last year in my report, I focused on three areas: strategy, culture and capital management. I am pleased to report we have made good progress in all three as part of our transformation journey. This year I want to call out three others, equally integral to our journey: innovation, community, and shareholder value.
INNOVATIONAmongst the many innovations in the group, our digital business, WooliesX is a standout. In a little over a year, we have created a market‑leading business with over $1 billion in sales, servicing 6.2 million orders and growing at 30%. Customers who shop with us both in‑store and online spend significantly more than in‑store only customers. Online sales in Australian Food now represents over 3% of total sales with further room to increase in comparison to other international markets.
COMMUNITYWe are proud of our contribution to the community and to the environment. We contributed over $30 million in direct community investment in FY18. We provided over eight million meals in food rescue through our partners OzHarvest, Foodbank and FareShare. We removed 180 tonnes of plastic from our fruit and vegetables, and removed single‑use plastic bags from our Australian supermarkets on 20 June.
In our stores we employ 1,875 Indigenous team members and, through our refugee employment
program, we saw 45 refugees commence employment in our Metro and Woolworths supermarkets. We were the first retail organisation to be recognised as AWEI Gold Tier Employer for LGBTI inclusion. In FY18 we reduced our carbon emissions to 13% below 2015 levels. At last year's AGM, we committed to review ALH's responsible gaming practices. In August, we completed two reviews with the findings leading to measures being put in place to address shortcomings. We will continue to support ALH on this journey.
SHAREHOLDER VALUEReflecting the progress we are making, our total return to shareholders in FY18 was 22.4%, outperforming the market.
This was driven by solid financial results from continuing operations: revenue growing at 3.4%, EBIT up 9.5%, NPAT growth of 12.9%, and Return on Funds Employed of 24.1%.
Our balance sheet was also stronger with net repayable debt reduced by a further $677 million, through business growth and good working capital management. As a result we were delighted to declare a final dividend of 50 cents, taking the full year dividend to 93 cents per share, an increase of 11% on the prior year. In addition, recognising our strong franking credit balance, and the benefits from our petrol partnership, we have also announced a fully franked special dividend of 10 cents per share.
In conclusion, both board and management are pleased with our progress, but diligent and determined to meet the challenges and opportunities ahead.
Gordon CairnsCHAIRMAN
This year we have been focused on embedding our Ways‑of‑Working and Core Values to deliver on our Group Purpose, to create better experiences together, that better the lives of our customers. I am proud of the team’s achievements through being better together in FY18 as we continue on our journey to deliver on our Group Purpose.
FY18 HIGHLIGHTS Improved customer satisfaction during the year led to higher customer numbers across all of our businesses, driving sales growth from continued operations of 3.4%. EBIT increased by 9.5% despite reinvestment in initiatives that will deliver benefits in future years. The strong trading performance also resulted in a meaningful reduction in net debt and improved financial profile which has allowed for an increase in the FY18 dividend to 93 cents (+11%), as well as a special dividend of 10 cents per share that will be paid to
shareholders with the final dividend of 50 cents in October.
In our focus on changing our business for the better, we made significant progress against our six strategic priorities. Further detail on the progress can be found on pages 8 to 10. The key highlights include:
• Voice of Customer, Voice of Supplier and Voice of Team scores all improving in the year as a result of our continued focus on a Customer 1st and Team 1st culture
• The combined effort from the team to increase the number of Pick up sites to over 2,900 stores across Australian and New Zealand supermarkets, Dan Murphy’s, BWS and BIG W to enhance our connected, personalised and convenient customer experiences
• Continuing to evolve our store renewal program in transforming Australia and New Zealand Food, completing a total of 80 Renewals (11 new stores) including 54 Upgrades
• Customer 1st Ranging rolled out across all BWS stores with ranges tailored to local customers, as we continue evolving the Drinks business
• Whilst we still have a lot to do to turnaround BIG W to unlock value in our portfolio, focusing on fixing the basics has seen improved item growth with the first positive full year sales increase in a number of years
Chief Executive Officer's ReportBrad BanducciGordon Cairns
2
3
4
5
BUSIN
ESS REV
IEWD
IRECTORS'
REPORT
FINA
NCIA
L REPO
RTO
THER
INFO
RMATIO
N5
WO
OLW
ORTH
S GRO
UP
AN
NU
AL REPO
RT 2018
4PERFO
RMA
NCE
HIG
HLIG
HTS
1
Woolworths Group PurposeWoolworths Group is a diverse group of retail businesses on a journey to becoming a purpose‑led organisation. United by our Group purpose, we create better experiences together, that better people’s lives, creates
the framework for how we aspire to operate, to be better; for our customers, our team, the communities we serve and our shareholders.
• Significant progress made in improving our end-to-end processes including the rollout of 1Store to all Australian Food stores and attached BWS which includes an upgrade of 1POS, ticketing and back office systems.
TEAM UPDATEDuring the year, we said farewell to our retiring team members, Martin Smith, Managing Director of Endeavour Drinks, and Dave Chambers, Managing Director of Woolworths New Zealand. I would like to thank them both for the significant contribution they have made to Woolworths Group. Our succession planning has meant that both roles have been filled internally with Steve Donohue heading up Endeavour Drinks and Natalie Davis leading Woolworths New Zealand. Von Ingram has been appointed Chief Customer Transformation Officer, replacing Natalie, to continue the momentum on our Customer 1st strategy.
PETROL ALLIANCEIn July we announced a new strategic alliance with Caltex, including a new long‑term fuel supply agreement. We are excited that our customers will benefit from an extended network of fuel discount redemption sites and the ability to earn Woolworths Rewards points on fuel and grocery purchases at over 700 Caltex sites. It also provides us with the platform to accelerate our convenience strategy with a plan to open up to 250 Metro stores on Caltex sites over the next six years. The team's performance despite the distraction of the sale process, with VOC remaining at 86%, was commendable. The new wholesale supply agreement also enables a competitive fuel price that will strengthen the business in the long‑term while we still pursue an IPO or sale. Further capital management will be considered as part of a successful exit of the Petrol business.
GROUP SUSTAINABILITYMore than ever, our strategy and approach to sustainability are integral to how we operate and the responsibility we have to live our purpose. In the year, we conducted a materiality assessment
of our sustainability responsibilities and identified the core areas of focus for our business in order to deliver positive change. As we move to a more circular economy, we removed single‑use plastic bags from all businesses as well as announced a commitment to no longer sell plastic straws by the end of 2018. We also continue to remove unnecessary packaging in produce with 180 tonnes removed over the last 12 months.
Ethical sourcing and our approach to human rights within our supply chain
is another critical area of focus. In the year, we conducted a group‑wide review of current practices which led to the launch of a new Responsible Sourcing Program in early July. The new policy and standards ensure our supplier business partners adhere to ethical business conduct consistent with our own, and we are committed to working with them to fulfil this common goal.
Further detail on our progress in the year can be found in our 2018 Woolworths Group Sustainability Report.
Who we are, and what sets us apart, is anchored by our Core Values. We care deeply, we listen and learn and we always do the right thing. Applying these Core Values to everything we do defines our behaviour
and drives our ambition to be a trustworthy, innovative and responsible Australian company.
How we work to live our purpose is defined by our Ways-of-Working.• We put our customers 1st,• We’re always improving, • We work end‑to‑end, • We keep things simple, and • We encourage freedom within a framework.
In FY19, Ways‑of‑Working will be incorporated into our performance measures to further connect our team to the purpose and strategy of the business. To be a truly purpose‑led organisation, embedding this framework will enable us to work together, to create better experiences, that deliver: • Good prices, service, quality, choice and
convenience for our customers, • support and provide opportunities
for our team members, • a positive impact on our communities, and • sustainable growth for our shareholders.
Chief Executive Officer's Report
FY19 FOCUSWhile we have made good progress, we continue to be energised by the many opportunities to transform our business.
In Australian Food, sales in the first seven weeks of Q1’19 slowed as customers adjusted to the removal of single-use plastic bags, the impact of a competitor continuity program, meat and fruit and vegetable deflation and the cycling of Earn and Learn in the prior year. We expect sales momentum to improve over the course of the half and are confident that we have strong plans in place to be ‘consistently good’ at the fundamentals and drive further shopping differentiation relative to our competitors.
We will also continue to invest in our online and convenience offerings, including scaling up ‘food for now’ and ‘food for later’ across our Metro stores, improving our online and app experiences, enhancing our loyalty programs and reducing friction in our payment processes. Our goal is to ensure a seamless experience for our increasingly connected customers.
Productivity improvements will remain a focus for FY19 as our Simpler for Stores program accelerates and we will open our state-of-the-art distribution centre in South Melbourne later in the year. We will continue to focus on our safety performance after slower than planned progress in FY18. We have identified key improvement opportunities to ensure Woolworths Group leads the retail sector safety for our team and customers.
We expect continued progress at BIG W, with a further reduction of losses in FY19. It is still early days in its turnaround and we still have a lot of work to do to improve underlying business processes and deliver sales stability. We also expect ALH to focus on leading in the area of responsible gaming and implementing the recommendations of the recent internal and external reviews.
In closing, I would like to thank the team for all their hard work during the year as the Group continues to go through a period of significant change. In our journey to be a purpose-led organisation, I am confident that over the next year we will continue to create better experiences for our customers, teams and communities, and in doing so, create further value for our shareholders.
Brad Banducci CHIEF EXECUTIVE OFFICER
We create better experiences together.
I alw
ays do t
he ri
ght t
hing
I listen and learn
I care deeply
We’r
e always
for store teams
simple, especially
We keep things
We work end-to-end
as one team
a framewor
k
We encourage
improving
freedom with
in
We put ourcustomers
1st
Our Ways-of-Working
Our PurposeWhy we exist
How we work
Who we areOur Values
2
3
4
5
BUSIN
ESS REV
IEWD
IRECTORS'
REPORT
FINA
NCIA
L REPO
RTO
THER
INFO
RMATIO
N7
WO
OLW
ORTH
S GRO
UP
AN
NU
AL REPO
RT 2018
6PERFO
RMA
NCE
HIG
HLIG
HTS
1
1. Customer 1st and Team 1st culture
2. Connected, personalised and convenient shopping experiences
Our key prioritiesWoolworths Group’s FY18 strategy house consists of six key priorities that focus
on pivotal initiatives across the Group. A key enabler of our transformation to date has been the improvement in our customer and team 1st culture, driving
the progress we have seen against the key priorities in the year.
Voice of Customer (VOC), Voice of Team (VOT) and Voice of Supplier (VOS) continue to be key measures of success in building the Customer 1st and Team 1st culture, and pleasingly, all tracked positively in FY18.
Year-end VOC for Australian Food improved 4 pts on the prior year with Overall Customer Satisfaction (Store and Online) at 81% in June. Store-controllable VOC increased 4 pts to 84% with all eight measures improving.
Rewards and Online VOC improved by 9 pts and 6 pts respectively, as customers recognised the significant improvements to the online platforms, convenience offers and personalised engagement through Rewards.
Another highlight was the consistently strong Woolworths Petrol VOC which ended the year at 86% despite the uncertainty about the potential sale of the business throughout the financial year. This reflected the Petrol team’s resilience and unwavering focus on the customer.
Embedding the right team culture has been a crucial element of the group transformation to date with VOT scores reflecting this positive
shift. We have seen improvements in team advocacy and sustainable engagement with a Voice of Team engagement score of 82%.
While we now receive formal supplier feedback bi-monthly, we were pleased with the improvement in the Advantage Group’s 2018 supplier survey. Woolworths Supermarkets ranked first in overall performance, lifting from 11th place in 2016. The team also ranked second for ‘dealing with suppliers in a fair and equitable manner’ which is consistent with the Group’s 2020 sustainability target for working with our partners. VOS scores materially improved over the course of FY18, however, there remains significant further opportunity to improve.
The increasing demand from connected customers seeking seamless and personalised shopping experiences has driven a number of improvements throughout the year.
The rollout of Pick up was a significant achievement in the year, with the convenience offer now available at over 2,900 Food, Drink and BIG W retail sites across Australia and New
Zealand. In Australian Food alone, Pick up delivered sales growth of over 100%, proving to be a popular choice for customers and now represents over a quarter of online orders.
Improvements were also made in online home delivery with the opening of additional customer fulfilment centres (CFC) in Sydney and Melbourne to complement our existing CFC in Sydney. The centres, dedicated to supporting the increased demand for online fulfilment, particularly during peak delivery windows, have contributed
to steady improvements in fulfilment targets set in FY18.
Supporting the 2.5 million customers who visit the Woolworths customer website and app weekly, material improvements were delivered earlier in the year to upgrade site speed and the overall user experience. Connected customers have also embraced the digitisation of their Woolworths Rewards with over half a million adding their Rewards card to either Apple or Google wallet since the service was launched.
3. Transforming Australian and New Zealand Food
4. Evolving our Endeavour Drinks business
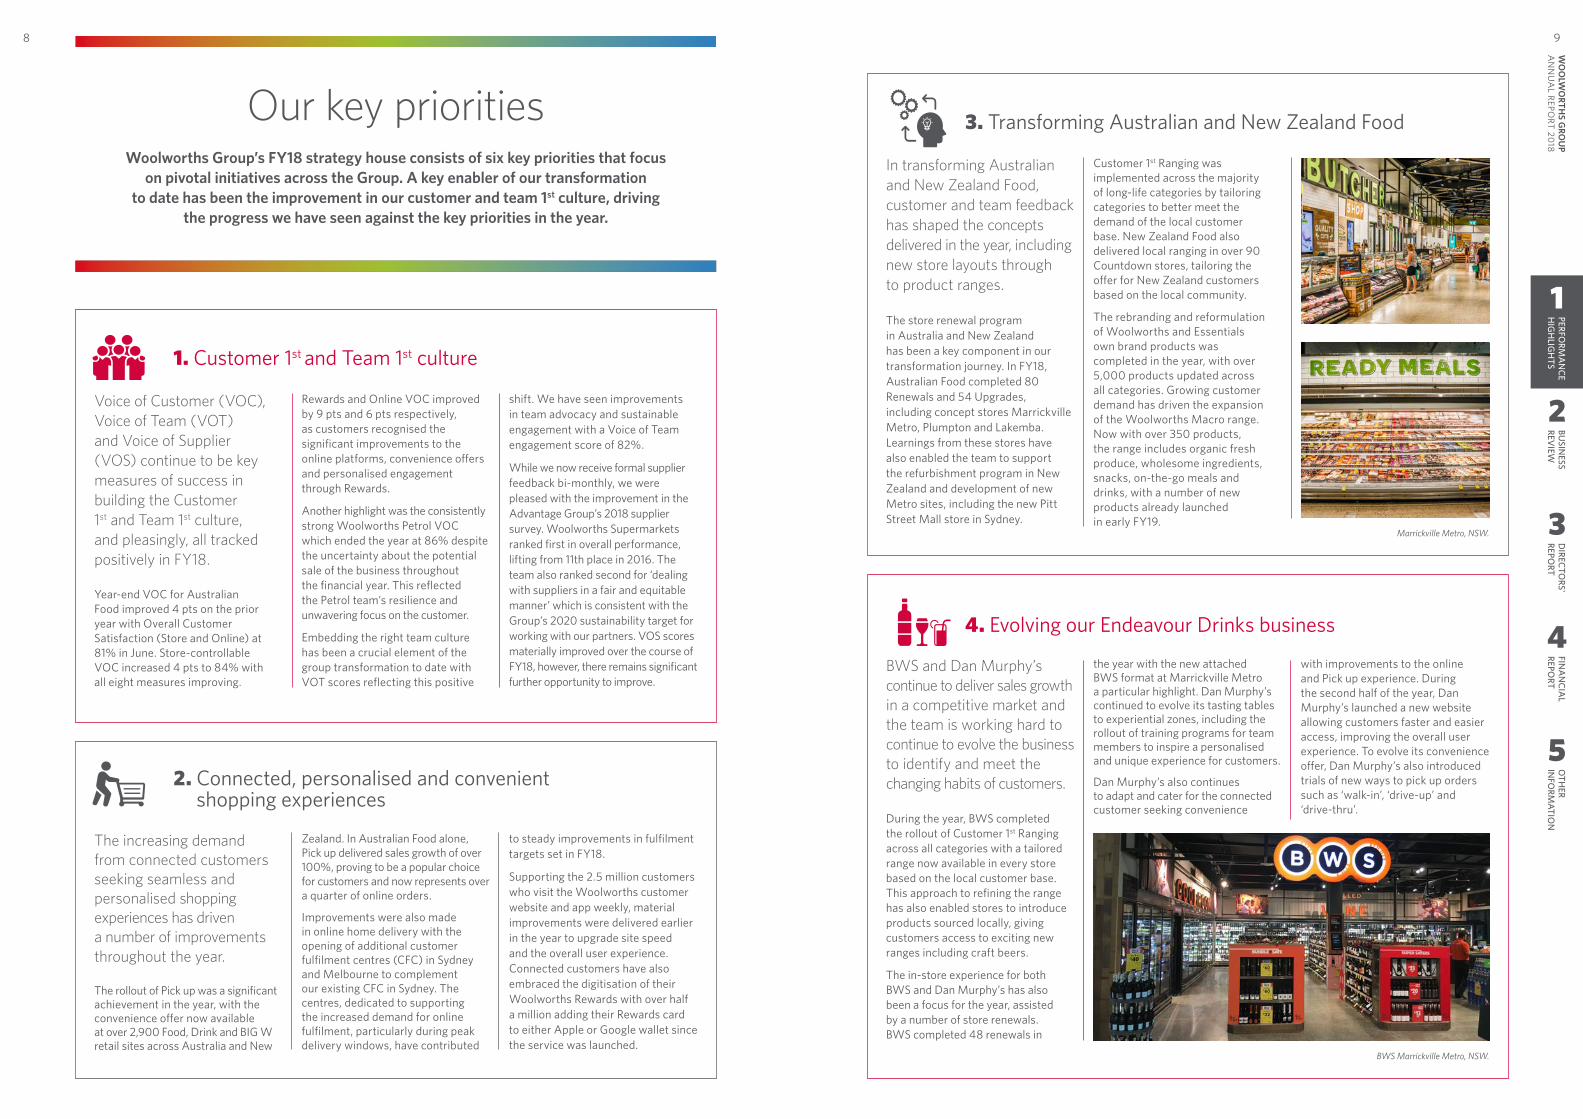
In transforming Australian and New Zealand Food, customer and team feedback has shaped the concepts delivered in the year, including new store layouts through to product ranges.
The store renewal program in Australia and New Zealand has been a key component in our transformation journey. In FY18, Australian Food completed 80 Renewals and 54 Upgrades, including concept stores Marrickville Metro, Plumpton and Lakemba. Learnings from these stores have also enabled the team to support the refurbishment program in New Zealand and development of new Metro sites, including the new Pitt Street Mall store in Sydney.
Customer 1st Ranging was implemented across the majority of long-life categories by tailoring categories to better meet the demand of the local customer base. New Zealand Food also delivered local ranging in over 90 Countdown stores, tailoring the offer for New Zealand customers based on the local community.
The rebranding and reformulation of Woolworths and Essentials own brand products was completed in the year, with over 5,000 products updated across all categories. Growing customer demand has driven the expansion of the Woolworths Macro range. Now with over 350 products, the range includes organic fresh produce, wholesome ingredients, snacks, on-the-go meals and drinks, with a number of new products already launched in early FY19.
BWS and Dan Murphy’s continue to deliver sales growth in a competitive market and the team is working hard to continue to evolve the business to identify and meet the changing habits of customers.
During the year, BWS completed the rollout of Customer 1st Ranging across all categories with a tailored range now available in every store based on the local customer base. This approach to refining the range has also enabled stores to introduce products sourced locally, giving customers access to exciting new ranges including craft beers.
The in-store experience for both BWS and Dan Murphy’s has also been a focus for the year, assisted by a number of store renewals. BWS completed 48 renewals in
the year with the new attached BWS format at Marrickville Metro a particular highlight. Dan Murphy’s continued to evolve its tasting tables to experiential zones, including the rollout of training programs for team members to inspire a personalised and unique experience for customers.
Dan Murphy’s also continues to adapt and cater for the connected customer seeking convenience
with improvements to the online and Pick up experience. During the second half of the year, Dan Murphy’s launched a new website allowing customers faster and easier access, improving the overall user experience. To evolve its convenience offer, Dan Murphy’s also introduced trials of new ways to pick up orders such as ‘walk-in’, ‘drive-up’ and ‘drive-thru’.
BWS Marrickville Metro, NSW.
Marrickville Metro, NSW.
2
3
4
5
BUSIN
ESS REV
IEWD
IRECTORS'
REPORT
FINA
NCIA
L REPO
RTO
THER
INFO
RMATIO
N9
WO
OLW
ORTH
S GRO
UP
AN
NU
AL REPO
RT 2018
8PERFO
RMA
NCE
HIG
HLIG
HTS
1
5. Unlocking value in our Portfolio
6. End-to-end processes: 'better for customers' and 'simpler for stores'
BIG W made progress in its turnaround: focusing on the customer, fixing the basics and addressing engagement and culture with a new team purpose.
Prices were dropped on over 4,500 items and Customer 1st Ranging was launched and rolled out across a number of categories, resonating positively with customers. The team has also reviewed the in-store customer experience and developed a number of initiatives to improve
the layout, address stock availability during key promotions and rostering of team members to align with customer demand. The turnaround journey remains at an early stage and embedding the new processes developed during the year will be critical for BIG W’s success.
In early July, a new strategic alliance between Woolworths Group and Caltex was announced across convenience, wholesale food, redemption, loyalty and fuel supply. The alliance increases the network of fuel sites where customers can redeem fuel discounts and earn Woolworths Rewards
points, significantly expands the footprint of Metro stores, and locks in a competitive fuel price to deliver a sustained benefit to the Petrol business.
Our ALH Hotels business had a strong year with growth across all areas of the business. Two reviews into responsible gaming practices were completed, with the outcomes announced on 6 August. As a result, ALH Group will implement a number of measures to support its commitment to responsible gaming which are outlined on page 23 of this report.
A focus on improving end‑to‑end processes and leveraging insights across the Group has resulted in the delivery of key projects in the year that will drive better outcomes for all businesses.
After a three-year implementation journey, the 1Store rollout was successfully completed across Australian Food and attached BWS stores. The 1Store program was the biggest store change program to date, with a number of new elements, including upgraded point-of-sale software and hardware, inventory management and ticketing software. The new systems deliver a number of productivity benefits, including increased speed at checkout, simplified store processes and reduced paperwork via new remote hand-held devices. The new system was also critical to enable stores to meet the Country of Origin labelling requirements by 1 July.
The rollout of 1Store was a significant achievement for the business and a reflection of how working
end-to-end delivers better experiences for team members and customers.
The rollout included:• Training approximately 90,000
team members• WiFi upgrades in over 850 stores• Delivering over 9,500 new remote
hand-held devices to stores.
The Melbourne South Regional Distribution Centre (MSRDC)
development is another key project to improve end-to-end processes, using world-class automation. During the year, the project reached an important milestone with the building and automation installation completed on time and on budget. The team is now focused on recruitment, testing and planning to ensure a seamless transition for our store teams and supplier partners.
Melbourne South Regional Distribution Centre, VIC.
Our key priorities
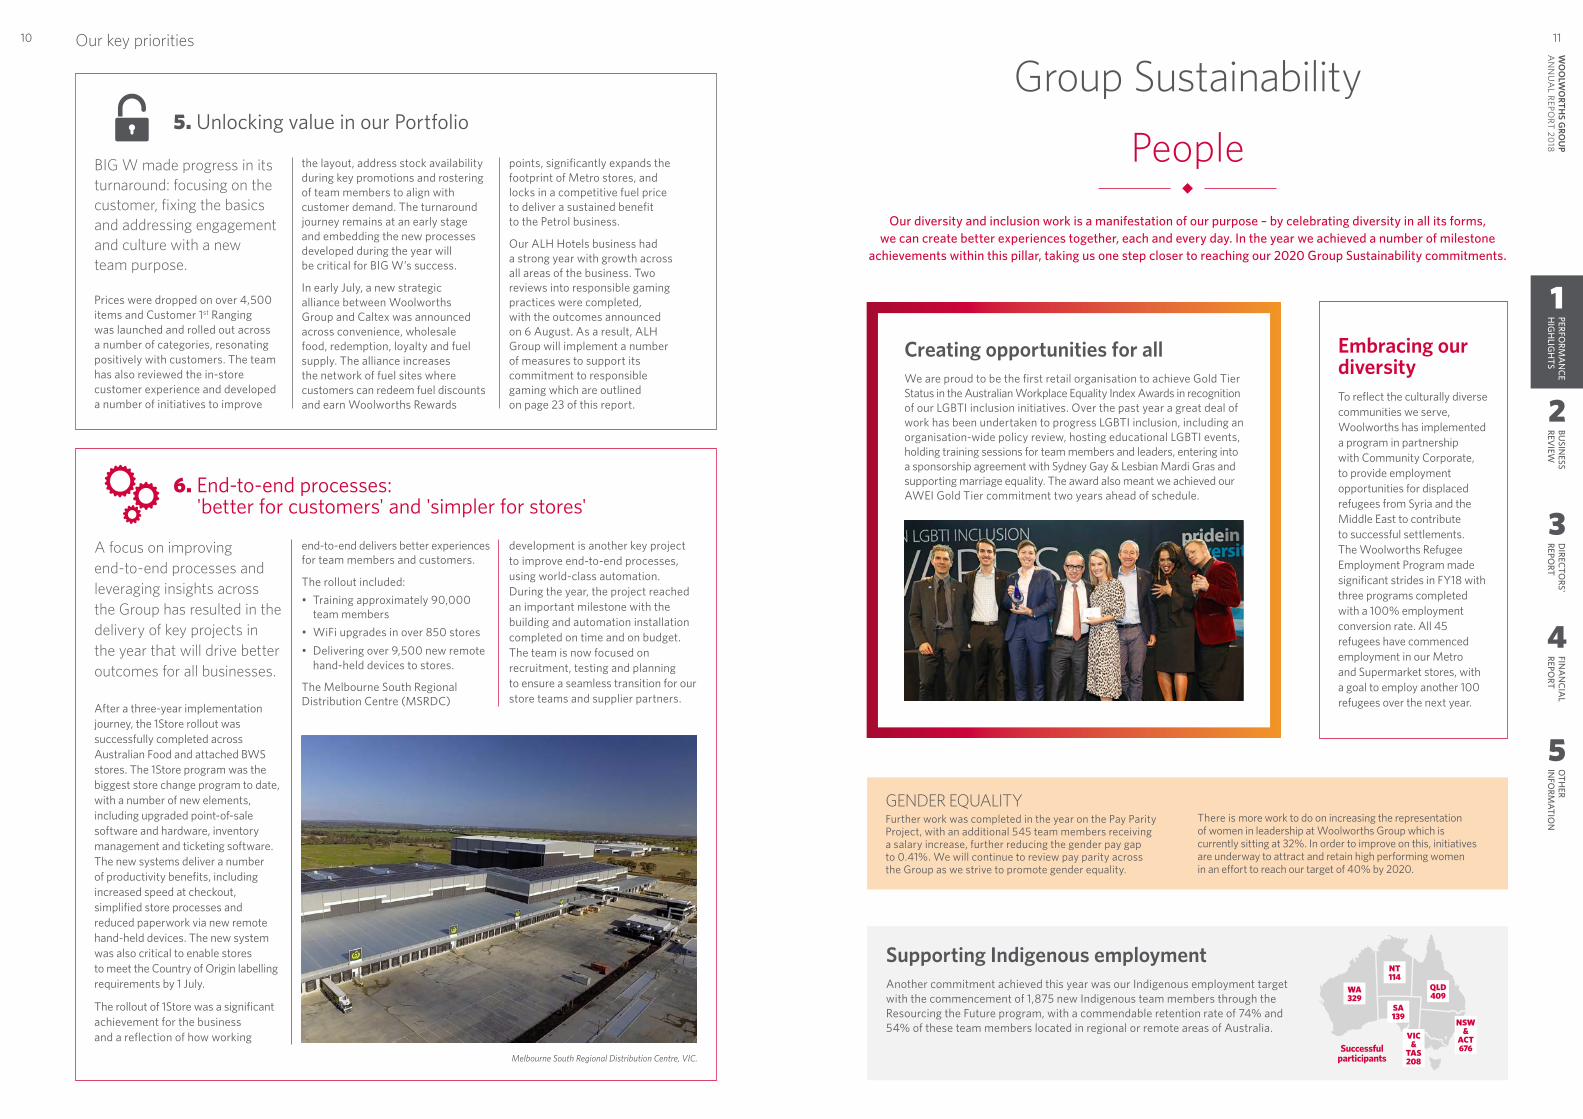
Creating opportunities for allWe are proud to be the first retail organisation to achieve Gold Tier Status in the Australian Workplace Equality Index Awards in recognition of our LGBTI inclusion initiatives. Over the past year a great deal of work has been undertaken to progress LGBTI inclusion, including an organisation-wide policy review, hosting educational LGBTI events, holding training sessions for team members and leaders, entering into a sponsorship agreement with Sydney Gay & Lesbian Mardi Gras and supporting marriage equality. The award also meant we achieved our AWEI Gold Tier commitment two years ahead of schedule.
Embracing our diversityTo reflect the culturally diverse communities we serve, Woolworths has implemented a program in partnership with Community Corporate, to provide employment opportunities for displaced refugees from Syria and the Middle East to contribute to successful settlements. The Woolworths Refugee Employment Program made significant strides in FY18 with three programs completed with a 100% employment conversion rate. All 45 refugees have commenced employment in our Metro and Supermarket stores, with a goal to employ another 100 refugees over the next year.
Supporting Indigenous employmentAnother commitment achieved this year was our Indigenous employment target with the commencement of 1,875 new Indigenous team members through the Resourcing the Future program, with a commendable retention rate of 74% and 54% of these team members located in regional or remote areas of Australia.
QLD409
NT114
WA329
SA139
NSW &
ACT676
VIC &
TAS208
Group Sustainability
Our diversity and inclusion work is a manifestation of our purpose – by celebrating diversity in all its forms, we can create better experiences together, each and every day. In the year we achieved a number of milestone
achievements within this pillar, taking us one step closer to reaching our 2020 Group Sustainability commitments.
People
GENDER EQUALITYFurther work was completed in the year on the Pay Parity Project, with an additional 545 team members receiving a salary increase, further reducing the gender pay gap to 0.41%. We will continue to review pay parity across the Group as we strive to promote gender equality.
There is more work to do on increasing the representation of women in leadership at Woolworths Group which is currently sitting at 32%. In order to improve on this, initiatives are underway to attract and retain high performing women in an effort to reach our target of 40% by 2020.
Successfulparticipants
2
3
4
5
BUSIN
ESS REV
IEWD
IRECTORS'
REPORT
FINA
NCIA
L REPO
RTO
THER
INFO
RMATIO
N11
WO
OLW
ORTH
S GRO
UP
AN
NU
AL REPO
RT 2018
10PERFO
RMA
NCE
HIG
HLIG
HTS
1
We recognise the environmental impact that our operations may have on the planet. We know that we can be leaders through the decisions we make. Every day we are exploring opportunities, trialling new initiatives and employing innovative technologies, to become a more sustainable organisation.
We continue to find ways to work better together with our partners – including our suppliers, customers and communities. The power of these strong relationships
builds trust and enables us to maximise our positive impact.
Planet Prosperity
Group Sustainability
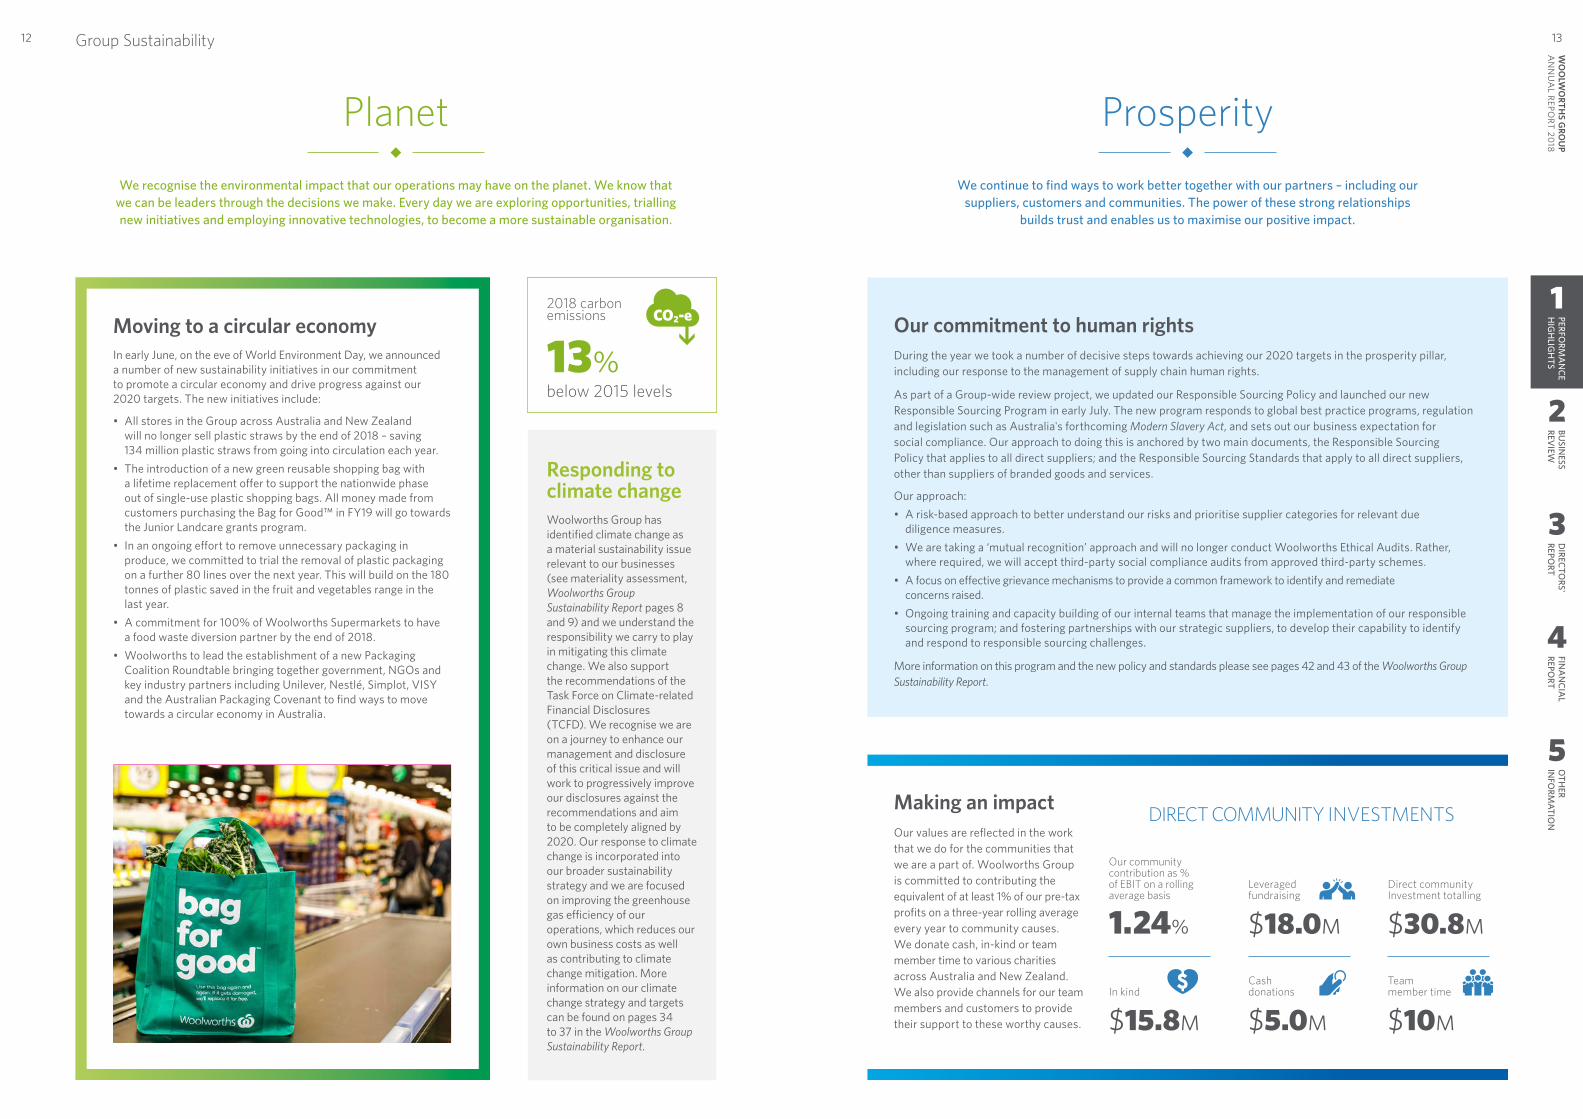
Moving to a circular economy In early June, on the eve of World Environment Day, we announced a number of new sustainability initiatives in our commitment to promote a circular economy and drive progress against our 2020 targets. The new initiatives include:
• All stores in the Group across Australia and New Zealand will no longer sell plastic straws by the end of 2018 – saving 134 million plastic straws from going into circulation each year.
• The introduction of a new green reusable shopping bag with a lifetime replacement offer to support the nationwide phase out of single-use plastic shopping bags. All money made from customers purchasing the Bag for Good™ in FY19 will go towards the Junior Landcare grants program.
• In an ongoing effort to remove unnecessary packaging in produce, we committed to trial the removal of plastic packaging on a further 80 lines over the next year. This will build on the 180 tonnes of plastic saved in the fruit and vegetables range in the last year.
• A commitment for 100% of Woolworths Supermarkets to have a food waste diversion partner by the end of 2018.
• Woolworths to lead the establishment of a new Packaging Coalition Roundtable bringing together government, NGOs and key industry partners including Unilever, Nestlé, Simplot, VISY and the Australian Packaging Covenant to find ways to move towards a circular economy in Australia.
Responding to climate changeWoolworths Group has identified climate change as a material sustainability issue relevant to our businesses (see materiality assessment, Woolworths Group Sustainability Report pages 8 and 9) and we understand the responsibility we carry to play in mitigating this climate change. We also support the recommendations of the Task Force on Climate-related Financial Disclosures (TCFD). We recognise we are on a journey to enhance our management and disclosure of this critical issue and will work to progressively improve our disclosures against the recommendations and aim to be completely aligned by 2020. Our response to climate change is incorporated into our broader sustainability strategy and we are focused on improving the greenhouse gas efficiency of our operations, which reduces our own business costs as well as contributing to climate change mitigation. More information on our climate change strategy and targets can be found on pages 34 to 37 in the Woolworths Group Sustainability Report.
2018 carbon emissions
13% below 2015 levels
Our commitment to human rights During the year we took a number of decisive steps towards achieving our 2020 targets in the prosperity pillar, including our response to the management of supply chain human rights.
As part of a Group-wide review project, we updated our Responsible Sourcing Policy and launched our new Responsible Sourcing Program in early July. The new program responds to global best practice programs, regulation and legislation such as Australia's forthcoming Modern Slavery Act, and sets out our business expectation for social compliance. Our approach to doing this is anchored by two main documents, the Responsible Sourcing Policy that applies to all direct suppliers; and the Responsible Sourcing Standards that apply to all direct suppliers, other than suppliers of branded goods and services.
Our approach: • A risk-based approach to better understand our risks and prioritise supplier categories for relevant due
diligence measures. • We are taking a ‘mutual recognition’ approach and will no longer conduct Woolworths Ethical Audits. Rather,
where required, we will accept third-party social compliance audits from approved third-party schemes. • A focus on effective grievance mechanisms to provide a common framework to identify and remediate
concerns raised. • Ongoing training and capacity building of our internal teams that manage the implementation of our responsible
sourcing program; and fostering partnerships with our strategic suppliers, to develop their capability to identify and respond to responsible sourcing challenges.
More information on this program and the new policy and standards please see pages 42 and 43 of the Woolworths Group Sustainability Report.
DIRECT COMMUNITY INVESTMENTSMaking an impactOur values are reflected in the work that we do for the communities that we are a part of. Woolworths Group is committed to contributing the equivalent of at least 1% of our pre-tax profits on a three-year rolling average every year to community causes. We donate cash, in-kind or team member time to various charities across Australia and New Zealand. We also provide channels for our team members and customers to provide their support to these worthy causes.
Our community contribution as % of EBIT on a rolling average basis
1.24%
Leveraged fundraising
$18.0M
In kind
$15.8M
Cash donations
$5.0M
Team member time
$10M
Direct community Investment totalling
$30.8M
2
3
4
5
BUSIN
ESS REV
IEWD
IRECTORS'
REPORT
FINA
NCIA
L REPO
RTO
THER
INFO
RMATIO
N13
WO
OLW
ORTH
S GRO
UP
AN
NU
AL REPO
RT 2018
12PERFO
RMA
NCE
HIG
HLIG
HTS
1
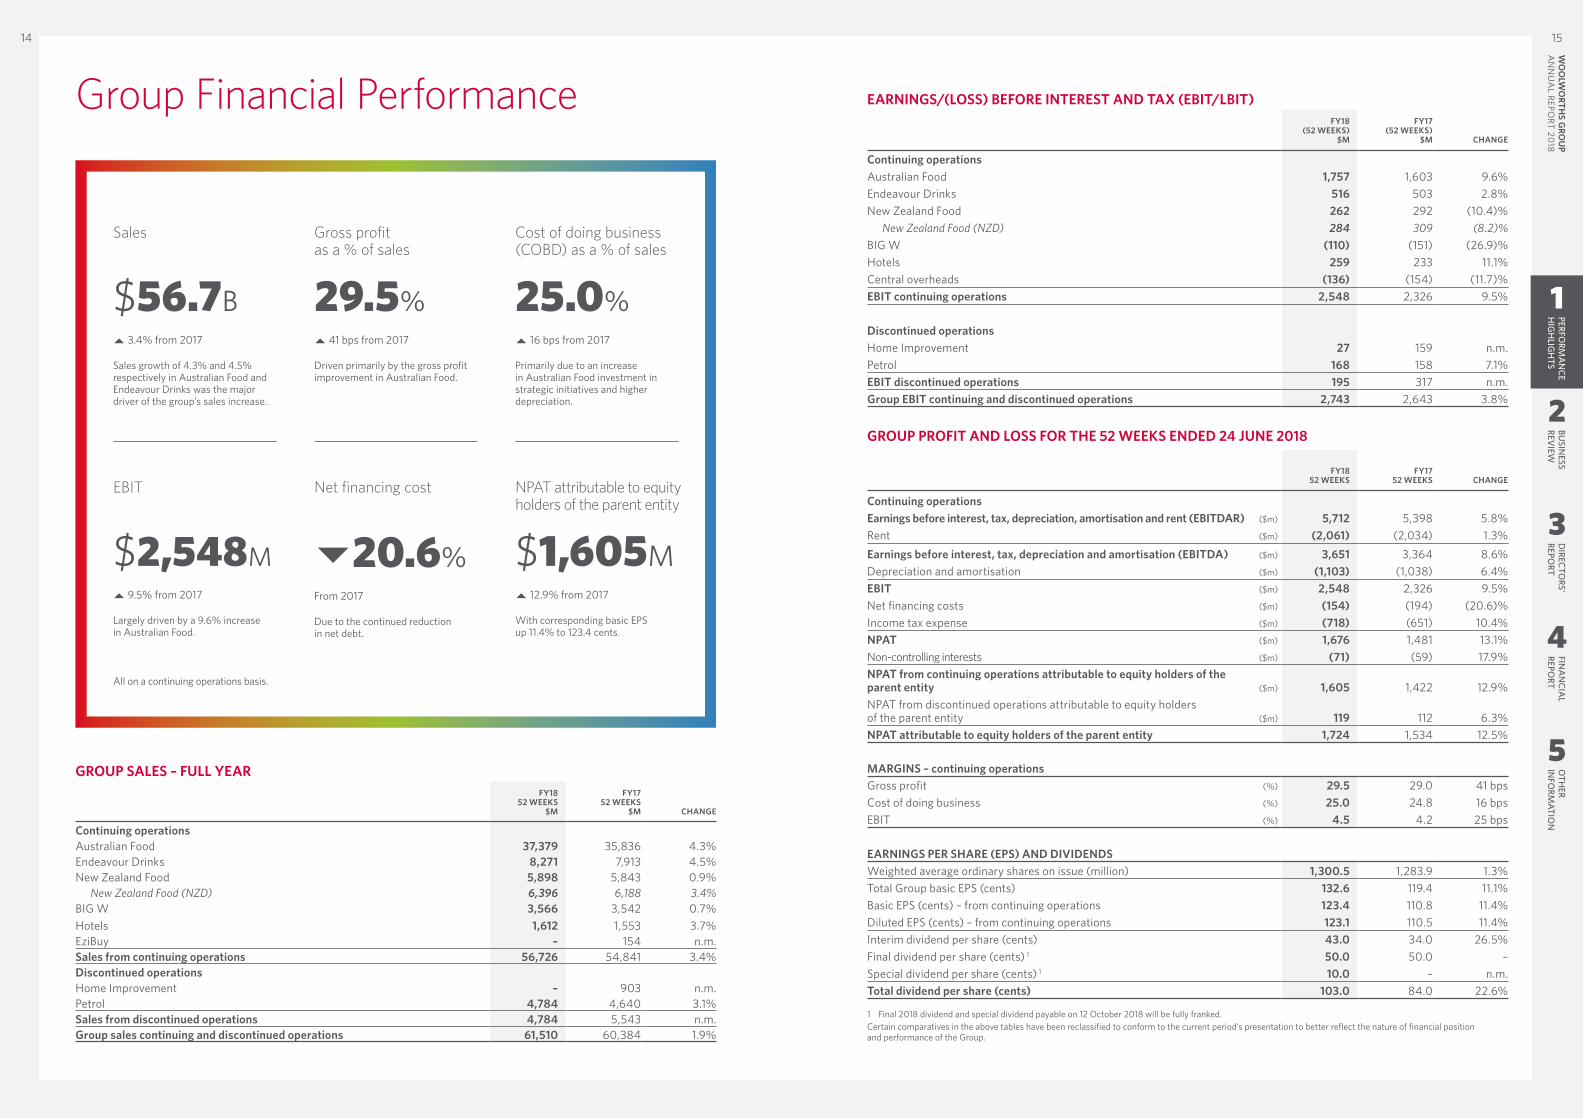
GROUP SALES – FULL YEARFY18
52 WEEKS$M
FY1752 WEEKS
$M CHANGE
Continuing operationsAustralian Food 37,379 35,836 4.3%Endeavour Drinks 8,271 7,913 4.5%New Zealand Food 5,898 5,843 0.9%
New Zealand Food (NZD) 6,396 6,188 3.4%BIG W 3,566 3,542 0.7%Hotels 1,612 1,553 3.7%EziBuy – 154 n.m.Sales from continuing operations 56,726 54,841 3.4%Discontinued operationsHome Improvement – 903 n.m.Petrol 4,784 4,640 3.1%Sales from discontinued operations 4,784 5,543 n.m.Group sales continuing and discontinued operations 61,510 60,384 1.9%
EARNINGS/(LOSS) BEFORE INTEREST AND TAX (EBIT/LBIT)FY18
(52 WEEKS)$M
FY17(52 WEEKS)
$M CHANGE
Continuing operationsAustralian Food 1,757 1,603 9.6%Endeavour Drinks 516 503 2.8%New Zealand Food 262 292 (10.4)%
New Zealand Food (NZD) 284 309 (8.2)%BIG W (110) (151) (26.9)%Hotels 259 233 11.1%Central overheads (136) (154) (11.7)%EBIT continuing operations 2,548 2,326 9.5%
Discontinued operationsHome Improvement 27 159 n.m.Petrol 168 158 7.1%EBIT discontinued operations 195 317 n.m.Group EBIT continuing and discontinued operations 2,743 2,643 3.8%
GROUP PROFIT AND LOSS FOR THE 52 WEEKS ENDED 24 JUNE 2018
FY1852 WEEKS
FY1752 WEEKS CHANGE
Continuing operationsEarnings before interest, tax, depreciation, amortisation and rent (EBITDAR) ($m) 5,712 5,398 5.8%Rent ($m) (2,061) (2,034) 1.3%Earnings before interest, tax, depreciation and amortisation (EBITDA) ($m) 3,651 3,364 8.6%Depreciation and amortisation ($m) (1,103) (1,038) 6.4%EBIT ($m) 2,548 2,326 9.5%Net financing costs ($m) (154) (194) (20.6)%Income tax expense ($m) (718) (651) 10.4%NPAT ($m) 1,676 1,481 13.1%Non-controlling interests ($m) (71) (59) 17.9%NPAT from continuing operations attributable to equity holders of the parent entity ($m) 1,605 1,422 12.9%NPAT from discontinued operations attributable to equity holders of the parent entity ($m) 119 112 6.3% NPAT attributable to equity holders of the parent entity 1,724 1,534 12.5%
MARGINS – continuing operationsGross profit (%) 29.5 29.0 41 bpsCost of doing business (%) 25.0 24.8 16 bpsEBIT (%) 4.5 4.2 25 bps
EARNINGS PER SHARE (EPS) AND DIVIDENDSWeighted average ordinary shares on issue (million) 1,300.5 1,283.9 1.3%Total Group basic EPS (cents) 132.6 119.4 11.1%Basic EPS (cents) – from continuing operations 123.4 110.8 11.4%Diluted EPS (cents) – from continuing operations 123.1 110.5 11.4%Interim dividend per share (cents) 43.0 34.0 26.5%Final dividend per share (cents) 1 50.0 50.0 –Special dividend per share (cents) 1 10.0 – n.m.Total dividend per share (cents) 103.0 84.0 22.6%
1 Final 2018 dividend and special dividend payable on 12 October 2018 will be fully franked.Certain comparatives in the above tables have been reclassified to conform to the current period’s presentation to better reflect the nature of financial position and performance of the Group.
Group Financial Performance
Sales
$56.7B 3.4% from 2017
Sales growth of 4.3% and 4.5% respectively in Australian Food and Endeavour Drinks was the major driver of the group’s sales increase.
Gross profit as a % of sales
29.5% 41 bps from 2017
Driven primarily by the gross profit improvement in Australian Food.
Cost of doing business (COBD) as a % of sales
25.0% 16 bps from 2017
Primarily due to an increase in Australian Food investment in strategic initiatives and higher depreciation.
EBIT
$2,548M 9.5% from 2017
Largely driven by a 9.6% increase in Australian Food.
Net financing cost
20.6%From 2017
Due to the continued reduction in net debt.
NPAT attributable to equity holders of the parent entity
$1,605M 12.9% from 2017
With corresponding basic EPS up 11.4% to 123.4 cents.
All on a continuing operations basis.
2
3
4
5
BUSIN
ESS REV
IEWD
IRECTORS'
REPORT
FINA
NCIA
L REPO
RTO
THER
INFO
RMATIO
N15
WO
OLW
ORTH
S GRO
UP
AN
NU
AL REPO
RT 2018
14PERFO
RMA
NCE
HIG
HLIG
HTS
1
TRADING PERFORMANCEAustralian Food’s customer scores improved over the year with Overall Customer Satisfaction (including Online) in June increasing to 81% (FY17: 77%) and store-controllable VOC increasing to 84% (FY17: 80%). Both were in line with Q3’18 despite an impact from the removal of single-use plastic bags at the end of June.All eight store-controllable VOC measures improved compared to the prior year. Ease of Pick up (+12 pts), Fruit & Vegetables (+8 pts) and On-shelf Availability (+4 pts) delivered the biggest improvement but continue to offer the most upside. In FY19, customer feedback measures will be broadened to include Net Promoter Score as part of short-term incentives to better align with our ambition to provide a ‘consistently good’ shopping experience for our customers.Australian Food sales of $37.4 billion increased 4.3% on the previous year, with comparable sales also increasing by 4.3%. Comparable customer transaction growth of 4.2% and an improvement in items per basket drove comparable item growth of 5.0% for the full year. Despite cycling strong prior year growth, we achieved comparable sales growth (Easter-adjusted) of 3.1% in Q4’18 with sales growth impacted somewhat by lower infant formula
sales along with significant fruit and vegetable deflation.Metro delivered double-digit comparable sales and we opened our new concept store in Pitt Street Mall, Sydney on 20 June. At the end of the financial year, there were 33 Metro branded stores with a further 15 small Woolworths Supermarkets now managed by the Metro team.The continued digital and data investment in WooliesX over the past year has delivered positive results with Online VOC scores improving 6 pts to 79% at the end of June and Rewards VOC improving 9 pts to 71%. Online sales in FY18 totalled $1.1 billion growing over 30% and by the end of the year, online penetration exceeded 3% of Australian Food sales. Online sales benefitted from the successful rollout and ongoing improvement in our Pick up offer to over 1,000 locations in FY18 with Pick up sales increasing 119% and now representing approximately a quarter of total online sales.Australian Food sales per square metre increased by 2.9% to $16,435, driven largely by strong comparable sales growth. During the year, we opened 17 new stores including 11 supermarkets and six Metros (of which two were former Thomas Dux stores), and we closed seven, ending the year with 1,008 Woolworths Supermarkets and Metro stores. Average space growth for the year was 1.4%.
Average prices declined by 1.9% in FY18 with lower prices translating into an improvement in price perception. Average price deflation increased in the fourth quarter to 2.3% largely due to lower fruit and vegetable prices (-9.7%) as we cycled fruit and vegetable inflation in Q4’17. Excluding fruit and vegetable deflation, average price deflation was 1.1% for the fourth quarter.The focus on improving overall price trust for customers has continued through lowering shelf prices and a shift from promotional pricing to trusted everyday low prices. At the end of June, over 4,800 products were on Low Price Always or Prices Dropped programs, an increase of around 1,500 compared to the end of FY17. Gross margin increased by 63 bps to 29.1%, primarily due to ongoing improvements in stock loss, our meat operating model, product mix and promotional effectiveness. CODB as a percentage of sales increased 41 bps to 24.4% as we invested to drive sales and gross margin and initiatives to support our long-term growth. Outside of volume and inflation increases, cost growth in FY18 was primarily a function of investment in three key areas:• Costs associated with strategic
investments: Approximately $130 million was on a range of strategic initiatives in FY18
SALES ($M)
EBIT ($M)
SALES PER M2
$37,379
$1,757
$16,435
4.3% from 2017
9.6% from 2017
2.9% from 2017
AustralianFood
PITT STREET METROMetro on Pitt Street is the latest iteration of the convenience store experience, a culmination of our learnings since opening the first Metro five years ago. The smaller format model offers a specific range that supports the shopping mission of a Metro customer, including 'food for now', and 'food for later' meals and the top-up grocery shop.
Pitt Street Metro opened on 20 June and has been purpose-built to cater to the high volume of pedestrian traffic in the precinct who are looking for the quick and easy 'grab and go' solutions. The new store includes an expansive fresh food section, a cafe with barista-made coffee, a deli including a create your own poke bowls, bakery, sushi counter, ready meal section and a dedicated area to the Macro range.
Customer fulfillment centres on the ground
3 centres
Rewards members
10.9M
1 year anniversary
Customer visits per week
2.1M online
Customer Pick up available at
1,070 locations
Voice of Customer improvements for Rewards and eCommerce
10%
including building digital and data capability in WooliesX and supply chain investments to drive benefits in the year and future years
– One-off costs of $35 million were incurred due to strategic decisions to exit Meat manufacturing and other Supply Chain network facilities. This will deliver material benefits in future years as the business transitions to a new automated distribution centre in Melbourne (MSRDC) in FY19, a new Queensland secondary meat processing facility in FY20 and a new Fresh distribution centre in Victoria in FY21
– In addition to online sales growth, WooliesX investment led to an increase in Rewards members to 10.9 million at the end of June and a lift in card scan rate by 2.8 pts. Critically, the underlying digital infrastructure
was also upgraded to improve the overall digital user experience
– Store-based strategic investments included Customer 1st Ranging which supported strong sales growth, a 3 pt improvement in Range VOC to 77%, as well as the Availability program (including Lost Sales Measure technology) which contributed to improvements in store efficiency and a 4 pt improvement in Availability VOC
– Depreciation increased by $55 million (+8.9%) as a result of increased spend on store IT investments and Renewals
• Customer-driven impacts: Approximately $60 million of incremental costs resulted from evolving customer needs and shopping patterns, including increased trading on weekends
(weekend VOC improved from 77% to 81%), Fresh unit growth ahead of sales and online sales growth of over 30%
• Structural inflation: Approximately $30 million was as a result of increases in underlying electricity costs and transaction costs as customers migrate from cash and EFTPOS into credit and tap tender types, which incur higher fees
Despite these investments, EBIT increased 9.6% to $1,757 million, a 4.7% EBIT margin for the year. Second half EBIT increased by 19 bps or 8.1% at a margin of 4.7%. ROFE increased by 4.6 pts with strong EBIT growth more than offsetting an increase in average funds employed.Funds employed increased by 13.4% at year-end due to higher investment in Renewals, digital, 1POS, and the new MSRDC.
BIG 5 Customer 1st prioritiesKey initiatives to support our ambition to be 'consistently good' across stores have been embedded during the year to deliver on our Customer 1st strategy. Known as the Big 5, the team made good progress across the initiatives in FY18.
Availability: on-shelf availability VOC up 4 pts from the prior year
Stock Loss: further improvements contributing to an increase in Australian Food gross margin
Customer-led Rostering: driving better outcomes in produce and checkouts, especially on weekends
Ease of Pick up: VOC measure up 13 pts from the prior year
1Store: Rolled out to all Woolworths Supermarkets in time to support Country of Origin Labelling launch
WooliesX encompasses, digital, e-commerce, customer loyalty
and rewards, and customer services teams.
FY1852 WEEKS
FY1752 WEEKS CHANGE
Sales ($m) 37,379 35,836 4.3%EBITDA ($m) 2,430 2,221 9.4%Depreciation and amortisation ($m) (673) (618) 8.9%EBIT ($m) 1,757 1,603 9.6%Gross margin (%) 29.1 28.5 63 bpsCost of doing business (%) 24.4 24.0 41 bpsEBIT to sales (%) 4.7 4.5 23 bpsSales per square metre ($) 16,435 15,974 2.9%Funds employed ($m) 1,215 1,071 13.4%Return on average funds employed (ROFE) (%) 170.7 166.1 4.6 pts
Certain comparatives have been reclassified to conform to the current period’s presentation to better reflect the nature of financial position and performance of the Group.
1
3
4
5
PERFORM
AN
CEH
IGH
LIGH
TSD
IRECTORS'
REPORT
FINA
NCIA
L REPO
RTO
THER
INFO
RMATIO
N17
WO
OLW
ORTH
S GRO
UP
AN
NU
AL REPO
RT 2018
16BU
SINESS
REVIEW
2
TRADING PERFORMANCEEndeavour Drinks sales increased by 4.5% to $8.3 billion in FY18 with comparable sales increasing 3.6%. BWS and Dan Murphy’s both delivered solid sales growth driven by effective execution of seasonal events and a significant contribution from attached BWS stores.
Dan Murphy’s maintained its market leading NPS and Dan Murphy’s and BWS both strengthened key VOC metrics during the year.
Dan Murphy’s sales growth was supported by eight new stores and strong double-digit sales growth in online. In the second half of the year, Dan Murphy’s launched a new online website allowing customers faster and easier access. This has increased visits and online sales conversion. Dan Murphy’s premium wine customers are experiencing
an enhanced service offering through increased partnership with the Langton’s wine broking business.
BWS had a pleasing year driven by its range segmentation and participation in the Rewards program. It opened 18 net new stores in FY18 bringing the network to 1,316 stores, with a successful trial of the store renewal program’s integrated formats. There is a strong focus on customer convenience with the acquisition of Jimmy Brings during the year adding to the rollout of express delivery services from stores.
Endeavour Drinks sales per square metre increased by 1.3% with total sales growth of 4.5%, offset by net average space growth of 3.2%.
Endeavour Drinks’ gross margin was flat at 23.1% with margin improvements in BWS wine and
spirits categories offset by a change in sales mix and a minor reclassification of costs between gross margin and CODB.
CODB as a percentage of sales increased by 13 bps but was broadly flat compared to the prior year excluding the $8.4 million gain on the sale of a business in FY17. EBIT increased 2.8% to $516 million in FY18, and excluding the prior year gain on sale, EBIT growth was 4.7%.
ROFE improved by 15 bps driven by continued improvement in working capital more than offsetting the impact of new store openings.
Delivering the ‘ultimate drinks experience’As our customers’ expectations change and evolve, Dan Murphy’s is focused on winning in customer experience. The team has already started working on evolving its tasting tables to experiential zones and also rolled out a new training program known as; Connect, Discover, Enjoy (CDE). The CDE program is about inspiring all the Dan Murphy’s team to deliver the ultimate drinks experience for customers.
Endeavour Drinks
Pinot Noir award for CellarmastersEarlier this year, Cellarmasters’ Dovetail Yarra Valley Pinot Noir won Best Wine and Best Pinot Noir at the International Cool Climate Wine Show. Established in 2000, the event is recognised as one of Australia’s foremost shows for inspirational cool climate wines.
‘Pinot Noir is very in vogue at the moment, and getting increasingly popular among Aussie wine lovers. It’s the red wine that’s growing fastest in popularity at the moment.
‘The International Cool Climate Wine Show is one of the most regarded wine shows for Pinot Noir, so this win says a lot about this wine. Layered with bright raspberry and cherry fruit and subtle integrated oak, this wine will add a special touch to any occasion’, explains Christine Ricketts, Cellar Director at Cellarmasters.
The fruit for the winning wine comes from a single specific vineyard in the Yarra Valley, known for it’s cool climate and long, slow ripening period that produces wines with delicate aromas and complex flavours.
Dan Murphy’s Pick upDan Murphy's is always looking for innovative ways to provide customers with greater convenience, including a seamless experience for customers who order online and Pick up in-store. During the year Dan Murphy's piloted a drive-thru Pick up service in Miami, Queensland, and an enhanced walk-in offer at Guildford, New South Wales. These pilots proved very successful and Dan Murphy's will commence rolling out an innovative Pick up service in Sydney in November 2019.
BWS ON DEMAND
BWS’ customer convenience offer continued to evolve in FY18, with the launch of BWS On Demand. At these sites, customers can purchase drinks
both in-store and online and have it delivered at a convenient time and
location, including express within one hour from the chosen BWS
store. At the end of the financial year, over 340 stores were offering this service and approximately 30,000
deliveries were completed.
Currently BWS delivers in six cities around Australia (Sydney,
Melbourne, Perth, Brisbane, Gold Coast and Adelaide) with expansion into Canberra set for July next year.
To further support the ever increasing customer demand for convenience, Endeavour
Drinks acquired Jimmy Brings in December 2017. Jimmy Brings delivers a curated
range of drinks to customers in under 30 minutes and since
acquisition, has launched in Victoria, and continues its
strong growth trajectory, with an average of 10% compound monthly growth in orders for
the past six months.
$8,271
$516
$18,155
4.5% from 2017
2.8% from 2017
1.3% from 2017
SALES ($M)
EBIT ($M)
SALES PER M2
FY1852 WEEKS
FY1752 WEEKS CHANGE
Sales ($m) 8,271 7,913 4.5%EBITDA ($m) 603 588 2.7%Depreciation and amortisation ($m) (87) (85) 3.1%EBIT ($m) 516 503 2.8%Gross margin (%) 23.1 23.1 2 bps Cost of doing business (%) 16.9 16.7 13 bpsEBIT to sales (%) 6.2 6.4 (11) bpsSales per square metre ($) 18,155 17,917 1.3%Funds employed ($m) 3,214 3,017 6.5%Return on average funds employed (ROFE) (%) 17.1 16.9 15 bps
Certain comparatives have been reclassified to conform to the current period’s presentation to better reflect the nature of financial position and performance of the Group.
1
3
4
5
PERFORM
AN
CEH
IGH
LIGH
TSD
IRECTORS'
REPORT
FINA
NCIA
L REPO
RTO
THER
INFO
RMATIO
N19
WO
OLW
ORTH
S GRO
UP
AN
NU
AL REPO
RT 2018
18BU
SINESS
REVIEW
2
year. In the second half of the year we established CountdownX to ensure that New Zealand Food maintains its leadership position in online and further enhances its digital and data capabilities.
Whilst Q4’18 comparable sales remained strong at 3.7%, total sales (+2.5%) were impacted by the scheduled closure of three Countdown stores in the second half. Deflation also accelerated in Q4’18 with a 1.8% decline in average prices, largely driven by lower Fruit & Vegetable and Grocery prices. There are now over 4,500 products on the Price Down program.
Gross margin was relatively unchanged on the prior year with further improvements in stock loss through store ranging and process excellence
initiatives offsetting increased price investment.
CODB as a percentage of sales increased 56 bps on the previous year driven by investment in the store team to improve the customer experience and further strengthen digital capability, with the result that EBITDA and EBIT decreased 3.6% and 8.2% respectively.
ROFE declined by 100 bps in FY18 to 9.5% largely due to the reduction in EBIT following the investments detailed above.
TRADING PERFORMANCENew Zealand Food’s sales for the year were NZ$6.4 billion, an increase of 3.4% on the previous year (0.9% increase in AUD). Comparable sales also increased 3.4% for the year as planned investments drove core business sales momentum. This was the strongest comparable sales performance in seven years.
Higher comparable sales growth was consistent across the year and benefitted from previously announced key initiatives including investments in store team hours, Fruit & Vegetables and digital. Double-digit online growth accelerated further in the year due to an expanded delivery capacity, reduced delivery fees and the launch of free Pick up for orders over $50, with Online VOC scores improving over the
New Zealand Food 1
COUNTDOWN GREENLANE RENEWALIn June 2018, Countdown’s Greenlane store in Auckland celebrated the completion of a comprehensive renewal. One of the many exciting features is the emphasis on energy efficiency as part of our sustainability commitments. The new additions in-store like energy efficient fittings, LED lighting and a state-of-the-art hybrid refrigeration system are expected to reduce energy use by 40 percent. Two new benches for customer seating have also been installed, made out of 21,000 recycled plastic bags and other soft plastics.
Alongside these new features, the store has a new wine cellar which holds one of Countdown’s largest wine selection in the country, a brand new pharmacy, an expanded product range and a new store layout, complete with bilingual signage.
Today’s connected customer expects that data is used to deliver personalised conversations and a more convenient shopping offer, whether that’s online or in-store.
In the second half of the year, we established CountdownX to to ensure that New Zealand Food maintains its
leadership position in online.
Following the lead set by WooliesX, CountdownX brings together
Countdown’s e-commerce teams for greater collaboration to ensure the
New Zealand business remains at the forefront of a compelling, user friendly and modern e-commerce experience.
Despite the online presence of competitors expanding, Countdown’s online and pick up service continues to see significant growth, helped by increased shopping windows, longer Sunday hours and Countdown’s pick
up app for customers.
Countdown’s expanded delivery capacity, reduced delivery fees and the launch of free pick up for orders
over $50, has also supported an acceleration in online sales growth for the year as well as an improved
Online VOC score.
Countdown's commitment to remove single-use plastic carrier bagsIn October 2017, Countdown became the first supermarket in New Zealand to commit to phasing out single-use plastic carrier bags from its checkouts and online shopping by the end of 2018. This will remove 350 million bags from circulation in the New Zealand waste stream each year.
Ten Countdown stores made the change in May 2018 with positive feedback from customers. At the same time, Countdown’s $1 Bag for Good program was launched to help customers as they transition to reusable bags.
Woolworths New Zealand LimitedAt the end of June, Progressive Enterprises Limited changed its name to Woolworths New Zealand Limited. The change of name is underpinned by the desire on both sides of the Tasman to further strengthen our collaboration and to share best practices. It also clearly demonstrates the Woolworths Group purpose to ‘create better experiences together’. The change was for the Progressive name only. Customers will continue to shop with us in our Countdown stores, or in our franchise SuperValue and FreshChoice stores.
$6,396
$284
$15,531
3.4% from 2017
(8.2)% from 2017
3.2% from 2017
SALES ($M)
EBIT ($M)
SALES PER M2
1 Growth for New Zealand Food quoted in New Zealand Dollars.
Certain comparatives have been reclassified to conform to the current period’s presentation to better reflect the nature of financial position and performance of the Group.
FY1852 WEEKS
FY1752 WEEKS CHANGE
Sales ($m) 6,396 6,188 3.4%EBITDA ($m) 411 427 (3.6)%Depreciation and amortisation ($m) (127) (118) 8.8%EBIT ($m) 284 309 (8.2)%Gross margin (%) 24.2 24.2 (1) bpsCost of doing business (%) 19.7 19.2 56 bpsEBIT to sales (%) 4.4 5.0 (56) bps Sales per square metre ($) 15,531 15,046 3.2%Funds employed ($m) 2,998 2,934 2.2%Return on average funds employed (ROFE) (%) 9.5 10.5 (100) bps
1
3
4
5
PERFORM
AN
CEH
IGH
LIGH
TSD
IRECTORS'
REPORT
FINA
NCIA
L REPO
RTO
THER
INFO
RMATIO
N21
WO
OLW
ORTH
S GRO
UP
AN
NU
AL REPO
RT 2018
20BU
SINESS
REVIEW
2
TRADING PERFORMANCEBIG W’s sales of $3.6 billion for the year increased 0.7% with comparable sales increasing by 0.9%, the first year of positive comparable sales growth since FY09. Easter-adjusted Q4’18 comparable sales grew 2.0%, positively impacted by Kids, Home and seasonal apparel categories.
Lower prices, improved product ranges, changes to store experience and the evolving digital offer has led to an increase in comparable items per basket of 3.5% and customer transactions of 1.4% on last year.
By the end of FY18, BIG W had dropped prices on over 4,500 items, completed a refresh of 165 stores and increased convenience for customers with Pick up available in all stores. Ranges have been reset in line with customers’ core needs with 13 Customer 1st Ranging categories introduced.
BIG W has materially improved the digital experience and the convenience offer for customers with average weekly visits to bigw.com.au up 25% on FY17. Free same day Pick up was launched across all stores, customer shopping tools were implemented (including in-store stock check), the delivery network was expanded as
well as more payment options introduced, including Afterpay.
Gross profit improved by 43 bps to 31.7%, as improved sell-through and inventory management of apparel allowed for reduced levels of markdown activity in H2’18.
CODB decreased by 74 bps to 34.8% but increased on a trading basis with store cost efficiencies offset by increases in marketing and transformation costs. CODB in FY17 included an asset impairment and onerous lease provision of $35.3 million.
Funds employed declined by 2.3% primarily reflecting lower levels of inventory at the end of June, particularly in apparel.
FY18 was a year of stabilisation for BIG W with progress made on the turnaround plan, but there is still a long way to go. BIG W has started the journey to being a purpose-led organisation and the team and customers continue to be the primary focus. For the year ahead, BIG W will continue to invest in price to regain customer trust, reset ranges in-store, improve the convenience of the in-store and digital experience and improve stock availability.
BIG W opened one new store and closed three stores this year, ending FY18 at 183 stores.
BIG W HotelsPortfolio Business Portfolio Business
Customer and team 1st
FY18 was the first year of BIG W’s multi-year turnaround journey with a focus on putting its team and customers 1st. Through this focus, BIG W is strengthening its business foundations to achieve the greatest impact for customers: regaining trust on price so customers have confidence BIG W is delivering real value, bettering our ranges in store to reflect what customers really want, improving the flow of stock so that what customers want is available when they want it and finally enhancing the customers' in-store experience.
THE DIGITAL EXPERIENCE: In FY18, BIG W focused on improving the digital experience and convenience offer by making it easier for customers to research and shop online. Key achievements include:• Average of 1.6m weekly visits to
bigw.com.au, up 25% from FY17,• Launched free, same-day
Pick up across all stores,• Implemented customer
shopping tools, including wishlist and in-store stock check,
• Invested in fulfilment capability and expanded the delivery network, and
• More payment options for customers with the introduction of Afterpay.
SALES ($M)
EBIT ($M)
$3,566
$(110)
$3,369
0.7% from 2017
(26.9%) from 2017
0.7% from 2017
SALES PER M2
Our commitment to responsible gamingFollowing the completion of the investigation into whistleblower allegations and the commissioned review from Responsible Gaming Council of Canada, ALH Group will implement a number of measures to support its commitment to responsible gaming. These include:
• publishing an updated national Gaming Code of Conduct,• enhanced training programs to help gaming staff with customer care,• implementing a policy across the organisation precluding the service
of complimentary alcohol in gaming rooms, • enhanced programs and customer engagement to promote voluntary
pre-commitment, • enhancements to its privacy training and procedures, and• disciplinary action where past instances of poor management have
been identified.
FY1852 WEEKS
FY1752 WEEKS CHANGE
Sales ($m) 3,566 3,542 0.7%LBITDA ($m) (30) (72) (57.3)%Depreciation and amortisation ($m) (80) (79) 0.3%LBIT ($m) (110) (151) (26.9)%Gross margin (%) 31.7 31.3 43 bpsCost of doing business (%) 34.8 35.6 (74) bpsLBIT to sales (%) (3.1) (4.2) 117 bpsSales per square metre ($) 3,369 3,345 0.7%Funds employed ($m) 502 514 (2.3)%Return on average funds employed (ROFE) (%) (23.3) (31.6) 8.3 pts
TRADING PERFORMANCESales for the year were $1.6 billion, an increase of 3.7% on the prior year. Comparable sales increased by 3.7%. In Q4’18, Easter adjusted comparable sales increased by 2.8%. Sales growth was driven by strong trading across all areas of the business assisted by the refurbishment of 52 venues during the year.
Gross margin increased by 107 bps due to favourable
changes in business mix and better buying.
CODB as a percentage of sales was flat on the prior year due to strong cost control.
EBIT increased 11.1% to $259 million. EBIT growth was assisted by live sporting events in the first half with the second half cycling a strong trading period in the prior year.
SALES ($M)
EBIT ($M)
$1,612
$259
3.7% from 2017
11.1% from 2017
FY1852 WEEKS
FY1752 WEEKS CHANGE
Sales ($m) 1,612 1,553 3.7%EBIT ($m) 259 233 11.1%Gross margin (%) 84.2 83.1 107 bpsCost of doing business (%) 68.1 68.1 –EBIT to sales (%) 16.1 15.0 107 bps
Certain comparatives have been reclassified to conform to the current period’s presentation to better reflect the nature of financial position and performance of the Group.Certain comparatives have been reclassified to conform to the current period’s presentation to better reflect the nature of financial position and performance of the Group.
1
3
4
5
PERFORM
AN
CEH
IGH
LIGH
TSD
IRECTORS'
REPORT
FINA
NCIA
L REPO
RTO
THER
INFO
RMATIO
N23
WO
OLW
ORTH
S GRO
UP
AN
NU
AL REPO
RT 2018
22BU
SINESS
REVIEW
2
CENTRAL OVERHEADS Central overheads were $136 million, a reduction of 11.7% on the prior year, which included a $12.6 million gain from property sales. In FY19, we continue to expect central overheads to be approximately $150 million per annum excluding the one-off payment of $50 million from Caltex made as part of the new fuel and convenience alliance.
BALANCE SHEETClosing inventory of $4,233 million has remained broadly flat. Closing inventory days decreased to 37.8 days and average inventory days decreased 1 day to 39.0 days.
Net investment in inventory of $1,083 million was favourable to the prior year due to an increase in trade payables.
Provisions of $2,393 million decreased $88 million driven by cash utilisation of FY16 significant items provisions. Excluding Home Improvement and significant items previously recognised, provisions increased $102 million primarily due to an increase in employee entitlement provisions and provisions related to exiting Meat manufacturing and other supply chain network facilities in FY20 and FY21.
Fixed assets and investments of $9,179 million increased by $623 million. This was driven by capital expenditure of $1,950 million relating to store refurbishments, supply chain and IT infrastructure offset by depreciation and asset disposals and retirements in the ordinary course of business.
Net assets held for sale of $800 million primarily relate to Petrol and other Woolworths Group properties held for sale. The decrease on the prior year was largely as a result of the disposal of the Home Improvement business.
Net tax balances of $161 million decreased $130 million due to the movement of net tax benefits arising from provisions and accruals.
Net repayable debt of $1,219 million declined by $677 million due to strong cash generation during the year.
Other financial liabilities decreased by $251 million due to the settlement of the Hydrox Put Option liability following the sale of Home Improvement.
ROFE from continuing operations was 24.1%, an increase of 188 bps on the prior year driven by higher EBIT. Lease-adjusted ROFE increased 90 bps to 14.0%. Group ROFE was 25.0% (FY17: 25.0%).
CASH FLOWCash flow from operating activities before interest and tax was $3,775 million, driven by an improvement in EBITDA of 3.8% (8.6% for continuing operations) reflecting the improved trading performance across the Group.
The cash realisation ratio was 101% with lower net investment in inventory compared to the FY17 financial year-end offset by the cash utilisation of provisions.
Net interest paid of $184 million decreased $50 million due to lower net debt.
Tax payments decreased marginally to $661 million for the year (FY17: $668 million) despite a higher tax expense predominately due to the reduction in the income tax instalment rate.
Proceeds from the sale of property, plant and equipment and businesses and investments were lower than the prior year due to lower proceeds from the sale of properties despite net cash proceeds of $259 million received from the disposal of Home Improvement.
Payments for the purchase of property, plant and equipment, property development, intangible assets, investments and contingent consideration was broadly in line with the prior year at $1,848 million.
Cash used in investing activities was $1,510 million, an increase of 5.5% on the prior year.
Our fixed charges cover ratio has increased to 2.6 times compared to 2.5 times at FY17.
Overheads, balance sheet and cash flow
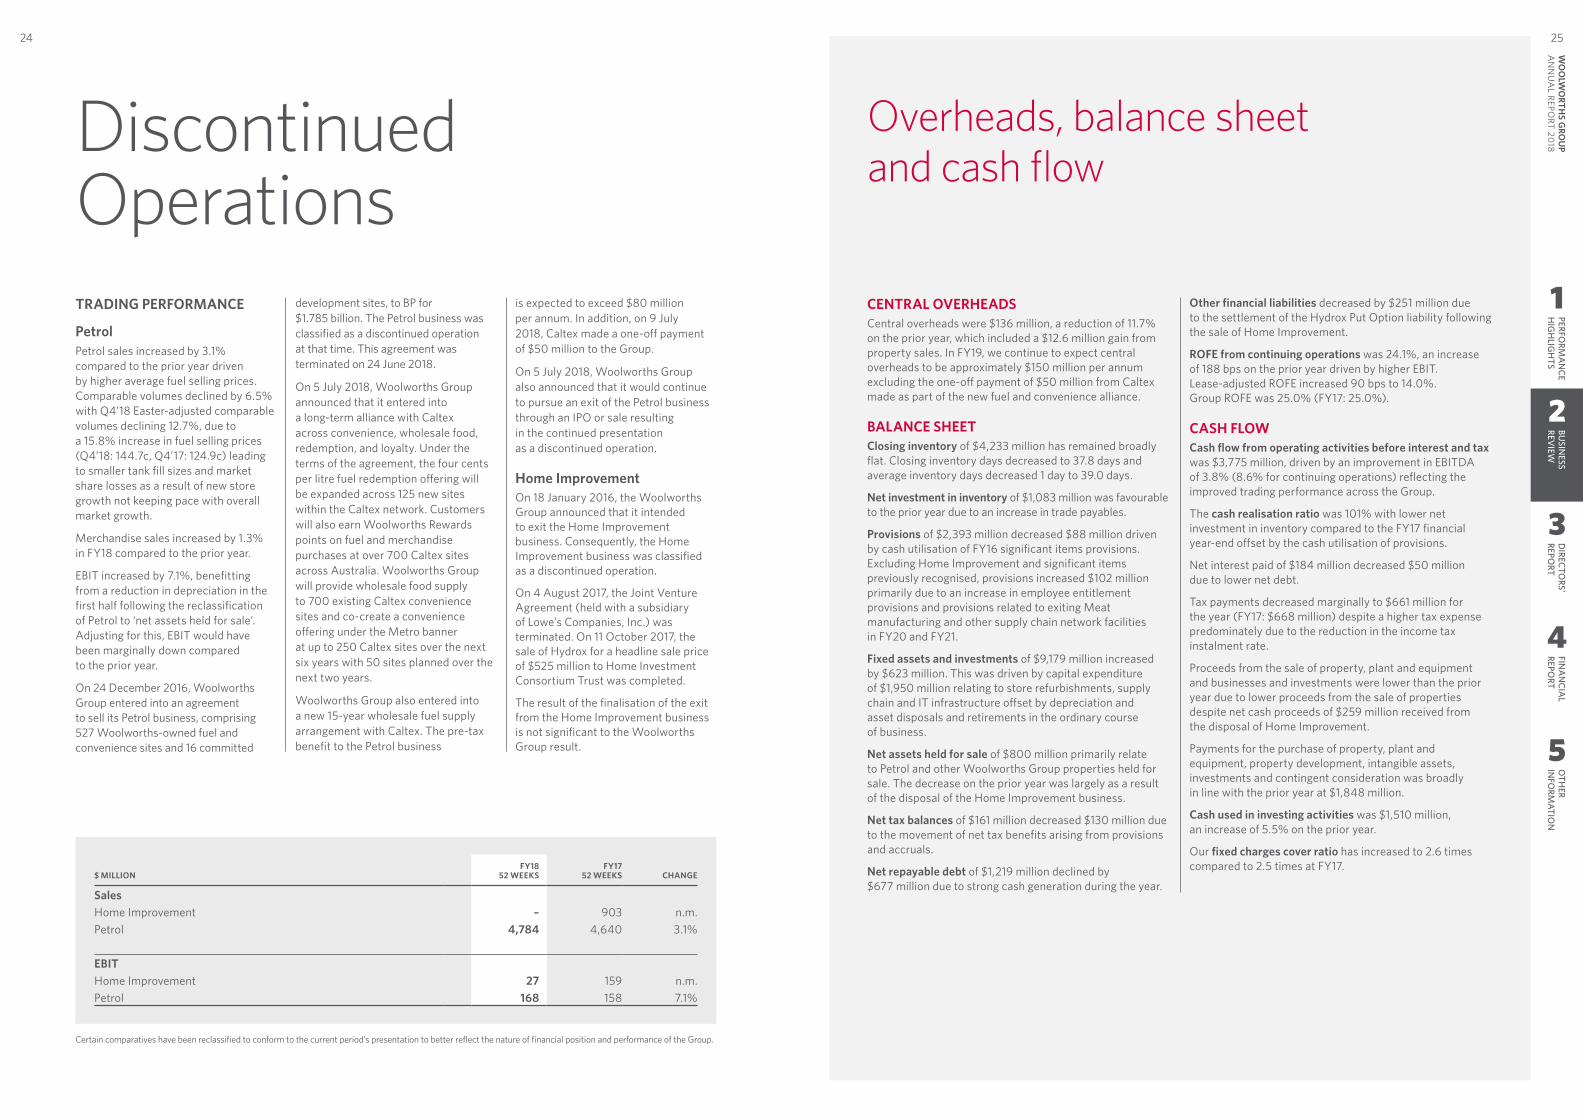
TRADING PERFORMANCE
PetrolPetrol sales increased by 3.1% compared to the prior year driven by higher average fuel selling prices. Comparable volumes declined by 6.5% with Q4’18 Easter-adjusted comparable volumes declining 12.7%, due to a 15.8% increase in fuel selling prices (Q4’18: 144.7c, Q4’17: 124.9c) leading to smaller tank fill sizes and market share losses as a result of new store growth not keeping pace with overall market growth.
Merchandise sales increased by 1.3% in FY18 compared to the prior year.
EBIT increased by 7.1%, benefitting from a reduction in depreciation in the first half following the reclassification of Petrol to ‘net assets held for sale’. Adjusting for this, EBIT would have been marginally down compared to the prior year.
On 24 December 2016, Woolworths Group entered into an agreement to sell its Petrol business, comprising 527 Woolworths-owned fuel and convenience sites and 16 committed
development sites, to BP for $1.785 billion. The Petrol business was classified as a discontinued operation at that time. This agreement was terminated on 24 June 2018.
On 5 July 2018, Woolworths Group announced that it entered into a long-term alliance with Caltex across convenience, wholesale food, redemption, and loyalty. Under the terms of the agreement, the four cents per litre fuel redemption offering will be expanded across 125 new sites within the Caltex network. Customers will also earn Woolworths Rewards points on fuel and merchandise purchases at over 700 Caltex sites across Australia. Woolworths Group will provide wholesale food supply to 700 existing Caltex convenience sites and co-create a convenience offering under the Metro banner at up to 250 Caltex sites over the next six years with 50 sites planned over the next two years.
Woolworths Group also entered into a new 15-year wholesale fuel supply arrangement with Caltex. The pre-tax benefit to the Petrol business
is expected to exceed $80 million per annum. In addition, on 9 July 2018, Caltex made a one-off payment of $50 million to the Group.
On 5 July 2018, Woolworths Group also announced that it would continue to pursue an exit of the Petrol business through an IPO or sale resulting in the continued presentation as a discontinued operation.
Home ImprovementOn 18 January 2016, the Woolworths Group announced that it intended to exit the Home Improvement business. Consequently, the Home Improvement business was classified as a discontinued operation.
On 4 August 2017, the Joint Venture Agreement (held with a subsidiary of Lowe’s Companies, Inc.) was terminated. On 11 October 2017, the sale of Hydrox for a headline sale price of $525 million to Home Investment Consortium Trust was completed.
The result of the finalisation of the exit from the Home Improvement business is not significant to the Woolworths Group result.
$ MILLIONFY18
52 WEEKSFY17
52 WEEKS CHANGE
Sales Home Improvement – 903 n.m.Petrol 4,784 4,640 3.1%
EBITHome Improvement 27 159 n.m.Petrol 168 158 7.1%
Discontinued Operations
Certain comparatives have been reclassified to conform to the current period’s presentation to better reflect the nature of financial position and performance of the Group.
1
3
4
5
PERFORM
AN
CEH
IGH
LIGH
TSD
IRECTORS'
REPORT
FINA
NCIA
L REPO
RTO
THER
INFO
RMATIO
N25
WO
OLW
ORTH
S GRO
UP
AN
NU
AL REPO
RT 2018
24BU
SINESS
REVIEW
2
The 2018 Annual Report contains certain non-IFRS financial measures of historical financial performance, balance sheet or cash flows. Non-IFRS financial measures are financial measures other than those defined or specified under all relevant accounting standards and may not be directly comparable with other companies’ measures but are common practice in the industry in which Woolworths Group operates. Non-IFRS financial information should be considered in addition to, and is not intended to be a substitute for, or more important than, IFRS measures. The presentation of non-IFRS measures is in line with Regulatory Guide 230 issued by Australian Security and Investments Commission (ASIC) in December 2011 to promote full and clear disclosure for investors and other users of financial information and minimise the possibility of being misled by such information.
These measures are used by management and the directors as the primary measures of assessing the financial performance of the Group and individual segments. The directors also believe that these non-IFRS measures assist in providing additional meaningful information on the underlying drivers of the business, performance and trends, as well as position of the Woolworths Group. Non-IFRS financial measures are also used to enhance the comparability of information between reporting periods (such as comparable sales), by adjusting for non-recurring or uncontrollable factors which affect IFRS measures, to aid the user in understanding the Woolworths Group’s performance. Consequently, non-IFRS measures are used by the directors and management for performance analysis, planning, reporting and incentive setting purposes and have remained consistent with the prior year. Non-IFRS measures are not subject to audit or review.
GLOSSARY
Cash realisation ratio Operating cash flow as a percentage of group net profit after tax before depreciation and amortisation
Comparable sales Measure of sales which excludes stores that have been opened or closed in the last 12 months and demonstrable impact on existing stores from store disruption as a result of store refurbishment or new store openings
Cost of doing business (CODB) Expenses which relate to the operation of the business
Customer 1st Ranging (CFR)
Developing a clearly defined range to provide an easier shopping experience for the customer
Customer fulfilment centre (CFC) Customer fulfilment centres are dedicated online distribution centres
Fixed charges cover ratio Group earnings before interest, tax, depreciation, amortisation and rent (EBITDAR) divided by rent and interest costs. Rent and interest costs include capitalised interest, but exclude foreign exchange gains/losses and dividend income
Free cash flow Cash flow generated by the Woolworths Group after equity related financing activities including dividends
Funds employed Net assets employed excluding net tax balances
Net assets employed Net assets excluding net repayable debt and other financial liabilities
Net Promoter Score A loyalty measure based on a single question where a customer rates a business on a scale of 0-10. The score is the net result of the percentage of customers providing a score of 9 or 10 (promoters) less the percentage of customers providing a score of 0-6 (detractors)
Net repayable debt Borrowings less cash balances including debt hedging derivatives
Renewals A total store transformation focused on the overall store environment, team, range and process efficiency (including digital)
Non-IFRS financial information and glossary
Woolworths Group manages its capital structure with the objective of enhancing long-term shareholder value through funding its business at an optimised weighted average cost of capital. It will seek to return capital to shareholders when that is consistent with its long-term capital structure objectives and where it will enhance shareholder value. The 10 cents per share special dividend declared in addition to the 2018 final dividend is an example of this disciplined approach to capital management. Woolworths Group remains committed to a solid investment grade credit rating 1 and a number of actions can be undertaken to support the credit profile including the sale of non-core assets, further working capital initiatives and adjusting its growth capital expenditure and property leasing profile.
FINANCING TRANSACTIONS DURING FY18
MaturitiesUS$100 million (A$127 million) in US Senior Notes (private placement) were repaid early in May 2018 using surplus cash. The loan was originally maturing in April 2020.
In November 2017, A$1.3 billion of undrawn syndicated bank facilities were voluntarily cancelled as they were surplus to business requirements.
In November 2017, A$400 million bank guarantee facility matured. It was replaced with pre-financing obtained in May 2017 and increased to A$500 million. This facility is for the purpose of Woolworths Group meeting its WorkCover obligations as a ‘self-insurer’
by issuing bank guarantees in favour of Australian WorkCover authorities and is underpinned by the international surety market. The new facility is for a three-year commitment to November 2020 and is currently fully drawn.
Upcoming refinancingThe Group has A$500 million domestic Medium Term Notes maturing in March 2019.
Capital management
New store rollout plans
1010–20 new full range supermarkets per annum
Dan Murphy's
86–10 new stores per annum
BWS (including attached)
186–10 new stores per annum (standalone)
Countdown
(3)3–4 new supermarkets per annum
Franchise Stores
4
(2)Only where previously committed
(6)Acquire as appropriate opportunities arise
Hotels (ALH Group)Australian Food 2
Endeavour Drinks
New Zealand Food
BIG W
FY18 net store openings
(incl. acquisitions)
Medium term target (net)
Space rollout is supported by detailed plans for the next three to five years identifying specific sites.
2 Including Metro and Thomas Dux.
1 The credit ratings referred to in this document have been issued by a credit rating agency which holds an Australian Financial Services Licence with an authorisation to issue credit ratings to wholesale clients only. The credit ratings in this document are published for the benefit of Woolworths Group’s debt providers.
1
3
4
5
PERFORM
AN
CEH
IGH
LIGH
TSD
IRECTORS'
REPORT
FINA
NCIA
L REPO
RTO
THER
INFO
RMATIO
N27
WO
OLW
ORTH
S GRO
UP
AN
NU
AL REPO
RT 2018
26BU
SINESS
REVIEW
2
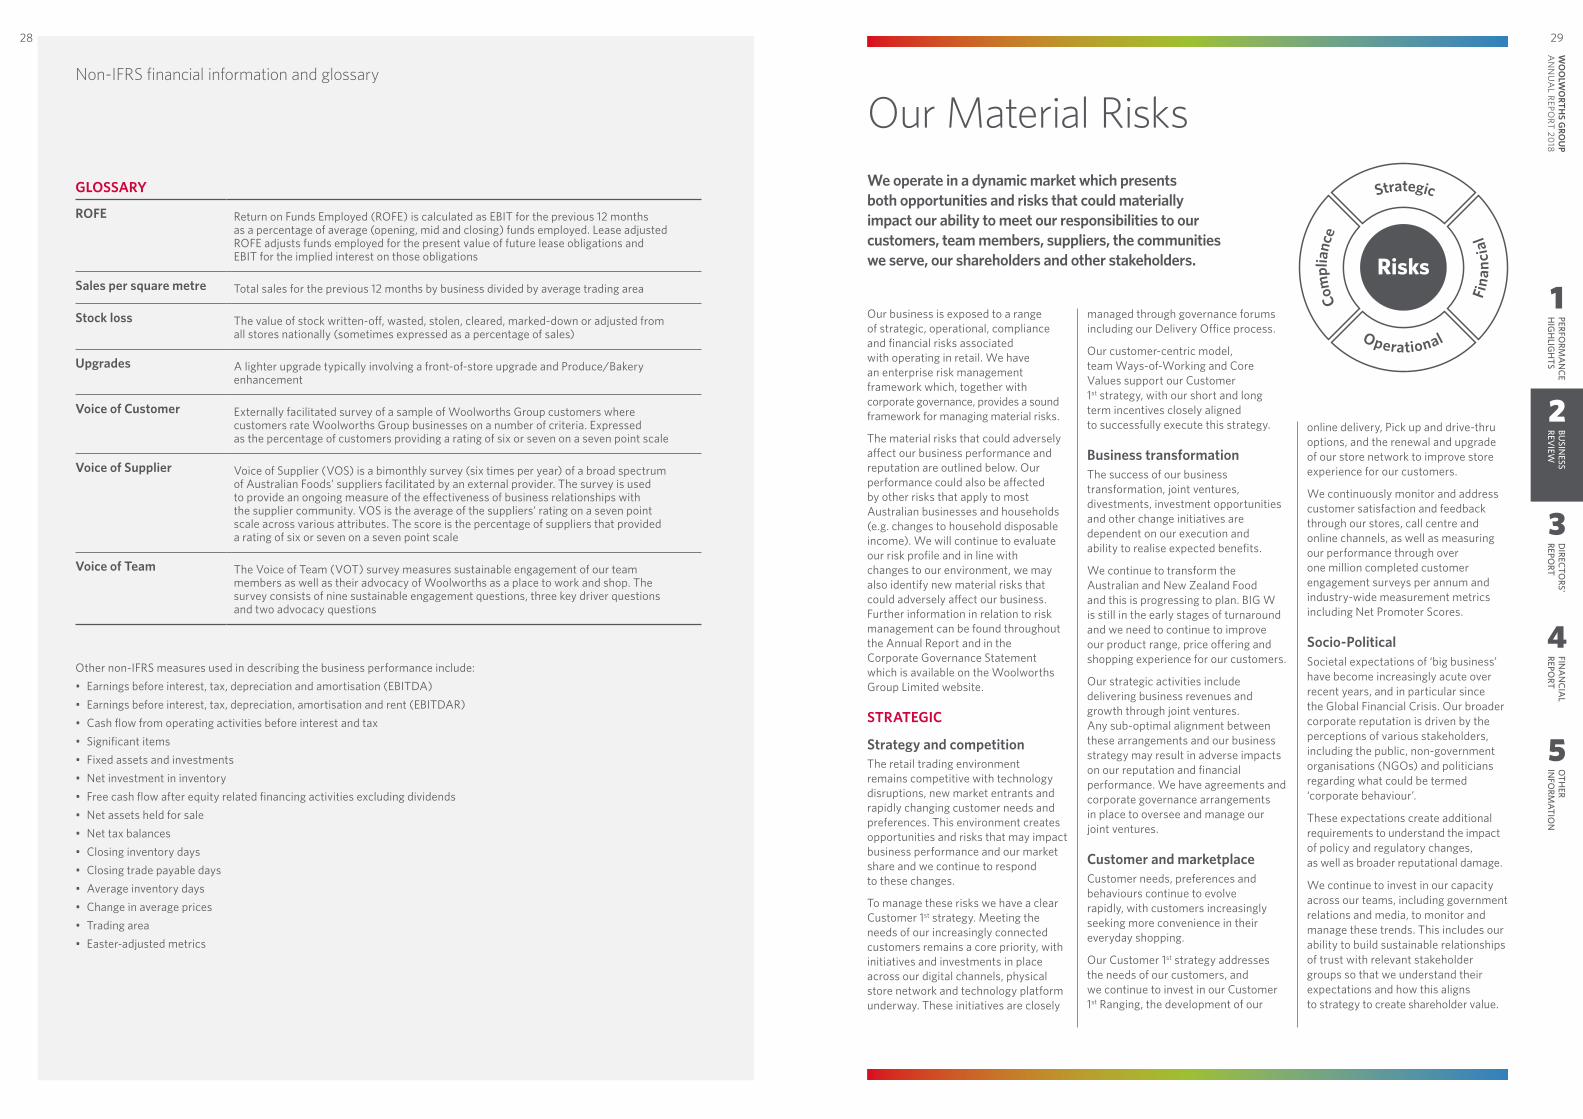
Our Material RisksWe operate in a dynamic market which presents both opportunities and risks that could materially impact our ability to meet our responsibilities to our customers, team members, suppliers, the communities we serve, our shareholders and other stakeholders.
Our business is exposed to a range of strategic, operational, compliance and financial risks associated with operating in retail. We have an enterprise risk management framework which, together with corporate governance, provides a sound framework for managing material risks.
The material risks that could adversely affect our business performance and reputation are outlined below. Our performance could also be affected by other risks that apply to most Australian businesses and households (e.g. changes to household disposable income). We will continue to evaluate our risk profile and in line with changes to our environment, we may also identify new material risks that could adversely affect our business. Further information in relation to risk management can be found throughout the Annual Report and in the Corporate Governance Statement which is available on the Woolworths Group Limited website.
STRATEGIC
Strategy and competition The retail trading environment remains competitive with technology disruptions, new market entrants and rapidly changing customer needs and preferences. This environment creates opportunities and risks that may impact business performance and our market share and we continue to respond to these changes.
To manage these risks we have a clear Customer 1st strategy. Meeting the needs of our increasingly connected customers remains a core priority, with initiatives and investments in place across our digital channels, physical store network and technology platform underway. These initiatives are closely
managed through governance forums including our Delivery Office process.
Our customer-centric model, team Ways-of-Working and Core Values support our Customer 1st strategy, with our short and long term incentives closely aligned to successfully execute this strategy.
Business transformationThe success of our business transformation, joint ventures, divestments, investment opportunities and other change initiatives are dependent on our execution and ability to realise expected benefits.
We continue to transform the Australian and New Zealand Food and this is progressing to plan. BIG W is still in the early stages of turnaround and we need to continue to improve our product range, price offering and shopping experience for our customers.
Our strategic activities include delivering business revenues and growth through joint ventures. Any sub-optimal alignment between these arrangements and our business strategy may result in adverse impacts on our reputation and financial performance. We have agreements and corporate governance arrangements in place to oversee and manage our joint ventures.
Customer and marketplace Customer needs, preferences and behaviours continue to evolve rapidly, with customers increasingly seeking more convenience in their everyday shopping.
Our Customer 1st strategy addresses the needs of our customers, and we continue to invest in our Customer 1st Ranging, the development of our
online delivery, Pick up and drive-thru options, and the renewal and upgrade of our store network to improve store experience for our customers.
We continuously monitor and address customer satisfaction and feedback through our stores, call centre and online channels, as well as measuring our performance through over one million completed customer engagement surveys per annum and industry-wide measurement metrics including Net Promoter Scores.
Socio-PoliticalSocietal expectations of ‘big business’ have become increasingly acute over recent years, and in particular since the Global Financial Crisis. Our broader corporate reputation is driven by the perceptions of various stakeholders, including the public, non-government organisations (NGOs) and politicians regarding what could be termed ‘corporate behaviour’.
These expectations create additional requirements to understand the impact of policy and regulatory changes, as well as broader reputational damage.
We continue to invest in our capacity across our teams, including government relations and media, to monitor and manage these trends. This includes our ability to build sustainable relationships of trust with relevant stakeholder groups so that we understand their expectations and how this aligns to strategy to create shareholder value.
Risks
Strategic
Fina
ncia
l
Operational
Com
plia
nce
GLOSSARY
ROFE Return on Funds Employed (ROFE) is calculated as EBIT for the previous 12 months as a percentage of average (opening, mid and closing) funds employed. Lease adjusted ROFE adjusts funds employed for the present value of future lease obligations and EBIT for the implied interest on those obligations
Sales per square metre Total sales for the previous 12 months by business divided by average trading area
Stock loss The value of stock written-off, wasted, stolen, cleared, marked-down or adjusted from all stores nationally (sometimes expressed as a percentage of sales)
Upgrades A lighter upgrade typically involving a front-of-store upgrade and Produce/Bakery enhancement
Voice of Customer Externally facilitated survey of a sample of Woolworths Group customers where customers rate Woolworths Group businesses on a number of criteria. Expressed as the percentage of customers providing a rating of six or seven on a seven point scale
Voice of Supplier Voice of Supplier (VOS) is a bimonthly survey (six times per year) of a broad spectrum of Australian Foods’ suppliers facilitated by an external provider. The survey is used to provide an ongoing measure of the effectiveness of business relationships with the supplier community. VOS is the average of the suppliers’ rating on a seven point scale across various attributes. The score is the percentage of suppliers that provided a rating of six or seven on a seven point scale
Voice of Team The Voice of Team (VOT) survey measures sustainable engagement of our team members as well as their advocacy of Woolworths as a place to work and shop. The survey consists of nine sustainable engagement questions, three key driver questions and two advocacy questions
Other non-IFRS measures used in describing the business performance include:• Earnings before interest, tax, depreciation and amortisation (EBITDA)• Earnings before interest, tax, depreciation, amortisation and rent (EBITDAR)• Cash flow from operating activities before interest and tax• Significant items• Fixed assets and investments• Net investment in inventory• Free cash flow after equity related financing activities excluding dividends • Net assets held for sale• Net tax balances • Closing inventory days• Closing trade payable days• Average inventory days• Change in average prices• Trading area• Easter-adjusted metrics
Non-IFRS financial information and glossary
1
3
4
5
PERFORM
AN
CEH
IGH
LIGH
TSD
IRECTORS'
REPORT
FINA
NCIA
L REPO
RTO
THER
INFO
RMATIO
N29
WO
OLW
ORTH
S GRO
UP
AN
NU
AL REPO
RT 2018
28BU
SINESS
REVIEW
2
We regularly gather and act upon Voice of Supplier feedback which is conducted independently for each of our businesses. Furthermore, a supplier escalation process and feedback channels are in place to deal with any specific issues or concerns which suppliers have.
We expect our suppliers to comply with applicable regulatory requirements, including Responsible Sourcing and Quality Standards.
Business disruptions As a business and a provider of critical infrastructure, we pride ourselves on our ability to deliver quality products and services. We are aware that business disruptions could impact our operations, our customers, our team members and cause reputational damage and have financial impacts.
We monitor and respond to threats in the continuity of our operations from natural disasters, weather conditions, power outages, industrial disputes, technology failures, cyber attacks, terrorism and other factors.
We have a Business Continuity Management Policy and Framework in place to guide our response to major incidents, business disruptions and oversee our recovery plans. We continue to invest in our technology infrastructure, applications and review our IT recovery plans to enhance our offsite backup and recovery capabilities.
COMPLIANCE
Legal, regulatory and governance Our operations are subject to a range of laws and regulatory requirements regarding competition, employment, health and safety, product and consumer regulation, privacy, anti-bribery and corruption, anti-money laundering, liquor, gaming and the environment.
Remaining compliant with the wide and diverse range of regulatory requirements applicable to our businesses is recognised as an important requirement to maintaining our ability to operate sustainably and successfully.
We have an overarching Compliance Framework in place encompassing a range of policies, procedures and business operational compliance plans to help manage our legal and regulatory compliance.
Our Government Relations team, along with members of the Legal team and other teams, monitor and engage with government and regulatory bodies on proposed changes to the policy and regulatory environment.
Our Code of Conduct and training programs promote awareness of our core legal, regulatory and internal policy requirements.
As a retailer of alcoholic beverages, we are aware of our obligations and have programs in place in relation to responsible drinking and the responsible service, ranging, sale and marketing of alcohol.
Our joint venture company, ALH, has a Hotel and Gaming Charter which outlines our commitment to responsible gambling. We continue to focus on team member education, training and enhancing our partnerships with the community.
LitigationFrom time to time we may be a party to litigation claims and legal proceedings which, if they crystallise, may adversely affect our business, reputation and have financial impacts. To manage these risks we have a legal team that helps monitor and manage legal claims, disputes, proceedings and compliance matters. We evaluate any litigation claims and legal proceedings to assess our risks on a principled basis and estimate, where possible, potential losses.
FINANCIAL
Financial and treasury The availability of funding and management of capital and liquidity are important requirements to fund our business operations and growth. In addition, we are exposed to material adverse fluctuations in interest rates and foreign exchange rates which could impact business profitability.
We have board approved Treasury Policies to govern the management of our financial risks, including liquidity, interest rates, foreign currency risks and the use of derivatives. To manage these risks we have a Treasury function that is responsible for managing our cash funding positions and supports the management of interest rate and foreign currency risks. Further information is included in the Notes to the Consolidated Financial Statements – Note 4.7 financial risk management.
InsuranceInsurance is a tool to protect our customers, team members and company against losses from accidents, natural disasters and other events.
In some cases, we choose to self-insure risks. This means that in the event of an incident, we cannot make a claim against a third party insurer but we will pay or absorb the losses ourselves. Our Treasury function is also responsible for managing the purchase of insurance where we determine this is prudent. We monitor our self-insured risks and have active programs to help us pre-empt and mitigate losses.
Our Material Risks
Sustainability and environmental We want to be a responsible organisation that conducts its business in line with our values while pursuing high standards of workplace safety. In this way we can deliver long term growth in sustainable shareholder value. Our commitments to social responsibility include minimising our impact on the environment and seeking to maintain our reputation as one of Australia’s leading companies.
We may be impacted by the long term effects of climate change, including:• increased severity or regularity
of extreme weather events which may result in business disruptions, changing supply conditions, safety risks for our team members and customers, and damage to our physical assets and transport infrastructure;
• changes to global policy and government regulations; and
• changes to customer needs, preferences and behaviours.
To manage these risks we are working to include the evaluation of the long term implications of climate change into our strategic planning and in the ongoing management of our business risks.
We also have a plan to progressively adopt the recommendations of the G20 Financial Stability Board’s Task Force on climate-related financial disclosures. Our 2018 Sustainability Report outlines our progress to date.
Our Board Sustainability Committee oversees the effectiveness of our policies and initiatives designed to support sustainability and the minimisation of our impact as a business.
Our Sustainability Strategy 2020 sets out the commitments we aim to achieve by the year 2020. Our 2018 Sustainability Report outlines our progress, which this year includes an enhanced approach to the management of human rights in our supply chain.
OPERATIONAL
Safety, health and wellbeingAt Woolworths we care deeply about the safety, health and wellbeing of our customers, team members, contractors and visitors and want them to go home safely everyday.
Our Board Sustainability Committee provides oversight of safety and health policies, programs, training, risk management and compliance with applicable legislative requirements.
We continue to invest to improve safety governance, address risks and develop a culture of care across our business as a key focus for our management team.
Product and food safetyThe safety of our customers is paramount. Poor product quality or unsafe products may result in injury, harm or illness to our customers, claims, regulatory impacts and significant reputational damage.
We have been implementing our Supplier Excellence Program for our own brand products and fresh food, requiring suppliers of these products to meet our quality standards and to comply with regulatory, product safety, compositional and labelling requirements.
We have in place a New Product Development Framework for our own and exclusive branded products to meet both mandatory and internal safety requirements prior to sale. Procedures are also in place to manage how we handle, store, transport, recall and withdraw products.
People and cultureOur team members are key to the success of our business, including our ability to build retailers of the future by attracting, retaining and motivating team members with diverse skills, capabilities and backgrounds.
To manage these risks we have workforce plans, conduct regular succession/talent planning sessions and have a focus on career development.
We are committed to promoting gender equity, workplace diversity and creating growth opportunities for our team members. We have set targets for gender equity, leadership diversity training and Aboriginal and Torres Strait Islander employment levels as a part of our Corporate Responsibility Strategy commitments.
Listening to our teams is important to us. We have various ways in which our teams can raise concerns or seek support including our SpeakUp and Assist programs. Team member engagement surveys are regularly conducted to understand and respond to the needs of our team members.
Asset and data loss/corruptionA major data or information security breach has the potential to result in unauthorised disclosure, loss and/or misuse of customer, supplier, team member and company information which may cause significant reputational damage, adverse regulatory and financial impacts.
To manage these risks we have a Code of Conduct and Privacy Policy which outlines our standards for how we treat the information with which we have been entrusted. In conjunction, our Acceptable Use of Information Systems Policy sets out our expectations of team members and suppliers in relation to accessing and managing information they have access to. Our Group Cyber Security Policy and standards set out the requirements of how we manage and secure our data, how we monitor our IT systems and how we implement and test our security controls.
Supplier relationshipsWe sell products which are sourced from a wide range of domestic and international suppliers. Effective supplier relationship management is important in delivering the right product proposition to our customers. We work with our suppliers and seek to more effectively engage with them through both internal ways of working and regulatory codes such as the Food & Grocery Code of Conduct.
1
3
4
5
PERFORM
AN
CEH
IGH
LIGH
TSD
IRECTORS'
REPORT
FINA
NCIA
L REPO
RTO
THER
INFO
RMATIO
N31
WO
OLW
ORTH
S GRO
UP
AN
NU
AL REPO
RT 2018
30BU
SINESS
REVIEW
2
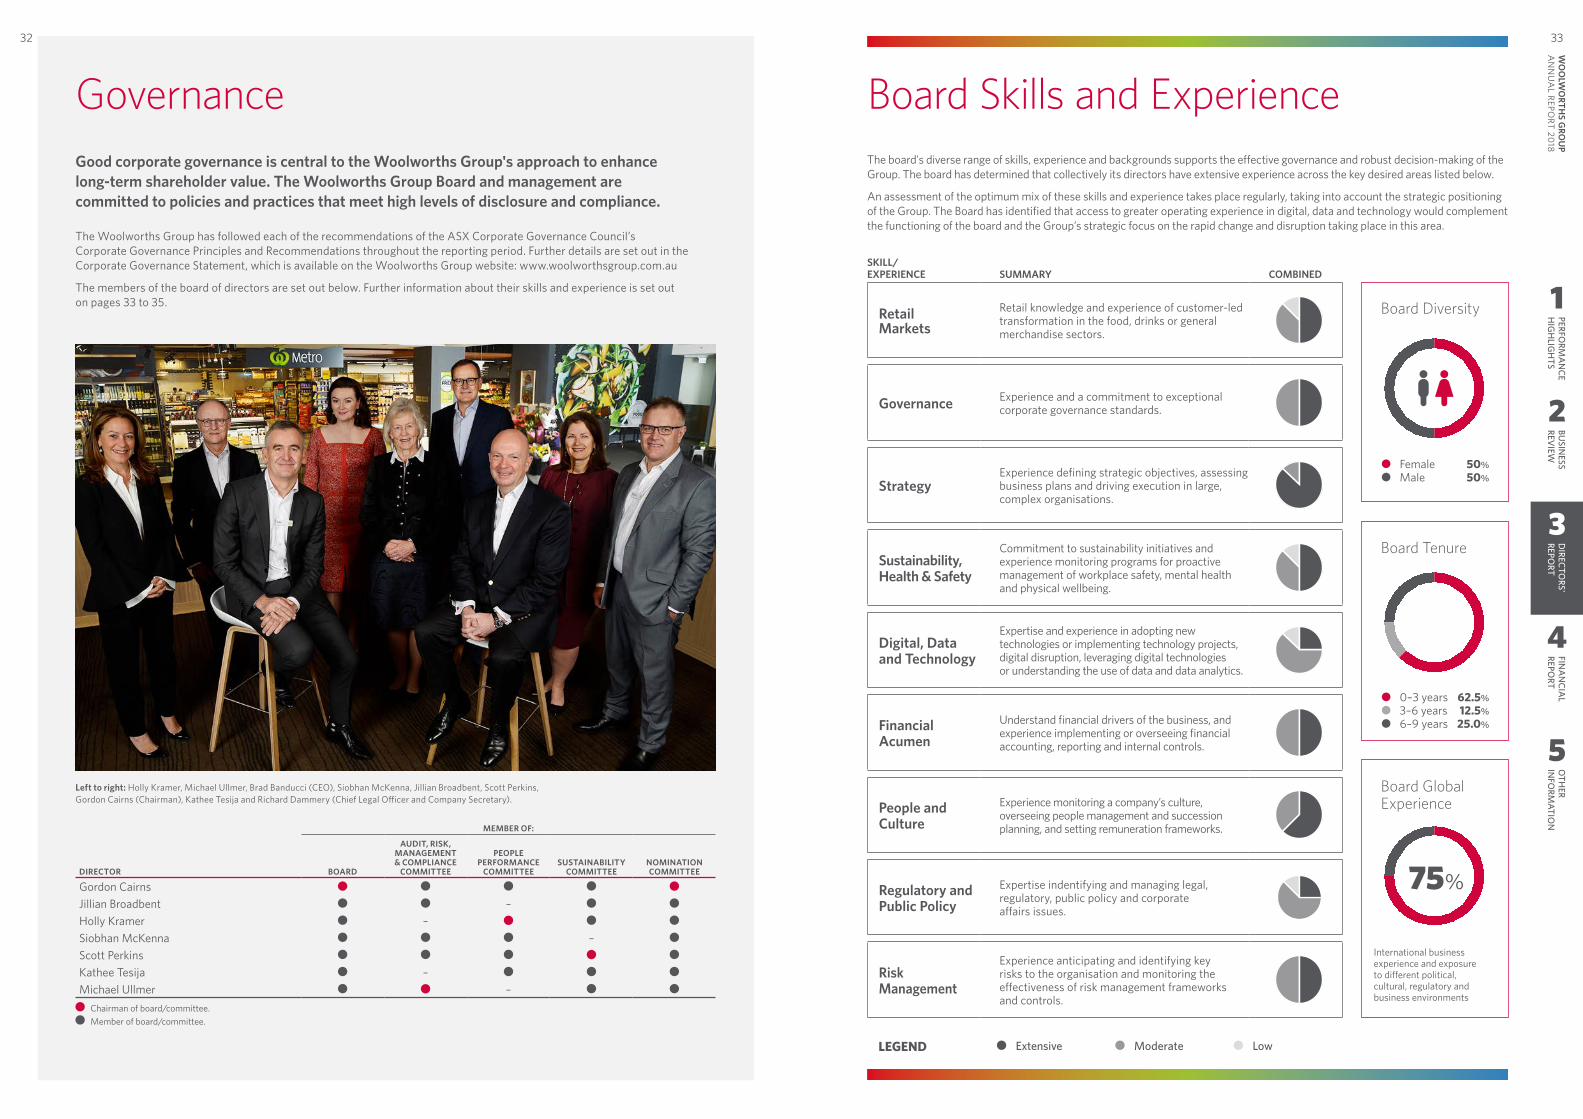
Good corporate governance is central to the Woolworths Group's approach to enhance long‑term shareholder value. The Woolworths Group Board and management are committed to policies and practices that meet high levels of disclosure and compliance.
The Woolworths Group has followed each of the recommendations of the ASX Corporate Governance Council’s Corporate Governance Principles and Recommendations throughout the reporting period. Further details are set out in the Corporate Governance Statement, which is available on the Woolworths Group website: www.woolworthsgroup.com.au
The members of the board of directors are set out below. Further information about their skills and experience is set out on pages 33 to 35.
Left to right: Holly Kramer, Michael Ullmer, Brad Banducci (CEO), Siobhan McKenna, Jillian Broadbent, Scott Perkins, Gordon Cairns (Chairman), Kathee Tesija and Richard Dammery (Chief Legal Officer and Company Secretary).
DIRECTOR
MEMBER OF:
BOARD
AUDIT, RISK, MANAGEMENT & COMPLIANCE
COMMITTEE
PEOPLE PERFORMANCE
COMMITTEESUSTAINABILITY
COMMITTEENOMINATION COMMITTEE
Gordon Cairns Jillian Broadbent –Holly Kramer –Siobhan McKenna –Scott PerkinsKathee Tesija –Michael Ullmer –
Chairman of board/committee. Member of board/committee.
Governance Board Skills and ExperienceThe board's diverse range of skills, experience and backgrounds supports the effective governance and robust decision-making of the Group. The board has determined that collectively its directors have extensive experience across the key desired areas listed below.
An assessment of the optimum mix of these skills and experience takes place regularly, taking into account the strategic positioning of the Group. The Board has identified that access to greater operating experience in digital, data and technology would complement the functioning of the board and the Group’s strategic focus on the rapid change and disruption taking place in this area.
Retail Markets
Retail knowledge and experience of customer-led transformation in the food, drinks or general merchandise sectors.
Governance Experience and a commitment to exceptional corporate governance standards.
StrategyExperience defining strategic objectives, assessing business plans and driving execution in large, complex organisations.
Sustainability, Health & Safety
Commitment to sustainability initiatives and experience monitoring programs for proactive management of workplace safety, mental health and physical wellbeing.
Digital, Data and Technology
Expertise and experience in adopting new technologies or implementing technology projects, digital disruption, leveraging digital technologies or understanding the use of data and data analytics.
Financial Acumen
Understand financial drivers of the business, and experience implementing or overseeing financial accounting, reporting and internal controls.
People and Culture
Experience monitoring a company’s culture, overseeing people management and succession planning, and setting remuneration frameworks.
Regulatory and Public Policy
Expertise indentifying and managing legal, regulatory, public policy and corporate affairs issues.
Risk Management
Experience anticipating and identifying key risks to the organisation and monitoring the effectiveness of risk management frameworks and controls.
SKILL/ EXPERIENCE
SUMMARY COMBINED
LEGEND Extensive Moderate Low
Board Diversity
Female 50%Male 50%
Board Tenure
Board Global Experience
International business experience and exposure to different political, cultural, regulatory and business environments
75%
0–3 years 62.5%3–6 years 12.5%6–9 years 25.0%
1
2
4
5
PERFORM
AN
CEH
IGH
LIGH
TSBU
SINESS
REVIEW
FINA
NCIA
L REPO
RTO
THER
INFO
RMATIO
N33
WO
OLW
ORTH
S GRO
UP
AN
NU
AL REPO
RT 2018
32D
IRECTORS'
REPORT
3
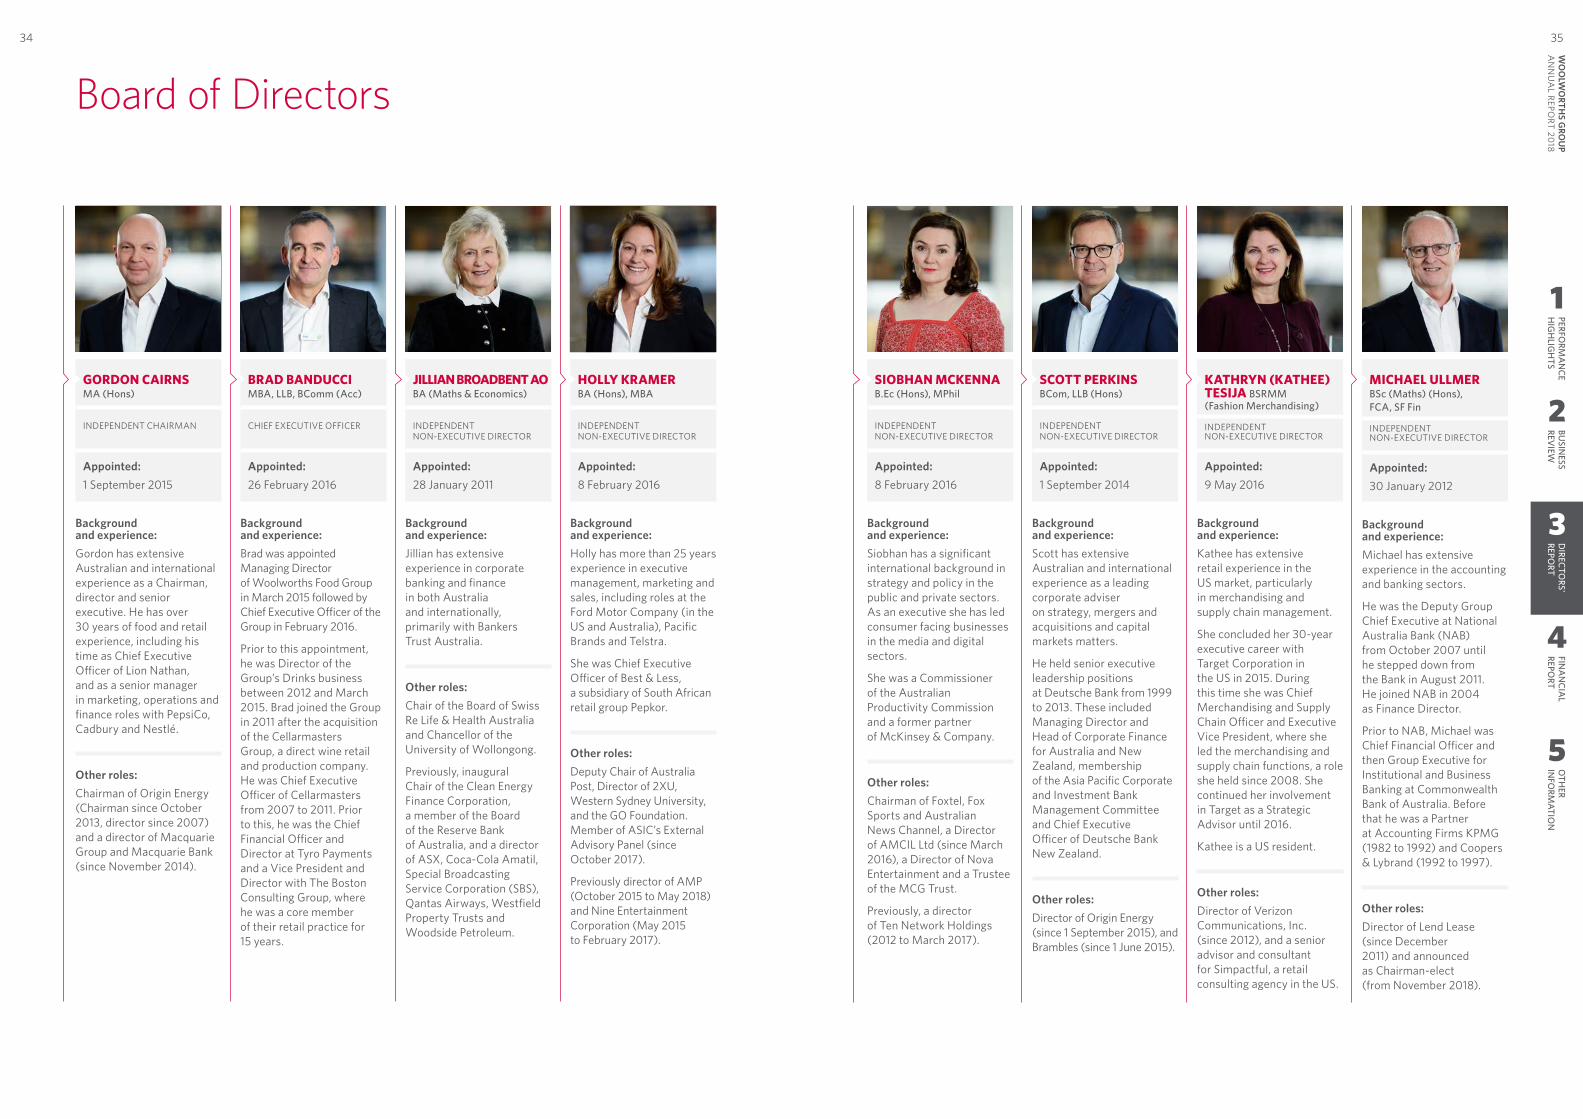
GORDON CAIRNS MA (Hons)
INDEPENDENT CHAIRMAN
Appointed: 1 September 2015
Background and experience:Gordon has extensive Australian and international experience as a Chairman, director and senior executive. He has over 30 years of food and retail experience, including his time as Chief Executive Officer of Lion Nathan, and as a senior manager in marketing, operations and finance roles with PepsiCo, Cadbury and Nestlé.
Other roles:Chairman of Origin Energy (Chairman since October 2013, director since 2007) and a director of Macquarie Group and Macquarie Bank (since November 2014).
BRAD BANDUCCI MBA, LLB, BComm (Acc)
CHIEF EXECUTIVE OFFICER
Appointed: 26 February 2016
Background and experience:Brad was appointed Managing Director of Woolworths Food Group in March 2015 followed by Chief Executive Officer of the Group in February 2016.
Prior to this appointment, he was Director of the Group’s Drinks business between 2012 and March 2015. Brad joined the Group in 2011 after the acquisition of the Cellarmasters Group, a direct wine retail and production company. He was Chief Executive Officer of Cellarmasters from 2007 to 2011. Prior to this, he was the Chief Financial Officer and Director at Tyro Payments and a Vice President and Director with The Boston Consulting Group, where he was a core member of their retail practice for 15 years.
JILLIAN BROADBENT AO BA (Maths & Economics)
INDEPENDENT NON-EXECUTIVE DIRECTOR
Appointed: 28 January 2011
Background and experience:Jillian has extensive experience in corporate banking and finance in both Australia and internationally, primarily with Bankers Trust Australia.
Other roles:Chair of the Board of Swiss Re Life & Health Australia and Chancellor of the University of Wollongong.
Previously, inaugural Chair of the Clean Energy Finance Corporation, a member of the Board of the Reserve Bank of Australia, and a director of ASX, Coca-Cola Amatil, Special Broadcasting Service Corporation (SBS), Qantas Airways, Westfield Property Trusts and Woodside Petroleum.
HOLLY KRAMER BA (Hons), MBA
INDEPENDENT NON-EXECUTIVE DIRECTOR
Appointed: 8 February 2016
Background and experience:Holly has more than 25 years experience in executive management, marketing and sales, including roles at the Ford Motor Company (in the US and Australia), Pacific Brands and Telstra.
She was Chief Executive Officer of Best & Less, a subsidiary of South African retail group Pepkor.
Other roles:Deputy Chair of Australia Post, Director of 2XU, Western Sydney University, and the GO Foundation. Member of ASIC’s External Advisory Panel (since October 2017).
Previously director of AMP (October 2015 to May 2018) and Nine Entertainment Corporation (May 2015 to February 2017).
SIOBHAN MCKENNA B.Ec (Hons), MPhil
INDEPENDENT NON-EXECUTIVE DIRECTOR
Appointed: 8 February 2016
Background and experience:Siobhan has a significant international background in strategy and policy in the public and private sectors. As an executive she has led consumer facing businesses in the media and digital sectors.
She was a Commissioner of the Australian Productivity Commission and a former partner of McKinsey & Company.
Other roles:Chairman of Foxtel, Fox Sports and Australian News Channel, a Director of AMCIL Ltd (since March 2016), a Director of Nova Entertainment and a Trustee of the MCG Trust.
Previously, a director of Ten Network Holdings (2012 to March 2017).
SCOTT PERKINS BCom, LLB (Hons)
INDEPENDENT NON-EXECUTIVE DIRECTOR
Appointed: 1 September 2014
Background and experience:Scott has extensive Australian and international experience as a leading corporate adviser on strategy, mergers and acquisitions and capital markets matters.
He held senior executive leadership positions at Deutsche Bank from 1999 to 2013. These included Managing Director and Head of Corporate Finance for Australia and New Zealand, membership of the Asia Pacific Corporate and Investment Bank Management Committee and Chief Executive Officer of Deutsche Bank New Zealand.
Other roles:Director of Origin Energy (since 1 September 2015), and Brambles (since 1 June 2015).
KATHRYN (KATHEE) TESIJA BSRMM (Fashion Merchandising)
INDEPENDENT NON-EXECUTIVE DIRECTOR
Appointed: 9 May 2016
Background and experience:Kathee has extensive retail experience in the US market, particularly in merchandising and supply chain management.
She concluded her 30-year executive career with Target Corporation in the US in 2015. During this time she was Chief Merchandising and Supply Chain Officer and Executive Vice President, where she led the merchandising and supply chain functions, a role she held since 2008. She continued her involvement in Target as a Strategic Advisor until 2016.
Kathee is a US resident.
Other roles:Director of Verizon Communications, Inc. (since 2012), and a senior advisor and consultant for Simpactful, a retail consulting agency in the US.
MICHAEL ULLMER BSc (Maths) (Hons), FCA, SF Fin
INDEPENDENT NON-EXECUTIVE DIRECTOR
Appointed: 30 January 2012
Background and experience:Michael has extensive experience in the accounting and banking sectors.
He was the Deputy Group Chief Executive at National Australia Bank (NAB) from October 2007 until he stepped down from the Bank in August 2011. He joined NAB in 2004 as Finance Director.
Prior to NAB, Michael was Chief Financial Officer and then Group Executive for Institutional and Business Banking at Commonwealth Bank of Australia. Before that he was a Partner at Accounting Firms KPMG (1982 to 1992) and Coopers & Lybrand (1992 to 1997).
Other roles:Director of Lend Lease (since December 2011) and announced as Chairman-elect (from November 2018).
Board of Directors
1
2
4
5
PERFORM
AN
CEH
IGH
LIGH
TSBU
SINESS
REVIEW
FINA
NCIA
L REPO
RTO
THER
INFO
RMATIO
N35
WO
OLW
ORTH
S GRO
UP
AN
NU
AL REPO
RT 2018
34D
IRECTORS'
REPORT
3
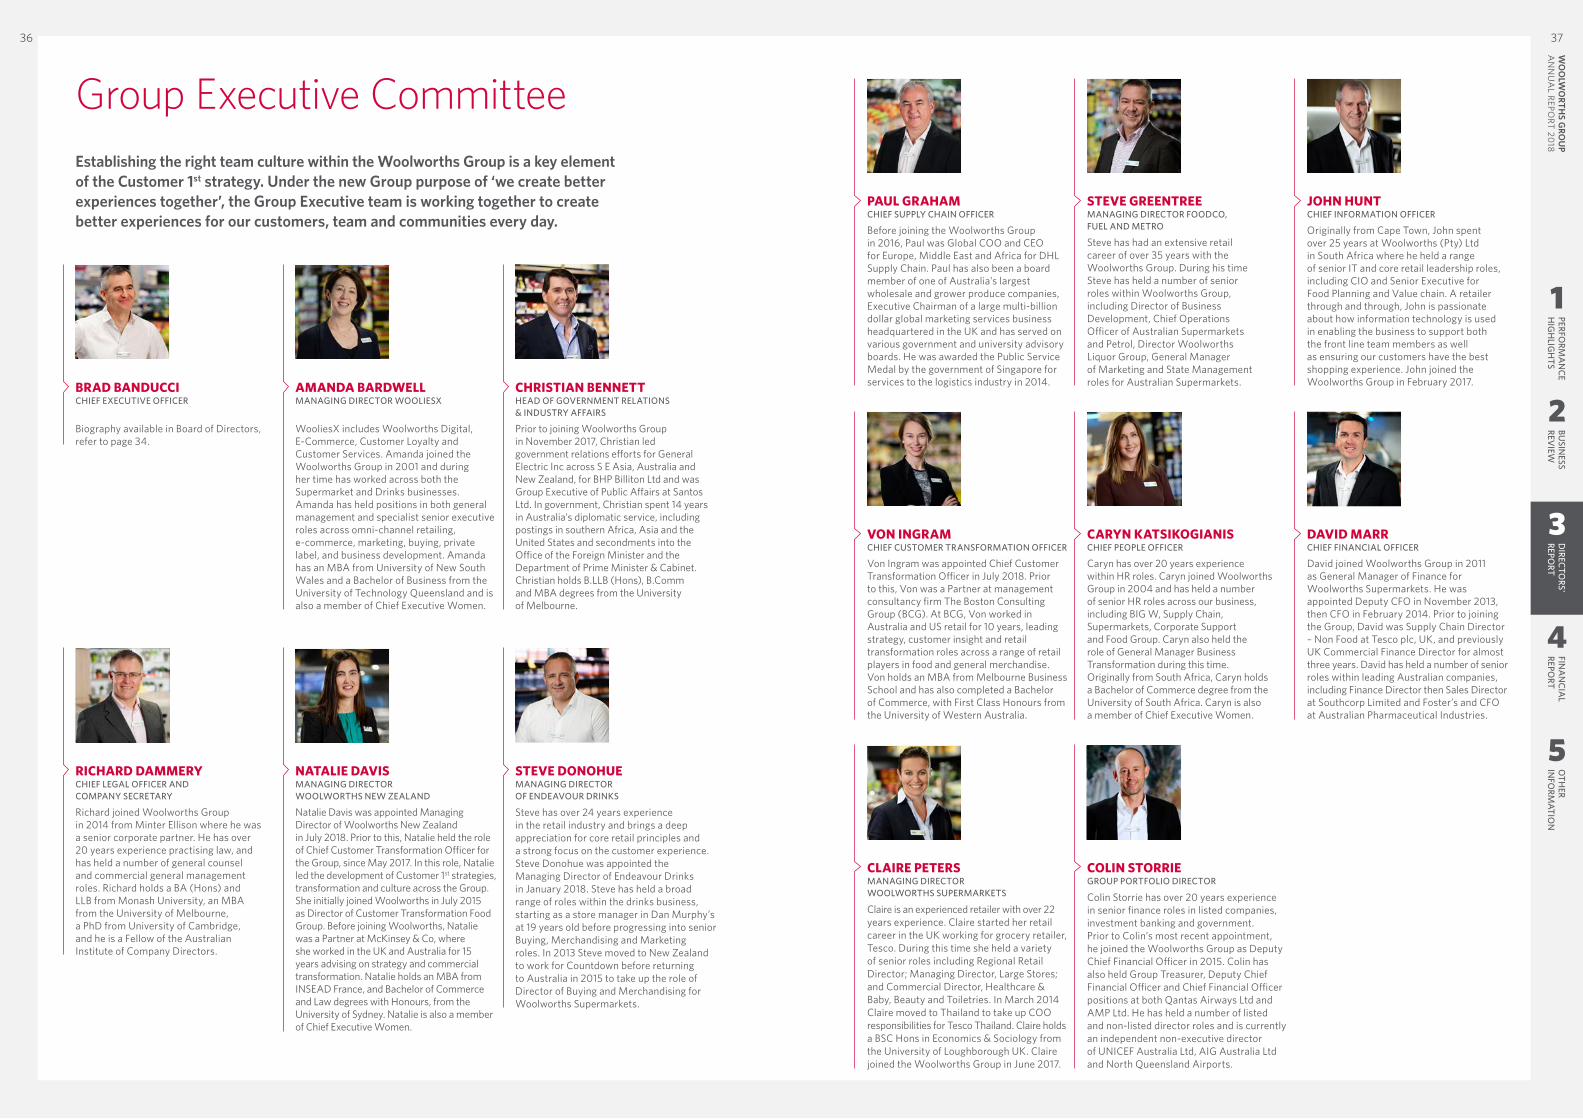
Establishing the right team culture within the Woolworths Group is a key element of the Customer 1st strategy. Under the new Group purpose of ‘we create better experiences together’, the Group Executive team is working together to create better experiences for our customers, team and communities every day.
BRAD BANDUCCICHIEF EXECUTIVE OFFICER
Biography available in Board of Directors, refer to page 34.
AMANDA BARDWELLMANAGING DIRECTOR WOOLIESX
WooliesX includes Woolworths Digital, E-Commerce, Customer Loyalty and Customer Services. Amanda joined the Woolworths Group in 2001 and during her time has worked across both the Supermarket and Drinks businesses. Amanda has held positions in both general management and specialist senior executive roles across omni-channel retailing, e-commerce, marketing, buying, private label, and business development. Amanda has an MBA from University of New South Wales and a Bachelor of Business from the University of Technology Queensland and is also a member of Chief Executive Women.
CHRISTIAN BENNETTHEAD OF GOVERNMENT RELATIONS & INDUSTRY AFFAIRS
Prior to joining Woolworths Group in November 2017, Christian led government relations efforts for General Electric Inc across S E Asia, Australia and New Zealand, for BHP Billiton Ltd and was Group Executive of Public Affairs at Santos Ltd. In government, Christian spent 14 years in Australia's diplomatic service, including postings in southern Africa, Asia and the United States and secondments into the Office of the Foreign Minister and the Department of Prime Minister & Cabinet. Christian holds B.LLB (Hons), B.Comm and MBA degrees from the University of Melbourne.
PAUL GRAHAMCHIEF SUPPLY CHAIN OFFICER
Before joining the Woolworths Group in 2016, Paul was Global COO and CEO for Europe, Middle East and Africa for DHL Supply Chain. Paul has also been a board member of one of Australia’s largest wholesale and grower produce companies, Executive Chairman of a large multi-billion dollar global marketing services business headquartered in the UK and has served on various government and university advisory boards. He was awarded the Public Service Medal by the government of Singapore for services to the logistics industry in 2014.
STEVE GREENTREEMANAGING DIRECTOR FOODCO, FUEL AND METRO
Steve has had an extensive retail career of over 35 years with the Woolworths Group. During his time Steve has held a number of senior roles within Woolworths Group, including Director of Business Development, Chief Operations Officer of Australian Supermarkets and Petrol, Director Woolworths Liquor Group, General Manager of Marketing and State Management roles for Australian Supermarkets.
JOHN HUNTCHIEF INFORMATION OFFICER
Originally from Cape Town, John spent over 25 years at Woolworths (Pty) Ltd in South Africa where he held a range of senior IT and core retail leadership roles, including CIO and Senior Executive for Food Planning and Value chain. A retailer through and through, John is passionate about how information technology is used in enabling the business to support both the front line team members as well as ensuring our customers have the best shopping experience. John joined the Woolworths Group in February 2017.
RICHARD DAMMERYCHIEF LEGAL OFFICER AND COMPANY SECRETARY
Richard joined Woolworths Group in 2014 from Minter Ellison where he was a senior corporate partner. He has over 20 years experience practising law, and has held a number of general counsel and commercial general management roles. Richard holds a BA (Hons) and LLB from Monash University, an MBA from the University of Melbourne, a PhD from University of Cambridge, and he is a Fellow of the Australian Institute of Company Directors.
NATALIE DAVISMANAGING DIRECTOR WOOLWORTHS NEW ZEALAND
Natalie Davis was appointed Managing Director of Woolworths New Zealand in July 2018. Prior to this, Natalie held the role of Chief Customer Transformation Officer for the Group, since May 2017. In this role, Natalie led the development of Customer 1st strategies, transformation and culture across the Group. She initially joined Woolworths in July 2015 as Director of Customer Transformation Food Group. Before joining Woolworths, Natalie was a Partner at McKinsey & Co, where she worked in the UK and Australia for 15 years advising on strategy and commercial transformation. Natalie holds an MBA from INSEAD France, and Bachelor of Commerce and Law degrees with Honours, from the University of Sydney. Natalie is also a member of Chief Executive Women.
STEVE DONOHUEMANAGING DIRECTOR OF ENDEAVOUR DRINKS
Steve has over 24 years experience in the retail industry and brings a deep appreciation for core retail principles and a strong focus on the customer experience. Steve Donohue was appointed the Managing Director of Endeavour Drinks in January 2018. Steve has held a broad range of roles within the drinks business, starting as a store manager in Dan Murphy’s at 19 years old before progressing into senior Buying, Merchandising and Marketing roles. In 2013 Steve moved to New Zealand to work for Countdown before returning to Australia in 2015 to take up the role of Director of Buying and Merchandising for Woolworths Supermarkets.
VON INGRAMCHIEF CUSTOMER TRANSFORMATION OFFICER
Von Ingram was appointed Chief Customer Transformation Officer in July 2018. Prior to this, Von was a Partner at management consultancy firm The Boston Consulting Group (BCG). At BCG, Von worked in Australia and US retail for 10 years, leading strategy, customer insight and retail transformation roles across a range of retail players in food and general merchandise. Von holds an MBA from Melbourne Business School and has also completed a Bachelor of Commerce, with First Class Honours from the University of Western Australia.
CARYN KATSIKOGIANISCHIEF PEOPLE OFFICER
Caryn has over 20 years experience within HR roles. Caryn joined Woolworths Group in 2004 and has held a number of senior HR roles across our business, including BIG W, Supply Chain, Supermarkets, Corporate Support and Food Group. Caryn also held the role of General Manager Business Transformation during this time. Originally from South Africa, Caryn holds a Bachelor of Commerce degree from the University of South Africa. Caryn is also a member of Chief Executive Women.
DAVID MARRCHIEF FINANCIAL OFFICER
David joined Woolworths Group in 2011 as General Manager of Finance for Woolworths Supermarkets. He was appointed Deputy CFO in November 2013, then CFO in February 2014. Prior to joining the Group, David was Supply Chain Director – Non Food at Tesco plc, UK, and previously UK Commercial Finance Director for almost three years. David has held a number of senior roles within leading Australian companies, including Finance Director then Sales Director at Southcorp Limited and Foster’s and CFO at Australian Pharmaceutical Industries.
CLAIRE PETERSMANAGING DIRECTOR WOOLWORTHS SUPERMARKETS
Claire is an experienced retailer with over 22 years experience. Claire started her retail career in the UK working for grocery retailer, Tesco. During this time she held a variety of senior roles including Regional Retail Director; Managing Director, Large Stores; and Commercial Director, Healthcare & Baby, Beauty and Toiletries. In March 2014 Claire moved to Thailand to take up COO responsibilities for Tesco Thailand. Claire holds a BSC Hons in Economics & Sociology from the University of Loughborough UK. Claire joined the Woolworths Group in June 2017.
COLIN STORRIEGROUP PORTFOLIO DIRECTOR
Colin Storrie has over 20 years experience in senior finance roles in listed companies, investment banking and government. Prior to Colin’s most recent appointment, he joined the Woolworths Group as Deputy Chief Financial Officer in 2015. Colin has also held Group Treasurer, Deputy Chief Financial Officer and Chief Financial Officer positions at both Qantas Airways Ltd and AMP Ltd. He has held a number of listed and non-listed director roles and is currently an independent non-executive director of UNICEF Australia Ltd, AIG Australia Ltd and North Queensland Airports.
Group Executive Committee
1
2
4
5
PERFORM
AN
CEH
IGH
LIGH
TSBU
SINESS
REVIEW
FINA
NCIA
L REPO
RTO
THER
INFO
RMATIO
N37
WO
OLW
ORTH
S GRO
UP
AN
NU
AL REPO
RT 2018
36D
IRECTORS'
REPORT
3
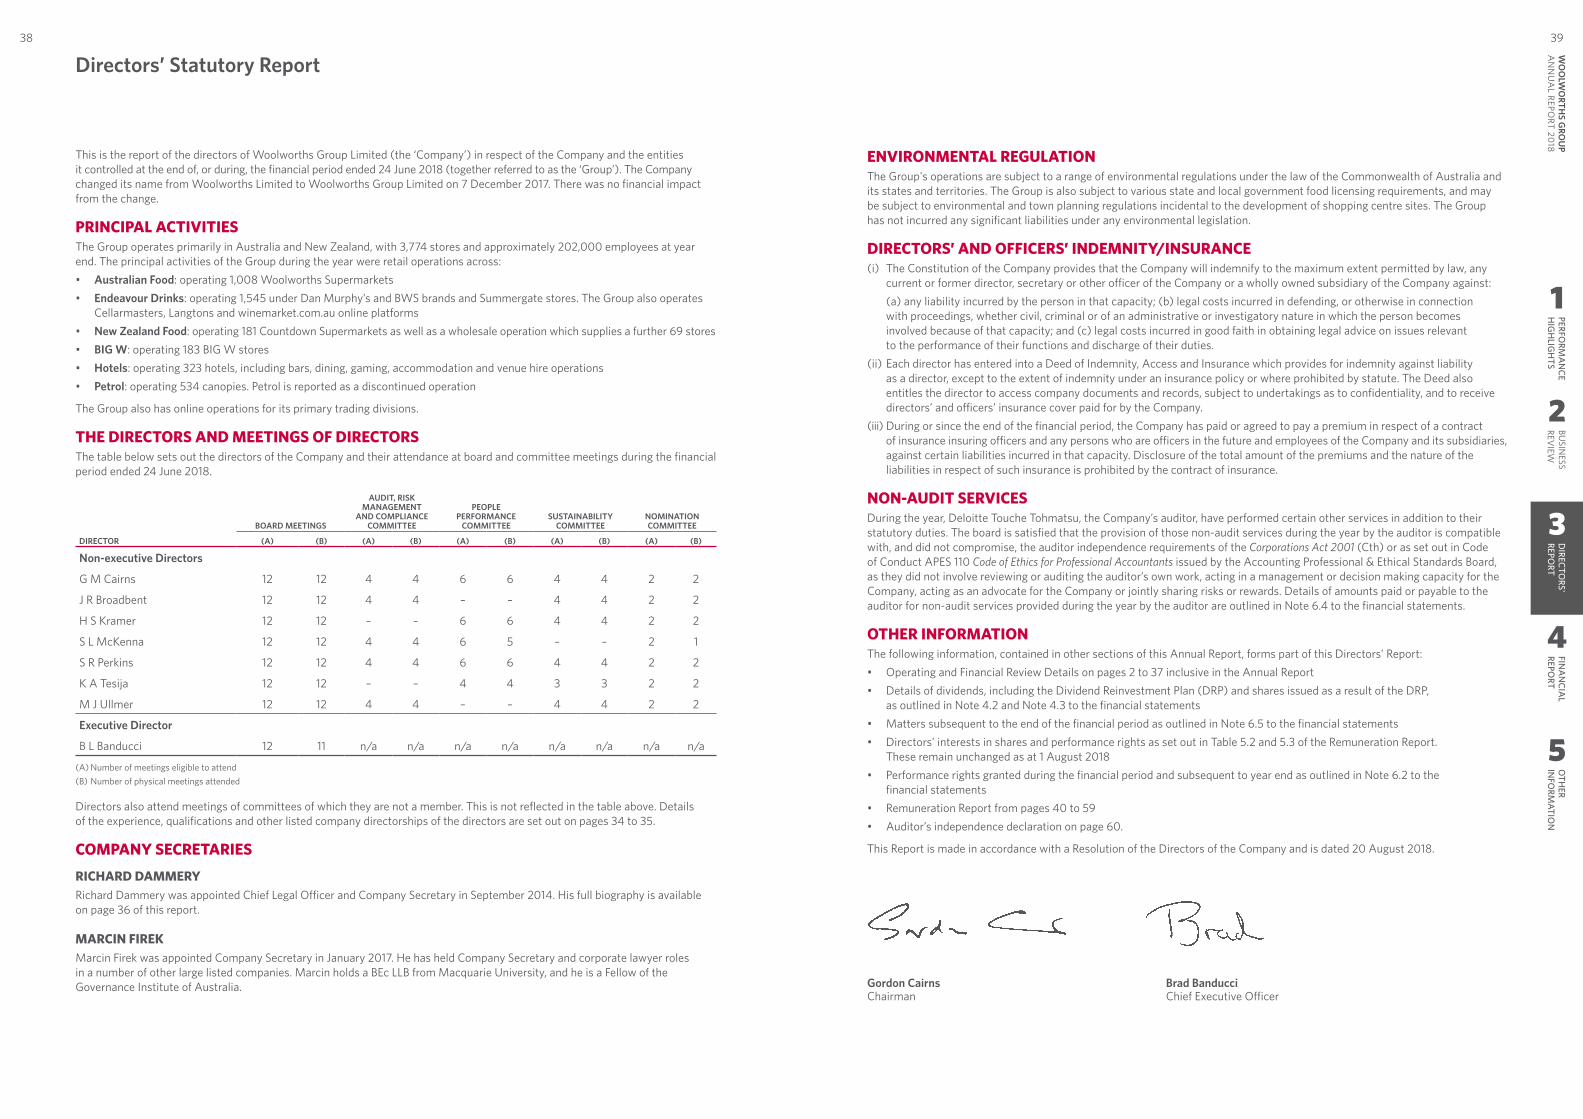
Directors’ Statutory Report
This is the report of the directors of Woolworths Group Limited (the ‘Company’) in respect of the Company and the entities it controlled at the end of, or during, the financial period ended 24 June 2018 (together referred to as the ‘Group’). The Company changed its name from Woolworths Limited to Woolworths Group Limited on 7 December 2017. There was no financial impact from the change.
PRINCIPAL ACTIVITIESThe Group operates primarily in Australia and New Zealand, with 3,774 stores and approximately 202,000 employees at year end. The principal activities of the Group during the year were retail operations across:• Australian Food: operating 1,008 Woolworths Supermarkets• Endeavour Drinks: operating 1,545 under Dan Murphy’s and BWS brands and Summergate stores. The Group also operates
Cellarmasters, Langtons and winemarket.com.au online platforms• New Zealand Food: operating 181 Countdown Supermarkets as well as a wholesale operation which supplies a further 69 stores• BIG W: operating 183 BIG W stores• Hotels: operating 323 hotels, including bars, dining, gaming, accommodation and venue hire operations• Petrol: operating 534 canopies. Petrol is reported as a discontinued operation
The Group also has online operations for its primary trading divisions.
THE DIRECTORS AND MEETINGS OF DIRECTORSThe table below sets out the directors of the Company and their attendance at board and committee meetings during the financial period ended 24 June 2018.
BOARD MEETINGS
AUDIT, RISK MANAGEMENT
AND COMPLIANCE COMMITTEE
PEOPLE PERFORMANCE
COMMITTEESUSTAINABILITY
COMMITTEENOMINATION COMMITTEE
DIRECTOR (A) (B) (A) (B) (A) (B) (A) (B) (A) (B)
Non-executive Directors
G M Cairns 12 12 4 4 6 6 4 4 2 2
J R Broadbent 12 12 4 4 – – 4 4 2 2
H S Kramer 12 12 – – 6 6 4 4 2 2
S L McKenna 12 12 4 4 6 5 – – 2 1
S R Perkins 12 12 4 4 6 6 4 4 2 2
K A Tesija 12 12 – – 4 4 3 3 2 2
M J Ullmer 12 12 4 4 – – 4 4 2 2
Executive Director
B L Banducci 12 11 n/a n/a n/a n/a n/a n/a n/a n/a
(A) Number of meetings eligible to attend(B) Number of physical meetings attended
Directors also attend meetings of committees of which they are not a member. This is not reflected in the table above. Details of the experience, qualifications and other listed company directorships of the directors are set out on pages 34 to 35.
COMPANY SECRETARIES
RICHARD DAMMERYRichard Dammery was appointed Chief Legal Officer and Company Secretary in September 2014. His full biography is available on page 36 of this report.
MARCIN FIREKMarcin Firek was appointed Company Secretary in January 2017. He has held Company Secretary and corporate lawyer roles in a number of other large listed companies. Marcin holds a BEc LLB from Macquarie University, and he is a Fellow of the Governance Institute of Australia.
ENVIRONMENTAL REGULATIONThe Group's operations are subject to a range of environmental regulations under the law of the Commonwealth of Australia and its states and territories. The Group is also subject to various state and local government food licensing requirements, and may be subject to environmental and town planning regulations incidental to the development of shopping centre sites. The Group has not incurred any significant liabilities under any environmental legislation.
DIRECTORS’ AND OFFICERS’ INDEMNITY/INSURANCE(i) The Constitution of the Company provides that the Company will indemnify to the maximum extent permitted by law, any
current or former director, secretary or other officer of the Company or a wholly owned subsidiary of the Company against:(a) any liability incurred by the person in that capacity; (b) legal costs incurred in defending, or otherwise in connection with proceedings, whether civil, criminal or of an administrative or investigatory nature in which the person becomes involved because of that capacity; and (c) legal costs incurred in good faith in obtaining legal advice on issues relevant to the performance of their functions and discharge of their duties.
(ii) Each director has entered into a Deed of Indemnity, Access and Insurance which provides for indemnity against liability as a director, except to the extent of indemnity under an insurance policy or where prohibited by statute. The Deed also entitles the director to access company documents and records, subject to undertakings as to confidentiality, and to receive directors’ and officers’ insurance cover paid for by the Company.
(iii) During or since the end of the financial period, the Company has paid or agreed to pay a premium in respect of a contract of insurance insuring officers and any persons who are officers in the future and employees of the Company and its subsidiaries, against certain liabilities incurred in that capacity. Disclosure of the total amount of the premiums and the nature of the liabilities in respect of such insurance is prohibited by the contract of insurance.
NON-AUDIT SERVICESDuring the year, Deloitte Touche Tohmatsu, the Company’s auditor, have performed certain other services in addition to their statutory duties. The board is satisfied that the provision of those non-audit services during the year by the auditor is compatible with, and did not compromise, the auditor independence requirements of the Corporations Act 2001 (Cth) or as set out in Code of Conduct APES 110 Code of Ethics for Professional Accountants issued by the Accounting Professional & Ethical Standards Board, as they did not involve reviewing or auditing the auditor’s own work, acting in a management or decision making capacity for the Company, acting as an advocate for the Company or jointly sharing risks or rewards. Details of amounts paid or payable to the auditor for non-audit services provided during the year by the auditor are outlined in Note 6.4 to the financial statements.
OTHER INFORMATIONThe following information, contained in other sections of this Annual Report, forms part of this Directors’ Report:• Operating and Financial Review Details on pages 2 to 37 inclusive in the Annual Report• Details of dividends, including the Dividend Reinvestment Plan (DRP) and shares issued as a result of the DRP,
as outlined in Note 4.2 and Note 4.3 to the financial statements• Matters subsequent to the end of the financial period as outlined in Note 6.5 to the financial statements• Directors’ interests in shares and performance rights as set out in Table 5.2 and 5.3 of the Remuneration Report.
These remain unchanged as at 1 August 2018• Performance rights granted during the financial period and subsequent to year end as outlined in Note 6.2 to the
financial statements• Remuneration Report from pages 40 to 59• Auditor’s independence declaration on page 60.
This Report is made in accordance with a Resolution of the Directors of the Company and is dated 20 August 2018.
Gordon Cairns Chairman
Brad Banducci Chief Executive Officer
1
2
3
4
5
PERFORM
AN
CEH
IGH
LIGH
TSBU
SINESS
REVIEW
DIRECTO
RS' REPO
RTFIN
AN
CIAL
REPORT
OTH
ER IN
FORM
ATION
39W
OO
LWO
RTHS G
ROU
P A
NN
UA
L REPORT 20
1838
1KEY QUESTIONSRemuneration Report
Remuneration Report 2018 Table of Contents
Dear Shareholder,
On behalf of the Board, I am pleased to share with you the Remuneration Report for FY18. We believe that the incentive outcomes appropriately recognise and reward performance: the remuneration earned by the CEO and Executive Key Management Personnel (KMP) reflect an overall Short Term Incentive (STI) outcome that was slightly below target. We delivered strong financial results and continued to meet our targets for customer satisfaction, although after a solid improvement last year, our progress against our Safety targets has slowed.
Since the end of FY17, four historical Long Term Incentive (LTI) Plans were due to vest. These plans were awarded in FY13, FY14, FY15 and FY16. None of these plans vested as they did not meet the performance hurdles required. This is in line with the Relative Total Shareholder Return and Earnings per Share performance over the relevant performance periods, reflecting the experience of our shareholders prior to our transformation.
When we introduced the current incentive structures in FY16, we focused on the first two years of our turnaround and set ourselves the task to review and update the structure for FY19 in order to ensure that it was still fit for purpose. As the business pivots from a period of turnaround to transformation, we will be making a few changes to the incentive structures from FY19. In particular, we have revised our LTI design to move to a more market-aligned approach. For further details refer to section 2.3.
We strongly believe that alignment of our STI arrangements from the CEO through to our store team members is a key symbol of our 'customer and team 1st' approach to transforming our business. This has resulted in increased engagement and accountability across the business in general and maintained focus on our key areas of performance. This will be further enhanced in FY19.
Finally I would like to acknowledge the many stakeholders who have shared their feedback with us over the past year. I can assure you that we are committed to ensuring the needs of our shareholders are front and centre in the development of our remuneration approach.
Holly Kramer Chair – People Performance Committee
FY18 PERFORMANCE
SalesSales momentum was maintained across our core businesses in FY18 through an ongoing focus on putting our customers needs first. The FY18 Sales outcome was just below Target.
Earnings before Interest and Tax (EBIT)The operating leverage achieved in our Food business translated to strong EBIT growth. The FY18 EBIT outcome achieved Stretch.
Working Capital Following significant improvement in FY17, we have made further progress in Working Capital this year. The FY18 Working Capital outcome was marginally above Target.
Customer SatisfactionIn FY18 we continued to drive significant improvements in our Voice of Customer scores. The FY18 Overall Customer Satisfaction outcome was between Target and Stretch.
SafetyProgress on our Safety targets slowed in FY18. The FY18 Safety outcome for our customers was just above Entry however the outcome for our teams was below Entry.
The report has been prepared and audited against the disclosure requirements of the Corporations Act 2001 (Cth).
1 KEY QUESTIONS
2 EXECUTIVE KMP REMUNERATION
2.1 How performance is linked to STI outcomes 442.2 What we paid Executive KMP in FY18 and progress on Minimum
Shareholding Requirements 452.3 Overview of FY18 remuneration framework and key changes for FY19 482.4 FY19 outlook 502.5 Five year performance perspective 502.6 Terms of Executive KMP service agreements 512.7 Executive Share Plans 51
3 NON–EXECUTIVE DIRECTORS’ ARRANGEMENTS
3.1 Non-executive Directors’ remuneration policy and structure 523.2 Non-executive Directors’ minimum shareholding requirement 523.3 Non-executive Directors’ equity plan 53
4 GOVERNANCE
4.1 Role of the People Performance Committee (PPC) 534.2 Use of remuneration advisors 534.3 Securities Trading Policy 53
5 KMP STATUTORY DISCLOSURES
5.1 KMP remuneration table 545.2 Executive KMP share right movements 565.3 KMP share movements 575.4 Share rights outstanding for Executive KMP at 24 June 2018 58
1
4
5
PERFORM
AN
CEH
IGH
LIGH
TSFIN
AN
CIAL
REPORT
OTH
ER IN
FORM
ATION
41W
OO
LWO
RTHS G
ROU
P A
NN
UA
L REPORT 20
1840
2
BUSIN
ESS REV
IEW
3
DIRECTO
RS' REPO
RT
Introduction from the Chair of the People Performance Committee
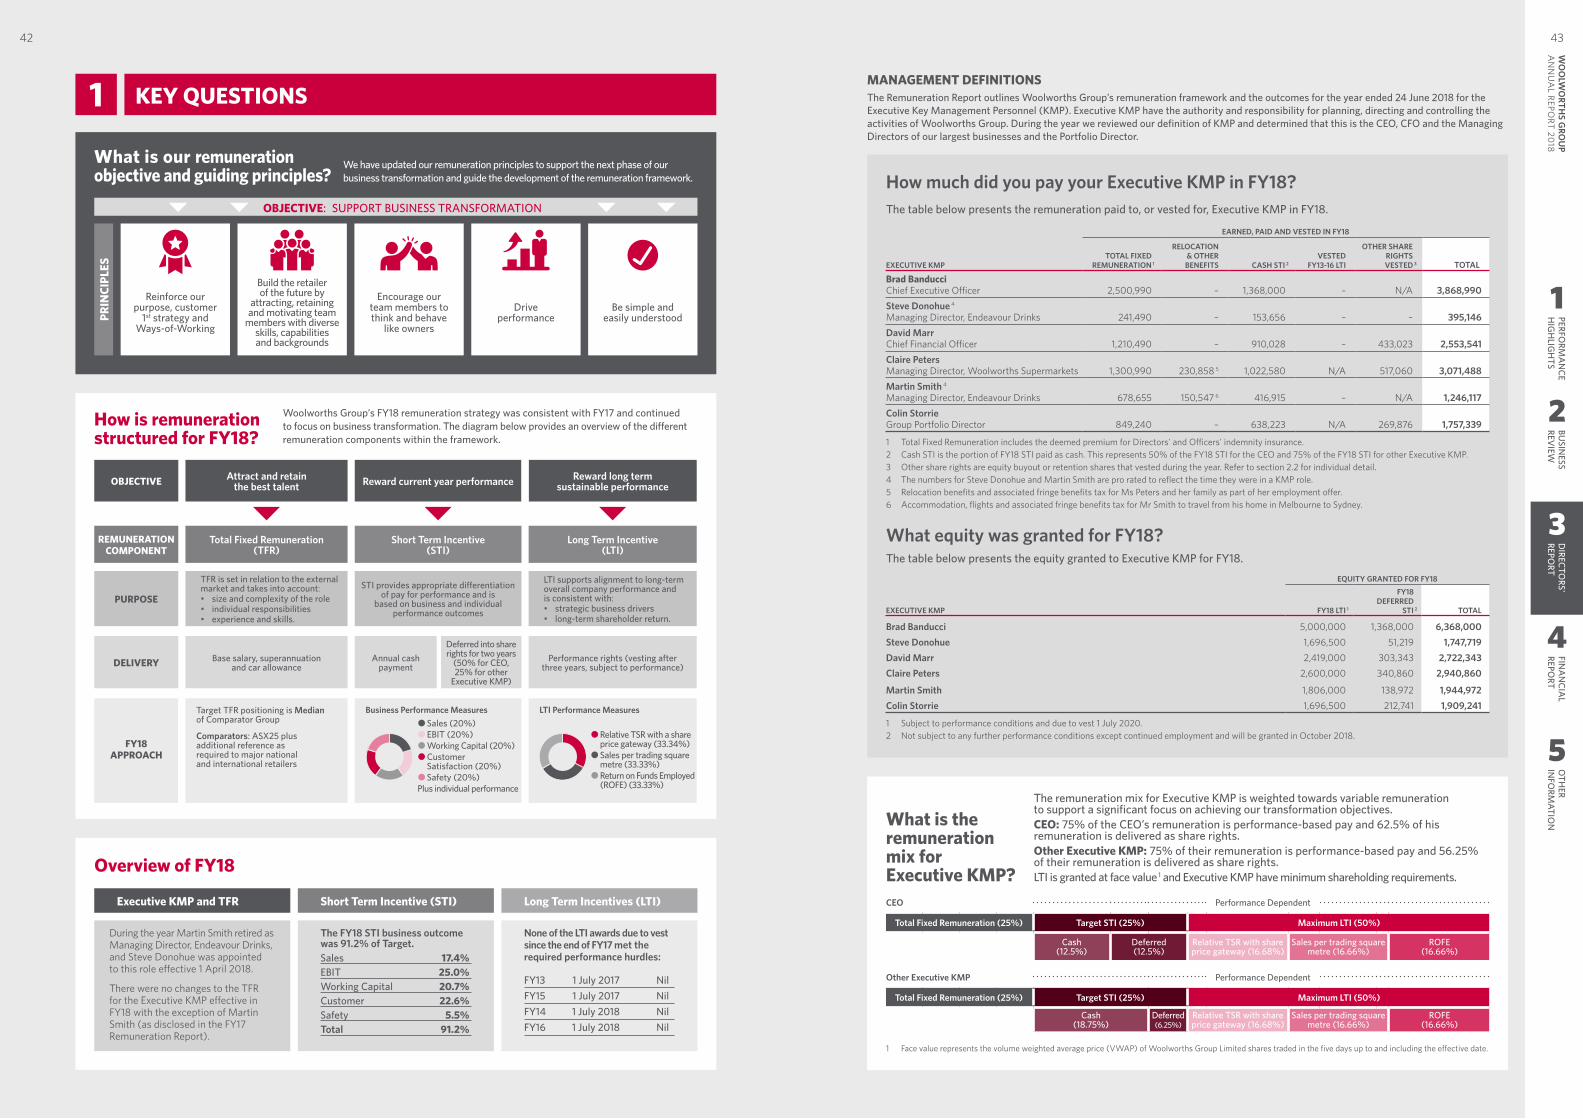
Remuneration Report
1 KEY QUESTIONS
How much did you pay your Executive KMP in FY18?The table below presents the remuneration paid to, or vested for, Executive KMP in FY18.
EARNED, PAID AND VESTED IN FY18
EXECUTIVE KMPTOTAL FIXED
REMUNERATION 1
RELOCATION & OTHER BENEFITS CASH STI 2
VESTED FY13-16 LTI
OTHER SHARE RIGHTSVESTED 3 TOTAL
Brad BanducciChief Executive Officer 2,500,990 – 1,368,000 – N/A 3,868,990Steve Donohue 4
Managing Director, Endeavour Drinks 241,490 – 153,656 – – 395,146David Marr Chief Financial Officer 1,210,490 – 910,028 – 433,023 2,553,541 Claire Peters
Managing Director, Woolworths Supermarkets 1,300,990 230,858 5 1,022,580 N/A 517,060 3,071,488 Martin Smith 4 Managing Director, Endeavour Drinks 678,655 150,547 6 416,915 – N/A 1,246,117 Colin Storrie
Group Portfolio Director 849,240 – 638,223 N/A 269,876 1,757,339
1 Total Fixed Remuneration includes the deemed premium for Directors' and Officers' indemnity insurance.2 Cash STI is the portion of FY18 STI paid as cash. This represents 50% of the FY18 STI for the CEO and 75% of the FY18 STI for other Executive KMP.3 Other share rights are equity buyout or retention shares that vested during the year. Refer to section 2.2 for individual detail.4 The numbers for Steve Donohue and Martin Smith are pro rated to reflect the time they were in a KMP role.5 Relocation benefits and associated fringe benefits tax for Ms Peters and her family as part of her employment offer.6 Accommodation, flights and associated fringe benefits tax for Mr Smith to travel from his home in Melbourne to Sydney.
What equity was granted for FY18?The table below presents the equity granted to Executive KMP for FY18.
EXECUTIVE KMP
EQUITY GRANTED FOR FY18
FY18 LTI 1
FY18 DEFERRED
STI 2 TOTAL
Brad Banducci 5,000,000 1,368,000 6,368,000Steve Donohue 1,696,500 51,219 1,747,719David Marr 2,419,000 303,343 2,722,343Claire Peters 2,600,000 340,860 2,940,860
Martin Smith 1,806,000 138,972 1,944,972Colin Storrie 1,696,500 212,741 1,909,241
1 Subject to performance conditions and due to vest 1 July 2020.2 Not subject to any further performance conditions except continued employment and will be granted in October 2018.
What is the remuneration mix for Executive KMP?CEO Performance Dependent
Total Fixed Remuneration (25%) Target STI (25%) Maximum LTI (50%)
Cash (12.5%)
Deferred(12.5%)
Relative TSR with shareprice gateway (16.68%)
Sales per trading square metre (16.66%)
ROFE (16.66%)
Other Executive KMP Performance Dependent
Total Fixed Remuneration (25%) Target STI (25%) Maximum LTI (50%)
Cash (18.75%)
Deferred(6.25%)
Relative TSR with shareprice gateway (16.68%)
Sales per trading square metre (16.66%)
ROFE (16.66%)
1 Face value represents the volume weighted average price (VWAP) of Woolworths Group Limited shares traded in the five days up to and including the effective date.
The remuneration mix for Executive KMP is weighted towards variable remuneration to support a significant focus on achieving our transformation objectives.CEO: 75% of the CEO’s remuneration is performance-based pay and 62.5% of his remuneration is delivered as share rights.Other Executive KMP: 75% of their remuneration is performance-based pay and 56.25% of their remuneration is delivered as share rights.LTI is granted at face value 1 and Executive KMP have minimum shareholding requirements.
Overview of FY18
Executive KMP and TFR Short Term Incentive (STI) Long Term Incentives (LTI)
During the year Martin Smith retired as Managing Director, Endeavour Drinks, and Steve Donohue was appointed to this role effective 1 April 2018.
There were no changes to the TFR for the Executive KMP effective in FY18 with the exception of Martin Smith (as disclosed in the FY17 Remuneration Report).
The FY18 STI business outcome was 91.2% of Target.Sales 17.4%EBIT 25.0%Working Capital 20.7%Customer 22.6%Safety 5.5%Total 91.2%
None of the LTI awards due to vest since the end of FY17 met the required performance hurdles:
FY13 1 July 2017 NilFY15 1 July 2017 NilFY14 1 July 2018 NilFY16 1 July 2018 Nil
How is remuneration structured for FY18?
Woolworths Group’s FY18 remuneration strategy was consistent with FY17 and continued to focus on business transformation. The diagram below provides an overview of the different remuneration components within the framework.
OBJECTIVE Attract and retain the best talent Reward current year performance Reward long term
sustainable performance
REMUNERATION COMPONENT
Total Fixed Remuneration (TFR)
Short Term Incentive (STI)
Long Term Incentive (LTI)
PURPOSE
TFR is set in relation to the external market and takes into account:• size and complexity of the role• individual responsibilities• experience and skills.
STI provides appropriate differentiation of pay for performance and is
based on business and individual performance outcomes
LTI supports alignment to long-term overall company performance and is consistent with:• strategic business drivers• long-term shareholder return.
DELIVERY Base salary, superannuation and car allowance
Annual cash payment
Deferred into share rights for two years
(50% for CEO, 25% for other
Executive KMP)
Performance rights (vesting after three years, subject to performance)
FY18 APPROACH
Target TFR positioning is Median of Comparator Group
Comparators: ASX25 plus additional reference as required to major national and international retailers
Business Performance Measures
Sales (20%) EBIT (20%) Working Capital (20%) Customer
Satisfaction (20%) Safety (20%)Plus individual performance
LTI Performance Measures
Relative TSR with a share price gateway (33.34%)
Sales per trading square metre (33.33%)
Return on Funds Employed (ROFE) (33.33%)
OBJECTIVE: SUPPORT BUSINESS TRANSFORMATION
PRIN
CIPL
ES
Reinforce our purpose, customer
1st strategy and Ways-of-Working
Build the retailer of the future by
attracting, retaining and motivating team
members with diverse skills, capabilities and backgrounds
Encourage our team members to think and behave
like owners
Drive performance
Be simple and easily understood
What is our remuneration objective and guiding principles?
We have updated our remuneration principles to support the next phase of our business transformation and guide the development of the remuneration framework.
MANAGEMENT DEFINITIONSThe Remuneration Report outlines Woolworths Group’s remuneration framework and the outcomes for the year ended 24 June 2018 for the Executive Key Management Personnel (KMP). Executive KMP have the authority and responsibility for planning, directing and controlling the activities of Woolworths Group. During the year we reviewed our definition of KMP and determined that this is the CEO, CFO and the Managing Directors of our largest businesses and the Portfolio Director.
1
4
5
PERFORM
AN
CEH
IGH
LIGH
TSFIN
AN
CIAL
REPORT
OTH
ER IN
FORM
ATION
43W
OO
LWO
RTHS G
ROU
P A
NN
UA
L REPORT 20
1842
2
BUSIN
ESS REV
IEW
3
DIRECTO
RS' REPO
RT
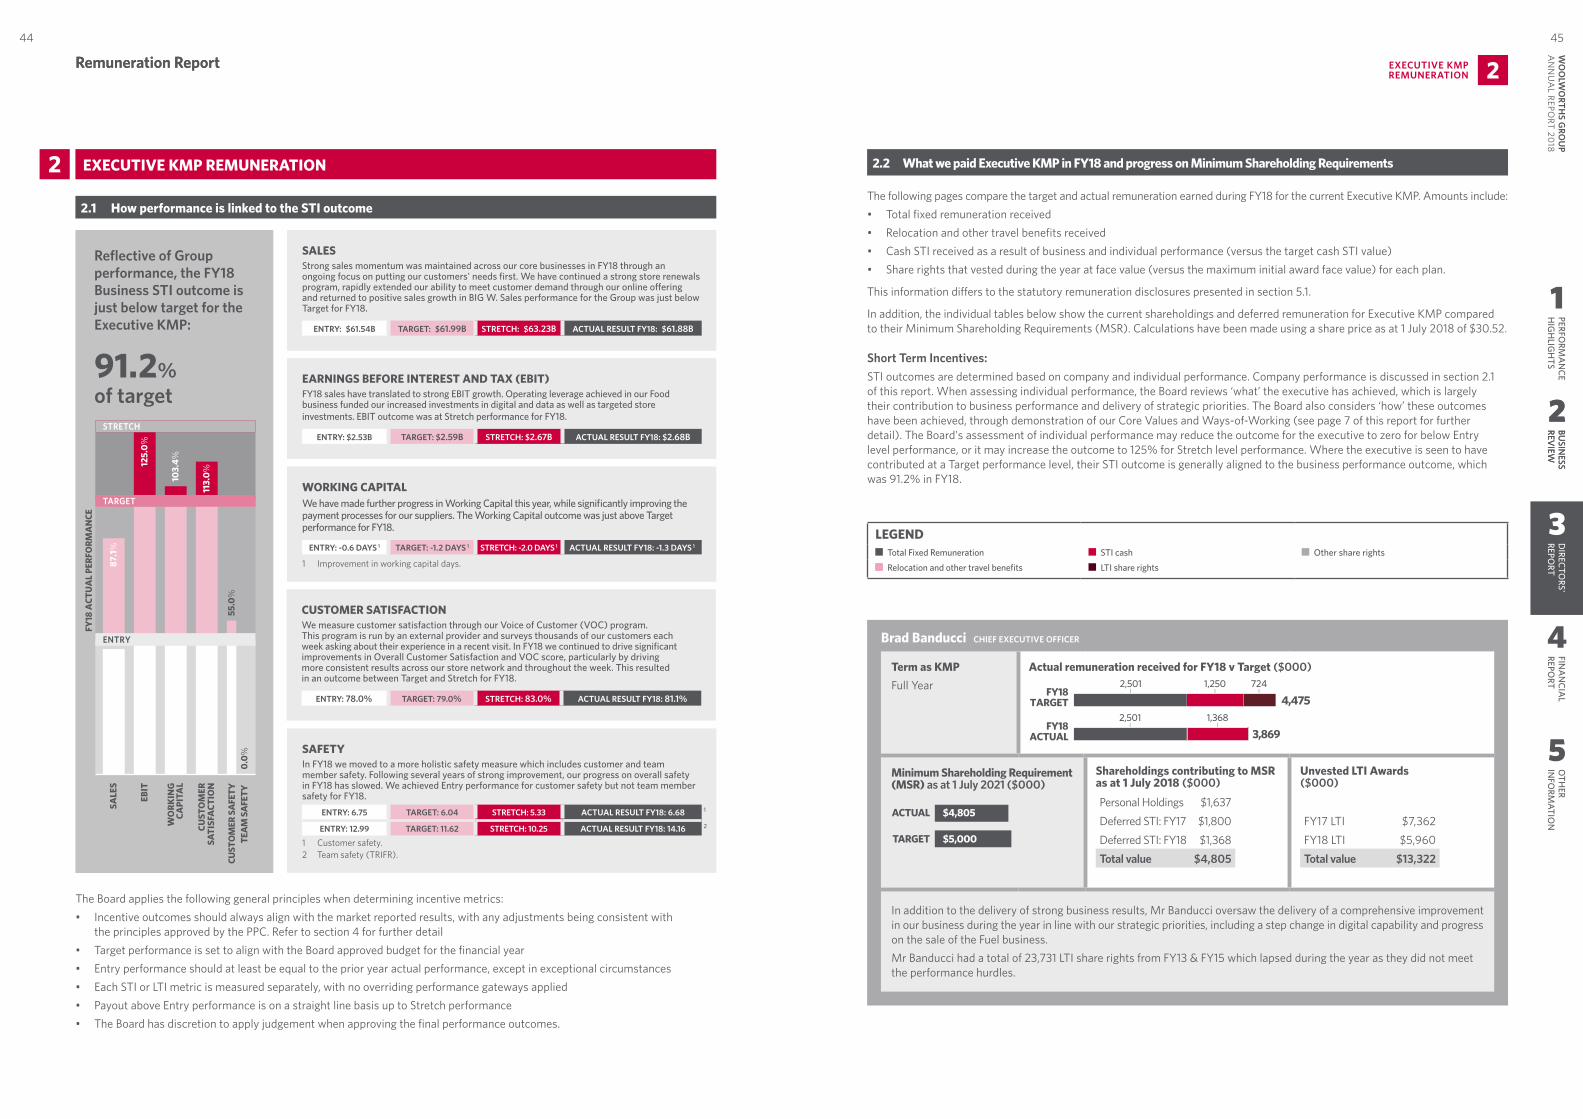
Remuneration Report EXECUTIVE KMP REMUNERATION 2Remuneration Report
2 EXECUTIVE KMP REMUNERATION
2.1 How performance is linked to the STI outcome
Reflective of Group performance, the FY18 Business STI outcome is just below target for the Executive KMP:
91.2% of target
SALE
S87
.1%
125.
0%
103.
4%
55.0
%
0.0%
EBIT
WO
RKIN
GCA
PITA
L
CUST
OM
ERSA
TISF
ACT
ION
FY18
ACT
UA
L PE
RFO
RMA
NCE
TARGET
STRETCH
113.
0%
CUST
OM
ER S
AFE
TYTE
AM
SA
FETY
ENTRY
SAFETYIn FY18 we moved to a more holistic safety measure which includes customer and team member safety. Following several years of strong improvement, our progress on overall safety in FY18 has slowed. We achieved Entry performance for customer safety but not team member safety for FY18.
ENTRY: 6.75 TARGET: 6.04 STRETCH: 5.33 ACTUAL RESULT FY18: 6.68 1
ENTRY: 12.99 TARGET: 11.62 STRETCH: 10.25 ACTUAL RESULT FY18: 14.16 2
1 Customer safety.2 Team safety (TRIFR).
CUSTOMER SATISFACTIONWe measure customer satisfaction through our Voice of Customer (VOC) program. This program is run by an external provider and surveys thousands of our customers each week asking about their experience in a recent visit. In FY18 we continued to drive significant improvements in Overall Customer Satisfaction and VOC score, particularly by driving more consistent results across our store network and throughout the week. This resulted in an outcome between Target and Stretch for FY18.
ENTRY: 78.0% TARGET: 79.0% STRETCH: 83.0% ACTUAL RESULT FY18: 81.1%
WORKING CAPITAL We have made further progress in Working Capital this year, while significantly improving the payment processes for our suppliers. The Working Capital outcome was just above Target performance for FY18.
ENTRY: -0.6 DAYS 1 TARGET: -1.2 DAYS 1 STRETCH: -2.0 DAYS 1 ACTUAL RESULT FY18: -1.3 DAYS 11
1 Improvement in working capital days.
EARNINGS BEFORE INTEREST AND TAX (EBIT)FY18 sales have translated to strong EBIT growth. Operating leverage achieved in our Food business funded our increased investments in digital and data as well as targeted store investments. EBIT outcome was at Stretch performance for FY18.
ENTRY: $2.53B TARGET: $2.59B STRETCH: $2.67B ACTUAL RESULT FY18: $2.68B
SALESStrong sales momentum was maintained across our core businesses in FY18 through an ongoing focus on putting our customers' needs first. We have continued a strong store renewals program, rapidly extended our ability to meet customer demand through our online offering and returned to positive sales growth in BIG W. Sales performance for the Group was just below Target for FY18.
ENTRY: $61.54B TARGET: $61.99B STRETCH: $63.23B ACTUAL RESULT FY18: $61.88B
The Board applies the following general principles when determining incentive metrics:• Incentive outcomes should always align with the market reported results, with any adjustments being consistent with
the principles approved by the PPC. Refer to section 4 for further detail• Target performance is set to align with the Board approved budget for the financial year• Entry performance should at least be equal to the prior year actual performance, except in exceptional circumstances• Each STI or LTI metric is measured separately, with no overriding performance gateways applied• Payout above Entry performance is on a straight line basis up to Stretch performance• The Board has discretion to apply judgement when approving the final performance outcomes.
2.2 What we paid Executive KMP in FY18 and progress on Minimum Shareholding Requirements
The following pages compare the target and actual remuneration earned during FY18 for the current Executive KMP. Amounts include:• Total fixed remuneration received• Relocation and other travel benefits received • Cash STI received as a result of business and individual performance (versus the target cash STI value)• Share rights that vested during the year at face value (versus the maximum initial award face value) for each plan.
This information differs to the statutory remuneration disclosures presented in section 5.1.
In addition, the individual tables below show the current shareholdings and deferred remuneration for Executive KMP compared to their Minimum Shareholding Requirements (MSR). Calculations have been made using a share price as at 1 July 2018 of $30.52.
Short Term Incentives:STI outcomes are determined based on company and individual performance. Company performance is discussed in section 2.1 of this report. When assessing individual performance, the Board reviews ‘what’ the executive has achieved, which is largely their contribution to business performance and delivery of strategic priorities. The Board also considers ‘how’ these outcomes have been achieved, through demonstration of our Core Values and Ways-of-Working (see page 7 of this report for further detail). The Board's assessment of individual performance may reduce the outcome for the executive to zero for below Entry level performance, or it may increase the outcome to 125% for Stretch level performance. Where the executive is seen to have contributed at a Target performance level, their STI outcome is generally aligned to the business performance outcome, which was 91.2% in FY18.
LEGEND Total Fixed Remuneration STI cash Other share rights
Relocation and other travel benefits LTI share rights
Brad Banducci CHIEF EXECUTIVE OFFICER
Term as KMPFull Year
Actual remuneration received for FY18 v Target ($000)
FY18ACTUAL
FY18TARGET
FY18ACTUAL
FY18TARGET
FY18ACTUAL
FY18TARGET
FY18ACTUAL
FY18TARGET
FY18ACTUAL
FY18TARGET
FY18ACTUAL
FY18TARGET
FY18ACTUAL
FY18TARGET
2,501 1,368
3,869
2,501 1,250 724
4,475
241 168
154
409241
395
848 16
865
16848 636 1,412
2,912
849 636 220
1,705849
1,757638 270679
1,247151417
679 151 508
1,599261
1,301 231
3,0721,023 517
1,301 231 975 497
3,004
1,210
2,553910 433
1,210 907 458
3,7651,190
Brad Richard David
Claire Martin Colin Stephen
NOTE Colours need to be�xed for print productionMULTIPLY Grey etc.As per �leWOW_AR18_REM_Executive KMP_v1a.ai
CMYK colour make up
Minimum Shareholding Requirement (MSR) as at 1 July 2021 ($000)
ACTUAL
TARGET
$4,805
$5,000
ACTUAL
TARGET
$785
$848
ACTUAL
TARGET
$2,443
$1,210
ACTUAL
TARGET
$2,947
$1,300
ACTUAL
TARGET
$1,165 ACTUAL
TARGET
$669
$962
ACTUAL $817
$848
Brad Richard David Claire Martin Colin SteveShareholdings contributing to MSR as at 1 July 2018 ($000)
Personal Holdings $1,637Deferred STI: FY17 $1,800Deferred STI: FY18 $1,368Total value $4,805
Unvested LTI Awards ($000)
FY17 LTI $7,362FY18 LTI $5,960Total value $13,322
In addition to the delivery of strong business results, Mr Banducci oversaw the delivery of a comprehensive improvement in our business during the year in line with our strategic priorities, including a step change in digital capability and progress on the sale of the Fuel business. Mr Banducci had a total of 23,731 LTI share rights from FY13 & FY15 which lapsed during the year as they did not meet the performance hurdles.
1
4
5
PERFORM
AN
CEH
IGH
LIGH
TSFIN
AN
CIAL
REPORT
OTH
ER IN
FORM
ATION
45W
OO
LWO
RTHS G
ROU
P A
NN
UA
L REPORT 20
1844
2
BUSIN
ESS REV
IEW
3
DIRECTO
RS' REPO
RT
2
BUSIN
ESS REV
IEW
3
DIRECTO
RS' REPO
RT
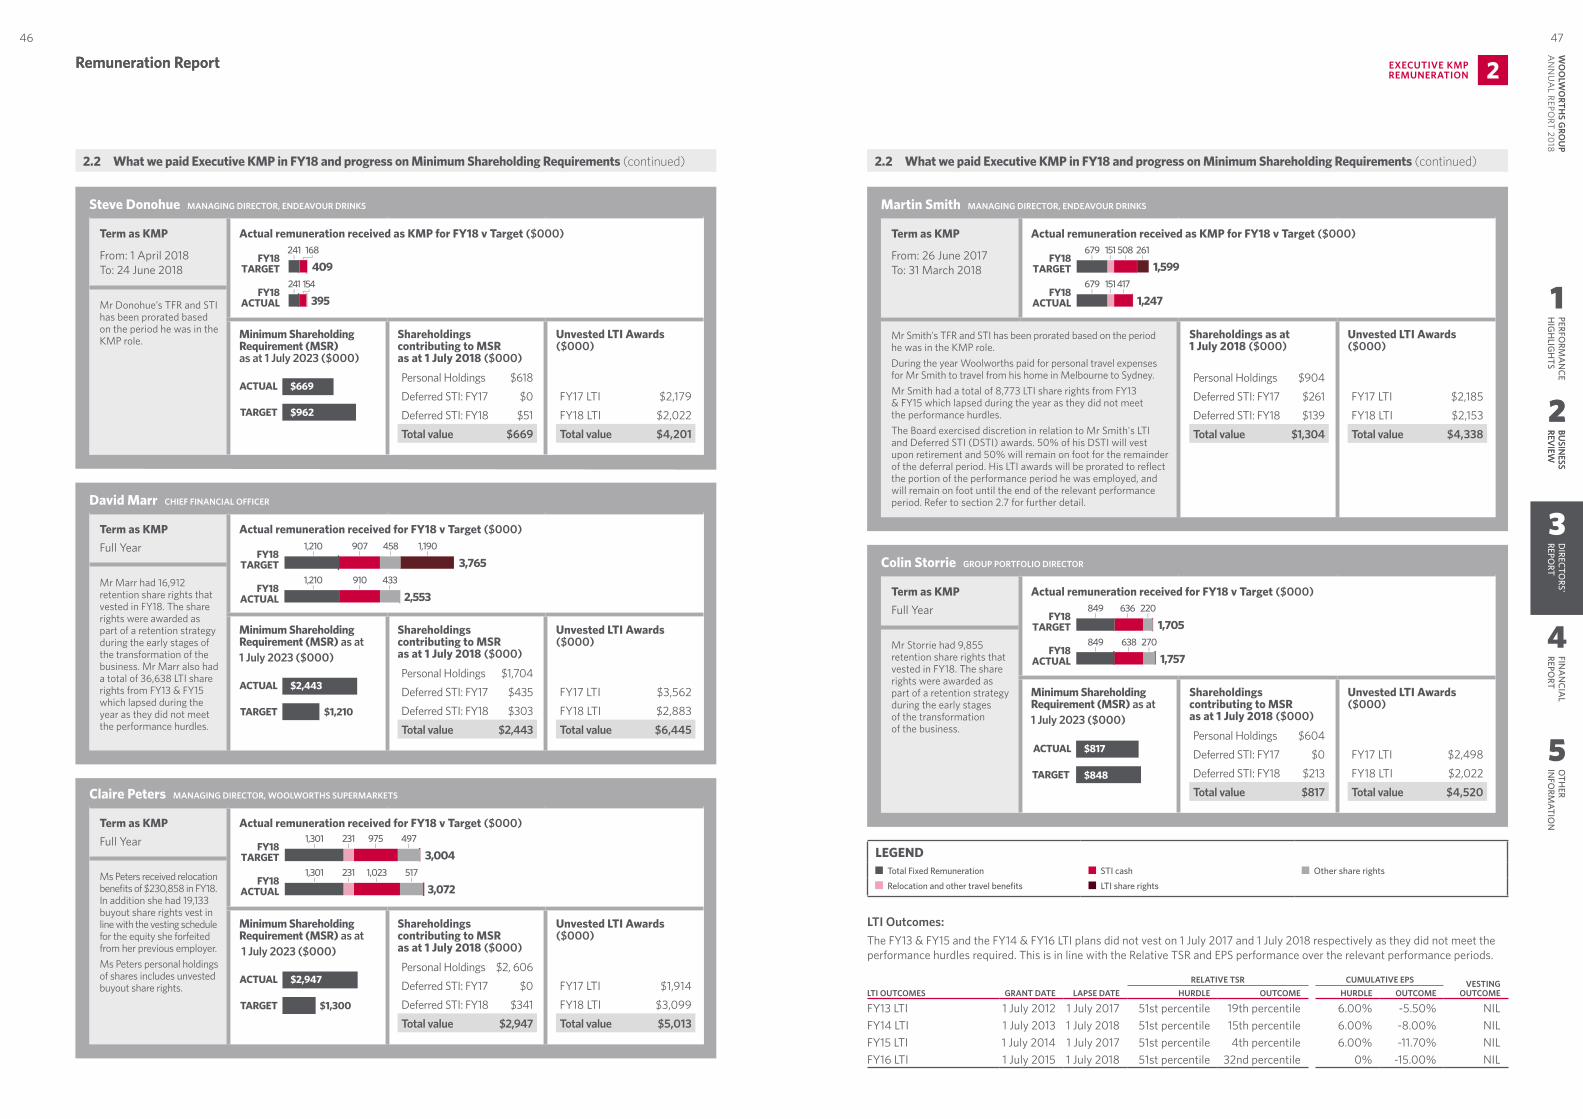
Remuneration Report EXECUTIVE KMP REMUNERATION 2Remuneration Report
Steve Donohue MANAGING DIRECTOR, ENDEAVOUR DRINKS
Term as KMP
From: 1 April 2018 To: 24 June 2018
Mr Donohue’s TFR and STI has been prorated based on the period he was in the KMP role.
Actual remuneration received as KMP for FY18 v Target ($000)
FY18ACTUAL
FY18TARGET
FY18ACTUAL
FY18TARGET
FY18ACTUAL
FY18TARGET
FY18ACTUAL
FY18TARGET
FY18ACTUAL
FY18TARGET
FY18ACTUAL
FY18TARGET
FY18ACTUAL
FY18TARGET
2,501 1,368
3,869
2,501 1,250 724
4,475
241 168
154
409241
395
848 16
865
16848 636 1,412
2,912
849 636 220
1,705849
1,757638 270679
1,247151417
679 151 508
1,599261
1,301 231
3,0721,023 517
1,301 231 975 497
3,004
1,210
2,553910 433
1,210 907 458
3,7651,190
Brad Richard David
Claire Martin Colin Stephen
NOTE Colours need to be�xed for print productionMULTIPLY Grey etc.As per �leWOW_AR18_REM_Executive KMP_v1a.ai
CMYK colour make up
Minimum Shareholding Requirement (MSR) as at 1 July 2023 ($000)
ACTUAL
TARGET
$4,805
$5,000
ACTUAL
TARGET
$785
$848
ACTUAL
TARGET
$2,443
$1,210
ACTUAL
TARGET
$2,947
$1,300
ACTUAL
TARGET
$1,165 ACTUAL
TARGET
$669
$962
ACTUAL $817
$848
Brad Richard David Claire Martin Colin SteveShareholdings contributing to MSR as at 1 July 2018 ($000)
Personal Holdings $618Deferred STI: FY17 $0Deferred STI: FY18 $51Total value $669
Unvested LTI Awards ($000)
FY17 LTI $2,179FY18 LTI $2,022Total value $4,201
David Marr CHIEF FINANCIAL OFFICER
Term as KMPFull Year
Mr Marr had 16,912 retention share rights that vested in FY18. The share rights were awarded as part of a retention strategy during the early stages of the transformation of the business. Mr Marr also had a total of 36,638 LTI share rights from FY13 & FY15 which lapsed during the year as they did not meet the performance hurdles.
Actual remuneration received for FY18 v Target ($000)
FY18ACTUAL
FY18TARGET
FY18ACTUAL
FY18TARGET
FY18ACTUAL
FY18TARGET
FY18ACTUAL
FY18TARGET
FY18ACTUAL
FY18TARGET
FY18ACTUAL
FY18TARGET
FY18ACTUAL
FY18TARGET
2,501 1,368
3,869
2,501 1,250 724
4,475
241 168
154
409241
395
848 16
865
16848 636 1,412
2,912
849 636 220
1,705849
1,757638 270679
1,247151417
679 151 508
1,599261
1,301 231
3,0721,023 517
1,301 231 975 497
3,004
1,210
2,553910 433
1,210 907 458
3,7651,190
Brad Richard David
Claire Martin Colin Stephen
NOTE Colours need to be�xed for print productionMULTIPLY Grey etc.As per �leWOW_AR18_REM_Executive KMP_v1a.ai
CMYK colour make up
Minimum Shareholding Requirement (MSR) as at 1 July 2023 ($000)
ACTUAL
TARGET
$4,805
$5,000
ACTUAL
TARGET
$785
$848
ACTUAL
TARGET
$2,443
$1,210
ACTUAL
TARGET
$2,947
$1,300
ACTUAL
TARGET
$1,165 ACTUAL
TARGET
$669
$962
ACTUAL $817
$848
Brad Richard David Claire Martin Colin SteveShareholdings contributing to MSR as at 1 July 2018 ($000)
Personal Holdings $1,704Deferred STI: FY17 $435Deferred STI: FY18 $303Total value $2,443
Unvested LTI Awards ($000)
FY17 LTI $3,562FY18 LTI $2,883Total value $6,445
Claire Peters MANAGING DIRECTOR, WOOLWORTHS SUPERMARKETS
Term as KMPFull Year
Ms Peters received relocation benefits of $230,858 in FY18. In addition she had 19,133 buyout share rights vest in line with the vesting schedule for the equity she forfeited from her previous employer.Ms Peters personal holdings of shares includes unvested buyout share rights.
Actual remuneration received for FY18 v Target ($000)
FY18ACTUAL
FY18TARGET
FY18ACTUAL
FY18TARGET
FY18ACTUAL
FY18TARGET
FY18ACTUAL
FY18TARGET
FY18ACTUAL
FY18TARGET
FY18ACTUAL
FY18TARGET
FY18ACTUAL
FY18TARGET
2,501 1,368
3,869
2,501 1,250 724
4,475
241 168
154
409241
395
848 16
865
16848 636 1,412
2,912
849 636 220
1,705849
1,757638 270679
1,247151417
679 151 508
1,599261
1,301 231
3,0721,023 517
1,301 231 975 497
3,004
1,210
2,553910 433
1,210 907 458
3,7651,190
Brad Richard David
Claire Martin Colin Stephen
NOTE Colours need to be�xed for print productionMULTIPLY Grey etc.As per �leWOW_AR18_REM_Executive KMP_v1a.ai
CMYK colour make up
Minimum Shareholding Requirement (MSR) as at 1 July 2023 ($000)
ACTUAL
TARGET
$4,805
$5,000
ACTUAL
TARGET
$785
$848
ACTUAL
TARGET
$2,443
$1,210
ACTUAL
TARGET
$2,947
$1,300
ACTUAL
TARGET
$1,165 ACTUAL
TARGET
$669
$962
ACTUAL $817
$848
Brad Richard David Claire Martin Colin SteveShareholdings contributing to MSR as at 1 July 2018 ($000)
Personal Holdings $2, 606Deferred STI: FY17 $0Deferred STI: FY18 $341Total value $2,947
Unvested LTI Awards ($000)
FY17 LTI $1,914FY18 LTI $3,099Total value $5,013
Martin Smith MANAGING DIRECTOR, ENDEAVOUR DRINKS
Term as KMP
From: 26 June 2017 To: 31 March 2018
Actual remuneration received as KMP for FY18 v Target ($000)
FY18ACTUAL
FY18TARGET
FY18ACTUAL
FY18TARGET
FY18ACTUAL
FY18TARGET
FY18ACTUAL
FY18TARGET
FY18ACTUAL
FY18TARGET
FY18ACTUAL
FY18TARGET
FY18ACTUAL
FY18TARGET
2,501 1,368
3,869
2,501 1,250 724
4,475
241 168
154
409241
395
848 16
865
16848 636 1,412
2,912
849 636 220
1,705849
1,757638 270679
1,247151417
679 151 508
1,599261
1,301 231
3,0721,023 517
1,301 231 975 497
3,004
1,210
2,553910 433
1,210 907 458
3,7651,190
Brad Richard David
Claire Martin Colin Stephen
NOTE Colours need to be�xed for print productionMULTIPLY Grey etc.As per �leWOW_AR18_REM_Executive KMP_v1a.ai
CMYK colour make up
Mr Smith's TFR and STI has been prorated based on the period he was in the KMP role. During the year Woolworths paid for personal travel expenses for Mr Smith to travel from his home in Melbourne to Sydney. Mr Smith had a total of 8,773 LTI share rights from FY13 & FY15 which lapsed during the year as they did not meet the performance hurdles. The Board exercised discretion in relation to Mr Smith's LTI and Deferred STI (DSTI) awards. 50% of his DSTI will vest upon retirement and 50% will remain on foot for the remainder of the deferral period. His LTI awards will be prorated to reflect the portion of the performance period he was employed, and will remain on foot until the end of the relevant performance period. Refer to section 2.7 for further detail.
Shareholdings as at 1 July 2018 ($000)
Personal Holdings $904Deferred STI: FY17 $261Deferred STI: FY18 $139Total value $1,304
Unvested LTI Awards ($000)
FY17 LTI $2,185FY18 LTI $2,153Total value $4,338
Colin Storrie GROUP PORTFOLIO DIRECTOR
Term as KMPFull Year
Mr Storrie had 9,855 retention share rights that vested in FY18. The share rights were awarded as part of a retention strategy during the early stages of the transformation of the business.
Actual remuneration received for FY18 v Target ($000)
FY18ACTUAL
FY18TARGET
FY18ACTUAL
FY18TARGET
FY18ACTUAL
FY18TARGET
FY18ACTUAL
FY18TARGET
FY18ACTUAL
FY18TARGET
FY18ACTUAL
FY18TARGET
FY18ACTUAL
FY18TARGET
2,501 1,368
3,869
2,501 1,250 724
4,475
241 168
154
409241
395
848 16
865
16848 636 1,412
2,912
849 636 220
1,705849
1,757638 270679
1,247151417
679 151 508
1,599261
1,301 231
3,0721,023 517
1,301 231 975 497
3,004
1,210
2,553910 433
1,210 907 458
3,7651,190
Brad Richard David
Claire Martin Colin Stephen
NOTE Colours need to be�xed for print productionMULTIPLY Grey etc.As per �leWOW_AR18_REM_Executive KMP_v1a.ai
CMYK colour make up
Minimum Shareholding Requirement (MSR) as at 1 July 2023 ($000)
ACTUAL
TARGET
$4,805
$5,000
ACTUAL
TARGET
$785
$848
ACTUAL
TARGET
$2,443
$1,210
ACTUAL
TARGET
$2,947
$1,300
ACTUAL
TARGET
$1,165 ACTUAL
TARGET
$669
$962
ACTUAL $817
$848
Brad Richard David Claire Martin Colin SteveShareholdings contributing to MSR as at 1 July 2018 ($000)
Personal Holdings $604Deferred STI: FY17 $0Deferred STI: FY18 $213Total value $817
Unvested LTI Awards ($000)
FY17 LTI $2,498FY18 LTI $2,022Total value $4,520
LEGEND Total Fixed Remuneration STI cash Other share rights
Relocation and other travel benefits LTI share rights
LTI Outcomes:The FY13 & FY15 and the FY14 & FY16 LTI plans did not vest on 1 July 2017 and 1 July 2018 respectively as they did not meet the performance hurdles required. This is in line with the Relative TSR and EPS performance over the relevant performance periods.
LTI OUTCOMES GRANT DATE LAPSE DATERELATIVE TSR CUMULATIVE EPS VESTING
OUTCOMEHURDLE OUTCOME HURDLE OUTCOME
FY13 LTI 1 July 2012 1 July 2017 51st percentile 19th percentile 6.00% -5.50% NILFY14 LTI 1 July 2013 1 July 2018 51st percentile 15th percentile 6.00% -8.00% NILFY15 LTI 1 July 2014 1 July 2017 51st percentile 4th percentile 6.00% -11.70% NILFY16 LTI 1 July 2015 1 July 2018 51st percentile 32nd percentile 0% -15.00% NIL
2.2 What we paid Executive KMP in FY18 and progress on Minimum Shareholding Requirements (continued) 2.2 What we paid Executive KMP in FY18 and progress on Minimum Shareholding Requirements (continued)
1
4
5
PERFORM
AN
CEH
IGH
LIGH
TSFIN
AN
CIAL
REPORT
OTH
ER IN
FORM
ATION
47W
OO
LWO
RTHS G
ROU
P A
NN
UA
L REPORT 20
1846
2
BUSIN
ESS REV
IEW
3
DIRECTO
RS' REPO
RT
2
BUSIN
ESS REV
IEW
3
DIRECTO
RS' REPO
RT
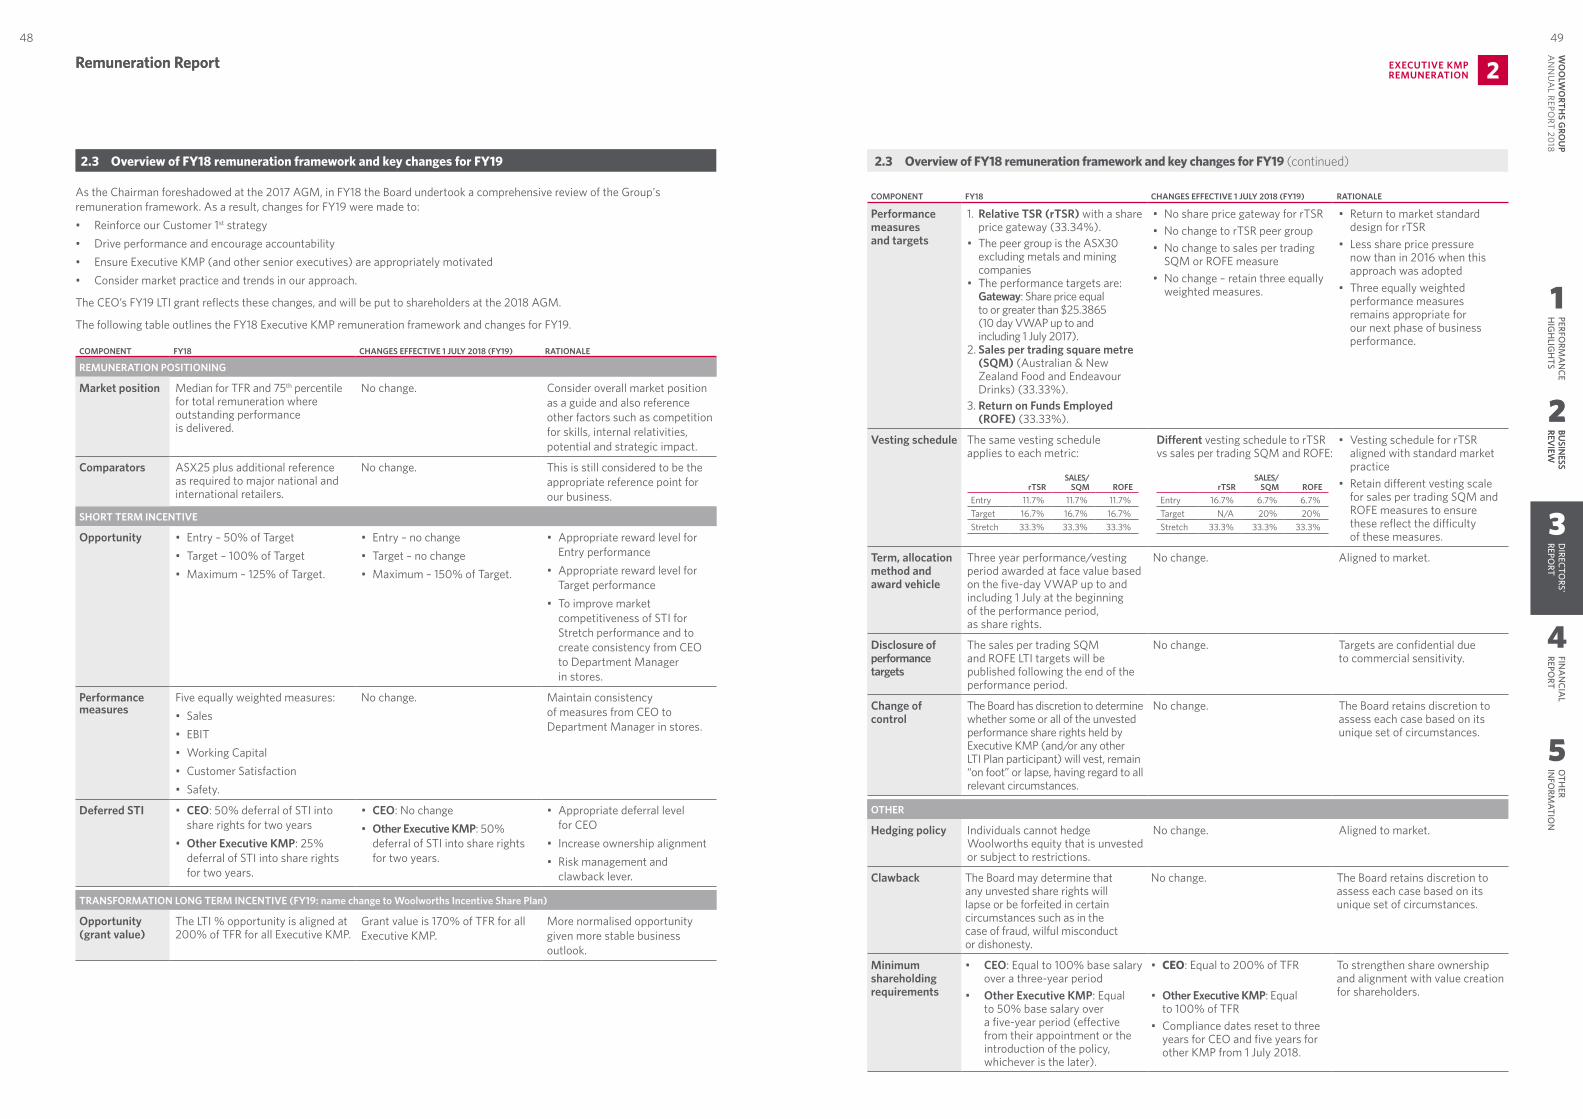
Remuneration Report EXECUTIVE KMP REMUNERATION 2Remuneration Report
2.3 Overview of FY18 remuneration framework and key changes for FY19
As the Chairman foreshadowed at the 2017 AGM, in FY18 the Board undertook a comprehensive review of the Group's remuneration framework. As a result, changes for FY19 were made to:• Reinforce our Customer 1st strategy• Drive performance and encourage accountability• Ensure Executive KMP (and other senior executives) are appropriately motivated• Consider market practice and trends in our approach.
The CEO’s FY19 LTI grant reflects these changes, and will be put to shareholders at the 2018 AGM.
The following table outlines the FY18 Executive KMP remuneration framework and changes for FY19.
COMPONENT FY18 CHANGES EFFECTIVE 1 JULY 2018 (FY19) RATIONALE
REMUNERATION POSITIONING
Market position Median for TFR and 75th percentile for total remuneration where outstanding performance is delivered.
No change. Consider overall market position as a guide and also reference other factors such as competition for skills, internal relativities, potential and strategic impact.
Comparators ASX25 plus additional reference as required to major national and international retailers.
No change. This is still considered to be the appropriate reference point for our business.
SHORT TERM INCENTIVE
Opportunity • Entry – 50% of Target• Target – 100% of Target• Maximum – 125% of Target.
• Entry – no change• Target – no change• Maximum – 150% of Target.
• Appropriate reward level for Entry performance
• Appropriate reward level for Target performance
• To improve market competitiveness of STI for Stretch performance and to create consistency from CEO to Department Manager in stores.
Performance measures
Five equally weighted measures:• Sales • EBIT• Working Capital• Customer Satisfaction • Safety.
No change. Maintain consistency of measures from CEO to Department Manager in stores.
Deferred STI • CEO: 50% deferral of STI into share rights for two years
• Other Executive KMP: 25% deferral of STI into share rights for two years.
• CEO: No change• Other Executive KMP: 50%
deferral of STI into share rights for two years.
• Appropriate deferral level for CEO
• Increase ownership alignment• Risk management and
clawback lever.
TRANSFORMATION LONG TERM INCENTIVE (FY19: name change to Woolworths Incentive Share Plan)
Opportunity (grant value)
The LTI % opportunity is aligned at 200% of TFR for all Executive KMP.
Grant value is 170% of TFR for all Executive KMP.
More normalised opportunity given more stable business outlook.
COMPONENT FY18 CHANGES EFFECTIVE 1 JULY 2018 (FY19) RATIONALE
Performance measures and targets
1. Relative TSR (rTSR) with a share price gateway (33.34%).
• The peer group is the ASX30 excluding metals and mining companies
• The performance targets are: Gateway: Share price equal to or greater than $25.3865 (10 day VWAP up to and including 1 July 2017).
2. Sales per trading square metre (SQM) (Australian & New Zealand Food and Endeavour Drinks) (33.33%).
3. Return on Funds Employed (ROFE) (33.33%).
• No share price gateway for rTSR• No change to rTSR peer group• No change to sales per trading
SQM or ROFE measure• No change – retain three equally
weighted measures.
• Return to market standard design for rTSR
• Less share price pressure now than in 2016 when this approach was adopted
• Three equally weighted performance measures remains appropriate for our next phase of business performance.
Vesting schedule The same vesting schedule applies to each metric:
rTSRSALES/
SQM ROFEEntry 11.7% 11.7% 11.7%Target 16.7% 16.7% 16.7%Stretch 33.3% 33.3% 33.3%
Different vesting schedule to rTSR vs sales per trading SQM and ROFE:
rTSRSALES/
SQM ROFEEntry 16.7% 6.7% 6.7%Target N/A 20% 20%Stretch 33.3% 33.3% 33.3%
• Vesting schedule for rTSR aligned with standard market practice
• Retain different vesting scale for sales per trading SQM and ROFE measures to ensure these reflect the difficulty of these measures.
Term, allocation method and award vehicle
Three year performance/vesting period awarded at face value based on the five-day VWAP up to and including 1 July at the beginning of the performance period, as share rights.
No change. Aligned to market.
Disclosure of performance targets
The sales per trading SQM and ROFE LTI targets will be published following the end of the performance period.
No change. Targets are confidential due to commercial sensitivity.
Change of control
The Board has discretion to determine whether some or all of the unvested performance share rights held by Executive KMP (and/or any other LTI Plan participant) will vest, remain “on foot” or lapse, having regard to all relevant circumstances.
No change. The Board retains discretion to assess each case based on its unique set of circumstances.
OTHER
Hedging policy Individuals cannot hedge Woolworths equity that is unvested or subject to restrictions.
No change. Aligned to market.
Clawback The Board may determine that any unvested share rights will lapse or be forfeited in certain circumstances such as in the case of fraud, wilful misconduct or dishonesty.
No change. The Board retains discretion to assess each case based on its unique set of circumstances.
Minimum shareholding requirements
• CEO: Equal to 100% base salary over a three-year period
• Other Executive KMP: Equal to 50% base salary over a five-year period (effective from their appointment or the introduction of the policy, whichever is the later).
• CEO: Equal to 200% of TFR
• Other Executive KMP: Equal to 100% of TFR
• Compliance dates reset to three years for CEO and five years for other KMP from 1 July 2018.
To strengthen share ownership and alignment with value creation for shareholders.
2.3 Overview of FY18 remuneration framework and key changes for FY19 (continued)
1
4
5
PERFORM
AN
CEH
IGH
LIGH
TSFIN
AN
CIAL
REPORT
OTH
ER IN
FORM
ATION
49W
OO
LWO
RTHS G
ROU
P A
NN
UA
L REPORT 20
1848
2
BUSIN
ESS REV
IEW
3
DIRECTO
RS' REPO
RT
2
BUSIN
ESS REV
IEW
3
DIRECTO
RS' REPO
RT
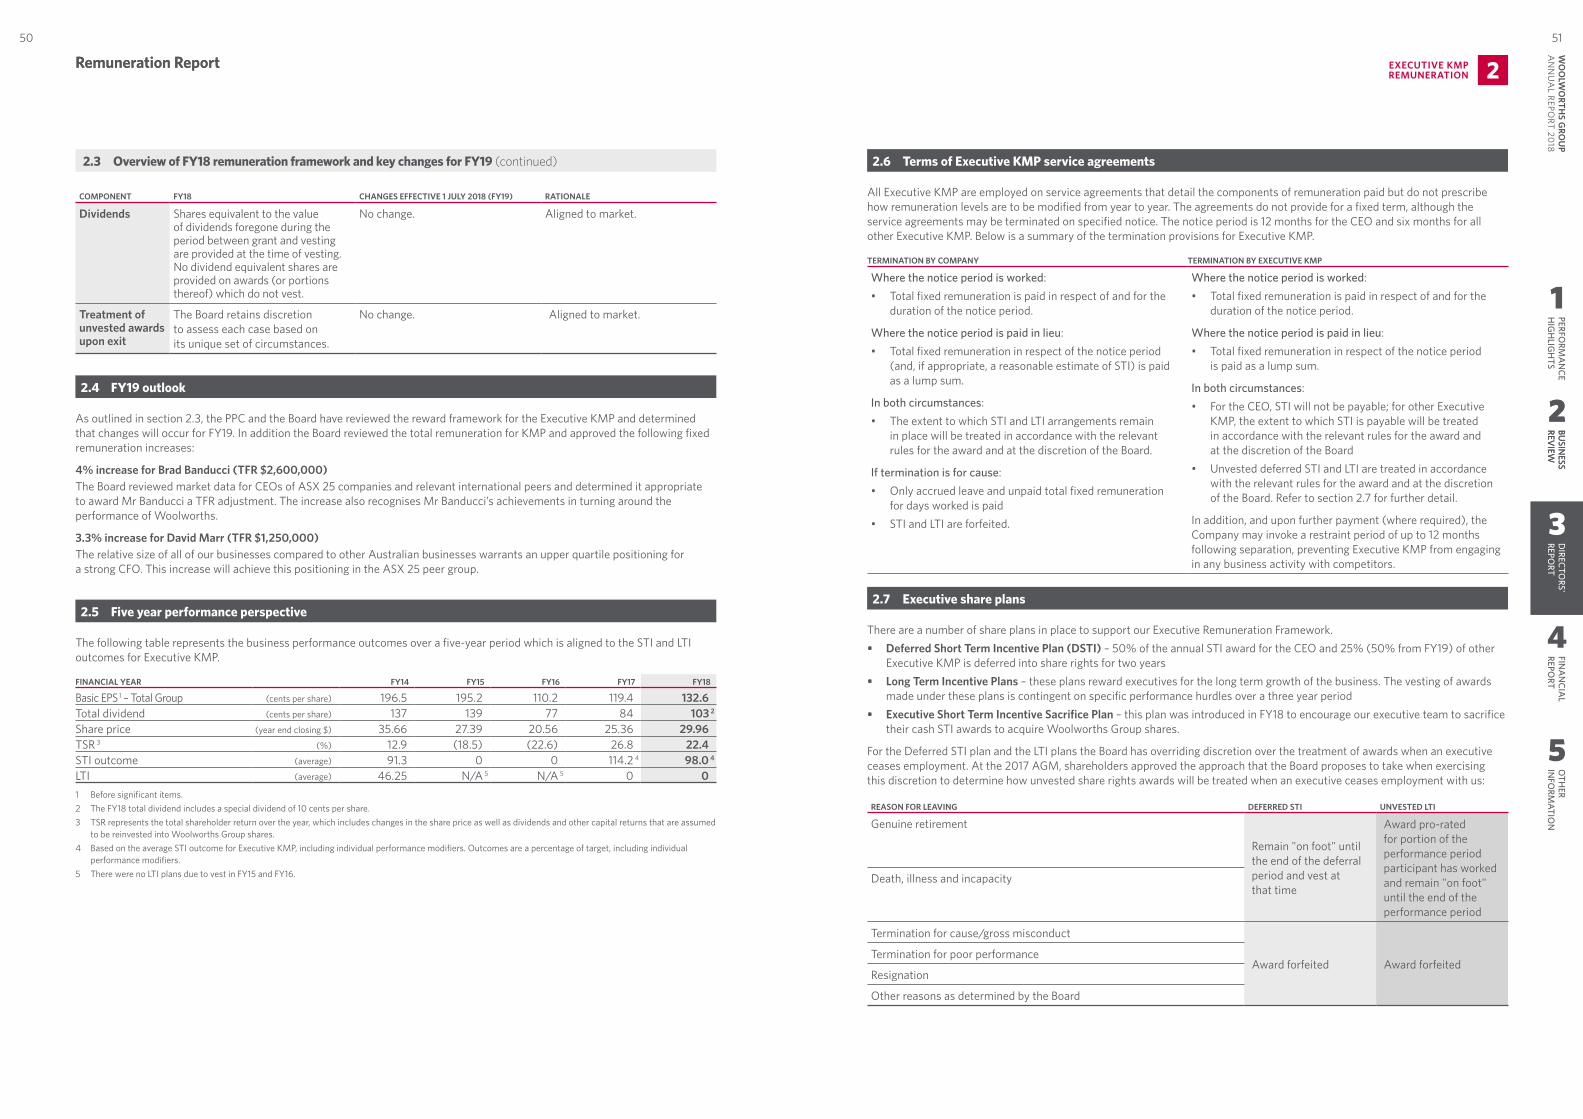
Remuneration Report EXECUTIVE KMP REMUNERATION 2Remuneration Report
COMPONENT FY18 CHANGES EFFECTIVE 1 JULY 2018 (FY19) RATIONALE
Dividends Shares equivalent to the value of dividends foregone during the period between grant and vesting are provided at the time of vesting. No dividend equivalent shares are provided on awards (or portions thereof) which do not vest.
No change. Aligned to market.
Treatment of unvested awards upon exit
The Board retains discretion to assess each case based on its unique set of circumstances.
No change. Aligned to market.
2.4 FY19 outlook
As outlined in section 2.3, the PPC and the Board have reviewed the reward framework for the Executive KMP and determined that changes will occur for FY19. In addition the Board reviewed the total remuneration for KMP and approved the following fixed remuneration increases:
4% increase for Brad Banducci (TFR $2,600,000)The Board reviewed market data for CEOs of ASX 25 companies and relevant international peers and determined it appropriate to award Mr Banducci a TFR adjustment. The increase also recognises Mr Banducci’s achievements in turning around the performance of Woolworths.
3.3% increase for David Marr (TFR $1,250,000)The relative size of all of our businesses compared to other Australian businesses warrants an upper quartile positioning for a strong CFO. This increase will achieve this positioning in the ASX 25 peer group.
2.5 Five year performance perspective
The following table represents the business performance outcomes over a five-year period which is aligned to the STI and LTI outcomes for Executive KMP.
FINANCIAL YEAR FY14 FY15 FY16 FY17 FY18
Basic EPS 1 – Total Group (cents per share) 196.5 195.2 110.2 119.4 132.6Total dividend (cents per share) 137 139 77 84 103 2
Share price (year end closing $) 35.66 27.39 20.56 25.36 29.96TSR 3 (%) 12.9 (18.5) (22.6) 26.8 22.4STI outcome (average) 91.3 0 0 114.2 4 98.0 4
LTI (average) 46.25 N/A 5 N/A 5 0 01 Before significant items.2 The FY18 total dividend includes a special dividend of 10 cents per share.3 TSR represents the total shareholder return over the year, which includes changes in the share price as well as dividends and other capital returns that are assumed
to be reinvested into Woolworths Group shares.4 Based on the average STI outcome for Executive KMP, including individual performance modifiers. Outcomes are a percentage of target, including individual
performance modifiers. 5 There were no LTI plans due to vest in FY15 and FY16.
2.6 Terms of Executive KMP service agreements
All Executive KMP are employed on service agreements that detail the components of remuneration paid but do not prescribe how remuneration levels are to be modified from year to year. The agreements do not provide for a fixed term, although the service agreements may be terminated on specified notice. The notice period is 12 months for the CEO and six months for all other Executive KMP. Below is a summary of the termination provisions for Executive KMP.
TERMINATION BY COMPANY TERMINATION BY EXECUTIVE KMP
Where the notice period is worked:• Total fixed remuneration is paid in respect of and for the
duration of the notice period.
Where the notice period is paid in lieu:• Total fixed remuneration in respect of the notice period
(and, if appropriate, a reasonable estimate of STI) is paid as a lump sum.
In both circumstances:• The extent to which STI and LTI arrangements remain
in place will be treated in accordance with the relevant rules for the award and at the discretion of the Board.
If termination is for cause:• Only accrued leave and unpaid total fixed remuneration
for days worked is paid• STI and LTI are forfeited.
Where the notice period is worked:• Total fixed remuneration is paid in respect of and for the
duration of the notice period.
Where the notice period is paid in lieu:• Total fixed remuneration in respect of the notice period
is paid as a lump sum.
In both circumstances:• For the CEO, STI will not be payable; for other Executive
KMP, the extent to which STI is payable will be treated in accordance with the relevant rules for the award and at the discretion of the Board
• Unvested deferred STI and LTI are treated in accordance with the relevant rules for the award and at the discretion of the Board. Refer to section 2.7 for further detail.
In addition, and upon further payment (where required), the Company may invoke a restraint period of up to 12 months following separation, preventing Executive KMP from engaging in any business activity with competitors.
2.7 Executive share plans
There are a number of share plans in place to support our Executive Remuneration Framework.• Deferred Short Term Incentive Plan (DSTI) – 50% of the annual STI award for the CEO and 25% (50% from FY19) of other
Executive KMP is deferred into share rights for two years• Long Term Incentive Plans – these plans reward executives for the long term growth of the business. The vesting of awards
made under these plans is contingent on specific performance hurdles over a three year period• Executive Short Term Incentive Sacrifice Plan – this plan was introduced in FY18 to encourage our executive team to sacrifice
their cash STI awards to acquire Woolworths Group shares.
For the Deferred STI plan and the LTI plans the Board has overriding discretion over the treatment of awards when an executive ceases employment. At the 2017 AGM, shareholders approved the approach that the Board proposes to take when exercising this discretion to determine how unvested share rights awards will be treated when an executive ceases employment with us:
REASON FOR LEAVING DEFERRED STI UNVESTED LTI
Genuine retirement
Remain "on foot" until the end of the deferral period and vest at that time
Award pro-rated for portion of the performance period participant has worked and remain "on foot" until the end of the performance period
Death, illness and incapacity
Termination for cause/gross misconduct
Award forfeited Award forfeitedTermination for poor performance
Resignation
Other reasons as determined by the Board
2.3 Overview of FY18 remuneration framework and key changes for FY19 (continued)
1
4
5
PERFORM
AN
CEH
IGH
LIGH
TSFIN
AN
CIAL
REPORT
OTH
ER IN
FORM
ATION
51W
OO
LWO
RTHS G
ROU
P A
NN
UA
L REPORT 20
1850
2
BUSIN
ESS REV
IEW
3
DIRECTO
RS' REPO
RT
2
BUSIN
ESS REV
IEW
3
DIRECTO
RS' REPO
RT
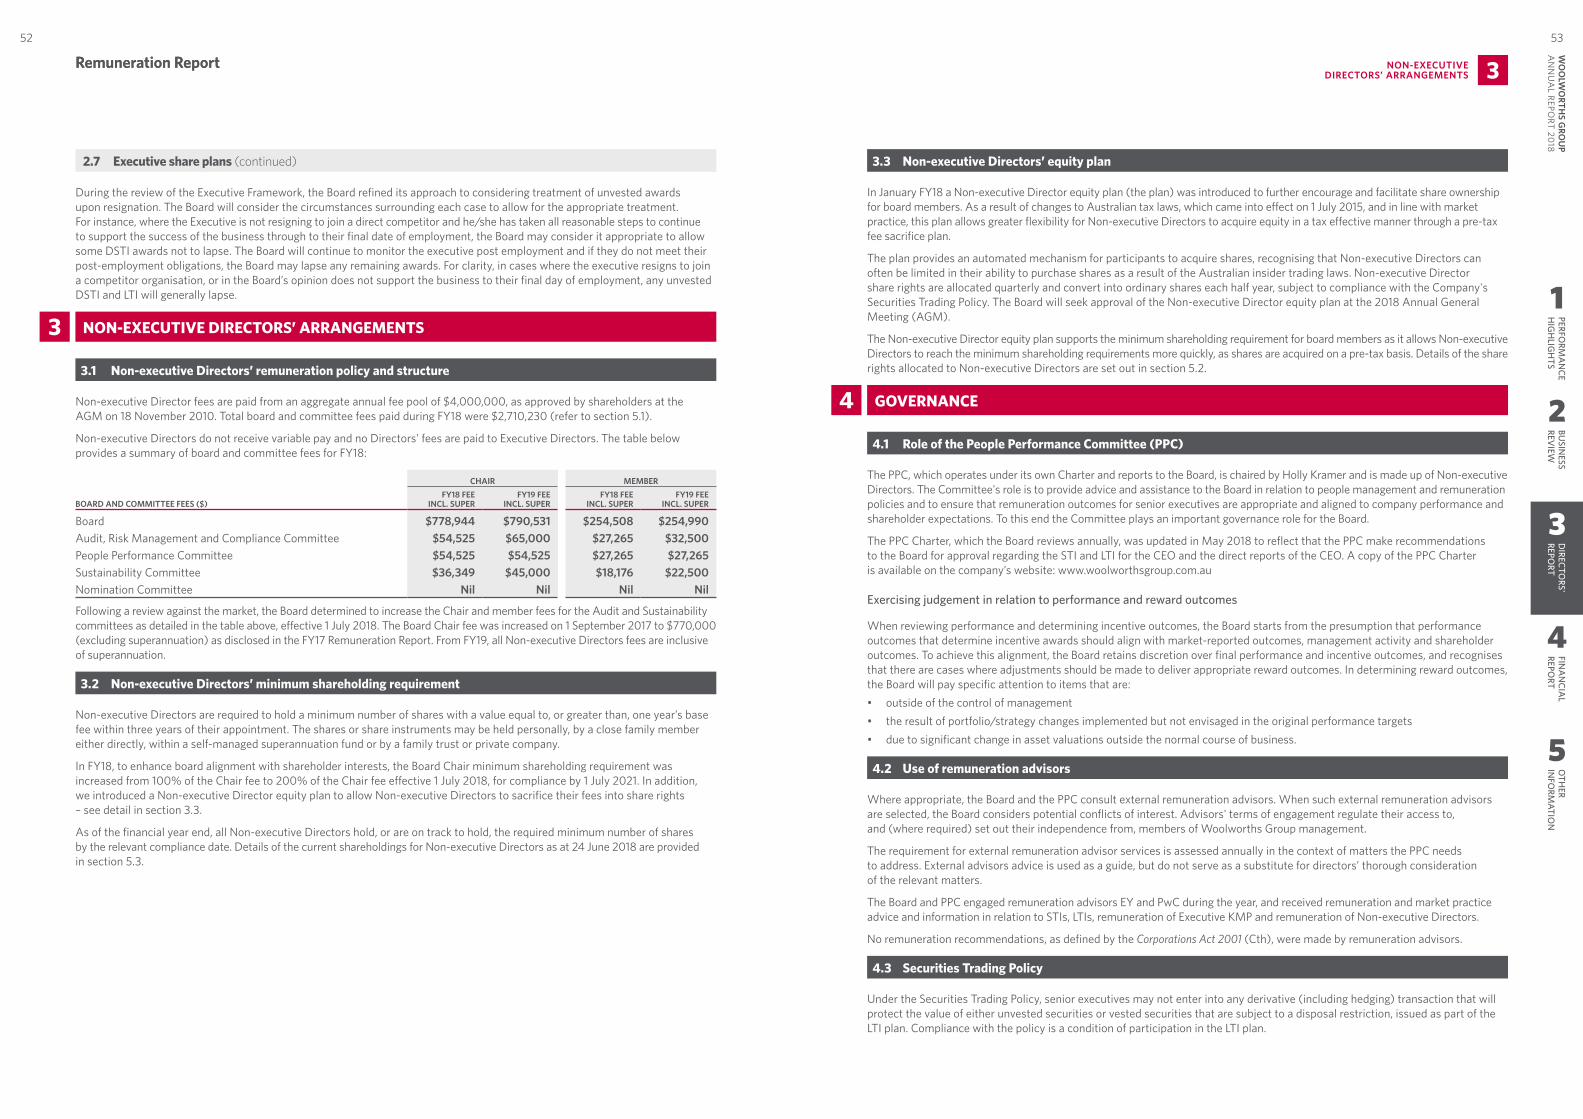
Remuneration Report 3NON-EXECUTIVE DIRECTORS’ ARRANGEMENTS
Remuneration Report
During the review of the Executive Framework, the Board refined its approach to considering treatment of unvested awards upon resignation. The Board will consider the circumstances surrounding each case to allow for the appropriate treatment. For instance, where the Executive is not resigning to join a direct competitor and he/she has taken all reasonable steps to continue to support the success of the business through to their final date of employment, the Board may consider it appropriate to allow some DSTI awards not to lapse. The Board will continue to monitor the executive post employment and if they do not meet their post-employment obligations, the Board may lapse any remaining awards. For clarity, in cases where the executive resigns to join a competitor organisation, or in the Board’s opinion does not support the business to their final day of employment, any unvested DSTI and LTI will generally lapse.
3 NON-EXECUTIVE DIRECTORS’ ARRANGEMENTS
3.1 Non-executive Directors’ remuneration policy and structure
Non-executive Director fees are paid from an aggregate annual fee pool of $4,000,000, as approved by shareholders at the AGM on 18 November 2010. Total board and committee fees paid during FY18 were $2,710,230 (refer to section 5.1).
Non-executive Directors do not receive variable pay and no Directors’ fees are paid to Executive Directors. The table below provides a summary of board and committee fees for FY18:
CHAIR MEMBER
BOARD AND COMMITTEE FEES ($)FY18 FEE
INCL. SUPERFY19 FEE
INCL. SUPERFY18 FEE
INCL. SUPERFY19 FEE
INCL. SUPER
Board $778,944 $790,531 $254,508 $254,990Audit, Risk Management and Compliance Committee $54,525 $65,000 $27,265 $32,500People Performance Committee $54,525 $54,525 $27,265 $27,265Sustainability Committee $36,349 $45,000 $18,176 $22,500Nomination Committee Nil Nil Nil Nil
Following a review against the market, the Board determined to increase the Chair and member fees for the Audit and Sustainability committees as detailed in the table above, effective 1 July 2018. The Board Chair fee was increased on 1 September 2017 to $770,000 (excluding superannuation) as disclosed in the FY17 Remuneration Report. From FY19, all Non-executive Directors fees are inclusive of superannuation.
3.2 Non-executive Directors’ minimum shareholding requirement
Non-executive Directors are required to hold a minimum number of shares with a value equal to, or greater than, one year’s base fee within three years of their appointment. The shares or share instruments may be held personally, by a close family member either directly, within a self-managed superannuation fund or by a family trust or private company.
In FY18, to enhance board alignment with shareholder interests, the Board Chair minimum shareholding requirement was increased from 100% of the Chair fee to 200% of the Chair fee effective 1 July 2018, for compliance by 1 July 2021. In addition, we introduced a Non-executive Director equity plan to allow Non-executive Directors to sacrifice their fees into share rights – see detail in section 3.3.
As of the financial year end, all Non-executive Directors hold, or are on track to hold, the required minimum number of shares by the relevant compliance date. Details of the current shareholdings for Non-executive Directors as at 24 June 2018 are provided in section 5.3.
3.3 Non-executive Directors’ equity plan
In January FY18 a Non-executive Director equity plan (the plan) was introduced to further encourage and facilitate share ownership for board members. As a result of changes to Australian tax laws, which came into effect on 1 July 2015, and in line with market practice, this plan allows greater flexibility for Non-executive Directors to acquire equity in a tax effective manner through a pre-tax fee sacrifice plan.
The plan provides an automated mechanism for participants to acquire shares, recognising that Non-executive Directors can often be limited in their ability to purchase shares as a result of the Australian insider trading laws. Non-executive Director share rights are allocated quarterly and convert into ordinary shares each half year, subject to compliance with the Company's Securities Trading Policy. The Board will seek approval of the Non-executive Director equity plan at the 2018 Annual General Meeting (AGM).
The Non-executive Director equity plan supports the minimum shareholding requirement for board members as it allows Non-executive Directors to reach the minimum shareholding requirements more quickly, as shares are acquired on a pre-tax basis. Details of the share rights allocated to Non-executive Directors are set out in section 5.2.
4 GOVERNANCE
4.1 Role of the People Performance Committee (PPC)
The PPC, which operates under its own Charter and reports to the Board, is chaired by Holly Kramer and is made up of Non-executive Directors. The Committee's role is to provide advice and assistance to the Board in relation to people management and remuneration policies and to ensure that remuneration outcomes for senior executives are appropriate and aligned to company performance and shareholder expectations. To this end the Committee plays an important governance role for the Board.
The PPC Charter, which the Board reviews annually, was updated in May 2018 to reflect that the PPC make recommendations to the Board for approval regarding the STI and LTI for the CEO and the direct reports of the CEO. A copy of the PPC Charter is available on the company’s website: www.woolworthsgroup.com.au
Exercising judgement in relation to performance and reward outcomes
When reviewing performance and determining incentive outcomes, the Board starts from the presumption that performance outcomes that determine incentive awards should align with market-reported outcomes, management activity and shareholder outcomes. To achieve this alignment, the Board retains discretion over final performance and incentive outcomes, and recognises that there are cases where adjustments should be made to deliver appropriate reward outcomes. In determining reward outcomes, the Board will pay specific attention to items that are:• outside of the control of management• the result of portfolio/strategy changes implemented but not envisaged in the original performance targets• due to significant change in asset valuations outside the normal course of business.
4.2 Use of remuneration advisors
Where appropriate, the Board and the PPC consult external remuneration advisors. When such external remuneration advisors are selected, the Board considers potential conflicts of interest. Advisors' terms of engagement regulate their access to, and (where required) set out their independence from, members of Woolworths Group management.
The requirement for external remuneration advisor services is assessed annually in the context of matters the PPC needs to address. External advisors advice is used as a guide, but do not serve as a substitute for directors’ thorough consideration of the relevant matters.
The Board and PPC engaged remuneration advisors EY and PwC during the year, and received remuneration and market practice advice and information in relation to STIs, LTIs, remuneration of Executive KMP and remuneration of Non-executive Directors.
No remuneration recommendations, as defined by the Corporations Act 2001 (Cth), were made by remuneration advisors.
4.3 Securities Trading Policy
Under the Securities Trading Policy, senior executives may not enter into any derivative (including hedging) transaction that will protect the value of either unvested securities or vested securities that are subject to a disposal restriction, issued as part of the LTI plan. Compliance with the policy is a condition of participation in the LTI plan.
2.7 Executive share plans (continued)
1
4
5
PERFORM
AN
CEH
IGH
LIGH
TSFIN
AN
CIAL
REPORT
OTH
ER IN
FORM
ATION
53W
OO
LWO
RTHS G
ROU
P A
NN
UA
L REPORT 20
1852
2
BUSIN
ESS REV
IEW
3
DIRECTO
RS' REPO
RT
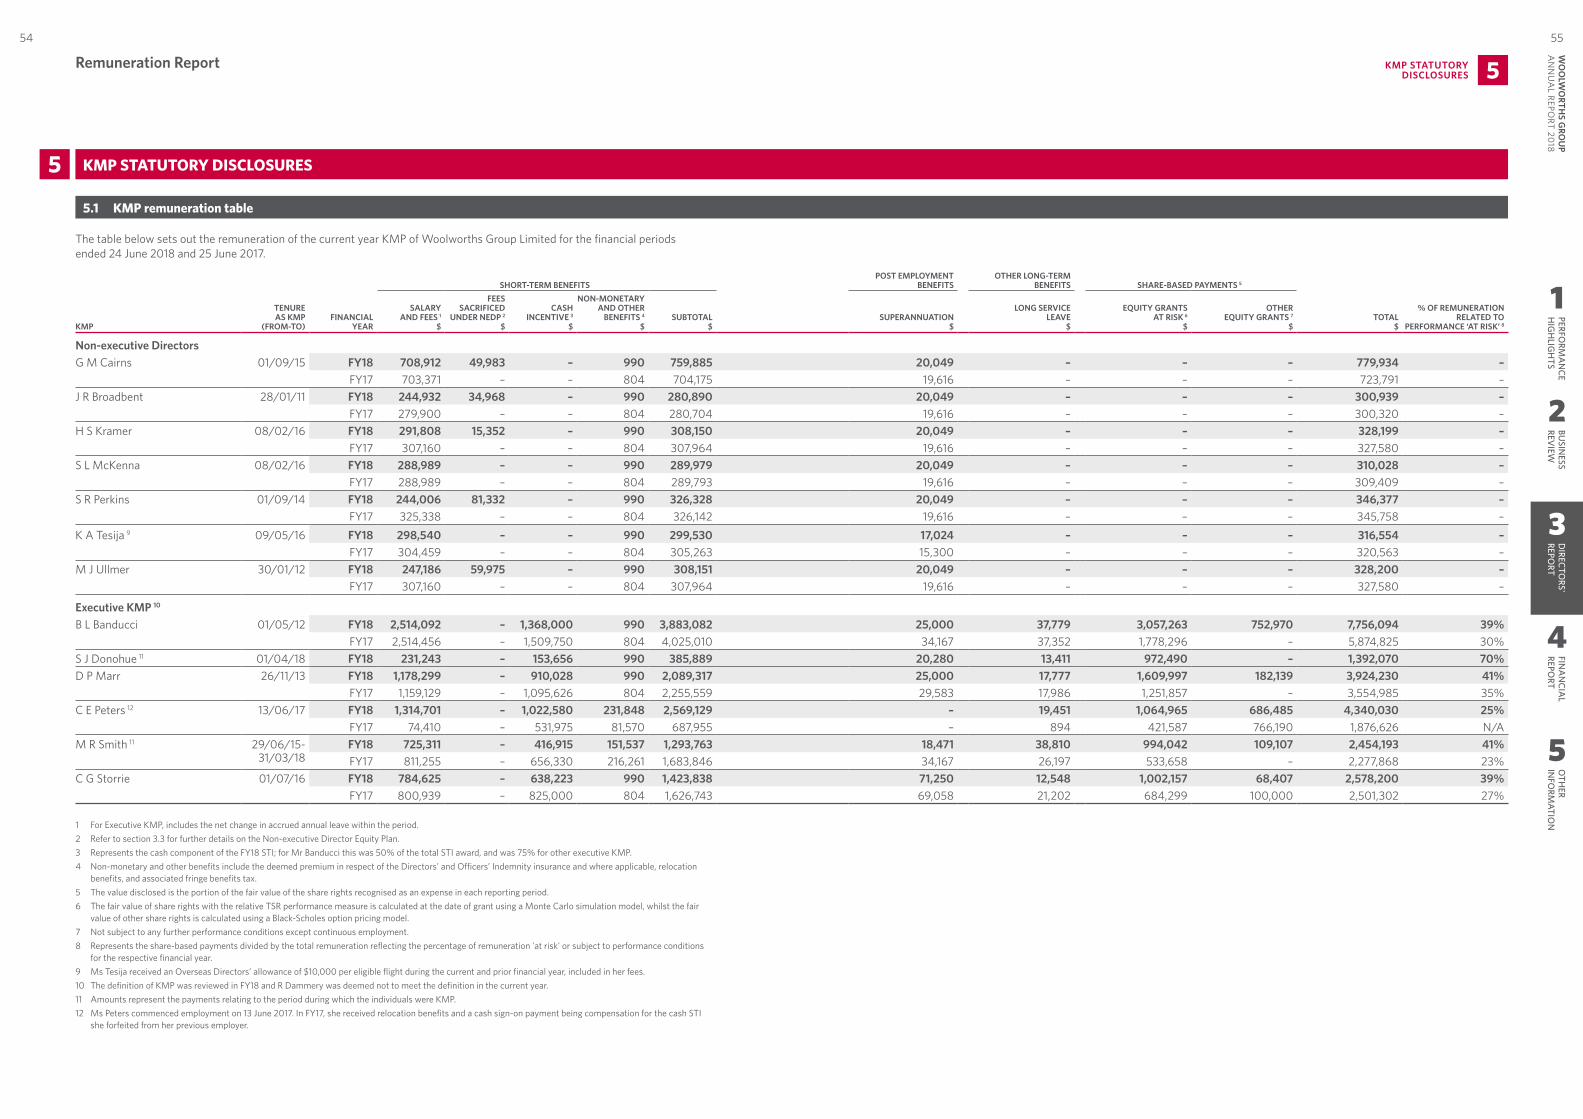
5KMP STATUTORY DISCLOSURES
Remuneration Report
5 KMP STATUTORY DISCLOSURES
5.1 KMP remuneration table
The table below sets out the remuneration of the current year KMP of Woolworths Group Limited for the financial periods ended 24 June 2018 and 25 June 2017.
SHORT-TERM BENEFITSPOST EMPLOYMENT
BENEFITSOTHER LONG-TERM
BENEFITS SHARE-BASED PAYMENTS 5
KMP
TENURE AS KMP
(FROM-TO)FINANCIAL
YEAR
SALARY AND FEES 1
$
FEES SACRIFICED
UNDER NEDP 2 $
CASH INCENTIVE 3
$
NON-MONETARY AND OTHER
BENEFITS 4 $
SUBTOTAL $
SUPERANNUATION $
LONG SERVICE LEAVE
$
EQUITY GRANTS AT RISK 6
$
OTHER EQUITY GRANTS 7
$ TOTAL
$
% OF REMUNERATION RELATED TO
PERFORMANCE ‘AT RISK’ 8
Non-executive DirectorsG M Cairns 01/09/15 FY18 708,912 49,983 – 990 759,885 20,049 – – – 779,934 –
FY17 703,371 – – 804 704,175 19,616 – – – 723,791 – J R Broadbent 28/01/11 FY18 244,932 34,968 – 990 280,890 20,049 – – – 300,939 –
FY17 279,900 – – 804 280,704 19,616 – – – 300,320 – H S Kramer 08/02/16 FY18 291,808 15,352 – 990 308,150 20,049 – – – 328,199 –
FY17 307,160 – – 804 307,964 19,616 – – – 327,580 – S L McKenna 08/02/16 FY18 288,989 – – 990 289,979 20,049 – – – 310,028 –
FY17 288,989 – – 804 289,793 19,616 – – – 309,409 – S R Perkins 01/09/14 FY18 244,006 81,332 – 990 326,328 20,049 – – – 346,377 –
FY17 325,338 – – 804 326,142 19,616 – – – 345,758 – K A Tesija 9 09/05/16 FY18 298,540 – – 990 299,530 17,024 – – – 316,554 –
FY17 304,459 – – 804 305,263 15,300 – – – 320,563 – M J Ullmer 30/01/12 FY18 247,186 59,975 – 990 308,151 20,049 – – – 328,200 –
FY17 307,160 – – 804 307,964 19,616 – – – 327,580 –
Executive KMP 10
B L Banducci 01/05/12 FY18 2,514,092 – 1,368,000 990 3,883,082 25,000 37,779 3,057,263 752,970 7,756,094 39%FY17 2,514,456 – 1,509,750 804 4,025,010 34,167 37,352 1,778,296 – 5,874,825 30%
S J Donohue 11 01/04/18 FY18 231,243 – 153,656 990 385,889 20,280 13,411 972,490 – 1,392,070 70%D P Marr 26/11/13 FY18 1,178,299 – 910,028 990 2,089,317 25,000 17,777 1,609,997 182,139 3,924,230 41%
FY17 1,159,129 – 1,095,626 804 2,255,559 29,583 17,986 1,251,857 – 3,554,985 35%C E Peters 12 13/06/17 FY18 1,314,701 – 1,022,580 231,848 2,569,129 – 19,451 1,064,965 686,485 4,340,030 25%
FY17 74,410 – 531,975 81,570 687,955 – 894 421,587 766,190 1,876,626 N/AM R Smith 11 29/06/15-
31/03/18FY18 725,311 – 416,915 151,537 1,293,763 18,471 38,810 994,042 109,107 2,454,193 41%FY17 811,255 – 656,330 216,261 1,683,846 34,167 26,197 533,658 – 2,277,868 23%
C G Storrie 01/07/16 FY18 784,625 – 638,223 990 1,423,838 71,250 12,548 1,002,157 68,407 2,578,200 39%FY17 800,939 – 825,000 804 1,626,743 69,058 21,202 684,299 100,000 2,501,302 27%
1 For Executive KMP, includes the net change in accrued annual leave within the period.2 Refer to section 3.3 for further details on the Non-executive Director Equity Plan.3 Represents the cash component of the FY18 STI; for Mr Banducci this was 50% of the total STI award, and was 75% for other executive KMP. 4 Non-monetary and other benefits include the deemed premium in respect of the Directors’ and Officers’ Indemnity insurance and where applicable, relocation
benefits, and associated fringe benefits tax.5 The value disclosed is the portion of the fair value of the share rights recognised as an expense in each reporting period.6 The fair value of share rights with the relative TSR performance measure is calculated at the date of grant using a Monte Carlo simulation model, whilst the fair
value of other share rights is calculated using a Black-Scholes option pricing model. 7 Not subject to any further performance conditions except continuous employment.8 Represents the share-based payments divided by the total remuneration reflecting the percentage of remuneration 'at risk' or subject to performance conditions
for the respective financial year.9 Ms Tesija received an Overseas Directors’ allowance of $10,000 per eligible flight during the current and prior financial year, included in her fees.10 The definition of KMP was reviewed in FY18 and R Dammery was deemed not to meet the definition in the current year.11 Amounts represent the payments relating to the period during which the individuals were KMP.12 Ms Peters commenced employment on 13 June 2017. In FY17, she received relocation benefits and a cash sign-on payment being compensation for the cash STI
she forfeited from her previous employer.
1
2
3
4
5
PERFORM
AN
CEH
IGH
LIGH
TSBU
SINESS
REVIEW
DIRECTO
RS' REPO
RTFIN
AN
CIAL
REPORT
OTH
ER IN
FORM
ATION
55W
OO
LWO
RTHS G
ROU
P A
NN
UA
L REPORT 20
1854

Remuneration Report 5KMP STATUTORY DISCLOSURES
5.3 KMP share movements
The table below summarises the movements during the year of interests in shares of Woolworths Group Limited held by current KMP.
SHAREHOLDING AT 25 JUNE 2017
NO.
SHARES ISSUED UNDER DRP
NO.
SHARES RECEIVED ON VESTING OF
SHARE RIGHTS NO.
SHARES PURCHASED
NO.
SHAREHOLDING AT 24 JUNE 2018
NO.
Non-executive DirectorsG M Cairns 20,723 851 – 5,486 27,060 J R Broadbent 65,138 – – – 65,138 H S Kramer 6,442 – – – 6,442 S L McKenna 10,428 106 – – 10,534 S R Perkins 14,197 378 – – 14,575 K A Tesija 4,980 – – – 4,980 M J Ullmer 20,000 – – – 20,000
Executive KMPB L Banducci 53,638 – – – 53,638 S J Donohue 1 6,246 – 14,011 – 20,257 D P Marr 36,946 1,980 16,912 – 55,838 C E Peters 1,997 – 19,376 2 – 21,373 M R Smith 29,614 – – – 29,614 C G Storrie 9,936 – 9,855 – 19,791
1 Mr Donohue held shares prior to his appointment effective 1 April 2018.2 Includes share rights for dividends earned during the vesting period.
5.2 KMP share right movementsThe table below summarises the share rights granted as part of the Non-executive Director Equity Plan introduced in January 2018 (see Section 3.3). No share rights were vested or lapsed as at 24 June 2018.
SHARE RIGHTS GRANTED UNDER THE NON-EXECUTIVE DIRECTORS
EQUITY PLANNON-EXECUTIVE DIRECTORS NO. $ 1
G M Cairns 1,781 49,983 J R Broadbent 1,246 34,968 H S Kramer 547 15,352 S L McKenna – – S R Perkins 2,898 81,332 K A Tesija – – M J Ullmer 2,137 59,975 Total 8,609 241,610 1 Amount represents Non-executive Director fees sacrificed.
The table below summarises the movements during the year in holdings of share right interests in Woolworths Group Limited for current Executive KMP. A share right entitles the holder to one ordinary fully paid Woolworths Group Limited share, subject to applicable performance and vesting conditions.
OPENING BALANCE
NO.
SHARE RIGHTS GRANTED SHARE RIGHTS VESTED 2 SHARE RIGHTS LAPSED 3
NO.
CLOSING BALANCE
NO.EXECUTIVE KMP NO. $ 1 NO. $
B L Banducci FY18 342,570 254,242 5,472,037 – – (23,731) 573,081 FY17 122,680 241,220 4,769,723 (21,330) 461,181 – 342,570
S J Donohue 4 FY18 108,352 66,257 1,340,379 (14,011) 359,727 (3,444) 157,154 D P Marr FY18 265,953 108,738 2,275,506 (16,912) 433,023 (36,638) 321,141
FY17 170,020 116,702 2,375,664 (16,219) 336,187 (4,550) 265,953 C E Peters FY18 143,590 101,544 2,054,235 (19,133) 517,060 – 226,001
FY17 – 145,587 3,140,868 (1,997) 51,792 – 143,590 M R Smith FY18 98,334 79,078 1,426,903 – – (8,773) 168,639
FY17 28,741 71,593 1,457,395 – – (2,000) 98,334 C G Storrie FY18 91,700 66,257 1,340,379 (9,855) 269,876 – 148,102
FY17 19,180 81,845 1,666,091 (9,325) 243,878 – 91,700 Total FY18 1,050,499 676,116 13,909,439 (59,911) 1,579,687 (72,586) 1,594,118
FY17 340,621 656,947 13,409,741 (48,871) 1,093,038 (6,550) 942,147
No share rights held by Executive KMP were forfeited during the year.
1 Share rights granted is the total fair value of share rights granted during the year determined by an independent actuary. This will be recognised in employee benefits expense over the vesting period of the share right, in accordance with Australian Accounting Standards.
2 The value of share rights vested during the year is calculated based on the VWAP of Woolworths Group Limited shares traded in the five days prior to and including the date of vesting.
3 The number of share rights which lapsed as a result of failure to meet performance hurdles relates to the FY13 LTI plan and FY15 LTI plan.4 Mr Donohue held share rights prior to his appointment effective 1 April 2018.
1
2
3
4
5
PERFORM
AN
CEH
IGH
LIGH
TSBU
SINESS
REVIEW
DIRECTO
RS' REPO
RTFIN
AN
CIAL
REPORT
OTH
ER IN
FORM
ATION
57W
OO
LWO
RTHS G
ROU
P A
NN
UA
L REPORT 20
1856
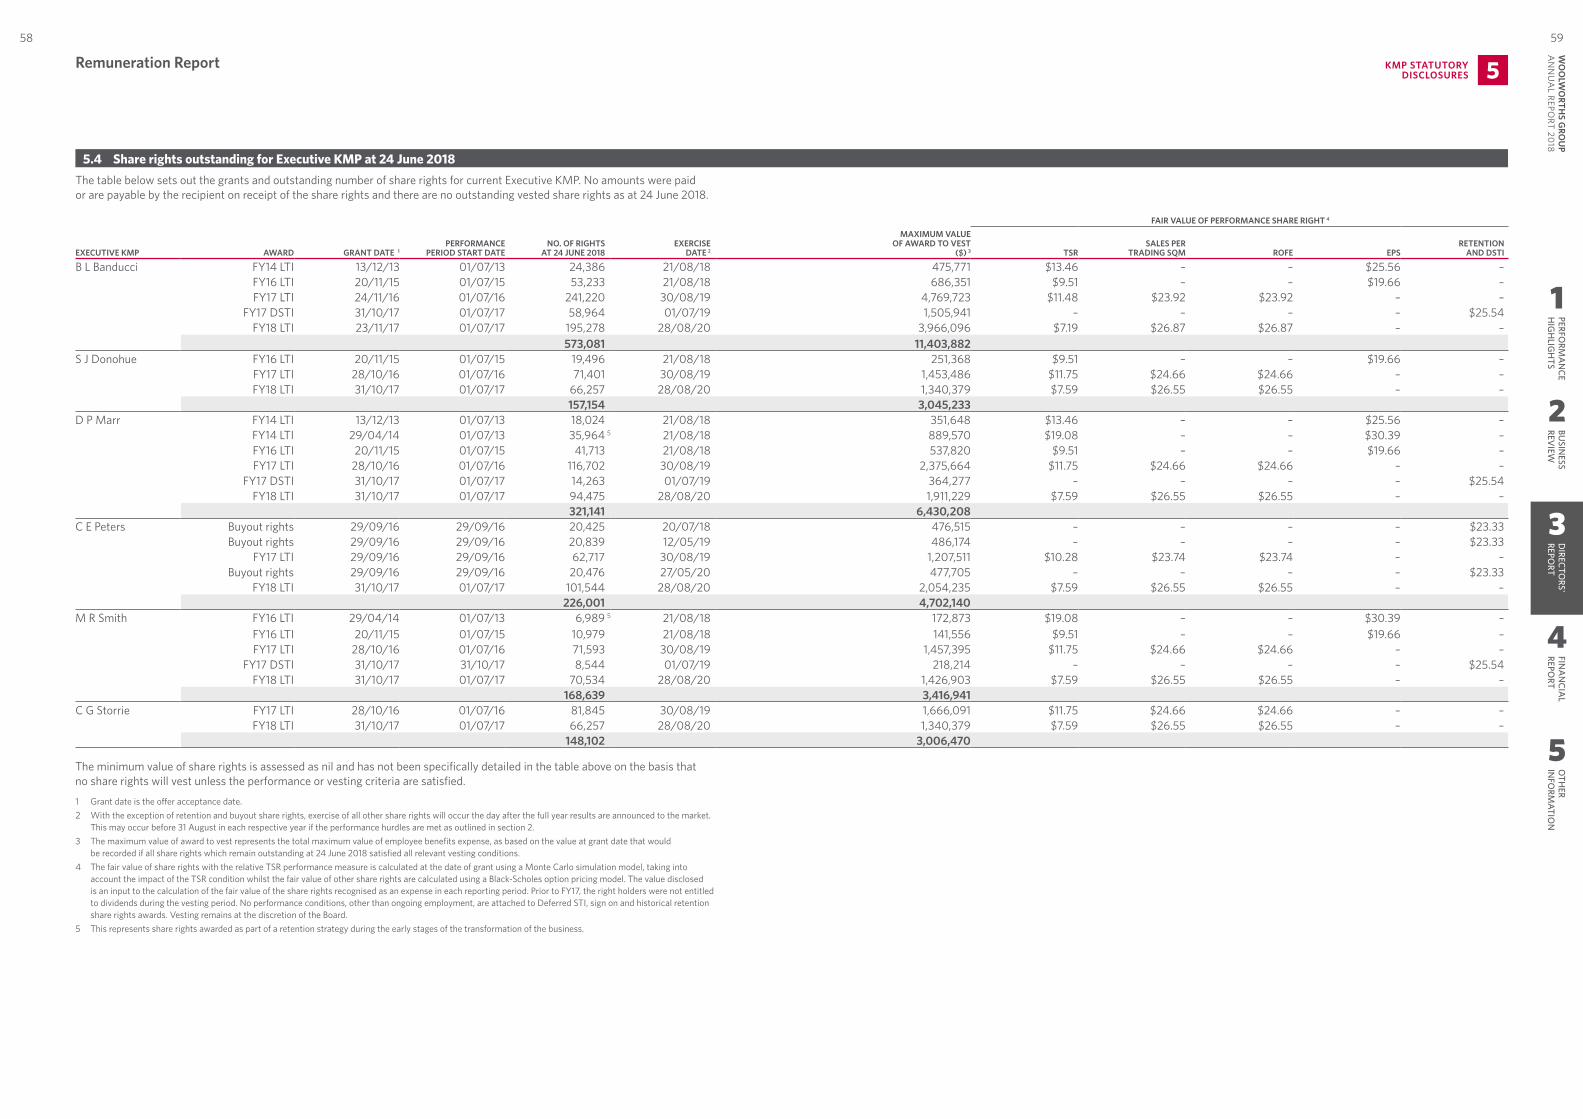
Remuneration Report 5KMP STATUTORY DISCLOSURES
5.4 Share rights outstanding for Executive KMP at 24 June 2018The table below sets out the grants and outstanding number of share rights for current Executive KMP. No amounts were paid or are payable by the recipient on receipt of the share rights and there are no outstanding vested share rights as at 24 June 2018.
FAIR VALUE OF PERFORMANCE SHARE RIGHT 4
EXECUTIVE KMP AWARD GRANT DATE 1PERFORMANCE
PERIOD START DATE NO. OF RIGHTS
AT 24 JUNE 2018 EXERCISE
DATE 2
MAXIMUM VALUE OF AWARD TO VEST
($) 3 TSR SALES PER
TRADING SQM ROFE EPS RETENTION
AND DSTI
B L Banducci FY14 LTI 13/12/13 01/07/13 24,386 21/08/18 475,771 $13.46 – – $25.56 – FY16 LTI 20/11/15 01/07/15 53,233 21/08/18 686,351 $9.51 – – $19.66 – FY17 LTI 24/11/16 01/07/16 241,220 30/08/19 4,769,723 $11.48 $23.92 $23.92 – –
FY17 DSTI 31/10/17 01/07/17 58,964 01/07/19 1,505,941 – – – – $25.54 FY18 LTI 23/11/17 01/07/17 195,278 28/08/20 3,966,096 $7.19 $26.87 $26.87 – –
573,081 11,403,882 S J Donohue FY16 LTI 20/11/15 01/07/15 19,496 21/08/18 251,368 $9.51 – – $19.66 –
FY17 LTI 28/10/16 01/07/16 71,401 30/08/19 1,453,486 $11.75 $24.66 $24.66 – – FY18 LTI 31/10/17 01/07/17 66,257 28/08/20 1,340,379 $7.59 $26.55 $26.55 – –
157,154 3,045,233 D P Marr FY14 LTI 13/12/13 01/07/13 18,024 21/08/18 351,648 $13.46 – – $25.56 –
FY14 LTI 29/04/14 01/07/13 35,964 5 21/08/18 889,570 $19.08 – – $30.39 – FY16 LTI 20/11/15 01/07/15 41,713 21/08/18 537,820 $9.51 – – $19.66 – FY17 LTI 28/10/16 01/07/16 116,702 30/08/19 2,375,664 $11.75 $24.66 $24.66 – –
FY17 DSTI 31/10/17 01/07/17 14,263 01/07/19 364,277 – – – – $25.54 FY18 LTI 31/10/17 01/07/17 94,475 28/08/20 1,911,229 $7.59 $26.55 $26.55 – –
321,141 6,430,208 C E Peters Buyout rights 29/09/16 29/09/16 20,425 20/07/18 476,515 – – – – $23.33
Buyout rights 29/09/16 29/09/16 20,839 12/05/19 486,174 – – – – $23.33 FY17 LTI 29/09/16 29/09/16 62,717 30/08/19 1,207,511 $10.28 $23.74 $23.74 – –
Buyout rights 29/09/16 29/09/16 20,476 27/05/20 477,705 – – – – $23.33 FY18 LTI 31/10/17 01/07/17 101,544 28/08/20 2,054,235 $7.59 $26.55 $26.55 – –
226,001 4,702,140 M R Smith FY16 LTI 29/04/14 01/07/13 6,989 5 21/08/18 172,873 $19.08 – – $30.39 –
FY16 LTI 20/11/15 01/07/15 10,979 21/08/18 141,556 $9.51 – – $19.66 – FY17 LTI 28/10/16 01/07/16 71,593 30/08/19 1,457,395 $11.75 $24.66 $24.66 – –
FY17 DSTI 31/10/17 31/10/17 8,544 01/07/19 218,214 – – – – $25.54 FY18 LTI 31/10/17 01/07/17 70,534 28/08/20 1,426,903 $7.59 $26.55 $26.55 – –
168,639 3,416,941 C G Storrie FY17 LTI 28/10/16 01/07/16 81,845 30/08/19 1,666,091 $11.75 $24.66 $24.66 – –
FY18 LTI 31/10/17 01/07/17 66,257 28/08/20 1,340,379 $7.59 $26.55 $26.55 – – 148,102 3,006,470
The minimum value of share rights is assessed as nil and has not been specifically detailed in the table above on the basis that no share rights will vest unless the performance or vesting criteria are satisfied.
1 Grant date is the offer acceptance date.2 With the exception of retention and buyout share rights, exercise of all other share rights will occur the day after the full year results are announced to the market.
This may occur before 31 August in each respective year if the performance hurdles are met as outlined in section 2. 3 The maximum value of award to vest represents the total maximum value of employee benefits expense, as based on the value at grant date that would
be recorded if all share rights which remain outstanding at 24 June 2018 satisfied all relevant vesting conditions.4 The fair value of share rights with the relative TSR performance measure is calculated at the date of grant using a Monte Carlo simulation model, taking into
account the impact of the TSR condition whilst the fair value of other share rights are calculated using a Black-Scholes option pricing model. The value disclosed is an input to the calculation of the fair value of the share rights recognised as an expense in each reporting period. Prior to FY17, the right holders were not entitled to dividends during the vesting period. No performance conditions, other than ongoing employment, are attached to Deferred STI, sign on and historical retention share rights awards. Vesting remains at the discretion of the Board.
5 This represents share rights awarded as part of a retention strategy during the early stages of the transformation of the business.
1
2
3
4
5
PERFORM
AN
CEH
IGH
LIGH
TSBU
SINESS
REVIEW
DIRECTO
RS' REPO
RTFIN
AN
CIAL
REPORT
OTH
ER IN
FORM
ATION
59W
OO
LWO
RTHS G
ROU
P A
NN
UA
L REPORT 20
1858
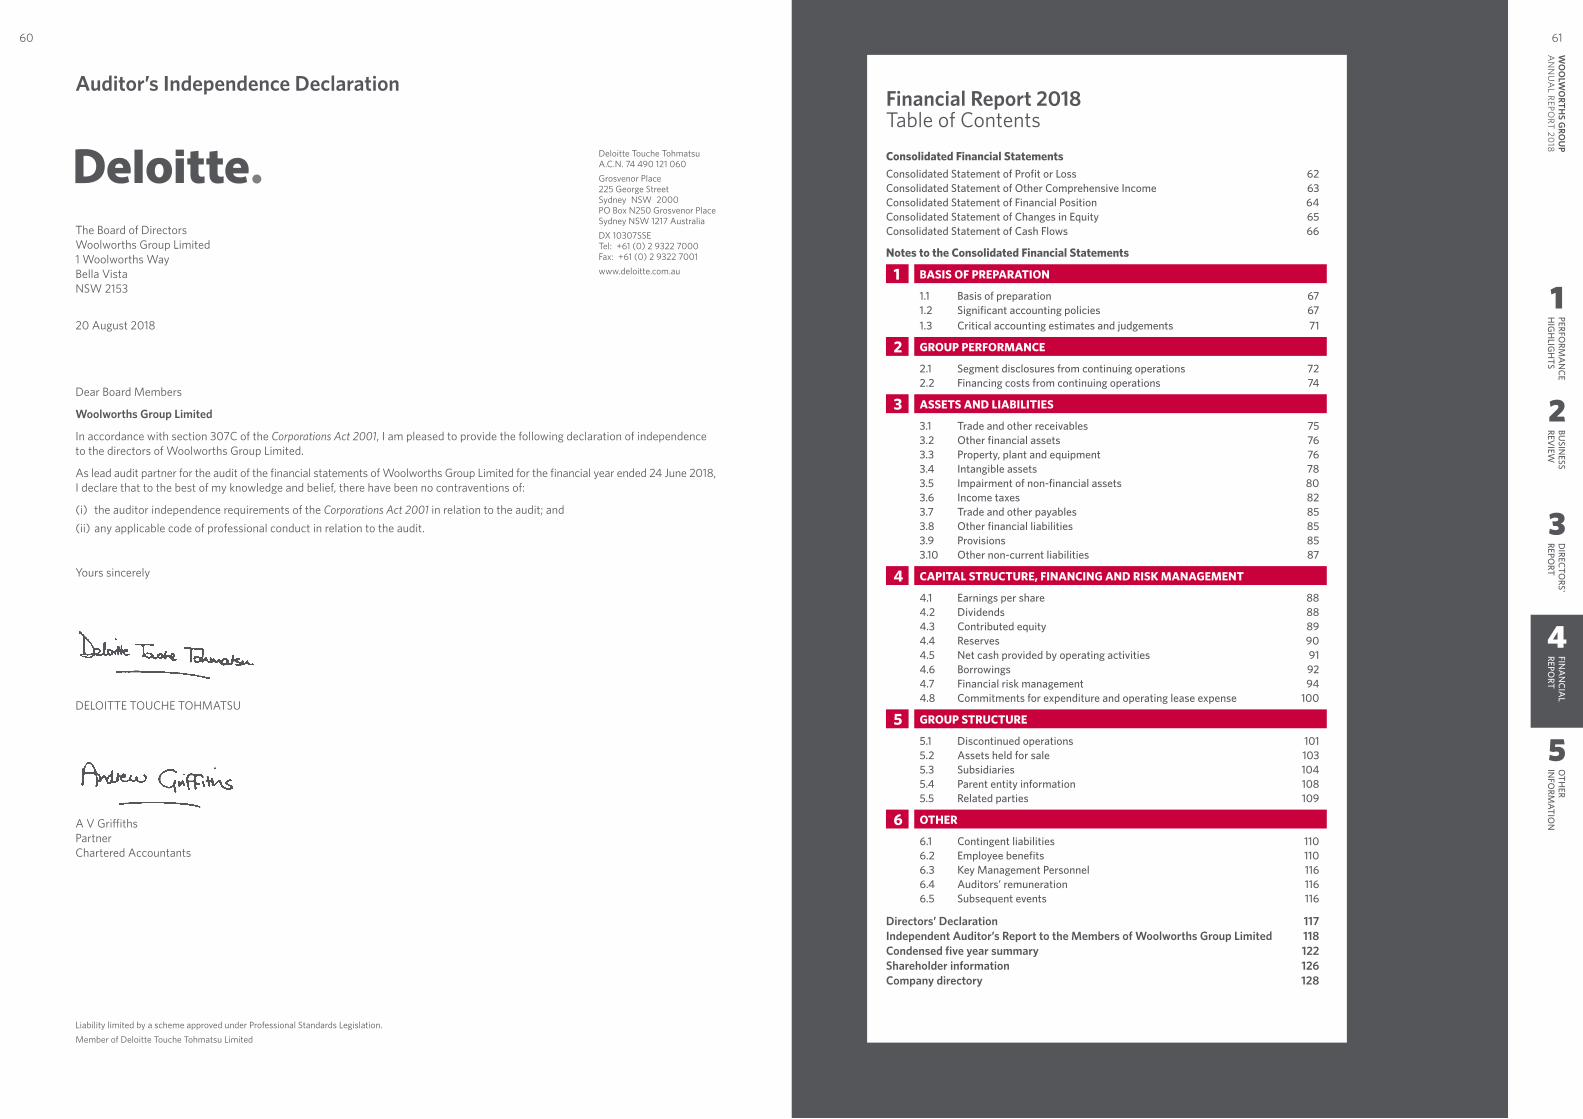
Auditor’s Independence Declaration
60
The Board of DirectorsWoolworths Group Limited1 Woolworths WayBella VistaNSW 2153
20 August 2018
Dear Board Members
Woolworths Group Limited
In accordance with section 307C of the Corporations Act 2001, I am pleased to provide the following declaration of independence to the directors of Woolworths Group Limited.
As lead audit partner for the audit of the financial statements of Woolworths Group Limited for the financial year ended 24 June 2018, I declare that to the best of my knowledge and belief, there have been no contraventions of:
(i) the auditor independence requirements of the Corporations Act 2001 in relation to the audit; and(ii) any applicable code of professional conduct in relation to the audit.
Yours sincerely
DELOITTE TOUCHE TOHMATSU
A V GriffithsPartnerChartered Accountants
Deloitte Touche Tohmatsu A.C.N. 74 490 121 060Grosvenor Place 225 George Street Sydney NSW 2000 PO Box N250 Grosvenor Place Sydney NSW 1217 AustraliaDX 10307SSE Tel: +61 (0) 2 9322 7000 Fax: +61 (0) 2 9322 7001www.deloitte.com.au
Liability limited by a scheme approved under Professional Standards Legislation.Member of Deloitte Touche Tohmatsu Limited
1
2
3
4
5
PERFORM
AN
CEH
IGH
LIGH
TSBU
SINESS
REVIEW
DIRECTO
RS' REPO
RTFIN
AN
CIAL
REPORT
OTH
ER IN
FORM
ATION
61W
OO
LWO
RTHS G
ROU
P A
NN
UA
L REPORT 20
18
Financial Report 2018 Table of ContentsConsolidated Financial StatementsConsolidated Statement of Profit or Loss 62Consolidated Statement of Other Comprehensive Income 63Consolidated Statement of Financial Position 64Consolidated Statement of Changes in Equity 65Consolidated Statement of Cash Flows 66
Notes to the Consolidated Financial Statements
1 BASIS OF PREPARATION
1.1 Basis of preparation 671.2 Significant accounting policies 671.3 Critical accounting estimates and judgements 71
2 GROUP PERFORMANCE
2.1 Segment disclosures from continuing operations 722.2 Financing costs from continuing operations 74
3 ASSETS AND LIABILITIES
3.1 Trade and other receivables 753.2 Other financial assets 763.3 Property, plant and equipment 763.4 Intangible assets 783.5 Impairment of non-financial assets 803.6 Income taxes 823.7 Trade and other payables 853.8 Other financial liabilities 853.9 Provisions 853.10 Other non-current liabilities 87
4 CAPITAL STRUCTURE, FINANCING AND RISK MANAGEMENT
4.1 Earnings per share 884.2 Dividends 884.3 Contributed equity 894.4 Reserves 904.5 Net cash provided by operating activities 914.6 Borrowings 924.7 Financial risk management 944.8 Commitments for expenditure and operating lease expense 100
5 GROUP STRUCTURE
5.1 Discontinued operations 1015.2 Assets held for sale 1035.3 Subsidiaries 1045.4 Parent entity information 1085.5 Related parties 109
6 OTHER
6.1 Contingent liabilities 1106.2 Employee benefits 1106.3 Key Management Personnel 1166.4 Auditors’ remuneration 1166.5 Subsequent events 116
Directors’ Declaration 117Independent Auditor’s Report to the Members of Woolworths Group Limited 118Condensed five year summary 122Shareholder information 126Company directory 128
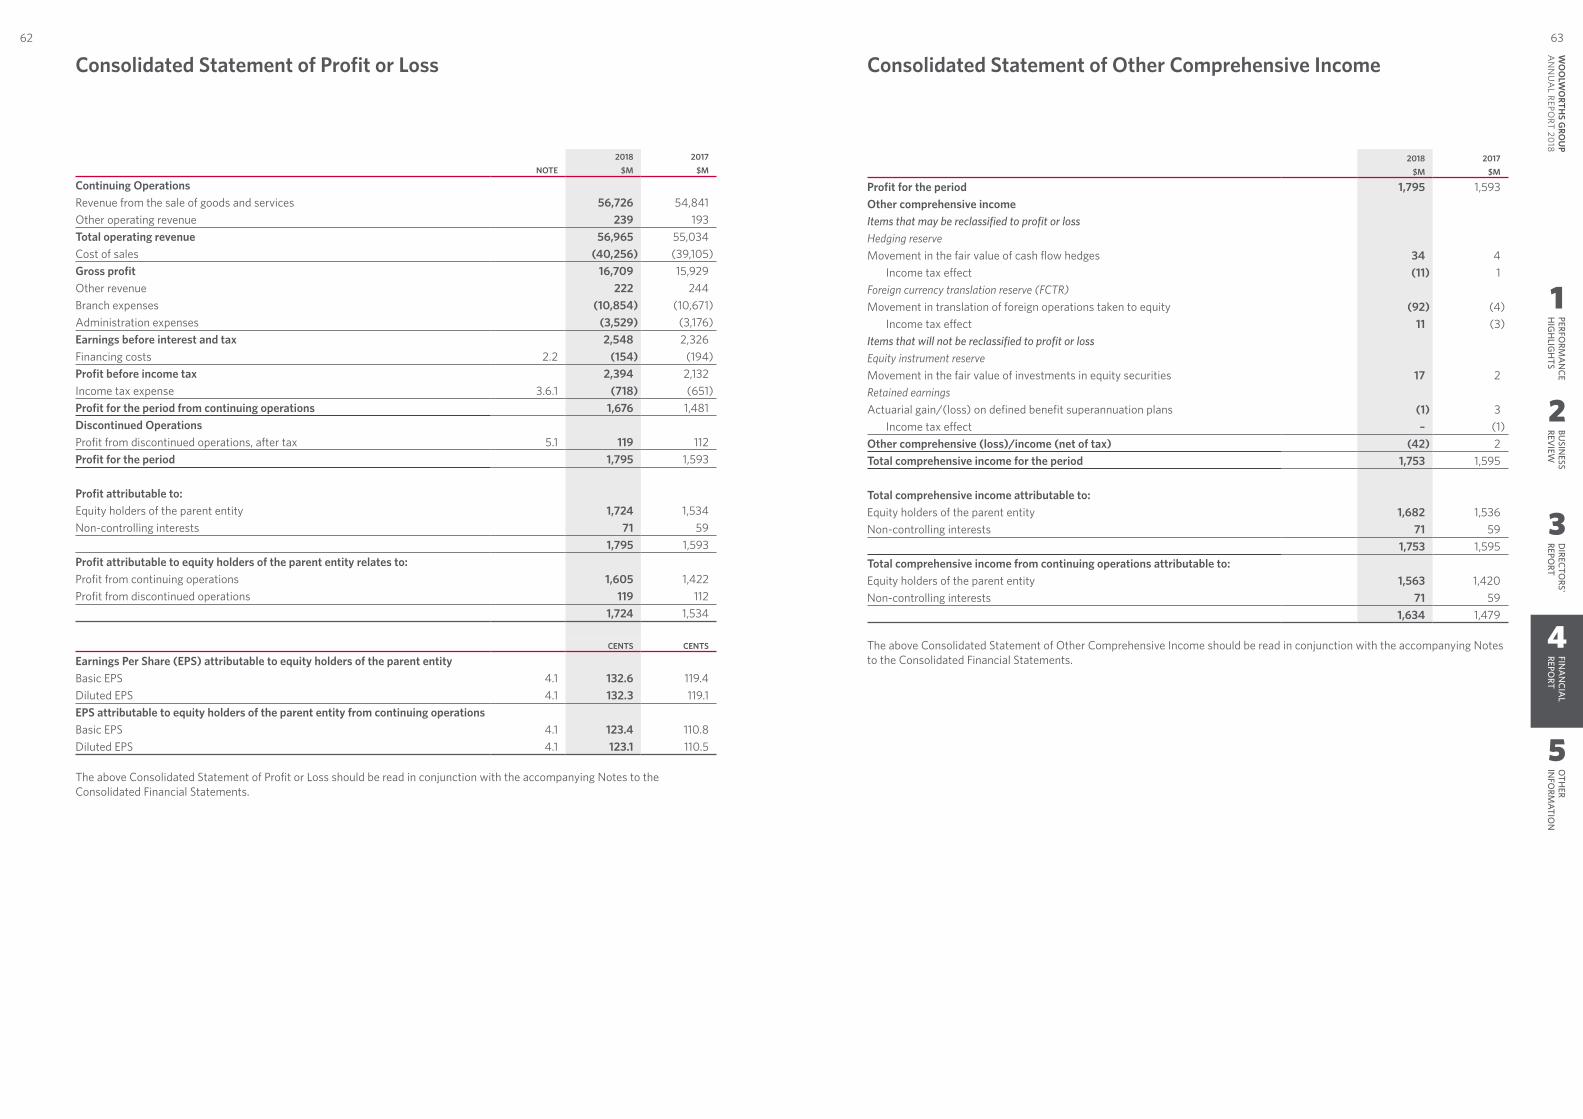
1
2
3
4
5
PERFORM
AN
CEH
IGH
LIGH
TSBU
SINESS
REVIEW
DIRECTO
RS' REPO
RTFIN
AN
CIAL
REPORT
OTH
ER IN
FORM
ATION
6362W
OO
LWO
RTHS G
ROU
P A
NN
UA
L REPORT 20
18
NOTE2018 2017
$M $M
Continuing OperationsRevenue from the sale of goods and services 56,726 54,841 Other operating revenue 239 193 Total operating revenue 56,965 55,034 Cost of sales (40,256) (39,105)Gross profit 16,709 15,929 Other revenue 222 244 Branch expenses (10,854) (10,671)Administration expenses (3,529) (3,176)Earnings before interest and tax 2,548 2,326 Financing costs 2.2 (154) (194)Profit before income tax 2,394 2,132 Income tax expense 3.6.1 (718) (651)Profit for the period from continuing operations 1,676 1,481 Discontinued OperationsProfit from discontinued operations, after tax 5.1 119 112 Profit for the period 1,795 1,593
Profit attributable to:Equity holders of the parent entity 1,724 1,534 Non‑controlling interests 71 59
1,795 1,593 Profit attributable to equity holders of the parent entity relates to:Profit from continuing operations 1,605 1,422 Profit from discontinued operations 119 112
1,724 1,534
CENTS CENTS
Earnings Per Share (EPS) attributable to equity holders of the parent entityBasic EPS 4.1 132.6 119.4 Diluted EPS 4.1 132.3 119.1 EPS attributable to equity holders of the parent entity from continuing operationsBasic EPS 4.1 123.4 110.8 Diluted EPS 4.1 123.1 110.5
The above Consolidated Statement of Profit or Loss should be read in conjunction with the accompanying Notes to the Consolidated Financial Statements.
2018 2017$M $M
Profit for the period 1,795 1,593 Other comprehensive incomeItems that may be reclassified to profit or lossHedging reserveMovement in the fair value of cash flow hedges 34 4
Income tax effect (11) 1 Foreign currency translation reserve (FCTR)Movement in translation of foreign operations taken to equity (92) (4)
Income tax effect 11 (3)Items that will not be reclassified to profit or lossEquity instrument reserveMovement in the fair value of investments in equity securities 17 2 Retained earningsActuarial gain/(loss) on defined benefit superannuation plans (1) 3
Income tax effect – (1)Other comprehensive (loss)/income (net of tax) (42) 2 Total comprehensive income for the period 1,753 1,595
Total comprehensive income attributable to:Equity holders of the parent entity 1,682 1,536 Non‑controlling interests 71 59
1,753 1,595 Total comprehensive income from continuing operations attributable to:Equity holders of the parent entity 1,563 1,420 Non‑controlling interests 71 59
1,634 1,479
The above Consolidated Statement of Other Comprehensive Income should be read in conjunction with the accompanying Notes to the Consolidated Financial Statements.
Consolidated Statement of Other Comprehensive IncomeConsolidated Statement of Profit or Loss
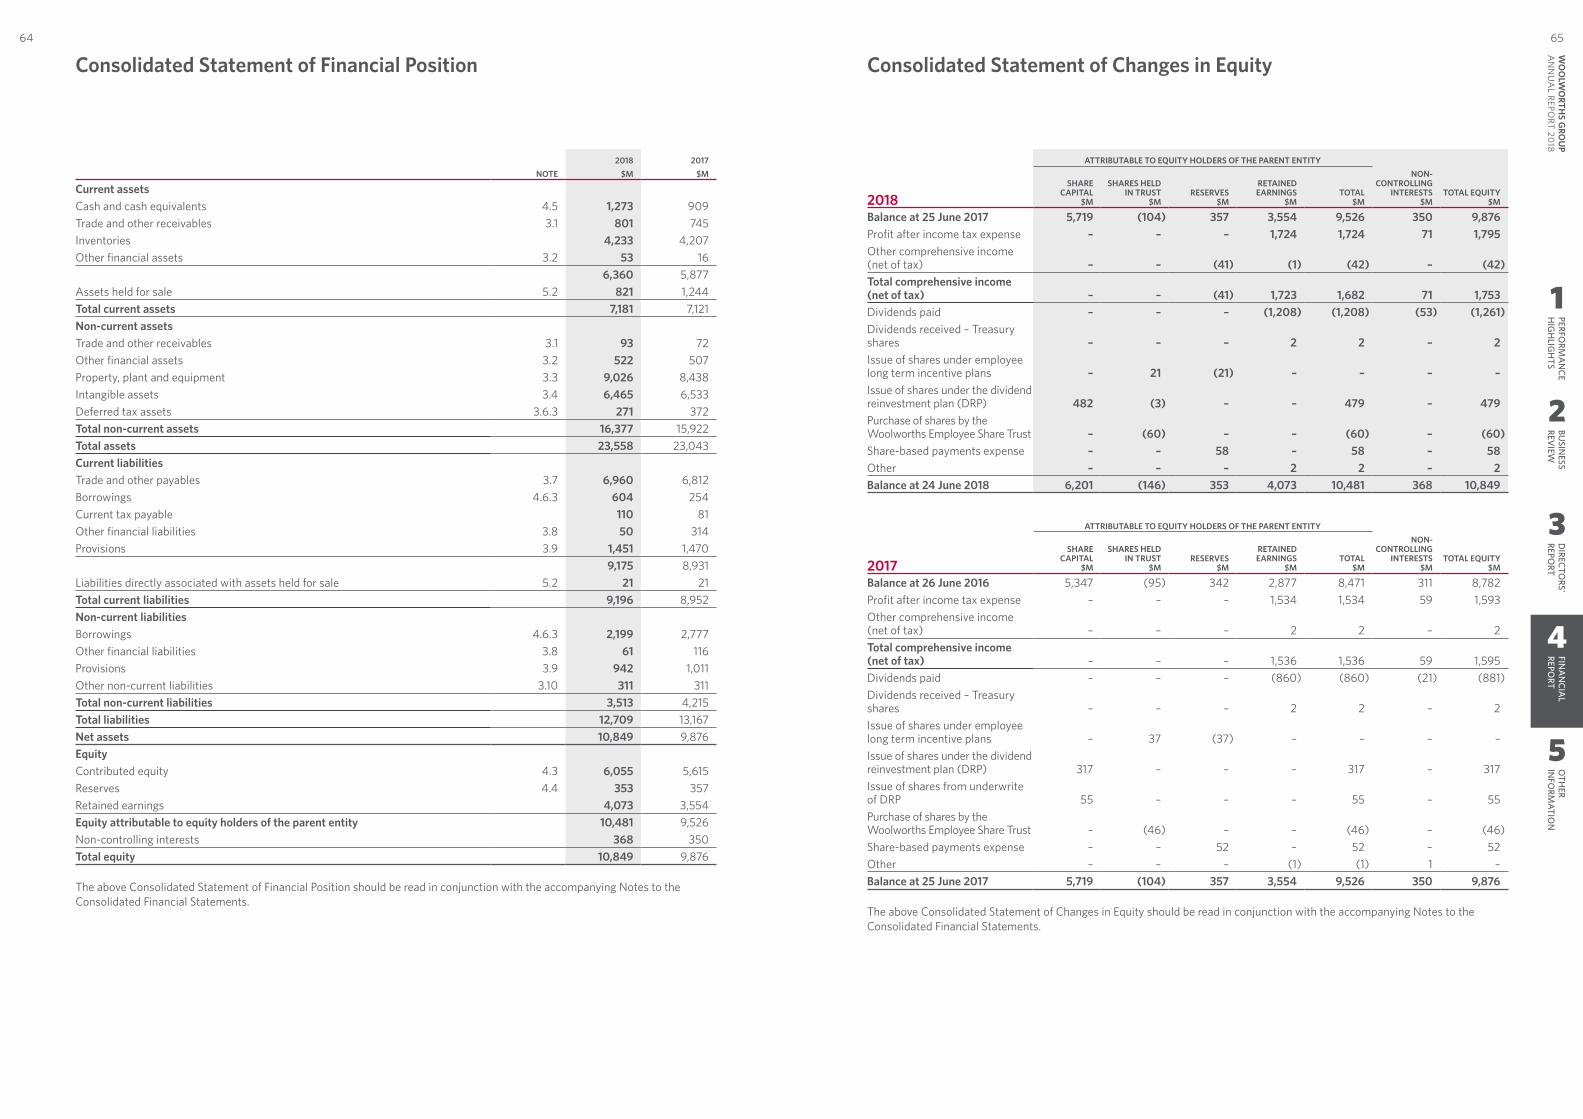
1
2
3
4
5
PERFORM
AN
CEH
IGH
LIGH
TSBU
SINESS
REVIEW
DIRECTO
RS' REPO
RTFIN
AN
CIAL
REPORT
OTH
ER IN
FORM
ATION
6564W
OO
LWO
RTHS G
ROU
P A
NN
UA
L REPORT 20
18
2018 2017NOTE $M $M
Current assetsCash and cash equivalents 4.5 1,273 909 Trade and other receivables 3.1 801 745 Inventories 4,233 4,207 Other financial assets 3.2 53 16
6,360 5,877 Assets held for sale 5.2 821 1,244 Total current assets 7,181 7,121 Non‑current assetsTrade and other receivables 3.1 93 72 Other financial assets 3.2 522 507 Property, plant and equipment 3.3 9,026 8,438 Intangible assets 3.4 6,465 6,533 Deferred tax assets 3.6.3 271 372 Total non‑current assets 16,377 15,922 Total assets 23,558 23,043 Current liabilitiesTrade and other payables 3.7 6,960 6,812 Borrowings 4.6.3 604 254 Current tax payable 110 81 Other financial liabilities 3.8 50 314 Provisions 3.9 1,451 1,470
9,175 8,931 Liabilities directly associated with assets held for sale 5.2 21 21 Total current liabilities 9,196 8,952 Non‑current liabilitiesBorrowings 4.6.3 2,199 2,777 Other financial liabilities 3.8 61 116 Provisions 3.9 942 1,011 Other non‑current liabilities 3.10 311 311 Total non‑current liabilities 3,513 4,215 Total liabilities 12,709 13,167 Net assets 10,849 9,876 EquityContributed equity 4.3 6,055 5,615 Reserves 4.4 353 357 Retained earnings 4,073 3,554 Equity attributable to equity holders of the parent entity 10,481 9,526 Non‑controlling interests 368 350 Total equity 10,849 9,876
The above Consolidated Statement of Financial Position should be read in conjunction with the accompanying Notes to the Consolidated Financial Statements.
ATTRIBUTABLE TO EQUITY HOLDERS OF THE PARENT ENTITY
2018SHARE
CAPITAL $M
SHARES HELD IN TRUST
$MRESERVES
$M
RETAINED EARNINGS
$MTOTAL
$M
NON‑CONTROLLING
INTERESTS $M
TOTAL EQUITY $M
Balance at 25 June 2017 5,719 (104) 357 3,554 9,526 350 9,876 Profit after income tax expense – – – 1,724 1,724 71 1,795 Other comprehensive income (net of tax) – – (41) (1) (42) – (42)Total comprehensive income (net of tax) – – (41) 1,723 1,682 71 1,753 Dividends paid – – – (1,208) (1,208) (53) (1,261)Dividends received – Treasury shares – – – 2 2 – 2 Issue of shares under employee long term incentive plans – 21 (21) – – – – Issue of shares under the dividend reinvestment plan (DRP) 482 (3) – – 479 – 479 Purchase of shares by the Woolworths Employee Share Trust – (60) – – (60) – (60)Share‑based payments expense – – 58 – 58 – 58 Other – – – 2 2 – 2 Balance at 24 June 2018 6,201 (146) 353 4,073 10,481 368 10,849
ATTRIBUTABLE TO EQUITY HOLDERS OF THE PARENT ENTITY
2017SHARE
CAPITAL $M
SHARES HELD IN TRUST
$MRESERVES
$M
RETAINED EARNINGS
$MTOTAL
$M
NON‑ CONTROLLING
INTERESTS $M
TOTAL EQUITY $M
Balance at 26 June 2016 5,347 (95) 342 2,877 8,471 311 8,782 Profit after income tax expense – – – 1,534 1,534 59 1,593 Other comprehensive income (net of tax) – – – 2 2 – 2 Total comprehensive income (net of tax) – – – 1,536 1,536 59 1,595 Dividends paid – – – (860) (860) (21) (881)Dividends received – Treasury shares – – – 2 2 – 2 Issue of shares under employee long term incentive plans – 37 (37) – – – – Issue of shares under the dividend reinvestment plan (DRP) 317 – – – 317 – 317 Issue of shares from underwrite of DRP 55 – – – 55 – 55 Purchase of shares by the Woolworths Employee Share Trust – (46) – – (46) – (46)Share‑based payments expense – – 52 – 52 – 52 Other – – – (1) (1) 1 – Balance at 25 June 2017 5,719 (104) 357 3,554 9,526 350 9,876
The above Consolidated Statement of Changes in Equity should be read in conjunction with the accompanying Notes to the Consolidated Financial Statements.
Consolidated Statement of Changes in EquityConsolidated Statement of Financial Position
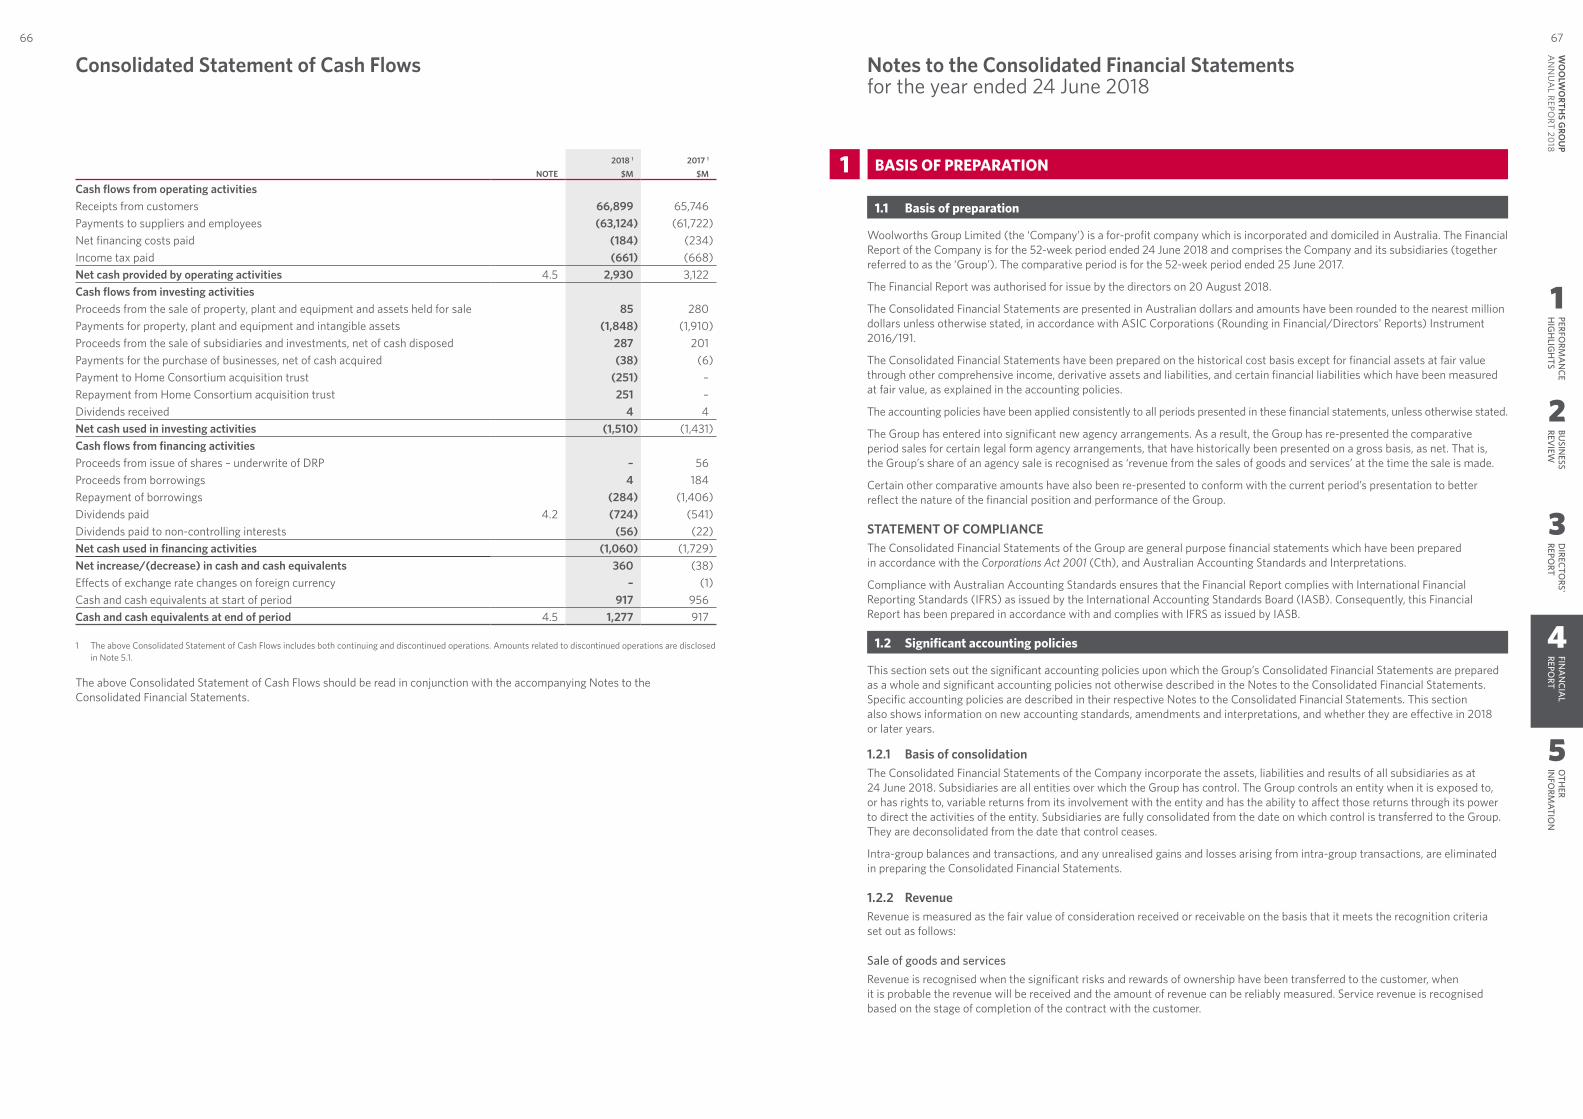
1
2
3
4
5
PERFORM
AN
CEH
IGH
LIGH
TSBU
SINESS
REVIEW
DIRECTO
RS' REPO
RTFIN
AN
CIAL
REPORT
OTH
ER IN
FORM
ATION
6766W
OO
LWO
RTHS G
ROU
P A
NN
UA
L REPORT 20
18
NOTE2018 1 2017 1
$M $M
Cash flows from operating activitiesReceipts from customers 66,899 65,746 Payments to suppliers and employees (63,124) (61,722)Net financing costs paid (184) (234)Income tax paid (661) (668)Net cash provided by operating activities 4.5 2,930 3,122 Cash flows from investing activitiesProceeds from the sale of property, plant and equipment and assets held for sale 85 280 Payments for property, plant and equipment and intangible assets (1,848) (1,910)Proceeds from the sale of subsidiaries and investments, net of cash disposed 287 201 Payments for the purchase of businesses, net of cash acquired (38) (6)Payment to Home Consortium acquisition trust (251) – Repayment from Home Consortium acquisition trust 251 – Dividends received 4 4 Net cash used in investing activities (1,510) (1,431)Cash flows from financing activitiesProceeds from issue of shares – underwrite of DRP – 56 Proceeds from borrowings 4 184 Repayment of borrowings (284) (1,406)Dividends paid 4.2 (724) (541)Dividends paid to non‑controlling interests (56) (22)Net cash used in financing activities (1,060) (1,729)Net increase/(decrease) in cash and cash equivalents 360 (38)Effects of exchange rate changes on foreign currency – (1)Cash and cash equivalents at start of period 917 956 Cash and cash equivalents at end of period 4.5 1,277 917
1 The above Consolidated Statement of Cash Flows includes both continuing and discontinued operations. Amounts related to discontinued operations are disclosed in Note 5.1.
The above Consolidated Statement of Cash Flows should be read in conjunction with the accompanying Notes to the Consolidated Financial Statements.
1 BASIS OF PREPARATION
1.1 Basis of preparation
Woolworths Group Limited (the ‘Company’) is a for‑profit company which is incorporated and domiciled in Australia. The Financial Report of the Company is for the 52‑week period ended 24 June 2018 and comprises the Company and its subsidiaries (together referred to as the ‘Group’). The comparative period is for the 52‑week period ended 25 June 2017.
The Financial Report was authorised for issue by the directors on 20 August 2018.
The Consolidated Financial Statements are presented in Australian dollars and amounts have been rounded to the nearest million dollars unless otherwise stated, in accordance with ASIC Corporations (Rounding in Financial/Directors' Reports) Instrument 2016/191.
The Consolidated Financial Statements have been prepared on the historical cost basis except for financial assets at fair value through other comprehensive income, derivative assets and liabilities, and certain financial liabilities which have been measured at fair value, as explained in the accounting policies.
The accounting policies have been applied consistently to all periods presented in these financial statements, unless otherwise stated.
The Group has entered into significant new agency arrangements. As a result, the Group has re‑presented the comparative period sales for certain legal form agency arrangements, that have historically been presented on a gross basis, as net. That is, the Group’s share of an agency sale is recognised as ‘revenue from the sales of goods and services’ at the time the sale is made.
Certain other comparative amounts have also been re‑presented to conform with the current period’s presentation to better reflect the nature of the financial position and performance of the Group.
STATEMENT OF COMPLIANCE The Consolidated Financial Statements of the Group are general purpose financial statements which have been prepared in accordance with the Corporations Act 2001 (Cth), and Australian Accounting Standards and Interpretations.
Compliance with Australian Accounting Standards ensures that the Financial Report complies with International Financial Reporting Standards (IFRS) as issued by the International Accounting Standards Board (IASB). Consequently, this Financial Report has been prepared in accordance with and complies with IFRS as issued by IASB.
1.2 Significant accounting policies
This section sets out the significant accounting policies upon which the Group’s Consolidated Financial Statements are prepared as a whole and significant accounting policies not otherwise described in the Notes to the Consolidated Financial Statements. Specific accounting policies are described in their respective Notes to the Consolidated Financial Statements. This section also shows information on new accounting standards, amendments and interpretations, and whether they are effective in 2018 or later years.
1.2.1 Basis of consolidationThe Consolidated Financial Statements of the Company incorporate the assets, liabilities and results of all subsidiaries as at 24 June 2018. Subsidiaries are all entities over which the Group has control. The Group controls an entity when it is exposed to, or has rights to, variable returns from its involvement with the entity and has the ability to affect those returns through its power to direct the activities of the entity. Subsidiaries are fully consolidated from the date on which control is transferred to the Group. They are deconsolidated from the date that control ceases.
Intra‑group balances and transactions, and any unrealised gains and losses arising from intra‑group transactions, are eliminated in preparing the Consolidated Financial Statements.
1.2.2 RevenueRevenue is measured as the fair value of consideration received or receivable on the basis that it meets the recognition criteria set out as follows:
Sale of goods and servicesRevenue is recognised when the significant risks and rewards of ownership have been transferred to the customer, when it is probable the revenue will be received and the amount of revenue can be reliably measured. Service revenue is recognised based on the stage of completion of the contract with the customer.
Notes to the Consolidated Financial Statementsfor the year ended 24 June 2018
Consolidated Statement of Cash Flows
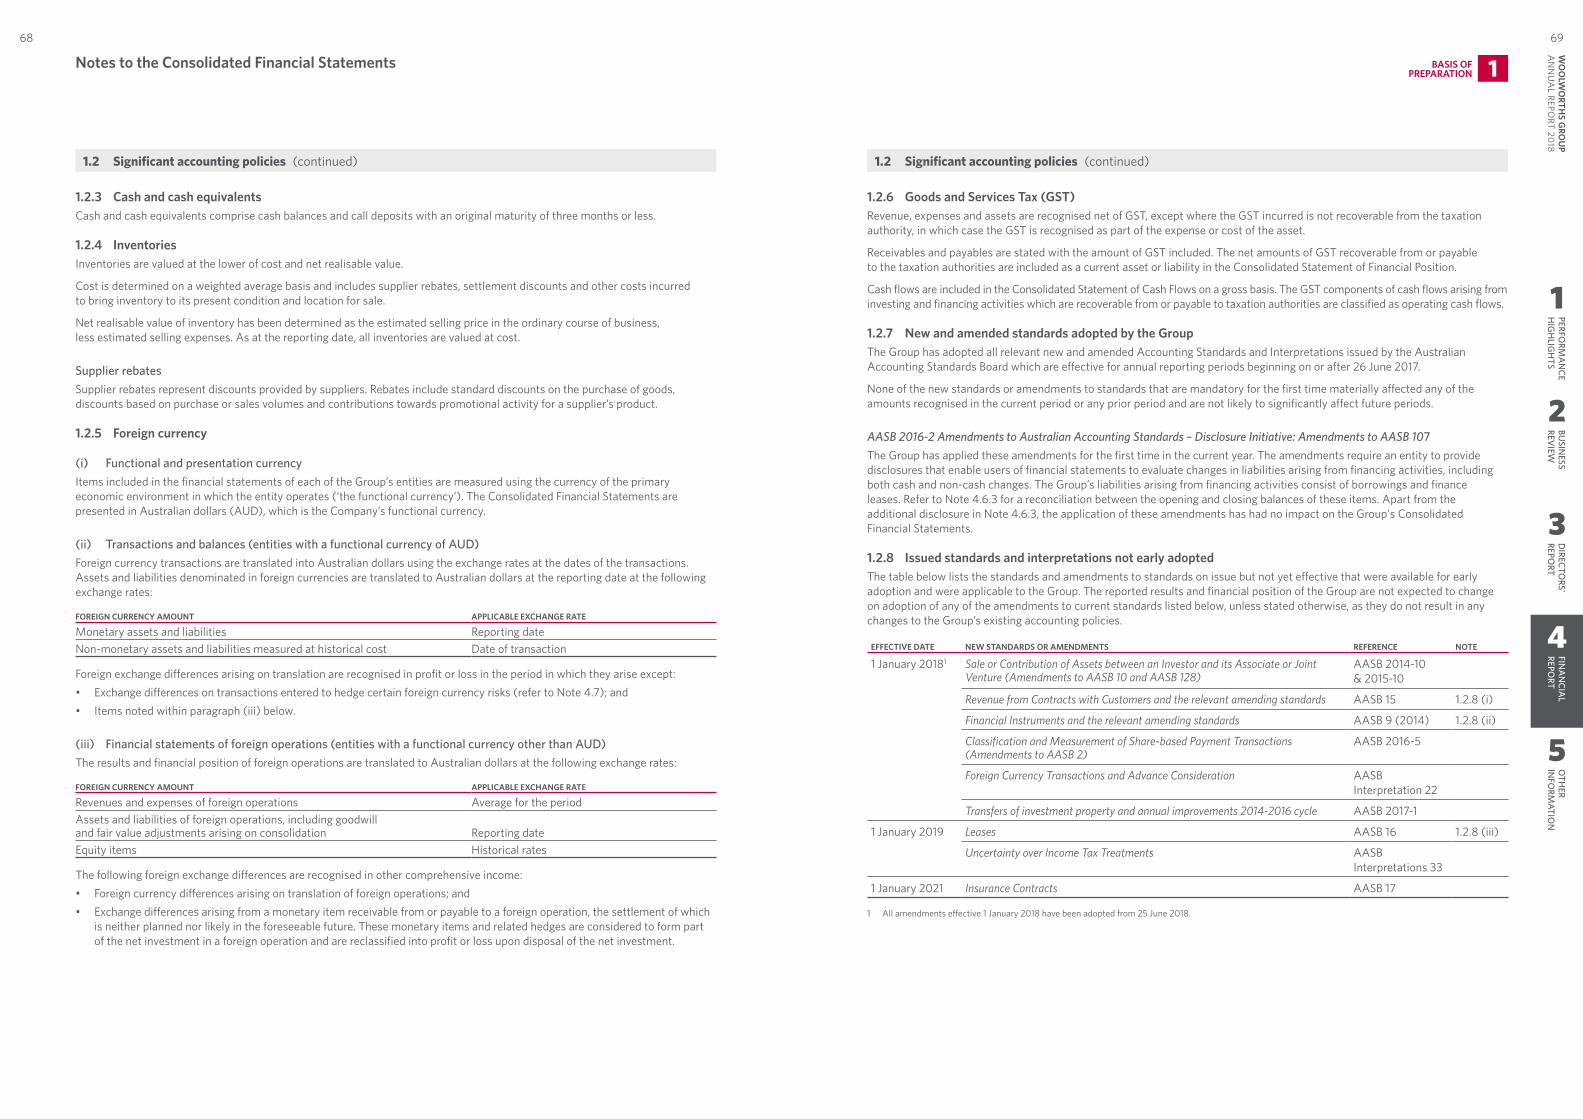
1
2
3
4
5
PERFORM
AN
CEH
IGH
LIGH
TSBU
SINESS
REVIEW
DIRECTO
RS' REPO
RTFIN
AN
CIAL
REPORT
OTH
ER IN
FORM
ATION
6968W
OO
LWO
RTHS G
ROU
P A
NN
UA
L REPORT 20
18
1.2.3 Cash and cash equivalentsCash and cash equivalents comprise cash balances and call deposits with an original maturity of three months or less.
1.2.4 InventoriesInventories are valued at the lower of cost and net realisable value.
Cost is determined on a weighted average basis and includes supplier rebates, settlement discounts and other costs incurred to bring inventory to its present condition and location for sale.
Net realisable value of inventory has been determined as the estimated selling price in the ordinary course of business, less estimated selling expenses. As at the reporting date, all inventories are valued at cost.
Supplier rebatesSupplier rebates represent discounts provided by suppliers. Rebates include standard discounts on the purchase of goods, discounts based on purchase or sales volumes and contributions towards promotional activity for a supplier’s product.
1.2.5 Foreign currency
(i) Functional and presentation currencyItems included in the financial statements of each of the Group’s entities are measured using the currency of the primary economic environment in which the entity operates (‘the functional currency’). The Consolidated Financial Statements are presented in Australian dollars (AUD), which is the Company’s functional currency.
(ii) Transactions and balances (entities with a functional currency of AUD)Foreign currency transactions are translated into Australian dollars using the exchange rates at the dates of the transactions. Assets and liabilities denominated in foreign currencies are translated to Australian dollars at the reporting date at the following exchange rates:
FOREIGN CURRENCY AMOUNT APPLICABLE EXCHANGE RATE
Monetary assets and liabilities Reporting dateNon‑monetary assets and liabilities measured at historical cost Date of transaction
Foreign exchange differences arising on translation are recognised in profit or loss in the period in which they arise except:• Exchange differences on transactions entered to hedge certain foreign currency risks (refer to Note 4.7); and• Items noted within paragraph (iii) below.
(iii) Financial statements of foreign operations (entities with a functional currency other than AUD)The results and financial position of foreign operations are translated to Australian dollars at the following exchange rates:
FOREIGN CURRENCY AMOUNT APPLICABLE EXCHANGE RATE
Revenues and expenses of foreign operations Average for the periodAssets and liabilities of foreign operations, including goodwill and fair value adjustments arising on consolidation Reporting dateEquity items Historical rates
The following foreign exchange differences are recognised in other comprehensive income:• Foreign currency differences arising on translation of foreign operations; and• Exchange differences arising from a monetary item receivable from or payable to a foreign operation, the settlement of which
is neither planned nor likely in the foreseeable future. These monetary items and related hedges are considered to form part of the net investment in a foreign operation and are reclassified into profit or loss upon disposal of the net investment.
1.2.6 Goods and Services Tax (GST)Revenue, expenses and assets are recognised net of GST, except where the GST incurred is not recoverable from the taxation authority, in which case the GST is recognised as part of the expense or cost of the asset.
Receivables and payables are stated with the amount of GST included. The net amounts of GST recoverable from or payable to the taxation authorities are included as a current asset or liability in the Consolidated Statement of Financial Position.
Cash flows are included in the Consolidated Statement of Cash Flows on a gross basis. The GST components of cash flows arising from investing and financing activities which are recoverable from or payable to taxation authorities are classified as operating cash flows.
1.2.7 New and amended standards adopted by the GroupThe Group has adopted all relevant new and amended Accounting Standards and Interpretations issued by the Australian Accounting Standards Board which are effective for annual reporting periods beginning on or after 26 June 2017.
None of the new standards or amendments to standards that are mandatory for the first time materially affected any of the amounts recognised in the current period or any prior period and are not likely to significantly affect future periods.
AASB 2016-2 Amendments to Australian Accounting Standards – Disclosure Initiative: Amendments to AASB 107The Group has applied these amendments for the first time in the current year. The amendments require an entity to provide disclosures that enable users of financial statements to evaluate changes in liabilities arising from financing activities, including both cash and non‑cash changes. The Group’s liabilities arising from financing activities consist of borrowings and finance leases. Refer to Note 4.6.3 for a reconciliation between the opening and closing balances of these items. Apart from the additional disclosure in Note 4.6.3, the application of these amendments has had no impact on the Group's Consolidated Financial Statements.
1.2.8 Issued standards and interpretations not early adoptedThe table below lists the standards and amendments to standards on issue but not yet effective that were available for early adoption and were applicable to the Group. The reported results and financial position of the Group are not expected to change on adoption of any of the amendments to current standards listed below, unless stated otherwise, as they do not result in any changes to the Group’s existing accounting policies.
EFFECTIVE DATE NEW STANDARDS OR AMENDMENTS REFERENCE NOTE
1 January 20181 Sale or Contribution of Assets between an Investor and its Associate or Joint Venture (Amendments to AASB 10 and AASB 128)
AASB 2014‑10 & 2015‑10
Revenue from Contracts with Customers and the relevant amending standards AASB 15 1.2.8 (i)
Financial Instruments and the relevant amending standards AASB 9 (2014) 1.2.8 (ii)
Classification and Measurement of Share-based Payment Transactions (Amendments to AASB 2)
AASB 2016‑5
Foreign Currency Transactions and Advance Consideration AASB Interpretation 22
Transfers of investment property and annual improvements 2014-2016 cycle AASB 2017‑1
1 January 2019 Leases AASB 16 1.2.8 (iii)
Uncertainty over Income Tax Treatments AASB Interpretations 33
1 January 2021 Insurance Contracts AASB 17
1 All amendments effective 1 January 2018 have been adopted from 25 June 2018.
Notes to the Consolidated Financial Statements BASIS OFPREPARATION 1
1.2 Significant accounting policies (continued) 1.2 Significant accounting policies (continued)
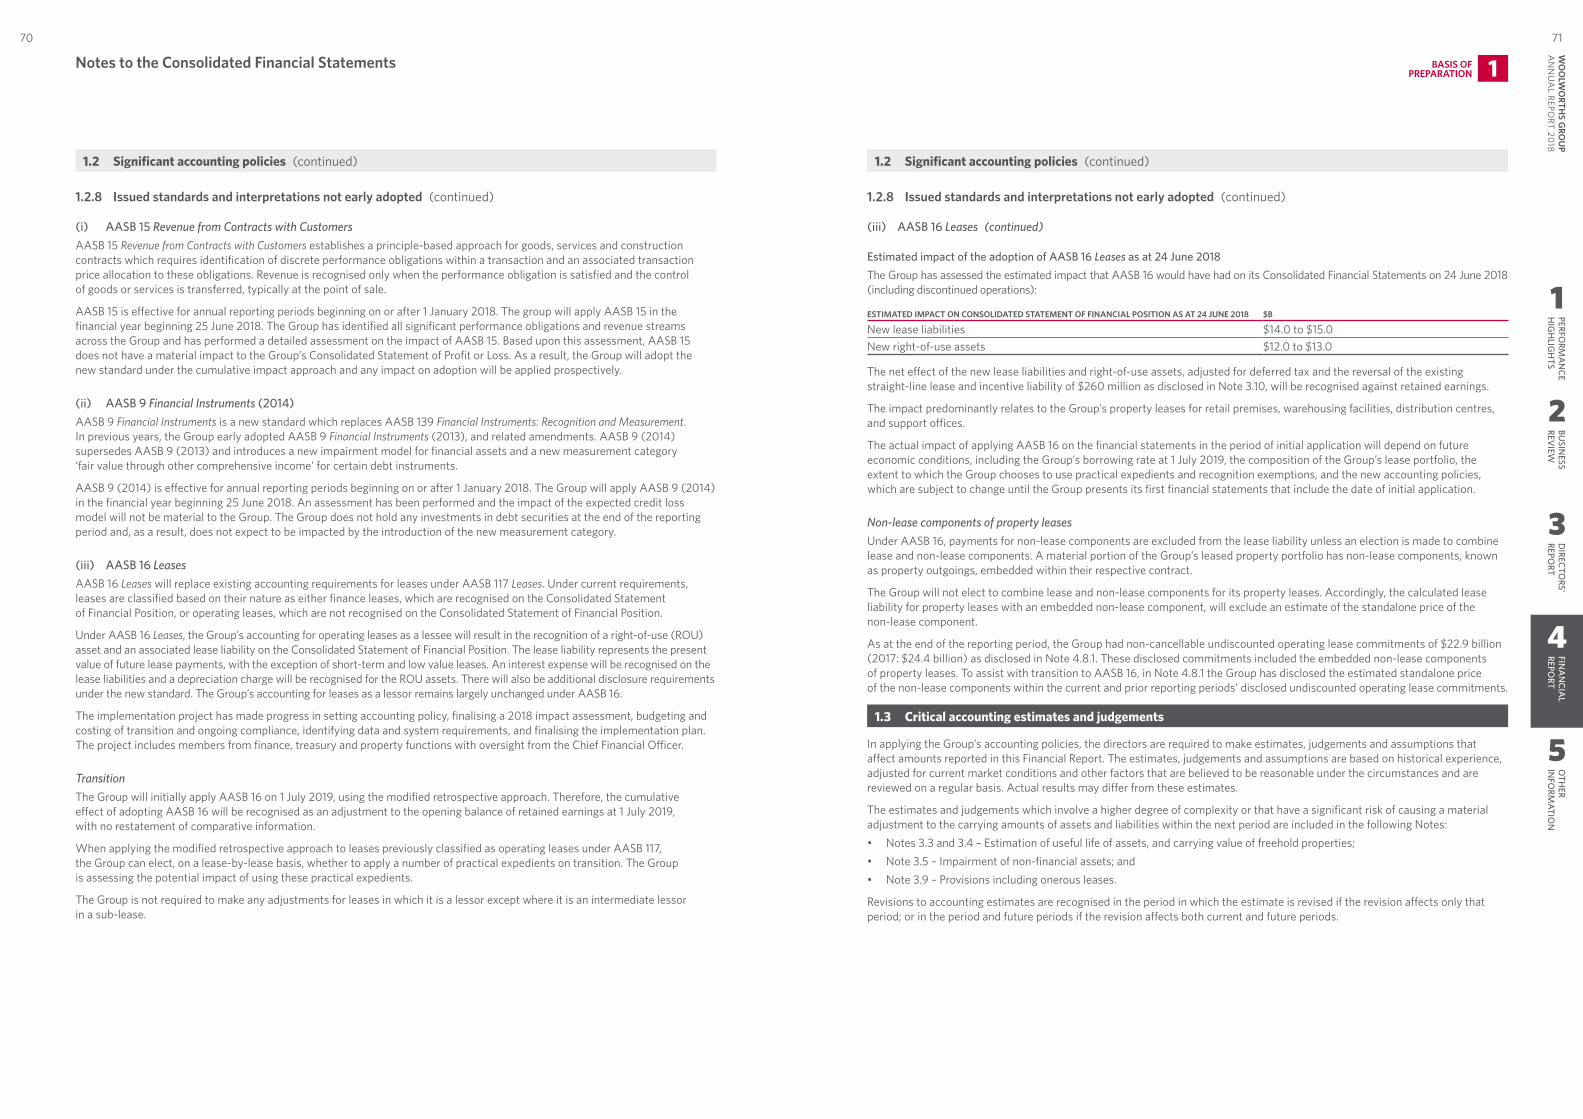
1
2
3
4
5
PERFORM
AN
CEH
IGH
LIGH
TSBU
SINESS
REVIEW
DIRECTO
RS' REPO
RTFIN
AN
CIAL
REPORT
OTH
ER IN
FORM
ATION
7170W
OO
LWO
RTHS G
ROU
P A
NN
UA
L REPORT 20
18
1.2.8 Issued standards and interpretations not early adopted (continued)
(i) AASB 15 Revenue from Contracts with CustomersAASB 15 Revenue from Contracts with Customers establishes a principle‑based approach for goods, services and construction contracts which requires identification of discrete performance obligations within a transaction and an associated transaction price allocation to these obligations. Revenue is recognised only when the performance obligation is satisfied and the control of goods or services is transferred, typically at the point of sale.
AASB 15 is effective for annual reporting periods beginning on or after 1 January 2018. The group will apply AASB 15 in the financial year beginning 25 June 2018. The Group has identified all significant performance obligations and revenue streams across the Group and has performed a detailed assessment on the impact of AASB 15. Based upon this assessment, AASB 15 does not have a material impact to the Group’s Consolidated Statement of Profit or Loss. As a result, the Group will adopt the new standard under the cumulative impact approach and any impact on adoption will be applied prospectively.
(ii) AASB 9 Financial Instruments (2014)AASB 9 Financial Instruments is a new standard which replaces AASB 139 Financial Instruments: Recognition and Measurement. In previous years, the Group early adopted AASB 9 Financial Instruments (2013), and related amendments. AASB 9 (2014) supersedes AASB 9 (2013) and introduces a new impairment model for financial assets and a new measurement category ‘fair value through other comprehensive income’ for certain debt instruments.
AASB 9 (2014) is effective for annual reporting periods beginning on or after 1 January 2018. The Group will apply AASB 9 (2014) in the financial year beginning 25 June 2018. An assessment has been performed and the impact of the expected credit loss model will not be material to the Group. The Group does not hold any investments in debt securities at the end of the reporting period and, as a result, does not expect to be impacted by the introduction of the new measurement category.
(iii) AASB 16 LeasesAASB 16 Leases will replace existing accounting requirements for leases under AASB 117 Leases. Under current requirements, leases are classified based on their nature as either finance leases, which are recognised on the Consolidated Statement of Financial Position, or operating leases, which are not recognised on the Consolidated Statement of Financial Position.
Under AASB 16 Leases, the Group’s accounting for operating leases as a lessee will result in the recognition of a right‑of‑use (ROU) asset and an associated lease liability on the Consolidated Statement of Financial Position. The lease liability represents the present value of future lease payments, with the exception of short‑term and low value leases. An interest expense will be recognised on the lease liabilities and a depreciation charge will be recognised for the ROU assets. There will also be additional disclosure requirements under the new standard. The Group’s accounting for leases as a lessor remains largely unchanged under AASB 16.
The implementation project has made progress in setting accounting policy, finalising a 2018 impact assessment, budgeting and costing of transition and ongoing compliance, identifying data and system requirements, and finalising the implementation plan. The project includes members from finance, treasury and property functions with oversight from the Chief Financial Officer.
TransitionThe Group will initially apply AASB 16 on 1 July 2019, using the modified retrospective approach. Therefore, the cumulative effect of adopting AASB 16 will be recognised as an adjustment to the opening balance of retained earnings at 1 July 2019, with no restatement of comparative information.
When applying the modified retrospective approach to leases previously classified as operating leases under AASB 117, the Group can elect, on a lease‑by‑lease basis, whether to apply a number of practical expedients on transition. The Group is assessing the potential impact of using these practical expedients.
The Group is not required to make any adjustments for leases in which it is a lessor except where it is an intermediate lessor in a sub‑lease.
1.2.8 Issued standards and interpretations not early adopted (continued)
(iii) AASB 16 Leases (continued)
Estimated impact of the adoption of AASB 16 Leases as at 24 June 2018The Group has assessed the estimated impact that AASB 16 would have had on its Consolidated Financial Statements on 24 June 2018 (including discontinued operations):
ESTIMATED IMPACT ON CONSOLIDATED STATEMENT OF FINANCIAL POSITION AS AT 24 JUNE 2018 $B
New lease liabilities $14.0 to $15.0 New right‑of‑use assets $12.0 to $13.0
The net effect of the new lease liabilities and right‑of‑use assets, adjusted for deferred tax and the reversal of the existing straight‑line lease and incentive liability of $260 million as disclosed in Note 3.10, will be recognised against retained earnings.
The impact predominantly relates to the Group’s property leases for retail premises, warehousing facilities, distribution centres, and support offices.
The actual impact of applying AASB 16 on the financial statements in the period of initial application will depend on future economic conditions, including the Group’s borrowing rate at 1 July 2019, the composition of the Group’s lease portfolio, the extent to which the Group chooses to use practical expedients and recognition exemptions, and the new accounting policies, which are subject to change until the Group presents its first financial statements that include the date of initial application.
Non-lease components of property leasesUnder AASB 16, payments for non‑lease components are excluded from the lease liability unless an election is made to combine lease and non‑lease components. A material portion of the Group’s leased property portfolio has non‑lease components, known as property outgoings, embedded within their respective contract.
The Group will not elect to combine lease and non‑lease components for its property leases. Accordingly, the calculated lease liability for property leases with an embedded non‑lease component, will exclude an estimate of the standalone price of the non‑lease component.
As at the end of the reporting period, the Group had non‑cancellable undiscounted operating lease commitments of $22.9 billion (2017: $24.4 billion) as disclosed in Note 4.8.1. These disclosed commitments included the embedded non‑lease components of property leases. To assist with transition to AASB 16, in Note 4.8.1 the Group has disclosed the estimated standalone price of the non‑lease components within the current and prior reporting periods’ disclosed undiscounted operating lease commitments.
1.3 Critical accounting estimates and judgements
In applying the Group’s accounting policies, the directors are required to make estimates, judgements and assumptions that affect amounts reported in this Financial Report. The estimates, judgements and assumptions are based on historical experience, adjusted for current market conditions and other factors that are believed to be reasonable under the circumstances and are reviewed on a regular basis. Actual results may differ from these estimates.
The estimates and judgements which involve a higher degree of complexity or that have a significant risk of causing a material adjustment to the carrying amounts of assets and liabilities within the next period are included in the following Notes:• Notes 3.3 and 3.4 – Estimation of useful life of assets, and carrying value of freehold properties;• Note 3.5 – Impairment of non‑financial assets; and• Note 3.9 – Provisions including onerous leases.
Revisions to accounting estimates are recognised in the period in which the estimate is revised if the revision affects only that period; or in the period and future periods if the revision affects both current and future periods.
Notes to the Consolidated Financial Statements BASIS OFPREPARATION 1
1.2 Significant accounting policies (continued) 1.2 Significant accounting policies (continued)
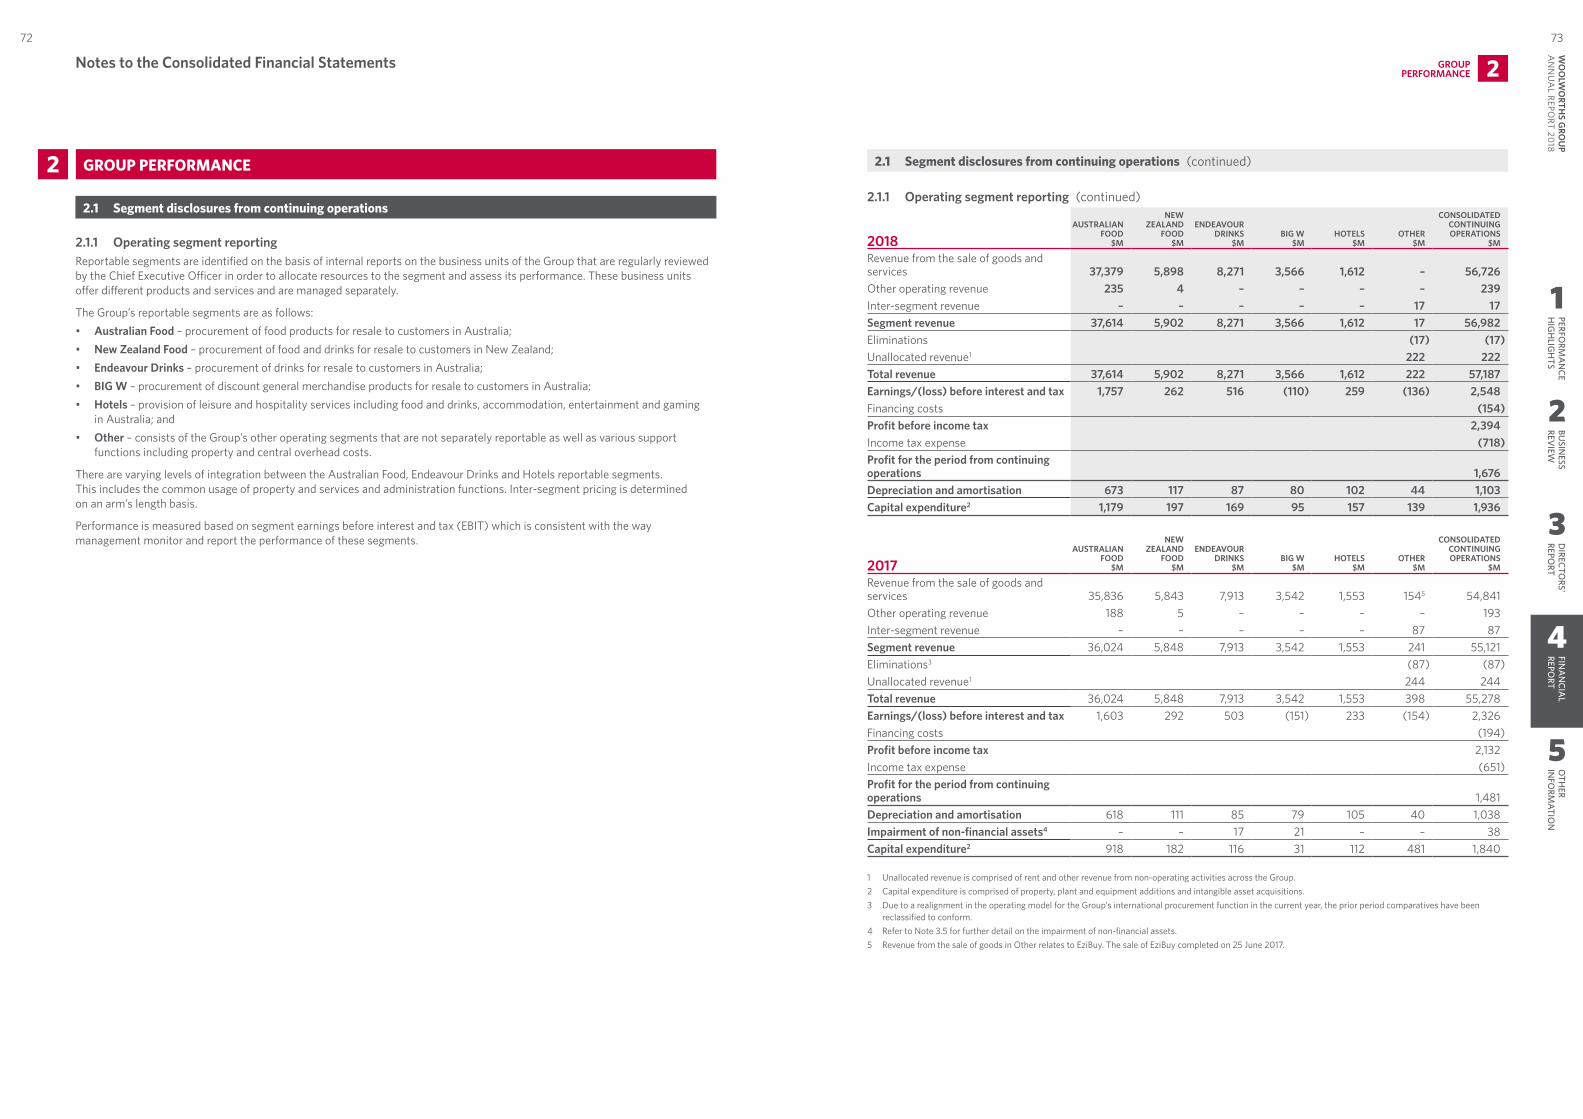
1
2
3
4
5
PERFORM
AN
CEH
IGH
LIGH
TSBU
SINESS
REVIEW
DIRECTO
RS' REPO
RTFIN
AN
CIAL
REPORT
OTH
ER IN
FORM
ATION
7372W
OO
LWO
RTHS G
ROU
P A
NN
UA
L REPORT 20
18
2 GROUP PERFORMANCE
2.1 Segment disclosures from continuing operations
2.1.1 Operating segment reportingReportable segments are identified on the basis of internal reports on the business units of the Group that are regularly reviewed by the Chief Executive Officer in order to allocate resources to the segment and assess its performance. These business units offer different products and services and are managed separately.
The Group’s reportable segments are as follows:• Australian Food – procurement of food products for resale to customers in Australia;• New Zealand Food – procurement of food and drinks for resale to customers in New Zealand;• Endeavour Drinks – procurement of drinks for resale to customers in Australia;• BIG W – procurement of discount general merchandise products for resale to customers in Australia; • Hotels – provision of leisure and hospitality services including food and drinks, accommodation, entertainment and gaming
in Australia; and• Other – consists of the Group’s other operating segments that are not separately reportable as well as various support
functions including property and central overhead costs.
There are varying levels of integration between the Australian Food, Endeavour Drinks and Hotels reportable segments. This includes the common usage of property and services and administration functions. Inter‑segment pricing is determined on an arm’s length basis.
Performance is measured based on segment earnings before interest and tax (EBIT) which is consistent with the way management monitor and report the performance of these segments.
2.1.1 Operating segment reporting (continued)
2018AUSTRALIAN
FOOD $M
NEW ZEALAND
FOOD $M
ENDEAVOUR DRINKS
$MBIG W
$MHOTELS
$MOTHER
$M
CONSOLIDATED CONTINUING OPERATIONS
$M
Revenue from the sale of goods and services 37,379 5,898 8,271 3,566 1,612 – 56,726 Other operating revenue 235 4 – – – – 239 Inter‑segment revenue – – – – – 17 17 Segment revenue 37,614 5,902 8,271 3,566 1,612 17 56,982 Eliminations (17) (17)Unallocated revenue1 222 222 Total revenue 37,614 5,902 8,271 3,566 1,612 222 57,187 Earnings/(loss) before interest and tax 1,757 262 516 (110) 259 (136) 2,548 Financing costs (154)Profit before income tax 2,394 Income tax expense (718)Profit for the period from continuing operations 1,676 Depreciation and amortisation 673 117 87 80 102 44 1,103 Capital expenditure2 1,179 197 169 95 157 139 1,936
2017AUSTRALIAN
FOOD $M
NEW ZEALAND
FOOD $M
ENDEAVOUR DRINKS
$MBIG W
$MHOTELS
$MOTHER
$M
CONSOLIDATED CONTINUING OPERATIONS
$M
Revenue from the sale of goods and services 35,836 5,843 7,913 3,542 1,553 1545 54,841 Other operating revenue 188 5 – – – – 193 Inter‑segment revenue – – – – – 87 87 Segment revenue 36,024 5,848 7,913 3,542 1,553 241 55,121 Eliminations3 (87) (87)Unallocated revenue1 244 244 Total revenue 36,024 5,848 7,913 3,542 1,553 398 55,278 Earnings/(loss) before interest and tax 1,603 292 503 (151) 233 (154) 2,326 Financing costs (194)Profit before income tax 2,132 Income tax expense (651)Profit for the period from continuing operations 1,481 Depreciation and amortisation 618 111 85 79 105 40 1,038 Impairment of non‑financial assets4 – – 17 21 – – 38 Capital expenditure2 918 182 116 31 112 481 1,840
1 Unallocated revenue is comprised of rent and other revenue from non‑operating activities across the Group.2 Capital expenditure is comprised of property, plant and equipment additions and intangible asset acquisitions. 3 Due to a realignment in the operating model for the Group’s international procurement function in the current year, the prior period comparatives have been
reclassified to conform.4 Refer to Note 3.5 for further detail on the impairment of non‑financial assets.5 Revenue from the sale of goods in Other relates to EziBuy. The sale of EziBuy completed on 25 June 2017.
Notes to the Consolidated Financial Statements GROUPPERFORMANCE 2
2.1 Segment disclosures from continuing operations (continued)
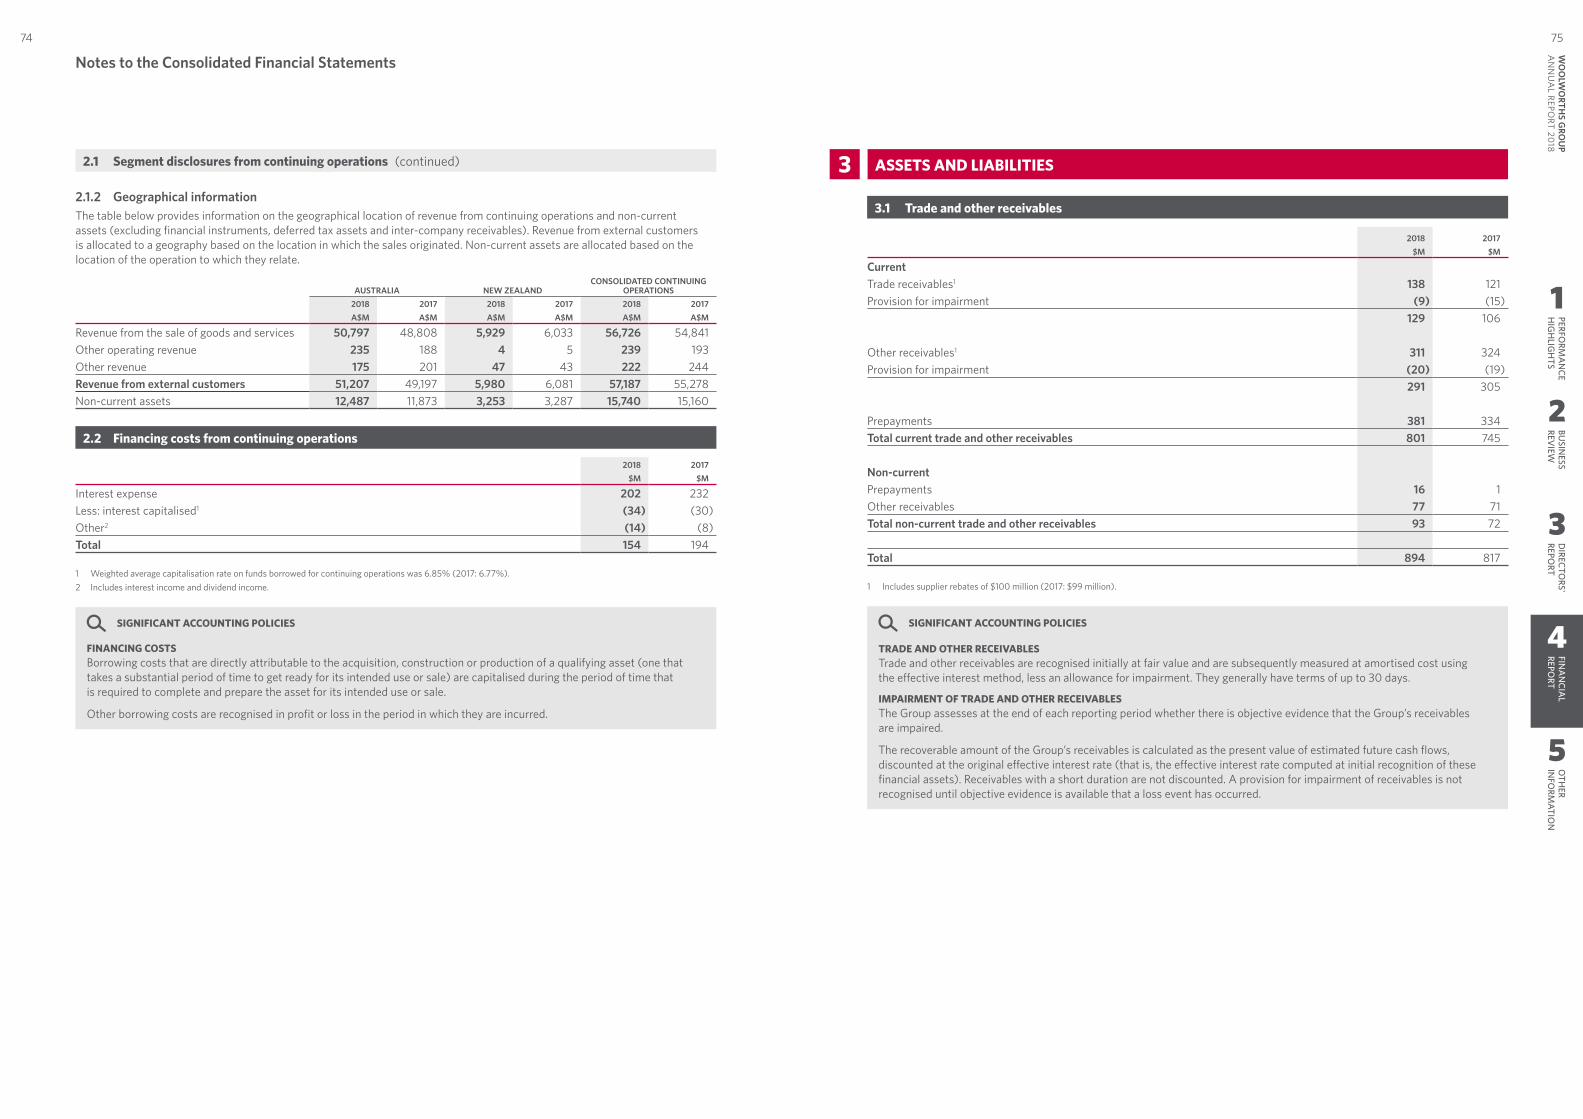
1
2
3
4
5
PERFORM
AN
CEH
IGH
LIGH
TSBU
SINESS
REVIEW
DIRECTO
RS' REPO
RTFIN
AN
CIAL
REPORT
OTH
ER IN
FORM
ATION
7574W
OO
LWO
RTHS G
ROU
P A
NN
UA
L REPORT 20
18
2.1.2 Geographical informationThe table below provides information on the geographical location of revenue from continuing operations and non‑current assets (excluding financial instruments, deferred tax assets and inter‑company receivables). Revenue from external customers is allocated to a geography based on the location in which the sales originated. Non‑current assets are allocated based on the location of the operation to which they relate.
AUSTRALIA NEW ZEALANDCONSOLIDATED CONTINUING
OPERATIONS2018 2017 2018 2017 2018 2017A$M A$M A$M A$M A$M A$M
Revenue from the sale of goods and services 50,797 48,808 5,929 6,033 56,726 54,841 Other operating revenue 235 188 4 5 239 193 Other revenue 175 201 47 43 222 244 Revenue from external customers 51,207 49,197 5,980 6,081 57,187 55,278 Non‑current assets 12,487 11,873 3,253 3,287 15,740 15,160
2.2 Financing costs from continuing operations
2018 2017$M $M
Interest expense 202 232 Less: interest capitalised1 (34) (30)Other2 (14) (8)Total 154 194
1 Weighted average capitalisation rate on funds borrowed for continuing operations was 6.85% (2017: 6.77%).2 Includes interest income and dividend income.
SIGNIFICANT ACCOUNTING POLICIES
FINANCING COSTSBorrowing costs that are directly attributable to the acquisition, construction or production of a qualifying asset (one that takes a substantial period of time to get ready for its intended use or sale) are capitalised during the period of time that is required to complete and prepare the asset for its intended use or sale.
Other borrowing costs are recognised in profit or loss in the period in which they are incurred.
3 ASSETS AND LIABILITIES
3.1 Trade and other receivables
2018 2017$M $M
CurrentTrade receivables1 138 121 Provision for impairment (9) (15)
129 106
Other receivables1 311 324 Provision for impairment (20) (19)
291 305
Prepayments 381 334 Total current trade and other receivables 801 745
Non‑currentPrepayments 16 1 Other receivables 77 71 Total non‑current trade and other receivables 93 72
Total 894 817
1 Includes supplier rebates of $100 million (2017: $99 million).
SIGNIFICANT ACCOUNTING POLICIES
TRADE AND OTHER RECEIVABLESTrade and other receivables are recognised initially at fair value and are subsequently measured at amortised cost using the effective interest method, less an allowance for impairment. They generally have terms of up to 30 days.
IMPAIRMENT OF TRADE AND OTHER RECEIVABLESThe Group assesses at the end of each reporting period whether there is objective evidence that the Group’s receivables are impaired.
The recoverable amount of the Group’s receivables is calculated as the present value of estimated future cash flows, discounted at the original effective interest rate (that is, the effective interest rate computed at initial recognition of these financial assets). Receivables with a short duration are not discounted. A provision for impairment of receivables is not recognised until objective evidence is available that a loss event has occurred.
ASSETS ANDLIABILITIES 3Notes to the Consolidated Financial Statements
2.1 Segment disclosures from continuing operations (continued)
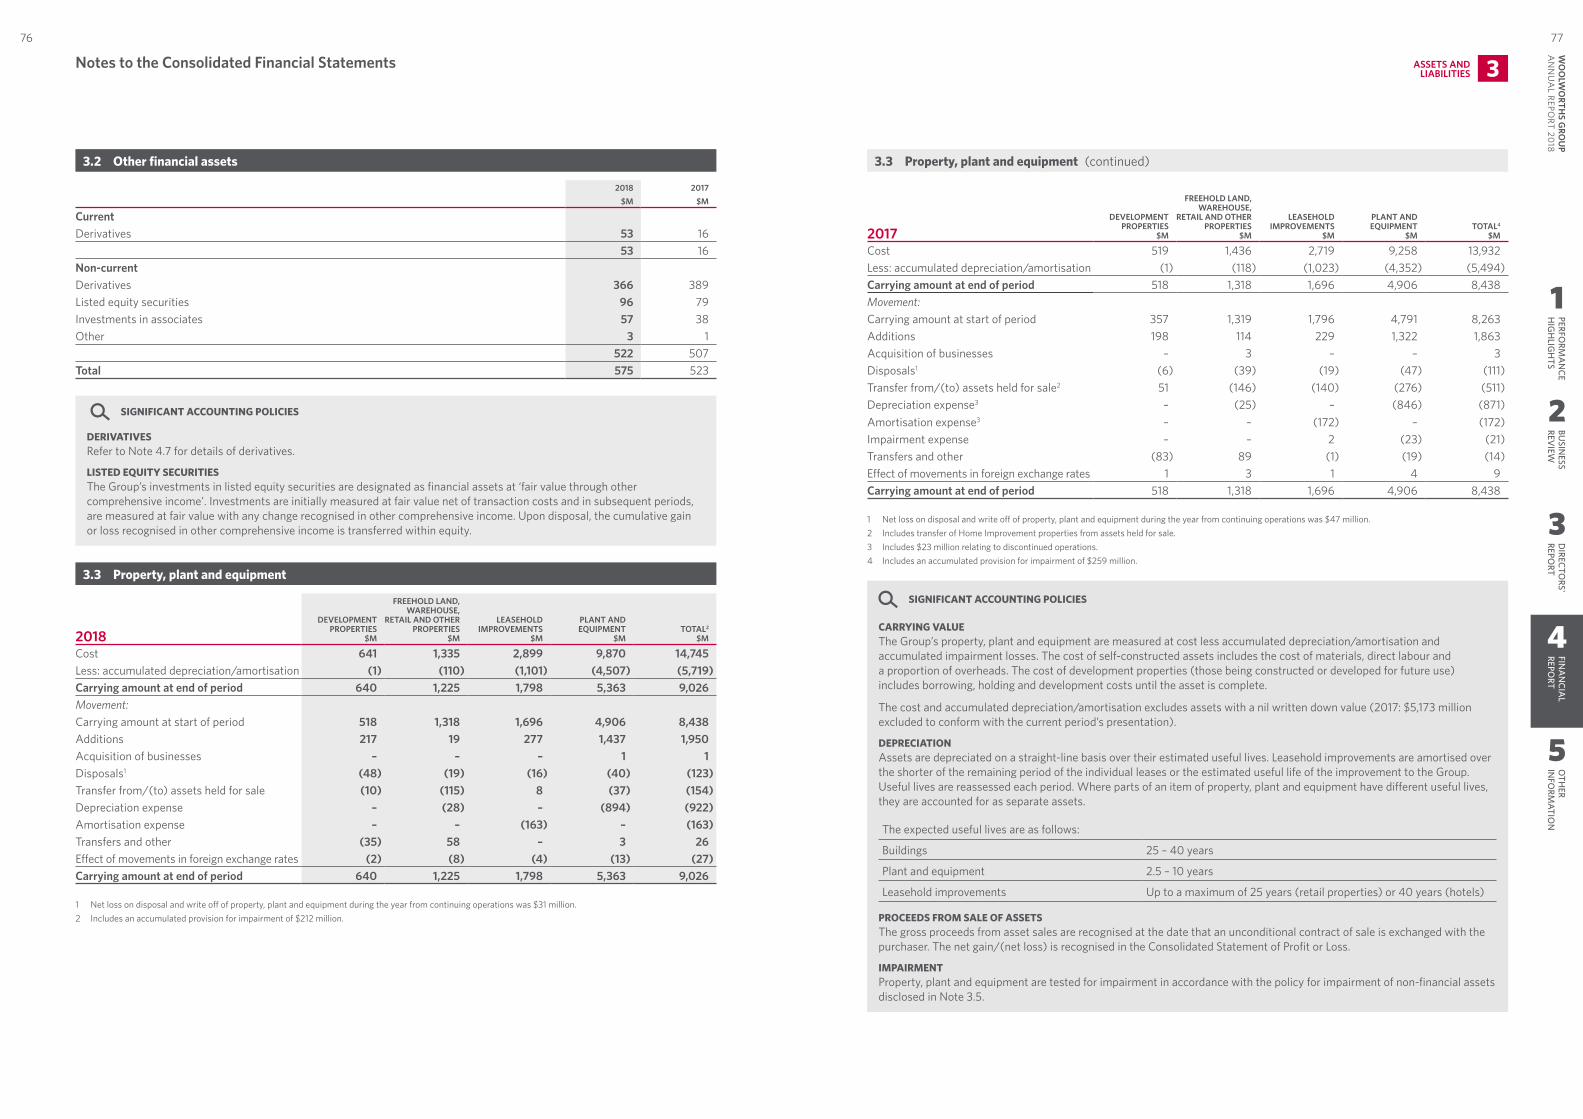
1
2
3
4
5
PERFORM
AN
CEH
IGH
LIGH
TSBU
SINESS
REVIEW
DIRECTO
RS' REPO
RTFIN
AN
CIAL
REPORT
OTH
ER IN
FORM
ATION
7776W
OO
LWO
RTHS G
ROU
P A
NN
UA
L REPORT 20
18
3.2 Other financial assets
2018 2017$M $M
CurrentDerivatives 53 16
53 16 Non‑currentDerivatives 366 389 Listed equity securities 96 79 Investments in associates 57 38 Other 3 1
522 507 Total 575 523
SIGNIFICANT ACCOUNTING POLICIES
DERIVATIVESRefer to Note 4.7 for details of derivatives.
LISTED EQUITY SECURITIESThe Group’s investments in listed equity securities are designated as financial assets at ‘fair value through other comprehensive income’. Investments are initially measured at fair value net of transaction costs and in subsequent periods, are measured at fair value with any change recognised in other comprehensive income. Upon disposal, the cumulative gain or loss recognised in other comprehensive income is transferred within equity.
3.3 Property, plant and equipment
2018DEVELOPMENT
PROPERTIES $M
FREEHOLD LAND, WAREHOUSE,
RETAIL AND OTHER PROPERTIES
$M
LEASEHOLD IMPROVEMENTS
$M
PLANT AND EQUIPMENT
$MTOTAL2
$M
Cost 641 1,335 2,899 9,870 14,745 Less: accumulated depreciation/amortisation (1) (110) (1,101) (4,507) (5,719)Carrying amount at end of period 640 1,225 1,798 5,363 9,026 Movement:Carrying amount at start of period 518 1,318 1,696 4,906 8,438 Additions 217 19 277 1,437 1,950 Acquisition of businesses – – – 1 1 Disposals1 (48) (19) (16) (40) (123)Transfer from/(to) assets held for sale (10) (115) 8 (37) (154)Depreciation expense – (28) – (894) (922)Amortisation expense – – (163) – (163)Transfers and other (35) 58 – 3 26 Effect of movements in foreign exchange rates (2) (8) (4) (13) (27)Carrying amount at end of period 640 1,225 1,798 5,363 9,026
1 Net loss on disposal and write off of property, plant and equipment during the year from continuing operations was $31 million.2 Includes an accumulated provision for impairment of $212 million.
2017DEVELOPMENT
PROPERTIES $M
FREEHOLD LAND, WAREHOUSE,
RETAIL AND OTHER PROPERTIES
$M
LEASEHOLD IMPROVEMENTS
$M
PLANT AND EQUIPMENT
$MTOTAL4
$M
Cost 519 1,436 2,719 9,258 13,932 Less: accumulated depreciation/amortisation (1) (118) (1,023) (4,352) (5,494)Carrying amount at end of period 518 1,318 1,696 4,906 8,438 Movement:Carrying amount at start of period 357 1,319 1,796 4,791 8,263 Additions 198 114 229 1,322 1,863 Acquisition of businesses – 3 – – 3 Disposals1 (6) (39) (19) (47) (111)Transfer from/(to) assets held for sale2 51 (146) (140) (276) (511)Depreciation expense3 – (25) – (846) (871)Amortisation expense3 – – (172) – (172)Impairment expense – – 2 (23) (21)Transfers and other (83) 89 (1) (19) (14)Effect of movements in foreign exchange rates 1 3 1 4 9 Carrying amount at end of period 518 1,318 1,696 4,906 8,438
1 Net loss on disposal and write off of property, plant and equipment during the year from continuing operations was $47 million.2 Includes transfer of Home Improvement properties from assets held for sale.3 Includes $23 million relating to discontinued operations.4 Includes an accumulated provision for impairment of $259 million.
SIGNIFICANT ACCOUNTING POLICIES
CARRYING VALUEThe Group’s property, plant and equipment are measured at cost less accumulated depreciation/amortisation and accumulated impairment losses. The cost of self‑constructed assets includes the cost of materials, direct labour and a proportion of overheads. The cost of development properties (those being constructed or developed for future use) includes borrowing, holding and development costs until the asset is complete.
The cost and accumulated depreciation/amortisation excludes assets with a nil written down value (2017: $5,173 million excluded to conform with the current period’s presentation).
DEPRECIATIONAssets are depreciated on a straight‑line basis over their estimated useful lives. Leasehold improvements are amortised over the shorter of the remaining period of the individual leases or the estimated useful life of the improvement to the Group. Useful lives are reassessed each period. Where parts of an item of property, plant and equipment have different useful lives, they are accounted for as separate assets.
The expected useful lives are as follows:
Buildings 25 – 40 years
Plant and equipment 2.5 – 10 years
Leasehold improvements Up to a maximum of 25 years (retail properties) or 40 years (hotels)
PROCEEDS FROM SALE OF ASSETSThe gross proceeds from asset sales are recognised at the date that an unconditional contract of sale is exchanged with the purchaser. The net gain/(net loss) is recognised in the Consolidated Statement of Profit or Loss.
IMPAIRMENTProperty, plant and equipment are tested for impairment in accordance with the policy for impairment of non‑financial assets disclosed in Note 3.5.
Notes to the Consolidated Financial Statements ASSETS ANDLIABILITIES 3
3.3 Property, plant and equipment (continued)
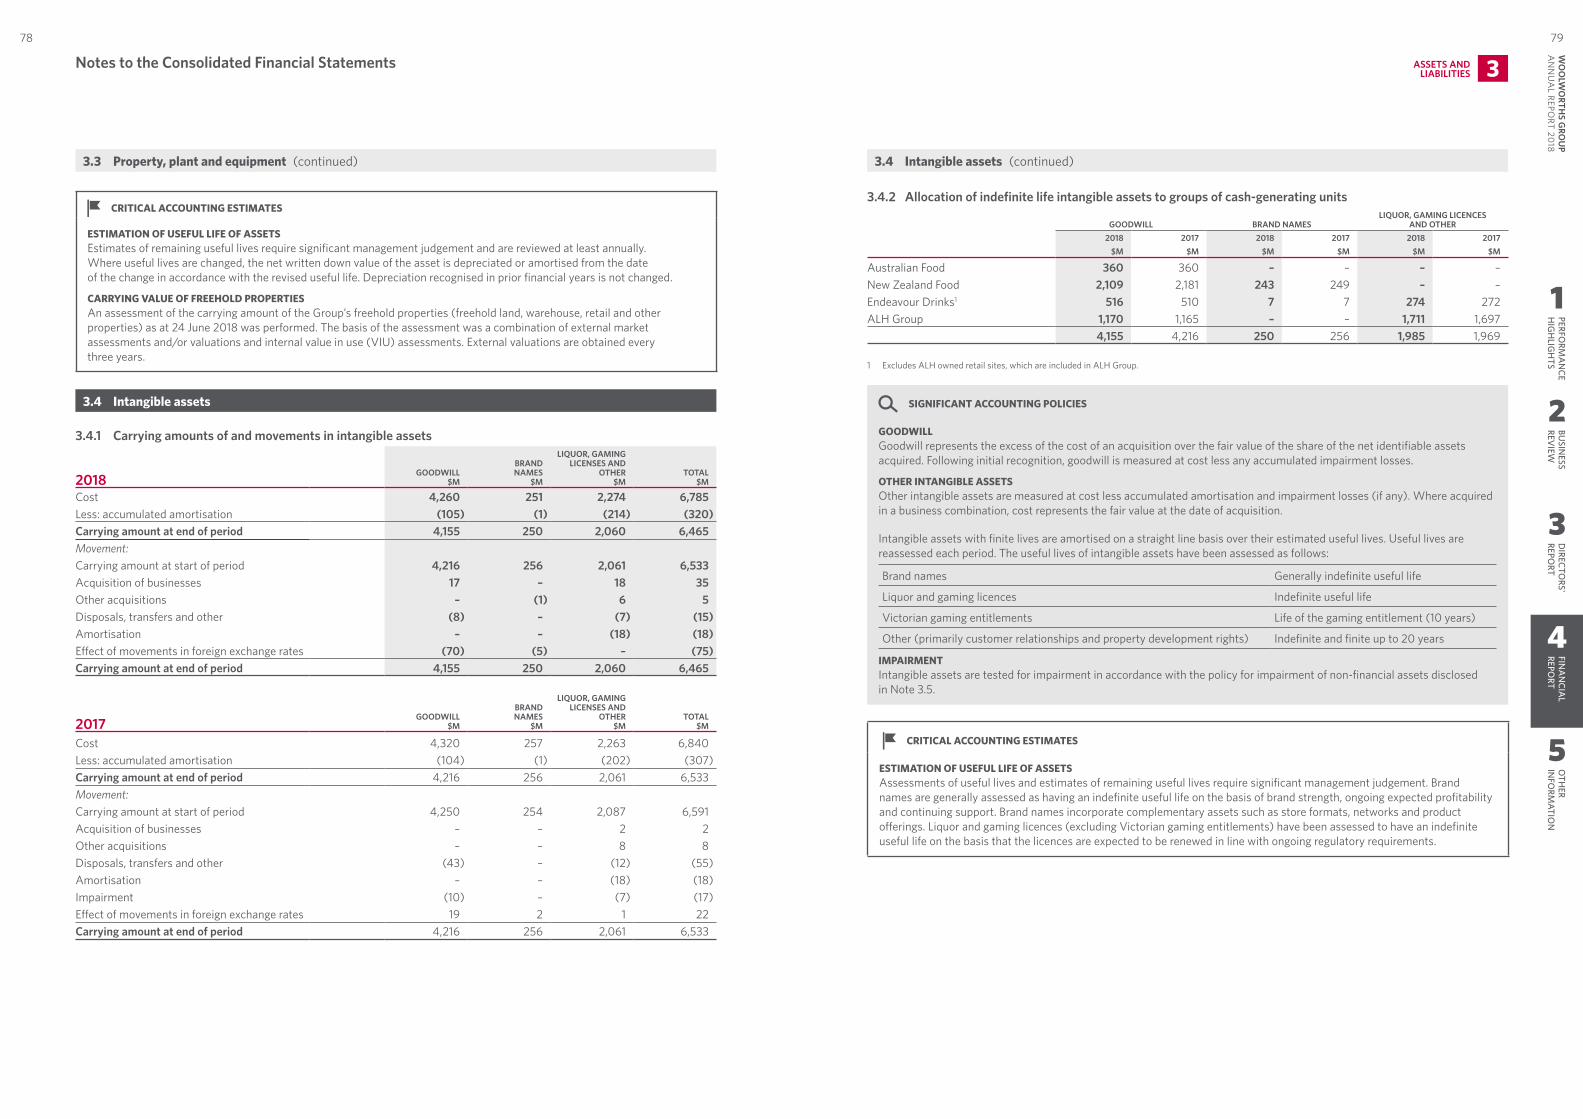
1
2
3
4
5
PERFORM
AN
CEH
IGH
LIGH
TSBU
SINESS
REVIEW
DIRECTO
RS' REPO
RTFIN
AN
CIAL
REPORT
OTH
ER IN
FORM
ATION
7978W
OO
LWO
RTHS G
ROU
P A
NN
UA
L REPORT 20
18
3.4.2 Allocation of indefinite life intangible assets to groups of cash‑generating units
GOODWILL BRAND NAMESLIQUOR, GAMING LICENCES
AND OTHER2018 2017 2018 2017 2018 2017
$M $M $M $M $M $M
Australian Food 360 360 – – – – New Zealand Food 2,109 2,181 243 249 – – Endeavour Drinks1 516 510 7 7 274 272 ALH Group 1,170 1,165 – – 1,711 1,697
4,155 4,216 250 256 1,985 1,969
1 Excludes ALH owned retail sites, which are included in ALH Group.
SIGNIFICANT ACCOUNTING POLICIES
GOODWILLGoodwill represents the excess of the cost of an acquisition over the fair value of the share of the net identifiable assets acquired. Following initial recognition, goodwill is measured at cost less any accumulated impairment losses.
OTHER INTANGIBLE ASSETSOther intangible assets are measured at cost less accumulated amortisation and impairment losses (if any). Where acquired in a business combination, cost represents the fair value at the date of acquisition.
Intangible assets with finite lives are amortised on a straight line basis over their estimated useful lives. Useful lives are reassessed each period. The useful lives of intangible assets have been assessed as follows:
Brand names Generally indefinite useful life
Liquor and gaming licences Indefinite useful life
Victorian gaming entitlements Life of the gaming entitlement (10 years)
Other (primarily customer relationships and property development rights) Indefinite and finite up to 20 years
IMPAIRMENTIntangible assets are tested for impairment in accordance with the policy for impairment of non‑financial assets disclosed in Note 3.5.
CRITICAL ACCOUNTING ESTIMATES
ESTIMATION OF USEFUL LIFE OF ASSETSAssessments of useful lives and estimates of remaining useful lives require significant management judgement. Brand names are generally assessed as having an indefinite useful life on the basis of brand strength, ongoing expected profitability and continuing support. Brand names incorporate complementary assets such as store formats, networks and product offerings. Liquor and gaming licences (excluding Victorian gaming entitlements) have been assessed to have an indefinite useful life on the basis that the licences are expected to be renewed in line with ongoing regulatory requirements.
CRITICAL ACCOUNTING ESTIMATES
ESTIMATION OF USEFUL LIFE OF ASSETSEstimates of remaining useful lives require significant management judgement and are reviewed at least annually. Where useful lives are changed, the net written down value of the asset is depreciated or amortised from the date of the change in accordance with the revised useful life. Depreciation recognised in prior financial years is not changed.
CARRYING VALUE OF FREEHOLD PROPERTIESAn assessment of the carrying amount of the Group’s freehold properties (freehold land, warehouse, retail and other properties) as at 24 June 2018 was performed. The basis of the assessment was a combination of external market assessments and/or valuations and internal value in use (VIU) assessments. External valuations are obtained every three years.
3.4 Intangible assets
3.4.1 Carrying amounts of and movements in intangible assets
2018 GOODWILL $M
BRAND NAMES
$M
LIQUOR, GAMING LICENSES AND
OTHER $M
TOTAL $M
Cost 4,260 251 2,274 6,785 Less: accumulated amortisation (105) (1) (214) (320)Carrying amount at end of period 4,155 250 2,060 6,465 Movement:Carrying amount at start of period 4,216 256 2,061 6,533 Acquisition of businesses 17 – 18 35 Other acquisitions – (1) 6 5 Disposals, transfers and other (8) – (7) (15)Amortisation – – (18) (18)Effect of movements in foreign exchange rates (70) (5) – (75)Carrying amount at end of period 4,155 250 2,060 6,465
2017 GOODWILL $M
BRAND NAMES
$M
LIQUOR, GAMING LICENSES AND
OTHER $M
TOTAL $M
Cost 4,320 257 2,263 6,840 Less: accumulated amortisation (104) (1) (202) (307)Carrying amount at end of period 4,216 256 2,061 6,533 Movement:Carrying amount at start of period 4,250 254 2,087 6,591 Acquisition of businesses – – 2 2 Other acquisitions – – 8 8 Disposals, transfers and other (43) – (12) (55)Amortisation – – (18) (18)Impairment (10) – (7) (17)Effect of movements in foreign exchange rates 19 2 1 22 Carrying amount at end of period 4,216 256 2,061 6,533
Notes to the Consolidated Financial Statements ASSETS ANDLIABILITIES 3
3.3 Property, plant and equipment (continued) 3.4 Intangible assets (continued)
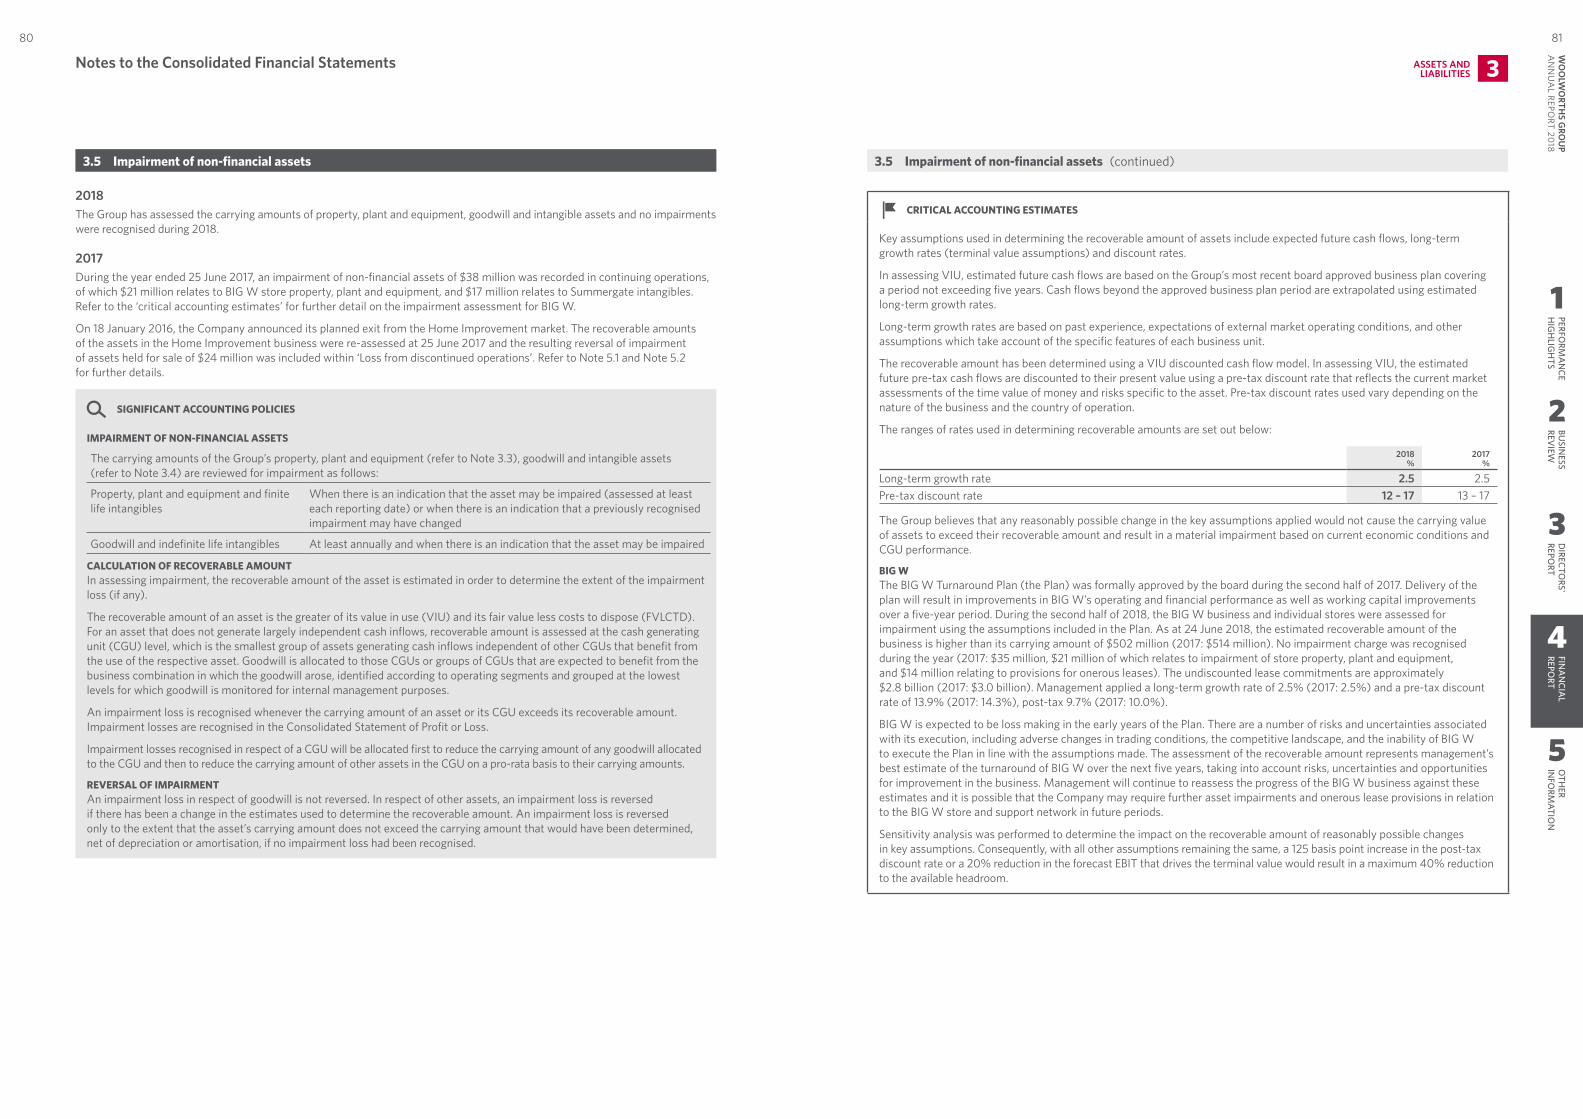
1
2
3
4
5
PERFORM
AN
CEH
IGH
LIGH
TSBU
SINESS
REVIEW
DIRECTO
RS' REPO
RTFIN
AN
CIAL
REPORT
OTH
ER IN
FORM
ATION
8180W
OO
LWO
RTHS G
ROU
P A
NN
UA
L REPORT 20
18
3.5 Impairment of non-financial assets
2018The Group has assessed the carrying amounts of property, plant and equipment, goodwill and intangible assets and no impairments were recognised during 2018.
2017During the year ended 25 June 2017, an impairment of non‑financial assets of $38 million was recorded in continuing operations, of which $21 million relates to BIG W store property, plant and equipment, and $17 million relates to Summergate intangibles. Refer to the ‘critical accounting estimates’ for further detail on the impairment assessment for BIG W.
On 18 January 2016, the Company announced its planned exit from the Home Improvement market. The recoverable amounts of the assets in the Home Improvement business were re‑assessed at 25 June 2017 and the resulting reversal of impairment of assets held for sale of $24 million was included within ‘Loss from discontinued operations’. Refer to Note 5.1 and Note 5.2 for further details.
SIGNIFICANT ACCOUNTING POLICIES
IMPAIRMENT OF NON-FINANCIAL ASSETS
The carrying amounts of the Group’s property, plant and equipment (refer to Note 3.3), goodwill and intangible assets (refer to Note 3.4) are reviewed for impairment as follows:
Property, plant and equipment and finite life intangibles
When there is an indication that the asset may be impaired (assessed at least each reporting date) or when there is an indication that a previously recognised impairment may have changed
Goodwill and indefinite life intangibles At least annually and when there is an indication that the asset may be impaired
CALCULATION OF RECOVERABLE AMOUNTIn assessing impairment, the recoverable amount of the asset is estimated in order to determine the extent of the impairment loss (if any).
The recoverable amount of an asset is the greater of its value in use (VIU) and its fair value less costs to dispose (FVLCTD). For an asset that does not generate largely independent cash inflows, recoverable amount is assessed at the cash generating unit (CGU) level, which is the smallest group of assets generating cash inflows independent of other CGUs that benefit from the use of the respective asset. Goodwill is allocated to those CGUs or groups of CGUs that are expected to benefit from the business combination in which the goodwill arose, identified according to operating segments and grouped at the lowest levels for which goodwill is monitored for internal management purposes.
An impairment loss is recognised whenever the carrying amount of an asset or its CGU exceeds its recoverable amount. Impairment losses are recognised in the Consolidated Statement of Profit or Loss.
Impairment losses recognised in respect of a CGU will be allocated first to reduce the carrying amount of any goodwill allocated to the CGU and then to reduce the carrying amount of other assets in the CGU on a pro‑rata basis to their carrying amounts.
REVERSAL OF IMPAIRMENTAn impairment loss in respect of goodwill is not reversed. In respect of other assets, an impairment loss is reversed if there has been a change in the estimates used to determine the recoverable amount. An impairment loss is reversed only to the extent that the asset’s carrying amount does not exceed the carrying amount that would have been determined, net of depreciation or amortisation, if no impairment loss had been recognised.
CRITICAL ACCOUNTING ESTIMATES
Key assumptions used in determining the recoverable amount of assets include expected future cash flows, long‑term growth rates (terminal value assumptions) and discount rates.
In assessing VIU, estimated future cash flows are based on the Group’s most recent board approved business plan covering a period not exceeding five years. Cash flows beyond the approved business plan period are extrapolated using estimated long‑term growth rates.
Long‑term growth rates are based on past experience, expectations of external market operating conditions, and other assumptions which take account of the specific features of each business unit.
The recoverable amount has been determined using a VIU discounted cash flow model. In assessing VIU, the estimated future pre‑tax cash flows are discounted to their present value using a pre‑tax discount rate that reflects the current market assessments of the time value of money and risks specific to the asset. Pre‑tax discount rates used vary depending on the nature of the business and the country of operation.
The ranges of rates used in determining recoverable amounts are set out below:
2018%
2017%
Long‑term growth rate 2.5 2.5Pre‑tax discount rate 12 – 17 13 – 17
The Group believes that any reasonably possible change in the key assumptions applied would not cause the carrying value of assets to exceed their recoverable amount and result in a material impairment based on current economic conditions and CGU performance.
BIG WThe BIG W Turnaround Plan (the Plan) was formally approved by the board during the second half of 2017. Delivery of the plan will result in improvements in BIG W’s operating and financial performance as well as working capital improvements over a five‑year period. During the second half of 2018, the BIG W business and individual stores were assessed for impairment using the assumptions included in the Plan. As at 24 June 2018, the estimated recoverable amount of the business is higher than its carrying amount of $502 million (2017: $514 million). No impairment charge was recognised during the year (2017: $35 million, $21 million of which relates to impairment of store property, plant and equipment, and $14 million relating to provisions for onerous leases). The undiscounted lease commitments are approximately $2.8 billion (2017: $3.0 billion). Management applied a long‑term growth rate of 2.5% (2017: 2.5%) and a pre‑tax discount rate of 13.9% (2017: 14.3%), post‑tax 9.7% (2017: 10.0%).
BIG W is expected to be loss making in the early years of the Plan. There are a number of risks and uncertainties associated with its execution, including adverse changes in trading conditions, the competitive landscape, and the inability of BIG W to execute the Plan in line with the assumptions made. The assessment of the recoverable amount represents management’s best estimate of the turnaround of BIG W over the next five years, taking into account risks, uncertainties and opportunities for improvement in the business. Management will continue to reassess the progress of the BIG W business against these estimates and it is possible that the Company may require further asset impairments and onerous lease provisions in relation to the BIG W store and support network in future periods.
Sensitivity analysis was performed to determine the impact on the recoverable amount of reasonably possible changes in key assumptions. Consequently, with all other assumptions remaining the same, a 125 basis point increase in the post‑tax discount rate or a 20% reduction in the forecast EBIT that drives the terminal value would result in a maximum 40% reduction to the available headroom.
Notes to the Consolidated Financial Statements ASSETS ANDLIABILITIES 3
3.5 Impairment of non-financial assets (continued)
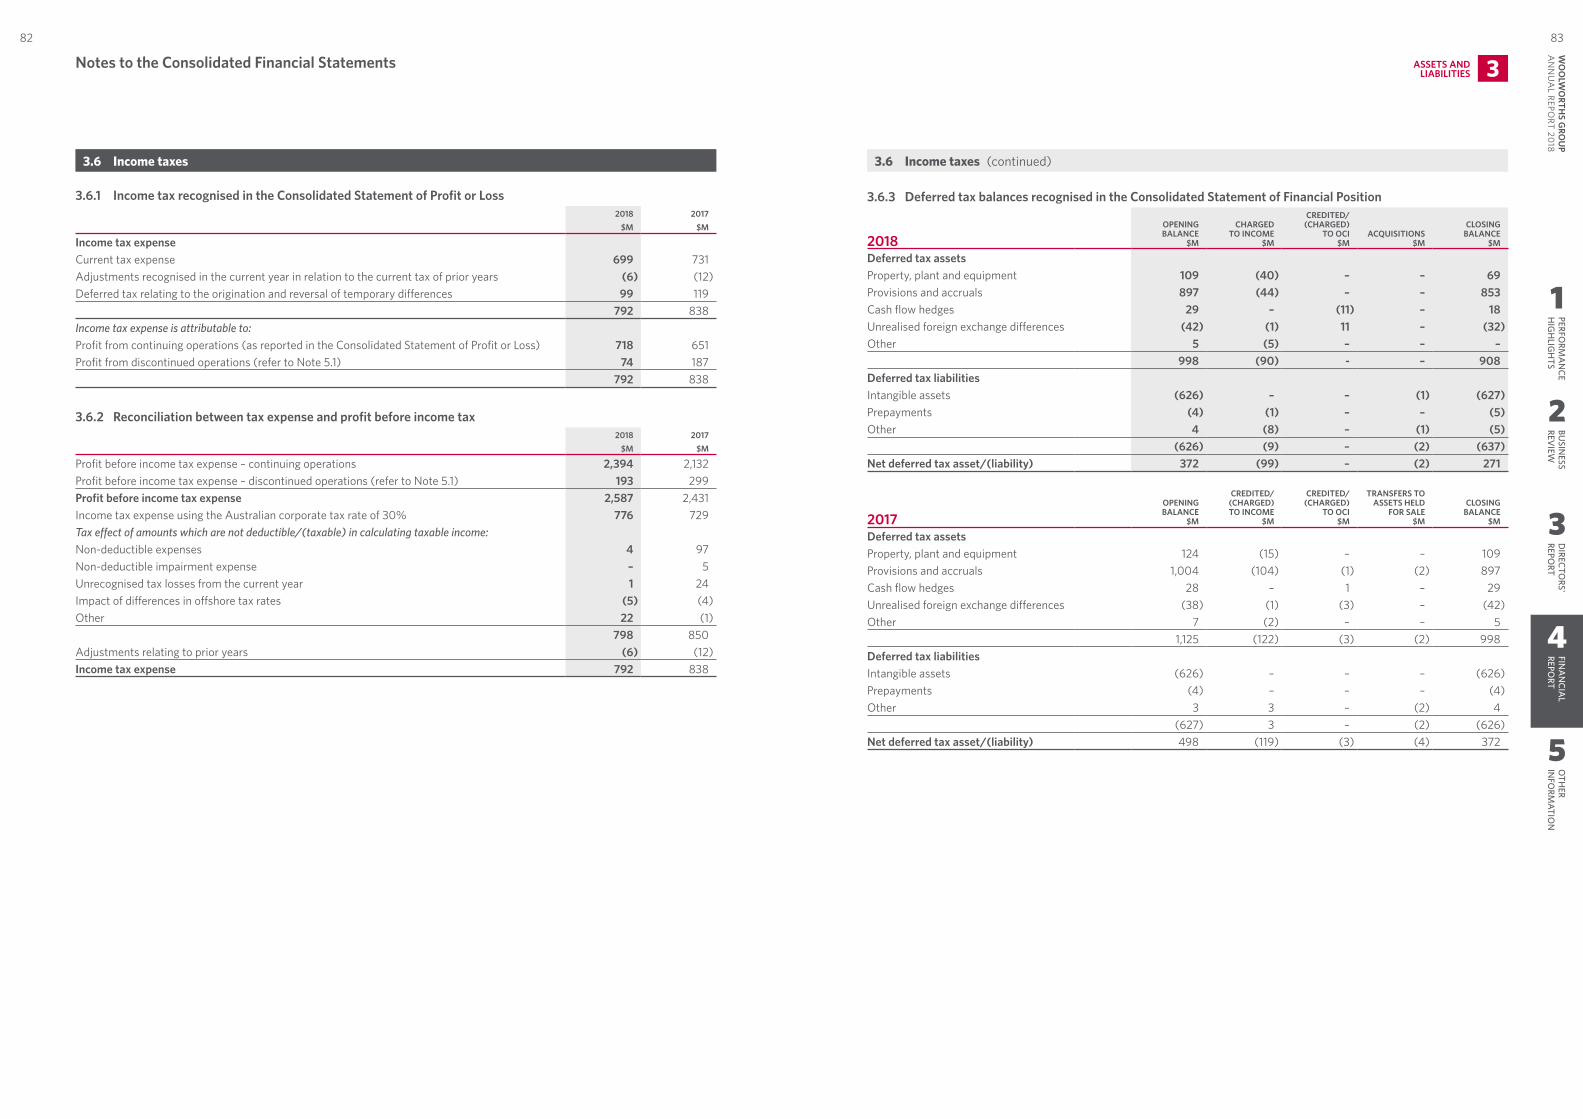
1
2
3
4
5
PERFORM
AN
CEH
IGH
LIGH
TSBU
SINESS
REVIEW
DIRECTO
RS' REPO
RTFIN
AN
CIAL
REPORT
OTH
ER IN
FORM
ATION
8382W
OO
LWO
RTHS G
ROU
P A
NN
UA
L REPORT 20
18
3.6 Income taxes
3.6.1 Income tax recognised in the Consolidated Statement of Profit or Loss2018 2017
$M $M
Income tax expenseCurrent tax expense 699 731 Adjustments recognised in the current year in relation to the current tax of prior years (6) (12)Deferred tax relating to the origination and reversal of temporary differences 99 119
792 838 Income tax expense is attributable to:Profit from continuing operations (as reported in the Consolidated Statement of Profit or Loss) 718 651 Profit from discontinued operations (refer to Note 5.1) 74 187
792 838
3.6.2 Reconciliation between tax expense and profit before income tax2018 2017
$M $M
Profit before income tax expense – continuing operations 2,394 2,132 Profit before income tax expense – discontinued operations (refer to Note 5.1) 193 299 Profit before income tax expense 2,587 2,431 Income tax expense using the Australian corporate tax rate of 30% 776 729 Tax effect of amounts which are not deductible/(taxable) in calculating taxable income:Non‑deductible expenses 4 97 Non‑deductible impairment expense – 5 Unrecognised tax losses from the current year 1 24 Impact of differences in offshore tax rates (5) (4)Other 22 (1)
798 850 Adjustments relating to prior years (6) (12)Income tax expense 792 838
3.6.3 Deferred tax balances recognised in the Consolidated Statement of Financial Position
2018OPENING BALANCE
$M
CHARGED TO INCOME
$M
CREDITED/ (CHARGED)
TO OCI $M
ACQUISITIONS $M
CLOSING BALANCE
$M
Deferred tax assetsProperty, plant and equipment 109 (40) – – 69 Provisions and accruals 897 (44) – – 853 Cash flow hedges 29 – (11) – 18 Unrealised foreign exchange differences (42) (1) 11 – (32)Other 5 (5) – – –
998 (90) ‑ – 908 Deferred tax liabilitiesIntangible assets (626) – – (1) (627)Prepayments (4) (1) – – (5)Other 4 (8) – (1) (5)
(626) (9) – (2) (637)Net deferred tax asset/(liability) 372 (99) – (2) 271
2017OPENING BALANCE
$M
CREDITED/ (CHARGED) TO INCOME
$M
CREDITED/ (CHARGED)
TO OCI $M
TRANSFERS TO ASSETS HELD
FOR SALE $M
CLOSING BALANCE
$M
Deferred tax assetsProperty, plant and equipment 124 (15) – – 109 Provisions and accruals 1,004 (104) (1) (2) 897 Cash flow hedges 28 – 1 – 29 Unrealised foreign exchange differences (38) (1) (3) – (42)Other 7 (2) – – 5
1,125 (122) (3) (2) 998 Deferred tax liabilitiesIntangible assets (626) – – – (626)Prepayments (4) – – – (4)Other 3 3 – (2) 4
(627) 3 – (2) (626)Net deferred tax asset/(liability) 498 (119) (3) (4) 372
Notes to the Consolidated Financial Statements ASSETS ANDLIABILITIES 3
3.6 Income taxes (continued)
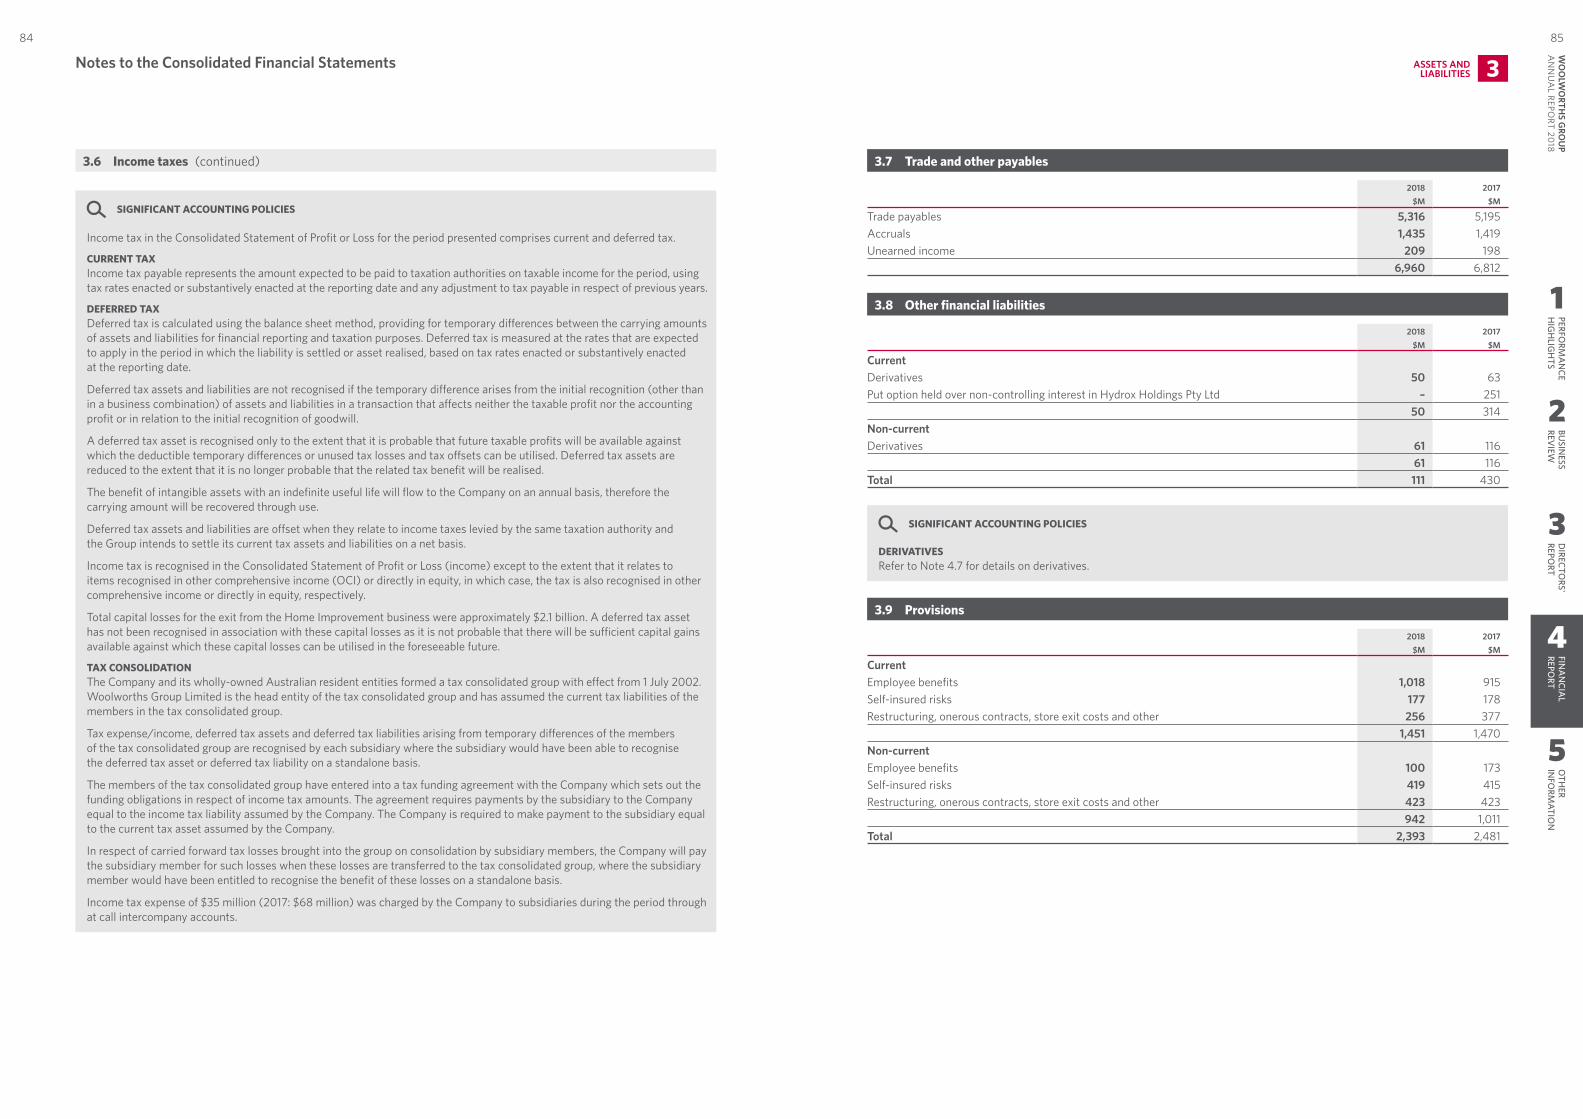
1
2
3
4
5
PERFORM
AN
CEH
IGH
LIGH
TSBU
SINESS
REVIEW
DIRECTO
RS' REPO
RTFIN
AN
CIAL
REPORT
OTH
ER IN
FORM
ATION
8584W
OO
LWO
RTHS G
ROU
P A
NN
UA
L REPORT 20
18
SIGNIFICANT ACCOUNTING POLICIES
Income tax in the Consolidated Statement of Profit or Loss for the period presented comprises current and deferred tax.
CURRENT TAXIncome tax payable represents the amount expected to be paid to taxation authorities on taxable income for the period, using tax rates enacted or substantively enacted at the reporting date and any adjustment to tax payable in respect of previous years.
DEFERRED TAXDeferred tax is calculated using the balance sheet method, providing for temporary differences between the carrying amounts of assets and liabilities for financial reporting and taxation purposes. Deferred tax is measured at the rates that are expected to apply in the period in which the liability is settled or asset realised, based on tax rates enacted or substantively enacted at the reporting date.
Deferred tax assets and liabilities are not recognised if the temporary difference arises from the initial recognition (other than in a business combination) of assets and liabilities in a transaction that affects neither the taxable profit nor the accounting profit or in relation to the initial recognition of goodwill.
A deferred tax asset is recognised only to the extent that it is probable that future taxable profits will be available against which the deductible temporary differences or unused tax losses and tax offsets can be utilised. Deferred tax assets are reduced to the extent that it is no longer probable that the related tax benefit will be realised.
The benefit of intangible assets with an indefinite useful life will flow to the Company on an annual basis, therefore the carrying amount will be recovered through use.
Deferred tax assets and liabilities are offset when they relate to income taxes levied by the same taxation authority and the Group intends to settle its current tax assets and liabilities on a net basis.
Income tax is recognised in the Consolidated Statement of Profit or Loss (income) except to the extent that it relates to items recognised in other comprehensive income (OCI) or directly in equity, in which case, the tax is also recognised in other comprehensive income or directly in equity, respectively.
Total capital losses for the exit from the Home Improvement business were approximately $2.1 billion. A deferred tax asset has not been recognised in association with these capital losses as it is not probable that there will be sufficient capital gains available against which these capital losses can be utilised in the foreseeable future.
TAX CONSOLIDATIONThe Company and its wholly‑owned Australian resident entities formed a tax consolidated group with effect from 1 July 2002. Woolworths Group Limited is the head entity of the tax consolidated group and has assumed the current tax liabilities of the members in the tax consolidated group.
Tax expense/income, deferred tax assets and deferred tax liabilities arising from temporary differences of the members of the tax consolidated group are recognised by each subsidiary where the subsidiary would have been able to recognise the deferred tax asset or deferred tax liability on a standalone basis.
The members of the tax consolidated group have entered into a tax funding agreement with the Company which sets out the funding obligations in respect of income tax amounts. The agreement requires payments by the subsidiary to the Company equal to the income tax liability assumed by the Company. The Company is required to make payment to the subsidiary equal to the current tax asset assumed by the Company.
In respect of carried forward tax losses brought into the group on consolidation by subsidiary members, the Company will pay the subsidiary member for such losses when these losses are transferred to the tax consolidated group, where the subsidiary member would have been entitled to recognise the benefit of these losses on a standalone basis.
Income tax expense of $35 million (2017: $68 million) was charged by the Company to subsidiaries during the period through at call intercompany accounts.
3.7 Trade and other payables
2018 2017$M $M
Trade payables 5,316 5,195 Accruals 1,435 1,419 Unearned income 209 198
6,960 6,812
3.8 Other financial liabilities
2018 2017$M $M
CurrentDerivatives 50 63 Put option held over non‑controlling interest in Hydrox Holdings Pty Ltd – 251
50 314 Non‑currentDerivatives 61 116
61 116 Total 111 430
SIGNIFICANT ACCOUNTING POLICIES
DERIVATIVESRefer to Note 4.7 for details on derivatives.
3.9 Provisions
2018 2017$M $M
CurrentEmployee benefits 1,018 915 Self‑insured risks 177 178 Restructuring, onerous contracts, store exit costs and other 256 377
1,451 1,470 Non‑currentEmployee benefits 100 173 Self‑insured risks 419 415 Restructuring, onerous contracts, store exit costs and other 423 423
942 1,011 Total 2,393 2,481
Notes to the Consolidated Financial Statements ASSETS ANDLIABILITIES 3
3.6 Income taxes (continued)
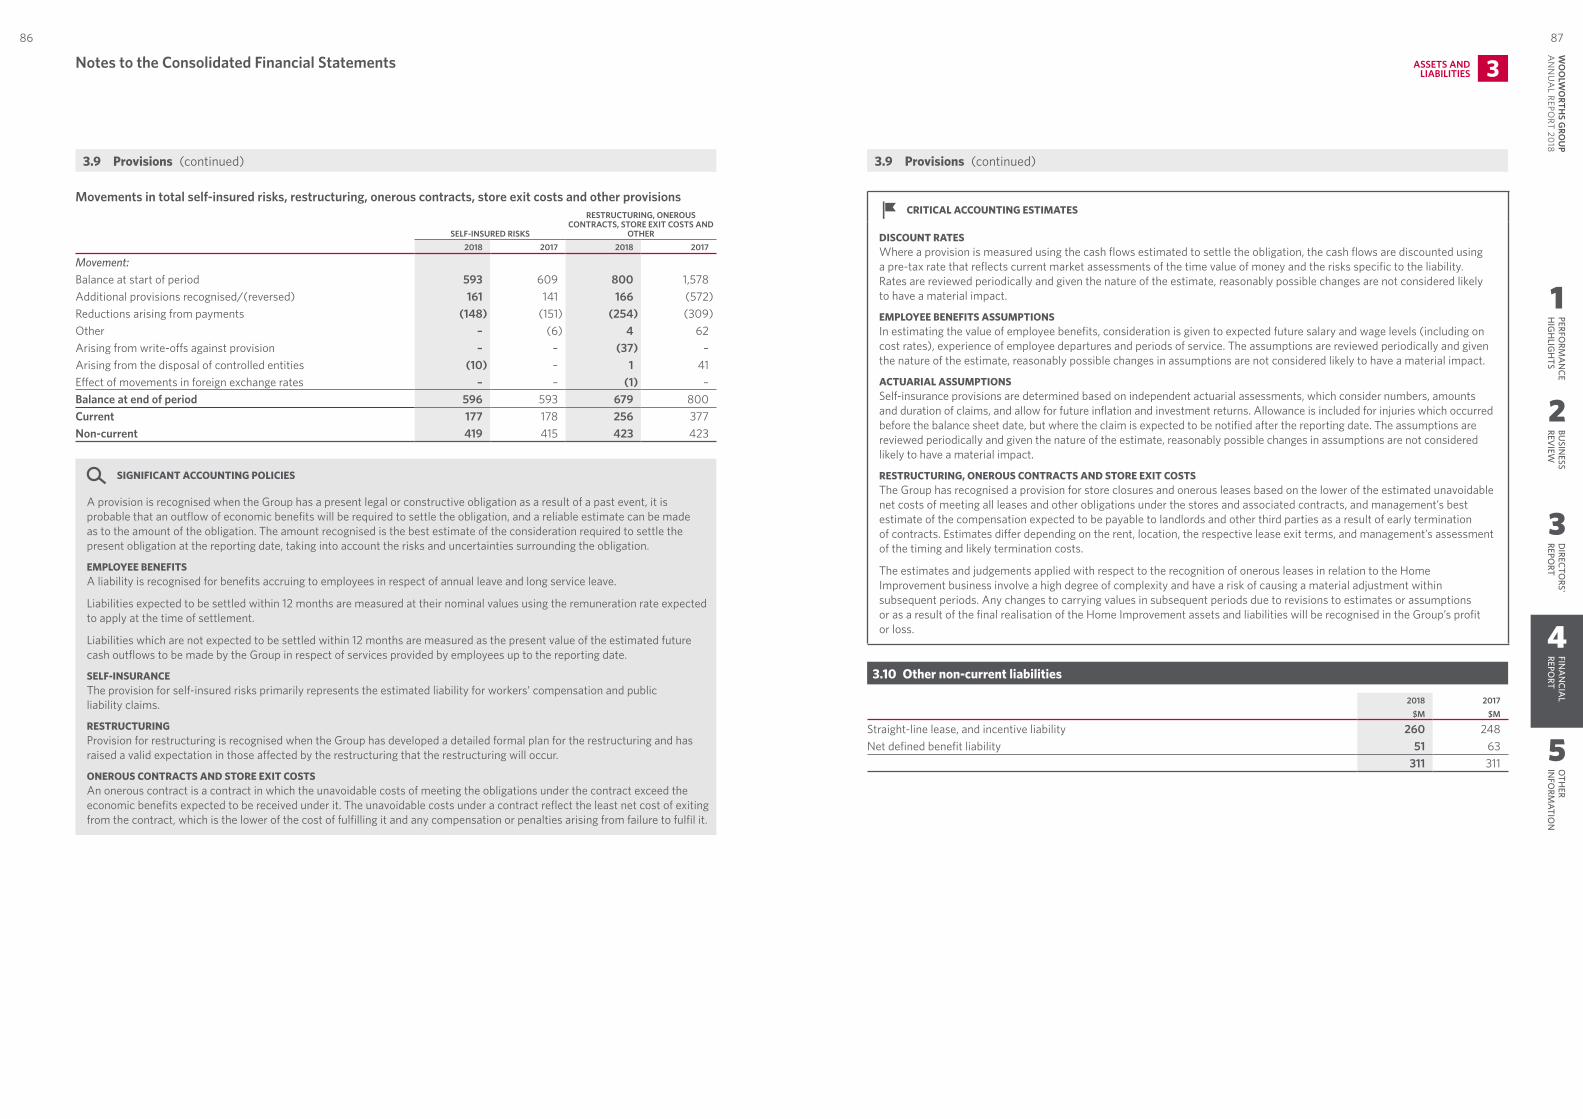
1
2
3
4
5
PERFORM
AN
CEH
IGH
LIGH
TSBU
SINESS
REVIEW
DIRECTO
RS' REPO
RTFIN
AN
CIAL
REPORT
OTH
ER IN
FORM
ATION
8786W
OO
LWO
RTHS G
ROU
P A
NN
UA
L REPORT 20
18
Movements in total self‑insured risks, restructuring, onerous contracts, store exit costs and other provisions
SELF‑INSURED RISKS
RESTRUCTURING, ONEROUS CONTRACTS, STORE EXIT COSTS AND
OTHER2018 2017 2018 2017
Movement:Balance at start of period 593 609 800 1,578 Additional provisions recognised/(reversed) 161 141 166 (572)Reductions arising from payments (148) (151) (254) (309)Other – (6) 4 62 Arising from write‑offs against provision – – (37) – Arising from the disposal of controlled entities (10) – 1 41 Effect of movements in foreign exchange rates – – (1) – Balance at end of period 596 593 679 800 Current 177 178 256 377 Non‑current 419 415 423 423
SIGNIFICANT ACCOUNTING POLICIES
A provision is recognised when the Group has a present legal or constructive obligation as a result of a past event, it is probable that an outflow of economic benefits will be required to settle the obligation, and a reliable estimate can be made as to the amount of the obligation. The amount recognised is the best estimate of the consideration required to settle the present obligation at the reporting date, taking into account the risks and uncertainties surrounding the obligation.
EMPLOYEE BENEFITSA liability is recognised for benefits accruing to employees in respect of annual leave and long service leave.
Liabilities expected to be settled within 12 months are measured at their nominal values using the remuneration rate expected to apply at the time of settlement.
Liabilities which are not expected to be settled within 12 months are measured as the present value of the estimated future cash outflows to be made by the Group in respect of services provided by employees up to the reporting date.
SELF-INSURANCEThe provision for self‑insured risks primarily represents the estimated liability for workers’ compensation and public liability claims.
RESTRUCTURINGProvision for restructuring is recognised when the Group has developed a detailed formal plan for the restructuring and has raised a valid expectation in those affected by the restructuring that the restructuring will occur.
ONEROUS CONTRACTS AND STORE EXIT COSTSAn onerous contract is a contract in which the unavoidable costs of meeting the obligations under the contract exceed the economic benefits expected to be received under it. The unavoidable costs under a contract reflect the least net cost of exiting from the contract, which is the lower of the cost of fulfilling it and any compensation or penalties arising from failure to fulfil it.
CRITICAL ACCOUNTING ESTIMATES
DISCOUNT RATESWhere a provision is measured using the cash flows estimated to settle the obligation, the cash flows are discounted using a pre‑tax rate that reflects current market assessments of the time value of money and the risks specific to the liability. Rates are reviewed periodically and given the nature of the estimate, reasonably possible changes are not considered likely to have a material impact.
EMPLOYEE BENEFITS ASSUMPTIONSIn estimating the value of employee benefits, consideration is given to expected future salary and wage levels (including on cost rates), experience of employee departures and periods of service. The assumptions are reviewed periodically and given the nature of the estimate, reasonably possible changes in assumptions are not considered likely to have a material impact.
ACTUARIAL ASSUMPTIONSSelf‑insurance provisions are determined based on independent actuarial assessments, which consider numbers, amounts and duration of claims, and allow for future inflation and investment returns. Allowance is included for injuries which occurred before the balance sheet date, but where the claim is expected to be notified after the reporting date. The assumptions are reviewed periodically and given the nature of the estimate, reasonably possible changes in assumptions are not considered likely to have a material impact.
RESTRUCTURING, ONEROUS CONTRACTS AND STORE EXIT COSTSThe Group has recognised a provision for store closures and onerous leases based on the lower of the estimated unavoidable net costs of meeting all leases and other obligations under the stores and associated contracts, and management’s best estimate of the compensation expected to be payable to landlords and other third parties as a result of early termination of contracts. Estimates differ depending on the rent, location, the respective lease exit terms, and management’s assessment of the timing and likely termination costs.
The estimates and judgements applied with respect to the recognition of onerous leases in relation to the Home Improvement business involve a high degree of complexity and have a risk of causing a material adjustment within subsequent periods. Any changes to carrying values in subsequent periods due to revisions to estimates or assumptions or as a result of the final realisation of the Home Improvement assets and liabilities will be recognised in the Group’s profit or loss.
3.10 Other non-current liabilities
2018 2017$M $M
Straight‑line lease, and incentive liability 260 248 Net defined benefit liability 51 63
311 311
Notes to the Consolidated Financial Statements ASSETS ANDLIABILITIES 3
3.9 Provisions (continued) 3.9 Provisions (continued)
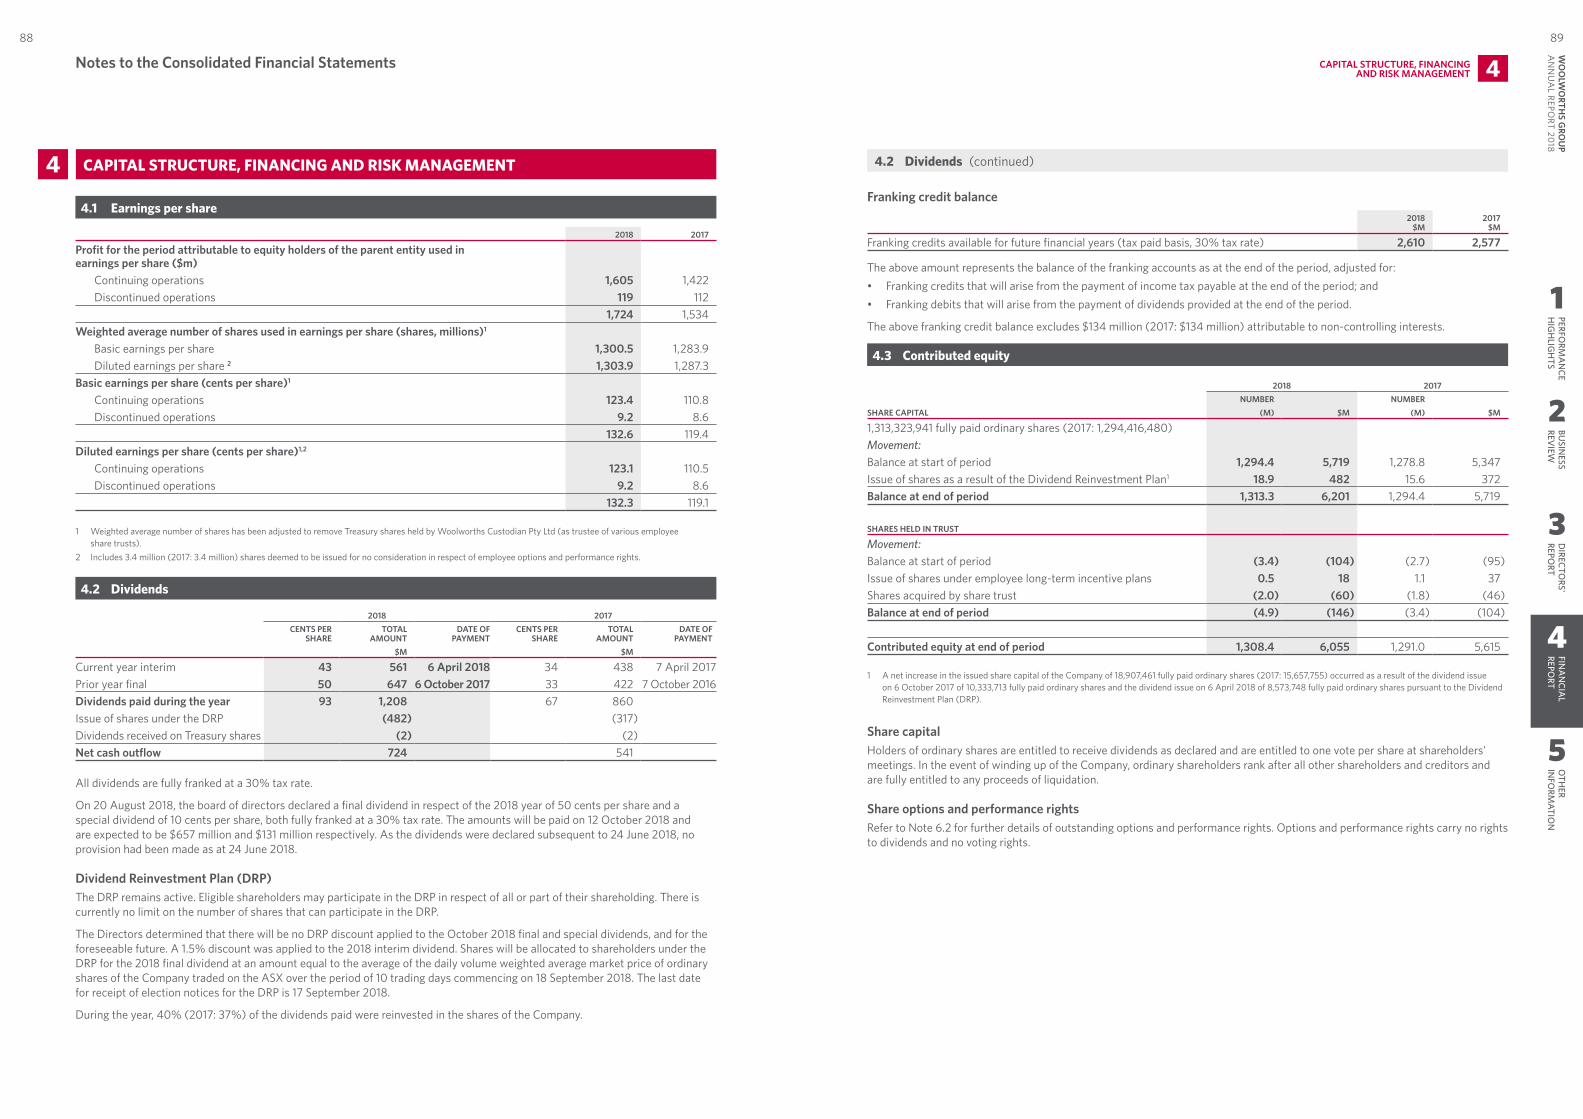
1
2
3
4
5
PERFORM
AN
CEH
IGH
LIGH
TSBU
SINESS
REVIEW
DIRECTO
RS' REPO
RTFIN
AN
CIAL
REPORT
OTH
ER IN
FORM
ATION
8988W
OO
LWO
RTHS G
ROU
P A
NN
UA
L REPORT 20
18
Franking credit balance2018
$M2017
$M
Franking credits available for future financial years (tax paid basis, 30% tax rate) 2,610 2,577
The above amount represents the balance of the franking accounts as at the end of the period, adjusted for:• Franking credits that will arise from the payment of income tax payable at the end of the period; and• Franking debits that will arise from the payment of dividends provided at the end of the period.
The above franking credit balance excludes $134 million (2017: $134 million) attributable to non‑controlling interests.
4.3 Contributed equity
2018 2017
SHARE CAPITALNUMBER
$MNUMBER
$M(M) (M)
1,313,323,941 fully paid ordinary shares (2017: 1,294,416,480)Movement:Balance at start of period 1,294.4 5,719 1,278.8 5,347 Issue of shares as a result of the Dividend Reinvestment Plan1 18.9 482 15.6 372 Balance at end of period 1,313.3 6,201 1,294.4 5,719
SHARES HELD IN TRUST
Movement:Balance at start of period (3.4) (104) (2.7) (95)Issue of shares under employee long‑term incentive plans 0.5 18 1.1 37 Shares acquired by share trust (2.0) (60) (1.8) (46)Balance at end of period (4.9) (146) (3.4) (104)
Contributed equity at end of period 1,308.4 6,055 1,291.0 5,615
1 A net increase in the issued share capital of the Company of 18,907,461 fully paid ordinary shares (2017: 15,657,755) occurred as a result of the dividend issue on 6 October 2017 of 10,333,713 fully paid ordinary shares and the dividend issue on 6 April 2018 of 8,573,748 fully paid ordinary shares pursuant to the Dividend Reinvestment Plan (DRP).
Share capitalHolders of ordinary shares are entitled to receive dividends as declared and are entitled to one vote per share at shareholders’ meetings. In the event of winding up of the Company, ordinary shareholders rank after all other shareholders and creditors and are fully entitled to any proceeds of liquidation.
Share options and performance rightsRefer to Note 6.2 for further details of outstanding options and performance rights. Options and performance rights carry no rights to dividends and no voting rights.
4 CAPITAL STRUCTURE, FINANCING AND RISK MANAGEMENT
4.1 Earnings per share
2018 2017
Profit for the period attributable to equity holders of the parent entity used in earnings per share ($m)
Continuing operations 1,605 1,422 Discontinued operations 119 112
1,724 1,534 Weighted average number of shares used in earnings per share (shares, millions)1
Basic earnings per share 1,300.5 1,283.9 Diluted earnings per share 2 1,303.9 1,287.3
Basic earnings per share (cents per share)1
Continuing operations 123.4 110.8 Discontinued operations 9.2 8.6
132.6 119.4 Diluted earnings per share (cents per share)1,2
Continuing operations 123.1 110.5 Discontinued operations 9.2 8.6
132.3 119.1
1 Weighted average number of shares has been adjusted to remove Treasury shares held by Woolworths Custodian Pty Ltd (as trustee of various employee share trusts).
2 Includes 3.4 million (2017: 3.4 million) shares deemed to be issued for no consideration in respect of employee options and performance rights.
4.2 Dividends
2018 2017CENTS PER
SHARETOTAL
AMOUNTDATE OF
PAYMENTCENTS PER
SHARETOTAL
AMOUNTDATE OF
PAYMENT$M $M
Current year interim 43 561 6 April 2018 34 438 7 April 2017Prior year final 50 647 6 October 2017 33 422 7 October 2016Dividends paid during the year 93 1,208 67 860 Issue of shares under the DRP (482) (317)Dividends received on Treasury shares (2) (2)Net cash outflow 724 541
All dividends are fully franked at a 30% tax rate.
On 20 August 2018, the board of directors declared a final dividend in respect of the 2018 year of 50 cents per share and a special dividend of 10 cents per share, both fully franked at a 30% tax rate. The amounts will be paid on 12 October 2018 and are expected to be $657 million and $131 million respectively. As the dividends were declared subsequent to 24 June 2018, no provision had been made as at 24 June 2018.
Dividend Reinvestment Plan (DRP)The DRP remains active. Eligible shareholders may participate in the DRP in respect of all or part of their shareholding. There is currently no limit on the number of shares that can participate in the DRP.
The Directors determined that there will be no DRP discount applied to the October 2018 final and special dividends, and for the foreseeable future. A 1.5% discount was applied to the 2018 interim dividend. Shares will be allocated to shareholders under the DRP for the 2018 final dividend at an amount equal to the average of the daily volume weighted average market price of ordinary shares of the Company traded on the ASX over the period of 10 trading days commencing on 18 September 2018. The last date for receipt of election notices for the DRP is 17 September 2018.
During the year, 40% (2017: 37%) of the dividends paid were reinvested in the shares of the Company.
CAPITAL STRUCTURE, FINANCINGAND RISK MANAGEMENT 4Notes to the Consolidated Financial Statements
4.2 Dividends (continued)

1
2
3
4
5
PERFORM
AN
CEH
IGH
LIGH
TSBU
SINESS
REVIEW
DIRECTO
RS' REPO
RTFIN
AN
CIAL
REPORT
OTH
ER IN
FORM
ATION
9190W
OO
LWO
RTHS G
ROU
P A
NN
UA
L REPORT 20
18
4.4 Reserves
2018 2017$M $M
Hedging reserve (43) (66)Foreign currency translation reserve 58 139 Remuneration reserve 279 242 Asset revaluation reserve 17 17 Equity instrument reserve 42 25
353 357
SIGNIFICANT ACCOUNTING POLICIES
The nature and purpose of each reserve account is outlined as follows:
HEDGING RESERVEThe hedging reserve comprises the effective portion of the cumulative net change in the fair value of cash flow hedging instruments related to hedged transactions that have not yet occurred. The cumulative deferred gain or loss on the hedge is recognised in the Consolidated Statement of Profit or Loss when the hedged transaction impacts the profit or loss, consistent with the applicable accounting policy. Refer to Note 4.7 for details of hedging.
FOREIGN CURRENCY TRANSLATION RESERVE (FCTR)FCTR comprises all foreign exchange differences arising from the translation of the financial statements of foreign operations where their functional currency is different to the Group’s presentation currency. Gains and losses on hedging instruments that are designated as hedging instruments for hedges of net investments in foreign operations are also included in the FCTR. Refer to Note 4.7 for details of hedging.
REMUNERATION RESERVEThe employee remuneration reserve comprises the fair value of share based payment plans recognised as an expense in the Consolidated Statement of Profit or Loss. Refer to Note 6.2 for details of share based payments. Shares issued by the Woolworths Employee Share Trust are charged against the reserve.
ASSET REVALUATION RESERVEThe asset revaluation reserve arose on acquisition of the previously equity accounted investment in MGW Hotels Pty Ltd and relates to the change in fair value of the Group’s interest in non‑current assets from the date of acquisition of the initial investment to the date control was achieved.
EQUITY INSTRUMENT RESERVEThe equity instrument reserve arises on the revaluation of investments in equity securities. Subsequent to initial recognition, they are measured at fair value with any changes recognised in other comprehensive income. Upon disposal, the cumulative gain or loss recognised in other comprehensive income is transferred within equity. Refer to Note 3.2 for details of listed equity securities.
4.5 Net cash provided by operating activities
Cash and cash equivalents as presented in the Consolidated Statement of Cash Flows2018 2017
$M $M
Cash and cash equivalents (as presented in the Consolidated Statement of Financial Position) 1,273 909 Cash and cash equivalents (included within assets held for sale) 4 8
1,277 917
Reconciliation of profit for the period to net cash provided by operating activities2018 2017
$M $M
Profit after income tax expense 1,795 1,593 Adjustments for:Depreciation and amortisation 1,103 1,061 Put option liability – 251 (Reversal of impairment)/impairment of non‑financial assets (24) 14 Share‑based payments expense 59 52 (Profit)/loss on disposal of business (14) 47 Interest capitalised (34) (30)Net loss/(profit) on disposal and write‑off of property, plant and equipment 20 (4)Dividends received (4) (4)Other (59) 32
Changes in:(Increase)/decrease in inventories (60) 305 Increase in trade payables 129 323 Decrease in provisions1 (61) (822)(Increase)/decrease in trade and other receivables (142) 3 Increase in sundry payables 96 134 Decrease in deferred tax assets 98 122 Increase in income tax payable 28 45 Net cash provided by operating activities 2,930 3,122
1 Includes restructuring, onerous contracts and store exit costs.
Notes to the Consolidated Financial Statements CAPITAL STRUCTURE, FINANCINGAND RISK MANAGEMENT 4

1
2
3
4
5
PERFORM
AN
CEH
IGH
LIGH
TSBU
SINESS
REVIEW
DIRECTO
RS' REPO
RTFIN
AN
CIAL
REPORT
OTH
ER IN
FORM
ATION
9392W
OO
LWO
RTHS G
ROU
P A
NN
UA
L REPORT 20
18
4.6 Borrowings
4.6.1 Capital managementThe Group manages its capital structure with the objective of enhancing long‑term shareholder value through funding its business at an optimised weighted average cost of capital.
The Company will seek to return capital to shareholders when that is consistent with its long‑term capital structure objectives and where it will enhance shareholder value.
The Company remains committed to a solid investment grade credit rating and a number of actions can be undertaken to support the credit profile including the sale of non‑core assets, further working capital initiatives and adjusting its growth capital expenditure and property leasing profile.
4.6.2 Financing
(i) Financing transactions during 2018
MaturitiesUS$100 million (A$127 million) in US Senior Notes (private placement) were repaid early in May 2018 using surplus cash. The loan was originally maturing in April 2020. This will provide a borrowing cost saving to the Company.
New transactionsThe Company had no new transactions during 2018.
OtherIn November 2017, A$1.3 billion of undrawn syndicated bank facilities were voluntarily cancelled as they were surplus to business requirements. This will provide a borrowing cost saving to the Company.
(ii) Upcoming refinancingA$500 million domestic Medium Term Notes maturing in March 2019.
(iii) Guarantee facilityIn November 2017, a A$400 million bank guarantee facility matured. It was replaced with pre‑financing obtained in May 2017 and increased to A$500 million. This facility is for the purpose of the Group meeting its WorkCover obligations as a 'self‑insurer' by issuing bank guarantees in favour of Australian WorkCover authorities and is underpinned by the international surety market. The new facility is for a three‑year commitment to November 2020 and is currently fully drawn.
4.6.3 Movements in borrowings
2018OPENING BALANCE
$M
NON‑CASH MOVEMENTS
$M
NET CASH MOVEMENTS
$M
CLOSING BALANCE
$M
Current, unsecuredShort‑term money market loans 171 – (155) 16 Bank loans 83 – 5 88 Securities – 500 – 500
254 500 (150) 604 Non‑current, unsecuredBank loans 529 11 – 540 Securities 2,263 (465) (130) 1,668 Unamortised borrowing costs (17) 8 – (9)Finance leases 2 (2) – –
2,777 (448) (130) 2,199 Total 3,031 52 (280) 2,803
4.6.3 Movement in borrowings (continued)
2017OPENING BALANCE
$M
NON‑CASH MOVEMENTS
$M
NET CASH MOVEMENTS
$M
CLOSING BALANCE
$M
Current, unsecuredShort‑term money market loans 46 – 125 171 Bank loans 37 – 46 83 Securities 407 (31) (376) –
490 (31) (205) 254 Non‑current, unsecuredBank loans 854 (9) (316) 529 Securities 2,333 (70) – 2,263 Woolworths Notes II 700 – (700) – Unamortised borrowing costs (19) 2 – (17)Finance leases 3 – (1) 2
3,871 (77) (1,017) 2,777 Total 4,361 (108) (1,222) 3,031
4.6.4 Composition of borrowings
CURRENCY (IF NOT AUD)
NOTIONAL VALUE CARRYING VALUE
MATURITY
2018 2017 2018 2017
A$M A$M A$M A$M
Short‑term money market loansShort‑term loan, on call At call – 128 – 128 Short‑term loan, on call1 (NZ$) At call 16 30 16 31 Short‑term loan, on call1 (US$) At call – 12 – 12
16 170 16 171 Bank loans (current)Committed Revolving Credit Facility1 (CNY) Feb‑19 50 47 51 45 Committed Revolving Credit Facility1 (NZ$) Nov‑18 37 38 37 38
87 85 88 83 Securities (current)Medium Term Notes Mar‑19 500 – 500 – Bank loans (non‑current)Syndicated Bank Loan (US$) Oct‑21 355 355 351 343 Syndicated Bank Loan (US$) Nov‑20 184 184 189 185
539 539 540 529 Securities (non‑current)US Senior Notes (US 144A market) (US$) Sep‑20 654 654 833 815 US Senior Notes (US 144A market) (US$) Apr‑21 424 424 591 579 US Senior Notes (private placement) (US$) Apr‑20 – 127 – 132 Medium Term Notes Mar‑19 – 500 – 498 European Medium Term Notes (JPY) Nov‑20 229 229 244 238
Other – – – – 1 1,307 1,934 1,668 2,263
1 Drawn by a subsidiary outside the Woolworths Group Limited Deed of Cross Guarantee.
Notes to the Consolidated Financial Statements CAPITAL STRUCTURE, FINANCINGAND RISK MANAGEMENT 4
4.6 Borrowings (continued)
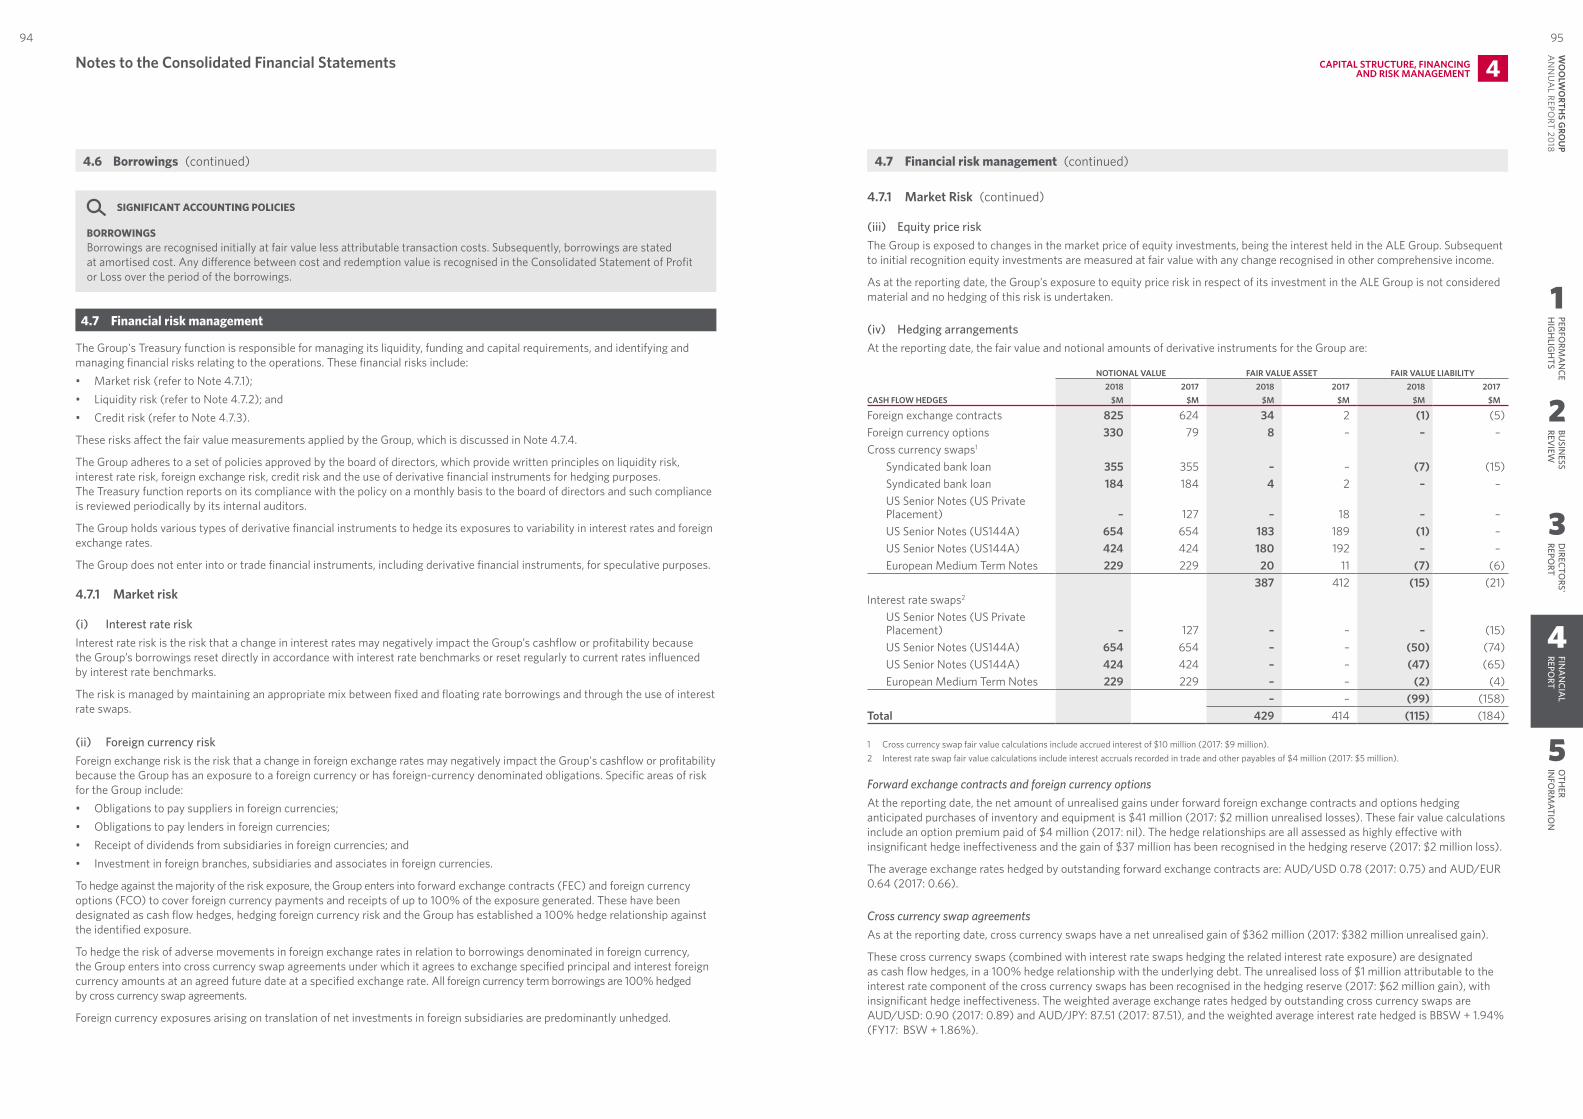
1
2
3
4
5
PERFORM
AN
CEH
IGH
LIGH
TSBU
SINESS
REVIEW
DIRECTO
RS' REPO
RTFIN
AN
CIAL
REPORT
OTH
ER IN
FORM
ATION
9594W
OO
LWO
RTHS G
ROU
P A
NN
UA
L REPORT 20
18
SIGNIFICANT ACCOUNTING POLICIES
BORROWINGSBorrowings are recognised initially at fair value less attributable transaction costs. Subsequently, borrowings are stated at amortised cost. Any difference between cost and redemption value is recognised in the Consolidated Statement of Profit or Loss over the period of the borrowings.
4.7 Financial risk management
The Group's Treasury function is responsible for managing its liquidity, funding and capital requirements, and identifying and managing financial risks relating to the operations. These financial risks include:• Market risk (refer to Note 4.7.1);• Liquidity risk (refer to Note 4.7.2); and• Credit risk (refer to Note 4.7.3).
These risks affect the fair value measurements applied by the Group, which is discussed in Note 4.7.4.
The Group adheres to a set of policies approved by the board of directors, which provide written principles on liquidity risk, interest rate risk, foreign exchange risk, credit risk and the use of derivative financial instruments for hedging purposes. The Treasury function reports on its compliance with the policy on a monthly basis to the board of directors and such compliance is reviewed periodically by its internal auditors.
The Group holds various types of derivative financial instruments to hedge its exposures to variability in interest rates and foreign exchange rates.
The Group does not enter into or trade financial instruments, including derivative financial instruments, for speculative purposes.
4.7.1 Market risk
(i) Interest rate riskInterest rate risk is the risk that a change in interest rates may negatively impact the Group’s cashflow or profitability because the Group’s borrowings reset directly in accordance with interest rate benchmarks or reset regularly to current rates influenced by interest rate benchmarks.
The risk is managed by maintaining an appropriate mix between fixed and floating rate borrowings and through the use of interest rate swaps.
(ii) Foreign currency riskForeign exchange risk is the risk that a change in foreign exchange rates may negatively impact the Group's cashflow or profitability because the Group has an exposure to a foreign currency or has foreign‑currency denominated obligations. Specific areas of risk for the Group include:• Obligations to pay suppliers in foreign currencies;• Obligations to pay lenders in foreign currencies;• Receipt of dividends from subsidiaries in foreign currencies; and• Investment in foreign branches, subsidiaries and associates in foreign currencies.
To hedge against the majority of the risk exposure, the Group enters into forward exchange contracts (FEC) and foreign currency options (FCO) to cover foreign currency payments and receipts of up to 100% of the exposure generated. These have been designated as cash flow hedges, hedging foreign currency risk and the Group has established a 100% hedge relationship against the identified exposure.
To hedge the risk of adverse movements in foreign exchange rates in relation to borrowings denominated in foreign currency, the Group enters into cross currency swap agreements under which it agrees to exchange specified principal and interest foreign currency amounts at an agreed future date at a specified exchange rate. All foreign currency term borrowings are 100% hedged by cross currency swap agreements.
Foreign currency exposures arising on translation of net investments in foreign subsidiaries are predominantly unhedged.
4.7.1 Market Risk (continued)
(iii) Equity price riskThe Group is exposed to changes in the market price of equity investments, being the interest held in the ALE Group. Subsequent to initial recognition equity investments are measured at fair value with any change recognised in other comprehensive income.
As at the reporting date, the Group’s exposure to equity price risk in respect of its investment in the ALE Group is not considered material and no hedging of this risk is undertaken.
(iv) Hedging arrangementsAt the reporting date, the fair value and notional amounts of derivative instruments for the Group are:
NOTIONAL VALUE FAIR VALUE ASSET FAIR VALUE LIABILITY
CASH FLOW HEDGES2018 2017 2018 2017 2018 2017
$M $M $M $M $M $M
Foreign exchange contracts 825 624 34 2 (1) (5)Foreign currency options 330 79 8 – – – Cross currency swaps1
Syndicated bank loan 355 355 – – (7) (15)Syndicated bank loan 184 184 4 2 – – US Senior Notes (US Private Placement) – 127 – 18 – – US Senior Notes (US144A) 654 654 183 189 (1) – US Senior Notes (US144A) 424 424 180 192 – – European Medium Term Notes 229 229 20 11 (7) (6)
387 412 (15) (21)Interest rate swaps2
US Senior Notes (US Private Placement) – 127 – – – (15)US Senior Notes (US144A) 654 654 – – (50) (74)US Senior Notes (US144A) 424 424 – – (47) (65)European Medium Term Notes 229 229 – – (2) (4)
– – (99) (158)Total 429 414 (115) (184)
1 Cross currency swap fair value calculations include accrued interest of $10 million (2017: $9 million).2 Interest rate swap fair value calculations include interest accruals recorded in trade and other payables of $4 million (2017: $5 million).
Forward exchange contracts and foreign currency optionsAt the reporting date, the net amount of unrealised gains under forward foreign exchange contracts and options hedging anticipated purchases of inventory and equipment is $41 million (2017: $2 million unrealised losses). These fair value calculations include an option premium paid of $4 million (2017: nil). The hedge relationships are all assessed as highly effective with insignificant hedge ineffectiveness and the gain of $37 million has been recognised in the hedging reserve (2017: $2 million loss).
The average exchange rates hedged by outstanding forward exchange contracts are: AUD/USD 0.78 (2017: 0.75) and AUD/EUR 0.64 (2017: 0.66).
Cross currency swap agreementsAs at the reporting date, cross currency swaps have a net unrealised gain of $362 million (2017: $382 million unrealised gain).
These cross currency swaps (combined with interest rate swaps hedging the related interest rate exposure) are designated as cash flow hedges, in a 100% hedge relationship with the underlying debt. The unrealised loss of $1 million attributable to the interest rate component of the cross currency swaps has been recognised in the hedging reserve (2017: $62 million gain), with insignificant hedge ineffectiveness. The weighted average exchange rates hedged by outstanding cross currency swaps are AUD/USD: 0.90 (2017: 0.89) and AUD/JPY: 87.51 (2017: 87.51), and the weighted average interest rate hedged is BBSW + 1.94% (FY17: BSW + 1.86%).
Notes to the Consolidated Financial Statements CAPITAL STRUCTURE, FINANCINGAND RISK MANAGEMENT 4
4.6 Borrowings (continued) 4.7 Financial risk management (continued)
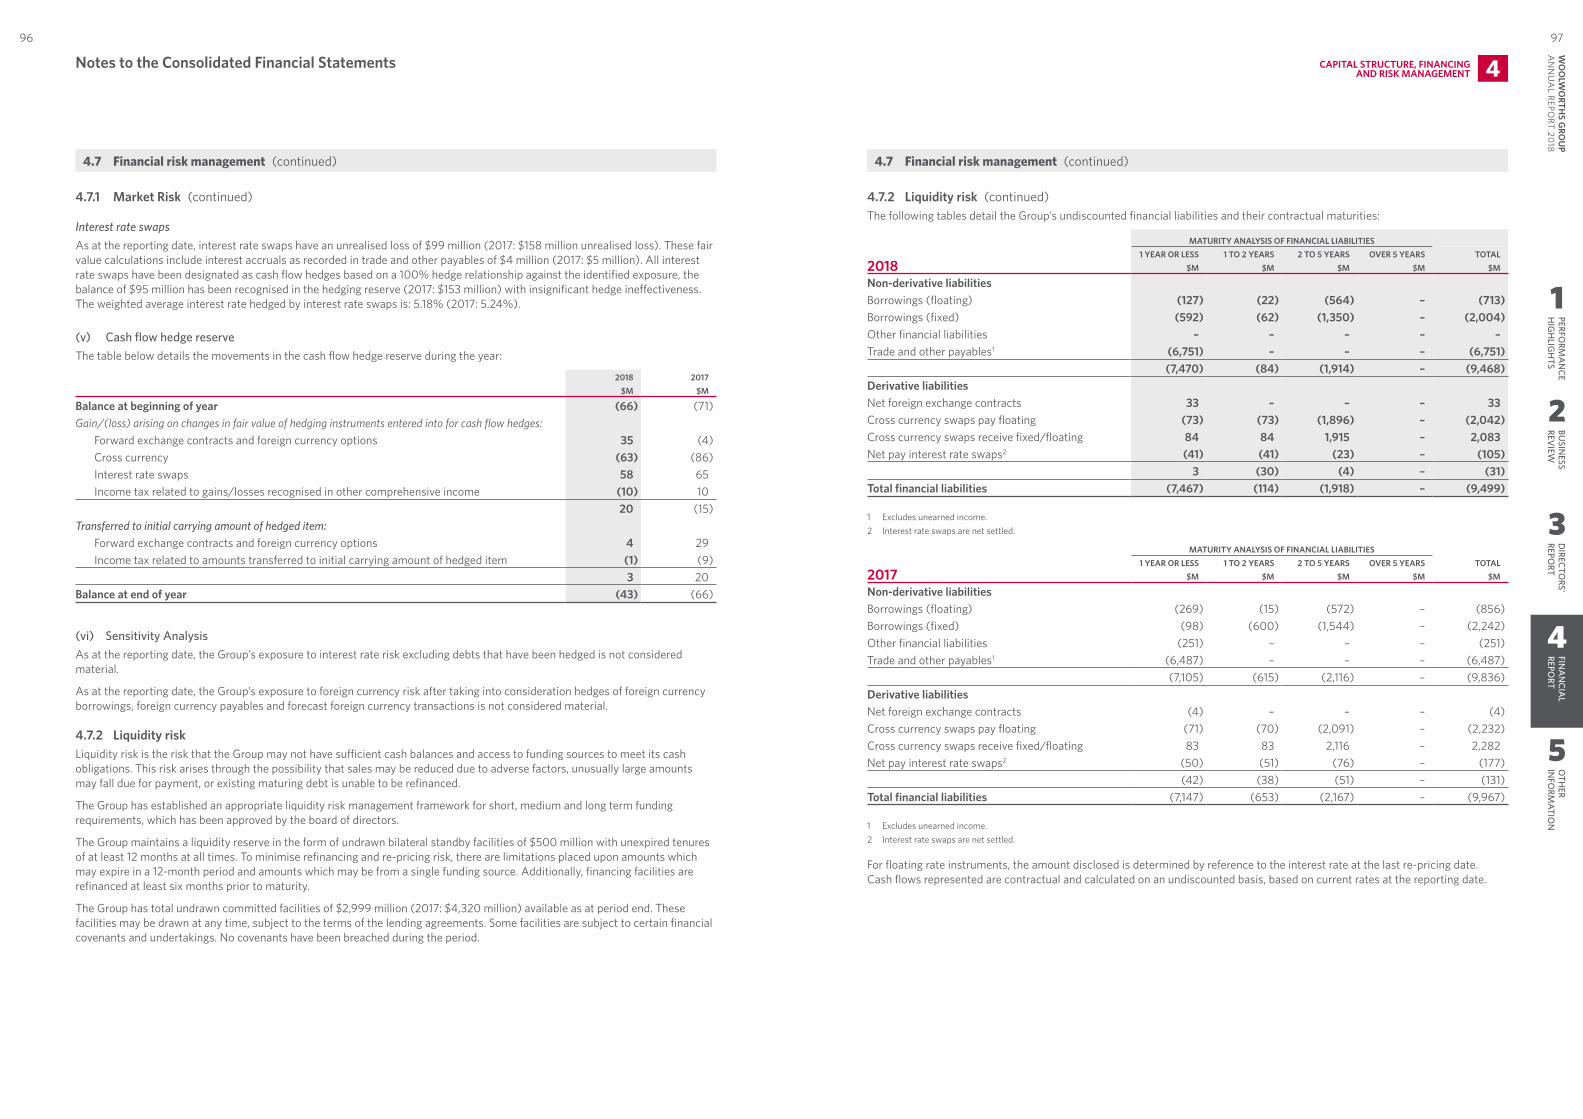
1
2
3
4
5
PERFORM
AN
CEH
IGH
LIGH
TSBU
SINESS
REVIEW
DIRECTO
RS' REPO
RTFIN
AN
CIAL
REPORT
OTH
ER IN
FORM
ATION
9796W
OO
LWO
RTHS G
ROU
P A
NN
UA
L REPORT 20
18
4.7.1 Market Risk (continued)
Interest rate swapsAs at the reporting date, interest rate swaps have an unrealised loss of $99 million (2017: $158 million unrealised loss). These fair value calculations include interest accruals as recorded in trade and other payables of $4 million (2017: $5 million). All interest rate swaps have been designated as cash flow hedges based on a 100% hedge relationship against the identified exposure, the balance of $95 million has been recognised in the hedging reserve (2017: $153 million) with insignificant hedge ineffectiveness. The weighted average interest rate hedged by interest rate swaps is: 5.18% (2017: 5.24%).
(v) Cash flow hedge reserveThe table below details the movements in the cash flow hedge reserve during the year:
2018 2017$M $M
Balance at beginning of year (66) (71)Gain/(loss) arising on changes in fair value of hedging instruments entered into for cash flow hedges:
Forward exchange contracts and foreign currency options 35 (4)Cross currency (63) (86)Interest rate swaps 58 65 Income tax related to gains/losses recognised in other comprehensive income (10) 10
20 (15)Transferred to initial carrying amount of hedged item:
Forward exchange contracts and foreign currency options 4 29 Income tax related to amounts transferred to initial carrying amount of hedged item (1) (9)
3 20 Balance at end of year (43) (66)
(vi) Sensitivity AnalysisAs at the reporting date, the Group’s exposure to interest rate risk excluding debts that have been hedged is not considered material.
As at the reporting date, the Group’s exposure to foreign currency risk after taking into consideration hedges of foreign currency borrowings, foreign currency payables and forecast foreign currency transactions is not considered material.
4.7.2 Liquidity riskLiquidity risk is the risk that the Group may not have sufficient cash balances and access to funding sources to meet its cash obligations. This risk arises through the possibility that sales may be reduced due to adverse factors, unusually large amounts may fall due for payment, or existing maturing debt is unable to be refinanced.
The Group has established an appropriate liquidity risk management framework for short, medium and long term funding requirements, which has been approved by the board of directors.
The Group maintains a liquidity reserve in the form of undrawn bilateral standby facilities of $500 million with unexpired tenures of at least 12 months at all times. To minimise refinancing and re‑pricing risk, there are limitations placed upon amounts which may expire in a 12‑month period and amounts which may be from a single funding source. Additionally, financing facilities are refinanced at least six months prior to maturity.
The Group has total undrawn committed facilities of $2,999 million (2017: $4,320 million) available as at period end. These facilities may be drawn at any time, subject to the terms of the lending agreements. Some facilities are subject to certain financial covenants and undertakings. No covenants have been breached during the period.
4.7.2 Liquidity risk (continued)The following tables detail the Group’s undiscounted financial liabilities and their contractual maturities:
MATURITY ANALYSIS OF FINANCIAL LIABILITIES
20181 YEAR OR LESS 1 TO 2 YEARS 2 TO 5 YEARS OVER 5 YEARS TOTAL
$M $M $M $M $M
Non‑derivative liabilitiesBorrowings (floating) (127) (22) (564) – (713)Borrowings (fixed) (592) (62) (1,350) – (2,004)Other financial liabilities – – – – – Trade and other payables1 (6,751) – – – (6,751)
(7,470) (84) (1,914) – (9,468)Derivative liabilitiesNet foreign exchange contracts 33 – – – 33 Cross currency swaps pay floating (73) (73) (1,896) – (2,042)Cross currency swaps receive fixed/floating 84 84 1,915 – 2,083 Net pay interest rate swaps2 (41) (41) (23) – (105)
3 (30) (4) – (31)Total financial liabilities (7,467) (114) (1,918) – (9,499)
1 Excludes unearned income.2 Interest rate swaps are net settled.
MATURITY ANALYSIS OF FINANCIAL LIABILITIES
20171 YEAR OR LESS 1 TO 2 YEARS 2 TO 5 YEARS OVER 5 YEARS TOTAL
$M $M $M $M $M
Non‑derivative liabilitiesBorrowings (floating) (269) (15) (572) – (856)Borrowings (fixed) (98) (600) (1,544) – (2,242)Other financial liabilities (251) – – – (251)Trade and other payables1 (6,487) – – – (6,487)
(7,105) (615) (2,116) – (9,836)Derivative liabilitiesNet foreign exchange contracts (4) – – – (4)Cross currency swaps pay floating (71) (70) (2,091) – (2,232)Cross currency swaps receive fixed/floating 83 83 2,116 – 2,282 Net pay interest rate swaps2 (50) (51) (76) – (177)
(42) (38) (51) – (131)Total financial liabilities (7,147) (653) (2,167) – (9,967)
1 Excludes unearned income.2 Interest rate swaps are net settled.
For floating rate instruments, the amount disclosed is determined by reference to the interest rate at the last re‑pricing date. Cash flows represented are contractual and calculated on an undiscounted basis, based on current rates at the reporting date.
Notes to the Consolidated Financial Statements CAPITAL STRUCTURE, FINANCINGAND RISK MANAGEMENT 4
4.7 Financial risk management (continued) 4.7 Financial risk management (continued)
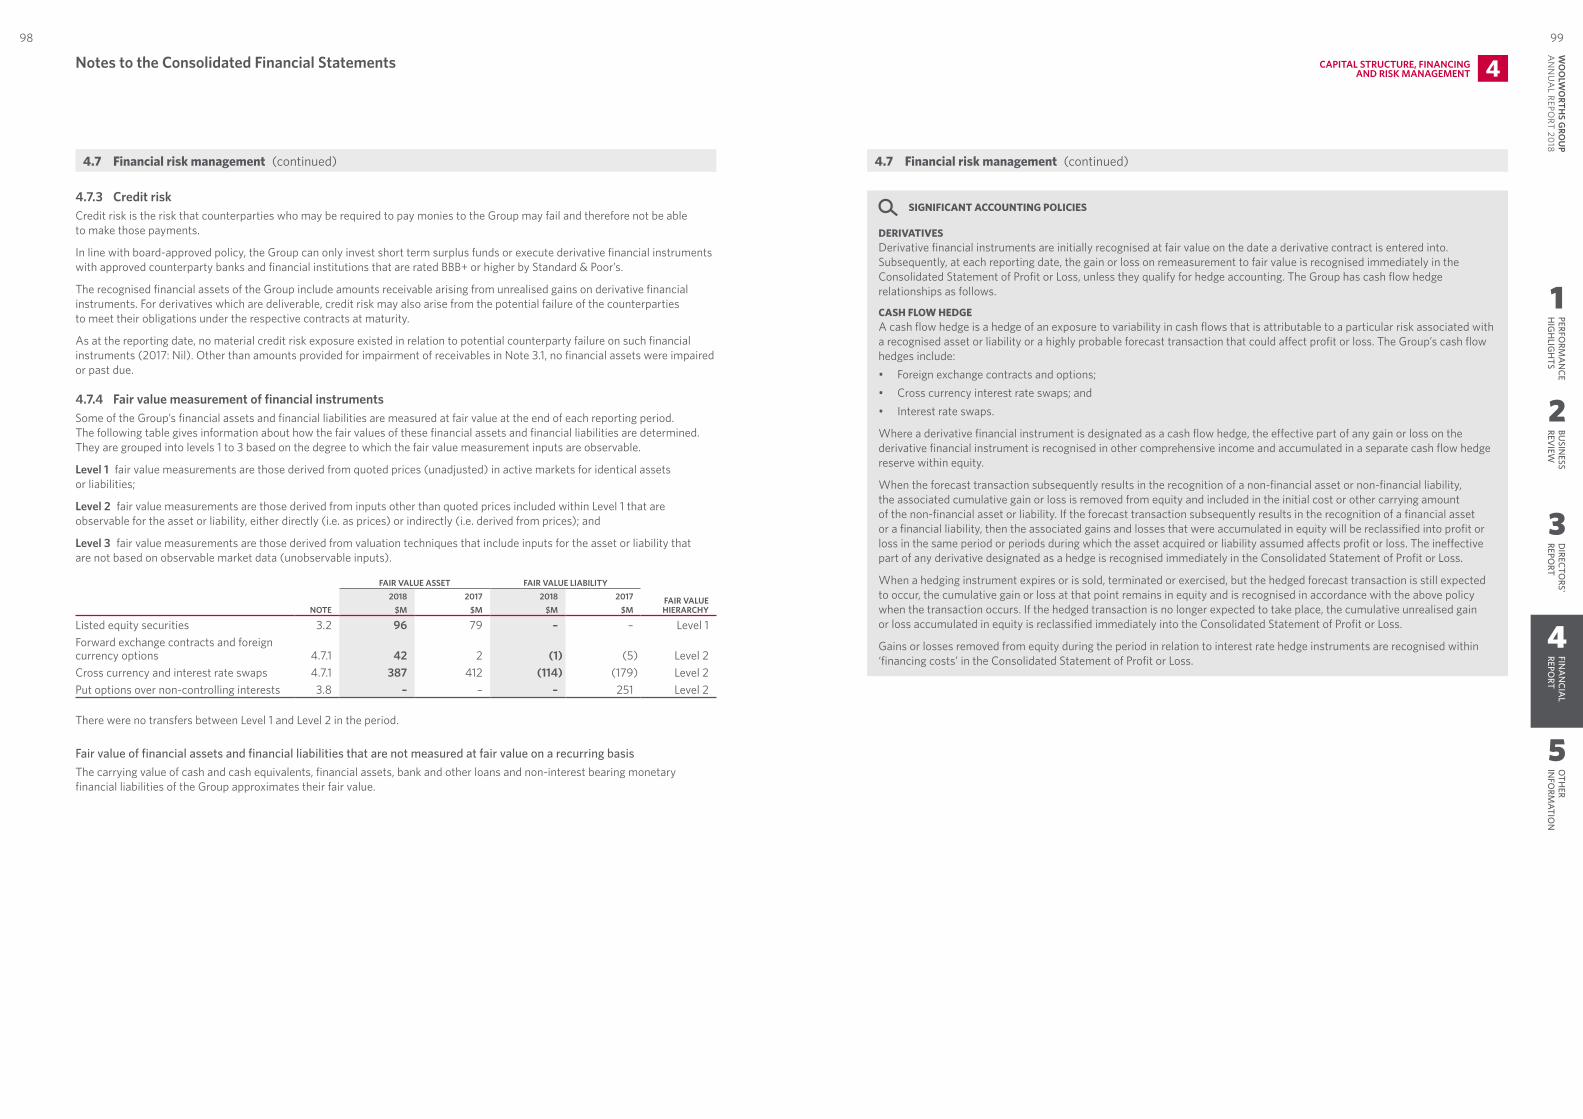
1
2
3
4
5
PERFORM
AN
CEH
IGH
LIGH
TSBU
SINESS
REVIEW
DIRECTO
RS' REPO
RTFIN
AN
CIAL
REPORT
OTH
ER IN
FORM
ATION
9998W
OO
LWO
RTHS G
ROU
P A
NN
UA
L REPORT 20
18
4.7.3 Credit riskCredit risk is the risk that counterparties who may be required to pay monies to the Group may fail and therefore not be able to make those payments.
In line with board‑approved policy, the Group can only invest short term surplus funds or execute derivative financial instruments with approved counterparty banks and financial institutions that are rated BBB+ or higher by Standard & Poor’s.
The recognised financial assets of the Group include amounts receivable arising from unrealised gains on derivative financial instruments. For derivatives which are deliverable, credit risk may also arise from the potential failure of the counterparties to meet their obligations under the respective contracts at maturity.
As at the reporting date, no material credit risk exposure existed in relation to potential counterparty failure on such financial instruments (2017: Nil). Other than amounts provided for impairment of receivables in Note 3.1, no financial assets were impaired or past due.
4.7.4 Fair value measurement of financial instrumentsSome of the Group’s financial assets and financial liabilities are measured at fair value at the end of each reporting period. The following table gives information about how the fair values of these financial assets and financial liabilities are determined. They are grouped into levels 1 to 3 based on the degree to which the fair value measurement inputs are observable.
Level 1 fair value measurements are those derived from quoted prices (unadjusted) in active markets for identical assets or liabilities;
Level 2 fair value measurements are those derived from inputs other than quoted prices included within Level 1 that are observable for the asset or liability, either directly (i.e. as prices) or indirectly (i.e. derived from prices); and
Level 3 fair value measurements are those derived from valuation techniques that include inputs for the asset or liability that are not based on observable market data (unobservable inputs).
FAIR VALUE ASSET FAIR VALUE LIABILITY
NOTE2018 2017 2018 2017 FAIR VALUE
HIERARCHY$M $M $M $M
Listed equity securities 3.2 96 79 – – Level 1Forward exchange contracts and foreign currency options 4.7.1 42 2 (1) (5) Level 2Cross currency and interest rate swaps 4.7.1 387 412 (114) (179) Level 2Put options over non‑controlling interests 3.8 – – – 251 Level 2
There were no transfers between Level 1 and Level 2 in the period.
Fair value of financial assets and financial liabilities that are not measured at fair value on a recurring basisThe carrying value of cash and cash equivalents, financial assets, bank and other loans and non‑interest bearing monetary financial liabilities of the Group approximates their fair value.
SIGNIFICANT ACCOUNTING POLICIES
DERIVATIVESDerivative financial instruments are initially recognised at fair value on the date a derivative contract is entered into. Subsequently, at each reporting date, the gain or loss on remeasurement to fair value is recognised immediately in the Consolidated Statement of Profit or Loss, unless they qualify for hedge accounting. The Group has cash flow hedge relationships as follows.
CASH FLOW HEDGEA cash flow hedge is a hedge of an exposure to variability in cash flows that is attributable to a particular risk associated with a recognised asset or liability or a highly probable forecast transaction that could affect profit or loss. The Group’s cash flow hedges include:• Foreign exchange contracts and options;• Cross currency interest rate swaps; and• Interest rate swaps.
Where a derivative financial instrument is designated as a cash flow hedge, the effective part of any gain or loss on the derivative financial instrument is recognised in other comprehensive income and accumulated in a separate cash flow hedge reserve within equity.
When the forecast transaction subsequently results in the recognition of a non‑financial asset or non‑financial liability, the associated cumulative gain or loss is removed from equity and included in the initial cost or other carrying amount of the non‑financial asset or liability. If the forecast transaction subsequently results in the recognition of a financial asset or a financial liability, then the associated gains and losses that were accumulated in equity will be reclassified into profit or loss in the same period or periods during which the asset acquired or liability assumed affects profit or loss. The ineffective part of any derivative designated as a hedge is recognised immediately in the Consolidated Statement of Profit or Loss.
When a hedging instrument expires or is sold, terminated or exercised, but the hedged forecast transaction is still expected to occur, the cumulative gain or loss at that point remains in equity and is recognised in accordance with the above policy when the transaction occurs. If the hedged transaction is no longer expected to take place, the cumulative unrealised gain or loss accumulated in equity is reclassified immediately into the Consolidated Statement of Profit or Loss.
Gains or losses removed from equity during the period in relation to interest rate hedge instruments are recognised within ‘financing costs’ in the Consolidated Statement of Profit or Loss.
Notes to the Consolidated Financial Statements CAPITAL STRUCTURE, FINANCINGAND RISK MANAGEMENT 4
4.7 Financial risk management (continued)4.7 Financial risk management (continued)
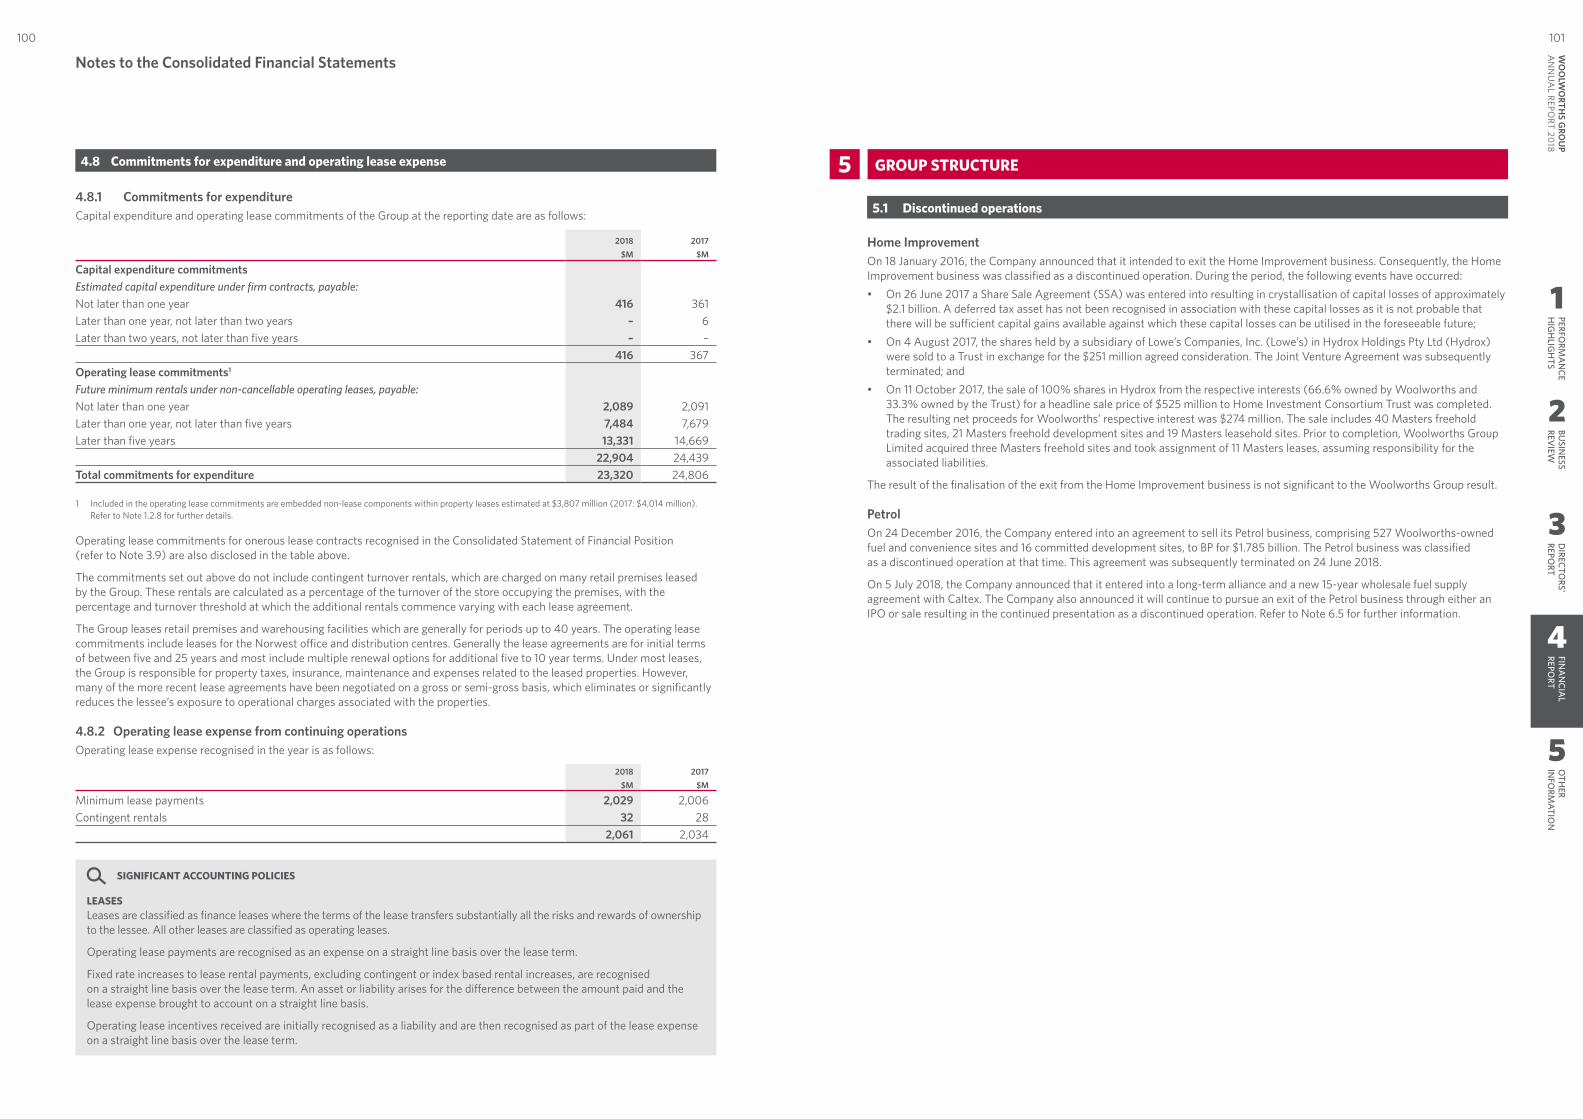
1
2
3
4
5
PERFORM
AN
CEH
IGH
LIGH
TSBU
SINESS
REVIEW
DIRECTO
RS' REPO
RTFIN
AN
CIAL
REPORT
OTH
ER IN
FORM
ATION
101100W
OO
LWO
RTHS G
ROU
P A
NN
UA
L REPORT 20
18
4.8.1 Commitments for expenditureCapital expenditure and operating lease commitments of the Group at the reporting date are as follows:
2018 2017$M $M
Capital expenditure commitmentsEstimated capital expenditure under firm contracts, payable:Not later than one year 416 361 Later than one year, not later than two years – 6 Later than two years, not later than five years – –
416 367 Operating lease commitments1
Future minimum rentals under non-cancellable operating leases, payable:Not later than one year 2,089 2,091 Later than one year, not later than five years 7,484 7,679 Later than five years 13,331 14,669
22,904 24,439 Total commitments for expenditure 23,320 24,806
1 Included in the operating lease commitments are embedded non‑lease components within property leases estimated at $3,807 million (2017: $4,014 million). Refer to Note 1.2.8 for further details.
Operating lease commitments for onerous lease contracts recognised in the Consolidated Statement of Financial Position (refer to Note 3.9) are also disclosed in the table above.
The commitments set out above do not include contingent turnover rentals, which are charged on many retail premises leased by the Group. These rentals are calculated as a percentage of the turnover of the store occupying the premises, with the percentage and turnover threshold at which the additional rentals commence varying with each lease agreement.
The Group leases retail premises and warehousing facilities which are generally for periods up to 40 years. The operating lease commitments include leases for the Norwest office and distribution centres. Generally the lease agreements are for initial terms of between five and 25 years and most include multiple renewal options for additional five to 10 year terms. Under most leases, the Group is responsible for property taxes, insurance, maintenance and expenses related to the leased properties. However, many of the more recent lease agreements have been negotiated on a gross or semi‑gross basis, which eliminates or significantly reduces the lessee’s exposure to operational charges associated with the properties.
4.8.2 Operating lease expense from continuing operationsOperating lease expense recognised in the year is as follows:
2018 2017$M $M
Minimum lease payments 2,029 2,006 Contingent rentals 32 28
2,061 2,034
SIGNIFICANT ACCOUNTING POLICIES
LEASESLeases are classified as finance leases where the terms of the lease transfers substantially all the risks and rewards of ownership to the lessee. All other leases are classified as operating leases.
Operating lease payments are recognised as an expense on a straight line basis over the lease term.
Fixed rate increases to lease rental payments, excluding contingent or index based rental increases, are recognised on a straight line basis over the lease term. An asset or liability arises for the difference between the amount paid and the lease expense brought to account on a straight line basis.
Operating lease incentives received are initially recognised as a liability and are then recognised as part of the lease expense on a straight line basis over the lease term.
5 GROUP STRUCTURE
5.1 Discontinued operations
Home ImprovementOn 18 January 2016, the Company announced that it intended to exit the Home Improvement business. Consequently, the Home Improvement business was classified as a discontinued operation. During the period, the following events have occurred: • On 26 June 2017 a Share Sale Agreement (SSA) was entered into resulting in crystallisation of capital losses of approximately
$2.1 billion. A deferred tax asset has not been recognised in association with these capital losses as it is not probable that there will be sufficient capital gains available against which these capital losses can be utilised in the foreseeable future;
• On 4 August 2017, the shares held by a subsidiary of Lowe’s Companies, Inc. (Lowe’s) in Hydrox Holdings Pty Ltd (Hydrox) were sold to a Trust in exchange for the $251 million agreed consideration. The Joint Venture Agreement was subsequently terminated; and
• On 11 October 2017, the sale of 100% shares in Hydrox from the respective interests (66.6% owned by Woolworths and 33.3% owned by the Trust) for a headline sale price of $525 million to Home Investment Consortium Trust was completed. The resulting net proceeds for Woolworths’ respective interest was $274 million. The sale includes 40 Masters freehold trading sites, 21 Masters freehold development sites and 19 Masters leasehold sites. Prior to completion, Woolworths Group Limited acquired three Masters freehold sites and took assignment of 11 Masters leases, assuming responsibility for the associated liabilities.
The result of the finalisation of the exit from the Home Improvement business is not significant to the Woolworths Group result.
PetrolOn 24 December 2016, the Company entered into an agreement to sell its Petrol business, comprising 527 Woolworths‑owned fuel and convenience sites and 16 committed development sites, to BP for $1.785 billion. The Petrol business was classified as a discontinued operation at that time. This agreement was subsequently terminated on 24 June 2018.
On 5 July 2018, the Company announced that it entered into a long‑term alliance and a new 15‑year wholesale fuel supply agreement with Caltex. The Company also announced it will continue to pursue an exit of the Petrol business through either an IPO or sale resulting in the continued presentation as a discontinued operation. Refer to Note 6.5 for further information.
GROUPSTRUCTURE 5Notes to the Consolidated Financial Statements
4.8 Commitments for expenditure and operating lease expense

1
2
3
4
5
PERFORM
AN
CEH
IGH
LIGH
TSBU
SINESS
REVIEW
DIRECTO
RS' REPO
RTFIN
AN
CIAL
REPORT
OTH
ER IN
FORM
ATION
103102W
OO
LWO
RTHS G
ROU
P A
NN
UA
L REPORT 20
18
Analysis of profit for the period from discontinued operationsThe profit for the Home Improvement and Petrol businesses for the reporting period are separately set out below, including comparative information:
2018 2017HOME IMPROVEMENT $M $M
Revenue from the sale of goods – 903 Expenses 3 (1,066)Reversal of impairment of Home Improvement assets and store exit costs1 24 573 Put option liability – (251)Earnings before interest and income tax 27 159 Net financing costs (3) (18)Profit before income tax 24 141 Income tax expense (23) (140)Profit for the period from Home Improvement discontinued operations 1 1
PETROL
Revenue from the sale of goods 4,784 4,640 Expenses (4,616) (4,482)Earnings before interest and income tax2,3 168 158 Net financing income 1 – Profit before income tax 169 158 Income tax expense (51) (47)Profit for the period from Petrol discontinued operations 118 111
Total profit from discontinued operations attributable to equity holders of the parent entity 119 112
1 2017 relates to the reassessment of the impairment in the recoverable amount of assets and liabilities that was previously recognised as a significant item in 2016 in connection with the Group’s decision to exit the Home Improvement business. The reassessment was predominately a result of the reflection of the financial impact of the transaction with Home Consortium on the basis that the sale of Lowe’s shares enabled completion of the Share Sale Agreement with Home Consortium.
2 Included in the Petrol EBIT for the reporting period ended 24 June 2018 are overhead and other costs of $18 million to $24 million (2017: $18 million to $24 million) that are expected to remain with the Company following the completion of an IPO or sale. A portion of these costs may be recovered in the short term following a sale as a result of a Transition Services Arrangement. The Company plans to minimise the impact of these costs going forward.
3 Included in the Petrol EBIT for the reporting period ended 24 June 2018 is the cost of funding the full 4cpl fuel discount offer of $63 million (2017: $69 million).
Cash flows from/(used in) discontinued operationsThe results of cash flows from/(used in) the Home Improvement and Petrol businesses during the period are set out below, including comparative information:
HOME IMPROVEMENT2018 2017
$M $M
Net cash outflow from operating activities (41) (123)Net cash (outflow)/inflow from investing activities (69) 149 Net cash inflow/(outflow) from financing activities – (4)
(110) 22
2018 2017PETROL $M $M
Net cash inflow from operating activities 102 115 Net cash outflow from investing activities (43) (31)Net cash inflow/(outflow) from financing activities – –
59 84
SIGNIFICANT ACCOUNTING POLICIES
DISCONTINUED OPERATIONSA discontinued operation is a component of the Group that represents a separate major line of business that is part of a disposal plan. The results of discontinued operations are presented separately in the Consolidated Statement of Profit or Loss.
5.2 Assets held for sale
On 24 December 2016, the Company entered into a binding agreement to sell its 527 Woolworths‑owned fuel convenience sites and 16 committed development sites to BP. This agreement was subsequently terminated on 24 June 2018. On 5 July 2018, the Company announced it will continue to pursue an exit of the Petrol business through either an IPO or sale (refer to Note 6.5).
The sale of Hydrox Holdings Pty Ltd was completed during the period (refer to Note 5.1).
At 24 June 2018, the assets and liabilities relating to the Petrol business, and other Group properties have been classified as held for sale (2017: Assets and liabilities relating to the Petrol business, property, plant and equipment relating to Masters, and other Group properties have been classified as held for sale).
2018 2017$M $M
Property, plant and equipment 666 1,111 Other assets 155 133 Total assets classified as held for sale 821 1,244
2018 2017$M $M
Total liabilities directly associated with assets held for sale 21 21
SIGNIFICANT ACCOUNTING POLICIES
NON-CURRENT ASSETS HELD FOR SALENon‑current assets are classified as held for sale if their carrying amount will be recovered principally through a sale transaction rather than continuing use and a sale is considered highly probable. They are measured at the lower of their carrying amount and fair value less costs to sell, except for assets such as deferred tax assets, assets arising from employee benefits and financial assets which are specifically exempt from this measurement requirement.
An impairment loss is recognised for any initial or subsequent write‑down of the asset to fair value less costs to sell. A gain is recognised for any subsequent increases in fair value less costs to sell of an asset, but not in excess of any cumulative impairment loss previously recognised. A gain or loss not previously recognised by the date of the sale of the non‑current asset is recognised at the date of derecognition. Non‑current assets are not depreciated or amortised while they are classified as held for sale. Interest and other expenses attributable to the liabilities classified as held for sale continue to be recognised.
Notes to the Consolidated Financial Statements GROUPSTRUCTURE 5
5.1 Discontinued operations (continued)5.1 Discontinued operations (continued)
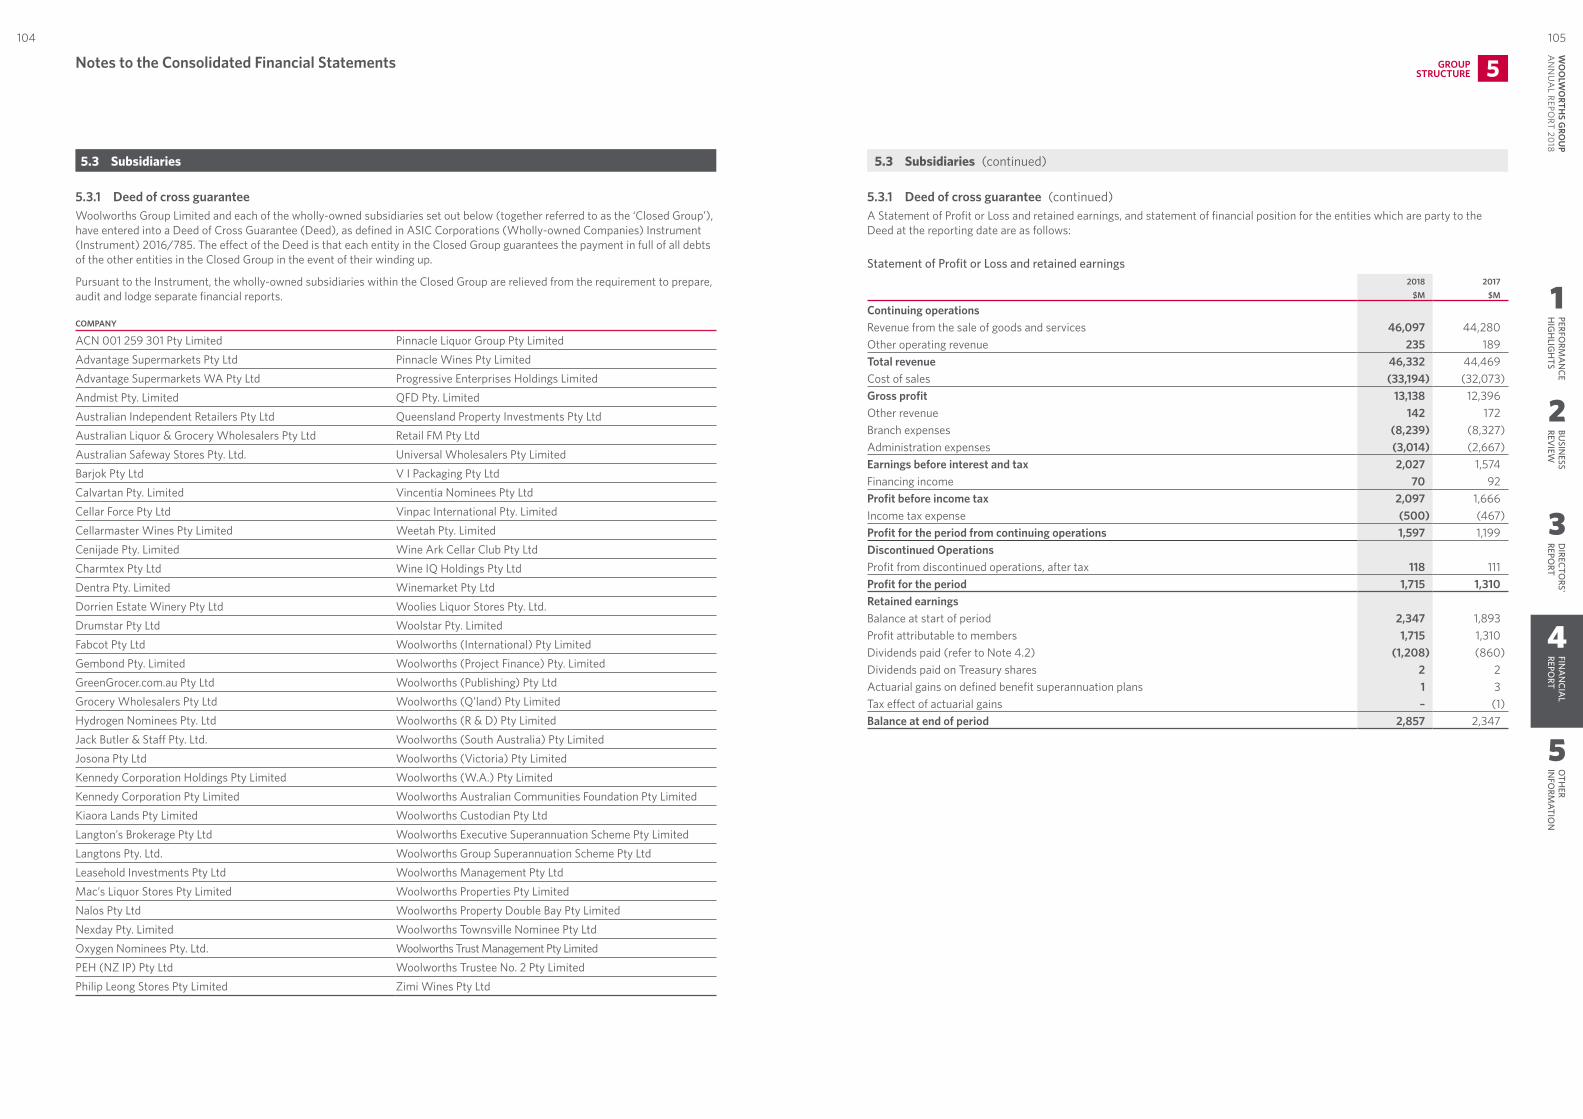
1
2
3
4
5
PERFORM
AN
CEH
IGH
LIGH
TSBU
SINESS
REVIEW
DIRECTO
RS' REPO
RTFIN
AN
CIAL
REPORT
OTH
ER IN
FORM
ATION
105104W
OO
LWO
RTHS G
ROU
P A
NN
UA
L REPORT 20
18
5.3.1 Deed of cross guarantee Woolworths Group Limited and each of the wholly‑owned subsidiaries set out below (together referred to as the ‘Closed Group’), have entered into a Deed of Cross Guarantee (Deed), as defined in ASIC Corporations (Wholly‑owned Companies) Instrument (Instrument) 2016/785. The effect of the Deed is that each entity in the Closed Group guarantees the payment in full of all debts of the other entities in the Closed Group in the event of their winding up.
Pursuant to the Instrument, the wholly‑owned subsidiaries within the Closed Group are relieved from the requirement to prepare, audit and lodge separate financial reports.
COMPANY
ACN 001 259 301 Pty Limited Pinnacle Liquor Group Pty LimitedAdvantage Supermarkets Pty Ltd Pinnacle Wines Pty LimitedAdvantage Supermarkets WA Pty Ltd Progressive Enterprises Holdings LimitedAndmist Pty. Limited QFD Pty. LimitedAustralian Independent Retailers Pty Ltd Queensland Property Investments Pty LtdAustralian Liquor & Grocery Wholesalers Pty Ltd Retail FM Pty LtdAustralian Safeway Stores Pty. Ltd. Universal Wholesalers Pty LimitedBarjok Pty Ltd V I Packaging Pty LtdCalvartan Pty. Limited Vincentia Nominees Pty LtdCellar Force Pty Ltd Vinpac International Pty. LimitedCellarmaster Wines Pty Limited Weetah Pty. LimitedCenijade Pty. Limited Wine Ark Cellar Club Pty LtdCharmtex Pty Ltd Wine IQ Holdings Pty LtdDentra Pty. Limited Winemarket Pty LtdDorrien Estate Winery Pty Ltd Woolies Liquor Stores Pty. Ltd.Drumstar Pty Ltd Woolstar Pty. LimitedFabcot Pty Ltd Woolworths (International) Pty LimitedGembond Pty. Limited Woolworths (Project Finance) Pty. LimitedGreenGrocer.com.au Pty Ltd Woolworths (Publishing) Pty LtdGrocery Wholesalers Pty Ltd Woolworths (Q’land) Pty LimitedHydrogen Nominees Pty. Ltd Woolworths (R & D) Pty LimitedJack Butler & Staff Pty. Ltd. Woolworths (South Australia) Pty LimitedJosona Pty Ltd Woolworths (Victoria) Pty LimitedKennedy Corporation Holdings Pty Limited Woolworths (W.A.) Pty LimitedKennedy Corporation Pty Limited Woolworths Australian Communities Foundation Pty LimitedKiaora Lands Pty Limited Woolworths Custodian Pty LtdLangton’s Brokerage Pty Ltd Woolworths Executive Superannuation Scheme Pty LimitedLangtons Pty. Ltd. Woolworths Group Superannuation Scheme Pty LtdLeasehold Investments Pty Ltd Woolworths Management Pty LtdMac’s Liquor Stores Pty Limited Woolworths Properties Pty LimitedNalos Pty Ltd Woolworths Property Double Bay Pty LimitedNexday Pty. Limited Woolworths Townsville Nominee Pty LtdOxygen Nominees Pty. Ltd. Woolworths Trust Management Pty LimitedPEH (NZ IP) Pty Ltd Woolworths Trustee No. 2 Pty LimitedPhilip Leong Stores Pty Limited Zimi Wines Pty Ltd
5.3.1 Deed of cross guarantee (continued)A Statement of Profit or Loss and retained earnings, and statement of financial position for the entities which are party to the Deed at the reporting date are as follows:
Statement of Profit or Loss and retained earnings2018 2017
$M $M
Continuing operationsRevenue from the sale of goods and services 46,097 44,280 Other operating revenue 235 189 Total revenue 46,332 44,469 Cost of sales (33,194) (32,073)Gross profit 13,138 12,396 Other revenue 142 172 Branch expenses (8,239) (8,327)Administration expenses (3,014) (2,667)Earnings before interest and tax 2,027 1,574 Financing income 70 92 Profit before income tax 2,097 1,666 Income tax expense (500) (467)Profit for the period from continuing operations 1,597 1,199 Discontinued OperationsProfit from discontinued operations, after tax 118 111 Profit for the period 1,715 1,310 Retained earningsBalance at start of period 2,347 1,893 Profit attributable to members 1,715 1,310 Dividends paid (refer to Note 4.2) (1,208) (860)Dividends paid on Treasury shares 2 2 Actuarial gains on defined benefit superannuation plans 1 3 Tax effect of actuarial gains – (1)Balance at end of period 2,857 2,347
Notes to the Consolidated Financial Statements GROUPSTRUCTURE 5
5.3 Subsidiaries 5.3 Subsidiaries (continued)
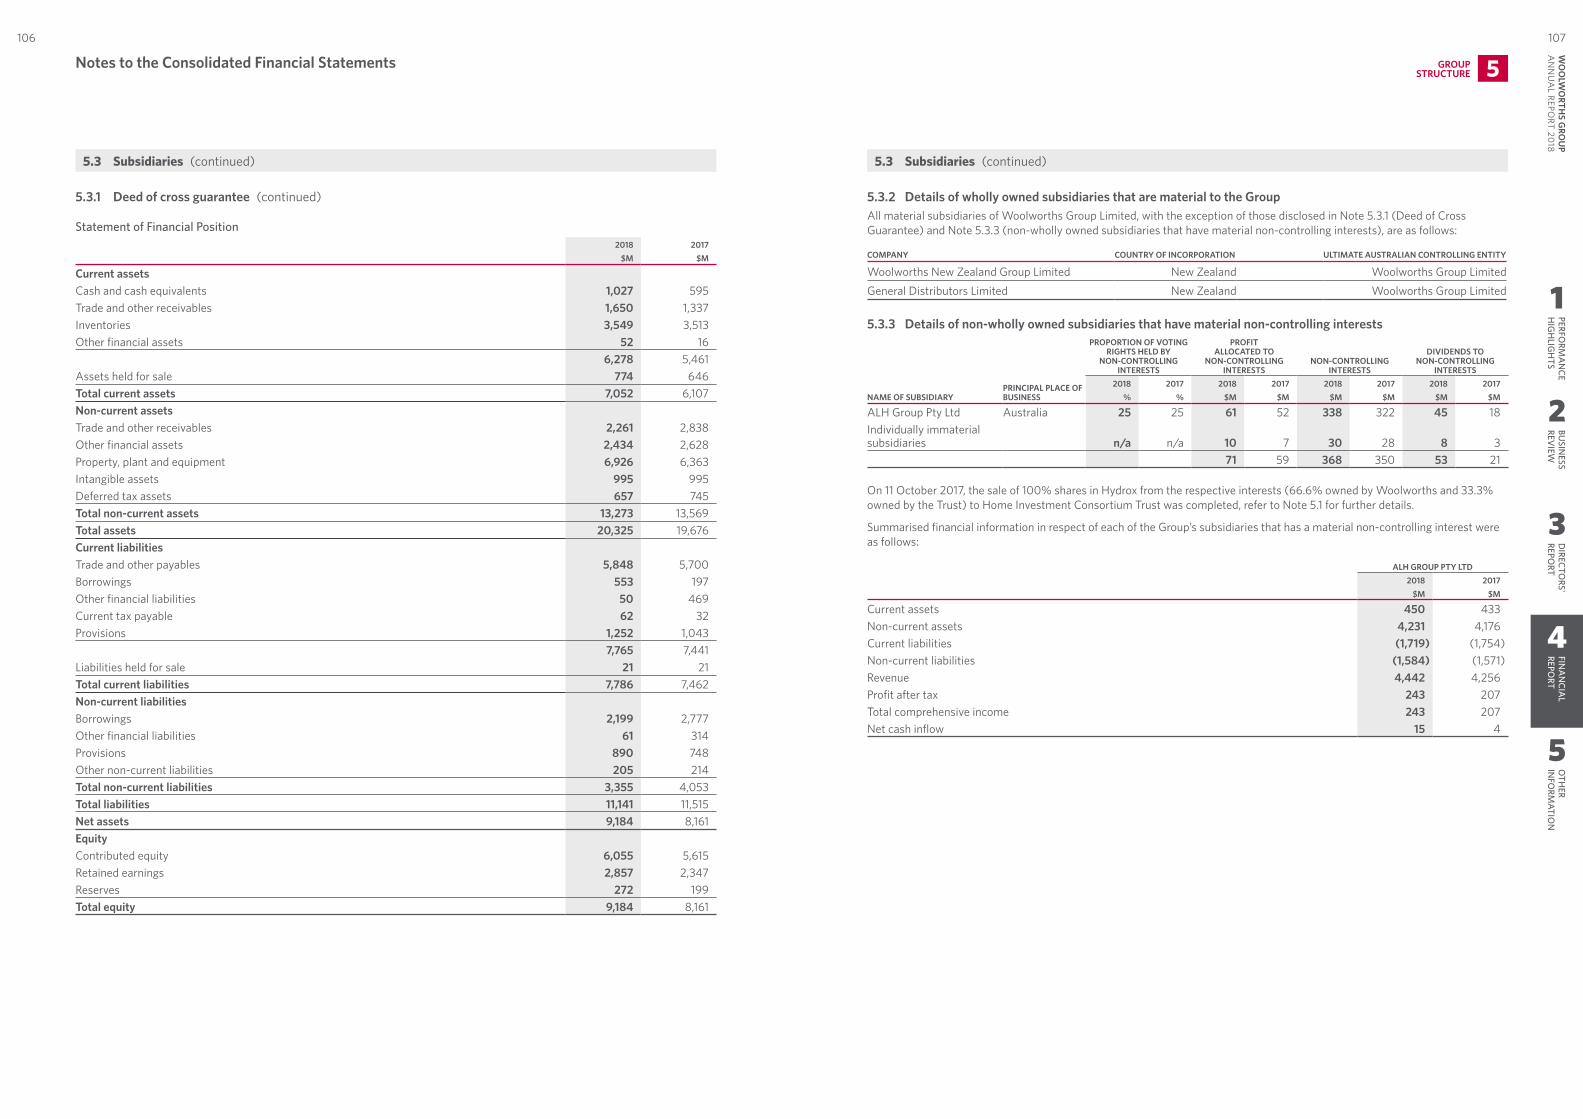
1
2
3
4
5
PERFORM
AN
CEH
IGH
LIGH
TSBU
SINESS
REVIEW
DIRECTO
RS' REPO
RTFIN
AN
CIAL
REPORT
OTH
ER IN
FORM
ATION
107106W
OO
LWO
RTHS G
ROU
P A
NN
UA
L REPORT 20
18
5.3.1 Deed of cross guarantee (continued)
Statement of Financial Position2018 2017
$M $M
Current assetsCash and cash equivalents 1,027 595 Trade and other receivables 1,650 1,337 Inventories 3,549 3,513 Other financial assets 52 16
6,278 5,461 Assets held for sale 774 646 Total current assets 7,052 6,107 Non‑current assetsTrade and other receivables 2,261 2,838 Other financial assets 2,434 2,628 Property, plant and equipment 6,926 6,363 Intangible assets 995 995 Deferred tax assets 657 745 Total non‑current assets 13,273 13,569 Total assets 20,325 19,676 Current liabilitiesTrade and other payables 5,848 5,700 Borrowings 553 197 Other financial liabilities 50 469 Current tax payable 62 32 Provisions 1,252 1,043
7,765 7,441 Liabilities held for sale 21 21 Total current liabilities 7,786 7,462 Non‑current liabilitiesBorrowings 2,199 2,777 Other financial liabilities 61 314 Provisions 890 748 Other non‑current liabilities 205 214 Total non‑current liabilities 3,355 4,053 Total liabilities 11,141 11,515 Net assets 9,184 8,161 EquityContributed equity 6,055 5,615 Retained earnings 2,857 2,347 Reserves 272 199 Total equity 9,184 8,161
5.3.2 Details of wholly owned subsidiaries that are material to the GroupAll material subsidiaries of Woolworths Group Limited, with the exception of those disclosed in Note 5.3.1 (Deed of Cross Guarantee) and Note 5.3.3 (non‑wholly owned subsidiaries that have material non‑controlling interests), are as follows:
COMPANY COUNTRY OF INCORPORATION ULTIMATE AUSTRALIAN CONTROLLING ENTITY
Woolworths New Zealand Group Limited New Zealand Woolworths Group LimitedGeneral Distributors Limited New Zealand Woolworths Group Limited
5.3.3 Details of non‑wholly owned subsidiaries that have material non‑controlling interestsPROPORTION OF VOTING
RIGHTS HELD BY NON‑CONTROLLING
INTERESTS
PROFIT ALLOCATED TO
NON‑CONTROLLING INTERESTS
NON‑CONTROLLING INTERESTS
DIVIDENDS TO NON‑CONTROLLING
INTERESTS
NAME OF SUBSIDIARY PRINCIPAL PLACE OF BUSINESS
2018 2017 2018 2017 2018 2017 2018 2017% % $M $M $M $M $M $M
ALH Group Pty Ltd Australia 25 25 61 52 338 322 45 18Individually immaterial subsidiaries n/a n/a 10 7 30 28 8 3
71 59 368 350 53 21
On 11 October 2017, the sale of 100% shares in Hydrox from the respective interests (66.6% owned by Woolworths and 33.3% owned by the Trust) to Home Investment Consortium Trust was completed, refer to Note 5.1 for further details.
Summarised financial information in respect of each of the Group’s subsidiaries that has a material non‑controlling interest were as follows:
ALH GROUP PTY LTD2018 2017
$M $M
Current assets 450 433 Non‑current assets 4,231 4,176 Current liabilities (1,719) (1,754)Non‑current liabilities (1,584) (1,571)Revenue 4,442 4,256 Profit after tax 243 207 Total comprehensive income 243 207 Net cash inflow 15 4
Notes to the Consolidated Financial Statements GROUPSTRUCTURE 5
5.3 Subsidiaries (continued)5.3 Subsidiaries (continued)
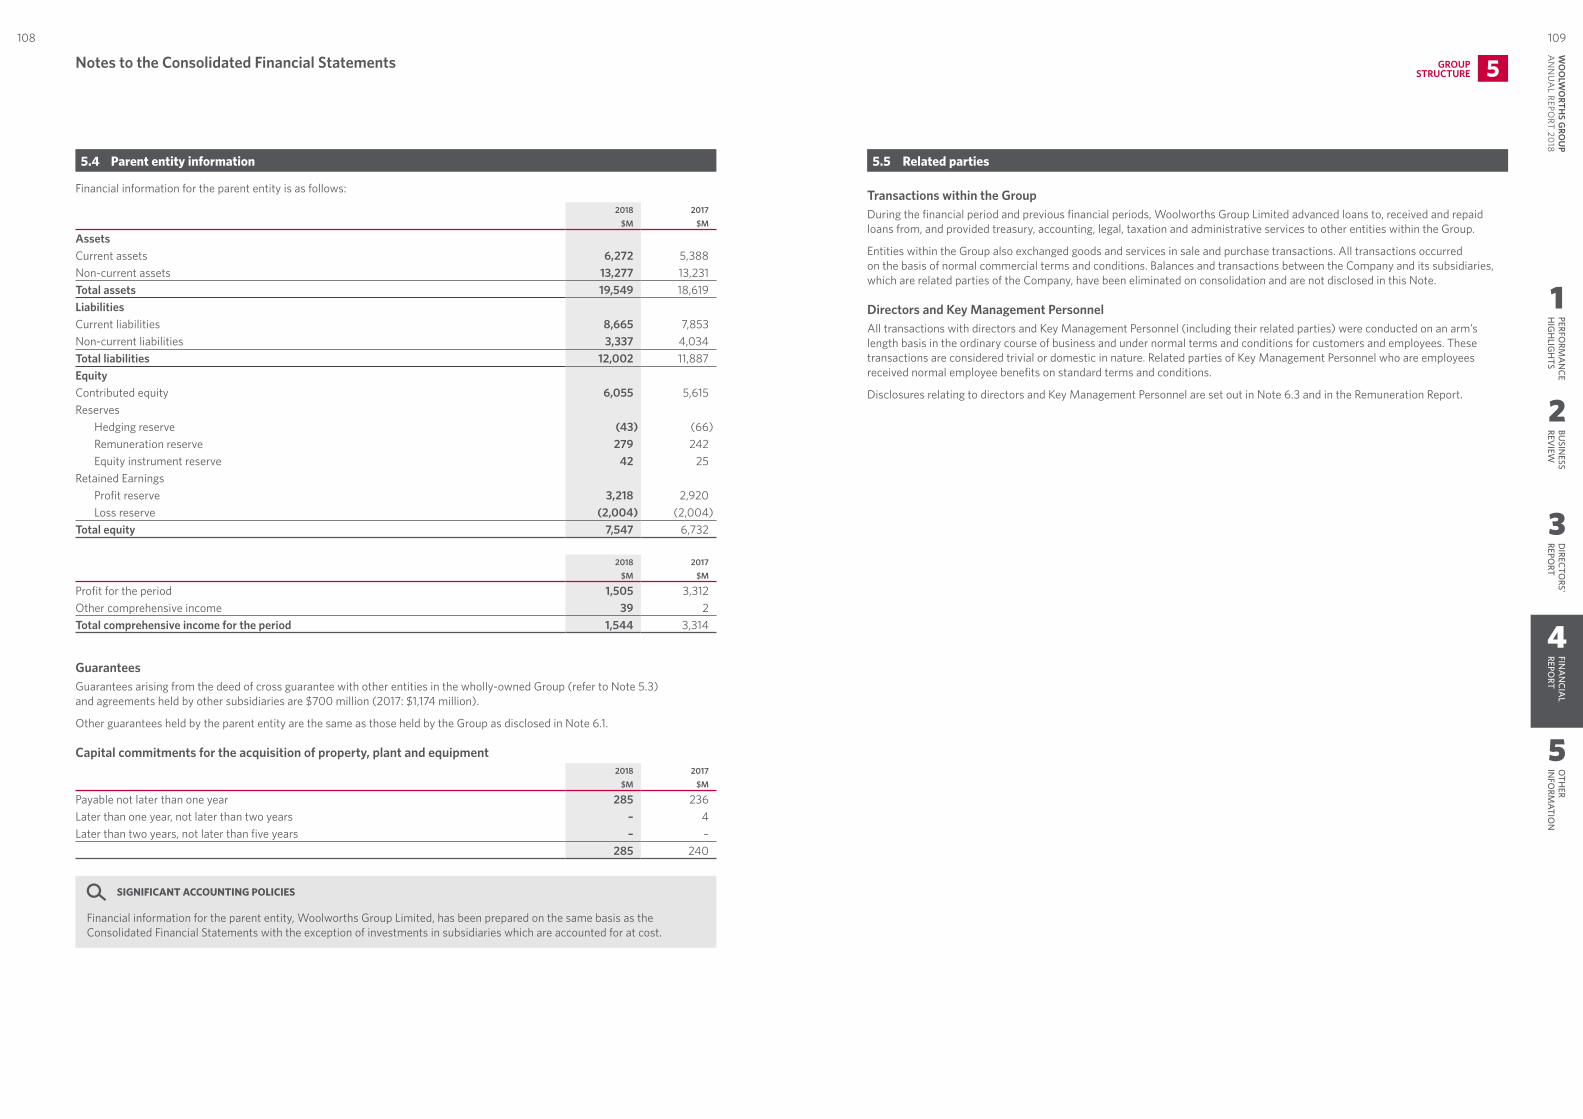
1
2
3
4
5
PERFORM
AN
CEH
IGH
LIGH
TSBU
SINESS
REVIEW
DIRECTO
RS' REPO
RTFIN
AN
CIAL
REPORT
OTH
ER IN
FORM
ATION
109108W
OO
LWO
RTHS G
ROU
P A
NN
UA
L REPORT 20
18
5.4 Parent entity information
Financial information for the parent entity is as follows:
2018 2017$M $M
AssetsCurrent assets 6,272 5,388 Non‑current assets 13,277 13,231 Total assets 19,549 18,619 LiabilitiesCurrent liabilities 8,665 7,853 Non‑current liabilities 3,337 4,034 Total liabilities 12,002 11,887 EquityContributed equity 6,055 5,615 Reserves
Hedging reserve (43) (66)Remuneration reserve 279 242 Equity instrument reserve 42 25
Retained EarningsProfit reserve 3,218 2,920 Loss reserve (2,004) (2,004)
Total equity 7,547 6,732
2018 2017$M $M
Profit for the period 1,505 3,312 Other comprehensive income 39 2 Total comprehensive income for the period 1,544 3,314
GuaranteesGuarantees arising from the deed of cross guarantee with other entities in the wholly‑owned Group (refer to Note 5.3) and agreements held by other subsidiaries are $700 million (2017: $1,174 million).
Other guarantees held by the parent entity are the same as those held by the Group as disclosed in Note 6.1.
Capital commitments for the acquisition of property, plant and equipment
2018 2017
$M $M
Payable not later than one year 285 236 Later than one year, not later than two years – 4 Later than two years, not later than five years – –
285 240
SIGNIFICANT ACCOUNTING POLICIES
Financial information for the parent entity, Woolworths Group Limited, has been prepared on the same basis as the Consolidated Financial Statements with the exception of investments in subsidiaries which are accounted for at cost.
5.5 Related parties
Transactions within the GroupDuring the financial period and previous financial periods, Woolworths Group Limited advanced loans to, received and repaid loans from, and provided treasury, accounting, legal, taxation and administrative services to other entities within the Group.
Entities within the Group also exchanged goods and services in sale and purchase transactions. All transactions occurred on the basis of normal commercial terms and conditions. Balances and transactions between the Company and its subsidiaries, which are related parties of the Company, have been eliminated on consolidation and are not disclosed in this Note.
Directors and Key Management PersonnelAll transactions with directors and Key Management Personnel (including their related parties) were conducted on an arm’s length basis in the ordinary course of business and under normal terms and conditions for customers and employees. These transactions are considered trivial or domestic in nature. Related parties of Key Management Personnel who are employees received normal employee benefits on standard terms and conditions.
Disclosures relating to directors and Key Management Personnel are set out in Note 6.3 and in the Remuneration Report.
Notes to the Consolidated Financial Statements GROUPSTRUCTURE 5
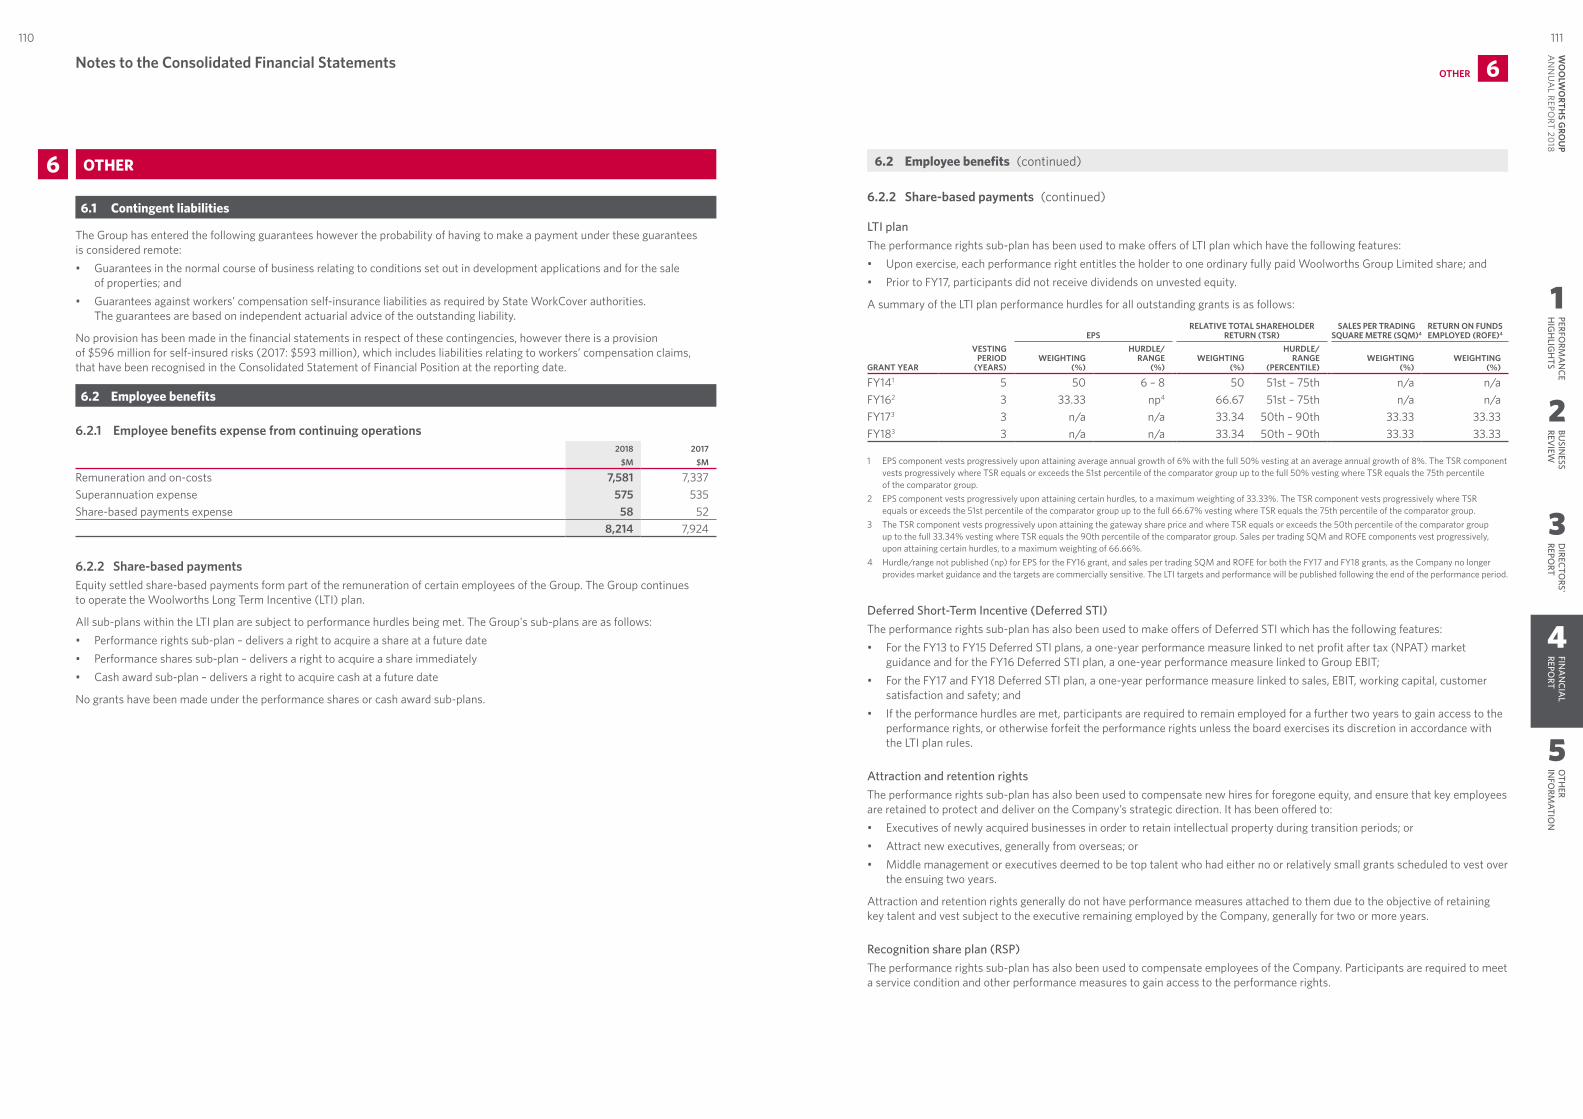
1
2
3
4
5
PERFORM
AN
CEH
IGH
LIGH
TSBU
SINESS
REVIEW
DIRECTO
RS' REPO
RTFIN
AN
CIAL
REPORT
OTH
ER IN
FORM
ATION
111110W
OO
LWO
RTHS G
ROU
P A
NN
UA
L REPORT 20
18
6 OTHER
6.1 Contingent liabilities
The Group has entered the following guarantees however the probability of having to make a payment under these guarantees is considered remote: • Guarantees in the normal course of business relating to conditions set out in development applications and for the sale
of properties; and • Guarantees against workers’ compensation self‑insurance liabilities as required by State WorkCover authorities.
The guarantees are based on independent actuarial advice of the outstanding liability.
No provision has been made in the financial statements in respect of these contingencies, however there is a provision of $596 million for self‑insured risks (2017: $593 million), which includes liabilities relating to workers’ compensation claims, that have been recognised in the Consolidated Statement of Financial Position at the reporting date.
6.2 Employee benefits
6.2.1 Employee benefits expense from continuing operations2018 2017
$M $M
Remuneration and on‑costs 7,581 7,337 Superannuation expense 575 535 Share‑based payments expense 58 52
8,214 7,924
6.2.2 Share‑based payments Equity settled share‑based payments form part of the remuneration of certain employees of the Group. The Group continues to operate the Woolworths Long Term Incentive (LTI) plan.
All sub‑plans within the LTI plan are subject to performance hurdles being met. The Group's sub‑plans are as follows:• Performance rights sub‑plan – delivers a right to acquire a share at a future date• Performance shares sub‑plan – delivers a right to acquire a share immediately• Cash award sub‑plan – delivers a right to acquire cash at a future date
No grants have been made under the performance shares or cash award sub‑plans.
6.2.2 Share‑based payments (continued)
LTI planThe performance rights sub‑plan has been used to make offers of LTI plan which have the following features:• Upon exercise, each performance right entitles the holder to one ordinary fully paid Woolworths Group Limited share; and• Prior to FY17, participants did not receive dividends on unvested equity.
A summary of the LTI plan performance hurdles for all outstanding grants is as follows:
EPSRELATIVE TOTAL SHAREHOLDER
RETURN (TSR)SALES PER TRADING
SQUARE METRE (SQM)4RETURN ON FUNDS EMPLOYED (ROFE)4
GRANT YEAR
VESTING PERIOD
(YEARS)WEIGHTING
(%)
HURDLE/ RANGE
(%)WEIGHTING
(%)
HURDLE/ RANGE
(PERCENTILE)WEIGHTING
(%)WEIGHTING
(%)
FY141 5 50 6 – 8 50 51st – 75th n/a n/aFY162 3 33.33 np4 66.67 51st – 75th n/a n/aFY173 3 n/a n/a 33.34 50th – 90th 33.33 33.33FY183 3 n/a n/a 33.34 50th – 90th 33.33 33.33
1 EPS component vests progressively upon attaining average annual growth of 6% with the full 50% vesting at an average annual growth of 8%. The TSR component vests progressively where TSR equals or exceeds the 51st percentile of the comparator group up to the full 50% vesting where TSR equals the 75th percentile of the comparator group.
2 EPS component vests progressively upon attaining certain hurdles, to a maximum weighting of 33.33%. The TSR component vests progressively where TSR equals or exceeds the 51st percentile of the comparator group up to the full 66.67% vesting where TSR equals the 75th percentile of the comparator group.
3 The TSR component vests progressively upon attaining the gateway share price and where TSR equals or exceeds the 50th percentile of the comparator group up to the full 33.34% vesting where TSR equals the 90th percentile of the comparator group. Sales per trading SQM and ROFE components vest progressively, upon attaining certain hurdles, to a maximum weighting of 66.66%.
4 Hurdle/range not published (np) for EPS for the FY16 grant, and sales per trading SQM and ROFE for both the FY17 and FY18 grants, as the Company no longer provides market guidance and the targets are commercially sensitive. The LTI targets and performance will be published following the end of the performance period.
Deferred Short-Term Incentive (Deferred STI)The performance rights sub‑plan has also been used to make offers of Deferred STI which has the following features:• For the FY13 to FY15 Deferred STI plans, a one‑year performance measure linked to net profit after tax (NPAT) market
guidance and for the FY16 Deferred STI plan, a one‑year performance measure linked to Group EBIT;• For the FY17 and FY18 Deferred STI plan, a one‑year performance measure linked to sales, EBIT, working capital, customer
satisfaction and safety; and• If the performance hurdles are met, participants are required to remain employed for a further two years to gain access to the
performance rights, or otherwise forfeit the performance rights unless the board exercises its discretion in accordance with the LTI plan rules.
Attraction and retention rightsThe performance rights sub‑plan has also been used to compensate new hires for foregone equity, and ensure that key employees are retained to protect and deliver on the Company’s strategic direction. It has been offered to:• Executives of newly acquired businesses in order to retain intellectual property during transition periods; or• Attract new executives, generally from overseas; or• Middle management or executives deemed to be top talent who had either no or relatively small grants scheduled to vest over
the ensuing two years.
Attraction and retention rights generally do not have performance measures attached to them due to the objective of retaining key talent and vest subject to the executive remaining employed by the Company, generally for two or more years.
Recognition share plan (RSP)The performance rights sub‑plan has also been used to compensate employees of the Company. Participants are required to meet a service condition and other performance measures to gain access to the performance rights.
OTHER 6Notes to the Consolidated Financial Statements
6.2 Employee benefits (continued)
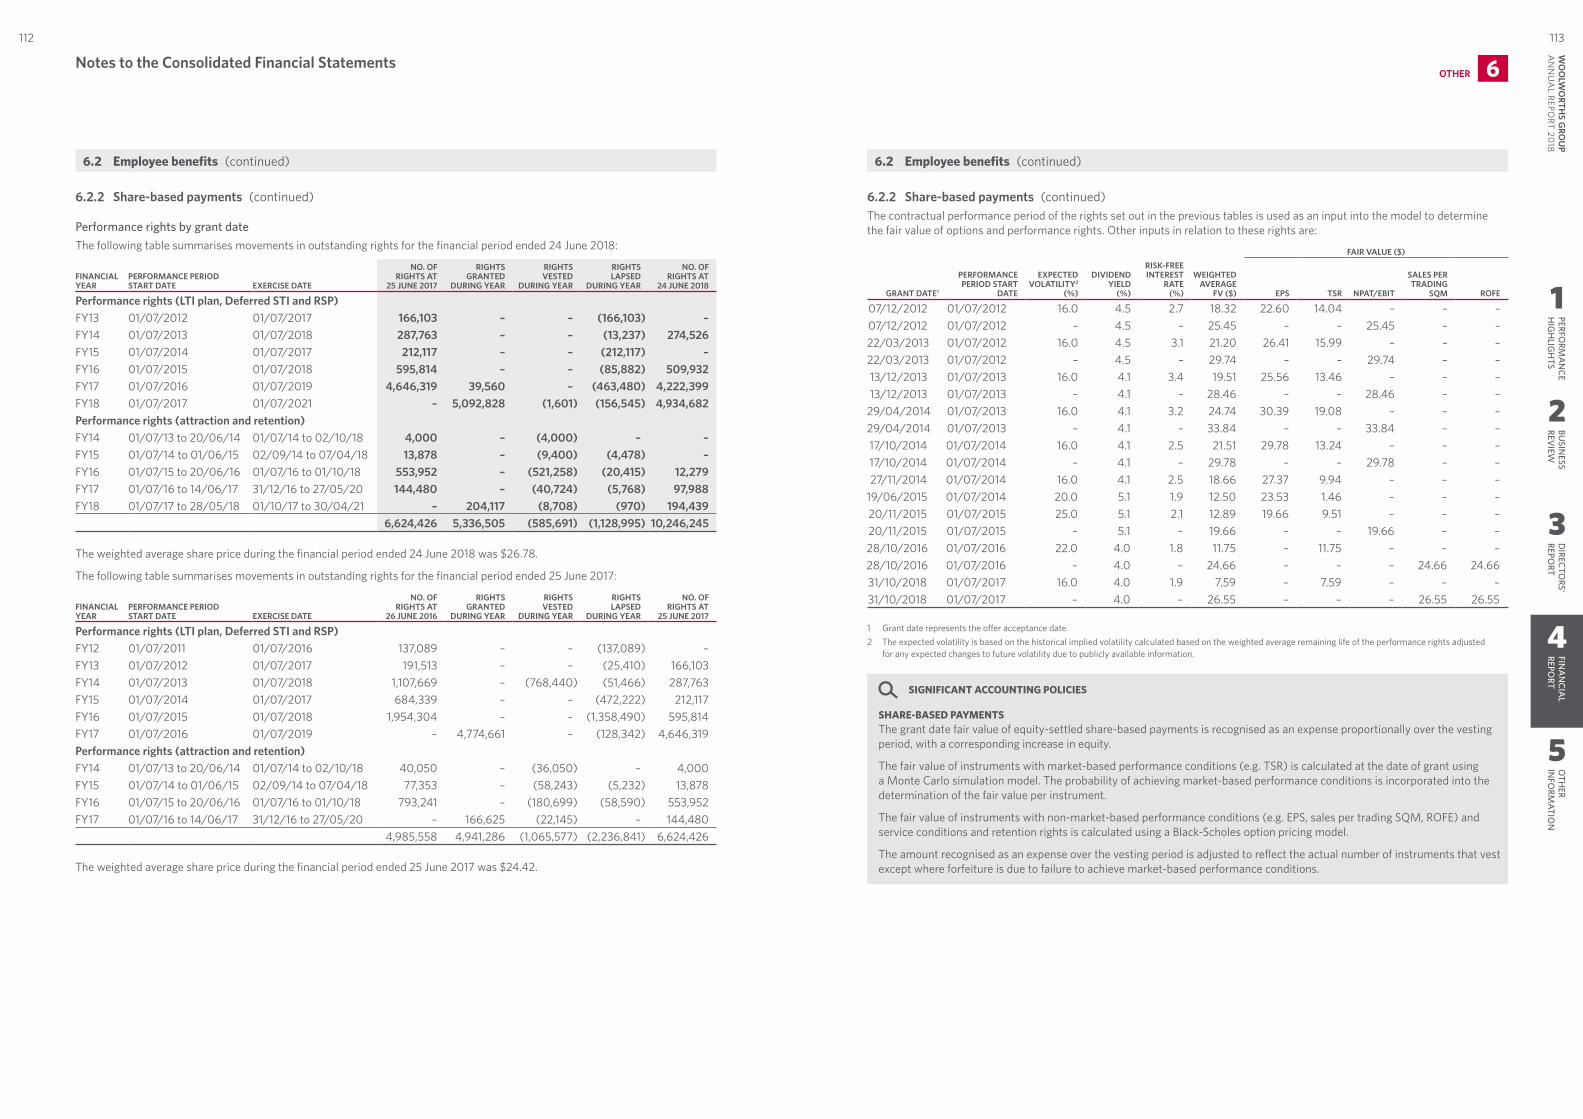
1
2
3
4
5
PERFORM
AN
CEH
IGH
LIGH
TSBU
SINESS
REVIEW
DIRECTO
RS' REPO
RTFIN
AN
CIAL
REPORT
OTH
ER IN
FORM
ATION
113112W
OO
LWO
RTHS G
ROU
P A
NN
UA
L REPORT 20
18
6.2.2 Share‑based payments (continued)
Performance rights by grant dateThe following table summarises movements in outstanding rights for the financial period ended 24 June 2018:
FINANCIAL YEAR
PERFORMANCE PERIOD START DATE EXERCISE DATE
NO. OF RIGHTS AT
25 JUNE 2017
RIGHTS GRANTED
DURING YEAR
RIGHTS VESTED
DURING YEAR
RIGHTS LAPSED
DURING YEAR
NO. OF RIGHTS AT
24 JUNE 2018
Performance rights (LTI plan, Deferred STI and RSP)FY13 01/07/2012 01/07/2017 166,103 – – (166,103) – FY14 01/07/2013 01/07/2018 287,763 – – (13,237) 274,526 FY15 01/07/2014 01/07/2017 212,117 – – (212,117) – FY16 01/07/2015 01/07/2018 595,814 – – (85,882) 509,932 FY17 01/07/2016 01/07/2019 4,646,319 39,560 – (463,480) 4,222,399 FY18 01/07/2017 01/07/2021 – 5,092,828 (1,601) (156,545) 4,934,682 Performance rights (attraction and retention)FY14 01/07/13 to 20/06/14 01/07/14 to 02/10/18 4,000 – (4,000) – – FY15 01/07/14 to 01/06/15 02/09/14 to 07/04/18 13,878 – (9,400) (4,478) – FY16 01/07/15 to 20/06/16 01/07/16 to 01/10/18 553,952 – (521,258) (20,415) 12,279 FY17 01/07/16 to 14/06/17 31/12/16 to 27/05/20 144,480 – (40,724) (5,768) 97,988 FY18 01/07/17 to 28/05/18 01/10/17 to 30/04/21 – 204,117 (8,708) (970) 194,439
6,624,426 5,336,505 (585,691) (1,128,995) 10,246,245
The weighted average share price during the financial period ended 24 June 2018 was $26.78.
The following table summarises movements in outstanding rights for the financial period ended 25 June 2017:
FINANCIAL YEAR
PERFORMANCE PERIOD START DATE EXERCISE DATE
NO. OF RIGHTS AT
26 JUNE 2016
RIGHTS GRANTED
DURING YEAR
RIGHTS VESTED
DURING YEAR
RIGHTS LAPSED
DURING YEAR
NO. OF RIGHTS AT
25 JUNE 2017
Performance rights (LTI plan, Deferred STI and RSP)FY12 01/07/2011 01/07/2016 137,089 – – (137,089) – FY13 01/07/2012 01/07/2017 191,513 – – (25,410) 166,103 FY14 01/07/2013 01/07/2018 1,107,669 – (768,440) (51,466) 287,763 FY15 01/07/2014 01/07/2017 684,339 – – (472,222) 212,117 FY16 01/07/2015 01/07/2018 1,954,304 – – (1,358,490) 595,814 FY17 01/07/2016 01/07/2019 – 4,774,661 – (128,342) 4,646,319 Performance rights (attraction and retention)FY14 01/07/13 to 20/06/14 01/07/14 to 02/10/18 40,050 – (36,050) – 4,000 FY15 01/07/14 to 01/06/15 02/09/14 to 07/04/18 77,353 – (58,243) (5,232) 13,878 FY16 01/07/15 to 20/06/16 01/07/16 to 01/10/18 793,241 – (180,699) (58,590) 553,952 FY17 01/07/16 to 14/06/17 31/12/16 to 27/05/20 – 166,625 (22,145) – 144,480
4,985,558 4,941,286 (1,065,577) (2,236,841) 6,624,426
The weighted average share price during the financial period ended 25 June 2017 was $24.42.
6.2.2 Share‑based payments (continued)The contractual performance period of the rights set out in the previous tables is used as an input into the model to determine the fair value of options and performance rights. Other inputs in relation to these rights are:
FAIR VALUE ($)
GRANT DATE1
PERFORMANCE PERIOD START
DATE
EXPECTED VOLATILITY2
(%)
DIVIDEND YIELD
(%)
RISK‑FREE INTEREST
RATE (%)
WEIGHTED AVERAGE
FV ($) EPS TSR NPAT/EBIT
SALES PER TRADING
SQM ROFE
07/12/2012 01/07/2012 16.0 4.5 2.7 18.32 22.60 14.04 – – – 07/12/2012 01/07/2012 – 4.5 – 25.45 – – 25.45 – – 22/03/2013 01/07/2012 16.0 4.5 3.1 21.20 26.41 15.99 – – – 22/03/2013 01/07/2012 – 4.5 – 29.74 – – 29.74 – – 13/12/2013 01/07/2013 16.0 4.1 3.4 19.51 25.56 13.46 – – – 13/12/2013 01/07/2013 – 4.1 – 28.46 – – 28.46 – –
29/04/2014 01/07/2013 16.0 4.1 3.2 24.74 30.39 19.08 – – – 29/04/2014 01/07/2013 – 4.1 – 33.84 – – 33.84 – – 17/10/2014 01/07/2014 16.0 4.1 2.5 21.51 29.78 13.24 – – – 17/10/2014 01/07/2014 – 4.1 – 29.78 – – 29.78 – – 27/11/2014 01/07/2014 16.0 4.1 2.5 18.66 27.37 9.94 – – –
19/06/2015 01/07/2014 20.0 5.1 1.9 12.50 23.53 1.46 – – – 20/11/2015 01/07/2015 25.0 5.1 2.1 12.89 19.66 9.51 – – – 20/11/2015 01/07/2015 – 5.1 – 19.66 – – 19.66 – – 28/10/2016 01/07/2016 22.0 4.0 1.8 11.75 – 11.75 – – – 28/10/2016 01/07/2016 – 4.0 – 24.66 – – – 24.66 24.66 31/10/2018 01/07/2017 16.0 4.0 1.9 7.59 – 7.59 – – – 31/10/2018 01/07/2017 – 4.0 – 26.55 – – – 26.55 26.55
1 Grant date represents the offer acceptance date.2 The expected volatility is based on the historical implied volatility calculated based on the weighted average remaining life of the performance rights adjusted
for any expected changes to future volatility due to publicly available information.
SIGNIFICANT ACCOUNTING POLICIES
SHARE-BASED PAYMENTSThe grant date fair value of equity‑settled share‑based payments is recognised as an expense proportionally over the vesting period, with a corresponding increase in equity.
The fair value of instruments with market‑based performance conditions (e.g. TSR) is calculated at the date of grant using a Monte Carlo simulation model. The probability of achieving market‑based performance conditions is incorporated into the determination of the fair value per instrument.
The fair value of instruments with non‑market‑based performance conditions (e.g. EPS, sales per trading SQM, ROFE) and service conditions and retention rights is calculated using a Black‑Scholes option pricing model.
The amount recognised as an expense over the vesting period is adjusted to reflect the actual number of instruments that vest except where forfeiture is due to failure to achieve market‑based performance conditions.
Notes to the Consolidated Financial StatementsOTHER 6
6.2 Employee benefits (continued)6.2 Employee benefits (continued)
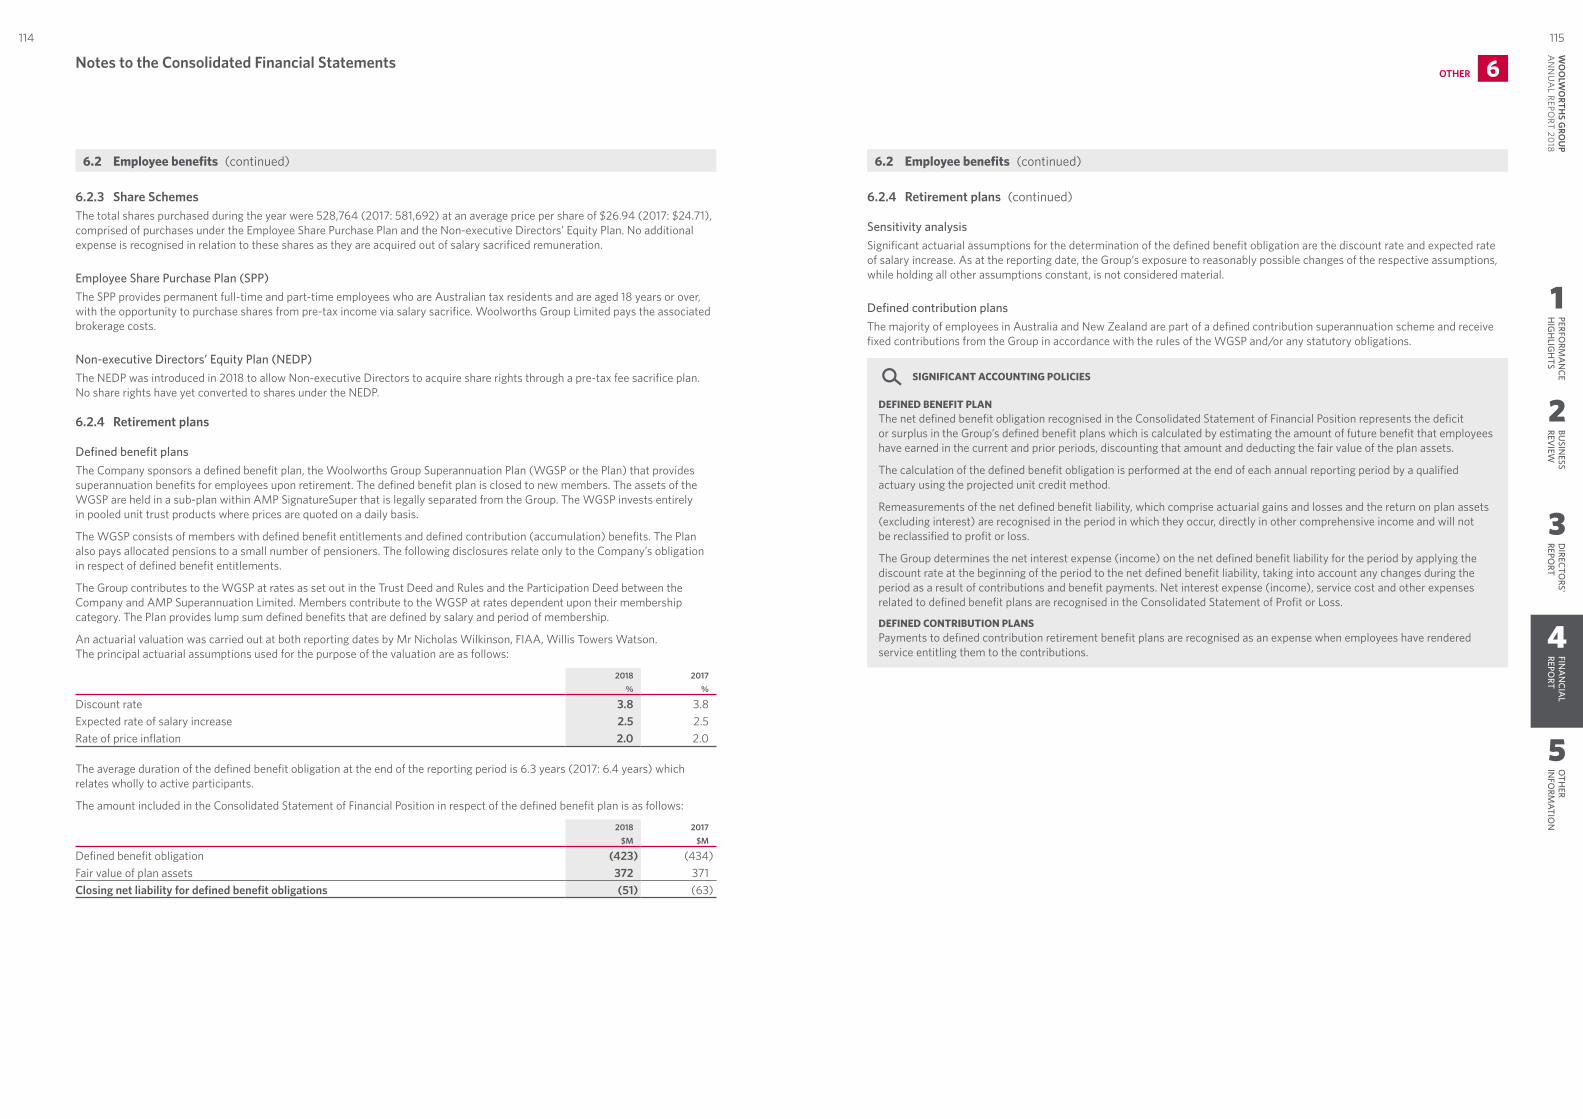
1
2
3
4
5
PERFORM
AN
CEH
IGH
LIGH
TSBU
SINESS
REVIEW
DIRECTO
RS' REPO
RTFIN
AN
CIAL
REPORT
OTH
ER IN
FORM
ATION
115114W
OO
LWO
RTHS G
ROU
P A
NN
UA
L REPORT 20
18
6.2.3 Share SchemesThe total shares purchased during the year were 528,764 (2017: 581,692) at an average price per share of $26.94 (2017: $24.71), comprised of purchases under the Employee Share Purchase Plan and the Non‑executive Directors’ Equity Plan. No additional expense is recognised in relation to these shares as they are acquired out of salary sacrificed remuneration.
Employee Share Purchase Plan (SPP)The SPP provides permanent full‑time and part‑time employees who are Australian tax residents and are aged 18 years or over, with the opportunity to purchase shares from pre‑tax income via salary sacrifice. Woolworths Group Limited pays the associated brokerage costs.
Non-executive Directors’ Equity Plan (NEDP)The NEDP was introduced in 2018 to allow Non‑executive Directors to acquire share rights through a pre‑tax fee sacrifice plan. No share rights have yet converted to shares under the NEDP.
6.2.4 Retirement plans
Defined benefit plansThe Company sponsors a defined benefit plan, the Woolworths Group Superannuation Plan (WGSP or the Plan) that provides superannuation benefits for employees upon retirement. The defined benefit plan is closed to new members. The assets of the WGSP are held in a sub‑plan within AMP SignatureSuper that is legally separated from the Group. The WGSP invests entirely in pooled unit trust products where prices are quoted on a daily basis.
The WGSP consists of members with defined benefit entitlements and defined contribution (accumulation) benefits. The Plan also pays allocated pensions to a small number of pensioners. The following disclosures relate only to the Company’s obligation in respect of defined benefit entitlements.
The Group contributes to the WGSP at rates as set out in the Trust Deed and Rules and the Participation Deed between the Company and AMP Superannuation Limited. Members contribute to the WGSP at rates dependent upon their membership category. The Plan provides lump sum defined benefits that are defined by salary and period of membership.
An actuarial valuation was carried out at both reporting dates by Mr Nicholas Wilkinson, FIAA, Willis Towers Watson. The principal actuarial assumptions used for the purpose of the valuation are as follows:
2018 2017% %
Discount rate 3.8 3.8Expected rate of salary increase 2.5 2.5Rate of price inflation 2.0 2.0
The average duration of the defined benefit obligation at the end of the reporting period is 6.3 years (2017: 6.4 years) which relates wholly to active participants.
The amount included in the Consolidated Statement of Financial Position in respect of the defined benefit plan is as follows:
2018 2017$M $M
Defined benefit obligation (423) (434)Fair value of plan assets 372 371 Closing net liability for defined benefit obligations (51) (63)
6.2.4 Retirement plans (continued)
Sensitivity analysisSignificant actuarial assumptions for the determination of the defined benefit obligation are the discount rate and expected rate of salary increase. As at the reporting date, the Group’s exposure to reasonably possible changes of the respective assumptions, while holding all other assumptions constant, is not considered material.
Defined contribution plansThe majority of employees in Australia and New Zealand are part of a defined contribution superannuation scheme and receive fixed contributions from the Group in accordance with the rules of the WGSP and/or any statutory obligations.
SIGNIFICANT ACCOUNTING POLICIES
DEFINED BENEFIT PLANThe net defined benefit obligation recognised in the Consolidated Statement of Financial Position represents the deficit or surplus in the Group’s defined benefit plans which is calculated by estimating the amount of future benefit that employees have earned in the current and prior periods, discounting that amount and deducting the fair value of the plan assets.
The calculation of the defined benefit obligation is performed at the end of each annual reporting period by a qualified actuary using the projected unit credit method.
Remeasurements of the net defined benefit liability, which comprise actuarial gains and losses and the return on plan assets (excluding interest) are recognised in the period in which they occur, directly in other comprehensive income and will not be reclassified to profit or loss.
The Group determines the net interest expense (income) on the net defined benefit liability for the period by applying the discount rate at the beginning of the period to the net defined benefit liability, taking into account any changes during the period as a result of contributions and benefit payments. Net interest expense (income), service cost and other expenses related to defined benefit plans are recognised in the Consolidated Statement of Profit or Loss.
DEFINED CONTRIBUTION PLANSPayments to defined contribution retirement benefit plans are recognised as an expense when employees have rendered service entitling them to the contributions.
Notes to the Consolidated Financial StatementsOTHER 6
6.2 Employee benefits (continued)6.2 Employee benefits (continued)
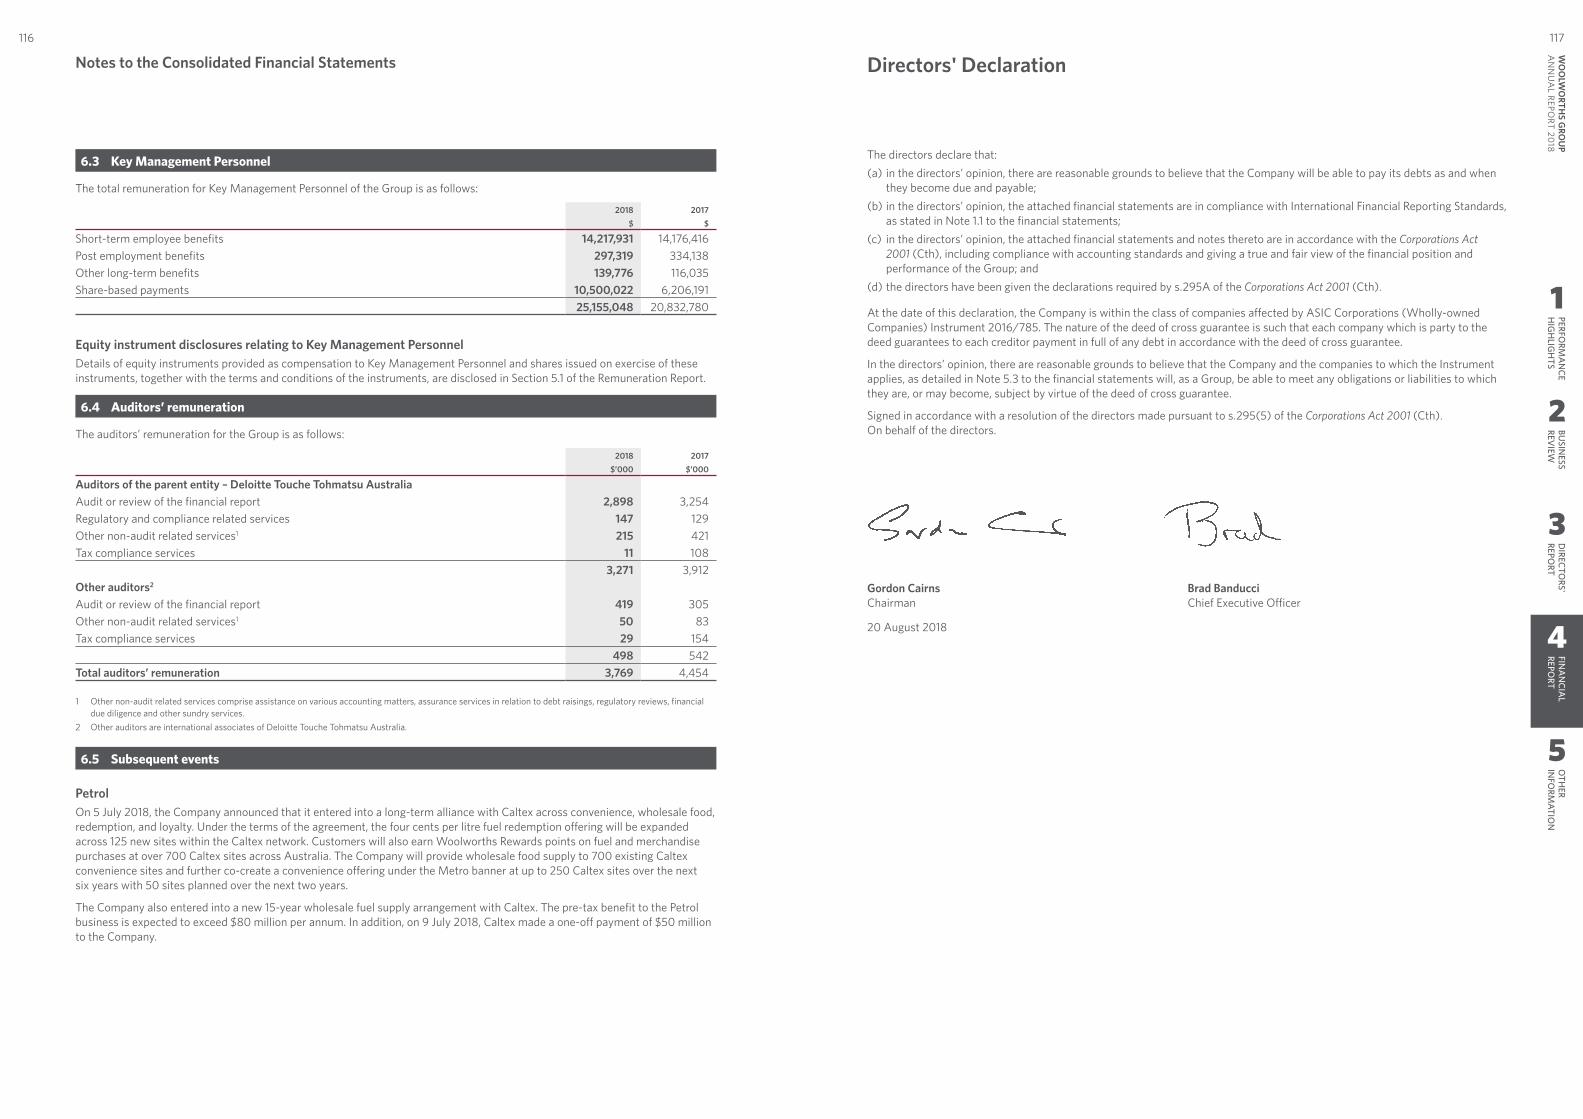
1
2
3
4
5
PERFORM
AN
CEH
IGH
LIGH
TSBU
SINESS
REVIEW
DIRECTO
RS' REPO
RTFIN
AN
CIAL
REPORT
OTH
ER IN
FORM
ATION
117116W
OO
LWO
RTHS G
ROU
P A
NN
UA
L REPORT 20
18
6.3 Key Management Personnel
The total remuneration for Key Management Personnel of the Group is as follows:
2018 2017$ $
Short‑term employee benefits 14,217,931 14,176,416Post employment benefits 297,319 334,138Other long‑term benefits 139,776 116,035Share‑based payments 10,500,022 6,206,191
25,155,048 20,832,780
Equity instrument disclosures relating to Key Management PersonnelDetails of equity instruments provided as compensation to Key Management Personnel and shares issued on exercise of these instruments, together with the terms and conditions of the instruments, are disclosed in Section 5.1 of the Remuneration Report.
6.4 Auditors’ remuneration
The auditors’ remuneration for the Group is as follows:
2018 2017$’000 $’000
Auditors of the parent entity – Deloitte Touche Tohmatsu AustraliaAudit or review of the financial report 2,898 3,254 Regulatory and compliance related services 147 129 Other non‑audit related services1 215 421 Tax compliance services 11 108
3,271 3,912 Other auditors2
Audit or review of the financial report 419 305 Other non‑audit related services1 50 83 Tax compliance services 29 154
498 542 Total auditors’ remuneration 3,769 4,454
1 Other non‑audit related services comprise assistance on various accounting matters, assurance services in relation to debt raisings, regulatory reviews, financial due diligence and other sundry services.
2 Other auditors are international associates of Deloitte Touche Tohmatsu Australia.
6.5 Subsequent events
PetrolOn 5 July 2018, the Company announced that it entered into a long‑term alliance with Caltex across convenience, wholesale food, redemption, and loyalty. Under the terms of the agreement, the four cents per litre fuel redemption offering will be expanded across 125 new sites within the Caltex network. Customers will also earn Woolworths Rewards points on fuel and merchandise purchases at over 700 Caltex sites across Australia. The Company will provide wholesale food supply to 700 existing Caltex convenience sites and further co‑create a convenience offering under the Metro banner at up to 250 Caltex sites over the next six years with 50 sites planned over the next two years.
The Company also entered into a new 15‑year wholesale fuel supply arrangement with Caltex. The pre‑tax benefit to the Petrol business is expected to exceed $80 million per annum. In addition, on 9 July 2018, Caltex made a one‑off payment of $50 million to the Company.
The directors declare that:(a) in the directors’ opinion, there are reasonable grounds to believe that the Company will be able to pay its debts as and when
they become due and payable;(b) in the directors’ opinion, the attached financial statements are in compliance with International Financial Reporting Standards,
as stated in Note 1.1 to the financial statements;(c) in the directors’ opinion, the attached financial statements and notes thereto are in accordance with the Corporations Act
2001 (Cth), including compliance with accounting standards and giving a true and fair view of the financial position and performance of the Group; and
(d) the directors have been given the declarations required by s.295A of the Corporations Act 2001 (Cth).
At the date of this declaration, the Company is within the class of companies affected by ASIC Corporations (Wholly‑owned Companies) Instrument 2016/785. The nature of the deed of cross guarantee is such that each company which is party to the deed guarantees to each creditor payment in full of any debt in accordance with the deed of cross guarantee.
In the directors’ opinion, there are reasonable grounds to believe that the Company and the companies to which the Instrument applies, as detailed in Note 5.3 to the financial statements will, as a Group, be able to meet any obligations or liabilities to which they are, or may become, subject by virtue of the deed of cross guarantee.
Signed in accordance with a resolution of the directors made pursuant to s.295(5) of the Corporations Act 2001 (Cth). On behalf of the directors.
Gordon Cairns Chairman
Brad Banducci Chief Executive Officer
20 August 2018
Directors' DeclarationNotes to the Consolidated Financial Statements
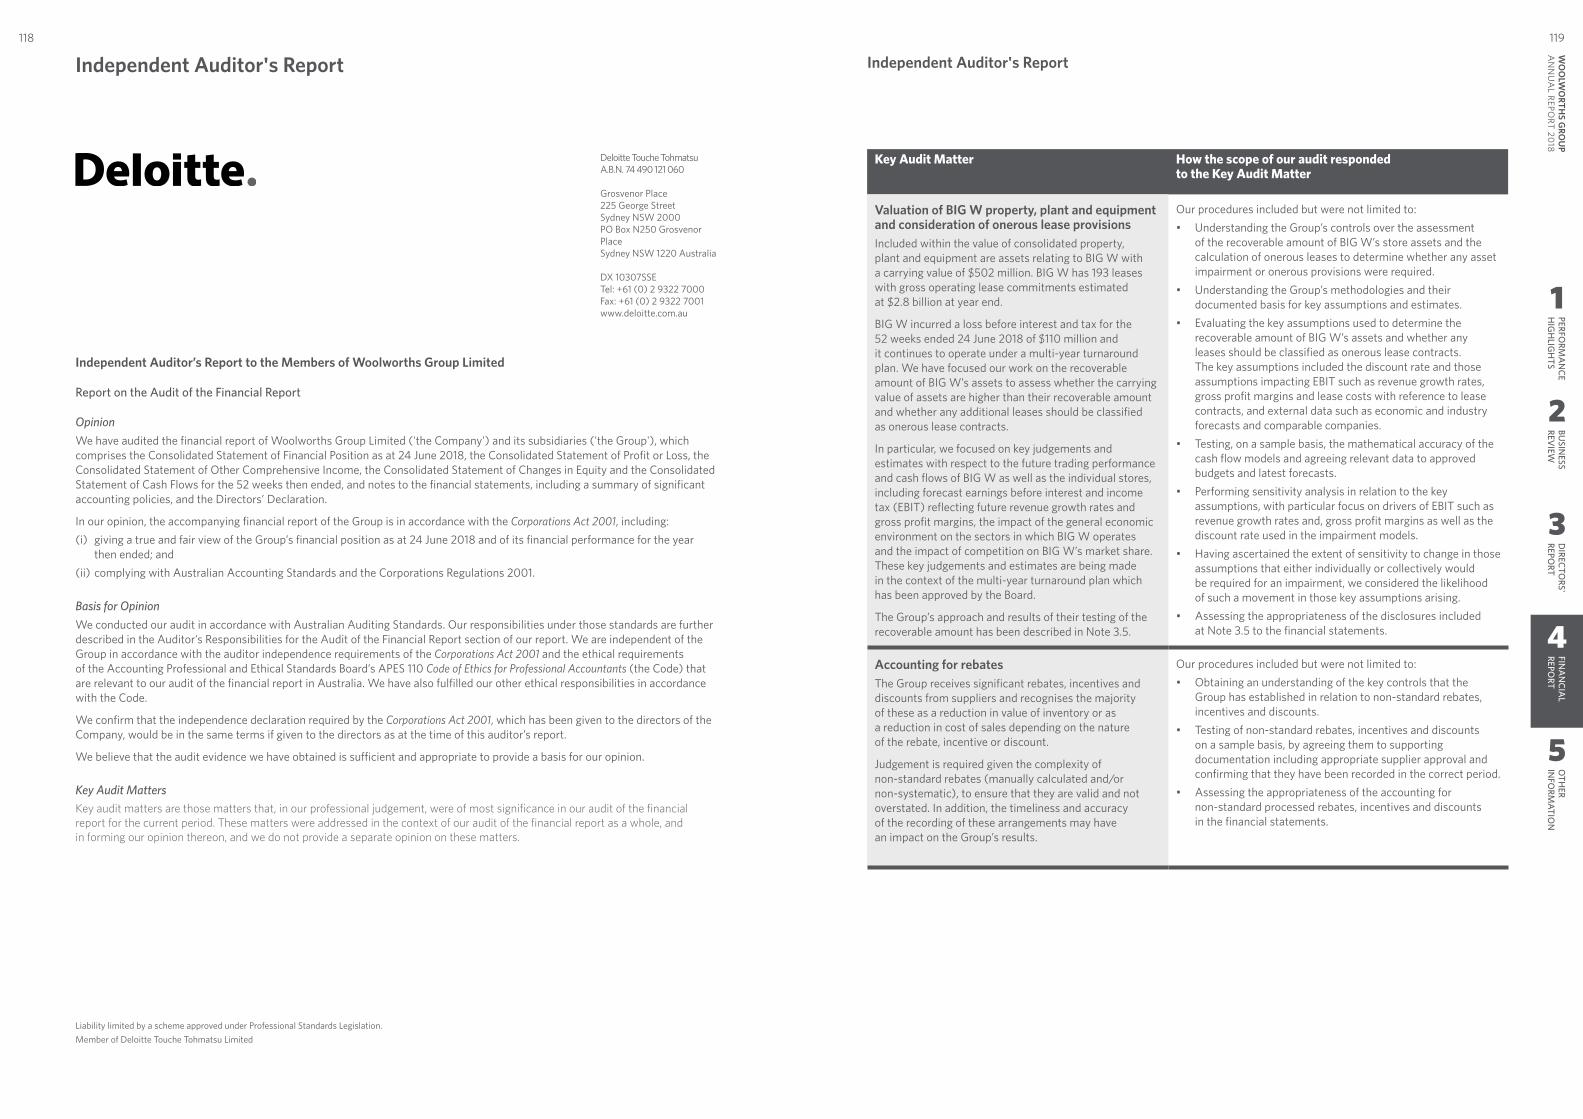
1
2
3
4
5
PERFORM
AN
CEH
IGH
LIGH
TSBU
SINESS
REVIEW
DIRECTO
RS' REPO
RTFIN
AN
CIAL
REPORT
OTH
ER IN
FORM
ATION
119118W
OO
LWO
RTHS G
ROU
P A
NN
UA
L REPORT 20
18
Deloitte Touche Tohmatsu A.B.N. 74 490 121 060
Grosvenor Place 225 George Street Sydney NSW 2000 PO Box N250 Grosvenor Place Sydney NSW 1220 Australia
DX 10307SSE Tel: +61 (0) 2 9322 7000 Fax: +61 (0) 2 9322 7001 www.deloitte.com.au
Independent Auditor’s Report to the Members of Woolworths Group Limited
Report on the Audit of the Financial Report
Opinion We have audited the financial report of Woolworths Group Limited ('the Company') and its subsidiaries ('the Group'), which comprises the Consolidated Statement of Financial Position as at 24 June 2018, the Consolidated Statement of Profit or Loss, the Consolidated Statement of Other Comprehensive Income, the Consolidated Statement of Changes in Equity and the Consolidated Statement of Cash Flows for the 52 weeks then ended, and notes to the financial statements, including a summary of significant accounting policies, and the Directors’ Declaration.
In our opinion, the accompanying financial report of the Group is in accordance with the Corporations Act 2001, including: (i) giving a true and fair view of the Group’s financial position as at 24 June 2018 and of its financial performance for the year
then ended; and(ii) complying with Australian Accounting Standards and the Corporations Regulations 2001.
Basis for Opinion We conducted our audit in accordance with Australian Auditing Standards. Our responsibilities under those standards are further described in the Auditor’s Responsibilities for the Audit of the Financial Report section of our report. We are independent of the Group in accordance with the auditor independence requirements of the Corporations Act 2001 and the ethical requirements of the Accounting Professional and Ethical Standards Board’s APES 110 Code of Ethics for Professional Accountants (the Code) that are relevant to our audit of the financial report in Australia. We have also fulfilled our other ethical responsibilities in accordance with the Code.
We confirm that the independence declaration required by the Corporations Act 2001, which has been given to the directors of the Company, would be in the same terms if given to the directors as at the time of this auditor’s report.
We believe that the audit evidence we have obtained is sufficient and appropriate to provide a basis for our opinion.
Key Audit Matters Key audit matters are those matters that, in our professional judgement, were of most significance in our audit of the financial report for the current period. These matters were addressed in the context of our audit of the financial report as a whole, and in forming our opinion thereon, and we do not provide a separate opinion on these matters.
Key Audit Matter How the scope of our audit responded to the Key Audit Matter
Valuation of BIG W property, plant and equipment and consideration of onerous lease provisionsIncluded within the value of consolidated property, plant and equipment are assets relating to BIG W with a carrying value of $502 million. BIG W has 193 leases with gross operating lease commitments estimated at $2.8 billion at year end.
BIG W incurred a loss before interest and tax for the 52 weeks ended 24 June 2018 of $110 million and it continues to operate under a multi‑year turnaround plan. We have focused our work on the recoverable amount of BIG W’s assets to assess whether the carrying value of assets are higher than their recoverable amount and whether any additional leases should be classified as onerous lease contracts.
In particular, we focused on key judgements and estimates with respect to the future trading performance and cash flows of BIG W as well as the individual stores, including forecast earnings before interest and income tax (EBIT) reflecting future revenue growth rates and gross profit margins, the impact of the general economic environment on the sectors in which BIG W operates and the impact of competition on BIG W’s market share. These key judgements and estimates are being made in the context of the multi‑year turnaround plan which has been approved by the Board.
The Group’s approach and results of their testing of the recoverable amount has been described in Note 3.5.
Our procedures included but were not limited to:• Understanding the Group’s controls over the assessment
of the recoverable amount of BIG W’s store assets and the calculation of onerous leases to determine whether any asset impairment or onerous provisions were required.
• Understanding the Group’s methodologies and their documented basis for key assumptions and estimates.
• Evaluating the key assumptions used to determine the recoverable amount of BIG W’s assets and whether any leases should be classified as onerous lease contracts. The key assumptions included the discount rate and those assumptions impacting EBIT such as revenue growth rates, gross profit margins and lease costs with reference to lease contracts, and external data such as economic and industry forecasts and comparable companies.
• Testing, on a sample basis, the mathematical accuracy of the cash flow models and agreeing relevant data to approved budgets and latest forecasts.
• Performing sensitivity analysis in relation to the key assumptions, with particular focus on drivers of EBIT such as revenue growth rates and, gross profit margins as well as the discount rate used in the impairment models.
• Having ascertained the extent of sensitivity to change in those assumptions that either individually or collectively would be required for an impairment, we considered the likelihood of such a movement in those key assumptions arising.
• Assessing the appropriateness of the disclosures included at Note 3.5 to the financial statements.
Accounting for rebatesThe Group receives significant rebates, incentives and discounts from suppliers and recognises the majority of these as a reduction in value of inventory or as a reduction in cost of sales depending on the nature of the rebate, incentive or discount.
Judgement is required given the complexity of non‑standard rebates (manually calculated and/or non‑systematic), to ensure that they are valid and not overstated. In addition, the timeliness and accuracy of the recording of these arrangements may have an impact on the Group’s results.
Our procedures included but were not limited to:• Obtaining an understanding of the key controls that the
Group has established in relation to non‑standard rebates, incentives and discounts.
• Testing of non‑standard rebates, incentives and discounts on a sample basis, by agreeing them to supporting documentation including appropriate supplier approval and confirming that they have been recorded in the correct period.
• Assessing the appropriateness of the accounting for non‑standard processed rebates, incentives and discounts in the financial statements.
Liability limited by a scheme approved under Professional Standards Legislation.Member of Deloitte Touche Tohmatsu Limited
Independent Auditor's ReportIndependent Auditor's Report
1
2
3
4
5
PERFORM
AN
CEH
IGH
LIGH
TSBU
SINESS
REVIEW
DIRECTO
RS' REPO
RTFIN
AN
CIAL
REPORT
OTH
ER IN
FORM
ATION
121120W
OO
LWO
RTHS G
ROU
P A
NN
UA
L REPORT 20
18
Key Audit Matter How the scope of our audit responded to the Key Audit Matter
IT SystemsThe IT systems across the Group are complex and there are varying levels of integration between them. These systems are vital to the ongoing operations of the business and to the integrity of the financial reporting process and as a result the assessment of IT systems forms a key component of our external audit.
Our procedures included but were not limited to:• Discussing with management the IT environment and
consideration of the key financial processes to understand where IT systems were integral to the financial reporting process and to identify IT systems to include in the scope of our IT testing.
• Testing the design of the key IT controls relating to financial reporting systems of the Group.
• In respect of deficiencies identified, we completed a combination of identification of additional controls, and substantive testing in order to assist in evaluating risk and the extent of audit procedures to be performed, including:
– understanding review level controls in place – assessing the design and operating effectiveness of any
controls (including review controls) that mitigated the identified risks.
Other Information The directors are responsible for the other information. The other information comprises the information included in the Group's annual report, but does not include the financial report and our auditor’s report thereon.
Our opinion on the financial report does not cover the other information and we do not express any form of assurance conclusion thereon.
In connection with our audit of the financial report, our responsibility is to read the other information and, in doing so, consider whether the other information is materially inconsistent with the financial report or our knowledge obtained in the audit or otherwise appears to be materially misstated.
If, based on the work we have performed, we conclude that there is a material misstatement of this other information, we are required to report that fact. We have nothing to report in this regard.
Directors’ Responsibilities for the Financial Report The directors are responsible for the preparation of the financial report that gives a true and fair view in accordance with Australian Accounting Standards and the Corporations Act 2001 and for such internal control as the directors determine is necessary to enable the preparation of the financial report that gives a true and fair view and is free from material misstatement, whether due to fraud or error.
In preparing the financial report, the directors are responsible for assessing the ability of the Group to continue as a going concern, disclosing, as applicable, matters related to going concern and using the going concern basis of accounting unless the directors either intend to liquidate the Group or to cease operations, or has no realistic alternative but to do so.
Auditor’s Responsibilities for the Audit of the Financial Report Our objectives are to obtain reasonable assurance about whether the financial report as a whole is free from material misstatement, whether due to fraud or error, and to issue an auditor’s report that includes our opinion. Reasonable assurance is a high level of assurance, but is not a guarantee that an audit conducted in accordance with the Australian Auditing Standards will always detect a material misstatement when it exists. Misstatements can arise from fraud or error and are considered material if, individually or in the aggregate, they could reasonably be expected to influence the economic decisions of users taken on the basis of this financial report.As part of an audit in accordance with the Australian Auditing Standards, we exercise professional judgement and maintain professional scepticism throughout the audit. We also:• Identify and assess the risks of material misstatement of the financial report, whether due to fraud or error, design and perform
audit procedures responsive to those risks, and obtain audit evidence that is sufficient and appropriate to provide a basis for our opinion. The risk of not detecting a material misstatement resulting from fraud is higher than for one resulting from error, as fraud may involve collusion, forgery, intentional omissions, misrepresentations, or the override of internal control.
• Obtain an understanding of internal control relevant to the audit in order to design audit procedures that are appropriate in the circumstances, but not for the purpose of expressing an opinion on the effectiveness of the Group’s internal control.
• Evaluate the appropriateness of accounting policies used and the reasonableness of accounting estimates and related disclosures made by the directors.
• Conclude on the appropriateness of the directors’ use of the going concern basis of accounting and, based on the audit evidence obtained, whether a material uncertainty exists related to events or conditions that may cast significant doubt on the Group’s ability to continue as a going concern. If we conclude that a material uncertainty exists, we are required to draw attention in our auditor’s report to the related disclosures in the financial report or, if such disclosures are inadequate, to modify our opinion. Our conclusions are based on the audit evidence obtained up to the date of our auditor’s report. However, future events or conditions may cause the Group to cease to continue as a going concern.
• Evaluate the overall presentation, structure and content of the financial report, including the disclosures, and whether the financial report represents the underlying transactions and events in a manner that achieves fair presentation.
• Obtain sufficient appropriate audit evidence regarding the financial information of the entities or business activities within the Group to express an opinion on the financial report. We are responsible for the direction, supervision and performance of the Group audit. We remain solely responsible for our audit opinion.
We communicate with the directors regarding, among other matters, the planned scope and timing of the audit and significant audit findings, including any significant deficiencies in internal control that we identify during our audit.
We also provide the directors with a statement that we have complied with relevant ethical requirements regarding independence, and to communicate with them all relationships and other matters that may reasonably be thought to bear on our independence, and where applicable, related safeguards.
From the matters communicated with the directors, we determine those matters that were of most significance in the audit of the financial report of the current period and are therefore the key audit matters. We describe these matters in our auditor’s report unless law or regulation precludes public disclosure about the matter or when, in extremely rare circumstances, we determine that a matter should not be communicated in our report because the adverse consequences of doing so would reasonably be expected to outweigh the public interest benefits of such communication.
Report on the Remuneration Report
Opinion on the Remuneration ReportWe have audited the Remuneration Report included in pages 40 to 59 of the Directors’ Report for the 52 weeks ended 24 June 2018.
In our opinion, the Remuneration Report of Woolworths Group Limited, for the 52 weeks ended 24 June 2018, complies with section 300A of the Corporations Act 2001.
Responsibilities The directors of the Company are responsible for the preparation and presentation of the Remuneration Report in accordance with section 300A of the Corporations Act 2001. Our responsibility is to express an opinion on the Remuneration Report, based on our audit conducted in accordance with Australian Auditing Standards.
DELOITTE TOUCHE TOHMATSU
A V Griffiths Partner Chartered Accountants
Sydney, 20 August 2018
Independent Auditor's Report Independent Auditor's Report
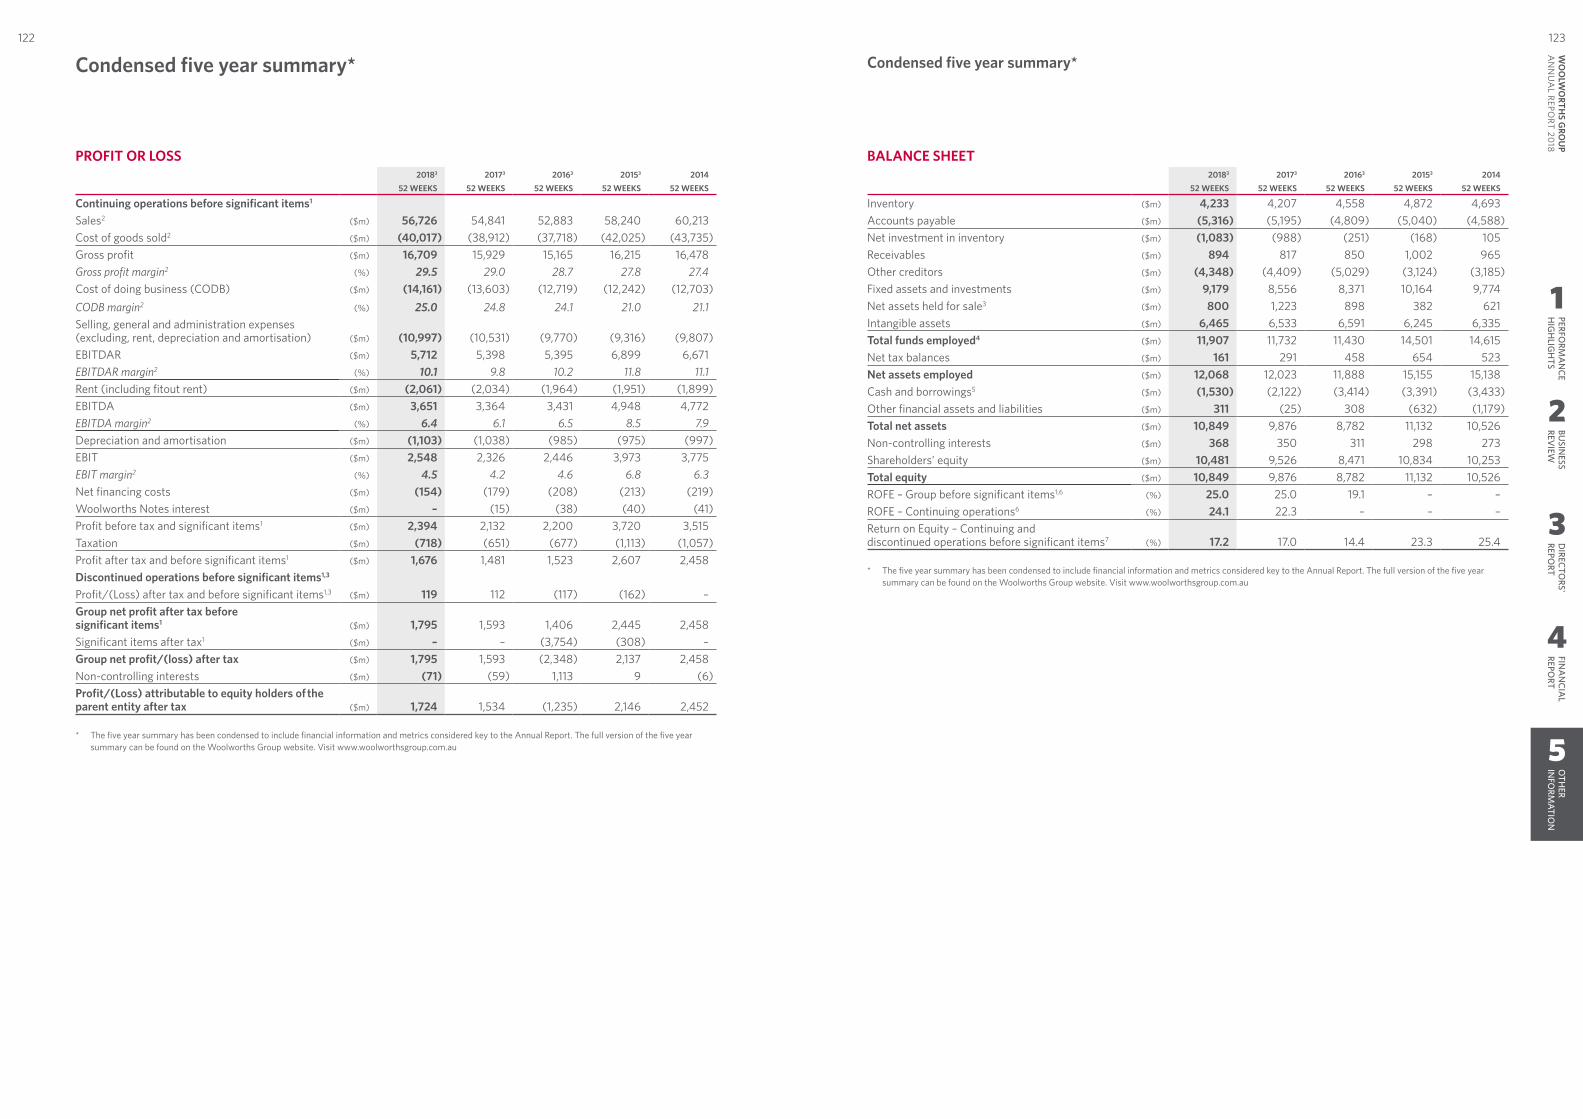
1
2
3
4
5
PERFORM
AN
CEH
IGH
LIGH
TSBU
SINESS
REVIEW
DIRECTO
RS' REPO
RTFIN
AN
CIAL
REPORT
OTH
ER IN
FORM
ATION
123122W
OO
LWO
RTHS G
ROU
P A
NN
UA
L REPORT 20
18
Condensed five year summary*Condensed five year summary*
PROFIT OR LOSS20183 20173 20163 20153 2014
52 WEEKS 52 WEEKS 52 WEEKS 52 WEEKS 52 WEEKS
Continuing operations before significant items1 Sales2 ($m) 56,726 54,841 52,883 58,240 60,213 Cost of goods sold2 ($m) (40,017) (38,912) (37,718) (42,025) (43,735)Gross profit ($m) 16,709 15,929 15,165 16,215 16,478 Gross profit margin2 (%) 29.5 29.0 28.7 27.8 27.4 Cost of doing business (CODB) ($m) (14,161) (13,603) (12,719) (12,242) (12,703)CODB margin2 (%) 25.0 24.8 24.1 21.0 21.1 Selling, general and administration expenses (excluding, rent, depreciation and amortisation) ($m) (10,997) (10,531) (9,770) (9,316) (9,807)EBITDAR ($m) 5,712 5,398 5,395 6,899 6,671 EBITDAR margin2 (%) 10.1 9.8 10.2 11.8 11.1 Rent (including fitout rent) ($m) (2,061) (2,034) (1,964) (1,951) (1,899)EBITDA ($m) 3,651 3,364 3,431 4,948 4,772 EBITDA margin2 (%) 6.4 6.1 6.5 8.5 7.9 Depreciation and amortisation ($m) (1,103) (1,038) (985) (975) (997)EBIT ($m) 2,548 2,326 2,446 3,973 3,775 EBIT margin2 (%) 4.5 4.2 4.6 6.8 6.3 Net financing costs ($m) (154) (179) (208) (213) (219)Woolworths Notes interest ($m) – (15) (38) (40) (41)Profit before tax and significant items1 ($m) 2,394 2,132 2,200 3,720 3,515 Taxation ($m) (718) (651) (677) (1,113) (1,057)Profit after tax and before significant items1 ($m) 1,676 1,481 1,523 2,607 2,458 Discontinued operations before significant items1,3
Profit/(Loss) after tax and before significant items1,3 ($m) 119 112 (117) (162) – Group net profit after tax before significant items1 ($m) 1,795 1,593 1,406 2,445 2,458 Significant items after tax1 ($m) – – (3,754) (308) – Group net profit/(loss) after tax ($m) 1,795 1,593 (2,348) 2,137 2,458 Non‑controlling interests ($m) (71) (59) 1,113 9 (6)Profit/(Loss) attributable to equity holders of the parent entity after tax ($m) 1,724 1,534 (1,235) 2,146 2,452
* The five year summary has been condensed to include financial information and metrics considered key to the Annual Report. The full version of the five year summary can be found on the Woolworths Group website. Visit www.woolworthsgroup.com.au
BALANCE SHEET20183 20173 20163 20153 2014
52 WEEKS 52 WEEKS 52 WEEKS 52 WEEKS 52 WEEKS
Inventory ($m) 4,233 4,207 4,558 4,872 4,693 Accounts payable ($m) (5,316) (5,195) (4,809) (5,040) (4,588)Net investment in inventory ($m) (1,083) (988) (251) (168) 105 Receivables ($m) 894 817 850 1,002 965 Other creditors ($m) (4,348) (4,409) (5,029) (3,124) (3,185)Fixed assets and investments ($m) 9,179 8,556 8,371 10,164 9,774 Net assets held for sale3 ($m) 800 1,223 898 382 621 Intangible assets ($m) 6,465 6,533 6,591 6,245 6,335 Total funds employed4 ($m) 11,907 11,732 11,430 14,501 14,615 Net tax balances ($m) 161 291 458 654 523 Net assets employed ($m) 12,068 12,023 11,888 15,155 15,138 Cash and borrowings5 ($m) (1,530) (2,122) (3,414) (3,391) (3,433)Other financial assets and liabilities ($m) 311 (25) 308 (632) (1,179)Total net assets ($m) 10,849 9,876 8,782 11,132 10,526 Non‑controlling interests ($m) 368 350 311 298 273 Shareholders’ equity ($m) 10,481 9,526 8,471 10,834 10,253 Total equity ($m) 10,849 9,876 8,782 11,132 10,526 ROFE – Group before significant items1,6 (%) 25.0 25.0 19.1 – – ROFE – Continuing operations6 (%) 24.1 22.3 – – – Return on Equity – Continuing and discontinued operations before significant items7 (%) 17.2 17.0 14.4 23.3 25.4
* The five year summary has been condensed to include financial information and metrics considered key to the Annual Report. The full version of the five year summary can be found on the Woolworths Group website. Visit www.woolworthsgroup.com.au
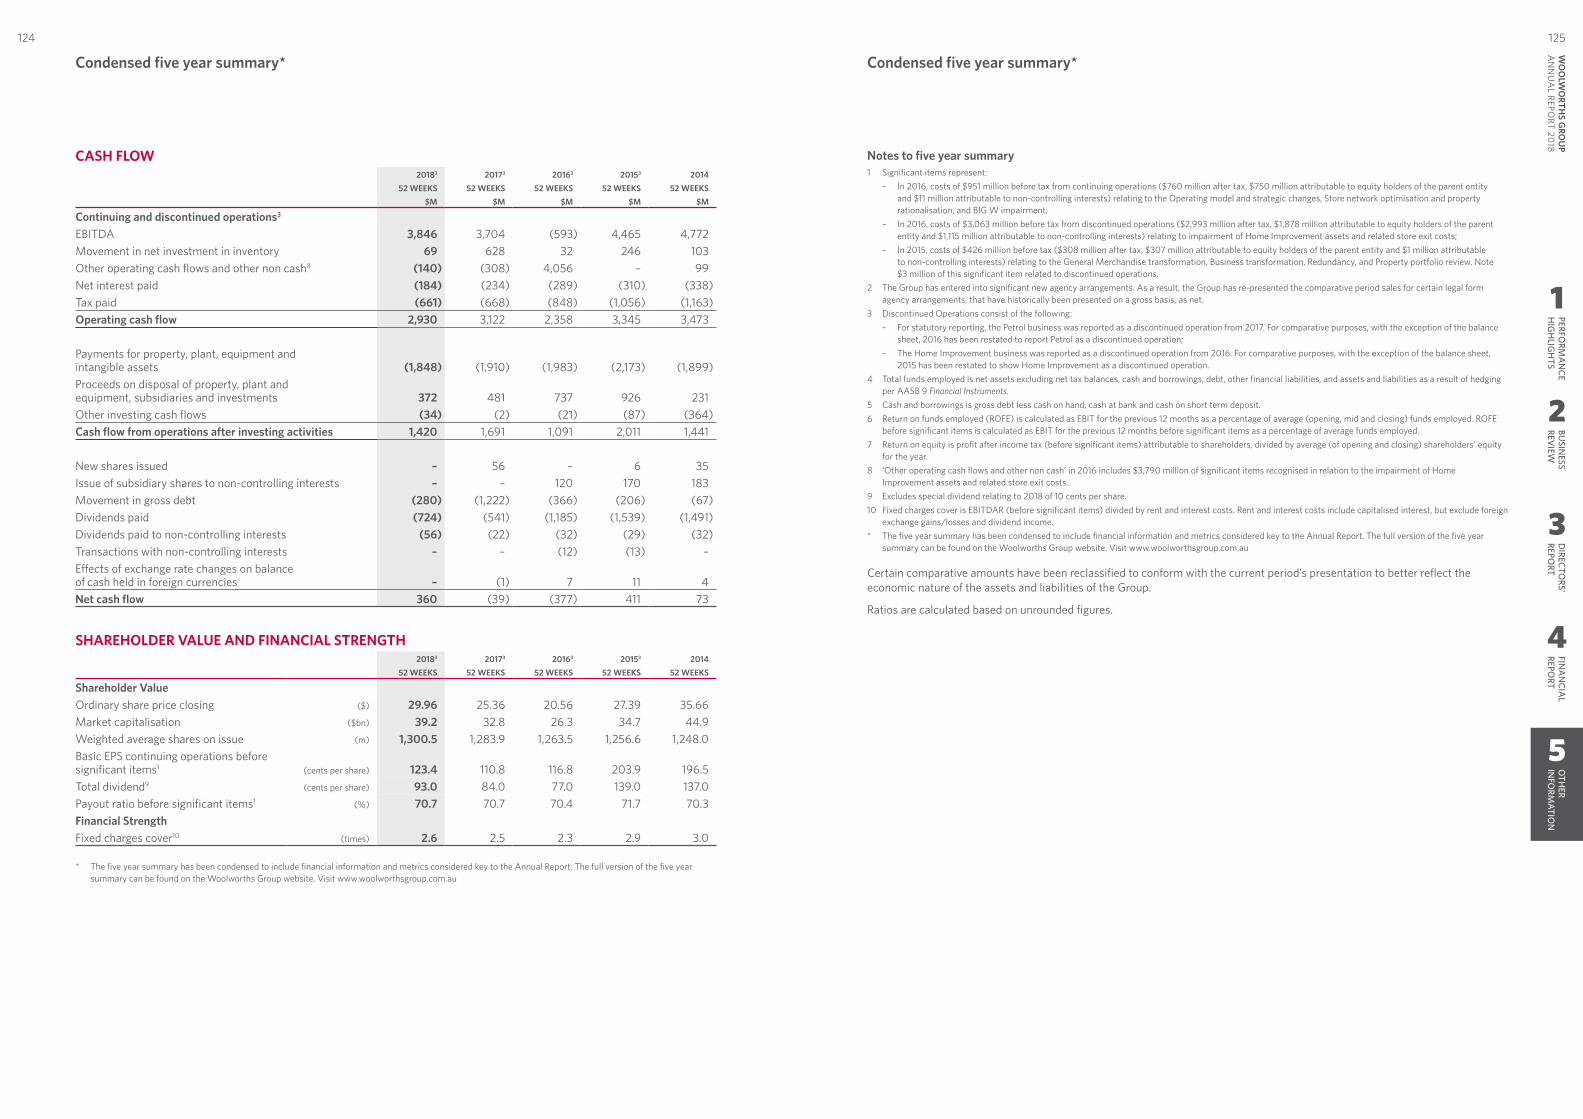
1
2
3
4
5
PERFORM
AN
CEH
IGH
LIGH
TSBU
SINESS
REVIEW
DIRECTO
RS' REPO
RTFIN
AN
CIAL
REPORT
OTH
ER IN
FORM
ATION
125124W
OO
LWO
RTHS G
ROU
P A
NN
UA
L REPORT 20
18
Condensed five year summary* Condensed five year summary*
CASH FLOW20183 20173 20163 20153 2014
52 WEEKS 52 WEEKS 52 WEEKS 52 WEEKS 52 WEEKS$M $M $M $M $M
Continuing and discontinued operations3
EBITDA 3,846 3,704 (593) 4,465 4,772 Movement in net investment in inventory 69 628 32 246 103 Other operating cash flows and other non cash8 (140) (308) 4,056 – 99 Net interest paid (184) (234) (289) (310) (338)Tax paid (661) (668) (848) (1,056) (1,163)Operating cash flow 2,930 3,122 2,358 3,345 3,473
Payments for property, plant, equipment and intangible assets (1,848) (1,910) (1,983) (2,173) (1,899)Proceeds on disposal of property, plant and equipment, subsidiaries and investments 372 481 737 926 231 Other investing cash flows (34) (2) (21) (87) (364)Cash flow from operations after investing activities 1,420 1,691 1,091 2,011 1,441
New shares issued – 56 – 6 35 Issue of subsidiary shares to non‑controlling interests – – 120 170 183 Movement in gross debt (280) (1,222) (366) (206) (67)Dividends paid (724) (541) (1,185) (1,539) (1,491)Dividends paid to non‑controlling interests (56) (22) (32) (29) (32)Transactions with non‑controlling interests – – (12) (13) – Effects of exchange rate changes on balance of cash held in foreign currencies – (1) 7 11 4 Net cash flow 360 (39) (377) 411 73
SHAREHOLDER VALUE AND FINANCIAL STRENGTH20183 20173 20163 20153 2014
52 WEEKS 52 WEEKS 52 WEEKS 52 WEEKS 52 WEEKS
Shareholder ValueOrdinary share price closing ($) 29.96 25.36 20.56 27.39 35.66 Market capitalisation ($bn) 39.2 32.8 26.3 34.7 44.9 Weighted average shares on issue (m) 1,300.5 1,283.9 1,263.5 1,256.6 1,248.0 Basic EPS continuing operations before significant items1 (cents per share) 123.4 110.8 116.8 203.9 196.5 Total dividend9 (cents per share) 93.0 84.0 77.0 139.0 137.0 Payout ratio before significant items1 (%) 70.7 70.7 70.4 71.7 70.3 Financial StrengthFixed charges cover10 (times) 2.6 2.5 2.3 2.9 3.0
* The five year summary has been condensed to include financial information and metrics considered key to the Annual Report. The full version of the five year summary can be found on the Woolworths Group website. Visit www.woolworthsgroup.com.au
Notes to five year summary1 Significant items represent:
– In 2016, costs of $951 million before tax from continuing operations ($760 million after tax, $750 million attributable to equity holders of the parent entity and $11 million attributable to non‑controlling interests) relating to the Operating model and strategic changes, Store network optimisation and property rationalisation, and BIG W impairment;
– In 2016, costs of $3,063 million before tax from discontinued operations ($2,993 million after tax, $1,878 million attributable to equity holders of the parent entity and $1,115 million attributable to non‑controlling interests) relating to impairment of Home Improvement assets and related store exit costs;
– In 2015, costs of $426 million before tax ($308 million after tax, $307 million attributable to equity holders of the parent entity and $1 million attributable to non‑controlling interests) relating to the General Merchandise transformation, Business transformation, Redundancy, and Property portfolio review. Note $3 million of this significant item related to discontinued operations.
2 The Group has entered into significant new agency arrangements. As a result, the Group has re‑presented the comparative period sales for certain legal form agency arrangements, that have historically been presented on a gross basis, as net.
3 Discontinued Operations consist of the following: – For statutory reporting, the Petrol business was reported as a discontinued operation from 2017. For comparative purposes, with the exception of the balance
sheet, 2016 has been restated to report Petrol as a discontinued operation; – The Home Improvement business was reported as a discontinued operation from 2016. For comparative purposes, with the exception of the balance sheet,
2015 has been restated to show Home Improvement as a discontinued operation.4 Total funds employed is net assets excluding net tax balances, cash and borrowings, debt, other financial liabilities, and assets and liabilities as a result of hedging
per AASB 9 Financial Instruments. 5 Cash and borrowings is gross debt less cash on hand, cash at bank and cash on short term deposit.6 Return on funds employed (ROFE) is calculated as EBIT for the previous 12 months as a percentage of average (opening, mid and closing) funds employed. ROFE
before significant items is calculated as EBIT for the previous 12 months before significant items as a percentage of average funds employed. 7 Return on equity is profit after income tax (before significant items) attributable to shareholders, divided by average (of opening and closing) shareholders’ equity
for the year. 8 ‘Other operating cash flows and other non cash’ in 2016 includes $3,790 million of significant items recognised in relation to the impairment of Home
Improvement assets and related store exit costs. 9 Excludes special dividend relating to 2018 of 10 cents per share.10 Fixed charges cover is EBITDAR (before significant items) divided by rent and interest costs. Rent and interest costs include capitalised interest, but exclude foreign
exchange gains/losses and dividend income.* The five year summary has been condensed to include financial information and metrics considered key to the Annual Report. The full version of the five year
summary can be found on the Woolworths Group website. Visit www.woolworthsgroup.com.au
Certain comparative amounts have been reclassified to conform with the current period’s presentation to better reflect the economic nature of the assets and liabilities of the Group.
Ratios are calculated based on unrounded figures.

1
2
3
4
5
PERFORM
AN
CEH
IGH
LIGH
TSBU
SINESS
REVIEW
DIRECTO
RS' REPO
RTFIN
AN
CIAL
REPORT
OTH
ER IN
FORM
ATION
127126W
OO
LWO
RTHS G
ROU
P A
NN
UA
L REPORT 20
18
The shareholder information set out below was applicable as at 1 August 2018.
DISTRIBUTION OF SHARESAnalysis of numbers of shareholders by size of holding:
RANGE OF SHARESNUMBER OF
SHAREHOLDERSNUMBER
OF SHARES
1 – 1,000 252,034 92,856,6291,001 – 5,000 116,726 247,299,1605,001 – 10,000 11,349 79,488,89310,001 – 100,000 5,150 98,003,277100,001 and over 118 795,675,982Total 385,377 1,313,323,941
All shares above are fully paid ordinary shares.
There were 7,601 holders of less than a marketable parcel of shares.
TOP 20 LARGEST SHAREHOLDERS
NAME NUMBER OF SHARES
PERCENTAGE OF TOTAL SHARES
ISSUED (%)
1 HSBC Custody Nominees (Australia) Limited 317,274,048 24.162 JP Morgan Nominees Australia Limited 198,312,685 15.103 BNP Paribas Nominees Pty Ltd 88,718,394 6.764 Citicorp Nominees Pty Limited 74,114,238 5.645 National Nominees Limited 51,074,648 3.896 UBS Nominees Pty Ltd 8,080,088 0.627 Woolworths Custodian Pty Ltd 6,469,945 0.498 Australian Foundation Investment Company Limited 5,731,718 0.449 AMP Life Limited 4,384,296 0.3310 IOOF Investment Management Limited 3,769,060 0.2911 Argo Investments Limited 3,333,026 0.2512 Milton Corporation Limited 2,903,973 0.2213 Pacific Custodians Pty Limited <WOW Plans Ctrl A/C> 2,208,205 0.1714 Netwealth Investments Limited <Wrap Services A/C> 2,127,926 0.1615 Navigator Australia Ltd <MLC Investment Sett A/C> 2,109,854 0.1616 Nulis Nominees (Australia) Limited <Navigator Mast Plan Sett A/C> 1,675,780 0.1317 BKI Investment Company Limited 1,121,244 0.0918 BNP Paribas Noms (NZ) Ltd <DRP> 1,051,478 0.0819 Australian United Investment Company Limited 1,000,000 0.0820 The Senior Master Of The Supreme Court <Common Fund No 3 A/C> 959,970 0.07
SUBSTANTIAL SHAREHOLDERSWoolworths Group Limited had received the following substantial shareholder notification. As at 1 August 2018, no other substantial notices have been received.
HOLDERSHARES HELD AT DATE OF
NOTICEPERCENTAGE OF SHARES
HELD AT DATE OF NOTICE(%) DATE OF NOTICE
BlackRock Group 64,766,473 5.00 19 June 2017
UNQUOTED EQUITY SECURITIESAs at 1 August 2018, there were 10,498,618 performance rights over unissued ordinary shares.
DIVIDENDThe final dividend of 50 cents per share and special dividend of 10 cents per share are both expected to be paid on 12 October 2018 to eligible shareholders. No discount will apply to the dividend reinvestment plan for the 2018 final and special dividends. There is currently no limit on the number of shares that can participate in the DRP.
STOCK EXCHANGE LISTINGSWoolworths Group Limited ordinary shares are listed on the Australian Securities Exchange (ASX) under code: WOW.
Woolworths Group Limited shares may be traded in sponsored American Depository Receipts form in the United States.
CORPORATE GOVERNANCE STATEMENTA copy of the Corporate Governance Statement can be found on our website. Visit www.woolworthsgroup.com.au
SHAREHOLDER CALENDAR1
2018
September14 Record date for Final Dividend
October12 Payment date for Final Dividend
November1 Announcement of first quarter sales results21 Annual General Meeting – Sydney
2019
February20 Announcement of half year results
March1 Record date for Interim Dividend
April
5 Payment date for Interim Dividend30 Announcement of third quarter sales results
1 Dates are subject to change.
Shareholder information (as at 1 August 2018)Shareholder information (as at 1 August 2018)
128
REGISTERED OFFICE1 Woolworths WayBella Vista NSW 2153Tel: (02) 8885 0000Web: www.woolworthsgroup.com.au
COMPANY SECRETARIESRichard DammeryMarcin Firek
INVESTOR RELATIONSPaul van Meurs – Head of Investor Relations
AUDITORDeloitte Touche Tohmatsu225 George Street, Sydney NSW 2000Tel: (02) 9322 7000Web: www.deloitte.com.au
SHAREHOLDER ENQUIRIESEnquiries and correspondence should be directed to Woolworths Group Limited’s Share and Share Plans Registrar, Link Market Services as follows:
Link Market ServicesLocked Bag A14, Sydney South NSW 1235Web: www.linkmarketservices.com.au
For shareholders:Tel: 1300 368 664Email: [email protected]
For employees:Tel: 1800 111 281Email: [email protected]
MEDIAWoolworths Press Office Tel: (02) 8885 1033 Email: [email protected]
Company directory
Designed and produced by ArmstrongQ ArmstrongQ.com.au
We look for ways to improve every day –
better for our customers, team and communities.
It's both the retail experiences and the experiences we make
possible in customers' lives. We work seamlessly as one team, leveraging our strength as a Group.
We are constantly innovating to meet changing needs.
We create better
experiences together
that better people̓s lives.