Embed Size (px)
Citation preview
Work-Related Musculoskeletal Disorders (WMSDs) in Washington State
Manufacturing A Summary of Research Study Findings
SEPTEMBER 2015
AUTHORS Ninica Howard, Principal Investigator
Stephen Bao, Co-Investigator Jia-Hua Lin, Senior Researcher
Daniel Hunter, Research Investigator Alysa Haas, Research Analyst
Acknowledgements: We wish to thank Darrin Adams, Naomi Anderson,
Randy Clark, Renae Knowles, and Jena Williams for their contributions to this report.
This report was compiled by researchers at the Safety and Health
Assessment and Research for Prevention (SHARP) Program in the Washington State Department of Labor and Industries. This research is supported in part by a grant from the National Institute for Occupational
Safety and Health (NIOSH Grant # 5U60OH008487-10).
Publication No. 40-14-2015
- 2 -
Contents OVERVIEW 3
Why do we study sprains and strains and overexertions? 3 TRENDS 4
What are the injury trends in Manufacturing? 4 How does Manufacturing compare to other industry sectors in Washington State? 5
Which industry groups in Manufacturing have high WMSD claims rates? 6
What is the burden of WMSDs in Manufacturing? 7 What kind of WMSD injuries are occurring in Manufacturing? 9
RESEARCH 10
What are the physical risks in Manufacturing? 10 Job Categories Assessed 11
Level of Risk from Awkward Neck Postures 12
Level of Risk from Awkward Wrist Postures 13 Level of Risk from Work-Related Stress 14
Level of Risk from Hand Activity 15 Level of Risk from Static Back Postures 16
Discussion 17
SOLUTIONS 18 Physical Job Evaluation Checklist for Manufacturing 18
Start With the Basics: General Principles for Preventing Musculoskeletal Injuries and Disorders 18
What other factors could be involved in sprains, strains, and overexertions? 20 Industry Prevention Strategies 22
Additional Resources 24
- 3 -
OVERVIEW
Why do we study sprains and strains and overexertions?
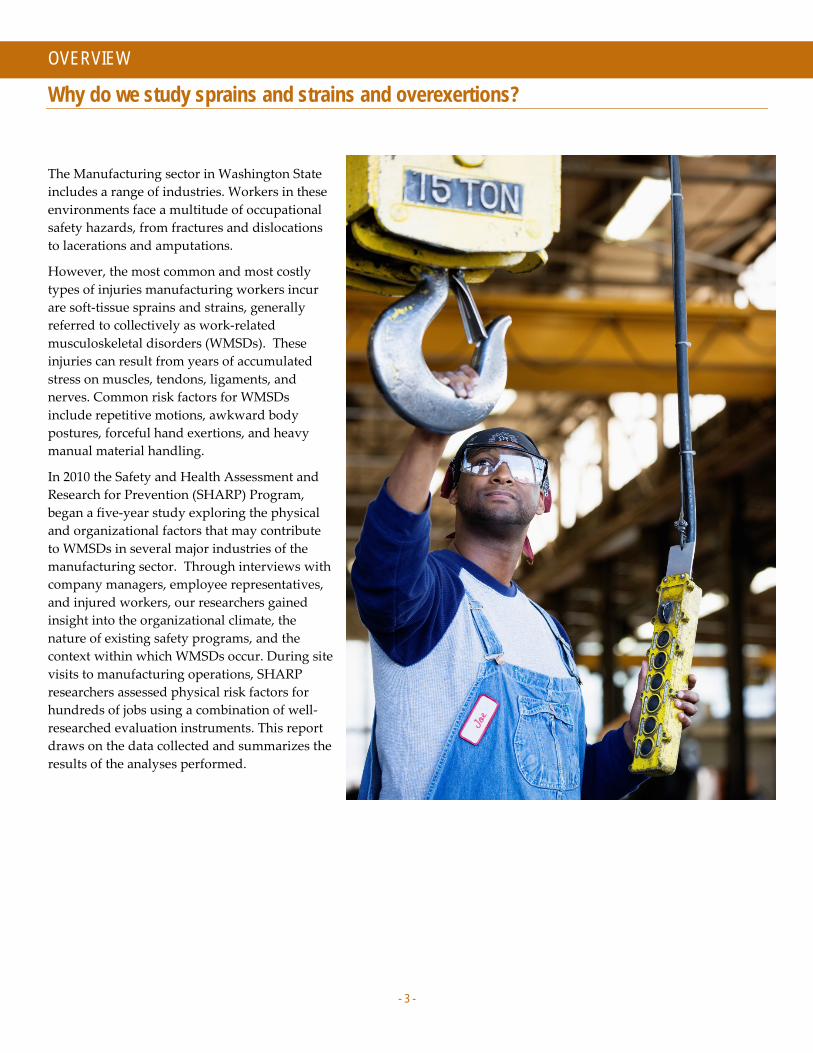
The Manufacturing sector in Washington State includes a range of industries. Workers in these environments face a multitude of occupational safety hazards, from fractures and dislocations to lacerations and amputations.
However, the most common and most costly types of injuries manufacturing workers incur are soft-tissue sprains and strains, generally referred to collectively as work-related musculoskeletal disorders (WMSDs). These injuries can result from years of accumulated stress on muscles, tendons, ligaments, and nerves. Common risk factors for WMSDs include repetitive motions, awkward body postures, forceful hand exertions, and heavy manual material handling.
In 2010 the Safety and Health Assessment and Research for Prevention (SHARP) Program, began a five-year study exploring the physical and organizational factors that may contribute to WMSDs in several major industries of the manufacturing sector. Through interviews with company managers, employee representatives, and injured workers, our researchers gained insight into the organizational climate, the nature of existing safety programs, and the context within which WMSDs occur. During site visits to manufacturing operations, SHARP researchers assessed physical risk factors for hundreds of jobs using a combination of well-researched evaluation instruments. This report draws on the data collected and summarizes the results of the analyses performed.
- 4 -
TRENDS
What are the injury trends in Manufacturing?
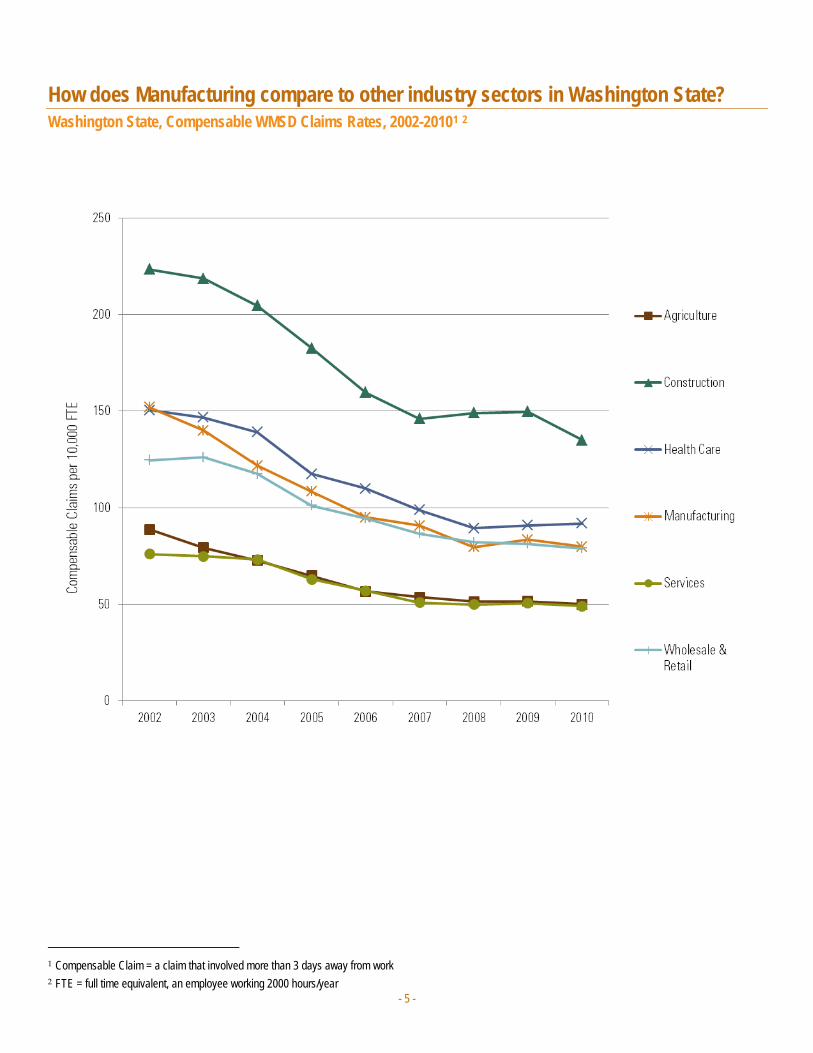
According to Washington State workers’ compensation claims data from 2002-2010, Manufacturing ranks third (out of six) when compared to other industry sectors in its compensable claims rate of WMSD injuries (for claims that involved more than 3 days away from work).
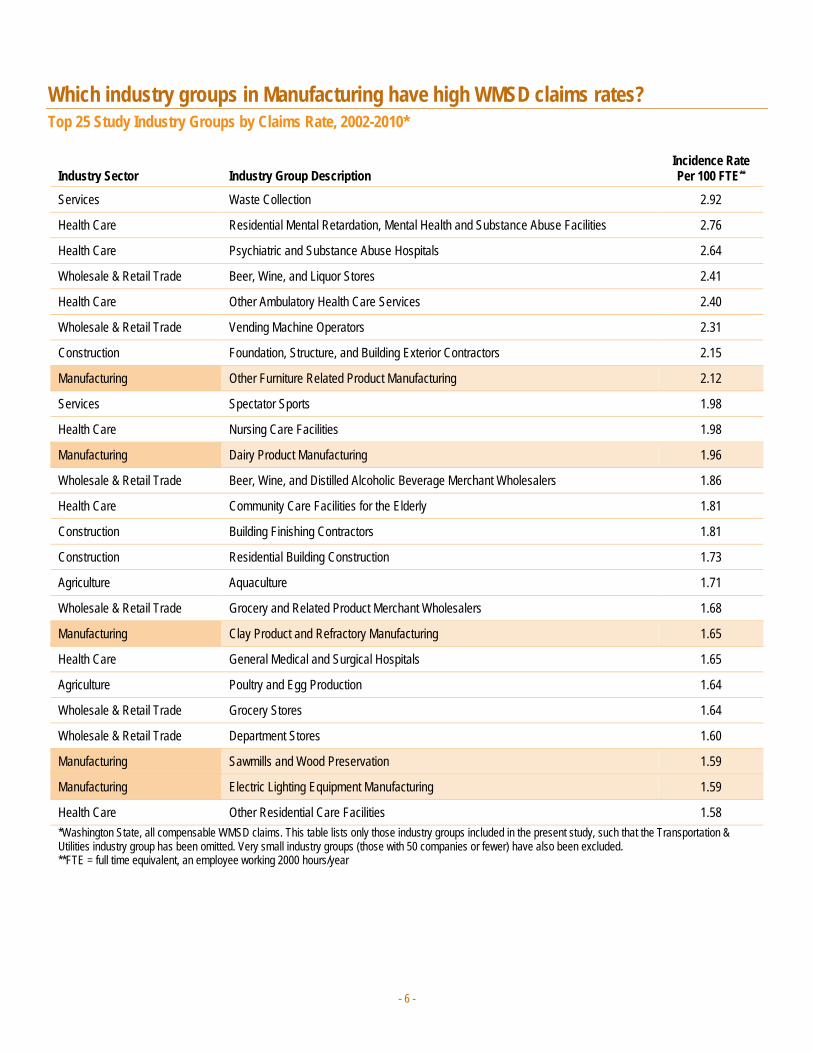
Five manufacturing industry groups rank in the top 25 when ranking industry groups within all industry sectors by compensable claims incidence rate.
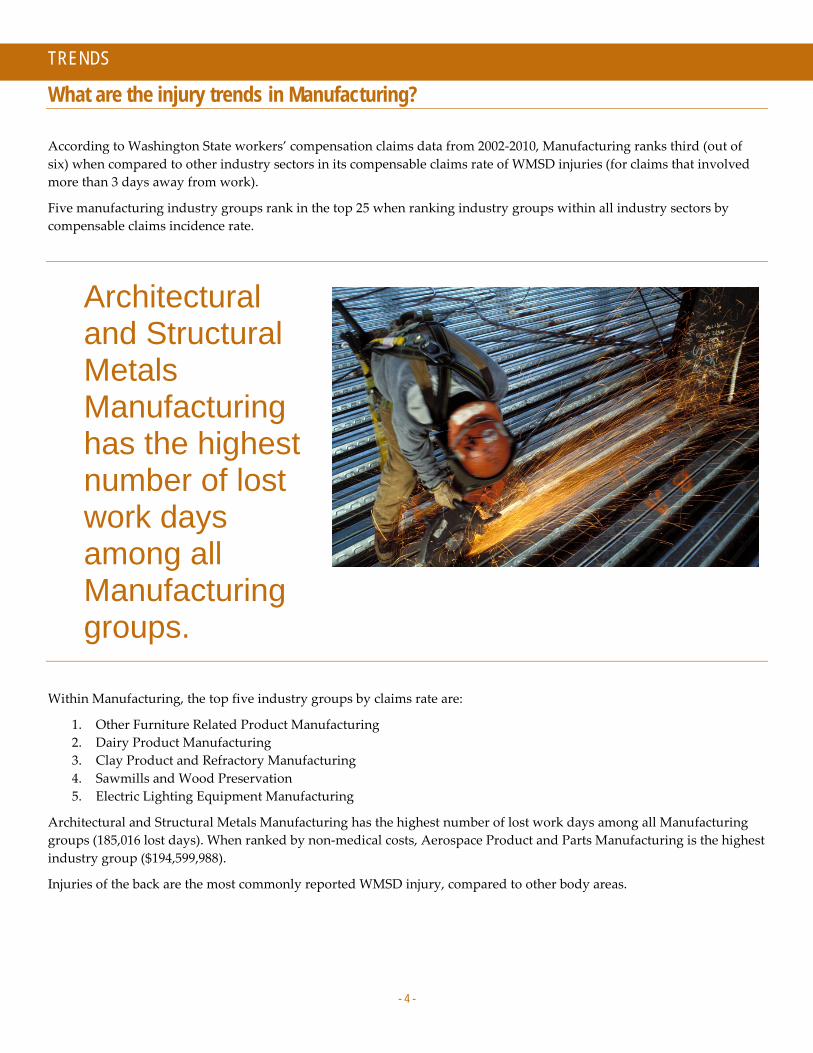
Architectural and Structural Metals Manufacturing has the highest number of lost work days among all Manufacturing groups.
Within Manufacturing, the top five industry groups by claims rate are:
1. Other Furniture Related Product Manufacturing 2. Dairy Product Manufacturing 3. Clay Product and Refractory Manufacturing 4. Sawmills and Wood Preservation 5. Electric Lighting Equipment Manufacturing
Architectural and Structural Metals Manufacturing has the highest number of lost work days among all Manufacturing groups (185,016 lost days). When ranked by non-medical costs, Aerospace Product and Parts Manufacturing is the highest industry group ($194,599,988).
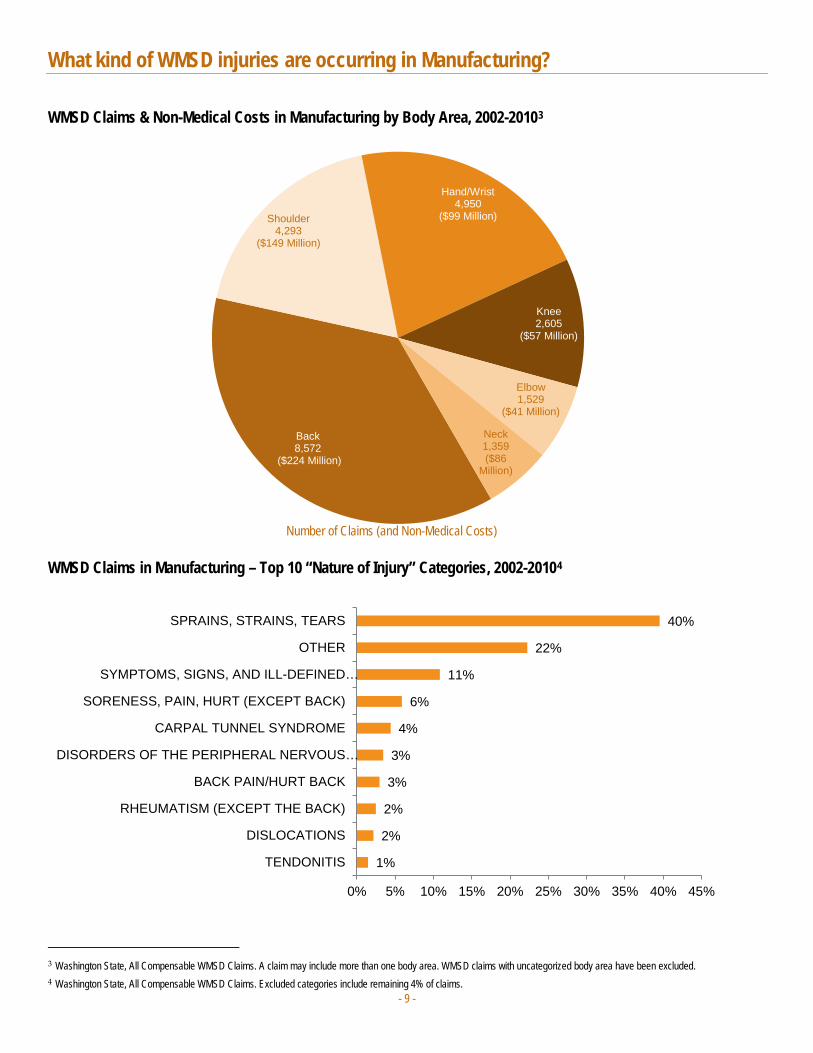
Injuries of the back are the most commonly reported WMSD injury, compared to other body areas.
- 5 -
How does Manufacturing compare to other industry sectors in Washington State? Washington State, Compensable WMSD Claims Rates, 2002-20101 2
1 Compensable Claim = a claim that involved more than 3 days away from work 2 FTE = full time equivalent, an employee working 2000 hours/year
- 6 -
Which industry groups in Manufacturing have high WMSD claims rates? Top 25 Study Industry Groups by Claims Rate, 2002-2010*
Industry Sector Industry Group Description Incidence Rate Per 100 FTE**
Services Waste Collection 2.92
Health Care Residential Mental Retardation, Mental Health and Substance Abuse Facilities 2.76
Health Care Psychiatric and Substance Abuse Hospitals 2.64
Wholesale & Retail Trade Beer, Wine, and Liquor Stores 2.41
Health Care Other Ambulatory Health Care Services 2.40
Wholesale & Retail Trade Vending Machine Operators 2.31
Construction Foundation, Structure, and Building Exterior Contractors 2.15
Manufacturing Other Furniture Related Product Manufacturing 2.12
Services Spectator Sports 1.98
Health Care Nursing Care Facilities 1.98
Manufacturing Dairy Product Manufacturing 1.96
Wholesale & Retail Trade Beer, Wine, and Distilled Alcoholic Beverage Merchant Wholesalers 1.86
Health Care Community Care Facilities for the Elderly 1.81
Construction Building Finishing Contractors 1.81
Construction Residential Building Construction 1.73
Agriculture Aquaculture 1.71
Wholesale & Retail Trade Grocery and Related Product Merchant Wholesalers 1.68
Manufacturing Clay Product and Refractory Manufacturing 1.65
Health Care General Medical and Surgical Hospitals 1.65
Agriculture Poultry and Egg Production 1.64
Wholesale & Retail Trade Grocery Stores 1.64
Wholesale & Retail Trade Department Stores 1.60
Manufacturing Sawmills and Wood Preservation 1.59
Manufacturing Electric Lighting Equipment Manufacturing 1.59
Health Care Other Residential Care Facilities 1.58 *Washington State, all compensable WMSD claims. This table lists only those industry groups included in the present study, such that the Transportation & Utilities industry group has been omitted. Very small industry groups (those with 50 companies or fewer) have also been excluded. **FTE = full time equivalent, an employee working 2000 hours/year

- 7 -
What is the burden of WMSDs in Manufacturing? Cost and Lost Days in Manufacturing (Industry Groups by Rate Rank), 2002-2010*
Industry Group Non-Medical Costs
Lost Work Days**
Incidence Rate Per 100
FTE*** Rate Rank
All Industries $3,881,386,921 28,354,928 0.89 - -
All Manufacturing $595,838,577 3,030,583 1.05 - -
Other Furniture Related Product Manufacturing $4,122,021 51,242 2.12 1
Dairy Product Manufacturing $5,350,591 10,826 1.96 2
Clay Product and Refractory Manufacturing $1,368,171 4,559 1.65 3
Sawmills and Wood Preservation $24,144,701 163,882 1.59 4
Electric Lighting Equipment Manufacturing $1,817,109 4,282 1.59 5
Foundries $6,839,523 63,731 1.56 6
Beverage Manufacturing $10,965,497 57,930 1.52 7
Veneer, Plywood, and Engineered Wood Product Manufacturing $9,843,396 90,758 1.50 8
Railroad Rolling Stock Manufacturing $2,221,058 15,526 1.50 9
Pulp, Paper, and Paperboard Mills $28,717,476 34,664 1.48 10
Motor Vehicle Body and Trailer Manufacturing $3,985,856 32,034 1.47 11
Other Nonmetallic Mineral Product Manufacturing $4,357,395 37,261 1.45 12
Other Wood Product Manufacturing $22,574,950 179,182 1.43 13
Sugar and Confectionery Product Manufacturing $2,349,622 29,761 1.42 14
Household and Institutional Furniture and Kitchen Cabinet Manufacturing $17,286,597 173,904 1.39 15
Animal Slaughtering and Processing $11,872,597 89,623 1.39 16
Ventilation, Heating, Air-Conditioning, and Commercial Refrigeration Equipment Manufacturing $5,008,645 40,289 1.37 17
Office Furniture (including Fixtures) Manufacturing $3,933,998 32,730 1.33 18
Alumina and Aluminum Production and Processing $7,305,030 2,083 1.29 19
Ship and Boat Building $8,307,040 70,899 1.28 20
Architectural and Structural Metals Manufacturing $21,559,970 185,016 1.24 21
Converted Paper Product Manufacturing $7,460,914 60,481 1.21 22
Cement and Concrete Product Manufacturing $11,930,420 93,117 1.20 23
Bakeries and Tortilla Manufacturing $11,575,385 83,376 1.18 24
Fabric Mills $1,988,112 12,291 1.18 25
Plastics Product Manufacturing $18,241,017 164,605 1.17 26
Aerospace Product and Parts Manufacturing $194,599,988 80,721 1.14 27
Boiler, Tank, and Shipping Container Manufacturing $3,780,371 26,117 1.10 28
Other Fabricated Metal Product Manufacturing $9,975,376 93,945 1.06 29
Nonferrous Metal (except Aluminum) Production and Processing $469,725 718 1.06 30
Coating, Engraving, Heat Treating, and Allied Activities $2,979,134 36,951 1.05 31
Other Food Manufacturing $4,243,623 20,441 1.03 32
Seafood Product Preparation and Packaging $9,698,410 83,755 0.99 33
Glass and Glass Product Manufacturing $4,894,238 37,845 0.98 34
Other Textile Product Mills $1,827,828 18,825 0.98 35 (Continued on next page)
Other General Purpose Machinery Manufacturing $8,352,173 25,344 0.96 36
- 8 -
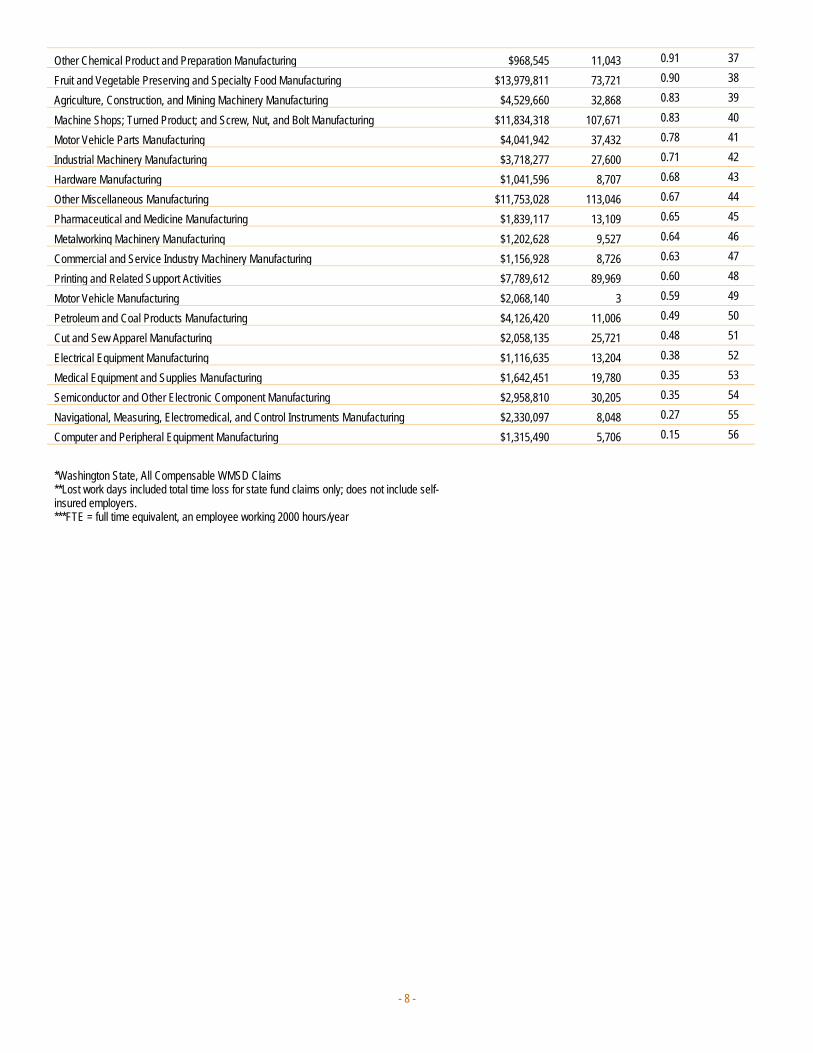
Other Chemical Product and Preparation Manufacturing $968,545 11,043 0.91 37
Fruit and Vegetable Preserving and Specialty Food Manufacturing $13,979,811 73,721 0.90 38
Agriculture, Construction, and Mining Machinery Manufacturing $4,529,660 32,868 0.83 39
Machine Shops; Turned Product; and Screw, Nut, and Bolt Manufacturing $11,834,318 107,671 0.83 40
Motor Vehicle Parts Manufacturing $4,041,942 37,432 0.78 41
Industrial Machinery Manufacturing $3,718,277 27,600 0.71 42
Hardware Manufacturing $1,041,596 8,707 0.68 43
Other Miscellaneous Manufacturing $11,753,028 113,046 0.67 44
Pharmaceutical and Medicine Manufacturing $1,839,117 13,109 0.65 45
Metalworking Machinery Manufacturing $1,202,628 9,527 0.64 46
Commercial and Service Industry Machinery Manufacturing $1,156,928 8,726 0.63 47
Printing and Related Support Activities $7,789,612 89,969 0.60 48
Motor Vehicle Manufacturing $2,068,140 3 0.59 49
Petroleum and Coal Products Manufacturing $4,126,420 11,006 0.49 50
Cut and Sew Apparel Manufacturing $2,058,135 25,721 0.48 51
Electrical Equipment Manufacturing $1,116,635 13,204 0.38 52
Medical Equipment and Supplies Manufacturing $1,642,451 19,780 0.35 53
Semiconductor and Other Electronic Component Manufacturing $2,958,810 30,205 0.35 54
Navigational, Measuring, Electromedical, and Control Instruments Manufacturing $2,330,097 8,048 0.27 55
Computer and Peripheral Equipment Manufacturing $1,315,490 5,706 0.15 56
*Washington State, All Compensable WMSD Claims **Lost work days included total time loss for state fund claims only; does not include self-insured employers. ***FTE = full time equivalent, an employee working 2000 hours/year
- 9 -
Back8,572
($224 Million)
Shoulder4,293
($149 Million)
Hand/Wrist4,950
($99 Million)
Knee2,605
($57 Million)
Elbow1,529
($41 Million)
Neck1,359($86
Million)
What kind of WMSD injuries are occurring in Manufacturing?
WMSD Claims & Non-Medical Costs in Manufacturing by Body Area, 2002-20103
WMSD Claims in Manufacturing – Top 10 “Nature of Injury” Categories, 2002-20104
3 Washington State, All Compensable WMSD Claims. A claim may include more than one body area. WMSD claims with uncategorized body area have been excluded. 4 Washington State, All Compensable WMSD Claims. Excluded categories include remaining 4% of claims.
1%
2%
2%
3%
3%
4%
6%
11%
22%
40%
0% 5% 10% 15% 20% 25% 30% 35% 40% 45%
TENDONITIS
DISLOCATIONS
RHEUMATISM (EXCEPT THE BACK)
BACK PAIN/HURT BACK
DISORDERS OF THE PERIPHERAL NERVOUS…
CARPAL TUNNEL SYNDROME
SORENESS, PAIN, HURT (EXCEPT BACK)
SYMPTOMS, SIGNS, AND ILL-DEFINED…
OTHER
SPRAINS, STRAINS, TEARS
Number of Claims (and Non-Medical Costs)
- 10 -
RESEARCH
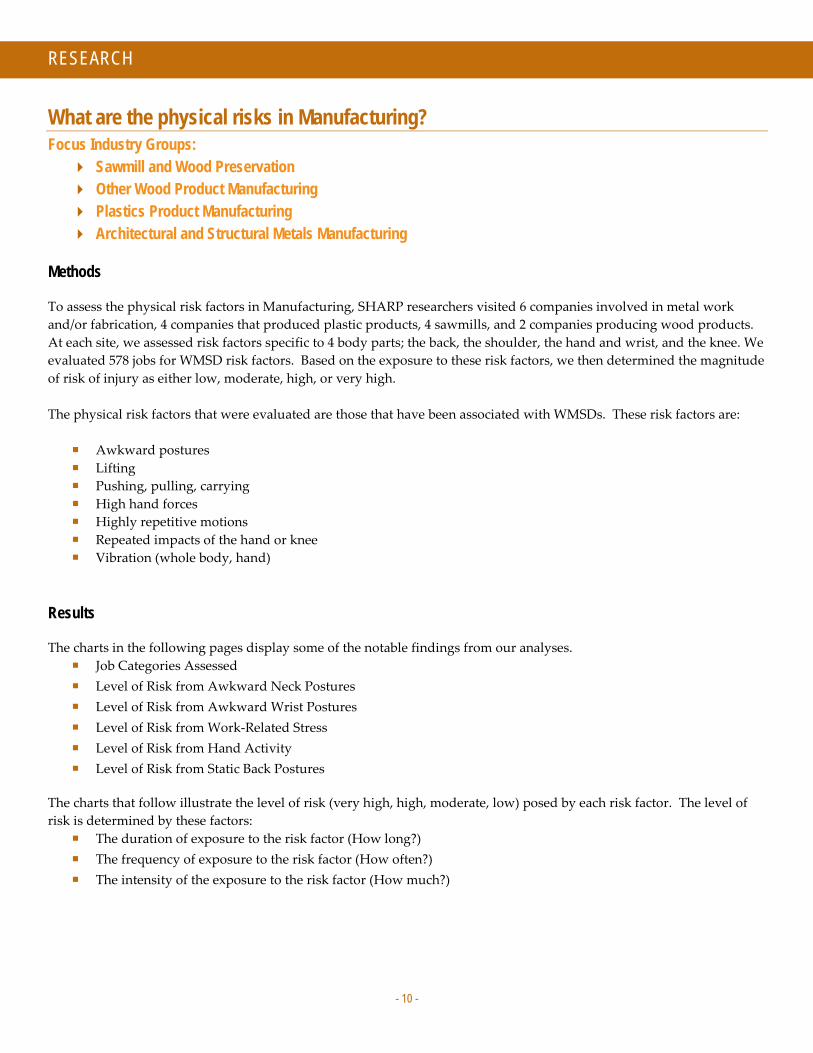
What are the physical risks in Manufacturing? Focus Industry Groups: Sawmill and Wood Preservation Other Wood Product Manufacturing Plastics Product Manufacturing Architectural and Structural Metals Manufacturing
Methods
To assess the physical risk factors in Manufacturing, SHARP researchers visited 6 companies involved in metal work and/or fabrication, 4 companies that produced plastic products, 4 sawmills, and 2 companies producing wood products. At each site, we assessed risk factors specific to 4 body parts; the back, the shoulder, the hand and wrist, and the knee. We evaluated 578 jobs for WMSD risk factors. Based on the exposure to these risk factors, we then determined the magnitude of risk of injury as either low, moderate, high, or very high. The physical risk factors that were evaluated are those that have been associated with WMSDs. These risk factors are:
Awkward postures Lifting Pushing, pulling, carrying High hand forces Highly repetitive motions Repeated impacts of the hand or knee Vibration (whole body, hand)
Results
The charts in the following pages display some of the notable findings from our analyses. Job Categories Assessed Level of Risk from Awkward Neck Postures Level of Risk from Awkward Wrist Postures Level of Risk from Work-Related Stress Level of Risk from Hand Activity Level of Risk from Static Back Postures
The charts that follow illustrate the level of risk (very high, high, moderate, low) posed by each risk factor. The level of risk is determined by these factors:
The duration of exposure to the risk factor (How long?) The frequency of exposure to the risk factor (How often?) The intensity of the exposure to the risk factor (How much?)
- 11 -
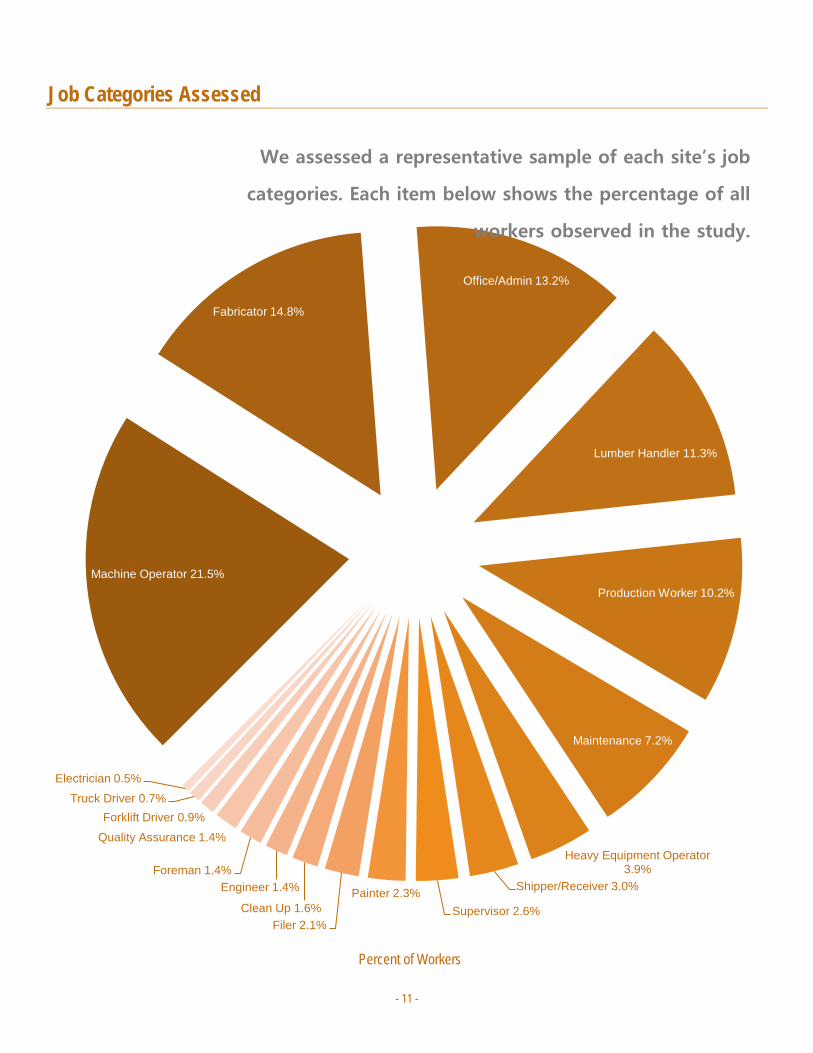
Machine Operator 21.5%
Fabricator 14.8%
Office/Admin 13.2%
Lumber Handler 11.3%
Production Worker 10.2%
Maintenance 7.2%
Heavy Equipment Operator3.9%
Shipper/Receiver 3.0%
Supervisor 2.6%Painter 2.3%
Filer 2.1%Clean Up 1.6%
Engineer 1.4%Foreman 1.4%
Quality Assurance 1.4%
Forklift Driver 0.9%Truck Driver 0.7%
Electrician 0.5%
Job Categories Assessed
Percent of Workers
We assessed a representative sample of each site’s job
categories. Each item below shows the percentage of all
workers observed in the study.

- 12 -
Level of Risk from Awkward Neck Postures
Most jobs in manufacturing posed a high or
very high risk of injury. In the jobs
observed, most of the work occurred
between waist and elbow height, with no
possibility of changing the height.
- 13 -
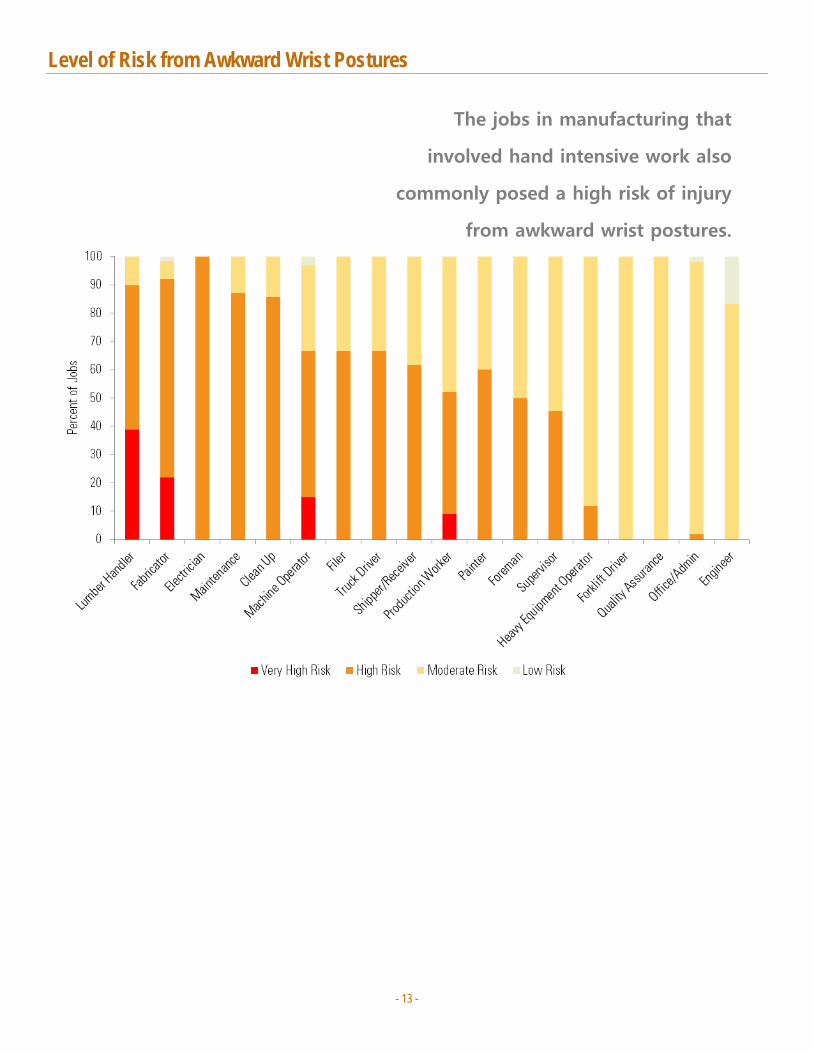
Level of Risk from Awkward Wrist Postures
The jobs in manufacturing that
involved hand intensive work also
commonly posed a high risk of injury
from awkward wrist postures.
- 14 -
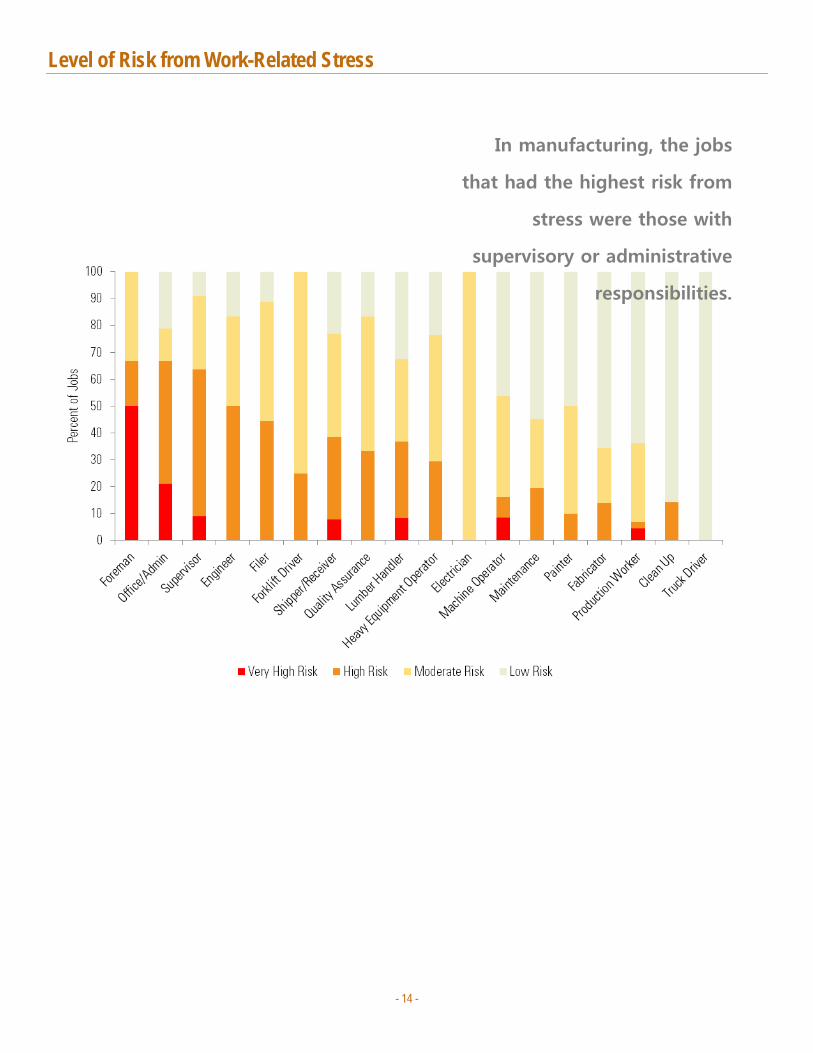
Level of Risk from Work-Related Stress
In manufacturing, the jobs
that had the highest risk from
stress were those with
supervisory or administrative
responsibilities.
- 15 -
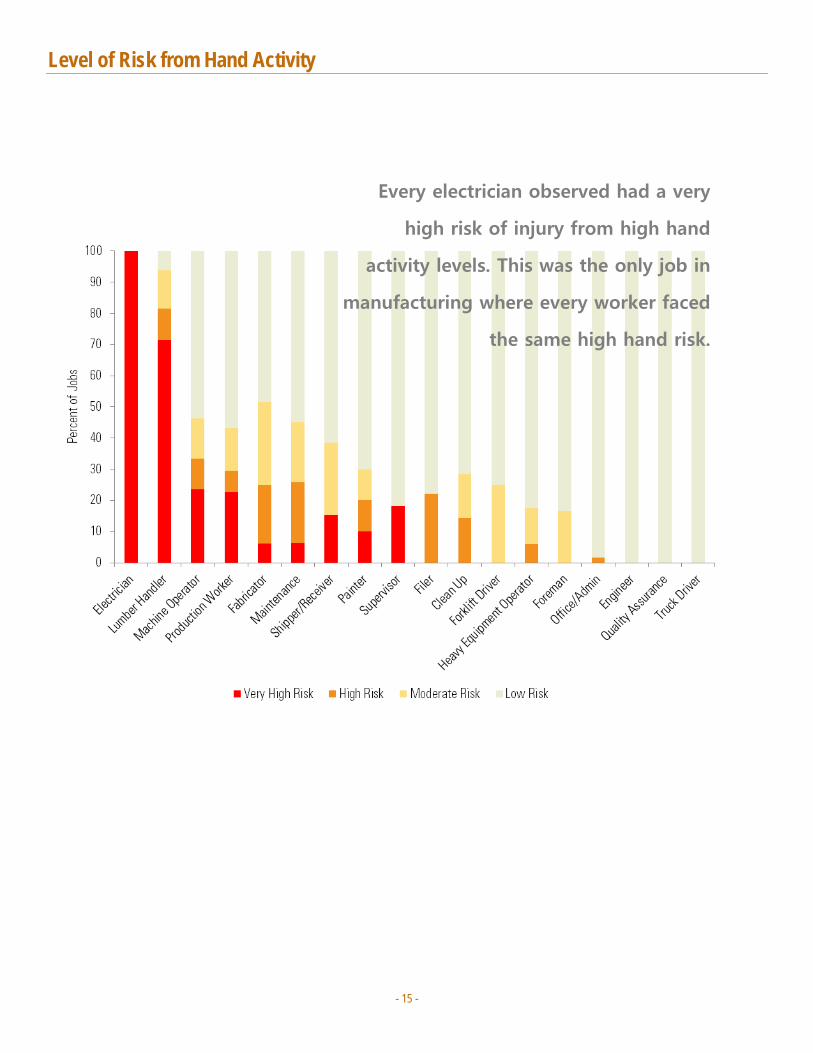
Level of Risk from Hand Activity
Every electrician observed had a very
high risk of injury from high hand
activity levels. This was the only job in
manufacturing where every worker faced
the same high hand risk.
- 16 -
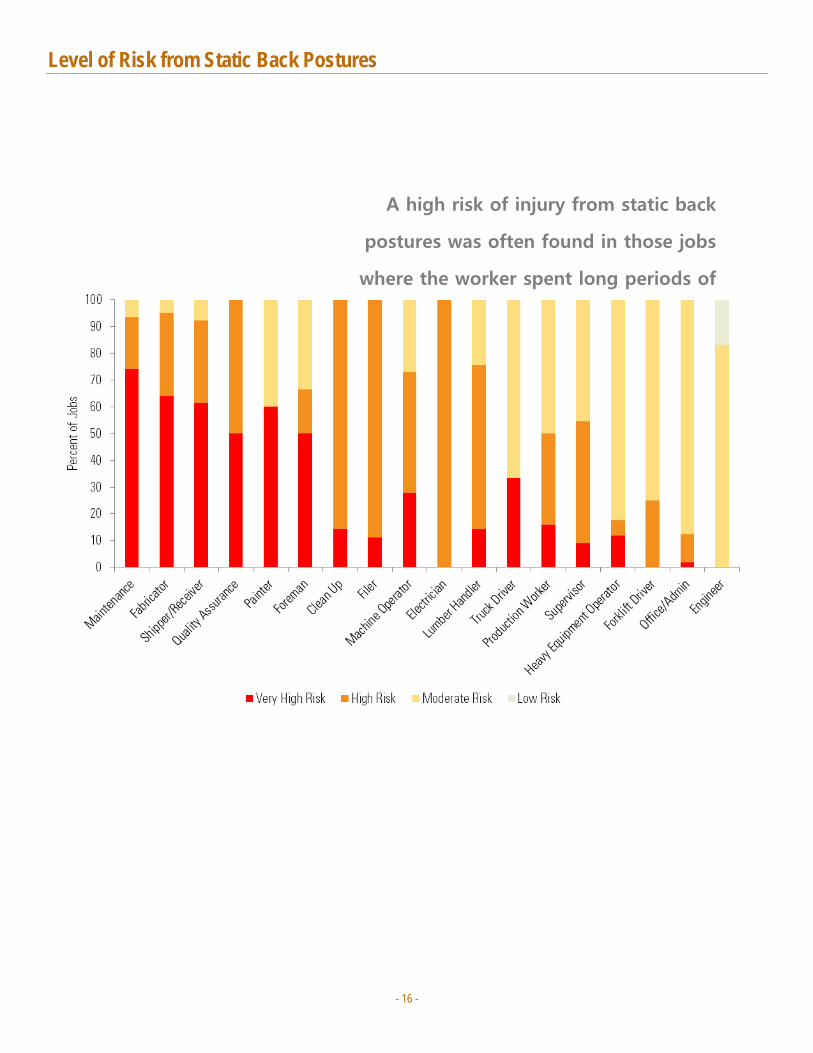
Level of Risk from Static Back Postures
A high risk of injury from static back
postures was often found in those jobs
where the worker spent long periods of
- 17 -
Discussion Among the manufacturing companies involved in our study, there was great diversity in the products produced and the processes used. As a result, collectively within this industry, every risk factor of interest posed more than a minimal risk. Several assessed risk factors produced interesting results:
Standing was very common among the jobs in manufacturing – 47% of the jobs required standing for more than 6 hours per day.
In over 20% of the jobs, manual material handling (carrying, pushing/pulling, and lifting) posed a high or very high risk of injury.
In 28% of the jobs, reported stress levels posed a high or very high risk. High levels of stress have been linked to many health issues, including high blood pressure, heart disease and diabetes.
Exposure to a single risk factor can pose a high risk but exposure to a combination of risk factors increases the risk of injury. Risk factor combinations that have been associated with increased injury risk include awkward back postures with frequent/heavy lifting, awkward wrist postures with highly repetitive motions, and awkward wrist postures with forceful hand exertions
Although the design of our study did not allow us to determine if risk factors occurred simultaneously, it was possible to identify where these risk factors occurred in the same job. Additionally, if the duration of exposure to each of these risk factors were for longer periods, then the likelihood that these risk factors occurred at the same time was high. The following risk combinations were found among the jobs in manufacturing:
The combination of high risk from forceful pinching and high risk from repetitive hand motions was most often seen in jobs in sawmills and wood product manufacturers.
The combination of high risk from forceful pinching and deviated wrist postures was also most often seen in jobs in sawmills and work product manufacturers.
The combination of high risk from forceful gripping and deviated wrist postures occurred frequently in jobs in structural metal manufacturers.
This study identified physical risk factors specific to the Manufacturing sector. Prevention activities focused on jobs with high demands for manual material handling, high hand activity, and prolonged standing should contribute to the reduction of WMSDs in this industry sector.
- 18 -
SOLUTIONS
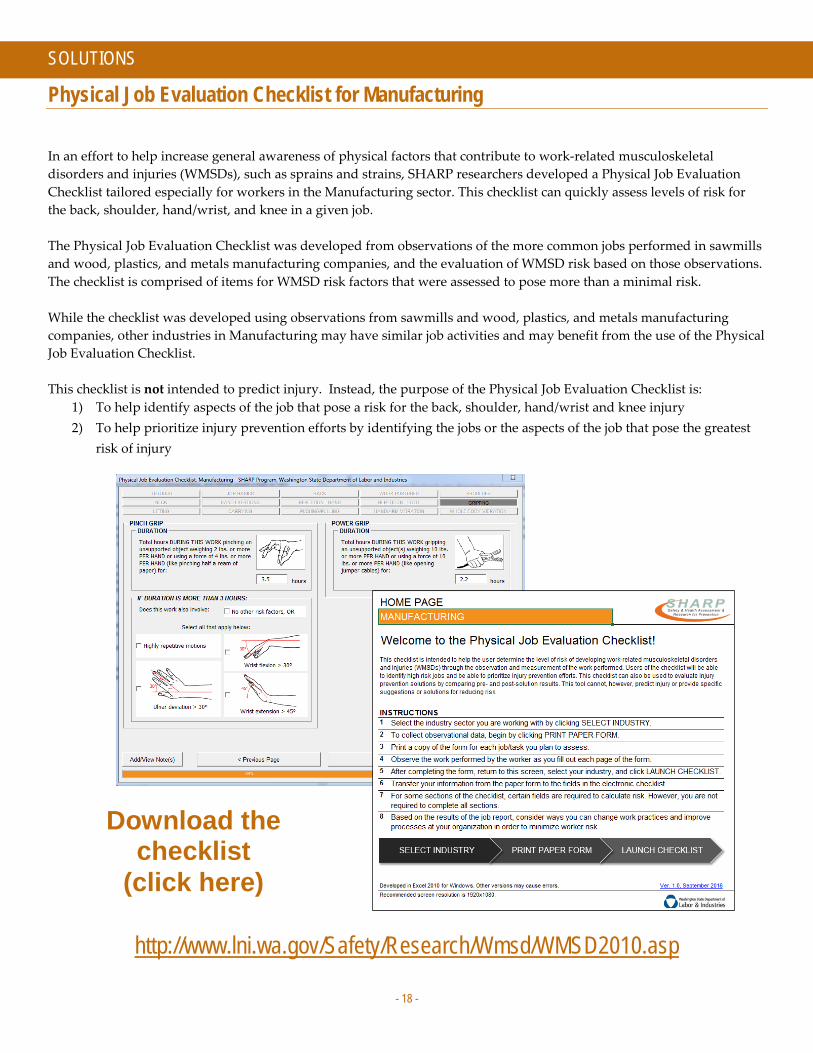
Physical Job Evaluation Checklist for Manufacturing In an effort to help increase general awareness of physical factors that contribute to work-related musculoskeletal disorders and injuries (WMSDs), such as sprains and strains, SHARP researchers developed a Physical Job Evaluation Checklist tailored especially for workers in the Manufacturing sector. This checklist can quickly assess levels of risk for the back, shoulder, hand/wrist, and knee in a given job. The Physical Job Evaluation Checklist was developed from observations of the more common jobs performed in sawmills and wood, plastics, and metals manufacturing companies, and the evaluation of WMSD risk based on those observations. The checklist is comprised of items for WMSD risk factors that were assessed to pose more than a minimal risk. While the checklist was developed using observations from sawmills and wood, plastics, and metals manufacturing companies, other industries in Manufacturing may have similar job activities and may benefit from the use of the Physical Job Evaluation Checklist. This checklist is not intended to predict injury. Instead, the purpose of the Physical Job Evaluation Checklist is:
1) To help identify aspects of the job that pose a risk for the back, shoulder, hand/wrist and knee injury 2) To help prioritize injury prevention efforts by identifying the jobs or the aspects of the job that pose the greatest
risk of injury
Download the checklist
(click here)
http://www.lni.wa.gov/Safety/Research/Wmsd/WMSD2010.asp
- 19 -
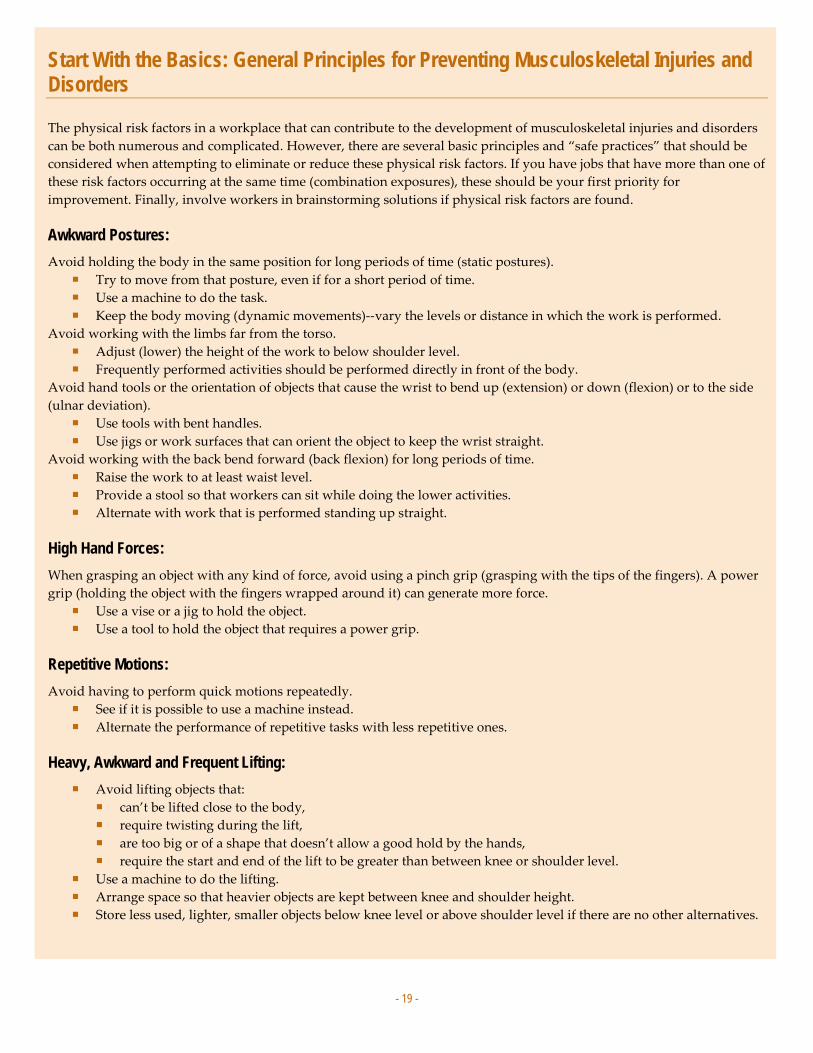
Start With the Basics: General Principles for Preventing Musculoskeletal Injuries and Disorders The physical risk factors in a workplace that can contribute to the development of musculoskeletal injuries and disorders can be both numerous and complicated. However, there are several basic principles and “safe practices” that should be considered when attempting to eliminate or reduce these physical risk factors. If you have jobs that have more than one of these risk factors occurring at the same time (combination exposures), these should be your first priority for improvement. Finally, involve workers in brainstorming solutions if physical risk factors are found. Awkward Postures: Avoid holding the body in the same position for long periods of time (static postures).
Try to move from that posture, even if for a short period of time. Use a machine to do the task. Keep the body moving (dynamic movements)--vary the levels or distance in which the work is performed.
Avoid working with the limbs far from the torso. Adjust (lower) the height of the work to below shoulder level. Frequently performed activities should be performed directly in front of the body.
Avoid hand tools or the orientation of objects that cause the wrist to bend up (extension) or down (flexion) or to the side (ulnar deviation).
Use tools with bent handles. Use jigs or work surfaces that can orient the object to keep the wrist straight.
Avoid working with the back bend forward (back flexion) for long periods of time. Raise the work to at least waist level. Provide a stool so that workers can sit while doing the lower activities. Alternate with work that is performed standing up straight.
High Hand Forces: When grasping an object with any kind of force, avoid using a pinch grip (grasping with the tips of the fingers). A power grip (holding the object with the fingers wrapped around it) can generate more force.
Use a vise or a jig to hold the object. Use a tool to hold the object that requires a power grip.
Repetitive Motions: Avoid having to perform quick motions repeatedly.
See if it is possible to use a machine instead. Alternate the performance of repetitive tasks with less repetitive ones.
Heavy, Awkward and Frequent Lifting:
Avoid lifting objects that: can’t be lifted close to the body, require twisting during the lift, are too big or of a shape that doesn’t allow a good hold by the hands, require the start and end of the lift to be greater than between knee or shoulder level.
Use a machine to do the lifting. Arrange space so that heavier objects are kept between knee and shoulder height. Store less used, lighter, smaller objects below knee level or above shoulder level if there are no other alternatives.

- 20 -
What other factors could be involved in sprains, strains, and overexertions? Important WMSD risks described by injured Manufacturing workers
Over the course of our research we conducted many physical exposures assessments of jobs at companies throughout Washington State. Risk factors were evaluated using a set of established tools designed to assess factors such as posture, force, and repetition. However, we also conducted interviews with workers from the manufacturing industry that had filed workers’ compensation claims for sprains, strains, and other WMSDs. These interviews helped shed light on factors, other than physical, our tools could not measure but which may have contributed to, or exacerbated, their injuries. These factors could be summarized into three categories: years of cumulative trauma, working through injury, and poorly maintained tools and equipment. The following are excerpts taken from these interviews and illustrate aspects of the work environment our physical assessments did not capture. Years of cumulative trauma
I think it’s just because over so many years of doing the same thing it finally just did it. It was just picking up and moving machines and they weigh anywhere from 50-110 pounds. Picking them up and turning them and putting them into boxes for shipping and that’s when it happened to me. --Production assistant, back injury, 187 time-loss days I have no idea why this step up was any different than my normal everyday step that I do. Why this time did it. Well the step – I have driven this same forklift for all this time. All 27 years on this forklift. --Forklift driver, knee injury, 112 time-loss days That’s why I’m still kind of shocked. I don’t know. Just stretching out that far. I don’t know. I really don’t. I asked the doctor that too and he even told me the same thing. It’s just one of those things. You do the same movement for years and then one time, that’s all it takes. I don’t know what else to say on that. --Dispatcher, shoulder injury, 9 time-loss days
- 21 -
Working Through Injury
When I was in shipping, that’s when I finally threw up my hands and was like I can’t take this anymore. I’ve gotta figure out what’s going on. Which I’d always had an idea that that’s what it was, but just kind of maintained. I slept in wrist braces for a year. Night time is when I have the hardest time. Slept in wrist braces for a year. --Laborer, hand/wrist injury, kept on salary We were just offloading stuff off of a rack on to the conveyor and I bent down to grab something, lifted it and lifted it wrong. I felt something burn but really didn’t think anything of it. I continued to work that night, went home and the next day it was worse. I thought it was going to get better and it didn’t get better. --Painter, back injury, 40 time-loss days
Poorly Maintained Tools and Equipment
Our complaint was always about the racks not being maintained very well if they were really bad. If there was a piece of steel that hung out, we would just say we’re not handling it and that it’s dangerous. If a wheel fell off you couldn’t move it and they had to repair it. We always talked about them maintaining the wheels and racks because the wheels get stuck. --Transport driver, shoulder injury, 31 time-loss days I was working on a machine I didn’t normally use. This particular one that I was working on, the foot pedal didn’t work so I had to use the bar pedal. I was just working on this machine forming parts and I stepped down on the bar pedal and felt a pinch in my knee. It runs the length of the machine and takes a lot bigger step to actually get it to work. It's a bigger range of motion. --Press brake operator, knee injury, 136 time-loss days
- 22 -
Industry Prevention Strategies Lessons learned from Manufacturing insiders After interviewing a wide range of employers in the manufacturing industry, we learned about several interesting injury-prevention strategies that could work for others as well.
Case Study One: Maximizing the Power of Safety Meetings
One company we worked with in our study has developed their safety meeting process into a comprehensive system of risk reduction tools. This company employs more than 100 workers. Their safety manager described their system this way:
We have a very unconventional style for safety meetings. There are actually three different kinds per quarter: a sit-down, a walk-through, and an action meeting. At the sit-down safety meeting we require attendance by all employees. The owner presents a topic, there's a Q&A, and we drill down pretty good each time. We end up generating up to ten action items as a group. They range from pure safety to pure mechanical; could be process, could be procurement. During the walk-throughs, the owner goes around and talks to every employee on the floor. He conducts very in-depth interviews regarding resource needs, hazard assessments, etc. He will generate another 15-30 action items per walk-through. All action items are entered into a "hit list" database. The action meetings are held by a specialized committee composed of top operators, millwrights, managers, and the owner. We review the hit list collectively, and the tougher-to-resolve items are deliberated over and a course of action is determined. The owner does all three types of safety meetings at both plant locations.
Through ongoing collaboration between workers and committee members, safety issues are identified quickly and resolved collectively. This commitment to safety and strong leadership from upper management helps drive the process and set an example for each employee.
The most effective component is when the owner and managers shut down a line at a time to do their walk-throughs. It really keeps safety an ongoing dialogue between workers and management. They start with an interview with the employee, and the operator walks us through every step. We work together with them to identify all the key hazards. We know all the big hazards, but the employees are critical to uncovering the harder to see hazards. Our safety meeting process works much better than the traditional ones where they elect people. Often times, the ones they elect are the ones with the poorest safety record; it's more of a popularity contest. When you have 100% participation--and when it's all driven by upper management--it really works. Everybody is a member of the safety committee. Most companies don't want to shut down production for an hour, but it's worth it to us. For example, we changed machine heights to accommodate workers when we moved to the new shop. We also added raised walk-ways to get workers to the right height, changed to more padded gloves, put in a new storage system to eliminate bending to lift heavy dies, and installed auto-stackers to two machines to eliminate heavy lifting of bundles of steel studs. They were very expensive to procure, but they've helped tremendously.
- 23 -
Case Study Two: Open Communication between Workers and Management
One sawmill that participated in our study places a high priority on seeking feedback from their employees. They have committed to taking a long-term approach to incorporating workers’ suggestions into both workplace improvement plans as well as purchasing decisions.
Safety is an ever-evolving process, and we encourage workers to make suggestions. We want them to think about what could work to make a job safer. They can do it verbally or they can fill out a Safety Action Report, which is used for reporting incidents, close calls, near misses, suggested equipment purchases, or anything at all safety related. –HR Coordinator
One method that has worked well for them is a system of drop boxes located strategically throughout the facility.
Workers can make suggestions and put them in locked boxes throughout the mill. They can be filled out anonymously or they can put their name on it. Some folks don't want to feel like a tattletale. There are no bad suggestions. There is no negativity from management regarding safety suggestions. We all know it only benefits us anyway. We're not going to redesign the whole plant for someone, but we'll try to do the best we can with what we've got to work with. –Safety Committee Representative
Workers’ voices are heard and their opinions are taken seriously. They are given the opportunity to make changes to the ways they perform their jobs.
For example, recently a cleaning task that required one continuous hour of stooping and bending each day was redesigned into three 15-minute operations performed throughout the day.” –HR Coordinator We put in a new sorter that reduces repetitive hand/arm motions. Another example was as the wrapping station: the belt used to be 6" off the ground and required deep stooping while walking along and wrapping product. Now, it's been raised up to a comfortable standing height and the wrapping method was improved to be easier as well. –Safety Committee Representative
- 24 -
Additional Resources
WMSDs
Work-Related Musculoskeletal Disorders of the Back, Upper Extremity, and Knee in Washington State, 2002-2010 Report Summary: http://www.lni.wa.gov/Safety/Research/Files/WMSD_TR_EXP_Summary2.pdf Full Report: http://www.lni.wa.gov/Safety/Research/Files/WMSD_TechReport2015.pdf
Perceptions of risk from workers in high risk industries with work related musculoskeletal disorders http://iospress.metapress.com/content/e3553913x0503461/
Job Organization and Worker Health http://www.tandfonline.com/doi/full/10.1080/00140139.2015.1065347
L&I Programs
SHARP Program http://www.lni.wa.gov/Safety/Research/default.asp
Sprains & Strains Prevention Resources http://www.lni.wa.gov/safety/SprainsStrains/
DOSH Consultations http://www.lni.wa.gov/Safety/Consultation/default.asp